UNITED STATES
SECURITIES AND EXCHANGE COMMISSION
Washington, D.C. 20549
FORM 10-K
(Mark One)
| x | ANNUAL REPORT PURSUANT TO SECTION 13 OR 15(d) OF THE SECURITIES EXCHANGE ACT OF 1934 |
For the fiscal year ended December 31, 2007
| ¨ | TRANSITION REPORT PURSUANT TO SECTION 13 OR 15(d) OF THE SECURITIES EXCHANGE ACT OF 1934 |
For the transition period from to
Commission file number 0-33407
APP PHARMACEUTICALS, INC.
(Exact name of registrant as specified in its charter)
| | |
| Delaware | | 30-0431736 |
| (State of Incorporation) | | (I.R.S. Employer Identification No.) |
| |
1501 East Woodfield Road, Suite 300 East Schaumburg, IL 60173-5837 | | (847) 969-2700 |
| (Address of principal executive offices, including zip code) | | (Registrant’s telephone number, including area code) |
Securities registered pursuant to Section 12(b) of the Act:
| | |
| Common Stock, par value $0.001 per share | | The NASDAQ Stock Market LLC |
| (Title of Class) | | (Name of each exchange on which registered) |
Securities registered pursuant to Section 12(g) of the Act: None
Indicate by check mark if the registrant is a well-known seasoned issuer, as defined in Rule 405 of the Securities Act. Yes x No ¨
Indicate by check mark if the registrant is not required to file reports pursuant to Section 13 or Section 15(d) of the Act. Yes ¨ No x
Indicate by check mark whether the registrant (1) has filed all reports required to be filed by Section 13 or 15(d) of the Securities Exchange Act of 1934 during the preceding 12 months (or for such shorter period that the registrant was required to file such reports), and (2) has been subject to such filing requirements for the past 90 days. Yes x No ¨
Indicate by check mark if disclosure of delinquent filers pursuant to Item 405 of Regulation S-K is not contained herein, and will not be contained to the best of the registrant’s knowledge, in definitive proxy or information statements incorporated by reference in Part III of this Form 10-K or any amendment to this Form 10-K. ¨
Indicate by check mark whether the registrant is a large accelerated filer, an accelerated filer or a non-accelerated filer. See definition of “accelerated filer and large accelerated filer” in Rule 12b-2 of the Exchange Act. (Check one):
| | | | |
| Large Accelerated filer x | | Accelerated Filer ¨ | | Non-Accelerated Filer ¨ |
Indicate by check mark whether the registrant is a shell company (as determined by rule 12b-2 of the Exchange Act). Yes ¨ No x
As of June 29, 2007 (the last business day of the registrant’s most recently completed second quarter), the aggregate market value of the voting stock held by non-affiliates of the registrant was approximately $593.6 million or $317.2 million, based on the adjusted Nasdaq closing price of $11.88 per common share on that date, as adjusted for the spin-off described herein. The registrant has no non-voting common stock.
As of March 3, 2008, the registrant had 160,091,099 shares of common stock outstanding.
DOCUMENTS INCORPORATED BY REFERENCE
Portions of the Proxy Statement for the registrant’s 2008 Annual Meeting of Stockholders are incorporated by reference into Part III of this Annual Report on Form 10-K.
APP Pharmaceuticals Inc.
FORM 10-K
For the Year Ended December 31, 2007
TABLE OF CONTENTS
PART I
Unless the context otherwise requires, references in this report to “New APP,” “APP Pharmaceuticals,” “we,” “us” and “our” refer to APP Pharmaceuticals, Inc. and its subsidiaries, including our operating subsidiary APP Pharmaceuticals, LLC (which we refer to as New APP, LLC in this information statement), references to “Old Abraxis” refer to Abraxis BioScience, Inc. prior to the separation and related transactions, references to “New Abraxis” refer to New Abraxis Inc., which was our wholly owned subsidiary prior to the separation and which changed its name to Abraxis BioSciences, Inc. following the separation, and references to the “distribution,” “separation” or “spin-off” refer to the transactions in which the proprietary business was separated from Old Abraxis and New Abraxis became an independent publicly-traded company.
Note Regarding Forward-Looking Statements
This Annual Report on Form 10-K and other documents we file with the Securities and Exchange Commission contain forward-looking statements, as the term is defined in the Private Securities Litigation Reform Act of 1995. In addition, we may make forward-looking statements in press releases or written statements, or in our communications and discussion with investors and analysts in the normal course of business through meetings, webcasts, phone calls and conference calls. Such forward-looking statements, whether expressed or implied, are subject to risks and uncertainties which can cause actual results to differ materially from those currently anticipated, due to a number of factors, many of which are beyond our control, which include, but are not limited to:
| | • | | the market adoption of and demand for our existing and new pharmaceutical products; |
| | • | | our ability to maintain and/or improve sales and earnings performance; |
| | • | | the ability to successfully manufacture products in an efficient, time-sensitive and cost effective manner; |
| | • | | our ability to service our debt; |
| | • | | the impact on our products and revenues of patents and other proprietary rights licensed or owned by us, our competitors and other third parties; |
| | • | | our ability, and that of our suppliers, to comply with laws, regulations and standards, and the application and interpretation of those laws, regulations and standards, that govern or affect the pharmaceutical industry, the non-compliance with which may delay or prevent the sale of our products; |
| | • | | the difficulty in predicting the timing or outcome of product development efforts and regulatory approvals; |
| | • | | the availability and price of acceptable raw materials and components from third-party suppliers; |
| | • | | evolution of the fee-for-service arrangements being adopted by our major wholesale customers; |
| | • | | risks inherent in divestitures and spin-offs, including business risks, legal risks and risks associated with the tax and accounting treatment of such transactions; |
| | • | | inventory reductions or fluctuations in buying patterns by wholesalers or distributors; and |
| | • | | the impact of recent legislative changes to the governmental reimbursement system. |
Forward-looking statements also include the assumptions underlying or relating to any of the foregoing or other such statements. When used in this report, the words “may,” “will,” “should,” “could,” “expect,” “plan,” “anticipate,” “believe,” “estimate,” “predict” and similar expressions are generally intended to identify forward-looking statements.
1
Readers are cautioned not to place undue reliance on these forward-looking statements, which reflect management’s opinions only as of the date hereof. We undertake no obligation to revise or publicly release the results of any revision to these forward-looking statements, whether as a result of new information, changes in assumptions, future events or otherwise. Readers should carefully review the factors described in Item 1A: Risk Factors below and other documents we file from time to time with the Securities and Exchange Commission for a more detailed description of the risks and other factors that may affect the forward-looking statements. Readers should understand that it is not possible to predict or identify all such factors. Consequently, readers should not consider any such list to be a complete set of all potential risks or uncertainties.
Overview
We are a fully-integrated pharmaceutical company that develops, manufactures and markets injectable pharmaceutical products. We believe that we are the only independent U.S. public company with a primary focus on the injectable critical care, anti-infective and oncology markets, and we further believe that we offer one of the most comprehensive injectable product portfolios in the pharmaceutical industry. We manufacture products in each of the three basic forms in which injectable products are sold: liquid, powder and lyophilized, or freeze-dried.
Our products are generally used in hospitals, long-term care facilities, alternate care sites and clinics within North America. Unlike the retail pharmacy market for oral products, the injectable pharmaceuticals marketplace is largely made up of end users who have relationships with group purchasing organizations, or GPOs, and/or specialty distributors who distribute products within a particular end-user market, such as oncology clinics. GPOs and specialty distributors generally enter into collective product purchasing agreements with pharmaceutical suppliers in an effort to secure more favorable drug pricing on behalf of their members.
We began in 1996 with an initial focus on U.S. marketing and distribution of generic pharmaceutical products manufactured by others. In June 1998, we acquired Fujisawa USA, Inc.’s generic injectable pharmaceutical business, including manufacturing facilities in Melrose Park, Illinois and Grand Island, New York and a research and development facility in Melrose Park, Illinois. We also acquired additional assets in this transaction, including inventories, plant and equipment and abbreviated new drug applications that were approved by or pending with the FDA.
On April 18, 2006, we completed a merger with American BioScience, Inc., or ABI, our former parent. In connection with the closing of that merger, our certificate of incorporation was amended to change our original name of American Pharmaceutical Partners, Inc. to Abraxis BioScience, Inc. Old Abraxis was operated as two distinct business segments: the proprietary business and the hospital-based business.
On November 13, 2007, Old Abraxis was separated into two independent publicly-traded companies: our company, APP Pharmaceuticals, Inc., which owns and operates the hospital-based business; and the other which owns and operates the proprietary business. We refer to the proprietary business following the separation as “New Abraxis,” which subsequently changed its name to Abraxis BioScience, Inc. We continue to operate the hospital-based business (which we refer to as “New APP” following the separation) under the name APP Pharmaceuticals, Inc. Our common stock is traded and quoted on the NASDAQ Global Market under the symbol “APPX.”
New APP and New Abraxis entered into a series of agreements in connection with the separation, including a separation and distribution agreement, a transition services agreement, an employee matters agreement, a tax allocation agreement, a manufacturing agreement and various real estate leases. Please refer toNote 7—Related Parties for additional information on the separation related agreements. Also, in connection with the separation, we incurred $1 billion of indebtedness and, in addition, entered into a $150 million revolving credit facility. $700 million of the proceeds from this indebtedness was contributed to New Abraxis, approximately $12 million was used to pay fees and expenses related to the debt financing, approximately $276 million of the proceeds was
2
used to repay in full the then existing revolving credit facility and the remainder was retained by New APP. New APP is solely responsible for servicing the debt. Please refer toItem 8—Financial Statements and Supplementary Data Note 3—Spin-off of New Abraxis in the accompanying audited consolidated financial statements for further details.
Our Products
Injectable Oncology Products
We presently manufacture and market 17 injectable oncology products in 38 dosages and formulations. According to IMS Health, Inc., or IMS, a pharmaceutical market research firm, during 2007 we were the market leader for four of these products in terms of units sold in the United States. Net revenue of our injectable oncology products was $55.3 million in 2007 and represented 9 % of total 2007 revenue.
Our oncology products include:
Carboplatin. Carboplatin is indicated for the initial treatment of advanced ovarian carcinoma in combination with other chemotherapeutic agents and for the palliative treatment of recurrent ovarian carcinoma after prior chemotherapy. Carboplatin is the generic equivalent of Bristol-Myers Squibb Company’s Paraplatin®. We launched the liquid and lyophilized versions of carboplatin in October 2004, and we received approval for the liquid, 600 mg, multi-dose vial form of the product in February 2006.
Doxorubicin. Doxorubicin is indicated for use in adjuvant therapy for the treatment of breast cancer where there is evidence of axillary lymph node involvement following tumor resection. Doxorubicin has been successful in producing regression in disseminated neoplastic conditions, including several types of leukemias, ovarian, breast and bladder cancers as well as Hodgkin’s disease. Doxorubicin is the generic equivalent of Pharmacia & Upjohn Company’s Adriamycin®. We launched the liquid version of doxorubicin in August 2007.
Fludarabine. Fludarabine is indicated for the treatment of adult patients with B-cell chronic lymphocytic leukemia whose disease is unresponsive, or has progressed, despite treatment with an alkylinating-agent containing regimen. We launched fludarabine in October 2007.
Fluorouracil. Fluorouracil is part of a class of drugs known as “antineoplastics” which are used in the treatment of various cancers to slow or stop the growth of cancer cells. Fluorouracil is indicated for the palliative management of carcinoma of the colon, rectum, breast, stomach and pancreas and is the generic equivalent of Sicor Pharmaceuticals’ Adrucil®. We launched the fluorouracil in December 1998.
Ifosfamide.Ifosfamide is a chemotherapy drug used to treat germ cell testicular cancer and is often given in combination with Mesna. Bristol-Myers originally marketed ifosfamide under the brand name Ifex®. In response to customer requests, we were the first to offer individually packaged generic ifosfamide; our lyophilized form eliminated the need for the refrigerated storage required by the previous generic ifosfamide/mesna kit packaging. We launched ifosfamide in July 2002 with 180-day exclusivity.
Mesna. Mesna is a cytoprotectant used to treat the side effects associated with certain chemotherapy drugs. Bristol-Myers originally marketed mesna under the brand name Mesnex®. Launched in May 2001, we were the first to market a generic version of mesna.
Injectable Anti-Infective Products
We manufacture and market 21 injectable anti-infective products. According to IMS, we were the United States market leader for ten injectable anti-infective products in terms of units or dollars sold during 2007. Our injectable anti-infective products generated net revenues of $193.7 million in 2007 and represented 30% of 2007 total net revenues.
We believe we offer one of the most comprehensive portfolios of injectable anti-infective products, including eleven different classes of antimicrobials. We believe we are the only generic pharmaceutical company
3
that owns and operates a dedicated cephalosporins manufacturing facility in the United States. The FDA requires dedicated facilities for the manufacture of cephalosporins. We believe that we currently offer the broadest portfolio of generic cephalosporins. According to IMS, the 2007 markets for first, second and third generation cephalosporins exceeded $300 million.
Our anti-infective product line includes:
Ampicillin.Ampicillin is a penicillin based antibiotic, which treats various types of infections of the skin, central nervous system, heart, respiratory tract, sinuses, ear and kidney.
Ampicillin and Sulbactam. Ampicillin and Sulbactam is an injectable antibacterial combination consisting of the seminsynthetic antibiotic ampicillin sodium and the beta-lactamase inhibitor sulbactam sodium. Administered intravenously or intramuscular, Ampicillin and Sulbactam is indicated for the treatment of several skin and skin structure, intra-abdominal and gynecological infections due to susceptible strains of microorganisms. Ampicillin and Sulbactam is the generic equivalent of Pfizer Inc.’s Unasyn®. We launched this product in November 2006.
Azithromycin. Azithromycin is indicated for the treatment of community-acquired pneumonia and pelvic inflammatory disease when caused by susceptible microorganisms. Azithromycin is the generic equivalent of Pfizer Inc.’s Zithromax®. We launched this product in February 2006.
Cefotetan.Cefotetan is a second-generation cephalosporin with a broad range of anti-microbial activity. Cefotetan is often used for surgical prophylaxis and offers the longest half-life of any cephalopsorin. AstraZeneca marketed the innovator product under the brand name Cefotan®. We launched cefotetan in September 2007 and are currently the only company to market cefotetan in the United States.
Vancomycin.Vancomycin is an antibiotic used to treat some types of Staph, Strep or other infections, particularly in patients who are allergic to penicillins or cephalosporins. Eli Lilly originally marketed vancomycin under the brand name Vancocin®.
Injectable Critical Care Products
We manufacture and market more than 60 injectable critical care products, which includes the eight Anesthetic and Analgesics product families we acquired in June 2006. According to IMS, 13 of our critical products held first position and 9 held second position in the United States market in terms of units sold in 2007. Our critical care product line encompasses a wide range of products essential to hospitals and clinics, ranging from diluents, to heart medications, to steroidal products to sedatives. Our injectable critical care products generated net revenues of approximately $382.8 million for the year ended December 31, 2007. Products acquired in June 2006 totaled $180.7 million for the year ending December 31, 2007.
Our critical care products include:
Diprivan®.Diprivan® is a patent protected intravenous sedative-hypnotic agent and the first of a new class of intravenous anesthetic agents—the alkylphenols. Diprivan® is indicated for the induction of general anesthesia in adult and pediatric patients; maintenance of general anesthesia in adult and pediatric patients; and intensive care unit sedation for intubated, mechanically ventilated adults. Zeneca Pharmaceuticals first commercially introduced Diprivan® in the United States in 1989, and we purchased this product from AstraZeneca in June 2006. Diprivan® maintains the number one unit and dollar position in the US market.
Heparin. Injectable heparin is a blood thinner used to prevent and treat blood clotting, especially during and after surgery. We manufacture one of the most comprehensive lines of injectable therapeutic heparin. According to 2007 IMS data, we currently hold the number one unit and dollar share position for injectable therapeutic heparin. The U.S. market for injectable therapeutic heparin vials was 80 million units in 2007.
Naropin®.Naropin® is a patent protected long-acting local anesthetic that contains ropivicaine HCI, which is a member of the amino amide class of local anesthetics. Naropin® is indicated for the production of local
4
or regional anesthesia for surgery and for acute pain management. AstraZeneca developed Naropin®, and we purchased this product from AstraZeneca in June 2006.
Oxytocin. Oxytocin is used to induce labor at term and control postpartum bleeding. Wyeth-Ayerst originally marketed oxytocin under the brand name Pitocin®. We currently hold the number one unit and dollar share position for oxytocin in the US market.
Recent Developments
In the first quarter of 2008, a major supplier of heparin announced the recall of all the heparin sodium injection and heparin flush products that they were offering to the market. In response to FDA and hospital concerns about a potential shortage of therapeutic heparin, we announced that we would immediately increase manufacturing of this product. Since that time, we have has ramped up production to a level we believe is sufficient to meet the entire U.S. market demand.
Injectable Pharmaceutical Products under Development
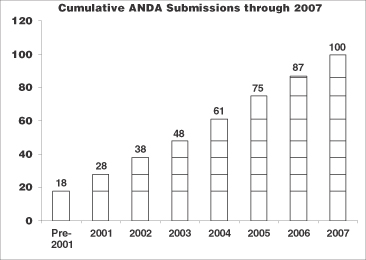
We believe that we are currently the leader in injectable ANDA drug approvals. Since June 1, 1998, when we acquired 14 pending abbreviated new drug applications, or ANDA’s, we have filed 100 applications with the FDA and received a total of 83 product approvals.
5
We currently have over 30 ANDA’s pending with the FDA and over 70 product candidates under development across our oncology, anti-infective and critical care product categories. In 2007, we received 11 ANDA approvals and 4 tentative approvals and in 2008 have received 4 approvals to date.

Research and Development
We have approximately 72 employees dedicated to product development who have expertise in areas such as pharmaceutical formulation, analytical chemistry and drug delivery. We currently lease and operate 48,000 square feet in a research and development facility in Melrose Park, Illinois. In 2006, the Melrose Park facility underwent a major renovation, reconfiguration and expansion to enhance our development capabilities.
When developing new products, we consider a variety of factors, including:
| | • | | potential pricing and gross margins; |
| | • | | existing and potential market size; |
| | • | | high barriers to entry; |
| | • | | patent expiration date; |
| | • | | our manufacturing capabilities and access to raw materials; |
| | • | | potential development and competitive challenges; and |
| | • | | whether these products complement our existing products and the opportunity to leverage these products with the development of additional products. |
We have made, and will continue to make, substantial investment in research and development. Research and development costs for the years ended December 31, 2007 and 2006 totaled $46.5 million and $27.8 million, respectively.
Sales and Marketing
Our products are primarily marketed by a dedicated sales force to hospitals, long-term care facilities, alternate care sites, clinics and doctors who administer injectable products in their offices. Many purchases by these buyers are made through arrangements with GPOs, which negotiate collective purchasing agreements on behalf of their members, or through specialty distributors, which specialize in particular therapeutic categories such as oncology. We sell to members of all of the major GPOs in the United States, which we believe
6
collectively represent over 95% of all hospital-based pharmaceutical purchasers in the United States. We also sell products to the leading specialty distributors. We believe we have access to nearly 100% of the buyers of injectable products in the United States. Our sales force is comprised of approximately 36 field sales and national accounts professionals, supported by our customer service and sales support groups. Our representatives typically have substantial injectable pharmaceutical sales experience in the geographic region in which they operate.
We currently derive, and expect to continue to derive, a large percentage of our revenue from customers that are members of a small number of GPOs. Currently, fewer than ten GPOs control a large majority of sales to hospital customers. We have purchasing arrangements with the major GPOs in the United States, including AmeriNet, Inc., Broadlane Healthcare Corporation, Consorta, Inc., MedAssets Inc., Novation, LLC, Owen Healthcare, Inc., PACT, LLC, Premier Purchasing Partners, LP, International Oncology Network, or ION, National Oncology Alliance, or NOA and U.S. Oncology, Inc. In order to maintain these relationships, we believe we need to be a reliable supplier, offer a broad product line, remain price competitive, comply with FDA regulations and provide high-quality products. Our GPO agreements are typically multi-year in duration and may be terminated on short notice.
Competition
Competition among pharmaceutical and other companies that develop, manufacture or market pharmaceutical products is intense. We compete with these entities in all areas of business, including competing to attract and retain qualified scientific and technical personnel.
We face competition from major, brand name pharmaceutical companies as well as generic manufacturers such as Hospira, Inc., Bedford Laboratories, Baxter Laboratories (including Elkin-Sinn), SICOR Inc. (acquired by Teva Pharmaceuticals USA), Mayne Pharma (acquired by Hospira, Inc.) and increased competition from new, overseas competitors.
Revenue and gross profit derived from sales of generic pharmaceutical products tend to follow a pattern based on regulatory and competitive factors. As patents for brand name products and related exclusivity periods expire, the first generic pharmaceutical manufacturer to receive regulatory approval for generic versions of these products is generally able to achieve significant market penetration and higher margins. As competing generic manufacturers receive regulatory approvals on similar products, market share, revenue and gross profit typically decline. The level of market share, revenue and gross profit attributable to a particular generic pharmaceutical product is normally related to the number of competitors in that product’s market and the timing of that product’s regulatory approval and launch in relation to competing approvals and launches. We continue to develop and introduce new products in a timely and cost-effective manner and identify niche products with significant barriers to entry in order to maintain our revenue and gross margins.
Regulatory Considerations
Prescription pharmaceutical products are subject to extensive pre- and post-market regulation by the FDA, including regulations that govern the testing, manufacturing, safety, efficacy, labeling, storage, record keeping, advertising and promotion of the products under the Federal Food Drug and Cosmetic Act and the Public Health Services Act, and by comparable agencies in foreign countries. FDA approval is required before any dosage form of any drug can be marketed in the United States. All applications for FDA approval must contain information relating to pharmaceutical formulation, stability, manufacturing, processing, packaging, labeling and quality control.
Generic Drug Approval
The Drug Price Competition and Patent Term Restoration Act of 1984, or the Hatch-Waxman Act, established abbreviated FDA approval procedures for those drugs that are no longer protected by patents and
7
which are shown to be equivalent to previously approved proprietary drugs. Approval to manufacture these drugs is obtained by filing an abbreviated new drug application, or an ANDA. An ANDA is a comprehensive submission that must contain data and information pertaining to the active pharmaceutical ingredient, drug product formulation, specifications and stability of the generic drug, as well as analytical methods, manufacturing process validation data and quality control procedures. As a substitute for clinical studies, the FDA may require data indicating that the ANDA drug formulation is equivalent to a previously approved proprietary drug. In order to obtain an ANDA approval of strength or dosage form that differs from the referenced brand name drug, an applicant must file and have granted an ANDA Suitability Petition. A product is not eligible for ANDA approval if it is not determined by the FDA to be equivalent to the referenced brand name drug or if it is intended for a different use. However, such a product might be approved under a New Drug Application, or an NDA, with supportive data from clinical trials.
One advantage of the ANDA approval process is that an ANDA applicant generally can rely upon equivalence data in lieu of conducting pre-clinical testing and clinical trials to demonstrate that a product is safe and effective for its intended use. We generally file ANDAs to obtain approval to manufacture and market our generic products. No assurance can be given that ANDAs submitted for our products will receive FDA approval on a timely basis, if at all.
New Drug Approval
The process required by the FDA before a new drug may be marketed in the United States generally involves:
| | • | | completion of pre-clinical laboratory and animal testing; |
| | • | | submission of an investigational new drug application, or IND, which must become effective before trials may begin; |
| | • | | performance of adequate and well-controlled human clinical trials to establish the safety and efficacy of the proposed drug product’s intended use; and |
| | • | | submission to and approval by the FDA of a new drug application, or NDA. |
Clinical trials are typically conducted in three sequential phases that may overlap. These phases generally include:
| | • | | Phase I during which the drug is introduced into healthy human subjects or, on occasion, patients, and generally is tested for safety, stability, dose tolerance and metabolism; |
| | • | | Phase II during which the drug is introduced into a limited patient population to determine the efficacy of the product in specific targeted diseases, to determine dosage tolerance and optimal dosage and to identify possible adverse effects and safety risks; and |
| | • | | Phase III during which the clinical trial is expanded to a more diverse patient group in geographically dispersed trial sites to further evaluate clinical efficacy, optimal dosage and safety. |
The drug sponsor, the FDA or the Institutional Review Board at each institution at which a clinical trial is being performed may suspend a clinical trial at any time for various reasons, including a belief that the subjects are being exposed to an unacceptable health risk.
The results of product development, preclinical animal studies and human studies are submitted to the FDA as part of the NDA. The NDA also must contain extensive manufacturing information. The FDA may approve on the basis of the submission made or disapprove the NDA if applicable FDA regulatory criteria are not satisfied. The FDA may also require additional clinical data. Under certain circumstances, drug sponsors may obtain approval pursuant to Section 505(b)(2) of the Federal Food, Drug & Cosmetic Act based in part upon literature or an FDA finding and/or effectiveness for another approved product, even where the products are not duplicates in
8
terms of chemistry and bioequivalence. Once approved, the FDA may withdraw the product approval if compliance with pre- and post-market regulatory standards is not maintained or if problems occur after the product reaches the marketplace. In addition, the FDA may require post-marketing studies to monitor the effect of approved products and may limit further marketing of the product based on the results of these post-marketing studies. The FDA has broad post-market regulatory and enforcement powers, including the ability to levy fines and civil penalties, suspend or delay issuance of approvals, seize or recall products, and withdraw approvals.
Satisfaction of FDA pre-market approval requirements typically takes several years and the actual time required may vary substantially based upon the type, complexity and novelty of the product or disease. Government regulation may delay or prevent marketing of potential products for a considerable period of time and impose costly procedures upon a manufacturer’s activities. Success in early stage clinical trials does not assure success in later stage clinical trials. Data obtained from clinical activities is not always conclusive and may be susceptible to varying interpretations that could delay, limit or prevent regulatory approval. Even if a product receives regulatory approval, later discovery of previously unknown problems with a product may result in restrictions on the product or even complete withdrawal of the product from the market.
In addition to regulating and auditing human clinical trials, the FDA regulates and inspects equipment, facilities, laboratories, and processes used in the manufacturing and testing of such products prior to providing approval to market a product. If after receiving clearance from the FDA, a material change is made in manufacturing equipment, location or process, additional regulatory review may be required. Our manufacturers also must adhere to current Good Manufacturing Practice and product-specific regulations enforced by the FDA through its facilities inspection program. The FDA also conducts regular, periodic visits to re-inspect equipment, facilities, laboratories and processes following the initial approval. If, as a result of these inspections, the FDA determines that the equipment, facilities, laboratories, or processes of our manufacturers do not comply with applicable FDA regulations and conditions of product approval, the FDA may seek civil, criminal, or administrative sanctions and/or remedies against our manufacturers, including the suspension of manufacturing operations.
We are also subject to various federal and state laws pertaining to health care “fraud and abuse,” including anti-kickback laws and false claims laws. Anti-kickback laws make it illegal to solicit, offer, receive, or pay any remuneration in exchange for, or to induce, the referral of business, including the purchase or prescription of a particular drug. The federal government has published regulations that identify “safe harbors” or exemptions for certain arrangements that do not violate the anti-kickback statutes. Due to the breadth of the statutory provisions and the absence of guidance in the form of regulations or court decisions addressing some of practices, it is possible that our practices might be challenged under anti-kickback or similar laws. False claims laws prohibit anyone from knowingly and willingly presenting, or causing to be presented for payment to third party payers (including Medicare and Medicaid), claims for reimbursed drugs or services that are false or fraudulent, claims for items or services not provided as claimed, or claims for medically unnecessary items or services. The activities of our strategic partners relating to the sale and marketing of our products may be subject to scrutiny under these laws. Violations of fraud and abuse laws may be punishable by criminal and/or civil sanctions, including fines and civil monetary penalties, as well as the possibility of exclusion from federal health care programs (including Medicare and Medicaid). If the government were to allege against or convict us of violating these laws, there could be a material adverse effect on us. Our activities could be subject to challenge for the reasons discussed above and due to the broad scope of these laws and the increasing attention being given to them by law enforcement authorities.
We are also subject to regulation under the Occupational Safety and Health Act, the Toxic Substances Control Act, the Resource Conservation and Recovery Act, and other current and potential future federal, state, or local laws, rules, and/or regulations. Our research and development activities involve the controlled use of chemicals, biological materials and other hazardous materials. We believe that our procedures comply with the standards prescribed by federal, state, or local laws, rules, and/or regulations; however, the risk of injury or accidental contamination cannot be completely eliminated.
9
Manufacturing
Our manufacturing operations are located in Melrose Park, Illinois, Grand Island, New York, and Barceloneta, Puerto Rico. The Puerto Rico facility, which we acquired from Pfizer Inc. in February 2007, consists of a validated manufacturing plant with capabilities of producing EU and US compliant injectable pharmaceuticals, as well as protein based biologics and metered dosed inhalers. We began commercial manufacturing from our Puerto Rico facility in the second half of 2007. These manufacturing facilities, which include dedicated cephalosporin powder filling, liquid filling line and oncolytic manufacturing suites, have in the aggregate approximately 848,500 square feet of manufacturing, packaging, laboratory, office and warehouse space.
We can produce a broad range of dosage formulations, including lyophilized products, liquids, both aseptically filled and terminally sterilized, and powders. We currently produce approximately 190 million vials of product per year and have the capacity to produce 250 million vials of product per year.
Since 1998, we increased our capacity from three to 14 lyophilizers with an additional four presently pending installation. This increased lyophilizer capacity has enhanced our ability to deliver on our product pipeline.
In addition to manufacturing, we have fully integrated manufacturing support systems, including quality assurance, quality control, regulatory affairs and inventory control. These support systems enable us to maintain high standards of quality for our products and simultaneously deliver reliable services and goods to our customers on a timely basis.
We are required to comply with the applicable FDA manufacturing requirements contained in the FDA’s current Good Manufacturing Practice, or cGMP, regulations. cGMP regulations require quality control and quality assurance as well as the corresponding maintenance of records and documentation. Our manufacturing facilities must meet cGMP requirements to permit us to manufacture our products. We are subject to the periodic inspection of our facilities, procedures and operations and/or the testing of our products by the FDA, the Drug Enforcement Administration and other authorities to assess our compliance with applicable regulations.
Failure to comply with the statutory and regulatory requirements subjects the manufacturer to possible legal or regulatory action, including the seizure or recall of products, injunctions, consent decrees placing significant restrictions on or suspending manufacturing operations, and civil and criminal penalties. Adverse experiences with the product must be reported to the FDA and could result in the imposition of market restriction through labeling changes or in product removal. Product approvals may be withdrawn if compliance with regulatory requirements is not maintained or if problems concerning safety or efficacy of the product occur following approval.
Raw Materials
The manufacture of our products requires raw materials and other components that must meet stringent FDA requirements. Some of these raw materials and other components currently are available only from a limited number of sources. Additionally, regulatory approvals for a particular product denote the raw materials and components, and the suppliers for such materials that may be used for that product. Even when more than one supplier exists, we may elect to list, and in some cases have only listed, one supplier in our applications with the FDA. Any change in or addition of a supplier not previously approved must then be submitted through a formal approval process with the FDA. From time to time, it is necessary to maintain increased levels of certain raw materials due to the anticipation of raw material shortages or in response to market opportunities.
Intellectual Property
We rely on trade secrets, unpatented proprietary know-how, continuing technological innovation and patent protection to preserve our competitive position. Our success depends on our ability to operate without infringing the patents and proprietary rights of third parties. We cannot determine with certainty whether patents or patent applications of other parties will materially affect our ability to make, use or sell any products. A number of
10
pharmaceutical companies, biotechnology companies, universities and research institutions may have filed patent applications or may have been granted patents that cover aspects of our or our licensors’ products, product candidates or other technologies.
Intellectual property protection is highly uncertain and involves complex legal and factual questions. Our patents and those for which we have or will license rights may be challenged, invalidated, infringed or circumvented, and the rights granted in those patents may not provide proprietary protection or competitive advantages to us. We and our licensors may not be able to develop patentable products. Even if patent claims are allowed, the claims may not issue, or in the event of issuance, may not be sufficient to protect the technology owned by or licensed to us.
Third-party patent applications and patents could reduce the coverage of the patents licensed, or that may be licensed to or owned by us. If patents containing competitive or conflicting claims are issued to third parties, we may be enjoined from commercialization of products or be required to obtain licenses to these patents or to develop or obtain alternative technology. In addition, other parties may duplicate, design around or independently develop similar or alternative technologies to our licensors or ours.
Litigation may be necessary to enforce patents issued or licensed to us or to determine the scope or validity of another party’s proprietary rights. U.S. Patent and Trademark Office interference proceedings may be necessary if we and another party both claim to have invented the same subject matter. We could incur substantial costs and our management’s attention would be diverted if:
| | • | | patent litigation is brought by third parties; |
| | • | | we are party to or participate in patent suits brought against or initiated by our licensors; |
| | • | | we initiate similar suits; or |
| | • | | we are party to or participate in an interference proceeding. |
In addition, we may not prevail in any of these actions or proceedings.
Employees
As of December 31, 2007, we had a total of 1,375 full-time employees, of which 72 were engaged in research and development, 315 were in quality assurance and quality control, 779 were in manufacturing, 61 were in sales and marketing and 148 were in administration and finance. None of our employees are represented by a labor union or subject to a collective bargaining agreement. We have not experienced any work stoppage and consider our relations with our employees to be good.
Environment
We believe that our operations comply in all material respects with applicable laws and regulations concerning the environment. While it is impossible to predict accurately the future costs associated with environmental compliance and potential remediation activities, compliance with environmental laws is not expected to require significant capital expenditures and has not had, and is not expected to have, a material adverse effect on our earnings or competitive position.
Available Information
Our Internet address is www.apppharma.com. Our annual reports on Form 10-K, quarterly reports on Form 10-Q, current reports on Form 8-K and amendments to such reports, are available free of charge on our website as soon as reasonably practical after they are electronically filed or furnished to the SEC. The information found on our website shall not be deemed incorporated by reference by any general statement into any filing under the Securities Act of 1933 or under the Securities Exchange Act of 1934, except to the extent we specifically incorporate the information found on our website by reference, and shall not be deemed filed under such Acts.
11
The SEC also maintains an Internet site that contains reports, proxy and information statements, and other information about issuers that file reports electronically with the SEC. The address of that site is http://www.sec.gov.
You should carefully consider the risks described below before investing in our securities. The risks described below are not only risks unique to our company. Our business is also subject to the risks that affect many other companies, such as competition and general economic conditions. Additional risks not currently known to us or that we currently believe are immaterial also may impair our business operations and our liquidity.
Factors That May Affect Future Results of Operations
If we are unable to develop and commercialize new products, our financial condition will deteriorate.
Profit margins for a pharmaceutical product generally decline as new competitors enter the market. As a result, our future success will depend on our ability to commercialize the product candidates we are currently developing, as well as develop new products in a timely and cost-effective manner. We currently have over 30 ANDAs pending with the FDA and over 70 product candidates under development. Successful development and commercialization of our product candidates will require significant investment in many areas, including research and development and sales and marketing, and we may not realize a return on those investments. In addition, development and commercialization of new products are subject to inherent risks, including:
| | • | | failure to receive necessary regulatory approvals; |
| | • | | difficulty or impossibility of manufacture on a large scale; |
| | • | | prohibitive or uneconomical costs of marketing products; |
| | • | | inability to secure raw material or components from third-party vendors in sufficient quantity or quality or at a reasonable cost; |
| | • | | failure to be developed or commercialized prior to the successful marketing of similar or superior products by third parties; |
| | • | | lack of acceptance by customers; |
| | • | | impact of authorized generic competition; |
| | • | | infringement on the proprietary rights of third parties; |
| | • | | grant of new patents for existing products may be granted, which could prevent the introduction of newly-developed products for additional periods of time; and |
| | • | | grant to another manufacturer by the FDA of a 180-day period of marketing exclusivity under the Drug Price Competition and Patent Term Restoration Act of 1984, or the Hatch-Waxman Act, as patents or other exclusivity periods for brand name products expire. |
The timely and continuous introduction of new products is critical to our business. Our financial condition will deteriorate if we are unable to successfully develop and commercialize new products.
If sales of our key products decline, our business may be adversely affected.
Our top ten products comprised approximately 57% of our total revenue for the year ended December 31, 2007. Our key products could lose market share or revenue due to numerous factors, many of which are beyond our control, including:
| | • | | lower prices offered on similar products by other manufacturers; |
| | • | | substitute or alternative products or therapies; |
12
| | • | | development by others of new pharmaceutical products or treatments that are more effective than our products; |
| | • | | introduction of other generic equivalents or products which may be therapeutically interchanged with our products; |
| | • | | interruptions in manufacturing or supply; |
| | • | | changes in the prescribing practices of physicians; |
| | • | | changes in third-party reimbursement practices; and |
| | • | | migration of key customers to other manufacturers or sellers. |
Any factor adversely affecting the sale of our key products may cause our revenues to decline.
If we or our suppliers are unable to comply with ongoing and changing regulatory standards, sales of our products could be delayed or prevented.
Virtually all aspects of our business, including the development, testing, manufacturing, processing, quality, safety, efficacy, packaging, labeling, record-keeping, distribution, storage and advertising and promotion of our products and disposal of waste products arising from these activities, are subject to extensive regulation by federal, state and local governmental authorities in the United States, including the FDA and the Department of Health and Humans Services Office of Inspector General (OIG). Our business is also subject to regulation in foreign countries. Compliance with these regulations is costly and time-consuming.
Our manufacturing facilities and procedures and those of our suppliers are subject to ongoing regulation, including periodic inspection by the FDA and foreign regulatory agencies. For example, manufacturers of pharmaceutical products must comply with detailed regulations governing current good manufacturing practices, including requirements relating to quality control and quality assurance. We must spend funds, time and effort in the areas of production, safety, quality control and quality assurance to ensure compliance with these regulations. We cannot assure that our manufacturing facilities or those of our suppliers will not be subject to regulatory action in the future.
Our products generally must receive appropriate regulatory clearance before they can be sold in a particular country, including the United States. We may encounter delays in the introduction of a product as a result of, among other things, insufficient or incomplete submissions to the FDA for approval of a product, objections by another company with respect to our submissions for approval, new patents by other companies, patent challenges by other companies which result in a 180-day exclusivity period, and changes in regulatory policy during the period of product development or during the regulatory approval process. The FDA has the authority to revoke drug approvals previously granted and remove from the market previously approved products for various reasons, including issues related to current good manufacturing practices for that particular product or in general. We may be subject from time to time to product recalls initiated by us or by the FDA. Delays in obtaining regulatory approvals, the revocation of a prior approval, or product recalls could impose significant costs on us and adversely affect our ability to generate revenue.
Our inability or the inability of our suppliers to comply with applicable FDA and other regulatory requirements can result in, among other things, warning letters, fines, consent decrees restricting or suspending our manufacturing operations, delay of approvals for new products, injunctions, civil penalties, recall or seizure of products, total or partial suspension of sales and criminal prosecution. Any of these or other regulatory actions could materially adversely affect our business and financial condition.
State pharmaceutical marketing compliance and reporting requirements may expose us to regulatory and legal action by state governments or other government authorities.
In recent years, several states, including California, Vermont, Maine, Minnesota, New Mexico and West Virginia, in addition to the District of Columbia, have enacted legislation requiring pharmaceutical companies to
13
establish marketing compliance programs and file periodic reports on sales, marketing, pricing and other activities. Similar legislation is being considered in other states. Many of these requirements are new and uncertain, and available guidance is limited. We are continuing to assess our compliance with these state laws. Unless we are in full compliance with these laws, we could face enforcement action and fines and other penalties and could receive adverse publicity, all of which could harm our business.
We may be required to change the labeling of our products if side effects or manufacturing problems are identified after the products are on the market.
If side effects are identified after any of our products are on the market, or if manufacturing problems occur, regulatory approval may be withdrawn and reformulation of products, additional clinical trials, changes in labeling of products, and changes to or re-approvals of our manufacturing facilities may be required, any of which could have a material adverse effect on sales of the affected products and on our business and results of operations. For example, a supplier recently initiated a recall of its heparin product due to increased adverse events associated with the product.
After any of our products are approved for commercial use, we or regulatory bodies could decide that changes to our product labeling are required. Label changes may be necessary for a number of reasons, including the identification of actual or theoretical safety or efficacy concerns by regulatory agencies or the discovery of significant problems with a similar product that implicates an entire class of products. Any significant concerns raised about the safety or efficacy of our products could also result in the need to reformulate those products, to conduct additional clinical trials, to make changes to our manufacturing processes, or to seek re-approval of our manufacturing facilities. Significant concerns about the safety and effectiveness of a product could ultimately lead to the revocation of its marketing approval. The revision of product labeling or the regulatory actions described above could be required even if there is no clearly established connection between the product and the safety or efficacy concerns that have been raised. The revision of product labeling or the regulatory actions described above could have a material adverse effect on sales of the affected products and on our business and results of operations.
The manufacture of our products is highly exacting and complex, and if we or our suppliers encounter production problems, our business may suffer.
Almost all of the pharmaceutical products we make are sterile, injectable drugs. We also purchase some such products from other companies. The manufacture of all our products is highly exacting and complex, due in part to strict regulatory requirements and standards which govern both the manufacture of a particular product and the manufacture of these types of products in general. Problems may arise during their manufacture due to a variety of reasons including equipment malfunction, failure to follow specific protocols and procedures and environmental factors. If problems arise during the production of a batch of product, that batch of product may have to be discarded. This could, among other things, lead to loss of the cost of raw materials and components used, lost revenue, time and expense spent in investigating the cause and, depending on the cause, similar losses with respect to other batches or products. If such problems are not discovered before the product is released to the market, recall costs may also be incurred. To the extent we experience problems in the production of our pharmaceutical products, this may be detrimental to our business, operating results and reputation. Additionally, we could incur additional costs if we fail to timely transfer products to our Puerto Rico manufacturing facility.
Our markets are highly competitive and, if we are unable to compete successfully, our revenue will decline and our business will be harmed.
The markets for injectable pharmaceutical products are highly competitive, rapidly changing and undergoing consolidation. Most of our products are generic injectable versions of brand name products that are still being marketed by proprietary pharmaceutical companies. The first company to market a generic product is often initially able to achieve high sales, profitability and market share with respect to that product. Prices, revenue and market size for a product typically decline, however, as additional generic manufacturers enter the market.
14
We face competition from major, brand name pharmaceutical companies as well as generic manufacturers such as Hospira, Inc., Bedford Laboratories, Baxter Laboratories (including Elkin-Sinn), SICOR Inc. (acquired by Teva Pharmaceuticals USA) and Mayne Pharma (acquired by Hospira, Inc.) and, in the future, increased competition from new, foreign competitors. Smaller and foreign companies may also prove to be significant competitors, particularly through collaboration arrangements with large and established companies. Many of our competitors have significantly greater research and development, financial, sales and marketing, manufacturing, regulatory and other resources than us. As a result, they may be able to devote greater resources to the development, manufacture, marketing or sale of their products, receive greater resources and support for their products, initiate or withstand substantial price competition, more readily take advantage of acquisition or other opportunities, or otherwise more successfully market their products.
Any reduction in demand for our products could lead to a decrease in prices, fewer customer orders, reduced revenues, reduced margins, reduced levels of profitability, or loss of market share. These competitive pressures could adversely affect our business and operating results.
We face uncertainty related to pricing and reimbursement and health care reform.
In both domestic and foreign markets, sales of our products will depend in part on the availability of reimbursement from third-party payors such as government health administration authorities, private health insurers, health maintenance organizations and other health care-related organizations. However, reimbursement by such payors is presently undergoing reform, and there is significant uncertainty at this time how this will affect sales of certain pharmaceutical products. There is possible U.S. legislation or regulatory action affecting, among other things, pharmaceutical pricing and reimbursement, including under Medicaid and Medicare, the importation of prescription drugs that are marketed outside the U.S. and sold at prices that are regulated by governments of various foreign countries.
Medicare, Medicaid and other governmental reimbursement legislation or programs govern drug coverage and reimbursement levels in the United States. Federal law requires all pharmaceutical manufacturers to rebate a percentage of their revenue arising from Medicaid-reimbursed drug sales to individual states. Generic drug manufacturers’ agreements with federal and state governments provide that the manufacturer will remit to each state Medicaid agency, on a quarterly basis, 11% of the average manufacturer price for generic products marketed and sold under abbreviated new drug applications covered by the state’s Medicaid program. For proprietary products, which are marketed and sold under new drug applications, manufacturers are required to rebate the greater of (a) 15.1% of the average manufacturer price or (b) the difference between the average manufacturer price and the lowest manufacturer price for products sold during a specified period.
Both the federal and state governments in the United States and foreign governments continue to propose and pass new legislation, rules and regulations designed to contain or reduce the cost of health care. Existing regulations that affect the price of pharmaceutical and other medical products may also change before any of our products are approved for marketing. Cost control initiatives could decrease the price that we receive for any product we develop in the future. In addition, third-party payers are increasingly challenging the price and cost-effectiveness of medical products and services and litigation has been filed against a number of pharmaceutical companies in relation to these issues. Additionally, significant uncertainty exists as to the reimbursement status of newly approved injectable pharmaceutical products. Our products may not be considered cost effective or adequate third-party reimbursement may not be available to enable us to maintain price levels sufficient to realize an adequate return on our investment.
If we are unable to maintain our key customer arrangements, sales of our products and revenue would decline.
Almost all injectable pharmaceutical products are sold to customers through arrangements with group purchasing organizations, or GPOs, and distributors. The majority of hospitals contract with the GPO of their
15
choice for their purchasing needs. We currently derive, and expect to continue to derive, a large percentage of our revenue from customers that are members of a small number of GPOs. Currently, fewer than ten GPOs control a large majority of sales to hospital customers.
We have purchasing arrangements with the major GPOs in the United States, including AmeriNet, Inc., Broadlane Healthcare Corporation, Consorta, Inc., MedAssets Inc., Novation, LLC, Owen Healthcare, Inc., PACT, LLC, Premier Purchasing Partners, LP, International Oncology Network, or ION, National Oncology Alliance, or NOA, and U.S. Oncology, Inc. In order to maintain these relationships, we believe we need to be a reliable supplier, offer a broad product line, remain price competitive, comply with FDA regulations and provide high-quality products. The GPOs through which we sell our products also have purchasing agreements with other manufacturers that sell competing products and the bid process for products such as ours is highly competitive. Most of our GPO agreements may be terminated on short notice. If we are unable to maintain our arrangements with GPOs and key customers, sales of our products and revenue would decline.
The strategy to license rights to or acquire and commercialize proprietary or other specialty injectable products may not be successful, and we may never receive any return on our investment in these product candidates.
We may license rights to or acquire or commercialize proprietary or other specialty injectable products or technologies. Other companies, including those with substantially greater financial and sales and marketing resources, will compete with us to license rights to or acquire or commercialize these products. We may not be able to license rights to or acquire these proprietary or other products or technologies on acceptable terms, if at all. Even if we obtain rights to a pharmaceutical product and commit to payment terms, including, in some cases, up-front license payments, we may not be able to generate product sales sufficient to create a profit or otherwise avoid a loss.
A product candidate may fail to result in a commercially successful drug for other reasons, including the possibility that the product candidate may:
| | • | | fail to receive necessary regulatory approvals; |
| | • | | be difficult or uneconomical to produce in commercial quantities; |
| | • | | be precluded from commercialization by proprietary rights of third parties; or |
| | • | | fail to achieve market acceptance. |
The marketing strategy, distribution channels and levels of competition with respect to any licensed or acquired product may be different from those of our current products, and we may not be able to compete favorably in any new product category.
Our chief executive officer and entities affiliated with him own a significant percentage of our common stock and could exercise significant influence over matters requiring stockholder approval, regardless of the wishes of other stockholders.
As of December 31, 2007, our chief executive officer and entities affiliated with him owned over 80% of our common stock. Accordingly, they have the ability to significantly influence all matters requiring stockholder approval, including the election and removal of directors and approval of significant corporate transactions such as mergers, consolidations and sales of assets. This concentration of ownership could have the effect of delaying, deferring or preventing a change in control or impeding a merger or consolidation, takeover or other business combination, which could cause the market price of our common stock to fall or prevent our stockholders from receiving a premium in such a transaction. This significant concentration of stock ownership may adversely affect the market for and trading price of our common stock if investors perceive that conflicts of interest may exist or arise.
16
We depend heavily on the principal members of our management team, the loss of whom could harm our business.
We depend heavily on the principal members of our management team. Each of the members of the executive management team is employed “at will.” The loss of the services of any member of the executive management team may significantly delay or prevent the achievement of product development or business objectives.
To be successful, we must attract, retain and motivate key employees, and the inability to do so could seriously harm our operations.
To be successful, we must attract, retain and motivate executives and other key employees. We face competition for qualified scientific, technical and other personnel, which may adversely affect our ability to attract and retain key personnel. We also must continue to attract and motivate employees and keep them focused on our strategies and goals.
We depend on third parties to supply raw materials and other components and may not be able to obtain sufficient quantities of these materials, which will limit our ability to manufacture our products on a timely basis and harm our operating results.
The manufacture of our products requires raw materials and other components that must meet stringent FDA requirements. Some of these raw materials and other components are available only from a limited number of sources. Additionally, our regulatory approvals for each particular product denote the raw materials and components, and the suppliers for such materials, we may use for that product. Obtaining approval to change, substitute or add a raw material or component, or the supplier of a raw material or component, can be time consuming and expensive, as testing and regulatory approval is necessary. If our suppliers are unable to deliver sufficient quantities of these materials on a timely basis or we encounter difficulties in our relationships with these suppliers, the manufacture and sale of our products may be disrupted, and our business, operating results and reputation could be adversely affected.
Other companies may claim that we infringe their intellectual property or proprietary rights, which could cause us to incur significant expenses or prevent us from selling our products.
Our success depends in part on our ability to operate without infringing the patents and proprietary rights of third parties. The manufacture, use, offer for sale and sale of pharmaceutical products have been subject to substantial litigation in the pharmaceutical industry. These lawsuits relate to the enforceability, validity and infringement of patents or proprietary rights of third parties. Infringement litigation is prevalent with respect to generic versions of products for which the patent covering the brand name product is expiring, particularly since many companies which market generic products focus their development efforts on products with expiring patents. A number of pharmaceutical companies, biotechnology companies, universities and research institutions may have filed patent applications or may have been granted patents that cover aspects of our products or our licensors’ products, product candidates or other technologies.
Future or existing patents issued to third parties may contain claims that conflict with our products. We are subject to infringement claims from time to time in the ordinary course of our business, and third parties could assert infringement claims against us in the future with respect to our current products, products we may develop or products we may license. In addition, our patents and patent applications, or those of our licensors, could face other challenges, such as interference, opposition and reexamination proceedings. Any such challenge, if successful, could result in the invalidation of, or a narrowing of scope of, any such patents and patent applications. Litigation or other proceedings could force us to:
| | • | | stop or delay selling, manufacturing or using products that incorporate or are made using the challenged intellectual property; |
17
| | • | | enter into licensing or royalty agreements that may not be available on acceptable terms, if at all. |
Any litigation or interference proceedings, regardless of their outcome, would likely delay the regulatory approval process, be costly and require significant time and attention of key management and technical personnel.
Our inability to protect our intellectual property rights in the United States and foreign countries could limit our ability to manufacture or sell our products.
We rely on trade secrets, unpatented proprietary know-how, continuing technological innovation and patent protection to preserve our competitive position. Our patents and those for which we have or will license rights, may be challenged, invalidated, infringed or circumvented, and the rights granted in those patents may not provide proprietary protection or competitive advantages to us. We and our licensors may not be able to develop patentable products. Even if patent claims are allowed, the claims may not issue, or in the event of issuance, may not be sufficient to protect the technology owned by or licensed to us. Third-party patents could reduce the coverage of the patents licensed, or that may be license to or owned by us. If patents containing competitive or conflicting claims are issued to third parties, we may be prevented from commercializing the products covered by such patents, or may be required to obtain or develop alternate technology. In addition, other parties may duplicate, design around or independently develop similar or alternative technologies.
We may not be able to prevent third parties from infringing or using our intellectual property. We generally control and limit access to, and the distribution of, our product documentation and other proprietary information. Despite our efforts to protect this proprietary information, however, unauthorized parties may obtain and use information that we regard as proprietary. Other parties may independently develop similar know-how or may even obtain access to our technologies.
The laws of some foreign countries do not protect proprietary information to the same extent as the laws of the United States, and many companies have encountered significant problems and costs in protecting their proprietary information in these foreign countries.
The U.S. Patent and Trademark Office and the courts have not established a consistent policy regarding the breadth of claims allowed in pharmaceutical patents. The allowance of broader claims may increase the incidence and cost of patent interference proceedings and the risk of infringement litigation. On the other hand, the allowance of narrower claims may limit the value of our proprietary rights.
We may become subject to federal false claims or other similar litigation brought by private individuals and the government.
The Federal False Claims Act allows persons meeting specified requirements to bring suit alleging false or fraudulent Medicare or Medicaid claims and to share in any amounts paid to the government in fines or settlement. These suits, known as qui tam actions, have increased significantly in recent years and have increased the risk that a health care company will have to defend a false claim action, pay fines and/or be excluded from Medicare and Medicaid programs. Federal false claims litigation can lead to civil monetary penalties, criminal fines and imprisonment and/or exclusion from participation in Medicare, Medicaid and other federally funded health programs. Other alternate theories of liability may also be available to private parties seeking redress for such claims. A number of parties have brought claims against numerous pharmaceutical manufacturers, and we cannot be certain that such claims will not be brought against us, or if they are brought, that such claims might not be successful.
18
We may need to change our business practices to comply with changes to, or may be subject to charges under, the fraud and abuse laws.
We are subject to various federal and state laws pertaining to health care fraud and abuse, including the federal Anti-Kickback Statute and its various state analogues, the federal False Claims Act and marketing and pricing laws. Violations of these laws are punishable by criminal and/or civil sanctions, including, in some instances, imprisonment and exclusion from participation in federal and state health care programs such as Medicare and Medicaid. We may have to change our advertising and promotional business practices, or our existing business practices could be challenged as unlawful due to changes in laws, regulations or rules or due to administrative or judicial findings, which could materially adversely affect our business.
We may be required to defend lawsuits or pay damages for product liability claims.
Product liability is a major risk in testing and marketing biotechnology and pharmaceutical products. We may face substantial product liability exposure in human clinical trials and for products that we sell after regulatory approval. Historically, we have carried product liability insurance and we expect to continue to carry such policies. Product liability claims, regardless of their merits, could exceed policy limits, divert management’s attention and adversely affect our reputation and the demand for our products.
Future sales of substantial amounts of our common stock may adversely affect our market price.
In connection with our 2006 merger with ABI, we issued a significant number of shares of our common stock to a small number of former ABI shareholders. Although such shares are not immediately freely tradable, we have granted registration rights to the former ABI shareholders, including our chief executive officer, to permit the resale of the shares of our common stock that they received in the merger. Future sales of substantial amounts of our common stock into the public market, or perceptions in the market that such sales could occur, may adversely affect the prevailing market price of our common stock.
Our stock price has been volatile in response to market and other factors.
The market price for our common stock has been and may continue to be volatile and subject to price and volume fluctuations in response to market and other factors, including the following, some of which are beyond our control:
| | • | | the concentration of the ownership of our shares by a limited number of affiliated stockholders may limit interest in our securities; |
| | • | | variations in quarterly operating results from the expectations of securities analysts or investors; |
| | • | | revisions in securities analysts’ estimates or reductions in security analysts’ coverage; |
| | • | | announcements of technological innovations or new products or services by us or our competitors; |
| | • | | reductions in the market share of our products; |
| | • | | announcements by us or our competitors of significant acquisitions, strategic partnerships, joint ventures or capital commitments; |
| | • | | general technological, market or economic trends; |
| | • | | investor perception of our industry or prospects; |
| | • | | insider selling or buying; |
| | • | | investors entering into short sale contracts; |
| | • | | regulatory developments affecting our industry; and |
| | • | | additions or departures of key personnel. |
19
Risks Relating to the Separation of New Abraxis from New APP
Debt incurred in connection with the separation could adversely affect our operations and financial condition.
We are leveraged as a result of the separation of New Abraxis. We have incurred $1 billion of indebtedness and have an additional $150 million revolving credit facility that is currently unused. $700 million of the proceeds of the indebtedness was contributed to New Abraxis in connection with the separation. Such indebtedness, coupled with the restrictions on our ability to issue equity securities due to the separation without jeopardizing the intended tax consequences of the separation, could have adverse consequences for our business, financial condition and results of operations, such as:
| | • | | making more difficult the satisfaction of our obligations to our lenders, resulting in possible defaults on and acceleration of such indebtedness; |
| | • | | limiting our ability to obtain additional financing to fund growth, working capital, capital expenditures, debt service requirements, acquisitions or other cash requirements; |
| | • | | limiting our operational flexibility in planning for or reacting to changing conditions in our business and industry; |
| | • | | requiring dedication of a substantial portion of our cash flows from operations to make payments on our debt, which would reduce the availability of such cash flows to fund working capital, capital expenditures and other general corporate purposes; |
| | • | | limiting our ability to compete with companies that are not as leveraged, or whose debt is at more favorable interest rates and that, as a result, may be better positioned to withstand economic downturns; and |
| | • | | increasing our vulnerability to economic downturns and changing market conditions or preventing us from carrying out capital spending that is necessary or important to our growth strategy and efforts to improve operating margins. |
We expect to pay our expenses and to pay the principal and interest on our outstanding debt with funds generated by our operations. Our ability to meet our expenses and debt service obligations will depend on our future performance, which will be affected by financial, business, economic and other factors, including potential changes in customer preferences, the success of product and marketing innovations and pressure from competitors. If we do not have enough money to pay our debt service obligations, we may be required to refinance all or part of our existing debt, sell assets or borrow more money. We may not be able to, at any given time, refinance our debt, sell assets or borrow more money on terms acceptable to us or at all, the failure to do any of which could have adverse consequences for our business, financial condition and results of operations.
The financing arrangements we entered into in connection with the separation contain restrictions and limitations that could impact our ability to operate our business.
Our agreements governing the indebtedness we incurred in connection with the separation contain covenants that, among other things, put limitations on our ability and/or one or more of our subsidiaries to dispose of assets, to incur additional indebtedness, to incur guarantee obligations, to pay dividends, to create liens on assets, to enter into sale and leaseback transactions, to make investments (including joint ventures), loans or advances, to engage in mergers, consolidations or sales of all or substantially all of their respective assets, to change the business conducted by us or engage in certain transactions with affiliates.
Various risks, uncertainties and events beyond our control could affect our ability to comply with the covenants contained in our debt agreements. Failure to comply with any of the covenants in our existing or future financing agreements could result in a default under those agreements and under other agreements containing cross-default provisions. A default would permit lenders to accelerate the maturity of the debt under these agreements and to foreclose upon any collateral securing the debt. Under these circumstances, we might not have
20
sufficient funds or other resources to satisfy all of our obligations. In addition, the limitations imposed by financing agreements on our ability to incur additional debt and to take other actions might impair our ability to obtain other financing. We cannot assure you that we will be granted waivers or amendments to these agreements if for any reason we are unable to comply with these agreements or that we will be able to refinance our debt on terms acceptable to us, or at all.
Specifically, the terms of the debt agreement include covenants such as:
| | • | | restrictions on acquisitions, which may limit our ability to make attractive acquisitions; |
| | • | | restrictions on investments, which may prevent us from investing in other companies or entering into joint ventures; |
| | • | | restrictions on guarantees, which may prevent us from providing commercially desirable credit support to suppliers, customers or other business partners; and |
| | • | | restrictions on incurrence of additional debt, which may further restrict our ability to make acquisitions or investments or to otherwise expand our business. |
Such restrictions in our debt agreement may prevent us from taking actions that would be in the best interest of our business, and may make it difficult to successfully execute our business strategy or effectively compete with companies that are not similarly restricted.
We cannot assure you that we will be able to generate sufficient cash flow needed to service our indebtedness.
Our ability to make scheduled payments on our indebtedness and to fund planned capital expenditures will depend on our ability and that of our subsidiaries to generate cash flow in the future. Our future performance is subject to general economic, financial, competitive, legislative, regulatory and other factors, many of which are beyond our control. We cannot assure you that our business will generate sufficient cash flow from operations or that future borrowings will be available in an amount sufficient to enable us to service this debt and fund our other liquidity needs.
If our cash flow and capital resources are insufficient to fund our debt service obligations, we may be forced to reduce or delay capital expenditures, sell assets or seek to obtain additional equity capital, or refinance indebtedness or obtain additional financing. In the future, our cash flow and capital resources may not be sufficient for payments of interest on and principal of this anticipated debt and there can be no assurance that any of, or a combination of, such alternative measures would provide us with sufficient cash flows. In addition, such alternative measures could have an adverse effect on our business, financial condition and results of operations. In the absence of sufficient operating results and resources, we could face substantial liquidity problems and might be required to dispose of material assets or operations to meet our anticipated debt service and other obligations or otherwise risk default under the agreements governing our anticipated indebtedness.
We may have potential conflicts of interest with New Abraxis.
Conflicts of interest may arise between New Abraxis and us in a number of areas relating to our past and ongoing relationships, including:
| | • | | business opportunities that may be attractive to both New Abraxis and us; |
| | • | | manufacturing and transitional service arrangements we entered into with New Abraxis; |
| | • | | lease agreements we entered into with New Abraxis; and |
| | • | | employee retention and recruiting. |
21
Our Chief Executive Officer and Chairman of our board of directors, Patrick Soon-Shiong, M.D., is also the chief executive officer and chairman of the board of directors of New Abraxis. Dr. Soon-Shiong also beneficially owns over 80% of the outstanding capital stock of New Abraxis. Accordingly, he may experience conflicts of interest with respect to decisions involving business opportunities and similar matters that may arise in the ordinary course of our business, on the one hand, and the business of New Abraxis, on the other hand.
We expect to resolve potential conflicts of interest on a case-by-case basis, in the manner required by applicable law and customary business practices. In connection with the separation and related transactions, we entered into an agreement with New Abraxis under which we and New Abraxis acknowledged and agreed that Dr. Soon-Shiong and Ms. Gopala may serve as an officer of both companies and receive compensation from either or both companies. We also acknowledged and agreed in this agreement that neither Dr. Soon-Shiong nor Ms. Gopala will have any obligation to present to our company any business or corporate opportunity that may come to his or her attention other than certain business opportunities relating to the manufacture or sale of products that either were manufactured and sold by the hospital-based products business prior to the separation or were the subject of an ANDA filed prior to the separation and related transactions. This agreement does not ensure the continued services of either Dr. Soon-Shiong or Ms. Gopala following the separation and related transactions, restrict these individuals from resigning from our company or restrict our board of directors from terminating their employment with us. In connection with the private letter ruling, Old Abraxis has represented to the Internal Revenue Service that no person will serve as an executive officer of both New Abraxis and New APP one year following the distribution. Resolutions of some potential conflicts of interest are subject to review and approval by the audit committee of our board of directors or approval by another independent committee of our board of directors. We still may be unable, however, to resolve some potential conflicts of interest with New Abraxis and Dr. Soon-Shiong and, even if we do, the resolution may be less favorable than if we were dealing with an unaffiliated party.
We may be required to indemnify New Abraxis and may not be able to collect on indemnification rights from New Abraxis.
Under the terms of the separation and distribution agreement, New Abraxis agreed to indemnify us from and after the distribution with respect to all liabilities of Old Abraxis not related to its hospital-based products business and the use by us of any trademarks or other source identifiers owned by New Abraxis. Similarly, we have agreed to indemnify New Abraxis from and after the distribution with respect to all liabilities of Old Abraxis related to its hospital-based products business and the use by us of any trademarks or other source identifiers owned by us. Under the terms of the tax allocation agreement, New Abraxis agrees to indemnify us against all tax liabilities to the extent they relate to the proprietary products business, and we agreed to indemnify New Abraxis against all liabilities to the extent they relate to the hospital-based products business. In addition, New Abraxis agreed to indemnify us for any taxes resulting from a failure of the distribution to qualify as a tax-free distribution under Section 355 and Section 368(a)(1)(D) of the Internal Revenue Code, unless such failure results solely from specified acts of us after the distribution. Under the terms of the manufacturing agreement, New Abraxis agreed to indemnify us from any damages resulting from a third-party claim caused by or alleged to be caused by (i) New Abraxis’ failure to perform its obligations under the manufacturing agreement; (ii) any product liability claim arising from the negligence, fraud or intentional misconduct of New Abraxis or any of its affiliates or any product liability claim arising from New Abraxis’ manufacturing obligations (or any failure or deficiency in New Abraxis’ manufacturing obligations) under the manufacturing agreement; (iii) any claim that the manufacture, use or sale of Abraxane® or our pipeline products infringes a patent or any other proprietary right of a third party; or (iv) any recall, product liability claim or other third-party claim not arising from the gross negligence or bad faith of, or intentional misconduct or intentional breach of the manufacturing agreement by, us by reason of the $100 million limitation of liability described below. New Abraxis also agreed to indemnify us for liabilities that it becomes subject to as a result of its activities under the manufacturing agreement and for which it is not responsible under the terms of the manufacturing agreement. We agreed to indemnify New Abraxis from any damages resulting from a third-party claim caused by or alleged to be caused by (i) our gross negligence, bad faith, intentional misconduct or intentional failure to perform our
22
obligations under the manufacturing agreement; or (ii) any product liability claim arising from the gross negligence or bad faith of, or intentional misconduct or intentional breach of the manufacturing agreement by, us. We generally will not have any liability for monetary damages to us or third parties in connection with the manufacturing agreement for damages in excess of $100 million in the aggregate. There are no time limits on when an indemnification claim must be brought and no other monetary limits on the amount of indemnification that may be provided. These indemnification obligations could be significant. Our ability to satisfy any of these indemnification obligations will depend upon the future financial strength of our company. We cannot determine whether we will have to indemnify New Abraxis for any substantial obligations after the separation. We also cannot assure you that, if New Abraxis becomes obligated to indemnify us for any substantial obligations, New Abraxis will have the ability to satisfy those obligations. Any indemnification payment by us, or any failure by New Abraxis to satisfy its indemnification obligations, could have a material adverse effect on our business.
If the holding company merger does not qualify as a reorganization under Section 368(a)(1) of the Internal Revenue Code, then Old Abraxis and Old Abraxis stockholders may be responsible for payment of significant U.S. federal income taxes, and if the distribution does not constitute a tax-free distribution under Section 355 of the Internal Revenue Code, then New APP and New APP stockholders may be responsible for payment of significant U.S. federal income taxes.
In connection with the separation, we received a private letter ruling from the Internal Revenue Service to the effect that (i) the merger of Old Abraxis into Abraxis BioScience, LLC, or the holding company merger, qualifies as a reorganization under Section 368(a)(1)(F) of the Internal Revenue Code and (ii) the contribution of Abraxis BioScience, LLC to New Abraxis, which we refer to as the “proprietary contribution,” the cash contribution and the distribution qualify as a reorganization under Section 368(a)(1)(D) of the Internal Revenue Code and, subject to the following sentence, the distribution qualifies for nonrecognition treatment under Sections 355(a) and 361(c) of the Internal Revenue Code. The private letter ruling, however, does not address two requirements under Section 355 of the Internal Revenue Code on which the Internal Revenue Service will not rule (namely, that the distribution (a) is motivated, in whole or substantial part, by one or more corporate business purposes and (b) is not being used principally as a device for the distribution of the earnings and profits of New APP, New Abraxis or both). Thus, we received an opinion of Fried, Frank, Harris, Shriver & Jacobson LLP to the effect that these two requirements should be satisfied.
The private letter ruling and opinion of counsel are based, in part on assumptions and representations as to factual matters made by, among others, Old Abraxis, Dr. Soon-Shiong, his wife, and certain Old Abraxis stockholders, as requested by the Internal Revenue Service or counsel, which, if incorrect, could jeopardize the conclusions reached by the Internal Revenue Service and counsel. The private letter ruling does not address certain material legal issues that could affect its conclusions (including whether the distribution is motivated, in whole or substantial part, by one or more corporate business purposes, whether the distribution is being used principally as a device for the distribution of the earnings and profits of New APP, New Abraxis or both, and whether the distribution and any acquisition or acquisitions are part of a plan or series of related transactions under Section 355(e) of the Internal Revenue Code), and reserves the right of the Internal Revenue Service to raise such issues upon a subsequent audit. Opinions of counsel neither bind the Internal Revenue Service or any court, nor preclude the Internal Revenue Service from adopting a contrary position.
If the holding company merger does not qualify as a reorganization under Section 368(a)(1) of the Internal Revenue Code, each Old Abraxis stockholder who received New APP common stock in exchange for Old Abraxis common stock will recognize taxable gain or loss equal to the difference between the fair market value of the Old Abraxis common stock received and such stockholder’s basis in the Old Abraxis common stock exchanged therefor, and Old Abraxis will recognize taxable gain equal to the fair market value of its assets over their aggregate adjusted basis.
If the distribution does not qualify as a tax-free distribution under Section 355 of the Internal Revenue Code, New APP would recognize taxable gain equal to the excess of the fair market value of the New Abraxis common
23
stock distributed to the Old Abraxis stockholders over New APP’s tax basis in the New Abraxis common stock. In addition, each Old Abraxis stockholder who receives New Abraxis common stock in the distribution would generally be treated as receiving a taxable distribution in an amount equal to the fair market value of the New Abraxis common stock received.
In the event that New APP recognizes a taxable gain in connection with the distribution because the distribution does not qualify as a tax-free distribution under Section 355 of the Internal Revenue Code, the taxable gain recognized by New APP would result in significant U.S. federal income tax liabilities to New APP. Under the Internal Revenue Code, New APP would be primarily liable for these taxes and New Abraxis would be secondarily liable. Under the terms of the tax allocation agreement among New APP, New APP LLC, New Abraxis and New Abraxis, LLC, New Abraxis will generally be required to indemnify New APP against any such taxes unless such taxes would not have been imposed but for an act of New APP or its affiliates, subject to specified exceptions. New Abraxis’ or New APP’s respective obligations to indemnify the other pursuant to the tax allocation agreement could have a material adverse effect on New APP and/or New Abraxis. In addition, these mutual indemnity obligations could discourage or prevent a third party from making a proposal to acquire either party.
The distribution may be taxable to New APP and New Abraxis if there is an acquisition of 50% or more of the outstanding common stock of New APP or New Abraxis.
Even if the distribution otherwise qualifies as a tax-free distribution under Section 355 of the Internal Revenue Code, under Section 355(e) of the Internal Revenue Code the distribution of New Abraxis common stock to Old Abraxis stockholders would result in significant U.S. federal income tax liabilities to New APP (but not New APP stockholders) if there is an acquisition of stock of New Abraxis or New APP as part of a plan or series of related transactions that includes the distribution and that results in an acquisition of 50% or more of the outstanding common stock of New Abraxis or New APP.
For purposes of determining whether the distribution of New Abraxis common stock to New APP stockholders in connection with the distribution is disqualified as tax-free to New APP under the rules described in the preceding paragraph, any acquisitions of the stock of New Abraxis or New APP within two years before or after the distribution are presumed to be part of a plan, although the parties may be able to rebut that presumption.
The process for determining whether a prohibited 50% or greater change in control has occurred under these rules is complex, inherently factual and subject to interpretation of the facts and circumstances of a particular case. If New Abraxis or New APP engages in a transaction involving the issuance or disposition or shares, or that otherwise creates a significant change in ownership, New APP would recognize taxable gain if such issuance, disposition or other change in ownership results in an acquisition of 50% or more of the outstanding common stock of New Abraxis or New APP. Furthermore, because a substantial portion of our stock and the stock of New APP will be held by or on behalf of a single stockholder, that stockholder will have the ability to cause or permit a prohibited change in the ownership of New APP or of New Abraxis to occur, which would also cause New APP to recognize a taxable gain under these rules. The private letter ruling and tax opinion obtained in connection with the separation does not address whether the distribution and any acquisition or acquisitions are part of a plan or series of related transactions under Section 355(e) of the Internal Revenue Code.
In the event that New APP recognizes a taxable gain in connection with the distribution because of an acquisition of 50% or more of the outstanding common stock of New Abraxis or New APP as part of a plan or series of related transactions that includes the distribution, the taxable gain recognized by New APP would result in significant U.S. federal income tax liabilities to New APP. Under the Internal Revenue Code, New APP would be primarily liable for these taxes and New Abraxis would be secondarily liable. Under the terms of the tax allocation agreement between New APP and New Abraxis, New Abraxis will generally be required to indemnify New APP against any such taxes unless such taxes would not have been imposed but for an act of New APP or its affiliates, subject to specified exceptions. New Abraxis’s or New APP’s respective obligations to indemnify
24
the other pursuant to the tax allocation agreement could have a material adverse effect on New APP and/or New Abraxis. There can be no assurance that New APP would be able to fulfill its obligations under the tax allocation agreement if New APP was determined to be responsible for these taxes. In addition, these mutual indemnity obligations could discourage or prevent a third party from making a proposal to acquire either party.
Actions taken by our chief executive officer, his wife, or entities affiliated with him or one or more members of his family could adversely affect the tax-free nature of the distribution.
Sales of New Abraxis common stock or New APP common stock by Dr. Soon-Shiong, his wife, or entities affiliated with Dr. Soon-Shiong or one or more members of his family after completion of the distribution may adversely affect the tax-free nature of the distribution. Sales of New Abraxis common stock or New APP common stock by Dr. Soon-Shiong, his wife, or entities affiliated with Dr. Soon-Shiong or one or more members of his family after completion of the distribution might be considered evidence that the distribution was used principally as a device for the distribution of earnings and profits of New APP, New Abraxis or both, particularly if it were determined that the selling stockholder had an intent to effect such sale at the time of the distribution. The obligation of the parties to effect the separation was conditioned upon the receipt of an opinion of Fried, Frank, Harris, Shriver & Jacobson LLP to the effect that, among other requirements, the distribution is not being used principally as a device for the distribution of earnings and profits of New APP, New Abraxis or both. If sales of New Abraxis common stock or New APP common stock by Dr. Soon-Shiong, his wife, or entities affiliated with Dr. Soon-Shiong or one or more members of his family occur after completion of the distribution, the conclusions reached in the opinion may not apply. Dr. Soon-Shiong, his wife and the entities that hold shares of Old Abraxis common stock on behalf of Dr. Soon-Shiong or one or more members of his immediate family have provided a representation to the Internal Revenue Service in connection with the private letter ruling that they have no plan or intention to sell, transfer or otherwise dispose of any of the shares of New Abraxis common stock and New APP common stock they will hold after the distribution. Dr. Soon-Shiong, his wife and such entities provided a similar representation to counsel in connection with counsel’s opinion. If the Internal Revenue Service successfully asserted that the distribution was used principally as a device for the distribution of earnings and profits of New APP, New Abraxis or both, the distribution would not qualify as a tax-free distribution, and thus would be taxable to both New APP and the New APP stockholders (as a result of which New Abraxis would be required to indemnify New APP to the extent required under the tax allocation agreement). Furthermore, sales of New Abraxis common stock or New APP common stock by Dr. Soon-Shiong, his wife, or entities affiliated with Dr. Soon-Shiong or one or more members of his family after completion of the distribution could cause a prohibited change in the ownership of New Abraxis or New APP to occur within the meaning of Section 355(e) of the Internal Revenue Code, which would cause New APP to recognize a taxable gain.
In the event that New APP recognizes a taxable gain in connection with the distribution because the distribution does not qualify as a tax-free distribution under Section 355 of the Internal Revenue Code or because of an acquisition of 50% or more of the outstanding common stock of New Abraxis or New APP as part of a plan or series of related transactions that includes the distribution within the meaning of Section 355(e) of the Internal Revenue Code, the taxable gain recognized by New APP would result in significant U.S. federal income tax liabilities to New APP. Under the Internal Revenue Code, New APP would be primarily liable for these taxes and New Abraxis would be secondarily liable. Under the terms of the tax allocation agreement among New APP, New APP LLC, New Abraxis and New Abraxis LLC, New Abraxis will generally be required to indemnify New APP against any such taxes unless such taxes would not have been imposed but for an act of New APP or its affiliates, subject to specified exceptions. New Abraxis’s or New APP’s respective obligations to indemnify the other pursuant to the tax allocation agreement could have a material adverse effect on New APP and/or New Abraxis. There can be no assurance that New APP would be able to fulfill its obligations under the tax allocation agreement if New APP was determined to be responsible for these taxes. In addition, these mutual indemnity obligations could discourage or prevent a third party from making a proposal to acquire either party.
| Item 1B. | UNRESOLVED STAFF COMMENTS |
None
25
We operate various facilities in the United States and Canada and Puerto Rico, which have an aggregate size of approximately 848,500 square feet.
| | | | | | | | |
Location | | Use | | Own/
Lease | | Lease Expiration | | Approximate
Square Feet |
Schaumburg, Illinois | | Administration | | Lease | | May 2016 | | 45,400 |
Ontario, Canada | | Business office | | Lease | | June 2014 | | 10,100 |
Melrose Park, Illinois | | Manufacturing(1) | | Lease | | December 2011 | | 122,000 |
Melrose Park, Illinois | | Research and Development | | Lease | | December, 2010 | | 48,000 |
Melrose Park, Illinois | | Warehouse and administrative | | Lease | | December, 2011 | | 71,000 |
Bensenville, Illinois | | Distribution facility | | Lease | | May 2016 | | 100,000 |
Grand Island, New York | | Manufacturing(2) | | Own | | — | | 160,000 |
Grand Island, New York | | Warehouse and administrative(3) | | Own | | — | | 120,000 |
Barceloneta, Puerto Rico | | Manufacturing(4) | | Own | | — | | 172,000 |
| | | | | | | | |
| | | | | | | | 848,500 |
| | | | | | | | |
| (1) | We also use this facility for packaging, laboratory, office and warehouse space. |
| (2) | Approximately 5,700 of manufacturing space has been leased to New Abraxis through December 2011, with an option to extend until December 2012 in certain circumstances. |
| (3) | This facility may be used to expand certain of our manufacturing operations. |
| (4) | Approximately 90,000 of the Puerto Rico facility was conveyed to New Abraxis, representing the active pharmaceutical ingredients manufacturing plant currently leased to Pfizer for a term expiring on February 2012. |
In October 2007, Old Abraxis entered into a settlement agreement and release with respect to all disputes with a former officer and employee of ABI. Under the separation and distribution agreement, New Abraxis assumed all liabilities relating to litigation with this individual. Pursuant to the indemnification provisions of the definitive agreements for the 2006 merger, the former ABI shareholders indemnified Old Abraxis for approximately two-thirds of the obligations under the settlement agreement and the amount is recorded in our statement of cash flows as non-cash issuance for legal expenses while the entire settlement is reflected in our statement of operations as discontinued operations.
We are from time to time subject to claims and litigation arising in the ordinary course of business. These claims have included assertions that our products infringe existing patents, product liability and also claims that the use of our products has caused personal injuries. We intend to defend vigorously any such litigation that may arise under all defenses that would be available to us. In the opinion of management, the ultimate outcome of proceedings of which management is aware, even if adverse to us, will not have a material adverse effect on our consolidated financial position or results of operations.
26
| Item 4. | SUBMISSION OF MATTERS TO A VOTE OF SECURITY HOLDERS |
| (a) | Our 2007 annual meeting of stockholders was held on December 19, 2007. |
| (c) | 1. Our stockholders voted as follows with respect to a proposal to elect six directors to serve until our next annual meeting of stockholders or until their successors are duly elected and qualified: |
| | | | |
DIRECTORS | | FOR | | Authority
Withheld |
Patrick Soon-Shiong, M.D. | | 128,496,977 | | -0- |
Michael D. Blaszyk | | 128,496,977 | | -0- |
Michael Sitrick | | 128,496,977 | | -0- |
Joseph M. Pizza | | 128,496,977 | | -0- |
Ramesh Gopalakrishnan | | 128,496,977 | | -0- |
Stuart DePina | | 128,496,977 | | -0- |
| 2. | Our stockholders voted as follows with respect to a proposal to ratify the appointment of Ernst & Young LLP as our independent registered public accounting firm for the fiscal year ended December 31, 2007. |
| | | | | | |
FOR | | AGAINST | | ABSTENTIONS | | BROKER NON-VOTES |
128,496,977 | | -0- | | -0- | | -0- |
27
PART II
| Item 5. | MARKET FOR REGISTRANT’S COMMON EQUITY, RELATED STOCKHOLDER MATTERS AND ISSUER PURCHASES OF EQUITY SECURITIES |
Market for Common Stock
Our common stock is listed and traded on the NASDAQ Global Market under the symbol “APPX.” Prior to the separation of the hospital-based and proprietary businesses of Old Abraxis into two independent public companies on November 13, 2007, the common stock of Old Abraxis, our predecessor registrant, was listed and traded on the NASDAQ Global Market under the symbol “ABBI.” Prior to the merger of American BioScience into Old Abraxis on April 18, 2006, Old Abraxis’ common stock was listed and traded on the NASDAQ Global Market under the symbol “APPX.” The following table sets forth the high and low split-adjusted closing prices for our common stock, as reported by the NASDAQ composite transaction reporting system as “adjusted closing price” for fiscal year 2007 and for 2006:
| | | | | | | | | | | | |
| | | 2007
Price Per Share | | 2006
Price Per Share |
| For the quarter ended: | | High | | Low | | High | | Low |
March 31, | | $ | 14.56 | | $ | 13.06 | | $ | 21.41 | | $ | 14.92 |
June 30, | | $ | 15.05 | | $ | 11.28 | | $ | 17.32 | | $ | 12.53 |
September 30, | | $ | 12.91 | | $ | 10.70 | | $ | 14.84 | | $ | 10.68 |
December 31, | | $ | 13.82 | | $ | 10.06 | | $ | 15.62 | | $ | 14.02 |
As of March 3, 2008, the closing price for our common stock, as reported on NASDAQ, was $11.28 per share. On March 3, 2008, we had approximately 95 holders of record of our common stock.
Dividend Policy
We have never declared or paid a cash dividend. Our senior secured credit agreement limits cash dividend payments, subject to certain limitations,generally up to a maximum aggregate of $10 million. We have no current intention of paying cash dividends.
Issuer Purchases of Equity Securities
We did not purchase any of our equity securities during the fourth quarter of 2007.
28
| Item 6. | SELECTED FINANCIAL DATA |
| | | | | | | | | | | | | | | | | | | | |
| | | Year ended December 31, | |
| | | 2007 | | | 2006 | | | 2005 | | | 2004 | | | 2003 | |
| | | (in thousands, except per share data) | |
Net revenue | | $ | 647,374 | | | $ | 583,201 | | | $ | 385,082 | | | $ | 405,010 | | | $ | 351,315 | |
Cost of sales | | | 332,046 | | | | 288,079 | | | | 203,436 | | | | 191,774 | | | | 161,573 | |
| | | | | | | | | | | | | | | | | | | | |
Gross profit | | | 315,328 | | | | 295,122 | | | | 181,646 | | | | 213,236 | | | | 189,742 | |
Operating expenses: | | | | | | | | | | | | | | | | | | | | |
Research and development | | | 46,497 | | | | 27,787 | | | | 18,454 | | | | 16,707 | | | | 17,422 | |
Selling, general and administrative | | | 90,229 | | | | 80,669 | | | | 69,059 | | | | 59,710 | | | | 51,699 | |
Amortization of merger related intangibles | | | 15,418 | | | | 10,926 | | | | — | | | | — | | | | — | |
Separation related costs | | | 3,024 | | | | — | | | | — | | | | — | | | | — | |
Merger related in-process research and development charge | | | — | | | | 22,330 | | | | — | | | | — | | | | — | |
Other merger related costs | | | — | | | | 12,613 | | | | 7,863 | | | | — | | | | — | |
Total operating expenses | | | 155,168 | | | | 154,325 | | | | 95,376 | | | | 76,417 | | | | 69,121 | |
| | | | | | | | | | | | | | | | | | | | |
Income from operations | | | 160,160 | | | | 140,797 | | | | 86,270 | | | | 136,819 | | | | 120,621 | |
Interest income and other | | | 2,182 | | | | 3,557 | | | | 470 | | | | 1,934 | | | | 2,295 | |
Interest expense | | | (25,162 | ) | | | (9,186 | ) | | | — | | | | — | | | | — | |
Loss on early extinguishment of credit facility | | | — | | | | — | | | | — | | | | (1,986 | ) | | | — | |
Minority interests | | | — | | | | (11,383 | ) | | | (25,875 | ) | | | (16,301 | ) | | | (21,377 | ) |
| | | | | | | | | | | | | | | | | | | | |
Income from continuing operations before income taxes | | | 137,180 | | | | 123,785 | | | | 60,865 | | | | 120,466 | | | | 101,539 | |
Provision for income taxes from continuing operations | | | 55,001 | | | | 68,559 | | | | 30,409 | | | | 45,482 | | | | 41,176 | |
| | | | | | | | | | | | | | | | | | | | |
Net income from continuing operations | | | 82,179 | | | | 55,226 | | | | 30,456 | | | | 74,984 | | | | 60,363 | |
Net loss from discontinued operations, net of taxes | | | (47,821 | ) | | | (102,123 | ) | | | (12,799 | ) | | | (56,763 | ) | | | (34,010 | ) |
| | | | | | | | | | | | | | | | | | | | |
Net income (loss) | | $ | 34,358 | | | $ | (46,897 | ) | | $ | 17,657 | | | $ | 18,221 | | | $ | 26,353 | |
| | | | | | | | | | | | | | | | | | | | |
Basic income (loss) per common share: | | | | | | | | | | | | | | | | | | | | |
Continuing operations | | $ | 0.51 | | | $ | 0.35 | | | $ | 0.19 | | | $ | 0.59 | | | $ | 0.39 | |
Discontinued operations | | | (0.29 | ) | | | (0.65 | ) | | | (0.08 | ) | | | (0.47 | ) | | | (0.22 | ) |
| | | | | | | | | | | | | | | | | | | | |
Net income (loss) per common share: | | $ | 0.22 | | | $ | (0.30 | ) | | $ | 0.11 | | | $ | 0.12 | | | $ | 0.17 | |
| | | | | | | | | | | | | | | | | | | | |
Diluted income (loss) per common share: | | | | | | | | | | | | | | | | | | | | |
Continuing operations | | $ | 0.51 | | | $ | 0.35 | | | $ | 0.19 | | | $ | 0.58 | | | $ | 0.38 | |
Discontinued operations | | | (0.30 | ) | | | (0.64 | ) | | | (0.08 | ) | | | (0.47 | ) | | | (0.22 | ) |
| | | | | | | | | | | | | | | | | | | | |
Net income (loss) per common share: | | $ | 0.21 | | | $ | (0.29 | ) | | $ | 0.11 | | | $ | 0.11 | | | $ | 0.16 | |
| | | | | | | | | | | | | | | | | | | | |
Basic weighted-average common shares outstanding: | | | 159,643 | | | | 158,937 | | | | 157,694 | | | | 156,189 | | | | 155,557 | |
| | | | | |
Diluted weighted-average common shares outstanding: | | | 161,006 | | | | 160,002 | | | | 159,742 | | | | 159,031 | | | | 158,629 | |
| | | | | |
Other data: | | | | | | | | | | | | | | | | | | | | |
Cash flow provided by operating activities | | $ | 12,353 | | | $ | 324,977 | | | $ | 34,466 | | | $ | 42,353 | | | $ | 30,348 | |
Cash flow (used in) investing activities | | | (89,022 | ) | | | (372,800 | ) | | | (43,172 | ) | | | (62,795 | ) | | | (78,966 | ) |
Cash flow provided by financing activities | | | 66,893 | | | | 59,391 | | | | 33,872 | | | | 17341 | | | | 12,915 | |
Consolidated balance sheet data: | | | | | | | | | | | | | | | | | | | | |
Working capital | | $ | 216,727 | | | $ | 65,556 | | | $ | 248,284 | | | $ | 150,846 | | | $ | 137,238 | |
Total assets | | | 1,077,587 | | | | 1,773,721 | | | | 524,229 | | | | 392,623 | | | | 323,777 | |
Long term debt | | | 995,000 | | | | 165,000 | | | | 190,000 | | | | 42,750 | | | | 30,850 | |
Total stockholder’s equity (deficit) | | | (79,771 | ) | | | 1,033,361 | | | | 68,140 | | | | 167,418 | | | | 139,747 | |
The composition of stock-based compensation included above is as follows: | | | | | | | | | | | | | | | | | | | | |
Cost of sales | | $ | 2,502 | | | $ | 2,668 | | | $ | 2,947 | | | $ | 2,613 | | | $ | 1,636 | |
Research and development | | | 602 | | | | 554 | | | | 465 | | | | 303 | | | | (138 | ) |
Selling, general and administrative | | | 8,977 | | | | 7,902 | | | | 8,625 | | | | 3,833 | | | | 3,848 | |
Discontinued operations | | | 16,517 | | | | 23,899 | | | | 4,372 | | | | 3,052 | | | | 792 | |
| | | | | | | | | | | | | | | | | | | | |
| | $ | 38,598 | | | $ | 35,023 | | | $ | 16,409 | | | $ | 9,801 | | | $ | 6,138 | |
| | | | | | | | | | | | | | | | | | | | |
29
| Item 7. | MANAGEMENT’S DISCUSSION AND ANALYSIS OF FINANCIAL CONDITION AND RESULTS OF OPERATIONS |
OVERVIEW
The following management’s discussion and analysis of financial condition and results of operations, or MD&A, is intended to assist the reader in understanding our company. The MD&A is provided as a supplement to, and should be read in conjunction with the other sections of this Annual Report on Form 10-K, including “Item 1: Business”; “Item 1A: Risk Factors”, “Item 6: Selected Financial Data”; and “Item 8: Financial Statements and Supplemental Data.”
Background
We are a fully-integrated pharmaceutical company that develops, manufactures and markets injectable pharmaceutical products. We believe that we are the only independent U.S. public company with a primary focus on the injectable critical care, anti-infective and oncology markets, and we further believe that we offer one of the most comprehensive injectable product portfolios in the pharmaceutical industry. We manufacture products in each of the three basic forms in which injectable products are sold: liquid, powder and lyophilized, or freeze-dried.
Our products are generally used in hospitals, long-term care facilities, alternate care sites and clinics within North America. Unlike the retail pharmacy market for oral products, the injectable pharmaceuticals marketplace is largely made up of end users who have relationships with group purchasing organizations, or GPOs, and/or specialty distributors who distribute products within a particular end-user market, such as oncology clinics. GPOs and specialty distributors generally enter into collective product purchasing agreements with pharmaceutical suppliers in an effort to secure more favorable drug pricing on behalf of their members.
We began in 1996 with an initial focus on U.S. marketing and distribution of generic pharmaceutical products manufactured by others. In June 1998, we acquired Fujisawa USA, Inc.’s generic injectable pharmaceutical business, including manufacturing facilities in Melrose Park, Illinois and Grand Island, New York and a research and development facility in Melrose Park, Illinois. We also acquired additional assets in this transaction, including inventories, plant and equipment and abbreviated new drug applications that were approved by or pending with the FDA.
On April 18, 2006, we completed a merger with American BioScience, Inc., or ABI, our former parent. In connection with the closing of that merger, our certificate of incorporation was amended to change our original name of American Pharmaceutical Partners, Inc. to Abraxis BioScience, Inc. which we refer to as “Old Abraxis.” Old Abraxis was operated as two distinct business segments: the proprietary business and the hospital-based business.
Separation Agreement
On November 13, 2007, Old Abraxis separated into two independent publicly-traded companies: our company, APP Pharmaceuticals, Inc., which owns and operates the hospital-based business; and the other which owns and operates the proprietary business. We refer to the proprietary business following the separation as “New Abraxis,” which subsequently changed its name to Abraxis BioScience, Inc. We continue to operate the hospital-based business (which we refer to as “New APP” following the separation) under the name APP Pharmaceuticals, Inc.
New APP and New Abraxis entered into a series of agreements in connection with the separation, including a separation and distribution agreement, a transition services agreement, an employee matters agreement, a taxallocation agreement, a manufacturing agreement and various real estate leases. Please refer to Note 7—Related
30
Parties for additional information on the separation related agreements. Also, in connection with the separation, we incurred $1 billion of indebtedness and, in addition, entered into a $150 million revolvingcredit facility that is currently unused. $700 million of the proceeds from this indebtedness was contributed to New Abraxis, approximately $12 million was used to pay fees and expenses related to the debt financing and approximately $276 million of the proceeds was used to repay in full the then existing revolving credit facility. New APP is solely responsible for servicing the debt. The historical operating and cash flow results of New Abraxis are now presented as discontinued operations. Please refer toNote 3—Spin-off of New Abraxis, in the accompanying audited financial statements for further details.
31
RESULTS OF OPERATIONS
Overview
The following table sets forth the results of our operations for each of the three years ended December 31, and forms the basis for the following discussion of our operating activities:
| | | | | | | | | | | | | | | | | | | | | | | | | | |
| | | Year Ended December 31, | | | Change Favorable (Unfavorable) | |
| | | | 2007 vs. 2006 | | | 2006 vs. 2005 | |
| | | 2007 | | | 2006 | | | 2005 | | | $ | | | % | | | $ | | | % | |
| | | (in thousands, except per share data and percentages) | |
Consolidated statements of operations data: | | | | | | | | | | | | | | | | | | | | | | | | | | |
Net revenues | | | | | | | | | | | | | | | | | | | | | | | | | | |
Critical care | | $ | 382,772 | | | $ | 302,244 | | | $ | 163,581 | | | $ | 80,528 | | | 27 | % | | $ | 138,663 | | | 84 | % |
Anti-infective | | | 193,704 | | | | 213,490 | | | | 169,818 | | | | (19,786 | ) | | -9 | % | | | 43,672 | | | 26 | % |
Oncology | | | 55,308 | | | | 57,872 | | | | 51,084 | | | | (2,564 | ) | | -4 | % | | | 6,788 | | | 13 | % |
Contract manufacturing and other | | | 15,590 | | | | 9,595 | | | | 599 | | | | 5,995 | | | 62 | % | | | 8,996 | | | 1501 | % |
| | | | | | | | | | | | | | | | | | | | | | | | | | |
Total net revenue | | | 647,374 | | | | 583,201 | | | | 385,082 | | | | 64,173 | | | 11 | % | | | 198,119 | | | 51 | % |
Cost of sales | | | 332,046 | | | | 288,079 | | | | 203,436 | | | | (43,967 | ) | | -15 | % | | | (84,643 | ) | | -42 | % |
| | | | | | | | | | | | | | | | | | | | | | | | | | |
Gross profit | | | 315,328 | | | | 295,122 | | | | 181,646 | | | | 20,206 | | | 7 | % | | | 113,476 | | | -
63 |
% |
Percent to total revenue | | | 48.7 | % | | | 50.6 | % | | | 47.2 | % | | | | | | | | | | | | | | |
Operating expenses: | | | | | | | | | | | | | | | | | | | | | | | | | | |
Research and development | | | 46,497 | | | | 27,787 | | | | 18,454 | | | | (18,710 | ) | | -67 | % | | | (9,333 | ) | | -51 | % |
Percent to total revenue | | | 7.2 | % | | | 4.8 | % | | | 4.8 | % | | | | | | | | | | | | | | |
Selling, general and administrative | | | 90,229 | | | | 80,669 | | | | 69,059 | | | | (9,560 | ) | | -12 | % | | | (11,610 | ) | | -17 | % |
Percent to total revenue | | | 13.9 | % | | | 13.8 | % | | | 17.9 | % | | | | | | | | | | | | | | |
Amortization of merger related intangibles | | | 15,418 | | | | 10,926 | | | | — | | | | (4,492 | ) | | -41 | % | | | (10,926 | ) | | — | |
Separation related costs | | | 3,024 | | | | — | | | | — | | | | (3,024 | ) | | — | | | | — | | | — | |
Merger related in-process research and development charge | | | — | | | | 22,330 | | | | — | | | | 22,330 | | | — | | | | (22,330 | ) | | — | |
Other merger related costs | | | — | | | | 12,613 | | | | 7,863 | | | | 12,613 | | | — | | | | (4,750 | ) | | -60 | % |
| | | | | | | | | | | | | | | | | | | | | | | | | | |
Total operating expenses | | | 155,168 | | | | 154,325 | | | | 95,376 | | | | (843 | ) | | -1 | % | | | (58,949 | ) | | -62 | % |
| | | | | | | | | | | | | | | | | | | | | | | | | | |
Percent to total revenue | | | 24.0 | % | | | 26.5 | % | | | 24.8 | % | | | | | | | | | | | | | | |
Income from operations | | | 160,160 | | | | 140,797 | | | | 86,270 | | | | 19,363 | | | 14 | % | | | 54,527 | | | 63 | % |
Percent to total revenue | | | 24.7 | % | | | 24.1 | % | | | 22.4 | % | | | | | | | | | | | | | | |
Interest income and other | | | 2,182 | | | | 3,557 | | | | 470 | | | | (1,375 | ) | | -39 | % | | | 3,087 | | | 657 | % |
Interest expense | | | (25,162 | ) | | | (9,186 | ) | | | — | | | | (15,976 | ) | | 174 | % | | | (9,186 | ) | | — | |
Minority interests | | | — | | | | (11,383 | ) | | | (25,875 | ) | | | 11,383 | | | — | | | | 14,492 | | | -56 | % |
| | | | | | | | | | | | | | | | | | | | | | | | | | |
Income from continuing operations before income taxes | | | 137,180 | | | | 123,785 | | | | 60,865 | | | | 13,395 | | | 11 | % | | | 62,920 | | | 103 | % |
Provision for income taxes from continuing operations | | | 55,001 | | | | 68,559 | | | | 30,409 | | | | 13,558 | | | 20 | % | | | (38,150 | ) | | -125 | % |
| | | | | | | | | | | | | | | | | | | | | | | | | | |
Net income from continuing operations | | | 82,179 | | | | 55,226 | | | | 30,456 | | | $ | 26,953 | | | 49 | % | | $ | 24,770 | | | 81 | % |
Percent to total revenue | | | 12.7 | % | | | 9.5 | % | | | 7.9 | % | | | | | | | | | | | | | | |
Net loss from discontinued operations, net of taxes | | | (47,821 | ) | | | (102,123 | ) | | | (12,799 | ) | | | | | | | | | | | | | | |
| | | | | | | | | | | | | | | | | | | | | | | | | | |
Net income (loss) | | $ | 34,358 | | | $ | (46,897 | ) | | $ | 17,657 | | | | | | | | | | | | | | | |
| | | | | | | | | | | | | | | | | | | | | | | | | | |
Basic income (loss) per common share: | | | | | | | | | | | | | | | | | | | | | | | | | | |
Continuing operations | | $ | 0.51 | | | $ | 0.35 | | | $ | 0.19 | | | | | | | | | | | | | | | |
Discontinued operations | | | (0.29 | ) | | | (0.65 | ) | | | (0.08 | ) | | | | | | | | | | | | | | |
| | | | | | | | | | | | | | | | | | | | | | | | | | |
Net income (loss) per common share: | | $ | 0.22 | | | $ | (0.30 | ) | | $ | 0.11 | | | | | | | | | | | | | | | |
| | | | | | | | | | | | | | | | | | | | | | | | | | |
Diluted income (loss) per common share: | | | | | | | | | | | | | | | | | | | | | | | | | | |
Continuing operations | | $ | 0.51 | | | $ | 0.35 | | | $ | 0.19 | | | | | | | | | | | | | | | |
Discontinued operations | | | (0.30 | ) | | | (0.64 | ) | | | (0.08 | ) | | | | | | | | | | | | | | |
| | | | | | | | | | | | | | | | | | | | | | | | | | |
Net income (loss) per common share: | | $ | 0.21 | | | $ | (0.29 | ) | | $ | 0.11 | | | | | | | | | | | | | | | |
| | | | | | | | | | | | | | | | | | | | | | | | | | |
Weighted-average common shares outstanding: | | | | | | | | | | | | | | | | | | | | | | | | | | |
Basic | | | 159,643 | | | | 158,937 | | | | 157,694 | | | | | | | | | | | | | | | |
Diluted | | | 161,006 | | | | 160,002 | | | | 159,742 | | | | | | | | | | | | | | | |
32
Operating Results
Net revenues
Net revenues for the year ending December 31, 2007 increased $64.2 million, or 11% to $647.4 million as compared to the same period of 2006. The increase was primarily due to twelve months of product sales in 2007 versus six months of product sales in 2006 related to the products we acquired in June 2006. The 11% increase in net revenues for the twelve months ended December 31, 2007 over the prior year period was comprised of a 9.6% unit volume increase and a 1.4% increase in unit prices. Excluding the impact of the product acquisition, net revenues of our core hospital-based products decreased $12.8 million for the twelve months ended December 31, 2007 to $466.7 million as compared to $479.5 million in the prior year.
Sales of critical care products for the twelve months ended December 31, 2007 increased $80.5 million, or 27%, to $382.8 million as compared to the same period in the prior year due primarily to increased volume, favorable pricing as a result of market conditions and the effects of twelve months of product sales in 2007 versus only six months of product sales in 2006 relating to the products we acquired in June 2006. Net revenues of anti-infective products for the twelve months ended December 31, 2007 decreased $19.8 million, or 9%, to $193.7 million due mainly to our cephalosporin products, which were on backorder during portions of the year due to the voluntary precautionary distribution holds we placed on product manufactured with certain materials. The required testing was completed, all internal issues have been satisfactorily resolved and we resumed distribution of these products in August 2007. Net revenues of oncology products for the twelve months ended December 31, 2007 decreased $2.6 million, or 4%, to $55.3 million mainly due to continued decreased demand for pamidronate as a result new competition in the market.
Net revenues in 2006 increased $198.1 million, or 51%, to $583.2 million as compared to the prior year. The increase was primarily due to product sales relating our acquired critical care products, favorable market conditions, newly launched products and stronger demand for products manufactured at our Melrose Park facility. Excluding the impact of the products acquired during the year, our product sales increased $94.4 million, or 25%, and was comprised of a 11% overall increase in price and a 4% increase in overall unit volume. Total sales for anti-infective products increased $43.7 million, or 26%, from the prior year due to newly launched antibiotics and strong demand for previously existing products. Total revenue for critical care products increased $138.7 million, or 84% from the prior year, due to $103.7 million of sales relating to products we acquired in June 2006, continued strong demand and favorable market conditions for existing products. Total revenue for oncology products increased by $6.8 million, or 13%, as compared to the prior year due to stronger demand for products manufactured at our Melrose Park facility. Contract manufacturing revenue increased to $9.6 million from $0.6 million in the prior year as a result of the resumption of contract manufacturing after the revalidation of the Melrose Park facility.
Gross profit
Gross profit for the twelve months ended December 31, 2007 was $315.3 million, or 48.7% of total revenue, inclusive of the recognition of a $16.4 million charge relating to the amortization of intangible product rights associated with the 2006 product purchase, as compared to $295.1 million, or 50.6% of total revenue, in the same period of 2006, inclusive of the recognition of the $11.8 million charge related to the one-time write-up of finished goods associated with the merger, and a $8.2 million charge relating to the amortization of 2006 intangible product rights. Excluding the non-cash items associated with the merger and the 2006 product acquisition, gross margin as a percentage of total revenue was 51.1% for the twelve months ended December 31, 2007 versus 54.0% for the prior year. The decline over the prior year was mainly attributable to the voluntary precautionary hold placed on our cephalosporin products as well as an extended maintenance shut down of one of our product lines at our Melrose Park facility. In addition, 2006 benefited from higher margins, relating primarily to the products acquired during the year.
Gross profit in 2006 was $295.1 million, or 50.6% of total revenue, inclusive of a $11.8 million charge related to the one-time write-up of finished goods inventory in the merger, and an $8.2 million charge relating to
33
the amortization of intangible product rights associated with the product rights purchased during the year. Gross profit in 2005 was $181.6 million, or 47.2% of total revenue. Excluding the impact of non-cash merger adjustments and non-cash items associated with the June product purchase, 2006 gross profit as a percentage of total revenue was 54.0%. The increase over the prior year was primarily due to the prior year extended Melrose Park revalidation process.
Research and development, or R&D
Research and development expense for the twelve months ended December 31, 2007 increased $18.7 million, or 67%, to $46.5 million as compared to the same period in 2006. The increase was due primarily to expense associated with the transfer of products to our Puerto Rico facility which is included in our results of operations for the entire twelve month period during 2007.
R&D expense increased by $9.3 million, or 51%, in 2006 to $27.8 million as compared to $18.5 million in 2005. The increase was primarily due to expense associated with the transfer of products to our Puerto Rico facility during the second half of 2006.
Selling, general and administrative, or SG&A
Selling, general and administrative expense for the twelve months ended December 31, 2007 increased $9.6 million to $90.2 million, or 13.9% net revenues, from $80.7 million, or 13.8% of net revenues, for the comparable period in 2006. The increase was due primarily to increased selling and marketing costs to support higher sales levels and expenses related to increased headcount to support our strategic initiatives.
SG&A expense increased $11.6 million, or 17%, in 2006 as compared to $69.1 million for the same period in 2005. The increase was due primarily to costs associated with increased headcount and compensation and higher professional fees. As a percentage of revenue, SG&A expenses decreased to 13.8% for the twelve months ended December 31, 2006, as compared to 17.9% for the twelve months ended December 31, 2005.
Amortization, merger and separation costs
The twelve months ended December 31, 2007 included $15.4 million of merger related amortization compared to approximately $10.9 million for the twelve months ended December 31, 2006 reflecting the merger between APP and ABI on April 18, 2006. The twelve months ended December 31, 2007 included $3.0 million in direct professional fees and transaction related costs relating to the separation of our proprietary business while the twelve months ended December 31, 2006 included $12.6 million in direct merger and transactions costs relating to the merger between APP and ABI. In addition, the twelve months ended December 31, 2006 included a $22.3 million charge relating to the step up of in process research and development associated with the merger between APP and ABI. 2005 included $7.9 million of direct merger and transaction related costs and professional fees.
Other income, other non-operating items
Interest income and other consists primarily of interest earned on invested cash, the impact of foreign currency charges on intercompany trading accounts and other financing costs. Interest income and other decreased to $2.2 million for the twelve months ended December 31, 2007 from $3.6 million for the comparable period in 2006.
Interest expense increased to $25.2 million for the twelve months ended December 31, 2007 as compared to $9.2 million for the twelve months ended December 31, 2006. The increase in interest expense was primarily the result of higher average debt levels and interest expense related to a note payable due in June 2007. There was no interest expense in 2005.
34
Minority interest charges represent the net earnings attributable to minority shareholders prior to the closing of the merger between APP and ABI. Subsequent to the merger, no minority interests charges have been recorded. The twelve-month period ended December 31, 2006 included a $11.4 million charge relating to minority interests, while the twelve month period ended December 31, 2005 included a charge relating to minority interests of $25.9 million. The decrease in 2006 was due to the timing of the merger between APP and ABI which occurred in April of 2006.
Provision for Income Taxes
Our effective tax rate for the year ended December 31, 2007 was 40.1%. Our tax rate for this period was favorably impacted by a $3.1 million reduction of reserves relating to FIN 48 due to the closure of IRS examinations for the 2004 and 2005 tax years. Excluding the impact of the FIN 48 adjustment, our effective tax rate would have been 42.4%. Our effective tax rates for the years ended December 31, 2006 and 2005 were 55.4% and 50.1%, respectively. These rates included the effects of addbacks of non-deductible minority interest of $11.4 million and $25.9 million, respectively. Without the minority interest, our tax rate would have been 45.0% and 33.8% in 2006 and 2005, respectively. The increase in the 2006 rate to 45.0% was due to non-deductible items associated with the merger between APP and ABI.
LIQUIDITY AND CAPITAL RESOURCES
Overview
The following table summarizes key elements of our financial position and sources and (uses) of cash and cash equivalents for the three years ended December 31, 2007:
| | | | | | | | | | | | |
| | | December 31,
2007 | | | December 31,
2006 | | | December 31,
2005 | |
| | | (in thousands) | |
Summary Financial Position: | | | | | | | | | | | | |
Cash, cash equivalents and short-term investments | | $ | 31,788 | | | $ | 39,297 | | | $ | 83,273 | |
| | | | | | | | | | | | |
Working capital | | $ | 216,727 | | | $ | 65,556 | | | $ | 248,284 | |
| | | | | | | | | | | | |
Total assets | | $ | 1,077,587 | | | $ | 1,773,721 | | | $ | 524,229 | |
| | | | | | | | | | | | |
Total stockholders’ equity (deficit) | | $ | (79,771 | ) | | $ | 1,033,361 | | | $ | 68,140 | |
| | | | | | | | | | | | |
| |
| | | Twelve Months Ended December 31 | |
| | | 2007 | | | 2006 | | | 2005 | |
| | | (in thousands) | |
Summary of Sources and (Uses) of Cash and Cash Equivalents: | | | | | | | | | | | | |
Operating activities | | $ | 12,353 | | | $ | 324,977 | | | $ | 34,466 | |
| | | | | | | | | | | | |
Purchase of property, plant and equipment | | $ | (86,160 | ) | | $ | (84,486 | ) | | $ | (51,107 | ) |
| | | | | | | | | | | | |
Purchase of product license rights and other | | $ | (2,862 | ) | | $ | (342,769 | ) | | $ | (4,085 | ) |
| | | | | | | | | | | | |
Sale of short-term investments | | $ | — | | | $ | 54,455 | | | $ | 12,020 | |
| | | | | | | | | | | | |
Financing activities | | $ | 66,893 | | | $ | 59,391 | | | $ | 33,872 | |
| | | | | | | | | | | | |
Sources and Uses of Cash
Operating Activities
Cash flow from operations has been our primary source of liquidity. Net cash provided by operating activities was $12.4 million for the twelve months ended December 31, 2007 as compared to cash provided of
35
$325.0 million for the same period in 2006. This $312.6 million decrease in cash provided by operating activities for the 2007 period was due primarily to the transfer of assets associated with the spin-off of our proprietary business and the fact that the 2006 period included the receipt of $200.0 million associated with the Abraxane co-promotion with AstraZeneca, and non-cash expenses associated with the prior merger with ABI, which included amortization of merger related intangibles and in-process research and development charges.
Net cash provided by operations was $325.0 million for the period ended December 31, 2006 as compared to $34.5 million in 2005. The $290.5 million increase in 2006 cash provided by operating activities was due primarily to the recognition of deferred revenue relating to the AstraZeneca product purchase and non-cash expenses associated with the prior merger with ABI, which included amortization of merger related intangibles and in-process research and development charges.
Investing Activities
Our investing activities have included capital expenditures necessary to expand and maintain our manufacturing capabilities and infrastructure and outlays necessary to acquire various product or intellectual property rights. Cash used in investing activities during the twelve months ended December 31, 2007 included approximately $32.5 million relating to the acquisition of our manufacturing facility in Puerto Rico as well as approximately $53.7 million relating to the purchase of property, plant and equipment primarily as investment in our core manufacturing and development capabilities, including the purchase of a manufacturing facility in Phoenix which was distributed to New Abraxis in connection with the separation. Cash used in investing activities for the twelve months ended December 31, 2006 primarily related to the purchase of product rights from AstraZeneca, and the purchase of property, plant and equipment, primarily as investment in the core manufacturing and development capability and the purchase of an aircraft. This was partially offset by $54.5 million of sales of short term municipal variable rate demand notes.
Net cash used for the acquisition of property, plant and equipment totaled $86.2, $84.5 million and $51.1 million, in 2007, 2006, and 2005, respectively. The 2006 increase over 2005 was due primarily to the purchase of an aircraft and increased capital investment in our core manufacturing and development capabilities. Net cash used for the acquisition of product license rights totaled $0, $328.8 million, and $4.1 million in 2007, 2006, and 2005, respectively. The 2006 increase resulted from the purchase of product rights from AstraZeneca.
Financing Activities
Financing activities generally include borrowings under our credit facility, the issuance or repurchase of our common stock and proceeds from the exercise of employee stock options. Net cash provided by financing activities was $66.9 million for the twelve months ended December 31, 2007, which included issuance of $1 billion of debt as a result of the separation, issuance of other debt of $366 million, reduced by repayment of borrowings of $531 million and notes payable of $67 million. The $696.4 million outflow includes a $700 million of cash distributed to New Abraxis as part of the separation.
Net cash provided by financing activities was $59.4 million in 2006 which represented an increase in notes payable associated with the AstraZeneca product rights purchase of $72.2 million and proceeds relating to stock transactions of $13.9 million being partially offset by net repayments on borrowings of $25.0 million.
Net cash provided by financing activities totaled $33.9 million in 2005 and consisted of $147.3 million in net proceeds under our credit facilities and $30.4 million in proceeds relating to employee stock plans and related tax benefits. Partially offsetting these proceeds were the repurchase for $67.5 million of shares of ABI’s common stock, the repurchase for $55.7 million of all outstanding shares of ABI’s Series A and B preferred stock. In June 2005, Dr. Soon-Shiong, ABI’s controlling shareholder, sold to ABI his entire ownership interest in Transplant Research Institute, or TRI, comprising all of the outstanding capital stock of TRI, in exchange for $20.0 million in cash.
36
Sources of Financing and Capital Requirements
We have historically funded our research and development activities through product license fees, including milestones, and borrowings, whereas our primary source of liquidity has been cash flow from operations.
Sources of Financing and Capital Requirements
We have historically financed our operations primarily through cash flow from operations and borrowings under our previous lines of credit.
Credit Agreement
On November 13, 2007, we, our operating subsidiary APP Pharmaceuticals, LLC (“New APP LLC”) and APP Pharmaceuticals Manufacturing, LLC, a wholly-owned subsidiary of New APP LLC (“P.R. Borrower” and together with New APP LLC, the “Borrowers”) entered into a senior secured credit agreement (as amended, the “Credit Agreement”) with certain lenders and Deutsche Bank AG New York Branch, as Administrative Agent. The Credit Agreement provides for two term loan facilities: a Term Loan A facility for $500 million and a Term Loan B facility for $500 million. The Credit Agreement also provides for a revolving credit facility of $150 million. A portion of the proceeds from the debt financing was used to repay our existing indebtedness and $700 million was contributed to New Abraxis immediately prior to the separation.
The term loan facilities mature on November 13, 2013, and the revolving credit facility matures on November 13, 2012. The Term Loan A facility amortizes based on the following schedule: 0% in year one; 2.5% in year two; 10% in year three; 15% in year four; 20% in year five; and 52.5% in year six. The Term Loan B facility amortizes 1% in each of the first six years, with a balloon payment due at maturity. Amounts drawn under the term loan facilities or revolving credit facility bear the following annual interest rates: for the Term Loan A facility and the revolving credit facility, a rate at either an adjusted LIBOR, plus a margin of 2.25%, or an alternate base rate plus a margin of 1.25%; and for the Term loan B facility, a rate at either an adjusted LIBOR, plus a margin of 2.50%, or an alternate base rate plus a margin of 1.50%. The revolving credit facility includes a $40 million sub-limit for swingline loans and a $20 million sub-limit for letters of credit. The interest rate margins are subject to step downs based on, among other things, our total leverage ratio. Effective February 14, 2008, we entered into interest rate swap agreements with an aggregate notional principal amount of $990 million to pay interest at a fixed rate of 3.04% and to receive interest at variable rate of one-month LIBOR. The interest rate swaps expire in February 2009.
The Credit Agreement contains a number of negative covenants restricting, among other things, indebtedness, liens, merger or transfer of substantially all assets of our company or the Borrowers, asset dispositions, distributions, dividends and repurchases of capital stock, prepayment or modification of certain other debt, acquisitions and investments, affiliate transactions, and limitations on dividends or other payments to subsidiaries or the parent company, APP Pharmaceuticals, Inc. We are required to comply with a senior secured leverage ratio test. The Credit Agreement contains customary events of default.
Beginning in December 2008, the Credit Agreement requires the Borrowers to prepay any outstanding loans, subject to specified exceptions, with (i) 50% of excess cash flow (with step downs to 0% based on our total leverage ratio), (ii) 100% of the net proceeds of non-ordinary course asset sales and any insurance or condemnation proceeds (with step downs to 75% based on our total leverage ratio), and (iii) 100% of the proceeds of any indebtedness not otherwise permitted to be incurred or issued under the Credit Agreement, subject to our total leverage ratio.
The obligations of New APP LLC under the term loan facilities and revolving credit facility are unconditionally guaranteed on a senior secured basis by our company and each direct and indirect wholly-owned domestic restricted subsidiary of New APP LLC (each, a “Subsidiary Guarantor”). The obligations of P.R.
37
Borrower are unconditionally guaranteed by our company, New APP LLC and each future wholly-owned subsidiary of P.R. Borrower (each, a “P.R. Subsidiary Guarantor). The obligations and guarantees of the Borrowers are secured by a first-priority security interest in substantially all tangible and intangible assets (including a pledge of capital stock, limited to 65% for pledges of stock of foreign subsidiaries) of our company, New APP LLC and each Subsidiary Guarantor and, in the case of P.R. Borrower, such assets of P.R. Borrower and P.R. Subsidiary Guarantor.
Capital Requirements
Our future capital requirements will depend on numerous factors, including:
| | • | | the obligations placed upon our company from our credit agreement discussed above, including any debt covenants related to those obligations; |
| | • | | working capital requirements and production, sales, marketing and development costs required to support our business; |
| | • | | the need for manufacturing expansion and improvement; |
| | • | | the transfer of products to our Puerto Rico manufacturing facility; |
| | • | | the requirements of any potential future acquisitions, asset purchases or equity investments; and |
| | • | | the amount of cash generated by operations, including potential milestone and license revenue. |
We anticipate that cash and short-term investments, cash generated from operations and funds available under our credit facility will be sufficient to finance operations of our company, including ongoing, product development and capital expenditures for at least the next twelve months. In the event we engage in future acquisitions or capital projects, we may have to raise additional capital through additional borrowings or the issuance of debt or equity securities.
As described further above, we are responsible for servicing the debt of $1 billion incurred in connection with the separation. We expect to pay the principal and interest on the outstanding debt with funds generated by our operations. Our ability to meet our debt service obligations will depend on our future performance, which will be affected by financial, business, economic and other factors, including potential changes in customer preferences, the success of product and marketing innovations and pressure from competitors. If we do not have enough money to pay our debt service obligations, we may be required to refinance all or part of our existing debt, sell assets or borrow more money. We may not be able to, at any given time, refinance this debt, sell assets or borrow more money on terms acceptable to us or at all, the failure to do any of which could have adverse consequences for our business, financial condition and results of operations.
Contractual Obligations and Off-Balance Sheet Arrangements
Contractual obligations represent future cash commitments and liabilities under agreements with third parties, and exclude contingent liabilities for which we cannot reasonably predict future payment. The following information summarizes our contractual obligations and other commitments, including credit facilities and operating leases, as of December 31, 2007:
| | | | | | | | | | | | | | | |
| | | Payments due by period |
Contractual Obligations | | Total | | Less than
1 year | | 1-3 years | | 3-5 years | | More than
5 years |
| | | (in thousands) |
Credit facility principal repayments (excluding interest) | | | 1,000,000 | | | 5,000 | | | 72,500 | | | 185,000 | | | 737,500 |
Operating lease obligations | | | 23,820 | | | 7,384 | | | 9,441 | | | 4,013 | | | 2,982 |
| | | | | | | | | | | | | | | |
Total | | $ | 1,023,820 | | $ | 12,384 | | $ | 81,941 | | $ | 189,013 | | $ | 740,482 |
| | | | | | | | | | | | | | | |
We do not currently have any off-balance sheet arrangements that are material or reasonably likely to be material to our financial position or results of operations.
38
CRITICAL ACCOUNTING POLICIES AND ESTIMATES
The preparation of financial statements in conformity with accounting principles generally accepted in the United States requires management to make estimates and assumptions that affect the reported amounts of assets and liabilities and disclosure of contingent assets and liabilities at the date of the financial statements and the reported amounts of revenues and expenses during the reporting period. The most significant estimates in our unaudited condensed consolidated financial statements are discussed below. Actual results could vary from those estimates.
Revenue Recognition
Product Revenue Recognition
We recognize revenue from the sale of a product and for contract manufacturing when title and risk of loss have transferred to the customer, collection is reasonably assured and we have no further performance obligation. This is typically when the product is received by the customer. At the time of sale, as further described below, we reduce sales and provide for estimated chargebacks, contractual allowances or customer rebates, product returns and customer credits and cash discounts. Our methodology used to estimate and provide for these sales provisions was consistent across all periods presented. Accruals for sales provisions are presented in our financial statements as a reduction of revenue and accounts receivable and, for contractual allowances, an increase in accrued liabilities. We regularly review information related to these estimates and adjust our reserves accordingly if, and when, actual experience differs from estimates.
We have internal historical information on chargebacks, rebates and customer returns and credits which we use as the primary factor in determining the related reserve requirements. As further described below, due to the nature of our injectable products and their primary use in hospital and clinical settings with generally consistent demand, we believe that this internal historical data, in conjunction with periodic review of available third-party data and updated for any applicable changes in available information provides a reliable basis for such estimates.
We periodically review the wholesale supply levels of our more significant products by reviewing inventory reports purchased or available from wholesalers, evaluating our unit sales volume, and incorporating data from third-party market research firms. Based on these activities, we attempt to keep a consistent wholesale stocking level of approximately two- to six-weeks across our hospital-based products. The buying patterns of our customers do vary from time to time, both from customer to customer and product to product, but we believe that historic wholesale stocking or speculative buying activity in our hospital-based distribution channels has not had a significant impact on our historic sales comparisons or sales provisions.
Sales Provisions
Our sales provisions totaled $1,080.1 million, $759.9 million and $573.8 million for the year ended December 31, 2007, 2006 and 2005, respectively, and related reserves totaled $125.1 million, $112.5 million and $84.5 million at December 31, 2007, 2006 and 2005, respectively.
Chargebacks
Following industry practice, we typically sell our products to independent pharmaceutical wholesalers at wholesale list price. The wholesaler in turn sells our products to an end user, normally a hospital or alternative healthcare facility, at a lower contractual price previously established between us and the end user via a group purchasing organization, or GPO. GPOs enter into collective purchasing contracts with pharmaceutical suppliers to secure more favorable product pricing on behalf of their end-user members.
Our initial sale to the wholesaler, and the resulting receivable, are recorded at our wholesale list price. However, as most of these selling prices will be reduced to a lower end-user contract price, at the time of sale revenue is reduced by, and a provision recorded for, the difference between the list price and estimated end-user
39
contract price multiplied by the estimated wholesale units outstanding pending chargeback that will ultimately be sold under end-user contracts. When the wholesaler ultimately sells the product to the end user at the end-user contract price, the wholesaler charges us, a chargeback, for the difference between the list price and the end-user contract price and such chargeback is offset against our initial estimated contra asset. The most significant estimates inherent in the initial chargeback provision relate to wholesale units pending chargeback and the ultimate end-user contract-selling price. We base our estimation for these factors primarily on internal, product-specific sales and chargeback processing experience, estimated wholesaler inventory stocking levels, current contract pricing, IMS data and our expectation for future contract pricing changes.
Our net chargeback reserve totaled $101.2 million and $92.4 million at December 31, 2007 and 2006, respectively. Due to information constraints in the distribution channel, it has not been practical, and has not been necessary, for us to capture and quantify the impact of current versus prior year activity on the chargeback provision. Information constraints within the distribution channel primarily relate to our inability to track product through the channel on a unit or specific lot basis. In addition, for the most part, we do not receive information from our customers with respect to what level of their sales are subject to chargeback. The lack of information on a specific lot basis precludes us from tracking actual chargeback activity to the period of our initial sale. As a result, we rely on internal data, external IMS data and management estimates in order to estimate the amount of product in the channel subject to future chargeback. The amount of product in the channel is comprised of physical inventory at the wholesaler and product that the wholesaler has yet to report as end user sales. We estimate yet to be reported end user sales based on a historical average number of days to process chargeback activities from the date of the end user sale. We also review current year chargeback activity to determine whether material changes in the provision relate to prior period sales; such changes have not been material to our statements of operations. A one percent decrease in our estimated end-user contract-selling prices would reduce total revenue for the year ended December 31, 2007 by $0.2 million and a one percent increase in wholesale units pending chargeback at December 31, 2007 would decrease total revenue for the year ended December 31, 2007 by $0.5 million.
Contractual Allowances, Returns and Credits, Cash discounts and Bad Debts
Contractual allowances, generally rebates or administrative fees, are offered to certain wholesale customers, GPOs and end-user customers, consistent with pharmaceutical industry practices. Settlement of rebates and fees may generally occur from one to 15 months from date of sale. We provide a general provision for contractual allowances at the time of sale based on the historical relationship between sales and such allowances. Upon receipt of chargeback, due to the availability of product and customer specific information on these programs, we then establish a specific provision for fees or rebates based on the specific terms of each agreement. Our reserve for contractual allowances totaled $10.1 million and $16.6 million at December 31, 2007 and 2006, respectively. A one percent increase in the estimated rate of contractual allowances to total revenue at December 31, 2007 would decrease net revenues by $0.8 million at that point in time. Contractual allowances are reflected in the financial statements as a reduction of total revenue and as a current accrued liability.
Consistent with industry practice, our return policy permits our customers to return products within a window of time before and after the expiration of product dating. We provide for product returns and other customer credits at the time of sale by applying historical experience factors generally based on our historic data on credits issued by credit category or product, relative to related sales and we provide specifically for known outstanding returns and credits. Our reserve for customer credits and product returns totaled $8.8 million and $9.8 million at December 31, 2007 and 2006, respectively. At December 31, 2007, a one percent increase in the estimated reserve requirements for customer credits and product returns would have decreased total revenue for the year ended December 31, 2007 by $1.7 million.
We generally offer our customers a standard cash discount on our hospital-based products for prompt payments and, from time-to-time, may offer a greater discount and extended terms in support of product launches or other promotional programs. A provision for cash discounts is established at the time of sale based on the terms of sale and adjusted for historical experience factors on the level of cash discount taken.
40
We establish a reserve for bad debts based on general and identified customer credit exposure. Our historic bad debt losses have been insignificant.
Inventories
Inventories consist of products currently approved for marketing and may include certain products pending regulatory approval. From time to time, we capitalize inventory costs associated with products prior to regulatory approval based on our judgment of probable future commercial success and realizable value. Such judgment incorporates our knowledge and best judgment of where the product is in the regulatory review process, our required investment in the product, market conditions, competing products and our economic expectations for the product post-approval relative to the risk of manufacturing the product prior to approval. If final regulatory approval for such products is denied or delayed, we may need to provide for and expense such inventory.
We routinely review our inventory and establish reserves when the cost of the inventory is not expected to be recovered or our product cost exceeds realizable market value. In instances where inventory is at or approaching expiry, is not expected to be saleable based on our quality and control standards or for which the selling price has fallen below cost, we reserve for any inventory impairment based on the specific facts and circumstances. In evaluating the market value of inventory pending regulatory approval as compared to its cost, we consider the market, pricing and demand for competing products, our anticipated selling price for the product and the position of the product in the regulatory review process. Provisions for inventory reserves are reflected in the financial statements as an element of cost of sales with inventories presented net of related reserves.
Expense Recognition
Cost of sales represents the costs of the products which we have sold and consists of labor, raw materials, components, packaging, quality assurance and quality control, shipping and manufacturing overhead costs and the cost of finished products purchased from third parties. In addition, for the years ended December 31, 2007 and 2006, cost of sales included amortization of product rights purchased in June 2006 of $16.4 million and $8.2 million, respectively. The year ended December 31, 2006 also included a $11.8 million charge related to the one-time write-up of finished goods associated with the merger.
Research and development costs are expensed as incurred or consumed and consist primarily of salaries and other personnel-related expenses, as well as depreciation of equipment, allocable facility, raw material and production expenses and contract and consulting fees. Research and development costs also include costs associated with our Puerto activities prior to commercial production.
Selling, general and administrative expenses consist primarily of salaries, commissions and other personnel-related expenses, as well as costs for travel, trade shows and conventions, promotional material and catalogs, advertising and promotion, facilities, risk management and professional fees.
Stock-Based Compensation
We account for stock based compensation in accordance with FAS 123R, which requires the recognition of compensation cost for all share-based payments (including employee stock options) at fair value. Effective January 1, 2006, we adopted the provisions of FAS 123R. We use the straight-line attribution method to recognize share-based compensation expenses over the applicable vesting period of the award. Options currently granted generally expire ten years from the grant date and vest ratably over a four year period while restricted stock units currently granted under the 2001 Stock Plan general vest ratably over a four year period. Awards under the APP Pharmaceuticals, Inc. Restricted Stock Unit Plan (the “RSU Plan”) vest with respect to one half of the units on the second anniversary of the 2006 Merger and with respect to the remaining one half of the units on the fourth anniversary of the 2006 Merger. Excluding the effects of discontinued operations, pre-tax stock-based compensation costs for the year ended December 31, 2007, 2006 and 2005 were $12.1 million, $11.1 million and $12.0 million, respectively.
41
To determine stock-based compensation, we use the Black-Scholes option pricing model to estimate the fair value of options granted under equity incentive plans and rights to acquire stock granted under our stock participation plan. Compensation expense related to equity awards of restricted stock units is based upon the market price on the date of the grant. Stock compensation expense charged to earnings on a straight-line basis over the applicable vesting period. Awards under the RSU Plan entitle the holders on each vesting date to convert the vested portion of their awards into that number of shares of our common stock equal to the value of the vested portion of the award divided by the lower of (i) the average closing price of our common stock over the three consecutive trading days ending on and including the second full trading day preceding the vesting date and (ii) $14.47 (which is the adjusted price following the separation). Accordingly, compensation expense related to the RSU Plan is based on the lower of the market price or $14.47 and is expensed under the liability method in accordance with FAS 123(R) on a straight-line basis over the applicable vesting period.
Income taxes
Deferred tax assets and liabilities are recognized for future tax consequences attributable to differences between the consolidated financial statement carrying amounts of existing assets and liabilities and their respective tax bases as well as net operating loss and capital loss carry forwards. Deferred tax assets and liabilities are measured using enacted tax rates expected to apply to taxable income in the years in which those temporary differences are expected to be recovered or settled. The effect of deferred tax assets and liabilities of a change in tax rates is recognized in the consolidated financial statements in the period that includes the legislative enactment date.
In 2006, the FASB issued FASB Interpretation No. 48, “Accounting for Uncertainty in Income Taxes—an Interpretation of FASB Statement No. 109” (“FIN 48”), which provides specific guidance on the financial statement recognition, measurement, reporting and disclosure of uncertain tax positions taken or expected to be taken in a tax return. FIN 48 addresses the determination of whether tax benefits, either permanent or temporary, should be recorded in the financial statements. We adopted FIN 48 as of January 1, 2007 and as a result recognized a $0.1 million increase to retained earnings from the cumulative effect of adoption.
As of December 31, 2007, the total amount of gross unrecognized tax benefits, which are reported in other liabilities in our unaudited condensed consolidated balance sheet, was $3.0 million. This entire amount would impact our effective tax rate over time, if recognized. In addition, we accrue interest and any necessary penalties related to unrecognized tax positions in our provision for income taxes.
Our effective tax rate for the years ended December 31, 2007 was 40.1%. Our tax rate during the year ended December 31, 2007 was favorably impacted by a $3.1 million net reduction of reserves relating to FIN 48 due to closure of IRS examinations for the 2004 and 2005 tax years. Excluding the impact of the FIN 48 adjustment, our effective tax rate for the year ended December 31, 2007 would have been 42.1%.
We or one of our subsidiaries files income tax returns in the U.S. federal jurisdiction and various states and foreign jurisdictions. In the second quarter of 2007, the Internal Revenue Service (IRS) concluded an examination of our U.S. income tax returns for tax years 2004 and 2005. This resulted in our paying approximately $0.5 million of assessed tax resulting from our method of inventory capitalization. This amount was fully reserved. In addition, we recently received a “no adjustment” closing letter from the IRS in regard to an audit for our former previous parent company (American BioScience, Inc.) related to a 2002 net operating loss carry back to consolidated tax years 1997, 1998, 1999, 2000 and 2001. The Illinois Department of Revenue has commenced an audit of the Combined Unitary Tax Returns for tax years 2003 through 2005. The previous Illinois audit for tax years 2000, 2001, and 2002 resulted in a refund of approximately $2.3 million. In addition, we have received notice of intent to examine income tax returns from California (tax years 2004-2006), Massachusetts (2005-2006) and North Carolina (2003-2006). The California and Massachusetts audits began in the fourth quarter of 2007, and the North Carolina audit is anticipated to begin in the first quarter of 2008. There are no other open federal, state, or foreign government income tax audits at this time.
42
Acquisitions
Our consolidated financial statements and results of operations reflect an acquired business after the completion of the acquisition. We account for acquired businesses using the purchase method of accounting, which requires that the assets acquired and liabilities assumed be recorded at the date of acquisition at their respective fair values. Any excess of the purchase price over the estimated fair values of the net assets acquired is recorded as goodwill. Amounts allocated to acquired IPR&D are expensed at the date of acquisition. When we acquire net assets that do not constitute a business under generally accepted accounting principles in the U.S. (GAAP), no goodwill is recognized.
The judgments made in determining the estimated fair value assigned to each class of assets acquired and liabilities assumed, as well as asset lives, can materially impact our results of operations. Accordingly, for significant items, we typically obtain assistance from third-party valuation specialists. The valuations are based on information available near the acquisition date and are based on expectations and assumptions that have been deemed reasonable by management.
Determining the useful life of an intangible asset also requires judgment, as different types of intangible assets will have different useful lives and certain assets may even be considered to have indefinite useful lives. For example, the useful life of the right associated with a pharmaceutical product’s exclusive patent will be finite and will result in amortization expense being recorded in our results of operations over a determinable period. However, the useful life associated with a brand that has no patent protection but that retains, and is expected to retain, a distinct market identity could be considered to be indefinite and the asset would not be amortized.
Impairment of long-lived assets
We review all of our long-lived assets, including goodwill and other intangible assets, for impairment indicators at least annually and we perform detailed impairment testing for goodwill annually and for all other long-lived assets whenever impairment indicators are present. Examples of those events or circumstances that may be indicative of impairment include:
| | • | | A significant adverse change in legal factors or in the business climate that could affect the value of the asset, including, by way of example, a successful challenge of our patent rights resulting in generic competition earlier than expected. |
| | • | | A significant adverse change in the extent or manner in which an asset is used, including, by way of example, restrictions imposed by the FDA or other regulatory authorities that affect our ability to manufacture or sell a product. |
| | • | | A projection or forecast that demonstrates losses associated with an asset, including, by way of example, a change in a government reimbursement program that results in an inability to sustain projected product revenues or profitability or the introduction of a competitor’s product that results in a significant loss of market share. |
The value of intangible assets is determined primarily using the “income method,” which starts with a forecast of all expected future net cash flows. Accordingly, the potential for impairment for intangible assets may exist if actual revenues are significantly less than those initially forecasted or actual expenses are significantly more than those initially forecasted. Some of the more significant estimates and assumptions inherent in the intangible asset impairment estimation process include: the amount and timing of projected future cash flows; the discount rate selected to measure the risks inherent in the future cash flows; and the assessment of the asset’s life cycle and the competitive trends impacting the asset, including consideration of any technical, legal, regulatory, or economic barriers to entry as well as expected changes in standards of practice for indications addressed by the asset.
43
RECENT ACCOUNTING PRONOUNCEMENTS
In December 2007, the FASB issued Statement No. 141(R), “Business Combination” (SFAS 141R) and Statement No. 160, “Accounting and Reporting of Noncontrolling Interest in Consolidated Financial Statements, an Amendment of ARB No. 51 (SFAS 160). These new standards will significantly change the accounting for and reporting of business combination transactions and noncontrolling (minority) interests consolidated financial statements. SFAS 141R and SFAS 160 are required to be adopted simultaneously and are effective for the first annual reporting period beginning on or after December 15, 2008. Earlier application is not permitted. SFAS 141R and SFAS 160 could have a significant impact on our accounting for future business combinations and other business arrangements after the implementation of these statements.
In June 2007, the FASB ratified the consensus reached by the EITF on EITF Issue No. 07-3, “Accounting for Nonrefundable Advance Payments for Goods or Services Received for Use in Future Research and Development Activities” (or “EITF 07-3”). EITF 07-3 states that nonrefundable advance payments for goods or services that will be used or rendered for future research and development activities should be deferred or capitalized. Such amounts should be recognized as an expense as the related goods are delivered or the related services performed. If an entity does not expect the goods to be delivered or services to be rendered, the capitalized advance payment should be charged to expense. EITF 07-3 is effective for fiscal years beginning after December 15, 2007 and earlier application is not permitted. We occasionally enter into agreements for research and development of goods and service. We are presently evaluating the impact that the adoption of EITF 07-3 will have on our condensed consolidated financial statements.
In February 2007, the FASB issued SFAS No. 159, “The Fair Value Option for Financial Assets and Financial Liabilities—Including an amendment of FASB Statement No. 115.” SFAS No. 159 permits entities to choose to measure many financial instruments and certain other items at fair value. Unrealized gains and losses on items for which the fair value option has been elected will be recognized in earnings at each subsequent reporting date. SFAS No. 159 is effective for our company January 1, 2008. We are evaluating the impact that the adoption of SFAS No. 159 will have on our consolidated financial statements.
In September 2006, the FASB issued SFAS No. 157 which redefines fair value, establishes a framework for measuring fair value in generally accepted accounting principles (“GAAP”), and expands disclosures about fair value measurements. SFAS No. 157 applies where other accounting pronouncements require or permit fair value measurements. SFAS No. 157 is effective for fiscal years beginning after November 15, 2007. The effects of adoption will be determined by the types of instruments carried at fair value in our financial statements at the time of adoption as well as the methods utilized to determine their fair values prior to adoption. Based on our current use of fair value measurements, SFAS No. 157 is not expected to have a material effect on our results of operations or financial position.
| Item 7A. | QUANTITATIVE AND QUALITATIVE DISCLOSURES ABOUT MARKET RISK |
We are exposed to market risks associated with changes in interest rates and foreign currency exchange rates. Interest rate changes affect primarily our debt obligations and our investments in marketable securities. Changes in foreign currency exchange rates can affect our operations outside of the United States.
Interest Rate Risk:We are exposed to changes in interest rates on our borrowings. We have credit facilities totaling $1 billion as well as an unused $150 million revolving credit facility, all of which were outstanding as of December 31, 2007 and all of which bear interest at a variable rate. Effective February 14, 2008, we entered into interest rate swap agreements with an aggregate notional principal amount of $990 million to pay interest at a fixed rate of 3.04% and to receive interest at variable rate of one-month LIBOR. The interest rate swaps expire in February 2009. We formally designated these swaps as a hedge of our exposure to variability in future cash flows attributable to the LIBOR interest payments due on the credit facilities. Changes in fair values of the interest rate swaps are recorded in comprehensive income in our balance sheet each period. Because the terms of the swap and the LIBOR debt coincide (notional amount, interest rate reset dates, and underlying index), there are no other
44
basis differences and the likelihood of swap counterparty default is not probable, the hedge is expected to exactly offset changes in expected cash flows due to fluctuations in the LIBOR rate over the term of the swap agreements and there is no source of ineffectiveness. The effectiveness of the hedge relationship will be periodically assessed during the life of the hedge by comparing the current terms of the swap and the debt to assure they continue to coincide and through an evaluation of the continued ability of the counterparty to the swap to honor its obligations under the swap.
If our interest rates were to increase 1% in 2008 as compared to the weighted average interest rate in 2007, our interest expense for 2008 would increase $10 million based on our outstanding debt balances at December 31, 2007
Foreign Currency Risk: We have operations in Canada, however, both revenue and expenses of our Canadian operations are typically denominated in the currency of the country of operations, providing a partial hedge. Nonetheless, these foreign subsidiaries are presented in our financial statement in U.S. dollars and can be impacted by foreign currency exchange fluctuations through both (i) translation risk, which is the risk that the financial statements for a particular period or as of a certain date depend on the prevailing exchange rates of the various currencies against the U.S. dollar, and (ii) transaction risk, which is the risk that the currency impact of transactions denominated in currencies other than the subsidiaries functional currency may vary according to currency fluctuations.
With respect to translation risk, even though there may be fluctuations of currencies against the U.S. dollar, which may impact comparisons with prior periods, the translation impact is included in accumulated other comprehensive income, a component of stockholders’ equity, and does not affect the underlying results of operations. Gains and losses related to transactions denominated in a currency other than the functional currency of the countries in which we operate are included in the consolidated statements of operations. As of December 31, 2007, there were no outstanding hedge arrangements.
Investment Risk: The primary objectives of our investment program are the safety and preservation of principal, maintaining liquidity to meet operating and projected cash flow requirements, and maximizing return on invested funds, while diversifying risk. Some of the securities that we invest in may have interest rate risk. This means that a change in prevailing interest rates may cause the fair value of the principal amount of the investment to fluctuate. For example, if we hold a security that was issued with a fixed interest rate at the prevailing rate and the prevailing rate later rises, the fair value of the principal amount of our investment will probably decline.
To minimize this risk, we maintain an investment portfolio of cash equivalents and short-term investments consisting of high credit quality securities, including money market funds, commercial paper, government and non-government debt securities. We do not use derivative financial instruments. The average maturity of the debt securities in which we invest has been less than 90 days and the maximum maturity has been three months.
| Item 8. | FINANCIAL STATEMENTS AND SUPPLEMENTARY DATA |
The information required by this item is incorporated herein by reference to the financial statements and schedule listed in Item 15 (a)1 and (a)2 of Part IV and included in this Form 10-K Annual Report.
45
Report of Independent Registered Public Accounting Firm
The Board of Directors and Stockholders of APP Pharmaceuticals, Inc.
We have audited the accompanying consolidated balance sheets of APP Pharmaceuticals, Inc. and subsidiaries (previously known as Abraxis BioScience, Inc.) as of December 31, 2007 and 2006, and the related consolidated statements of operations, stockholders’ equity, and cash flows for each of the three years in the period ended December 31, 2007. Our audits also included the financial statement schedule included in the Index at Item 15(a). These financial statements and schedule are the responsibility of company’s management. Our responsibility is to express an opinion on these financial statements and schedule based on our audits.
We conducted our audits in accordance with the standards of the Public Company Accounting Oversight Board (United States). Those standards require that we plan and perform the audit to obtain reasonable assurance about whether the financial statements are free of material misstatement. An audit includes examining, on a test basis, evidence supporting the amounts and disclosures in the financial statements. An audit also includes assessing the accounting principles used and significant estimates made by management, as well as evaluating the overall financial statement presentation. We believe that our audits provide a reasonable basis for our opinion.
In our opinion, the financial statements referred to above present fairly, in all material respects, the consolidated financial position of APP Pharmaceuticals, Inc. and subsidiaries at December 31, 2007 and 2006, and the consolidated results of their operations and their cash flows for each of the three years in the period ended December 31, 2007, in conformity with U.S. generally accepted accounting principles. Also, in our opinion the related financial statement schedule, when considered in relation to the basic financial statements taken as a whole, presents fairly in all material respects the information set forth therein.
We also have audited, in accordance with the standards of the Public Company Accounting Oversight Board (United States), APP Pharmaceuticals, Inc.’s internal control over financial reporting as of December 31, 2007, based on criteria established in Internal Control-Integrated Framework issued by the Committee of Sponsoring Organizations of the Treadway Commission and our report dated March 17, 2008 expressed an unqualified opinion thereon.
/s/ Ernst & Young LLP
Chicago, Illinois
March 17, 2008
46
APP Pharmaceuticals, Inc.
Consolidated Balance Sheets
| | | | | | | | |
| | | December 31,
2007 | | | December 31,
2006 | |
| | | (in thousands, except share data) | |
Assets | | | | | | | | |
Current assets: | | | | | | | | |
Cash and cash equivalents | | $ | 31,788 | | | $ | 39,297 | |
Accounts receivable, less allowances for doubtful accounts of $100 in 2007 and 2006, and net chargebacks of $101,177 and $92,427 in 2007 and 2006 | | | 85,209 | | | | 84,684 | |
Inventories | | | 149,191 | | | | 218,280 | |
Prepaid expenses and other current assets | | | 13,531 | | | | 15,570 | |
Current receivables from related parties | | | 6,996 | | | | | |
Deferred income taxes | | | 17,109 | | | | 27,168 | |
| | | | | | | | |
Total current assets | | | 303,824 | | | | 384,999 | |
Property, plant and equipment, net | | | 132,528 | | | | 217,819 | |
Investment in Drug Source Company, LLC | | | — | | | | 5,504 | |
Intangible assets, net of accumulated amortization of $51,336 and $47,482 in 2007 and 2006 | | | 463,154 | | | | 738,440 | |
Goodwill | | | 160,239 | | | | 401,600 | |
Non-current receivables from related parties | | | — | | | | 39 | |
Deferred financing costs and other non-current assets, net of accumulated amortization of $299 and $281 in 2007 and 2006 | | | 17,842 | | | | 25,320 | |
| | | | | | | | |
Total assets | | $ | 1,077,587 | | | $ | 1,773,721 | |
| | | | | | | | |
Liabilities and stockholders’ equity (deficit) | | | | | | | | |
Current liabilities: | | | | | | | | |
Accounts payable | | $ | 36,502 | | | $ | 65,471 | |
Accrued liabilities | | | 45,595 | | | | 61,428 | |
Income taxes payable | | | — | | | | 80,054 | |
Deferred revenue | | | — | | | | 39,225 | |
Minimum royalties payable | | | — | | | | 1,017 | |
Notes payable | | | — | | | | 72,248 | |
Short term portion of debt | | | 5,000 | | | | — | |
| | | | | | | | |
Total current liabilities | | | 87,097 | | | | 319,443 | |
| | | | | | | | |
Long-term debt | | | 995,000 | | | | 165,000 | |
Deferred income taxes, non-current | | | 71,011 | | | | 90,776 | |
Long-term portion of deferred revenue | | | — | | | | 158,135 | |
Other non-current liabilities | | | 4,250 | | | | 7,006 | |
| | | | | | | | |
Total liabilities | | | 1,157,358 | | | | 740,360 | |
Stockholders’ equity (deficit): | | | | | | | | |
Common stock—$0.001 par value; 350,000,000 shares authorized; | | | | | | | | |
160,069,196 and 165,928,134 shares issued in 2007 and 2006 | | | 160 | | | | 166 | |
Additional paid-in capital | | | (96,357 | ) | | | 1,085,196 | |
Retained earnings | | | 13,715 | | | | 4,483 | |
Accumulated other comprehensive income | | | 2,711 | | | | 1,257 | |
Less treasury stock at cost, 6,705,116 common shares were outstanding in 2006 | | | — | | | | (57,741 | ) |
| | | | | | | | |
Total stockholders’ (deficit) equity | | | (79,771 | ) | | | 1,033,361 | |
| | | | | | | | |
Total liabilities and stockholders’ equity (deficit) | | $ | 1,077,587 | | | $ | 1,773,721 | |
| | | | | | | | |
47
APP Pharmaceuticals, Inc.
Consolidated Statements of Operations
| | | | | | | | | | | | |
| | | Year ended December 31, | |
| | | 2007 | | | 2006 | | | 2005 | |
| | | (in thousands, except per share data) | |
Net revenue | | $ | 647,374 | | | $ | 583,201 | | | $ | 385,082 | |
Cost of sales | | | 332,046 | | | | 288,079 | | | | 203,436 | |
| | | | | | | | | | | | |
Gross profit | | | 315,328 | | | | 295,122 | | | | 181,646 | |
Operating expenses: | | | | | | | | | | | | |
Research and development | | | 46,497 | | | | 27,787 | | | | 18,454 | |
Selling, general and administrative | | | 90,229 | | | | 80,669 | | | | 69,059 | |
Amortization of merger related intangibles | | | 15,418 | | | | 10,926 | | | | — | |
Separation related costs | | | 3,024 | | | | — | | | | — | |
Merger related in-process research and development charge | | | — | | | | 22,330 | | | | — | |
Other merger related costs | | | — | | | | 12,613 | | | | 7,863 | |
| | | | | | | | | | | | |
Total operating expense | | | 155,168 | | | | 154,325 | | | | 95,376 | |
| | | | | | | | | | | | |
Income from operations | | | 160,160 | | | | 140,797 | | | | 86,270 | |
Interest income and other | | | 2,182 | | | | 3,557 | | | | 470 | |
Interest expense | | | (25,162 | ) | | | (9,186 | ) | | | — | |
Minority interests | | | — | | | | (11,383 | ) | | | (25,875 | ) |
| | | | | | | | | | | | |
Income from continuing operations before income taxes | | | 137,180 | | | | 123,785 | | | | 60,865 | |
Provision for income taxes from continuing operations | | | 55,001 | | | | 68,559 | | | | 30,409 | |
| | | | | | | | | | | | |
Net income from continuing operations | | | 82,179 | | | | 55,226 | | | | 30,456 | |
Net loss from discontinued operations, net of taxes | | | (47,821 | ) | | | (102,123 | ) | | | (12,799 | ) |
| | | | | | | | | | | | |
Net income (loss) | | $ | 34,358 | | | $ | (46,897 | ) | | $ | 17,657 | |
| | | | | | | | | | | | |
Basic income (loss) per common share: | | | | | | | | | | | | |
Continuing operations | | $ | 0.51 | | | $ | 0.35 | | | $ | 0.19 | |
Discontinued operations | | | (0.29 | ) | | | (0.65 | ) | | | (0.08 | ) |
| | | | | | | | | | | | |
Net income (loss) per common share: | | $ | 0.22 | | | $ | (0.30 | ) | | $ | 0.11 | |
| | | | | | | | | | | | |
Diluted income (loss) per common share: | | | | | | | | | | | | |
Continuing operations | | $ | 0.51 | | | $ | 0.35 | | | $ | 0.19 | |
Discontinued operations | | | (0.30 | ) | | | (0.64 | ) | | | (0.08 | ) |
| | | | | | | | | | | | |
Net income (loss) per common share: | | $ | 0.21 | | | $ | (0.29 | ) | | $ | 0.11 | |
| | | | | | | | | | | | |
The composition of stock-based compensation from continuing operations included above is as follows: | | | | | | | | | | | | |
Cost of sales | | $ | 2,502 | | | $ | 2,668 | | | $ | 2,947 | |
Research and development | | | 602 | | | | 554 | | | | 465 | |
Selling, general and administrative | | | 8,977 | | | | 7,902 | | | | 8,625 | |
| | | | | | | | | | | | |
| | $ | 12,081 | | | $ | 11,124 | | | $ | 12,037 | |
| | | | | | | | | | | | |
48
APP Pharmaceuticals, Inc.
Consolidated Statements of Stockholders’ Equity
Years Ended December 31, 2007, 2006 and 2005
| | | | | | | | | | | | | | | | | | | | | | | | | | | | | | | | | | | | | | | | | | | |
| | | Series A Preferred
Stock | | | Series B Preferred
Stock | | | Common Stock | | | Additional
Paid-in
Capital | | | Retained
Earnings
(Deficit) | | | Other
Comprehensive
Income (Loss) | | | Treasury Stock | | | Total | |
| | | Shares | | | Amount | | | Shares | | | Amount | | | Shares | | | Amount | | | | | | Shares | | | Amount | | |
| | | (in thousands) | |
Balance, January 1, 2005 | | 10,000,000 | | | $ | 10,000 | | | 22,500,000 | | | $ | 22,500 | | | 172,888,327 | | | $ | 173 | | | $ | 137,062 | | | $ | 53,723 | | | $ | 234 | | | (6,646,398 | ) | | $ | (56,274 | ) | | 135,322 | |
Effect of equity transactions by American Pharmaceutical Partners, Inc. | | — | | | | — | | | — | | | | — | | | — | | | | — | | | | 24,826 | | | | — | | | | — | | | — | | | | — | | | 24,826 | |
Purchase of common stock | | — | | | | — | | | — | | | | — | | | (7,896,226 | ) | | | (8 | ) | | | (67,492 | ) | | | — | | | | — | | | — | | | | — | | | (67,500 | ) |
Purchase of preferred stock A | | (10,000,000 | ) | | | (10,000 | ) | | — | | | | — | | | — | | | | — | | | | (7,125 | ) | | | — | | | | — | | | — | | | | — | | | (17,125 | ) |
Purchase of preferred stock B | | — | | | | — | | | (22,500,000 | ) | | | (22,500 | ) | | — | | | | — | | | | (16,031 | ) | | | — | | | | — | | | — | | | | — | | | (38,531 | ) |
Distribution of equity to acquire Transplant Research Institute | | — | | | | — | | | — | | | | — | | | — | | | | — | | | | — | | | | (20,000 | ) | | | — | | | — | | | | — | | | (20,000 | ) |
Comprehensive income: | | | | | | | | | | | | | | | | | | | | | | | | | | | | | | | | | | | | | | | | | | | |
Net income | | — | | | | — | | | — | | | | — | | | — | | | | — | | | | — | | | | 17,657 | | | | — | | | — | | | | — | | | 17,657 | |
Unrealized gain on available-for-sale securities, net of tax | | — | | | | — | | | — | | | | — | | | — | | | | — | | | | — | | | | — | | | | 1,066 | | | — | | | | — | | | 1,066 | |
Foreign currency translation adjustments | | — | | | | — | | | — | | | | — | | | — | | | | — | | | | — | | | | — | | | | 329 | | | — | | | | — | | | 329 | |
| | | | | | | | | | | | | | | | | | | | | | | | | | | | | | | | | | | | | | | | | | | |
Comprehensive income | | — | | | | — | | | — | | | | — | | | — | | | | — | | | | — | | | | — | | | | — | | | — | | | | — | | | 19,052 | |
| | | | | | | | | | | | | | | | | | | | | | | | | | | | | | | | | | | | | | | | | | | |
Balance, December 31, 2005 | | — | | | | — | | | — | | | | — | | | 164,992,101 | | | | 165 | | | | 71,240 | | | | 51,380 | | | | 1,629 | | | (6,646,398 | ) | | | (56,274 | ) | | 68,140 | |
Effect of merger between APP and ABI | | — | | | | — | | | — | | | | — | | | — | | | | — | | | | 979,245 | | | | — | | | | — | | | — | | | | — | | | 979,245 | |
Exercise of Stock Options | | — | | | | — | | | — | | | | — | | | 643,578 | | | | 1 | | | | 7,975 | | | | — | | | | — | | | — | | | | — | | | 7,976 | |
Issuance of stock for employee retirement and stock purchase plan | | — | | | | — | | | — | | | | — | | | 157,792 | | | | — | | | | 3,274 | | | | — | | | | — | | | — | | | | — | | | 3,274 | |
Unvested restricted stock and stock options forfeited | | — | | | | — | | | — | | | | — | | | (5,449 | ) | | | — | | | | — | | | | — | | | | — | | | — | | | | — | | | — | |
Issuance of vested stock | | — | | | | — | | | — | | | | — | | | 140,112 | | | | — | | | | (41 | ) | | | — | | | | — | | | — | | | | — | | | (41 | ) |
Purchase of treasury stock | | — | | | | — | | | — | | | | — | | | — | | | | — | | | | — | | | | — | | | | — | | | (58,718 | ) | | | (1,467 | ) | | (1,467 | ) |
Stock compensation expense | | — | | | | — | | | — | | | | — | | | — | | | | — | | | | 19,436 | | | | — | | | | — | | | — | | | | — | | | 19,436 | |
Tax benefit of stock compensation plants | | — | | | | — | | | — | | | | — | | | — | | | | — | | | | 4,067 | | | | — | | | | — | | | — | | | | — | | | 4,067 | |
Comprehensive income: | | | | | | | | | | | | | | | | | | | | | | | | | | | | | | | | | | | | | | | | | | | |
Net income | | — | | | | — | | | — | | | | — | | | — | | | | — | | | | — | | | | (46,897 | ) | | | — | | | — | | | | — | | | (46,897 | ) |
Unrealized gain on available-for-sale securities, net of tax | | — | | | | — | | | — | | | | — | | | — | | | | — | | | | — | | | | — | | | | (1,089 | ) | | — | | | | — | | | (1,089 | ) |
Foreign currency translation adjustments | | — | | | | — | | | — | | | | — | | | — | | | | — | | | | — | | | | — | | | | 717 | | | — | | | | — | | | 717 | |
| | | | | | | | | | | | | | | | | | | | | | | | | | | | | | | | | | | | | | | | | | | |
Comprehensive income | | — | | | | — | | | — | | | | — | | | — | | | | — | | | | — | | | | — | | | | — | | | — | | | | — | | | (47,269 | ) |
| | | | | | | | | | | | | | | | | | | | | | | | | | | | | | | | | | | | | | | | | | | |
Balance, December 31, 2006 | | — | | | | — | | | — | | | | — | | | 165,928,134 | | | | 166 | | | | 1,085,196 | | | | 4,483 | | | | 1,257 | | | (6,705,116 | ) | | | (57,741 | ) | | 1,033,361 | |
| | | | | | | | | | | | | | | | | | | | | | | | | | | | | | | | | | | | | | | | | | | |
49
APP Pharmaceuticals, Inc.
Consolidated Statements of Stockholders’ Equity—(Continued)
Years Ended December 31, 2007, 2006 and 2005
| | | | | | | | | | | | | | | | | | | | | | | | | | | | | | | | | | | |
| | | Series A
Preferred Stock | | Series B
Preferred Stock | | Common Stock | | | Additional
Paid-in
Capital | | | Retained
Earnings
(Deficit) | | | Other
Comprehensive
Income (Loss) | | | Treasury Stock | | Total | |
| | | Shares | | Amount | | Shares | | Amount | | Shares | | | Amount | | | | | | Shares | | Amount | |
| | | (in thousands) | |
Distribution of New Abraxis | | — | | — | | — | | — | | — | | | | — | | | | (1,173,518 | ) | | | (25,043 | ) | | | (773 | ) | | — | | — | | | (1,199,334 | ) |
Exercise of stock options | | — | | — | | — | | — | | 439,325 | | | | — | | | | 3,450 | | | | — | | | | — | | | — | | — | | | 3,450 | |
Issuance of stock for employee retirement and stock purchase plan | | — | | — | | — | | — | | 220,010 | | | | — | | | | 3,801 | | | | — | | | | — | | | — | | — | | | 3,801 | |
Cumulative effect adjustment of adoption of FIN 48 | | — | | — | | — | | — | | — | | | | — | | | | | | | | (83 | ) | | | — | | | — | | — | | | (83 | ) |
Purchase/(retirement) of treasury stock | | — | | — | | — | | — | | (6,689,148 | ) | | | (6 | ) | | | (57,735 | ) | | | — | | | | — | | | 6,705,116 | | 57,741 | | | — | |
Issuance of shares in conjunction with legal settlement | | — | | — | | — | | — | | 43,500 | | | | — | | | | 14,763 | | | | — | | | | — | | | — | | — | | | 14,763 | |
Stock compensation related to restricted stock unit vesting | | — | | — | | — | | — | | 127,375 | | | | — | | | | (2,611 | ) | | | — | | | | — | | | — | | — | | | (2,611 | ) |
Stock compensation expense | | — | | — | | — | | — | | — | | | | — | | | | 28,136 | | | | — | | | | — | | | — | | — | | | 28,136 | |
Excess tax benefit of stock compensation plans | | — | | — | | — | | — | | — | | | | — | | | | 1,083 | | | | — | | | | — | | | — | | — | | | 1,083 | |
Tax benefit of licensing agreement and other | | | | | | | | | | — | | | | — | | | | 1,078 | | | | — | | | | — | | | — | | — | | | 1,078 | |
Comprehensive income: | | | | | | | | | | | | | | | | | | | | | | | | | | | | | | | | | | | |
Net income | | — | | — | | — | | — | | — | | | | — | | | | — | | | | 34,358 | | | | — | | | — | | — | | | 34,358 | |
Unrealized gain on available-for-sale securities, net of tax | | — | | — | | — | | — | | — | | | | — | | | | — | | | | — | | | | (460 | ) | | — | | — | | | (460 | ) |
Foreign currency translation adjustments | | — | | — | | — | | — | | — | | | | — | | | | — | | | | — | | | | 2,687 | | | — | | — | | | 2,687 | |
Comprehensive income | | — | | — | | — | | — | | — | | | | — | | | | — | | | | — | | | | — | | | — | | — | | | 36,585 | |
| | | | | | | | | | | | | | | | | | | | | | | | | | | | | | | | | | | |
Balance, December 31, 2007 | | — | | — | | — | | — | | 160,069,196 | | | $ | 160 | | | $ | (96,357 | ) | | $ | 13,715 | | | $ | 2,711 | | | — | | — | | $ | (79,771 | ) |
| | | | | | | | | | | | | | | | | | | | | | | | | | | | | | | | | | | |
50
APP Pharmaceuticals, Inc.
Consolidated Statements of Cash Flows
| | | | | | | | | | | | |
| | | Year Ended December 31, | |
| | | 2007 | | | 2006 | | | 2005 | |
| | | (in thousands) | |
Cash flows from operating activities: | | | | | | | | | | | | |
Net income from continuing operations | | $ | 82,179 | | | $ | 55,226 | | | $ | 30,456 | |
Net loss from discontinued operations, net of taxes | | | (47,821 | ) | | | (102,123 | ) | | | (12,798 | ) |
| | | | | | | | | | | | |
Net income (loss) | | | 34,358 | | | | (46,897 | ) | | | 17,658 | |
Adjustments to reconcile net income (loss) to net cash provided by (used in) operating activities: | | | | | | | | | | | | |
Depreciation | | | 28,460 | | | | 19,108 | | | | 14,224 | |
Amortization | | | 1,796 | | | | 1,608 | | | | 1,149 | |
Amortization of product rights | | | 16,440 | | | | 8,220 | | | | — | |
Amortization of merger related inventory step-up | | | — | | | | 12,480 | | | | — | |
Amortization of merger related intangibles | | | 50,811 | | | | 38,275 | | | | — | |
Merger related in-process R&D charge | | | — | | | | 105,777 | | | | — | |
Stock-based compensation | | | 28,598 | | | | 35,023 | | | | 16,409 | |
Non-cash issuance for legal expenses | | | 14,763 | | | | — | | | | — | |
Loss on disposal of property, plant and equipment | | | 797 | | | | 189 | | | | 941 | |
Excess tax benefit from stock-based compensation | | | (1,083 | ) | | | (4,067 | ) | | | (15,687 | ) |
Stock option grants/forfeitures | | | (2,611 | ) | | | | | | | | |
Deferred income taxes | | | (10,142 | ) | | | (83,199 | ) | | | (9,127 | ) |
Minority interest | | | — | | | | 11,383 | | | | 25,875 | |
Equity in net income of Drug Source Company, LLC, net of dividends received | | | (3,291 | ) | | | (2,776 | ) | | | 3,528 | |
Changes in operating assets and liabilities, net of effects of spin off: | | | | | | | | | | | | |
Accounts receivable, net | | | (42,199 | ) | | | (22,816 | ) | | | (46,351 | ) |
Inventories | | | (12,165 | ) | | | (42,998 | ) | | | (23,847 | ) |
Prepaid expenses and other current assets | | | (7,900 | ) | | | (2,004 | ) | | | (2,226 | ) |
Non-current receivables (due to) from related parties | | | (6,997 | ) | | | 610 | | | | (2 | ) |
Deferred revenue | | | (33,945 | ) | | | 178,956 | | | | 18,366 | |
Minimum royalties payable | | | (984 | ) | | | (3 | ) | | | (82 | ) |
Other non-current liabilities | | | 2,607 | | | | (1,565 | ) | | | 872 | |
Income taxes payable | | | (80,031 | ) | | | 73,062 | | | | (2,597 | ) |
Accounts payable and accrued expenses | | | 35,071 | | | | 46,611 | | | | 35,363 | |
| | | | | | | | | | | | |
Net cash provided by operating activities | | | 12,353 | | | | 324,977 | | | | 34,466 | |
Cash flows from investing activities: | | | | | | | | | | | | |
Purchases of property, plant and equipment | | | (86,160 | ) | | | (84,486 | ) | | | (51,107 | ) |
Purchases of other non-current assets | | | (2,862 | ) | | | (13,972 | ) | | | — | |
Purchase of product rights | | | — | | | | (328,797 | ) | | | (4,085 | ) |
Net sale (purchase) of short-term investments | | | — | | | | 54,455 | | | | 12,020 | |
| | | | | | | | | | | | |
Net cash (used in) investing activities | | | (89,022 | ) | | | (372,800 | ) | | | (43,172 | ) |
Cash flows from financing activities | | | | | | | | | | | | |
Proceeds from the exercise of stock options | | | 3,450 | | | | 7,975 | | | | 11,547 | |
Proceeds from issuance of senior secured credit agreement | | | 1,000,000 | | | | — | | | | — | |
Proceeds from issuance from unsecured credit facility | | | 366,000 | | | | 204,500 | | | | 190,000 | |
Proceeds from the sale of stock under employee retirement and stock purchase plan | | | 3,801 | | | | 3,274 | | | | 3,129 | |
Notes payable | | | (66,735 | ) | | | 72,248 | | | | — | |
Excess tax benefit from stock-based compensation | | | 1,083 | | | | 4,065 | | | | 15,687 | |
Repayment of borrowings on unsecured credit facility | | | (531,000 | ) | | | (229,500 | ) | | | (42,750 | ) |
Payment of deferred financing costs | | | (13,275 | ) | | | (1,704 | ) | | | (585 | ) |
Distribution of equity to acquire TRI | | | — | | | | — | | | | (20,000 | ) |
Repurchase of preferred stock | | | — | | | | — | | | | (55,656 | ) |
Retirement of treasury stock | | | — | | | | (1,467 | ) | | | (67,500 | ) |
Separation asset transfer | | | (696,431 | ) | | | — | | | | — | |
| | | | | | | | | | | | |
Net cash provided by financing activities | | | 66,893 | | | | 59,391 | | | | 33,872 | |
Effect of exchange rates on cash | | | 2,267 | | | | (1,089 | ) | | | 329 | |
| | | | | | | | | | | | |
Net (decrease) increase in cash and cash equivalents | | | (7,509 | ) | | | 10,479 | | | | 25,495 | |
Cash and cash equivalents, beginning of year | | | 39,297 | | | | 28,818 | | | | 3,323 | |
| | | | | | | | | | | | |
Cash and cash equivalents, end of year | | $ | 31,788 | | | $ | 39,297 | | | $ | 28,818 | |
| | | | | | | | | | | | |
Supplemental disclosure of cash flow information: | | | | | | | | | | | | |
Cash paid for interest | | $ | 17,552 | | | $ | 13,165 | | | $ | 7,674 | |
Cash paid for income taxes, net of refunds | | | 122,501 | | | | 33,490 | | | | 33,690 | |
See accompanying notes to consolidated financial statements
51
APP Pharmaceuticals, Inc.
Notes to Consolidated Financial Statements
December 31, 2007
1. Description of Business
We are a pharmaceutical company that develops, manufactures and markets injectable pharmaceutical products. We believe that we are the only independent U.S. public company with a primary focus on the injectable oncology, anti-infective and critical care markets, and we further believe that we offer one of the most comprehensive injectable product portfolios in the pharmaceutical industry. We manufacture products in each of the three basic forms in which injectable products are sold: liquid, powder and lyophilized, or freeze-dried.
We began in 1996 with an initial focus on U.S. marketing and distribution of generic pharmaceutical products manufactured by others. In June 1998, we acquired Fujisawa USA, Inc.’s generic injectable pharmaceutical business, including manufacturing facilities in Melrose Park, Illinois and Grand Island, New York and our research and development facility in Melrose Park, Illinois. We also acquired additional assets in this transaction, including inventories, plant and equipment and abbreviated new drug applications that were approved by or pending with the FDA.
Our products are generally used in hospitals, long-term care facilities, alternate care sites and clinics within North America. Unlike the retail pharmacy market for oral products, the injectable pharmaceuticals marketplace is largely made up of end users who have relationships with group purchasing organizations, or GPOs, and/or specialty distributors who distribute products within a particular end-user market, such as oncology clinics. GPOs and specialty distributors generally enter into collective product purchasing agreements with pharmaceutical suppliers in an effort to secure more favorable drug pricing on behalf of their members.
We are a Delaware corporation that was formed in 2001 as successor to a California corporation formed in 1996. On April 18, 2006, we completed a merger with American BioScience, Inc., or ABI, our former parent. In connection with the closing of that merger, our certificate of incorporation was amended to change our original name of American Pharmaceutical Partners, Inc. to Abraxis BioScience, Inc. which we refer to as “Old Abraxis.” Old Abraxis operated in two distinct business segments: Abraxis BioScience (ABI), representing the combined operations of Abraxis Oncology and Abraxis Research; and Abraxis Pharmaceutical Products (APP), representing the hospital-based operations.
On November 13, 2007, Old Abraxis separated into two independent publicly-traded companies, one holding the Abraxis Pharmaceutical Products business, focusing primarily on manufacturing and marketing our oncology, anti-infective and critical care hospital-based generic injectable products and marketing our proprietary anesthetic/analgesic products (which we refer to collectively as the “hospital-based business”), and the other holding the Abraxis Oncology and Abraxis Research businesses (which we refer to as the “proprietary business”). We refer to the proprietary business following the separation as “New Abraxis,” which subsequently changed its name to Abraxis BioScience, Inc. We continue to operate the hospital-based business (which we refer to as “New APP”) under the name APP Pharmaceuticals, Inc.
New APP and New Abraxis have entered into a series of agreements, including a separation and distribution agreement, a transition services agreement, an employee matters agreement, a tax allocation agreement, a manufacturing agreement and various real estate leases. Please refer toNote 7—Related Parties for additional information on the separation related agreements. Also, in connection with the separation, we incurred $1 billion of indebtedness and, in addition, entered into a $150 million revolving credit facility that is currently unused. Approximately $276 million of the proceeds of this indebtedness was used to repay in full our prior revolving credit facility; approximately $12 million was used to pay fees and expenses related to the debt financing; and $700 million was contributed to New Abraxis. New APP is solely responsible for servicing the debt following the transactions. Please refer toNote 3—Spin-off of New Abraxis.
52
2. Summary of Significant Accounting Policies
Basis of Accounting and Consolidation
On November 13, 2007, Old Abraxis separated into two independent publicly-traded companies: our company, APP Pharmaceuticals, Inc. (New APP), and New Abraxis. The consolidated financial statements include: (a) the assets, liabilities and results of operations of APP Pharmaceuticals, Inc. and our wholly owned subsidiaries, Pharmaceutical Partners of Canada, Inc. and APP Pharmaceuticals Manufacturing, LLC; and (b) for periods prior to the spin-off, the historical operations of New Abraxis and its subsidiaries. The historical operating results of New Abraxis are now presented as discontinued operations. Please refer toNote 3- Spin-off of New Abraxis.
Accordingly, prior to our separation, the consolidated assets and liabilities include the results of Old Abraxis and the wholly owned subsidiaries, Pharmaceutical Partners of Canada, Inc., APP Pharmaceuticals Manufacturing, LLC, Pharmaceutical Partners Switzerland, GmbH, VivoRx AutoImmune, Inc., Chicago BioScience, LLC and Transplant Research Institute, as well as the majority-owned subsidiary, Resuscitation Technologies, LLC, Cenomed, and investment in Drug Source Company, LLC, which is accounted for using the equity method.
Certain amounts in the accompanying financial statements were reclassified to conform to the current year presentation, including the reclassification of $52 million of current deferred tax assets to reduction in non-current deferred tax liability.
Fiscal Year
For years ended December 31, 2007 and 2006, APP Pharmaceuticals and its subsidiary use a calendar fiscal year, beginning on January 1 and ending on December 31. For year ended December 31, 2005, the company used a 52-week fiscal year, which ended on December 31, 2005.
Use of Estimates
The preparation of financial statements in conformity with accounting principles generally accepted in the United States requires management to make estimates and assumptions that affect the reported amounts of assets and liabilities and disclosure of contingent assets and liabilities at the date of the consolidated financial statements. Estimates may also affect the reported amounts of revenues and expenses during the reporting period. Actual results could differ from those estimates.
Cash, Cash Equivalents and Short-term Investments
It is our policy to include cash and investments having a maturity of three months or less at the time of acquisition in cash and cash equivalents. Short-term investments consist of highly-liquid, available-for-sale, municipal variable rate demand notes which are recorded at cost, and may be redeemed at par upon seven days notice. The cost of these short-term investments closely approximates their fair market value due to their variable interest rates, which typically reset every seven days. We have never incurred realized or unrealized holding gains or losses on these securities and income resulting from our short-term investments is recorded as interest income.
Accounts Receivable and Concentration of Credit Risk
We typically have multi-year contractual agreements with GPOs and individual hospital groups to supply our products to end-user hospital and alternate site customers. As is traditional in the pharmaceutical industry, a significant amount of our generic pharmaceutical products are sold to end users under GPO contracts through a relatively small number of drug wholesalers, which comprise the primary pharmaceutical distribution chain in
53
the United States. Three wholesalers collectively, and approximately proportionately, represented 74%, 73% and 77% of our sales in fiscal 2007, 2006 and 2005, respectively, and represented 86% and 88% of accounts receivable at December 31, 2007 and 2006, respectively. To help control our credit exposure, we routinely monitor the creditworthiness of our customers, review outstanding customer balances and record allowances for bad debts as necessary. We insure all, or a portion of, gross receivables from our largest customers to protect against risk of significant credit loss. Historical credit loss has been insignificant.
Inventories
Inventories are valued at the lower of cost or market as determined under the first-in, first-out, or FIFO, method, as follows:
| | | | | | | | | | | | | | | | | | |
| | | December 31, |
| | | 2007 | | 2006 |
| | | Approved | | Pending
Regulatory
Approval | | Total
Inventory | | Approved | | Pending
Regulatory
Approval | | Total
Inventory |
| | | (in thousands) |
Finished goods | | $ | 58,787 | | | | | $ | 58,787 | | $ | 55,248 | | | | | $ | 55,248 |
Work in process | | | 20,097 | | | 354 | | | 20,451 | | | 26,698 | | | 3,566 | | | 30,264 |
Raw materials | | | 68,202 | | | 1,751 | | | 69,953 | | | 110,642 | | | 22,126 | | | 132,768 |
| | | | | | | | | | | | | | | | | | |
| | $ | 147,086 | | $ | 2,105 | | $ | 149,191 | | $ | 192,589 | | $ | 25,692 | | $ | 218,280 |
| | | | | | | | | | | | | | | | | | |
Inventories consist of products currently approved for marketing and may include certain products pending regulatory approval. From time to time, we capitalize inventory costs associated with products prior to regulatory approval based on our judgment of probable future commercial success and realizable value. Such judgment incorporates our knowledge and best judgment of where the product is in the regulatory review process, our required investment in the product, market conditions, competing products and our economic expectations for the product post-approval relative to the risk of manufacturing the product prior to approval. If final regulatory approval for such products is denied or delayed, we may need to provide for and expense such inventory.
At December 31, 2007 and December 31, 2006, inventory included $2.1 and $25.7 million respectively in cost relating to products pending FDA and European approval. Included in the amount pending approval at December 31, 2006 was approximately $17.7 million of paclitaxel (whole plant) and other Abraxane® related products associated with New Abraxis’ operations, at our Grand Island facility.
We routinely review our inventory and establish reserves when the cost of the inventory is not expected to be recovered or our product cost exceeds realizable market value. In instances where inventory is at or approaching expiry, is not expected to be saleable based on our quality and control standards or for which the selling price has fallen below cost, we reserve for any inventory impairment based on the specific facts and circumstances. In evaluating the market value of inventory pending regulatory approval as compared to its cost, we considered the market, pricing and demand for competing products, our anticipated selling price for the product and the position of the product in the regulatory review process. Provisions for inventory reserves are reflected in the financial statements as an element of cost of sales with inventories presented net of related reserves.
54
Property, Plant and Equipment
Property, plant and equipment is stated on the basis of cost or allocated acquisition value. Provisions for depreciation are computed for financial reporting purposes using the straight-line method over the estimated useful life of the related asset and for leasehold improvements the lesser of the estimated useful life of the related asset or the term of the related lease as follows:
| | |
Buildings and improvements | | 10-30 years |
Machinery and equipment | | 3-10 years |
Furniture and fixtures | | 5-7 years |
Aircraft | | 15 years |
Depreciation expense from continuing operations was $19.1 million, $13.6 million and $11.4 million for the years ended December 31, 2007, 2006 and 2005, respectively. Depreciation expense increased $5.5 million in 2007 as compared to 2006, due primarily to our Puerto Rico facility. Depreciation expense increased $2.2 million in 2006 as compared to 2005, due primarily to an overall increase in capital expenditures.
Property, plant, and equipment consist of the following:
| | | | | | | | |
| | | December 31, | |
| | | 2007 | | | 2006 | |
| | | (in thousands) | |
Land | | $ | 3,619 | | | $ | 6,636 | |
Building and improvements | | | 41,743 | | | | 80,253 | |
Machinery and equipment | | | 81,252 | | | | 124,559 | |
Furniture and fixtures | | | 50,725 | | | | 40,599 | |
Construction in progress | | | 32,185 | | | | 49,702 | |
| | | | | | | | |
| | | 209,524 | | | | 301,749 | |
Less allowance for depreciation | | | (76,996 | ) | | | (83,930 | ) |
| | | | | | | | |
| | $ | 132,528 | | | $ | 217,819 | |
| | | | | | | | |
Approximately $145 million of the reduction from 2006 related to the spin-off of New Abraxis, as described in Note 3.
Deferred Financing Costs
Costs incurred in connection with the issuance and amendments to our credit facilities are capitalized and amortized using the straight-line methods over the term of the related facility, which approximates the effective interest method. Unamortized debt issue costs are written-off in conjunction with the refinancing or termination of the applicable debt arrangement prior to its scheduled maturity. We capitalized deferred financing costs of $13.3 million and $1.7 million in 2007 and 2006, respectively, associated with our new senior secured credit agreement entered into in November 2007 and our prior $450 million unsecured credit facility entered into in 2006. In addition, we wrote-off $0.8 million in 2007 and $0.5 million in 2006 of unamortized deferred financing costs relating to terminated debt.
Goodwill and Intangible Assets
We are required to perform impairment tests related to our goodwill under SFAS No. 142, “Goodwill and Other Intangible Assets” annually, which we perform on October 1, and whenever events or changes in circumstances suggest that it is more likely than not that the fair value of the reported units are below their carrying values. We completed the 2007 annual impairment tests for our goodwill and determined that goodwill
55
allocated to our reporting units was not impaired and that no impairment charges were required. The change in goodwill during 2007 was due to the spin-off of New Abraxis as detailed in Note 3.
Intangible assets are recorded at acquisition cost and are amortized on a straight-line basis over the period estimated revenues are expected to be derived from such assets (weighted average amortization period of approximately seventeen years). We review our intangible assets for impairment whenever events or changes in circumstance indicate that the carrying amount of an intangible asset may not recoverable.
Product Revenue recognition
We recognize revenue from the sale of a product and for contract manufacturing when title and risk of loss have transferred to the customer, collection is reasonably assured and we have no further performance obligation. This is typically when the product is received by the customer. At the time of sale, as further described below, we reduce sales and provide for estimated chargebacks, contractual allowances or customer rebates, product returns and customer credits and cash discounts. Our methodology used to estimate and provide for theses sales provisions was consistent across all periods presented. Historically, Medicaid rebates issued have not been material. Accruals for sales provisions are presented in our financial statements as a reduction of revenues and accounts receivable and, for contractual allowances, in accrued liabilities. We regularly review information related to these estimates and adjust our reserves accordingly if, and when, actual experience differs from estimates.
We have extensive, internal historical information on chargebacks, rebates and customer returns and credits which we use as the primary factor in determining the related reserve requirements. As further described below, due to the nature of our generic injectable products and their primary use in hospital and clinical settings with generally consistent demand, we believe that this internal historical data, in conjunction with periodic review of available third-party data (as described below) and updated for any applicable changes in available information provides a reliable basis for such estimates.
Sales to our three major wholesale customers comprised 74%, 73%, and 77% of our 2007, 2006 and 2005 net revenue respectively. We periodically, as we believe warranted, review the wholesale supply levels of our significant products by reviewing inventory reports purchased or available from wholesalers, evaluating our unit sales volume, and incorporating data from third-party market research firms and periodic visits to wholesalers’ warehouses. Based on these activities, we attempt to keep a consistent wholesale stocking level of approximately two- to six-weeks across our generic products. The buying patterns of our customers do vary from time to time, both from customer to customer and product to product, but we believe that historic wholesale stocking or speculative buying activity in our generic distribution channel has not had a significant impact on our historic sales comparisons or sales provisions.
From time to time we enter into inventory management agreements with our wholesale customers which require us to pay a fee in connection with their distribution of our products or other services, possibly including sales data and other services and contractual rights for us. In addition, we may be required to enter into such agreements in the future in order to maintain our relationships with other such wholesalers. We are unable to ascertain the potential impact of any such future agreements on our sales, but do not believe that such agreements would result in a substantial change in wholesale stocking levels of our products as compared to current levels.
Our sales provisions totaled $1,107.3 million, $759.9 million, and $573.8 million in 2007, 2006 and 2005, respectively, and related reserves totaled $125.1 million and $112.5 million and $84.5 million at December 31, 2007, 2006 and 2005, respectively.
56
Deferred Revenue
Other deferred revenue pertains to Old Abraxis (pre spin-off) upfront payments earned from our co-promotion agreement with AstraZeneca and our agreement with Taiho Pharmaceutical Co. Ltd. Such deferred revenue was recognized ratibly over the term of the agreement and is recorded as a component of discontinued operations in our statement of operations.
Chargebacks
The estimated provision for chargebacks is our most complex sales allowance. Following industry practice, we typically sell our product to independent pharmaceutical wholesalers at wholesale list price. The wholesaler in turn sells our product to an end user, normally a hospital or alternative healthcare facility, at a lower contractual price previously established between ourselves and the end user via a group purchasing organization, or GPO. GPOs enter into collective purchasing contracts with pharmaceutical suppliers to secure more favorable product pricing on behalf of their end-user members.
Our initial sale to the wholesaler, and the resulting receivable, are recorded at our wholesale list price. As most of these list selling prices will be reduced to a lower end-user contract price, we then reduce reported sales and receivables by the difference between the list price and estimated end-user contract price. Then, when the wholesaler ultimately sells the product to the end user at the end-user contract price, the wholesaler charges us, a chargeback, for the difference between the list price and the end-user contract price and such chargeback is offset against our initial estimated provision. On a monthly basis, we compare the unit and price components of our recorded chargeback provision to estimated ending wholesale units in the distribution channel pending chargeback under end-user contracts and estimated end-user contract prices and adjust the chargeback provision as necessary.
The most significant estimates inherent in the initial chargeback provision relate first to wholesale units pending chargeback and, second, to the ultimate end-user contract-selling price. We base our estimation for these factors on internal, product-specific sales and chargeback processing experience, estimated wholesaler inventory stocking levels, current contract pricing, our expectation for future contract pricing changes and IMS data. Key factors which complicate the chargeback calculation include the time lags between the date the product is sold to the wholesaler and the dates the wholesaler sells the product to the end-user customer and the related reporting of that final sale enabling us to process the chargeback. Our chargeback provision is also potentially impacted by a number of market conditions including: competitive pricing, competitive products and changes impacting demand in both the distribution channel and healthcare provider.
Due to information constraints in the distribution channel, it has not been practical, and has not been necessary, for us to capture and quantify the impact of current versus prior year activity on the chargeback provision. Information constraints within the distribution channel primarily relate to our inability to track product through the channel on a unit or specific lot basis. In addition, for the most part, we do not receive information from our customers with respect to what level of their sales are subject to chargeback. The lack of information on a specific lot basis precludes us from tracking actual chargeback activity to the period of its initial sale. As a result, we rely on internal data, external IMS data and management estimates in order to estimate the amount of inventory in the channel subject to future chargeback. The amount of product in the channel is comprised of product at the distributor and that the distributor has yet to report as end user sales. Physical inventory in the channel is estimated by our evaluation of our monthly sales to our wholesalers and our knowledge of inventory turnover at our major wholesalers. We estimate yet to be reported end user sales based on a historical average number of days to process chargeback activities from the date of the end user sale. We also review current year chargeback activity to determine whether material changes in the provision relate to prior period sales, such changes have not been material to the statement of operations. A one percent decrease in our estimated end-user contract-selling prices would reduce net revenue for the twelve months ended December 31, 2007 by $0.2 million and a one percent increase in wholesale units pending chargeback for the twelve months ended December 31, 2007 would reduce net revenue by less than $0.5 million.
57
The provision for chargebacks is presented in our financial statements as a reduction of sales:
| | | | | | | | | | | | |
| | | Year Ended December 31, | |
| | | 2007 | | | 2006 | | | 2005 | |
| | | (in thousands) | |
Balance at beginning of year | | $ | 92,427 | | | $ | 47,841 | | | $ | 97,382 | |
Provision for chargebacks | | | 1,003,577 | | | | 713,241 | | | | 519,750 | |
Credit or checks issued to third parties | | | (994,095 | ) | | | (668,655 | ) | | | (569,291 | ) |
Balance transferred at separation | | | (732 | ) | | | — | | | | — | |
| | | | | | | | | | | | |
Balance at end of year | | $ | 101,177 | | | $ | 92,427 | | | $ | 47,841 | |
| | | | | | | | | | | | |
Contractual allowances, returns and credits, cash discounts and bad debts
Contractual allowances, generally rebates or administrative fees, are offered to certain wholesale customers, GPOs and end-user customers, consistent with pharmaceutical industry practices. Settlement of rebates and fees may generally occur from one to 15 months from date of sale. We provide a general provision for contractual allowances at the time of sale based on the historical relationship between sales and such allowances. Upon receipt of chargeback, due to the availability of product and customer specific information on these programs, we then establish a specific provision for fees or rebates based on the specific terms of each agreement. A one percent increase in the estimated rate of contractual allowances to sales at December 31, 2007 would decrease net revenues by $0.8 million. Contractual allowances are reflected in the financial statements as a reduction of revenues and as a current accrued liability. The accrual for customer credits and product returns is presented in the financial statements as a reduction of revenues and accounts receivable. Our provision for contractual allowances during each of the three years ended December 31, 2007 was as follows:
| | | | | | | | | | | | |
| | | Year Ended December 31, | |
| | | 2007 | | | 2006 | | | 2005 | |
| | | (in thousands) | |
Balance at beginning of year | | $ | 16,555 | | | $ | 12,152 | | | $ | 11,433 | |
Provision for contractual allowances and customer rebates | | | 49,320 | | | | 33,525 | | | | 33,572 | |
Credit issued to third parties | | | (50,265 | ) | | | (29,122 | ) | | | (32,853 | ) |
Balance transferred at separation | | | (5,470 | ) | | | — | | | | — | |
| | | | | | | | | | | | |
Balance at end of year | | $ | 10,140 | | | $ | 16,555 | | | $ | 12,152 | |
| | | | | | | | | | | | |
Consistent with industry practice, our return policy permits our customers to return products within a window of time before and after the expiration of product dating. We provide for product returns and other customer credits at the time of sale by applying historical experience factors, generally based on our historic data on credits issued by credit category or product, relative to related sales and we provide specifically for known outstanding returns and credits. At December 31, 2007, a one-percent increase in the estimated reserve requirements for customer credits and product returns would have decreased 2007 net revenues by $1.7 million. Our provision for customer credits and product returns during each of the three years ended December 31, 2007 was as follows:
| | | | | | | | | | | | |
| | | Year Ended December 31, | |
| | | 2007 | | | 2006 | | | 2005 | |
| | | (in thousands) | |
Balance at beginning of year | | $ | 9,762 | | | $ | 16,272 | | | $ | 9,397 | |
Provision for customer credits and product returns | | | 7,871 | | | | 20,386 | | | | 27,010 | |
Credit issued to third parties | | | (8,347 | ) | | | (26,896 | ) | | | (20,135 | ) |
Balance transferred at separation | | | (444 | ) | | | — | | | | — | |
| | | | | | | | | | | | |
Balance at end of year | | $ | 8,842 | | | $ | 9,762 | | | $ | 16,272 | |
| | | | | | | | | | | | |
58
We generally offer our customer a standard cash discount on generic injectable products for prompt payments and, from time-to-time, may offer a greater discount and extended terms in support of product launches or other promotional programs. Our wholesale customers typically pay within terms and a provision for cash discount is established at the time of sale based on the terms of sale and adjusted for historical experience factors.
We establish a reserve for bad debts based on general and identified customer credit exposure. Our actual loss due to bad debts in each of the three-year period ended December 31, 2007 was less than $0.1 million.
Shipping and Handling Fees and Costs
Shipping and handling fees billed to customers are recognized in revenues. Other shipping and handling costs are included in cost of sales.
Income Taxes
Deferred tax assets and liabilities are recognized for future tax consequences attributable to differences between the consolidated financial statement carrying amounts of existing assets and liabilities and their respective tax bases as well as net operating loss and capital loss carry forwards. Deferred tax assets and liabilities are measured using enacted tax rates expected to apply to taxable income in the years in which those temporary differences are expected to be recovered or settled. The effect of deferred tax assets and liabilities of a change in tax rates is recognized in the consolidated financial statements in the period that includes the legislative enactment date.
Since our 2001 initial public offering and continuing through the year-ended December 31, 2005 we have filed separate, stand-alone federal income tax returns. For state purposes, depending upon the applicable state laws, we may have filed a separate or a consolidated tax return with American BioScience.
Due to the tax free merger with American BioScience in 2006, we filed final stand-alone federal and consolidated state income tax returns for American Pharmaceutical Partners, Inc. For tax year 2006 we included pre- and post-merger income from American BioScience, and post-merger income from American Pharmaceutical Partners, Inc. in new stand-alone federal and state tax return filings. For tax purposes, the downstream merger of parent into subsidiary was treated as a reverse acquisition whereby, American BioScience was the surviving entity.
New APP and New Abraxis entered into a series of agreements in connection with the separation, including a tax allocation agreement. Refer toNote 7—Related Party Transactions for further details.
Research and Development Costs
Research and development costs are expensed as incurred or consumed and consist of pre-production manufacturing scale-up activities and related salaries and other personnel-related expenses, depreciation, facilities, raw material and production costs and professional services.
Equity-Based Compensation
We account for stock-based compensation in accordance with FAS 123(R), which requires the recognition of compensation cost for all share-based payments (including employee stock options) at fair value. Effective January 1, 2006, we adopted the provisions of FAS 123(R) using a modified version of retrospective application. As a result, stock-based employee compensation for options is recorded as an expense based on the fair value method under FAS 123(R) (FAS 123 for 2005). We use the straight-line attribution method to recognize share-based compensation expense over the vesting period of the award. Options currently granted generally expire ten
59
years from the grant date and vest ratably over a four-year period, while restricted stock units currently granted vest ratably over a four-year period. Awards under the APP Pharmaceuticals, Inc. Restricted Stock Unit Plan (“the RSU Plan”) generally vest with respect to one half of the units on the second anniversary of the 2006 Merger and with respect to one half of the units on the fourth anniversary of the 2006 Merger.
Stock-based compensation recognized under FAS 123(R), as well as expense associated with the retrospective application, uses the Black-Scholes option pricing model to estimate the fair value of options granted under our equity incentive plans and rights to acquire stock granted under our stock participation plan. Compensation expense related to equity awards of restricted stock units is based upon the market price on the date of grant. Excluding the effects of discontinued operations, pre-tax stock-based compensation costs for the years ended December 31, 2007, 2006 and 2005 were $12.1 million, $11.1 million and $12.0 million, respectively.
Refer toNote 13—Stock Options, for a detail of financial statement changes caused by the retrospective application.
Fair Value of Financial Instruments
Our financial instruments consist mainly of cash and cash equivalents, short-term investments, accounts receivable, accounts payable and our credit facility. Cash equivalents include investments with maturities of three months or less at the time of acquisition. Short-term investments consist of highly-liquid, available-for-sale, municipal variable rate demand notes, which are recorded at cost, and may be redeemed at par upon seven days notice. At December 31, 2007 and 2006, the carrying amounts of items comprising current assets and current liabilities approximate fair value due to the short-term nature of these financial instruments. The interest rates on borrowings under the bank credit facility are revised periodically to reflect market rate fluctuations; as such, the carrying amount of the bank credit facility approximate fair value.
As of December 31, 2007, we did not have any derivatives or other foreign currency or interest rate hedging instruments.
60
Per Share Information
Basic income per common share is computed by dividing net income by the weighted-average number of common shares outstanding. Dilutive income per common share is computed by dividing net income by the weighted-average number of common shares used for the basic calculations plus potentially dilutive shares for the portion of the year that the shares were outstanding. Potentially dilutive common shares resulted from outstanding stock options. Calculations of basic and diluted income per common share information are based on the following:
| | | | | | | | | | | | |
| | | Year Ended December 31, | |
| | | 2007 | | | 2006 | | | 2005 | |
| | | (in thousands, except per share data) | |
Basic and dilutive numerator: | | | | | | | | | | | | |
Net income (loss) | | $ | 34,358 | | | $ | (46,897 | ) | | $ | 17,657 | |
| | | | | | | | | | | | |
Denominator: | | | | | | | | | | | | |
Weighted average common shares outstanding—basic | | | 159,643 | | | | 158,937 | | | | 157,694 | |
Net effect of dilutive securities: | | | | | | | | | | | | |
Stock options and restricted stock awards | | | 1,363 | | | | — | | | | 2,048 | |
| | | | | | | | | | | | |
Weighted average common shares outstanding—diluted | | | 161,006 | | | | 158,937 | | | | 159,742 | |
| | | | | | | | | | | | |
Income from continuing operations per common share—basic | | | 0.51 | | | | 0.35 | | | | 0.19 | |
| | | | | | | | | | | | |
Loss from discontinued operations per common share—basic | | | (0.29 | ) | | | (0.65 | ) | | | (0.08 | ) |
| | | | | | | | | | | | |
Net income (loss) per common share—basic | | $ | 0.22 | | | $ | (0.30 | ) | | $ | 0.11 | |
| | | | | | | | | | | | |
Income from continuing operations per common share—diluted | | | 0.51 | | | | 0.35 | | | | 0.19 | |
| | | | | | | | | | | | |
Loss from discontinued operations per common share—diluted | | | (0.30 | ) | | | (0.64 | ) | | | (0.08 | ) |
| | | | | | | | | | | | |
Net income (loss) per common share—diluted | | $ | 0.21 | | | $ | (0.29 | ) | | $ | 0.11 | |
| | | | | | | | | | | | |
Employee stock options for which the exercise price exceeded the average market price of our common stock in the respective fiscal years were excluded from the computation of diluted income per common share as follows:
| | | | | | |
| | | Year Ended December 31, |
| | | 2007 | | 2006 | | 2005 |
| | | (in thousands, except per share data) |
Number of options excluded | | 1,941 | | 2,706 | | 535 |
Range of exercise prices per share | | $10.27 - $28.73 | | $2.00 - $56.02 | | $45.86 - $56.02 |
Recent Accounting Pronouncements
In December 2007, the FASB issued Statement No. 141(R), “Business Combination” (SFAS 141R) and Statement No. 160, “Accounting and Reporting of Noncontrolling Interest in Consolidated Financial Statements, an Amendment of ARB No. 51 (SFAS 160). These new standards will significantly change the accounting for and reporting of business combination transactions and noncontrolling (minority) interests consolidated financial statements. SFAS 141R and SFAS 160 are required to be adopted simultaneously and are effective for the first annual reporting period beginning on or after December 15, 2008. Earlier application is not permitted. SFAS 141R and SFAS 160 could have a significant impact on our accounting for future business combinations and other business arrangements after the implementation of these statements.
61
In June 2007, the FASB ratified the consensus reached by the EITF on EITF Issue No. 07-3, “Accounting for Nonrefundable Advance Payments for Goods or Services Received for Use in Future Research and Development Activities” (or “EITF 07-3”). EITF 07-3 states that nonrefundable advance payments for goods or services that will be used or rendered for future research and development activities should be deferred or capitalized. Such amounts should be recognized as an expense as the related goods are delivered or the related services performed. If an entity does not expect the goods to be delivered or services to be rendered, the capitalized advance payment should be charged to expense. EITF 07-3 is effective for fiscal years beginning after December 15, 2007 and earlier application is not permitted. We often enter into agreements for research and development goods and service. We are presently evaluating the impact that the adoption of EITF 07-3 will have on our condensed consolidated financial statements.
In February 2007, the FASB issued SFAS No. 159, “The Fair Value Option for Financial Assets and Financial Liabilities—Including an amendment of FASB Statement No. 115.” SFAS No. 159 permits entities to choose to measure many financial instruments and certain other items at fair value. Unrealized gains and losses on items for which the fair value option has been elected will be recognized in earnings at each subsequent reporting date. SFAS No. 159 is effective for our company January 1, 2008. We are evaluating the impact that the adoption of SFAS No. 159 will have on our consolidated financial statements.
In September 2006, the FASB issued SFAS No. 157 which redefines fair value, establishes a framework for measuring fair value in generally accepted accounting principles (“GAAP”), and expands disclosures about fair value measurements. SFAS No. 157 applies where other accounting pronouncements require or permit fair value measurements. SFAS No. 157 is effective for fiscal years beginning after November 15, 2007. The effects of adoption will be determined by the types of instruments carried at fair value in our financial statements at the time of adoption as well as the methods utilized to determine their fair values prior to adoption. Based on our current use of fair value measurements, SFAS No. 157 is not expected to have a material effect on our results of operations or financial position.
3. Spin-off of New Abraxis
On November 13, 2007, Old Abraxis, Inc. was separated into two independent publicly-traded companies: our company, APP Pharmaceuticals, Inc., which owns and operates the hospital-based business; and the other which owns and operates the proprietary business. We refer to the proprietary business following the separation as “New Abraxis,” which subsequently changed its name to Abraxis BioScience, Inc. We continue to operate the hospital-based business (which we refer to as “New APP” following the separation) under the name APP Pharmaceuticals, Inc.
New APP and New Abraxis entered into a series of agreements in connection with the separation, including a separation and distribution agreement, a transition services agreement, an employee matters agreement, a tax allocation agreement, a manufacturing agreement and various real estate leases. Also, in connection with the separation, we incurred $1 billion of indebtedness and, in addition, entered into a $150 million revolving credit facility that is currently unused. Please refer toNote 7—Related Parties for additional information on the separation related agreements. $700 million of the proceeds from this indebtedness was contributed to New Abraxis, approximately $12 million was used to pay fees and expenses related to the debt financing and approximately $276 million of the proceeds was used to repay in full the then existing revolving credit facility. New APP is solely responsible for servicing the debt.
62
Summarized financial information for discontinued operations is as follows:
| | | | | | | | | | | | |
| | | 2007 | | | 2006 | | | 2005 | |
| | | (in thousands) | |
Net revenues | | $ | 293,415 | | | $ | 182,287 | | | $ | 135,675 | |
Earnings before taxes | | | (67,831 | ) | | | (141,383 | ) | | | (5,218 | ) |
Income tax (benefit) expense | | | (20,010 | ) | | | (39,260 | ) | | | 7,580 | |
Net earnings | | | (47,821 | ) | | | (102,123 | ) | | | (12,798 | ) |
The financial information above includes the operations of New Abraxis through November 30, 2007. Note: November 30, 2007 was used as the transaction date versus the November 13 date to ensure proper cutoffs were obtained. Operating results between November 13 and November 30 were not material. As a consequence, the results for the full year 2007 include eleven months of the operations of New Abraxis. The results of the discontinued operations also include direct transaction costs of approximately $14.3 million, net of tax, in 2007.
The following is a summary of the assets and liabilities transferred to New Abraxis on November 30, 2007. The December 31, 2006 balances represent assets and liabilities that are included in the accompanying consolidated balance sheet.
| | | | | | |
| | | November 30,
2007 | | December 31,
2006 |
| | | (in millions) |
Cash | | $ | 696 | | $ | 1 |
Receivables | | | 28 | | | 28 |
Inventory | | | 80 | | | 80 |
Prepaid expenses, deferred income taxes, and other receivables | | | 19 | | | 28 |
Net property and equipment | | | 145 | | | 116 |
Net intangibles | | | 208 | | | 243 |
Goodwill | | | 241 | | | 241 |
Other assets | | | 46 | | | 27 |
| | | | | | |
Total assets | | $ | 1,463 | | $ | 764 |
| | | | | | |
Trade accounts payable, salaries and other accruals | | $ | 82 | | $ | 71 |
Deferred revenue, long and short term | | | 163 | | | 197 |
Deferred income taxes, non-current | | | 14 | | | 29 |
Other long-term liabilities | | | 5 | | | 8 |
| | | | | | |
Total liabilities | | $ | 264 | | $ | 305 |
| | | | | | |
Net assets transferred to New Abraxis | | $ | 1,199 | | | |
| | | | | | |
For the twelve month periods ended December 31, 2007, 2006 and 2005, we have allocated interest expense of $0.2 million, $4.8 million and $6.6 million, respectively, to discontinued operations. The amounts allocated in 2006 and 2005 represents the interest expense for American BioScience, Inc. prior to the merger with American Pharmaceutical Partners, Inc.
4. Merger
On April 18, 2006, we completed a merger with American BioScience, Inc., or ABI, our former parent, pursuant to the terms of the Agreement and Plan of Merger dated November 27, 2005 that we entered into with ABI and certain shareholders of ABI.
For accounting purposes, the merger between us and ABI was treated as a downstream merger with ABI viewed as the surviving entity, although we were the surviving entity for legal purposes. As such, effective as of the merger date, the merger was accounted for in our consolidated financial statements as an implied acquisition
63
of our minority interests using the purchase method of accounting. Therefore, the historical book value of the minority interests was stepped up to its estimated fair values and the historical shareholders’ equity of the accounting acquirer, ABI, was retroactively restated for the equivalent number of shares received in the merger.
At the April 18, 2006 acquisition date, the minority shareholders owned 34.17% of our total outstanding common shares. Based on a $39.14 price for our common stock, representing the weighted average price of our common stock for the period three trading days prior to and three trading days subsequent to the merger announcement date, the fair value of the minority interests as of April 18, 2006 totaled approximately $974.8 million. This amount represented the estimated fair market value assigned to the shares owned by minority interests and will be referred to as the purchase price attributed to minority interests. The purchase price attributed to minority interests was allocated to the minority interests’ pro-rata share of our tangible and identifiable intangible assets and liabilities based on their estimated fair values at the acquisition date. The excess of the purchase price attributed to minority interests over the minority interests’ pro-rata share of the fair values of our assets and our liabilities has been reflected as goodwill. The amount allocated to goodwill will not be deductible for tax purposes.
The allocation of the purchase price to the estimated fair values of the assets and liabilities attributable to our minority interests as of the acquisition date was as follows (in thousands):
| | | | |
Working capital and other assets, net | | $ | 132,562 | |
Property, plant and equipment | | | 49,152 | |
Deferred tax assets | | | 9,282 | |
In-process research and development | | | 105,777 | |
Identifiable intangible assets | | | 455,370 | |
Goodwill | | | 401,600 | |
Deferred tax liability | | | (178,953 | ) |
| | | | |
Total | | $ | 974,790 | |
| | | | |
The estimated step-up of the minority interests to fair value has been assigned to the following categories (in thousands):
| | | | |
Inventory | | $ | 12,480 | |
Deferred tax assets | | | 9,282 | |
In-process research and development | | | 105,777 | |
Identifiable intangible assets | | | 455,370 | |
Goodwill | | | 401,600 | |
Deferred tax liability | | | (178,953 | ) |
| | | | |
Total | | $ | 805,556 | |
| | | | |
The above purchase price allocation was based in part on a third-party valuation of certain tangible and intangible assets, including in-process research and development and identifiable intangible assets.
In-process research and development
Approximately $105.8 million of the purchase price was allocated to in-process research and development and represents the minority interests’ share of the estimated fair value of in-process research and development assets for projects that, as of the acquisition date, had not yet reached technological or regulatory feasibility and had no alternative future uses in their current states. The values assigned to in-process research and development projects include unapproved indications for Abraxane. All of the $105.8 million of in-process research and development was expensed in the second quarter of 2006, of which $22.3 million related to continuing operations.
64
The estimated fair values of these projects were determined based on a discounted cash flow model prepared by an independent third party, KPMG LLP. The estimated cash flows for each project were probability adjusted to take into account the risks associated with the successful commercialization of the projects. The estimated after-tax cash flows were then discounted using discount rates of approximately 20%.
The major risks and uncertainties associated with the timely and successful completion of the acquired in-process research and development projects consist of the ability to confirm the safety and efficacy of the technology based on the data from clinical trials and obtaining necessary regulatory approvals. The major risks and uncertainties associated with the core technology consist of successfully utilizing the technology in future research projects. No assurance can be given that the underlying assumptions used to forecast the cash flows or the timely and successful completion of the projects will materialize, as estimated. For these reasons, among others, actual results may vary significantly from the estimated results.
Identifiable intangible assets
Acquired identifiable intangible assets primarily include core technology associated with Abraxane, customer relationships and trade name.
The amounts assigned to each intangible asset class as of the acquisition date and the related weighted average amortization periods are as follows:
| | | | | |
| | | Value of
acquired
intangibles | | Weighted-
average
amortization
period |
| | | (in thousands) | | |
Core technology | | $ | 158,863 | | 7 yrs |
Developed product technology | | | 146,002 | | 9 yrs |
Customer relationships | | | 124,027 | | 11 yrs |
Tradename | | | 26,478 | | 7 yrs |
| | | | | |
Total | | $ | 455,370 | | |
| | | | | |
Pro forma results of operations
The following unaudited pro forma information presents a summary of our consolidated results of operations as if the acquisition had taken place at the beginning of each period presented (in thousands, except per share data):
| | | | | | |
| | | Year Ended December 31, |
| | | 2006 | | 2005 |
Total revenue | | $ | 765,488 | | $ | 520,757 |
Net income | | | 60,531 | | | 2,459 |
Pro forma income per share: | | | | | | |
Basic | | | 0.38 | | | 0.02 |
Diluted | | | 0.38 | | | 0.02 |
The pro forma net income and income per share for each period above excludes the acquired in-process research and development charge of $105.8 million, or approximately $0.67 per share. In addition, the pro forma results of operations for the twelve months ended December 31, 2006 include a non-recurring tax benefit of $17.9 million related to the removal of our valuation allowance against certain deferred tax assets. The pro forma information is not necessarily indicative of results that would have been achieved had the acquisition occurred as of January 1, 2006 and 2005, or indicative of results that may be achieved in the future.
65
5. Goodwill and Other Intangibles
As of December 31, 2007 and 2006, goodwill had a carrying value of $160.2 million and $401.6 million, respectively, resulting from the merger, as fully described inNote 4—Merger, between ABI and APP on April 18, 2006 and the carrying value related to continuing operations has not changed since then. Substantially all of our intangible assets, other than goodwill, are subject to amortization. Amortization expense from continuing operations on intangible assets was $33.6 million, $19.3 million, and $1.1 million for the years ended December 31, 2007, 2006 and 2005, respectively. At December 31, 2007 the weighted average expected lives of intangibles was approximately 17.3 years.
The following table reflects the components of intangible assets, which have finite lives, as of December 31:
| | | | | | | | | | | | | | |
| | | 2007 | | 2006 | | Category
Amortization
Period |
| | | Gross
Carrying
Amount | | Accumulated
Amortization | | Gross
Carrying
Amount | | Accumulated
Amortization | |
| | | (in thousands) | | (in thousands) | | |
Product rights | | $ | 328,797 | | $ | 24,660 | | $ | 328,797 | | $ | 8,220 | | 20 years |
Customer relationships | | | 100,439 | | | 14,299 | | | 124,027 | | | 8,316 | | 12 years |
Developed product technology | | | 84,663 | | | 12,053 | | | 146,002 | | | 4,997 | | 12 years |
Other | | | 591 | | | 324 | | | 1,755 | | | 988 | | 5 years |
Core technology | | | — | | | — | | | 158,863 | | | 22,282 | | |
Tradename | | | — | | | — | | | 26,478 | | | 2,679 | | |
| | | | | | | | | | | | | | |
Total | | | 514,490 | | | 51,336 | | | 785,922 | | | 47,482 | | |
| | | | | | | | | | | | | | |
Approximately $208 million of the decrease in net intangible assets was due to the asset transfer to New Abraxis, which was made on November 30, 2007. Please refer to Note 3- “Spin-off of Abraxis BioScience”. Estimated amortization expense for identifiable intangible assets, other than goodwill, in each of the five succeeding years is approximately $31.9 million.
6. Acquisition of Assets
We entered into an Asset Purchase Agreement with AstraZeneca UK Limited on April 26, 2006 to acquire AstraZeneca’s U.S. anesthetics and analgesic product portfolio, which includes Diprivan® (propofol), Naropin® (ropivacaine), as well as a variety of local anesthetics including EMLA® (Eutectic Mixture of Lidocaine and Prilocaine), Xylocaine® (lidocaine), Polocaine® (mepivacaine), Nesacaine® (chloroprocaine HCl Injection, USP), Sensorcaine® (bupivacaine), and Astramorph® (morphine sulfate injection, USP). Under the agreement, we paid AstraZeneca approximately $259 million at closing and paid $75 million upon the first anniversary of closing, June 28, 2007, and these costs are being amortized, on a straight line basis, over twenty years. At the closing, AstraZeneca entered into an exclusive supply agreement with us under which AstraZeneca will supply these products to us for an initial term of five years. In addition, AstraZeneca has agreed that we will be its preferred partner for consideration of certain proprietary injectable products when patents on these products expire. Under the terms of the agreement, AstraZeneca has also granted us a right of first offer to purchase or license AstraZeneca’s anesthetics and analgesics portfolio outside of the U.S. should AstraZeneca decide to divest these assets. This transaction closed on June 28, 2006.
With respect to the products purchased from AstraZeneca we have recorded intangible assets of approximately $329 million which will be amortized over the estimated lives of the products, or twenty years. In determining the appropriate amortization period and method for these acquired products, we considered, among other things, the nature of the products, the anticipated timing of cash flows and the relatively high barriers to entry for competition due to the complex development and manufacturing processes. In particular, some of the products have been on the market since 1948 (and all since 1996), and they have generally experienced minimal price erosion and stable product sales. In addition, the products all share similar attributes in that they have a
66
favorable risk profile (e.g., minimal side effects, adverse experiences, etc.) and are easy to administer to patients. Based on the risk profile, ease of use and already low pricing, we do not expect new competing products will enter the market in the foreseeable future and the barriers to entry should help protect the market positions of the products and preserve their useful lives. Accordingly, as future cash flows with respect to these products are expected to exceed 20 years and remain relatively stable, we have utilized a straight-line 20 year amortization period.
7. Related Party Transactions
At December 31, 2007 and 2006, net receivable from related parties totaled $7.0 million and $0 million, respectively. Of the $7.0 million net receivable from related parties at December 31, 2007, $6.9 million related to activities provided under the agreements noted below, $0.1 related to charges associated with services rendered under these agreements. For December 31, 2007, net receivable from related party related primarily to transactions involving New Abraxis, which was spun-off from us on November 13, 2007. See below for a detailed discussion of these transactions with New Abraxis. For 2006, receivables from related parties consist of a note receivable from a former employee bearing interest at 3.44% per annum.
In connection with the separation and related transactions, we entered into a number of agreements that governs the relationship between New Abraxis and us for a period of time after the separation. The agreements were entered into while New Abraxis was still our wholly owned subsidiary. These agreements include:
| | • | | Tax allocation agreement |
| | • | | Employee matters agreement |
| | • | | Transition services agreement |
| | • | | Manufacturing agreement |
| | • | | Various real estate leases |
Tax Allocation Agreement
The tax allocation agreement allocates the liability for taxes. Under the tax allocation agreement, we are responsible for and have agreed to indemnify New Abraxis against all tax liabilities to the extent they relate to our hospital-based products business, and New Abraxis is responsible for and have agreed to indemnify us against all tax liabilities to the extent they relate to New Abraxis’ proprietary products business. The tax allocation agreement also provides the extent to which, and the circumstances under which, the parties would be liable if the distribution were not to constitute a tax-free distribution under Section 355 and Section 368(a)(1)(D) of the Internal Revenue Code. In general, New Abraxis would be required to indemnify us for any taxes resulting from a failure of the distribution to so qualify, unless such failures results solely from our specified acts.
Dual Officer Agreement
We entered into an agreement with New Abraxis under which we and New Abraxis acknowledged and agreed that Dr. Soon-Shiong and Ms. Gopala may serve as an officer of both companies and receive compensation from either or both companies. We also acknowledge and agree in this agreement that neither Dr. Soon-Shiong nor Ms. Gopala will have any obligation to present to us any business or corporate opportunity that may come to his or her attention, other than certain business opportunities relating to the manufacture or sale of products that either were manufactured and sold by the hospital-based products business prior to the separation or were the subject of an ANDA filed by New APP prior to the separation and related transactions. This agreement does not ensure the continued services of either Dr. Soon-Shiong or Ms. Gopala following the separation and related transactions, restrict these individuals from resigning from our company or restrict our
67
board of directors from terminating their employment with us. In connection with the private letter ruling, Old Abraxis has represented to the Internal Revenue Service that no person will serve as an executive officer of both New Abraxis and us one year following the distribution.
Employee Matters Agreement
We entered into an employee matters agreement with New Abraxis, providing our respective obligations to employees and former employees who are or were associated with our respective businesses, and for other employment and employee benefit matters. Under the terms of the employee matters agreement, we generally assumed all liabilities and obligations related to employee benefits for current and former employees who are or were associated with the hospital-based products business, and New Abraxis generally assumed all liabilities and obligations related to employee benefits for current and former employees who are or were associated with the proprietary products business. Under the employee matters agreement, the parties have agreed to reimburse one another for all indemnifiable losses that each may incur on behalf of the other as a result of any of the benefit plans or any of the termination or severance obligations.
Transition Services Agreement
Pursuant to the transition services agreement, New Abraxis and we will continue to provide to one another various services on an interim, transitional basis, for periods up to 24 months depending on the particular service. Services that New Abraxis provides to us include legal services (e.g., assistance with SEC filings, labor and employment matters, and litigation support), financial services and corporate development. Services that we provide to New Abraxis include information technology support, tax services, accounts payable services, internal audit services, accounts receivable services, general legal services, accounting related assistance, corporate insurance and franchise tax services, human resources, customer operations, sales and marketing support, corporate purchasing and facility services and regulatory support (including assistance with state and federal license renewals). Payments made under the transition services agreement are based on the providing party’s actual costs of providing a particular service. This agreement will terminate after a period of 24 months, but generally may be terminated earlier by either party as to specific services on certain conditions. For the year ended December 31, 2007, we incurred net transition service costs of $0.1 million with New Abraxis. As of December 31, 2007, we had a net receivable related to transition services of $0.1 million with New Abraxis.
Manufacturing Agreement
We entered into a manufacturing agreement with New Abraxis, through our wholly-owned subsidiary, New APP LLC, for the manufacture of Abraxane® and certain of New Abraxis’ pipeline products by New APP LLC for New Abraxis at the Melrose Park and Grand Island manufacturing facilities. Under the terms of the manufacturing agreement, New Abraxis will perform certain manufacturing activities with respect to Abraxane® or other pipeline products, principally related to the formulation and compounding of the active pharmaceutical ingredients in such products, and New APP LLC will undertake the remainder of the manufacturing processes. As part of the manufacturing services, New APP LLC will also provide New Abraxis with training related to proper manufacturing practices and other related training, assistance with quality assurance and control and information technology support related to manufacturing operations. With regard to the Melrose Park and Grand Island facilities, New APP LLC will be responsible for obtaining and maintaining necessary approvals to manufacture Abraxane® or other pipeline products in compliance with the regulatory requirements applicable as to the jurisdictions in which such products are sold, subject to the right to receive reimbursement from New Abraxis for the costs of such approvals in certain circumstances. New Abraxis will be responsible for obtaining and maintaining the remainder of the regulatory approvals required to sell and distribute Abraxane® both in the United States and in other jurisdictions and New Abraxis will be responsible for the final release of the product for sale at the completion of the manufacturing process.
In the manufacturing agreement, New APP LLC agreed with New Abraxis to cap the manufacturing growth over the term of the agreement of Abraxane® and other pipeline products that New APP LLC is required to
68
manufacture under the agreement. Further, in the event of capacity constraints at the Melrose Park or Grand Island facilities, the manufacturing agreement will provide that the available capacity will be prorated between New Abraxis and New APP LLC according to the parties’ then current use of New APP LLC’s manufacturing capacity. While the manufacturing agreement allows New Abraxis to override these proration provisions, New Abraxis may only do so by paying New APP LLC additional fees under the manufacturing agreement. The fee New Abraxis would be required to pay New APP LLC to override the proration provisions of the manufacturing agreement is equal to the profit lost by New APP LLC as a result of New Abraxis’ election to override the proration provisions.
New Abraxis will pay New APP LLC a customary margin on its manufacturing costs. In addition, during each of the first three years of the manufacturing agreement, New Abraxis will pay New APP LLC a facility management fee equal to $3 million. The amount of this fee may be offset to the extent New APP employees are transferred to New Abraxis based upon the amount of compensation paid to such transferred employees. The term of the manufacturing agreement will end on December 31, 2011, which will be automatically extended for one year if either New APP exercises its right to extend the lease on New Abraxis’ Melrose Park manufacturing facility for an additional year or New Abraxis exercises its right to extend the lease for New APP’s Grand Island manufacturing facility for an additional year. (See “—Real Estate Leases” below).
The manufacturing agreement includes customary confidentiality provisions pursuant to which New Abraxis and New APP LLC will keep confidential all confidential information of the other party, subject to certain exceptions.
In addition, the manufacturing agreement contains the following indemnification provisions. New Abraxis will indemnify New APP LLC, its affiliates and its officers, directors and employees and agents (which are referred to as the “APP indemnified parties”) from any damages incurred by or assessed against them resulting from a third-party claim caused by or alleged to be caused by (i) New Abraxis’ failure to perform its obligations under the manufacturing agreement (ii) any product liability claim arising from the negligence, fraud or intentional misconduct of New Abraxis or any of its affiliates or any product liability claim arising from its manufacturing obligations (or any failure or deficiency in New Abraxis’ manufacturing obligations) under the manufacturing agreement; (iii) any claim that the manufacture, use or sale of Abraxane® or New Abraxis pipeline products infringes a patent or any other proprietary right of a third party; or (iv) any recall, product liability claim or other third-party claim not arising from the gross negligence or bad faith of, or intentional misconduct or intentional breach of the manufacturing agreement by, the APP indemnified parties by reason of the $100 million limitation of liability described below. New Abraxis will also indemnify the APP indemnified parties for liabilities that they become subject to as a result of their activities under the manufacturing agreement and for which they are not responsible under the terms of the manufacturing agreement. New APP LLC will indemnify New Abraxis, and its affiliates, and their respective officers, directors, employees and agents from any damages incurred or assessed against them resulting from a third-party claim caused by or alleged to be caused by (i) New APP LLC’s gross negligence, bad faith, intentional misconduct or intentional failure to perform its obligations under the manufacturing agreement; and (ii) any product liability claim arising from the gross negligence or bad faith of, or intentional misconduct or intentional breach of the manufacturing agreement by, New APP LLC or its affiliates. The APP indemnified parties will not have any liability for monetary damages to New Abraxis or its affiliates or third parties in connection with the manufacturing agreement for damages in excess of $100 million in the aggregate, except to the extent that the damages are the result of (i) one of New APP LLC’s or New Abraxis’ executive officers in bad faith affirmatively instructing their employees to intentionally breach New APP LLC’s obligation to manufacture Abraxane® or pipeline products under the manufacturing agreement or (ii) any intentional failure by New APP LLC, in bad faith, to cure any material breach of its obligation to manufacture Abraxane® or pipeline products under the manufacturing agreement following notice of this breach.
For the period ended December 31, 2007, we had no earned margins relating to the manufacture of Abraxane for New Abraxis and recorded $0.3 million of facility management fees.
69
Real Estate Leases
Following the distribution, New Abraxis owns the manufacturing facility located on Ruby Street, Melrose Park, Illinois, and the research and development and the warehouse facility, both located in the same building on N. Cornell Avenue, Melrose Park, Illinois. We own the manufacturing facility located in Grand Island, New York. Following the distribution, the parties entered into a series of lease agreements to facilitate continued production of their respective pharmaceutical products while a manufacturing transition plan is being implemented. Under the terms of the lease agreements, New Abraxis leases the Ruby Street facility, consisting of approximately 122,000 square feet of office, warehouse and pharmaceutical manufacturing space, to us. The initial term of the lease expires on December 31, 2011 and may be renewed at New Abraxis’ option for one additional year if we are manufacturing a certain level of our products at the Ruby Street facility in the period prior to the expiration of the lease. During the term of the lease, New Abraxis will have access to the Ruby Street facility to perform certain elements of the manufacturing processes of Abraxane® and other nab™ technology product candidates under the manufacturing agreement as well as, under certain circumstances, to provide contract manufacturing services to third parties. See “Manufacturing Agreement” above. In order to provide sufficient warehouse space to us during the term of the Ruby Street lease, New Abraxis also leased the Cornell Warehouse facility, consisting of approximately 71,000 square feet of warehouse space, to us. The initial term of the lease will be until December 31, 2011, and may be renewed at our option for one additional year if the lease for the Ruby Street manufacturing facility is extended. New Abraxis also leased the Cornell R&D facility, consisting of approximately 48,000 square feet of research and development space, to us. The initial term of the lease will be until December 31, 2010 and may be terminated upon twelve months written notice from and after January 1, 2009. This lease has no option to extend the term of the lease.
New Abraxis leased a portion of our Grand Island facility, consisting of approximately 5,700 square feet of pharmaceutical manufacturing space, to allow New Abraxis to perform its obligations under the manufacturing agreement. The initial term of the lease will be until December 31, 2011, and may be renewed at New Abraxis’ option for one additional year if New Abraxis has not received regulatory approvals from the European Medicines Agency (or “EMEA”), the European equivalent to the FDA, to manufacture Abraxane® in at least two facilities (not including our Grand Island facility) by June 30, 2011.
For the period ended December 31, 2007, we incurred $0.2 million in net rental payments relating to these real estate leases.
From time to time in the ordinary course of business, we purchase active pharmaceutical ingredients or final dosage forms from Interchem Corporation and World Gen, LLC. Joseph M. Pizza, who became a director on December 19, 2007, is the president and chief executive officer of these entities. During the year ended December 31, 2007, we purchased a total of $20.7 million of products from these entities. As of December 31, 2007, we had approximately $3.8 million in accounts payable to these entities.
8. Accrued Liabilities
Accrued liabilities consist of the following at:
| | | | | | |
| | | December 31, |
| | | 2007 | | 2006 |
| | | (in thousands) |
Sales and marketing | | $ | 13,814 | | $ | 26,876 |
Payroll and employee benefits | | | 12,357 | | | 27,417 |
Legal and insurance | | | 10,213 | | | 2,045 |
Accrued Separation Costs | | | 1,993 | | | — |
Accrued Interest | | | 4,024 | | | 92 |
Other | | | 3,194 | | | 4,998 |
| | | | | | |
| | $ | 45,595 | | $ | 61,428 |
| | | | | | |
70
9. Long-Term Debt and Credit Facilities
Senior Secured Credit Agreement
On November 13, 2007, we, our wholly-owned operating subsidiary APP Pharmaceuticals, LLC (“New APP LLC”) and APP Pharmaceuticals Manufacturing, LLC, a wholly-owned subsidiary of New APP LLC (“P.R. Borrower” and together with New APP LLC, the “Borrowers”) entered into a senior secured credit agreement (the “Credit Agreement”) with certain lenders and Deutsche Bank AG New York Branch, as Administrative Agent. The Credit Agreement provides for two term loan facilities: a Term Loan A facility for $500 million and a Term Loan B facility for $500 million. The Credit Agreement also provides for a revolving credit facility of $150 million. A portion of the proceeds from the debt financing was used to repay our existing indebtedness including fees and expenses related to the debt financing and $700 million was contributed to New Abraxis immediately prior to the separation.
Loan Repayments—Cumulative for each calendar year
(in thousands)
| | | | | | | | | |
| | | Term Loan A | | Term Loan B | | Total |
2008 | | $ | — | | $ | 5,000 | | $ | 5,000 |
2009 | | | 12,500 | | | 5,000 | | | 17,500 |
2010 | | | 50,000 | | | 5,000 | | | 55,000 |
2011 | | | 75,000 | | | 5,000 | | | 80,000 |
2012 | | | 100,000 | | | 5,000 | | | 105,000 |
2013 | | | 262,500 | | | 475,000 | | | 737,500 |
| | | | | | | | | |
| | $ | 500,000 | | $ | 500,000 | | $ | 1,000,000 |
The term loan facilities mature on November 13, 2013, and the revolving credit facility matures on November 13, 2012. The Term Loan A facility amortizes based on the following schedule: 0% in year one; 2.5% in year two; 10% in year three; 15% in year four; 20% in year five; and 52.5% in year six. The Term Loan B facility amortizes 1% in each of the first six years, with a balloon payment due at maturity. Amounts drawn under the term loan facilities or revolving credit facility bear the following annual interest rates: for the Term Loan A facility and the revolving credit facility, a rate at either an adjusted LIBOR, plus a margin of 2.25%, or an alternate base rate plus a margin of 1.25%; and for the Term Loan B facility, a rate at either an adjusted LIBOR, plus a margin of 2.50%, or an alternate base rate plus a margin of 1.50%. The revolving credit facility includes a $40 million sub-limit for swingline loans and a $20 million sub-limit for letters of credit. The interest rate margins are subject to step downs based on, among other things, our total leverage ratio. Effective February 14, 2008, we entered into interest rate swap agreements with an aggregate notional principal amount of $990 million to pay interest at a fixed rate of 3.04% and to receive interest at variable rate of one-month LIBOR. The interest rate swaps expire in February 2009.
The Credit Agreement contains a number of negative covenants restricting, among other things, indebtedness, liens, merger or transfer of substantially all assets of our company or the Borrowers, asset dispositions, distributions, dividends and repurchases of capital stock, prepayment or modification of certain other debt, acquisitions and investments, affiliate transactions, and limitations on dividends or other payments to subsidiaries or the parent company, APP Pharmaceuticals, Inc. We are required to comply with a senior secured leverage ratio test. The Credit Agreement contains customary events of default.
Beginning in December 2008, the Credit Agreement requires the Borrowers to prepay any outstanding loans, subject to specified exceptions, with (i) 50% of excess cash flow (with step downs to 0% based on our total leverage ratio), (ii) 100% of the net proceeds of non-ordinary course asset sales and any insurance or condemnation proceeds (with step downs to 75% based on our total leverage ratio), and (iii) 100% of the proceeds of any indebtedness not otherwise permitted to be incurred or issued under the Credit Agreement, subject to our total leverage ratio.
71
The obligations of New APP LLC under the term loan facilities and revolving credit facility are unconditionally guaranteed on a senior secured basis by our company and each direct and indirect wholly-owned domestic restricted subsidiary of New APP LLC (each, a “Subsidiary Guarantor”). The obligations of P.R. Borrower are unconditionally guaranteed by our company, New APP LLC and each future wholly-owned subsidiary of P.R. Borrower (each, a “P.R. Subsidiary Guarantor). The obligations and guarantees of the Borrowers are secured by a first-priority security interest in substantially all tangible and intangible assets (including a pledge of capital stock, limited to 65% for pledges of stock of foreign subsidiaries) of our company, New APP LLC and each Subsidiary Guarantor and, in the case of P.R. Borrower, such assets of P.R. Borrower and P.R. Subsidiary Guarantor.
As of December 31, 2007, $1 billion was outstanding on the term loans at a weighted average interest rate of 7.63%. There was no outstanding balance on the revolving credit facility. We were in compliance with all covenants at December 31, 2007.
$450 million Unsecured Credit Facility
On April 18, 2006, in connection with the closing of our merger with ABI, the prior APP and ABI facilities were replaced with a three-year, $450 million, unsecured credit facility, with a sub-limit of $10 million for standby and commercial letters of credit and $20 million for swing line loans. In connection with the closing of the merger, the amount outstanding under the ABI facility was repaid with borrowings from the new facility. There was no outstanding balance under the APP facility as of such date. Interest rates under the new facility vary depending on the type of loan made and our leverage ratio as defined in the agreement. The agreement contains various restrictive covenants pertaining to the maintenance of minimum net worth, leverage and interest coverage ratios. In addition, the agreement restricts our ability to declare or pay dividends, make future loans to third parties and incur other indebtedness. Fees of $1.7 million associated with the new agreement were capitalized and will be amortized over the term of the agreement and the remaining $0.6 million in unamortized debt acquisition costs related to the prior facilities were written off in the second quarter of 2006 in conjunction with the closing of the merger.
As of December 31, 2006, $165 million was outstanding on our credit facility at a weighted average interest rate of 6.1%. In November 2007, in connection with the closing of the separation, we repaid in full the outstanding balance on the unsecured credit facility and wrote off $0.8 million in unamortized deferred financing costs.
Note Payable
In connection with the Asset Purchase Agreement with AstraZeneca UK Limited, we agreed to pay $75 million of the purchase price upon the first year anniversary of the closing. At December 31, 2006, $75 million was outstanding on the note which was repaid in full in July of 2007.
No interest was capitalized during the years ended December 31, 2007, 2006 and 2005
10. Leases and Commitments
We have entered into various operating lease agreements for warehouses, office space, automobiles, communications, information technology equipment and software, and office equipment including the real estate leases, as described inNote 7—Related Party Transactions. Rental expense for continuing operations amounted to $3.2 million, $2.6 million and $2.4 million for the years ended December 31, 2007, 2006 and 2005, respectively.
72
As of December 31, 2007, total future annual minimum lease payments related to non-cancelable operating leases including amounts pertaining to related party leases as disclosed in Note 7 are as follows:
| | | | | | |
Year | | Total
Amount | | Related
Parties |
| | | (in thousands) |
2008 | | $ | 7,384 | | $ | 2,588 |
2009 | | | 5,118 | | | 2,588 |
2010 | | | 4,323 | | | 2,588 |
2011 | | | 3,138 | | | 1,675 |
2012 | | | 875 | | | — |
Thereafter | | | 2,982 | | | — |
| | | | | | |
| | $ | 23,820 | | $ | 9,438 |
| | | | | | |
11. Employee Benefit Plan
We sponsor a 401(k) defined-contribution plan, or 401(k) Plan, covering substantially all eligible employees. Employee contributions to the 401(k) Plan are voluntary. In January 2005, we adopted an enhanced 401(k) defined-contribution plan to replace the previous plan. Under the new plan, we contribute a qualified non-elective contribution in an amount equal to 3% of all eligible employee's compensation, regardless of participation in the plan with such employer contributions vesting immediately. Participants' contributions are limited to their annual tax deferred contribution limit as allowed by the Internal Revenue Service. Our total matching contributions to the 401(k) Plan on a continuing operations basis were $2.1 million, $1.9 million, and $1.7 million for the years ended December 31, 2007, 2006 and 2005, respectively. We may contribute additional amounts to the 401(k) Plan at our discretion although, we have never made a discretionary contribution to the 401(k) Plan.
12. Stockholders’ Equity
For accounting purposes, the 2006 merger between APP and ABI was accounted for as a downstream merger with ABI viewed as the surviving entity, although APP was the surviving entity for legal purposes. The merger was accounted for as an implied acquisition of APP’s minority ownership interest by ABI. As such, the historical carrying value of APP’s minority ownership interest was stepped up to its estimated fair value and that increase in value was recorded in additional paid-in-capital on the balance sheet.
Additionally, pre-acquisition stockholders’ equity and earnings per share were retroactively restated for the equivalent number of shares received by the accounting acquirer in the 2006 merger, with differences between the par value of the issuers and accounting acquirer’s stock recorded in paid-in-capital.
Common Stock Voting Rights
The holders of our common stock are entitled to one vote for each share held of record upon such matters and in such manner as may be provided by law.
Preferred Stock
We are authorized to issue up to 6,000,000 shares of preferred stock that is not designated as a particular class. Our Board of Directors may authorize and cause the issuance of the undesignated preferred stock in one or more series, determine the powers, preferences and rights and the qualifications, limitations or restrictions granted to or imposed upon any wholly unissued series of undesignated preferred stock and to fix the number of shares constituting any series and the designation of the series, without any further vote or action by our stockholders.
73
Dividends
As part of the separation and distribution, we distributed on a pro rata basis to holders of record of our common stock on November 13, 2007 one share of New Abraxis common stock for every four shares of our common stock held on that date, or 39.9 million common stock shares (seeNote 3—Spin-off of New Abraxis above for more information). The distribution did not otherwise change the number of, or the rights associated with, outstanding shares of our common stock.
Other than the distribution of New Abraxis, we have never paid a dividend on any class of stock and have restrictions on the paying of cash dividends in the future. Our senior secured credit agreement limits cash dividend payments, subject to certain limitations,generally up to a maximum aggregate to $10 million. In the event that we liquidate, dissolve or wind-up, the holders of our common stock are entitled to share ratably in all assets remaining after payment of liabilities and liquidation preferences of any outstanding share of preferred stock. Holders of our common stock have no preemptive rights or rights to convert their common stock into any other securities.
Registration Rights
We granted registration rights to the former ABI shareholders with respect to all shares of our common stock they received in the 2006 merger. These holders of registrable securities have the right to require us to register all or a portion of the shares of our common stock they received in the merger. In addition, these holders of registrable securities may require us to include their shares in future registration statements that we file and may require us to register their shares for resale on a Form S-3 registration statement. Upon registration, the registered shares generally will be freely tradeable in the public market without restriction. However, in connection with any underwritten offering, the holders of registrable securities have agreed to lock up any other shares for up to 90 days and have agreed to a limit on the maximum number of shares that can be registered for the account of the holders of registrable securities under so-called “shelf” registration statements.
Except for underwriters’ discounts and commissions and certain marketing expenses, we will be obligated to pay all expenses for the first eight registration statements filed upon the request of a holder of registrable securities, and any other or additional expenses of registration are to be borne by the holders of registrable securities on a pro rata basis. These registration rights are subject to some conditions and limitations, among them the right of the underwriters of an offering to limit the number of shares included in registration. We will be obligated to indemnify the holders of these registration rights, and each selling holder will be obligated to indemnify us, against specified liabilities under the Securities Act of 1933, the Securities Exchange Act of 1934 and other applicable federal or state law.
Treasury Stock
We repurchased 58,718 of our shares in the 2006 third quarter for $1.5 million. The repurchase was funded using our internal cash resources and was held as treasury shares to be used for general corporate purposes. In aggregate, the 6,705,116 common shares held as treasury stock at December 31, 2006 had a cost basis of $8.61 per share. All treasury shares were cancelled as part of the separation and distribution of New Abraxis on November 13, 2007.
Increase in Authorized Shares
In connection with our 2006 merger with ABI, our Board of Directors approved an amendment to our certificate of incorporation to increase the authorized number of shares of common stock to 350,000,000, $0.001 par value per share. This charter amendment also was approved by the requisite vote of our stockholders pursuant to an action by written consent. Before giving effect to this charter amendment, our certificate of incorporation authorized us to issue 100,000,000 shares of common stock, $0.001 par value per share, and 6,000,000 shares of preferred stock, $0.001 par value per share. The authorized number of shares of preferred stock was not affected by the charter amendments.
74
13. Stock Options
We sponsor the following stock compensation plans:
1997 Stock Option Plan
Under the 1997 Stock Option Plan, or the 1997 Plan, options to purchase shares of our common stock were granted to certain employees and the directors with an exercise price equal to the estimated fair market value of our common stock on the date of grant. The 1997 Plan stock options vested upon completion of our initial public offering in December 2001.
2001 Stock Incentive Plan
The 2001 Stock Incentive Plan, or the 2001 Plan, provides for the grant of incentive stock options and restricted stock to our employees, including officers and employee directors, non-qualified stock options to employees, directors and consultants and other types of awards. At December 31, 2007, there were 18,210,995 options available for grant and 22,060,177 common shares reserved for the exercise of stock options under the 2001 Plan. Except as determined by our compensation committee, the number of shares reserved for issuance increases annually on the first day of each fiscal year by an amount equal to the lesser of a) 6,000,000 shares, b) 5% of the total number of shares outstanding as of that date or c) a number of shares as determined by our Board of Directors.
The compensation committee of our Board of Directors administers the 2001 Plan and has the authority to determine the terms and conditions of awards, including the types of awards, the number of shares subject to each award, the vesting schedule of the awards and the selection of the grantees. The exercise price of all options granted under the 2001 Plan will be determined by the compensation committee of our Board of Directors, but in no event will this price be less than the fair market value of our common stock on the date of grant.
2001 Non-Employee Director Stock Option Program
The 2001 Non-Employee Director Stock Option Program, or the 2001 Program, was adopted as part, and is subject to the terms and conditions, of the 2001 Plan. The 2001 Program establishes a program for the automatic grant of awards to our non-employee directors at the time that they initially join the board and at each annual meeting of the stockholders at which they are elected.
Restricted Stock
At December 31, 2007, 487,397 restricted units were outstanding under our 2001 Stock Incentive Plan with a weighted average per share market value of $12.56 and with vesting dates ranging from March 2008 to June 2011. Upon vesting, each restricted unit entitles the holder to one share of common stock. Compensation expense related to restricted stock grants is based upon the market price on the date of grant and is charged to earnings on a straight-line basis over the applicable vesting period. Restricted stock units currently granted generally vest ratably over a four year period. Restricted stock awards relating to the 2001 Stock Incentive Plan are accounted for under the equity method per FAS 123(R).
Restricted Unit Plan
In connection with the separation, we assumed the restricted units previously granted to our employees under the American BioScience Restricted Unit Plan II. Those awards are now governed under the APP Pharmaceuticals, Inc. Restricted Stock Unit Plan (the “RSU Plan”). Shares of our common stock are issuable upon the vesting of these units. The units issued under the RSU Plan vest one-half on April 18, 2008 (which is the second anniversary of the closing of the merger between Old Abraxis, then known as American
75
Pharmaceutical Partners, and American BioScience). The balance of the shares will vest on April 18, 2010. The restricted stock units entitle their holders to receive a number of our shares of common stock on each vesting date determined by taking the value of the vested portion of the award divided by our average trading price over the three days prior to vesting; except that if the average trading price of our stock price is less than $14.47, then the notional price is divided by $14.47. The maximum number of our shares that may be issuable under this restricted unit plan is 345,542 shares.
Pursuant to an agreement between Old Abraxis and RSU Plan LLC (“RSU LLC”), RSU LLC has agreed that prior to the date on which restricted stock units issued pursuant to the RSU Plan become vested, RSU LLC will deliver, or cause to be delivered, to us the number of our shares of common stock or cash (or a combination thereof) in an amount sufficient to satisfy the obligations to participants under the RSU Plan of the vested restricted units. We are required to satisfy our obligations under the RSU Plan by paying to the participants cash and/or shares of our common stock in the same proportion as was delivered by the RSU LLC. The intention of this agreement is to have RSU LLC satisfy our obligations under the RSU Plan so that there would not be any further dilution to our stockholders as a result of our assumption of certain awards under the American BioScience Restricted Unit Plan II.
Excluding the effects of discontinued operations stock based compensation costs for RSU awards for the years ended December 31, 2007, 2006 and 2005 were $6.0 million, $2.0 million and $1.0 million, respectively. As of December 31, 2007, there was $5.4 million of total unrecognized compensation expense related to restricted stock granted under the company’s equity incentive plans which is expected to be recognized over a weighted average period of 1.86 years.
Employee Stock Purchase Plan
Under the 2001 Employee Stock Purchase Plan, or the ESPP, eligible employees may contribute up to 10% of their base earnings toward the semi-annual purchase and issuance of our common stock. The employees’ purchase price is the lesser of 85% of the fair market value of the stock on the first business day of the offer period or 85% of the fair market value of the stock on the last business day of the semi-annual purchase period. Employees can purchase no more than 625 shares of our common stock within any given purchase period. An aggregate of 9,238,726 shares of our common stock were reserved for issuance under the ESPP at December 31, 2007. The ESPP provides for annual increases in the number of shares of our common stock issuable under the ESPP equal to the lesser of: a) 3,000,000 shares; b) a number of shares equal to 2% of the total number of shares outstanding; or c) a number of shares as determined by our Board of Directors. During the year ended December 31, 2007, approximately 220,000 shares of our stock were issued under the ESPP for an aggregate purchase price of $3.8 million. On August 7, 2007, in connection with the separation of Old Abraxis’ proprietary products business, Old Abraxis’ Compensation Committee indefinitely suspended the ESPP from and after completion of the purchase period that ended on July 31, 2007.
Stock Options
We account for stock-based compensation in accordance with FAS 123(R), which requires the recognition of compensation cost for all share-based payments, including employee stock options, at fair value. We use the straight-line attribution method to recognize share-based compensation expense over the vesting period of the award. Options currently granted generally expire ten years from the grant date and vest ratably over a four-year period.
In accordance with FAS 123(R), we adjust stock-based compensation on a quarterly basis for revisions to the estimated rate of equity award forfeitures based on actual forfeiture experience. The effect of adjusting the forfeiture rate for all expense amortization after January 1, 2005 will be recognized in the period the forfeiture estimate is changed. During the fourth quarter of 2007, we revised the forfeiture rate with respect to stock options. The effect of the change in the forfeiture rate resulted in a reduction in stock compensation expense of $2.1 million in the quarter. No changes in estimated rate of forfeitures were made during 2005 or 2006.
76
As of December 31, 2007, there was $7.0 million of total unrecognized compensation expense related to stock options granted under the company’s equity incentive plans which is expected to be recognized over a weighted average period of 2.15 years.
The fair values of options granted during the years ended December 31, 2007, 2006 and 2005 were determined using the Black-Scholes option pricing model, which incorporates various assumptions. The risk-free rate of interest for the average contractual life of the option is based on the U.S. Treasury yield curve in effect at the time of grant. The dividend yield is zero as we do not anticipate paying any dividends. The expected term of awards granted is based upon the historical exercise patterns of the participants in our plans and expected volatility is based on the historical volatility of our stock over the expected term of the award. The weighted average estimated values of employee stock option grants and rights granted under our employee stock purchase plan as well as the weighted average assumptions that were used in calculating such values during the last three years were based on estimates at the date of grant as follows:
| | | | | | | | | | | | |
| | | Twelve Months Ended December 31, | |
| | | 2007 | | | 2006 | | | 2005 | |
Stock Options | | | | | | | | | | | | |
Risk-free rate | | | 4.1 | % | | | 3.9 | % | | | 3.9 | % |
Dividend yield | | | — | | | | — | | | | — | |
Expected life in years | | | 5 | | | | 5 | | | | 5 | |
Volatility | | | 55 | % | | | 59 | % | | | 46 | % |
Fair value of options granted | | $ | 1,440,389 | | | $ | 21,395,865 | | | $ | 15,583,788 | |
Weighted average grant date fair value of options granted | | $ | 5.76 | | | $ | 13.23 | | | $ | 20.01 | |
| | | |
Employee Stock Purchase Plan | | | | | | | | | | | | |
Risk-free rate | | | 4.0 | % | | | 2.8 | % | | | 2.2 | % |
Dividend yield | | | — | | | | — | | | | — | |
Expected life in years | | | 1.2 | | | | 1.2 | | | | 1.2 | |
Volatility | | | 60 | % | | | 48 | % | | | 46 | % |
Our stock options outstanding that have vested and are expected to vest as of December 31, 2007 were as follows:
| | | | | | | | | | |
| | | Number of
Shares | | Weighted
Average
Exercise
Price | | Weighted
Average
Remaining
Contractual
Term | | Aggregate
Intinsic Value(1) |
Vested | | 1,695,836 | | $ | 10.83 | | 5.39 | | $ | 18,365,299 |
Expected to Vest | | 1,411,880 | | | 15.49 | | 8.35 | | | 21,869,890 |
| | | | | | | | | | |
Total | | 3,107,716 | | $ | 12.95 | | 6.73 | | $ | 40,235,189 |
| | | | | | | | | | |
| (1) | These amounts represent the difference between the exercise price and $10.27, the closing price of APP Pharmaceuticals stock on December 31, 2007 for in-the-money options. |
The above options outstanding that are expected to vest are net of estimated future option forfeitures in accordance with the provisions of FAS 123(R). Options with a fair value of $5.9 million and $8.3 million and with weighted average grant date fair values of $7.62 and $13.62 vested during the twelve months ended December 31, 2007 and 2006, respectively. Options with a fair value of $0.7 million and $5.6 million, weighted average grant date fair values of $3.83 and $8.68 and aggregate intrinsic values of $1.1 million and $10.6 million were exercised during the twelve months ended December 31, 2007 and 2006, respectively. Non-vested options totalling 1,411,885 and 2,188,175 shares with weighted average grant date fair values of $7.59 and $15.02 were outstanding at December 31, 2007 and 2006, respectively.
77
Additional information with respect to our stock option activity is as follows:
| | | | | | | | | | | |
| | | Options Outstanding | | Exercisable Options |
| | | Shares | | | Weighted
Average Exercise
Price | | Shares | | Weighted
Average Exercise
Price |
Outstanding at December 31, 2004 | | 4,970,137 | | | $ | 13.24 | | 2,625,886 | | $ | 5.62 |
| | | | | | | | | | | |
Granted | | 778,800 | | | $ | 45.91 | | | | | |
Exercised | | (1,760,444 | ) | | $ | 6.92 | | | | | |
Forfeited | | (416,496 | ) | | $ | 31.23 | | | | | |
| | | | | | | | | | | |
Outstanding at December 31, 2005 | | 3,571,997 | | | $ | 21.36 | | 1,774,537 | | $ | 11.31 |
| | | | | | | | | | | |
Granted | | 1,617,550 | | | $ | 28.40 | | | | | |
Exercised | | (644,030 | ) | | $ | 12.46 | | | | | |
Forfeited | | (573,646 | ) | | $ | 34.18 | | | | | |
| | | | | | | | | | | |
Outstanding at December 31, 2006 | | 3,971,871 | | | $ | 23.81 | | 1,783,696 | | $ | 14.94 |
| | | | | | | | | | | |
Granted | | 437,000 | | | $ | 23.41 | | | | | |
Exercised | | (398,871 | ) | | $ | 8.17 | | | | | |
Forfeited | | (363,285 | ) | | $ | 35.15 | | | | | |
| | | | | | | | | | | |
Outstanding at November 13, 2007 | | 3,646,715 | | | $ | 24.39 | | 1,960,183 | | $ | 20.18 |
| | | | | | | | | | | |
Separation Conversion(1) | | (514,245 | ) | | | | | | | | |
Granted | | 42,500 | | | $ | 10.28 | | | | | |
Exercised | | (39,468 | ) | | $ | 4.91 | | | | | |
Forfeited | | (27,786 | ) | | $ | 15.67 | | | | | |
| | | | | | | | | | | |
Outstanding at December 31, 2007 | | 3,107,716 | | | $ | 12.95 | | 1,695,836 | | $ | 10.83 |
| | | | | | | | | | | |
| (1) | As part of the separation, stock options relating to employees of New Abraxis were eliminated and stock options for our employees were converted to reflect the adjusted value of the options post-separation. The number of options outstanding on the split date and the associated exercise prices were converted at a rate of 1.9533, which was based on our closing stock price for the 10 consecutive trading days preceding and 10 consecutive trading days following the separation. No additional stock compensation expense resulted from the modifications made due to the anti-dilutive provisions related to the plan. |
The following table summarizes information about our stock options outstanding at December 31, 2007:
| | | | | | | | | | | | |
| | | Options Outstanding | | Options Exercisable |
Exercise Price Ranges | | Number of
Shares | | Weighted
Average
Remaining
Contractual
Life | | Weighted-
Average
Exercise
Price | | Number of
Shares | | Weighted
Average
Exercise
Price |
$ 0.00 – $ 2.70 | | 290,312 | | 1.4 | | $ | 1.30 | | 290,312 | | $ | 1.30 |
$ 2.70 – $ 5.40 | | 112,663 | | 4.1 | | $ | 4.11 | | 112,663 | | $ | 4.11 |
$ 5.40 – $ 8.10 | | 393,416 | | 5.0 | | $ | 6.48 | | 393,416 | | $ | 6.48 |
$ 8.10 – $10.80 | | 138,693 | | 8.9 | | $ | 10.27 | | 31,370 | | $ | 10.27 |
$10.80 – $13.50 | | 460,808 | | 7.7 | | $ | 12.49 | | 212,648 | | $ | 12.80 |
$13.50 – $16.21 | | 1,193,814 | | 8.1 | | $ | 15.23 | | 363,980 | | $ | 15.24 |
$16.21 – $18.91 | | 97,115 | | 6.3 | | $ | 17.80 | | 62,197 | | $ | 17.81 |
$18.91 – $21.61 | | 109,131 | | 7.2 | | $ | 20.63 | | 65,671 | | $ | 20.46 |
$21.61 – $24.31 | | 243,650 | | 7.0 | | $ | 23.60 | | 128,914 | | $ | 23.59 |
$24.31 – $27.01 | | 68,114 | | 7.0 | | $ | 25.68 | | 34,665 | | $ | 25.70 |
| | | | | | | | | | | | |
| | 3,107,716 | | 6.7 | | $ | 12.95 | | 1,695,836 | | $ | 10.83 |
| | | | | | | | | | | | |
78
14. Income Taxes
The provisions for income tax for continuing operations consists of the following:
| | | | | | | | | | | | |
| | | Year Ended December 31, | |
| | | 2007 | | | 2006 | | | 2005 | |
| | | (in thousands) | |
Current: | | | | | | | | | | | | |
Federal | | $ | 49,925 | | | $ | 86,709 | | | $ | 42,172 | |
State | | | 8,788 | | | | 5,069 | | | | 4,205 | |
Foreign | | | 4,376 | | | | 2,970 | | | | 1,696 | |
| | | | | | | | | | | | |
Total current | | | 63,089 | | | | 94,748 | | | | 48,073 | |
Deferred: | | | | | | | | | | | | |
Federal | | | (7,381 | ) | | | (26,610 | ) | | | (16,080 | ) |
State | | | (707 | ) | | | 421 | | | | (1,584 | ) |
| | | | | | | | | | | | |
Total deferred | | | (8,088 | ) | | | (26,189 | ) | | | (17,664 | ) |
| | | | | | | | | | | | |
Total provision for income taxes | | $ | 55,001 | | | $ | 68,559 | | | $ | 30,409 | |
| | | | | | | | | | | | |
A reconciliation of the federal statutory rate to our effective tax rate is as follows (in %):
| | | | | | | | | |
| | | Year Ended December 31, | |
| | | 2007 | | | 2006 | | | 2005 | |
Tax provision at statutory federal rate | | 35.0 | % | | 35.0 | % | | 35.0 | % |
State income taxes, net of federal income tax benefit | | 3.8 | | | 3.7 | | | 3.4 | |
In-process research and development | | — | | | 6.9 | | | — | |
Research and development tax credits | | (0.7 | ) | | (3.6 | ) | | (2.7 | ) |
Minority interest | | — | | | 3.5 | | | 16.3 | |
Foreign rate differential | | 6.2 | | | 3.3 | | | — | |
Domestic production activities deduction | | (2.1 | ) | | (1.8 | ) | | (2.1 | ) |
Stock based compensation | | 1.0 | | | 0.1 | | | — | |
Other items | | (2.3 | ) | | 8.3 | | | 0.2 | |
Change in FIN 48 liability | | (0.8 | ) | | — | | | — | |
| | | | | | | | | |
Income tax expense | | 40.1 | % | | 55.4 | % | | 50.1 | % |
| | | | | | | | | |
79
Deferred tax assets and liabilities consist of the following:
| | | | | | | | |
| | | December 31, | |
| | | 2007 | | | 2006 | |
| | | (in thousands) | |
Deferred tax assets: | | | | | | | | |
Inventory | | $ | 8,500 | | | $ | 11,770 | |
Milestone payment | | | — | | | | 3,578 | |
Deferred revenue | | | — | | | | 79,341 | |
Net operating loss and credit carryforwards | | | — | | | | 753 | |
Amortization of stock-based compensation | | | 4,190 | | | | 4,017 | |
Other accruals and reserves | | | 4,419 | | | | 8,265 | |
| | | | | | | | |
Total deferred tax assets | | | 17,109 | | | | 107,724 | |
Deferred tax liabilities: | | | | | | | | |
Intangible asset amortization | | | (64,239 | ) | | | (157,479 | ) |
Depreciation | | | (5,305 | ) | | | (13,725 | ) |
Foreign exchange | | | (1,374 | ) | | | — | |
Other accruals and reserves | | | (93 | ) | | | (128 | ) |
| | | | | | | | |
Total deferred tax liabilities | | | (71,011 | ) | | | (171,332 | ) |
| | | | | | | | |
Net deferred tax liability | | $ | (53,902 | ) | | $ | (63,608 | ) |
| | | | | | | | |
We adopted the provisions of FASB Interpretation No. 48, Accounting for Uncertainty in Income Taxes (“FIN 48”), on January 1, 2007. This interpretation clarifies what criteria must be met prior to the recognition of the financial statement benefit of a position taken in a tax return in accordance with FASB Statement No. 109, Accounting for Income Taxes. The effect of the implementation of FIN 48 was not material.
Following is a reconciliation of our total gross unrecognized tax benefits for the year-to-date at December 31, 2007 (in thousands). All of the total tax benefits of $3.0 million, if recognized, would affect our effective tax rate in future periods.
| | | | |
Balance, January 1, 2007 | | $ | 4,557 | |
Additions for tax positions related to current year | | | 835 | |
Additions for tax positions related to prior years | | | 662 | |
Reductions for tax periods of prior years | | | (3,095 | ) |
| | | | |
Balance, December 31, 2007 | | $ | 2,959 | |
| | | | |
We recognize interest and penalties related to unrecognized tax benefits in its income tax expense. At December 31, 2007, we had accrued $0.1 million for the payment of such interest.
We and our subsidiaries file income tax returns in the US Federal jurisdiction, Canada, Puerto Rico, and various state jurisdictions. We are subject to US federal income tax examinations for calendar years 2006 and 2007. We are also subject to Canadian income tax examinations for 2005 through 2007 tax years, and to Puerto Rican income tax examinations for 2006 and 2007 tax years. Additionally, we are subject to various state income tax examinations for the 2003 through 2007 tax years. We are currently under state income tax examinations in California, Illinois, Massachusetts and North Carolina for various tax years. There are no other open federal, state, or foreign government income tax audits at this time.
80
15. Regulatory Matters
We are subject to regulatory oversight by the United States Food and Drug Administration and other regulatory authorities with respect to the development and manufacturing of its products. Failure to comply with regulatory requirements can have a significant effect on our business and operations. Management has designed and operates a system of controls to attempt to ensure compliance with regulatory requirements.
16. Litigation
In October 2007, Old Abraxis entered into a settlement agreement and release with respect to all disputes with a former officer and employee of ABI. Under the separation and distribution agreement, New Abraxis assumed all liabilities relating to litigation with this individual. Pursuant to the indemnification provisions of the definitive agreements for the 2006 merger, the former ABI shareholders indemnified Old Abraxis for approximately two-thirds of the obligations under the settlement agreement and the amount is recorded in our statement of cash flows as non-cash issuance for legal expenses while the entire settlement is reflected in our statement of operations as discontinued operations.
We are from time to time subject to claims and litigation arising in the ordinary course of business. These claims have included assertions that our products infringe existing patents, product liability and also claims that the use of our products has caused personal injuries. We intend to defend vigorously any such litigation that may arise under all defenses that would be available to us. In the opinion of management, the ultimate outcome of proceedings of which management is aware, even if adverse to us, will not have a material adverse effect on our consolidated financial position or results of operations.
17. Total Revenue by Product Line
With the spin-off of New Abraxis, we currently maintain only one operating segment, hospital-based. Total revenue by product line were as follows:
| | | | | | | | | |
| | | 2007 | | 2006 | | 2005 |
| | | (in thousands) |
Critical care | | $ | 382,772 | | $ | 302,244 | | $ | 163,581 |
Anti-infective | | | 193,704 | | | 213,490 | | | 169,818 |
Oncology | | | 55,308 | | | 57,872 | | | 51,084 |
Contract manufacturing and other | | | 15,590 | | | 9,595 | | | 599 |
| | | | | | | | | |
Total revenue | | $ | 647,374 | | $ | 583,201 | | $ | 385,082 |
| | | | | | | | | |
18. Unaudited Quarterly Financial Data
Selected quarterly data for 2007 and 2006 is as follows:
| | | | | | | | | | | | | |
| | | Year Ended December 31, 2007 |
| | | First | | Second | | Third | | | Fourth |
| | | (in thousands, except per share data) |
Net revenue | | $ | 140,268 | | $ | 159,327 | | $ | 153,179 | | | $ | 194,600 |
Gross profit | | | 65,437.0 | | | 80,150.0 | | | 68,124.0 | | | | 101,617.0 |
Income (loss) from continuing operations | | | 13,617.0 | | | 22,792.0 | | | 14,110.0 | | | | 31,660.0 |
Net Income (Loss) | | $ | 11,115 | | $ | 23,096 | | $ | (8,385 | ) | | $ | 8,532 |
Income (loss) from continuing operations per common share: | | | | | | | | | | | | | |
Basic | | $ | 0.09 | | $ | 0.14 | | $ | 0.09 | | | $ | 0.20 |
Diluted | | $ | 0.08 | | $ | 0.14 | | $ | 0.09 | | | $ | 0.20 |
Net income (loss) per common share: | | | | | | | | | | | | | |
Basic | | $ | 0.07 | | $ | 0.14 | | $ | (0.05 | ) | | $ | 0.05 |
Diluted | | $ | 0.07 | | $ | 0.14 | | $ | (0.05 | ) | | $ | 0.05 |
81
During the 4th quarter of 2007, we revised our forfeiture rate with respect to stock options. As a result of this change in estimate, the 4th quarter includes a benefit of $2.1 million relating to stock compensation.
| | | | | | | | | | | | | |
| | | Year Ended December 31, 2006 |
| | | First | | Second | | | Third | | Fourth |
| | | (in thousands, except per share data) |
Net revenue | | $ | 113,472 | | $ | 120,255 | | | $ | 149,768 | | $ | 199,706 |
Gross profit | | $ | 59,950 | | $ | 58,371 | | | $ | 68,355 | | $ | 108,446 |
Income (loss) from continuing operations | | $ | 14,211 | | $ | (11,959 | ) | | $ | 16,344 | | $ | 36,629 |
Net Income (Loss) | | $ | 1,884 | | $ | (90,787 | ) | | $ | 13,557 | | $ | 28,449 |
Income (loss) from continuing operations per common share: | | | | | | | | | | | | | |
Basic | | $ | 0.09 | | $ | (0.08 | ) | | $ | 0.11 | | $ | 0.23 |
Diluted | | $ | 0.09 | | $ | (0.08 | ) | | $ | 0.11 | | $ | 0.23 |
Net income (loss) per common share: | | | | | | | | | | | | | |
Basic | | $ | 0.01 | | $ | (0.57 | ) | | $ | 0.09 | | $ | 0.18 |
Diluted | | $ | 0.01 | | $ | (0.57 | ) | | $ | 0.09 | | $ | 0.18 |
82
| Item 9. | CHANGES IN AND DISAGREEMENTS WITH ACCOUNTANTS ON ACCOUNTING AND FINANCIAL DISCLOSURE |
None.
| Item 9A. | CONTROLS AND PROCEDURES |
(a) Evaluation of disclosure controls and procedures.
We maintain disclosure controls and procedures, as such term is defined under Exchange Act Rules 13a-15(e) and 15d-15(e), that are designed to ensure that information required to be disclosed by us in the reports that we file or submit under the Exchange Act is recorded, processed, summarized and reported within the time periods specified in the SEC’s rules and forms, and that such information is accumulated and communicated to management, including our Chief Executive Officer and our Chief Financial Officer, to allow timely decisions regarding required disclosures. In designing and evaluating our disclosure controls and procedures, we recognize that any controls and procedures, no matter how well designed and operated, can only provide reasonable assurance of achieving the desired control objectives and in reaching a reasonable level of assurance we necessarily are required to apply judgment in evaluating the cost-benefit relationship of possible controls and procedures. Our management, with participation of our Chief Executive Officer and Chief Financial Officer, evaluated the effectiveness of our disclosure controls and procedures as of the end of the fiscal year covered by this report. Based on their evaluation and subject to the foregoing, management concluded that our disclosure controls and procedures were effective as of December 31, 2007.
(b) Management’s Report on Internal Control Over Financial Reporting
Our management is responsible for establishing and maintaining adequate internal control over financial reporting as defined in Rules 13a-15(f) under the Securities Exchange Act of 1934. Our internal control over financial reporting is a process designed to provide reasonable assurance regarding the reliability of financial reporting and the preparation of financial statements for external purposes in accordance with accounting principles generally accepted in the United States. Internal control over financial reporting includes those written policies and procedures that:
| | • | | pertain to the maintenance of records that, in reasonable detail, accurately and fairly reflect the transactions and dispositions of our assets; |
| | • | | provide reasonable assurance that transactions are recorded as necessary to permit preparation of financial statements in accordance with accounting principles generally accepted in the United States of America; |
| | • | | provide reasonable assurance that our receipts and expenditures are being made only in accordance with authorization of our management and directors; and |
| | • | | provide reasonable assurance regarding prevention or timely detection of unauthorized acquisition, use or disposition of assets that could have a material effect on the consolidated financial statements. |
Internal control over financial reporting includes the controls themselves, monitoring and internal auditing practices and actions taken to correct deficiencies as identified.
Because of its inherent limitations, internal control over financial reporting may not prevent or detect misstatements. Also, projections of any evaluation of effectiveness to future periods are subject to the risk that controls may become inadequate because of changes in conditions, or that the degree of compliance with the policies or procedures may deteriorate.
Management assessed the effectiveness of our internal control over financial reporting as of December 31, 2007. In making this assessment, management used the criteria set forth by the Committee of Sponsoring
83
Organizations of the Treadway Commission (COSO) in Internal Control—Integrated Framework. Management’s assessment included an evaluation of the design of our internal control over financial reporting and testing of the operational effectiveness of its internal control over financial reporting. Management reviewed the results of its assessment with the Audit Committee of our Board of Directors.
Based on this assessment, management believes that we maintained effective internal control over financial reporting as of December 31, 2007, based on those criteria.
The effectiveness of the Company’s internal control over financial reporting as of December 31, 2007 has been audited by Ernst & Young LLP, an independent registered public accounting firm, as stated in their report below.
(c) Changes in internal controls.
As reported in the Annual Report on Form 10-K for the year ended December 31, 2006, and in the Quarterly Reports on Form 10-Q for each of the first three quarters of 2007, management identified a material weakness in internal controls over the accounting for income taxes. As a result of this material weakness, management concluded in its 2006 Annual Report on Form 10-K that the company’s internal controls over financial reporting were not effective as of December 31, 2006.
During 2007, management carried out an evaluation of the company’s internal controls over financial reporting related to the accounting for income taxes. The company identified and undertook the following steps to remediate the material weakness described above:
| | • | | With the help of external advisors (other than the company’s independent registered public accounting firm), existing income tax-related controls were enhanced with standardized documentation, and additional controls were added as necessary to identify and quantify potential issues. |
| | • | | Organizational structure changes were implemented to enhance efficiencies, effectiveness, and accountability of the company’s tax department. Key tax positions were established to ensure tax processes and key controls are monitored and sustainable over time. |
| | • | | The company provided additional training and education efforts in the tax areas. |
The planned remediation steps set forth above were designed and initiated following the identification of the material weakness and deployed as soon as practicable throughout fiscal year 2007. The company undertook and completed, as appropriate, testing to validate the design and operating effectiveness of its existing and newly implemented procedures and controls described above for the quarters ended September 30, 2007 and December 31, 2007. In reviewing the results from this testing, management has concluded that the internal controls related to the accounting for income taxes have been significantly improved and that the above referenced material weakness in internal control over financial reporting related to the accounting for income taxes has been remediated as of December 31, 2007.
Management has determined that, as of December 31, 2007 other than as described above, there were no other changes in our internal control over financial reporting, as such term is defined in Exchange Act Rules 13a-15(f) and 15d-15(f), that occurred during our most recent fiscal quarter that have materially affected, or are reasonably likely to materially affect, our internal control over financial reporting.
| Item 9B. | OTHER INFORMATION |
None.
84
Report of Independent Registered Public Accounting Firm
The Board of Directors and Stockholders of APP Pharmaceuticals, Inc.
We have audited APP Pharmaceuticals, Inc.’s internal control over financial reporting as of December 31, 2007, based on criteria established in Internal Control—Integrated Framework issued by the Committee of Sponsoring Organizations of the Treadway Commission (the COSO criteria). APP Pharmaceuticals, Inc.’s management is responsible for maintaining effective internal control over financial reporting, and for its assessment of the effectiveness of internal control over financial reporting included in the accompanying management report entitled Management’s Report on Internal Control over Financial Reporting. Our responsibility is to express an opinion on the company’s internal control over financial reporting based on our audit.
We conducted our audit in accordance with the standards of the Public Company Accounting Oversight Board (United States). Those standards require that we plan and perform the audit to obtain reasonable assurance about whether effective internal control over financial reporting was maintained in all material respects. Our audit included obtaining an understanding of internal control over financial reporting, assessing the risk that a material weakness exists, testing and evaluating the design and operating effectiveness of internal control based on the assessed risk, and performing such other procedures as we considered necessary in the circumstances. We believe that our audit provides a reasonable basis for our opinion.
A company’s internal control over financial reporting is a process designed to provide reasonable assurance regarding the reliability of financial reporting and the preparation of financial statements for external purposes in accordance with generally accepted accounting principles. A company’s internal control over financial reporting includes those policies and procedures that (1) pertain to the maintenance of records that, in reasonable detail, accurately and fairly reflect the transactions and dispositions of the assets of the company; (2) provide reasonable assurance that transactions are recorded as necessary to permit preparation of financial statements in accordance with generally accepted accounting principles, and that receipts and expenditures of the company are being made only in accordance with authorizations of management and directors of the company; and (3) provide reasonable assurance regarding prevention or timely detection of unauthorized acquisition, use, or disposition of the company’s assets that could have a material effect on the financial statements.
Because of its inherent limitations, internal control over financial reporting may not prevent or detect misstatements. Also, projections of any evaluation of effectiveness to future periods are subject to the risk that controls may become inadequate because of changes in conditions, or that the degree of compliance with the policies or procedures may deteriorate.
In our opinion, APP Pharmaceuticals, Inc. maintained in all material respects, effective internal control over financial reporting as of December 31, 2007, based on the COSO criteria.
We also have audited, in accordance with the standards of the Public Company Accounting Oversight Board (United States), the consolidated balance sheets of APP Pharmaceuticals, Inc. as of December 31, 2007 and 2006, and the related consolidated statements of operations, stockholders’ equity, and cash flows for each of the three years in the period ended December 31, 2007 of APP Pharmaceuticals, Inc. and our report dated March 17, 2008 expressed an unqualified opinion thereon.
/s/ ERNST & YOUNG LLP
Chicago, Illinois
March 17, 2008
85
PART III
| Item 10. | DIRECTORS, EXECUTIVE OFFICERS AND CORPORATE GOVERNANCE |
The information required by this item will be contained in the Proxy Statement for our 2008 Annual Meeting of Stockholders and is incorporated herein by reference.
| Item 11. | EXECUTIVE COMPENSATION |
The information required by this item will be contained in the Proxy Statement for our 2008 Annual Meeting of Stockholders and is incorporated herein by reference.
| Item 12. | SECURITY OWNERSHIP OF CERTAIN BENEFICIAL OWNERS AND MANAGEMENT AND RELATED STOCKHOLDER MATTERS |
The information required by this item will be contained in the Proxy Statement for our 2008 Annual Meeting of Stockholders and is incorporated herein by reference.
| Item 13. | CERTAIN RELATIONSHIPS AND RELATED TRANSACTIONS |
The information required by this item will be contained in the Proxy Statement for our 2008 Annual Meeting of Stockholders and is incorporated herein by reference.
| Item 14. | PRINCIPAL ACCOUNTANT FEES AND SERVICES. |
The information required by this item will be contained in the Proxy Statement for our 2008 Annual Meeting of Stockholders and is incorporated herein by reference.
PART IV
| Item 15. | EXHIBITS, FINANCIAL STATEMENT SCHEDULE AND REPORTS ON FORM 8-K |
a. (1) Financial Statements
The following consolidated financial statements of APP Pharmaceuticals, Inc. are included in Part II, Item 8 of this Report:
|
| Management’s Report on Internal Control over Financial Reporting |
| Report of Independent Registered Public Accounting Firm on Internal Control over Financial Reporting |
| Report of Independent Registered Public Accounting Firm |
| Consolidated Balance Sheets at December 31, 2007 and 2006 |
| Consolidated Statements of Income for the Years Ended December 31, 2007, 2006 and 2005 |
| Consolidated Statements of Stockholders’ Equity for the Years Ended December 31, 2007, 2006 and 2005 |
| Consolidated Statements of Cash Flows for the Years Ended December 31, 2007, 2006 and 2005 |
| Notes to Consolidated Financial Statements |
(2) Financial Statement Schedule
The following consolidated financial statement schedule of APP Pharmaceuticals, Inc. is filed as part of this Report:
Schedule II. Valuation and Qualifying Accounts and Reserves
86
All other schedules are omitted because the required information is not present or is not present in amounts sufficient to require submission of the schedule or because the information required is given in the consolidated financial statements or the notes thereto.
(3) Exhibits
The exhibits are as set forth in the Exhibit Index.
87
SIGNATURES
Pursuant to the requirements of Section 13 or 15(d) of the Securities Exchange Act of 1934, the registrant has duly caused this report to be signed on its behalf by the undersigned, thereunto duly authorized, in the City of Los Angeles, State of California on the 17 day of March 2008.
| | |
| APP Pharmaceuticals, Inc. |
| |
By: | | /s/ PATRICK SOON-SHIONG, M.D. |
| | Patrick Soon-Shiong, M.D. Chairman of the Board of Directors and Chief Executive Officer |
POWER OF ATTORNEY
Each person whose signature appears below constitutes and appoints Patrick Soon-Shiong, M.D., Lisa Gopalakrishnan and Richard E. Maroun, and each of them, as attorneys-in-fact, each with the power of substitution, for him or her in any and all capacities, to sign any amendment to this Annual Report on Form 10-K and to file the same, with exhibits thereto and other documents in connection therewith, with the Commission, granting to said attorneys-in-fact, and each of them, full power and authority to do and perform each and every act and thing requisite and necessary to be done in connection therewith, as fully to all intents and purposes as he or she might or could do in person, hereby ratifying and confirming all that said attorneys-in-fact or any of them, or their or his substitute or substitutes, may lawfully do or cause to be done by virtue hereof.
Pursuant to the requirements of the Securities Exchange Act of 1934, this report has been signed below by the following persons on behalf of the Partnership in the capacities and on the dates indicated.
| | | | |
Signature | | Title | | Date |
| | |
/s/ PATRICK SOON-SHIONG, M.D. Patrick Soon-Shiong, M.D. | | Chairman of the Board of Directors and Chief Executive Officer (Principal Executive Officer) | | March 17, 2008 |
| | |
/s/ LISA GOPALAKRISHNAN Lisa Gopalakrishnan | | Executive Vice President and Chief Financial Officer (Principal Financial and Accounting Officer) | | March 17, 2008 |
| | |
/s/ MICHAEL D. BLASZYK Michael D. Blaszyk | | Director | | March 17, 2008 |
| | |
/s/ MICHAEL S. SITRICK Michael S. Sitrick | | Director | | March 17, 2008 |
| | |
/s/ JOSEPH M. PIZZA Joseph M. Pizza | | Director | | March 17, 2008 |
| | |
/s/ STUART DEPINA Stuart DePina | | Director | | March 17, 2008 |
| | |
/s/ RAMESH GOPALAKRISHNAN Ramesh Gopalakrishnan | | Director | | March 17, 2008 |
88
APP Pharmaceuticals, Inc.
Schedule II—Valuation and Qualifying Accounts For the Three Years Ended December 31, 2007
Allowance for doubtful accounts:
| | | | | | | | | | | | | |
Column A | | Column B | | Column C | | | Column D | | Column E |
Description | | Balance at
beginning
of period | | Additions charged
to costs and
expenses | | | Deductions | | Balance at
end of period |
| | | (in thousands) |
Year ended December 31, 2007 | | $ | 100 | | $ | 7 | | | $ | 7 | | $ | 100 |
Year ended December 31, 2006 | | $ | 627 | | $ | (472 | ) | | $ | 55 | | $ | 100 |
Year ended December 31, 2005 | | $ | 632 | | $ | 4 | | | $ | 9 | | $ | 627 |
EXHIBIT INDEX
| | |
Exhibit
Number | | Description |
| 2.1 | | Agreement and Plan of Merger, dated as of November 27, 2005, by and among American Pharmaceutical Partners, Inc., American BioScience, Inc. (“ABI”) and, with respect to specified matters, certain ABI shareholders (Incorporated by reference to Exhibit 2.1 to Registrant’s Current Report on Form 8-K filed with the Securities and Exchange Commission on November 29, 2005) |
| |
| 2.2 | | Agreement and Plan of Reorganization, dated as of November 13, 2007, by and among the Registrant, Abraxis BioScience, Inc. and Abraxis BioScience, LLC (Incorporated by reference to Exhibit 10.1 to Registrant’s Current Report on Form 8-K filed with the Securities and Exchange Commission on November 13, 2007) |
| |
| 2.3† | | Separation and Distribution Agreement among the Registrant, Abraxis BioScience, LLC, APP Pharmaceuticals, LLC and Abraxis BioScience, Inc. (f/k/a New Abraxis, Inc.) |
| |
| 3.1 | | Amended and Restated Certificate of Incorporation of the Registrant (Incorporated by reference to Exhibit 3.1 to Registrant’s Current Report on Form 8-K filed with the Securities and Exchange Commission on November 13, 2007) |
| |
| 3.2 | | Bylaws of the Registrant (Incorporated by reference to Exhibit 3.2 to Registrant’s Current Report on Form 8-K filed with the Securities and Exchange Commission on November 13, 2007) |
| |
| 4.1 | | Reference is made to Exhibits 3.1 and 3.2 |
| |
| 4.2† | | Specimen Stock Certificate of the Registrant |
| |
| 4.3 | | Registration Rights Agreement, dated April 18, 2006, by and among the Registrant and the ABI shareholders set forth therein (Incorporated by reference to Exhibit 4.4 to Registrant’s Quarterly Report on Form 10-Q filed with the Securities and Exchange Commission on May 10, 2006) |
| |
| 10.1† | | Separation and Distribution Agreement among the Registrant, Abraxis BioScience, LLC, APP Pharmaceuticals, LLC and Abraxis BioScience, Inc. (f/k/a New Abraxis, Inc.) (Filed as Exhibit 2.3 hereto) |
| |
| 10.2† | | Tax Allocation Agreement among the Registrant, Abraxis BioScience, LLC, APP Pharmaceuticals, LLC and Abraxis BioScience, Inc. (f/k/a New Abraxis, Inc.) |
| |
| 10.3† | | Transition Services Agreement between the Registrant and Abraxis BioScience, Inc. (f/k/a New Abraxis, Inc.) |
| |
| 10.4† | | Employee Matters Agreement among the Registrant, APP Pharmaceuticals, LLC, Abraxis BioScience, LLC and Abraxis BioScience, Inc. (f/k/a New Abraxis, Inc.) |
| |
| 10.5†* | | Manufacturing Agreement between APP Pharmaceuticals, LLC and Abraxis BioScience, Inc. (f/k/a New Abraxis, Inc.) |
| |
| 10.6† | | Lease Agreement between APP Pharmaceuticals, LLC and Abraxis BioScience, LLC for the premises located at 2020 Ruby Street, Melrose Park, Illinois |
| |
| 10.7† | | Lease Agreement between APP Pharmaceuticals, LLC and Abraxis BioScience, LLC for the warehouse facilities located at 2045 N. Cornell Avenue, Melrose Park, Illinois |
| |
| 10.8† | | Lease Agreement between APP Pharmaceuticals, LLC and Abraxis BioScience, LLC for the research and development facility located at 2045 N. Cornell Avenue, Melrose Park, Illinois |
| |
| 10.9† | | Lease Agreement between Abraxis BioScience, LLC and APP Pharmaceuticals, LLC for the premises located at 3159 Staley Road, Grand Island, New York |
| |
| 10.10 | | Form of Indemnification Agreement between the Registrant and each of its executive officers and directors (Incorporated by reference to Registrant’s Registration Statement filed on Form S-1/A, file number 333-70900, filed with the Securities and Exchange Commission on November 20, 2001) |
| | |
Exhibit
Number | | Description |
| 10.11 | | 1997 Stock Option Plan (Incorporated by reference to the Registrant’s Registration Statement filed on Form S-1, file number 333-70900, filed with the Securities and Exchange Commission on October 3, 2001) |
| |
| 10.12 | | 2001 Stock Incentive Plan, including forms of agreements thereunder (Incorporated by reference to the Registrant’s Definitive Proxy Statement on Form 14A filed with the Securities and Exchange Commission on April 29, 2005) |
| |
| 10.13 | | 2001 Employee Stock Purchase Plan, including forms of agreements thereunder (Incorporated by reference to the Registrant’s Registration Statement filed on Form S-1, file number 333-70900, filed with the Securities and Exchange Commission on October 3, 2001) |
| |
| 10.14 | | Lease Agreement between Manufacturers Life Insurance Company (U.S.A.) and the Registrant for 1501 E. Woodfield Road, Suite 300 East Schaumburg, Illinois, known as Schaumburg Corporate Center (Incorporated by reference to the Registrant’s Current Report on Form 8-K filed with the Securities and Exchange Commission on February 23, 2005) |
| |
| 10.15 | | Description of Non-Employee Director Cash Compensation Program (Incorporated by reference to the Registrant’s Current Report on Form 8-K filed with the Securities and Exchange Commission on July 25, 2005) |
| |
| 10.16 | | Amended and Restated 2001 Non-Employee Director Option Program (Incorporated by reference to Exhibit 10.26 to the Registrant’s Current Report on Form 8-K filed with the Securities and Exchange Commission on July 25, 2005) |
| |
| 10.17 | | Purchase and Sale Agreement, dated April 24, 2006, between the Registrant and Pfizer, Inc. (Incorporated by reference to Exhibit 10.26 to the Registrant’s Quarterly Report on Form 10-Q filed with the Securities and Exchange Commission on May 10, 2006) |
| |
| 10.18* | | Asset Purchase Agreement, dated April 26, 2006, between the Registrant and AstraZeneca UK Limited (Incorporated by reference to Exhibit 10.14 to the Registrant’s Quarterly Report on Form 10-Q/A filed with the Securities and Exchange Commission on August 10, 2006) |
| |
| 10.19* | | Amended to the Asset Purchase Agreement, dated June 28, 2006, between the Registrant and AstraZeneca UK Limited (Incorporated by reference to Exhibit 10.15 to the Registrant’s Quarterly Report on Form 10-Q/A filed with the Securities and Exchange Commission on August 10, 2006) |
| |
| 10.20* | | Manufacturing and Supply Agreement, dated June 28, 2006, between the Registrant and AstraZeneca LP. (Incorporated by reference to Exhibit 10.17 to the Registrant’s Quarterly Report on Form 10-Q/A filed with the Securities and Exchange Commission on August 10, 2006) |
| |
| 10.21* | | Manufacturing and Supply Agreement, dated June 28, 2006, between the Registrant and AstraZeneca Pharmaceuticals LP. (Incorporated by reference to Exhibit 10.18 to the Registrant’s Quarterly Report on Form 10-Q/A filed with the Securities and Exchange Commission on August 10, 2006) |
| |
| 10.22 | | Retention Agreement, dated as of November 20, 2006, between the Registration and Thomas H. Silberg (Incorporated by reference to Exhibit 10.24 to the Registrant’s Annual Report on Form 10-K filed with the Securities and Exchange Commission on March 1, 2007) |
| |
| 10.23 | | Retention Agreement, dated as of November 20, 2006, between the Registration and Frank Harmon (Incorporated by reference to Exhibit 10.25 to the Registrant’s Annual Report on Form 10-K filed with the Securities and Exchange Commission on March 1, 2007) |
| |
| 10.24† | | Credit Agreement, dated November 13, 2007, among the Registrant, APP Pharmaceuticals LLC, APP Pharmaceuticals Manufacturing LLC and the other parties thereto, including an amendment thereto |
| |
| 14.1 | | Code of Business Conduct (Incorporated by reference to Exhibit 14.1 to the Registrant’s Annual Report on Form 10-K filed with the Securities and Exchange Commission on March 1, 2007) |
| | |
Exhibit
Number | | Description |
| 21.1† | | List of Subsidiaries of the Registrant |
| |
| 23.1† | | Consent of Independent Registered Public Accounting Firm |
| |
| 24.1 | | Power of Attorney (included on signature page) |
| |
| 31.1† | | Certification of Chief Executive Officer pursuant to Section 302 of the Sarbanes-Oxley Act of 2002 |
| |
| 31.2† | | Certification of Chief Financial Officer pursuant to Section 302 of the Sarbanes-Oxley Act of 2002 |
| |
| 32.1† | | Certification of Chief Executive Officer pursuant to 18 U.S.C. Section 1350, as adopted by Section 906 of the Sarbanes-Oxley Act of 2002 |
| |
| 32.2† | | Certification of Chief Financial Officer pursuant to 18 U.S.C. Section 1350, as adopted by Section 906 of the Sarbanes-Oxley Act of 2002 |
| * | Certain portions of this exhibit have been omitted pursuant to a request for confidential treatment filed with the Securities and Exchange Commission. |