UNITED STATES
SECURITIES AND EXCHANGE COMMISSION
Washington, D.C. 20549
FORM N-CSR
CERTIFIED SHAREHOLDER REPORT OF REGISTERED
MANAGEMENT INVESTMENT COMPANIES
Investment Company Act file number 811-10401
Trust for Professional Managers
(Exact name of registrant as specified in charter)
615 East Michigan Street
Milwaukee, WI 53202
(Address of principal executive offices) (Zip code)
Jay S. Fitton
U.S. Bancorp Fund Services, LLC
615 East Michigan Street
Milwaukee, WI 53202
(Name and address of agent for service)
(513) 629-8104
Registrant's telephone number, including area code
Date of fiscal year end: December 31, 2022
Date of reporting period: December 31, 2022
Item 1. Reports to Stockholders.

ANNUAL REPORT
DECEMBER 31, 2022
- GROWTH FUND (MPGFX)
est. 1958
- BALANCED FUND (MAPOX)
est. 1961
- SMALL CAP FUND (MSCFX)
est. 2011
- MINNESOTA MUNICIPAL BOND ETF (MINN)
est. 2021
MAIRS & POWER FUNDS MARKET COMMENTARY (unaudited)
December 31, 2022
Firm Update | Remembering Allen Steinkopf
Allen Steinkopf, our friend, partner, and colleague, passed away on December 21, 2022. He played a large role in the success of Mairs & Power during his nine years with the firm. Allen spent time leading the Mairs & Power Small Cap Fund (MSCFX), managing advisory accounts, and providing insightful opinions on companies and investments.
Allen cared deeply about research, managing investments, and learning about the companies in which we invest. He also made sure his clients knew they were valued and appreciated. He brought so much more than his keen intellect and thoughtful analysis. Allen was passionate about coaching and mentoring younger staff to enable them to believe in themselves. He touched people's hearts and changed their lives. He will be greatly missed by all of us who had the privilege of knowing him.
Market Overview | Fourth Quarter 2022
We don't need to tell you that the market had a rough year in 2022. It recovered some in the fourth quarter with a total return (TR) of 7.56% for the S&P 500, 16.01% for the Dow Jones Industrial Average (TR), and 1.80% for the Bloomberg U.S. Government/Credit Bond Index. However, for the full year, those indexes dropped 18.11%, 6.86%, and 13.58%, respectively.
Interest rate increases were a major factor in the market's weak performance in 2022. The Federal Reserve (Fed) has been taking an aggressive approach in battling inflation. Last year, the Fed raised interest rates seven times, including an increase of 50 basis points at its December meeting. The federal funds rate is now at 4.5%, up from near zero a year ago, and the central bank has signaled that it will keep rates higher for longer.
The Fed's interest rate increases have pushed mortgage rates above 6%, compared to 3% at the end of 2021. As a result, the housing market, one of the bellwether measures of economic health, has weakened significantly. Sales of existing homes declined 7.7% in November from the previous month, putting them 40% below the peak in early 2021. That marked 10 months of declines, the longest such streak since 1999.
But despite inflation, the softening housing market, and rapidly climbing interest rates, the U.S. economy has remained remarkably resilient. Just before Christmas, the U.S. Commerce Department released third quarter GDP numbers, which showed growth of 3.2% at an annualized rate, beating consensus expectations of 2.9%. Consumers' financial health also remains fairly positive. We are seeing some increases in default rates, though from historically low levels. The savings rate declined in 2022 to a meager 2%, but the Conference Board, a private research group that tracks consumer confidence, reported that its index jumped from 101.4 in November to 108.3 in December. That's the highest it's been since April. In addition, recently released data from Mastercard shows that retail sales during the holiday season (Nov. 1 to Dec. 24) rose a festive 7.6% over 2021. One key reason for continued consumer confidence is the continued strength of the labor market. In December, a better-than-expected 223,000 jobs were created, and the unemployment rate declined to 3.5%.
GDP is the total monetary or market value of all the finished goods and services produced within a country's borders in a specific time period.
The federal funds rate is an interest rate set by the Federal Reserve to indirectly manage interest rates, inflation, and unemployment.
Future Outlook
However, the housing market's flattening is one sign that we're likely to experience a recession in 2023. Another omen is the recent data from the Purchasing Managers' Index (PMI). In December, the PMI for the services sector dropped to 44.4, versus 46.2 in November. In the manufacturing sector, the PMI was 46.2, down from 47.7 from the previous month, and the composite PMI, which measures all sectors, was 44.6, a decrease from November's 46.4. Any number below 50 indicates contraction in that part of the economy.
1
MAIRS & POWER FUNDS MARKET COMMENTARY (unaudited) (continued)
Despite these warning signs, we're convinced that the labor market will remain tight, thanks to an aging population, accelerated retirements, and lower immigration, among other factors. While there have been some signs of softening, businesses remain desperate for help. Job openings remain at a historically high 10.3 million vacancies. That tightness will likely remain a longer-term challenge for companies in managing labor costs and also presents a challenge to the Fed as it pursues its goal of 2% inflation. Lower unemployment typically results in higher wages, and that means higher prices. There was some helpful news on that front at the end of 2022: Wage growth in December slowed to 0.3% month over month and 4.6% versus a year ago.
There are other signs that inflation, while still high, has begun to come off the boil. Goods inflation, in particular, has rolled over the past few months. While services inflation is proving stickier, we expect that by the middle of this year, falling home prices will put downward pressure there as well. As inflation recedes, so should the upward pressure on interest rates. An end to rate hikes can begin to lay the foundation for renewed economic growth and a better stock market in the back half of 2023. In the meantime, however, the Fed will continue to raise rates. We believe that we're returning to the "old normal" level of interest rates that were common before the Great Recession of 2008-2009.
The tight labor situation, along with the strength of the banking sector and consumer spending, are key reasons why we anticipate that a 2023 recession could be fairly mild.
As for the market, it's likely that economic weakness will result in lower earnings per share this year. In 2022, the market fell much more than earnings, which we estimate grew 5% for the year. Our expectation is that a decline in earnings in 2023 will be relatively modest. Much of last year's market tumble was due to a contraction in valuations, and that's not necessarily a bad thing. In fact, we believe that this contraction should result in a healthier foundation for the market going forward. Over the long term, stocks and earnings travel in tandem. In 2021, stocks got ahead of themselves. Now, with the market having pulled back, we're finding more opportunities for good long-term investments at reasonable valuations.
S&P 500 Total Return (TR) Index is an unmanaged index of 500 common stocks that is generally considered representative of the U.S. stock market. It is not possible to invest directly in an index.
Dow Jones Industrial Average (TR) Index is a price-weighted average of 30 significant stocks traded on the New York Stock Exchange and the NASDAQ,
Bloomberg U.S. Government/Credit Bond Index is a broad-based flagship benchmark that measures the non-securitized component of the U.S. Aggregate Index. It includes investment-grade, U.S. dollar-denominated, fixed-rate Treasuries, government-related and corporate securities. It is not possible to invest directly in an index.
The Purchasing Managers' Index (PMI) is an index that measures the month-over-month change in economic activity within the manufacturing sector.
Basis point is a unit of measure for interest rates and other percentages in finance. One basis point is equal to 1/100th of 1%, or 0.01%, or 0.0001.
Earnings per share (EPS) is a company's net profit divided by the number of common shares it has outstanding.
Past performance is not a guarantee of future results.
2
MAIRS & POWER GROWTH FUND (unaudited)
To Our Shareholders: December 31, 2022
The Mairs & Power Growth Fund (the "Fund") lagged the S&P 500 TR Index for the year. Absolute performance of the Fund was down 21.07% for the year while the index was down 18.11%. The Fund also underperformed its peer group, as measured by the Morningstar Large Blend Category Index, which was down 16.94% for the year.
Stock selection was the primary driver of underperformance as sector selection was a positive relative contributor for the year. Not holding stocks in the Energy sector, which was the top performing sector in 2022, was a significant drag on relative performance. As the post-Covid economy snapped back, oil prices spiked and drove the Energy sector to outperform. But this underperformance due to under allocation in Energy shares was more than offset by positive contributions from underweighting the Consumer Discretionary sector and overweighting the Healthcare and Industrial sectors. Consumer Discretionary stocks struggled to overcome macro-economic concerns, and at the same time, Healthcare benefited as it was seen as a haven from a slowing economy.
Regarding stock selection, the largest detractors from Fund performance were not concentrated in a particular industry. They included Alphabet (formerly Google), Ecolab, and Bio-Techne.
Alphabet (GOOGL) finished down 38.67% for the year. While this was not out of line with some of the other big tech communication services stocks, it still was a significant drag on Fund performance. Fundamental operations at Alphabet slowed somewhat throughout the year, but the bigger headwind appeared to be a reset in the valuations investors were willing to pay for "growthier" stocks. Alphabet started the year at a 20% premium to what was being paid for earnings of the average company in the S&P 500 and ended very close to market multiple.
Bio-Techne (TECHNE) also suffered from a shift away from growth stocks by investors. Despite the company's fundamental outlook improving on a number of future growth initiatives, the stock still finished down 35.70% for the year. The Minnesota company's investments in commercial scale biologic manufacturing and liquid biopsies, as well as ongoing investment in digital connections with customers, positions it well for the long term. A recent significant increase in the National Institute of Health budget for 2023 should also benefit the company in the near term. The Fund has added to the position on the pullback.
Another significant detractor from relative performance was Ecolab (ECL). The Minnesota-based company was down 37.11% for the year. Ecolab suffered from higher input costs due to higher energy prices in 2022. While the company was able to make some positive changes to its supply chain and do some reformulation work, it was not able to overcome the inflationary pressures and, as a result, its margins have suffered. Currency and the European economy have weighed on results as well. Ecolab is a core holding within the Growth Fund, but we are waiting for improvement in organic volume-driven growth before adding to the position.
Toro (TTC) and UnitedHealth Group (UNH) were two of the largest positive contributors to relative performance for the year. Both Minnesota-based companies were up on an absolute basis, with Toro up 14.87% for the year and UnitedHealth up 6.95%. Toro stock continued its long-term outperformance in 2022 as the company's investment in new technologies continues to payoff. The company is seeing good opportunities in both its DitchWitch acquisition, which will benefit from increased infrastructure spending, as well as its internal investment in battery powered tools and equipment.
UnitedHealth performed well as the company's market-leading position in managed care and healthcare technology have provided the scale to outmaneuver smaller competitors. At the same time, its recent investments in OptumHealth, its own health services offering, have paid off handsomely in terms of both revenue growth and profitability.
Both Toro and UnitedHealth remain core holdings at Mairs & Power, but the Fund has trimmed both stocks in 2022 on their positive performance and resultant extended valuations.
It was a disappointing year for the Fund and while a difficult inflationary environment was anticipated, the scale and competitive positions of Fund holdings were expected to put those companies and their stocks in a
3
MAIRS & POWER GROWTH FUND (unaudited) (continued)
good position to weather the inflationary storm. That desire to hold companies with durable competitive positions also steered us to companies that were gaining market share and outgrowing the market. Unfortunately, as these "growthier" stocks fell out of favor in 2022, the result was Fund underperformance. However, this underperformance in stock price, but not necessarily fundamental operations, has resulted in some attractive valuations and investment opportunities. While it is difficult to gauge when the Fed will get inflation under control and investors will become more optimistic about the economy and the stock market, the Fund should be well positioned to take advantage of that change.
Andy Adams
Lead Manager | | Pete Johnson
Co-Manager | |
MAIRS & POWER GROWTH FUND (MPGFX) CONTRIBUTORS
Year To Date (12/31/2021 – 12/31/2022)
Largest Contributors To
Relative Performance | | Largest Detractors To
Relative Performance | |
Digi International, Inc. | | | 48.76 | % | | Amazon.com, Inc. | | | -49.62 | % | |
Eli Lilly & Company | | | 34.24 | % | | Alphabet, Inc. Class C | | | -38.67 | % | |
Principal Financial Group, Inc. | | | 20.05 | % | | QUALCOMM, Inc. | | | -38.61 | % | |
The Toro Company | | | 14.87 | % | | Ecolab, Inc. | | | -37.11 | % | |
UnitedHealth Group, Inc. | | | 6.95 | % | | Bio-Techne Corporation | | | -35.70 | % | |
Largest relative contributors and detractors are securities that were selected based on their contribution to the portfolio as of December 31, 2022. The performance number shown is total return of the security for the period and includes only securities held for the entire period. Total return is the amount of value an investor earns from a security over a specific period and when distributions are reinvested. Past performance does not guarantee future results.
All holdings in the portfolio are subject to change without notice and may or may not represent current or future portfolio composition. The mention of specific securities is not intended as a recommendation or an offer of a particular security, nor is it intended to be a solicitation for the purchase or sale of any security.
All investments have risks. The Growth Fund is designed for long-term investors. Equity investments are subject to market fluctuations and the Fund's share price can fall because of weakness in the broad market, a particular industry or specific holdings. Investments in small and midcap companies generally are more volatile. International investing risks include among others political, social or economic instability, difficulty in predicting international trade patterns, taxation and foreign trading practices and greater fluctuations in price than U.S. corporations.
This commentary includes forward-looking statements such as economic predictions and portfolio manager opinions. The statements are subject to change at any time based on market and other conditions. No predictions, forecasts, outlooks, expectations or beliefs are guaranteed.
S&P 500 Total Return (TR) Index is an unmanaged index of 500 common stocks that is generally considered representative of the U.S. stock market. It is not possible to invest directly in an index.
Morningstar U.S. Fund Large-Blend portfolios are fairly representative of the overall U.S. stock marketing in size, growth rates, and price. Stocks in the top 70% of the capitalization of the U.S equity market are defined as large-cap. The blend style is assigned to portfolios where neither growth nor value characteristics predominate. These portfolios tend to invest across the spectrum of U.S. industries, and owing to their broad exposure, the portfolios' returns are often similar to those of the S&P 500 Index.
4
Mairs & Power Growth Fund
PERFORMANCE INFORMATION (unaudited) December 31, 2022
Ten years of investment performance (through December 31, 2022)
This chart illustrates the performance of a hypothetical $10,000 investment made in the Fund 10 years ago.
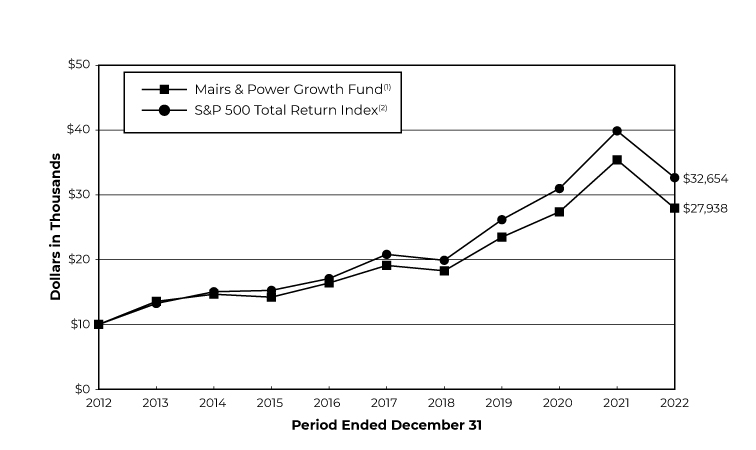
Average annual total returns for periods ended December 31, 2022
| | | 1 year | | 5 years | | 10 years | | 20 years | |
Mairs & Power Growth Fund(1) | | | -21.07 | % | | | 7.89 | % | | | 10.82 | % | | | 9.68 | % | |
S&P 500 Total Return Index(2) | | | -18.11 | % | | | 9.42 | % | | | 12.56 | % | | | 9.80 | % | |
Performance data quoted represents past performance and does not guarantee future results. All performance information shown includes the reinvestment of dividend and capital gain distributions, but does not reflect the deduction of taxes that a shareholder would pay on Fund distributions or the redemption of Fund shares. The investment return and principal value of an investment will fluctuate so that an investor's shares, when redeemed, may be worth more or less than their original cost. Current performance of the Fund may be lower or higher than the performance quoted. For the most recent month-end performance figures, visit the Fund's website at www.mairsandpower.com or call Shareholder Services at (800) 304-7404. Per the Prospectus dated April 20, 2022, the expense ratio for the Fund is 0.61%. See the Financial Highlights in this report for the most recent expense ratio.
(1) Performance figures reflect the historical performance of the Mairs & Power Growth Fund (the "Predecessor Growth Fund"), a series of Mairs & Power Funds Trust, for periods prior to April 29, 2022.
(2) The S&P 500 Total Return Index is an unmanaged index of 500 common stocks that is generally considered representative of the U.S. stock market. It tracks both the capital gains of a group of stocks over time and assumes that any cash distributions, such as dividends, are reinvested back into the index. It is not possible to invest directly in an index.
5
Mairs & Power Growth Fund
FUND INFORMATION (unaudited) December 31, 2022
Portfolio Managers
Andrew R. Adams, CFA, lead manager of the Mairs & Power Growth Fund and Predecessor Growth Fund since April 1, 2019, co-manager from January 1, 2015 through April 1, 2019, University of Wisconsin-Madison, MS Finance 1997
Peter J. Johnson, CFA, co-manager of the Mairs & Power Growth Fund and Predecessor Growth Fund since April 1, 2019, University of Wisconsin-Madison, MBA Applied Security Analysis 2010
General Information
Fund Symbol | | | MPGFX | | |
Net Asset Value (NAV) Per Share | | $ | 118.00 | | |
Expense Ratio | | | 0.63 | % | |
Portfolio Turnover Rate | | | 11.04 | % | |
Sales Charge | | | None1 | | |
Fund Inception Year | | | 1958 | | |
Portfolio Composition
Top Ten Portfolio Holdings
(Percent of Total Net Assets)2
Microsoft Corp | | | 7.8 | % | |
UnitedHealth Group Inc | | | 6.2 | | |
Alphabet Inc | | | 4.9 | | |
Toro Co/The | | | 4.1 | | |
US Bancorp/MN | | | 3.9 | | |
Amazon.com Inc | | | 3.8 | | |
Graco Inc | | | 3.6 | | |
Ecolab Inc | | | 3.5 | | |
Nvidia Corp | | | 3.3 | | |
Bio-Techne Corp | | | 3.0 | | |
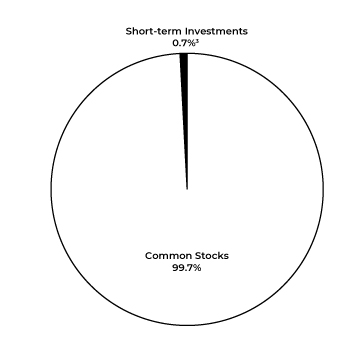
Portfolio Diversification
(Percent of Total Net Assets)
Common Stocks 99.7% | |
Information Technology | | | 26.0 | % | |
Health Care | | | 20.3 | | |
Industrials | | | 19.0 | | |
Financials | | | 10.9 | | |
Materials | | | 7.9 | | |
Communication Services | | | 5.7 | | |
Consumer Discretionary | | | 5.2 | | |
Consumer Staples | | | 4.2 | | |
Utilities | | | 0.5 | | |
Short-term Investments 0.3%3 | | | 0.3 | | |
| | | | 100.0 | % | |
1 Although the Fund is no-load, investment management fees and other expenses still apply.
2 All holdings in the portfolio are subject to change without notice and may or may not represent current or future portfolio composition. The mention of specific securities is not intended as a recommendation or offer for a particular security, nor is it intended to be a solicitation for the purchase or sale of any security.
3 Represents short-term investments and other assets and liabilities (net).
The Schedule of Investments and portfolio diversification utilize the Global Industry Classification Standard (GICS®) which was developed by and/or is the exclusive property of MSCI, Inc. and Standard & Poor's Financial Services LLC ("S&P"). GICS is a service mark of MSCI, Inc. and S&P and has been licensed for use by Mairs & Power, Inc. (the "Adviser").
6
Mairs & Power Growth Fund
SCHEDULE OF INVESTMENTS December 31, 2022
Shares | | Security Description | | Value | |
| | | COMMON STOCKS 99.7% | |
| | | COMMUNICATION SERVICES 5.7% | |
| | 2,381,802 | | | Alphabet Inc (a) | | $ | 211,337,292 | | |
| | 420,000 | | | Walt Disney Co/The (a) | | | 36,489,600 | | |
| | | | 247,826,892 | | |
| | | CONSUMER DISCRETIONARY 5.2% | |
| | 1,958,000 | | | Amazon.com Inc (a) | | | 164,472,000 | | |
| | 157,999 | | | Gentherm Inc (a) | | | 10,315,755 | | |
| | 35,000 | | | Home Depot Inc/The | | | 11,055,100 | | |
| | 218,000 | | | Polaris Inc | | | 22,018,000 | | |
| | 124,306 | | | Target Corp | | | 18,526,566 | | |
| | | | 226,387,421 | | |
| | | CONSUMER STAPLES 4.2% | |
| | 2,621,592 | | | Hormel Foods Corp | | | 119,413,516 | | |
| | 802,000 | | | Sysco Corp | | | 61,312,900 | | |
| | | | 180,726,416 | | |
| | | FINANCIALS 10.9% | |
| | 924,000 | | | Charles Schwab Corp/The | | | 76,932,240 | | |
| | 627,000 | | | JPMorgan Chase & Co | | | 84,080,700 | | |
| | 246,000 | | | Northern Trust Corp | | | 21,768,540 | | |
| | 634,000 | | | Principal Financial Group Inc | | | 53,205,280 | | |
| | 3,871,000 | | | US Bancorp/MN | | | 168,814,310 | | |
| | 1,600,000 | | | Wells Fargo & Co | | | 66,064,000 | | |
| | | | 470,865,070 | | |
| | | HEALTH CARE 20.3% | |
| | 415,212 | | | Abbott Laboratories | | | 45,586,125 | | |
| | 1,554,800 | | | Bio-Techne Corp | | | 128,861,824 | | |
| | 139,000 | | | Eli Lilly & Co | | | 50,851,760 | | |
| | 60,000 | | | Inspire Medical Systems Inc (a) | | | 15,112,800 | | |
| | 674,584 | | | Johnson & Johnson | | | 119,165,264 | | |
| | 1,624,000 | | | Medtronic PLC (b) | | | 126,217,280 | | |
| | 85,061 | | | Neogen Corp (a) | | | 1,295,479 | | |
| | 3,145,000 | | | Roche Holding AG (c) | | | 123,126,750 | | |
| | 506,000 | | | UnitedHealth Group Inc | | | 268,271,080 | | |
| | | | 878,488,362 | | |
| | | INDUSTRIALS 19.0% | |
| | 158,438 | | | 3M Co | | | 18,999,885 | | |
| | 492,000 | | | CH Robinson Worldwide Inc | | | 45,047,520 | | |
| | 49,000 | | | Chart Industries Inc (a) | | | 5,646,270 | | |
| | 1,422,247 | | | Donaldson Co Inc | | | 83,727,681 | | |
| | 1,588,000 | | | Fastenal Co | | | 75,144,160 | | |
| | 130,000 | | | Generac Holdings Inc (a) | | | 13,085,800 | | |
7
Mairs & Power Growth Fund
SCHEDULE OF INVESTMENTS (continued) December 31, 2022
Shares | | Security Description | | Value | |
| | | COMMON STOCKS (continued) | |
| | | INDUSTRIALS (continued) | |
| | 2,295,000 | | | Graco Inc | | $ | 154,361,700 | | |
| | 225,000 | | | Honeywell International Inc | | | 48,217,500 | | |
| | 2,005,659 | | | nVent Electric PLC (b) | | | 77,157,702 | | |
| | 268,000 | | | Rockwell Automation Inc | | | 69,028,760 | | |
| | 937,966 | | | Tennant Co (d) | | | 57,750,566 | | |
| | 1,564,200 | | | Toro Co/The | | | 177,067,440 | | |
| | | | 825,234,984 | | |
| | | INFORMATION TECHNOLOGY 26.0% (f) | |
| | 563,371 | | | Digi International Inc (a) | | | 20,591,210 | | |
| | 693,000 | | | Entegris Inc | | | 45,453,870 | | |
| | 1,031,000 | | | Fiserv Inc (a) | | | 104,203,170 | | |
| | 1,148,700 | | | Jamf Holding Corp (a) | | | 24,467,310 | | |
| | 500,000 | | | Littelfuse Inc | | | 110,100,000 | | |
| | 1,406,000 | | | Microsoft Corp | | | 337,186,920 | | |
| | 341,500 | | | Motorola Solutions Inc | | | 88,007,965 | | |
| | 978,000 | | | NVIDIA Corp | | | 142,924,920 | | |
| | 859,000 | | | QUALCOMM Inc | | | 94,438,460 | | |
| | 413,000 | | | salesforce.com Inc (a) | | | 54,759,670 | | |
| | 290,000 | | | Visa Inc | | | 60,250,400 | | |
| | 545,857 | | | Workiva Inc (a) | | | 45,835,612 | | |
| | | | 1,128,219,507 | | |
| | | MATERIALS 7.9% | |
| | 1,039,000 | | | Ecolab Inc | | | 151,236,840 | | |
| | 1,324,827 | | | HB Fuller Co | | | 94,884,110 | | |
| | 403,953 | | | Sherwin-Williams Co/The | | | 95,870,165 | | |
| | | | 341,991,115 | | |
| | | UTILITIES 0.5% | |
| | 429,000 | | | Alliant Energy Corp | | | 23,685,090 | | |
| | | | | TOTAL COMMON STOCKS
(cost $2,442,226,500) | | $ | 4,323,424,857
| | |
| | | SHORT-TERM INVESTMENTS 0.1% | |
| 4,713,004 | | | First American Government Obligations Fund, Class X, 0.0407% (e)
(cost $4,713,004) | | $ | 4,713,004 | | |
| | | | TOTAL INVESTMENTS 99.8%
(cost $2,446,939,504) | | $ | 4,328,137,861 | | |
| | | | | OTHER ASSETS AND LIABILITIES (NET) 0.2% | | | 8,347,803 | | |
| | | | | TOTAL NET ASSETS 100.0% | | $ | 4,336,485,664 | | |
8
Mairs & Power Growth Fund
SCHEDULE OF INVESTMENTS (continued) December 31, 2022
(a) Non-income producing.
(b) Issuer headquartered overseas but considered domestic. The Adviser defines foreign issuers as those whose operational leadership or headquarters is located in a foreign country; provided, however, if an issuer is believed by the Adviser to be headquartered in a jurisdiction primarily for tax purposes, the Adviser will consider the following additional factors: 1) the location of the primary exchange trading its securities; 2) where it derives the majority of its revenues; and/or 3) where it earns the majority of its profits.
(c) American Depositary Receipt
(d) Affiliated company at December 31, 2022.
(e) The rate quoted is the annualized seven-day effective yield as of December 31, 2022.
The Global Industry Classification Standard (GICS®) was developed by and/or is the exclusive property of MSCI, Inc. and Standard & Poor's Financial Services LLC ("S&P"). GICS is a service mark of MSCI, Inc. and S&P and has been licensed for use by the Adviser.
(f) The Fund is significantly invested in the information technology sector and therefore is subject to additional risks. Companies in the information technology sector and companies that rely heavily on technology are particularly vulnerable to rapid changes in technology product cycles, rapid product obsolescence, government regulation and competition.
See accompanying Notes to Financial Statements.
9
MAIRS & POWER BALANCED FUND (unaudited)
To Our Shareholders: December 31, 2022
The Mairs & Power Balanced Fund (the "Fund") finished 2022 down 14.91%. The Fund outperformed the benchmark composite index (60% S&P 500 Total Return Index and 40% Bloomberg US Government/Credit Bond Index), which lost 16.00%, while the Morningstar US Fund Allocation 50%-70% peer group fell 13.84%.
The year 2022 now holds the distinction of being the only year in the last 150 years where both stocks and bonds fell more than 10%; here's to hoping that it remains that way for the next 150 years as well. We also hope this is the last time a bond discussion comes first as this is not the norm.
Historically, bond returns have helped smooth the volatile nature of stock returns. However, with the Federal Reserve-induced return to normalcy in rates compared to the low interest rate environment which has prevailed since the Great Financial Crisis of 2008-2009, we are experiencing the painful withdrawals after years of cheap credit. With an increase in rates and more reasonable expected return on fixed income going forward, the standard 60-40 portfolio of stocks and bonds should have greater ability to help mitigate volatility in downturns.
Our fixed income portfolio outperformed the Bloomberg U.S. Government/Credit Bond Index since it maintained a duration short of the index which more than offset the portfolio's overweight to corporate credit. The Federal Reserve (Fed) continues raising the federal funds rate and is backing off its bond purchasing program, which has contributed to higher interest rates and worsening liquidity in the marketplace. The 10-year treasury yield rose from 1.51% at the end of 2021 to 3.88% at the end of 2022. Credit spreads widened since the beginning of the year, which indicates the market believes we will return to a more normalized credit environment. Our focus has been, and will continue to be, to selectively underwrite companies to achieve long-term outperformance.
Investors may be aware of our long-term equity investment strategy, which seeks to identify companies with durable competitive advantages, buy them at attractive valuations, and hold them for the long-run returns. Our equity portfolio outperformed the S&P 500 in 2022.
The Fund's underweight to Technology had a pronounced positive impact on relative equity returns in 2022, and selection within the Technology sector added to performance with our focus on robust cash flow generating companies.
Motorola Solutions (MSI) provided positive relative returns as it proved its operating model's strength with robust sales and bookings as municipalities consistently invest in advanced communications systems for first responders. Fiserv (FISV) and Visa (V) outperformed as well given a rebound in consumer spending and cross-border travel. Also contributing positively to returns was the general lack of Technology names carrying extended valuations fueled by the recent low interest rate environment.
Consumer Discretionary outperformed meaningfully primarily due to the Fund's underweight to the sector. Selection was also positive, as the Fund's two traditional retailer holdings, Home Depot (HD) and Target (TGT), outperformed the sector.
Given our regional tilt, the Fund continues to have an outsized exposure to industrial companies given their preponderance in the Upper Midwest. This overweight to Industrials helped performance while the selection of companies within the sector offset that slightly. Toro Company (TTC) was a shining star, accounting for nearly all sector outperformance as the company's innovations around autonomy and electrification continue to connect with the commercial landscaping and consumer end markets. Several companies that had performed well in recent years – Fastenal (FAST), Rockwell Automation (ROK), and UPS (UPS) – dragged on returns, but we continue to have a favorable long-term view of these holdings.
Communication Services benefited primarily from what the Fund avoided, namely social media and streaming companies. As mentioned in prior reports, Activision's (ATVI) sale announcement positively affected performance early in the year, and the Fund has since exited the position. These benefits were largely offset by
10
MAIRS & POWER BALANCED FUND (unaudited) (continued)
Alphabet (GOOG), the portfolio's largest holding, which lagged the market due to concerns around advertising trends in the face of a potential recession.
The lack of Energy holdings in the portfolio hurt performance for the year, but we have concluded commodity-driven energy firms cannot build sustainable durable competitive advantages, so we continue to seek opportunities to participate in the sector through firms with lower commodity dependence.
Materials was a large detractor to returns in 2022, as the Fund's holdings face short- term pressure partly due to the hydrocarbon price increases. The value-add portion of the supply chain, which is one step removed from commoditized materials, experienced significant cost pressure, including the Fund's two largest Materials holdings, Ecolab (ECL) and Sherwin Williams (SHW).
Financials had a small negative impact on returns as our near market weight was offset by negative selection effects. Notably, our recent addition of Northern Trust Corporation (NTRS) was ill-timed as the weak financial markets, combined with cost increases, impacted margins. We are confident in the company's long-term business model built on recurring revenues and an impressive record of client service allowing it to continue to execute well into the future. Positively, Principal Financial Group (PFG) benefited performance as it showed strength in asset management flows and a quality risk profile for its insurance business.
Asset allocation detracted from performance as stock returns in the Fund lagged bond returns for the year. As highlighted previously, the outperformance of stocks in the Fund compared to the index more than offset the overallocation to equities.
Lastly, we would like to make note of a shift in sector classification to take place next year. It will affect several of our names and will noticeably decrease our Technology exposure. Visa (V), Fiserv (FISV), and ADP (ADP) are all moving out of the Technology sector in March 2023, where those names account for about a quarter of the Fund's current Technology exposure.
Kevin Earley
Lead Manager | | Robert Thompson
Co-Manager | |
MAIRS & POWER BALANCED FUND (MAPOX) CONTRIBUTORS
Year To Date (12/31/2021 – 12/31/2022)
Largest Contributors
To Relative Performance | | Largest Detractors
To Relative Performance | |
Eli Lilly & Company | | | 34.24 | % | | Alphabet Inc. Class C | | | -38.67 | % | |
Hershey Company | | | 21.86 | % | | QUALCOMM, Inc. | | | -38.61 | % | |
Principal Financial Group, Inc. | | | 20.05 | % | | Ecolab, Inc. | | | -37.11 | % | |
The Toro Company | | | 14.87 | % | | Sherwin-Williams Company | | | -31.96 | % | |
UnitedHealth Group, Inc. | | | 6.95 | % | | U.S. Bancorp | | | -19.12 | % | |
Largest relative contributors and detractors are securities that were selected based on their contribution to the portfolio as of December 31, 2022. The performance number shown is total return of the security for the period and includes only securities held for the entire period. Total return is the amount of value an investor earns from a security over a specific period and when distributions are reinvested. Past performance does not guarantee future results.
Duration is a measure of the sensitivity of the price of a bond or other debt instrument to a change in interest rates.
Basis point is a unit of measure for interest rates and other percentages in finance. One basis point is equal to 1/100th of 1%, or 0.01%, or 0.0001.
11
MAIRS & POWER BALANCED FUND (unaudited) (continued)
All holdings in the portfolio are subject to change without notice and may or may not represent current or future portfolio composition. The mention of specific securities is not intended as a recommendation or an offer of a particular security, nor is it intended to be a solicitation for the purchase or sale of any security.
All investments have risks. The Balanced Fund is designed for long-term investors. The Fund's share price can fall because of weakness in the broad market, a particular industry or specific holdings. Investments in small and midcap companies generally are more volatile. International investing risks include among others political, social or economic instability, difficulty in predicting international trade patterns, taxation and foreign trading practices and greater fluctuations in price than U.S. corporations. The Balanced Fund is subject to yield and share price variances with changes in interest rates and market conditions. Investors should note that if interest rates rise significantly from current levels, bond total returns will decline and may even turn negative in the short-term. There is also a chance that some of the Balanced Fund's holdings may have their credit rating downgraded or may default.
Investments in debt securities typically decrease in value when interest rates rise. This risk is usually greater for longer-term debt securities. Investments in lower rated and non-rated securities present a greater risk of loss to principal and interest than higher rated securities.
This commentary includes forward-looking statements such as economic predictions and portfolio manager opinions. The statements are subject to change at any time based on market and other conditions. No predictions, forecasts, outlooks, expectations or beliefs are guaranteed.
Composite Index reflects an unmanaged portfolio of 60% of the S&P 500 TR Index and 40% of the Bloomberg Barclays U.S. Government/Credit Bond Index. It is not possible to invest directly in an index.
Morningstar US Fund Allocation – 50%-70% Equity Category is designed to benchmark target-date and target-risk investment products. Index is based on well-established asset allocation methodology from Ibbotson Associates, a Morningstar company. Index has 60% global equity exposure and 40% global bond exposure. It is not possible to invest directly in an index.
S&P 500 Total Return (TR) Index is an unmanaged index of 500 common stocks that is generally considered representative of the U.S. stock market. It is not possible to invest directly in an index.
Bloomberg U.S. Government/Credit Bond Index is a broad-based flagship benchmark that measures the non-securitized component of the U.S. Aggregate Index. It includes investment-grade, U.S. dollar-denominated, fixed-rate Treasuries, government-related and corporate securities. It is not possible to invest directly in an index.
12
Mairs & Power Balanced Fund
PERFORMANCE INFORMATION (unaudited) December 31, 2022
Ten years of investment performance (through December 31, 2022)
This chart illustrates the performance of a hypothetical $10,000 investment made in the Fund 10 years ago.
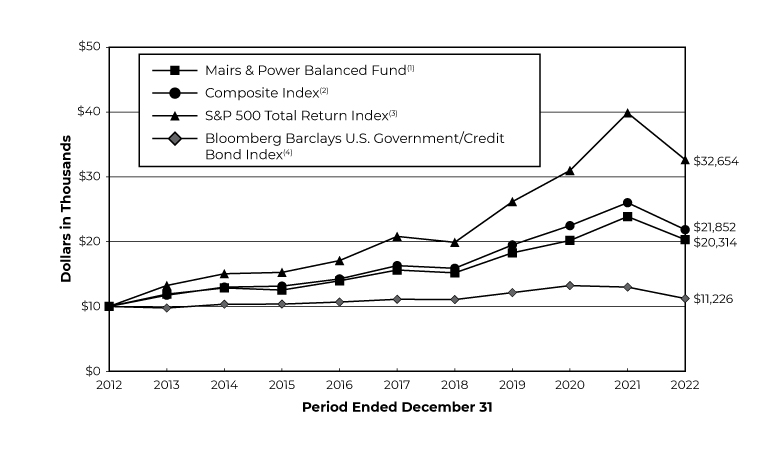
Average annual total returns for periods ended December 31, 2022
| | | 1 year | | 5 years | | 10 years | | 20 years | |
Mairs & Power Balanced Fund(1) | | | -14.91 | % | | | 5.39 | % | | | 7.34 | % | | | 7.81 | % | |
Composite Index(2) | | | -16.00 | % | | | 6.03 | % | | | 8.13 | % | | | 7.39 | % | |
S&P 500 Total Return Index(3) | | | -18.11 | % | | | 9.42 | % | | | 12.56 | % | | | 9.80 | % | |
Bloomberg U.S. Government/
Credit Bond Index(4) | | | -13.58 | % | | | 0.21 | % | | | 1.16 | % | | | 3.18 | % | |
Performance data quoted represents past performance and does not guarantee future results. All performance information shown includes the reinvestment of dividend and capital gain distributions, but does not reflect the deduction of taxes that a shareholder would pay on Fund distributions or the redemption of Fund shares. The investment return and principal value of an investment will fluctuate so that an investor's shares, when redeemed, may be worth more or less than their original cost. Current performance of the Fund may be lower or higher than the performance quoted. For the most recent month-end performance figures, visit the Fund's website at www.mairsandpower.com or call Shareholder Services at (800) 304-7404. Per the Prospectus dated April 20, 2022, the expense ratio for the Fund is 0.69%. See the Financial Highlights in this report for the most recent expense ratio.
(1) Performance figures reflect the historical performance of the Mairs & Power Balanced Fund (the "Predecessor Balanced Fund"), a series of Mairs & Power Funds Trust, for periods prior to April 29, 2022.
(2) The Composite Index reflects an unmanaged portfolio comprised of 60% of the S&P 500 Total Return Index and 40% of the Bloomberg Barclays U.S. Government/Credit Bond Index. It is not possible to invest directly in an index.
(3) The S&P 500 Total Return Index is an unmanaged index of 500 common stocks that is generally considered representative of the U.S. stock market. It tracks both the capital gains of a group of stocks over time and assumes that any cash distributions, such as dividends, are reinvested back into the index. It is not possible to invest directly in an index.
(4) The Bloomberg U.S. Government/Credit Bond Index is a broad-based flagship benchmark that measures the non-securitized component of the U.S. Aggregate Index. It includes investment-grade, U.S. dollar-denominated, fixed-rate Treasuries, government-related and corporate securities. It is not possible to invest directly in an index.
13
Mairs & Power Balanced Fund
FUND INFORMATION (unaudited) December 31, 2022
Portfolio Managers
Kevin V. Earley, CFA, lead manager of the Mairs & Power Balanced Fund and Predecessor Balanced Fund since April 1, 2018, co-manager from January 1, 2015 through April 1, 2018, University of Minnesota, MBA Finance 1990
Robert W. Thompson, CFA, co-manager of the Mairs & Power Balanced Fund and Predecessor Balanced Fund since April 1, 2018, University of Minnesota, MBA Finance 1995
General Information
Fund Symbol | | | MAPOX | | |
Net Asset Value (NAV) Per Share | | $ | 93.06 | | |
Expense Ratio | | | 0.69 | % | |
Portfolio Turnover Rate | | | 9.68 | % | |
Sales Charge | | | None1 | | |
Fund Inception Year | | | 1961 | | |
Portfolio Composition
Top Ten Common Stock Holdings
(Percent of Total Net Assets)2
Microsoft Corp | | | 3.8 | % | |
Alphabet Inc | | | 3.4 | | |
Eli Lilly & Co | | | 2.5 | | |
UnitedHealth Group Inc | | | 2.5 | | |
Abbott Laboratories | | | 2.4 | | |
Toro Co/The | | | 2.4 | | |
US Bancorp/MN | | | 2.4 | | |
JP Morgan Chase & Co | | | 2.2 | | |
Fiserv Inc | | | 2.1 | | |
Graco Inc | | | 2.0 | | |
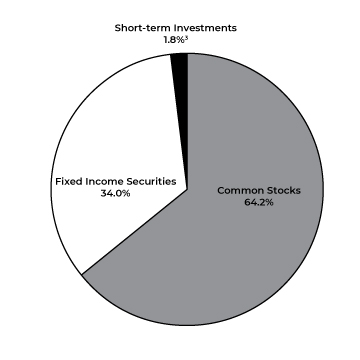
Portfolio Diversification
(Percent of Total Net Assets)
Fixed Income Securities 33.8% | |
Corporate Bonds | | | 29.0 | % | |
U.S. Government Obligations | | | 2.2 | | |
Asset Backed Securities | | | 1.5 | | |
Municipal Bonds | | | 1.1 | | |
Common Stocks 65.2% | |
Health Care | | | 15.4 | | |
Information Technology | | | 14.9 | | |
Industrials | | | 10.6 | | |
Financials | | | 8.5 | | |
Consumer Staples | | | 4.2 | | |
Materials | | | 4.2 | | |
Communications Services | | | 4.1 | | |
Consumer Discretionary | | | 2.4 | | |
Utilities | | | 0.9 | | |
Short-term Investments 1.0%3 | | | 1.0 | | |
| | | | 100.0 | % | |
1 Although the Fund is no-load, investment management fees and other expenses still apply.
2 All holdings in the portfolio are subject to change without notice and may or may not represent current or future portfolio composition. The mention of specific securities is not intended as a recommendation or offer for a particular security, nor is it intended to be a solicitation for the purchase or sale of any security.
3 Represents short-term investments and other assets and liabilities (net).
The Schedule of Investments and portfolio diversification utilize the Global Industry Classification Standard (GICS®) which was developed by and/or is the exclusive property of MSCI, Inc. and Standard & Poor's Financial Services LLC ("S&P"). GICS is a service mark of MSCI, Inc. and S&P and has been licensed for use by Mairs & Power, Inc. (the "Adviser").
14
Mairs & Power Balanced Fund
SCHEDULE OF INVESTMENTS December 31, 2022
Par Value | | Security Description | | Value | |
| | | FIXED INCOME SECURITIES 33.8% | |
| | | CORPORATE BONDS 29.0% | |
| | | COMMUNICATION SERVICES 1.1% | |
$ | 1,688,000 | | | Netflix Inc | | | 5.875 | % | | 11/15/28 | | $ | 1,715,059 | | |
| | 2,000,000 | | | Comcast Corp | | | 4.250 | % | | 01/15/33 | | | 1,893,924 | | |
| | 1,000,000 | | | Verizon Communications Inc | | | 4.400 | % | | 11/01/34 | | | 922,984 | | |
| | 1,880,000 | | | Cox Communications Inc (b) | | | 4.800 | % | | 02/01/35 | | | 1,679,488 | | |
| | 3,000,000 | | | AT&T Inc | | | 4.500 | % | | 05/15/35 | | | 2,742,352 | | |
| | | | 8,953,807 | | |
| | | CONSUMER DISCRETIONARY 3.4% | |
| | 1,000,000 | | | General Motors Financial Co Inc | | | 3.950 | % | | 04/13/24 | | | 981,134 | | |
| | 250,000 | | | General Motors Co | | | 4.000 | % | | 04/01/25 | | | 244,238 | | |
| | 1,000,000 | | | General Motors Financial Co Inc | | | 4.300 | % | | 07/13/25 | | | 970,373 | | |
| | 1,064,000 | | | Block Financial LLC | | | 5.250 | % | | 10/01/25 | | | 1,063,638 | | |
| | 1,500,000 | | | Ford Motor Co | | | 4.346 | % | | 12/08/26 | | | 1,426,981 | | |
| | 1,000,000 | | | Darden Restaurants Inc | | | 3.850 | % | | 05/01/27 | | | 956,679 | | |
| | 2,245,000 | | | Lear Corp | | | 3.800 | % | | 09/15/27 | | | 2,093,134 | | |
| | 1,000,000 | | | General Motors Co | | | 4.200 | % | | 10/01/27 | | | 943,465 | | |
| | 1,000,000 | | | AutoNation Inc | | | 3.800 | % | | 11/15/27 | | | 911,093 | | |
| | 2,000,000 | | | Hasbro Inc | | | 3.900 | % | | 11/19/29 | | | 1,786,491 | | |
| | 2,000,000 | | | Advance Auto Parts Inc | | | 3.900 | % | | 04/15/30 | | | 1,762,358 | | |
| | 2,000,000 | | | Mohawk Industries Inc | | | 3.625 | % | | 05/15/30 | | | 1,732,515 | | |
| | 2,000,000 | | | Block Financial LLC | | | 3.875 | % | | 08/15/30 | | | 1,759,593 | | |
| | 1,000,000 | | | Kohl's Corp (a) | | | 3.625 | % | | 05/01/31 | | | 701,380 | | |
| | 1,750,000 | | | Ford Motor Credit Co LLC | | | 3.625 | % | | 06/17/31 | | | 1,378,278 | | |
| | 1,000,000 | | | Starbucks Corp | | | 3.000 | % | | 02/14/32 | | | 857,562 | | |
| | 500,000 | | | Tapestry Inc | | | 3.050 | % | | 03/15/32 | | | 391,606 | | |
| | 500,000 | | | Ford Motor Co | | | 6.100 | % | | 08/19/32 | | | 463,524 | | |
| | 2,000,000 | | | eBay, Inc | | | 6.300 | % | | 11/22/32 | | | 2,091,741 | | |
| | 500,000 | | | Kohl's Corp | | | 6.875 | % | | 12/15/37 | | | 391,757 | | |
| | 1,000,000 | | | General Motors Co | | | 5.150 | % | | 04/01/38 | | | 870,157 | | |
| | 1,000,000 | | | Ford Motor Co | | | 4.750 | % | | 01/15/43 | | | 720,491 | | |
| | 1,100,000 | | | Whirlpool Corp | | | 5.150 | % | | 03/01/43 | | | 963,146 | | |
| | 750,000 | | | Hasbro Inc | | | 5.100 | % | | 05/15/44 | | | 645,830 | | |
| | 1,073,000 | | | Kohl's Corp | | | 5.550 | % | | 07/17/45 | | | 677,921 | | |
| | | | 26,785,085 | | |
| | | CONSUMER STAPLES 1.3% | |
| | 2,500,000 | | | Land O' Lakes Inc (b) (c) | | | 7.250 | % | | 04/04/27 | | | 2,150,000 | | |
| | 1,949,000 | | | Land O' Lakes Capital Trust I | | | 7.450 | % | | 03/15/28 | | | 1,910,020 | | |
| | 2,500,000 | | | Land O' Lakes Inc (b) (c) | | | 7.000 | % | | 09/18/28 | | | 2,204,063 | | |
| | 250,000 | | | Smithfield Foods Inc (b) | | | 3.000 | % | | 10/15/30 | | | 191,019 | | |
| | 1,000,000 | | | Walgreens Boots Alliance Inc | | | 4.500 | % | | 11/18/34 | | | 880,322 | | |
15
Mairs & Power Balanced Fund
SCHEDULE OF INVESTMENTS (continued) December 31, 2022
Par Value | | Security Description | | Value | |
| | | FIXED INCOME SECURITIES (continued) | |
| | | CORPORATE BONDS (continued) | |
| | | CONSUMER STAPLES (continued) | |
$ | 1,000,000 | | | Anheuser-Busch Cos LLC / Anheuser-Busch InBev
Worldwide Inc | | | 4.700 | % | | 02/01/36 | | $ | 950,952 | | |
| | 1,000,000 | | | Walgreens Boots Alliance Inc | | | 4.800 | % | | 11/18/44 | | | 846,304 | | |
| | 1,000,000 | | | Molson Coors Brewing Co | | | 4.200 | % | | 07/15/46 | | | 785,028 | | |
| | | | 9,917,708 | | |
| | | CONSUMER, NON-CYCLICAL 0.1% | |
| | 1,000,000 | | | Wildlife Conservation Society | | | 3.414 | % | | 08/01/50 | | | 686,217 | | |
| | | | 686,217 | | |
| | | ENERGY 0.5% | |
| | 1,500,000 | | | Sunoco Logistics Partners Operations LP | | | 3.450 | % | | 01/15/23 | | | 1,498,768 | | |
| | 1,000,000 | | | Boardwalk Pipelines LP | | | 4.950 | % | | 12/15/24 | | | 989,185 | | |
| | 1,200,000 | | | Kinder Morgan Inc | | | 5.300 | % | | 12/01/34 | | | 1,131,602 | | |
| | 500,000 | | | Murphy Oil Corp (a) | | | 6.125 | % | | 12/01/42 | | | 393,790 | | |
| | | | 4,013,345 | | |
| | | FINANCIALS 10.9% | |
| | 1,000,000 | | | Standard Chartered PLC (b) (d) | | | 3.950 | % | | 01/11/23 | | | 999,567 | | |
| | 500,000 | | | First American Financial Corp | | | 4.300 | % | | 02/01/23 | | | 499,505 | | |
| | 374,000 | | | Assurant Inc | | | 4.200 | % | | 09/27/23 | | | 369,942 | | |
| | 500,000 | | | CNA Financial Corp | | | 7.250 | % | | 11/15/23 | | | 510,612 | | |
| | 500,000 | | | Pacific Life Insurance Co | | | 7.900 | % | | 12/30/23 | | | 509,676 | | |
| | 1,000,000 | | | HSBC Holdings PLC (d) | | | 4.250 | % | | 03/14/24 | | | 983,035 | | |
| | 540,000 | | | Wintrust Financial Corp | | | 5.000 | % | | 06/13/24 | | | 535,135 | | |
| | 824,000 | | | Assured Guaranty US Holdings Inc | | | 5.000 | % | | 07/01/24 | | | 823,493 | | |
| | 3,088,000 | | | Legg Mason Inc | | | 3.950 | % | | 07/15/24 | | | 3,026,814 | | |
| | 1,500,000 | | | Symetra Financial Corp | | | 4.250 | % | | 07/15/24 | | | 1,472,471 | | |
| | 1,000,000 | | | Citigroup Inc | | | 4.000 | % | | 08/05/24 | | | 982,605 | | |
| | 3,000,000 | | | Synchrony Financial | | | 4.250 | % | | 08/15/24 | | | 2,934,247 | | |
| | 2,000,000 | | | Old Republic International Corp | | | 4.875 | % | | 10/01/24 | | | 1,990,485 | | |
| | 1,627,000 | | | Associated Banc-Corp | | | 4.250 | % | | 01/15/25 | | | 1,584,666 | | |
| | 4,000,000 | | | Kemper Corp | | | 4.350 | % | | 02/15/25 | | | 3,880,850 | | |
| | 1,050,000 | | | TCF National Bank | | | 4.600 | % | | 02/27/25 | | | 1,028,351 | | |
| | 1,000,000 | | | BBVA USA | | | 3.875 | % | | 04/10/25 | | | 975,659 | | |
| | 250,000 | | | Liberty Mutual Insurance Co (b) | | | 8.500 | % | | 05/15/25 | | | 261,549 | | |
| | 1,000,000 | | | Prudential Insurance Co of America/The (b) | | | 8.300 | % | | 07/01/25 | | | 1,058,812 | | |
| | 1,000,000 | | | Synchrony Financial | | | 4.500 | % | | 07/23/25 | | | 960,844 | | |
| | 2,000,000 | | | Janus Capital Group Inc | | | 4.875 | % | | 08/01/25 | | | 1,970,269 | | |
| | 2,000,000 | | | HSBC Holdings PLC (d) | | | 4.250 | % | | 08/18/25 | | | 1,927,464 | | |
| | 20,000 | | | Wells Fargo & Co (c) | | | 4.70 | % | | 12/15/25 | | | 367,800 | | |
| | 1,520,000 | | | Legg Mason Inc | | | 4.750 | % | | 03/15/26 | | | 1,526,427 | | |
| | 1,000,000 | | | Hanover Insurance Group Inc/The | | | 4.500 | % | | 04/15/26 | | | 980,753 | | |
16
Mairs & Power Balanced Fund
SCHEDULE OF INVESTMENTS (continued) December 31, 2022
Par Value | | Security Description | | Value | |
| | | FIXED INCOME SECURITIES (continued) | |
| | | CORPORATE BONDS (continued) | |
| | | FINANCIALS (continued) | |
$ | 1,000,000 | | | Wells Fargo & Co | | | 4.100 | % | | 06/03/26 | | $ | 970,308 | | |
| | 3,290,000 | | | Old Republic International Corp | | | 3.875 | % | | 08/26/26 | | | 3,122,847 | | |
| | 500,000 | | | Morgan Stanley | | | 4.350 | % | | 09/08/26 | | | 486,568 | | |
| | 1,000,000 | | | JPMorgan Chase & Co | | | 4.125 | % | | 12/15/26 | | | 968,731 | | |
| 4,000,000
| | | PNC Financial Services Group Inc/The (c) (i)
| | | 3.400% (5 Year
CMT Rate +
2.595%) | | |
09/15/26 | | | 3,180,000 | | |
| | 4,000,000 | | | Mercury General Corp | | | 4.400 | % | | 03/15/27 | | | 3,751,682 | | |
| | 450,000 | | | Athene Holding Ltd (d) | | | 4.125 | % | | 01/12/28 | | | 415,424 | | |
| 500,000
| | | Citigroup Inc (i)
| | | 3.070% (SOFR +
1.280%) | | |
02/24/28 | | | 452,119 | | |
| | 250,000 | | | Provident Cos Inc | | | 7.250 | % | | 03/15/28 | | | 263,627 | | |
| | 2,000,000 | | | E*TRADE Financial Corp | | | 4.500 | % | | 06/20/28 | | | 1,952,143 | | |
| | 500,000 | | | Farmers Exchange Capital | | | 7.050 | % | | 07/15/28 | | | 514,897 | | |
| | 1,000,000 | | | Lazard Group LLC | | | 4.375 | % | | 03/11/29 | | | 927,811 | | |
| | 2,500,000 | | | Wintrust Financial Corp | | | 4.850 | % | | 06/06/29 | | | 2,275,707 | | |
| | 2,300,000 | | | Assurant Inc | | | 3.700 | % | | 02/22/30 | | | 1,958,217 | | |
| 4,000,000
| | | Capital One Financial Corp. (i)
| | | 5.247% (SOFR +
2.600%) | | |
07/26/30 | | | 3,826,227 | | |
| 500,000
| | | Park National Corp (i)
| | | 4.500% (TSFR3M +
4.390%) | | |
09/01/30 | | | 462,655 | | |
| | 500,000 | | | Goldman Sachs Group Inc/The | | | 4.250 | % | | 11/15/30 | | | 455,142 | | |
| | 500,000 | | | Goldman Sachs Group Inc/The | | | 4.000 | % | | 02/15/31 | | | 450,935 | | |
| | 2,000,000 | | | Synchrony Financial | | | 2.875 | % | | 10/28/31 | | | 1,508,986 | | |
| | 1,000,000 | | | Blackstone Holdings Finance Co LLC (b) | | | 2.550 | % | | 03/30/32 | | | 783,428 | | |
| 2,000,000
| | | Goldman Sachs Group Inc/The (i)
| | | 2.650% (SOFR +
1.264%) | | |
10/21/32 | | | 1,589,574 | | |
| | 500,000 | | | Goldman Sachs Group Inc/The | | | 4.300 | % | | 12/15/32 | | | 448,107 | | |
| 1,700,000
| | | Morgan Stanley (i)
| | | 2.943% (SOFR +
1.290%) | | |
01/21/33 | | | 1,384,470 | | |
| 500,000
1,000,000 | | | American Express Co (i)
Bank of America Corp. (i) | | | 4.989% (SOFR +
2.255%)
5.015% (SOFR + | | |
05/26/33
| | | 483,706
| | |
| | | | | | 2.160 | %) | | 07/22/33 | | | 955,572 | | |
| 2,000,000
| | | US Bancorp (i)
| | | 5.850% (SOFR +
2.090%) | | |
10/21/33 | | | 2,089,811 | | |
| | 538,000 | | | Bank of America Corp | | | 4.000 | % | | 08/15/34 | | | 464,729 | | |
| 3,000,000
| | | Fulton Financial Corp (i)
| | | 3.750% (TSFR3M +
2.700%) | | |
03/15/35 | | | 2,465,465 | | |
| 2,150,000
| | | Bank of Montreal (d) (i)
| | | 3.088% (5 Year
CMT Rate +
1.400%) | | |
01/10/37 | | | 1,636,273 | | |
| | 500,000 | | | Principal Financial Group Inc | | | 4.350 | % | | 05/15/43 | | | 414,431 | | |
17
Mairs & Power Balanced Fund
SCHEDULE OF INVESTMENTS (continued) December 31, 2022
Par Value | | Security Description | | Value | |
| | | FIXED INCOME SECURITIES (continued) | |
| | | CORPORATE BONDS (continued) | |
| | | FINANCIALS (continued) | |
$ | 500,000
| | | BAC Capital Trust XIV (c) (i)
| | | 5.169% (3 Month
LIBOR USD +
0.400%) | | |
01/17/23 | | $ | 383,218 | | |
| 2,500,000
| | | M&T Bank Corp (c) (i)
| | | 5.125% (3 Month
LIBOR USD +
3.520%) | | |
11/01/26 | | | 2,157,934 | | |
| 1,000,000
| | | SVB Financial Group (c) (i)
| | | 4.100% (10 Year
CMT Rate +
3.064%) | | |
02/15/31 | | | 577,321 | | |
| 3,000,000
| | | JPMorgan Chase & Co (c) (i)
| | | 3.650% (5 Year
CMT Rate +
2.850%) | | |
06/01/26 | | | 2,576,250 | | |
| 2,000,000
| | | Bank of New York Mellon Corp/The (c) (i)
| | | 3.750% (5 Year
CMT Rate +
2.630%) | | |
12/20/26 | | | 1,615,914 | | |
| 6,000,000
| | | Charles Schwab Corp (c) (i)
| | | 4.000% (10 Year
CMT Rate +
3.079%) | | |
12/01/30 | | | 4,792,200 | | |
| | | | 84,923,460 | | |
| | | HEALTH CARE 0.7% | |
| | 500,000 | | | Wyeth LLC | | | 6.450 | % | | 02/01/24 | | | 509,249 | | |
| | 2,000,000 | | | AbbVie Inc | | | 3.800 | % | | 03/15/25 | | | 1,952,535 | | |
| | 43,000 | | | Bristol-Myers Squibb Co | | | 3.875 | % | | 08/15/25 | | | 41,897 | | |
| | 1,000,000 | | | Cigna Corp | | | 4.500 | % | | 02/25/26 | | | 986,817 | | |
| | 700,000 | | | Zimmer Biomet Holdings Inc | | | 4.250 | % | | 08/15/35 | | | 584,696 | | |
| | 1,400,000 | | | CVS Health Corp | | | 4.780 | % | | 03/25/38 | | | 1,285,462 | | |
| | | | 5,360,656 | | |
| | | INDUSTRIALS 2.7% | |
| | 1,000,000 | | | GATX Corp | | | 3.900 | % | | 03/30/23 | | | 995,696 | | |
| | 1,500,000 | | | Hillenbrand Inc | | | 5.000 | % | | 09/15/26 | | | 1,450,530 | | |
| | 500,000 | | | Toro Co/The | | | 7.800 | % | | 06/15/27 | | | 533,420 | | |
| | 2,000,000 | | | Kennametal Inc | | | 4.625 | % | | 06/15/28 | | | 1,883,206 | | |
| | 3,000,000 | | | Steelcase Inc | | | 5.125 | % | | 01/18/29 | | | 2,617,500 | | |
| | 1,000,000 | | | Oshkosh Corp | | | 3.100 | % | | 03/01/30 | | | 848,531 | | |
| | 1,000,000 | | | Flowserve Corp | | | 3.500 | % | | 10/01/30 | | | 836,708 | | |
| | 3,000,000 | | | Hillenbrand Inc | | | 3.750 | % | | 03/01/31 | | | 2,463,900 | | |
| | 4,000,000 | | | United Rentals North America Inc | | | 3.750 | % | | 01/15/32 | | | 3,268,520 | | |
| | 2,000,000 | | | Eaton Corp | | | 4.000 | % | | 11/02/32 | | | 1,852,819 | | |
| | 1,000,000 | | | GATX Corp | | | 4.900 | % | | 03/15/33 | | | 939,621 | | |
| | 1,000,000 | | | Alcoa Inc | | | 5.950 | % | | 02/01/37 | | | 972,666 | | |
| | 1,400,000 | | | Leidos Holdings Inc | | | 5.950 | % | | 12/01/40 | | | 1,322,565 | | |
| | 1,000,000 | | | FedEx Corp | | | 4.100 | % | | 04/15/43 | | | 790,506 | | |
| | | | 20,776,188 | | |
18
Mairs & Power Balanced Fund
SCHEDULE OF INVESTMENTS (continued) December 31, 2022
Par Value | | Security Description | | Value | |
| | | FIXED INCOME SECURITIES (continued) | |
| | | CORPORATE BONDS (continued) | |
| | | INFORMATION TECHNOLOGY 4.9% | |
$ | 696,000 | | | Dell International LLC / EMC Corp | | | 5.450 | % | | 06/15/23 | | $ | 696,515 | | |
| | 1,031,000 | | | Arrow Electronics Inc | | | 4.000 | % | | 04/01/25 | | | 997,466 | | |
| | 2,000,000 | | | Hewlett Packard Enterprise Co | | | 4.900 | % | | 10/15/25 | | | 1,984,787 | | |
| | 1,000,000 | | | Dell International LLC / EMC Corp | | | 6.020 | % | | 06/15/26 | | | 1,023,614 | | |
| | 2,500,000 | | | Motorola Solutions Inc | | | 4.600 | % | | 02/23/28 | | | 2,431,198 | | |
| | 1,500,000 | | | Trimble Inc | | | 4.900 | % | | 06/15/28 | | | 1,443,580 | | |
| | 1,000,000 | | | Fiserv Inc | | | 4.200 | % | | 10/01/28 | | | 949,832 | | |
| | 3,000,000 | | | Entegris Escrow Corp (b) | | | 4.750 | % | | 04/15/29 | | | 2,741,857 | | |
| | 1,000,000 | | | Juniper Networks Inc | | | 3.750 | % | | 08/15/29 | | | 895,569 | | |
| | 1,000,000 | | | Dell International LLC / EMC Corp | | | 5.300 | % | | 10/01/29 | | | 982,787 | | |
| | 2,000,000 | | | Avnet Inc | | | 3.000 | % | | 05/15/31 | | | 1,562,124 | | |
| | 1,000,000 | | | HP Inc | | | 2.650 | % | | 06/17/31 | | | 784,034 | | |
| | 1,000,000 | | | Autodesk Inc | | | 2.400 | % | | 12/15/31 | | | 806,584 | | |
| | 1,000,000 | | | Magallanes Inc (b) | | | 4.279 | % | | 03/15/32 | | | 827,377 | | |
| | 1,000,000 | | | Avnet Inc | | | 5.500 | % | | 06/01/32 | | | 929,248 | | |
| | 2,000,000 | | | Broadcom Inc | | | 4.300 | % | | 11/15/32 | | | 1,774,892 | | |
| | 3,000,000 | | | Intel Corp | | | 4.000 | % | | 12/15/32 | | | 2,799,374 | | |
| | 2,000,000 | | | HP Inc | | | 5.500 | % | | 01/15/33 | | | 1,890,948 | | |
| | 2,850,000 | | | Leidos Inc | | | 5.500 | % | | 07/01/33 | | | 2,645,769 | | |
| | 1,000,000 | | | Broadcom Inc (b) | | | 3.469 | % | | 04/15/34 | | | 804,295 | | |
| | 1,500,000 | | | Western Union Co/The | | | 6.200 | % | | 11/17/36 | | | 1,503,868 | | |
| | 1,500,000 | | | Broadcom Inc (b) | | | 4.926 | % | | 05/15/37 | | | 1,317,516 | | |
| | 3,000,000 | | | Oracle Corp | | | 3.600 | % | | 04/01/40 | | | 2,240,942 | | |
| | 1,000,000 | | | Dell Inc | | | 5.400 | % | | 09/10/40 | | | 881,710 | | |
| | 1,000,000 | | | Analog Devices Inc | | | 2.800 | % | | 10/01/41 | | | 741,590 | | |
| | 570,000 | | | Discovery Communications LLC | | | 4.950 | % | | 05/15/42 | | | 429,227 | | |
| | 2,000,000 | | | Motorola Solutions Inc | | | 5.500 | % | | 09/01/44 | | | 1,821,586 | | |
| | | | 37,908,289 | | |
| | | MATERIALS 2.4% | |
| | 756,000 | | | Eastman Chemical Co | | | 3.800 | % | | 03/15/25 | | | 734,680 | | |
| | 865,000 | | | Union Carbide Corp | | | 7.500 | % | | 06/01/25 | | | 906,390 | | |
| | 2,000,000 | | | DowDuPont Inc | | | 4.493 | % | | 11/15/25 | | | 1,970,672 | | |
| | 200,000 | | | Worthington Industries Inc | | | 4.550 | % | | 04/15/26 | | | 193,975 | | |
| | 1,500,000 | | | Cabot Corp | | | 3.400 | % | | 09/15/26 | | | 1,390,428 | | |
| | 782,000 | | | HB Fuller Co | | | 4.000 | % | | 02/15/27 | | | 723,636 | | |
| | 3,200,000 | | | HB Fuller Co | | | 4.250 | % | | 10/15/28 | | | 2,842,928 | | |
| | 4,000,000 | | | Cabot Corp | | | 4.000 | % | | 07/01/29 | | | 3,595,667 | | |
| | 1,175,000 | | | Albemarle Wodgina Property Ltd (d) | | | 3.450 | % | | 11/15/29 | | | 1,037,929 | | |
| | 3,000,000 | | | Freeport McMoRan Inc | | | 4.250 | % | | 03/01/30 | | | 2,727,919 | | |
| | 1,250,000 | | | Dow Chemical Co/The | | | 4.250 | % | | 10/01/34 | | | 1,138,996 | | |
19
Mairs & Power Balanced Fund
SCHEDULE OF INVESTMENTS (continued) December 31, 2022
Par Value | | Security Description | | Value | |
| | | FIXED INCOME SECURITIES (continued) | |
| | | CORPORATE BONDS (continued) | |
| | | MATERIALS (continued) | |
$ | 1,000,000 | | | Newmont Mining Corp | | | 4.875 | % | | 03/15/42 | | $ | 918,878 | | |
| | 325,000 | | | Albemarle Corp | | | 5.450 | % | | 12/01/44 | | | 296,612 | | |
| | 250,000 | | | Steel Dynamics Inc | | | 3.250 | % | | 10/15/50 | | | 164,158 | | |
| | | | 18,642,868 | | |
| | | REAL ESTATE 0.0% | |
| | 350,000 | | | CBRE Services Inc | | | 4.875 | % | | 03/01/26 | | | 346,327 | | |
| | | | 346,327 | | |
| | | UTILITIES 1.0% | |
| | 53,000 | | | National Fuel Gas Co | | | 3.750 | % | | 03/01/23 | | | 52,860 | | |
| | 250,000 | | | Jersey Central Power & Light Co (b) | | | 4.300 | % | | 01/15/26 | | | 241,597 | | |
| | 2,000,000 | | | National Fuel Gas Co | | | 3.950 | % | | 09/15/27 | | | 1,852,196 | | |
| | 416,000 | | | Toledo Edison Co (b) | | | 2.650 | % | | 05/01/28 | | | 364,874 | | |
| | 1,000,000 | | | National Fuel Gas Co | | | 4.750 | % | | 09/01/28 | | | 938,548 | | |
| | 2,000,000 | | | Alliant Energy Finance LLC (b) | | | 3.600 | % | | 03/01/32 | | | 1,735,888 | | |
| | 1,165,000 | | | Duke Energy Progress LLC | | | 5.700 | % | | 04/01/35 | | | 1,165,504 | | |
| | 1,080,000 | | | Southwestern Public Service Co | | | 6.000 | % | | 10/01/36 | | | 1,079,738 | | |
| | 1,021,000 | | | Northern Natural Gas Co (b) | | | 4.100 | % | | 09/15/42 | | | 779,748 | | |
| | | | 8,210,953 | | |
| | | TOTAL CORPORATE BONDS | | | 226,524,903 | | |
| | | US GOVERNMENT NOTES/BONDS 2.2% | |
| | 1,000,000 | | | United States Treasury Note/Bond | | | 0.875 | % | | 01/31/24 | | | 959,805 | | |
| | 1,000,000 | | | United States Treasury Note/Bond | | | 0.250 | % | | 03/15/24 | | | 948,574 | | |
| | 3,000,000 | | | United States Treasury Note/Bond | | | 0.750 | % | �� | 03/31/26 | | | 2,692,266 | | |
| | 1,000,000 | | | United States Treasury Note/Bond | | | 0.750 | % | | 04/30/26 | | | 895,234 | | |
| | 1,000,000 | | | United States Treasury Note/Bond | | | 1.125 | % | | 10/31/26 | | | 895,742 | | |
| | 1,000,000 | | | United States Treasury Note/Bond | | | 1.250 | % | | 06/30/28 | | | 866,602 | | |
| | 1,000,000 | | | United States Treasury Note/Bond | | | 1.000 | % | | 07/31/28 | | | 851,875 | | |
| | 7,000,000 | | | United States Treasury Note/Bond | | | 2.625 | % | | 02/15/29 | | | 6,485,937 | | |
| | 1,000,000 | | | United States Treasury Note/Bond | | | 3.250 | % | | 05/15/42 | | | 882,969 | | |
| | 2,000,000 | | | United States Treasury Note/Bond | | | 3.000 | % | | 02/15/49 | | | 1,662,422 | | |
| | | | 17,141,426 | | |
| | | ASSET BACKED SECURITIES 1.5% | |
| | 262,720 | | | US Airways 2010-1 Class A Pass Through Trust | | | 6.250 | % | | 04/22/23 | | | 260,187 | | |
| | 797,638 | | | Delta Air Lines 2015-1 Class B Pass Through Trust | | | 4.250 | % | | 07/30/23 | | | 774,926 | | |
| | 496,198 | | | American Airlines 2015-2 Class B Pass Through Trust | | | 4.400 | % | | 09/22/23 | | | 481,873 | | |
| | 160,298 | | | US Airways 2011-1 Class A Pass Through Trust | | | 7.125 | % | | 10/22/23 | | | 160,227 | | |
| | 1,916,598 | | | American Airlines 2016-1 Class B Pass Through Trust | | | 5.250 | % | | 01/15/24 | | | 1,872,277 | | |
20
Mairs & Power Balanced Fund
SCHEDULE OF INVESTMENTS (continued) December 31, 2022
Par Value | | Security Description | | Value | |
| | | FIXED INCOME SECURITIES (continued) | |
| | | ASSET BACKED SECURITIES (continued) | |
$ | 578,112 | | | Spirit Airlines Pass Through Trust 2015-1B | | | 4.450 | % | | 04/01/24 | | $ | 549,423 | | |
| | 1,474,280 | | | Hawaiian Airlines 2013-1 Class A Pass Through Certificates | | | 3.900 | % | | 01/15/26 | | | 1,275,623 | | |
| | 1,026,752 | | | Continental Airlines 2012-2 Class A Pass Through Trust | | | 4.000 | % | | 10/29/24 | | | 985,804 | | |
| | 623,755 | | | American Airlines 2017-1 Class B Pass Through Trust | | | 4.950 | % | | 02/15/25 | | | 585,035 | | |
| | 633,263 | | | United Airlines 2013-1 Class A Pass Through Trust | | | 4.300 | % | | 08/15/25 | | | 597,289 | | |
| | 558,082 | | | American Airlines 2016-3 Class B Pass Through Trust | | | 3.750 | % | | 10/15/25 | | | 497,456 | | |
| | 443,831 | | | US Airways 2013-1 Class A Pass Through Trust | | | 3.950 | % | | 11/15/25 | | | 403,423 | | |
| | 503,875 | | | United Airlines 2014-1 Class A Pass Through Trust | | | 4.000 | % | | 04/11/26 | | | 465,696 | | |
| | 422,515 | | | United Airlines 2014-2 Class A Pass Through Trust | | | 3.750 | % | | 09/03/26 | | | 387,532 | | |
| | 1,119,797 | | | American Airlines 2014-1 Class A Pass Through Trust | | | 3.700 | % | | 10/01/26 | | | 962,925 | | |
| | 290,997 | | | American Airlines 2015-1 Class A Pass Through Trust | | | 3.375 | % | | 05/01/27 | | | 240,551 | | |
| | 433,253 | | | American Airlines 2015-2 Class A Pass Through Trust | | | 4.000 | % | | 09/22/27 | | | 351,776 | | |
| | 132,882 | | | American Airlines 2015-2 Class AA Pass Through Trust | | | 3.600 | % | | 09/22/27 | | | 119,588 | | |
| | 82,555 | | | Spirit Airlines Pass Through Trust 2015-1A | | | 4.100 | % | | 04/01/28 | | | 71,090 | | |
| | 723,446 | | | British Airways 2018-1 Class A Pass Through Trust (b) (d) | | | 4.125 | % | | 09/20/31 | | | 622,854 | | |
| | | | 11,665,555 | | |
| | | MUNICIPAL BONDS 1.1% | |
| | 650,000 | | | Glendale Community College District/CA | | | 2.113 | % | | 08/01/31 | | | 513,881 | | |
| | 500,000 | | | Socorro Independent School District | | | 2.125 | % | | 08/15/31 | | | 407,735 | | |
| | 920,000 | | | Pierre School District No 32-2 | | | 2.040 | % | | 08/01/33 | | | 706,508 | | |
| | 500,000 | | | Redondo Beach Unified School District | | | 2.040 | % | | 08/01/34 | | | 364,231 | | |
| | 500,000 | | | DeKalb Kane & LaSalle Counties Etc Community College
District No 523 Kishwaukee | | | 3.017 | % | | 02/01/36 | | | 390,168 | | |
| | 1,000,000 | | | Crowley Independent School District | | | 3.010 | % | | 08/01/38 | | | 775,272 | | |
| | 500,000 | | | Idaho Bond Bank Authority | | | 2.354 | % | | 09/15/38 | | | 354,455 | | |
| | 850,000 | | | Worthington Independent School District No 518 | | | 3.300 | % | | 02/01/39 | | | 683,840 | | |
| | 610,000 | | | Rockwall Independent School District | | | 3.091 | % | | 02/15/39 | | | 471,914 | | |
| | 885,000 | | | Massachusetts Development Finance Agency | | | 2.550 | % | | 05/01/40 | | | 605,066 | | |
| | 750,000 | | | Woodbury County Law Enforcement Center Authority | | | 3.090 | % | | 06/01/40 | | | 567,344 | | |
| | 505,000 | | | Village of Ashwaubenon WI | | | 2.970 | % | | 06/01/40 | | | 374,464 | | |
| | 300,000 | | | Desert Community College District | | | 2.457 | % | | 08/01/40 | | | 201,558 | | |
| | 800,000 | | | Utah Transit Authority | | | 3.443 | % | | 12/15/42 | | | 634,645 | | |
| | 1,000,000 | | | Borough of Naugatuck CT | | | 3.090 | % | | 09/15/46 | | | 680,722 | | |
| | 1,000,000 | | | Michigan State University | | | 4.496 | % | | 08/15/48 | | | 895,017 | | |
| | | | 8,626,820 | | |
| | TOTAL FIXED INCOME SECURITIES
(cost $297,280,052) | | $ | 263,958,704 | | |
21
Mairs & Power Balanced Fund
SCHEDULE OF INVESTMENTS (continued) December 31, 2022
Shares | | Security Description | | Value | |
| | | COMMON STOCKS 65.2% | |
| | | COMMUNICATION SERVICES 4.1% | |
| | 301,000 | | | Alphabet Inc (e) | | $ | 26,707,730 | | |
| | 58,000 | | | Walt Disney Co/The (e) | | | 5,039,040 | | |
| | | | 31,746,770 | | |
| | | CONSUMER DISCRETIONARY 2.4% | |
| | 39,860 | | | Home Depot Inc/The | | | 12,590,180 | | |
| | 43,000 | | | Target Corp | | | 6,408,720 | | |
| | | | 18,998,900 | | |
| | | CONSUMER STAPLES 4.2% | |
| | 43,630 | | | Hershey Co/The | | | 10,103,399 | | |
| | 338,510 | | | Hormel Foods Corp | | | 15,419,131 | | |
| | 94,000 | | | Sysco Corp | | | 7,186,300 | | |
| | | | 32,708,830 | | |
| | | FINANCIALS 8.5% | |
| | 42,000 | | | American Express Co | | | 6,205,500 | | |
| | 127,633 | | | JPMorgan Chase & Co | | | 17,115,585 | | |
| | 86,000 | | | Northern Trust Corp | | | 7,610,140 | | |
| | 78,000 | | | Principal Financial Group Inc | | | 6,545,760 | | |
| | 425,017 | | | US Bancorp/MN | | | 18,534,992 | | |
| | 256,308 | | | Wells Fargo & Co | | | 10,582,957 | | |
| | | | 66,594,934 | | |
| | | HEALTH CARE 15.4% | |
| | 173,610 | | | Abbott Laboratories | | | 19,060,642 | | |
| | 62,000 | | | Baxter International Inc | | | 3,160,140 | | |
| | 114,000 | | | Bio-Techne Corp | | | 9,448,320 | | |
| | 125,000 | | | Elanco Animal Health Inc (e) | | | 1,527,500 | | |
| | 54,300 | | | Eli Lilly & Co | | | 19,865,112 | | |
| | 86,000 | | | Johnson & Johnson | | | 15,191,900 | | |
| | 173,000 | | | Medtronic PLC (f) | | | 13,445,560 | | |
| | 4,895 | | | Neogen Corp (e) | | | 74,551 | | |
| | 103,000 | | | Pfizer Inc | | | 5,277,720 | | |
| | 352,000 | | | Roche Holding AG (g) | | | 13,780,800 | | |
| | 37,013 | | | UnitedHealth Group Inc | | | 19,623,552 | | |
| | | | 120,455,797 | | |
| | | INDUSTRIALS 10.6% | |
| | 20,277 | | | 3M Co | | | 2,431,618 | | |
| | 65,000 | | | CH Robinson Worldwide Inc | | | 5,951,400 | | |
| | 95,000 | | | Donaldson Co Inc | | | 5,592,650 | | |
| | 135,000 | | | Fastenal Co | | | 6,388,200 | | |
| | 237,057 | | | Graco Inc | | | 15,944,454 | | |
| | 19,000 | | | Honeywell International Inc | | | 4,071,700 | | |
22
Mairs & Power Balanced Fund
SCHEDULE OF INVESTMENTS (continued) December 31, 2022
Shares | | Security Description | | Value | |
| | | COMMON STOCKS (continued) | |
| | | INDUSTRIALS (continued) | |
| | 140,000 | | | nVent Electric PLC (f) | | $ | 5,385,800 | | |
| | 19,000 | | | Rockwell Automation Inc | | | 4,893,830 | | |
| | 101,000 | | | Tennant Co | | | 6,218,570 | | |
| | 164,905 | | | Toro Co/The | | | 18,667,246 | | |
| | 40,000 | | | United Parcel Service Inc, Class B | | | 6,953,600 | | |
| | | | 82,499,068 | | |
| | | INFORMATION TECHNOLOGY 14.9% | |
| | 22,000 | | | Automatic Data Processing Inc | | | 5,254,920 | | |
| | 34,000 | | | Entegris Inc | | | 2,230,060 | | |
| | 166,000 | | | Fiserv Inc (e) | | | 16,777,620 | | |
| | 41,000 | | | Littelfuse Inc | | | 9,028,200 | | |
| | 125,000 | | | Microsoft Corp | | | 29,977,500 | | |
| | 50,000 | | | Motorola Solutions Inc | | | 12,885,500 | | |
| | 118,000 | | | QUALCOMM Inc | | | 12,972,920 | | |
| | 50,000 | | | salesforce.com Inc (e) | | | 6,629,500 | | |
| | 54,000 | | | Texas Instruments Inc | | | 8,921,880 | | |
| | 58,000 | | | Visa Inc | | | 12,050,080 | | |
| | | | 116,728,180 | | |
| | | MATERIALS 4.2% | |
| | 90,000 | | | Ecolab Inc | | | 13,100,400 | | |
| | 108,270 | | | HB Fuller Co | | | 7,754,297 | | |
| | 49,000 | | | Sherwin-Williams Co/The | | | 11,629,170 | | |
| | | | 32,483,867 | | |
| | | UTILITIES 0.9% | |
| | 104,000 | | | Xcel Energy Inc | | | 7,291,440 | | |
| | | | TOTAL COMMON STOCKS
(cost $285,300,782) | | $ | 509,507,786 | | |
| | | SHORT-TERM INVESTMENTS 0.5% | |
| 3,523,143 | | | First American Government Obligations Fund, Class X, 0.0407% (h)
(cost $3,523,143) | | $ | 3,523,143 | | |
| | | | TOTAL INVESTMENTS 99.5%
(cost $586,103,977) | | $ | 776,989,633 | | |
| | | | | OTHER ASSETS AND LIABILITIES (NET) 0.5% | | | 3,857,450 | | |
| | | | | TOTAL NET ASSETS 100.0% | | $ | 780,847,083 | | |
23
Mairs & Power Balanced Fund
SCHEDULE OF INVESTMENTS (continued) December 31, 2022
(a) Step Bonds – Securities for which the coupon rate of interest will adjust on specified future dates(s). The rate disclosed represents the coupon rate in effect as of December 31, 2022.
(b) Securities exempt from registration under Rule 144A of the Securities Act of 1933. These securities may be resold in transactions exempt from registration, normally to qualified institutional buyers. These securities have been determined to be liquid under guidelines established by the Funds's Board of Trustees. As of December 31, 2022, these securities represented $18,763,932 or 2.4% of total net assets.
(c) Perpetual maturity, date shown, if applicable, represents next contractual call date.
(d) Foreign security denominated in U.S. dollars. As of December 31, 2022, these securities represented $7,622,545 or 1.0% of total net assets.
(e) Non-income producing.
(f) Issuer headquartered overseas but considered domestic. The Adviser defines foreign issuers as those whose operational leadership or headquarters is located in a foreign country; provided, however, if an issuer is believed by the Adviser to be headquartered in a jurisdiction primarily for tax purposes, the Adviser will consider the following additional factors: 1) the location of the primary exchange trading its securities; 2) where it derives the majority of its revenues; and/or 3) where it earns the majority of its profits.
(g) American Depositary Receipt
(h) The rate quoted is the annualized seven-day effective yield as of December 31, 2022.
The Global Industry Classification Standard (GICS®) was developed by and/or is the exclusive property of MSCI, Inc. and Standard & Poor's Financial Services LLC ("S&P"). GICS is a service mark of MSCI, Inc. and S&P and has been licensed for use by the Adviser.
(i) Variable rate security; the rate shown represents the rate at December 31, 2022.
See accompanying Notes to Financial Statements.
24
MAIRS & POWER SMALL CAP FUND (unaudited)
To Our Shareholders: December 31, 2022
For 2022, the Mairs & Power Small Cap Fund (the "Fund") was down 13.93%, while its S&P Small Cap 600 TR benchmark fell 16.10%, and the Morningstar U.S. Fund Small Blend declined 16.35%. In the fourth quarter of 2022, the Fund was up 9.70%, the S&P Small Cap 600 TR was up 9.19%, and the Morningstar U.S. Fund Small Blend rose 9.01%.
The absence of Energy holdings was a headwind to relative performance year-to-date, and in the fourth quarter. The combination of underinvestment by the industry and recent geopolitical tensions have caused fossil fuel supplies to fall short of demand, driving up the prices of both Energy commodities and Energy stocks. We believe these conditions are temporary, and therefore we will continue to steer clear of the sector. Over the long term, we continue to believe that the broader Energy sector, which is made up primarily of companies in the traditional fossil fuel supply chain, will face secular headwinds as advancements in transportation, as well as battery and storage technologies, make the transition from fossil fuels to renewable sources of energy increasingly compelling, both financially and environmentally.
Year-to-date relative performance in Consumer Staples and Utilities sectors contributed to the Fund's year-to-date outperformance. Individual positions that significantly helped the Fund's performance year-to-date included: Digi International (DGII) in Technology, a Minnesota-based supplier of IoT and connectivity products that is seeing improved demand, margins, and revenue visibility, MGP Ingredients (MGPI) in Consumer Staples, a Kansas-based supplier of distillery products and branded spirits that is seeing improving fundamentals under new management, and AAR Corp (AIR) in Industrials, an Illinois-based provider of aviation services that outperformed as the corporate and government travel economies improved. Also contributing to year-to-date relative performance was Casey's General Stores (CASY), an Iowa-based operator of convenience stores and gas stations benefiting from improved store traffic and prepared food demand, as well as fuel margins and labor productivity, and Inspire Medical (INSP), a Minnesota medical device company whose obstructive sleep apnea product adoption accelerated with increased sleep center and doctor productivity.
Weak year-to-date relative performance in Energy, Technology, Materials, and Industrials sectors were headwinds to the Fund's year-to-date performance. Holdings that significantly detracted from year-to-date relative performance included: Catalent (CTLT) in Healthcare, a New Jersey-based provider of drug and consumer health product infrastructure and manufacturing products impacted by ebbing demand for COVID-19 vaccines, Sleep Number (SNBR) in Consumer Discretionary, the Minnesota-based maker of adjustable beds, which faced supply chain headwinds and weaker consumer demand, and JAMF (JAMF) in Technology, a Minneapolis-based software company primarily focused on managing Apple devices in an Enterprise setting. JAMF was impacted by both slowing growth in Apple product sales and slowing broader hiring trends. Also lagging were AZEK Co. (AZEK) in Industrials, a Chicago-based supplier of home exterior products which was impacted by rising interest rates, energy costs, and near-term declines in consumer demand, and Littelfuse (LFUS) in Technology, a Chicago-based maker of electric circuit protection, power control, and sensing products facing a demand contraction in consumer electronic end markets.
During the fourth quarter, as healthcare and biotech valuations declined, we added Wisconsin-based Exact Sciences (EXAS), a provider of cancer screening and diagnostics products which is one of the fastest growing and largest potential markets within the sector. Exact serves a growing market and doesn't face patent cliffs like traditional pharmaceutical companies. The company has established franchises in Cologuard and Oncotype Breast Cancer tests, and 70% or more gross margins are a result of Exact's first-mover advantage, product leadership, and reinvestment in R&D to support future product expansion and growth.
We also added Minnesota-based Clearfield (CLFD), a provider of passive optical equipment, in the Communications sector. Clearfield has established credibility with service provider customers for over 40 years, resulting in both a high degree of customer trust, and significant product design advantages, which are fueling growth and market share gains for the company in rural/community broadband markets. Clearfield's R&D process is deliberately integrated with their customers' yielding products that are iterative, faster to market, and require significantly less labor during fiber optic deployments, resulting in labor savings for services
25
MAIRS & POWER SMALL CAP FUND (unaudited) (continued)
providers. This advantage for Clearfield has led to accelerating growth, margin expansion, and rising ROIC. Given the upward pressures on labor costs, and the $60 billion plus U.S. broadband stimulus initiatives over the next several years, Clearfield's product advantages should continue to be highly valued by service providers racing to bring fiber connectivity to more homes.
As the economy mends from demand and supply shocks, high inflation, and the Fed's aggressive tightening actions to contain it, the process of normalization continues, albeit unevenly. While shortages of parts hampered manufacturers' ability to deliver goods when consumer and business demand was high, inflation accelerated higher. As stimulus waned, and high prices naturally curbed quantity of goods demanded, goods inflation came off the boil. However, with a few exceptions, businesses caught short of labor have thus far been reluctant to reduce headcount, which has resulted in wage pressures remaining elevated. This too will take some time to normalize. As long-term investors, and leveraging our experience through prior cycles, we view these challenges as temporary, and view the volatility experienced during this normalization as an opportunity to invest in impressive companies trading at significantly lower valuations.
As of December 31, the S&P Small Cap 600 group traded at 12.2 times forward earnings, a 27% discount to the S&P 500 index and a 30% discount to its 10-year average. Our experience over multiple economic cycles supports the belief that this is part of the handoff from one cycle to another. We believe top performing companies in the next cycle will be those with durable competitive advantages, the pricing power to navigate rising input costs, the cash flows to reinvest in new products and initiatives, and the margins and returns to drive higher earnings growth rates throughout the economic cycle. We remain confident that our long-term approach to investing is particularly well-suited for current conditions, where many high-quality companies' shares are trading at a discount.
Remembering Allen Steinkopf
Allen Steinkopf, our friend, partner, and colleague, passed away on December 21, 2022. He played a large role in the success of Mairs & Power during his nine years with the firm and as manager, in a lead and co-manager capacity, for the Mairs & Power Small Cap Fund (MSCFX) since 2015. Andy Adams, CIO and mentee of Al, said it best, "He taught me, challenged me, inspired me, and made work not work. He loved investing, and as everyone that worked with him knows, his passion was infectious. I loved spending time in his office just bouncing ideas back and forth with him."
As part of planning for his retirement at the end of 2023, Allen had been working with backup investment managers for his separately managed accounts and sharing coverage of the companies he follows with the other 13 investment professionals who are on the investment committee. Since 2019, we have strengthened the bench of the Small Cap team by bringing on Chris Strom and Mike Marzolf to join Andy Adams, lead manager of the Small Cap Fund. Chris joined the firm in 2017 and officially joined the Small Cap team in 2021. Mike Marzolf, a seasoned professional with over 30 years of investment experience, joined the firm and Small Cap team in 2022. Andy Adams will continue in his capacity as CIO and lead manager of the Small Cap Fund. Allen will be dearly missed by all of us who had the privilege of working with him.
Andy Adams
Lead Manager | | Mike Marzolf
Co-Manager | | Chris Strom
Co-Manager | |
26
MAIRS & POWER SMALL CAP FUND (unaudited) (continued)
MAIRS & POWER SMALL CAP FUND (MSCFX) CONTRIBUTORS
Year To Date (12/31/2021 – 12/31/2022)
Largest Contributors To
Relative Performance | | Largest Detractors To
Relative Performance | |
Digi International, Inc. | | | 48.76 | % | | Sleep Number Corp. | | | -66.08 | % | |
MGP Ingredients, Inc. | | | 25.78 | % | | Catalent, Inc. | | | -64.84 | % | |
AAR CORP. | | | 15.04 | % | | AZEK Co., Inc. Class A | | | -56.06 | % | |
Casey's General Stores, Inc. | | | 14.49 | % | | JAMF Holding Corporation | | | -43.96 | % | |
Inspire Medical Systems, Inc. | | | 9.48 | % | | Littelfuse, Inc. | | | -29.38 | % | |
Largest relative contributors and detractors are securities that were selected based on their contribution to the portfolio as of December 31, 2022. The performance number shown is total return of the security for the period and includes only securities held for the entire period. Total return is the amount of value an investor earns from a security over a specific period and when distributions are reinvested. Past performance does not guarantee future results.
All holdings in the portfolio are subject to change without notice and may or may not represent current or future portfolio composition. The mention of specific securities is not intended as a recommendation or an offer of a particular security, nor is it intended to be a solicitation for the purchase or sale of any security.
All investments have risks. The Small Cap Fund is designed for long-term investors. Equity investments are subject to market fluctuations and the Fund's share price can fall because of weakness in the broad market, a particular industry or specific holdings. Investments in small and midcap companies generally are more volatile. International investing risks include among others political, social or economic instability, difficulty in predicting international trade patterns, taxation and foreign trading practices, and greater fluctuations in price than U.S. corporations. The Fund may invest in initial public offerings by small cap companies, which can involve greater risk than investments in companies that are already publicly traded.
This commentary includes forward-looking statements such as economic predictions and portfolio manager opinions. The statements are subject to change at any time based on market and other conditions. No predictions, forecasts, outlooks, expectations or beliefs are guaranteed.
S&P Small Cap 600 Total Return (S&P 600) is an index of small company stocks managed by Standard & Poor's Financial Services LLC that covers a broad range of small cap stocks in the U.S. The index is weighted according to market capitalization and covers about 3-4% of the total market for equities in the U.S. It tracks both the capital gains of a group of stocks over time and assumes that any cash distributions, such as dividends, are reinvested back into the index. It is not possible to invest directly in an index.
Morningstar Small Blend Category, as defined by Morningstar are stocks in the bottom 10% of the capitalization of the U.S. equity market are defined as small cap. The blend style is assigned to portfolios where neither growth nor value characteristics predominate. It is not possible to invest directly in an index.
27
Mairs & Power Small Cap Fund
PERFORMANCE INFORMATION (unaudited) December 31, 2022
Investment performance since commencement of operations (through December 31, 2022)
This chart illustrates the performance of a hypothetical $10,000 investment made in the Fund since commencement of operations.
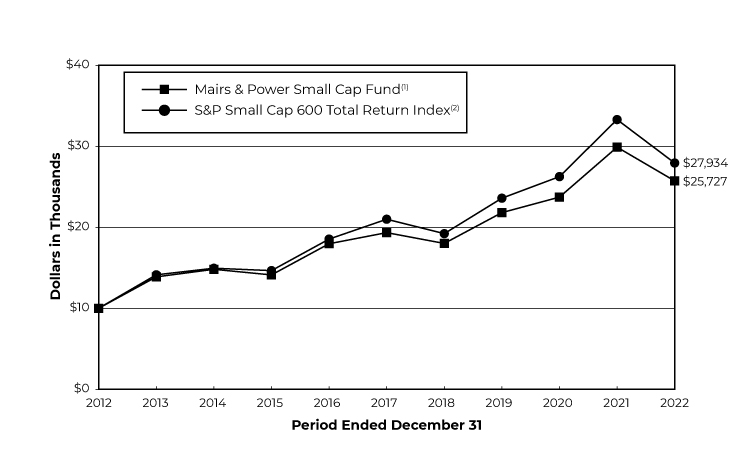
Average annual total returns for periods ended December 31, 2022
| | | 1 Year | | 3 Year | | 5 Year | | 10 Year | | Since Inception(3) | |
Mairs & Power Small Cap Fund(1) | | | -13.93 | % | | | 5.66 | % | | | 5.87 | % | | | 9.91 | % | | | 12.35 | % | |
S&P Small Cap 600 Total Return Index(2) | | | -16.10 | % | | | 5.80 | % | | | 5.88 | % | | | 10.82 | % | | | 11.83 | % | |
Performance data quoted represents past performance and does not guarantee future results. All performance information shown includes the reinvestment of dividend and capital gain distributions, but does not reflect the deduction of taxes that a shareholder would pay on Fund distributions or the redemption of Fund shares. The investment return and principal value of an investment will fluctuate so that an investor's shares, when redeemed, may be worth more or less than their original cost. Current performance of the Fund may be lower or higher than the performance quoted. For the most recent month-end performance figures, visit the Fund's website at www.mairsandpower.com or call Shareholder Services at (800) 304-7404. Per the Prospectus dated April 20, 2022, the expense ratio for the Fund is 0.95%. See the Financial Highlights in this report for the most recent expense ratio.
(1) Performance figures reflect the historical performance of the Mairs & Power Small Cap Fund (the "Predecessor Small Cap Fund"), a series of Mairs & Power Funds Trust, for periods prior to April 29, 2022.
(2) The S&P Small Cap 600 Total Return Index is an index of small-company stocks managed by Standard & Poor's Financial Services LLC that covers a broad range of small cap stocks in the U.S. The index is weighted according to market capitalization and covers about 3-4% of the total market for equities in the U.S. It tracks both the capital gains of a group of stocks over time and assumes that any cash distributions, such as dividends, are reinvested back into the index. It is not possible to invest directly in an index.
(3) Since inception performance is as of August 11, 2011, which is the offering date of the Small Cap Fund.
28
Mairs & Power Small Cap Fund
FUND INFORMATION (unaudited) December 31, 2022
Portfolio Managers
Andrew R. Adams, CFA, lead manager of the Mairs & Power Small Cap Fund and Predecessor Small Cap Fund since August 20, 2021, co-manager from April 1, 2019 to August 20, 2021, lead manager from 2011 to April 1, 2019, University of Wisconsin-Madison, MS Finance 1997
Christopher D. Strom, CFA, co-manager of the Mairs & Power Small Cap Fund and Predecessor Small Cap Fund since January 1, 2021, University of Wisconsin-Madison, MBA Applied Security Analysis 2010
Michael C. Marzolf, CFA, co-manager of the Mairs & Power Small Cap Fund and Predecessor Small Cap Fund since January 1, 2022, University of St. Thomas, BS Accounting 1993
General Information
Fund Symbol | | | MSCFX | | |
Net Asset Value (NAV) Per Share | | $ | 26.43 | | |
Expense Ratio | | | 0.92 | % | |
Portfolio Turnover Rate | | | 19.81 | % | |
Sales Charge | | | None1 | | |
Fund Inception Year | | | 2011 | | |
Portfolio Composition
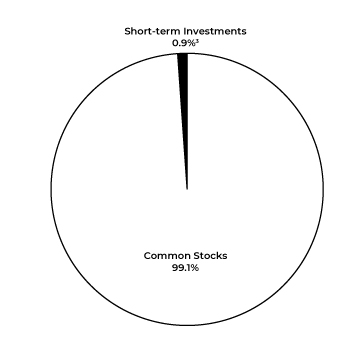
Top Ten Portfolio Holdings
(Percent of Total Net Assets)2
Inspire Medical Systems Inc | | | 4.2 | % | |
AAR Corp | | | 4.1 | | |
Wintrust Financial Corp | | | 4.0 | | |
Cullen/Frost Bankers Inc | | | 4.0 | | |
Littelfuse Inc | | | 4.0 | | |
nVent Electric PLC | | | 3.7 | | |
Casey's General Stores Inc | | | 3.7 | | |
Workiva Inc | | | 3.6 | | |
HB Fuller Co | | | 3.6 | | |
Glacier Bancorp Inc | | | 3.3 | | |
Portfolio Diversification
(Percent of Total Net Assets)
Common Stocks 99.1% | |
Industrials | | | 26.6 | % | |
Information Technology | | | 20.5 | | |
Financials | | | 18.8 | | |
Health Care | | | 11.6 | | |
Consumer Staples | | | 5.3 | | |
Consumer Discretionary | | | 4.9 | | |
Utilities | | | 3.8 | | |
Materials | | | 3.6 | | |
Communication Services | | | 2.2 | | |
Real Estate | | | 1.8 | | |
Short-term Investments 0.9%3 | | | 0.9 | | |
| | | | 100.0 | % | |
1 Although the Fund is no-load, investment management fees and other expenses still apply. Shares of the Fund are also subject to a 1.00% redemption fee for any shares held for 180 days or less.
2 All holdings in the portfolio are subject to change without notice and may or may not represent current or future portfolio composition. The mention of specific securities is not intended as a recommendation or offer for a particular security, nor is it intended to be a solicitation for the purchase or sale of any security.
3 Represents short-term investments and other assets and liabilities (net).
The Schedule of Investments and portfolio diversification utilize the Global Industry Classification Standard (GICS®) which was developed by and/or is the exclusive property of MSCI, Inc. and Standard & Poor's Financial Services LLC ("S&P"). GICS is a service mark of MSCI, Inc. and S&P and has been licensed for use by Mairs & Power, Inc. (the "Adviser").
29
Mairs & Power Small Cap Fund
SCHEDULE OF INVESTMENTS December 31, 2022
Shares | | Security Description | | Value | |
| | | COMMON STOCKS 99.1% | |
| | | COMMUNICATION SERVICES 2.2% | |
| | 515,823 | | | Marcus Corp/The | | $ | 7,422,693 | | |
| | | CONSUMER DISCRETIONARY 4.9% | |
| | 122,980 | | | Gentherm Inc (a) | | | 8,029,364 | | |
| | 50,600 | | | Polaris Inc | | | 5,110,600 | | |
| | 136,445 | | | Sleep Number Corp (a) | | | 3,544,841 | | |
| | | | 16,684,805 | | |
| | | CONSUMER STAPLES 5.3% | |
| | 55,170 | | | Casey's General Stores Inc | | | 12,377,389 | | |
| | 51,610 | | | MGP Ingredients Inc | | | 5,490,272 | | |
| | | | 17,867,661 | | |
| | | FINANCIALS 18.8% | |
| | 139,441 | | | Alerus Financial Corp | | | 3,255,947 | | |
| | 309,261 | | | Associated Banc-Corp | | | 7,140,837 | | |
| | 99,800 | | | Cullen/Frost Bankers Inc | | | 13,343,260 | | |
| | 194,656 | | | First Interstate BancSystem, Inc | | | 7,523,455 | | |
| | 226,420 | | | Glacier Bancorp Inc | | | 11,189,676 | | |
| | 147,278 | | | QCR Holdings Inc | | | 7,310,880 | | |
| | 159,500 | | | Wintrust Financial Corp | | | 13,480,940 | | |
| | | | 63,244,995 | | |
| | | HEALTH CARE 11.6% | |
| | 99,600 | | | Bio-Techne Corp | | | 8,254,848 | | |
| | 128,000 | | | Catalent Inc (a) | | | 5,761,280 | | |
| | 89,445 | | | CVRx Inc (a) | | | 1,641,316 | | |
| | 23,500 | | | Exact Sciences Corp. (a) | | | 1,163,485 | | |
| | 56,185 | | | Inspire Medical Systems Inc (a) | | | 14,151,878 | | |
| | 31,100 | | | Medpace Holdings Inc (a) | | | 6,605,951 | | |
| | 42,218 | | | SurModics Inc (a) | | | 1,440,478 | | |
| | | | 39,019,236 | | |
| | | INDUSTRIALS 26.6% (d) | |
| | 307,978 | | | AAR Corp (a) | | | 13,828,212 | | |
| | 356,500 | | | AZEK Co Inc/The (a) | | | 7,244,080 | | |
| | 70,263 | | | Donaldson Co Inc | | | 4,136,383 | | |
| | 33,672 | | | Generac Holdings Inc (a) | | | 3,389,424 | | |
| | 54,700 | | | Graco Inc | | | 3,679,122 | | |
| | 108,700 | | | Hub Group Inc, Class A (a) | | | 8,640,563 | | |
| | 136,700 | | | Hyliion Holdings Corp (a) | | | 319,878 | | |
| | 67,900 | | | John Bean Technologies Corp | | | 6,201,307 | | |
| | 322,100 | | | nVent Electric PLC (b) | | | 12,391,187 | | |
| | 111,470 | | | Oshkosh Corp | | | 9,830,539 | | |
| | 163,851 | | | Tennant Co | | | 10,088,306 | �� | |
| | 88,200 | | | Toro Co/The | | | 9,984,240 | | |
| | | | 89,733,241 | | |
30
Mairs & Power Small Cap Fund
SCHEDULE OF INVESTMENTS (continued) December 31, 2022
Shares | | Security Description | | Value | |
| | | COMMON STOCKS (continued) | |
| | | INFORMATION TECHNOLOGY 20.5% | |
| | 124,200 | | | Altair Engineering Inc (a) | | $ | 5,647,374 | | |
| | 26,600 | | | Clearfield, Inc. (a) | | | 2,504,124 | | |
| | 129,524 | | | Digi International Inc (a) | | | 4,734,102 | | |
| | 74,507 | | | Entegris Inc | | | 4,886,914 | | |
| | 84,200 | | | Envestnet Inc (a) | | | 5,195,140 | | |
| | 445,250 | | | Jamf Holding Corp (a) | | | 9,483,825 | | |
| | 60,500 | | | Littelfuse Inc | | | 13,322,100 | | |
| | 95,920 | | | Plexus Corp (a) | | | 9,873,045 | | |
| | 201,790 | | | SkyWater Technology Inc (a) | | | 1,434,727 | | |
| | 145,380 | | | Workiva Inc (a) | | | 12,207,559 | | |
| | | | 69,288,910 | | |
| | | MATERIALS 3.6% | |
| | 169,200 | | | HB Fuller Co | | | 12,118,104 | | |
| | | REAL ESTATE 1.8% | |
| | 416,200 | | | Physicians Realty Trust | | | 6,022,414 | | |
| | | UTILITIES 3.8% | |
| | 94,400 | | | Black Hills Corp | | | 6,640,096 | | |
| | 103,900 | | | NorthWestern Corp | | | 6,165,426 | | |
| | | | 12,805,522 | | |
| | | | TOTAL COMMON STOCKS
(cost $254,411,752) | | $ | 334,207,581 | | |
| | | SHORT-TERM INVESTMENTS 0.4% | |
| 1,294,679 | | | First American Government Obligations Fund, Class X, 0.0407% (c)
(cost $1,294,679) | | $ | 1,294,679 | | |
| | | | TOTAL INVESTMENTS 99.5%
(cost $255,706,431) | | $ | 335,502,260 | | |
| | | | | OTHER ASSETS AND LIABILITIES (NET) 0.5% | | | 1,699,171 | | |
| | | | | TOTAL NET ASSETS 100.0% | | $ | 337,201,431 | | |
31
Mairs & Power Small Cap Fund
SCHEDULE OF INVESTMENTS (continued) December 31, 2022
(a) Non-income producing.
(b) Issuer headquartered overseas but considered domestic. The Adviser defines foreign issuers as those whose operational leadership or headquarters is located in a foreign country; provided, however, if an issuer is believed by the Adviser to be headquartered in a jurisdiction primarily for tax purposes, the Adviser will consider the following additional factors: 1) the location of the primary exchange trading its securities; 2) where it derives the majority of its revenues; and/or 3) where it earns the majority of its profits.
(c) The rate quoted is the annualized seven-day effective yield as of December 31, 2022.
The Global Industry Classification Standard (GICS®) was developed by and/or is the exclusive property of MSCI, Inc. and Standard & Poor's Financial Services LLC ("S&P"). GICS is a service mark of MSCI, Inc. and S&P and has been licensed for use by the Adviser.
(d) The Fund is significantly invested in the industrials sector and therefore is subject to additional risks. The industrials sector may be significantly affected by general economic trends, including such factors as import controls, commodity prices and worldwide competition.
See accompanying Notes to Financial Statements.
32
MAIRS & POWER MINNESOTA MUNICIPAL BOND ETF (unaudited)
To Our Shareholders: December 31, 2022
The Mairs & Power Minnesota Municipal Bond ETF (the "Fund") delivered a total return of -12.20% (NAV) and -12.27% (Market Price) during the year of 2022. During the same period, the Bloomberg Minnesota Municipal Total Return (TR) Index, the Fund's benchmark, had a total return of -7.36%. However, the 30-Day SEC Yield of the portfolio increased from 0.99% at year-end 2021 to 2.68% at the end of 2022.
The Fund's underperformance was mostly driven by the first half of the year, while the back half of the year resulted in marginally improved performance. To say the first half of the year was a shock to municipal fixed income markets would be an understatement. It was, indeed, the worst period for municipal bonds in the modern municipal marketplace. Interest rates rose by about 170 basis points (bps) across the curve, while many of the "par bonds" which were issued for most of the year last year and which we worked to largely avoid have traded 15-20% or more below their issuance price.
The Fund's average maturity is short to the benchmark index while the duration to worst continues to be slightly long of the index as we invested the portfolio where we found opportunities at reasonable prices for the long-term. It's against this backdrop we reiterate a Mairs & Power mantra: quality for the long-term.
We are increasingly convinced that credit quality is going to matter more for municipal credits over the next decade than it did over the previous decade due to a shift in potential issues, such as inflation, facing municipal credits.
Credit still starts at the state level for most Minnesota credits, at least for any that are political subdivisions of the state. The state's economy is healthy as evidenced by Minnesota posting the lowest unemployment rate of any state ever mid 2022 at 1.8% in June and July. Although the number of employed people has not reached pre-COVID levels, it is very close to achieving that and year-over-year employment was recently growing in the 3% range. Year-to-date business filings through November with planned wages help portend future economic growth. Although this was lower than last year, filings were still 22% higher than the same period in 2019, and were higher than any other year from 2010-2020. Minnesota's future economy looks bright.
From a financial picture, we think the state looks to be in good shape. There was no agreement in how to spend the surplus projected for the last legislative session, and in November the state projected that it will post a $17.6 billion surplus for the current biennium(1) – that's nearly 2% of the Minnesota's GDP annually. In our view, this bolsters state finances as fund balances at June 30, 2022 amounted to 47% of governmental spending. Notably, Moody's upgraded the state to Aaa mid-2022.
One trend we think will continue to impact municipal credits is the lack of available employees and the resulting wage inflation. As inflationary effects eat away at public servants' and nonprofit employees' real purchasing power, much like in the private sector it seems probable wage growth will need to accelerate. It is apparent to us that we are potentially entering a time – we don't know how long – of potentially larger wage increases than we have seen in years past. Each municipality and nonprofit has varying degrees of revenue flexibility, so this will have a disparate impact across portfolios. This requires a keener attention to credit quality than the previously benign inflation environment.
We feel confident in our credit selection at this juncture and take comfort in the fact over 50% of the portfolio is invested in local general obligation bonds ultimately backed by property taxes of well-established tax bases. The second largest sector in the portfolio – leases – is a mix of essential purpose lease projects representing a mix of projects including school additions, special education centers, and a county courthouse, among others. We are careful in credit selection and anticipate our preference for essential projects will continue to prevail as we will not sacrifice quality for the sake of additional yield.
Brent S. Miller
Lead Manager | | Robert W. Thompson
Co-Manager | |
(1) Minnesota House of Representatives: https://house.leg.state.mn.us/SessionDaily/Story/17484
33
MAIRS & POWER MINNESOTA MUNICIPAL BOND ETF (unaudited) (continued)
Past performance is not a guarantee of future results.
Bloomberg Minnesota Municipal (TR) Index is a market capitalization-weighted index of Minnesota investment-grade bonds with maturities of one year or more. It is not possible to invest directly in an index.
The 30-Day SEC yield is a calculation based on the 30 days ending on the last day of the previous month. The yield figure reflects the dividends and interest earned during the period, after the deduction of the Fund's expense.
A par bond refers to a bond that currently trades at its face value.
Duration to Worst is a measure of weighted average expected cash flows based on expected maturity of bonds. This measure can indicate interest rate sensitivity as a higher duration to worst indicates greater sensitivity to moves in interest rates and a lower duration to worst indicates relatively lower sensitivity to a move in interest rates.
Investing in the Fund is subject to investment risks, including, but not limited to, possible loss of the principal amount invested.
The Fund's investment objective, risks, charges and expenses must be considered carefully before investing. The summary prospectus or prospectus contains this and other important information about the Fund. Read the summary prospectus or prospectus carefully before investing.
Shares of any ETF are bought and sold at market price (not NAV), may trade at a discount or premium to NAV and are not individually redeemed from the funds. Brokerage commissions will reduce returns. The Fund is non-diversified, meaning it may concentrate more of its assets in a smaller number of issuers than diversified funds.
Investments in debt securities typically decrease in value when interest rates rise. This risk is usually greater for longer-term debt securities. Investment by the Fund in lower-rated and non-rated securities presents a greater risk of loss to principal and interest than higher-rated securities. Because the Fund invests substantially in Minnesota municipal instruments, it is more exposed to the impact of negative political, economic and legislative factors within Minnesota than a fund that invests more widely. Because the Fund is "non-diversified," it may invest a greater percentage of its assets in the securities of a single issuer or a smaller number of issuers than if it were a diversified fund. The Fund is also subject to risks associated with investments in the municipal bond market, municipal mortgage-backed securities, and other investment companies.
Mairs & Power uses the lower of the S&P or Moody's ratings and chooses to display credit ratings using S&P's convention, although the rating itself might be sourced from another Nationally Recognized Statistical Rating Agency. The ratings apply to the credit worthiness of the issuers of the underlying securities and not to the Fund itself. Ratings are expressed as letters ranging from 'AAA', which is the highest grade, to 'D', which is the lowest grade. In limited situations when the rating agency has not issued a formal rating, the rating agency will classify the security as unrated.
Foreside Fund Services, LLC is the Distributor for the Mairs & Power Funds.
Foreside is not related to Mairs & Power.
34
Mairs & Power Minnesota Municipal Bond ETF
PERFORMANCE INFORMATION (unaudited) December 31, 2022
Investment performance since commencement of operations (through December 31, 2022)
This chart illustrates the performance of a hypothetical $10,000 investment made in the Fund since commencement of operations.
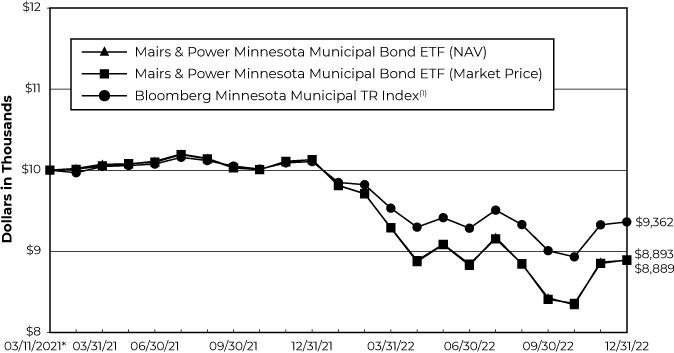
Average Annual total returns for periods ended December 31, 2022
| | 1 Year | | Since
Commencement
of Operations(2) | |
Mairs & Power Minnesota Municipal Bond ETF (NAV) | | | -12.20 | % | | | -6.28 | % | |
Mairs & Power Minnesota Municipal Bond ETF (Market Price) | | | -12.27 | % | | | -6.31 | % | |
Bloomberg Minnesota Municipal TR Index (1) | | | -7.36 | % | | | -3.58 | % | |
Performance data quoted represents past performance and does not guarantee future results. All performance information shown includes the reinvestment of dividend and capital gain distributions, but does not reflect the deduction of taxes that a shareholder would pay on Fund distributions or the redemption of Fund shares. The investment return and principal value of an investment will fluctuate so that an investor's shares, when redeemed, may be worth more or less than their original cost. Current performance of the Fund may be lower or higher than the performance quoted. For the most recent month-end performance figures, visit the Fund's website at www.mairsandpower.com or call Shareholder Services at (855) 839-2800. Per the Prospectus dated April 30, 2022, the expense ratio for the Fund is 0.39%. See the Financial Highlights in this report for the most recent expense ratio.
(1) Bloomberg Minnesota Municipal TR Index is a market capitalization – weighted index of Minnesota investment-grade bonds with maturities of one year or more.
(2) Since commencement of operations performance is as of March 11, 2021, which is the offering date of the Minnesota Municipal Bond ETF.
35
Mairs & Power Minnesota Municipal Bond ETF
FUND INFORMATION (unaudited) December 31, 2022
Portfolio Managers
Brent S. Miller, CFA, lead manager since March 11, 2021, Northwestern University, MBA Management & Strategy 2016
Robert W. Thompson, CFA, co-manager since March 11, 2021, University of Minnesota, MBA Finance 1995
General Information
Fund Symbol | | | MINN | | |
Net Asset Value (NAV) Per Share | | $ | 21.80 | | |
Expense Ratio | | | 0.39 | % | |
Portfolio Turnover Rate | | | 17.81 | % | |
Sales Charge | | | None1 | | |
Fund Inception Year | | | 2021 | | |
Portfolio Composition
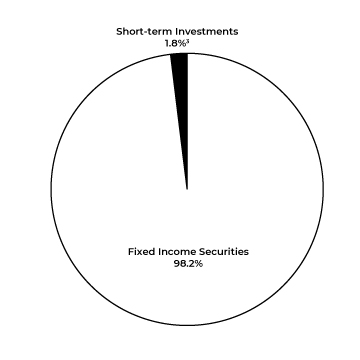
Top Ten Portfolio Holdings
(Percent of Total Net Assets)2
State of Minnesota | | | 603,340 | | |
State of Minnesota | | | 539,298 | | |
Minneapolis Special School
District No 1 | | | 516,981 | | |
Anoka-Hennepin Independent
School District No 11 | | | 422,294 | | |
City of Elk River MN Electric Revenue | | | 358,888 | | |
State of Minnesota | | | 330,008 | | |
North St Paul-Maplewood-Oakdale
Independent School District No 622 | | | 326,994 | | |
City of Elk River MN | | | 326,558 | | |
Minnesota Higher Education
Facilities Authority | | | 323,071 | | |
State of Minnesota | | | 310,937 | | |
Portfolio Diversification
(Percent of Total Net Assets)
Fixed Income Securities 98.2% | |
Municipal Bonds | | | 98.2 | % | |
Short-term Investments 1.8%3 | | | 1.8 | | |
| | | | 100.0 | % | |
1 Although the Fund is no-load, investment management fees and other expenses still apply.
2 All holdings in the portfolio are subject to change without notice and may or may not represent current or future portfolio composition. The mention of specific securities is not intended as a recommendation or offer for a particular security, nor is it intended to be a solicitation for the purchase or sale of any security.
3 Represents short-term investments and other assets and liabilities (net).
36
Mairs & Power Minnesota Municipal Bond ETF
SCHEDULE OF INVESTMENTS December 31, 2022
Par Value | | Security Description | | Value | |
| | | FIXED INCOME SECURITIES 98.2% | |
| | | MUNICIPAL BONDS 98.2% (a) | |
$ | 200,000 | �� | | City of Richfield MN | | | 4.000 | % | | 02/01/23 | | $ | 200,122 | | |
| | 140,000 | | | County of Redwood MN | | | 5.000 | % | | 04/01/23 | | | 140,664 | | |
| | 155,000 | | | State of Minnesota | | | 5.000 | % | | 08/01/23 | | | 156,883 | | |
| | 100,000 | | | Minnesota Municipal Power Agency | | | 5.000 | % | | 10/01/23 | | | 101,455 | | |
| | 275,000 | | | County of Hennepin MN | | | 5.000 | % | | 12/15/23 | | | 280,637 | | |
| | 250,000 | | | Richfield Independent School District No 280 | | | 5.000 | % | | 02/01/24 | | | 255,712 | | |
| | 100,000 | | | Minnesota Higher Education Facilities Authority | | | 5.000 | % | | 12/01/24 | | | 104,102 | | |
| | 115,000 | | | Spring Lake Park Independent School District No 16 | | | 4.000 | % | | 02/01/25 | | | 117,792 | | |
| | 125,000 | | | Minneapolis Special School District No 1 | | | 5.000 | % | | 02/01/25 | | | 130,976 | | |
| | 230,000 | | | Northfield Independent School District No 659 | | | 5.000 | % | | 02/01/25 | | | 240,805 | | |
| | 250,000 | | | Rosemount-Apple Valley-Eagan Independent School
District No 196 | | | 5.000 | % | | 04/01/25 | | | 261,444 | | |
| | 100,000 | | | City of Chaska MN Electric Revenue | | | 5.000 | % | | 10/01/25 | | | 105,985 | | |
| | 220,000 | | | City of North Mankato MN | | | 4.000 | % | | 12/01/25 | | | 227,980 | | |
| | 200,000 | | | Spring Lake Park Independent School District No 16 | | | 4.000 | % | | 02/01/26 | | | 202,969 | | |
| | 200,000 | | | Southern Plains Education Cooperative No 915 | | | 3.000 | % | | 02/01/26 | | | 198,368 | | |
| | 125,000 | | | Housing & Redevelopment Authority of The City of
St Paul Minnesota | | | 3.500 | % | | 09/01/26 | | | 118,876 | | |
| | 200,000 | | | City of Willmar MN | | | 5.000 | % | | 02/01/27 | | | 216,376 | | |
| | 100,000 | | | City of Richfield MN | | | 4.000 | % | | 02/01/27 | | | 104,997 | | |
| | 305,000 | | | State of Minnesota | | | 5.000 | % | | 08/01/27 | | | 330,008 | | |
| | 135,000 | | | City of Center City MN | | | 4.000 | % | | 11/01/27 | | | 135,465 | | |
| | 100,000 | | | City of Wayzata MN | | | 3.000 | % | | 12/01/27 | | | 100,023 | | |
| | 200,000 | | | North Branch Independent School District No 138 | | | 5.000 | % | | 02/01/28 | | | 218,500 | | |
| | 175,000 | | | City of Fridley MN | | | 4.000 | % | | 02/01/28 | | | 182,006 | | |
| | 110,000 | | | City of Cannon Falls MN | | | 4.000 | % | | 02/01/28 | | | 115,921 | | |
| | 210,000 | | | City of New Ulm MN | | | 4.000 | % | | 12/01/28 | | | 224,746 | | |
| | 95,000 | | | City of Apple Valley MN | | | 3.000 | % | | 12/15/28 | | | 97,050 | | |
| | 125,000 | | | City of Faribault MN | | | 4.000 | % | | 12/15/28 | | | 133,476 | | |
| | 120,000 | | | Minneapolis-St Paul Metropolitan Airports Commission | | | 5.000 | % | | 01/01/29 | | | 129,406 | | |
| | 125,000 | | | City of Faribault MN | | | 3.000 | % | | 12/15/29 | | | 125,733 | | |
| | 120,000 | | | City of Apple Valley MN | | | 3.000 | % | | 12/15/29 | | | 120,647 | | |
| | 200,000 | | | Minneapolis-St Paul Metropolitan Airports Commission | | | 5.000 | % | | 01/01/30 | | | 223,888 | | |
| | 185,000 | | | City of Hopkins MN | | | 2.000 | % | | 02/01/30 | | | 170,750 | | |
| | 215,000 | | | City of North Mankato MN | | | 4.000 | % | | 02/01/30 | | | 228,188 | | |
| | 110,000 | | | Rocori Area Schools Independent School District No 750 | | | 4.000 | % | | 02/01/30 | | | 115,854 | | |
| | 150,000 | | | Rosemount-Apple Valley-Eagan Independent School
District No 196 | | | 1.300 | % | | 04/01/30 | | | 127,462 | | |
| | 200,000 | | | City of Minneapolis MN | | | 2.000 | % | | 12/01/30 | | | 184,544 | | |
| | 150,000 | | | County of Hennepin MN | | | 5.000 | % | | 12/15/30 | | | 172,856 | | |
| | 200,000 | | | Duluth Independent School District No 709 | | | 0.000 | % (b) | | 02/01/31 | | | 147,428 | | |
| | 200,000 | | | North St Paul-Maplewood-Oakdale Independent School
District No 622 | | | 2.000 | % | | 02/01/31 | | | 182,137 | | |
37
Mairs & Power Minnesota Municipal Bond ETF
SCHEDULE OF INVESTMENTS (continued) December 31, 2022
Par Value | | Security Description | | Value | |
| | | FIXED INCOME SECURITIES (continued) | |
| | | MUNICIPAL BONDS (continued) | |
$ | 130,000 | | | St Cloud Housing & Redevelopment Authority | | | 2.000 | % | | 02/01/31 | | $ | 119,722 | | |
| | 325,000 | | | City of Elk River MN | | | 3.000 | % | | 02/01/31 | | | 326,558 | | |
| | 50,000 | | | Pelican Rapids Independent School District No 548 | | | 2.150 | % | | 02/01/31 | | | 47,130 | | |
| | 275,000 | | | Springfield Independent School District No 85 | | | 3.000 | % | | 02/01/31 | | | 275,107 | | |
| | 175,000 | | | Minneapolis-St Paul Metropolitan Airports Commission | | | 5.000 | % | | 01/01/32 | | | 187,878 | | |
| | 65,000 | | | Dakota County Community Development Agency | | | 2.000 | % | | 01/01/32 | | | 57,995 | | |
| | 195,000 | | | City of Carver MN | | | 3.000 | % | | 02/01/32 | | | 191,943 | | |
| | 200,000 | | | Pine City Independent School District No 578 | | | 2.000 | % | | 04/01/32 | | | 174,815 | | |
| | 365,000 | | | City of Elk River MN Electric Revenue | | | 3.000 | % | | 08/01/32 | | | 358,888 | | |
| | 75,000 | | | Housing & Redevelopment Authority of The City of
St Paul Minnesota | | | 4.000 | % | | 10/01/32 | | | 76,809 | | |
| | 100,000 | | | St Paul Public Library Agency | | | 3.000 | % | | 10/01/32 | | | 99,265 | | |
| | 110,000 | | | Housing & Redevelopment Authority of The City of
St Paul Minnesota | | | 3.125 | % | | 11/15/32 | | | 104,309 | | |
| | 200,000 | | | St Paul Independent School District No 625 | | | 3.000 | % | | 02/01/33 | | | 196,120 | | |
| | 200,000 | | | City of Carver MN | | | 3.000 | % | | 02/01/33 | | | 195,782 | | |
| | 115,000 | | | City of Madelia MN | | | 2.000 | % | | 02/01/33 | | | 101,569 | | |
| | 160,000 | | | St Cloud Housing & Redevelopment Authority | | | 2.000 | % | | 02/01/33 | | | 142,863 | | |
| | 300,000 | | | Hibbing Independent School District No 701 | | | 3.000 | % | | 03/01/33 | | | 297,545 | | |
| | 300,000 | | | City of St Paul MN | | | 2.000 | % | | 05/01/33 | | | 255,925 | | |
| | 120,000 | | | City of Minneapolis MN | | | 5.000 | % | | 11/15/33 | | | 128,387 | | |
| | 160,000 | | | County of Hennepin MN | | | 5.000 | % | | 12/15/33 | | | 182,967 | | |
| | 125,000 | | | Zumbro Education District | | | 4.000 | % | | 02/01/34 | | | 124,108 | | |
| | 200,000 | | | City of St Cloud MN | | | 2.000 | % | | 02/01/34 | | | 166,824 | | |
| | 300,000 | | | City of Hutchinson MN | | | 2.000 | % | | 02/01/34 | | | 249,599 | | |
| | 110,000 | | | Shakopee Independent School District No 720 | | | 3.500 | % | | 02/01/34 | | | 110,431 | | |
| | 275,000 | | | State of Minnesota | | | 5.000 | % | | 08/01/34 | | | 310,937 | | |
| | 115,000 | | | Minneapolis-St Paul Metropolitan Airports Commission | | | 5.000 | % | | 01/01/35 | | | 124,885 | | |
| | 350,000 | | | North St Paul-Maplewood-Oakdale Independent
School District No 622 | | | 3.000 | % | | 02/01/35 | | | 326,994 | | |
| | 100,000 | | | County of Pennington MN | | | 2.375 | % | | 02/01/35 | | | 87,361 | | |
| | 100,000 | | | St Paul Independent School District No 625 | | | 2.250 | % | | 02/01/35 | | | 83,756 | | |
| | 350,000 | | | County of St Louis MN | | | 2.000 | % | | 12/01/35 | | | 278,308 | | |
| | 100,000 | | | City of Coon Rapids MN | | | 2.500 | % | | 02/01/36 | | | 85,723 | | |
| | 500,000 | | | Minneapolis Special School District No 1 | | | 4.000 | % | | 02/01/36 | | | 516,981 | | |
| | 100,000 | | | University of Minnesota | | | 5.000 | % | | 04/01/36 | | | 105,428 | | |
| | 150,000 | | | Minnetonka Independent School District No 276 | | | 3.000 | % | | 07/01/36 | | | 139,439 | | |
| | 200,000 | | | Minnesota Higher Education Facilities Authority | | | 3.000 | % | | 10/01/36 | | | 168,876 | | |
| | 100,000 | | | City of Hanover MN | | | 3.300 | % | | 02/01/37 | | | 94,387 | | |
| | 225,000 | | | Fergus Falls Independent School District No 544 | | | 3.000 | % | | 02/01/37 | | | 206,549 | | |
| | 130,000 | | | Minnesota Higher Education Facilities Authority | | | 4.000 | % | | 03/01/37 | | | 133,579 | | |
| | 250,000 | | | Housing & Redevelopment Authority of The City of
St Paul Minnesota | | | 4.000 | % | | 10/01/37 | | | 245,517 | | |
38
Mairs & Power Minnesota Municipal Bond ETF
SCHEDULE OF INVESTMENTS (continued) December 31, 2022
Par Value/Shares | | Security Description | | Value | |
| | | FIXED INCOME SECURITIES (continued) | |
| | | MUNICIPAL BONDS (continued) | |
$ | 275,000 | | | Zumbro Education District | | | 4.000 | % | | 02/01/38 | | $ | 257,791 | | |
| | 295,000 | | | County of Wright MN | | | 3.000 | % | | 12/01/38 | | | 254,878 | | |
| | 250,000 | | | Rochester Independent School District No 535 | | | 2.500 | % | | 02/01/39 | | | 194,422 | | |
| | 485,000 | | | State of Minnesota | | | 5.000 | % | | 08/01/39 | | | 539,298 | | |
| | 250,000 | | | County of Wright MN | | | 3.000 | % | | 12/01/39 | | | 213,270 | | |
| | 545,000 | | | State of Minnesota | | | 5.000 | % | | 08/01/40 | | | 603,340 | | |
| | 175,000 | | | City of Minneapolis MN | | | 4.000 | % | | 11/15/40 | | | 166,278 | | |
| | 290,000 | | | City of Apple Valley MN | | | 4.000 | % | | 09/01/41 | | | 245,349 | | |
| | 400,000 | | | Minnesota Higher Education Facilities Authority | | | 3.000 | % | | 10/01/41 | | | 323,071 | | |
| | 500,000 | | | Anoka-Hennepin Independent School District No 11 | | | 3.000 | % | | 02/01/43 | | | 422,294 | | |
| | 125,000 | | | Minnesota Higher Education Facilities Authority | | | 3.000 | % | | 03/01/43 | | | 99,907 | | |
| | 100,000 | | | Western Minnesota Municipal Power Agency | | | 5.000 | % | | 01/01/49 | | | 105,660 | | |
| | | | 17,139,048 | | |
| | TOTAL FIXED INCOME SECURITIES
(cost $19,227,540) | | | | | | | | | | $ | 17,139,048 | | |
Shares | | | | | |
| | | SHORT-TERM INVESTMENTS 0.6% | |
| 97,161 | | | First American Government Obligations Fund, Class X, 0.0407% (c)
(cost $97,161) | | | | | | | | | | $ | 97,161 | | |
| | | | TOTAL INVESTMENTS 98.8%
(cost $19,324,701) | | | | | | | | | | $ | 17,236,209 | | |
| | | | | OTHER ASSETS AND LIABILITIES (NET) 1.2% | | | | | | | | | | | 203,263 | | |
| | | | | TOTAL NET ASSETS 100.0% | | | | | | | | | | $ | 17,439,472 | | |
(a) The date shown represents the earliest of the next put date or final maturity date.
(b) Zero coupon bond.
(c) The rate quoted is the annualized seven-day effective yield as of December 31, 2022.
See accompanying Notes to Financial Statements.
39
STATEMENTS OF ASSETS AND LIABILITIES December 31, 2022
| | | Mairs & Power
Growth Fund | | Mairs & Power
Balanced Fund | | Mairs & Power
Small Cap Fund | | Mairs & Power
Minnesota
Municipal
Bond ETF | |
ASSETS | |
| Investments, at fair value (Note 1) *: | |
Unaffiliated securities * | | $ | 4,270,387,295 | | | $ | 776,989,633 | | | $ | 335,502,260 | | | $ | 17,236,209 | | |
| Affiliated securities (Note 5) * | | | 57,750,566 | | | | - | | | | - | | | | - | | |
| | | | 4,328,137,861 | | | | 776,989,633 | | | | 335,502,260 | | | | 17,236,209 | | |
Cash | | | - | | | | 6,250 | | | | - | | | | - | | |
Receivable for Fund shares sold | | | 2,711,232 | | | | 150,145 | | | | 2,136,979 | | | | - | | |
Receivable for securities sold | | | 14,128,169 | | | | 532,165 | | | | 1,613,753 | | | | - | | |
Dividends and interest receivable | | | 6,316,847 | | | | 4,156,804 | | | | 74,900 | | | | 206,450 | | |
Prepaid expenses and other assets | | | 71,629 | | | | 27,996 | | | | 18,677 | | | | - | | |
| | | | 4,351,365,738 | | | | 781,862,993 | | | | 339,346,569 | | | | 17,442,659 | | |
LIABILITIES | |
Payable for Fund shares redeemed | | | 3,955,031 | | | | 320,637 | | | | 353,677 | | | | - | | |
Payable for securities purchased | | | 8,250,189 | | | | 167,622 | | | | 1,483,079 | | | | - | | |
| Payable to Affiliates (Note 7) | | | 385,320 | | | | 76,338 | | | | 32,642 | | | | - | | |
| Payable to ReFlow (Note 11) | | | 100,455 | | | | 13,029 | | | | 11,737 | | | | - | | |
Accrued investment management
fees (Note 4) | | | 2,070,407 | | | | 391,087 | | | | 227,047 | | | | 3,187 | | |
Accrued audit and tax fees | | | 19,551 | | | | 20,769 | | | | 20,092 | | | | - | | |
Other accrued fees | | | 99,121 | | | | 26,428 | | | | 16,864 | | | | - | | |
| | | | 14,880,074 | | | | 1,015,910 | | | | 2,145,138 | | | | 3,187 | | |
NET ASSETS | | $ | 4,336,485,664 | | | $ | 780,847,083 | | | $ | 337,201,431 | | | $ | 17,439,472 | | |
NET ASSETS CONSIST OF | |
Paid-in capital | | $ | 2,428,179,308 | | | $ | 583,816,634 | | | $ | 256,780,225 | | | $ | 800 | | |
Additional paid-in capital | | | - | | | | - | | | | - | | | | 19,896,618 | | |
Total distributable earnings | | | 1,908,306,356 | | | | 197,030,449 | | | | 80,421,206 | | | | (2,457,946 | ) | |
TOTAL NET ASSETS | | $ | 4,336,485,664 | | | $ | 780,847,083 | | | $ | 337,201,431 | | | $ | 17,439,472 | | |
Fund shares, par value | | $ | 0.01 | | | $ | 0.01 | | | $ | 0.01 | | | $ | 0.001 | | |
Authorized | | | unlimited | | | | unlimited | | | | unlimited | | | | unlimited | | |
Fund shares issued and outstanding | | | 36,750,994 | | | | 8,390,577 | | | | 12,759,298 | | | | 800,000 | | |
Net asset value per share | | $ | 118.00 | | | $ | 93.06 | | | $ | 26.43 | | | $ | 21.80 | | |
* Cost of investments | | | | | | | | | |
Cost of unaffiliated securities | | $ | 2,383,503,406 | | | $ | 586,103,977 | | | $ | 255,706,431 | | | $ | 19,324,701 | | |
| Cost of affiliated securities (Note 5) | | | 63,436,098 | | | | - | | | | - | | | | - | | |
| | | $ | 2,446,939,504 | | | $ | 586,103,977 | | | $ | 255,706,431 | | | $ | 19,324,701 | | |
See accompanying Notes to Financial Statements.
40
STATEMENTS OF OPERATIONS Year Ended December 31, 2022
| | | Mairs & Power
Growth Fund | | Mairs & Power
Balanced Fund | | Mairs & Power
Small Cap Fund | | Mairs & Power
Minnesota
Municipal
Bond ETF | |
INVESTMENT INCOME | |
Income: | |
Dividends from unaffiliated securities * | | $ | 66,162,594 | | | $ | 9,773,578 | | | $ | 4,029,084 | | | $ | - | | |
Dividends from affiliated securities
(Note 5) | | | 950,860 | | | | - | | | | - | | | | - | | |
Interest income | | | - | | | | 12,015,889 | | | | - | | | | 301,178 | | |
TOTAL INCOME | | | 67,113,454 | | | | 21,789,467 | | | | 4,029,084 | | | | 301,178 | | |
Expenses: | |
| Investment management fees (Note 4) | | | 26,898,147 | | | | 5,226,372 | | | | 2,921,144 | | | | 68,443 | | |
| Transfer agent fees (Note 7) | | | 1,595,633 | | | | 302,858 | | | | 175,560 | | | | - | | |
| Fund administration fees (Note 7) | | | 755,137 | | | | 146,621 | | | | 67,212 | | | | - | | |
| Fund accounting fees (Note 7) | | | 483,482 | | | | 119,811 | | | | 37,435 | | | | - | | |
| Custodian fees (Note 7) | | | 248,549 | | | | 46,795 | | | | 20,150 | | | | - | | |
Printing and mailing fees | | | 218,306 | | | | 54,145 | | | | 35,282 | | | | - | | |
Legal and audit fees | | | 112,491 | | | | 42,113 | | | | 32,940 | | | | - | | |
| ReFlow fees (Note 11) | | | 100,655 | | | | 13,029 | | | | 11,737 | | | | - | | |
Trustees' fees | | | 76,789 | | | | 15,297 | | | | 7,780 | | | | - | | |
| Chief Compliance Officer fees (Note 7) | | | 8,449 | | | | 7,465 | | | | 7,337 | | | | - | | |
Other fees | | | 205,106 | | | | 63,988 | | | | 47,809 | | | | - | | |
TOTAL EXPENSES | | | 30,702,744 | | | | 6,038,494 | | | | 3,364,386 | | | | 68,443 | | |
NET INVESTMENT INCOME | | | 36,410,710 | | | | 15,750,973 | | | | 664,698 | | | | 232,735 | | |
| REALIZED AND UNREALIZED GAIN (LOSS) (Note 4) | |
Net realized gain (loss) on investments | |
Unaffiliated issuers | | | 248,617,133 | | | | 35,870,771 | | | | 15,867,849 | | | | (370,658 | ) | |
| Affiliated issuers (Note 5) | | | (97,239 | ) | | | - | | | | - | | | | - | | |
Redemptions in-kind | | | 43,473,964 | | | | 5,591,645 | | | | 4,198,239 | | | | - | | |
| | | | 291,993,858 | | | | 41,462,416 | | | | 20,066,088 | | | | (370,658 | ) | |
Change in net unrealized appreciation/
depreciation on investments | |
Unaffiliated issuers | | | (1,545,762,542 | ) | | | (207,886,965 | ) | | | (79,413,681 | ) | | | (2,159,038 | ) | |
| Affiliated issuers (Note 5) | | | (18,287,019 | ) | | | - | | | | - | | | | - | | |
| | | | (1,564,049,561 | ) | | | (207,886,965 | ) | | | (79,413,681 | ) | | | (2,159,038 | ) | |
NET LOSS ON INVESTMENTS | | | (1,272,055,703 | ) | | | (166,424,549 | ) | | | (59,347,593 | ) | | | (2,529,696 | ) | |
NET DECREASE IN NET ASSETS
FROM OPERATIONS | | $ | (1,235,644,993 | ) | | $ | (150,673,576 | ) | | $ | (58,682,895 | ) | | $ | (2,296,961 | ) | |
* Net of foreign taxes withheld and fees of: | | $ | 696,936 | | | $ | 49,804 | | | $ | - | | | $ | - | | |
See accompanying Notes to Financial Statements.
41
Mairs & Power Growth Fund
STATEMENTS OF CHANGES IN NET ASSETS
| | | Year Ended
December 31,
2022 | | Year Ended
December 31,
2021 | |
OPERATIONS | |
Net investment income | | $ | 36,410,710 | | | $ | 30,151,298 | | |
Net realized gain on investments sold | | | 291,993,858 | | | | 464,820,115 | | |
Net change in unrealized appreciation/depreciation of investments | | | (1,564,049,561 | ) | | | 893,526,366 | | |
NET INCREASE (DECREASE) IN NET ASSETS FROM OPERATIONS | | | (1,235,644,993 | ) | | | 1,388,497,779 | | |
DISTRIBUTIONS TO SHAREHOLDERS | | | (359,003,743 | ) | | | (453,637,206 | ) | |
CAPITAL TRANSACTIONS | |
Proceeds from shares sold | | | 213,375,112 | | | | 198,856,879 | | |
Reinvestment of distributions | | | 335,444,125 | | | | 421,862,552 | | |
Cost of shares redeemed | | | (567,846,097 | )(1) | | | (463,607,896 | ) | |
INCREASE (DECREASE) IN NET ASSETS FROM CAPITAL
TRANSACTIONS | | | (19,026,860 | ) | | | 157,111,535 | | |
TOTAL INCREASE (DECREASE) IN NET ASSETS: | | | (1,613,675,596 | ) | | | 1,091,972,108 | | |
NET ASSETS | |
Beginning of year | | | 5,950,161,260 | | | | 4,858,189,152 | | |
End of year | | $ | 4,336,485,664 | | | $ | 5,950,161,260 | | |
FUND SHARE TRANSACTIONS | |
Shares sold | | | 1,594,383 | | | | 1,275,694 | | |
Shares issued for reinvested distributions | | | 2,797,786 | | | | 2,616,009 | | |
Shares redeemed | | | (4,246,139 | )(1) | | | (2,987,997 | ) | |
NET INCREASE IN FUND SHARES | | | 146,030 | | | | 903,706 | | |
(1) Includes redemption in-kind transactions. See additional information contained in Note 11.
See accompanying Notes to Financial Statements.
42
Mairs & Power Balanced Fund
STATEMENTS OF CHANGES IN NET ASSETS
| | | Year Ended
December 31,
2022 | | Year Ended
December 31,
2021 | |
OPERATIONS | |
Net investment income | | $ | 15,750,973 | | | $ | 14,165,258 | | |
Net realized gain on investments sold | | | 41,462,416 | | | | 56,802,196 | | |
Net change in unrealized appreciation/depreciation of investments | | | (207,886,965 | ) | | | 90,941,913 | | |
NET INCREASE (DECREASE) IN NET ASSETS FROM OPERATIONS | | | (150,673,576 | ) | | | 161,909,367 | | |
DISTRIBUTIONS TO SHAREHOLDERS | | | (53,002,212 | ) | | | (62,569,410 | ) | |
CAPITAL TRANSACTIONS | |
Proceeds from shares sold | | | 41,813,579 | | | | 70,367,342 | | |
Reinvestment of distributions | | | 51,362,388 | | | | 60,674,913 | | |
Cost of shares redeemed | | | (131,604,263 | )(1) | | | (102,683,757 | ) | |
INCREASE (DECREASE) IN NET ASSETS FROM CAPITAL
TRANSACTIONS | | | (38,428,296 | ) | | | 28,358,498 | | |
TOTAL INCREASE (DECREASE) IN NET ASSETS: | | | (242,104,084 | ) | | | 127,698,455 | | |
NET ASSETS | |
Beginning of year | | | 1,022,951,167 | | | | 895,252,712 | | |
End of year | | $ | 780,847,083 | | | $ | 1,022,951,167 | | |
FUND SHARE TRANSACTIONS | |
Shares sold | | | 406,105 | | | | 613,763 | | |
Shares issued for reinvested distributions | | | 539,062 | | | | 524,235 | | |
Shares redeemed | | | (1,305,931 | )(1) | | | (894,478 | ) | |
NET INCREASE (DECREASE) IN FUND SHARES | | | (360,764 | ) | | | 243,520 | | |
(1) Includes redemption in-kind transactions. See additional information contained in Note 11.
See accompanying Notes to Financial Statements.
43
Mairs & Power Small Cap Fund
STATEMENTS OF CHANGES IN NET ASSETS
| | | Year Ended
December 31,
2022 | | Year Ended
December 31,
2021 | |
OPERATIONS | |
Net investment income | | $ | 664,698 | | | $ | 103,065 | | |
Net realized gain on investments sold | | | 20,066,088 | | | | 42,489,046 | | |
Net change in unrealized appreciation/depreciation of investments | | | (79,413,681 | ) | | | 49,431,355 | | |
NET INCREASE (DECREASE) IN NET ASSETS FROM OPERATIONS | | | (58,682,895 | ) | | | 92,023,466 | | |
DISTRIBUTIONS TO SHAREHOLDERS | | | (20,863,780 | ) | | | (33,571,862 | ) | |
CAPITAL TRANSACTIONS | |
Proceeds from shares sold | | | 48,415,834 | | | | 37,409,155 | | |
Reinvestment of distributions | | | 20,228,875 | | | | 32,598,477 | | |
Cost of shares redeemed (1) | | | (79,153,217 | )(2) | | | (62,797,031 | ) | |
INCREASE (DECREASE) IN NET ASSETS FROM CAPITAL
TRANSACTIONS | | | (10,508,508 | ) | | | 7,210,601 | | |
TOTAL INCREASE (DECREASE) IN NET ASSETS: | | | (90,055,183 | ) | | | 65,662,205 | | |
NET ASSETS | |
Beginning of year | | | 427,256,614 | | | | 361,594,409 | | |
End of year | | $ | 337,201,431 | | | $ | 427,256,614 | | |
FUND SHARE TRANSACTIONS | |
Shares sold | | | 1,684,901 | | | | 1,133,844 | | |
Shares issued for reinvested distributions | | | 762,491 | | | | 1,018,384 | | |
Shares redeemed | | | (2,757,980 | )(2) | | | (1,927,537 | ) | |
NET INCREASE (DECREASE) IN FUND SHARES | | | (310,588 | ) | | | 224,691 | | |
| (1) Net of redemption fees of: | | $ | 12,163 | | | $ | 12,734 | | |
(2) Includes redemption in-kind transactions. See additional information contained in Note 11.
See accompanying Notes to Financial Statements.
44
Mairs & Power Minnesota Municipal Bond ETF
STATEMENTS OF CHANGES IN NET ASSETS
| | | Year Ended
December 31,
2022 | | Period Ended
December 31,
2021 (1) | |
OPERATIONS | |
Net investment income | | $ | 232,735 | | | $ | 94,805 | | |
Net realized loss on investments sold | | | (370,658 | ) | | | (362 | ) | |
Net change in unrealized appreciation/depreciation of investments | | | (2,159,038 | ) | | | 70,546 | | |
NET INCREASE (DECREASE) IN NET ASSETS FROM OPERATIONS | | | (2,296,961 | ) | | | 164,989 | | |
DISTRIBUTIONS TO SHAREHOLDERS | | | (231,169 | ) | | | (96,326 | ) | |
CAPITAL TRANSACTIONS | |
Proceeds from shares sold | | | 5,601,935 | | | | 18,545,349 | | |
Cost of shares redeemed | | | (4,268,958 | ) | | | - | | |
| Transaction fees (Note 8) | | | 15,199 | | | | 5,414 | | |
INCREASE IN NET ASSETS FROM CAPITAL TRANSACTIONS | | | 1,348,176 | | | | 18,550,763 | | |
TOTAL INCREASE (DECREASE) IN NET ASSETS: | | | (1,179,954 | ) | | | 18,619,426 | | |
NET ASSETS | |
Beginning of year | | | 18,619,426 | | | | - | | |
End of year | | $ | 17,439,472 | | | $ | 18,619,426 | | |
FUND SHARE TRANSACTIONS | |
Shares sold | | | 250,000 | | | | 740,000 | | |
Shares redeemed | | | (190,000 | ) | | | - | | |
NET INCREASE IN FUND SHARES | | | 60,000 | | | | 740,000 | | |
(1) Period from March 11, 2021 (commencement of operations) through December 31, 2021.
See accompanying Notes to Financial Statements.
45
NOTES TO THE FINANCIAL STATEMENTS December 31, 2022
Trust for Professional Managers (the "Trust") was organized as a Delaware statutory trust under a Declaration of Trust dated May 29, 2001. The Trust is registered under the Investment Company Act of 1940, as amended (the "1940 Act"), as an open-end, management investment company. The Mairs & Power Funds (the "Funds") are comprised of the Mairs & Power Growth Fund (the "Growth Fund"), Mairs & Power Balanced Fund (the "Balanced Fund"), Mairs & Power Small Cap Fund (the "Small Cap Fund") (collectively, the "Mutual Funds") and the Mairs & Power Minnesota Municipal Bond ETF (the "Minnesota ETF"), each representing a distinct series with its own investment objective and policies within the Trust.
The investment objective of the Growth Fund is to provide shareholders with a diversified portfolio of common stocks, which have the potential for above-average, long- term appreciation. The investment objective of the Balanced Fund is to provide capital growth, current income and preservation of capital. The investment objective of the Small Cap Fund is to seek above-average, long-term appreciation.
Pursuant to three tax-free reorganizations that took place after the close of business on April 29, 2022 (each such transaction, a "Reorganization," and collectively, the "Reorganizations"), the Growth Fund, the Balanced Fund and the Small Cap Fund are the successors to the Mairs & Power Growth Fund (the "Predecessor Growth Fund"), the Mairs & Power Balanced Fund (the "Predecessor Balanced Fund") and the Mairs & Power Small Cap Fund (the "Predecessor Small Cap Fund," and together with the Predecessor Growth Fund and the Predecessor Balanced Fund, the "Predecessor Funds"), respectively, each a series of Mairs & Power Funds Trust. Each Predecessor Fund was deemed to be the accounting survivor of its Reorganization for financial reporting purposes and as a result, the financial statements of each Mutual Fund reflect the operations of the corresponding Predecessor Fund for the period prior to April 29, 2022. Two-thirds of the Reorganization costs were paid by the Mutual Funds' investment adviser and the Mutual Funds paid the remaining one-third of the costs.
The following table illustrates the specifics of the Reorganization:
| | Predecessor
Fund
Net Assets* | | Shares Issued to
Shareholders of
Predecessor
Funds | | Mutual Fund
Net Assets | | Combined
Net Assets | |
Growth Fund(1) | | $ | 4,925,878,421 | | | | 35,901,368 | | | $ | - | | | $ | 4,925,878,421 | | |
Balanced Fund(2) | | | 890,697,396 | | | | 8,627,959 | | | | - | | | | 890,697,396 | | |
Small Cap Fund(3) | | | 357,977,711 | | | | 12,779,782 | | | | - | | | | 357,977,711 | | |
(1) Includes accumulated net investment income, accumulated realized gains and unrealized appreciation in the amounts of $17,951,171, $285,674,754 and $2,369,969,445, respectively.
(2) Includes accumulated net investment income, accumulated realized gains and unrealized appreciation in the amounts of $1,711,962, $29,195,158 and $263,238,231, respectively.
(3) Includes accumulated net investment income, accumulated realized gains and unrealized appreciation in the amounts of $2,882,205, $27,509,087 and $83,577,770, respectively.
The Predecessor Growth Fund commenced operations on November 7, 1958. The Predecessor Balanced Fund commenced operations on January 10, 1961. The Predecessor Small Cap Fund commenced operations on August 11, 2011.
The Minnesota ETF is an actively-managed exchange-traded fund. The investment objective of the Minnesota ETF is to seek current income that is exempt from federal and Minnesota state income tax consistent with the preservation of capital. The Minnesota ETF commenced operations on March 11, 2021.
Costs incurred by the Funds in connection with the organization and the initial public offering of shares were paid by Mairs & Power, Inc. (the "Adviser"), the Funds' investment adviser. The Trust may issue an unlimited number of shares of beneficial interest at par value of $0.01 and $0.001 for the Mutual Funds and Minnesota ETF, respectively. The assets of the Funds' are segregated, and a shareholder's interest is limited to the fund in which shares are held.
46
NOTES TO THE FINANCIAL STATEMENTS (continued) December 31, 2022
Note 1 – Organization (continued)
The Funds are investment companies and accordingly follows the investment company accounting and reporting guidance of the Financial Accounting Standards Board ("FASB") Accounting Standards Codification ("ASC") Topic 946 "Financial Services – Investment Companies".
Note 2 – Significant Accounting Policies
The following is a summary of significant accounting policies consistently followed by the Funds in the preparation of the financial statements. These policies are in conformity with generally accepted accounting principles in the United States of America ("GAAP").
Investment Valuation
Each equity security owned by a Fund that is listed on a securities exchange, except for securities listed on the NASDAQ Stock Market LLC ("NASDAQ"), is valued at its last sale price on the exchange on the date as of which assets are valued. When the security is listed on more than one exchange, the Fund will use the price of the exchange that the Fund generally considers to be the principal exchange on which the stock is traded. Fund securities listed on NASDAQ will be valued at the NASDAQ Official Closing Price ("NOCP"), which may not necessarily represent the last sale price. If the NOCP is not available, such securities shall be valued at the last sale price on the day of valuation. If there has been no sale on such exchange or on NASDAQ on such day, the security is valued at (i) the mean between the most recent quoted bid and asked prices at the close of the exchange on such day or (ii) the latest sales price on the Composite Market for the day such security is being valued. "Composite Market" means a consolidation of the trade information provided by national securities and foreign exchanges and over-the- counter markets as published by an approved independent pricing service (a "Pricing Service").
Debt securities, such as U.S. government securities, corporate securities, municipal securities and asset-backed and mortgage-backed securities, including short-term debt instruments having a maturity of 60 days or less, are valued at the mean in accordance with prices supplied by a Pricing Service. Pricing Services may use various valuation methodologies such as the mean between the bid and the asked prices, matrix pricing and other analytical pricing models as well as market transactions and dealer quotations. If a price is not available from a Pricing Service, the most recent quotation obtained from one or more broker-dealers known to follow the issue will be obtained. Quotations will be valued at the mean between the bid and the offer. In the absence of available quotations, the securities will be priced at fair value. Any discount or premium is accreted or amortized over the expected life of the respective security using the constant yield to maturity method. Pricing Services generally value debt securities assuming orderly transactions of an institutional round lot size, but such securities may be held or transactions may be conducted in such securities in smaller, odd lot sizes. Odd lots often trade at lower prices than institutional round lots.
Demand notes and repurchase agreements are valued at cost. If cost does not represent current market value the securities will be priced at fair value.
Redeemable securities issued by open-end, registered investment companies are valued at the net asset values ("NAVs") of such companies for purchase and/or redemption orders placed on that day. If, on a particular day, a share of an investment company is not listed on NASDAQ, such security's fair value will be determined.
When market quotations are not readily available, any security or other asset is valued at its fair value in accordance with Rule 2a-5 of the 1940 Act as determined under the Adviser's fair value pricing procedures, subject to oversight by the Trust's Board of Trustees (the "Board"). These fair value procedures will also be used to price a security when corporate events, events in the securities market or world events cause the Adviser to believe that a security's last sale price may not reflect its actual fair market value. The intended effect of using fair value pricing procedures is to ensure that each Fund is accurately priced.
47
NOTES TO THE FINANCIAL STATEMENTS (continued) December 31, 2022
Note 2 – Significant Accounting Policies (continued)
Investment Valuation (continued)
FASB ASC Topic 820, "Fair Value Measurements and Disclosures" ("ASC 820"), establishes an authoritative definition of fair value and sets out a hierarchy for measuring fair value. ASC 820 requires an entity to evaluate certain factors to determine whether there has been a significant decrease in volume and level of activity for the security such that recent transactions and quoted prices may not be determinative of fair value and further analysis and adjustment may be necessary to estimate fair value. ASC 820 also requires enhanced disclosure regarding the inputs and valuation techniques used to measure fair value in those instances as well as expanded disclosure of valuation levels for each class of investments. These inputs are summarized in the three broad levels listed below:
• Level 1 – Quoted prices in active markets for identical securities.
• Level 2 – Other significant observable inputs (including quoted prices for similar securities, interest rates, prepayment speeds, credit risk, etc.).
• Level 3 – Significant unobservable inputs (including the Fund's own assumptions in determining the fair value of investments).
The inputs or methodology used for valuing securities are not necessarily an indication of the risk associated with investing in those securities. The following is a summary of the inputs used to value the Funds' investments carried at fair value as of December 31, 2022:
| | | Growth Fund | | Balanced Fund | | Small Cap Fund | | Minnesota ETF | |
Level 1* | | $ | 4,328,137,861 | | | $ | 513,398,729 | | | $ | 335,502,260 | | | $ | 97,161 | | |
Level 2** | | | - | | | | 263,590,904 | | | | - | | | | 17,139,048 | | |
Level 3 | | | - | | | | - | | | | - | | | | - | | |
Total | | $ | 4,328,137,861 | | | $ | 776,989,633 | | | $ | 335,502,260 | | | $ | 17,236,209 | | |
* All Level 1 investments are equity securities (common stocks and preferred stocks) and short-term investments.
** All Level 2 investments are fixed income securities.
For detail of securities by major sector classification for the Funds, please refer to the Schedules of Investments.
The Funds did not hold any Level 3 investments during the year ended December 31, 2022.
The Funds did not hold any financial derivative instruments during the year ended December 31, 2022.
Federal Income Taxes
The Funds intend to comply with the requirements of Subchapter M of the Internal Revenue Code of 1986 (the "Code"), as amended, necessary to qualify as a regulated investment company and to make the requisite distributions of income and capital gains to its shareholders sufficient to relieve it from all or substantially all federal income taxes. Therefore, no federal income tax provision has been provided.
The Funds' federal income tax returns are subject to examination by the Internal Revenue Service (the "IRS") for a period of three fiscal years after they are filed. State and local tax returns may be subject to examination for an additional fiscal year depending on the jurisdiction. As of and during the period ended December 31, 2022, the Funds did not have a liability for any unrecognized tax benefits.
The Funds recognize interest and penalties, if any, related to uncertain tax benefits as income tax expense in the Statements of Operations. During the year, the Funds did not incur any interest or penalties.
Distributions to Shareholders
In general, the Growth Fund will distribute any net investment income semiannually. The Balanced Fund will distribute any net investment income quarterly. The Small Cap Fund will distribute any net investment income at least annually. The Minnesota ETF will distribute any net investment income monthly. The Funds will
48
NOTES TO THE FINANCIAL STATEMENTS (continued) December 31, 2022
Note 2 – Significant Accounting Policies (continued)
Distributions to Shareholders (continued)
distribute any net realized long- or short-term capital gains, if any, at least annually. Distributions from net realized gains for book purposes may include short-term capital gains. All short-term capital gains are included in ordinary income for tax purposes.
Distributions to shareholders are recorded on the ex-dividend date. The Funds may also pay a special distribution at the end of the calendar year to comply with federal tax requirements. Income and capital gain distributions may differ from GAAP, primarily due to timing differences in the recognition of income, gains and losses by the Funds. To the extent that these differences are attributable to permanent book and tax accounting differences, the components of net assets have been adjusted.
The Minnesota ETF intends to make distributions that are exempt from federal and Minnesota state income tax, in the form of exempt-interest dividends. However, some of the Minnesota ETF's distributions other than exempt-interest dividends may be taxed as ordinary income or capital gains (or a combination). The Minnesota ETF may invest a portion of its assets in securities that generate income that is not exempt from federal income tax or Minnesota state income tax. Income exempt from federal income tax may be subject to state and local income tax. The federal income tax status of all distributions made by the Minnesota ETF for the preceding year will be reported annually to shareholders.
Use of Estimates
The preparation of financial statements in conformity with GAAP requires management to make estimates and assumptions that affect the reported amounts of assets and liabilities and disclosure of contingent assets and liabilities at the date of the financial statements and the reported amounts of revenues and expenses during the reporting period. Actual results could differ from those estimates.
Share Transactions
The NAV per share of a Fund is calculated by dividing the sum of the value of the securities held by the Fund, plus cash or other assets, minus all liabilities (including estimated accrued expenses) divided by the total number of shares outstanding for the Fund, rounded to the nearest cent. The Funds' shares will not be priced on the days on which the New York Stock Exchange ("NYSE") is closed for trading.
Expenses
Expenses associated with a specific fund in the Trust are charged to that fund. Common expenses are typically allocated evenly between the series of the Trust, or by other equitable means.
Other
Investment transactions are recorded on the trade date. The Funds determine the gain or loss from investment transactions on the identified cost basis by comparing the cost of the security lot sold with the net sales proceeds. Any discount or premium on securities purchased are accreted or amortized over the expected life of the respective securities using the constant yield method. Dividend income, less foreign withholding tax, is recognized on the ex-dividend date and interest income is recognized on an accrual basis. Withholding taxes on foreign dividends and interest, net of any reclaims, have been provided for in accordance with the Funds' understanding of the applicable country's tax rules and rates.
49
NOTES TO THE FINANCIAL STATEMENTS (continued) December 31, 2022
Note 3 – Federal Tax Matters
At December 31, 2022, the Mutual Funds' components of accumulated earnings (losses) on a tax basis were as follows:
| | | Growth Fund | | Balanced Fund | | Small Cap Fund | |
Cost of investments | | $ | 2,446,939,504 | | | $ | 586,104,983 | | | $ | 256,403,202 | | |
Gross unrealized appreciation | | $ | 2,181,322,380 | | | $ | 240,239,191 | | | $ | 110,261,270 | | |
Gross unrealized depreciation | | | (300,124,023 | ) | | | (49,354,541 | ) | | | (31,162,212 | ) | |
| Net unrealized appreciation | | | 1,881,198,357 | | | | 190,884,650 | | | | 79,099,058 | | |
| Undistributed ordinary income | | | 976,123 | | | | 290,512 | | | | 99,363 | | |
Undistributed long-term capital gains | | | 26,131,876 | | | | 5,936,287 | | | | 1,222,785 | | |
| Distributable earnings | | | 27,107,999 | | | | 6,145,799 | | | | 1,322,148 | | |
Other accumulated earnings | | | - | | | | - | | | | - | | |
Total distributable earnings | | $ | 1,908,306,356 | | | $ | 197,030,449 | | | $ | 80,421,206 | | |
The Mutual Funds' tax character of distributions paid during the years ended December 31, 2022 and December 31, 2021 were as follows:
Year ended December 31, 2022 | |
Distributions paid from: | | Growth Fund | | Balanced Fund | | Small Cap Fund | |
Ordinary income | | $ | 35,434,587 | | | $ | 15,541,461 | | | $ | 565,335 | | |
Long-term capital gains | | | 323,569,156 | | | | 37,460,751 | | | | 20,298,445 | | |
Total distributions paid | | $ | 359,003,743 | | | $ | 53,002,212 | | | $ | 20,863,780 | | |
Year ended December 31, 2021 | |
Distributions paid from: | | Growth Fund | | Balanced Fund | | Small Cap Fund | |
Ordinary income | | $ | 30,356,013 | | | $ | 14,165,258 | | | $ | 1,311,178 | | |
Long-term capital gains | | | 423,281,193 | | | | 48,404,152 | | | | 32,260,684 | | |
Total distributions paid | | $ | 453,637,206 | | | $ | 62,569,410 | | | $ | 33,571,862 | | |
As of December 31, 2022, none of the Mutual Funds had capital loss carryforwards.
In addition, GAAP requires that certain components of net assets relating to permanent difference be reclassified between financial and tax reporting. The permanent differences primarily relate to utilization of earnings and profits distributed to shareholders on redemption of shares and distribution reclasses and securities redeemed in-kind. These reclassifications have no effect on net assets or net asset value per share. On the Statements of Assets and Liabilities, the following reclassifications were made for the year end ended December 31, 2022:
| | Total Distributable
Earnings | | Paid in Capital | |
Growth Fund | | $ | (69,405,728 | ) | | $ | 69,405,728 | | |
Balanced Fund | | | (9,443,244 | ) | | | 9,443,244 | | |
Small Cap Fund | | | (7,188,736 | ) | | | 7,188,736 | | |
Minnesota ETF
As of December 31, 2022, the Minnesota ETF's cost and unrealized on investments on a tax basis were as follows:
Cost of investments for tax purposes | | $ | 19,324,701 | | |
Gross tax unrealized appreciation | | $ | 2,842 | | |
Gross tax unrealized depreciation | | | (2,091,334 | ) | |
Net tax unrealized appreciation | | $ | (2,088,492 | ) | |
50
NOTES TO THE FINANCIAL STATEMENTS (continued) December 31, 2022
Note 3 – Federal Tax Matters (continued)
Minnesota ETF (continued)
As of November 30, 2022, the Minnesota ETF's tax year end, the tax basis of distributable earnings/(accumulated losses) were as follows:
Undistributed ordinary income | | $ | 8,962 | | |
Other accumulated losses | | | (371,020 | ) | |
| Unrealized depreciation on investments | | | (2,152,252 | ) | |
Total distributable earnings | | $ | (2,514,310 | ) | |
At November 30, 2022, the Minnesota ETF had short-term and long-term capital losses of $241,995 and $129,025, respectively, which will be carried forward indefinitely to offset future realized capital gains. To the extent the Minnesota ETF realizes future net capital gains, taxable distributions to its shareholders will be first offset by any unused capital loss carryovers from the period ended November 30, 2022.
The Minnesota ETF's tax character of distributions paid during the years ended November 30, 2022 and November 30, 2021 were as follows:
Period ended November 30, 2022 | |
Distributions paid from: | |
Ordinary income | | $ | 2,453 | | |
Tax-exempt income | | | 223,112 | | |
Long-term capital gains | | | - | | |
Total distributions paid | | $ | 225,565 | | |
Period ended November 30, 2021 | |
Distributions paid from: | |
Ordinary income | | $ | 268 | | |
Tax-exempt income | | | 71,382 | | |
Long-term capital gains | | | - | | |
Total distributions paid | | $ | 71,650 | | |
For the year ended December 31, 2022, the Minnesota ETF had no required reclassifications to certain components of net assets related financial and tax reporting.
Note 4 – Investment Adviser
The Trust has an investment advisory agreement (the "Mutual Funds Agreement") with the Adviser to furnish investment advisory services to the Mutual Funds. Under the terms of the Mutual Funds Agreement between the Trust, on behalf of each Mutual Fund, and the Adviser, the Adviser is paid a monthly fee on average daily net assets at the following annual rates for the Mutual Funds:
| | | Growth Fund | | Balanced Fund | | Small Cap Fund | |
Up to $2.5 Billion | | | 0.60 | % | | | 0.60 | % | | | 0.80 | % | |
Over $2.5 Billion | | | 0.50 | % | | | 0.60 | % | | | 0.80 | % | |
Under the investment advisory agreement, the Adviser has agreed to reimburse the Growth Fund or Balanced Fund in the event that the total expenses incurred by either Fund in any fiscal year, excluding interest, taxes, brokerage commissions and extraordinary litigation costs, but including payments to the Adviser, shall exceed 1.50% of the first $30 million dollars and 1.00% of the balance of the average value of the net assets of the Fund during such fiscal year, based upon computations of such value made as of the close of business on the last valuation day of each month during such fiscal year. Any amounts waived or reimbursed by the Adviser pursuant to the investment advisory agreement may not be recouped.
The Adviser has also agreed to waive its management fees and/or reimburse expenses of the Growth Fund, Balanced Fund or Small Cap Fund for a period of two years following the closing of the Reorganizations, to the
51
NOTES TO THE FINANCIAL STATEMENTS (continued) December 31, 2022
Note 4 – Investment Adviser (continued)
extent that Covered Expenses (defined below) accrued for the twelve months ending on the first anniversary of the closing of the Reorganizations and the twelve months ending on the second anniversary of the Reorganizations exceed $137,000, $72,000 and $62,500, respectively. Covered Expenses shall be limited to outside legal expenses, audit and tax expenses, trustees' fees, insurance expenses, ICI membership fees, and chief compliance officer fees (Covered Expenses).
In addition, the Trust, on behalf of the Minnesota ETF, has entered into an investment advisory agreement (the "ETF Agreement") with the Adviser to furnish investment advisory services to the Minnesota ETF. Pursuant to the ETF Agreement, the Minnesota ETF pays a unitary management fee to the Adviser, which is calculated daily and paid monthly, at an annual rate of 0.39% of the Minnesota ETF's average daily net assets. The Adviser has agreed to pay all expenses of the Minnesota ETF except the unitary management fee paid to the Adviser under the ETF Agreement, interest charges on any borrowings, dividends and other expenses on securities sold short, taxes, brokerage commissions and other expenses incurred in placing orders for the purchase and sale of securities and other investment instruments, acquired fund fees and expenses, accrued deferred tax liability, extraordinary expenses, distribution fees and expenses paid by the Minnesota ETF under any distribution plan adopted pursuant to Rule 12b-1 under the 1940 Act.
Note 5 – Transactions With Affiliated Companies
The Growth Fund owned 5% or more of the voting securities of the company noted in the table below during the year ended December 31, 2022. As a result, this company is deemed an affiliate of the Growth Fund as defined by the 1940 Act. Transactions during the period in this security were as follows:
Growth Fund
Security
Name | | Share
Balance
12/31/22 | | Fair
Value at
12/31/21 | | Purchases | | Sales | | Realized
Gain
(Loss)(1) | | Change in
Unrealized
Appreciation | | Fair
Value at
12/31/22 | | Dividend
Income(1) | |
Tennant Co | | | 937,966 | | | $ | 76,985,245 | | | $ | 2,032,174 | | | $ | 2,882,595 | | | $ | (97,239 | ) | | $ | (18,287,019 | ) | | $ | 57,750,566 | | | $ | 950,860 | | |
(1) Dividend income and realized gain amounts are reported for the period in which the security was deemed an affiliate.
Note 6 – Distribution Agreement
Foreside Fund Services, LLC (the "Distributor") serves as the Mutual Funds' distributor pursuant to a Distribution Agreement and the Minnesota ETF's distributor pursuant to an ETF Distributor Agreement. The Distributor receives compensation for the statutory underwriting services it provides to the Funds. The Distributor enters into agreements with certain broker-dealers and others that will allow those parties to be "Authorized Participants" and to subscribe for and redeem shares of the Minnesota ETF. With respect to the Minnesota ETF, the Distributor will not distribute shares in less than whole Creation Units and does not maintain a secondary market in shares.
Note 7 – Related Party Transactions
U.S. Bancorp Fund Services, LLC, doing business as U.S. Bank Global Fund Services ("Fund Services" or the "Administrator"), acts as the Funds' administrator under a Fund Servicing Agreement. The Administrator prepares various federal and state regulatory filings, reports and returns for the Funds; prepares reports and materials to be supplied to the Trustees; monitors the activities of the Funds' custodian, transfer agent and fund accountant; coordinates the preparation and payment of the Funds' expenses; and reviews the Funds' expense accruals. Fund Services also serves as the fund accountant and transfer agent to the Funds. U.S. Bank N.A. (the "Custodian"), an affiliate of Fund Services, serves as the Funds' custodian pursuant to a Custody Agreement. The Trust's Chief Compliance Officer is also an employee of Fund Services. Under the terms of the ETF Agreement, the Adviser pays the Minnesota ETF's administrative, custody, transfer agency,
52
NOTES TO THE FINANCIAL STATEMENTS (continued) December 31, 2022
Note 7 – Related Party Transactions (continued)
accounting and Chief Compliance Officer fees; Expenses incurred by the Mutual Funds for the year ended December 31, 2022, and owed as of December 31, 2022 are as follows:
Administration | | Incurred | | Owed | |
Mairs & Power Growth Fund | | $ | 755,137 | | | $ | 134,921 | | |
Mairs & Power Balanced Fund | | | 146,621 | | | | 25,831 | | |
Mairs & Power Small Cap Fund | | | 67,212 | | | | 11,304 | | |
Accounting | | Incurred | | Owed | |
Mairs & Power Growth Fund | | $ | 483,482 | | | $ | 76,927 | | |
Mairs & Power Balanced Fund | | | 119,811 | | | | 20,039 | | |
Mairs & Power Small Cap Fund | | | 37,435 | | | | 6,091 | | |
Transfer Agent | | Incurred(1) | | Owed | |
Mairs & Power Growth Fund | | $ | 932,369 | | | $ | 131,989 | | |
Mairs & Power Balanced Fund | | | 143,873 | | | | 20,372 | | |
Mairs & Power Small Cap Fund | | | 67,867 | | | | 9,824 | | |
(1) These amounts do not include sub-transfer agency fees, therefore they do not agree to the amounts referenced on the Statements of Operations.
Custody | | Incurred | | Owed | |
Mairs & Power Growth Fund | | $ | 248,549 | | | $ | 39,607 | | |
Mairs & Power Balanced Fund | | | 46,795 | | | | 8,220 | | |
Mairs & Power Small Cap Fund | | | 20,150 | | | | 3,549 | | |
Chief Compliance Officer | | Incurred | | Owed | |
Mairs & Power Growth Fund | | $ | 8,449 | | | $ | 1,876 | | |
Mairs & Power Balanced Fund | | | 7,465 | | | | 1,876 | | |
Mairs & Power Small Cap Fund | | | 7,337 | | | | 1,874 | | |
Certain officers of the Funds are also employees of Fund Services.
The Trust's Chief Compliance Officer is also an employee of Fund Services.
Note 8 – Creation and Redemption Transactions
Shares of the Minnesota ETF are listed and traded on the Cboe BZX Exchange, Inc. (the "Exchange"). The Minnesota ETF issues and redeems shares on a continuous basis at NAV only in large blocks of shares called "Creation Units." A Creation Unit generally consists of 10,000 shares though this may change from time to time. Creation Units are to be issued and redeemed principally in kind for a basket of securities and a balancing cash amount. Shares generally will trade in the secondary market in amounts less than a Creation Unit at market prices that change throughout the day. Market prices for the shares may be different from their NAV. The NAV is determined as of the close of trading (generally, 4:00 p.m. Eastern Time) on each day the NYSE is open for trading. The NAV of the shares of the Minnesota ETF will be equal to a Fund's total assets minus a Fund's total liabilities divided by the total number of shares outstanding. The NAV that is published will be rounded to the nearest cent; however, for purposes of determining the price of Creation Units, the NAV will be calculated to five decimal places.
Only "Authorized Participants" may purchase or redeem shares directly from the Minnesota ETF. An Authorized Participant is either (i) a broker-dealer or other participant in the clearing process through the Continuous Net Settlement System of National Securities Clearing Corporation or (ii) a DTC participant and, in each case, must have executed a Participant Agreement with the Distributor. Most retail investors will not qualify as Authorized Participants or have the resources to buy and sell whole Creation Units. Therefore, they will be unable to purchase or redeem the shares directly from the Minnesota ETF. Rather, most retail investors will purchase shares in the secondary market with the assistance of a broker and will be subject to customary brokerage commissions or fees. Securities received or delivered in connection with in-kind creates and redeems are valued as of the close of business on the effective date of the creation or redemption.
53
NOTES TO THE FINANCIAL STATEMENTS (continued) December 31, 2022
Note 8 – Creation and Redemption Transactions (continued)
Creation Unit Transaction Fee
Authorized Participants will be required to pay to the Custodian a fixed transaction fee (the "Creation Transaction Fee") in connection with the issuance of Creation Units. The standard Creation Transaction Fee will be the same regardless of the number of Creation Units purchased by an investor on the applicable Business Day. The Creation Transaction Fee for the Minnesota ETF is $250.
An additional variable fee of up to a maximum of 2% of the value of the Creation Units subject to the transaction may be imposed for cash purchases, non-standard orders, or partial purchase of Creation Units. For orders comprised entirely of cash, a variable fee of 0.03% of the value of the order will be charged by the Minnesota ETF. The variable charge is primarily designed to cover additional costs (e.g., brokerage, taxes) involved with buying the securities with cash. The Minnesota ETF may determine to not charge a variable fee on certain orders when the Adviser has determined that doing so is in the best interests of Fund shareholders.
A creation unit will generally not be issued until the transfer of good title of the deposit securities to the Minnesota ETF and the payment of any cash amounts have been completed. To the extent contemplated by the applicable participant agreement, Creation Units of the Minnesota ETF will be issued to such authorized participant notwithstanding the fact that the Minnesota ETF's deposits have not been received in part or in whole, in reliance on the undertaking of the authorized participant to deliver the missing deposit securities as soon as possible. If the MinnesotaETF or its agents do not receive all of the deposit securities, or the required cash amounts, by such time, then the order may be deemed rejected and the authorized participant shall be liable to the Minnesota ETF for losses, if any.
Note 9 – Investment Transactions
Purchases and sales of investment securities, excluding government securities, short-term securities and temporary cash investments, during the year ended December 31, 2022 were as follows:
| | | Purchases | | Sales | |
Growth Fund | | $ | 539,433,036 | | | $ | 815,875,211 | (a) | |
Balanced Fund | | | 81,223,697 | | | | 139,967,311 | (a) | |
Small Cap Fund | | | 72,428,672 | | | | 98,831,023 | (a) | |
Minnesota ETF | | | 4,095,875 | | | | 3,053,118 | | |
Purchases and sales of government securities during the year ended December 31, 2022 were as follows:
| | | Purchases | | Sales | |
Growth Fund | | $ | - | | | $ | - | | |
Balanced Fund | | | 1,995,195 | | | | - | | |
Small Cap Fund | | | - | | | | - | | |
Minnesota ETF | | | - | | | | - | | |
(a) Sales exclude redemptions in-kind of $48,323,361, $6,143,110, and $5,652,636 for the Growth Fund, Balanced Fund and Small Cap Fund, respectively. See Note 11.
Note 10 – Principal Risks of the Funds
As with all investment companies, shareholders of the Funds are subject to the risk that their investment could lose money. Each Fund is subject to its principal risks, any of which may adversely affect a Fund's NAV, trading price, yield, total return and ability to meet its investment objective as applicable. A description of the principal risks of each Fund is included in the applicable prospectus under the heading "Principal Risks''.
Note 11 – ReFlow Transactions
The Mutual Funds may participate in the ReFlow Fund, LLC ("ReFlow") liquidity program, which is designed to provide an alternative liquidity source for mutual funds experiencing net redemptions of their shares. Pursuant
54
NOTES TO THE FINANCIAL STATEMENTS (continued) December 31, 2022
Note 11 – ReFlow Transactions (continued)
to the program, ReFlow provides participating mutual funds (including each Mutual Fund) with a source of cash to meet net shareholder redemptions by standing ready each business day to purchase Fund shares up to the value of the net shares redeemed by other shareholders that are to settle the next business day. Following purchases of a Fund's shares, ReFlow then generally redeems those shares when the Fund experiences net sales, at the end of a maximum holding period determined by ReFlow (currently 14 days) or at other times at ReFlow's or the Adviser's discretion. While ReFlow holds a Fund's shares, it will have the same rights and privileges with respect to those shares as any other shareholder. For use of the ReFlow service, a Fund pays a fee to ReFlow each time it purchases Fund shares, calculated by applying to the purchase amount a fee rate determined through an automated daily auction among participating mutual funds. The current minimum fee rate is 0.20% of the value of the Fund shares purchased by ReFlow, although a Fund may submit a bid at a higher fee rate if it determines that doing so is in the best interest of Fund shareholders. ReFlow's purchases of a Fund's shares through the liquidity program are made on an investment-blind basis without regard to a Fund's objective, policies or anticipated performance. In accordance with federal securities laws, ReFlow is prohibited from acquiring more than 3% of the outstanding voting securities of a Fund. ReFlow will not be subject to the Funds' investment minimums, the Small Cap Fund's redemption fee, or the limitations noted in the "Frequent Purchases and Redemptions of Fund Shares" section within the Funds' prospectus. ReFlow will periodically redeem its entire share position in a Fund and request that such redemption be met in-kind in accordance with the Funds' redemption in-kind policies. The Board has approved the Funds' use of the ReFlow program. The Adviser believes that the program may assist in stabilizing each Fund's net assets, to the benefit of the Fund and its shareholders, although there is no guarantee that the program will do so. To the extent that the Funds' assets do not decline, the Adviser may also benefit. ReFlow fees that were incurred by the Funds during the year ended December 31, 2022 are recorded within the Statement of Operations, if applicable.
During the year ended December 31, 2022 the Mutual Funds satisfied redemption in-kind requests made by Reflow. The transfers were effected in accordance with policies and procedures approved by the Board. Consideration paid and shares sold were as follows:
Fund | | Date Range | | Value of Cash
and Securities Sold | | Shares Sold | |
Growth Fund | | November 2022-December 2022 | | | 48,323,361 | | | | 420,149 | | |
Balanced Fund | | December 2022 | | | 6,143,110 | | | | 67,204 | | |
Small Cap Fund | | December 2022 | | | 5,652,636 | | | | 221,778 | | |
Note 12 – Recent Market Events
U.S. and international markets have experienced significant periods of volatility in recent years and months due to a number of economic, political and global macro factors including rising inflation, uncertainty regarding central banks' interest rate increases, the possibility of a national or global recession, trade tensions, political events, the war between Russia and Ukraine and the impact of the coronavirus (COVID-19) global pandemic. The global recovery from COVID-19 may last for an extended period of time. As a result of continuing political tensions and armed conflicts, including the war between Ukraine and Russia, the U.S. and the European Union imposed sanctions on certain Russian individuals and companies, including certain financial institutions, and have limited certain exports and imports to and from Russia. The war has contributed to recent market volatility and may continue to do so. These developments, as well as other events, could result in further market volatility and negatively affect financial asset prices, the liquidity of certain securities and the normal operations of securities exchanges and other markets, despite government efforts to address market disruptions. Continuing market volatility as a result of recent market conditions or other events may have adverse effects on your account.
55
NOTES TO THE FINANCIAL STATEMENTS (continued) December 31, 2022
Note 13 – Subsequent Events
The Minnesota ETF paid distributions to shareholders as follows:
| Record Date | | Ex-Date | | Reinvestment
Date/Payable
Date | | Ordinary
Income Rate | | Ordinary Income
Distribution Paid | |
| 1/24/2023 | | 1/23/2023 | | 1/31/2023 | | $ | 0.01774329 | | | $ | 14,904 | | |
| 2/21/2023 | | 2/17/2023 | | 2/28/2023 | | $ | 0.02418402 | | | $ | 20,315 | | |
Other than as disclosed, there were no other subsequent events requiring recognition or disclosure through the date the financial statements were issued.
56
Mairs & Power Growth Fund
FINANCIAL HIGHLIGHTS
SELECTED DATA AND RATIOS
(for a share outstanding throughout each year)
| | | Year Ended December 31, | |
| | | 2022 | | 2021 | | 2020 | | 2019 | | 2018 | |
Per Share | |
Net asset value, beginning of year | | $ | 162.55 | | | $ | 136.08 | | | $ | 127.22 | | | $ | 106.45 | | | $ | 121.12 | | |
Income from investment operations: | |
Net investment income | | | 1.02 | (3) | | | 0.87 | | | | 1.48 | | | | 1.59 | | | | 1.61 | | |
Net realized and unrealized gain (loss) | | | (35.15 | ) | | | 38.82 | | | | 19.37 | | | | 28.59 | | | | (6.96 | ) | |
Total from investment operations | | | (34.13 | ) | | | 39.69 | | | | 20.85 | | | | 30.18 | | | | (5.35 | ) | |
Distributions to shareholders from: | |
Net investment income | | | (1.01 | ) | | | (0.91 | ) | | | (1.45 | ) | | | (1.58 | ) | | | (1.59 | ) | |
Net realized gains on investments sold | | | (9.41 | ) | | | (12.31 | ) | | | (10.54 | ) | | | (7.83 | ) | | | (7.73 | ) | |
Total distributions | | | (10.42 | ) | | | (13.22 | ) | | | (11.99 | ) | | | (9.41 | ) | | | (9.32 | ) | |
Net asset value, end of year | | $ | 118.00 | | | $ | 162.55 | | | $ | 136.08 | | | $ | 127.22 | | | $ | 106.45 | | |
Total investment return (loss) | | | (21.07 | )% | | | 29.27 | % | | | 16.67 | % | | | 28.39 | % | | | (4.34 | )% | |
Net assets, end of year, in thousands | | $ | 4,336,486 | | | $ | 5,950,161 | | | $ | 4,858,189 | | | $ | 4,633,937 | | | $ | 3,938,943 | | |
Ratios/supplemental data: | |
Ratio of expenses to average net assets | | | 0.63 | % | | | 0.61 | % | | | 0.64 | % | | | 0.65 | % | | | 0.64 | % | |
Ratio of net investment income to average
net assets | | | 0.75 | | | | 0.55 | | | | 1.12 | (1) | | | 1.28 | | | | 1.27 | | |
Portfolio turnover rate | | | 11.04 | (2) | | | 13.17 | | | | 14.52 | | | | 10.77 | | | | 9.25 | | |
(1) Ratio revised subsequent to the completion of the annual report dated December 31, 2020 to include immaterial reclass adjustments related to the Fund's holding of real estate investment trusts.
(2) Excludes in-kind transactions associated with redemptions of the Fund.
(3) Per share net investment income was calculated using average shares outstanding.
See accompanying Notes to Financial Statements.
57
Mairs & Power Balanced Fund
FINANCIAL HIGHLIGHTS
SELECTED DATA AND RATIOS
(for a share outstanding throughout each year)
| | | Year Ended December 31, | |
| | | 2022 | | 2021 | | 2020 | | 2019 | | 2018 | |
Per Share | |
Net asset value, beginning of year | | $ | 116.89 | | | $ | 105.23 | | | $ | 99.74 | | | $ | 86.79 | | | $ | 94.01 | | |
Income from investment operations: | |
Net investment income | | | 1.86 | (3) | | | 1.68 | | | | 1.98 | | | | 2.13 | | | | 2.09 | | |
Net realized and unrealized gain (loss) | | | (19.21 | ) | | | 17.42 | | | | 8.10 | | | | 15.39 | | | | (4.71 | ) | |
Total from investment operations | | | (17.35 | ) | | | 19.10 | | | | 10.08 | | | | 17.52 | | | | (2.62 | ) | |
Distributions to shareholders from: | |
Net investment income | | | (1.86 | ) | | | (1.68 | ) | | | (1.99 | ) | | | (2.12 | ) | | | (2.09 | ) | |
Net realized gains on investments sold | | | (4.62 | ) | | | (5.76 | ) | | | (2.60 | ) | | | (2.45 | ) | | | (2.51 | ) | |
Total distributions | | | (6.48 | ) | | | (7.44 | ) | | | (4.59 | ) | | | (4.57 | ) | | | (4.60 | ) | |
Net asset value, end of year | | $ | 93.06 | | | $ | 116.89 | | | $ | 105.23 | | | $ | 99.74 | | | $ | 86.79 | | |
Total investment return (loss) | | | (14.91 | )% | | | 18.30 | % | | | 10.44 | % | | | 20.32 | % | | | (2.80 | )% | |
Net assets, end of year, in thousands | | $ | 780,847 | | | $ | 1,022,951 | | | $ | 895,253 | | | $ | 928,828 | | | $ | 807,455 | | |
Ratios/supplemental data: | |
Ratio of expenses to average net assets | | | 0.69 | % | | | 0.69 | % | | | 0.71 | % | | | 0.71 | % | | | 0.72 | % | |
Ratio of net investment income to average
net assets | | | 1.81 | | | | 1.45 | | | | 2.01 | (1) | | | 2.22 | | | | 2.20 | | |
Portfolio turnover rate | | | 9.68 | (2) | | | 13.00 | | | | 15.96 | | | | 13.60 | | | | 9.01 | | |
(1) Ratio revised subsequent to the completion of the annual report dated December 31, 2020 to include immaterial reclass adjustments related to the Fund's holding of real estate investment trusts.
(2) Excludes in-kind transactions associated with redemptions of the Fund.
(3) Per share net investment income was calculated using average shares outstanding.
See accompanying Notes to Financial Statements.
58
Mairs & Power Small Cap Fund
FINANCIAL HIGHLIGHTS
SELECTED DATA AND RATIOS
(for a share outstanding throughout each year)
| | | Year Ended December 31, | |
| | | 2022 | | 2021 | | 2020 | | 2019 | | 2018 | |
Per Share | |
Net asset value, beginning of year | | $ | 32.69 | | | $ | 28.15 | | | $ | 26.41 | | | $ | 22.48 | | | $ | 25.32 | | |
Income from investment operations: | |
Net investment income | | | 0.05 | (5) | | | 0.01 | | | | 0.19 | | | | 0.13 | | | | 0.15 | | |
Net realized and unrealized gain (loss) | | | (4.59 | ) | | | 7.25 | | | | 2.13 | | | | 4.62 | | | | (1.92 | ) | |
Total from investment operations | | | (4.54 | ) | | | 7.26 | | | | 2.32 | | | | 4.75 | | | | (1.77 | ) | |
Distributions to shareholders from: | |
Net investment income | | | (0.05 | ) | | | (0.01 | ) | | | (0.17 | ) | | | (0.11 | ) | | | (0.15 | ) | |
Net realized gains on investments sold | | | (1.67 | ) | | | (2.71 | ) | | | (0.41 | ) | | | (0.71 | ) | | | (0.92 | ) | |
Redemption fees (1)(2) | | | 0.00 | | | | 0.00 | | | | 0.00 | | | | 0.00 | | | | 0.00 | | |
Total distributions | | | (1.72 | ) | | | (2.72 | ) | | | (0.58 | ) | | | (0.82 | ) | | | (1.07 | ) | |
Net asset value, end of year | | $ | 26.43 | | | $ | 32.69 | | | $ | 28.15 | | | $ | 26.41 | | | $ | 22.48 | | |
Total investment return (loss) | | | (13.93 | )% | | | 26.00 | % | | | 8.78 | % | | | 21.13 | % | | | (6.91 | )% | |
Net assets, end of year, in thousands | | $ | 337,201 | | | $ | 427,257 | | | $ | 361,594 | | | $ | 437,300 | | | $ | 367,477 | | |
Ratios/supplemental data: | |
Ratio of expenses to average net assets | | | 0.92 | % | | | 0.95 | % | | | 1.04 | % | | | 1.05 | % | | | 1.04 | % | |
Ratio of net investment income to average
net assets | | | 0.18 | | | | 0.02 | | | | 0.58 | (3) | | | 0.48 | | | | 0.54 | | |
Portfolio turnover rate | | | 19.81 | (4) | | | 21.45 | | | | 16.39 | | | | 15.07 | | | | 20.40 | | |
(1) The Fund charges a 1.00% redemption fee on shares held 180 days or less.
(2) Amount per share is less than $0.005.
(3) Ratio revised subsequent to the completion of the annual report dated December 31, 2020 to include immaterial reclass adjustments related to the Fund's holding of real estate investment trusts.
(4) Excludes in-kind transactions associated with redemptions of the Fund.
(5) Per share net investment income was calculated using average shares outstanding.
See accompanying Notes to Financial Statements.
59
Mairs & Power Minnesota Municipal Bond ETF
FINANCIAL HIGHLIGHTS
SELECTED DATA AND RATIOS
(for a share outstanding throughout each year/period)
| | | Year Ended
December 31, 2022 | | Period Ended
December 31, 2021 (1) | |
Per Share | |
Net asset value, beginning of year/period | | $ | 25.16 | | | $ | 25.00 | | |
Income from investment operations: | |
Net investment income (2) | | | 0.29 | | | | 0.18 | | |
Net realized and unrealized gain (loss) | | | (3.36 | ) | | | 0.14 | | |
Total from investment operations | | | (3.07 | ) | | | 0.32 | | |
Distributions to shareholders from: | |
Net investment income | | | (0.29 | ) | | | (0.16 | ) | |
Total distributions | | | (0.29 | ) | | | (0.16 | ) | |
Net asset value, end of year/period | | $ | 21.80 | | | $ | 25.16 | | |
Total investment return, at NAV (3) | | | (12.20 | )% | | | 1.29 | % | |
Total investment return, at Market (3) | | | (12.27 | )% | | | 1.32 | % | |
Net assets, end of year/period, in thousands | | $ | 17,439 | | | $ | 18,619 | | |
Ratios/supplemental data: | |
Ratio of expenses to average net assets (4) | | | 0.39 | % | | | 0.39 | % | |
Ratio of net investment income to average net assets (4) | | | 1.33 | % | | | 0.88 | % | |
Portfolio turnover rate (3)(5) | | | 17.81 | % | | | 2.54 | % | |
(1) The Fund commenced investment operations on March 11, 2021.
(2) Per share net investment income was calculated using average shares outstanding.
(3) Not annualized for periods less than one year.
(4) Annualized for periods less than one year.
(5) Excludes in-kind transations associated with creations and redemptions of the Fund.
See accompanying Notes to Financial Statements.
60
REPORT OF INDEPENDENT REGISTERED PUBLIC ACCOUNTING FIRM
To the Shareholders of Mairs & Power Funds and
Board of Trustees of Trust for Professional Managers
Opinion on the Financial Statements
We have audited the accompanying statements of assets and liabilities, including the schedules of investments, of Mairs & Power Funds comprising the funds listed below (the "Funds"), each a series of Trust for Professional Managers, as of December 31, 2022, the related statement of operations, the statements of changes in net assets, the related notes, and the financial highlights for each of the periods indicated below (collectively referred to as the "financial statements"). In our opinion, the financial statements present fairly, in all material respects, the financial position of the Funds as of December 31, 2022, the results of their operations, the changes in net assets, and the financial highlights for each of the periods indicated below in conformity with accounting principles generally accepted in the United States of America.
| Fund Name | | Statements of
Operations | | Statements of
Changes in Net Assets | | Financial Highlights | |
Mairs & Power Minnesota Municipal Bond ETF | | For the year ended December 31, 2022 | | For the year ended December 31, 2022 and for the period from March 11, 2021 (commencement of operations) through December 31, 2021 | | For the year ended December 31, 2022 and for the period from March 11, 2021 (commencement of operations) through December 31, 2021 | |
Mairs & Power Growth Fund, Mairs & Power Balanced Fund, and Mairs & Power Small Cap Fund (the "Mutual Funds") | | For the year ended December 31, 2022 | |
The Mairs & Power Funds Trust (comprising Mairs & Power Growth Fund, Mairs & Power Balanced Fund and Mairs & Power Small Cap Fund, predecessor funds to the Mutual Funds, financial statements and financial highlights for the years ended December 31, 2021, and prior, were audited by other auditors whose report dated February 18, 2022, expressed an unqualified opinion on those financial statements and financial highlights.
Basis for Opinion
These financial statements are the responsibility of the Funds' management. Our responsibility is to express an opinion on the Funds' financial statements based on our audit. We are a public accounting firm registered with the Public Company Accounting Oversight Board (United States) ("PCAOB") and are required to be independent with respect to the Funds in accordance with the U.S. federal securities laws and the applicable rules and regulations of the Securities and Exchange Commission and the PCAOB. We conducted our audits in accordance with the standards of the PCAOB. Those standards require that we plan and perform the audit to obtain reasonable assurance about whether the financial statements are free of material misstatement whether due to error or fraud.
Our audits included performing procedures to assess the risks of material misstatement of the financial statements, whether due to error or fraud, and performing procedures that respond to those risks. Such procedures included examining, on a test basis, evidence regarding the amounts and disclosures in the
61
REPORT OF INDEPENDENT REGISTERED PUBLIC ACCOUNTING FIRM (continued)
financial statements. Our procedures included confirmation of securities owned as of December 31, 2022, by correspondence with the custodian and brokers. Our audits also included evaluating the accounting principles used and significant estimates made by management, as well as evaluating the overall presentation of the financial statements. We believe that our audit provides a reasonable basis for our opinion.
We have served as the Funds' auditor since 2021.

COHEN & COMPANY, LTD.
Milwaukee, Wisconsin
February 28, 2023
62
FUND EXPENSES (unaudited)
As a shareholder of the Mutual Funds, you incur two types of costs: (1) transaction costs, including redemption fees for shareholders of the Small Cap Fund, and (2) ongoing expenses for the operation of the Funds (e.g., asset-based charges, such as investment management fees). The Mutual Funds are "no-load" mutual funds. As a result, shareholders pay no commissions, fees, or expenses associated with sales representatives or sales charges. As a shareholder of the Minnesota ETF, you incur two types of costs: (1) transaction costs, including brokerage commissions paid on purchases and sales of the Fund's shares, and (2) ongoing costs, including management fees of the Fund.
This example is intended to help you understand your ongoing costs (in dollars) of investing in the Funds and to compare these costs with the ongoing costs of investing in other mutual funds. The table below reports the Funds' expenses during the period June 1, 2022 through December 31, 2022 and includes the costs associated with a $1,000 investment.
Actual Expenses
The first line in the tables below provides information about the actual account values and actual expenses. You may use this information in this line, together with the amount you invested to estimate the expenses you paid over the reporting period. You can do this by dividing your account value by $1,000 and multiplying the result by the expense shown in the table below. For example, if your account value is $8,600, divided by $1,000 = $8.60. Multiply the result by the number in the first line under the heading entitled "Expenses Paid During Period." By doing this you can estimate the expenses you paid on your account during this period.
Hypothetical Example
The second line of the tables below provides information about hypothetical account values and hypothetical expenses based on the Funds' actual expenses and assumed returns of 5% per year before expenses, which are not the Funds' actual returns. The results may be used to provide you with a basis for comparing the ongoing costs of investing in the Funds with the ongoing costs of investing in other funds. To do so, compare these 5% hypothetical examples with the 5% hypothetical examples that appear in the shareholder reports of other funds. Please note that these hypothetical examples highlight ongoing costs only and do not reflect any transactional fees, such as redemption fees. In addition, if these transactional fees were included, your costs would have been higher. These hypothetical expense examples may not be used to estimate the actual ending account balances or expenses you paid during the period and will not help you determine the relative total costs of owning different funds.
Mairs & Power Growth Fund
| | Beginning Account
Value 06/30/2022 | | Ending Account
Value 12/31/2022 | | Expenses Paid
During Period * | |
Actual return | | $ | 1,000.00 | | | $ | 1,007.80 | | | $ | 3.14 | | |
Hypothetical assumed 5% return | | $ | 1,000.00 | | | $ | 1,022.08 | | | $ | 3.16 | | |
* The Fund's expenses are equal to the Fund's annualized expense ratio for the most recent six-month period of 0.62%, multiplied by the average account value over the Fund's second fiscal half-year, multiplied by the number of days in the Fund's second fiscal half-year (184 days), divided by 365 days.
Mairs & Power Balanced Fund
| | Beginning Account
Value 06/30/2022 | | Ending Account
Value 12/31/2022 | | Expenses Paid
During Period * | |
Actual return | | $ | 1,000.00 | | | $ | 1,010.50 | | | $ | 3.04 | | |
Hypothetical assumed 5% return | | $ | 1,000.00 | | | $ | 1,022.18 | | | $ | 3.06 | | |
* The Fund's expenses are equal to the Fund's annualized expense ratio for the most recent six-month period of 0.60%, multiplied by the average account value over the Fund's second fiscal half-year, multiplied by the number of days in the Fund's second fiscal half-year (184 days), divided by 365 days.
63
FUND EXPENSES (unaudited) (continued)
Mairs & Power Small Cap Fund
| | Beginning Account
Value 06/30/2022 | | Ending Account
Value 12/31/2022 | | Expenses Paid
During Period * | |
Actual return | | $ | 1,000.00 | | | $ | 1,059.40 | | | $ | 4.83 | | |
Hypothetical assumed 5% return | | $ | 1,000.00 | | | $ | 1,020.52 | | | $ | 4.74 | | |
* The Fund's expenses are equal to the Fund's annualized expense ratio for the most recent six-month period of 0.93%, multiplied by the average account value over the Fund's second fiscal half-year, multiplied by the number of days in the Fund's second fiscal half-year (184 days), divided by 365 days.
Mairs & Power Minnesota Municipal Bond ETF
| | Beginning Account
Value 06/30/2022 | | Ending Account
Value 12/31/2022 | | Expenses Paid
During Period * | |
Actual return | | $ | 1,000.00 | | | $ | 994.20 | | | $ | 1.96 | | |
Hypothetical assumed 5% return | | $ | 1,000.00 | | | $ | 1,023.24 | | | $ | 1.99 | | |
* The Fund's expenses are equal to the Fund's annualized expense ratio for the period of 0.39%, multiplied by the average account value over the period, multiplied by the number of days in the period (184 days), divided by 365 days.
64
BASIS FOR TRUSTEES' APPROVAL OF INVESTMENT ADVISORY AGREEMENT (unaudited)
The Board of Trustees (the "Trustees") of Trust for Professional Managers (the "Trust") met on August 26, 2022 to consider the renewal of the Investment Advisory Agreement (the "Agreement") between the Trust, on behalf of the Mairs & Power Minnesota Municipal Bond ETF (the "Fund"), a series of the Trust, and Mairs & Power, Inc. ("Mairs & Power"), the Fund's investment adviser. The Trustees also met at a prior meeting held on June 13, 2022 (the "June 13, 2022 Meeting") to review materials related to the renewal of the Agreement. Prior to these meetings, the Trustees requested and received materials to assist them in considering the renewal of the Agreement. The materials provided contained information with respect to the factors enumerated below, including a copy of the Agreement, a memorandum prepared by the Trust's outside legal counsel discussing in detail the Trustees' fiduciary obligations and the factors they should assess in considering the renewal of the Agreement, detailed comparative information relating to the Fund's performance, as well as the management fees and other expenses of the Fund, due diligence materials relating to the Adviser (including a due diligence questionnaire completed on behalf of the Fund by the Adviser, the Adviser's Form ADV, select financial statements of the Adviser, biographical information of the Adviser's key management and compliance personnel, comparative fee information for the Fund and the Adviser's other separately-managed accounts and a summary detailing key provisions of the Adviser's written compliance program, including its code of ethics) and other pertinent information. The Trustees also received information periodically throughout the year that was relevant to the Agreement renewal process, including performance, management fee and other expense information. Based on their evaluation of the information provided by the Adviser, in conjunction with the Fund's other service providers, the Trustees, by a unanimous vote (including a separate vote of the Trustees who are not "interested persons," as that term is defined in the Investment Company Act of 1940, as amended (the "Independent Trustees")), approved the continuation of the Agreement for an additional one-year term ending August 31, 2023.
DISCUSSION OF FACTORS CONSIDERED
In considering the approval of the Agreement and reaching their conclusions, the Trustees reviewed and analyzed various factors that they determined were relevant, including the factors enumerated below.
1. NATURE, EXTENT AND QUALITY OF SERVICES PROVIDED TO THE FUND
The Trustees considered the nature, extent and quality of services provided by the Adviser to the Fund and the amount of time devoted to the Fund's operations by the Adviser's staff. The Trustees considered the Adviser's specific responsibilities in all aspects of day-to-day management of the Fund, including the investment strategies implemented by the Adviser, as well as the qualifications, experience and responsibilities of Brent S. Miller, Lead Portfolio Manager, and Robert W. Thompson, Co-Manager, of the Fund, and other key personnel at the Adviser involved in the day-to-day activities of the Fund. The Trustees reviewed information provided by the Adviser in a due diligence questionnaire, including the structure of the Adviser's compliance program and its continuing commitment to the Fund. The Trustees noted that during the course of the prior year the Adviser had participated in a Trust board meeting to discuss the Fund's performance and outlook, along with the compliance efforts made by the Adviser. The Trustees also noted any services that extended beyond portfolio management, and they considered the brokerage practices of the Adviser. The Trustees discussed the Adviser's handling of compliance matters, including the reports of the Trust's chief compliance officer to the Trustees on the effectiveness of the Adviser's compliance program. The Trustees also considered the Adviser's overall financial condition, as well as the implementation and operational effectiveness of the Adviser's business continuity plan in response to the COVID-19 pandemic. The Trustees concluded that the Adviser had sufficient quality and depth of personnel, resources, investment methods and compliance policies and procedures essential to performing its duties under the Advisory Agreement and that the nature, overall quality and extent of the management services provided to the Fund, as well as the Adviser's compliance program, were satisfactory and reliable.
2. INVESTMENT PERFORMANCE OF THE FUND AND THE ADVISER
The Trustees discussed the performance of the Fund for the quarter, one-year, and since inception periods ended March 31, 2022. In assessing the quality of the portfolio management services delivered by the Adviser,
65
BASIS FOR TRUSTEES' APPROVAL OF INVESTMENT ADVISORY AGREEMENT (unaudited) (continued)
the Trustees also compared the short-term and longer-term performance of the Fund on both an absolute basis and in comparison to a benchmark index (the Bloomberg Minnesota Municipal Total Return Index) and in comparison to a peer group of funds as constructed using publicly-available data provided by Morningstar, Inc. and presented by Barrington Financial Group, LLC d/b/a Barrington Partners, an independent third-party benchmarking firm, through its cohort selection process (a peer group of U.S. open-end municipal national intermediate bond, U.S. dollar government bond, municipal national long-term bond and municipal Minnesota bond exchange-traded funds) (the "Barrington Cohort"). The Trustees also reviewed information on the historical performance of other separately-managed accounts of the Adviser with the same or similar investment strategies as the Fund.
The Trustees noted the Fund's performance for the one-year period ended March 31, 2022 was below the Barrington Cohort average. The Trustees noted that for each of the quarter, one-year, and since inception periods ended March 31, 2022, the Fund had underperformed the Bloomberg Minnesota Municipal Total Return Index.
After considering all of the information, the Trustees concluded that the performance obtained by the Adviser for the Fund was satisfactory under current market conditions. Although past performance is not a guarantee or indication of future results, the Trustees determined that the Fund and its shareholders were likely to benefit from the Adviser's continued management.
3. COSTS OF SERVICES PROVIDED AND PROFITS REALIZED BY THE ADVISER
The Trustees considered the cost of services and the structure of the Adviser's fees, including a review of the expense analyses and other pertinent material with respect to the Fund. The Trustees took into consideration that the management fee was a "unitary management fee" whereby the Adviser agrees to pay all expenses incurred by the Fund, except the unitary management fee payable to the Adviser and certain other costs of the Fund, specifically interest charges on any borrowings, dividends and other expenses on securities sold short, taxes, brokerage commissions and other expenses incurred in placing orders for the purchase and sale of securities and other investment instruments, acquired fund fees and expenses, accrued deferred tax liability, extraordinary expenses and any Rule 12b-1 plan fees. The Trustees reviewed the related statistical information and other materials provided, including the comparative expenses and Barrington Cohort comparisons. The Trustees considered the cost structure of the Fund relative to its Barrington Cohort and the separately-managed accounts of the Adviser with the same or similar investment strategies as the Fund.
The Trustees also considered the overall profitability of the Adviser and reviewed the Adviser's financial information. The Trustees also examined the level of profits that could be expected to accrue to the Adviser from the fees payable under the Advisory Agreement, as well as the Fund's brokerage practices, noting that the Adviser makes no effort to seek soft dollar arrangements. These considerations were based on materials requested by the Trustees and the Fund's administrator specifically for the June 13, 2022 meeting and the August 26, 2022 meeting at which the Advisory Agreement was formally considered, as well as the reports prepared by the Adviser over the course of the year.
The Trustees noted that the Fund's contractual management fee of 0.39% was above the Barrington Cohort average of 0.35%. The Trustees observed that the Fund's unitary fee structure limits the Fund's total expense ratio to 0.39% and such expense ratio was above the Barrington Cohort average of 0.36%. The Trustees also compared the fees paid by the Fund to the fees paid by separately-managed accounts of the Adviser with the same or similar investment strategies as the Fund.
The Trustees concluded that the Fund's expenses and the management fees paid to the Adviser were fair and reasonable in light of the comparative performance, expense and management fee information. The Trustees noted, based on a profitability analysis prepared by the Adviser, that the Adviser was not realizing profits in connection with its management of the Fund, and the Trustees further concluded that the Adviser maintained adequate profit levels to support the services to the Fund from the revenues of its overall investment advisory business.
66
BASIS FOR TRUSTEES' APPROVAL OF INVESTMENT ADVISORY AGREEMENT (unaudited) (continued)
4. EXTENT OF ECONOMIES OF SCALE AS THE FUND GROWS
The Trustees compared the Fund's expenses relative to its peer group and discussed realized and potential economies of scale. The Trustees also reviewed the structure of the Fund's management fee and whether the Fund was large enough to generate economies of scale for shareholders or whether economies of scale would be expected to be realized as Fund assets grow (and if so, how those economies of scale were being or would be shared with shareholders). The Trustees noted that the Fund's management fee structure did not contain any breakpoint reductions as the Fund's assets grow in size, but that the feasibility of incorporating breakpoints would continue to be reviewed on a regular basis. With respect to the Adviser's fee structure, the Trustees concluded that the current fee structure was reasonable and reflected a sharing of economies of scale between the Adviser and the Fund at the Fund's current asset level.
5. BENEFITS DERIVED FROM THE RELATIONSHIP WITH THE FUND
The Trustees considered the direct and indirect benefits that could be received by the Adviser from its association with the Fund. The Trustees examined the brokerage practices of the Adviser with respect to the Fund. The Trustees concluded that the benefits the Adviser may receive, such as greater name recognition and increased ability to attract additional investor assets, appear to be reasonable, and in many cases may benefit the Fund.
CONCLUSIONS
The Trustees considered all of the foregoing factors. In considering the renewal of the Advisory Agreement, the Trustees did not identify any one factor as all-important, but rather considered these factors collectively in light of the Fund's surrounding circumstances. Based on this review, the Trustees, including a majority of the Independent Trustees, approved the continuation of the Advisory Agreement for an additional one-year term ending August 31, 2023 as being in the best interests of the Fund and its shareholders.
67
NOTICE OF PRIVACY POLICY & PRACTICES (unaudited)
We collect non-public personal information about you from the following sources:
• information we receive about you on applications or other forms;
• information you give us orally; and
• information about your transactions with us or others.
The types of non-public personal information we collect and share can include:
• social security numbers;
• account balances;
• account transactions;
• transaction history;
• wire transfer instructions; and
• checking account information.
What Information We Disclose
We do not disclose any non-public personal information about our shareholders or former shareholders without the shareholder's authorization, except as permitted by law or in response to inquiries from governmental authorities. We may share information with affiliated parties and unaffiliated third parties with whom we have contracts for servicing the Fund. We will provide unaffiliated third parties with only the information necessary to carry out their assigned responsibility.
How We Protect Your Information
All shareholder records will be disposed of in accordance with applicable law. We maintain physical, electronic and procedural safeguards to protect your non-public personal information and require third parties to treat your non-public personal information with the same high degree of confidentiality.
In the event that you hold shares of the Fund through a financial intermediary, including, but not limited to, a broker-dealer, bank or trust company, the privacy policy of your financial intermediary would govern how your non-public personal information would be shared with unaffiliated third parties.
68
Proxy Voting Policies and Procedures that the Trust uses to determine how to vote proxies relating to portfolio securities are available (i) without charge, upon request, by calling (855)-839-2800 for the Minnesota ETF or (800) 304-7404 for the Mutual Funds and requesting a copy of the applicable Statement of Additional Information (SAI) and (ii) on the Securities and Exchange Commission's (SEC's) website at www.sec.gov (access Form N-1A).
Information on how the Funds voted proxies relating to portfolio securities during the most recent 12-month period ended June 30 is available at www.mairsandpower.com and on the SEC's website at www.sec.gov on Form N-PX.
DISCLOSURE OF PORTFOLIO HOLDINGS (unaudited)
A description of the Funds' policies and procedures with respect to the disclosure of portfolio holdings is available in the SAI and on the Funds' website. A complete list of each Fund's holdings is available on or about 15 days after each quarter-end at www.mairsandpower.com. This list remains available on the website until it is replaced with the following quarter-end list. The portfolio holdings list is also filed in the Funds' annual and semi-annual reports to shareholders filed with the SEC on Form N-CSR and as an exhibit to Form N-PORT following the end of each quarter. Form N-CSR and the public portion of Form N-PORT, when available, may be viewed on the SEC's website at www.sec.gov.
HOUSEHOLDING (unaudited)
In an effort to decrease costs, the Trust intends to reduce the number of duplicate prospectuses, supplements and certain other shareholder documents you receive by sending only one copy of each to those addresses shared by two or more accounts and to shareholders reasonably believed to be from the same family or household. Once implemented, if you would like to discontinue householding for your accounts, please call the Minnesota ETF at (855)-839-2800 or the Mutual Funds at (800) 304-7404 to request individual copies of these documents. Once notification to stop householding is received, the Trust will begin sending individual copies thirty days after receiving your request. This policy does not apply to account statements.
eDelivery is available to all direct shareholders. eDelivery provides your tax statements, account statements, trade confirmation statements and certain other shareholder documents online rather than by regular mail. In addition to reducing paper waste, eDelivery may reduce your Fund fees by lowering printing and mailing costs over time. To receive materials electronically, please contact the Minnesota ETF at (855)-839-2800 or the Mutual Funds at (800) 304-7404 or visit www.mairsandpower.com to sign up for eDelivery. If you hold your Fund shares through a Financial Intermediary, please contact your Financial Intermediary regarding electronic delivery options.
FREQUENCY DISTRIBUTION OF PREMIUMS AND DISCOUNTS (unaudited)
Information regarding how often shares of the Minnesota ETF trade on an exchange at a price above (i.e., at a premium) or below (i.e., at a discount) the NAV of the Minnesota ETF is available without charge, on the Minnesota ETF's website at www.mairsandpower.com.
69
TAX INFORMATION (unaudited)
For the year ended December 31, 2022, certain dividends paid by the Funds may be subject to a maximum tax rate of 23.8%, as provided for by the Jobs and Growth Tax Relief Reconciliation Act of 2003. The percentage of dividends declared from ordinary income designated as qualified dividend income was as follows:
Mairs & Power Growth Fund | | | 100.00 | % | |
Mairs & Power Balanced Fund | | | 62.37 | % | |
Mairs & Power Small Cap Fund | | | 100.00 | % | |
For corporate shareholders, the percent of ordinary income distributions qualifying for the corporate dividends received deduction for the fiscal year ended December 31, 2022, was as follows:
Mairs & Power Growth Fund | | | 100.00 | % | |
Mairs & Power Balanced Fund | | | 55.93 | % | |
Mairs & Power Small Cap Fund | | | 100.00 | % | |
70
INFORMATION ABOUT TRUSTEES (unaudited)
The business and affairs of the Trust are managed under the direction of the Board of Trustees. Information pertaining to the Trustees of the Trust is set forth below. The Statement of Additional Information includes additional information about the Trustees and is available, without charge, upon request by calling 1-855-839-2800.
Name,
Address and
Year of Birth | | Position(s)
Held with
the Trust | | Term of
Office and
Length of
Time Served | | Number of
Portfolios
in Trust
Overseen
by Trustee | | Principal Occupation(s)
During the Past Five Years | | Other
Directorships
Held by Trustee
During the Past
Five Years | |
INDEPENDENT TRUSTEES | |
Michael D. Akers, Ph.D.
615 E. Michigan St. Milwaukee, WI 53202 Year of Birth: 1955 | | Trustee | | Indefinite Term; Since August 22, 2001 | | | 22 | | | • Professor Emeritus, Department of Accounting (June 2019-present), Professor, Department of Accounting (2004-May 2019), Chair, Department of Accounting (2004-2017), Marquette University. | | Independent Trustee, USA MUTUALS
(an open-end investment company) (2001-2021). | |
Gary A. Drska
615 E. Michigan St. Milwaukee, WI 53202 Year of Birth: 1956 | | Trustee | | Indefinite Term; Since August 22, 2001 | | | 22 | | | • Retired; Pilot, Frontier/Midwest Airlines, Inc. (airline company) (1986-2021). | | Independent Trustee, USA MUTUALS
(an open-end investment company) (2001-2021). | |
Vincent P. Lyles
615 E. Michigan St. Milwaukee, WI 53202 Year of Birth: 1961 | | Trustee | | Indefinite Term; Since April 6, 2022 | | | 22 | | | • Executive Director, Milwaukee Succeeds (education advocacy organization) (2023-present); System Vice President of Community Relations, Advocate Aurora Health Care (health care provider) (2019-2022); President and Chief Executive Officer, Boys & Girls Club of Greater Milwaukee (2012-2018). | | Independent Director, BMO Funds, Inc. (an open-end investment company) (2017-2022). | |
Erik K. Olstein
615 E. Michigan St. Milwaukee, WI 53202 Year of Birth: 1967 | | Trustee | | Indefinite Term; Since April 6, 2022 | | | 22 | | | • Retired; President and Chief Operating Officer (2000-2020), Vice President of Sales and Chief Operating Officer (1995-2000), Olstein Capital Management, L.P. (asset management firm); Secretary and Assistant Treasurer, The Olstein Funds (1995-2018). | | Trustee, The Olstein Funds (an open-end investment company) (1995-2018). | |
Lisa Zúñiga Ramírez
615 E. Michigan St. Milwaukee, WI 53202 Year of Birth: 1969 | | Trustee | | Indefinite Term; Since April 6, 2022 | | | 22 | | | • Retired; Principal and Senior Portfolio Manager, Segall, Bryant & Hamill, LLC (asset management firm) (2018-2020); Partner and Senior Portfolio Manager, Denver Investments LLC (asset management firm) (2009-2018). | | N/A | |
71
INFORMATION ABOUT TRUSTEES (unaudited) (continued)
Name,
Address and
Year of Birth | | Position(s)
Held with
the Trust | | Term of
Office and
Length of
Time Served | | Number of
Portfolios
in Trust
Overseen
by Trustee | | Principal Occupation(s)
During the Past Five Years | | Other
Directorships
Held by Trustee
During the Past
Five Years | |
INDEPENDENT TRUSTEES (continued) | |
Gregory M. Wesley 615 E. Michigan St. Milwaukee, WI 53202 Year of Birth: 1969 | | Trustee | | Indefinite Term; Since April 6, 2022 | | | 22 | | | • Senior Vice President of Strategic Alliances and Business Development, Medical College of Wisconsin (2016-present). | | N/A | |
INTERESTED TRUSTEE AND OFFICERS | |
John P. Buckel*
615 E. Michigan St. Milwaukee, WI 53202 Year of Birth: 1957 | | Chairperson, Trustee, President and Principal Executive Officer | | Indefinite Term Chairperson and Trustee (since January 19, 2023); Indefinite Term; Since January 24, 2013 | | | N/A | | | • Vice President, U.S. Bancorp Fund Services, LLC (2004-present). | | N/A | |
Jennifer A. Lima
615 E. Michigan St. Milwaukee, WI 53202 Year of Birth: 1974 | | Vice President, Treasurer and Principal Financial and Accounting Officer | | Indefinite Term; Since January 24, 2013 | | | N/A | | | • Vice President, U.S. Bancorp Fund Services, LLC (2002-present). | | N/A | |
Deanna B. Marotz
615 E. Michigan St. Milwaukee, WI 53202 Year of Birth: 1965 | | Chief Compliance Officer, Vice President and Anti-Money Laundering Officer | | Indefinite Term; Since October 21, 2021 | | | N/A | | | • Senior Vice President, U.S. Bancorp Fund Services, LLC (2021-present); Chief Compliance Officer, Keeley-Teton Advisors, LLC and Teton Advisors, Inc (2017-2021); Chief Compliance Officer, Keeley Asset Management Corp. (2015-2017). | | N/A | |
Jay S. Fitton
615 E. Michigan St. Milwaukee, WI 53202 Year of Birth: 1970 | | Secretary | | Indefinite Term; Since July 22, 2019 | | | N/A | | | • Vice President, U.S. Bancorp Fund Services, LLC (2019-present); Partner, Practus, LLP (2018-2019); Counsel, Drinker Biddle & Reath LLP (2016-2018). | | N/A | |
Kelly A. Strauss
615 E. Michigan St. Milwaukee, WI 53202 Year of Birth: 1987 | | Assistant Treasurer | | Indefinite Term; Since April 23, 2015 | | | N/A | | | • Assistant Vice President, U.S. Bancorp Fund Services, LLC (2011-present). | | N/A | |
72
INFORMATION ABOUT TRUSTEES (unaudited) (continued)
Name,
Address and
Year of Birth | | Position(s)
Held with
the Trust | | Term of
Office and
Length of
Time Served | | Number of
Portfolios
in Trust
Overseen
by Trustee | | Principal Occupation(s)
During the Past Five Years | | Other
Directorships
Held by Trustee
During the Past
Five Years | |
INTERESTED TRUSTEE AND OFFICERS (continued) | |
Shannon Coyle
615 E. Michigan St. Milwaukee, WI 53202 Year of Birth: 1990 | | Assistant Treasurer | | Indefinite Term; Since August 26, 2022 | | | N/A | | | • Officer, U.S. Bancorp Fund Services, LLC (2015-present). | | N/A | |
Laura A. Caroll
615 E. Michigan St. Milwaukee, WI 53202 Year of Birth: 1985 | | Assistant Treasurer | | Indefinite Term; Since August 20, 2018 | | | N/A | | | • Assistant Vice President, U.S. Bancorp Fund Services, LLC (2007-present). | | N/A | |
* Mr. Buckel is an "interested person" of the Trust as defined by the 1940 Act due to his position and material business relationship with the Trust.
73
Mairs & Power Growth Fund, established 1958
Mairs & Power Balanced Fund, established 1961
Mairs & Power Small Cap Fund, established 2011
Mairs & Power Minnesota Municipal Bond ETF (MINN), established 2021
To Contact the Funds
Call 1-855-839-2800
for the Minnesota ETF
or 1-800-304-7404
for the Mutual Funds
Or write to:
(via Regular Mail)
c/o U.S. Bancorp Fund Services, LLC
615 East Michigan Street
P. O. Box 701
Milwaukee, WI 53201-0701 | | (via Overnight or Express Mail)
c/o U.S. Bancorp Fund Services, LLC
3rd Floor
615 East Michigan Street
Milwaukee, WI 53202-0701 | |
For Fund literature and information, visit the Fund's website at:
www.mairsandpower.com
Investment Manager
Mairs & Power, Inc.
30 East 7th Street
Suite 2500
Saint Paul, MN 55101
Custodian
U.S. Bank, N.A.
Custody Operations
1555 North River Center Drive, Suite 302
Milwaukee, WI 53212
Distributor
Foreside Fund Services, LLC
Three Canal Plaza, Suite 100
Portland, ME 04101
Independent Registered Public Accounting Firm
Cohen & Company, Ltd.
342 North Water Street, Suite 830
Milwaukee, WI 53202
This report is intended for shareholders of the Funds and may not be used as sales literature unless preceded or accompanied by a current prospectus.
Mairs & Power, Inc.
c/o U.S. Bancorp Fund Services, LLC
3rd Floor
615 East Michigan Street
Milwaukee, WI 53202-0701
Item 2. Code of Ethics.
The registrant has adopted a code of ethics that applies to the registrant’s principal executive officer and principal financial officer. The registrant has not made any substantive amendments to its code of ethics during the period covered by this report. The registrant has not granted any waivers from any provisions of the code of ethics during the period covered by this report. A copy of the registrant’s Code of Ethics is filed herewith.
Item 3. Audit Committee Financial Expert.
Dr. Michael Akers is the “audit committee financial expert” and is considered to be “independent” as each term is defined in Item 3 of Form N-CSR. Dr. Akers holds a Ph.D. in accountancy and is a professor Emeritus of accounting at Marquette University in Milwaukee, Wisconsin.
Item 4. Principal Accountant Fees and Services.
The registrant has engaged its principal accountant to perform audit services, audit-related services, tax services and other services during the past two fiscal years. “Audit services” refer to performing an audit of the registrant's annual financial statements or services that are normally provided by the accountant in connection with statutory and regulatory filings or engagements for those fiscal years. “Audit-related services” refer to the assurance and related services by the principal accountant that are reasonably related to the performance of the audit. “Tax services” refer to professional services rendered by the principal accountant for tax compliance, tax advice, and tax planning. The following table details the aggregate fees billed or expected to be billed for the last two fiscal years for audit fees, audit-related fees, tax fees and other fees by the principal accountant.
| | | FYE 12/31/2022* | | | FYE 12/31/2021** | |
| (a) Audit Fees | | $ | 65,000 | | | $ | 14,500 | |
| (b) Audit-Related Fees | | | 0 | | | | 0 | |
| (c) Tax Fees | | | 12,000 | | | | 3,000 | |
| (d) All Other Fees | | | 0 | | | | 0 | |
* Fees for the fiscal year ended December 31, 2022 pertained to four funds.
** Fees for the fiscal year ended December 31, 2021 pertained to one fund.
(e)(1) The audit committee has adopted pre-approval policies and procedures that require the audit committee to pre-approve all audit and non-audit services of the registrant, including services provided to any entity affiliated with the registrant.
(e)(2) The percentage of fees billed by Cohen & Company Ltd. applicable to non-audit services pursuant to waiver of pre-approval requirement were as follows:
| | | FYE 12/31/2022 | | | FYE 12/31/2021 | |
| Audit-Related Fees | | | 0 | % | | | 0 | % |
| Tax Fees | | | 0 | % | | | 0 | % |
| All Other Fees | | | 0 | % | | | 0 | % |
(f) All of the principal accountant’s hours spent on auditing the registrant’s financial statements were attributed to work performed by full-time permanent employees of the principal accountant.
(g) The following table indicates the non-audit fees billed or expected to be billed by the registrant’s accountant for services to the registrant and to the registrant’s investment adviser (and any other controlling entity, etc.—not sub-adviser) for the last two fiscal years.
| Non-Audit Related Fees | | FYE 12/31/2022 | | | FYE 12/31/2021 | |
| Registrant | | | 0 | | | | 0 | |
| Registrant’s Investment Adviser | | | 0 | | | | 0 | |
(h) The audit committee of the board of trustees has considered whether the provision of non-audit services that were rendered to the registrant's investment adviser is compatible with maintaining the principal accountant's independence and has concluded that the provision of such non-audit services by the accountant has not compromised the accountant’s independence.
(i) Not applicable.
(j) Not applicable.
Item 5. Audit Committee of Listed Registrants.
| (a) | The registrant is an issuer as defined in Rule 10A-3 under the Securities Exchange Act of 1934, (the “Act”) and has a separately-designated standing audit committee established in accordance with Section 3(a)(58)(A) of the Act. The entire Board of Trustees is acting as the registrant’s audit committee. |
Item 6. Investments.
| (a) | Schedule of Investments is included as part of the report to shareholders filed under Item 1 of this Form. |
Item 7. Disclosure of Proxy Voting Policies and Procedures for Closed-End Management Investment Companies.
Not applicable to open-end investment companies.
Item 8. Portfolio Managers of Closed-End Management Investment Companies.
Not applicable to open-end investment companies.
Item 9. Purchases of Equity Securities by Closed-End Management Investment Company and Affiliated Purchasers.
Not applicable to open-end investment companies.
Item 10. Submission of Matters to a Vote of Security Holders.
There have been no material changes to the procedures by which shareholders may recommend nominees to the registrant’s board of trustees.
Item 11. Controls and Procedures.
| (a) | The Registrant’s President and Treasurer have reviewed the Registrant's disclosure controls and procedures (as defined in Rule 30a-3(c) under the Investment Company Act of 1940 (the “Act”)) as of a date within 90 days of the filing of this report, as required by Rule 30a-3(b) under the Act and Rules 13a-15(b) or 15d-15(b) under the Securities Exchange Act of 1934. Based on their review, such officers have concluded that the disclosure controls and procedures are effective in ensuring that information required to be disclosed in this report is appropriately recorded, processed, summarized and reported and made known to them by others within the Registrant and by the Registrant’s service provider. |
| (b) | There were no changes in the Registrant's internal control over financial reporting (as defined in Rule 30a-3(d) under the Act) that occurred during the period covered by this report that has materially affected, or is reasonably likely to materially affect, the Registrant's internal control over financial reporting. |
Item 12. Disclosure of Securities Lending Activities for Closed-End Management Investment Companies
Not applicable to open-end investment companies.
Item 13. Exhibits.
(2) A separate certification for each principal executive and principal financial officer pursuant to Section 302 of the Sarbanes-Oxley Act of 2002. Filed herewith.
(3) Any written solicitation to purchase securities under Rule 23c-1 under the Act sent or given during the period covered by the report by or on behalf of the registrant to 10 or more persons. Not applicable to open-end investment companies.
(4) Change in the registrant’s independent public accountant. There was no change in the registrant’s independent public accountant for the period covered by this report.
SIGNATURES
Pursuant to the requirements of the Securities Exchange Act of 1934 and the Investment Company Act of 1940, the registrant has duly caused this report to be signed on its behalf by the undersigned, thereunto duly authorized.
| (Registrant) | Trust for Professional Managers | |
| By (Signature and Title)* |  | |
| | John Buckel, President | |
Pursuant to the requirements of the Securities Exchange Act of 1934 and the Investment Company Act of 1940, this report has been signed below by the following persons on behalf of the registrant and in the capacities and on the dates indicated.
| By (Signature and Title)* | | |
| | John Buckel, President | |
| By (Signature and Title)* |  | |
| | Jennifer Lima, Treasurer | |
* Print the name and title of each signing officer under his or her signature.