UNITED STATES
SECURITIES AND EXCHANGE COMMISSION
Washington, D.C. 20549
FORM 10-Q
(Mark One)
| x | QUARTERLY REPORT PURSUANT TO SECTION 13 OR 15(d) OF THE SECURITIES EXCHANGE ACT OF 1934 |
For the quarterly period ended March 31, 2011
or
| ¨ | TRANSITION REPORT PURSUANT TO SECTION 13 OR 15(d) OF THE SECURITIES EXCHANGE ACT OF 1934 |
For the transition period from to
Commission File Number: 1-16735
PENN VIRGINIA RESOURCE PARTNERS, L.P.
(Exact name of registrant as specified in its charter)
| | |
| Delaware | | 23-3087517 |
(State or other jurisdiction of incorporation or organization) | | (I.R.S. Employer Identification No.) |
FIVE RADNOR CORPORATE CENTER, SUITE 500
100 MATSONFORD ROAD
RADNOR, PA 19087
(Address of principal executive offices) (Zip Code)
(610) 975-8200
(Registrant’s telephone number, including area code)
(Former name, former address and former fiscal year, if changed since last report)
Indicate by check mark whether the registrant (1) has filed all reports required to be filed by Section 13 or 15(d) of the Securities Exchange Act of 1934 (“Exchange Act”) during the preceding 12 months (or for such shorter period that the registrant was required to file such reports), and (2) has been subject to such filing requirements for the past 90 days. x Yes ¨ No
Indicate by check mark whether the registrant has submitted electronically and posted on its corporate Web site, if any, every Interactive Data File required to be submitted and posted pursuant to Rule 405 of Regulation S-T during the preceding 12 months (or for such shorter period that the registrant was required to submit and post such files). Yes ¨ No ¨
Indicate by a check mark whether the registrant is a large accelerated filer, an accelerated filer, a non-accelerated filer or a smaller reporting company. See the definitions of “large accelerated filer,” “accelerated filer” and “smaller reporting company” in Rule 12b-2 of the Exchange Act.
| | | | | | |
| Large accelerated filer | | ¨ | | Accelerated filer | | x |
| | | |
| Non-accelerated filer | | ¨ (Do not check if a smaller reporting company) | | Smaller reporting company | | ¨ |
Indicate by check mark whether the registrant is a shell company (as defined in Rule 12b-2 of the Exchange Act). ¨ Yes x No
As of April 21, 2011, 70,964,698 common units representing limited partner interests were outstanding.
PENN VIRGINIA RESOURCE PARTNERS, L.P.
INDEX
PART I. FINANCIAL INFORMATION
| Item 1 | Financial Statements |
PENN VIRGINIA RESOURCE PARTNERS, L.P. AND SUBSIDIARIES
CONSOLIDATED STATEMENTS OF INCOME – unaudited
(in thousands, except per unit data)
| | | | | | | | |
| | | Three Months Ended
March 31, | |
| | | 2011 | | | 2010 | |
Revenues | | | | | | | | |
Natural gas midstream | | $ | 206,281 | | | $ | 170,609 | |
Coal royalties | | | 38,991 | | | | 28,226 | |
Other | | | 8,255 | | | | 7,643 | |
| | | | | | | | |
Total revenues | | | 253,527 | | | | 206,478 | |
| | | | | | | | |
| | |
Expenses | | | | | | | | |
Cost of gas purchased | | | 170,255 | | | | 141,795 | |
Operating | | | 13,073 | | | | 10,308 | |
General and administrative | | | 10,970 | | | | 9,799 | |
Depreciation, depletion and amortization | | | 21,244 | | | | 17,818 | |
| | | | | | | | |
Total expenses | | | 215,542 | | | | 179,720 | |
| | | | | | | | |
| | |
Operating income | | | 37,985 | | | | 26,758 | |
| | |
Other income (expense) | | | | | | | | |
Interest expense | | | (10,850 | ) | | | (5,835 | ) |
Derivatives | | | (19,761 | ) | | | (7,568 | ) |
Other | | | 137 | | | | 327 | |
| | | | | | | | |
| | |
Net income | | $ | 7,511 | | | $ | 13,682 | |
Net loss (income) attributable to noncontrolling interests, pre-merger (Note 1) | | | 664 | | | | (5,257 | ) |
| | | | | | | | |
Net income attributable to Penn Virginia Resource Partners, L.P. | | $ | 8,175 | | | $ | 8,425 | |
| | | | | | | | |
| | |
Basic and diluted net income per limited partner unit | | $ | 0.17 | | | $ | 0.22 | |
| | |
Weighted average number of units outstanding, basic and diluted | | | 46,426 | | | | 38,293 | |
The accompanying notes are an integral part of these Consolidated Financial Statements.
1
PENN VIRGINIA RESOURCE PARTNERS, L.P. AND SUBSIDIARIES
CONSOLIDATED BALANCE SHEETS – unaudited
(in thousands)
| | | | | | | | |
| | | March 31,
2011 | | | December 31,
2010 | |
Assets | | | | | | | | |
Current assets | | | | | | | | |
Cash and cash equivalents | | $ | 14,475 | | | $ | 15,964 | |
Accounts receivable, net of allowance for doubtful accounts | | | 99,609 | | | | 97,787 | |
Other current assets | | | 4,716 | | | | 5,900 | |
| | | | | | | | |
Total current assets | | | 118,800 | | | | 119,651 | |
| | | | | | | | |
| | |
Property, plant and equipment | | | 1,418,365 | | | | 1,295,227 | |
Accumulated depreciation, depletion and amortization | | | (343,811 | ) | | | (324,181 | ) |
| | | | | | | | |
Net property, plant and equipment | | | 1,074,554 | | | | 971,046 | |
| | | | | | | | |
| | |
Equity investments | | | 81,167 | | | | 84,327 | |
Intangible assets, net | | | 75,379 | | | | 76,950 | |
Other long-term assets | | | 45,767 | | | | 52,231 | |
| | | | | | | | |
Total assets | | $ | 1,395,667 | | | $ | 1,304,205 | |
| | | | | | | | |
| | |
Liabilities and Partners’ Capital | | | | | | | | |
Current liabilities | | | | | | | | |
Accounts payable and accrued liabilities | | $ | 104,971 | | | $ | 103,845 | |
Deferred income | | | 3,729 | | | | 4,360 | |
Derivative liabilities | | | 29,016 | | | | 19,516 | |
| | | | | | | | |
Total current liabilities | | | 137,716 | | | | 127,721 | |
| | | | | | | | |
| | |
Deferred income | | | 10,376 | | | | 7,874 | |
Other liabilities | | | 16,604 | | | | 20,853 | |
Derivative liabilities | | | 10,321 | | | | 5,107 | |
Senior notes | | | 300,000 | | | | 300,000 | |
Revolving credit facility | | | 515,000 | | | | 408,000 | |
| | |
Partners’ capital | | | | | | | | |
Common unitholders | | | 405,052 | | | | 213,646 | |
Accumulated other comprehensive loss | | | 598 | | | | 159 | |
| | | | | | | | |
| | | 405,650 | | | | 213,805 | |
Non-controlling interests, pre-merger (Note 1) | | | — | | | | 220,845 | |
| | | | | | | | |
Total partners’ capital | | | 405,650 | | | | 434,650 | |
| | | | | | | | |
Total liabilities and partners’ capital | | $ | 1,395,667 | | | $ | 1,304,205 | |
| | | | | | | | |
The accompanying notes are an integral part of these Consolidated Financial Statements.
2
PENN VIRGINIA RESOURCE PARTNERS, L.P. AND SUBSIDIARIES
CONSOLIDATED STATEMENTS OF CASH FLOWS – unaudited
(in thousands)
| | | | | | | | |
| | | Three Months Ended
March 31, | |
| | | 2011 | | | 2010 | |
Cash flows from operating activities | | | | | | | | |
Net income | | $ | 7,511 | | | $ | 13,682 | |
Adjustments to reconcile net income to net cash provided by operating activities: | | | | | | | | |
Depreciation, depletion and amortization | | | 21,244 | | | | 17,818 | |
Commodity derivative contracts: | | | | | | | | |
Total derivative losses | | | 19,761 | | | | 8,150 | |
Cash payments to settle derivatives | | | (4,858 | ) | | | (1,646 | ) |
Non-cash interest expense | | | 1,040 | | | | 1,243 | |
Non-cash unit-based compensation | | | 821 | | | | 935 | |
Equity earnings, net of distributions received | | | 3,160 | | | | 443 | |
Other | | | (147 | ) | | | (302 | ) |
Changes in operating assets and liabilities | | | | | | | | |
Accounts receivable | | | (1,795 | ) | | | 9,504 | |
Accounts payable and accrued liabilities | | | 8,421 | | | | (4,831 | ) |
Deferred income | | | (147 | ) | | | (39 | ) |
Other asset and liabilities | | | (203 | ) | | | 3,565 | |
| | | | | | | | |
Net cash provided by operating activities | | | 54,808 | | | | 48,522 | |
| | | | | | | | |
| | |
Cash flows from investing activities | | | | | | | | |
Acquisitions | | | (95,216 | ) | | | (29 | ) |
Additions to property, plant and equipment | | | (37,451 | ) | | | (7,957 | ) |
Other | | | 1,007 | | | | 272 | |
| | | | | | | | |
Net cash used in investing activities | | | (131,660 | ) | | | (7,714 | ) |
| | | | | | | | |
| | |
Cash flows from financing activities | | | | | | | | |
Distributions to partners | | | (30,633 | ) | | | (30,153 | ) |
Proceeds from borrowings | | | 120,000 | | | | 10,000 | |
Repayments of borrowings | | | (13,000 | ) | | | (12,000 | ) |
Cash paid for merger | | | (1,004 | ) | | | — | |
| | | | | | | | |
Net cash provided by (used in) financing activities | | | 75,363 | | | | (32,153 | ) |
| | | | | | | | |
| | |
Net increase (decrease) in cash and cash equivalents | | | (1,489 | ) | | | 8,655 | |
Cash and cash equivalents – beginning of period | | | 15,964 | | | | 19,314 | |
| | | | | | | | |
Cash and cash equivalents – end of period | | $ | 14,475 | | | $ | 27,969 | |
| | | | | | | | |
| | |
Supplemental disclosure: | | | | | | | | |
Cash paid for interest | | $ | 5,616 | | | $ | 6,429 | |
| | |
Noncash investing activities: | | | | | | | | |
Other liabilities related to acquisitions | | $ | 2,060 | | | $ | — | |
The accompanying notes are an integral part of these Consolidated Financial Statements.
3
PENN VIRGINIA RESOURCE PARTNERS, L.P. AND SUBSIDIARIES
CONSOLIDATED STATEMENT OF PARTNERS’ CAPITAL AND COMPREHENSIVE INCOME –
unaudited
(in thousands)
| | | | | | | | | | | | | | | | | | | | | | | | |
| | | Common Units (1) | | | Accumulated Other
Comprehensive
Income | | | Noncontrolling
interests of PVR (2) | | | Total | | | Comprehensive
Income | |
| | | | | | |
Balance at December 31, 2010 | | | 38,293 | | | $ | 213,646 | | | $ | 159 | | | $ | 220,845 | | | $ | 434,650 | | | | | |
| | | | | | |
Unit-based compensation | | | 4 | | | $ | 4,930 | | | | | | | | | | | $ | 4,930 | | | | | |
Costs associated with merger | | | | | | $ | (10,997 | ) | | | | | | | | | | $ | (10,997 | ) | | | | |
Units issued to acquire non-controlling interest | | | 32,665 | | | $ | 204,537 | | | $ | 250 | | | $ | (204,787 | ) | | $ | — | | | | | |
Distributions paid | | | | | | $ | (15,239 | ) | | | | | | $ | (15,394 | ) | | $ | (30,633 | ) | | | | |
Net income (loss) | | | | | | $ | 8,175 | | | | | | | $ | (664 | ) | | $ | 7,511 | | | $ | 7,511 | |
Other comprehensive income | | | | | | | | | | $ | 189 | | | | | | | $ | 189 | | | $ | 189 | |
| | | | | | | | | | | | | | | | | | | | | | | | |
| | | | | | |
Balance at March 31, 2011 | | | 70,962 | | | $ | 405,052 | | | $ | 598 | | | $ | — | | | $ | 405,650 | | | $ | 7,700 | |
| | | | | | | | | | | | | | | | | | | | | | | | |
| | | | | |
| | | Common Units (1) | | | Accumulated Other
Comprehensive
Income (Loss) | | | Noncontrolling
interests of PVR | | | Total | | | Comprehensive
Income | |
| | | | | | |
Balance at December 31, 2009 | | | 38,293 | | | $ | 250,240 | | | $ | (544 | ) | | $ | 235,907 | | | $ | 485,603 | | | | | |
| | | | | | |
Unit-based compensation | | | | | | $ | — | | | | | | | $ | 937 | | | $ | 937 | | | | | |
Change in ownership | | | | | | $ | (309 | ) | | | | | | $ | 309 | | | $ | — | | | | | |
Distributions paid | | | | | | $ | (14,848 | ) | | | | | | $ | (15,305 | ) | | $ | (30,153 | ) | | | | |
Net income | | | | | | $ | 8,425 | | | | | | | $ | 5,257 | | | $ | 13,682 | | | $ | 13,682 | |
Other comprehensive income | | | | | | | | | | $ | 228 | | | $ | 354 | | | $ | 582 | | | $ | 582 | |
| | | | | | | | | | | | | | | | | | | | | | | | |
| | | | | | |
Balance at March 31, 2010 | | | 38,293 | | | $ | 243,508 | | | $ | (316 | ) | | $ | 227,459 | | | $ | 470,651 | | | $ | 14,264 | |
| | | | | | | | | | | | | | | | | | | | | | | | |
| (1) | The outstanding common units have been adjusted to reflect the effect of the Merger, see Note 1, Organization, and Note 2, Basis of Presentation. PVG unitholders received consideration of 0.98 of a PVR common unit for each PVG common unit. |
| (2) | Effective with the Merger, see Note 1, Organization, and Note 2, Basis of Presentation, noncontrolling interests no longer exist and has become part of common units. |
The accompanying notes are an integral part of these Consolidated Financial Statements.
4
PENN VIRGINIA RESOURCE PARTNERS, L.P. AND SUBSIDIARIES
NOTES TO CONSOLIDATED FINANCIAL STATEMENTS – unaudited
March 31, 2011
Penn Virginia Resource Partners, L.P. is a publicly traded Delaware master limited partnership, the limited partner units representing limited partner interests which are listed on the New York Stock Exchange (“NYSE”) under ticker symbol “PVR.” As used in these Notes to Consolidated Financial Statements, the “Partnership,” “PVR,” “we,” “us” or “our” mean Penn Virginia Resource Partners, L.P. and, where the context requires, includes our subsidiaries.
We are principally engaged in the management of coal and natural resource properties and the gathering and processing of natural gas in the United States. We currently conduct operations in two business segments: (i) coal and natural resource management and (ii) natural gas midstream.
Our coal and natural resource management segment primarily involves the management and leasing of coal properties and the subsequent collection of royalties. Our coal reserves are primarily located in Kentucky, Virginia, West Virginia, Illinois, New Mexico and Tennessee. We also earn revenues from other land management activities, such as selling standing timber, leasing fee-based coal-related infrastructure facilities to certain lessees and end-user industrial plants, collecting oil and gas royalties and from coal transportation, or wheelage, fees.
Our natural gas midstream segment is engaged in providing natural gas processing, gathering and other related services. We own and operate natural gas midstream assets located in Oklahoma, Texas and Pennsylvania. Our natural gas midstream business derives revenues primarily from gas processing contracts with natural gas producers and from fees charged for gathering natural gas volumes and providing other related services. In addition, we own a 25% member interest in Thunder Creek Gas Services, LLC (“Thunder Creek”), a joint venture that gathers and transports coalbed methane in Wyoming’s Powder River Basin. We also own a 50% percent member interest in Crosspoint Pipeline LLC (“Crosspoint”), a joint venture that gathers and transports natural gas from our Crossroads gas processing plant to an interstate pipeline. We own a natural gas marketing business, which aggregates third-party volumes and sells those volumes into intrastate pipeline systems and at market hubs accessed by various interstate pipelines.
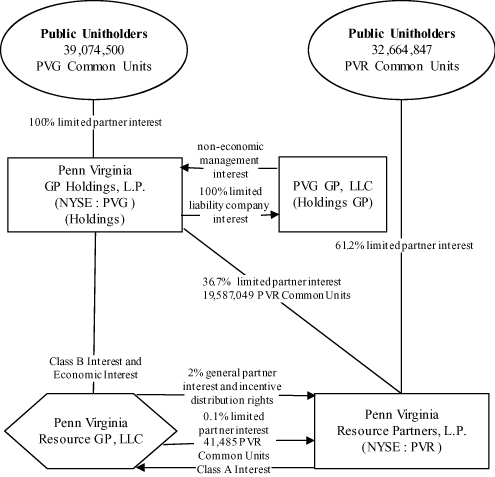
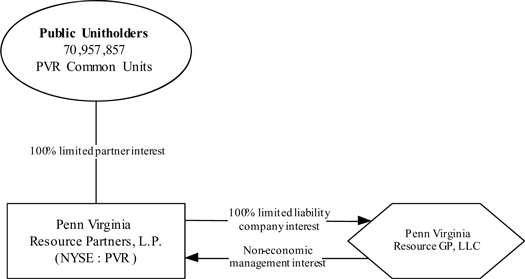
On September 21, 2010, we entered into an Agreement and Plan of Merger (the “Merger Agreement”) by and among PVR, Penn Virginia Resource GP, LLC (“PVR GP”), Penn Virginia GP Holdings, L.P. (“PVG”), PVG GP LLC (“PVG GP”) and PVR Radnor, LLC (“Merger Sub”), a wholly owned subsidiary of PVR. The Merger Agreement received final approval by PVR unitholders on February 16, 2011 and PVG unitholders on March 9, 2011. Pursuant to the Merger Agreement, PVG and PVG GP were merged into Merger Sub, with Merger Sub as the surviving entity (the “Merger”). Merger Sub was subsequently merged into PVR GP, with PVR GP being the surviving entity as a subsidiary of PVR. In the transaction, PVG unitholders received consideration of 0.98 PVR common units for each PVG common unit, representing aggregate consideration of approximately 38.3 million PVR common units. Pursuant to the Merger Agreement and the Fourth Amended and Restated Agreement of Limited Partnership of PVR, the incentive distribution rights held by PVR’s general partner were extinguished, the 2.0% general partner interest in PVR held by PVR’s general partner was converted into a noneconomic interest and approximately 19.6 million PVR common units owned by PVG were cancelled. The Merger closed on March 10, 2011. After the effective date of the Merger and related transactions, the separate existence of each of PVG, PVG GP and Merger Sub ceased, and PVR GP survives as a wholly-owned subsidiary of PVR.
Historically, PVG’s ownership of PVR’s general partner gave it control of PVR. During the periods that PVG controlled PVR (prior to March 10, 2011), PVG had no substantial assets or liabilities other than those of PVR. PVG’s consolidated financial statements included noncontrolling owners’ interest of consolidated subsidiaries, which reflected the proportion of PVR common units owned by PVR’s unitholders other than PVG. These amounts are reflected in the historical financial balances presented up to consummation of the Merger.
5
PVG is considered the surviving consolidated entity for accounting purposes, while PVR is the surviving consolidated entity for legal and reporting purposes. The Merger was accounted for as an equity transaction. Therefore, the changes in ownership interests as a result of the Merger did not result in gain or loss recognition.
After the Merger, the board of directors of PVR’s general partner, PVR GP, consists of nine members, six of whom were existing members of the PVR GP board of directors before the Merger and three of whom were the three existing members of the conflicts committee of the board of directors of PVG GP prior to the Merger.
During the three months ended March 31, 2011 and for the year ended December 31, 2010, we incurred $6.4 million and $4.6 million of direct costs associated with the Merger. The aggregate costs of $11.0 million were charged to partners’ capital upon the effective date of the Merger in 2011. At December 31, 2010, the $4.6 million of costs incurred at that time were included in other long-term assets on the consolidated balance sheet. Costs incurred and paid during the three months ended March 31, 2011 are reported under the caption “Cash paid for merger” in financing activities section of the consolidated statement of cash flows. No merger costs were incurred in the three months ended March 31, 2010.
The following diagrams depict the ownership structure of PVR and PVG before and after the Merger:
Ownership Structure Before Merger
6
Ownership Structure Following the Merger on March 10, 2011
These financial statements were originally the financial statements of PVG prior to the effective date of the Merger. The Merger was accounted for in accordance with consolidation accounting standards for changes in parent’s ownership interest in a subsidiary. Under these accounting standards, the exchange of PVG common units for PVR common units was accounted for as a PVG equity issuance and PVG was the surviving entity for accounting purposes. Although PVG was the surviving entity for accounting purposes, PVR is the surviving entity for legal and reporting purposes; consequently, the name on these financial statements was changed from “Penn Virginia GP Holdings, L.P.” to “Penn Virginia Resource Partners, L.P.”
The reconciliation of PVR’s net income, as historically reported, to the net income reported in these financial statements is as follows (in thousands):
| | | | |
| | | Three Months
Ended March 31, | |
| | | 2010 | |
Net income, as previously reported | | $ | 14,651 | |
Adjustments: | | | | |
General and administrative expense(a) | | | (988 | ) |
Interest income | | | 19 | |
| | | | |
Net income | | $ | 13,682 | |
| | | | |
| (a) | PVG incurred general and administrative expenses primarily related to audit fees, board of director fees, insurance and SEC filing expenses. |
Pursuant to the Merger, PVG’s unitholders received 0.98 of PVR common units for each PVG common unit they owned, or approximately 38.3 million of PVR common units in the aggregate, in exchange for all outstanding PVG common units. Also pursuant to the Merger, approximately 19.6 million PVR common units that were held by PVG were cancelled. As a result, PVR’s common units outstanding increased from 52.3 million to 71.0 million. However, for historical reporting purposes, the impact of this change was accounted for as a reverse unit split of
7
0.98 to 1.0. Therefore, since PVG was the surviving entity for accounting purposes, the weighted average common units outstanding used for basic and diluted earnings per unit calculations are PVG’s historical weighted average common units outstanding adjusted for the retrospective application of the reverse unit split. Amounts reflecting historical PVG common unit and per common unit amounts included in this report have been restated for the reverse unit split.
Our Consolidated Financial Statements include the accounts of PVR and all of our wholly owned subsidiaries. Investments in non-controlled entities over which we exercise significant influence are accounted for using the equity method. Intercompany balances and transactions have been eliminated in consolidation. Our Consolidated Financial Statements have been prepared in accordance with accounting principles generally accepted in the United States of America. These statements involve the use of estimates and judgments where appropriate. In the opinion of management, all adjustments, consisting of normal recurring accruals, considered necessary for a fair presentation of our Consolidated Financial Statements have been included. Our Consolidated Financial Statements should be read in conjunction with our consolidated financial statements and footnotes included in PVR’s and PVG’s Annual Reports on Form 10-K for the year ended December 31, 2010. Operating results for the three months ended March 31, 2011 are not necessarily indicative of the results that may be expected for the year ending December 31, 2011.
Management has evaluated all activities of PVR through the date upon which our Consolidated Financial Statements were issued and concluded that no subsequent events have occurred that would require recognition in the Consolidated Financial Statements, but disclosure is required in the Notes to Consolidated Financial Statements. See Note 13 to the Consolidated Financial Statements.
All dollar and unit amounts presented in the tables to these Notes are in thousands unless otherwise indicated.
In the following paragraphs, all references to coal, crude oil and natural gas reserves and acreage acquired are unaudited. The factors we used to determine the fair market value of the acquisition include, but are not limited to, discounted future net cash flows on a risk-adjusted basis, geographic location, quality of resources, potential marketability and financial condition of lessees.
Business Combination
Middle Fork
On January 25, 2011, we completed an acquisition to acquire certain mineral rights and associated oil and gas royalty interests in Kentucky and Tennessee for approximately $95.7 million. The results of Middle Fork operations have been included in the consolidated financial statements since that date. The mineral rights include approximately 102 million tons of coal reserves and resources. The coal is primarily steam coal and expands our geographic scope in the Central Appalachia coal region.
We acquired assets of $97.8 million and liabilities of $2.1 million, which primarily represent deferred income. Deferred income represents minimum royalty payments paid by operators of the properties that may be recouped through future production. Funding for the acquisition was provided by borrowings under our revolving credit facility (the “Revolver”).
The Middle Fork acquisition has been accounted for using the purchase method of accounting. Under the purchase method of accounting, the total purchase price has been allocated to the tangible assets acquired and liabilities assumed. Below is the detailed allocation based upon acquisition date fair values:
8
| | | | |
Fair value of assets acquired and liabilities assumed: | | | | |
Coal mineral interests | | $ | 94,410 | |
Oil and gas interests | | | 2,857 | |
Land | | | 449 | |
Support equipment | | | 60 | |
Deferred income | | | (2,018 | ) |
Other liabilities | | | (42 | ) |
| | | | |
| |
Fair value of assets acquired and liabilities assumed | | $ | 95,716 | |
| | | | |
The following pro forma financial information reflects the consolidated results of our operations as if the Middle Fork acquisition had occurred on January 1, 2010. The pro forma information includes adjustments for royalty revenues, operating expenses, general and administrative expense, depreciation and depletion of the acquired property and equipment, interest expense for acquisition debt and the change in weighted average common units resulting from the Merger. The pro forma financial information is not necessarily indicative of the results of operations as it would have been had these transactions been effected on the assumed date (in thousands, except per unit data):
| | | | | | | | |
| | | March 31,
2011 | | | March 31,
2010 | |
| | |
Revenues | | $ | 254,380 | | | $ | 208,838 | |
Net income attributable to PVR | | $ | 8,338 | | | $ | 8,867 | |
Net income per limited partner unit, basic and diluted | | $ | 0.18 | | | $ | 0.23 | |
| 4. | Fair Value Measurements |
We apply the authoritative accounting provisions for measuring fair value of both our financial and nonfinancial assets and liabilities. Fair value is an exit price representing the expected amount we would receive to sell an asset or pay to transfer a liability in an orderly transaction with market participants at the measurement date. We have followed consistent methods and assumptions to estimate the fair values as more fully described in our Annual Report on Form 10-K for the year ended December 31, 2010.
Our financial instruments that are subject to fair value disclosure consist of cash and cash equivalents, accounts receivable, accounts payable, derivatives and long-term debt. At March 31, 2011, the carrying values of all of these financial instruments, except the long-term debt with fixed interest rates, approximated fair value. The fair value of floating-rate debt approximates the carrying amount because the interest rates paid are based on short-term maturities. The fair value of our fixed-rate long-term debt is estimated based on the published market prices for the same or similar issues. As of March 31, 2011, the fair value of our fixed-rate debt was $321.0 million.
Nonrecurring Fair Value Measurements
We completed the Middle Fork acquisition during the first quarter of 2011. See Note 3, “Acquisitions,” for a description of this acquisition. In connection with our accounting for this acquisition, it was necessary for us to estimate the values of the assets acquired and liabilities assumed, which involved the use of various assumptions. The most significant assumptions, and the ones requiring the most judgment, involved the estimated fair values of coal minerals and oil and gas royalties along with the related pricing and production activities. The coal minerals acquisition included nonfinancial assets and liabilities that were measured at fair value as of the acquisition date. The total purchase price allocation was $95.7 million.
The following table summarizes the fair value estimates for nonfinancial assets and liabilities measured at fair value on a nonrecurring basis by category during the first quarter of 2011:
9
| | | | | | | | | | | | | | | | |
Description | | Fair Value
Measurements at
January 25, 2011 | | | Quoted Prices in
Active Markets for
Identical Assets
(Level 1) | | | Significant Other
Observable Inputs
(Level 2) | | | Significant
Unobservable
Inputs (Level 3) | |
Middle Fork assets | | $ | 97,776 | | | $ | — | | | $ | — | | | $ | 97,776 | |
Middle Fork liabilities | | | (2,060 | ) | | | — | | | | — | | | | (2,060 | ) |
| | | | | | | | | | | | | | | | |
Total | | $ | 95,716 | | | $ | — | | | $ | — | | | $ | 95,716 | |
| | | | | | | | | | | | | | | | |
Recurring Fair Value Measurements
Certain assets and liabilities, including our derivatives, are measured at fair value on a recurring basis in our Consolidated Balance Sheet. The following tables summarize the valuation of these assets and liabilities for the periods presented:
| | | | | | | | | | | | | | | | |
| | | | | | Fair Value Measurements at March 31, 2011, Using | |
Description | | Fair Value
Measurements at
March 31, 2011 | | | Quoted Prices in
Active Markets for
Identical Assets
(Level 1) | | | Significant Other
Observable Inputs
(Level 2) | | | Significant
Unobservable
Inputs (Level 3) | |
Interest rate swap liabilities - current | | $ | (6,112 | ) | | $ | — | | | $ | (6,112 | ) | | $ | — | |
Interest rate swap liabilities - noncurrent | | | (888 | ) | | | — | | | | (888 | ) | | | — | |
Commodity derivative liabilities - current | | | (22,904 | ) | | | — | | | | (22,904 | ) | | | — | |
Commodity derivative liabilities - noncurrent | | | (9,433 | ) | | | — | | | | (9,433 | ) | | | — | |
| | | | | | | | | | | | | | | | |
Total | | $ | (39,337 | ) | | $ | — | | | $ | (39,337 | ) | | $ | — | |
| | | | | | | | | | | | | | | | |
| | |
| | | | | | Fair Value Measurements at December 31, 2010, Using | |
Description | | Fair Value
Measurements at
December 31, 2010 | | | Quoted Prices in
Active Markets for
Identical Assets
(Level 1) | | | Significant Other
Observable Inputs
(Level 2) | | | Significant
Unobservable
Inputs (Level 3) | |
Interest rate swap liabilities - current | | $ | (7,647 | ) | | $ | — | | | $ | (7,647 | ) | | $ | — | |
Interest rate swap liabilities - noncurrent | | | (1,037 | ) | | | — | | | | (1,037 | ) | | | — | |
Commodity derivative liabilities - current | | | (11,869 | ) | | | — | | | | (11,869 | ) | | | — | |
Commodity derivative liabilities - noncurrent | | | (4,070 | ) | | | — | | | | (4,070 | ) | | | — | |
| | | | | | | | | | | | | | | | |
Total | | $ | (24,623 | ) | | $ | — | | | $ | (24,623 | ) | | $ | — | |
| | | | | | | | | | | | | | | | |
We used the following methods and assumptions to estimate the fair values:
| | • | | Commodity derivatives: We utilize costless collars and swap derivative contracts to hedge against the variability in the fractionation, or frac, spread. We determine the fair values of our commodity derivative agreements based on discounted cash flows based on quoted forward prices for the respective commodities. Each of these is a level 2 input. We use the income approach, using valuation techniques that convert future cash flows to a single discounted value. |
| | • | | Interest rate swaps: We have entered into the interest rate swaps (“Interest Rate Swaps”) to establish fixed rates on a portion of the outstanding borrowings under the Revolver. We use an income approach using valuation techniques that connect future cash flows to a single discounted value. We estimate the fair value of the swaps based on published interest rate yield curves as of the date of the estimate. Each of these is a level 2 input. |
10
Natural Gas Midstream Segment Commodity Derivatives
We determine the fair values of our derivative agreements using third-party quoted forward prices for the respective commodities as of the end of the reporting period and discount rates adjusted for the credit risk of our counterparties if the derivative is in an asset position and our own credit risk if the derivative is in a liability position. The following table sets forth our commodity derivative positions as of March 31, 2011:
| | | | | | | | | | | | | | | | | | | | |
| | | Average
Volume
Per Day | | | Swap Price | | | Weighted Average Price | | | Fair Value at
March 31, 2011 | |
| | | | | Put | | | Call | | |
| | | | | |
NGL - natural gasoline collar | | | (gallons | ) | | | | | | | (per gallon | ) | | | | | | | | |
Second quarter 2011 through fourth quarter 2011 | | | 95,000 | | | | | | | $ | 1.57 | | | $ | 1.94 | | | $ | (14,440 | ) |
| | | | | |
Crude oil collar | | | (barrels | ) | | | | | | | (per barrel | ) | | | | | | | | |
Second quarter 2011 through fourth quarter 2011 | | | 400 | | | | | | | $ | 75.00 | | | $ | 98.50 | | | | (1,367 | ) |
| | | | | |
Natural gas purchase swap | | | (MMBtu | ) | | | (MMBtu | ) | | | | | | | | | | | | |
Second quarter 2011 through fourth quarter 2011 | | | 6,500 | | | $ | 5.80 | | | | | | | | | | | | (2,167 | ) |
| | | | | |
NGL - natural gasoline collar | | | (gallons | ) | | | | | | | (per gallon | ) | | | | | | | | |
First quarter 2012 through fourth quarter 2012 | | | 54,000 | | | | | | | $ | 1.75 | | | $ | 2.02 | | | | (8,963 | ) |
| | | | | |
Crude oil swap | | | (barrels | ) | | | (per barrel | ) | | | | | | | | | | | | |
First quarter 2012 through fourth quarter 2012 | | | 600 | | | $ | 88.62 | | | | | | | | | | | | (3,724 | ) |
| | | | | |
Natural gas purchase swap | | | (MMBtu | ) | | | (MMBtu | ) | | | | | | | | | | | | |
First quarter 2012 through fourth quarter 2012 | | | 4,000 | | | $ | 5.195 | | | | | | | | | | | | (196 | ) |
| | | | | |
Settlements to be paid in subsequent period | | | | | | | | | | | | | | | | | | | (1,480 | ) |
Interest Rate Swaps
We have entered into the Interest Rate Swaps to establish fixed interest rates on a portion of the outstanding borrowings under the Revolver. The following table sets forth the positions of the Interest Rate Swaps for the periods presented:
| | | | | | | | | | | | | | | | |
| | | Notional Amounts
(in millions) | | | Swap Interest
Rates (1) | | | Fair Value at
March 31, 2011 | |
Term | | | Pay | | | Receive | | |
March 2010 - December 2011 | | $ | 250.0 | | | | 3.37 | % | | | LIBOR | | | $ | (4,398 | ) |
December 2011 - December 2012 | | $ | 100.0 | | | | 2.09 | % | | | LIBOR | | | $ | (2,602 | ) |
| (1) | References to LIBOR represent the 3-month rate. |
We reported a (i) net derivative liability of $39.3 million at March 31, 2011 and (ii) gain in accumulated other comprehensive income (“AOCI”) of $0.6 million as of March 31, 2011 related to the Interest Rate Swaps. In connection with periodic settlements, we reclassified a total of $0.2 million and $0.6 million of net hedging losses on the Interest Rate Swaps from AOCI to the derivatives and interest line on the Consolidated Statements of Income during the three months ended March 31, 2011 and 2010. See the following “Financial Statement Impact of Derivatives” section for the impact of the Interest Rate Swaps on our Consolidated Financial Statements.
11
Financial Statement Impact of Derivatives
The following table summarizes the effects of our derivative activities, as well as the location of losses on our Consolidated Statements of Income for the periods presented:
| | | | | | | | | | |
| | | Location of derivatives recognized in income statement | | | | | | |
| | | | Three Months Ended
March 31, | |
| | | | 2011 | | | 2010 | |
Derivatives not designated as hedging instruments: | | | | | | | | | | |
Interest rate contracts (1) | | Interest expense | | | — | | | | (582 | ) |
Interest rate contracts | | Derivatives | | | (382 | ) | | | (3,130 | ) |
Commodity contracts | | Derivatives | | | (19,379 | ) | | | (4,438 | ) |
| | | | | | | | | | |
Total decrease in net income resulting from derivatives | | | | $ | (19,761 | ) | | $ | (8,150 | ) |
| | | | | | | | | | |
Realized and unrealized derivative impact: | | | | | | | | | | |
Cash paid for commodity and interest rate contract settlements | | Derivatives | | $ | (4,858 | ) | | $ | (1,646 | ) |
Unrealized derivative losses (2) | | | | | (14,903 | ) | | | (6,504 | ) |
| | | | | | | | | | |
Total decrease in net income resulting from derivatives | | | | $ | (19,761 | ) | | $ | (8,150 | ) |
| | | | | | | | | | |
| (1) | This activity represents Interest Rate Swap amounts reclassified out of AOCI and into earnings. |
| (2) | This activity represents unrealized losses in the interest expense and derivatives caption on our Consolidated Statements of Income. |
The following table summarizes the fair value of our derivative instruments, as well as the locations of these instruments, on our Consolidated Balance Sheets for the periods presented:
| | | | | | | | | | | | | | | | | | |
| | | | | Fair values as of
March 31, 2011 | | | Fair values as of
December 31, 2010 | |
| | | Balance Sheet Location | | Derivative
Assets | | | Derivative
Liabilities | | | Derivative
Assets | | | Derivative
Liabilities | |
Derivatives not designated as hedging instruments: | | | | | | | | | | | | | | | | | | |
Interest rate contracts | | Derivative assets/liabilities - current | | $ | — | | | $ | 6,112 | | | $ | — | | | $ | 7,647 | |
Interest rate contracts | | Derivative assets/liabilities - noncurrent | | | — | | | | 888 | | | | — | | | | 1,037 | |
Commodity contracts | | Derivative assets/liabilities - current | | | — | | | | 22,904 | | | | — | | | | 11,869 | |
Commodity contracts | | Derivative assets/liabilities - noncurrent | | | — | | | | 9,433 | | | | — | | | | 4,070 | |
| | | | | | | | | | | | | | | | | | |
Total derivatives not designated as hedging instruments | | $ | — | | | $ | 39,337 | | | $ | — | | | $ | 24,623 | |
| | | | | | | | | | | | | | | | | | |
Total fair value of derivative instruments | | $ | — | | | $ | 39,337 | | | $ | — | | | $ | 24,623 | |
| | | | | | | | | | | | | | | | | | |
As of March 31, 2011, we were not party to derivative instruments that were classified as fair value hedges or trading securities. In addition, as of March 31, 2011, we were not party to derivative instruments containing credit risk contingencies.
In accordance with the equity method of accounting, we recognized earnings of $1.6 million and $2.2 million for the three months ended March 31, 2011 and 2010, with a corresponding increase in the investment. The joint ventures generally pay quarterly distributions on their cash flow. We received distributions of $4.8 million and $2.7 million for the three months ended March 31, 2011 and 2010. Equity earnings related to our 50% interest in Coal Handling Solutions LLC, our 25% interest in Thunder Creek and our 50% interest in Crosspoint are recorded in other revenues on the Consolidated Statements of Income. The equity investments for all joint ventures are included in the equity investments caption on the Consolidated Balance Sheets.
Summarized financial information of unconsolidated equity investments is as follows for the periods presented:
12
| | | | | | | | |
| | | March 31,
2011 | | | December 31,
2010 | |
Current assets | | $ | 35,494 | | | $ | 43,367 | |
Noncurrent assets | | $ | 206,696 | | | $ | 203,595 | |
Current liabilities | | $ | 12,013 | | | $ | 6,890 | |
Noncurrent liabilities | | $ | 5,231 | | | $ | 5,147 | |
| |
| | | Three Months Ended March 31, | |
| | | 2011 | | | 2010 | |
Revenues | | $ | 14,823 | | | $ | 16,959 | |
Expenses | | $ | 8,236 | | | $ | 8,917 | |
Net income | | $ | 6,587 | | | $ | 8,042 | |
Revolver
As of March 31, 2011, net of outstanding indebtedness of $515.0 million and letters of credit of $1.6 million, we had remaining borrowing capacity of $333.4 million on the Revolver. The weighted average interest rate on borrowings outstanding under the Revolver during the first quarter of 2011 was approximately 2.9%. We do not have a public rating for the Revolver. As of March 31, 2011, we were in compliance will all our covenants under the Revolver.
| 8. | Partners’ Capital and Distributions |
As of March 31, 2011, partners’ capital consisted of 71.0 million common units. As noted in the Consolidated Statement of Partners’ Capital and Comprehensive Income and described in Note 1, Organization, and Note 2, Basis of Presentation, our outstanding number of units has changed in connection with the Merger.
Net Income per Limited Partner Unit
Basic net income per limited partner unit is computed by dividing net income allocable to limited partners by the weighted average number of limited partner and vested deferred common units outstanding during the period. Diluted net income per limited partner unit is computed by dividing net income allocable to limited partners by the weighted average number of limited partner and vested deferred common units outstanding during the period and, when dilutive, phantom units. For the three months ended March 31, 2011 weighted average awards of 88 thousand phantom units were excluded from the diluted net income per limited partner unit calculation because the inclusion of these phantom units would have had an antidilutive effect. The March 31, 2010 computation of net income per limited partner unit relates to the financial statements of PVG prior to the effective date of the Merger. For the three months ended March 31, 2010, PVG did not have any phantom units or other participating securities outstanding, which would affect the computation of net income per limited partner unit.
The following table reconciles the computation of net income to net income allocable to limited partners:
13
| | | | | | | | |
| | | Three Months Ended March 31, | |
| | | 2011 | | | 2010 | |
Net income | | $ | 7,511 | | | $ | 13,682 | |
Net loss (income) attributable to noncontrolling interests, pre-merger (Note 1) | | | 664 | | | | (5,257 | ) |
| | | | | | | | |
Net income attributable to Penn Virginia Resource Partners, L.P. | | $ | 8,175 | | | $ | 8,425 | |
Adjustments: | | | | | | | | |
Distributions to participating securities | | | (80 | ) | | | — | |
Participating securities’ allocable share of net income | | | 30 | | | | — | |
Participating securities’ earnings reallocated to unvested securities | | | (30 | ) | | | — | |
| | | | | | | | |
Net income allocable to limited partners | | $ | 8,095 | | | $ | 8,425 | |
| | | | | | | | |
| | |
Weighted average limited partner units, basic and diluted | | | 46,426 | | | | 38,293 | |
| | |
Net income per limited partner unit, basic and diluted | | $ | 0.17 | | | $ | 0.22 | |
Cash Distributions
We distribute 100% of Available Cash (as defined in our partnership agreement) within 45 days after the end of each quarter to unitholders of record and, prior to the Merger, to our general partner. Available Cash is generally defined as all of our cash and cash equivalents on hand at the end of each quarter less reserves established by our general partner for future requirements. Our general partner has the discretion to establish cash reserves that are necessary or appropriate to (i) provide for the proper conduct of our business, (ii) comply with applicable law, any of our debt instruments or any other agreements and (iii) provide funds for distributions to unitholders and our general partner for any one or more of the next four quarters.
The following table reflects the allocation of total cash distributions paid by us during the periods presented, all of which were paid prior to the Merger:
| | | | | | | | |
| | | Three Months Ended March 31, | |
| | | 2011 | | | 2010 | |
PVG limited partners | | $ | 15,239 | | | $ | 14,848 | |
PVR limited partners (1) | | | 15,348 | | | | 15,140 | |
PVR phantom units | | | 46 | | | | 165 | |
| | | | | | | | |
| | |
Total cash distribution paid during period | | $ | 30,633 | | | $ | 30,153 | |
| | | | | | | | |
| (1) | PVR limited partner unit distributions represent distributions paid to public unitholders and not to units owned by PVG prior to the Merger. |
On May 13, 2011, we will pay a $0.48 per unit quarterly distribution to unitholders of record on May 6, 2011.
| 9. | Related-Party Transactions |
In June 2010, Penn Virginia Corporation (“PVA”) sold its remaining interest in PVG and as a result, PVA no longer owned any limited or general partner interests in us or PVG. As a result of the divestiture, the related party transactions noted below are now considered arm’s-length and no longer require separate disclosures. Related party transactions included charges from PVA for certain corporate administrative expenses which were allocable to us and our subsidiaries. Other transactions involved subsidiaries of PVA related to the marketing of natural gas, gathering and processing of natural gas, and the purchase and sale of natural gas and NGLs in which we took title to the products. The Consolidated Statements of Income amounts noted below represent related party transactions prior to June 7, 2010 (date of divestiture).
14
| | | | | | | | |
| | | Three months Ended March 31, | |
| | | 2011 | | | 2010 | |
Consolidated Statements of Income: | | | | | | | | |
Natural gas midstream revenues | | $ | — | | | $ | 18,903 | |
Other income | | $ | — | | | $ | 414 | |
Cost of gas purchased | | $ | — | | | $ | 18,194 | |
General and administrative | | $ | — | | | $ | 1,312 | |
| 10. | Unit-Based Compensation |
The Penn Virginia Resource GP, LLC Fifth Amended and Restated Long-Term Incentive Plan (the “LTIP”) permits the grant of common units, deferred common units, unit options, restricted units and phantom units to employees and directors of our general partner and its affiliates. Common units and deferred common units granted under the LTIP are immediately vested, and we recognize compensation expense related to those grants on the grant date. Restricted units and phantom units granted under the LTIP generally vest over a three-year period, with one-third vesting in each year, and we recognize compensation expense related to those grants on a straight-line basis over the vesting period. These compensation expenses are recorded in the general and administrative expenses caption on our Consolidated Statements of Income. During the three months ended March 31, 2011, we granted 152 thousand phantom units at a weighted average grant-date fair value of $27.94.
Prior to the Merger, the PVG GP, LLC Amended and Restated Long-Term Incentive Plan (“the PVG LTIP”) likewise permitted the granting of PVG common units, deferred common units, unit options restricted units and phantom units to employees and directors of the general partner and its affiliates. At the time of the Merger, deferred PVG common units held on account of PVG’s directors were automatically converted to deferred PVR common units at the rate of 0.98 deferred PVR common units for each deferred PVG common unit.
In connection with the normal three-year vesting of phantom and restricted units, as well as deferred common unit awards, we recognized non-cash compensation expense of $0.8 million and $1.5 million for the three months ended March 31, 2011 and 2010.
| 11. | Commitments and Contingencies |
Legal
We are involved, from time to time, in various legal proceedings arising in the ordinary course of business. While the ultimate results of these proceedings cannot be predicted with certainty, our management believes that these claims will not have a material adverse effect on our financial position, results of operations or cash flows.
Environmental Compliance
As of March 31, 2011 and December 31, 2010, our environmental liabilities were $0.8 million and $0.9 million, which represents our best estimate of the liabilities as of those dates. We have reclamation bonding requirements with respect to certain unleased and inactive properties. Given the uncertainty of when a reclamation area will meet regulatory standards, a change in this estimate could occur in the future.
Mine Health and Safety Laws
There are numerous mine health and safety laws and regulations applicable to the coal mining industry. However, since we do not operate any mines and do not employ any coal miners, we are not subject to such laws and regulations. Accordingly, we have not accrued any related liabilities.
15
Customer Credit Risk
For the three months ended March 31, 2011, four of our natural gas midstream segment customers accounted for $38.0 million, $23.0 million, $22.3 million and $21.8 million, or for an aggregate of 41% of our total consolidated revenues. At March 31, 2011, 38% of our consolidated accounts receivable related to these customers.
Our reportable segments are as follows:
| | • | | Coal and Natural Resource Management— Our coal and natural resource management segment primarily involves the management and leasing of coal properties and the subsequent collection of royalties. We also earn revenues from other land management activities, such as selling standing timber, leasing coal-related infrastructure facilities and collecting oil and gas royalties. |
| | • | | Natural Gas Midstream— Our natural gas midstream segment is engaged in providing natural gas processing, gathering and other related services. In addition, we own member interests in joint ventures that gather and transport natural gas. |
| | • | | The corporate and other caption primarily represents corporate functions. |
The following tables present a summary of certain financial information relating to our segments for the periods presented:
| | | | | | | | | | | | | | | | |
| | | Revenues | | | Operating income | |
| | | Three Months Ended March 31, | | | Three Months Ended March 31, | |
| | | 2011 | | | 2010 | | | 2011 | | | 2010 | |
Coal and natural resource management | | $ | 45,428 | | | $ | 33,560 | | | $ | 27,478 | | | $ | 20,361 | |
Natural gas midstream | | | 208,099 | | | | 172,918 | | | | 10,507 | | | | 7,385 | |
Corporate and other | | | — | | | | — | | | | — | | | | (988 | ) |
| | | | | | | | | | | | | | | | |
Totals | | $ | 253,527 | | | $ | 206,478 | | | $ | 37,985 | | | $ | 26,758 | |
| | | | | | | | | | | | | | | | |
Interest expense | | | | | | | | | | | (10,850 | ) | | | (5,835 | ) |
Derivatives | | | | | | | | | | | (19,761 | ) | | | (7,568 | ) |
Other | | | | | | | | | | | 137 | | | | 327 | |
| | | | | | | | | | | | | | | | |
Net income | | | | | | | | | | $ | 7,511 | | | $ | 13,682 | |
| | | | | | | | | | | | | | | | |
| | |
| | | Additions to property and equipment | | | Depreciation, depletion & amortization | |
| | | Three Months Ended March 31, | | | Three Months Ended March 31, | |
| | | 2011 | | | 2010 | | | 2011 | | | 2010 | |
Coal and natural resource management | | $ | 95,600 | | | $ | 32 | | | $ | 9,320 | | | $ | 7,326 | |
Natural gas midstream | | | 37,067 | | | | 7,954 | | | | 11,924 | | | | 10,492 | |
| | | | | | | | | | | | | | | | |
Totals | | $ | 132,667 | | | $ | 7,986 | | | $ | 21,244 | | | $ | 17,818 | |
| | | | | | | | | | | | | | | | |
| | | |
| | | Total assets at | | | | | | | |
| | | March 31, | | | December 31, | | | | | | | |
| | | 2011 | | | 2010 | | | | | | | |
Coal and natural resource management | | $ | 681,085 | | | $ | 585,559 | | | | | | | | | |
Natural gas midstream | | | 714,582 | | | | 711,942 | | | | | | | | | |
Corporate and other | | | — | | | | 6,704 | | | | | | | | | |
| | | | | | | | | | | | | | | | |
Totals | | $ | 1,395,667 | | | $ | 1,304,205 | | | | | | | | | |
| | | | | | | | | | | | | | | | |
16
On April 19, 2011, our wholly-owned subsidiary, PVR Finco LLC, entered into the first amendment to the amended and restated secured credit agreement increasing our borrowing capacity under the Revolver from $850.0 million to $1.0 billion and extending the maturity date to April 19, 2016. PVR Finco LLC has an option to increase the commitments under the Revolver by up to an additional $200.0 million, to a total of $1.2 billion, upon receipt of commitments from one or more lenders. The amendment did not change the collateral provisions of the Revolver which is secured by substantially all of our assets, including recent acquisitions. The interest rate under the Revolver fluctuates based on the ratio of our total indebtedness-to-EBITDA. Interest is payable at the base rate plus an applicable margin ranging from 0.75% to 1.75% if we select the base rate indebtedness option under the Revolver or at a rate derived from LIBOR plus an applicable margin ranging from 1.75% to 2.75% if we select the LIBOR-based indebtedness option.
17
Forward-Looking Statements
Certain statements contained herein include “forward-looking statements.” All statements that express beliefs, expectations, estimates or intentions, as well as those that are not statements of historical fact, are forward-looking statements. Words such as “may,” “will,” “could,” “should,” “expect,” “plan,” “project,” “intend,” “anticipate,” “believe,” “estimate,” “predict,” “potential,” “pursue,” “target,” “continue,” and similar expressions are intended to identify such forward-looking statements. Because such statements include risks, uncertainties and contingencies, actual results may differ materially from those expressed or implied by such forward-looking statements. These risks, uncertainties and contingencies include, but are not limited to, the following:
| | • | | the volatility of commodity prices for natural gas, natural gas liquids, or NGLs and coal; |
| | • | | our ability to access external sources of capital; |
| | • | | any impairment writedowns of our assets; |
| | • | | the relationship between natural gas, NGL and coal prices; |
| | • | | the projected demand for and supply of natural gas, NGLs and coal; |
| | • | | competition among producers in the coal industry generally and among natural gas midstream companies; |
| | • | | the extent to which the amount and quality of actual production of our coal differs from estimated recoverable coal reserves; |
| | • | | our ability to generate sufficient cash from our businesses to maintain and pay the quarterly distribution to our unitholders; |
| | • | | the experience and financial condition of our coal lessees and natural gas midstream customers, including our lessees’ ability to satisfy their royalty, environmental, reclamation and other obligations to us and others; |
| | • | | operating risks, including unanticipated geological problems, incidental to our coal and natural resource management or natural gas midstream businesses; |
| | • | | our ability to acquire new coal reserves or natural gas midstream assets and new sources of natural gas supply and connections to third-party pipelines on satisfactory terms; |
| | • | | our ability to retain existing or acquire new natural gas midstream customers and coal lessees; |
| | • | | the ability of our lessees to produce sufficient quantities of coal on an economic basis from our reserves and obtain favorable contracts for such production; |
| | • | | the occurrence of unusual weather or operating conditions including force majeure events; |
| | • | | delays in anticipated start-up dates of our lessees’ mining operations and related coal infrastructure projects and new processing plants in our natural gas midstream business; |
| | • | | environmental risks affecting the mining of coal reserves or the production, gathering and processing of natural gas; |
| | • | | the timing of receipt of necessary governmental permits by us or our lessees; |
| | • | | changes in governmental regulation or enforcement practices, especially with respect to environmental, health and safety matters, including with respect to emissions levels applicable to coal-burning power generators; |
| | • | | uncertainties relating to the outcome of current and future litigation regarding mine permitting; |
| | • | | risks and uncertainties relating to general domestic and international economic (including inflation, interest rates and financial and credit markets) and political conditions (including the impact of potential terrorist attacks); and |
18
| | • | | other risks set forth in our Annual Report on Form 10-K for the year ended December 31, 2010. |
Additional information concerning these and other factors can be found in our press releases and public periodic filings with the Securities and Exchange Commission, including our Annual Report on Form 10-K for the year ended December 31, 2010. Many of the factors that will determine our future results are beyond the ability of management to control or predict. Readers should not place undue reliance on forward-looking statements, which reflect management’s views only as of the date hereof. We undertake no obligation to revise or update any forward-looking statements, or to make any other forward-looking statements, whether as a result of new information, future events or otherwise.
19
| Item 2 | Management’s Discussion and Analysis of Financial Condition and Results of Operations |
The following discussion and analysis of the financial condition and results of operations of Penn Virginia Resource Partners, L.P. and its subsidiaries (the “Partnership,” “PVR,” “we,” “us” or “our”) should be read in conjunction with our Consolidated Financial Statements and Notes thereto in Item 1. All dollar amounts presented in the tables that follow are in thousands unless otherwise indicated.
Overview of Business
We are a publicly traded Delaware limited partnership principally engaged in the management of coal and natural resource properties and the gathering and processing of natural gas in the United States.
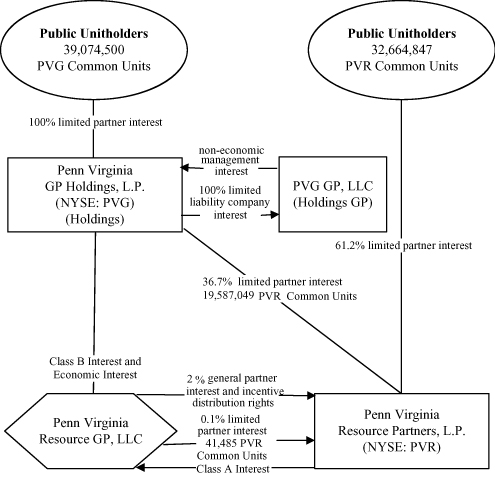
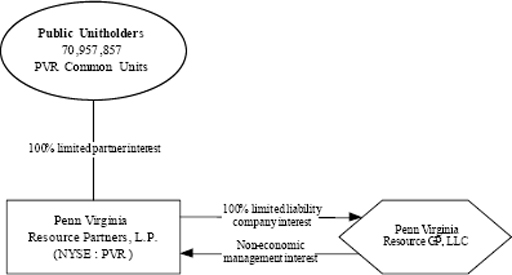
On September 21, 2010, we entered into an Agreement and Plan of Merger (the “Merger Agreement”) by and among PVR, Penn Virginia Resource GP, LLC (“PVR GP”), Penn Virginia GP Holdings, L.P. (“PVG”), PVG GP LLC (“PVG GP”) and PVR Radnor, LLC (“Merger Sub”), a wholly owned subsidiary of PVR. The Merger Agreement received final approval by PVR unitholders on February 16, 2011 and PVG unitholders on March 9, 2011. Pursuant to the Merger Agreement, PVG and PVG GP were merged into Merger Sub, with Merger Sub as the surviving entity (the “Merger”). Merger Sub was subsequently merged into PVR GP, with PVR GP being the surviving entity as a subsidiary of PVR. In the transaction, PVG unitholders received consideration of 0.98 PVR common units for each PVG common unit, representing aggregate consideration of approximately 38.3 million PVR common units. Pursuant to the Merger Agreement and the Fourth Amended and Restated Agreement of Limited Partnership of PVR, the incentive distribution rights held by PVR’s general partner were extinguished, the 2.0% general partner interest in PVR held by PVR’s general partner was converted into a noneconomic interest and approximately 19.6 million PVR common units owned by PVG were cancelled. The Merger closed on March 10, 2011. After the effective date of the Merger and related transactions, the separate existence of each of PVG, PVG GP and Merger Sub ceased, and PVR GP survives as a wholly-owned subsidiary of PVR.
Historically, PVG’s ownership of PVR’s general partner gave it control of PVR. During the periods that PVG controlled PVR (prior to March 10, 2011), PVG had no substantial assets or liabilities other than those of PVR. PVG’s consolidated financial statements included noncontrolling owners’ interest of consolidated subsidiaries, which reflected the proportion of PVR common units owned by PVR’s unitholders other than PVG. These amounts are reflected in the historical financial balances presented up to consummation of the Merger.
PVG is considered the surviving consolidated entity for accounting purposes, while PVR is the surviving consolidated entity for legal and reporting purposes. The Merger was accounted for as an equity transaction. Therefore, the changes in ownership interests as a result of the Merger did not result in gain or loss recognition.
After the Merger, the board of directors of PVR’s general partner, PVR GP, consists of nine members, six of whom were existing members of the PVR GP board of directors before the Merger and three of whom were the three existing members of the conflicts committee of the board of directors of PVG GP prior to the Merger.
During the three months ended March 31, 2011 and for the year ended December 31, 2010, we incurred $6.4 million and $4.6 million of direct costs associated with the Merger. The aggregate costs of $11.0 million were charged to partners’ capital upon the effective date of the Merger in 2011. At December 31, 2010, the $4.6 million of costs incurred at that time were included in other long-term assets on the consolidated balance sheet. Costs incurred and paid during the three months ended March 31, 2011 are reported under the caption “Cash paid for merger” in financing activities section of the consolidated statement of cash flows. No merger costs were incurred in the three months ended March 31, 2010.
The following diagrams depict the ownership structure of PVR and PVG before and after the Merger:
20
Ownership Structure Before Merger
Ownership Structure Following the Merger on March 10, 2011
21
Key Developments
During the three months ended March 31, 2011, the following general business developments and corporate actions had an impact, or will have impact, on our results of operations. A discussion of these key developments follows:
PVR Midstream Marcellus Shale Construction
Construction efforts continue in Pennsylvania as we work toward building and operating gas gathering pipelines and compression facilities servicing natural gas producers in the Marcellus Shale development. In February we completed construction and commenced operation of the first phase of the Lycoming midstream pipeline system.
Middle Fork Acquisition
On January 25, 2011, we completed an acquisition to acquire certain mineral rights and associated oil and gas royalty interests in Kentucky and Tennessee for approximately $95.7 million. The mineral rights include approximately 102 million tons of coal reserves and resources. The coal is primarily steam coal and expands our geographic scope in the Central Appalachia coal region.
2011 Commodity Prices
Coal royalties, which accounted for 86% of the coal and natural resource management segment revenues for the three months ended March 31, 2011 and 84% for the same period in 2010, were higher as compared to 2010. The increase was attributed to increased production and higher realized coal royalty per ton primarily in the Central Appalachian region. The January 25, 2011 Middle Fork acquisition and favorable mining conditions contributed to the increase in production. Average coal prices received by lessees have generally increased in the first quarter of 2011 compared to the same quarter of 2010.
The average commodity prices for crude oil and natural gas liquids, or NGLs, for the first quarter of 2011 increased from levels experienced in the first quarter of 2010, while natural gas prices decreased for the comparable periods.
Revenues, profitability and the future rate of growth of our natural gas midstream segment are highly dependent on market demand and prevailing NGL and natural gas prices. Historically, changes in the prices of most NGL products have generally correlated with changes in the price of crude oil. NGL and natural gas prices have been subject to significant volatility in recent years in response to changes in the supply and demand for NGL products and natural gas market demand. As part of our risk management strategy, we use derivative financial instruments to hedge NGLs sold and natural gas purchased. Our derivative financial instruments include costless collars and swaps. Based upon current volumes, we have entered into hedging arrangements covering approximately 57% and 34% of our commodity-sensitive volumes in 2011 and 2012. Historically, we have targeted hedging 50% to 60% of our commodity-sensitive volumes covering a two-year period.
Liquidity and Capital Resources
Cash Flows
On an ongoing basis, we generally satisfy our working capital requirements and fund our capital expenditures using cash generated from our operations, borrowings under the Revolver and proceeds from debt and equity offerings. As discussed in more detail in “—Sources of Liquidity” below, as of March 31, 2011, we had availability of $333.4 million on the Revolver. We fund our debt service obligations and distributions to unitholders solely using cash generated from our operations. We believe that the cash generated from our operations and our borrowing capacity will be sufficient to meet our working capital requirements, anticipated capital expenditures (other than major capital improvements or acquisitions), scheduled debt payments and distributions. However, our ability to meet these requirements in the future will depend upon our future operating performance, which will be affected by prevailing economic conditions in the coal industry and natural gas midstream market, most of which are beyond our control.
22
The following table summarizes our statements of cash flow for the periods presented:
| | | | | | | | |
| | | Three Months Ended
March 31, | |
| | | 2011 | | | 2010 | |
Cash flows from operating activities: | | | | | | | | |
Net income | | $ | 7,511 | | | $ | 13,682 | |
Adjustments to reconcile net income to net cash provided by operating activities (summarized) | | | 41,021 | | | | 26,641 | |
Net changes in operating assets and liabilities | | | 6,276 | | | | 8,199 | |
| | | | | | | | |
Net cash provided by operating activities | | | 54,808 | | | | 48,522 | |
Net cash used in investing activities (summarized) | | | (131,660 | ) | | | (7,714 | ) |
Net cash provided by (used in) financing activities (summarized) | | | 75,363 | | | | (32,153 | ) |
| | | | | | | | |
Net increase (decrease) in cash and cash equivalents | | $ | (1,489 | ) | | $ | 8,655 | |
| | | | | | | | |
Cash Flows From Operating Activities
The overall increase in net cash provided by operating activities in the three months ended March 31, 2011 as compared to the same period in 2010 was driven by an increase in coal royalties and an increase in the natural gas midstream segment’s gross margin. These increases were partially offset by increased operating and general administrative costs and derivative settlements paid.
Cash Flows From Investing Activities
Net cash used in investing activities was primarily for capital expenditures. The following table sets forth our capital expenditures program, adjusted for accruals and noncash items, for the periods presented:
| | | | | | | | |
| | | Three Months Ended March 31, | |
| | | 2011 | | | 2010 | |
Coal and natural resource management | | | | | | | | |
Acquisitions | | $ | 97,276 | | | $ | 29 | |
Maintenance | | | 104 | | | | 3 | |
| | | | | | | | |
Total | | | 97,380 | | | | 32 | |
| | | | | | | | |
| | |
Natural gas midstream | | | | | | | | |
Expansion capital | | | 21,691 | | | | 7,400 | |
Maintenance | | | 3,075 | | | | 1,857 | |
| | | | | | | | |
Total | | | 24,766 | | | | 9,257 | |
| | | | | | | | |
| | |
Total capital expenditures | | $ | 122,146 | | | $ | 9,289 | |
| | | | | | | | |
In January 2011 we completed the acquisition of the Middle Fork properties, which added significant reserves to our coal and natural resource segment in the Central Appalachia region. Our natural gas midstream capital expenditures for the three months ended March 31, 2011 and 2010 consisted primarily of internal growth capital expanding our operational footprint in our Marcellus and Panhandle Shale systems.
Cash Flows From Financing Activities
During the three months ended March 31, 2011, we incurred net borrowings of $107.0 million to fund our coal and natural resources acquisition and to finance the construction of natural gas midstream capital expenditures. We also paid $1.0 million of direct costs incurred related to the Merger. During the three months ended March 31, 2011 and 2010 we paid cash distributions to our unitholders of $30.6 million and $30.2 million.
23
Certain Non-GAAP Financial Measures
We use non-GAAP (Generally Accepted Accounting Principles) measures to evaluate our business and performance. None of these measures should be considered an alternative to, or more meaningful than, net income, operating income, cash flows from operating activities or any other measure of financial performance or liquidity presented in accordance with GAAP, or as indicators of our operating performance or liquidity.
PENN VIRGINIA RESOURCE PARTNERS, L.P.
CERTAIN NON-GAAP FINANCIAL MEASURES - unaudited
(in thousands)
| | | | | | | | |
| | | Three Months Ended
March 31, | |
| | | 2011 | | | 2010 | |
Reconciliation of GAAP “Operating income” to Non-GAAP “EBITDA” | | | | | | | | |
Operating income | | $ | 37,985 | | | $ | 26,758 | |
Depreciation, depletion and amortization | | | 21,244 | | | | 17,818 | |
| | | | | | | | |
| | |
EBITDA (a) | | $ | 59,229 | | | $ | 44,576 | |
| | | | | | | | |
| | |
Reconciliation of GAAP “Net income” to Non-GAAP “Distributable cash flow” | | | | | | | | |
Net income | | $ | 7,511 | | | $ | 13,682 | |
Depreciation, depletion and amortization | | | 21,244 | | | | 17,818 | |
Commodity derivative contracts: | | | | | | | | |
Derivative losses included in net income | | | 19,761 | | | | 8,150 | |
Cash receipts (payments) to settle derivatives for the period | | | (4,858 | ) | | | (1,646 | ) |
Equity earnings from joint venture, net of distributions | | | 3,160 | | | | 443 | |
Maintenance capital expenditures | | | (3,179 | ) | | | (1,857 | ) |
Replacement capital expenditures | | | (6,725 | ) | | | — | |
| | | | | | | | |
| | |
Distributable cash flow (b) | | $ | 36,914 | | | $ | 36,590 | |
| | | | | | | | |
| | |
Distribution to Partners: | | | | | | | | |
| | |
PVG limited partners | | $ | 15,239 | | | $ | 14,848 | |
PVR limited partners (c) | | | 15,348 | | | | 15,140 | |
PVR phantom units (d) | | | 46 | | | | 165 | |
| | | | | | | | |
| | |
Total cash distribution paid during period | | $ | 30,633 | | | $ | 30,153 | |
| | | | | | | | |
| | |
Reconciliation of GAAP “Net income” to Non-GAAP “Net income as adjusted” | | | | | | | | |
Net income | | $ | 7,511 | | | $ | 13,682 | |
Adjustments for derivatives: | | | | | | | | |
Derivative losses included in net income | | | 19,761 | | | | 8,150 | |
Cash receipts (payments) to settle derivatives for the period | | | (4,858 | ) | | | (1,646 | ) |
| | | | | | | | |
| | |
Net income, as adjusted (e) | | $ | 22,414 | | | $ | 20,186 | |
| | | | | | | | |
| (a) | EBITDA, or earnings before interest, tax and depreciation, depletion and amortization (“DD&A”), represents operating income plus DD&A, plus impairments. We believe this presentation is commonly used by investors and professional research analysts in the valuation, comparison, rating and investment recommendations of companies in the coal and natural gas midstream industries. We |
24
| | use this information for comparative purposes within the industry. EBITDA is not a measure of financial performance under GAAP and should not be considered as a measure of liquidity or as an alternative to net income. |
| (b) | Distributable cash flow represents net income plus depreciation, depletion and amortization expenses, plus impairments, plus (minus) derivative losses (gains) included in other income, plus (minus) cash received (paid) for derivative settlements, minus equity earnings in joint ventures, plus cash distributions from joint ventures, minus maintenance capital expenditures, minus replacement capital expenditures. Distributable cash flow is a significant liquidity metric which is an indicator of our ability to generate cash flows at a level that can sustain or support the quarterly cash distributions paid to our partners. Distributable cash flow is also the quantitative standard used by investors and professional research analysts in the valuation, comparison, rating and investment recommendations of publicly traded partnerships. Distributable cash flow is presented because we believe it is a useful adjunct to net cash provided by operating activities under GAAP. Distributable cash flow is not a measure of financial performance under GAAP and should not be considered as an alternative to cash flows from operating, investing or financing activities, as an indicator of cash flows, as a measure of liquidity or as an alternative to net income. |
| (c) | PVR limited partner unit distributions represent distributions paid to public unitholders and not units owned by PVG prior to the Merger. |
| (d) | Phantom unit grants were made under our long-term incentive plan. Phantom units receive distribution rights; thus, we have presented distributions paid to phantom unit holders in our total distributions paid to Partners. |
| (e) | Net income, as adjusted, represents net income adjusted to exclude the effects of non-cash changes in the fair value of derivatives and impairments. We believe this presentation is commonly used by investors and professional research analysts in the valuation, comparison, rating and investment recommendations of companies in the natural gas midstream industry. We use this information for comparative purposes within the industry. Net income, as adjusted, is not a measure of financial performance under GAAP and should not be considered as a measure of liquidity or as an alternative to net income. |
Sources of Liquidity
Long-Term Debt
Revolver. On April 19, 2011, we entered into an amended and restated secured credit agreement increasing our borrowing capacity under the Revolver from $850 million to $1.0 billion and extending the maturity date until April 19, 2016. The interest rate under the Revolver fluctuates based on the ratio of our total indebtedness-to-EBITDA. As of April 19, 2011, interest is payable at the base rate plus an applicable margin ranging from 0.75% to 1.75% if we select the base rate indebtedness option under the Revolver or at a rate derived from LIBOR plus an applicable margin ranging from 1.75% to 2.75% if we select the LIBOR-based indebtedness option. As of March 31, 2011, net of outstanding indebtedness of $515.0 million and letters of credit of $1.6 million, we had remaining borrowing capacity of $333.4 million on the $850 million Revolver. The Revolver is available to provide funds for general partnership purposes, including working capital, capital expenditures, acquisitions and quarterly distributions. The weighted average interest rate on borrowings outstanding under the Revolver during the three months ended March 31, 2011 was approximately 2.9%. We do not have a public rating for the Revolver. As of March 31, 2011, we were in compliance with all of our covenants under the Revolver.
Interest Rate Swaps.We have entered into interest rate swaps, or the Interest Rate Swaps, to establish fixed rates on a portion of the outstanding borrowings under the Revolver. The following table sets forth the Interest Rate Swap positions as of March 31, 2011:
| | | | | | | | | | | | |
| | | Notional Amounts
(in millions) | | | Swap Interest Rates (1) | |
Term | | | Pay | | | Receive | |
March 2010 - December 2011 | | $ | 250.0 | | | | 3.37 | % | | | LIBOR | |
December 2011 - December 2012 | | $ | 100.0 | | | | 2.09 | % | | | LIBOR | |
25
| (1) | References to LIBOR represent the 3-month rate. |
After considering the applicable margin of 2.75% in effect as of March 31, 2011 the total interest rate on the $250.0 million portion of the Revolver borrowings covered by the Interest Rate Swaps was 6.12% as of March 31, 2011.
Senior Notes. In April 2010, we sold $300.0 million of Senior Notes due on April 15, 2018 with an annual interest rate of 8.25%, which is payable semi-annually in arrears on April 15 and October 15 of each year. The Senior Notes were sold at par, equating to an effective yield to maturity of approximately 8.25%. The net proceeds from the sale of the Senior Notes of approximately $292.6 million, after deducting fees and expenses of approximately $7.4 million, were used to repay borrowings under the Revolver. The Senior Notes are senior to any subordinated indebtedness, and are effectively subordinated to all of our secured indebtedness including the Revolver to the extent of the collateral securing that indebtedness. The obligations under the Senior Notes are fully and unconditionally guaranteed by our current and future subsidiaries, which are also guarantors under the Revolver.
Future Capital Needs and Commitments
As of March 31, 2011, our remaining borrowing capacity under the $850 million Revolver of approximately $333.4 million is sufficient to meet our anticipated 2011 capital needs and commitments. Our short-term cash requirements for operating expenses and quarterly distributions to our general partner and our unitholders are expected to be funded through operating cash flows. In 2011, we expect to invest approximately $150.0 million in internal growth capital, excluding acquisitions. The majority of the 2011 internal growth capital is expected to be incurred in the natural gas midstream segment, primarily in the Marcellus Shale region. Long-term cash requirements for acquisitions and internal growth capital are expected to be funded by operating cash flows, borrowings under the Revolver and issuances of additional debt and equity securities if available under commercially acceptable terms.
Part of our long-term strategy is to increase cash available for distribution to our unitholders by making acquisitions and other capital expenditures. Our ability to make these acquisitions and other capital expenditures in the future will depend largely on the availability of debt financing and on our ability to periodically use equity financing through the issuance of new common units. Future financing will depend on various factors, including prevailing market conditions, interest rates and our financial condition and credit rating.
Results of Operations
Consolidated Review
The following table presents summary consolidated results for the periods presented:
| | | | | | | | |
| | | Three Months Ended March 31, | |
| | | 2011 | | | 2010 | |
Revenues | | $ | 253,527 | | | $ | 206,478 | |
Expenses | | | (215,542 | ) | | | (179,720 | ) |
| | | | | | | | |
Operating income | | | 37,985 | | | | 26,758 | |
Other income (expense) | | | (30,474 | ) | | | (13,076 | ) |
| | | | | | | | |
Net income | | | 7,511 | | | | 13,682 | |
Net loss (income) attributable to noncontrolling interests, pre-merger (Note 1) | | | 664 | | | | (5,257 | ) |
| | | | | | | | |
Net income attributable to Penn Virginia Resource Partners, L.P. | | $ | 8,175 | | | $ | 8,425 | |
| | | | | | | | |
26
The following table presents a summary of certain financial information relating to our segments for the periods presented:
| | | | | | | | | | | | | | | | |
| | | Coal and Natural
Resource
Management | | | Natural Gas
Midstream | | | Corporate and
Other | | | Consolidated | |
For the Three Months Ended March 31, 2011: | | | | | | | | | | | | | | | | |
Revenues | | $ | 45,428 | | | $ | 208,099 | | | $ | — | | | $ | 253,527 | |
Cost of gas purchased | | | — | | | | (170,255 | ) | | | — | | | | (170,255 | ) |
Operating costs and expenses | | | (8,630 | ) | | | (15,413 | ) | | | — | | | | (24,043 | ) |
Depreciation, depletion and amortization | | | (9,320 | ) | | | (11,924 | ) | | | — | | | | (21,244 | ) |
| | | | | | | | | | | | | | | | |
Operating income | | $ | 27,478 | | | $ | 10,507 | | | $ | — | | | $ | 37,985 | |
| | | | | | | | | | | | | | | | |
| | | | |
For the Three Months Ended March 31, 2010: | | | | | | | | | | | | | | | | |
Revenues | | $ | 33,560 | | | $ | 172,918 | | | $ | — | | | $ | 206,478 | |
Cost of gas purchased | | | — | | | | (141,795 | ) | | | — | | | | (141,795 | ) |
Operating costs and expenses | | | (5,873 | ) | | | (13,246 | ) | | | (988 | ) | | | (20,107 | ) |
Depreciation, depletion and amortization | | | (7,326 | ) | | | (10,492 | ) | | | — | | | | (17,818 | ) |
| | | | | | | | | | | | | | | | |
Operating income | | $ | 20,361 | | | $ | 7,385 | | | $ | (988 | ) | | $ | 26,758 | |
| | | | | | | | | | | | | | | | |
27
Coal and Natural Resource Management Segment
Three Months Ended March 31, 2011 Compared with Three Months Ended March 31, 2010
The following table sets forth a summary of certain financial and other data for our coal and natural resource management segment and the percentage change for the periods presented:
| | | | | | | | | | | | | | | | |
| | | | | | Favorable
(Unfavorable) | | | % Change
Favorable
(Unfavorable) | |
| | | Three Months Ended March 31, | | | |
| | | 2011 | | | 2010 | | | |
Financial Highlights | | | | | | | | | | | | | | | | |
Revenues | | | | | | | | | | | | | | | | |
Coal royalties | | $ | 38,991 | | | $ | 28,226 | | | $ | 10,765 | | | | 38 | % |
Coal services | | | 2,310 | | | | 1,973 | | | | 337 | | | | 17 | % |
Timber | | | 1,109 | | | | 1,305 | | | | (196 | ) | | | (15 | %) |
Oil and gas royalty | | | 793 | | | | 744 | | | | 49 | | | | 7 | % |
Other | | | 2,225 | | | | 1,312 | | | | 913 | | | | 70 | % |
| | | | | | | | | | | | | | | | |
Total revenues | | | 45,428 | | | | 33,560 | | | | 11,868 | | | | 35 | % |
| | | | | | | | | | | | | | | | |
| | | | |
Expenses | | | | | | | | | | | | | | | | |
Operating | | | 3,684 | | | | 2,263 | | | | (1,421 | ) | | | (63 | %) |
General and administrative | | | 4,946 | | | | 3,610 | | | | (1,336 | ) | | | (37 | %) |
Depreciation, depletion and amortization | | | 9,320 | | | | 7,326 | | | | (1,994 | ) | | | (27 | %) |
| | | | | | | | | | | | | | | | |
Total expenses | | | 17,950 | | | | 13,199 | | | | (4,751 | ) | | | (36 | %) |
| | | | | | | | | | | | | | | | |
| | | | |
Operating income | | $ | 27,478 | | | $ | 20,361 | | | $ | 7,117 | | | | 35 | % |
| | | | | | | | | | | | | | | | |
| | | | |
Other data | | | | | | | | | | | | | | | | |
| | | | |
Coal royalty tons by region | | | | | | | | | | | | | | | | |
Central Appalachia | | | 5,070 | | | | 3,929 | | | | 1,141 | | | | 29 | % |
Northern Appalachia | | | 1,146 | | | | 1,038 | | | | 108 | | | | 10 | % |
Illinois Basin | | | 1,271 | | | | 1,082 | | | | 189 | | | | 17 | % |
San Juan Basin | | | 2,410 | | | | 2,194 | | | | 216 | | | | 10 | % |
| | | | | | | | | | | | | | | | |
Total tons | | | 9,897 | | | | 8,243 | | | | 1,654 | | | | 20 | % |
| | | | | | | | | | | | | | | | |
| | | | |
Coal royalties revenues by region | | | | | | | | | | | | | | | | |
Central Appalachia | | $ | 27,966 | | | $ | 18,530 | | | $ | 9,436 | | | | 51 | % |
Northern Appalachia | | | 2,363 | | | | 1,950 | | | | 413 | | | | 21 | % |
Illinois Basin | | | 3,213 | | | | 2,942 | | | | 271 | | | | 9 | % |
San Juan Basin | | | 5,449 | | | | 4,804 | | | | 645 | | | | 13 | % |
| | | | | | | | | | | | | | | | |
Total royalties | | $ | 38,991 | | | $ | 28,226 | | | $ | 10,765 | | | | 38 | % |
| | | | | | | | | | | | | | | | |
| | | | |
Coal royalties per ton by region ($/ton) | | | | | | | | | | | | | | | | |
Central Appalachia | | $ | 5.52 | | | $ | 4.72 | | | $ | 0.80 | | | | 17 | % |
Northern Appalachia | | | 2.06 | | | | 1.88 | | | | 0.18 | | | | 10 | % |
Illinois Basin | | | 2.53 | | | | 2.72 | | | | (0.19 | ) | | | (7 | %) |
San Juan Basin | | | 2.26 | | | | 2.19 | | | | 0.07 | | | | 3 | % |
| | | | | | | | | | | | | | | | |
Average royalties per ton | | $ | 3.94 | | | $ | 3.42 | | | $ | 0.52 | | | | 15 | % |
| | | | | | | | | | | | | | | | |
Revenues
Coal royalties revenues increased due to higher production and realized coal royalties per ton. The Middle Fork acquisition on January 25, 2011 contributed to these increases in Central Appalachia. Improved mining conditions, new mines starting up and the metallurgical coal market accounted for the remainder of the tonnage increase in Central Appalachia. The Northern Appalachia tonnage increase is due to the timing of longwall operations on our
28
property. Illinois Basin volumes increased due to a one-time international spot market sale that was shipped from accumulated inventory by one of our lessees. Equipment added during 2010 to the mines in the San Juan Basin continues to increase production relative to prior year periods.
Coal royalties per ton increased in all regions, except for the Illinois Basin, for the first quarter of 2011 compared to the same quarter of last year. The reduced realized royalty rate in the Illinois Basin is due to contractual changes in royalties we receive on some properties in this region.
The increase in coal services revenues is in direct relationship to the increased tons produced on certain leases. Other revenues in the first quarter of 2011 have increased due to minimum royalty forfeitures. Based upon lease contracts, which vary by lessee, lessees paying minimum royalties have an established time to recoup minimum royalties paid. If the stated levels of production have not occurred after the exhaustion of that time period, the minimum payments are recognized into earnings.
Expenses
Operating expenses have increased primarily due to coal royalty costs and the recent Middle Fork acquisition. Increased mining activity by our lessees from subleased properties in Central Appalachia region increased coal royalties expense. Mining activity on our subleased property fluctuates between periods due to the proximity of our property boundaries and other mineral owners.
General and administrative expenses increased as a result of our change in management structure related to the Merger and some shared costs with our former parent, Penn Virginia Corporation, are now direct costs of the Partnership. Also contributing to the increase were due diligence costs related to a recent acquisition.
DD&A expenses increased for the comparative periods due to the increase in coal production and related depletion expense.
29
Natural Gas Midstream Segment
Three Months Ended March 31, 2011 Compared with Three Months Ended March 31, 2010
The following table sets forth a summary of certain financial and other data for our natural gas midstream segment and the percentage change for the periods presented:
| | | | | | | | | | | | | | | | |
| | | Three Months Ended
March 31, | | | Favorable | | | % Change Favorable | |
| | | 2011 | | | 2010 | | | (Unfavorable) | | | (Unfavorable) | |
Financial Highlights | | | | | | | | | | | | | | | | |
Revenues | | | | | | | | | | | | | | | | |
Residue gas (1) | | $ | 91,978 | | | $ | 94,896 | | | $ | (2,918 | ) | | | (3 | %) |
Natural gas liquids | | | 98,828 | | | | 66,643 | | | | 32,185 | | | | 48 | % |
Condensate | | | 10,014 | | | | 6,736 | | | | 3,278 | | | | 49 | % |
Gathering, processing and transportation fees | | | 5,461 | | | | 2,334 | | | | 3,127 | | | | 134 | % |
| | | | | | | | | | | | | | | | |
Total natural gas midstream revenues | | | 206,281 | | | | 170,609 | | | | 35,672 | | | | 21 | % |
Equity earnings in equity investment | | | 1,030 | | | | 1,683 | | | | (653 | ) | | | (39 | %) |
Producer services | | | 788 | | | | 626 | | | | 162 | | | | 26 | % |
| | | | | | | | | | | | | | | | |
Total revenues | | | 208,099 | | | | 172,918 | | | | 35,181 | | | | 20 | % |
| | | | | | | | | | | | | | | | |
| | | | |
Expenses | | | | | | | | | | | | | | | | |
Cost of gas purchased (1) | | | 170,255 | | | | 141,795 | | | | (28,460 | ) | | | (20 | %) |
Operating | | | 9,389 | | | | 8,092 | | | | (1,297 | ) | | | (16 | %) |
General and administrative | | | 6,024 | | | | 5,154 | | | | (870 | ) | | | (17 | %) |
Depreciation and amortization | | | 11,924 | | | | 10,492 | | | | (1,432 | ) | | | (14 | %) |
| | | | | | | | | | | | | | | | |
Total operating expenses | | | 197,592 | | | | 165,533 | | | | (32,059 | ) | | | (19 | %) |
| | | | | | | | | | | | | | | | |
| | | | |
Operating income | | $ | 10,507 | | | $ | 7,385 | | | $ | 3,122 | | | | 42 | % |
| | | | | | | | | | | | | | | | |
| | | | |
Operating Statistics | | | | | | | | | | | | | | | | |
Daily throughput volumes (MMcfd) | | | 420 | | | | 308 | | | | 112 | | | | 36 | % |
| | | | |
Gross margin | | $ | 36,026 | | | $ | 28,814 | | | $ | 7,212 | | | | 25 | % |
Cash impact of derivatives | | | (2,982 | ) | | | 780 | | | | (3,762 | ) | | | (482 | %) |
| | | | | | | | | | | | | | | | |
Gross margin, adjusted for impact of derivatives | | $ | 33,044 | | | $ | 29,594 | | | $ | 3,450 | | | | 12 | % |
| | | | | | | | | | | | | | | | |
| (1) | For the three months ended March 31, 2010, we recorded $18.2 million of natural gas midstream revenues and $18.2 million for the cost of gas purchased related to the purchase of natural gas from Penn Virginia Oil & Gas, L.P (a subsidiary of Penn Virginia Corporation and considered a related party up to June 7, 2010) and the subsequent sale of that gas to third parties. We took title to the gas prior to transporting it to third parties. These transactions do not impact the gross margin. |
Gross Margin
Gross margin is the difference between our natural gas midstream revenues and our cost of gas purchased. Natural gas midstream revenues included residue gas sold from processing plants after NGLs were removed, NGLs sold after being removed from system throughput volumes received, condensate collected and sold and gathering and other fees primarily from natural gas volumes connected to our gas processing plants. Cost of gas purchased consisted of amounts payable to third-party producers for natural gas purchased under percentage-of-proceeds and gas purchase/keep-whole contracts.
The gross margin increase was a result of higher system throughput and processed volumes, as well as higher NGL pricing and higher fractionation, or frac, spreads. Frac spreads are the difference between the price of NGLs
30
sold and the cost of natural gas purchased on a per MMBtu basis. Offsetting the higher volumes and commodity prices was a change in contract mix. Given our completion of certain assets in the Marcellus Shale, we gathered and transported an average of 39 MMcfd during the first quarter 2011 of fee-based volumes from these assets in the Marcellus Shale. This added to the mix a lower-risk, lower-margin element to our total gross margin. We process gas under three general types of contracts (gas purchase/keep whole contracts, percentage-of-proceeds contracts, and fee-based arrangements). These contracts are more fully described in our Annual Report on Form 10-K for the year ended December 31, 2010. New gas volumes being added to our Panhandle system are primarily under percentage of proceeds contracts. The result of this is a relative volumetric decrease in the higher-risk, higher-margin gas purchase/keep whole contracts, meaning that we are sharing more of the processing margin with our producers in this region.
We generated a majority of our gross margin from contractual arrangements under which the gross margin is exposed to increases and decreases in the price of natural gas and NGLs. As part of our risk management strategy, we use derivative financial instruments to hedge NGLs sold and natural gas purchased. Midstream gross margin, including the cash impact of midstream derivatives, was $33.0 million compared to $29.6 million. This $3.4 million increase was primarily due to the increased system volumes, partially offset by a relative increase in lower-risk, lower-margin, percentage of proceeds and fee-based contracts (as noted above).
Expenses
Operating expenses increased due to prior and current years’ expansion projects and acquisitions. The related costs of these facilities included increased costs of labor, utilities and property tax.
General and administrative expenses increased as a result of our change in management structure related to the Merger and some shared costs with our former parent, Penn Virginia Corporation, are now direct costs of the Partnership.
Depreciation and amortization expenses increased primarily due to acquisitions and capital expansions on the Marcellus Shale and Panhandle systems.
31
Other
Our other results consist of interest expense and derivative gains and losses. The following table sets forth a summary of certain financial data for our other results for the periods presented:
| | | | | | | | |
| | | Three Months Ended March 31, | |
| | | 2011 | | | 2010 | |
Operating income | | $ | 37,985 | | | $ | 26,758 | |
Other income (expense) | | | | | | | | |
Interest expense | | | (10,850 | ) | | | (5,835 | ) |
Derivatives | | | (19,761 | ) | | | (7,568 | ) |
Other | | | 137 | | | | 327 | |
| | | | | | | | |
Net income | | $ | 7,511 | | | $ | 13,682 | |
| | | | | | | | |
Interest Expense. Our consolidated interest expense for the periods presented is comprised of the following:
| | | | | | | | |
| | | Three Months Ended March 31, | |
Source | | 2011 | | | 2010 | |
Interest on Revolver | | $ | (3,930 | ) | | $ | (3,869 | ) |
Interest on Senior Notes | | | (6,188 | ) | | | — | |
Debt issuance costs and other | | | (1,040 | ) | | | (1,384 | ) |
Interest rate swaps | | | — | | | | (582 | ) |
Capitalized interest | | | 308 | | | | — | |
| | | | | | | | |
Total interest expense | | $ | (10,850 | ) | | $ | (5,835 | ) |
| | | | | | | | |
Interest expense for the three months ended March 31, 2011 has increased compared to the same period in 2010. The increase is due to the issuance of the Senior Notes in April 2010 bearing an annual interest rate of 8.25%.
Derivatives. Our results of operations and operating cash flows were impacted by changes in market prices affecting fair values for NGL, crude oil and natural gas prices, as well as the Interest Rate Swaps.
Commodity markets are volatile, and as a result, our hedging activity results can vary significantly. Our results of operations are affected by the volatility of changes in fair value, which fluctuate with changes in NGL, crude oil and natural gas prices. We determine the fair values of our commodity derivative agreements based on discounted cash flows based on quoted forward prices for the respective commodities. The discounted cash flows utilize discount rates adjusted for the credit risk of our counterparties for derivatives in an asset position and our own credit risk for derivatives in a liability position.
Our derivative activity for the periods presented is summarized below:
| | | | | | | | |
| | | Three Months Ended March 31, | |
| | | 2011 | | | 2010 | |
Interest Rate Swap realized derivative loss | | $ | (1,876 | ) | | $ | (2,426 | ) |
Interest Rate Swap unrealized derivative gain (loss) | | | 1,683 | | | | (704 | ) |
Interest Rate Swap other comprehensive income reclass | | | (189 | ) | | | — | |
Natural gas midstream commodity realized derivative gain (loss) | | | (2,982 | ) | | | 780 | |
Natural gas midstream commodity unrealized derivative loss | | | (16,397 | ) | | | (5,218 | ) |
| | | | | | | | |
Total derivative loss | | $ | (19,761 | ) | | $ | (7,568 | ) |
| | | | | | | | |
32
Environmental Matters
Our operations and those of our coal lessees are subject to environmental laws and regulations adopted by various governmental authorities in the jurisdictions in which these operations are conducted. The terms of our coal property leases impose liability on the relevant lessees for all environmental and reclamation liabilities arising under those laws and regulations. The lessees are bonded and have indemnified us against any and all future environmental liabilities. We regularly visit our coal properties to monitor lessee compliance with environmental laws and regulations and to review mining activities. Our management believes that our operations and those of our lessees comply with existing laws and regulations and does not expect any environment-related material adverse impact on our financial condition or results of operations.
As of March 31, 2011 and December 31, 2010, our environmental liabilities were $0.8 million and $0.9 million, which represents our best estimate of the liabilities as of those dates related to our coal and natural resource management and natural gas midstream businesses. We have reclamation bonding requirements with respect to certain unleased and inactive properties. Given the uncertainty of when a reclamation area will meet regulatory standards, a change in this estimate could occur in the future.
Critical Accounting Estimates
The process of preparing financial statements in accordance with accounting principles generally accepted in the United States of America requires our management to make estimates and judgments regarding certain items and transactions. It is possible that materially different amounts could be recorded if these estimates and judgments change or if the actual results differ from these estimates and judgments. Our most critical accounting estimates which involve the judgment of our management were fully disclosed in PVR’s and PVG’s Annual Reports on Form 10-K for the year ended December 31, 2010 and remained unchanged as of March 31, 2011.
33
| Item 3 | Quantitative and Qualitative Disclosures About Market Risk |
Market risk is the risk of loss arising from adverse changes in market rates and prices. The principal market risks to which we are exposed are as follows:
As a result of our risk management activities as discussed below, we are also exposed to counterparty risk with financial institutions with whom we enter into these risk management positions.
We have completed a number of acquisitions in recent years. In conjunction with our accounting for these acquisitions, it was necessary for us to estimate the values of the assets acquired and liabilities assumed, which involved the use of various assumptions. The most significant assumptions, and the ones requiring the most judgment, involve the estimated fair values of property, plant and equipment, and the resulting amount of goodwill, if any. Changes in operations, decreases in commodity prices, changes in the business environment or deterioration of market conditions could substantially alter management’s assumptions and could result in lower estimates of values of acquired assets or of future cash flows. If these events occur, it is reasonably possible that we could record a significant impairment loss on our Consolidated Statements of Income.
Price Risk
Our price risk management program permits the utilization of derivative financial instruments (such as futures, forwards, option contracts and swaps) to seek to mitigate the price risks associated with fluctuations in natural gas, NGL and crude oil prices as they relate to our natural gas midstream segment. The derivative financial instruments are placed with major financial institutions that we believe are of acceptable credit risk. The fair values of our derivative financial instruments are significantly affected by fluctuations in the prices of natural gas, NGLs and crude oil.
At March 31, 2011, we reported a net commodity derivative related to our natural gas midstream segment of $32.3 million that is with four counterparties and is substantially concentrated with three of those counterparties. This concentration may impact our overall credit risk, either positively or negatively, in that these counterparties may be similarly affected by changes in economic or other conditions. We neither paid nor received collateral with respect to our derivative positions. No significant uncertainties related to the payment of amounts to or collectability of amounts owed to us exist with regard to these counterparties.
For the three months ended March 31, 2011 and 2010, we reported net derivative losses of $19.4 million and $4.4 million for commodity derivatives. Because we no longer use hedge accounting for our commodity derivatives, we recognize changes in fair value in earnings currently in the derivatives caption on our Consolidated Statements of Income. We have experienced and could continue to experience significant changes in the estimate of derivative gains or losses recognized due to fluctuations in the value of our commodity derivative contracts. Our results of operations are affected by the volatility of unrealized gains and losses and changes in fair value, which fluctuate with changes in natural gas, crude oil and NGL prices. These fluctuations could be significant in a volatile pricing environment.
The following table lists our commodity derivative agreements for the period presented:
34
| | | | | | | | | | | | | | | | | | | | |
| | | Average
Volume Per
Day | | | Swap Price | | | Weighted Average Price | | | Fair Value at
March 31, 2011 | |
| | | | | Put | | | Call | | |
| | | | |
NGL - natural gasoline collar | | | (gallons | ) | | | | | | | (per gallon) | | | | | |
Second quarter 2011 through fourth quarter 2011 | | | 95,000 | | | | | | | $ | 1.57 | | | $ | 1.94 | | | $ | (14,440 | ) |
| | | | |
Crude oil collar | | | (barrels | ) | | | | | | | (per barrel) | | | | | |
Second quarter 2011 through fourth quarter 2011 | | | 400 | | | | | | | $ | 75.00 | | | $ | 98.50 | | | | (1,367 | ) |
| | | | | |
Natural gas purchase swap | | | (MMBtu | ) | | | (MMBtu | ) | | | | | | | | | | | | |
Second quarter 2011 through fourth quarter 2011 | | | 6,500 | | | $ | 5.80 | | | | | | | | | | | | (2,167 | ) |
| | | | |
NGL - natural gasoline collar | | | (gallons | ) | | | | | | | (per gallon) | | | | | |
First quarter 2012 through fourth quarter 2012 | | | 54,000 | | | | | | | $ | 1.75 | | | $ | 2.02 | | | | (8,963 | ) |
| | | | | |
Crude oil swap | | | (barrels | ) | | | (per barrel | ) | | | | | | | | | | | | |
First quarter 2012 through fourth quarter 2012 | | | 600 | | | $ | 88.62 | | | | | | | | | | | | (3,724 | ) |
| | | | | |
Natural gas purchase swap | | | (MMBtu | ) | | | (MMBtu | ) | | | | | | | | | | | | |
First quarter 2012 through fourth quarter 2012 | | | 4,000 | | | $ | 5.195 | | | | | | | | | | | | (196 | ) |
| | | | | |
Settlements to be paid in subsequent period | | | | | | | | | | | | | | | | | | | (1,480 | ) |
| | | | | | | | | | | | | | | | | | | | |
| | | | | | | | | | | | | | | | | | $ | (32,337 | ) |
| | | | | | | | | | | | | | | | | | | | |
We estimate that a $5.00 per barrel increase in the crude oil price would decrease the fair value of our crude oil collars by $1.5 million. We estimate that a $5.00 per barrel decrease in the crude oil price would increase the fair value of our crude oil collars by $1.6 million. We estimate that a $1.00 per MMBtu increase in the natural gas price would increase the fair value of our natural gas purchase swaps by $3.0 million. We estimate that a $1.00 per MMBtu decrease in the natural gas price would decrease the fair value of our natural gas purchase swaps by $3.0 million. We estimate that a $0.10 per gallon increase in the natural gasoline (an NGL) price would decrease the fair value of our natural gasoline collar by $2.9 million. We estimate that a $0.10 per gallon decrease in the natural gasoline price would increase the fair value of our natural gasoline collar by $5.7 million.
We estimate that, excluding the effects of derivative positions described above, for every $1.00 per MMBtu increase or decrease in the natural gas price, our natural gas midstream gross margin and operating income for the remainder of 2011 would increase or decrease by $0.7 million. In addition, we estimate that for every $5.00 per barrel increase or decrease in the crude oil price, our natural gas midstream gross margin and operating income for the remainder of 2011 would increase or decrease by $4.4 million. This assumes that natural gas prices, crude oil prices and inlet volumes remain constant at anticipated levels. These estimated changes in our gross margin and operating income exclude potential cash receipts or payments in settling these derivative positions.
Interest Rate Risk
As of March 31, 2011, we had $515.0 million of outstanding indebtedness under the Revolver, which carries a variable interest rate throughout its term. We entered into the Interest Rate Swaps to establish fixed interest rates on a portion of the outstanding borrowings under the Revolver. From March 2010 to December 2011, the notional amounts of the Interest Rate Swaps total $250.0 million, or 49% of our outstanding indebtedness under the Revolver as of March 31, 2011, with us paying a weighted average fixed rate of 3.37% on the notional amount, and the counterparties paying a variable rate equal to the three-month LIBOR. From December 2011 to December 2012, the notional amounts of the Interest Rate Swaps total $100.0 million, or 19% of our outstanding indebtedness under the Revolver as of March 31, 2011, with us paying a weighted average fixed rate of 2.09% on the notional amount, and the counterparties paying a variable rate equal to the three-month LIBOR. A 1% increase in short-term interest rates on the floating rate debt outstanding under the Revolver (net of amounts fixed through the Interest Rate Swaps) as of March 31, 2011 would cost us approximately $2.7 million in additional interest expense per year.
35
Customer Credit Risk
We are exposed to the credit risk of our customers and lessees. Approximately 83%, or $83.2 million, of our consolidated accounts receivable at March 31, 2011 resulted from our natural gas midstream segment and approximately 17%, or $16.4 million, resulted from our coal and natural resource management segment. Approximately $38.3 million of the natural gas midstream segment’s receivables at March 31, 2011 related to four customers, Conoco Phillips Company, Tenaska Marketing Ventures, Targa Liquids Marketing and Trade and Williams NGL Marketing, LLC. At March 31, 2011, 46% of our natural gas midstream segment accounts receivable and 38% of our consolidated accounts receivable related to these natural gas midstream customers. No significant uncertainties related to the collectability of amounts owed to us exist in regard to this natural gas midstream customer.
This customer concentration increases our exposure to credit risk on our accounts receivables, because the financial insolvency of any of these customers could have a significant impact on our results of operations. If our natural gas midstream customers or coal lessees become financially insolvent, they may not be able to continue to operate or meet their payment obligations to us. Any material losses as a result of customer or lessee defaults could harm and have an adverse effect on our business, financial condition or results of operations. Substantially all of our trade accounts receivable are unsecured.
To mitigate the risks of nonperformance by our natural gas midstream customers, we perform ongoing credit evaluations of our existing customers. We monitor individual customer payment capability in granting credit arrangements to new customers by performing credit evaluations, seek to limit credit to amounts we believe the customers can pay and maintain reserves we believe are adequate to cover exposure for uncollectible accounts. As of March 31, 2011, no receivables were collateralized, and we had a $0.3 million allowance for doubtful accounts, of which the majority related to our natural gas midstream segment.
36
| Item 4 | Controls and Procedures |
(a) Disclosure Controls and Procedures
Under the supervision and with the participation of our management, including our Chief Executive Officer and our Chief Financial Officer, we performed an evaluation of the design and operation of our disclosure controls and procedures (as defined in Rule 13a-15(e) of the Exchange Act) as of March 31, 2011. Our disclosure controls and procedures are designed to ensure that information required to be disclosed by us in the reports we file or submit under the Exchange Act is recorded, processed, summarized and reported accurately and on a timely basis. Based on that evaluation, our Chief Executive Officer and our Chief Financial Officer concluded that, as of March 31, 2011, such disclosure controls and procedures were effective.
(b) Changes in Internal Control Over Financial Reporting
On January 1, 2011, we migrated to a new enterprise resource planning (��ERP”) system. As a result of moving to the new ERP system, some process level control procedures were changed in order to conform to the new ERP system. While we believe that the new ERP system will ultimately have no negative effect on our internal control over financial reporting, there are inherent weaknesses in implementing any new system and we could experience control and implementation issues impacting our financial reporting. In the event that such an issue occurs, we have manual procedures in place which would allow us to continue to record and report results from the new ERP system. We are continuing to implement additional features and aspects of the new ERP system and will monitor, test and evaluate the impact and effect of the new ERP system on our internal controls and procedures as part of the evaluation of our internal control over financial reporting for 2011. Except for the new ERP system implementation, there were no changes made in our internal control over financial reporting during our last fiscal quarter that have materially affected, or are reasonably likely to materially affect, our internal control over financial reporting.
37
PART II. OTHER INFORMATION
| Item I. | Legal Proceedings. |
For information on legal proceedings, see Part I, Item I, Financial Statements, Note 12, “Commitments and Contingencies” in the Notes to Unaudited Consolidated Financial Statements included in this quarterly report, which is incorporated into this item by reference.
There have been no material changes from the risk factors described previously in Part I, Item IA of the Partnership’s Annual Report on Form 10-K for the year ended December 31, 2010, filed on February 24, 2011.
| | |
| 10.1 | | First Amendment to the Amended and Restated Credit Agreement, dated as of April 19, 2011 by and among PVR Finco LLC, the guarantors party thereto, PNC Bank, National Association, as Administrative Agent, and the other financial institutions party thereto (incorporated by reference to Exhibit 10.1 to Registrant’s Current Report on Form 8-K filed on April 21, 2011). |
| |
| 12.1 | | Statement of Computation of Ratio of Earnings to Fixed Charges Calculation. |
| |
| 31.1 | | Certification Pursuant to Exchange Act Rule 13a-14(a) or Rule 15d-14(a), as Adopted Pursuant to Section 302 of the Sarbanes-Oxley Act of 2002. |
| |
| 31.2 | | Certification Pursuant to Exchange Act Rule 13a-14(a) or Rule 15d-14(a), as Adopted Pursuant to Section 302 of the Sarbanes-Oxley Act of 2002. |
| |
| 32.1 | | Certification Pursuant to 18 U.S.C. Section 1350, as Adopted Pursuant to Section 906 of the Sarbanes-Oxley Act of 2002. |
| |
| 32.2 | | Certification Pursuant to 18 U.S.C. Section 1350, as Adopted Pursuant to Section 906 of the Sarbanes-Oxley Act of 2002. |
38
SIGNATURES
Pursuant to the requirements of the Securities Exchange Act of 1934, as amended, the Registrant has duly caused this report to be signed on its behalf by the undersigned thereunto duly authorized.
| | | | |
| | PENN VIRGINIA RESOURCE PARTNERS, L.P. |
| | |
| | By: | | PENN VIRGINIA RESOURCE GP, LLC |
| | |
| Date: April 29, 2011 | | By: | | /s/ Robert B. Wallace |
| | | | Robert B. Wallace |
| | | | Executive Vice President and Chief Financial Officer |
| | |
| Date: April 29, 2011 | | By: | | /s/ Forrest W. McNair |
| | | | Forrest W. McNair |
| | | | Vice President and Controller |
39