2024
UNITED STATES
SECURITIES AND EXCHANGE COMMISSION
Washington, D.C. 20549
Form 10-K
(Mark One)
| | | | | |
| ☒ | ANNUAL REPORT PURSUANT TO SECTION 13 OR 15(d) OF THE SECURITIES EXCHANGE ACT OF 1934 |
For the fiscal year ended December 31, 2024
OR
| | | | | |
| ☐ | TRANSITION REPORT PURSUANT TO SECTION 13 OR 15(d) OF THE SECURITIES EXCHANGE ACT OF 1934 |
| For the transition period from _______________ to _______________ |
Commission file number: 001-32395
ConocoPhillips
(Exact name of registrant as specified in its charter)
| | | | | |
| Delaware | 01-0562944 |
| (State or other jurisdiction of incorporation or organization) | (I.R.S. Employer identification No.) |
925 N. Eldridge Parkway, Houston, TX 77079
(Address of principal executive offices) (Zip Code)
Registrant's telephone number, including area code: 281-293-1000
Securities registered pursuant to Section 12(b) of the Act:
| | | | | | | | |
| Title of each class | Trading symbols | Name of each exchange on which registered |
| Common Stock, $.01 Par Value | COP | New York Stock Exchange |
| 7% Debentures due 2029 | CUSIP—718507BK1 | New York Stock Exchange |
Securities registered pursuant to Section 12(g) of the Act: None
Indicate by check mark if the registrant is a well-known seasoned issuer, as defined in Rule 405 of the Securities Act. ☒ Yes ☐ No
Indicate by check mark if the registrant is not required to file reports pursuant to Section 13 or Section 15(d) of the Act. ☐ Yes ☒ No
Indicate by check mark whether the registrant (1) has filed all reports required to be filed by Section 13 or 15(d) of the Securities Exchange Act of 1934 during the preceding 12 months (or for such shorter period that the registrant was required to file such reports), and (2) has been subject to such filing requirements for the past 90 days. ☒ Yes ☐ No
Indicate by check mark whether the registrant has submitted electronically every Interactive Data File required to be submitted pursuant to Rule 405 of Regulation S-T (§ 232.405 of this chapter) during the preceding 12 months (or for such shorter period that the registrant was required to submit such files). ☒ Yes ☐ No
Indicate by check mark whether the registrant is a large accelerated filer, an accelerated filer, a non-accelerated filer, a smaller reporting company, or an emerging growth company. See the definitions of “large accelerated filer,” “accelerated filer,” “smaller reporting company” and “emerging growth company” in Rule 12b-2 of the Exchange Act.
| | | | | | | | | | | | | | | | | | | | | | | | | | | | | |
| Large Accelerated Filer | ☒ | Accelerated filer | ☐ | Non-accelerated filer | ☐ | Smaller reporting company | ☐ | Emerging growth company | ☐ |
If an emerging growth company, indicate by check mark if the registrant has elected not to use the extended transition period for complying with any new or revised financial accounting standards provided pursuant to Section 13(a) of the Exchange Act. ☐
Indicate by check mark whether the registrant has filed a report on and attestation to its management’s assessment of the effectiveness of its internal control over financial reporting under Section 404(b) of the Sarbanes-Oxley Act (15 U.S.C. 7262(b)) by the registered public accounting firm that prepared or issued its audit report. ☒
If securities are registered pursuant to Section 12(b) of the Act, indicate by checkmark whether the financial statements of the registrant included in the filing reflect the correction of an error to previously issued financial statements. ☐
Indicate by check mark whether any of those error corrections are restatements that required a recovery analysis of incentive-based compensation received by any of the registrant's executive officers during the relevant recovery period pursuant to §240.10D-1(b). ☐
Indicate by check mark whether the registrant is a shell company (as defined in Rule 12b-2 of the Act). ☐ Yes ☒ No
The aggregate market value of common stock held by non-affiliates of the registrant on June 30, 2024, the last business day of the registrant’s most recently completed second fiscal quarter, based on the closing price on that date of $103.61, was $132.7 billion.
The registrant had 1,272,380,205 shares of common stock outstanding at January 31, 2025.
Documents incorporated by reference:
Portions of the Proxy Statement for the Annual Meeting of Stockholders to be held on May 13, 2025 (Part III)
Table of Contents
| | | | | | | | |
| | Page |
| Commonly Used Abbreviations | |
| | |
| Item | | |
| | |
| | |
| | |
| | |
| | |
| | |
| | |
| | |
| | |
| | |
| | |
| | |
| | |
| | |
| | |
| | |
| | |
| | |
| 1C. | | |
| | |
| | |
| | |
| | |
| | |
| | |
| | |
| | |
| | |
| | |
| | |
| | |
| | |
| | |
| | |
| | |
| | |
| | |
| | |
| | |
| | |
| | |
| | |
| | |
| | |
| | |
| | |
| | |
| | |
| | | | | |
| Commonly Used Abbreviations | |
Commonly Used Abbreviations
The following industry-specific, accounting and other terms and abbreviations may be commonly used in this report.
| | | | | | | | | | | |
| Currencies | | Accounting | |
| $ or USD | U.S. dollar | ARO | asset retirement obligation |
| CAD | Canadian dollar | ASC | accounting standards codification |
| EUR | Euro | ASU | accounting standards update |
| GBP | British pound | DD&A | depreciation, depletion and |
| NOK | Norwegian kroner | | amortization |
| | FASB | Financial Accounting Standards |
| Units of Measurement | | | Board |
| BBL | barrel | FIFO | first-in, first-out |
| BCF | billion cubic feet | G&A | general and administrative |
| BOE | barrels of oil equivalent | GAAP | generally accepted accounting |
| MBD | thousands of barrels per day | | principles |
| MCF | thousand cubic feet | LIFO | last-in, first-out |
| MM | million | NPNS | normal purchase normal sale |
| MMBOE | million barrels of oil equivalent | PP&E | properties, plants and equipment |
| MBOED | thousand barrels of oil equivalent | VIE | variable interest entity |
| per day | | |
| MMBOED | million barrels of oil equivalent | Miscellaneous | |
| per day | CERCLA | Federal Comprehensive |
| MMBTU | million British thermal units | | Environmental Response |
| MMCFD | million cubic feet per day | | Compensation and Liability Act |
| MTPA | million tonnes per annum | EPA | Environmental Protection Agency |
| | ESG | environmental, social and governance |
| Industry | | EU | European Union |
| BLM | Bureau of Land Management | FERC | Federal Energy Regulatory |
| CBM | coalbed methane | | Commission |
| CCS | carbon capture and storage | GHG | greenhouse gas |
| E&P | exploration and production | HSE | health, safety and environment |
| FEED | front-end engineering and design | ICC | International Chamber of Commerce |
| FID | final investment decision | ICSID | World Bank’s International |
| FPS | floating production system | | Centre for Settlement of |
| FPSO | floating production, storage and | | Investment Disputes |
| offloading | IRS | Internal Revenue Service |
| G&G | geological and geophysical | OTC | over-the-counter |
| JOA | joint operating agreement | NYSE | New York Stock Exchange |
| LNG | liquefied natural gas | SEC | U.S. Securities and Exchange |
| NGLs | natural gas liquids | | Commission |
| OPEC | Organization of Petroleum | TSR | total shareholder return |
| Exporting Countries | U.K. | United Kingdom |
| PSC | production sharing contract | U.S. | United States of America |
| PUDs | proved undeveloped reserves | VROC | variable return of cash |
| SAGD | steam-assisted gravity drainage | | |
| WCS | Western Canadian Select | | |
| WTI | West Texas Intermediate | | |
| | | | | |
| 1 | ConocoPhillips 2024 10-K |
Part I
Unless otherwise indicated, “the company,” “we,” “our,” “us” and “ConocoPhillips” are used in this report to refer to the businesses of ConocoPhillips and its consolidated subsidiaries. Items 1 and 2—Business and Properties, contain forward-looking statements including, without limitation, statements relating to our plans, strategies, objectives, expectations and intentions that are made pursuant to the “safe harbor” provisions of the Private Securities Litigation Reform Act of 1995. The words “ambition,” “anticipate,” “believe,” “budget,” “continue,” “could,” “effort,” “estimate,” “expect,” “forecast,” “goal,” “guidance,” “intend,” “may,” “objective,” “outlook,” “plan,” “potential,” “predict,” “projection,” “seek,” “should,” “target,” “will,” “would” and similar expressions identify forward-looking statements. The company does not undertake to update, revise or correct any forward-looking information unless required to do so under the federal securities laws. Readers are cautioned that such forward-looking statements should be read in conjunction with the company’s disclosures under the headings “Risk Factors” beginning on page 19 and “CAUTIONARY STATEMENT FOR THE PURPOSES OF THE ‘SAFE HARBOR’ PROVISIONS OF THE PRIVATE SECURITIES LITIGATION REFORM ACT OF 1995,” beginning on page 65. Items 1 and 2. Business and Properties
Corporate Structure
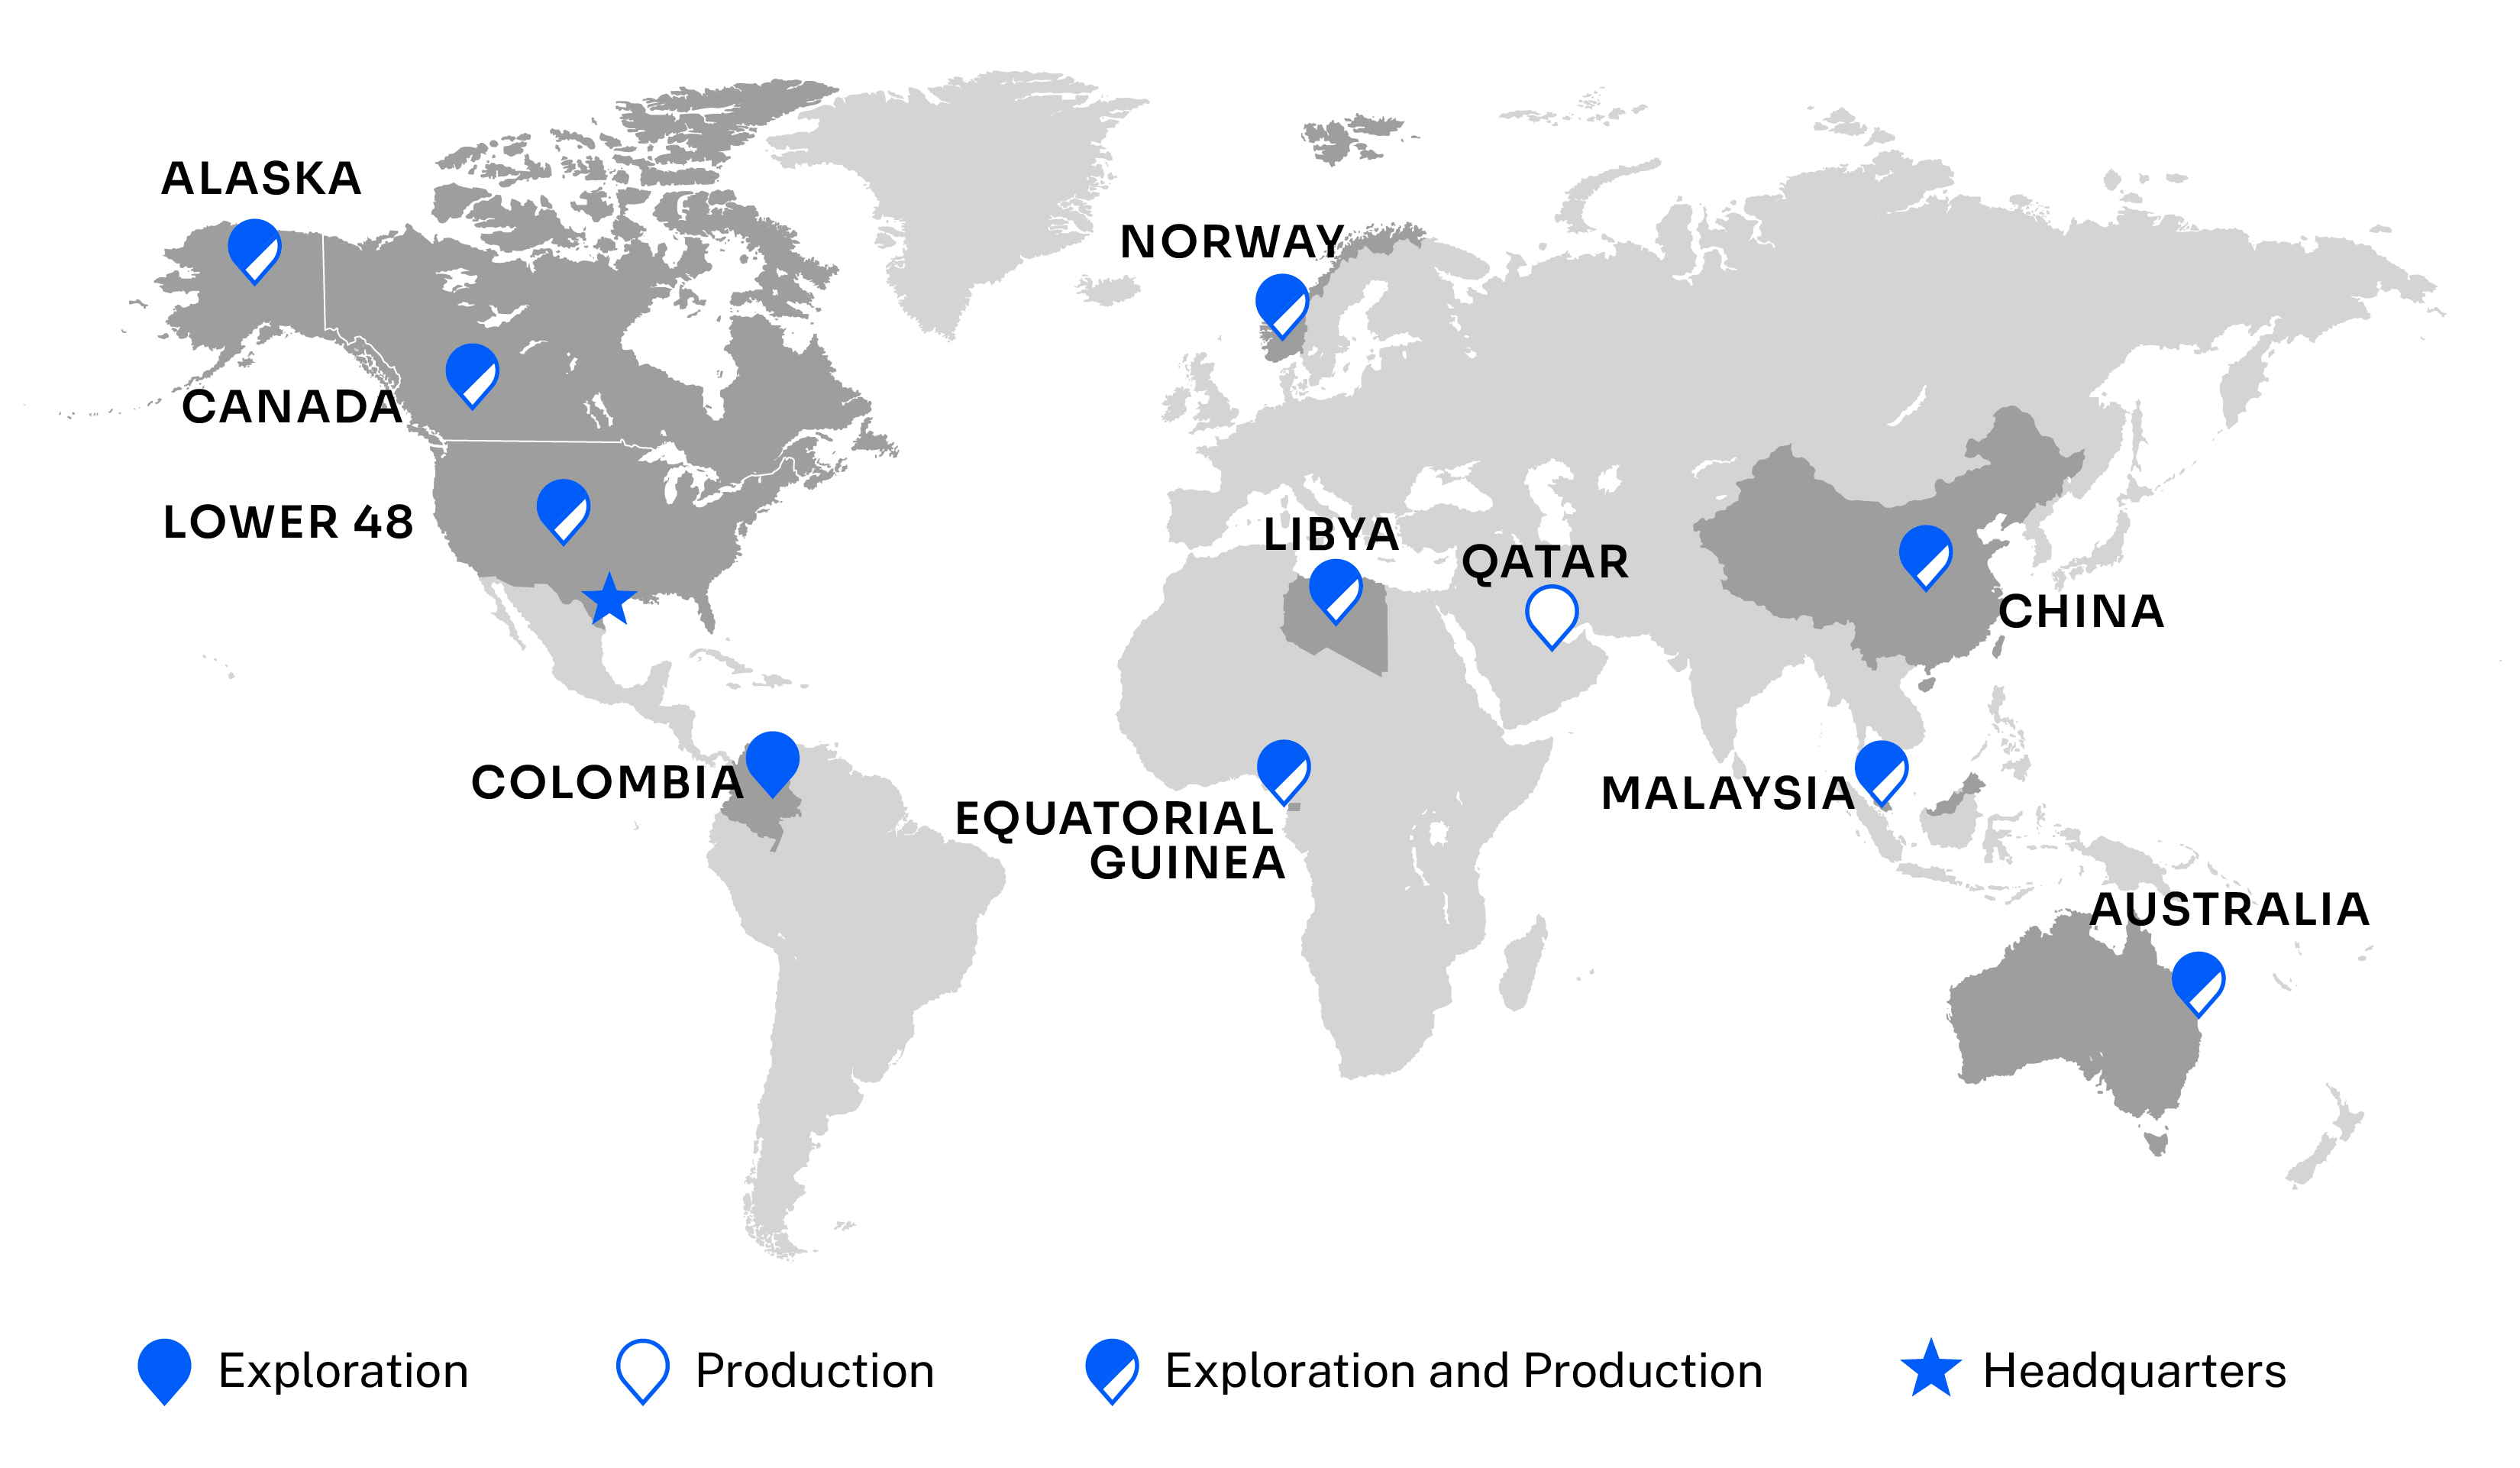
ConocoPhillips is an independent E&P company headquartered in Houston, Texas with operations and activities in 14 countries. Our diverse, low cost of supply portfolio includes resource-rich unconventional plays in North America; conventional assets in North America, Europe, Africa and Asia; LNG developments; oil sands in Canada; and an inventory of global exploration prospects. On December 31, 2024, we employed approximately 11,800 people worldwide and had total assets of about $123 billion. Total company production for the year was 1,987 MBOED.
ConocoPhillips was incorporated in the state of Delaware in 2001, in connection with, and in anticipation of, the merger between Conoco Inc. and Phillips Petroleum Company. The merger between Conoco and Phillips was consummated on August 30, 2002. In April 2012, ConocoPhillips completed the separation of the downstream business into an independent, publicly traded energy company, Phillips 66.
On November 22, 2024, we completed our acquisition of Marathon Oil Corporation (Marathon Oil), an independent oil and gas exploration and production company with operations in multiple basins in the Lower 48, as well as Equatorial Guinea internationally. For additional information related to this transaction, see Note 3. Segment and Geographic Information
| | | | | |
| ConocoPhillips 2024 10-K | 2 |
We manage our operations through six operating segments, defined by geographic region: Alaska; Lower 48; Canada; Europe, Middle East and North Africa; Asia Pacific; and Other International. For operating segment and geographic information, see Note 23. We explore for, produce, transport and market crude oil, bitumen, natural gas, NGLs and LNG on a worldwide basis. At December 31, 2024, our operations were producing in the U.S., Norway, Canada, Australia, Malaysia, Libya, China, Qatar and Equatorial Guinea.
•Proved worldwide crude oil, NGLs, natural gas and bitumen reserves.
•Net production of crude oil, NGLs, natural gas and bitumen.
•Average sales prices of crude oil, NGLs, natural gas and bitumen.
•Average production costs per BOE.
•Net wells completed, wells in progress and productive wells.
•Developed and undeveloped acreage.
| | | | | | | | | | | |
| Millions of Barrels of Oil Equivalent |
| Net Proved Reserves at December 31 | 2024 | 2023 | 2022 |
| Crude oil | | | |
| Consolidated operations | 3,406 | | 3,032 | | 2,975 | |
| Equity affiliates | 108 | | 89 | | 93 | |
| Total Crude Oil | 3,514 | | 3,121 | | 3,068 | |
| | | |
| Natural gas liquids | | | |
| Consolidated operations | 1,147 | | 892 | | 845 | |
| Equity affiliates | 62 | | 48 | | 50 | |
| Total Natural Gas Liquids | 1,209 | | 940 | | 895 | |
| | | |
| Natural gas | | | |
| Consolidated operations | 1,629 | | 1,408 | | 1,461 | |
| Equity affiliates | 977 | | 879 | | 959 | |
| Total Natural Gas | 2,606 | | 2,287 | | 2,420 | |
| | | |
| Bitumen | | | |
| Consolidated operations | 483 | | 410 | | 216 | |
| Total Bitumen | 483 | | 410 | | 216 | |
| | | |
| Total consolidated operations | 6,665 | | 5,742 | | 5,497 | |
| Total equity affiliates | 1,147 | | 1,016 | | 1,102 | |
| Total company | 7,812 | | 6,758 | | 6,599 | |
| | | | | |
| 3 | ConocoPhillips 2024 10-K |
Alaska
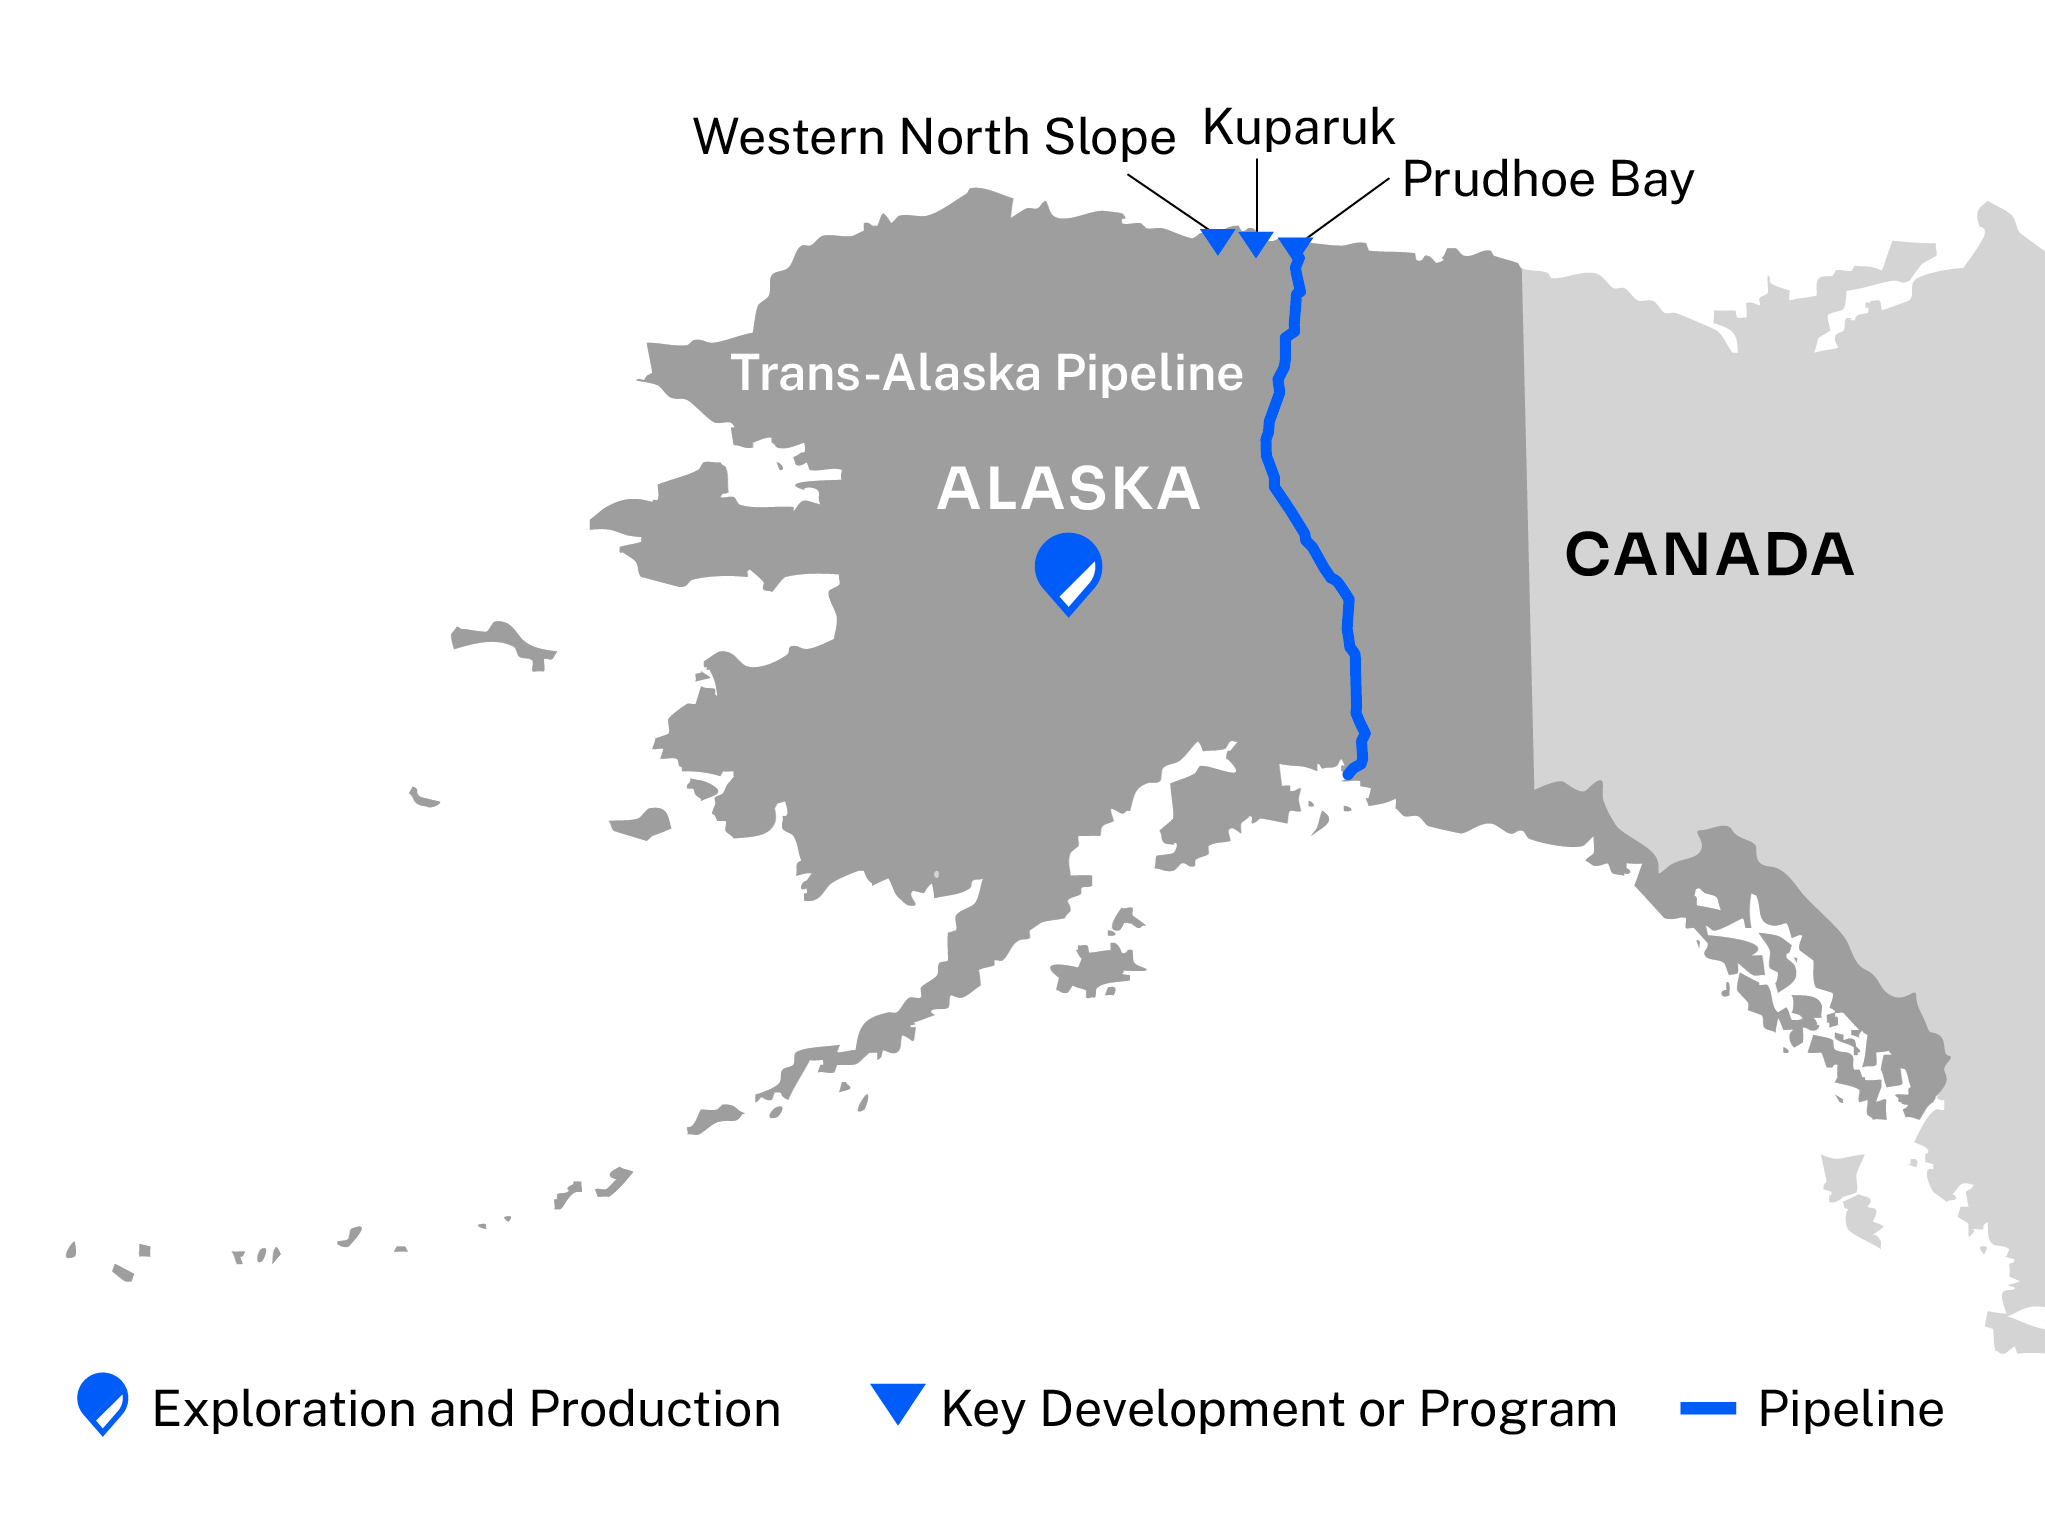
The Alaska segment primarily explores for, produces, transports and markets crude oil, natural gas and NGLs. We are the largest crude oil producer in Alaska and have major ownership interests in the Prudhoe Bay, Kuparuk and Western North Slope asset areas. Additionally, we are one of Alaska’s largest owners of state, federal and fee exploration leases, with approximately one million net undeveloped acres at year-end 2024. Alaska operations contributed 14 percent of our consolidated liquids production and two percent of our consolidated natural gas production.
| | | | | | | | | | | | | | | | | | | | | | | | | | |
| | | | | 2024 |
| Interest | | Operator | | Crude Oil
MBD | NGL
MBD | Natural Gas
MMCFD | Total
MBOED |
| Average Daily Net Production | | | | | | | | |
| Greater Prudhoe Area* | 36.5 | % | | Hilcorp | | 67 | | 15 | | 36 | | 88 | |
| Greater Kuparuk Area* | 94.2-99.8 | | ConocoPhillips | | 63 | | — | | 2 | | 63 | |
| Western North Slope | 100.0 | | ConocoPhillips | | 43 | | — | | 1 | | 43 | |
| Total Alaska | | | | | 173 | | 15 | | 39 | | 194 | |
*Acquired additional working interest in the fourth quarter of 2024. See Note 3. |
After exercising our preferential rights, we completed our acquisition of additional working interest in the Kuparuk River Unit and Prudhoe Bay Unit from Chevron U.S.A. Inc and Union Oil Company of California in the fourth quarter of 2024. This transaction increased our working interest by approximately five percent in the Kuparuk River Unit and approximately 0.4 percent in the Prudhoe Bay Unit. See Note 3.
Greater Prudhoe Area
The Greater Prudhoe Area includes the Prudhoe Bay Unit, which consists of the Prudhoe Bay Field and five satellite fields, as well as the Greater Point McIntyre Area fields. Prudhoe Bay, the largest conventional oil field in North America, is the site of a large waterflood and enhanced oil recovery operation, supported by a large gas and water processing operation. Field installations include seven production facilities, two gas plants, two seawater plants and a central power station. In 2024, on average, there were two rigs drilling throughout the year.
Greater Kuparuk Area
The Greater Kuparuk Area includes the Kuparuk River Unit, which consists of the Kuparuk Field and six satellite fields. Field installations include three central production facilities which separate oil, natural gas and water, and a seawater treatment plant. In 2024, we operated two drilling rigs and two workover rigs. The Nuna project, which targets the Moraine reservoir, was sanctioned in 2023 and achieved first oil in the fourth quarter of 2024. The Coyote reservoir discovered in 2021 progressed to development in 2023 with additional wells drilled in 2024 and planned for 2025.
| | | | | |
| ConocoPhillips 2024 10-K | 4 |
Western North Slope
The Western North Slope includes the Colville River Unit, the Greater Mooses Tooth Unit and the Bear Tooth Unit. In 2024, we operated one full-time drilling rig and one seasonal drilling rig between the Colville River and Greater Mooses Tooth Units.
The Colville River Unit includes the Alpine Field and four satellite fields. Field installations include one central production facility, which separates oil, natural gas and water.
The Greater Mooses Tooth Unit is the first unit established entirely within the National Petroleum Reserve Alaska (NPR-A). The unit was constructed in two phases: Greater Mooses Tooth #1 (GMT1) and Greater Mooses Tooth #2 (GMT2).
In December 2023, we announced Willow FID. The project will consist of three drill sites, an operations center and camp, and a processing facility. In 2024, construction included installation of the Willow Access Road, the Willow Operations Center pad and pipeline segments. Additionally, fabrication and delivery of the Willow Operations Center modules to the North Slope were completed. First oil is anticipated in 2029.
Transportation
We transport the petroleum liquids produced on the North Slope to Valdez, Alaska through an 800-mile pipeline that is part of the Trans-Alaska Pipeline System (TAPS). We have a 29.5 percent ownership interest in TAPS, and also have ownership interests in, and operate the Alpine, Kuparuk and Oliktok pipelines on the North Slope.
We manage the marine transportation of our North Slope production using five company-owned, double-hulled tankers, and charter third-party vessels, as necessary. The tankers deliver oil from Valdez, Alaska, primarily to refineries on the west coast of the U.S.
| | | | | |
| 5 | ConocoPhillips 2024 10-K |
Lower 48
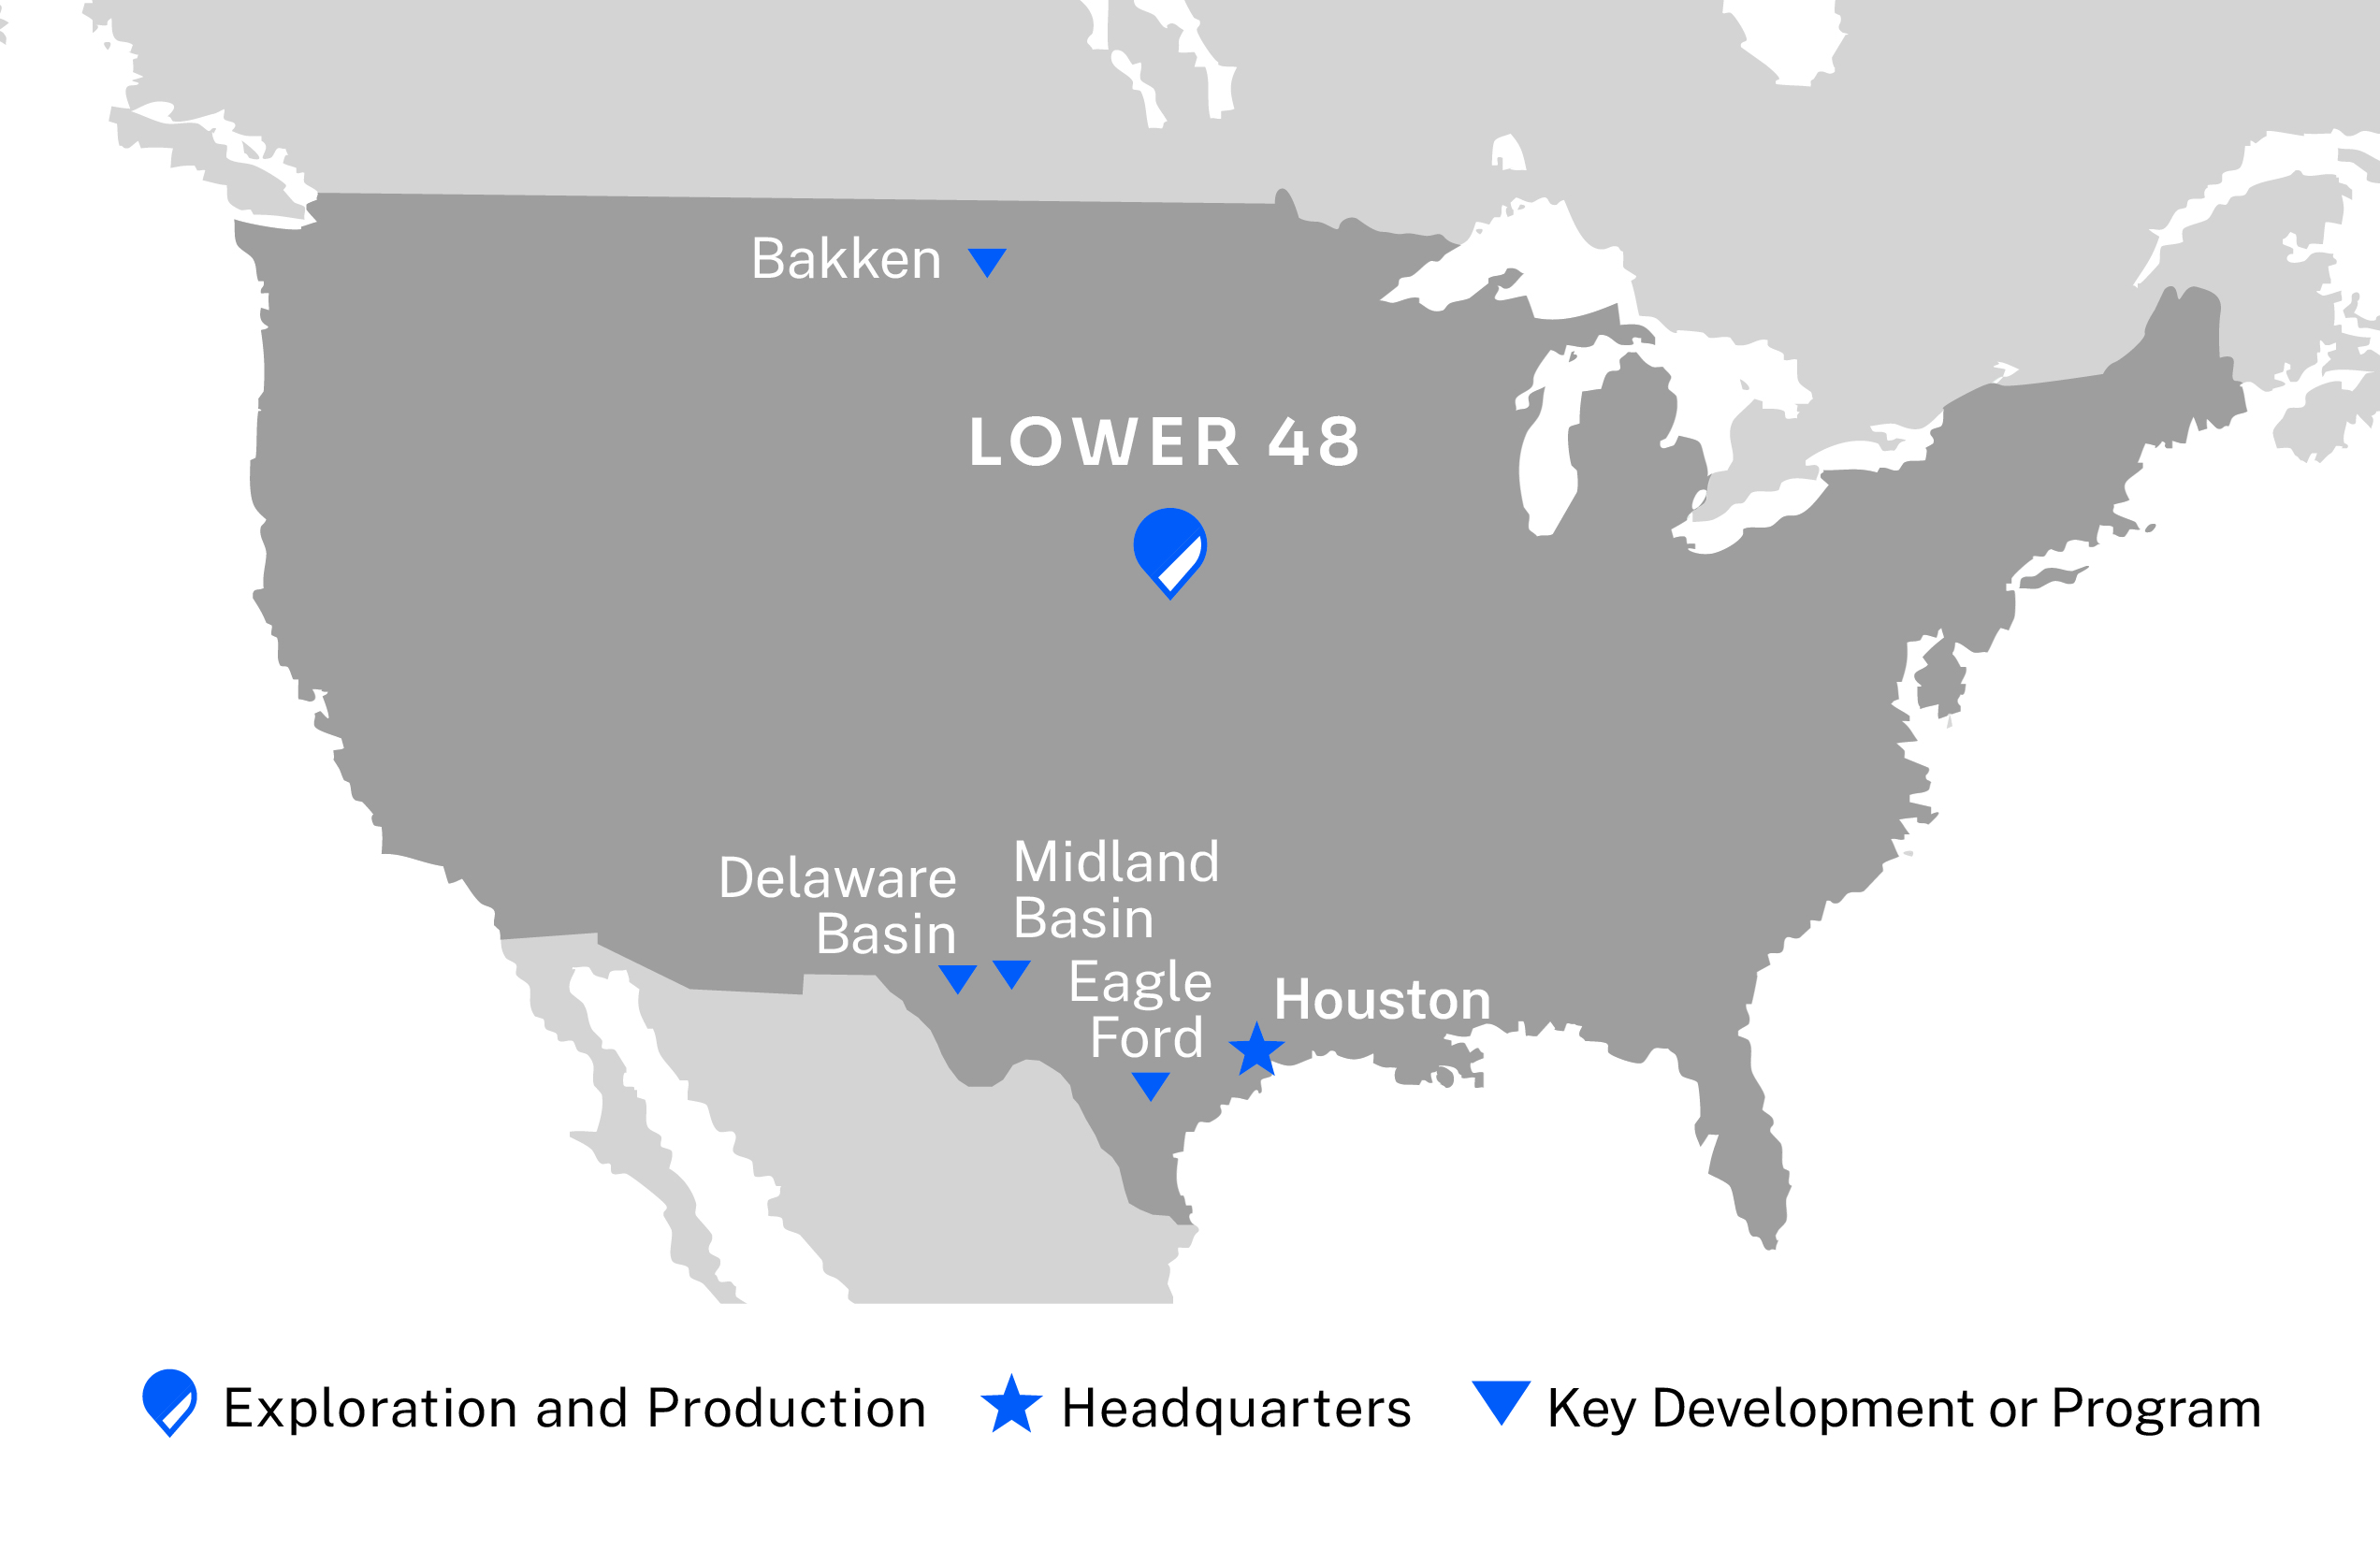
The Lower 48 segment consists of operations located in the 48 contiguous U.S. states and the Gulf of Mexico, with a portfolio mainly consisting of low cost of supply, short cycle time, resource-rich unconventional plays and commercial operations. Based on 2024 production volumes, the Lower 48 is our largest segment and contributed 63 percent of our consolidated liquids production and 74 percent of our consolidated natural gas production.
| | | | | | | | | | | | | | |
| 2024 |
| Crude Oil
MBD | NGL
MBD | Natural Gas
MMCFD | Total
MBOED |
| Average Daily Net Production | | | | |
| Delaware Basin | 301 | | 144 | | 884 | | 593 | |
| Eagle Ford | 124 | | 66 | | 322 | | 244 | |
| Midland Basin | 101 | | 44 | | 224 | | 182 | |
| Bakken | 66 | | 22 | | 164 | | 115 | |
| Other | 10 | | 3 | | 31 | | 18 | |
| Total Lower 48 | 602 | | 279 | | 1,625 | | 1,152 | |
|
On November 22, 2024, we completed the acquisition of Marathon Oil, further enhancing our Lower 48 position. This acquisition adds low cost of supply, complementary acreage in the Delaware, Eagle Ford and Bakken basins. See Note 3. Delaware Basin
We hold approximately 792,000 unconventional net acres in the Delaware Basin, spanning west Texas through southeast New Mexico. Current development activity targets prospects in the Avalon, Bone Springs and Wolfcamp formations while balancing leasehold obligations and permit terms. We operated ten rigs and two frac crews on average during 2024, resulting in 166 operated wells drilled and 151 operated wells brought online.
Eagle Ford
We hold approximately 484,000 unconventional net acres in the Eagle Ford, located in south Texas. The current focus is on full-field development, using customized well spacing and stacking patterns adapted through reservoir analysis. We operated seven rigs and two frac crews on average during 2024, resulting in 182 operated wells drilled and 154 operated wells brought online.
Midland Basin
We hold approximately 265,000 unconventional net acres in the Midland Basin, located in west Texas. The current development strategy is focused on full-field development utilizing multi-well pad projects targeting both Spraberry and Wolfcamp reservoir targets. We operated five rigs and two frac crews on average during 2024, resulting in 119 operated wells drilled and 111 operated wells brought online.
Bakken
We hold approximately 790,000 unconventional net acres in the Williston Basin, located in North Dakota and eastern Montana. The primary producing zones are the Middle Bakken and Three Forks formations. We operated four rigs and one frac crew on average during 2024, resulting in 66 operated wells drilled and 83 operated wells brought online.
Partner-Operated
We participate in partner-operated wells when they align with our investment decision criteria and development strategies. In 2024, we participated in partner-operated wells with varying working interests across our Lower 48 portfolio.
Facilities
We operate and own, with varying interests, centralized processing facilities in Texas and New Mexico in support of our Delaware, Eagle Ford and Midland assets.
| | | | | |
| ConocoPhillips 2024 10-K | 6 |
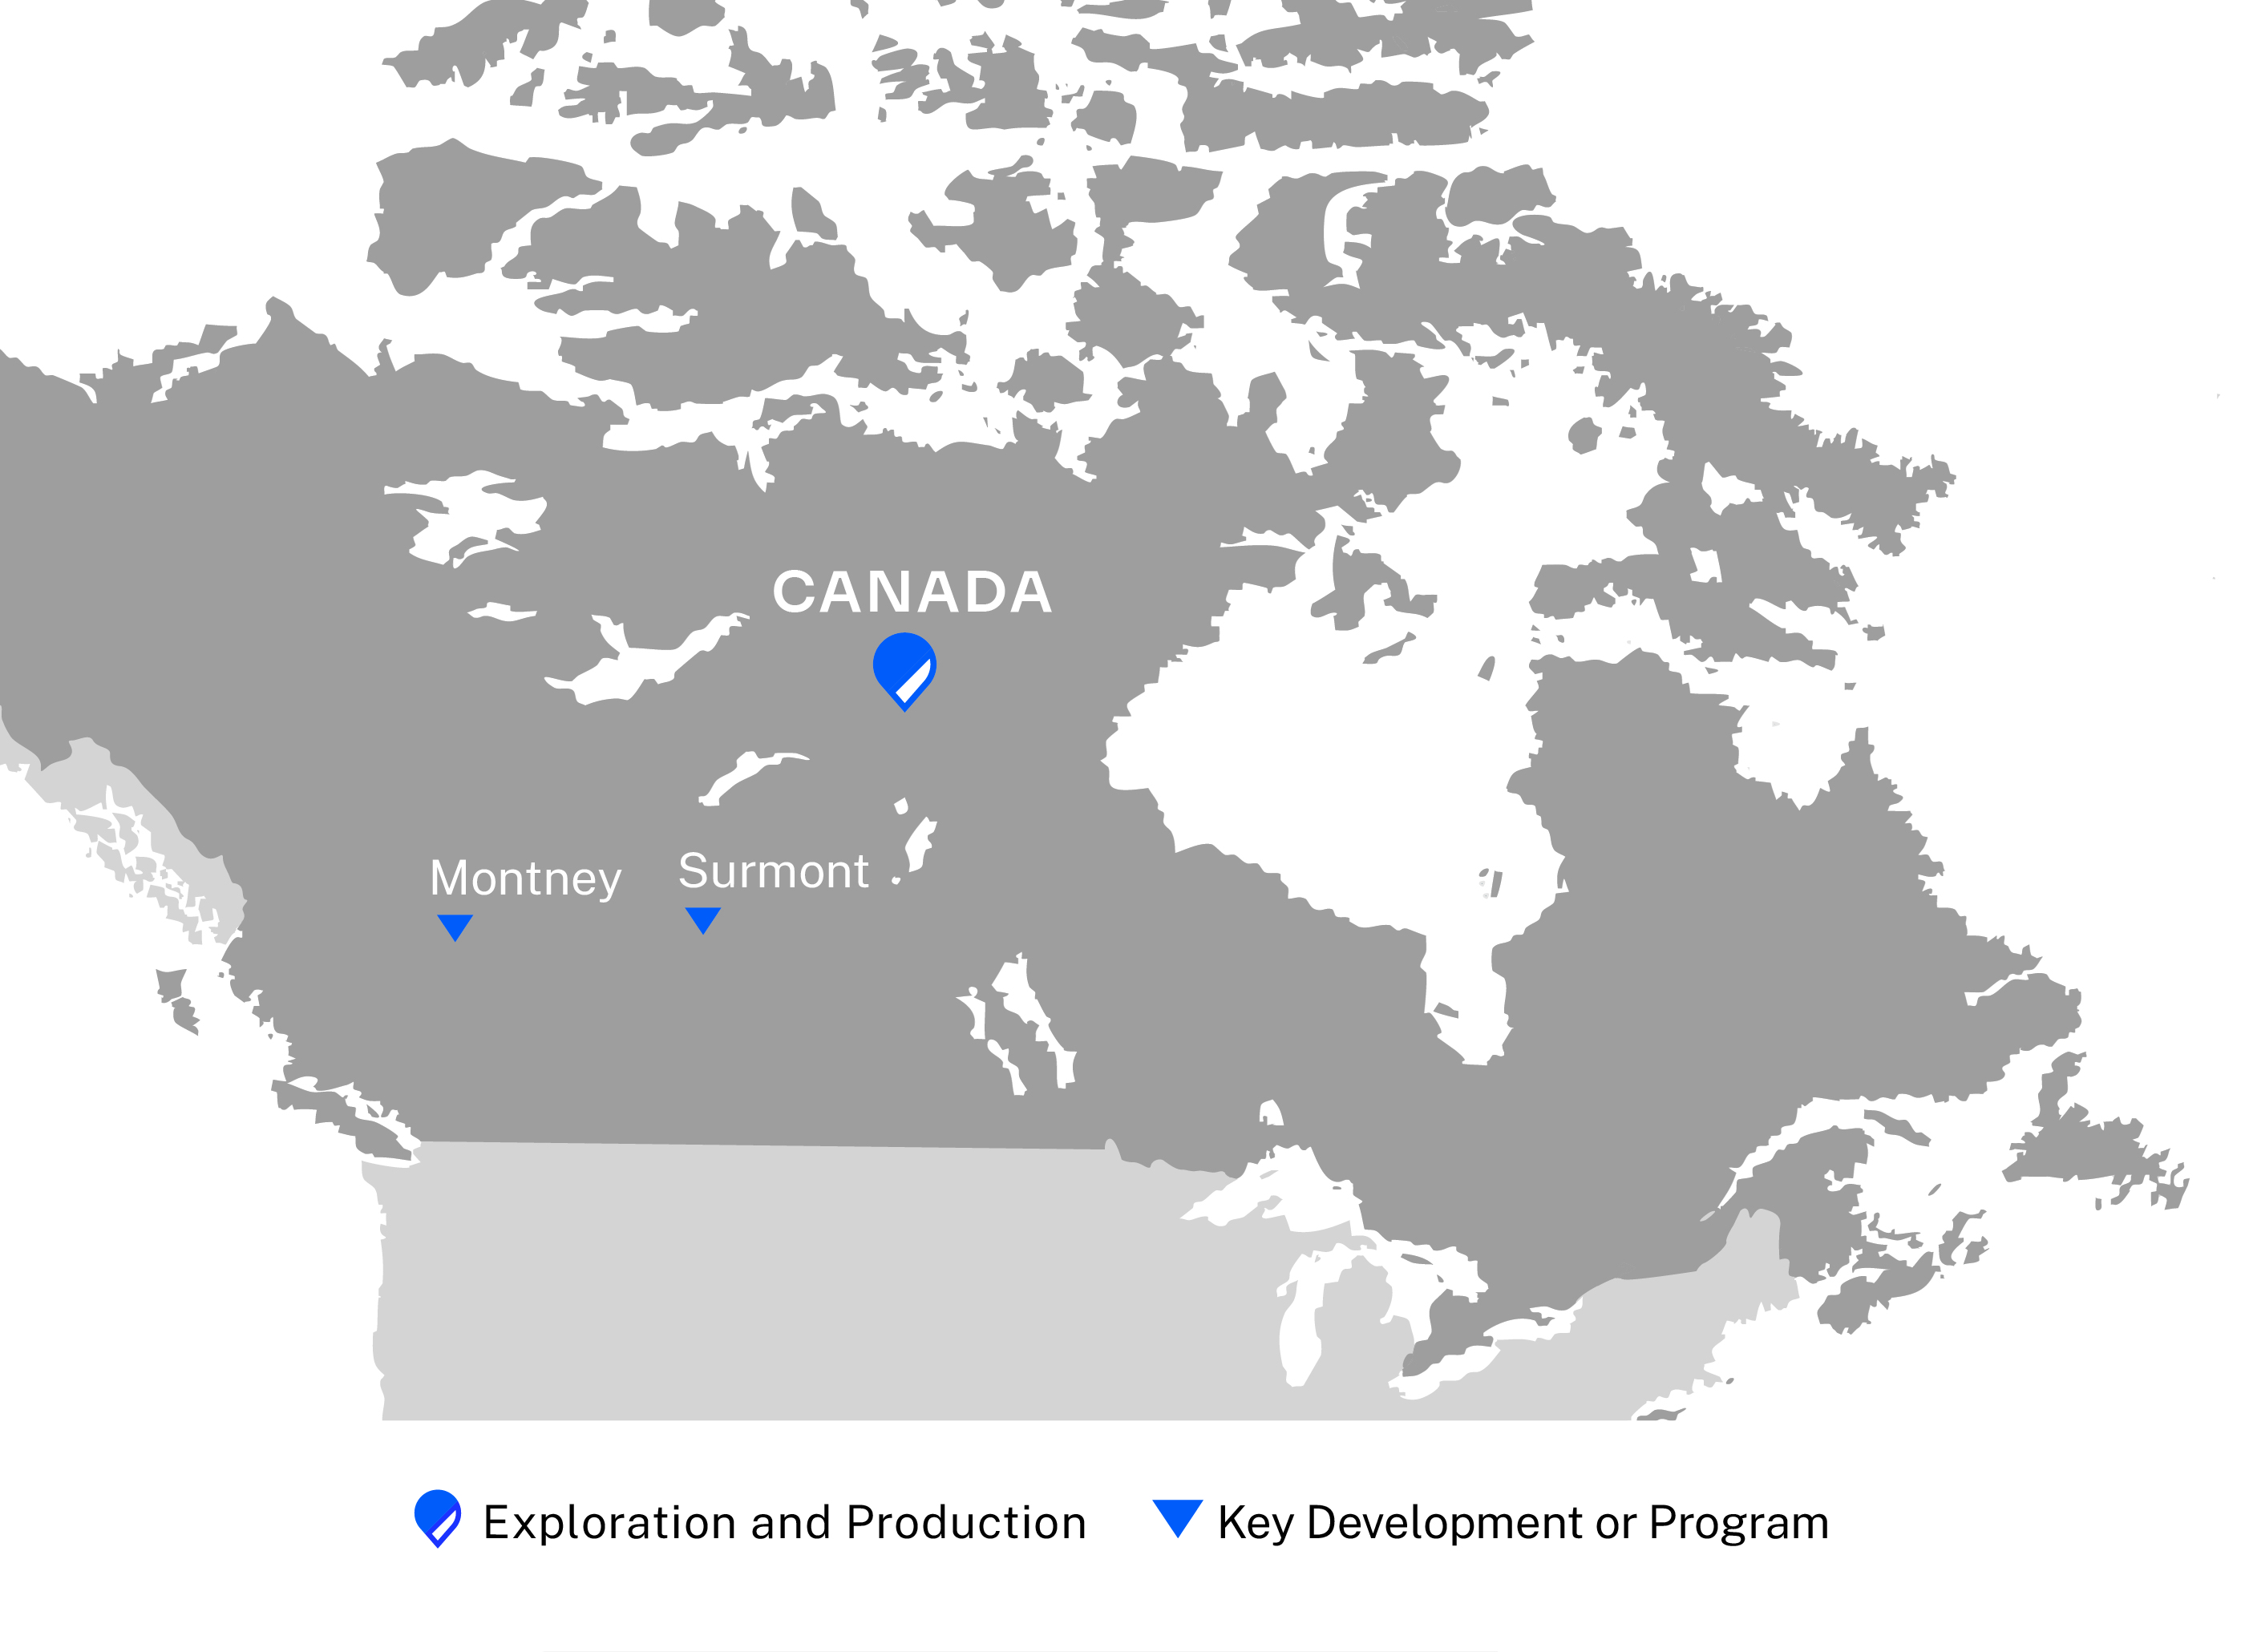
Canada
Our Canadian operations consist of the Surmont oil sands development in Alberta, the liquids-rich Montney unconventional play in British Columbia and commercial operations. In 2024, operations in Canada contributed ten percent of our consolidated liquids production and five percent of our consolidated natural gas production.
| | | | | | | | | | | | | | | | | | | | | | | | | | | | | |
| | | | | 2024 |
| Interest | | Operator | | Crude Oil
MBD | NGL
MBD | Natural Gas
MMCFD | Bitumen
MBD | Total
MBOED |
| Average Daily Net Production | | | | | | | | | |
| Surmont | 100.0 | % | | ConocoPhillips | | — | | — | | — | | 122 | | 122 | |
| Montney | 100.0 | | ConocoPhillips | | 17 | | 6 | | 115 | | — | | 42 | |
| Total Canada | | | | | 17 | | 6 | | 115 | | 122 | | 164 | |
|
Our bitumen resources in Canada are produced via SAGD, an enhanced thermal oil recovery method where steam is injected into the reservoir, effectively liquefying the heavy bitumen, which is recovered and pumped to the surface for further processing. Operations include two central processing facilities for treatment and blending of bitumen, and a diluent recovery unit. These facilities have allowed the asset to lower blend ratio and diluent supply costs, while gaining protection from diluent supply disruptions and increased market access for our product. At December 31, 2024, we held approximately 684,000 net acres of land in the Athabasca Region of northeastern Alberta.
Surmont
The Surmont oil sands leases are located south of Fort McMurray, Alberta. Surmont is a 100 percent working interest asset that offers sustained, long-life production. We are focused on keeping facilities full, structurally lowering costs, reducing GHG intensity and optimizing asset performance. In 2024, we brought all wells at Pad 267 to expected production, commenced the drilling of Pad 104 and executed the asset's largest re-drill program to date of 29 wells. First production from Pad 104 is expected in 2026.
Montney
The Montney is a liquids-rich unconventional play located in northeastern British Columbia. At December 31, 2024, we held approximately 297,000 net acres of land in the Montney. In 2024, we operated two rigs resulting in 33 wells drilled and 27 operated wells brought online. Early development activities will continue in 2025 with drilling and completions activity.
| | | | | |
| 7 | ConocoPhillips 2024 10-K |
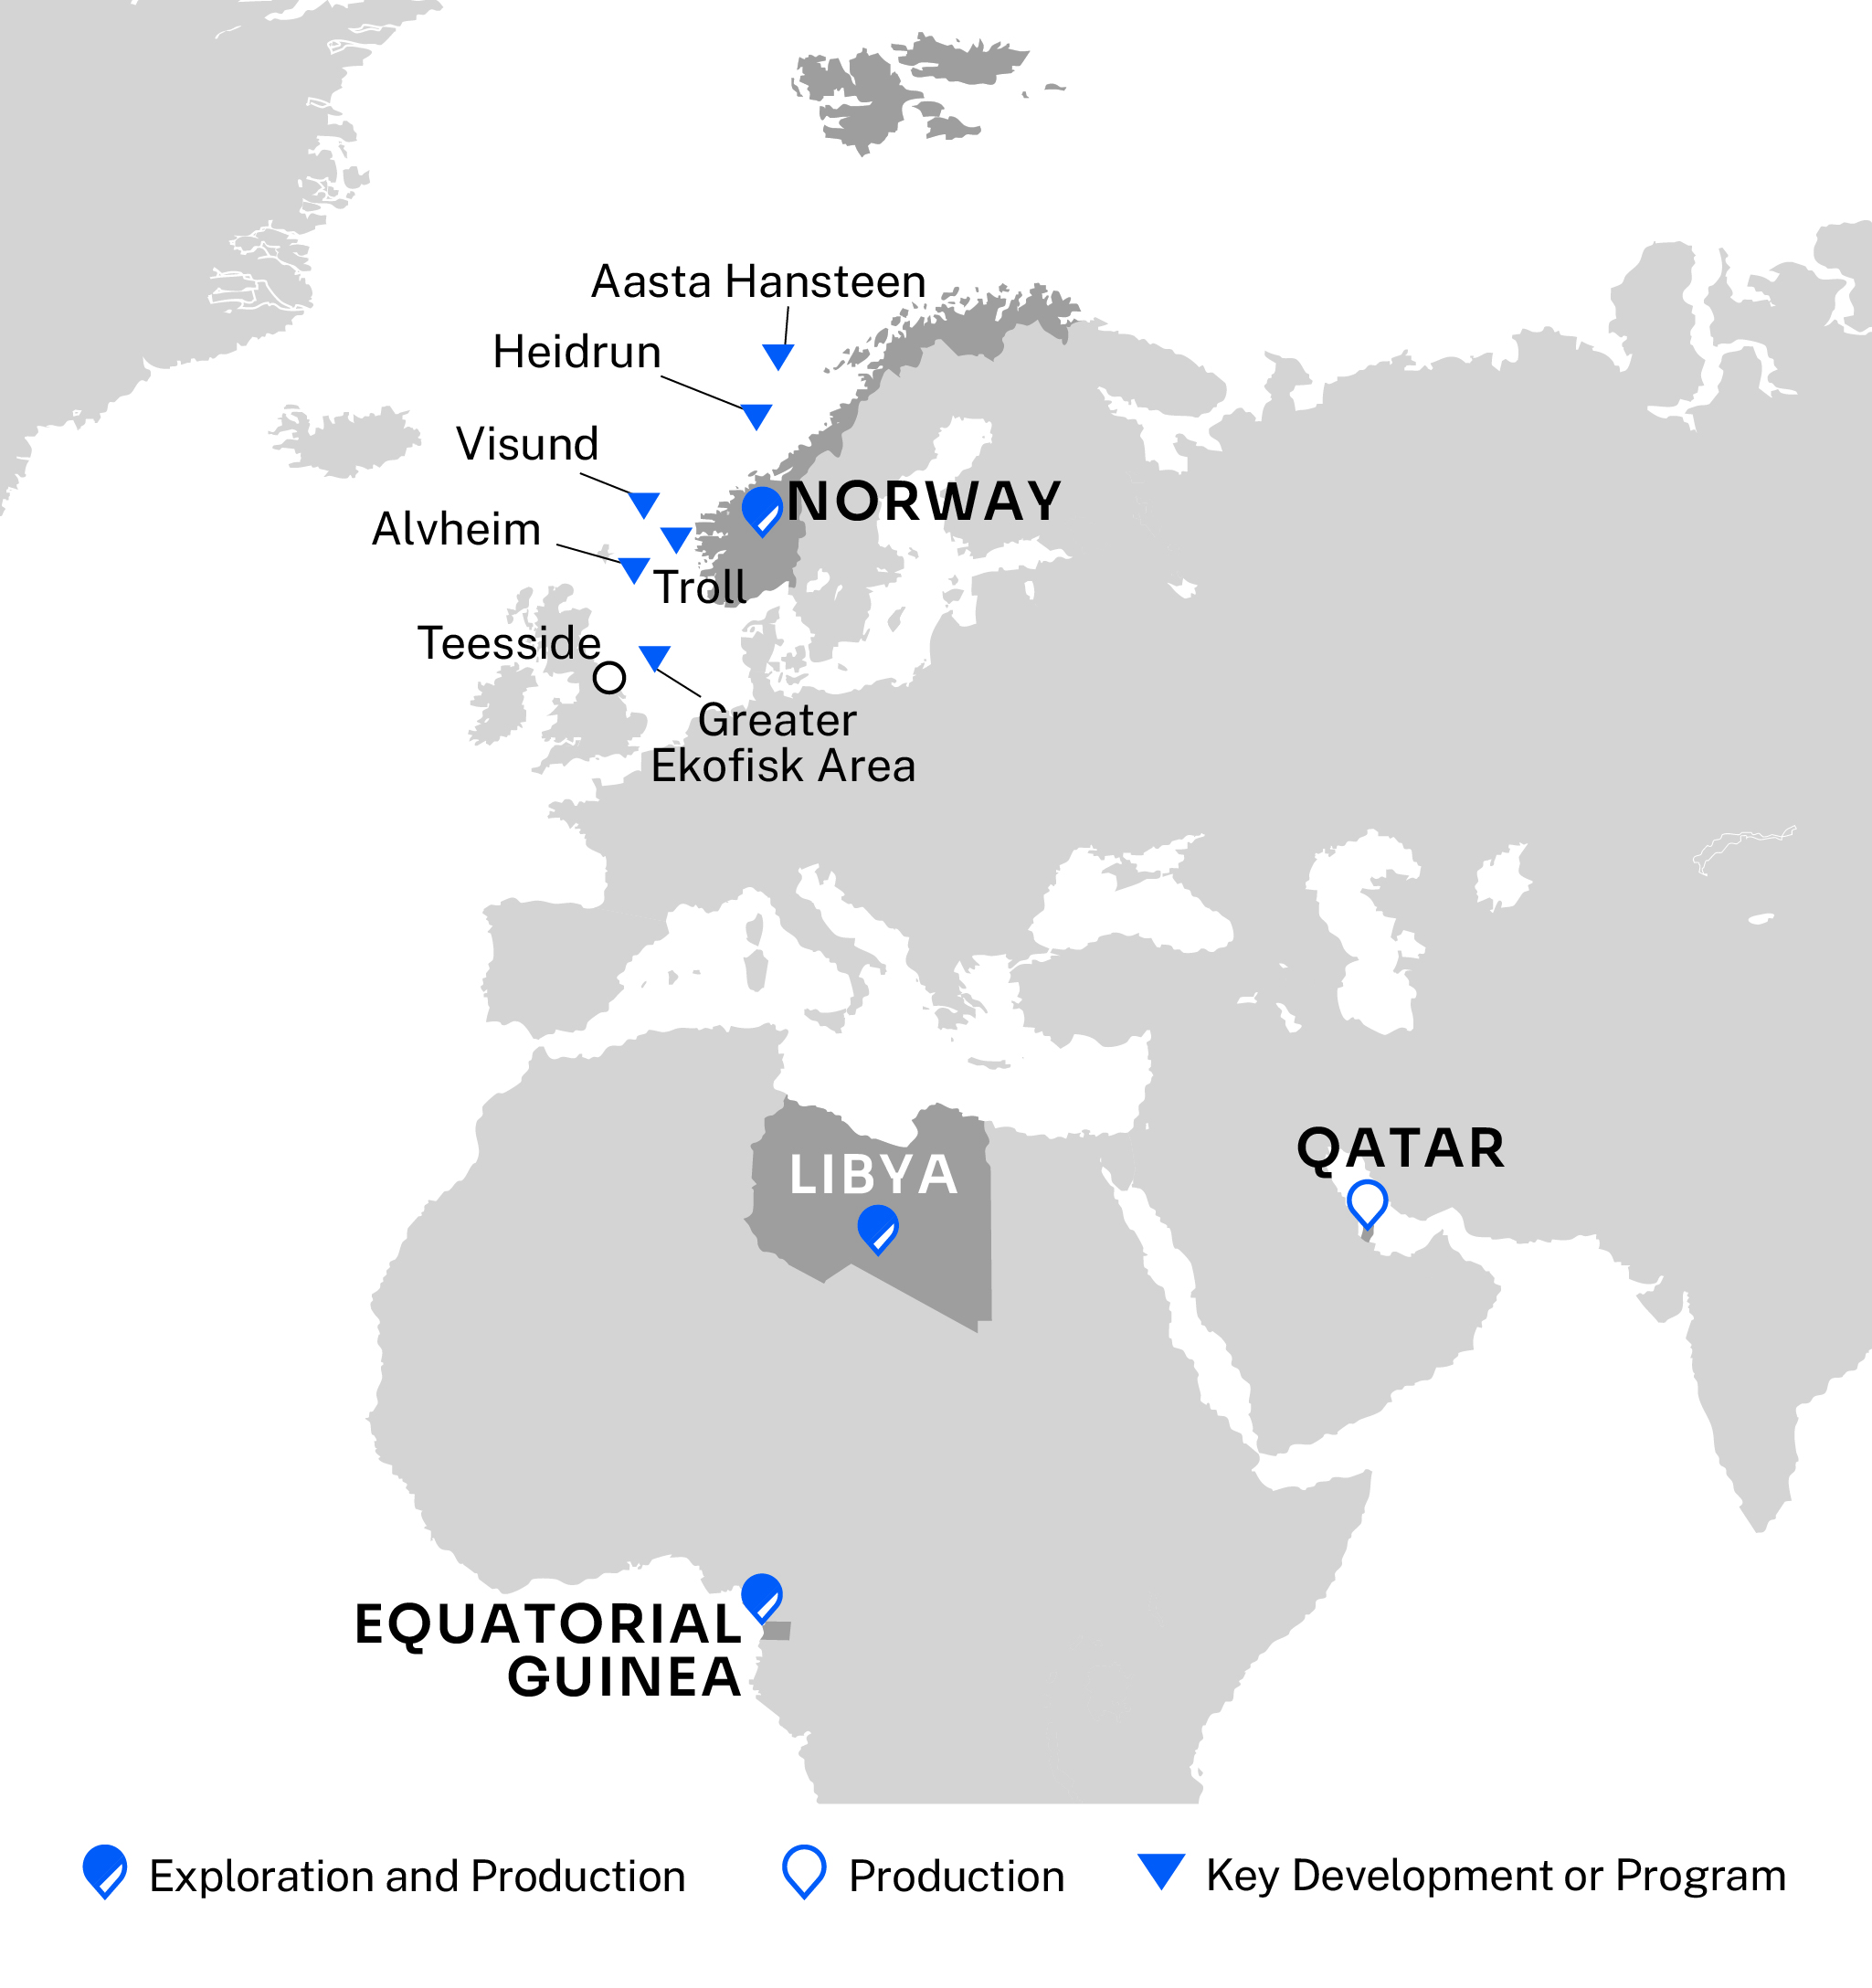
Europe, Middle East and North Africa
The Europe, Middle East and North Africa segment consists of operations principally located in the Norwegian sector of the North Sea, the Norwegian Sea, Qatar, Libya, Equatorial Guinea and commercial and terminalling operations in the U.K. In 2024, operations in Europe, Middle East and North Africa contributed nine percent of our consolidated liquids production and 17 percent of our consolidated natural gas production.
Norway
| | | | | | | | | | | | | | | | | | | | | | | | | | |
| | | | | 2024 |
| Interest | | Operator | | Crude Oil
MBD | NGL
MBD | Natural Gas
MMCFD | Total
MBOED |
| Average Daily Net Production | | | | | | | | |
| Greater Ekofisk Area | 28.3-35.1 % | | ConocoPhillips | | 43 | | 2 | | 73 | | 57 | |
| Heidrun Field | 24.0 | | | Equinor | | 9 | | 1 | | 37 | | 16 | |
| Aasta Hansteen Field | 10.0 | | | Equinor | | — | | — | | 78 | | 13 | |
| Troll Field | 1.6 | | | Equinor | | 1 | | — | | 69 | | 13 | |
| Alvheim Field | 20.0 | | | Aker BP | | 8 | | — | | 15 | | 11 | |
| Visund Field | 9.1 | | | Equinor | | 1 | | 1 | | 36 | | 8 | |
| Other Fields | Various | | Equinor | | 7 | | — | | 21 | | 10 | |
| Total Norway | | | | | 69 | | 4 | | 329 | | 128 | |
Greater Ekofisk Area
The Greater Ekofisk Area is located offshore Stavanger, Norway, in the North Sea, and is comprised of five producing fields. Crude oil is exported to our operated terminal located at Teesside, U.K., and the natural gas is exported to Emden, Germany. In 2024, the Eldfisk North development, a subsea tieback to Eldfisk, achieved first production.
Heidrun Field
The Heidrun Field is located in the Norwegian Sea. Produced crude oil is stored in a floating storage unit and exported via shuttle tankers. Most of the gas is transported to Europe via gas processing terminals in Norway with some reinjected for pressure support if required. A portion of the gas is also transported for use as feedstock in a methanol plant in Norway, in which we have an 18 percent interest.
Aasta Hansteen Field
The Aasta Hansteen Field is located in the Norwegian Sea. Gas is transported through the Polarled gas pipeline to the onshore Nyhamna processing plant for final processing prior to export to market. Produced condensate is loaded onto shuttle tankers and transported to market.
| | | | | |
| ConocoPhillips 2024 10-K | 8 |
Troll Field
The Troll Field lies in the northern part of the North Sea and consists of the Troll A, B and C platforms. The natural gas from Troll A is transported to Kollsnes, Norway. Crude oil from floating platforms Troll B and Troll C is transported to Mongstad, Norway, for storage and export.
Alvheim Field
The Alvheim Field is located in the northern part of the North Sea and consists of a FPSO vessel and subsea installations. Produced crude oil is exported via shuttle tankers and natural gas is transported to the Scottish Area Gas Evacuation (SAGE) Terminal at St. Fergus, U.K., through the SAGE Pipeline.
Visund Field
The Visund Field is located in the northern part of the North Sea and consists of a floating drilling, production and processing unit and subsea installations. Crude oil is transported by pipeline to a nearby third-party field for storage and export via tankers. The natural gas is transported to the gas processing plants at Kollsnes and Kårstø, through the Gassled transportation system.
Other Fields
We also have varying ownership interests in three other producing fields in the Norwegian sector of the North Sea.
Exploration
In 2024, we were awarded three new exploration licenses, PL1205, PL1207 and PL1208 located in the North Sea. In the first quarter of 2024, we recorded the investment in the suspended Busta discovery well on license PL782S, located in the North Sea, as dry hole expense. In 2025, we plan to drill the second appraisal well in the 2020 Slagugle discovery on PL891, located in the Norwegian Sea, and participate in two partner-operated exploration wells in the Bounty Up-dip prospect on PL886 and in Othello South on PL124B, both located in the Norwegian Sea.
Transportation
We have a 35.1 percent ownership interest in the Norpipe Oil Pipeline System, a 220-mile pipeline which carries crude oil from Ekofisk to a crude oil stabilization and NGLs processing facility in Teesside, U.K.
Facilities
We operate and have a 40.25 percent ownership interest in a crude oil stabilization and NGLs processing facility at Teesside, U.K. to support our Norway operations.
Qatar
| | | | | | | | | | | | | | | | | | | | | | | | | | |
| | | | | 2024 |
| Interest | | Operator | | Crude Oil
MBD | NGL
MBD | Natural Gas
MMCFD | Total
MBOED |
| Average Daily Net Production | | | | | | | | |
| QatarEnergy LNG N(3) | 30.0 | % | | QatarEnergy LNG | | 13 | | 8 | | 374 | | 83 | |
QatarEnergy LNG N(3) (N3), is an integrated development jointly owned by QatarEnergy (68.5 percent), ConocoPhillips (30 percent) and Mitsui & Co., Ltd. (1.5 percent). N3 consists of upstream natural gas production facilities, which produce approximately 1.4 gross BCF per day of natural gas from Qatar’s North Field over a 25-year life, in addition to a 7.8 million gross tonnes per year LNG facility. LNG is shipped in leased LNG carriers destined for sale globally, while liquids are sold into the domestic market or marketed internationally through QatarEnergy Marketing.
N3 executed the development of the onshore and offshore assets as a single integrated development with QatarEnergy LNG N(4) (N4), a joint venture between QatarEnergy and Shell plc. This included the joint development of offshore facilities situated in a common offshore block in Qatar's North Field, as well as the construction of two identical LNG process trains and associated gas treating facilities for both the N3 and N4 joint ventures. Production from the LNG trains and associated facilities is mutualized between the two joint ventures.
We have a 25 percent interest in both QatarEnergy LNG NFE (4) (NFE4) and QatarEnergy LNG NFS (3) (NFS3) joint ventures, which are participating in the North Field East (NFE) and North Field South (NFS) LNG projects. See Note 3 and Note 4.
| | | | | |
| 9 | ConocoPhillips 2024 10-K |
Libya
| | | | | | | | | | | | | | | | | | | | | | | | | | |
| | | | | 2024 |
| Interest | | Operator | | Crude Oil
MBD | NGL
MBD | Natural Gas
MMCFD | Total
MBOED |
| Average Daily Net Production | | | | | | | | |
| Waha Concession | 20.4 | % | | Waha Oil Co. | | 48 | | — | | 28 | | 53 | |
The Waha Concession is made up of multiple concessions and encompasses approximately 13 million acres onshore in the Sirte Basin for exploration and production activity. Oil is transported by pipeline to the Es Sider terminal for export. Natural gas is transported and sold domestically. Current production comes from 13 existing fields within the Waha Concession.
Equatorial Guinea
| | | | | | | | | | | | | | | | | | | | | | | | | | |
| | | | | 2024 |
| Interest | | Operator | | Crude Oil
MBD | NGL
MBD | Natural Gas
MMCFD | Total
MBOED |
| Average Daily Net Production | | | | | | | | |
| Alba Unit | 64.2 | % | | ConocoPhillips | | 1 | | — | | 14 | | 3 | |
On November 22, 2024, we completed the acquisition of Marathon Oil. With the acquisition, we have increased our global operations adding oil, natural gas and LNG activity in Equatorial Guinea to our portfolio. See Note 3.
We have varying stages of oil and gas exploration, development and production activities in Equatorial Guinea. We operate in both the Alba and Block D PSCs that form the Alba Unit located offshore Equatorial Guinea.
Gas Processing
The following facilities located on Bioko Island allow us to further monetize natural gas production from the Alba Unit and are accounted for as equity method investments and are reflected in the "Equity in earnings of affiliates" line of our consolidated income statement.
We own a 52.2 percent interest in the Alba Plant LLC, our joint venture with Chevron Corporation (27.8 percent) and Sociedad Nacional de Gas de Guinea Ecuatorial (SONAGAS) (20.0 percent), which operates an onshore liquified petroleum gas (LPG) processing plant. Alba Plant LLC processes Alba Unit natural gas under a fixed-rate long-term contract. The LPG processing plant extracts condensate and LPG from the natural gas stream and sells it at market prices, with our share of the revenue reflected in the "Equity in earnings of affiliates" line of our consolidated income statement. Processed natural gas is delivered to Equatorial Guinea LNG Holdings Limited (EG LNG) for liquefaction and storage. We market our share of LNG to third parties indexed at global LNG prices.
We own a 56.0 percent interest in EG LNG, our joint venture with SONAGAS (37.9 percent) and Marubeni Gas Development UK Limited (6.1 percent), which operates a 3.7 MTPA LNG production facility. In January 2024, we began a five-year LNG sales agreement for a portion of our equity gas from the Alba Unit, providing us with additional exposure to the European LNG market.
We own a 45.0 percent interest in Atlantic Methanol Production Company LLC (AMPCO), our joint venture with Chevron Corporation (45.0 percent) and SONAGAS (10.0 percent), which operates a methanol plant. The plant is currently offline.
Additionally, Alba Plant LLC and EG LNG process third-party gas from the Alen Field under a combination of tolling fee and profit-sharing arrangements which are reflected in the "Equity in earnings of affiliates" line of our consolidated income statement.
| | | | | |
| ConocoPhillips 2024 10-K | 10 |
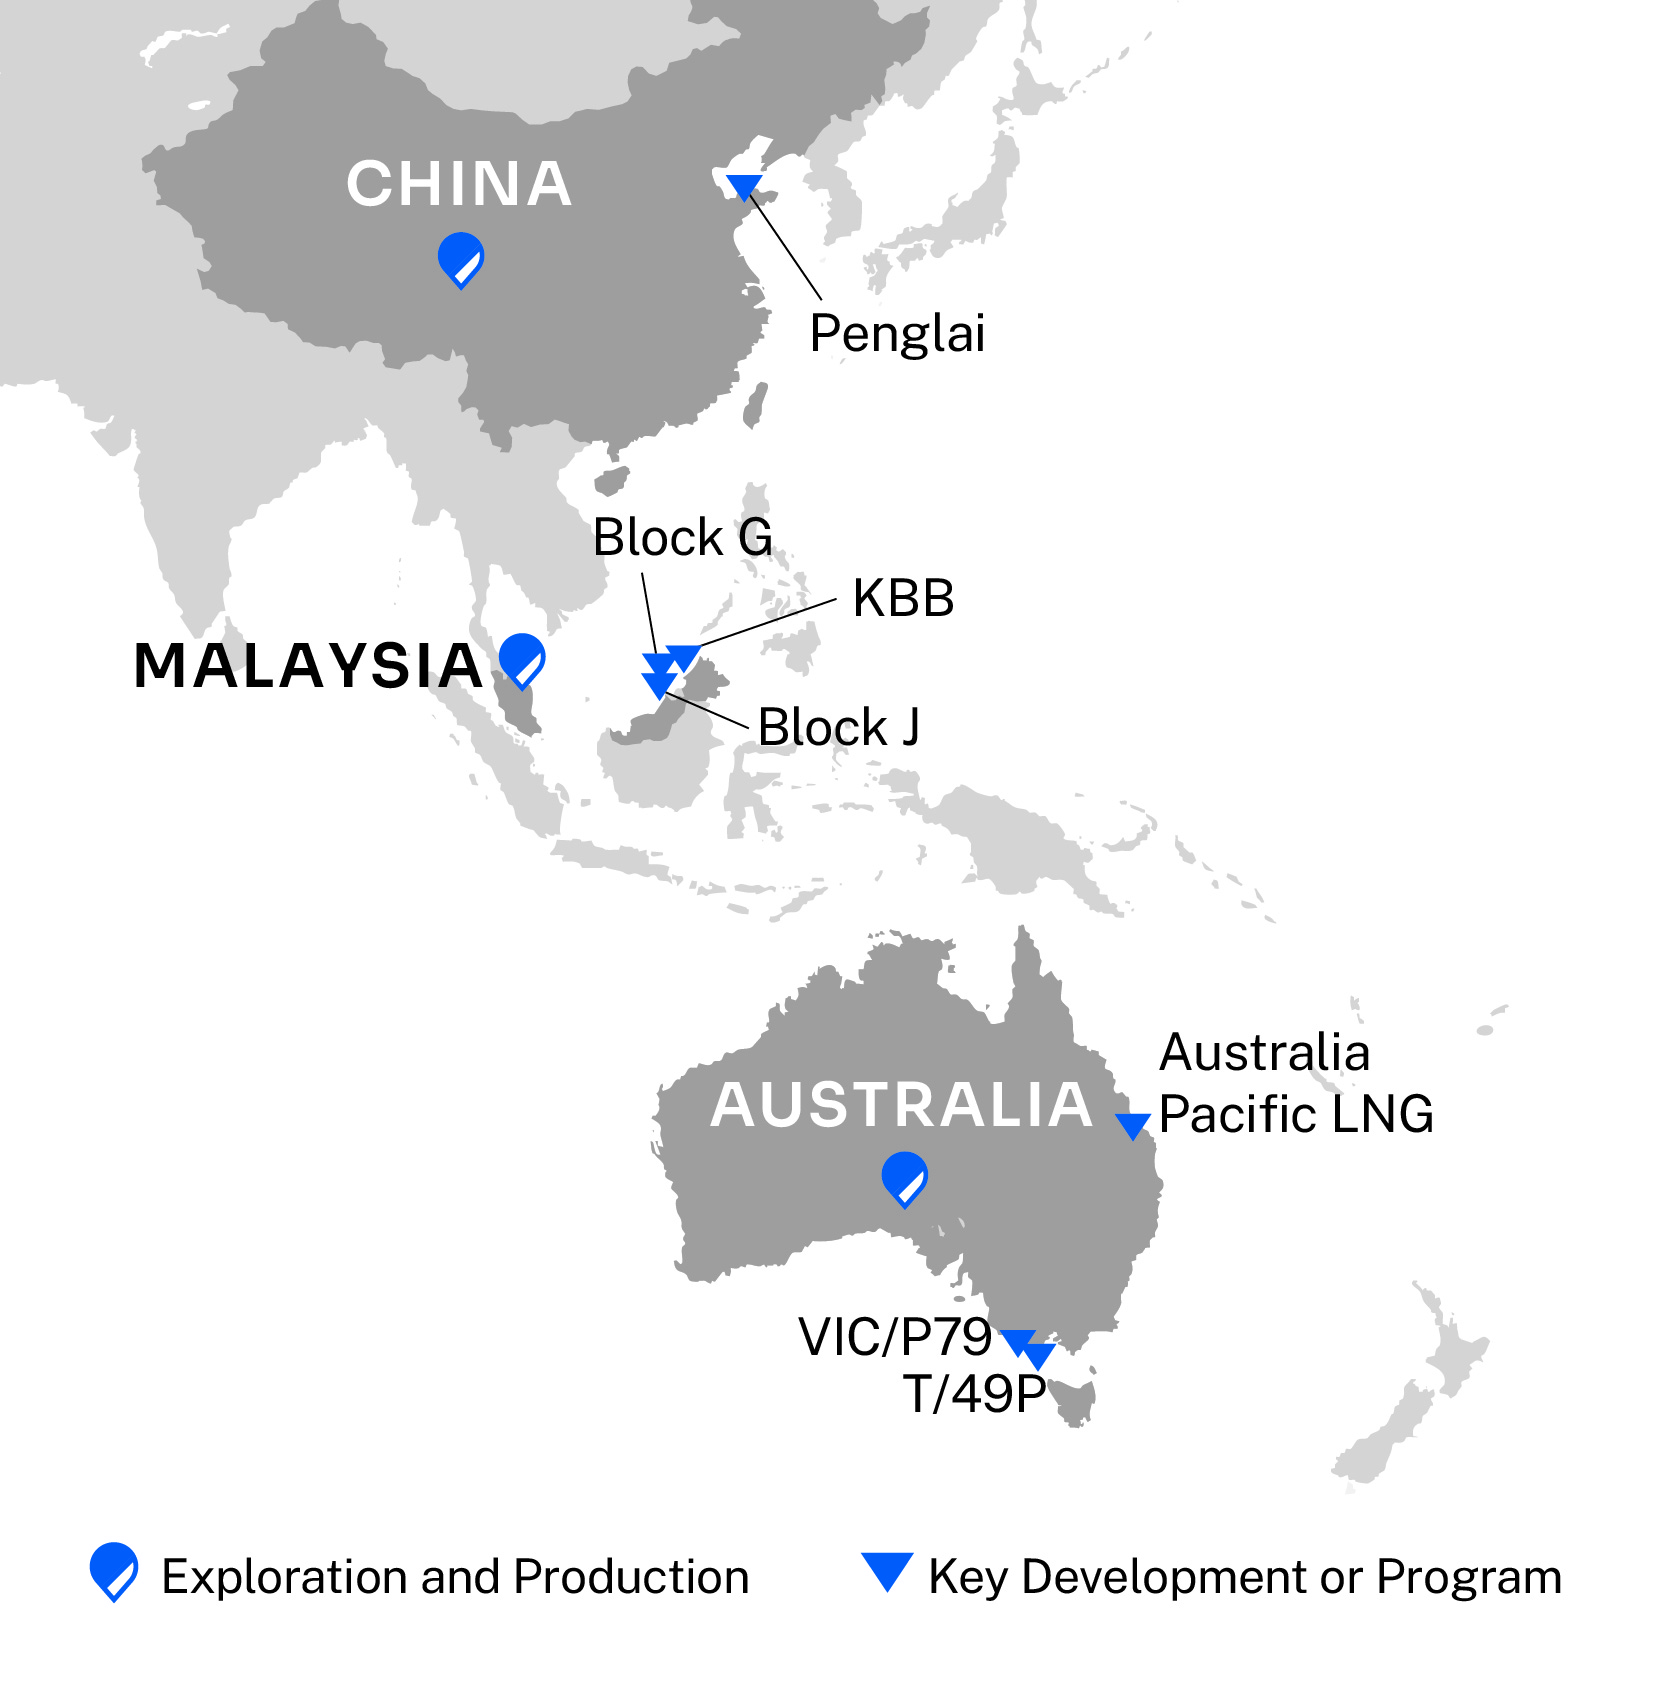
Asia Pacific
The Asia Pacific segment has exploration and production operations in China, Malaysia, Australia and commercial operations in China, Singapore and Japan. In 2024, operations in the Asia Pacific segment contributed four percent of our consolidated liquids production and two percent of our consolidated natural gas production.
Australia | | | | | | | | | | | | | | | | | | | | | | | | | | |
| | | | | 2024 |
| Interest | | Operator | | Crude Oil
MBD | NGL
MBD | Natural Gas
MMCFD | Total
MBOED |
| Average Daily Net Production | | | | | | | | |
| Australia Pacific LNG | 47.5 | % | | ConocoPhillips/Origin Energy | | — | | — | | 859 | | 143 | |
Australia Pacific LNG Pty Ltd. (APLNG), our joint venture with Origin Energy Limited (Origin) and China Petrochemical Corporation (Sinopec), is focused on producing CBM from the Bowen and Surat basins in Queensland, Australia, to supply the domestic gas market and convert the CBM into LNG for export. Origin operates APLNG’s upstream production and pipeline system, and we operate the downstream LNG facility, located on Curtis Island near Gladstone, Queensland, as well as the LNG export sales business.
We operate two fully subscribed 4.5 MTPA LNG trains. Approximately 3,500 net wells are ultimately expected to supply both the LNG sales contracts and domestic gas market. The wells are supported by gathering systems, central gas processing and compression stations, water treatment facilities and an export pipeline connecting the gas fields to the LNG facilities. The LNG is being sold to Sinopec under a 20-year sales agreement for 7.6 MTPA of LNG, and Japan-based Kansai Electric Power Co., Inc. under a 20-year sales agreement for approximately one MTPA of LNG.
Exploration
We own an 80 percent working interest in both Exploration Permit (T/49P) and (VIC/P79) located in the Otway Basin, Australia. During 2023, we executed a drilling consortium agreement with other operators in Australia and secured a contract for a semi-sub drilling rig. The proposed exploration program involves seabed surveys and drilling of exploration wells planned for 2025.
| | | | | |
| 11 | ConocoPhillips 2024 10-K |
China | | | | | | | | | | | | | | | | | | | | | | | | | | |
| | | | | 2024 |
| Interest | | Operator | | Crude Oil
MBD | NGL
MBD | Natural Gas
MMCFD | Total
MBOED |
| Average Daily Net Production | | | | | | | | |
| Penglai | 49.0 | % | | CNOOC | | 33 | | — | | — | | 33 | |
Penglai
The Penglai 19-3, 19-9 and 25-6 fields are located in the Bohai Bay Block 11/05 and are being developed in stages from large offshore platforms and a FPSO. Most of the crude oil produced from the block is sold to the domestic market in China, with the remainder exported to international markets.
Phase 3 consists of three wellhead platforms and a central processing platform. First production was achieved in 2018 and as of December 2024, all 186 wells have been completed and brought online.
Phase 4A consists of one wellhead platform. First production was achieved in 2020 and as of December 2024, all 62 wells have been completed and brought online.
Phase 4B consists of two wellhead platforms. First production was achieved in the fourth quarter of 2023. This project could include up to 144 new wells, 41 of which have been completed and brought online as of December 2024.
Phase 5 consists of two new wellhead platforms and four wellhead platform expansions. First production was achieved in the fourth quarter of 2024. This project could include up to 91 new wells, 10 of which have been completed and brought online as of December 2024.
Malaysia
| | | | | | | | | | | | | | | | | | | | | | | | | | |
| | | | | 2024 |
| Interest | | Operator | | Crude Oil
MBD | NGL
MBD | Natural Gas
MMCFD | Total
MBOED |
| Average Daily Net Production | | | | | | | | |
| Gumusut | 29.5 | % | | Shell | | 12 | | — | | — | | 12 | |
| Malikai | 35.0 | | | Shell | | 12 | | — | | — | | 12 | |
| Kebabangan (KBB) | 30.0 | | | KPOC | | 1 | | — | | 49 | | 9 | |
| Siakap North-Petai | 21.0 | | | PTTEP | | 1 | | — | | 1 | | 1 | |
| Total Malaysia | | | | | 26 | | — | | 50 | | 34 | |
We have varying stages of exploration, development and production activities across approximately 2.6 million net acres in Malaysia, with working interests in six PSCs. Four of these PSCs are located in waters off the eastern Malaysian state of Sabah: Block G, Block J, the Kebabangan Cluster (KBBC) and the Ubah Cluster, acquired in 2024. We also operate another two exploration blocks, Block WL4-00 and Block SK304, in waters off the eastern Malaysian state of Sarawak.
Block J
Gumusut
We own a 29.5 percent working interest in the unitized Gumusut Field. Development associated with Gumusut Phase 4, a four-well program targeting the Brunei acreage of the unitized Gumusut Field that straddles Malaysia and Brunei waters, completed drilling in 2024 with first oil anticipated in early 2025. The unitized Gumusut Field is operated on a FPS with oil evacuation via a pipeline to the Sabah Oil and Gas Terminal (SOGT) for tanker liftings.
| | | | | |
| ConocoPhillips 2024 10-K | 12 |
KBBC
We own a 30 percent working interest in the KBB, Kamunsu East and Kamunsu East Upthrown Canyon gas and condensate fields. KBBC was previously operated by a joint operating company, Kebabangan Petroleum Operating Company, and in January 2025, we became the sole operator of KBBC. There was no change to working interest as part of ConocoPhillips becoming sole operator.
KBB
Gas is transported from the KBB platform via pipeline for sale to the domestic gas market. Since 2019, KBB tied-in to a nearby third-party floating LNG vessel, which provided additional gas offtake capacity.
Block G
Malikai
We own a 35 percent working interest in Malikai. Malikai Phase 2 development first oil was achieved in February 2021. Malikai operates on a tension leg platform and pipes oil to the KBB platform for processing. Oil evacuation is via pipeline to SOGT for tanker liftings.
Siakap North-Petai
We own a 21 percent working interest in the unitized Siakap North-Petai (SNP) oil field. First oil from SNP Phase 2 was achieved in November 2021. The subsea system in the SNP oil field is tied back to a FPSO operated by PTTEP.
Exploration
We operate three exploration PSCs with 85 percent working interest in Block SK304, 50 percent working interest in Block WL4-00 and 35 percent working interest in the Ubah Cluster. Off the coast of Sarawak, offshore Malaysia, Block SK304 encompasses 1.8 million net acres and Block WL4-00 encompasses 0.3 million net acres. Off the coast of Sabah, offshore Malaysia near the KBBC, the Ubah Cluster encompasses 11 thousand net acres. We continue to evaluate these blocks and are using information from seismic and prior well results to help optimize future plans.
In 2021, we were awarded operatorship and an 85 percent working interest in Block SB405 encompassing 1.2 million net acres off the coast of Sabah, offshore Malaysia. A 3D seismic survey was acquired in 2022, and processing and evaluation work was completed in 2024. In the fourth quarter of 2024, we elected not to proceed to the second phase of exploration for SB405 PSC and relinquished the block.
Other International
The Other International segment includes interests in Colombia as well as contingencies associated with prior operations in other countries.
Colombia
We have an 80 percent working interest in the Middle Magdalena Basin Block VMM-3 extending over approximately 67,000 net acres. In addition, we have an 80 percent working interest in the VMM-2 Block, which extends over approximately 58,000 net acres and is contiguous to the VMM-3 Block. The contracts for this project are currently in force majeure due to the lack of a defined environmental licensing required for the execution of unconventional exploratory activities. Additionally, the government of Colombia supports a ban on such activities.
Venezuela
For discussion of our contingencies in Venezuela, see Note 10. | | | | | |
| 13 | ConocoPhillips 2024 10-K |
Other
Marketing Activities
Our Commercial organization manages our worldwide commodity portfolio, which includes natural gas, crude oil, bitumen, NGLs, LNG and power. Marketing activities are performed through offices in the U.S., Canada, Europe and Asia. In marketing our production, we attempt to minimize flow disruptions, maximize realized prices and manage credit-risk exposure. Commodity sales are generally made at prevailing market prices at the time of sale. We also purchase and sell third-party commodity volumes to better position the company to satisfy customer demand while fully utilizing transportation and storage capacity.
Crude Oil, Bitumen and NGLs
Our crude oil, bitumen and NGL revenues are derived from production in the U.S., Canada, Asia, Africa and Europe. These commodities are primarily sold under contracts with prices based on market indices, adjusted for location, quality and transportation.
Natural Gas
Our natural gas production, along with third-party purchased gas, is primarily marketed in the U.S., Canada and Europe. Our natural gas is sold to a diverse client portfolio, which includes local distribution companies; gas and power utilities; large industrials; independent, integrated or state-owned oil and gas companies; as well as marketing companies. To reduce our market exposure and credit risk, we also transport natural gas via firm and interruptible transportation agreements to major market hubs.
LNG
We have producing equity LNG facilities located in Australia, Qatar and Equatorial Guinea. We also have a 30 percent direct equity holding in the Port Arthur LNG (PALNG) facility, which is scheduled to start up in 2027. As part of our LNG strategy to build a dynamic LNG portfolio and expand our footprint across the LNG value chain, in the future we have LNG offtake due to start up in the U.S. Gulf Coast and the west coast of Mexico with approximately 7.4 MTPA, and currently have a total regasification capacity of 5.2 MTPA at terminals in Belgium, Germany and the Netherlands. We continue to progress discussions across all major LNG producing and consuming regions and markets to further add high-quality positions to our portfolio. See Note 3. Emergency Response Partnerships
Emergency response partnerships are vital for effective disaster management. By uniting government agencies, non-profits, private companies and community groups, these partnerships enhance preparedness, response and recovery efforts. We maintain memberships in several global response and containment partnerships as a key element of our emergency response preparedness program, complementing our internal response resources.
Oil Spill Response Organizations (OSROs)
We maintain memberships in several OSROs, many of which are not-for-profit cooperatives owned by member companies. We may actively participate in these organizations as members of the board of directors, steering committees, work groups or other supporting roles. In North America, our primary OSROs include the Marine Spill Response Corporation for the continental U.S. and Alaska Clean Seas and Ship Escort/Response Vessel System for the Alaska North Slope and Prince William Sound, respectively. Internationally, we maintain memberships in various OSROs, including Oil Spill Response Limited, the Norwegian Clean Seas Association for Operating Companies, the Australian Marine Oil Spill Center and Petroleum Industry of Malaysia Mutual Aid Group.
| | | | | |
| ConocoPhillips 2024 10-K | 14 |
Technology
We have several technology programs that improve our ability to develop unconventional reservoirs, increase recovery from our legacy fields, improve the efficiency of our exploration program, produce heavy oil economically with lower emissions and implement sustainability measures.
LNG Liquefaction Technology
We are the second-largest LNG liquefaction technology provider globally. Our Optimized Cascade® LNG liquefaction technology has been licensed for use in 28 LNG trains around the world, with FEED studies ongoing for additional trains.
Low Carbon Technologies
Our multi-disciplinary Low Carbon Technologies organization's remit includes supporting our operational emissions reductions objectives, understanding the alternative energy landscape and prioritizing opportunities for future competitive investment. To help achieve our targets, the Low Carbon Technologies organization works with our business units to develop and implement Scope 1 and 2 emissions reduction initiatives and identify potential technology solutions for hard-to-abate emissions. We continue to focus on implementing emissions reduction projects across our global portfolio, including operational efficiency measures and methane and flaring reductions. For example, since 2021 we have conducted CCS and electrification studies, initiated zero/low emission equipment design enhancements, installed mechanisms to continuously monitor and detect methane emissions and implemented operation changes to reduce or eliminate flaring and methane venting volumes.
We also continue to evaluate low-carbon opportunities for future competitive investment. For example, since 2021:
•We evaluated carbon dioxide storage sites primarily along the U.S. Gulf Coast, progressed land acquisition efforts and business development work, drilled two appraisal wells and advanced engineering studies for multiple opportunities.
•We evaluated hydrogen opportunities in the U.S. and Asia Pacific regions. As a result of hydrogen and ammonia markets not developing at a pace required to support further investment, we decided to suspend our evaluation of a low-carbon ammonia production facility on the U.S. Gulf Coast.
Delivery Commitments
We sell crude oil and natural gas from our producing operations under a variety of contractual arrangements, some of which specify the delivery of a fixed and determinable quantity. Our commercial organization also enters into natural gas sales contracts where the source of the natural gas used to fulfill the contract can be the spot market or a combination of our reserves and the spot market. Worldwide, we are contractually committed to deliver approximately 675 billion cubic feet of natural gas and 253 million barrels of crude oil in the future. These contracts have various expiration dates through the year 2034. We have a variety of options to fulfill our delivery commitments including third-party purchases, as supported by our gas management and power supply agreements, proved developed reserves and PUDs. See the disclosure on “Proved Undeveloped Reserves” in the “Supplementary Data - Oil and Gas Operations” section following the Notes to Consolidated Financial Statements, for information on the development of PUDs. Competition
ConocoPhillips is one of the world’s leading E&P companies based on both production and reserves, with a globally diversified asset portfolio. We compete with private, public and state-owned companies in all facets of the E&P business. Some of our competitors are larger and have greater resources. Each of our segments is highly competitive, with no single competitor, or small group of competitors, dominating.
We compete with numerous other companies in the industry, including state-owned companies, to locate and obtain new sources of supply and to produce oil, bitumen, LNG, NGLs and natural gas in an efficient, cost-effective manner. We deliver our production into the worldwide commodity markets. Principal methods of competing include geological, geophysical and engineering research and technology; experience and expertise; equipment and personnel; economic analysis in connection with portfolio management and safely operating oil and gas producing properties.
| | | | | |
| 15 | ConocoPhillips 2024 10-K |
Human Capital Management
At ConocoPhillips, our strategy, performance, culture and reputation are fueled by our workforce. Attracting, retaining and developing a world-class workforce is a competitive imperative within our complex industry. Our human capital management (HCM) approach is based on our core SPIRIT Values – Safety, People, Integrity, Responsibility, Innovation and Teamwork – which set the tone for our interactions with all stakeholders. We believe a safe organization is a successful organization and we prioritize personal and process safety across the company.
Our Executive Leadership Team (ELT) and Board of Directors help to set our HCM strategy and drive accountability for meaningful progress. Our HCM programs are managed by our human resources function with support from business leaders across the company and are regularly reviewed by the Board of Directors. Our efforts are built around three pillars: a compelling culture, attracting a world-class workforce and valuing our people.
At year-end 2024, we had approximately 11,800 employees in 14 countries. Tables of 2024 employees by country and demographics are shown below:
| | | | | |
| 2024 Employees by Country | Percent of Total |
| U.S. | 67 | % |
| Norway | 14 | |
| Canada | 8 | |
| |
| Australia | 3 | |
| U.K. | 3 | |
| |
| Other Global Locations | 5 | |
| 100 | % |
2024 Employees by Demographics
| | | | | | | | | | | | | | | | | |
| Global | | U.S. |
| Male | Female | | White | POC* |
| All Employees | 73 | % | 27 | % | | 67 | % | 33 | % |
| All Leadership | 74 | | 26 | | | 75 | | 25 | |
| Top Leadership | 74 | | 26 | | | 81 | | 19 | |
| Junior Leadership | 74 | | 26 | | | 74 | | 26 | |
*"POC" refers to People of Color or racial and ethnic minorities self-reported in the U.S.
A Compelling Culture
How we do our work is what sets us apart and drives our performance. As our industry evolves, we need a workforce equipped to address new opportunities and challenges. Our success depends on our people. Effectively engaging, developing and rewarding our employees is a priority for us. Together, we deliver strong performance while embracing our core cultural attributes.
Health, Safety and Environment
Our HSE organization sets expectations and provides tools and assurance to our workforce to promote and achieve HSE excellence. We manage and assure ConocoPhillips HSE policies, standards and practices, to help ensure business activities are consistently safe, healthy and conducted in an environmentally and socially responsible manner across the globe. Each business unit manages its local operational risks with particular attention to process safety, occupational safety and environmental and emergency preparedness risks. Objectives, targets and deadlines are set and tracked annually to drive strong HSE performance. Progress is tracked and reported to our ELT and the Board of Directors. Corporate HSE audits are conducted on business units and staff groups to ensure conformance with ConocoPhillips HSE policies, standards and practices. If improvement actions are identified, they are tracked to completion.
| | | | | |
| ConocoPhillips 2024 10-K | 16 |
We continuously look for ways to operate more safely, efficiently and responsibly. We focus on reducing human error by emphasizing interaction among people, equipment and work processes. We believe our HSE policies such as Life Saving Rules, Process Safety Fundamentals, safety procedures and our stop work policy can reduce the likelihood and severity of unexpected incidents. We conduct thorough investigations of all serious incidents to understand the root cause and share lessons learned globally to improve our facility designs, procedures, training and maintenance programs. It is important that we drive an HSE culture of continuous learning and improvement, refine our existing HSE processes and tools and enhance our commitment to safe, efficient and responsible operations.
Attracting a World-Class Workforce
Our continued success requires a skilled global workforce. Our SPIRIT Values help to cultivate an inclusive environment where everyone can contribute, promoting innovation and leading to better business outcomes. This helps us attract a workforce equipped to address new opportunities and challenges that we face in a complex industry. We recruit experienced hires to help us sustain a broad range of expertise and partner with universities and organizations to create a pipeline of early-career talent. We strive to ensure fair and consistent practices in our recruitment process and conduct talent assessments to meet our business needs.
We monitor recruitment metrics and track voluntary turnover to guide our retention activities.
| | | | | |
| 2024 Hiring & Attrition Metrics | Percent of Total |
| U.S. university hire acceptance rate | 75 | % |
| U.S. interns acceptance rate | 74 | |
| Global hiring - Women/Men | 25/75 |
| U.S. hiring - U.S. POC/U.S. White | 41/59 |
| Total voluntary attrition | 4 | |
Valuing our People
Employee Engagement and Development
We engage and develop our workforce through on-the-job learning, formal training, ongoing feedback, coaching and mentoring. Additionally, we use a performance management program focused on merit, objectivity, credibility and transparency. The program includes broad stakeholder feedback, real-time monetary and non-monetary recognition and a formal "how" rating to assess behavior to ensure they align with our SPIRIT Values.
Skills-based Talent Management Teams (TMTs) guide employee development and career progression, help identify workforce planning needs and assess the availability of critical skill sets. Succession planning is a top priority for management and the Board of Directors to ensure talent readiness and availability for leadership roles.
We measure and assess employee satisfaction and engagement through periodic employee engagement surveys. Our leaders review survey feedback to guide priorities and goals.
Compensation, Benefits and Well-Being
We offer competitive, performance-based compensation packages and have global, equitable pay practices. Our compensation programs generally include base pay, the annual Variable Cash Incentive Program (VCIP) and, for eligible employees, the Restricted Stock Unit (RSU) program. Our retirement and savings plans support employees' financial futures and are competitive within local markets.
We routinely benchmark our global compensation and benefits programs to ensure they are competitive and meet the needs of our employees. We provide flexible work schedules and competitive time off, including parental leave in many locations. We also provide coverage for disability support, elder care and childcare, including onsite childcare, where access locally is a challenge.
Our global wellness programs include biometric screenings and fitness challenges. All employees have access to our employee assistance program, and many of our locations offer custom mental well-being programs.
| | | | | |
| 17 | ConocoPhillips 2024 10-K |
General
The environmental information contained in Management’s Discussion and Analysis of Financial Condition and Results of Operations beginning on page 55 under the caption "Environmental" and beginning on page 57 under the caption “Climate Change” is incorporated herein by reference. It includes information on expensed and capitalized environmental costs for 2024 and those expected for 2025 and 2026. Website Access to SEC Reports
Our internet website address is www.conocophillips.com. Information contained on our internet website is not part of this report on Form 10-K.
Our Annual Reports on Form 10-K, Quarterly Reports on Form 10-Q, Current Reports on Form 8-K and any amendments to these reports filed or furnished pursuant to Section 13(a) or 15(d) of the Securities Exchange Act of 1934 are available on our website, free of charge, as soon as reasonably practicable after such reports are filed with, or furnished to, the SEC. Alternatively, you may access these reports at the SEC’s website at www.sec.gov.
| | | | | |
| ConocoPhillips 2024 10-K | 18 |
Item 1A. Risk Factors
You should carefully consider the following risk factors in addition to the other information included in this Annual Report on Form 10-K. These risk factors are not the only risks we face. Our business could also be affected by additional risks and uncertainties not currently known to us or that we currently consider to be immaterial. If any of these risks or other risks that are yet unknown or currently considered immaterial were to occur, our business, operating results and financial condition, as well as the value of an investment in our common stock, could be materially and adversely affected.
Risks Related to Our Industry
Our operating results, our ability to execute on our strategy and the carrying value of our assets are exposed to the effects of volatile commodity prices or prolonged periods of low commodity prices.
Among the most significant factors impacting our revenues, operating results and future rate of growth are the sales prices for crude oil, bitumen, LNG, natural gas and NGLs. These prices are tied to market prices that can fluctuate widely due to factors beyond our control. For example, over the course of 2024, WTI crude oil prices ranged from a high of $87 per barrel in April to a low of $66 per barrel in September. Given the volatility in commodity price drivers and the worldwide political and economic environment, including potential economic slowdowns or recessions, unexpected shocks to supply and demand resulting from future global health crises, such as those that were experienced in connection with the COVID-19 pandemic, or increased uncertainty generated by armed hostilities and geopolitical tension in various oil-producing regions around the globe, prices for crude oil, bitumen, LNG, natural gas and NGLs may continue to be volatile.
Prolonged periods of low commodity prices could have a material adverse effect on our revenues, operating income, cash flows and liquidity, and may also affect the amount of dividends we elect to declare and pay on our common stock and the amount of shares we elect to acquire as part of our share repurchase program and the timing of such repurchases.
Lower prices may also limit the amount of reserves we can produce economically, thus adversely affecting our proved reserves and reserve replacement ratio and accelerating the reduction in our existing proved reserve levels as we continue production from upstream fields. Prolonged depressed prices may affect strategic decisions related to our operations, including decisions to reduce capital investments or curtail operated production.
Significant reductions in crude oil, bitumen, LNG, natural gas and NGLs prices could also require us to reduce our capital expenditures, impair the carrying value of our assets or discontinue the classification of certain assets as proved reserves. Although it is not reasonably practicable to quantify the impact of any future impairments or estimated change to our unit-of-production rates at this time, our results of operations could be adversely affected as a result.
If we do not successfully develop resources, the scope of our business will decline, and our financial condition and results of operations may be adversely affected.
As we produce crude oil, bitumen, natural gas and NGLs from our existing portfolio, the amount of our remaining reserves declines. If we do not successfully replace the resources we produce with good prospects for future organic development or through acquisitions, our business will decline. In addition, our ability to successfully develop our reserves depends on our achievement of a number of operational and strategic objectives, some aspects of which are beyond our control, including navigating political and regulatory challenges to obtain and renew rights to develop and produce hydrocarbons; reservoir optimization; bringing long-lead time, capital intensive projects to completion on budget and on schedule; and efficiently and profitably operating mature properties. If we are not successful in developing the resources in our portfolio, our financial condition and results of operations may be adversely affected.
The exploration and production of oil and gas is a highly competitive industry.
The exploration and production of crude oil, bitumen, natural gas and NGLs is a highly competitive business. We compete with private, public and state-owned companies in all facets of the exploration and production business, including locating, acquiring and developing new sources of supply and producing crude oil, bitumen, natural gas and NGLs in an efficient, cost-effective manner. In addition, we anticipate the oil and gas industry will face additional competition from alternative fuels. We must also compete for the materials, equipment, services, employees and other personnel (including geologists, geophysicists, engineers and other specialists) necessary to conduct our business. If we are not successful in any facet of this competition, our financial condition and results of operations may be adversely affected.
| | | | | |
| 19 | ConocoPhillips 2024 10-K |
Our ability to successfully execute on our plans to reduce operational GHG emissions intensity is subject to a number of risks and uncertainties and such reductions may be costly and challenging to achieve.
Our framework for managing climate-related business risk is set out in our Climate Risk Strategy, which describes our strategic flexibility, approach to reducing Scope 1 and 2 emissions intensity, technology choices and engagement efforts. Among other things, we have set near- and medium-term GHG intensity reduction targets, as well as targets around flaring and methane. Our ability to achieve the stated targets, goals and ambitions within the Climate Risk Strategy's framework is subject to a number of risks and uncertainties beyond our control, including government policies and markets, acceptance of carbon capture technologies, development of markets and potential permitting and regulatory changes, all of which may impair our ability to execute on current or future plans. In addition, the pace of development of effective emissions measurement and abatement technologies, and the actual pace of development may be inadequate, or the technologies actually developed may be insufficient to allow us to achieve our stated targets, goals and ambitions.
Furthermore, executing our Climate Risk Strategy could be costly, is likely to encounter unforeseen obstacles, will proceed at varying paces and may be accomplished in a manner that we cannot predict at this time. We expect to be required to purchase emission credits and/or offsets in the future. There may be an insufficient supply of offsets, and we could incur increasingly greater expenses related to our purchase of such offsets. Even if we are able to acquire an adequate amount of such offsets at satisfactory prices, investors, regulators or other third parties may not perceive this practice as an acceptable means of achieving our emission reduction goals. As advanced technologies are developed to accurately measure emissions, we may be required to revise our emissions estimates and reduction goals or otherwise revise aspects of our Climate Risk Strategy. We may be adversely affected and potentially need to reduce economic end-of-field life of certain assets and impair associated net book value due to the emissions intensity of some of our assets. Even if we meet our goals, our efforts may be characterized as insufficient.
In early 2021, we established a multidisciplinary Low Carbon Technologies organization with the remit of supporting our emissions reduction objectives, understanding the alternative energy landscape and prioritizing opportunities for future competitive investment. Such potential investments may expose us to numerous financial, legal, operational, reputational and other risks. While we perform a thorough analysis on these investments, the related technologies and markets are at early stages of development and we do not yet know what rate of return we will achieve, if any, and we may suspend our evaluation or investment if we determine that applicable markets have not developed at the pace required to support further investment. For example, as a result of the hydrogen and ammonia markets not developing at a pace required to support further investment, in 2024 we decided to suspend our evaluation of a low-carbon ammonia production facility on the U.S. Gulf Coast. Furthermore, we may not be able to scale potential investments. The success of our low-carbon strategy will depend in part upon the cooperation of government agencies, the support of stakeholders, the development of relevant markets for low carbon fuels, our ability to research and forecast potential investments, willingness of industry partners to collaborate and our ability to apply our existing strengths and expertise to new technologies, projects and markets.
Estimates of crude oil, bitumen, natural gas and NGL reserves are imprecise and may be subject to revision, and any material change in the factors and assumptions underlying our estimates of crude oil, bitumen, natural gas and NGL reserves could impair the quantity and value of those reserves.
Our proved reserve information included in this annual report represents management’s best estimates based on assumptions, as of a specified date, of the volumes to be recovered from underground accumulations of crude oil, bitumen, natural gas and NGLs. Such volumes cannot be directly measured, and the estimates and underlying assumptions used by management are subject to substantial risk and uncertainty. Any material changes in the factors and assumptions underlying our estimates of these items could result in a material negative impact to the volume of reserves reported or could cause us to incur impairment expenses on property associated with the production of those reserves. Future reserve revisions could also result from changes in, among other things, governmental regulation and commodity prices. For more information on estimates used, see the "Critical Accounting Estimates" section of Management's Discussion and Analysis of Financial Condition and Results of Operations. | | | | | |
| ConocoPhillips 2024 10-K | 20 |
Our business may be adversely affected by price controls; government-imposed limitations on production or exports of crude oil, bitumen, LNG, natural gas and NGLs; or the unavailability of adequate gathering, processing, compression, transportation, and pipeline facilities and equipment for our production of crude oil, bitumen, natural gas and NGLs.
As discussed herein, our operations are subject to extensive governmental regulations across numerous jurisdictions. From time to time, regulatory agencies have imposed price controls and limitations on production by restricting the rate of flow of crude oil, bitumen, natural gas and NGLs wells below actual production capacity. Similarly, in response to increased domestic energy costs, circumstances determined to be in the economic or other interest of the country, or a declared national emergency, governments could restrict the export or import of our products which would adversely impact our business. For example, in January 2024, in response to concerns from environmental groups, the U.S. announced a temporary pause on new authorizations of certain LNG exports. The pause was subsequently lifted in January 2025. This pause and other difficulties in the regulatory approval processes may have an extended adverse impact on our global LNG business. Furthermore, because legal requirements are frequently changed and subject to interpretation, we cannot predict whether future restrictions on our business may be enacted or become applicable to us.
Our ability to sell and deliver the crude oil, bitumen, LNG, natural gas and NGLs that we produce also depends on the availability, proximity and capacity of gathering, processing, compression, transportation and pipeline facilities and equipment, as well as any necessary diluents to prepare our crude oil, bitumen, LNG, natural gas and NGLs for transport. The facilities, equipment and diluents we rely on may be temporarily unavailable to us due to market conditions, extreme weather events, permitting delays and other regulatory matters, mechanical reasons or other factors or conditions, many of which are beyond our control. In addition, in certain newer plays, the capacity of necessary facilities, equipment and diluents may not be sufficient to accommodate production from existing and new wells, and construction and permitting delays, permitting costs and regulatory or other constraints could limit or delay the construction, manufacture or other acquisition of new facilities and equipment. If any facilities, equipment or diluents, or any of the transportation methods and channels that we rely on become unavailable for any period of time, we may incur increased costs to transport our crude oil, bitumen, LNG, natural gas and NGLs for sale; we may be forced to curtail our production of crude oil, bitumen, natural gas or NGLs, or we may not be able to meet all the objectives in our Climate Risk Strategy, such as reducing routine flaring.
Our ability to manage risk or influence outcomes in joint ventures may be constrained.
We conduct many of our operations through joint ventures in which another joint venture partner is the operator or we may not have majority control. In these cases, the economic, business, or legal interests or goals of the operator or the voting majority may be inconsistent with ours, and we may not be able to influence the decision making or outcomes to align with our interests or goals. Failure by an operator or a voting majority, with whom we have a joint venture interest, to adequately manage the risks associated with any operations could have an adverse effect on the financial condition or results of operations of our joint ventures and, in turn, our business and operations.
Our operations are subject to hazards and risks that require significant and continuous oversight.
Our operations are subject to a variety of hazards and risks that require significant and continuous oversight, such as the monitoring, prevention or mitigation of or protection from explosions, fires, product spills, severe weather, geological events, global health crises, such as epidemics and pandemics, labor disputes, geopolitical tensions, armed hostilities, terrorist or piracy attacks, sabotage, civil unrest or cyberattacks. Our operations are subject to additional hazards concerning exposure to and potential release of pollutants and toxic substances, as well as other environmental hazards and risks. For example, offshore activities may pose incrementally greater technological challenges, operating risks and potential for adverse consequences from operational failures because of complex subsurface conditions such as higher reservoir pressures, water depths and metocean conditions. All such hazards could result in loss of human life, significant property and equipment damage, environmental pollution, impairment of operations, substantial losses to us and damage to our reputation. Our business and operations may be disrupted if we do not respond, or are perceived not to respond, in an appropriate manner to any of these hazards and risks or any other major crisis or if we are unable to efficiently restore or replace affected operational components and capacity. Countermeasures to address global health crises, epidemics or pandemics may result in reduced demand for our products; disruptions to our supply chain, the global economy or financial or commodity markets; disruptions in our contractual arrangements with our service providers, suppliers and other counterparties; failures by our suppliers, contract manufacturers, contractors, joint venture partners and external business partners, to meet their obligations to us; reduced workforce productivity; and voluntary or involuntary curtailments. Further, our insurance may not be adequate to compensate us for all resulting losses described above, and the cost to obtain adequate coverage may increase for us in the future or may not be available.
| | | | | |
| 21 | ConocoPhillips 2024 10-K |
In addition, although we design and operate our business operations to accommodate expected climatic conditions, to the extent there are significant changes in the earth's climate, such as more severe or frequent weather conditions in the markets where we operate or the areas where our assets reside, we could incur increased expenses, our operations and supply chain could be adversely impacted and demand for our products could fall.
Any of these factors, or other cascading effects of such factors, could materially increase our costs; negatively impact our revenues or ability to implement and advance our Climate Risk Strategy; and damage our financial condition, results of operations, cash flows and liquidity position. The full extent and duration of any such impacts cannot be predicted at this time because of the lack of certainty surrounding their sources, causes and outcomes.
Legal and Regulatory Risks
We expect to continue to incur substantial capital expenditures and operating costs as a result of our compliance with existing and future environmental laws and regulations.
Our business is subject to numerous laws and regulations relating to the protection of the environment, which are expected to continue to have an increasing impact on our operations. For a description of the most significant of these environmental laws and regulations, see the “Contingencies—Environmental”, “—Climate Change” and "—Company Response to Climate-Related Risks" sections of Management’s Discussion and Analysis of Financial Condition and Results of Operations. These laws and regulations continue to increase in both number and complexity and affect our operations with respect to, among other things: •Permits required in connection with exploration, drilling, production and other activities, including those issued by national, subnational and local authorities;
•The discharge of pollutants into the environment;
•Emissions into the atmosphere, such as nitrogen oxides, sulfur dioxide, mercury and GHG emissions, including methane and carbon dioxide;
•Carbon taxes;
•The handling, use, storage, transportation, disposal and cleanup of hazardous materials and hazardous and nonhazardous wastes;
•The dismantlement, abandonment and restoration of historic properties and facilities at the end of their useful lives; and
•Exploration and production activities in certain areas, such as offshore environments, arctic fields, oil sands reservoirs and unconventional plays.
We have incurred and will continue to incur substantial capital, operating and maintenance, and remediation expenditures as a result of these laws and regulations. In addition, to the extent these expenditures are assumed by a buyer as a result of a disposition, it may result in our incurring substantial costs if the buyer is unable to satisfy these obligations. Any actual or perceived failure by us to comply with existing or future laws, regulations and other requirements could result in administrative or civil penalties, criminal fines, other enforcement actions or third-party litigation against us. To the extent these expenditures, as with all costs, are not ultimately reflected in the prices of our products, our business, financial condition, results of operations and cash flows in future periods, as well as our ability to implement and advance our Climate Risk Strategy could be adversely affected.
Existing and future laws, regulations and internal initiatives relating to global climate change, such as limitations on GHG emissions or provisions aimed at reducing such emissions, may impact or limit our business plans, result in significant expenditures, promote alternative uses of energy or reduce demand for our products.
Continuing political and societal attention to the issue of global climate change has resulted in both existing and pending international agreements and national, regional or local legislation and regulatory measures to limit GHG emissions, such as cap and trade regimes, specific emission standards, carbon taxes, restrictive permitting, increased fuel efficiency standards and incentives or mandates for renewable and alternative energy. Although we may support the intent of legislative and regulatory measures aimed at addressing climate-related risks, the specifics of how and when they are enacted could result in a material adverse effect to our business, financial condition, results of operations and cash flows in future periods as well as our ability to implement and advance our Climate Risk Strategy.
| | | | | |
| ConocoPhillips 2024 10-K | 22 |
For example, in 2024, New York and Vermont passed legislation seeking to hold certain energy companies financially responsible for state climate change mitigation and adaptation measures, following the "polluter pays" model of existing Superfund laws. This responsibility may include paying into a fund for infrastructure repairs and recovery from extreme weather events that would otherwise be covered by the government. While only two U.S. states have enacted such laws to date, other states have introduced similar measures, and it is likely that more states will consider a similar approach. Compliance with such legislation may expose us to significant additional liabilities.
Furthermore, in December 2023, the EPA published a final rule that revises the regulations governing, among other things, the emission of methane and volatile organic compounds from new oil and gas production facilities and emission guidelines for states to use when revising Clean Air Act implementation plans to limit methane emissions from existing oil and gas facilities. Also pursuant to the Inflation Reduction Act of 2022, the EPA published certain rules in 2024 to facilitate the determination and payment of a charge on methane emissions from selected facilities in the oil and natural gas industry, including many of the facilities operated by ConocoPhillips. These final rules could result in additional capital expenditures and compliance, operating and maintenance costs, any of which may have an adverse effect on our business and results of operations.
Additionally, in 2023, at the international community at the 28th Conference of the Parties (COP28), nearly 200 countries, including most of the countries in which we operate, renewed their commitment to deliver on the aims of the 2015 Paris Agreement. COP28 included a decision on the world's first 'global stocktake' to ratchet up climate action before the end of the decade — including a goal to triple renewable energy capacity by 2030 — and for the first time its final agreement explicitly recommended "transitioning away from fossil fuels in the energy system."
The implementation of current agreements and regulatory or judicial measures, as well as any future agreements or measures addressing climate change and GHG emissions, may adversely increase our capital and operating expenses, impact the demand for our products, impose taxes on our products or operations, or require us to purchase emission credits or reduce emissions of GHGs from our operations. As a result, we may incur substantial capital expenditures and compliance, operating, maintenance and remediation costs, any of which may have an adverse effect on our business and results of operations.
For more information on legislation or precursors for possible regulation relating to global climate change that affect or could affect our operations and a description of the company's response, see the "Contingencies—Climate Change” and "—Company Response to Climate-Related Risks" sections of Management’s Discussion and Analysis of Financial Condition and Results of Operations. Broader investor and societal attention to and efforts to address global climate change may limit who can do business with us or our access to financial markets and could subject us to litigation.
Increasing attention to global climate change has also resulted in pressure from and upon stockholders, financial institutions and other financial market participants to potentially limit or discontinue investments, insurance and funding to oil and gas companies. For example, a significant number of financial institutions have pledged to meet the goal of net zero by 2050, as well as setting interim targets for 2030 or earlier. While these targets do not prohibit financial sector stakeholders from doing business with oil and gas companies, stakeholders may self-impose limits. Conversely, we also face pressure from some in the investment community and certain public interest groups to limit the focus on ESG in our decision-making, arguing that ESG considerations do not relate to financial outcomes. As public pressure continues to mount on the financial sector, our costs of capital may increase.
Furthermore, increasing attention to global climate change has resulted in an increased likelihood of governmental investigations and private litigation, which could increase our costs or otherwise adversely affect our business. Beginning in 2017 and continuing through 2024, cities, counties, governments and other entities in several states/territories in the U.S. have filed lawsuits against oil and gas companies, including ConocoPhillips, seeking compensatory damages and equitable relief to abate alleged climate change impacts. Additional lawsuits with similar allegations are expected to be filed. The amounts claimed by plaintiffs are unspecified and the legal and factual issues involved in these cases are unprecedented. We believe these lawsuits are factually and legally meritless and are an inappropriate vehicle to address the challenges associated with climate change, and we will vigorously defend against such lawsuits. The ultimate outcome and impact to us cannot be predicted with certainty, and we expect to incur substantial legal costs associated with defending these and similar lawsuits in the future. We could also receive lawsuits alleging a failure or lack of diligence to meet our publicly stated ESG goals or alleging misrepresentation related to our ESG activity.
| | | | | |
| 23 | ConocoPhillips 2024 10-K |
Political and economic developments could damage our operations and materially reduce our profitability and cash flows.
Actions of the U.S., state, local and foreign governments, through sanctions, tax, tariffs and other legislation, executive orders and commercial restrictions, could reduce our operating profitability both in the U.S. and abroad. In certain locations, restrictions on our operations; leasing restrictions; special taxes or tax assessments; tariffs; and payment transparency regulations that could require us to disclose competitively sensitive information or might cause us to violate non-disclosure laws of other countries have been imposed or proposed by governments or certain interest groups. In addition, we may face regulatory changes in the U.S. including, but not limited to, the enactment of tax law changes that adversely affect the fossil fuel industry, new methane emissions standards, requirements restricting or prohibiting flaring and subsurface water disposal, more stringent environmental impact studies and reviews and policies inhibiting or curtailing LNG or crude oil exports. Similar regulatory shifts, including attendant higher costs and market access constraints, may also occur in international jurisdictions in which we currently operate or seek to operate.
Hydraulic fracturing, an essential completion technique that facilitates production of oil and natural gas otherwise trapped in lower permeability rock formations, has historically attracted political and regulatory scrutiny. A range of local, state, federal and national laws and regulations currently govern, constrain or prohibit hydraulic fracturing in some jurisdictions. New or more stringent permitting, disclosure or other regulatory requirements on hydraulic fracturing or other oil and natural gas operations, including subsurface water disposal, could result in increased costs, operating restrictions or operational delays or could limit the ability to develop oil and natural gas resources.
In addition, certain interest groups have also proposed ballot initiatives, contested lease sales and challenged project permits, for example, to restrict oil and natural gas development generally as well as specific projects, including the Willow project in Alaska. In the event that ballot initiatives, local, state, or national restrictions or prohibitions are adopted and result in more stringent limitations on the production and development of oil and natural gas in areas where we conduct operations, we may incur significant costs to comply with such requirements or may experience delays or curtailment in the permitting or pursuit of exploration, development or production activities. Such compliance costs and delays, curtailments, limitations or prohibitions could have a material adverse effect on our business, prospects, results of operations, financial condition, liquidity and ability to implement and advance the Climate Risk Strategy.
Political and economic factors in international markets could have a material adverse effect on us.
Approximately 32 percent of our hydrocarbon production was derived from production outside the U.S. in 2024, and 32 percent of our proved reserves, as of December 31, 2024, were located outside the U.S. We are subject to risks associated with our operations in foreign jurisdictions and international markets, including changes in foreign governmental policies relating to crude oil, bitumen, LNG, natural gas or NGLs pricing and taxation; other regulatory or economic developments (including the macro effects of international trade policies and disputes); disruptive geopolitical conditions such as the escalation of geopolitical tension in the Middle East in late 2023 and through 2024; and international monetary and currency rate fluctuations. Restrictions on production of oil and gas could increase to the extent governments view such measures as a viable approach for pursuing national and global energy security and climate policies. In addition, some countries where we operate lack a fully independent judiciary system. This, coupled with changes in foreign law or policy, results in a lack of legal certainty that exposes our operations to increased risks, including increased difficulty in enforcing our agreements in those jurisdictions and increased risks of adverse actions by local government authorities, such as expropriations. Actions by host governments, such as the expropriation of our oil assets by the Venezuelan government, have affected operations significantly in the past and may continue to do so in the future.
In addition, the U.S. government has the authority to prevent or restrict us from doing business in foreign jurisdictions or with certain parties. These restrictions and similar restrictions imposed by foreign governments have in the past limited our ability to operate in, or gain access to, opportunities in various jurisdictions. Diplomatic relations or policies between the U.S. government and one or more foreign jurisdictions may increase our expenses or impair our ability to collect awards in legal actions against such foreign jurisdictions. Changes in domestic and international policies and regulations may also restrict our ability to obtain or maintain licenses or permits necessary to operate in foreign jurisdictions, including those necessary for drilling and development of wells. Similarly, the declaration of a “climate emergency” could result in actions to limit exports of our products and other restrictions.
Any of these actions could adversely affect our business or operating results, including our ability to implement and advance the Climate Risk Strategy.
| | | | | |
| ConocoPhillips 2024 10-K | 24 |
Risks Related to Our Acquisition of Marathon Oil
Integrating Marathon Oil's business may be more difficult, costly or time-consuming than expected, and we may fail to achieve the expected benefits and synergies of the Marathon Oil acquisition, which may adversely affect our business results and negatively affect the value of our common stock.
The success of our acquisition of Marathon Oil will depend on, among other things, our ability to integrate Marathon Oil with our business in a manner that facilitates development opportunities and realizes expected synergies. We may encounter difficulties in integrating our and Marathon Oil’s businesses and realizing the expected benefits and synergies of the acquisition of Marathon Oil. If we are not able to successfully achieve our objectives, the anticipated benefits of the acquisition of Marathon Oil may not be realized fully, or at all, or may take longer to realize than expected.
Prior to the completion of our acquisition of Marathon Oil, each of ConocoPhillips and Marathon Oil operated as an independent public company. There can be no assurances that Marathon Oil’s business can be integrated successfully into ours. It is possible that the integration process could result in the loss of commercial and vendor partners; the disruption of our, Marathon Oil’s or both companies’ ongoing businesses; inconsistencies in standards, controls, procedures and policies; unexpected integration issues; higher than expected integration costs; and an overall post-completion integration process that takes longer than originally anticipated. We will be required to devote management attention and resources to integrating Marathon Oil’s business practices and operations.
An inability to realize the full extent of the anticipated benefits of the acquisition of Marathon Oil, as well as any delays encountered in the integration process, could have an adverse effect upon our revenues, level of expenses and operating results, which may adversely affect the value of our common stock.
In addition, the actual integration may result in additional and unforeseen expenses, and the anticipated benefits of the integration plan may not be realized. There are numerous processes, policies, procedures, operations and technologies and systems that must be integrated in connection with our acquisition of Marathon Oil and the integration of Marathon Oil’s business. Any efficiencies related to the integration of Marathon Oil’s business may not offset incremental transaction and acquisition-related costs in the near term or at all. If we are not able to adequately address integration challenges, we may be unable to successfully integrate operations or realize the anticipated benefits of the acquisition.
The market value of our common stock could decline if large amounts of our common stock are sold now that the Marathon Oil acquisition has been consummated.
We issued shares of ConocoPhillips common stock to former Marathon Oil stockholders. Former Marathon Oil stockholders may decide not to hold the shares of ConocoPhillips common stock that they received in the acquisition of Marathon Oil, and ConocoPhillips stockholders may decide to reduce their investment in ConocoPhillips due to the changes to ConocoPhillips’ investment profile as a result of the acquisition of Marathon Oil. Other Marathon Oil stockholders, such as funds with limitations on their permitted holdings of stock in individual issuers, may be required to sell the shares of ConocoPhillips common stock that they received in the acquisition of Marathon Oil. Such sales of ConocoPhillips common stock could have the effect of depressing the market price for ConocoPhillips common stock.
Other Risk Factors Facing our Business or Operations
We may need additional capital in the future, and it may not be available on acceptable terms or at all.
We have historically relied primarily upon cash generated by our business to fund our operations and strategy; however, we have also relied from time to time on access to the capital markets for funding. There can be no assurance that additional financing will be available in the future on acceptable terms or at all. In addition, although we anticipate we will be able to repay our existing indebtedness when it matures or in accordance with our stated plans, there can be no assurance we will be able to do so. Our ability to obtain additional financing or refinance our existing indebtedness when it matures or in accordance with our plans, will be subject to a number of factors, including market conditions, our operating performance, investor sentiment, risks impacting financial institutions and the credit markets more broadly and financial institution policies regarding the oil and gas industry. If we are unable to generate sufficient funds from operations or raise additional capital for any reason, our business could be adversely affected.
| | | | | |
| 25 | ConocoPhillips 2024 10-K |
In addition, we are regularly evaluated by the major rating agencies based on a number of factors, including our financial strength and conditions affecting the oil and gas industry generally. We and other industry companies have had our ratings reduced in the past due to negative commodity price outlooks. These major rating agencies are now considering ESG attributes when assessing credit profiles. While these assessments have limited impact today, they have the potential to pressure credit ratings over time. Any downgrade in our credit rating or announcement that our credit rating is under review for possible downgrade could increase the cost associated with any additional indebtedness we incur.
Our business may be adversely affected by deterioration in the credit quality of, or defaults under our contracts with, third parties with whom we do business.
The operation of our business requires us to engage in transactions with numerous counterparties operating in a variety of industries, including other companies operating in the oil and gas industry. These counterparties may default on their obligations to us as a result of operational failures or a lack of liquidity, or for other reasons, including bankruptcy. Market speculation about the credit quality of these counterparties, or their ability to continue performing on their existing obligations, may also exacerbate any operational difficulties or liquidity issues they are experiencing. Any default by any of our counterparties may result in our inability to perform our obligations under agreements we have made with third parties or may otherwise adversely affect our business or results of operations. In addition, our rights against any of our counterparties as a result of a default may not be adequate to compensate us for the resulting harm caused or may not be enforceable at all in some circumstances. We may also be forced to incur additional costs as we attempt to enforce any rights we have against a defaulting counterparty, which could further adversely impact our results of operations.
Our ability to execute our capital return program is subject to certain considerations.
Ordinary dividends are authorized and determined by our Board of Directors in its sole discretion and depend upon a number of factors, including:
•Cash available for distribution;
•Our results of operations and anticipated future results of operations;
•Our financial condition, especially in relation to anticipated future capital needs;
•The level of distributions paid by comparable companies;
•Our operating expenses; and
•Other factors our Board of Directors deems relevant.
We paid a quarterly VROC to our shareholders in the first three quarters of 2024. In the fourth quarter of 2024, we declared an ordinary dividend that incorporated the prior VROC equivalent per share payment and did not make a separate VROC payment. VROC distributions remain an option in elevated price environments, to be authorized and determined by our Board of Directors in its sole discretion and depending on factors it deems relevant. Our Board may determine not to pay a dividend in a quarter or may cease declaring a dividend at any time.
Additionally, as of December 31, 2024, $30.7 billion of repurchase authority remained. In October 2024, our Board of Directors approved an increase from our prior authorization of $45 billion by a total of the lesser of $20 billion or the number of shares issued in our acquisition of Marathon Oil, such that the company is not to exceed $65 billion in aggregate purchases. Our share repurchase program does not obligate us to acquire a specific number of shares during any period, and our decision to commence, discontinue or resume repurchases in any period will depend on the same factors that our Board of Directors may consider when declaring dividends, among other factors. In the past, we have suspended our share repurchase program in response to market downturns, including as a result of the oil market downturn that began in early 2020, and we may do so again in the future.
Any downward revision in the amount of our ordinary dividend or the volume of shares we purchase under our share repurchase program could have an adverse effect on the market price of our common stock.
| | | | | |
| ConocoPhillips 2024 10-K | 26 |
There are substantial risks with any acquisitions or divestitures we have completed or that we may choose to undertake.
We regularly review our portfolio and pursue growth through acquisitions and seek to divest noncore assets or businesses. We may not be able to complete these transactions on favorable terms, on a timely basis, or at all. Even if we do complete such transactions, our cash flow from operations may be adversely impacted or otherwise the transactions may not result in the benefits anticipated due to various risks, including, but not limited to (i) the failure of the acquired assets or businesses to meet or exceed expected returns, including risk of impairment; (ii) the inability to dispose of noncore assets and businesses on satisfactory terms and conditions; and (iii) the discovery of unknown and unforeseen liabilities or other issues related to any acquisition for which contractual protections are inadequate or we lack insurance or indemnities, including environmental liabilities, or with regard to divested assets or businesses, claims by purchasers to whom we have provided contractual indemnification. In addition, we may face difficulties in integrating the operations, technologies, products and personnel of any acquired assets or businesses.
Our technologies, systems and networks are subject to cybersecurity threats.
Our business is faced with growing cybersecurity threats as we increasingly rely on digital technologies across our business. Cybersecurity risks to our business, including our suppliers, third-party service providers, contractors, joint venture partners and external business partners, include but are not limited to:
•Unauthorized access to, or control of or disclosure of sensitive information about our business and our employees;
•Compromise of our data or systems, including corruption, sabotage, encryption or acts that otherwise render our data or systems unusable (or those of third parties with whom we do business, including third-party cloud and information technology (IT) service providers);
•Theft or manipulation of our proprietary information;
•Ransom;
•Extortion;
•Threats to the security of our facilities and infrastructure; and
•Cyber terrorism.
In addition, we have exposure to cybersecurity risks where our data and proprietary information are collected, hosted, and/or processed by third-party cloud and service providers. In addition, many of our vendors, including suppliers that are closely integrated into our business, have been victims of cybersecurity attacks that have accessed and exfiltrated information from their systems. Our risks may be exacerbated by a delay or failure to detect a cybersecurity incident or understand the full extent of such incident notwithstanding our risk management processes and controls. We face risks associated with new and ever-increasing phishing techniques, hidden malware, as well as risks associated with electronic data proliferation and technology digitization. We also face increased risk with the increased sophistication of generative artificial intelligence capabilities, which may improve or expand the existing capabilities of cybercriminals described above in a manner we cannot predict at this time.
Our increasing reliance on IT in our production, distribution and marketing systems may allow cybersecurity threats to disrupt our oil and gas operations, both domestically and abroad.
If our data, IT, operational technology (OT), including industrial control and supervisory control and data acquisition (SCADA) systems were to be breached, damaged or disrupted due to a cybersecurity incident or cyber-attack (directly, indirectly through third parties or through the IT networks, servers, software, or infrastructure on which they rely), we could be subject to serious negative consequences. These consequences could include physical damage to production, distribution or storage assets; delay or prevention of delivery to markets; disruption or prevention of accurate accounting for production and settlement of transactions; negative impacts on public health, safety, the environment, economic security, or national security; financial impacts; business interruption; reputational damage; loss of employee, supplier, contractor, partner and/or public trust; reimbursement or other costs; increased compliance costs; regulatory investigations; litigation exposure and legal liability or regulatory fines; penalties or other external intervention.
Although we have business continuity plans in place, our operations may be adversely affected by significant and widespread disruption to our systems and infrastructure that support our business. If we seek insurance against cybersecurity risks, it may be limited by the availability and increasing expense of sufficient coverage.
| | | | | |
| 27 | ConocoPhillips 2024 10-K |
Item 1B. Unresolved Staff Comments
None.
Item 1C. Cybersecurity
Cybersecurity Risk Management and Strategy
Cybersecurity Risk Assessment and Management
We take a multilayered approach to cybersecurity risk management and strategy. Our IT/OT Security Program integrates administrative, technical, and physical controls against evolving cybersecurity threats, and includes enterprise IT and OT security architecture, cybersecurity operations, data privacy and governance, supply chain security, and governance, risk, and compliance. Additionally, it is designed to identify, assess, and manage cybersecurity risks and protect the confidentiality, integrity, and availability of our data, IT, and OT.
Cybersecurity is a component of our IT/OT Security Program, which we periodically review and adapt to respond to new and evolving circumstances, cybersecurity threats and regulations. We evaluate security, privacy, and resiliency risks, including those related to cybersecurity, in our overall Enterprise Risk Management (ERM) program's annual risk assessment process. This annual risk assessment process takes into account broader risks based on likelihood, potential consequences, and mitigations, such as operational and economic impact; health, safety and environmental impact; and reputational and financial implications. This risk assessment is discussed with members of the ELT, Audit and Finance Committee (AFC) of the Board of Directors, and Board of Directors on at least an annual basis.
We consult recognized security frameworks, such as the National Institute of Standards and Technology Cybersecurity Framework to organize, improve, and assess our IT/OT Security Program to manage and reduce cybersecurity risk. We deploy, configure, and maintain various technologies designed to enforce security policies, detect and protect against cybersecurity threats, and help safeguard IT and OT assets. We operate a Cybersecurity Operation Center (CSOC) to ingest threat intelligence, monitor cybersecurity threats, coordinate incident response resources and manage response times.
Our Global Computer Security Incident Response Plan (CSIRP) establishes the framework for our response to cybersecurity incidents. Under the CSIRP, cybersecurity incidents are escalated based on a defined incident categorization to the Chief Information Security Officer (CISO) and senior leaders, including the Chief Digital & Information Officer (CD&IO), General Counsel, Chief Financial Officer, and other cybersecurity program stakeholders, such as the AFC and/or the full Board of Directors. We also conduct incident response exercises at least annually, which are facilitated by internal team members and, in some instances, with assistance from third-party experts.
Physical controls are designed to work in conjunction with digital and cybersecurity controls to help protect the company’s IT and OT assets from physical threats. Our Chief Security Officer is responsible for a physical security program including site plans, cameras, security systems monitoring, and access control and badging systems to manage physical security risks.
Our governing policies, standards and procedures create a structured approach to managing cybersecurity risk. Information security requirements for employees, contractors and partners are detailed in the ConocoPhillips Information Security & Protection Policy. Our workforce is required to complete information security training annually, and we periodically communicate ways to recognize and avoid cybersecurity threats to our workforce.
| | | | | |
| ConocoPhillips 2024 10-K | 28 |
Engagement of Third Parties
We engage third-party cybersecurity consultants and experts to supplement staffing of our CSOC, as well as to help us assess, validate, and enhance our security practices, including conducting cybersecurity maturity assessments, vulnerability assessments and penetration tests.
As part of the cybersecurity incident response process described above, we engage third-party experts as needed to support incident response, such as external legal advisors, cybersecurity forensic firms and other specialists.
Third-Party Service Provider Risk Management
Our third-party risk management process is designed to identify, assess, and mitigate risks associated with third-party service providers, including cybersecurity risks. An initial assessment is conducted to assess the cybersecurity risks associated with a third-party provider based on various criteria, such as whether the third-party provider has access to our network, data, and information systems. Third-party providers that are identified through the initial assessment as warranting further review are subject to additional risk assessment. In parallel, we have designed a contracting process to mitigate cybersecurity risks by specifying the rights and responsibilities of the parties.
Risks from Material Cybersecurity Threats
While we are subject to ongoing cybersecurity threats, we do not believe that the risks from previous threats have materially affected or are reasonably likely to materially affect the company, including our business strategy, results of operations or financial condition. Nevertheless, we recognize cybersecurity threats are on-going and evolving, and our program is designed to identify and manage those threats. See item 1A. Risk Factors—Our technologies, systems and networks are subject to cybersecurity threats for more information on our risks relating to our technologies, systems, and networks.
Cybersecurity Governance
Management's Role
A dedicated CISO leads the IT/OT Security Team and is responsible for our cybersecurity risk management and strategy. The CISO has over 20 years of experience in security, of which 15 years is specific to cybersecurity and has served as a CISO since 2013, having joined ConocoPhillips as CISO in 2022. The CISO holds a master’s degree and is a Certified Information Security Professional. The CISO reports to the CD&IO, who holds a master’s degree in information technology and has served as Chief Information Officer/Chief Technology Officer and various roles in information technology for over 28 years. The CD&IO reports to the Executive Vice President and Chief Financial Officer. This management team assesses and manages risks associated with cybersecurity.
Board of Directors' Oversight
While our cybersecurity management team is responsible for the day-to-day assessment and management of material risks from cybersecurity threats, the ConocoPhillips Board of Directors has oversight responsibility for our ERM program and the individual risk management programs comprising our ERM program, including cybersecurity risk management. To help maintain effective Board of Directors' oversight across the entire enterprise, the Board of Directors delegates certain elements of its oversight function to individual committees. The AFC assists the Board of Directors in fulfilling its oversight of our ERM program and cybersecurity.
The Board of Directors receives a report on cybersecurity annually, and the AFC receives reports on cybersecurity multiple times a year. For meetings where cybersecurity is not on the formal agenda, the AFC will receive a pre-read that includes cybersecurity updates or discussion topics. During these reviews, management discusses various topics, including information relating to IT/OT Security strategy, program management, cybersecurity risks and threats, and provides briefings on notable cybersecurity attacks, including those relating to third-party service providers, if known. In addition to this regular reporting, significant cybersecurity risks or threats may also be escalated on an as needed basis to the AFC and Board of Directors.
| | | | | |
| 29 | ConocoPhillips 2024 10-K |
Item 3. Legal Proceedings
We are a defendant in a number of legal and administrative proceedings arising in the ordinary course of business, including those involving governmental authorities under federal, state and local laws regulating the discharge of materials into the environment. While it is not possible to accurately predict the final outcome of these pending proceedings, if any one or more of such proceedings were to be decided adversely to ConocoPhillips, we expect there would not be a material effect to our consolidated financial position.
ConocoPhillips has elected to use a $1 million threshold for disclosing certain proceedings arising under federal, state or local environmental laws when a governmental authority is a party. ConocoPhillips believes proceedings under this threshold are not material to ConocoPhillips' business and financial condition. Applying this threshold, there are no such proceedings to disclose for the year ended December 31, 2024. See Note 10 for information regarding other legal and administrative proceedings. Item 4. Mine Safety Disclosures
Not applicable.
Information about our Executive Officers
| | | | | | | | |
| Name | Position Held | Age* |
| William L. Bullock, Jr. | Executive Vice President and Chief Financial Officer | 60 |
| Christopher P. Delk | Vice President, Controller and General Tax Counsel | 55 |
| Heather G. Hrap | Senior Vice President, Human Resources and Real Estate and Facilities Services | 52 |
| Kirk L. Johnson | Senior Vice President, Global Operations | 49 |
| Ryan M. Lance | Chairman of the Board of Directors and Chief Executive Officer | 62 |
| Andrew D. Lundquist | Senior Vice President, Government Affairs | 64 |
| Andrew M. O'Brien | Senior Vice President, Strategy, Commercial, Sustainability and Technology | 50 |
| Nicholas G. Olds | Executive Vice President, Lower 48 | 55 |
| Kelly B. Rose | Senior Vice President, Legal, General Counsel and Corporate Secretary | 58 |
_____________________
*On February 18, 2025.
There are no family relationships among any of the officers named above. Each officer of the company is elected by the Board of Directors at its first meeting after the Annual Meeting of Stockholders and thereafter as appropriate. Each officer of the company holds office from the date of election until the first meeting of the directors held after the next Annual Meeting of Stockholders or until a successor is elected. The date of the next annual meeting is May 13, 2025. Set forth below is information about the executive officers.
William L. Bullock, Jr. was appointed Executive Vice President and Chief Financial Officer as of September 2020, having previously served as President, Asia Pacific & Middle East since April 2015. Prior to that, he was Vice President, Corporate Planning & Development since May 2012.
Christopher P. Delk was appointed Vice President, Controller and General Tax Counsel in November 2022, having previously served as Vice President and General Tax Counsel since July 2015.
| | | | | |
| ConocoPhillips 2024 10-K | 30 |
Heather G. Hrap was appointed Senior Vice President, Human Resources and Real Estate and Facilities Services in March 2022, having previously served as Vice President, Human Resources from January 2019. Prior to that, she served as Human Resources General Manager from October 2015 to January 2019.
Kirk L. Johnson was appointed Senior Vice President, Global Operations in 2024, having previously served as Senior Vice President, Lower 48 Assets and Operations since May 2022. Prior to that he served as Vice President, Corporate Planning and Development since June 2021, President Canada from June 2018 to May 2021 and Manager, Strategy, Planning and Portfolio Management from July 2017 to June 2018.
Ryan M. Lance was appointed Chairman of the Board of Directors and Chief Executive Officer in May 2012, having previously served as Senior Vice President, Exploration and Production—International since May 2009.
Andrew D. Lundquist was appointed Senior Vice President, Government Affairs in February 2013. Prior to that, he served as managing partner of BlueWater Strategies LLC, since 2002.
Andrew M. O'Brien was appointed Senior Vice President, Strategy, Commercial, Sustainability and Technology in 2024, having previously served as Senior Vice President, Global Operations since November 2022. Prior to that, he served as Vice President and Treasurer since May 2021, Vice President of Corporate Planning and Development from August 2020 to May 2021, Lower 48 Finance Manager from August 2018 to August 2020, and Manager of Investor Relations from November 2016 to August 2018.
Nicholas G. Olds was appointed Executive Vice President, Lower 48 in November 2022, having previously served as Executive Vice President, Global Operations since September 2021. Prior to that, he served as Senior Vice President, Global Operations from August 2020 to September 2021, Vice President, Corporate Planning & Development from June 2018 to August 2020, Vice President, Mid-Continent Business Unit, Lower 48 from September 2016 to June 2018, and Vice President, North Slope Operations and Development in Alaska from August 2012 to September 2016.
Kelly B. Rose was appointed Senior Vice President, Legal, General Counsel and Corporate Secretary in September 2018. Prior to that, she was a senior partner in the Houston office of an international law firm, Baker Botts L.L.P., where she counseled clients on corporate and securities matters. She began her career at the firm in 1991.
| | | | | |
| 31 | ConocoPhillips 2024 10-K |
Part II
Item 5. Market for Registrant's Common Equity, Related Stockholder Matters and Issuer Purchases of Equity Securities
ConocoPhillips’ common stock is traded on the NYSE under the symbol “COP.”
Cash Dividends Per Share
| | | | | | | | | | | | | | | | | |
| 2024 | | 2023 |
| Ordinary | VROC | | Ordinary | VROC |
| First | $ | 0.58 | | 0.20 | | | 0.51 | | 0.60 | |
| Second | 0.58 | | 0.20 | | | 0.51 | | 0.60 | |
| Third | 0.58 | | 0.20 | | | 0.51 | | 0.60 | |
| Fourth | 0.78 | | — | | | 0.58 | | — | |
| Number of Stockholders of Record at January 31, 2025* | | | | | 48,051 |
Dividends shown above reflect the quarter in which the dividend was declared.
*In determining the number of stockholders, we consider clearing agencies and security position listings as one stockholder for each agency listing.
Issuer Purchases of Equity Securities
| | | | | | | | | | | | | | |
| Millions of Dollars |
| Period | Total Number of
Shares Purchased* | Average
Price Paid
Per Share | Shares Purchased
as Part of Publicly
Announced Plans
or Programs | Approximate Dollar
Value of Shares
that May Yet Be
Purchased Under the
Plans or Programs |
| | | | |
| October 1-31, 2024 | 6,052,176 | | $ | 107.40 | | 6,052,176 | | $ | 32,028 | |
| November 1-30, 2024 | 5,853,754 | | 111.04 | | 5,853,754 | | 31,378 | |
| December 1-31, 2024 | 6,462,609 | | 100.58 | | 6,462,609 | | 30,728 | |
| 18,368,539 | | | 18,368,539 | | |
*There were no repurchases of common stock from company employees in connection with the company's broad-based employee incentive plans.
In late 2016, we initiated our current share repurchase program. In October 2024, our Board of Directors approved an increase from our previous authorization of $45 billion by a total of the lesser of $20 billion or the number of shares issued in our acquisition of Marathon Oil, such that the company is not to exceed $65 billion in aggregate repurchases. As of December 31, 2024, we had repurchased $34.3 billion of shares since 2016. Repurchases are made at management’s discretion, at prevailing prices, subject to market conditions and other factors. Except as limited by applicable legal requirements, repurchases may be increased, decreased or discontinued at any time without prior notice. Shares of stock repurchased under the plan are held as treasury shares. For more information, see “Item 1A—Risk Factors – Our ability to execute our capital return program is subject to certain considerations.” | | | | | |
| ConocoPhillips 2024 10-K | 32 |
Stock Performance Graph
The following graph shows the cumulative TSR for ConocoPhillips’ common stock in each of the five years from December 31, 2019 to December 31, 2024. The graph also compares the cumulative total returns for the same five-year period with the S&P 500 Index and our performance peer group consisting of APA Corporation, Chevron, Devon Energy, Diamondback Energy, EOG Resources, ExxonMobil, Hess, and Occidental Petroleum weighted according to the respective peer’s stock market capitalization at the beginning of each annual period. In 2024, we updated our performance peer group, adding Diamondback Energy, to better align with our business and market capitalization, and removing Pioneer. Due to ExxonMobil’s acquisition of Pioneer completed in 2024, Pioneer’s performance has been excluded from all five years of the previous peer group performance.
The comparison assumes $100 was invested on December 31, 2019, in ConocoPhillips stock, the S&P 500 Index and ConocoPhillips’ peer group and assumes that all dividends were reinvested. The cumulative total returns of the peer group companies' common stock do not include the cumulative total return of ConocoPhillips’ common stock. The stock price performance included in this graph is not necessarily indicative of future stock price performance.
| | | | | |
| 33 | ConocoPhillips 2024 10-K |
| | | | | |
| Management’s Discussion and Analysis | |
Item 7. Management’s Discussion and Analysis of Financial Condition and
Results of Operations
Management’s Discussion and Analysis is the company’s analysis of its financial performance and of significant trends and uncertainties that may affect future performance. It should be read in conjunction with the financial statements and notes, and supplemental oil and gas disclosures included elsewhere in this report. It contains forward-looking statements including, without limitation, statements relating to the company’s plans, strategies, objectives, expectations and intentions that are made pursuant to the “safe harbor” provisions of the Private Securities Litigation Reform Act of 1995. The words “ambition,” “anticipate,” “believe,” “budget,” “continue,” “could,” “effort,” “estimate,” “expect,” “forecast,” “goal,” “guidance,” “intend,” “may,” “objective,” “outlook,” “plan,” “potential,” “predict,” “projection,” “seek,” “should,” “target,” “will,” “would” and similar expressions identify forward-looking statements. The company does not undertake to update, revise or correct any of the forward-looking information unless required to do so under the federal securities laws. Readers are cautioned that such forward-looking statements should be read in conjunction with the company’s disclosures under the heading: “CAUTIONARY STATEMENT FOR THE PURPOSES OF THE ‘SAFE HARBOR’ PROVISIONS OF THE PRIVATE SECURITIES LITIGATION REFORM ACT OF 1995,” beginning on page 65. The terms “earnings” and “loss” as used in Management’s Discussion and Analysis refer to net income (loss).
Business Environment and Executive Overview
ConocoPhillips is one of the world’s leading E&P companies based on both production and reserves with operations and activities in 14 countries. Our diverse, low cost of supply portfolio includes resource-rich unconventional plays in North America; conventional assets in North America, Europe, Africa and Asia; global LNG developments; oil sands in Canada; and an inventory of global exploration prospects. Headquartered in Houston, Texas, at December 31, 2024, we employed approximately 11,800 people worldwide and had total assets of $123 billion.
Completed Acquisition of Marathon Oil Corporation
On November 22, 2024, we completed our acquisition of Marathon Oil, an independent oil and gas exploration and production company. The acquisition adds high-quality, low cost of supply, development opportunities to our existing Lower 48 portfolio and additional LNG capacity to our global LNG portfolio through Equatorial Guinea.
At closing, the acquisition was valued at approximately $16.5 billion, in which 0.255 shares of ConocoPhillips common stock was exchanged for each outstanding share of Marathon Oil common stock, resulting in the issuance of approximately 143 million shares of ConocoPhillips common stock. We also assumed $4.6 billion in aggregate principal amount of outstanding debt for Marathon Oil, which was recorded at fair value of $4.7 billion as of the closing date. We expect to capture approximately $1 billion in synergies on a run rate basis within the first full year following the close of the transaction. See Note 3 and Note 8.
Overview
At ConocoPhillips, we anticipate that commodity prices will continue to be cyclical and volatile, and our view is that a successful business strategy in the E&P industry must be resilient in lower price environments while also retaining upside during periods of higher prices. As such, we are unhedged, remain committed to our disciplined investment framework and continually monitor market fundamentals, including the impacts associated with geopolitical tensions and conflicts, global demand for our products, oil and gas inventory levels, governmental policies, inflation and supply chain disruptions.
The macro-environment of the global energy industry continues to evolve. We believe ConocoPhillips plays an essential role in responsibly meeting the global demand for energy, while continuing to deliver competitive returns on and of capital and working to meet our previously established emissions-reduction targets. We call this our Triple Mandate, and it represents our commitment to create long-term value for stockholders. Our value proposition to deliver competitive returns to stockholders through price cycles is guided by our foundational principles which consist of maintaining balance sheet strength, providing peer-leading distributions, making disciplined investments, and demonstrating responsible and reliable ESG performance.
| | | | | |
| ConocoPhillips 2024 10-K | 34 |
| | | | | |
| Management’s Discussion and Analysis | |
Total company production in 2024 was 1,987 MBOED, yielding cash provided by operating activities of $20.1 billion. We invested $12.1 billion into the business in the form of capital expenditures and investments, inclusive of $0.4 billion of spend related to fourth-quarter acquisitions, and provided returns of capital to shareholders of $9.1 billion through our ordinary dividend, VROC and share repurchases. In 2024, we returned $3.6 billion through the ordinary dividend and VROC, including in December when we increased our ordinary dividend by 34 percent to 78 cents per share, effectively incorporating the amount of the prior quarter VROC into the ordinary dividend. In addition, we returned $5.5 billion to shareholders through share repurchases. As of December 31, 2024, we have repurchased $34.3 billion of our authorized share repurchase program since 2016. In February 2025, we announced our 2025 planned return of capital to shareholders of $10 billion, at current commodity prices, through our return of capital framework. We also declared a first-quarter ordinary dividend of 78 cents per share.
In 2024, we continued to optimize our portfolio geared towards our return focused value proposition. In the third quarter, we added to our global LNG portfolio through agreements that provide additional access to European and Asian natural gas markets by entering into an 18-year agreement securing regasification capacity at Zeebrugge LNG terminal in Belgium which includes regasification services for approximately 0.75 MTPA of LNG beginning in 2027. Additionally, in the third quarter, we entered into a long-term LNG sales agreement for approximately 0.5 MTPA into Asia starting in 2027.
After exercising our preferential rights, we completed our acquisition of additional working interest in the Kuparuk River Unit and Prudhoe Bay Unit in our Alaska segment in the fourth quarter of 2024. In conjunction with the announcement of our acquisition of Marathon Oil, we communicated a disposition target of approximately $2 billion of assets across the portfolio. We recently entered into agreements to sell noncore assets within our Lower 48 segments that are expected to close in the first half of 2025 for approximately $600 million, subject to customary closing adjustments. See Note 3.
In the fourth quarter of 2024, we completed strategic debt transactions, which simplified our capital structure, extended the debt portfolio's weighted average maturity, lowered its weighted average coupon and reduced near-term maturities. See Note 3 and Note 8. Operationally, we remain focused on safely executing the business. Production for 2024 was 1,987 MBOED, representing an increase of 161 MBOED or nine percent compared to 2023. After adjusting for closed acquisitions and dispositions, production increased by 69 MBOED or three percent. Our Lower 48 segment achieved record production of 1,152 MBOED in 2024. Our international projects reached several key operational milestones; including first production ahead of schedule at Eldfisk North in Norway, Nuna in Alaska and Bohai Bay in China; and we celebrated the one thousandth cargo lift at both APLNG and Bohai Bay in China.
Business Environment
The energy industry has historically been subject to volatility in commodity prices, which fluctuate with the global economy's supply and demand for energy. Our profitability, reserves base, reinvestment of cash flows and distributions to shareholders are influenced by these fluctuations. Our foundational principles guide our differential value proposition to deliver competitive returns on and of capital to stockholders through price cycles. Our foundational principles consist of maintaining balance sheet strength, providing peer-leading distributions, making disciplined investments and demonstrating responsible and reliable ESG performance, all of which support strong financial returns and mitigate uncertainty associated with volatile commodity prices.
Balance sheet strength. A strong balance sheet is a strategic asset that provides flexibility through price cycles. We strive to maintain our ‘A’-rating, as we did throughout 2024. In 2024, we initiated and completed strategic debt transactions to extend the weighted average maturity of our portfolio and reduce near-term debt maturities. We ended the year with cash and cash equivalents and restricted cash of $5.9 billion, short-term investments of $0.5 billion and long-term investments in debt securities of $1.1 billion, maintaining balance sheet strength.
Peer leading distributions. We believe in delivering value to our shareholders via our return of capital framework, which consists of a growing, sustainable ordinary dividend, share repurchases and the discretion to utilize VROC in an elevated price environment. This framework is how we plan to return greater than 30 percent of our net cash provided by operating activities to shareholders. In 2024, we returned $3.6 billion to shareholders through our ordinary dividend and VROC and $5.5 billion through share repurchases. Our combined dividends and share repurchases of $9.1 billion represented 45 percent of our net cash provided by operating activities. In February 2025, we announced our 2025 planned return of capital to shareholders of $10 billion, at current commodity prices, through our return of capital framework.
| | | | | |
| 35 | ConocoPhillips 2024 10-K |
| | | | | |
| Management’s Discussion and Analysis | |
Disciplined investments. Our goal is to optimize free cash flow by exercising capital discipline, controlling our costs, and safely and reliably delivering production. We expect to make capital investments sufficient to at least sustain production throughout the price cycles. Free cash flow is defined as cash from operations net of capital expenditures and investments and provides funds that are available to return to shareholders, strengthen the balance sheet or reinvest back into the business for future cash flow expansion.
•Exercise capital discipline. Our global portfolio is deep, diverse and durable. As we consider our capital investment opportunities, we apply a rigorous framework that we believe allows for competitive free cash flow to be available to return to shareholders. By allocating to our low cost of supply resource base, we are allocating to high return assets and driving resiliency to low prices. We also balance our investments between short and longer cycle projects. For example, in 2024, we invested in short-cycle projects in the Lower 48 segment, as well as longer-cycle projects such as Willow in Alaska and LNG projects in Qatar and Port Arthur. This capital allocation framework seeks to maximize free cash flow through price cycles. Cost of supply is the WTI equivalent price that generates a 10 percent after-tax return on a point-forward and fully burdened basis. Fully burdened basis includes capital infrastructure, foreign currency exchange rates, cost of carbon, price-related inflation and G&A.
•Control our costs. Controlling our costs, without compromising safety or environmental stewardship, is a high priority. Using various methodologies, we monitor costs monthly, on an absolute-dollar basis and a per-unit basis and report to management. Managing costs is critical to maintaining a competitive position in our cyclical industry and positively impacts our ability to deliver strong cash from operations.
•Optimize our portfolio. We continue to evaluate our assets to determine whether they compete for capital within our portfolio and optimize as necessary, directing capital towards the most competitive investments and disposing of assets that do not compete.
In 2024, we completed our acquisition of Marathon Oil and additional working interest in Alaska, as well as signed additional LNG regasification and sales agreements. In 2024, we also signed an agreement to divest certain noncore assets in our Lower 48 segment. See Note 3. •Add to our proved reserve base. We primarily add to our proved reserve base in three ways:
•Acquire interests in existing or new fields.
•Apply new technologies and processes to improve recovery from existing fields.
•Successfully explore, develop and exploit new and existing fields.
Reserve replacement represents the net change in proved reserves, net of production, divided by our current year production. Our reserve replacement was 244 percent in 2024, reflecting a net increase from development drilling activity; extensions and discoveries; and purchases, including our acquisition of Marathon Oil; partially offset by lower prices. Our organic reserve replacement, which excludes a net increase of 886 MMBOE from sales and purchases, was 123 percent in 2024.
In the three years ended December 31, 2024, our reserve replacement was 183 percent. Our organic reserve replacement during the three years ended December 31, 2024, which excludes a net increase of 1,064 MMBOE related to sales and purchases, was 131 percent.
Environmental, Social and Governance performance. We are committed to the efficient and effective exploration and production of oil and natural gas. We seek to deliver energy to the world through an integrated management system that assesses sustainability-related business risks and opportunities as part of our decision-making process and remain committed to our targets. Recognizing the importance of ESG performance to our stakeholders and company success, we have a governance structure that extends from the board of directors to executive leadership and business unit managers.
| | | | | |
| ConocoPhillips 2024 10-K | 36 |
| | | | | |
| Management’s Discussion and Analysis | |
Commodity Prices
Our earnings and operating cash flows generally correlate with crude oil and natural gas commodity prices. Commodity price levels are subject to factors external to the company and over which we have no control, including but not limited to global economic health, supply or demand disruptions or fears thereof caused by civil unrest, global pandemics, military conflicts, actions taken by OPEC Plus and other major oil producing countries, environmental laws, tax regulations, governmental policies and weather-related disruptions. The following graph depicts the average benchmark prices for WTI crude oil, Brent crude oil and U.S. Henry Hub natural gas since 2022:
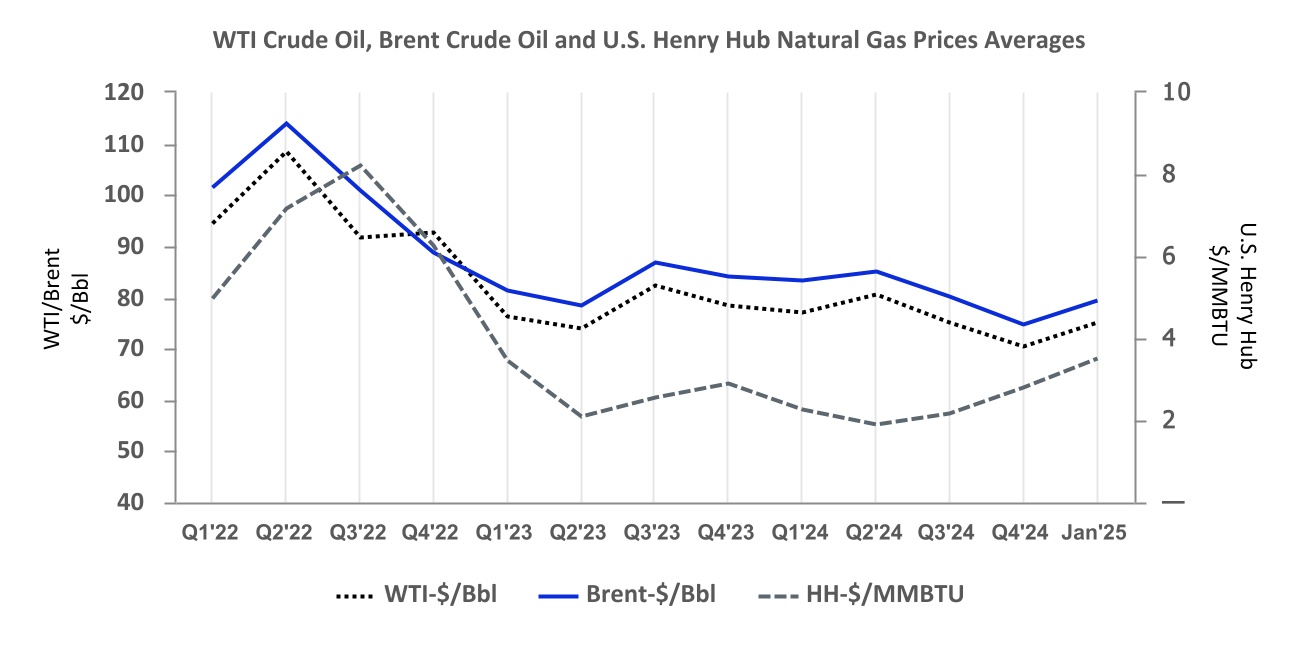
Brent crude oil prices decreased two percent from $82.62 per barrel in 2023 to $80.76 per barrel in 2024. Similarly, average WTI crude oil prices decreased two percent from $77.62 per barrel in 2023 to $75.72 per barrel in 2024. Prices were lower through 2024 due to slower global demand growth in 2024 relative to 2023 and higher supplies from non-OPEC Plus counties.
U.S. Henry Hub natural gas prices decreased 17 percent from an average of $2.74 per MMBTU in 2023 to $2.27 per MMBTU in 2024. Natural gas prices decreased due to excess North American natural gas storage levels following a mild 2023-2024 winter. Lower 48 segment realized gas prices decreased to $0.18 in the third quarter of 2024 driven by lower regional prices related to pipeline capacity constraints. In the fourth quarter of 2024 prices increased as constraints were relieved and realizations ended the year at an average of $0.87.
Our realized bitumen price increased 14 percent from an average of $42.15 per barrel in 2023 to $47.92 per barrel in 2024. The increase was driven by narrowing WCS differentials due to Trans Mountain Expansion project egress, tightening Russian sanctions impacting global heavy oil supply and improving heavy oil demand in Asia. We continue to optimize bitumen price realizations through optimizing diluent recovery unit operation, blending and transportation strategies.
Our worldwide annual average realized price decreased six percent from $58.39 per BOE in 2023 to $54.83 per BOE in 2024 primarily due to lower crude and natural gas prices.
| | | | | |
| 37 | ConocoPhillips 2024 10-K |
| | | | | |
| Management’s Discussion and Analysis | |
Key Operating and Financial Summary
Significant items during 2024 and recent announcements included the following:
•Completed the acquisition of Marathon Oil, adding high-quality, low cost of supply inventory adjacent to the company's leading U.S. unconventional position;
•Reported fourth-quarter 2024 earnings per share of $1.90;
•Delivered 2024 reserve replacement ratio of 244 percent and organic reserve replacement ratio of 123 percent;
•Announced planned 2025 return of capital target of $10 billion at current commodity prices and declared first-quarter 2025 ordinary dividend of $0.78 per share;
•Provided 2025 guidance including full-year capital of approximately $12.9 billion;
•Generated cash provided by operating activities of $20.1 billion;
•Distributed $9.1 billion to shareholders, including $5.5 billion through share repurchases and $3.6 billion through the ordinary dividend and VROC;
•Ended the year with cash, cash equivalents and restricted cash of $5.9 billion, short-term investments of $0.5 billion and long-term investments in debt securities of $1.1 billion;
•Advanced previously announced $2 billion disposition target by signing agreements to divest noncore Lower 48 assets of $0.6 billion, subject to customary closing adjustments and expected to close in the first half of 2025;
•Delivered full-year total company and Lower 48 production of 1,987 MBOED and 1,152 MBOED, respectively. Excluding one month of Marathon Oil production, the company and Lower 48 produced 1,955 MBOED and 1,124 MBOED, respectively;
•Reached first production at Nuna in Alaska and Bohai Phase 5 in China in the fourth quarter and at Eldfisk North in Norway in the second quarter;
•Progressed global LNG strategy with a long-term regasification agreement at Zeebrugge LNG terminal in Belgium and a long-term sales agreement in Asia;
•Exercised preferential rights and acquired additional working interests in Alaska's Kuparuk River and Prudhoe Bay Units in the fourth quarter;
•Completed debt transactions to simplify the company's capital structure post the acquisition of Marathon Oil, extending the weighted average maturity and improving the weighted average coupon of the portfolio; and
•Achieved the Oil and Gas Methane Partnership 2.0 Gold Standard designation in 2024.
Outlook
Production, DD&A and Capital
2025 production guidance is 2.34 to 2.38 MMBOED which includes 20 MBOED from planned turnarounds. First-quarter 2025 production is expected to be 2.34 to 2.38 MMBOED, which includes impacts of 20 MBOED from January weather and 5 MBOED from turnarounds.
Guidance for 2025 includes DD&A of $11.3 to $11.5 billion and capital expenditures of approximately $12.9 billion.
Operating Segments
We manage our operations through six operating segments, which are primarily defined by geographic region: Alaska; Lower 48; Canada; Europe, Middle East and North Africa; Asia Pacific; and Other International.
Corporate and Other represents income and costs not directly associated with an operating segment, such as most interest income and expense; impacts from certain debt transactions; corporate overhead and certain technology activities, including licensing revenues; and unrealized holding gains or losses on equity securities. All cash and cash equivalents and short-term investments are included in Corporate and Other.
Our key performance indicators, shown in the statistical tables provided at the beginning of the operating segment sections that follow, reflect results from our operations, including commodity prices and production.
| | | | | |
| ConocoPhillips 2024 10-K | 38 |
Results of Operations
This section of the Form 10-K discusses year-to-year comparisons between 2024 and 2023. For discussion of year-to-year comparisons between 2023 and 2022, see "Management's Discussion and Analysis of Financial Condition and Results of Operations" in Part II, Item 7 of our 2023 10-K.
Consolidated Results
Summary Operating Statistics
| | | | | | | | | | | |
| 2024 | 2023 | 2022 |
| Average Net Production | | | |
| Crude oil (MBD) | | | |
| Consolidated Operations | 969 | | 923 | | 885 | |
| Equity affiliates | 13 | | 13 | | 13 | |
| Total crude oil | 982 | | 936 | | 898 | |
| | | |
| Natural gas liquids (MBD) | | | |
| Consolidated Operations | 304 | | 279 | | 244 | |
| Equity affiliates | 8 | | 8 | | 8 | |
| Total natural gas liquids | 312 | | 287 | | 252 | |
| | | |
| Bitumen (MBD) | 122 | | 81 | | 66 | |
| | | |
| Natural gas (MMCFD) | | | |
| Consolidated Operations | 2,200 | | 1,916 | | 1,939 | |
| Equity affiliates | 1,233 | | 1,219 | | 1,191 | |
| Total natural gas | 3,433 | | 3,135 | | 3,130 | |
| | | |
Total Production (MBOED) | 1,987 | | 1,826 | | 1,738 | |
Total Production (MMBOE) | 727 | | 666 | | 634 | |
| | | | | | | | | | | |
| Dollars Per Unit |
| Average Sales Prices | | | |
| Crude oil (per bbl) | | | |
| Consolidated Operations | $ | 76.74 | | 78.97 | | 97.23 | |
| Equity affiliates | 76.76 | | 78.45 | | 97.31 | |
| Total crude oil | 76.74 | | 78.96 | | 97.23 | |
| | | |
| Natural gas liquids (per bbl) | | | |
| Consolidated Operations | 22.43 | | 22.12 | | 35.67 | |
| Equity affiliates | 51.53 | | 47.09 | | 61.22 | |
| Total natural gas liquids | 23.19 | | 22.82 | | 36.50 | |
| | | |
| Bitumen (per bbl) | 47.92 | | 42.15 | | 55.56 | |
| | | |
| Natural gas (per mcf) | | | |
| Consolidated Operations | 2.61 | | 3.89 | | 10.56 | |
| Equity affiliates | 8.22 | | 8.46 | | 10.67 | |
| Total natural gas | 4.69 | | 5.69 | | 10.60 | |
| | | | | |
| 39 | ConocoPhillips 2024 10-K |
| | | | | | | | | | | |
| Millions of Dollars |
| Worldwide Exploration Expenses | | | |
| General and administrative; geological and geophysical, lease rental, and other | $ | 309 | | 236 | | 224 | |
| Leasehold impairment | 6 | | 53 | | 89 | |
| Dry holes | 40 | | 109 | | 251 | |
| Total Exploration Expenses | $ | 355 | | 398 | | 564 | |
Total Company Production
We explore for, produce, transport and market crude oil, bitumen, natural gas, NGLs and LNG on a worldwide basis. At December 31, 2024, our operations were producing in the U.S., Norway, Canada, Australia, China, Malaysia, Qatar, Libya and Equatorial Guinea.
Total production of 1,987 MBOED increased 161 MBOED or nine percent in 2024 compared with 2023. Production increases include:
•New wells online in the Lower 48, Alaska, Australia, Canada, China, Libya and Norway.
•Our acquisition of the remaining working interest in Surmont in the fourth quarter of 2023.
•Our acquisition of Marathon Oil in the fourth quarter of 2024.
The increase in production during 2024 was partly offset by normal field decline.
After adjusting for closed acquisitions and dispositions, production increased by 69 MBOED or three percent.
| | | | | |
| ConocoPhillips 2024 10-K | 40 |
Income Statement Analysis
Unless otherwise indicated, all results in Income Statement Analysis are before-tax.
| | | | | | | | | | | |
| Millions of Dollars |
| Years Ended December 31 | 2024 | 2023 | 2022 |
| | | |
| Sales and other operating revenues | $ | 54,745 | | 56,141 | | 78,494 | |
| | | |
| Gain (loss) on dispositions | 51 | | 228 | | 1,077 | |
| | | |
| Purchased commodities | 20,012 | | 21,975 | | 33,971 | |
| Production and operating expenses | 8,751 | | 7,693 | | 7,006 | |
| Selling, general and administrative expenses | 1,158 | | 705 | | 623 | |
| | | |
| Depreciation, depletion and amortization | 9,599 | | 8,270 | | 7,504 | |
| | | |
| | | |
| | | |
| | | |
| Foreign currency transaction (gain) loss | (50) | | 92 | | (100) | |
| Other expenses | 181 | | 2 | | (47) | |
| Income tax provision (benefit) | 4,427 | | 5,331 | | 9,548 | |
| | | |
Sales and other operating revenues decreased $1,396 million in 2024, primarily due to lower realized natural gas and crude prices of $1,031 million and $791 million, respectively, and the timing of sales as compared to 2023. These decreases were partially offset by higher volumes of $2,659 million, inclusive of sales volumes from our acquisitions of Surmont and Marathon Oil, and higher realized bitumen prices of $258 million. See Note 3. Gain (loss) on dispositions decreased $177 million in 2024, primarily due to the absence of gains associated with the divestitures of an equity investment and noncore assets in Lower 48 segment.
Purchased commodities decreased $1,963 million in 2024, primarily driven by lower natural gas and crude prices, partially offset by higher crude volumes.
Production and operating expenses increased $1,058 million in 2024, due to higher lease operating expenses and transportation costs in our Lower 48 and Alaska segments, higher volumes primarily in our Canada and Lower 48 segments, as well as higher expenses associated with the Surmont turnaround in our Canada segment. See Note 3.
Selling, general and administrative expenses increased $453 million in 2024, primarily due to transaction expenses of $545 million associated with our acquisition of Marathon Oil, partially offset by lower compensation and benefits costs, including mark-to-market impacts of certain key employee compensation programs. See Note 15.
DD&A increased $1,329 million in 2024 primarily due to higher volumes in our Lower 48 and Canada segments, higher rates in our Alaska and Lower 48 segments and the impact of our acquisition of Marathon Oil. See Note 3.
Foreign currency transaction (gain) loss for the year was improved by $142 million, primarily due to the absence of losses of $112 million associated with forward contracts in support of our Surmont acquisition. See Note 3.
Other expenses increased $179 million primarily related to a loss of $173 million associated with the extinguishment of debt in the fourth quarter of 2024. See Note 8.
See Note 16—Income Taxes for information regarding our income tax provision and effective tax rate. | | | | | |
| 41 | ConocoPhillips 2024 10-K |
Segment Results
Unless otherwise indicated, discussion of Segment Results is after-tax.
A summary of the company’s net income (loss) by business segment follows:
| | | | | | | | | | | |
| Millions of Dollars |
| Years Ended December 31 | 2024 | 2023 | 2022 |
| | | |
| Alaska | $ | 1,326 | | 1,778 | | 2,352 | |
| Lower 48 | 5,175 | | 6,461 | | 11,015 | |
| Canada | 712 | | 402 | | 714 | |
| Europe, Middle East and North Africa | 1,189 | | 1,189 | | 2,244 | |
| Asia Pacific | 1,724 | | 1,961 | | 2,736 | |
| Other International | (1) | | (13) | | (51) | |
| Corporate and Other | (880) | | (821) | | (330) | |
| Net income (loss) | $ | 9,245 | | 10,957 | | 18,680 | |
For further discussion of segment results, see the following pages.
| | | | | |
| ConocoPhillips 2024 10-K | 42 |
Alaska
| | | | | | | | | | | |
| | | |
| 2024 | 2023 | 2022 |
Select financial data by segment before-tax ($MM) | | | |
| Sales and other operating revenues ($MM) | $ | 6,553 | | 7,098 | | 7,905 | |
| Production and operating expenses ($MM) | 1,951 | | 1,829 | | 1,703 | |
| Depreciation, depletion and amortization ($MM) | 1,299 | | 1,061 | | 939 | |
| Taxes other than income taxes ($MM) | 470 | | 497 | | 1,323 | |
| | | |
Net Income (Loss) ($MM) | $ | 1,326 | | 1,778 | | 2,352 | |
| | | |
| Average Net Production | | | |
| Crude oil (MBD) | 173 | | 173 | | 177 | |
| Natural gas liquids (MBD) | 15 | | 16 | | 17 | |
| Natural gas (MMCFD) | 39 | | 38 | | 34 | |
Total Production (MBOED) | 194 | | 195 | | 200 | |
Total Production (MMBOE) | 71 | | 71 | | 73 | |
| | | |
| Average Sales Prices | | | |
| Crude oil ($ per bbl) | $ | 81.73 | | 83.05 | | 101.72 | |
| Natural gas ($ per mcf) | 3.90 | | 4.47 | | 3.64 | |
The Alaska segment primarily explores for, produces, transports and markets crude oil, NGLs and natural gas. In 2024, Alaska contributed 14 percent of our consolidated liquids production and two percent of our consolidated natural gas production.
Net Income (Loss)
Alaska reported earnings of $1,326 million in 2024, compared with earnings of $1,778 million in 2023.
Decreases to earnings included lower revenues resulting from lower commodity prices of $73 million and the timing of sales as compared with 2023. Additional decreases to earnings included higher DD&A expenses of $175 million, driven by higher rates as a result of 2023 year-end downward reserve revisions as well as higher production and operating expenses of $90 million, driven by higher well work activity of $56 million and transportation related costs of $26 million.
Production
Average production decreased one MBOED in 2024 compared with 2023, primarily due to normal field decline.
The production decrease was partly offset by new wells online at our Western North Slope and Greater Kuparuk Area assets.
Acquisition of Additional Working Interest in Kuparuk River Unit and Prudhoe Bay Unit
After exercising our preferential rights, we completed an acquisition of additional working interest in both the Kuparuk River Unit and the Prudhoe Bay Unit in the fourth quarter of 2024. Production from the additional working interest averaged approximately five MBOED each month for November and December 2024. See Note 3. | | | | | |
| 43 | ConocoPhillips 2024 10-K |
Lower 48
| | | | | | | | | | | |
| | | |
| 2024 | 2023 | 2022 |
Select financial data by segment before-tax ($MM) | | | |
| Sales and other operating revenues ($MM) | $ | 37,026 | | 38,237 | | 52,903 | |
| Production and operating expenses ($MM) | 4,751 | | 4,199 | | 3,627 | |
| Depreciation, depletion and amortization ($MM) | 6,442 | | 5,722 | | 4,865 | |
| Taxes other than income taxes ($MM) | 1,378 | | 1,352 | | 1,693 | |
| | | |
Net Income (Loss) ($MM) | $ | 5,175 | | 6,461 | | 11,015 | |
| | | |
| Average Net Production | | | |
| Crude oil (MBD) | 602 | | 569 | | 534 | |
| Natural gas liquids (MBD) | 279 | | 256 | | 221 | |
| Natural gas (MMCFD) | 1,625 | | 1,457 | | 1,402 | |
Total Production (MBOED) | 1,152 | | 1,067 | | 989 | |
Total Production (MMBOE) | 422 | | 389 | | 361 | |
| | | |
| Average Sales Prices | | | |
| Crude oil ($ per bbl) | $ | 74.17 | | 76.19 | | 94.46 | |
| Natural gas liquids ($ per bbl) | 22.02 | | 21.73 | | 35.36 | |
| Natural gas ($ per mcf) | 0.87 | | 2.12 | | 5.92 | |
The Lower 48 segment consists of operations located in the contiguous U.S. and the Gulf of Mexico and commercial operations. During 2024, the Lower 48 contributed 63 percent of our consolidated liquids production and 74 percent of our consolidated natural gas production.
Net Income (Loss)
Lower 48 reported earnings of $5,175 million in 2024, compared with earnings of $6,461 million in 2023.
Decreases to earnings included lower revenues resulting from lower overall commodity prices of $904 million and the timing of sales as compared with 2023, partly offset by higher volumes of $1,003 million, which includes volumes added from our acquisition of Marathon Oil. Additional decreases to earnings included higher DD&A of $562 million, driven by higher production of $250 million, higher rates of $181 million and impacts from our acquisition of Marathon Oil of $139 million; higher production and operating expenses of $431 million, driven by higher transportation related costs of $132 million, expenses associated with our acquisition of Marathon Oil of $110 million and higher lease operating expenses of $100 million; as well as the absence of gains associated with the divestiture of an equity investment of $100 million. See Note 3. Production
Total average production increased 85 MBOED in 2024 compared with 2023, primarily due to new wells online from our development programs in Delaware Basin, Eagle Ford, Midland Basin and Bakken and the impact from assets acquired from Marathon Oil. See Note 3. The production increase was partly offset by normal field decline and higher unplanned downtime across all basins.
Acquisition of Marathon Oil
On November 22, 2024, we completed our acquisition of Marathon Oil. The transaction added additional assets to our Lower 48 segment across several basins. Production from Lower 48 assets acquired from Marathon Oil averaged approximately 334 MBOED in the month of December 2024. See Note 3. Planned Dispositions
We recently entered into agreements to sell noncore assets within our Lower 48 segment that are expected to close in the first half of 2025 for approximately $600 million, subject to customary closing adjustments. See Note 3. | | | | | |
| ConocoPhillips 2024 10-K | 44 |
Canada
| | | | | | | | | | | |
| | | |
| 2024 | 2023 | 2022 |
Select financial data by segment before-tax ($MM) | | | |
| Sales and other operating revenues ($MM) | $ | 3,514 | | 3,006 | | 3,714 | |
| Production and operating expenses ($MM) | 902 | | 619 | | 591 | |
| Depreciation, depletion and amortization ($MM) | 639 | | 420 | | 402 | |
| Taxes other than income taxes ($MM) | 31 | | 26 | | 21 | |
| | | |
Net Income (Loss) ($MM) | $ | 712 | | 402 | | 714 | |
| | | |
| Average Net Production | | | |
| Crude oil (MBD) | 17 | | 9 | | 6 | |
| Natural gas liquids (MBD) | 6 | | 3 | | 3 | |
| Bitumen (MBD) | 122 | | 81 | | 66 | |
| Natural gas (MMCFD) | 115 | | 65 | | 61 | |
Total Production (MBOED) | 164 | | 104 | | 85 | |
Total Production (MMBOE) | 60 | | 38 | | 31 | |
| | | |
| Average Sales Prices | | | |
| Crude oil ($ per bbl) | $ | 64.47 | | 66.19 | | 79.94 | |
| Natural gas liquids ($ per bbl) | 29.59 | | 26.13 | | 37.70 | |
| Bitumen ($ per bbl) | 47.92 | | 42.15 | | 55.56 | |
| Natural gas ($ per mcf)* | 0.54 | | 1.80 | | 3.62 | |
*Average sales prices include unutilized transportation costs.
The Canada segment operations include the Surmont oil sands development in Alberta, the Montney unconventional play in British Columbia and commercial operations. In 2024, Canada contributed ten percent of our consolidated liquids production and five percent of our consolidated natural gas production.
Net Income (Loss)
Canada reported earnings of $712 million in 2024 compared with earnings of $402 million in 2023.
Earnings included higher revenues resulting from higher volumes of $676 million; driven by our increased working interest in Surmont of $584 million and new wells online in the Montney of $180 million, partially offset by planned turnaround activity at Surmont impacting revenues by $157 million. Additionally, revenues increased from higher overall commodity prices of $153 million, driven primarily by higher bitumen prices. See Note 3.
Decreases to earnings included higher production and operating expenses of $215 million; driven by an impact of $175 million related to higher overall production, including our increased working interest in Surmont; as well as expenses of $55 million related to turnaround activity at Surmont. Additional decreases to earnings included higher DD&A expenses of $166 million resulting from higher volumes and the absence of a $92 million tax benefit recognized upon the closing of a Canada Revenue Agency audit in 2023.
Production
Total average production increased 60 MBOED in 2024 compared with 2023. Increases to production resulted from our increased working interest in Surmont as well as new wells online in the Montney and Surmont. See Note 3. These production increases were partly offset by higher downtime resulting from a planned turnaround activity at a Surmont central processing facility and normal field decline.
| | | | | |
| 45 | ConocoPhillips 2024 10-K |
Europe, Middle East and North Africa
| | | | | | | | | | | |
| | | |
| 2024 | 2023 | 2022 |
Select financial data by segment before-tax ($MM) | | | |
| Sales and other operating revenues ($MM) | $ | 5,788 | | 5,854 | | 11,270 | |
| Production and operating expenses ($MM) | 671 | | 593 | | 590 | |
| Depreciation, depletion and amortization ($MM) | 761 | | 587 | | 736 | |
| Taxes other than income taxes ($MM) | 41 | | 39 | | 39 | |
| | | |
Net Income (Loss) ($MM) | $ | 1,189 | | 1,189 | | 2,244 | |
| | | |
| Consolidated Operations | | | |
| Average Net Production | | | |
| Crude oil (MBD) | 118 | | 112 | | 107 | |
| Natural gas liquids (MBD) | 4 | | 4 | | 3 | |
| Natural gas (MMCFD) | 371 | | 308 | | 328 | |
Total Production (MBOED) | 184 | | 168 | | 165 | |
Total Production (MMBOE) | 67 | | 61 | | 60 | |
| | | |
| Average Sales Prices | | | |
| Crude oil ($ per bbl) | $ | 80.92 | | 83.96 | | 99.20 | |
| Natural gas liquids ($ per bbl) | 40.29 | | 41.13 | | 54.52 | |
| Natural gas ($ per mcf) | 10.70 | | 12.68 | | 33.39 | |
The Europe, Middle East and North Africa segment consists of operations principally located in the Norwegian sector of the North Sea, the Norwegian Sea, Qatar, Libya, Equatorial Guinea and commercial and terminalling operations in the U.K. In 2024, our Europe, Middle East and North Africa operations contributed nine percent of our consolidated liquids production and 17 percent of our consolidated natural gas production.
Net Income (Loss)
The Europe, Middle East and North Africa segment reported earnings of $1,189 million in 2024 compared with earnings of $1,189 million in 2023.
Earnings in 2024 included lower revenues resulting from lower overall commodity prices of $118 million and the timing of sales as compared with 2023, partly offset by higher volumes of $144 million, which includes $49 million from volumes added from our acquisition of Marathon Oil. Additional decreases to earnings included higher DD&A of $51 million.
Consolidated Production
Average consolidated production increased 16 MBOED in 2024, compared with 2023. The consolidated production increase was primarily due to new wells online and improved performance in Norway, as well as the impact from assets acquired from Marathon Oil. See Note 3. The production increase was partly offset by normal field decline.
Acquisition of Marathon Oil
On November 22, 2024, we completed our acquisition of Marathon Oil. The transaction added Equatorial Guinea to our global portfolio which resides in our Europe, Middle East and North Africa segment. Production from Equatorial Guinea averaged approximately 40 MBOED in the month of December 2024. See Note 3. Exploration Activity
In 2024, we charged approximately $40 million before-tax as dry hole expenses primarily for two partner operated exploration wells in the Alvheim area in the Norwegian sector of the North Sea and the Busta suspended discovery well on license PL782S. See Note 6. | | | | | |
| ConocoPhillips 2024 10-K | 46 |
Asia Pacific
| | | | | | | | | | | |
| | | |
| 2024 | 2023 | 2022 |
Select financial data by segment before-tax ($MM) | | | |
| Sales and other operating revenues ($MM) | $ | 1,847 | | 1,913 | | 2,606 | |
| Production and operating expenses ($MM) | 384 | | 391 | | 365 | |
| Depreciation, depletion and amortization ($MM) | 425 | | 455 | | 518 | |
| Taxes other than income taxes ($MM) | 109 | | 117 | | 243 | |
| | | |
Net Income (Loss) ($MM) | $ | 1,724 | | 1,961 | | 2,736 | |
| | | |
| Consolidated Operations | | | |
| Average Net Production | | | |
| Crude oil (MBD) | 59 | | 60 | | 61 | |
| | | |
| Natural gas (MMCFD) | 50 | | 48 | | 114 | |
Total Production (MBOED) | 67 | | 68 | | 80 | |
Total Production (MMBOE) | 25 | | 25 | | 29 | |
| | | |
| Average Sales Prices | | | |
| Crude oil ($ per bbl) | $ | 82.42 | | 84.79 | | 105.52 | |
| | | |
| Natural gas ($ per mcf) | 3.74 | | 3.95 | | 5.84 | |
The Asia Pacific segment consists of operations in China, Malaysia, and Australia, and commercial operations in China, Singapore and Japan. During 2024, Asia Pacific contributed four percent of our consolidated liquids production and two percent of our consolidated natural gas production.
Net Income (Loss)
Asia Pacific reported earnings of $1,724 million in 2024, compared with $1,961 million in 2023.
Decreases to earnings included lower revenues resulting from lower commodity prices of $49 million and lower volumes of $20 million. Additional decreases to earnings included the absence of a tax benefit recognized in 2023 from the reversal of a tax reserve. See Note 16. Earnings also decreased due to lower equity in earnings of affiliates of $57 million.
Increases to earnings included lower DD&A expenses of $27 million resulting from lower volumes.
Consolidated Production
Average consolidated production decreased one MBOED in 2024, compared with 2023. The decrease was primarily due to normal field decline.
These production decreases were partly offset by development activity at Bohai Bay in China.
| | | | | |
| 47 | ConocoPhillips 2024 10-K |
Other International | | | | | | | | | | | |
| | | |
| 2024 | 2023 | 2022 |
Net Income (Loss) ($MM) | $ | (1) | | (13) | | (51) | |
The Other International segment consists of activities associated with prior operations in other countries.
Earnings from our Other International operations improved $12 million in 2024, compared with 2023.
Corporate and Other
| | | | | | | | | | | |
| Millions of Dollars |
| 2024 | 2023 | 2022 |
| Net Income (Loss) | | | |
| Net interest expense | $ | (379) | | (360) | | (600) | |
| Corporate G&A expenses | (716) | | (357) | | (244) | |
| Technology | (137) | | (34) | | 32 | |
| Other income (expense) | 352 | | (70) | | 482 | |
| $ | (880) | | (821) | | (330) | |
Net interest consists of interest and financing expense, net of interest income and capitalized interest.
Corporate G&A expenses include compensation programs and staff costs. These expenses increased by $359 million in 2024 compared with 2023, primarily due to transaction expenses of $432 million associated with our acquisition of Marathon Oil, partially offset by lower compensation and benefits costs, including mark-to-market impacts of certain key employee compensation programs. See Note 15. Technology includes our investments in low-carbon technology opportunities as well as other new technologies or businesses and licensing revenues. Other new technologies or businesses and LNG licensing activities are focused on both conventional and tight oil reservoirs, shale gas, oil sands, enhanced oil recovery as well as LNG. Earnings in Technology decreased due to increased costs in low-carbon and other new technologies and lower licensing revenues.
Other income (expense) or "Other" includes certain foreign currency transaction gains and losses, environmental costs associated with sites no longer in operation, other costs not directly associated with an operating segment, gains or losses on early retirement of debt, holding gains or losses on equity securities and pension settlement expense. Earnings in “Other” increased by $422 million in 2024 compared with 2023. This was primarily due to a tax benefit of $455 million as a result of the acquisition of Marathon Oil and the subsequent utilization of foreign tax credits, and the absence of $89 million loss associated with forward foreign exchange contracts to buy CAD, in support of our acquisition of additional working interest in Surmont in 2023. Decreases to earnings in "Other" were driven by a loss of $147 million associated with the extinguishment of debt in the fourth quarter of 2024. See Note 3, Note 8 and Note 16. | | | | | |
| ConocoPhillips 2024 10-K | 48 |
| | | | | |
| Capital Resources and Liquidity | |
Capital Resources and Liquidity
Financial Indicators
| | | | | | | | | | | |
| Millions of Dollars
Except as Indicated |
| 2024 | 2023 | 2022 |
| | | |
| Net cash provided by operating activities | $ | 20,124 | | 19,965 | | 28,314 | |
| Cash and cash equivalents | 5,607 | | 5,635 | | 6,458 | |
| Short-term investments | 507 | | 971 | | 2,785 | |
| Short-term debt | 1,035 | | 1,074 | | 417 | |
| Total debt | 24,324 | | 18,937 | | 16,643 | |
| Total equity | 64,796 | | 49,279 | | 48,003 | |
| Percent of total debt to capital* | 27 | % | 28 | | 26 | |
| Percent of floating-rate debt to total debt | 1 | % | 2 | | 2 | |
Balance Sheet related line items are shown as of December 31st.
*Capital includes total debt and total equity.
To meet our short- and long-term liquidity requirements, we look to a variety of funding sources, including cash generated from operating activities, our commercial paper and credit facility programs and our ability to sell securities using our shelf registration statement. In 2024, the primary uses of our available cash were $12.1 billion to support our ongoing capital expenditures and investments program, which included $0.4 billion of spend related to fourth-quarter acquisitions; $5.5 billion to repurchase common stock; and $3.6 billion to pay the ordinary dividend and VROC. In addition to cash from operating activities, the other primary sources of capital were $5.6 billion in proceeds from long-term debt issuances, of which $4.1 billion was used to repurchase certain existing Marathon Oil debt assumed in the acquisition and ConocoPhillips debt; and $0.4 billion net sales of short-term investments. In 2024, cash and cash equivalents remained flat with 2023 at $5.6 billion. See Note 8. At December 31, 2024, we had cash and cash equivalents of $5.6 billion, short-term investments of $0.5 billion, and available borrowing capacity under our credit facility of $5.5 billion, totaling approximately $11.6 billion of liquidity. We believe current cash balances and cash generated by operations, together with access to external sources of funds as described below in the “Significant Changes in Capital” section, will be sufficient to meet our funding requirements in the near- and long-term, including our capital spending program, capital return program and required debt payments.
Significant Changes in Capital
Operating Activities
Cash provided by operating activities in 2024 totaled $20.1 billion, compared with $20.0 billion for 2023, and $28.3 billion for 2022. In 2024, cash provided by operating activities improved from 2023 due to increased production primarily from Canada and the Lower 48, including the Surmont 50 percent working interest acquired in the fourth quarter of 2023 and our acquisition of Marathon Oil in late 2024. The increase in production was partly offset by lower commodity prices and lower distributions from equity affiliates. See Note 3.
The decrease in cash provided by operating activities from 2023 compared to 2022 is primarily due to lower realized commodity prices across all products, partly offset by higher sales volumes, net of associated production and operating costs.
Our short- and long-term operating cash flows are highly dependent upon prices for crude oil, bitumen, natural gas, LNG and NGLs. Prices and margins in our industry have historically been volatile and are driven by market conditions over which we have no control. Absent other mitigating factors, as these prices and margins fluctuate, we would expect a corresponding change in our operating cash flows.
| | | | | |
| 49 | ConocoPhillips 2024 10-K |
| | | | | |
| Capital Resources and Liquidity | |
The level of absolute production volumes, as well as product and location mix, is another significant factor impacting our cash flows. Full-year production averaged 1,987 MBOED in 2024, an increase of 161 MBOED or nine percent compared to 2023. First-quarter 2025 production is expected to be 2.34 MMBOED to 2.38 MMBOED. Future production is subject to numerous uncertainties, including, among others, the volatile crude oil and natural gas price environment, which may impact investment decisions; the effects of price changes on production sharing and variable-royalty contracts; acquisition and disposition of fields; field production decline rates; new technologies; operating efficiencies; timing of startups and major turnarounds; political instability; weather-related disruptions; and the addition of proved reserves through exploratory success and their timely and cost-effective development. While we actively monitor and manage these factors, changes in production levels can cause variability in cash flows, although we generally experience less variability in our cash flows due to changes in production levels than due to changes in commodity prices.
Investing Activities
In 2024, we invested $12.1 billion in capital expenditures and investments; $0.8 billion of which was primarily payments towards our equity investments in LNG projects, including Port Arthur Liquefaction Holdings, LLC (PALNG), QatarEnergy LNG NFE(4) (NFE4) and QatarEnergy LNG NFS(3) (NFS3); and $0.4 billion of spend related to fourth-quarter acquisitions. See Note 3. The remaining $10.9 billion funded our operating capital program. Capital expenditures invested in 2023 and 2022 were $11.2 billion and $10.2 billion, respectively. See the “Capital Expenditures and Investments” section.
In conjunction with the announcement of our acquisition of Marathon Oil, we communicated a disposition target of approximately $2 billion of assets across the portfolio. We recently entered into agreements to sell noncore assets within our Lower 48 segments that are expected to close in the first half of 2025 for approximately $600 million, subject to customary closing adjustments. See Note 3.
After exercising our preferential rights, we completed an acquisition that increased our working interest by approximately five percent in the Kuparuk River Unit and approximately 0.4 percent in the Prudhoe Bay Unit in Alaska from Chevron U.S.A. Inc. and Union Oil Company of California in the fourth quarter of 2024 for $296 million before customary adjustments. See Note 3.
In October 2023, we acquired the remaining 50 percent working interest in Surmont from TotalEnergies EP Canada Ltd. for approximately $2.7 billion of cash after customary adjustments. We funded this transaction by issuing new long-term debt. See Note 3 and Note 8.
Proceeds from asset sales were $0.3 billion in 2024, $0.6 billion in 2023 and $3.5 billion in 2022. In 2022, we received proceeds of $1.4 billion for the sale of our remaining 91 million common shares of Cenovus Energy (CVE), proceeds of approximately $1.5 billion, primarily from asset divestitures in our Asia Pacific and Lower 48 segments, and $0.5 billion in contingent payments associated with prior divestitures. See Note 3 and Note 5. We invest in short-term investments as part of our cash investment strategy, the primary objective of which is to protect principal, maintain liquidity and provide yield and total returns; these investments include time deposits, commercial paper, as well as debt securities classified as available for sale. Funds for short-term investments needs to support our operating plan and provide resiliency to react to short-term price volatility are invested in highly liquid instruments with maturities within the year. Funds we consider available to maintain resiliency in longer term price downturns and to capture opportunities outside a given operating plan may be invested in instruments with maturities greater than one year. See Note 11 and Note 19. Investing activities in 2024 included net sales of $415 million of investments. We had net sales of $961 million of short-term investments and net purchases of $546 million of long-term investments. See Note 18. | | | | | |
| ConocoPhillips 2024 10-K | 50 |
| | | | | |
| Capital Resources and Liquidity | |
Financing Activities
In November 2024, we acquired Marathon Oil. At closing, the acquisition was valued at $16.5 billion and was allocated to assets acquired and liabilities assumed. ConocoPhillips common stock was issued and exchanged for outstanding Marathon Oil shares. With the acquisition, we also assumed Marathon Oil's debt of approximately $4.6 billion. See Note 3 and Note 8.
Our debt balance at December 31, 2024 was $24.3 billion compared with $18.9 billion at December 31, 2023. The current portion of debt, including payments for finance leases, is $1.0 billion. In 2024, the company retired $726 million principal amount of Notes at maturity consisting of $265 million of our 3.35% Notes and $461 million of our 2.125% Notes. In addition, we completed concurrent debt transactions consisting of new long-term debt issuances of $5.2 billion; a $4.1 billion repurchase of certain existing Marathon Oil and ConocoPhillips debt (with priority for Marathon Oil debt assumed); a non-cash obligor exchange offer to retire $0.9 billion of Marathon Oil debt in exchange for new ConocoPhillips debt; and remarketing of $0.4 billion in available municipal bonds. The debt transactions simplified our capital structure, extended the debt portfolio's weighted average maturity, lowered its weighted average coupon and reduced near-term maturities. See Note 8.
In 2023, we issued $2.7 billion principal amount of new debt to fund our acquisition of the remaining 50 percent working interest in Surmont and completed refinancing transactions consisting of $1.1 billion in tender offers to repurchase existing debt with cash and a $1.1 billion new debt issuance to fund the repurchases, extending the weighted average maturity of our portfolio from 15 to 17 years and reducing near-term debt maturities. See Note 8. In 2022, we repurchased notes, retired floating rate debt and executed a debt refinancing comprised of concurrent transactions including new debt issuances, a cash tender offer and debt exchange offers. In aggregate, these transactions along with naturally maturing debt, reduced the company's total debt by $3.3 billion.
In 2022, we refinanced our revolving credit facility from a total aggregate principal amount of $6.0 billion to $5.5 billion with an expiration date of February 2027. Our revolving credit facility may be used for direct bank borrowings, the issuance of letters of credit totaling up to $500 million, or as support for our commercial paper program. The revolving credit facility is broadly syndicated among financial institutions and does not contain any material adverse change provisions or any covenants requiring maintenance of specified financial ratios or credit ratings. The facility agreement contains a cross-default provision relating to the failure to pay principal or interest on other debt obligations of $200 million or more by ConocoPhillips, or any of its consolidated subsidiaries. The amount of the facility is not subject to redetermination prior to its expiration date.
Credit facility borrowings may bear interest at a margin above the Secured Overnight Financing Rate (SOFR). The agreement calls for commitment fees on available, but unused, amounts. The agreement also contains early termination rights if our current directors or their approved successors cease to be a majority of the Board of Directors.
The revolving credit facility supports ConocoPhillips Company’s ability to issue up to $5.5 billion of commercial paper, which is primarily a funding source for short-term working capital needs. Commercial paper maturities are generally limited to 90 days. With no commercial paper outstanding and no direct borrowings or letters of credit, we had access to $5.5 billion in available borrowing capacity under our revolving credit facility at December 31, 2024.
In November 2024, Fitch affirmed our long-term credit rating. The current credit ratings on our long-term debt are:
•Fitch: “A” with a “stable” outlook
•S&P: “A-” with a “stable” outlook
•Moody's: "A2" with a "stable" outlook
See Note 8 for additional information on debt and the revolving credit facility. We do not have any ratings triggers on any of our corporate debt that would cause an automatic default, and thereby impact our access to liquidity, upon downgrade of our credit ratings. If our credit ratings are downgraded from their current levels, it could increase the cost of corporate debt available to us and restrict our access to the commercial paper markets. If our credit rating were to deteriorate to a level prohibiting us from accessing the commercial paper market, we would still be able to access funds under our revolving credit facility.
| | | | | |
| 51 | ConocoPhillips 2024 10-K |
| | | | | |
| Capital Resources and Liquidity | |
Certain of our project-related contracts, commercial contracts and derivative instruments contain provisions requiring us to post collateral. Many of these contracts and instruments permit us to post either cash or letters of credit as collateral. At December 31, 2024 and December 31, 2023, we had direct bank letters of credit of $278 million and $340 million, respectively, which secured performance obligations related to various purchase commitments incident to the ordinary conduct of business. In the event of a credit rating downgrade, we may be required to post additional letters of credit.
Shelf Registration
We have a universal shelf registration statement on file with the SEC under which we have the ability to issue and sell an indeterminate amount of various types of debt and equity securities.
Capital Requirements
For information about our capital expenditures and investments, see the “Capital Expenditures and Investments” section.
Our debt balance at December 31, 2024, was $24.3 billion, an increase of $5.4 billion from the balance at December 31, 2023 of $18.9 billion. In 2024, the company assumed $4.6 billion principal of debt with our acquisition of Marathon Oil and retired $726 million principal amount of Notes at maturity. In addition, we completed concurrent debt transactions consisting of new long-term debt issuances of $5.2 billion; a $4.1 billion repurchase of certain existing Marathon Oil and ConocoPhillips debt; a non-cash obligor exchange offer to retire $0.9 billion of Marathon Oil debt in exchange for new ConocoPhillips debt; and the remarketing of $0.4 billion in available municipal bonds. The debt transactions simplified our capital structure, extended the debt portfolio's weighted average maturity, lowered its weighted average coupon and reduced near-term maturities. See Note 8.
In February 2025, we announced our 2025 planned return of capital to shareholders of $10 billion, at current commodity prices, through our return of capital framework. We plan to deliver a compelling, growing ordinary dividend and through-cycle share repurchases. We anticipate returning greater than 30 percent of cash from operating activities during periods where commodity prices are meaningfully higher than our planning price range. Our 2024 total capital returned was $9.1 billion.
In 2023, we issued $2.7 billion principal amount of new debt to fund our acquisition of the remaining 50 percent working interest in Surmont and completed refinancing transactions consisting of $1.1 billion in tender offers to repurchase existing debt with cash and a $1.1 billion new debt issuance to fund the repurchases. In 2022, we executed concurrent debt refinancing transactions, repurchased existing notes, and retired floating rate notes upon natural maturity, that in aggregate reduced our total debt by $3.3 billion, while also lowering our annual cash interest expense and extending the weighted average maturity of our debt portfolio. See Note 8 for information regarding debt and Note 18 for information regarding non-cash consideration of the Surmont transaction.
Consistent with our commitment to deliver value to shareholders, for the full year of 2024, we paid ordinary dividends of $2.52 per common share and VROC payments of $0.60 per common share. In the fourth quarter of 2024, we incorporated the equivalent amount of prior quarter VROC into the ordinary dividend. In 2023 we paid ordinary dividends of $2.11 and VROC payments of $2.50 per common share and in 2022 we paid an ordinary dividend of $1.89 and VROC payments of $2.60. In February 2025, we declared a first-quarter ordinary dividend of $0.78 per common share payable March 3, 2025, to shareholders of record on February 17, 2025.
VROC remains a discretionary option in elevated price environments. The ordinary dividend and VROC are subject to numerous considerations and are determined and approved each quarter by the Board of Directors. Beginning in the first quarter of 2024, we announced and paid quarterly dividends and VROC payments concurrently. VROC payments had been paid in the subsequent quarter of announcement in 2023 and 2022.
In late 2016, we initiated our current share repurchase program. In October 2024, our Board of Directors approved an increase from our prior authorization of $45 billion by a total of the lesser of $20 billion or the number of shares issued in our acquisition of Marathon Oil, such that the company is not to exceed $65 billion in aggregate repurchases. Share repurchases were $5.5 billion, $5.4 billion, and $9.3 billion in 2024, 2023, and 2022, respectively. As of December 31, 2024, share repurchases since the inception of our current program totaled 432.6 million shares and $34.3 billion since 2016. Repurchases are made at management’s discretion, at prevailing prices, subject to market conditions and other factors.
| | | | | |
| ConocoPhillips 2024 10-K | 52 |
| | | | | |
| Capital Resources and Liquidity | |
As of December 31, 2024, in addition to the priorities described above, we have contractual obligations to purchase goods and services of approximately $31.6 billion. We expect to fulfill $7.5 billion of these obligations in 2025. These figures exclude purchase commitments for jointly owned fields and facilities where we are not the operator. Purchase obligations of $13.0 billion are related to agreements to access and utilize the capacity of third-party equipment and facilities, including pipelines and LNG product terminals, to transport, process, treat and store commodities. Purchase obligations of $16.8 billion are related to market-based contracts for commodity product purchases with third parties. The remainder is primarily our net share of purchase commitments for materials and services for jointly owned fields and facilities where we are the operator.
Capital Expenditures and Investments | | | | | | | | | | | |
| Millions of Dollars |
| 2024 | 2023 | 2022 |
| Alaska | $ | 3,194 | | 1,705 | | 1,091 | |
| Lower 48 | 6,510 | | 6,487 | | 5,630 | |
| Canada | 551 | | 456 | | 530 | |
| Europe, Middle East and North Africa | 1,021 | | 1,111 | | 998 | |
| Asia Pacific | 370 | | 354 | | 1,880 | |
| Other International | — | | — | | — | |
| Corporate and Other | 472 | | 1,135 | | 30 | |
| Capital Program* | $ | 12,118 | | 11,248 | | 10,159 | |
* Excludes capital related to acquisitions of businesses, net of cash acquired.
Our capital expenditures and investments for the three-year period ended December 31, 2024, totaled $33.5 billion. The 2024 capital expenditures and investments supported key operating activities and acquisitions, primarily:
•Appraisal and development activities in Alaska related to the Western North Slope, inclusive of Willow, and development activities in the Greater Kuparuk Area.
•Development activities in the Lower 48, primarily in the Delaware Basin, Eagle Ford, Midland Basin and Bakken.
•Appraisal and development activities in the Montney as well as development and optimization of Surmont in Canada.
•Development activities across assets in Norway.
•Continued development activities in Malaysia and China.
•Investments in PALNG, NFE4 and NFS3.
2025 Capital Budget
In February 2025, we announced our 2025 operating plan capital is expected to be $12.9 billion. The plan includes funding for ongoing development drilling programs, major projects, exploration and appraisal activities and base maintenance.
| | | | | |
| 53 | ConocoPhillips 2024 10-K |
| | | | | |
| Capital Resources and Liquidity | |
Guarantor Summarized Financial Information
We have various cross guarantees among ConocoPhillips, ConocoPhillips Company and Burlington Resources LLC with respect to publicly held debt securities. ConocoPhillips Company is 100 percent owned by ConocoPhillips. Burlington Resources LLC is 100 percent owned by ConocoPhillips Company. ConocoPhillips and/or ConocoPhillips Company have fully and unconditionally guaranteed the payment obligations of Burlington Resources LLC with respect to its publicly held debt securities. Similarly, ConocoPhillips has fully and unconditionally guaranteed the payment obligations of ConocoPhillips Company with respect to its publicly held debt securities. In addition, ConocoPhillips Company has fully and unconditionally guaranteed the payment obligations of ConocoPhillips with respect to its publicly held debt securities. All guarantees are joint and several.
The following tables present summarized financial information for the Obligor Group, as defined below:
•The Obligor Group will reflect guarantors and issuers of guaranteed securities consisting of ConocoPhillips, ConocoPhillips Company and Burlington Resources LLC.
•Consolidating adjustments for elimination of investments in and transactions between the collective guarantors and issuers of guaranteed securities are reflected in the balances of the summarized financial information.
•Non-Obligated Subsidiaries are excluded from this presentation.
Transactions and balances reflecting activity between the Obligors and Non-Obligated Subsidiaries are presented separately below:
Summarized Income Statement Data
| | | | | |
| Millions of Dollars |
| 2024 |
| Revenues and Other Income | $ | 35,033 | |
| Income (loss) before income taxes* | 8,252 | |
| |
| Net Income (Loss) | 9,245 | |
*Includes approximately $8.6 billion of purchased commodities expense for transactions with Non-Obligated Subsidiaries.
Summarized Balance Sheet Data
| | | | | |
| Millions of Dollars |
| December 31, 2024 |
| Current assets | $ | 6,077 | |
| Amounts due from Non-Obligated Subsidiaries, current | 319 | |
| Noncurrent assets | 120,845 | |
| Amounts due from Non-Obligated Subsidiaries, noncurrent | 11,719 | |
| Current liabilities | 4,504 | |
| Amounts due to Non-Obligated Subsidiaries, current | 935 | |
| Noncurrent liabilities | 64,088 | |
| Amounts due to Non-Obligated Subsidiaries, noncurrent | 41,826 | |
| | | | | |
| ConocoPhillips 2024 10-K | 54 |
| | | | | |
| Capital Resources and Liquidity | |
Contingencies
We are subject to legal proceedings, claims and liabilities that arise in the ordinary course of business. We accrue for losses associated with legal claims when such losses are considered probable and the amounts can be reasonably estimated. See “Critical Accounting Estimates” and Note 10 for information on contingencies. Legal and Tax Matters
We are subject to various lawsuits and claims, including but not limited to matters involving oil and gas royalty and severance tax payments, gas measurement and valuation methods, contract disputes, environmental damages, climate change, personal injury and property damage. Our primary exposures for such matters relate to alleged royalty and tax underpayments on certain federal, state and privately owned properties, claims of alleged environmental contamination and damages from historic operations and climate change. We will continue to defend ourselves vigorously in these matters.
Our legal organization applies its knowledge, experience and professional judgment to the specific characteristics of our cases, employing a litigation management process to manage and monitor the legal proceedings against us. Our process facilitates the early evaluation and quantification of potential exposures in individual cases. This process also enables us to track those cases that have been scheduled for trial and/or mediation. Based on professional judgment and experience in using these litigation management tools and available information about current developments in all our cases, our legal organization regularly assesses the adequacy of current accruals and determines if adjustment of existing accruals, or establishment of new accruals, is required. See Note 16. Environmental
We are subject to the same numerous international, federal, state and local environmental laws and regulations as other companies in our industry. The most significant of these environmental laws and regulations include, among others, the:
•U.S. Federal Clean Air Act, which governs air emissions;
•U.S. Federal Clean Water Act, which governs discharges to water bodies;
•EU Regulation for Registration, Evaluation, Authorization and Restriction of Chemicals (REACH);
•U.S. Federal Comprehensive Environmental Response, Compensation and Liability Act (CERCLA or Superfund), which imposes liability on generators, transporters and arrangers of hazardous substances at sites where hazardous substance releases have occurred or are threatening to occur;
•U.S. Federal Resource Conservation and Recovery Act (RCRA), which governs the treatment, storage, and disposal of solid waste;
•U.S. Federal Oil Pollution Act of 1990 (OPA90), under which owners and operators of onshore facilities and pipelines, lessees or permittees of an area in which an offshore facility is located, and owners and operators of vessels are liable for removal costs and damages that result from a discharge of oil into navigable waters of the U.S.;
•U.S. Federal Emergency Planning and Community Right-to-Know Act (EPCRA), which requires facilities to report toxic chemical inventories with local emergency planning committees and response departments;
•U.S. Federal Safe Drinking Water Act, which governs the disposal of wastewater in underground injection wells;
•U.S. Department of the Interior regulations, which relate to offshore oil and gas operations in U.S. waters and impose liability for the cost of pollution cleanup resulting from operations, as well as potential liability for pollution damages; and
•EU Trading Directive resulting in EU Emissions Trading Scheme (EU ETS).
These laws and their implementing regulations set limits on emissions and, in the case of discharges to water, establish water quality limits. They also establish standards and impose obligations for the remediation of releases of hazardous substances and hazardous wastes. In most cases, these regulations require permits in association with new or modified operations. These permits can require an applicant to collect substantial information in connection with the application process, which can be expensive and time-consuming. In addition, there can be delays associated with notice and comment periods and the agency’s processing of the application. Many of the delays associated with the permitting process are beyond the control of the applicant.
Many states and foreign countries where we operate also have or are developing, similar environmental laws and regulations governing these same types of activities. While similar, in some cases these regulations may impose additional, or more stringent, requirements that can add to the cost and difficulty of marketing or transporting products across state and international borders.
| | | | | |
| 55 | ConocoPhillips 2024 10-K |
| | | | | |
| Capital Resources and Liquidity | |
The ultimate financial impact arising from environmental laws and regulations is neither clearly known nor easily determinable as new standards, such as air emission standards and water quality standards, continue to evolve. However, environmental laws and regulations, including those that may arise to address concerns about global climate change, are expected to continue to have an increasing impact on our operations in the U.S. and in other countries in which we operate. Notable areas of potential impacts include air emission compliance and remediation obligations in the U.S. and Canada.
An example is the use of hydraulic fracturing, an essential completion technique that facilitates production of oil and natural gas otherwise trapped in lower permeability rock formations. A range of local, state, federal, or national laws and regulations currently govern hydraulic fracturing operations, with hydraulic fracturing currently prohibited in some jurisdictions. Although hydraulic fracturing has been conducted for many decades, potential new laws, regulations and permitting requirements from various state environmental agencies, and others could result in increased costs, operating restrictions, operational delays and/or limit the ability to develop oil and natural gas resources. Governmental restrictions on hydraulic fracturing could impact the overall profitability or viability of certain of our oil and natural gas investments. We have adopted operating principles that incorporate established industry standards designed to meet or exceed government requirements. Our practices continually evolve as technology improves and regulations change.
We also are subject to certain laws and regulations relating to environmental remediation obligations associated with current and past operations. Such laws and regulations include CERCLA and RCRA and their equivalents in their respective jurisdictions. Longer-term expenditures are subject to considerable uncertainty and may fluctuate significantly.
We occasionally receive requests for information or notices of potential liability from the EPA and state environmental agencies alleging that we are a potentially responsible party under CERCLA or an equivalent state statute. On occasion, we also have been made a party to cost recovery litigation by those agencies or by private parties. These requests, notices and lawsuits assert potential liability for remediation costs at various sites that typically are not owned by us, but allegedly contain waste attributable to our past operations. As of December 31, 2024, there were 15 sites around the U.S. in which we were identified as a potentially responsible party under CERCLA and comparable state laws.
For most Superfund sites, our potential liability will be significantly less than the total site remediation costs because the percentage of waste attributable to us, versus that attributable to all other potentially responsible parties, is relatively low. Although liability of those potentially responsible is generally joint and several for federal sites and frequently so for state sites, other potentially responsible parties at sites where we are a party typically have had the financial strength to meet their obligations, and where they have not, or where potentially responsible parties could not be located, our share of liability has not increased materially. Many of the sites at which we are potentially responsible are still under investigation by the EPA or the state agencies concerned. Prior to actual cleanup, those potentially responsible normally assess site conditions, apportion responsibility and determine the appropriate remediation. In some instances, we may have no liability or attain a settlement of liability. Actual cleanup costs generally occur after the parties obtain EPA or equivalent state agency approval. There are relatively few sites where we are a major participant, and given the timing and amounts of anticipated expenditures, neither the cost of remediation at those sites nor such costs at all CERCLA sites, in the aggregate, is expected to have a material adverse effect on our competitive or financial condition.
Expensed environmental costs were $914 million in 2024 and are expected to be approximately $1.1 billion in 2025 and 2026. Capitalized environmental costs were $535 million in 2024 and are expected to be about $720 million and $656 million in 2025 and 2026, respectively.
Accrued liabilities for remediation activities are not reduced for potential recoveries from insurers or other third parties and are not discounted (except those assumed in a purchase business combination, which we do record on a discounted basis).
Many of these liabilities result from CERCLA, RCRA, and similar state or international laws that require us to undertake certain investigative and remedial activities at sites where we conduct or once conducted operations or at sites where ConocoPhillips-generated waste was disposed. The accrual also includes a number of sites we identified that may require environmental remediation but which are not currently the subject of CERCLA, RCRA, or other agency enforcement activities. The laws that require or address environmental remediation may apply retroactively and regardless of fault, the legality of the original activities or the current ownership or control of sites. If applicable, we accrue receivables for probable insurance or other third-party recoveries. In the future, we may incur significant costs under both CERCLA and RCRA.
| | | | | |
| ConocoPhillips 2024 10-K | 56 |
| | | | | |
| Capital Resources and Liquidity | |
Remediation activities vary substantially in duration and cost from site to site, depending on the mix of unique site characteristics, evolving remediation technologies, diverse regulatory agencies and enforcement policies, and the presence or absence of potentially liable third parties. Therefore, it is difficult to develop reasonable estimates of future site remediation costs.
At December 31, 2024, our balance sheet included total accrued environmental costs of $206 million, compared with $184 million at December 31, 2023, for remediation activities in the U.S. and Canada. We expect to incur a substantial amount of these expenditures within the next 30 years.
Notwithstanding any of the foregoing, and as with other companies engaged in similar businesses, environmental costs and liabilities are inherent concerns in our operations and products, and there can be no assurance that material costs and liabilities will not be incurred. However, we currently do not expect any material adverse effect upon our results of operations or financial position as a result of compliance with current environmental laws and regulations.
Climate Change
Continuing political and social attention to the issue of global climate change has resulted in a broad range of proposed or promulgated state, national and international laws focusing on GHG emissions reduction. These laws apply or could apply in countries where we have interests or may have interests in the future. Laws in this field continue to evolve and while it is not possible to accurately estimate either a timetable for implementation or our future compliance costs relating to implementation, such laws, if enacted, could have a material impact on our operational results and financial condition. Examples of legislation and precursors for possible regulation that do or could affect our operations include:
Emissions trading schemes.
•EU ETS is the program through which many of the EU member states aim to reduce emissions. Our cost of compliance with the EU ETS in 2024 was approximately $20 million (net share before-tax).
•The U.K. Emissions Trading Scheme (U.K. ETS) is the program with which the U.K. has replaced the EU ETS. Our cost of compliance with the U.K. ETS in 2024 was approximately $0.8 million (net share before-tax).
GHG regulations for emissions reductions.
•The Alberta Technology Innovation and Emissions Reduction (TIER) regulation requires any existing facility with emissions equal to or greater than 100,000 metric tonnes of carbon dioxide, or equivalent, per year to meet a facility benchmark intensity. The total cost of compliance related to this regulation in 2024 was approximately $4.5 million (net share before-tax) after savings from using our existing bank of offsets and performance credits ($7.7 million before savings).
•As of April 2024, the British Columbia Output Based Pricing System (BC OBPS) regulation requires facilities or linear operations (such as oil and gas gathering systems) with emissions equal to or greater than 10,000 metric tonnes of carbon dioxide or equivalent per year to remit payments on the difference between actual emissions and allowable emissions based on product and activity benchmarks. The benchmarks and guidance for these emissions have yet to be finalized, and compliance payments are not due until later in 2025. Based on interim benchmarks, our BC OBPS obligation is expected to total $1.5 million (net share before-tax) for Montney in 2024.
•In 2024, the EU passed regulation on the reduction of methane emissions in the energy sector that will apply a methane limit on oil and gas imports to the EU, as well as mandate the monitoring, reporting, verification and reduction of methane emissions.
•Our APLNG assets in Australia are subject to the Safeguard Mechanism, enacted through the National Greenhouse and Energy Reporting Act 2007. In the previous Australian financial year of July 1, 2023, to June 30, 2024, our operated downstream APLNG facility was in excess of its baseline emissions, while the upstream partner-operated facilities were below their baseline emissions. As we expect there to be a surplus of eligible carbon units across the joint venture, there is no expense expected to be incurred by ConocoPhillips for the 2024 Australian financial year.
•In 2024 the U.S. EPA published final rulemaking for New Source Performance Standards (OOOOb) and Emissions Guidelines (OOOOc). Implementing this regulation across our U.S. portfolio will result in additional compliance costs.
| | | | | |
| 57 | ConocoPhillips 2024 10-K |
| | | | | |
| Capital Resources and Liquidity | |
•In connection with OOOOb and OOOOc rulemaking, the U.S. EPA established the Methane Super Emitter Program whereby certified third parties can use EPA-approved technology to identify and report super-emitter events for EPA review. An operator must initiate an investigation within five days of receiving notification from the EPA regarding a super-emitter event.
•In November 2024, the U.S. EPA finalized the Waste Emissions Charge (WEC) as part of the Methane Emission Reduction Program (MERP) within the Inflation Reduction Act of 2022. The implementation of the WEC will require payments to the EPA, accounting for methane emissions subject to the rule. The filing deadline for the 2024 WEC is August 2025.
Carbon taxes in certain jurisdictions.
•We incurred carbon tax cost in our Montney operations in the first three months of 2024, before the BC OBPS came into force. We may also incur a carbon tax for any emissions in Montney that falls outside the scope of our BC OBPS activities. We also incur a nominal carbon tax for emissions from fossil fuel combustion at some of our Surmont operations in Alberta that occur outside of TIER facilities. Carbon tax costs in our Canada operations totaled $1.7 million (net share before-tax).
•Our cost of compliance with Norwegian carbon legislation in 2024 was approximately $37 million (net share before-tax).
Other environmental regulations.
•The White House Council on Environmental Quality (CEQ) issued final National Environmental Policy Act implementation regulations (NEPA Phase 2) in 2024. Since then, the DC Circuit Court has suggested that CEQ lacks authority to adopt any binding regulations, introducing potential uncertainty into the regulatory process.
•Climate Superfund laws. In 2024, New York and Vermont passed legislation seeking to hold certain energy companies financially responsible for state climate change mitigation and adaptation measures, following the “polluter pays” model of existing Superfund laws. This responsibility may include paying into a fund for infrastructure repairs and recovery from extreme weather events that would otherwise be covered by the government. While only two U.S. states have enacted such laws to date, it is likely that more states will consider a similar approach. Compliance with such legislation may expose us to significant additional liabilities.
•Climate Private Action laws. In 2025, California, New Hampshire, and Oregon introduced bills seeking to create a private right of action for individuals to bring strict liability claims for alleged damages related to climate change impacts (including non-economic, actual and punitive damages). These bills also authorize insurance companies to pursue subrogation claims to recover damages for amounts paid to insureds for climate change impacts.
Non-regulatory initiatives or agreements.
•The U.S. government announced on September 17, 2021 the Global Methane Pledge, a global initiative to reduce global methane emissions by at least 30 percent from 2020 levels by 2030.
•The agreement reached in Paris in December 2015 at the 21st Conference of the Parties to the United Nations Framework Convention on Climate Change set out a process for achieving global emissions reductions. Accordingly, parties to the Paris Agreement have set targets to reduce emissions by 2030. While the current administration has officially withdrawn the U.S. from the Paris Agreement, some states have indicated that they plan to remain committed to the goals of the agreement.
Regulated sustainability disclosures.
Governments and financial regulators are developing new reporting rules requiring increased disclosure around a range of sustainability topics. The patchwork of reporting standards that is developing may require significant increases in disclosures, which may be costly to implement. In March 2022 the U.S. SEC proposed rule changes that would require registrants to include certain climate-related disclosures in their registration statements and periodic reports; In January 2023 the EU finalized the Corporate Sustainability Reporting Directive that will require more detailed sustainability reporting; in June 2023 the International Sustainability Standards Board issued inaugural sustainability reporting standards; in October 2023 in California multiple bills were signed into law requiring climate-related disclosures for companies that conduct business in the state; and in September 2024, the Australian Government passed legislation which mandated a new standard for climate-related disclosures.
| | | | | |
| ConocoPhillips 2024 10-K | 58 |
| | | | | |
| Capital Resources and Liquidity | |
Compliance with changes in laws and regulations that create a GHG tax, emission trading scheme or GHG reduction policies could significantly increase our costs, reduce demand for fossil energy derived products, impact the cost and availability of capital and increase our exposure to litigation. Such laws and regulations could also increase demand for less carbon intensive energy sources, including natural gas. The ultimate impact on our financial performance, either positive or negative, will depend on a number of factors, including but not limited to:
•Whether and to what extent legislation or regulation is enacted;
•The timing of the introduction of such legislation or regulation;
•The nature of the legislation (such as a cap and trade system or a tax on emissions) or regulation;
•The price placed on GHG emissions (either by the market or through a tax);
•The GHG emissions reductions required;
•The price and availability of offsets;
•The amount and allocation of allowances;
•Technological and scientific developments leading to new products or services;
•Any potential significant physical effects of climate change (such as increased severe weather events, changes in sea levels and changes in temperature); and
•Whether, and the extent to which, increased compliance costs are ultimately reflected in the prices of our products and services.
Company Response to Climate-Related Risks
The objective of our Climate Risk Strategy is to manage climate-related risk, optimize opportunities and equip the company to respond to changes in key uncertainties, including government policies around the world, technologies for emissions reduction, alternative energy technologies and changes in consumer trends. The strategy sets out our choices around portfolio composition, emissions reductions, targets and incentives, emissions-related technology development, and our climate-related policy and finance sector engagement.
Our Climate Risk Strategy is intended to enable us to responsibly meet the global demand for energy, deliver competitive returns on and of capital and work to meet our previously established emissions-reduction targets. First, meeting global energy demand requires a focus on delivering production that will best compete in any energy mix scenario. This production will be delivered from resources with a competitive cost of supply and low GHG intensity, as well as portfolio diversity by market and asset type. Next, in delivering competitive returns, ConocoPhillips has been a leader in shifting the exploration and production sector’s value proposition away from one focused on production toward one focused on returns. Finally, to drive accountability for the emissions that are within our control, we are progressing toward our Scope 1 and Scope 2 emissions intensity targets.
| | | | | |
| 59 | ConocoPhillips 2024 10-K |
| | | | | |
| Capital Resources and Liquidity | |
Key elements of the Climate Risk Strategy include:
•Strategic flexibility and portfolio composition
◦Building a resilient asset portfolio with a focus on low cost of supply and low GHG intensity to meet global energy demand.
◦Committing to capital discipline through use of a fully burdened cost of supply, including cost of carbon, as the basis for capital allocation.
◦Testing our portfolio against future energy demand scenarios through a comprehensive scenario planning process that helps us assess the resilience of our corporate strategy to climate risk.
•Scope 1 and 2 emissions targets and reductions
◦Setting targets for emissions over which we have ownership and control.
◦Reducing emissions through the marginal abatement cost curve process.
•LNG and technology
◦Building an attractive LNG portfolio as an important component of responsibly meeting global energy demand due to LNG's opportunity to displace higher-emissions fuels such as coal for electricity generation.
◦Evaluating potential investments in emerging alternative energy sources and low-carbon technologies.
•External engagement
◦Advocating for a well-designed, economy-wide price on carbon and engaging in development of other policy and legislation to address end-use emissions.
◦Working with our suppliers and commercial partners to reduce emissions along the value chain.
Our Climate Risk Strategy does not include a Scope 3 emissions target. We recognize that end-use emissions must be reduced to meet global climate objectives. However, it is our view that supply-side constraints through Scope 3 targets for North American and European upstream oil and gas producers would be counterproductive to climate goals. In the absence of policy measures that address global demand, Scope 3 targets would shift production to other global operators, potentially eroding energy security and increasing emissions. This is why we have consistently taken a prominent role in advocating for a well-designed, economy wide price on carbon and engaged in development of other policies or legislation that could address end-use emissions from high-carbon intensity energy use. We have also expanded policy advocacy beyond carbon pricing to include energy efficiency, end-use emissions policy and regulatory action, such as support for the direct federal regulation of methane.
In support of addressing our Scope 1 and 2 emissions, we have made recent progress in several key areas.
•Completed our 2024 scope 1 and 2 emissions reduction projects within the allotted capital and cost budget. These projects will support our GHG emissions intensity reduction target of 50-60 percent by 2030 from a 2016 baseline for both gross operated and net equity emissions.
•Achieved the Gold Standard Reporting for emissions reporting in the Oil and Gas Methane Partnership 2.0 Initiative, one of only three U.S. companies to earn this distinction.
•Remained on schedule to meet a target of zero routine flaring by the end of 2025 for heritage ConocoPhillips assets.
New Accounting Standards
For discussion of new accounting standards, see Note 24. | | | | | |
| ConocoPhillips 2024 10-K | 60 |
Critical Accounting Estimates
The preparation of financial statements in conformity with GAAP requires management to select appropriate accounting policies and to make estimates and assumptions that affect the reported amounts of assets, liabilities, revenues and expenses. See Note 1 for descriptions of our significant accounting policies. Certain of these accounting policies involve judgments and uncertainties to such an extent there is a reasonable likelihood materially different amounts would have been reported under different conditions, or if different assumptions had been used. These critical accounting estimates are discussed with the Audit and Finance Committee of the Board of Directors at least annually. We believe the following discussions of critical accounting estimates address all important accounting areas where the nature of accounting estimates or assumptions is material due to the levels of subjectivity and judgment necessary to account for highly uncertain matters or the susceptibility of such matters to change. Oil and Gas Accounting
Accounting for oil and gas activity is subject to special accounting rules unique to the oil and gas industry. The acquisition of G&G seismic information, prior to the discovery of proved reserves, is expensed as incurred, similar to accounting for research and development costs. However, leasehold acquisition costs and exploratory well costs are capitalized on the balance sheet pending determination of whether proved oil and gas reserves have been recognized.
Property Acquisition Costs
For individually significant leaseholds, management periodically assesses for impairment based on exploration and drilling efforts to date. For insignificant individual leasehold acquisition costs, management exercises judgment and determines a percentage probability that the prospect ultimately will fail to find proved oil and gas reserves, including estimates of future expirations, and pools that leasehold information with others in similar geographic areas. For prospects in areas with limited, or no, previous exploratory drilling, the percentage probability of ultimate failure is normally judged to be quite high. This judgmental percentage is multiplied by the leasehold acquisition cost, and that product is divided by the contractual period of the leasehold to determine a periodic leasehold impairment charge that is reported in exploration expense. This judgmental probability percentage is reassessed and adjusted throughout the contractual period of the leasehold based on favorable or unfavorable exploratory activity on the leasehold or on adjacent leaseholds, and leasehold impairment amortization expense is adjusted prospectively.
At year-end 2024, we held $14.7 billion of net capitalized unproved property costs, $10.8 billion of which was added this year through our acquisition of Marathon Oil. These capitalized costs consist primarily of individually significant and pooled leaseholds, mineral rights held in perpetuity by title ownership, exploratory wells currently being drilled, suspended exploratory wells and capitalized interest. Of this amount, approximately $13.4 billion is concentrated in the Lower 48 Basins, primarily the Delaware, Eagle Ford and Bakken Basins, where we have an ongoing significant and active development program. Outside of the Lower 48 Basins, the remaining $1.3 billion is primarily concentrated in Canada. Management periodically assesses our unproved property for impairment based on the results of exploration and drilling efforts and the outlook for commercialization.
Exploratory Costs
For exploratory wells, drilling costs are temporarily capitalized, or “suspended,” on the balance sheet, pending a determination of whether potentially economic oil and gas reserves have been discovered by the drilling effort to justify development.
If exploratory wells encounter potentially economic quantities of oil and gas, the well costs remain capitalized on the balance sheet as long as sufficient progress assessing the reserves and the economic and operating viability of the project is being made. The accounting notion of “sufficient progress” is a judgmental area, but the accounting rules do prohibit continued capitalization of suspended well costs on the expectation future market conditions will improve or new technologies will be found that would make the development economically profitable. Often, the ability to move into the development phase and record proved reserves is dependent on obtaining permits and government or coventurer approvals, the timing of which is ultimately beyond our control. Exploratory well costs remain suspended as long as we are actively pursuing such approvals and permits and believe they will be obtained. Once all required approvals and permits have been obtained, the projects are moved into the development phase, and the oil and gas reserves are designated as proved reserves.
At year-end 2024, total suspended well costs were $196 million, compared with $184 million at year-end 2023. For additional information on suspended wells, including an aging analysis, see Note 6. | | | | | |
| 61 | ConocoPhillips 2024 10-K |
Proved Reserves
Engineering estimates of the quantities of proved reserves are inherently imprecise and represent only approximate amounts because of the judgments involved in developing such information. Reserve estimates are based on geological and engineering assessments of in-place hydrocarbon volumes, the production plan, historical extraction recovery and processing yield factors, installed plant operating capacity and approved operating limits. The reliability of these estimates at any point in time depends on both the quality and quantity of the technical and economic data and the efficiency of extracting and processing the hydrocarbons.
Despite the inherent imprecision in these engineering estimates, accounting rules require disclosure of “proved” reserve estimates due to the importance of these estimates to better understand the perceived value and future cash flows of a company’s operations. There are several authoritative guidelines regarding the engineering criteria that must be met before estimated reserves can be designated as “proved.” Our geosciences and reservoir engineering organization has policies and procedures in place consistent with these authoritative guidelines. We have trained and experienced internal engineering personnel who estimate our proved reserves held by consolidated companies, as well as our share of equity affiliates. See “Supplementary Data - Oil and Gas Operations” for additional information. Proved reserve estimates are adjusted annually in the fourth quarter and during the year if significant changes occur and take into account recent production and subsurface information about each field. Also, as required by current authoritative guidelines, the estimated future date when an asset will reach the end of its economic life is based on historical 12-month first-of-month average prices and current costs. This date estimates when production will end and affects the amount of estimated reserves. Therefore, as prices and cost levels change from year to year, the estimate of proved reserves also changes. Generally, our proved reserves decrease as prices decline and increase as prices rise.
Our proved reserves include estimated quantities related to PSCs, reported under the “economic interest” method, as well as variable-royalty regimes, and are subject to fluctuations in commodity prices, recoverable operating expenses and capital costs. If costs remain stable, reserve quantities attributable to recovery of costs will change inversely to changes in commodity prices. We would expect reserves from these contracts to decrease when product prices rise and increase when prices decline.
The estimation of proved reserves is also important to the income statement because the proved reserve estimate for a field serves as the denominator in the unit-of-production calculation of the DD&A of the capitalized costs for that asset. At year-end 2024, the net book value of productive PP&E subject to a unit-of-production calculation was approximately $77 billion and the DD&A recorded on these assets in 2024 was approximately $9.4 billion. The estimated proved developed reserves for our consolidated operations were 4.4 billion BOE at the end of 2023 and 5.1 billion BOE at the end of 2024. If the estimates of proved reserves used in the unit-of-production calculations had been lower by 10 percent across all calculations, before-tax DD&A in 2024 would have increased by an estimated $1,040 million.
Business Combination—Valuation of Oil and Gas Properties
For business combinations, management applies the principles of acquisition accounting under FASB ASC Topic 805 – “Business Combinations” and allocates the purchase price to assets acquired and liabilities assumed, based on their estimated fair values as of the acquisition date. Estimating the fair values involves making various assumptions, of which the most significant assumptions relate to the fair values assigned to proved and unproved oil and gas properties. For significant business combinations, management generally utilizes a discounted cash flow approach, based on market participant assumptions, and considers engaging third party valuation experts in preparing fair value estimates.
Significant inputs incorporated within the valuation include future commodity price assumptions and production profiles of reserve estimates, future operating and development costs, inflation rates, and discount rates using a market-based weighted average cost of capital determined at the time of the acquisition. When estimating the fair value of unproved properties, additional risk-weighting adjustments are applied to probable and possible reserves.
The assumptions and inputs incorporated within the fair value estimates are subject to considerable management judgement and are based on industry, market and economic conditions prevalent at the time of the acquisition. Although we based these estimates on assumptions believed to be reasonable, these estimates are inherently unpredictable and uncertain and actual results could differ. If the initial accounting for the business combination is incomplete by the end of the reporting period in which the acquisition occurs, an estimate is recorded. Subsequent to the acquisition date, and not later than one year from the acquisition date, we record any material adjustments to the initial estimate based on new information obtained that would have existed as of the date of the acquisition. Any adjustment that arises from information obtained that did not exist as of the date of acquisition is recorded in the period the adjustment arises. See Note 3. | | | | | |
| ConocoPhillips 2024 10-K | 62 |
Impairments
Long-lived assets used in operations are assessed for impairment whenever changes in facts and circumstances indicate a possible significant deterioration in the future cash flows expected to be generated by an asset group. If there is an indication the carrying amount of an asset may not be recovered, a recoverability test is performed using management’s assumptions for prices, volumes and future development plans. If the sum of the undiscounted cash flows before income-taxes is less than the carrying value of the asset group, the carrying value is written down to estimated fair value and reported as an impairment in the periods in which the determination is made. Individual assets are grouped for impairment purposes at the lowest level for which there are identifiable cash flows that are largely independent of the cash flows of other groups of assets—generally on a field-by-field basis for E&P assets. Because there usually is a lack of quoted market prices for long-lived assets, the fair value of impaired assets is typically determined based on the present values of expected future cash flows using discount rates and prices believed to be consistent with those used by principal market participants, or based on a multiple of operating cash flow validated with historical market transactions of similar assets where possible.
The expected future cash flows used for impairment reviews and related fair value calculations are based on estimated future production volumes, commodity prices, operating costs and capital decisions, considering all available evidence at the date of review. Differing assumptions could affect the timing and the amount of an impairment in any period.
Investments in nonconsolidated entities accounted for under the equity method are assessed for impairment whenever changes in the facts and circumstances indicate a loss in value has occurred. Such evidence of a loss in value might include our inability to recover the carrying amount, the lack of sustained earnings capacity which would justify the current investment amount, or a current fair value less than the investment’s carrying amount. When such a condition is judgmentally determined to be other than temporary, an impairment charge is recognized for the difference between the investment’s carrying value and its estimated fair value. When determining whether a decline in value is other than temporary, management considers factors such as the length of time and extent of the decline, the investee’s financial condition and near-term prospects and our ability and intention to retain our investment for a period that will be sufficient to allow for any anticipated recovery in the market value of the investment. Since quoted market prices are usually not available, the fair value is typically based on the present value of expected future cash flows using discount rates and prices believed to be consistent with those used by principal market participants, plus market analysis of comparable assets owned by the investee, if appropriate. Differing assumptions could affect the timing and the amount of an impairment of an investment in any period.
Asset Retirement Obligations and Environmental Costs
Under various contracts, permits and regulations, we have material legal obligations to remove tangible equipment and restore the land or seabed at the end of operations at operational sites. Our largest asset removal obligations involve plugging and abandonment of wells, removal and disposal of offshore oil and gas platforms around the world, as well as oil and gas production facilities and pipelines in Alaska. Fair value is estimated using a present value approach, incorporating assumptions about estimated amounts and timing of settlements and impacts of the use of technologies. Estimating future asset removal costs requires significant judgement. Most of these removal obligations are many years, or decades, in the future and the contracts and regulations often have vague descriptions of what removal practices and criteria must be met when the removal event actually occurs. The carrying value of our asset retirement obligation estimate is sensitive to inputs such as asset removal technologies and costs, regulatory and other compliance considerations, expenditure timing, and other inputs into valuation of the obligation, including discount and inflation rates, which are all subject to change between the time of initial recognition of the liability and future settlement of our obligation.
Normally, changes in asset removal obligations are reflected in the income statement as increases or decreases to DD&A over the remaining life of the assets. However, for assets at or nearing the end of their operations, as well as previously sold assets for which we retained the asset removal obligation, an increase in the asset removal obligation can result in an immediate charge to earnings, because any increase in PP&E due to the increased obligation would immediately be subject to impairment, due to the low fair value of these properties.
In addition to asset removal obligations, under the above or similar contracts, permits and regulations, we have certain environmental-related projects. These are primarily related to remediation activities required by Canada and various states within the U.S. at exploration and production sites. Future environmental remediation costs are difficult to estimate because they are subject to change due to such factors as the uncertain magnitude of cleanup costs, the unknown time and extent of such remedial actions that may be required, and the determination of our liability in proportion to that of other responsible parties. See Note 7. | | | | | |
| 63 | ConocoPhillips 2024 10-K |
Projected Benefit Obligations
The actuarial determination of projected benefit obligations and company contribution requirements involves judgment about uncertain future events, including estimated retirement dates, salary levels at retirement, mortality rates, lump-sum election rates, rates of return on plan assets, future health care cost-trend rates and rates of utilization of health care services by retirees. Due to the specialized nature of these calculations, we engage outside actuarial firms to assist in the determination of these projected benefit obligations and company contribution requirements. Ultimately, we will be required to fund all vested benefits under pension and postretirement benefit plans not funded by plan assets or investment returns, but the judgmental assumptions used in the actuarial calculations significantly affect periodic financial statements and funding patterns over time. Projected benefit obligations are particularly sensitive to the discount rate assumption. A 100 basis-point decrease in the discount rate assumption would increase projected benefit obligations by $500 million. Benefit expense is sensitive to the discount rate and return on plan assets assumptions. A 100 basis-point decrease in the discount rate assumption would increase annual benefit expense by $40 million, while a 100 basis-point decrease in the return on plan assets assumption would increase annual benefit expense by $70 million. In determining the discount rate, we use yields on high-quality fixed income investments matched to the estimated benefit cash flows of our plans. We are also exposed to the possibility that lump sum retirement benefits taken from pension plans during the year could exceed the total of service and interest components of annual pension expense and trigger accelerated recognition of a portion of unrecognized net actuarial losses and gains. These benefit payments are based on decisions by plan participants and are therefore difficult to predict. In the event there is a significant reduction in the expected years of future service of present employees or the elimination of the accrual of defined benefits for some or all of their future services for a significant number of employees, we could recognize a curtailment gain or loss. See Note 15. Contingencies
A number of claims and lawsuits are made against the company arising in the ordinary course of business. Management exercises judgment related to accounting and disclosure of these claims which includes losses, damages and underpayments associated with environmental remediation, tax, contracts and other legal disputes. As we learn new facts concerning contingencies, we reassess our position both with respect to amounts recognized and disclosed considering changes to the probability of additional losses and potential exposure; however, actual losses can and do vary from estimates for a variety of reasons including legal, arbitration or other third-party decisions; settlement discussions; evaluation of scope of damages; interpretation of regulatory or contractual terms; expected timing of future actions; and proportion of liability shared with other responsible parties. Estimated future costs related to contingencies are subject to change as events evolve and as additional information becomes available during the administrative and litigation processes. For additional information on contingent liabilities, see the “Contingencies” section within “Capital Resources and Liquidity” and Note 10. Income Taxes
We are subject to income taxation in numerous jurisdictions worldwide. We record deferred tax assets and liabilities to account for the expected future tax consequences of events that have been recognized in our financial statements and our tax returns. We routinely assess our deferred tax assets and reduce such assets by a valuation allowance if we deem it is more likely than not that some portion, or all, of the deferred tax assets will not be realized. In assessing the need for adjustments to existing valuation allowances, we consider all available positive and negative evidence. Positive evidence includes reversals of temporary differences, forecasts of future taxable income, assessment of future business assumptions and applicable tax planning strategies that are prudent and feasible. Negative evidence includes losses in recent years as well as the forecasts of future net income (loss) in the realizable period. In making our assessment regarding valuation allowances, we weigh the evidence based on objectivity. Numerous judgments and assumptions are inherent in the determination of future taxable income, including factors such as future operating conditions and the assessment of the effects of foreign taxes on our U.S. federal income taxes (particularly as related to prevailing oil and gas prices). See Note 16. We regularly assess and, if required, establish accruals for uncertain tax positions that could result from assessments of additional tax by taxing jurisdictions in countries where we operate. We recognize a tax benefit from an uncertain tax position when it is more likely than not the position will be sustained upon examination, based on the technical merits of the position. These accruals for uncertain tax positions are subject to a significant amount of judgment and are reviewed and adjusted on a periodic basis in light of changing facts and circumstances considering the progress of ongoing tax audits, court proceedings, changes in applicable tax laws, including tax case rulings and legislative guidance, or expiration of the applicable statute of limitations. See Note 16. | | | | | |
| ConocoPhillips 2024 10-K | 64 |
Cautionary Statement for the Purposes of the “Safe Harbor” Provisions of the Private Securities Litigation Reform Act of 1995
This report includes forward-looking statements within the meaning of Section 27A of the Securities Act of 1933 and Section 21E of the Securities Exchange Act of 1934. All statements other than statements of historical fact included or incorporated by reference in this report, including, without limitation, statements regarding our future financial position, business strategy, budgets, projected revenues, costs and plans, objectives of management for future operations, the anticipated benefits of our acquisition of Marathon Oil, the anticipated impact of our acquisition of Marathon Oil on the combined company’s business and future financial and operating results and the expected amount and timing of synergies from our acquisition of Marathon Oil are forward-looking statements. Examples of forward-looking statements contained in this report include our expected production growth and outlook on the business environment generally, our expected capital budget and capital expenditures, and discussions concerning development or replacement of reserves and future dividends. You can often identify our forward-looking statements by the words “ambition,” “anticipate,” “believe,” “budget,” “continue,” “could,” “effort,” “estimate,” “expect,” “forecast,” “goal,” “guidance,” “intend,” “may,” “objective,” “outlook,” “plan,” “potential,” “predict,” “projection,” “seek,” “should,” “target,” “will,” “would” and similar expressions.
We based the forward-looking statements on our current expectations, estimates and projections about ourselves and the industries in which we operate in general. We caution you these statements are not guarantees of future performance as they involve assumptions that, while made in good faith, may prove to be incorrect or inaccurate, and involve risks and uncertainties we cannot predict. Accordingly, our actual outcomes and results may differ materially from what we have expressed or forecast in the forward-looking statements. Any differences could result from a variety of factors and uncertainties, including, but not limited to, the following:
•Effects of volatile commodity prices, including prolonged periods of low commodity prices, which may adversely impact our operating results and our ability to execute on our strategy and could result in recognition of impairment charges on our long-lived assets, leaseholds and nonconsolidated equity investments.
•Global and regional changes in the demand, supply, prices, differentials or other market conditions affecting oil and gas, including changes as a result of any ongoing military conflict and the global response to such conflict; security threats on facilities and infrastructure; global health crises; the imposition or lifting of crude oil production quotas or other actions that might be imposed by OPEC and other producing countries; or the resulting company or third-party actions in response to such changes.
•The potential for insufficient liquidity or other factors, such as those described herein, that could impact our ability to repurchase shares and declare and pay dividends, whether fixed or variable.
•Potential failures or delays in achieving expected reserve or production levels from existing and future oil and gas developments, including due to operating hazards, drilling risks and the inherent uncertainties in predicting reserves and reservoir performance.
•Reductions in our reserve replacement rates, whether as a result of significant declines in commodity prices or otherwise.
•Unsuccessful exploratory drilling activities or the inability to obtain access to exploratory acreage.
•Failure to progress or complete announced and future development plans related to constructing, modifying or operating E&P and LNG facilities, or unexpected changes in costs, inflationary pressures or technical equipment related to such plans.
•Significant operational or investment changes imposed by legislative and regulatory initiatives and international agreements addressing environmental concerns, including initiatives addressing the impact of global climate change, such as limiting or reducing GHG emissions; regulations concerning hydraulic fracturing, methane emissions, flaring or water disposal; and prohibitions on commodity exports.
•Broader societal attention to and efforts to address climate change may cause substantial investment in and increased adoption of competing or alternative energy sources.
•Risks, uncertainties and high costs that may prevent us from successfully executing on our Climate Risk Strategy.
•Lack or inadequacy of, or disruptions in, reliable transportation for our crude oil, bitumen, natural gas, LNG and NGLs.
•Inability to timely obtain or maintain permits, including those necessary for construction, drilling and/or development, or inability to make capital expenditures required to maintain compliance with any necessary permits or applicable laws or regulations.
•Potential disruption or interruption of our operations and any resulting consequences due to accidents; extraordinary weather events; supply chain disruptions; civil unrest; political events; war; terrorism; cybersecurity threats or information technology failures, constraints or disruptions.
| | | | | |
| 65 | ConocoPhillips 2024 10-K |
•Liability for remedial actions, including removal and reclamation obligations, under existing or future environmental regulations and litigation.
•Liability resulting from pending or future litigation or our failure to comply with applicable laws and regulations.
•General domestic and international economic, political and diplomatic developments, including deterioration of international trade relationships; the imposition of trade restrictions or tariffs relating to commodities and material or products (such as aluminum and steel) used in the operation of our business; expropriation of assets; changes in governmental policies relating to commodity pricing, including the imposition of price caps; sanctions; or other adverse regulations or taxation policies.
•Competition and consolidation in the oil and gas E&P industry, including competition for sources of supply, services, personnel and equipment.
•Any limitations on our access to capital or increase in our cost of capital or insurance, including as a result of illiquidity, changes or uncertainty in domestic or international financial markets, foreign currency exchange rate fluctuations or investment sentiment.
•Challenges or delays to our execution of, or successful implementation of the acquisition of Marathon Oil or any future asset dispositions or acquisitions we elect to pursue; potential disruption of our operations, including the diversion of management time and attention; our inability to realize anticipated cost savings or capital expenditure reductions; difficulties integrating acquired businesses and technologies; or other unanticipated changes.
•Our inability to deploy the net proceeds from any asset dispositions that are pending or that we elect to undertake in the future in the manner and timeframe we anticipate, if at all.
•The operation, financing and management of risks of our joint ventures.
•The ability of our customers and other contractual counterparties to satisfy their obligations to us, including our ability to collect payments when due from the government of Venezuela or PDVSA.
•Uncertainty as to the long-term value of our common stock.
•The factors generally described in Part I—Item 1A in this 2024 Annual Report on Form 10-K and any additional risks described in our other filings with the SEC. | | | | | |
| ConocoPhillips 2024 10-K | 66 |
Item 7A. Quantitative and Qualitative Disclosures about Market Risk
Financial Instrument Market Risk
We and certain of our subsidiaries hold and issue derivative contracts and financial instruments that expose our cash flows or earnings to changes in commodity prices, foreign currency exchange rates or interest rates. We may use financial and commodity-based derivative contracts to manage the risks produced by changes in the prices of natural gas, crude oil and related products; fluctuations in interest rates and foreign currency exchange rates; or to capture market opportunities.
Our use of derivative instruments is governed by an “Authority Limitations” document approved by our Board of Directors that prohibits the use of highly leveraged derivatives or derivative instruments without sufficient liquidity. The Authority Limitations document also establishes the Value at Risk (VaR) limits for the company, and compliance with these limits is monitored daily. The Commercial organization manages our commercial marketing, optimizes our commodity flows and positions, and monitors risks. The Executive Vice President and Chief Financial Officer, who reports to the Chief Executive Officer, monitors commodity price risk and risks resulting from foreign currency exchange rates and interest rates.
Commodity Price Risk
Our Commercial organization uses futures, forwards, swaps and options in various markets to accomplish the following objectives:
•Consistent with our policy to generally remain exposed to market prices, we use swap contracts to convert fixed-price sales contracts, which are often requested by natural gas consumers, to floating market prices.
•Enable us to use market knowledge to capture opportunities such as moving physical commodities to more profitable locations and storing commodities to capture seasonal or time premiums. We may use derivatives to optimize these activities.
We use a VaR model to estimate the loss in fair value that could potentially result on a single day from the effect of adverse changes in market conditions on the derivative financial instruments and derivative commodity contracts we hold or issue, including commodity purchases and sales contracts recorded on the balance sheet at December 31, 2024. Using Monte Carlo simulation, a 95 percent confidence level and a one-day holding period, the VaR for those instruments issued or held for trading purposes or held for purposes other than trading at December 31, 2024 and 2023, was immaterial to our consolidated cash flows and net income.
| | | | | |
| 67 | ConocoPhillips 2024 10-K |
Interest Rate Risk
The following table provides information about our debt instruments that are sensitive to changes in U.S. interest rates. The table presents principal cash flows and related weighted-average interest rates by expected maturity dates. Weighted-average variable rates are based on effective rates at the reporting date. The carrying amount of our floating-rate debt approximates its fair value. A hypothetical 10 percent change in prevailing interest rates would not have a material impact on interest expense associated with our floating-rate debt. The fair value of the fixed-rate debt is measured using prices available from a pricing service that is corroborated by market data. Changes to prevailing interest rates would not impact our cash flows associated with fixed-rate debt, unless we elect to repurchase or retire such debt prior to maturity.
| | | | | | | | | | | | | | | | | | | | |
| | Millions of Dollars Except as Indicated |
| | Debt |
| Expected Maturity Date | | Fixed
Rate
Maturity | Average
Interest
Rate | | Floating
Rate
Maturity | Average
Interest
Rate |
| Year-End 2024 | | | | | | |
| 2025 | | $ | 735 | | 3.87 | % | | $ | — | | — | % |
| 2026 | | 704 | | 3.40 | | | — | | — | |
| 2027 | | 778 | | 4.82 | | | — | | — | |
| 2028 | | 664 | | 3.78 | | | — | | — | |
| 2029 | | 997 | | 6.78 | | | — | | — | |
| Remaining years | | 19,924 | | 5.23 | | | 283 | | 2.97 | % |
| Total | | $ | 23,802 | | | | $ | 283 | | |
| Fair value | | $ | 22,714 | | | | $ | 283 | | |
| | | | | | |
| Year-End 2023 | | | | | | |
| 2024 | | $ | 759 | | 2.70 | % | | $ | — | | — | % |
| 2025 | | 735 | | 3.87 | | | — | | — | |
| 2026 | | 104 | | 6.41 | | | — | | — | |
| 2027 | | 438 | | 5.79 | | | — | | — | |
| 2028 | | 265 | | 4.50 | | | — | | — | |
| Remaining years | | 15,829 | | 5.45 | | | 283 | | 4.06 | % |
| Total | | $ | 18,130 | | | | $ | 283 | | |
| Fair value | | $ | 18,338 | | | | $ | 283 | | |
| | | | | |
| ConocoPhillips 2024 10-K | 68 |
Foreign Currency Exchange Risk
We have foreign currency exchange rate risk resulting from international operations. We do not comprehensively hedge the exposure to currency exchange rate changes although we may choose to selectively hedge certain foreign currency exchange rate exposures, such as firm commitments for capital projects or local currency tax payments, dividends and cash returns from net investments in foreign affiliates to be remitted within the coming year and acquisitions.
At December 31, 2024 and 2023, we had outstanding foreign currency exchange forward contracts hedging cross-border commercial activity and for purposes of mitigating our cash-related exposures. Although these forwards hedge exposures to fluctuations in exchange rates, we elected not to utilize hedge accounting. As a result, the change in the fair value of these foreign currency exchange derivatives is recorded directly in earnings. Since the gain or loss on the exchange contracts is offset by the gain or loss from remeasuring cash related balances, and since our aggregate position in the forwards was not material, there would be no material impact to our income from an adverse hypothetical 10 percent change in the December 2024 or December 2023 exchange rates.
The gross notional and fair value of these positions at December 31, 2024 and 2023, were as follows:
| | | | | | | | | | | | | | | | | | | | |
| Foreign Currency Exchange Derivatives | In Millions |
| | Notional | | Fair Value* |
| | 2024 | 2023 | | 2024 | 2023 |
| | | | | | |
| Buy Canadian dollar, sell U.S. dollar | CAD | 10 | | 5 | | | — | | — | |
| Sell British pound, buy Euro | GBP | 13 | | 52 | | | — | | (2) | |
| Buy British pound, sell Euro | GBP | 17 | | 58 | | | — | | — | |
*Denominated in USD.
| | | | | |
| 69 | ConocoPhillips 2024 10-K |
Item 8. Financial Statements and Supplementary Data
ConocoPhillips
| | | | | |
| Index to Financial Statements |
| Page |
| |
| |
| |
| |
| Financial Statements | |
| |
| |
Consolidated Statement of Comprehensive Income for the years ended | |
| |
| |
| |
| |
| |
Consolidated Statement of Changes in Equity for the years ended | |
| |
| |
| |
| |
| |
| |
| |
| |
| |
| |
| |
| |
| |
| |
| |
| |
| |
| |
| |
| |
| |
| |
| |
| |
| |
| |
| |
| |
| |
| |
| | | | | |
| ConocoPhillips 2024 10-K | 70 |
Management prepared, and is responsible for, the consolidated financial statements and the other information appearing in this annual report. The consolidated financial statements present fairly the company’s financial position, results of operations and cash flows in conformity with accounting principles generally accepted in the United States. In preparing its consolidated financial statements, the company includes amounts that are based on estimates and judgments management believes are reasonable under the circumstances. The company’s financial statements have been audited by Ernst & Young LLP, an independent registered public accounting firm appointed by the Audit and Finance Committee of the Board of Directors and ratified by stockholders. Management has made available to Ernst & Young LLP all of the company’s financial records and related data, as well as the minutes of stockholders’ and directors’ meetings.
Assessment of Internal Control Over Financial Reporting
Management is also responsible for establishing and maintaining adequate internal control over financial reporting. ConocoPhillips’ internal control system was designed to provide reasonable assurance to the company’s management and directors regarding the preparation and fair presentation of published financial statements.
All internal control systems, no matter how well designed, have inherent limitations. Therefore, even those systems determined to be effective can provide only reasonable assurance with respect to financial statement preparation and presentation.
Management assessed the effectiveness of the company’s internal control over financial reporting as of December 31, 2024. In making this assessment, it used the criteria set forth by the Committee of Sponsoring Organizations of the Treadway Commission in Internal Control—Integrated Framework (2013). Our assessment of, and conclusion on, the effectiveness of internal control over financial reporting did not include the internal controls of Marathon Oil Corporation, acquired in 2024, which is included in our consolidated financial statements and represented approximately 22% of our total assets as of December 31, 2024, approximately 1% of our revenues and other income and less than 1% of our net income for the year ended December 31, 2024.
Based on our assessment, we believe the company’s internal control over financial reporting was effective as of December 31, 2024.
Ernst & Young LLP has issued an audit report on the company’s internal control over financial reporting as of December 31, 2024, and their report is included herein.
| | | | | |
| /s/ Ryan M. Lance | /s/ William L. Bullock, Jr. |
| |
| Ryan M. Lance | William L. Bullock, Jr. |
Chairman and Chief Executive Officer | Executive Vice President and Chief Financial Officer |
| | | | | |
| 71 | ConocoPhillips 2024 10-K |
| | |
| Report of Independent Registered Public Accounting Firm |
To the Stockholders and the Board of Directors of ConocoPhillips
Opinion on the Financial Statements
We have audited the accompanying consolidated balance sheets of ConocoPhillips (the Company) as of December 31, 2024 and 2023, the related consolidated income statement, consolidated statements of comprehensive income, changes in equity and cash flows for each of the three years in the period ended December 31, 2024, and the related notes (collectively referred to as the “consolidated financial statements”). In our opinion, the consolidated financial statements present fairly, in all material respects, the financial position of the Company at December 31, 2024 and 2023, and the results of its operations and its cash flows for each of the three years in the period ended December 31, 2024, in conformity with U.S. generally accepted accounting principles.
We also have audited, in accordance with the standards of the Public Company Accounting Oversight Board (United States) (PCAOB), the Company’s internal control over financial reporting as of December 31, 2024, based on criteria established in Internal Control—Integrated Framework issued by the Committee of Sponsoring Organizations of the Treadway Commission (2013 framework), and our report dated February 18, 2025 expressed an unqualified opinion thereon.
Basis for Opinion
These financial statements are the responsibility of the Company’s management. Our responsibility is to express an opinion on the Company’s financial statements based on our audits. We are a public accounting firm registered with the PCAOB and are required to be independent with respect to the Company in accordance with the U.S. federal securities laws and the applicable rules and regulations of the Securities and Exchange Commission and the PCAOB.
We conducted our audits in accordance with the standards of the PCAOB. Those standards require that we plan and perform the audit to obtain reasonable assurance about whether the financial statements are free of material misstatement, whether due to error or fraud. Our audits included performing procedures to assess the risks of material misstatement of the financial statements, whether due to error or fraud, and performing procedures that respond to those risks. Such procedures included examining, on a test basis, evidence regarding the amounts and disclosures in the financial statements. Our audits also included evaluating the accounting principles used and significant estimates made by management, as well as evaluating the overall presentation of the financial statements. We believe that our audits provide a reasonable basis for our opinion.
Critical Audit Matters
The critical audit matters communicated below are matters arising from the current period audit of the financial statements that were communicated or required to be communicated to the Audit and Finance Committee and that: (1) relate to accounts or disclosures that are material to the financial statements and (2) involved our especially challenging, subjective or complex judgments. The communication of critical audit matters does not alter in any way our opinion on the consolidated financial statements, taken as a whole, and we are not, by communicating the critical audit matters below, providing separate opinions on the critical audit matters or on the accounts or disclosures to which they relate.
| | | | | |
| ConocoPhillips 2024 10-K | 72 |
| | | | | |
| |
| |
| |
| |
| |
| |
| Depreciation, depletion and amortization of proved oil and gas properties, plants and equipment |
| |
| Description of the Matter | At December 31, 2024, the net book value of the Company’s proved oil and gas properties, plants and equipment (PP&E) was $77 billion, and depreciation, depletion and amortization (DD&A) expense was $9.4 billion for the year then ended. As described in Note 1, under the successful efforts method of accounting, DD&A of PP&E on producing hydrocarbon properties and steam-assisted gravity drainage facilities and certain pipeline and liquified natural gas assets (those which are expected to have a declining utilization pattern) are determined by the unit-of-production method. The unit-of-production method uses proved oil and gas reserves, as estimated by the Company’s internal reservoir engineers.
Proved oil and gas reserves estimates are based on geological and engineering assessments of in-place hydrocarbon volumes, the production plan, historical extraction recovery and processing yield factors, installed plant operating capacity and approved operating limits. Significant judgment is required by the Company’s internal reservoir engineers in evaluating the data used to estimate proved oil and gas reserves. Estimating proved oil and gas reserves also requires the selection of inputs, including historical production, oil and gas price assumptions and future operating costs assumptions, among others.
Auditing the Company’s DD&A calculation is complex because of the use of the work of the internal reservoir engineers and the evaluation of management’s determination of the inputs described above used by the internal reservoir engineers in estimating proved oil and gas reserves.
|
| |
| How We Addressed the Matter in Our Audit | We obtained an understanding, evaluated the design and tested the operating effectiveness of the Company’s internal controls over its processes to calculate DD&A, including management’s controls over the completeness and accuracy of significant data provided to the internal reservoir engineers for use in estimating proved oil and gas reserves.
Our audit procedures included, among others, evaluating the professional qualifications and objectivity of the Company’s internal reservoir engineers primarily responsible for overseeing the preparation of the proved oil and gas reserves estimates. In addition, in assessing whether we can use the work of the internal reservoir engineers, we evaluated the completeness and accuracy of the significant data and inputs described above used by the internal reservoir engineers in estimating proved oil and gas reserves by agreeing them to source documentation and we identified and evaluated corroborative and contrary evidence. We also tested the accuracy of the DD&A calculation, including comparing the proved oil and gas reserves amounts used in the calculation to the Company’s reserve report.
|
| | | | | |
| 73 | ConocoPhillips 2024 10-K |
| | | | | |
| Valuation and recognition of proved and unproved oil and gas properties acquired in a business combination |
| |
| Description of the Matter | During 2024, the Company closed its acquisition of Marathon Oil Corporation resulting in the recognition of a provisional fair value of proved and unproved oil and gas properties within net properties, plants and equipment of $13.2 billion and $10.8 billion, respectively. As described in Note 3, the transaction was accounted for as a business combination using the acquisition method, which requires assets acquired and liabilities assumed to be measured at their acquisition date fair values. As also described in Note 3, the Company has not finalized its allocation of fair value to unproved properties. Oil and gas properties were valued by specialists using a discounted cash flow approach based on market participant assumptions. Significant inputs to the valuation of proved and unproved oil and gas properties include estimates of future commodity prices and production, future operating costs and discount rates using a market-based weighted average cost of capital.
Auditing the Company's accounting for its provisional valuation of proved and unproved oil and gas properties within the Lower 48 segment is complex and judgmental due to the significant estimation required by management of reserves associated with the acquired assets and the sensitivity of significant assumptions used in determining the fair value. In evaluating the reasonableness of management’s estimates and assumptions used, the audit testing procedures performed required a high degree of auditor judgment and additional effort, including involving internal valuation specialists.
|
| |
| How We Addressed the Matter in Our Audit | We obtained an understanding, evaluated the design and tested the operating effectiveness of the Company’s internal controls over its process to estimate the provisional fair value of the acquired proved and unproved oil and gas properties, including management’s review of the significant assumptions used as inputs to the fair value calculations and recording of the provisional valuation.
To test the provisional fair value of the acquired proved and unproved oil and gas properties, our audit procedures included, among others, evaluating the significant assumptions used and testing the completeness and accuracy of the underlying data supporting the significant assumptions. For example, we compared certain significant assumptions to current industry and third-party data and historical results for reasonableness. We also performed sensitivity analyses of significant assumptions, to evaluate the extent of their impact to the provisional fair value calculation. In addition, we involved internal valuation specialists to assist with certain significant assumptions included in the provisional fair value estimate. Furthermore, we evaluated the professional qualifications and objectivity of the Company’s internal reservoir engineers primarily responsible for overseeing the oil and gas reserves estimates and the valuation specialists used by the Company to prepare the provisional fair value of the acquired proved and unproved oil and gas properties. In addition, in assessing whether we can use the work of the internal reservoir engineers, we evaluated the completeness and accuracy of the significant data and inputs used by the internal reservoir engineers in estimating oil and gas reserves by agreeing them to source documentation, as applicable, and we identified and evaluated corroborative and contrary evidence. As noted above, the Company has not finalized its allocation of fair value to unproved properties
|
/s/ Ernst & Young LLP
We have served as the Company's auditor since 1949.
Houston, Texas
February 18, 2025
| | | | | |
| ConocoPhillips 2024 10-K | 74 |
| | |
| Report of Independent Registered Public Accounting Firm |
To the Stockholders and the Board of Directors of ConocoPhillips
Opinion on Internal Control Over Financial Reporting
We have audited ConocoPhillips’ internal control over financial reporting as of December 31, 2024, based on criteria established in Internal Control–Integrated Framework issued by the Committee of Sponsoring Organizations of the Treadway Commission (2013 framework) (the COSO criteria). In our opinion, ConocoPhillips (the Company) maintained, in all material respects, effective internal control over financial reporting as of December 31, 2024, based on the COSO criteria.
As indicated under the heading “Assessment of Internal Control Over Financial Reporting” in the accompanying “Reports of Management”, management’s assessment of and conclusion on the effectiveness of internal control over financial reporting did not include the internal controls of Marathon Oil Corporation, which is included in the 2024 consolidated financial statements of the Company and constituted approximately 22% of consolidated total assets as of December 31, 2024, approximately 1% of revenues and other income and less than 1% of net income for the year ended December 31, 2024. Our audit of internal control over financial reporting of ConocoPhillips also did not include an evaluation of the internal control over financial reporting of Marathon Oil Corporation.
We also have audited, in accordance with the standards of the Public Company Accounting Oversight Board (United States) (PCAOB), the consolidated balance sheets of the Company as of December 31, 2024 and 2023, the related consolidated income statement, consolidated statements of comprehensive income, changes in equity and cash flows for each of the three years in the period ended December 31, 2024, and the related notes and our report dated February 18, 2025 expressed an unqualified opinion thereon.
Basis for Opinion
The Company’s management is responsible for maintaining effective internal control over financial reporting and for its assessment of the effectiveness of internal control over financial reporting included under the heading “Assessment of Internal Control Over Financial Reporting” in the accompanying "Reports of Management." Our responsibility is to express an opinion on the Company’s internal control over financial reporting based on our audit. We are a public accounting firm registered with the PCAOB and are required to be independent with respect to the Company in accordance with the U.S. federal securities laws and the applicable rules and regulations of the Securities and Exchange Commission and the PCAOB.
We conducted our audit in accordance with the standards of the PCAOB. Those standards require that we plan and perform the audit to obtain reasonable assurance about whether effective internal control over financial reporting was maintained in all material respects.
Our audit included obtaining an understanding of internal control over financial reporting, assessing the risk that a material weakness exists, testing and evaluating the design and operating effectiveness of internal control based on the assessed risk, and performing such other procedures as we considered necessary in the circumstances. We believe that our audit provides a reasonable basis for our opinion.
| | | | | |
| 75 | ConocoPhillips 2024 10-K |
Definition and Limitations of Internal Control Over Financial Reporting
A company’s internal control over financial reporting is a process designed to provide reasonable assurance regarding the reliability of financial reporting and the preparation of financial statements for external purposes in accordance with generally accepted accounting principles. A company’s internal control over financial reporting includes those policies and procedures that (1) pertain to the maintenance of records that, in reasonable detail, accurately and fairly reflect the transactions and dispositions of the assets of the company; (2) provide reasonable assurance that transactions are recorded as necessary to permit preparation of financial statements in accordance with generally accepted accounting principles, and that receipts and expenditures of the company are being made only in accordance with authorizations of management and directors of the company; and (3) provide reasonable assurance regarding prevention or timely detection of unauthorized acquisition, use, or disposition of the company’s assets that could have a material effect on the financial statements.
Because of its inherent limitations, internal control over financial reporting may not prevent or detect misstatements. Also, projections of any evaluation of effectiveness to future periods are subject to the risk that controls may become inadequate because of changes in conditions, or that the degree of compliance with the policies or procedures may deteriorate.
/s/ Ernst & Young LLP
Houston, Texas
February 18, 2025
| | | | | |
| ConocoPhillips 2024 10-K | 76 |
| | | | | |
| Consolidated Income Statement | ConocoPhillips |
| | | | | | | | | | | |
| Years Ended December 31 | Millions of Dollars |
| 2024 | 2023 | 2022 |
| Revenues and Other Income | | | |
| Sales and other operating revenues | $ | 54,745 | | 56,141 | | 78,494 | |
| Equity in earnings of affiliates | 1,705 | | 1,720 | | 2,081 | |
| Gain (loss) on dispositions | 51 | | 228 | | 1,077 | |
| Other income | 452 | | 485 | | 504 | |
| Total Revenues and Other Income | 56,953 | | 58,574 | | 82,156 | |
| | | |
| Costs and Expenses | | | |
| Purchased commodities | 20,012 | | 21,975 | | 33,971 | |
| Production and operating expenses | 8,751 | | 7,693 | | 7,006 | |
| Selling, general and administrative expenses | 1,158 | | 705 | | 623 | |
| Exploration expenses | 355 | | 398 | | 564 | |
| Depreciation, depletion and amortization | 9,599 | | 8,270 | | 7,504 | |
| Impairments | 80 | | 14 | | (12) | |
| Taxes other than income taxes | 2,087 | | 2,074 | | 3,364 | |
| Accretion on discounted liabilities | 325 | | 283 | | 250 | |
| Interest and debt expense | 783 | | 780 | | 805 | |
| Foreign currency transaction (gain) loss | (50) | | 92 | | (100) | |
| Other expenses | 181 | | 2 | | (47) | |
| Total Costs and Expenses | 43,281 | | 42,286 | | 53,928 | |
| Income (loss) before income taxes | 13,672 | | 16,288 | | 28,228 | |
| Income tax provision (benefit) | 4,427 | | 5,331 | | 9,548 | |
| Net Income (Loss) | $ | 9,245 | | 10,957 | | 18,680 | |
| | | |
| | | |
| | | |
Net Income (Loss) Per Share of Common Stock (dollars) | | | |
| Basic | $ | 7.82 | | 9.08 | | 14.62 | |
| Diluted | 7.81 | | 9.06 | | 14.57 | |
| | | |
Average Common Shares Outstanding (in thousands) | | | |
| Basic | 1,178,920 | | 1,202,757 | | 1,274,028 | |
| Diluted | 1,180,871 | | 1,205,675 | | 1,278,163 | |
See Notes to Consolidated Financial Statements.
| | | | | |
| 77 | ConocoPhillips 2024 10-K |
| | | | | |
| Consolidated Statement of Comprehensive Income | ConocoPhillips |
| | | | | | | | | | | |
| Years Ended December 31 | Millions of Dollars |
| 2024 | 2023 | 2022 |
| Net Income (Loss) | $ | 9,245 | | 10,957 | | 18,680 | |
| Other comprehensive income (loss) | | | |
| Defined benefit plans | | | |
| Prior service credit (cost) arising during the period | (57) | | — | | (10) | |
| Reclassification adjustment for amortization of prior service cost (credit) included in net income (loss) | (38) | | (38) | | (39) | |
| Net change | (95) | | (38) | | (49) | |
| Net actuarial gain (loss) arising during the period | 81 | | 37 | | (623) | |
| Reclassification adjustment for amortization of net actuarial losses (gains) included in net income (loss) | 65 | | 82 | | 72 | |
| Net change | 146 | | 119 | | (551) | |
| Nonsponsored plans* | 1 | | (3) | | 5 | |
| Income taxes on defined benefit plans | (49) | | (23) | | 178 | |
| Defined benefit plans, net of tax | 3 | | 55 | | (417) | |
| Unrealized holding gain (loss) on securities | 3 | | 20 | | (13) | |
| Reclassification adjustment for (gain) loss included in net income | (2) | | (4) | | (1) | |
| Income taxes on unrealized holding gain (loss) on securities | — | | (3) | | 3 | |
| Unrealized holding gain (loss) on securities, net of tax | 1 | | 13 | | (11) | |
| Foreign currency translation adjustments | (760) | | 195 | | (623) | |
| Income taxes on foreign currency translation adjustments | — | | 2 | | 1 | |
| Foreign currency translation adjustments, net of tax | (760) | | 197 | | (622) | |
| Unrealized gain (loss) on hedging activities | (56) | | 78 | | — | |
| Income taxes on unrealized gain (loss) on hedging activities | 12 | | (16) | | — | |
| Unrealized gain (loss) on hedging activities, net of tax | (44) | | 62 | | — | |
| Other Comprehensive Income (Loss), Net of Tax | (800) | | 327 | | (1,050) | |
| Comprehensive Income (Loss) | $ | 8,445 | | 11,284 | | 17,630 | |
| | | |
| | | |
*Plans for which ConocoPhillips is not the primary obligor—primarily those administered by equity affiliates.
See Notes to Consolidated Financial Statements.
| | | | | |
| ConocoPhillips 2024 10-K | 78 |
| | | | | |
| Consolidated Balance Sheet | ConocoPhillips |
| | | | | | | | |
| At December 31 | Millions of Dollars |
| 2024 | 2023 |
| Assets | | |
| Cash and cash equivalents | $ | 5,607 | | 5,635 | |
| Short-term investments | 507 | | 971 | |
| Accounts and notes receivable (net of allowance of $7 and $3, respectively) | 6,621 | | 5,461 | |
| Accounts and notes receivable—related parties | 74 | | 13 | |
| | |
| Inventories | 1,809 | | 1,398 | |
| Prepaid expenses and other current assets | 1,029 | | 852 | |
| Total Current Assets | 15,647 | | 14,330 | |
| Investments and long-term receivables | 9,869 | | 9,130 | |
| | |
| Net properties, plants and equipment (net of accumulated DD&A of $81,072 and $74,361, respectively) | 94,356 | | 70,044 | |
| Other assets | 2,908 | | 2,420 | |
| Total Assets | $ | 122,780 | | 95,924 | |
| | |
| Liabilities | | |
| Accounts payable | $ | 5,987 | | 5,083 | |
| Accounts payable—related parties | 57 | | 34 | |
| Short-term debt | 1,035 | | 1,074 | |
| Accrued income and other taxes | 2,460 | | 1,811 | |
| Employee benefit obligations | 1,087 | | 774 | |
| Other accruals | 1,498 | | 1,229 | |
| Total Current Liabilities | 12,124 | | 10,005 | |
| Long-term debt | 23,289 | | 17,863 | |
| Asset retirement obligations and accrued environmental costs | 8,089 | | 7,220 | |
| Deferred income taxes | 11,426 | | 8,813 | |
| Employee benefit obligations | 1,022 | | 1,009 | |
| Other liabilities and deferred credits | 2,034 | | 1,735 | |
| Total Liabilities | 57,984 | | 46,645 | |
| | |
| Equity | | |
Common stock (2,500,000,000 shares authorized at $0.01 par value) Issued (2024—2,250,672,734 shares; 2023—2,103,772,516 shares) | | |
| Par value | 23 | | 21 | |
| Capital in excess of par | 77,529 | | 61,303 | |
| Treasury stock (at cost: 2024—974,806,010 shares; 2023—925,670,961 shares) | (71,152) | | (65,640) | |
| Accumulated other comprehensive income (loss) | (6,473) | | (5,673) | |
| Retained earnings | 64,869 | | 59,268 | |
| Total Equity | 64,796 | | 49,279 | |
| Total Liabilities and Equity | $ | 122,780 | | 95,924 | |
See Notes to Consolidated Financial Statements.
| | | | | |
| 79 | ConocoPhillips 2024 10-K |
| | | | | |
| Consolidated Statement of Cash Flows | ConocoPhillips |
| | | | | | | | | | | |
| Years Ended December 31 | Millions of Dollars |
| 2024 | 2023 | 2022 |
| Cash Flows From Operating Activities | | | |
| Net income (loss) | $ | 9,245 | | 10,957 | | 18,680 | |
| Adjustments to reconcile net income (loss) to net cash provided by operating activities | | | |
| Depreciation, depletion and amortization | 9,599 | | 8,270 | | 7,504 | |
| Impairments | 80 | | 14 | | (12) | |
| Dry hole costs and leasehold impairments | 46 | | 162 | | 340 | |
| Accretion on discounted liabilities | 325 | | 283 | | 250 | |
| Deferred taxes | 367 | | 1,145 | | 2,086 | |
| Distributions more (less) than income from equity affiliates | 564 | | 964 | | 942 | |
| (Gain) loss on dispositions | (51) | | (228) | | (1,077) | |
| (Gain) loss on investment in Cenovus Energy | — | | — | | (251) | |
| | | |
| Other | 130 | | (220) | | 86 | |
| Working capital adjustments | | | |
| Decrease (increase) in accounts and notes receivable | (262) | | 1,333 | | (963) | |
| Decrease (increase) in inventories | (68) | | (103) | | (38) | |
| Decrease (increase) in prepaid expenses and other current assets | 79 | | 337 | | (173) | |
| Increase (decrease) in accounts payable | (543) | | (1,118) | | 901 | |
| Increase (decrease) in taxes and other accruals | 613 | | (1,831) | | 39 | |
| Net Cash Provided by Operating Activities | 20,124 | | 19,965 | | 28,314 | |
| Cash Flows From Investing Activities | | | |
| Capital expenditures and investments | (12,118) | | (11,248) | | (10,159) | |
| Working capital changes associated with investing activities | 302 | | 30 | | 520 | |
| Acquisition of businesses, net of cash acquired | (24) | | (2,724) | | (60) | |
| Proceeds from asset dispositions | 261 | | 632 | | 3,471 | |
| Net sales (purchases) of investments | 415 | | 1,373 | | (2,629) | |
| Collection of advances/loans—related parties | — | | — | | 114 | |
| Other | 14 | | (63) | | 2 | |
| Net Cash Used in Investing Activities | (11,150) | | (12,000) | | (8,741) | |
| Cash Flows From Financing Activities | | | |
| Issuance of debt | 5,591 | | 3,787 | | 2,897 | |
| Repayment of debt | (4,981) | | (1,379) | | (6,267) | |
| Issuance of company common stock | (78) | | (52) | | 362 | |
| Repurchase of company common stock | (5,463) | | (5,400) | | (9,270) | |
| Dividends paid | (3,646) | | (5,583) | | (5,726) | |
| Other | (258) | | (34) | | (49) | |
| Net Cash Used in Financing Activities | (8,835) | | (8,661) | | (18,053) | |
| Effect of Exchange Rate Changes on Cash, Cash Equivalents and Restricted Cash | (133) | | (99) | | (224) | |
| Net Change in Cash, Cash Equivalents and Restricted Cash | 6 | | (795) | | 1,296 | |
| Cash, cash equivalents and restricted cash at beginning of period | 5,899 | | 6,694 | | 5,398 | |
| Cash, Cash Equivalents and Restricted Cash at End of Period | $ | 5,905 | | 5,899 | | 6,694 | |
Restricted cash of $298 million and $264 million is included in the “Other assets” line of our Consolidated Balance Sheet as of December 31, 2024 and December 31, 2023, respectively.See Notes to Consolidated Financial Statements.
| | | | | |
| ConocoPhillips 2024 10-K | 80 |
| | | | | |
| Consolidated Statement of Changes in Equity | ConocoPhillips |
| | | | | | | | | | | | | | | | | | | | | |
| Millions of Dollars |
| | | |
| Common Stock | | | | |
| Par Value | Capital in
Excess of
Par | Treasury
Stock | Accum. Other
Comprehensive
Income (Loss) | Retained
Earnings | | Total |
| | | | | | | |
| Balances at December 31, 2021 | $ | 21 | | 60,581 | | (50,920) | | (4,950) | | 40,674 | | | 45,406 | |
| Net income (loss) | | | | | 18,680 | | | 18,680 | |
| Other comprehensive income (loss) | | | | (1,050) | | | | (1,050) | |
| Dividends declared | | | | | | | |
| Ordinary ($1.89 per share of common stock) | | | | | (2,419) | | | (2,419) | |
| Variable return of cash ($3.10 per share of common stock) | | | | | (3,908) | | | (3,908) | |
| Repurchase of company common stock | | | (9,270) | | | | | (9,270) | |
| Distributed under benefit plans | | 561 | | | | | | 561 | |
| Other | | | 1 | | | 2 | | | 3 | |
| Balances at December 31, 2022 | $ | 21 | | 61,142 | | (60,189) | | (6,000) | | 53,029 | | | 48,003 | |
| Net income (loss) | | | | | 10,957 | | | 10,957 | |
| Other comprehensive income (loss) | | | | 327 | | | | 327 | |
| Dividends declared | | | | | | | |
| Ordinary ($2.11 per share of common stock) | | | | | (2,550) | | | (2,550) | |
| Variable return of cash ($1.80 per share of common stock) | | | | | (2,170) | | | (2,170) | |
| Repurchase of company common stock | | | (5,400) | | | | | (5,400) | |
| Excise tax on share repurchases | | | (50) | | | | | (50) | |
| Distributed under benefit plans | | 161 | | | | | | 161 | |
| Other | | | (1) | | | 2 | | | 1 | |
| Balances at December 31, 2023 | $ | 21 | | 61,303 | | (65,640) | | (5,673) | | 59,268 | | | 49,279 | |
| Net income (loss) | | | | | | | | | 9,245 | | | 9,245 | |
| Other comprehensive income (loss) | | | | | | | (800) | | | | | (800) | |
| Dividends declared | | | | | | | | | | | | |
| Ordinary ($2.52 per share of common stock) | | | | | | | | | (2,942) | | | (2,942) | |
| Variable return of cash ($0.60 per share of common stock) | | | | | | | | | (704) | | | (704) | |
| Acquisition of Marathon Oil | 2 | | 16,037 | | | | | | | | | 16,039 | |
| Repurchase of company common stock | | | | | (5,463) | | | | | | | (5,463) | |
| Excise tax on share repurchases | | | (50) | | | | | (50) | |
| Distributed under benefit plans | | | 189 | | | | | | | | | 189 | |
| Other | | | | | 1 | | | | 2 | | | 3 | |
| Balances at December 31, 2024 | $ | 23 | | 77,529 | | (71,152) | | (6,473) | | 64,869 | | | 64,796 | |
See Notes to Consolidated Financial Statements.
| | | | | |
| 81 | ConocoPhillips 2024 10-K |
| | | | | |
| Notes to Consolidated Financial Statements | |
Notes to Consolidated Financial Statements
Note 1—Accounting Policies
•Consolidation Principles and Investments—Our consolidated financial statements include the accounts of majority-owned, controlled subsidiaries and, if applicable, variable interest entities where we are the primary beneficiary. The equity method is used to account for investments in affiliates in which we have the ability to exert significant influence over the affiliates’ operating and financial policies. When we do not have the ability to exert significant influence, the investment is measured at fair value except when the investment does not have a readily determinable fair value. For those exceptions, it will be measured at cost minus impairment, plus or minus observable price changes in orderly transactions for an identical or similar investment of the same issuer. Undivided interests in oil and gas joint ventures, pipelines, natural gas plants and terminals are consolidated on a proportionate basis. Other securities and investments are generally carried at cost. We manage our operations through six operating segments, defined by geographic region: Alaska; Lower 48; Canada; Europe, Middle East and North Africa; Asia Pacific; and Other International. See Note 23. •Foreign Currency Translation—Adjustments resulting from the process of translating foreign functional currency financial statements into U.S. dollars are included in accumulated other comprehensive income (loss) in common stockholders’ equity. Foreign currency transaction gains and losses are included in current earnings. Some of our foreign operations use their local currency as the functional currency.
•Use of Estimates—The preparation of financial statements in conformity with U.S. GAAP requires management to make estimates and assumptions that affect the reported amounts of assets, liabilities, revenues and expenses and the disclosures of contingent assets and liabilities. Actual results could differ from these estimates.
•Revenue Recognition—Revenues associated with the sales of crude oil, bitumen, natural gas, NGLs, LNG and other items are recognized at the point in time when the customer obtains control of the asset. In evaluating when a customer has control of the asset, we primarily consider whether the transfer of legal title and physical delivery has occurred, whether the customer has significant risks and rewards of ownership and whether the customer has accepted delivery and a right to payment exists. These products are typically sold at prevailing market prices. We allocate variable market-based consideration to deliveries (performance obligations) in the current period as that consideration relates specifically to our efforts to transfer control of current period deliveries to the customer and represents the amount we expect to be entitled to in exchange for the related products. Payment is typically due within 30 days or less.
Transactions commonly called buy/sell contracts, in which the purchase and sale of inventory with the same counterparty are entered into “in contemplation” of one another, are combined and reported net (i.e., on the same income statement line).
•Shipping and Handling Costs—We typically incur shipping and handling costs prior to control transferring to the customer and account for these activities as fulfillment costs. Accordingly, we include shipping and handling costs in production and operating expenses for production activities. Transportation costs related to marketing activities are recorded in purchased commodities. Freight costs billed to customers are treated as a component of the transaction price and recorded as a component of revenue when the customer obtains control.
•Cash Equivalents—Cash equivalents are highly liquid, short-term investments that are readily convertible to known amounts of cash and have original maturities of 90 days or less from their date of purchase. They are carried at cost plus accrued interest, which approximates fair value.
•Short-Term Investments—Short-term investments include investments in bank time deposits and marketable securities (commercial paper and government obligations) which are carried at cost plus accrued interest and have original maturities of greater than 90 days but within one year or when the remaining maturities are within one year. We also invest in financial instruments classified as available for sale debt securities which are carried at fair value. Those instruments are included in short-term investments when they have remaining maturities of one year or less, as of the balance sheet date.
•Long-Term Investments in Debt Securities—Long-term investments in debt securities includes financial instruments classified as available for sale debt securities with remaining maturities greater than one year as of the balance sheet date. They are carried at fair value and presented within the “Investments and long-term receivables” line of our consolidated balance sheet.
| | | | | |
| ConocoPhillips 2024 10-K | 82 |
| | | | | |
| Notes to Consolidated Financial Statements | |
•Inventories—We have several valuation methods for our various types of inventories and consistently use the following methods for each type of inventory. The majority of our commodity-related inventories are recorded at cost using the LIFO basis. We measure these inventories at the lower-of-cost-or-market in the aggregate. Any necessary lower-of-cost-or-market write-downs at year end are recorded as permanent adjustments to the LIFO cost basis. LIFO is used to better match current inventory costs with current revenues. Costs include both direct and indirect expenditures incurred in bringing an item or product to its existing condition and location, but not unusual/nonrecurring costs or research and development costs. Materials, supplies and other miscellaneous inventories, such as tubular goods and well equipment, are valued using various methods, including the weighted-average-cost method and the FIFO method, consistent with industry practice.
•Fair Value Measurements—Assets and liabilities measured at fair value and required to be categorized within the fair value hierarchy are categorized into one of three different levels depending on the observability of the inputs employed in the measurement. Level 1 inputs are quoted prices in active markets for identical assets or liabilities. Level 2 inputs are observable inputs other than quoted prices included within Level 1 for the asset or liability, either directly or indirectly through market-corroborated inputs. Level 3 inputs are unobservable inputs for the asset or liability reflecting significant modifications to observable related market data or our assumptions about pricing by market participants.
•Derivative Instruments—Derivative instruments are recorded on the balance sheet at fair value. If the right of offset exists and certain other criteria are met, derivative assets and liabilities with the same counterparty are netted on the balance sheet and the collateral payable or receivable is netted against derivative assets and derivative liabilities, respectively.
Recognition and classification of the gain or loss that results from recording and adjusting a derivative to fair value depends on the purpose for issuing or holding the derivative. Gains and losses from derivatives not accounted for as hedges are recognized immediately in earnings. We do not apply hedge accounting to our commodity derivative instruments.
•Oil and Gas Exploration and Development—Oil and gas exploration and development costs are accounted for using the successful efforts method of accounting.
Property Acquisition Costs—Oil and gas leasehold acquisition costs are capitalized and included in the balance sheet caption PP&E. Leasehold impairment is recognized based on exploratory experience and management’s judgment. Upon achievement of all conditions necessary for reserves to be classified as proved, the associated leasehold costs are reclassified to proved properties.
Exploratory Costs—Geological and geophysical costs and the costs of carrying and retaining undeveloped properties are expensed as incurred. Exploratory well costs are capitalized, or “suspended,” on the balance sheet pending further evaluation of whether economically recoverable reserves have been found. If economically recoverable reserves are not found, exploratory well costs are expensed as dry holes. If exploratory wells encounter potentially economic quantities of oil and gas, the well costs remain capitalized on the balance sheet as long as sufficient progress assessing the reserves and the economic and operating viability of the project is being made. For complex exploratory discoveries, it is not unusual to have exploratory wells remain suspended on the balance sheet for several years while we perform additional appraisal drilling and seismic work on the potential oil and gas field or while we seek government or coventurer approval of development plans or seek environmental permitting. Once all required approvals and permits have been obtained, the projects are moved into the development phase, and the oil and gas resources are designated as proved reserves.
Management reviews suspended well balances quarterly, continuously monitors the results of the additional appraisal drilling and seismic work, and expenses the suspended well costs as dry holes when it judges the potential field does not warrant further investment in the near term. See Note 6. Development Costs—Costs incurred to drill and equip development wells, including unsuccessful development wells, are capitalized.
Depletion and Amortization—Leasehold costs of producing properties are depleted using the unit-of-production method based on estimated proved developed and proved undeveloped oil and gas reserves. Amortization of development costs is based on the unit-of-production method using estimated proved developed oil and gas reserves.
| | | | | |
| 83 | ConocoPhillips 2024 10-K |
| | | | | |
| Notes to Consolidated Financial Statements | |
•Capitalized Interest—Interest from external borrowings is capitalized on major projects with an expected construction period of one year or longer. Capitalized interest is added to the cost of the underlying asset and is amortized over the useful lives of the assets in the same manner as the underlying assets.
•Depreciation and Amortization—Depreciation and amortization of PP&E on producing hydrocarbon properties and SAGD facilities and certain pipeline and LNG assets (those which are expected to have a declining utilization pattern), are determined by the unit-of-production method. Depreciation and amortization of all other PP&E are determined by either the individual-unit-straight-line method or the group-straight-line method (for those individual units that are highly integrated with other units).
•Impairment of Properties, Plants and Equipment—Long-lived assets used in operations are assessed for impairment whenever changes in facts and circumstances indicate a possible significant deterioration in the future cash flows expected to be generated by an asset group. If there is an indication the carrying amount of an asset may not be recovered, a recoverability test is performed using management’s assumptions for prices, volumes and future development plans. If the sum of the undiscounted cash flows before income-taxes is less than the carrying value of the asset group, the carrying value is written down to estimated fair value and reported as an impairment in the period in which the determination is made. Individual assets are grouped for impairment purposes at the lowest level for which there are identifiable cash flows that are largely independent of the cash flows of other groups of assets—generally on a field-by-field basis for E&P assets. Because there usually is a lack of quoted market prices for long-lived assets, the fair value of impaired assets is typically determined based on the present values of expected future cash flows using discount rates and prices believed to be consistent with those used by principal market participants, or based on a multiple of operating cash flow validated with historical market transactions of similar assets where possible.
The expected future cash flows used for impairment reviews and related fair value calculations are based on estimated future production volumes, commodity prices, operating costs and capital decisions, considering all available evidence at the date of review. The impairment review includes cash flows from proved developed and undeveloped reserves, including any development expenditures necessary to achieve that production. Additionally, when probable and possible reserves exist, an appropriate risk-adjusted amount of these reserves may be included in the impairment calculation.
Long-lived assets committed by management for disposal within one year are accounted for at the lower of amortized cost or fair value, less cost to sell, with fair value determined using a binding negotiated price, if available, or present value of expected future cash flows as previously described.
•Maintenance and Repairs—Costs of maintenance and repairs, which are not significant improvements, are expensed when incurred.
•Property Dispositions—When complete units of depreciable property are sold, the asset cost and related accumulated depreciation are eliminated, with any gain or loss reflected in the “Gain (loss) on dispositions” line of our consolidated income statement. When partial units of depreciable property are sold or retired which do not significantly alter the DD&A rate, the asset cost and accumulated depreciation are eliminated such that no gain or loss is recorded.
•Asset Retirement Obligations and Environmental Costs—The fair value of legal obligations to retire and remove long-lived assets are recorded in the period in which the obligation is incurred (typically when the asset is installed at the production location). Fair value is estimated using a present value approach, incorporating assumptions about estimated amounts and timing of settlements and impacts of the use of technologies. See Note 7. Environmental expenditures are expensed or capitalized, depending upon their future economic benefit. Expenditures relating to an existing condition caused by past operations, and those having no future economic benefit, are expensed. Liabilities for environmental expenditures are recorded on an undiscounted basis (unless acquired through a business combination, which we record on a discounted basis) when environmental assessments or cleanups are probable and the costs can be reasonably estimated. Recoveries of environmental remediation costs from other parties are recorded as assets when their receipt is probable and estimable.
| | | | | |
| ConocoPhillips 2024 10-K | 84 |
| | | | | |
| Notes to Consolidated Financial Statements | |
•Impairment of Investments in Nonconsolidated Entities—Investments in nonconsolidated entities are assessed for impairment whenever changes in the facts and circumstances indicate a loss in value has occurred. When such a condition is judgmentally determined to be other than temporary, the carrying value of the investment is written down to fair value. The fair value of the impaired investment is based on quoted market prices, if available, or upon the present value of expected future cash flows using discount rates and prices believed to be consistent with those used by principal market participants, plus market analysis of comparable assets owned by the investee, if appropriate.
•Guarantees—The fair value of a guarantee is determined and recorded as a liability at the time the guarantee is given. The initial liability is subsequently reduced as we are released from exposure under the guarantee. We amortize the guarantee liability over the relevant time period, if one exists, based on the facts and circumstances surrounding each type of guarantee. In cases where the guarantee term is indefinite, we reverse the liability when we have information indicating the liability is essentially relieved or amortize it over an appropriate time period as the fair value of our guarantee exposure declines over time. We amortize the guarantee liability to the related income statement line item based on the nature of the guarantee. When it becomes probable that we will have to perform on a guarantee, we accrue a separate liability if it is reasonably estimable, based on the facts and circumstances at that time. We reverse the fair value liability only when there is no further exposure under the guarantee.
•Share-Based Compensation—We recognize share-based compensation expense over the shorter of the service period (i.e., the stated period of time required to earn the award) or the period beginning at the start of the service period and ending when an employee first becomes eligible for retirement. We have elected to recognize expense on a straight-line basis over the service period for the entire award, whether the award was granted with ratable or cliff vesting.
•Income Taxes—Deferred income taxes are computed using the liability method and are provided on all temporary differences between the financial reporting basis and the tax basis of our assets and liabilities, except for deferred taxes on income and temporary differences related to the cumulative translation adjustment considered to be permanently reinvested in certain foreign subsidiaries and foreign corporate joint ventures. Allowable tax credits are applied currently as reductions of the provision for income taxes. Interest related to unrecognized tax benefits is reflected in interest and debt expense, and penalties related to unrecognized tax benefits are reflected in production and operating expenses.
•Taxes Collected from Customers and Remitted to Governmental Authorities—Sales and value-added taxes are recorded net.
•Net Income (Loss) Per Share of Common Stock—Basic net income (loss) per share (EPS) is calculated using the two-class method. Under the two-class method, all earnings (distributed and undistributed) are allocated to common stock (including fully vested stock and unit awards that have not yet been issued as common stock) and participating securities. ConocoPhillips grants Restricted Stock Units (RSUs) under its share-based compensation programs, the majority of which entitle recipients to receive non-forfeitable dividends during the vesting period on a basis equivalent to dividends paid to holders of the company’s common stock. See Note 15. These unvested RSUs meet the definition of participating securities based on their respective rights to receive non-forfeitable dividends and are treated as a separate class of securities in computing basic EPS. Participating securities are not included as incremental shares in computing diluted EPS. Diluted EPS includes the potential impact of contingently issuable shares, including awards which require future service as a condition of delivery of the underlying common stock. Diluted EPS is calculated under both the two-class and treasury stock methods, and the more dilutive amount is reported. Diluted net loss per share does not assume conversion or exelrcise of securities that would have an antidilutive effect. Treasury stock is excluded from the daily weighted-average number of common shares outstanding in both calculations. See Note 22. | | | | | |
| 85 | ConocoPhillips 2024 10-K |
| | | | | |
| Notes to Consolidated Financial Statements | |
Note 2—Inventories
Inventories at December 31 were:
| | | | | | | | |
| Millions of Dollars |
| 2024 | 2023 |
| | |
| Crude oil and natural gas | $ | 907 | | 676 | |
| Materials and supplies | 902 | | 722 | |
| Total inventories | $ | 1,809 | | 1,398 | |
| | |
| Inventories valued on the LIFO basis | $ | 578 | | 401 | |
The estimated excess of current replacement cost over LIFO cost of inventories was approximately $113 million and $91 million at December 31, 2024 and 2023, respectively.
Note 3—Acquisitions and Dispositions
All gains or losses on asset dispositions are reported before-tax and are included net in the “Gain (loss) on dispositions” line on our consolidated income statement. Cash proceeds and payments are included in the “Cash Flows From Investing Activities” section of our consolidated statement of cash flows except for cash payments associated with a contingent consideration arrangement that are included in the "Cash Flows From Financing Activities" section.
2024
Acquisition of Marathon Oil Corporation (Marathon Oil)
In November 2024, we completed our acquisition of Marathon Oil, an independent oil and gas exploration and production company with operations across the Lower 48 and in Equatorial Guinea. At close, the transaction was valued at $16.5 billion, which primarily represented 0.255 shares of ConocoPhillips common stock exchanged for each outstanding share of Marathon Oil common stock.
| | | | | |
| Total Fair Value | Millions of Dollars |
| Value of ConocoPhillips common stock issued* | 15,972 | |
| Cash transferred at close** | 451 | |
| Value attributable to Marathon Oil share-based awards | 67 | |
| Other liabilities incurred*** | 17 | |
| Total Fair Value (Millions) | $ | 16,507 | |
*Represents the fair value of approximately 143 million shares of ConocoPhillips common stock issued to Marathon Oil stockholders. The fair value is based on the number of eligible shares of Marathon Oil common stock at a 0.255 exchange ratio and ConocoPhillips' average stock price on November 22, 2024, which was $111.93.
**Cash transferred at close primarily represents funds contributed to Marathon Oil for repayment of Marathon Oil's estimated commercial paper liabilities as of the closing date.
***Liabilities incurred are related to cash settled share-based awards and payment of cash in lieu of fractional Marathon Oil shares outstanding. These liabilities were settled prior to the end of 2024.
The transaction was accounted for as a business combination under FASB Topic ASC 805 using the acquisition method, which requires assets acquired and liabilities assumed to be measured at their acquisition date fair values. Fair value measurements were made for acquired assets and liabilities, and adjustments to those measurements may be made in subsequent periods, up to one year from the acquisition date, as we identify new information about facts and circumstances that existed as of the acquisition date to consider. At December 31, 2024, remaining items to finalize include allocation of fair value to unproved properties. The impact of finalizing the fair value allocation is not expected to have a material impact to our consolidated financial statements.
| | | | | |
| ConocoPhillips 2024 10-K | 86 |
| | | | | |
| Notes to Consolidated Financial Statements | |
Oil and gas properties were valued using a discounted cash flow approach incorporating market participant and internally generated price assumptions; production profiles; and operating and development cost assumptions. Debt assumed in the acquisition was valued based on observable market prices. The fair values of accounts receivable, accounts payable, and most other current assets and current liabilities were determined to be equivalent to the carrying value due to their short-term nature. The acquisition, valued at $16.5 billion, was allocated to the identifiable assets and liabilities based on their estimated fair values as of the acquisition date of November 22, 2024.
| | | | | |
| Assets Acquired | Millions of Dollars |
| Cash and cash equivalents | $ | 385 | |
| Accounts receivable, net | 969 | |
| Inventories | 360 | |
| |
| Investments and long-term receivables | 550 | |
| Net properties, plants and equipment | 24,178 | |
| Other assets | 201 | |
| Total assets acquired | $ | 26,643 | |
| |
| Liabilities Assumed | |
| Accounts payable | $ | 1,180 | |
| Accrued income and other taxes | 200 | |
| Employee benefit obligations | 187 | |
| |
| Long-term debt | 4,719 | |
| Asset retirement obligations | 781 | |
| Deferred income taxes | 2,486 | |
| Other liabilities | 583 | |
| Total liabilities assumed | $ | 10,136 | |
| Net assets acquired | $ | 16,507 | |
With the completion of the transaction, we acquired proved properties of approximately $13.2 billion, with $12.1 billion in Lower 48 and $1.1 billion in Equatorial Guinea, and unproved properties of $10.8 billion in Lower 48.
We recognized approximately $545 million of transaction-related costs, the majority of which were expensed in the fourth quarter of 2024. These non-recurring costs related primarily to employee severance and related benefits, fees paid to advisors and the settlement of share-based awards for certain Marathon Oil employees based on the terms of the Merger Agreement. These transaction-related costs included $328 million of employee severance expense. See Note 15.
For the year ended December 31, 2024, "Total Revenues and Other Income" and "Net Income (Loss)" associated with the acquired assets were $677 million and income of $66 million, respectively.
Alaska Acquisition
In the fourth quarter of 2024, after exercising our preferential rights, we completed an acquisition that increased our working interest by approximately 5 percent in the Kuparuk River Unit and approximately 0.4 percent in the Prudhoe Bay Unit from Chevron U.S.A. Inc. and Union Oil Company of California for $296 million, before customary adjustments. The transaction was accounted for as an asset acquisition, with the consideration allocated primarily to PP&E.
Assets Held For Sale
In December 2024, we entered into an agreement to sell our interests in certain noncore assets in the Lower 48 segment for $235 million, before customary adjustments. These assets have a net carrying value of approximately $235 million, which consists primarily of $251 million of PP&E and $16 million of liabilities, primarily noncurrent AROs. These assets met held for sale criteria in the fourth quarter of 2024, and as of December 31, 2024, we reclassified the PP&E to “Prepaid expenses and other current assets” and the noncurrent liabilities to “Other accruals” on our consolidated balance sheet. This transaction is anticipated to close in the first quarter of 2025.
| | | | | |
| 87 | ConocoPhillips 2024 10-K |
| | | | | |
| Notes to Consolidated Financial Statements | |
Planned Dispositions
In January 2025, we entered into an agreement to sell our interests in certain noncore assets in the Lower 48 segment for approximately $400 million, before customary adjustments. This transaction is expected to close in the first half of 2025.
2023
Surmont Acquisition
In October 2023, we completed our acquisition of the remaining 50 percent working interest in Surmont, an asset in our Canada segment, from TotalEnergies EP Canada Ltd. Following the acquisition, we own 100 percent working interest in Surmont. The final consideration for the all-cash transaction was $3.0 billion (CAD $4.1 billion) after customary adjustments:
| | | | | |
| Fair value of consideration | Millions of Dollars |
| Cash paid | $ | 2,635 | |
| Contingent consideration | 320 | |
| Total consideration | $ | 2,955 | |
The contingent consideration arrangement requires additional consideration to be paid to TotalEnergies EP Canada Ltd. up to $0.4 billion CAD over a five-year term. The contingent payments represent $2 million for every dollar that WCS pricing exceeds $52 per barrel during the month, subject to certain production targets being achieved. The undiscounted amounts we could pay under this arrangement was up to $0.3 billion USD at closing. The fair value of the contingent consideration on the acquisition date was $320 million and estimated by applying the income approach. For the year ended December 31, 2024, we have made payments of $158 million USD under this arrangement, reflected in the "Other" line within the Financing Activities section of our Consolidated Statement of Cash Flows. See Note 12.
The transaction was accounted for as a business combination under FASB Topic ASC 805 using the acquisition method, which requires assets acquired and liabilities assumed to be measured at their acquisition date fair values. By the end of the first quarter of 2024, we finalized the allocation of the purchase price to specific assets and liabilities. It was based on the fair value of the final consideration and the conclusion of the fair value determination of long-lived assets and all other assets acquired and liabilities assumed.
Oil and gas properties were valued using a discounted cash flow approach incorporating market participant and internally generated price assumptions, production profiles and operating and development cost assumptions. The fair values of other assets acquired and liabilities assumed, which included accounts receivable, accounts payable, and most other current assets and current liabilities, were determined to be equivalent to the carrying value due to their short-term nature. The total consideration of $3.0 billion was allocated to the identifiable assets and liabilities based on their fair values as of the acquisition date of October 4, 2023.
| | | | | |
| Recognized amounts of identifiable assets acquired and liabilities assumed | Millions of Dollars |
| |
| |
| |
| Oil and gas properties | 3,082 | |
| |
| |
| |
| |
| |
| |
| |
| |
| Asset retirement obligations | (112) | |
| Other | (15) | |
| |
| Total identifiable net assets | $ | 2,955 | |
With the completion of the transaction, we acquired proved and unproved properties of approximately $2.9 billion and $0.2 billion, respectively.
In anticipation of the acquisition, we entered into, and settled, various foreign exchange forward contracts to purchase CAD. For the year ended December 31, 2023, we recognized a loss of $112 million in the "Foreign currency transaction (gain) loss" line on our consolidated income statement associated with these forward contracts. The related cash flows are included within "Cash Flows From Investing Activities" on our consolidated statement of cash flows.
From the acquisition date through December 31, 2023, "Total Revenues and Other Income" and "Net Income (Loss)" associated with the acquired assets were $572 million and $119 million, respectively.
| | | | | |
| ConocoPhillips 2024 10-K | 88 |
| | | | | |
| Notes to Consolidated Financial Statements | |
Supplemental Pro Forma (unaudited)
The following tables summarize the unaudited supplemental pro forma financial information combining the consolidated income statement of ConocoPhillips with assets acquired as shown for the year ended December 31, 2024, 2023, and 2022, as if we had completed the acquisition of Marathon Oil on January 1, 2023 and the remaining working interest in Surmont on January 1, 2022, respectively.
| | | | | | | | | | | | | | | | | |
| Millions of Dollars |
| Year Ended December 31, 2024 |
| As reported | | | Pro forma Marathon Oil | Pro forma Combined |
| | | | | |
| Total Revenues and Other Income | $ | 56,953 | | | | 6,168 | | 63,121 | |
| | | | | |
| Net Income (Loss) | 9,245 | | | | 1,312 | | 10,557 | |
| | | | | |
| Earnings per share: | | | | | |
| Basic net income (loss) | $ | 7.82 | | | | | 8.06 | |
| Diluted net income (loss) | 7.81 | | | | | 8.05 | |
| | | | | |
| | | | | |
| | | | | |
| | | | | |
| Millions of Dollars |
| Year Ended December 31, 2023 |
| As reported | | Pro forma Surmont | Pro forma Marathon Oil | Pro forma Combined |
| Total Revenues and Other Income | $ | 58,574 | | | 2,561 | | 6,705 | | 67,840 | |
| | | | | |
| Net Income (Loss) | 10,957 | | | 501 | | 1,657 | | 13,115 | |
| | | | | |
| Earnings per share: | | | | | |
| Basic net income (loss) | $ | 9.08 | | | | | 9.72 | |
| Diluted net income (loss) | 9.06 | | | | | 9.70 | |
| | | | | |
| Millions of Dollars |
| Year Ended December 31, 2022 |
| As reported | | Pro forma Surmont | | Pro forma Combined |
| Total Revenues and Other Income | $ | 82,156 | | | 3,582 | | | 85,738 | |
| | | | | |
| Net Income (Loss) | 18,680 | | | 720 | | | 19,400 | |
| | | | | |
| Earnings per share: | | | | | |
| Basic net income (loss) | $ | 14.62 | | | | | 15.18 | |
| Diluted net income (loss) | 14.57 | | | | | 15.13 | |
The unaudited supplemental pro forma financial information is presented for illustration purposes only and is not necessarily indicative of the operating results that would have occurred had the transaction been completed on January 1, 2022, and January 1, 2023, respectively, nor is it necessarily indicative of future operating results of the combined entity. The pro forma results do not include cost savings anticipated as a result of the transaction. The pro forma results include adjustments which relate primarily to DD&A, which is based on the unit-of-production method, resulting from the purchase price allocated to oil and gas properties as well as adjustments for the timing of transaction costs and tax impacts. We believe the estimates and assumptions are reasonable, and the relative effects of the transaction are properly reflected.
QatarEnergy LNG NFS(3) (NFS3)
During 2022, we were awarded a 25 percent interest in NFS3, a new joint venture with QatarEnergy, to participate in the North Field South (NFS) LNG project. Formation of NFS3 closed during 2023. NFS3 has a 25 percent interest in the NFS project and is reported as an equity method investment in our Europe, Middle East and North Africa segment. See Note 4.
| | | | | |
| 89 | ConocoPhillips 2024 10-K |
| | | | | |
| Notes to Consolidated Financial Statements | |
Port Arthur Liquefaction Holdings, LLC (PALNG)
During 2023, we acquired a 30 percent interest in PALNG, a joint venture for the development of a large-scale LNG facility for the first phase of the Port Arthur LNG project ("Phase 1"). Sempra PALNG Holdings, LLC owns the remaining 70 percent interest in the joint venture. PALNG is reported as an equity method investment in our Corporate and Other segment. See Note 4.
Contingent Payments
We recorded contingent payments related to the previous dispositions of our working interests in the Foster Creek Christina Lake Partnership and western Canada gas assets, and our San Juan assets. Contingent payments were recorded as (gain) loss on disposition on our consolidated income statement and reflected within our Canada and Lower 48 segments. In our Canada segment, the contingent payment, calculated and paid quarterly, was $6 million CAD for every $1 CAD by which the WCS quarterly average crude oil price exceeded $52 CAD per barrel. In our Lower 48 segment, the contingent payment, paid annually, was calculated monthly at $7 million per month when the U.S. Henry Hub natural gas price was at or above $3.20 per MMBTU. The term of contingent payments in our Canada segment ended in the second quarter of 2022 and the term of contingent payments in our Lower 48 segment ended at the end of 2023. Contingent payments recorded in the years 2023 and 2022 were $7 million and $451 million, respectively.
2022
Acquisition of Additional Shareholding Interest in Australia Pacific LNG (APLNG)
In February 2022, we completed the acquisition of an additional 10 percent interest in APLNG from Origin Energy for approximately $1.4 billion, after customary adjustments, in an all-cash transaction resulting from the exercise of our preemption right. This increased our ownership in APLNG to 47.5 percent, with Origin Energy and Sinopec owning
27.5 percent and 25.0 percent, respectively. APLNG is reported as an equity investment in our Asia Pacific segment.
QatarEnergy LNG NFE(4) (NFE4)
During 2022, we were awarded a 25 percent interest in NFE4, a new joint venture with QatarEnergy to participate in the North Field East (NFE) LNG project. NFE4 has a 12.5 percent interest in the NFE project and is reported as an equity method investment in our Europe, Middle East and North Africa segment. See Note 4.
Asset Acquisition
In September 2022, we completed the acquisition of an additional working interest in certain Eagle Ford acreage in the Lower 48 segment for cash consideration of $236 million after customary adjustments. This agreement was accounted for as an asset acquisition, with the consideration allocated primarily to PP&E.
Assets Sold
During 2022, we sold our interests in certain noncore assets in our Lower 48 segment for net proceeds of $680 million, with no gain or loss recognized on sale. At the time of disposition, our interest in these assets had a net carrying value of $680 million, consisting of $825 million of assets, primarily related to $818 million of PP&E, and $145 million of liabilities, primarily related to AROs.
In March 2022, we completed the divestiture of our subsidiaries that held our Indonesia assets and operations, and based on an effective date of January 1, 2021, we received net proceeds of $731 million after customary adjustments and recognized a $534 million before-tax and $462 million after-tax gain related to this transaction. Together, the subsidiaries sold indirectly held our 54 percent interest in the Indonesia Corridor Block PSC and 35 percent shareholding in the Transasia Pipeline Company. At the time of the disposition, the net carrying value was approximately $0.2 billion, excluding $0.2 billion of cash and restricted cash. The net book value consisted primarily of $0.3 billion of PP&E and $0.1 billion of ARO. The before-tax earnings associated with the subsidiaries sold, excluding the gain on disposition noted above, was $138 million for the year ended December 31, 2022. Results of operations for the Indonesia interests sold were reported in our Asia Pacific segment.
| | | | | |
| ConocoPhillips 2024 10-K | 90 |
| | | | | |
| Notes to Consolidated Financial Statements | |
Note 4—Investments, Loans and Long-Term Receivables
Components of investments and long-term receivables at December 31 were:
| | | | | | | | |
| Millions of Dollars |
| 2024 | 2023 |
| Equity investments | $ | 8,611 | | 7,905 | |
| Long-term receivables | 113 | | 143 | |
| Long-term investments in debt securities | 1,055 | | 989 | |
| Other investments | 90 | | 93 | |
| $ | 9,869 | | 9,130 | |
Equity Investments
Affiliated companies in which we had a significant equity investment at December 31, 2024, included:
•APLNG—47.5 percent owned joint venture with Origin Energy (27.5 percent) and Sinopec (25 percent)—to produce CBM from the Bowen and Surat basins in Queensland, Australia, as well as process and export LNG.
•PALNG—30 percent owned joint venture with Sempra PALNG Holdings, LLC for the development of a large-scale LNG facility for the first phase of the Port Arthur LNG project ("Phase 1"). See Note 3. •N3—30 percent owned joint venture with an affiliate of QatarEnergy (68.5 percent) and Mitsui & Co., Ltd. (1.5 percent)—produces and liquefies natural gas from Qatar’s North Field, as well as exports LNG.
•NFE4—25 percent owned joint venture with affiliates of QatarEnergy (70 percent) and China National Petroleum Corporation (5 percent)—participant in the North Field East (NFE) LNG project. See Note 3. •NFS3—25 percent owned joint venture with an affiliate of QatarEnergy (75 percent)—participant in the North Field South LNG project. See Note 3. Summarized 100 percent earnings information for equity method investments in affiliated companies, combined, was as follows:
| | | | | | | | | | | |
| Millions of Dollars |
| 2024 | 2023 | 2022 |
| Revenues | $ | 15,286 | | 15,314 | | 18,356 | |
| Income (loss) before income taxes | 6,446 | | 6,301 | | 8,234 | |
| Net income (loss) | 4,389 | | 4,214 | | 5,507 | |
Summarized 100 percent balance sheet information for equity method investments in affiliated companies, combined, was as follows:
| | | | | | | | |
| Millions of Dollars |
| 2024 | 2023 |
| Current assets | $ | 4,608 | | 3,827 | |
| Noncurrent assets | 41,417 | | 39,299 | |
| Current liabilities | 3,829 | | 3,462 | |
| Noncurrent liabilities | 16,947 | | 16,665 | |
Our share of income taxes incurred directly by an equity method investee is reported in equity in earnings of affiliates, and as such is not included in income taxes on our consolidated financial statements.
At December 31, 2024, retained earnings included $96 million related to the undistributed earnings of affiliated companies. Dividends received from affiliates were $2,283 million, $2,684 million and $3,045 million in 2024, 2023 and 2022, respectively.
| | | | | |
| 91 | ConocoPhillips 2024 10-K |
| | | | | |
| Notes to Consolidated Financial Statements | |
APLNG
APLNG is a joint venture focused on producing CBM from the Bowen and Surat basins in Queensland, Australia. Natural gas is sold to domestic customers and LNG is processed and exported to Asia Pacific markets. Our investment in APLNG gives us access to CBM resources in Australia and enhances our LNG position. The majority of APLNG LNG is sold under two long-term sales and purchase agreements, supplemented with sales of additional LNG cargoes targeting the Asia Pacific markets. Origin Energy, an integrated Australian energy company, is the operator of APLNG’s production and pipeline system, while we operate the LNG facility.
In 2012, APLNG executed an $8.5 billion project finance facility that became non-recourse following financial completion in 2017. The facility is currently composed of a financing agreement with the Export-Import Bank of the United States, a commercial bank facility and two United States Private Placement note facilities. APLNG principal and interest payments commenced in March 2017 and are scheduled to occur bi-annually until September 2030. At December 31, 2024, a balance of $4.0 billion was outstanding on the facilities. See Note 9. At December 31, 2024, the carrying value of our equity method investment in APLNG was approximately $5.0 billion.
PALNG
PALNG is a joint venture for the development of a large-scale LNG facility. At December 31, 2024, the carrying value of our equity method investment in PALNG was approximately $1.5 billion. See Note 3. N3
N3 is a joint venture that owns an integrated large-scale LNG project located in Qatar. We have terminal and pipeline use agreements with Golden Pass LNG Terminal and affiliated Golden Pass Pipeline near Sabine Pass, Texas, intended to provide us with terminal and pipeline capacity for the receipt, storage and regasification of LNG purchased from N3. Currently, the LNG from N3 is being sold to markets outside of the U.S.
NFE4
NFE4 is a joint venture participating in the NFE LNG project. NFE4 has a 12.5 percent interest in the NFE project. See Note 3.
During the second quarter of 2024, we were notified that an affiliate of QatarEnergy transferred a 5 percent joint venture interest in NFE4 to an affiliate of China National Petroleum Corporation. As a result, we have concluded NFE4 is a VIE as it currently requires advances from the joint venture participants to fund the project. We are not the primary beneficiary of the VIE because we do not have the power to direct the activities that most significantly impact economic performance of NFE4, which involve activities related to the production and commercialization of natural gas, as well as LNG processing and export marketing. As a result, we do not consolidate NFE4, and it is accounted for under the equity method. As of December 31, 2024, the carrying value of our equity is included in the total carrying value of our equity method investments in Qatar. This equity together with the guarantee is the only financial support that we have provided NFE4. See Note 9.
NFS3
NFS3 is a joint venture participating in the NFS LNG project. NFS3 has a 25 percent interest in the NFS project. See Note 3.
At December 31, 2024, the carrying value of our equity method investments in Qatar was approximately $1.4 billion.
Loans
As part of our normal ongoing business operations and consistent with industry practice, we enter into numerous agreements with other parties to pursue business opportunities. Included in such activity are loans to certain affiliated and non-affiliated companies.
At December 31, 2024, there were no outstanding loans to affiliated companies.
| | | | | |
| ConocoPhillips 2024 10-K | 92 |
| | | | | |
| Notes to Consolidated Financial Statements | |
Note 5—Investment in Cenovus Energy
In 2022, we sold our remaining 91 million shares of Cenovus Energy (CVE), recognizing proceeds of $1.4 billion and a net gain of $251 million. All gains and losses were recognized within "Other income" on our consolidated income statement. Proceeds related to the sale of our CVE shares were included within "Cash Flows From Investing Activities" on our consolidated statement of cash flows.
Note 6—Suspended Wells and Exploration Expenses
The following table reflects the net changes in suspended exploratory well costs during 2024, 2023 and 2022:
| | | | | | | | | | | | |
| Millions of Dollars | |
| 2024 | 2023 | 2022 | |
| | | | |
| Beginning balance | $ | 184 | | 527 | | 660 | | |
| Additions pending the determination of proved reserves | 32 | | — | | 5 | | |
| Reclassifications to proved properties | (2) | | (285) | | (7) | | |
| | | | |
| Charged to dry hole expense | (18) | | (58) | | (131) | | |
| Ending balance | $ | 196 | | 184 | | 527 | | |
The following table provides an aging of suspended well balances at December 31:
| | | | | | | | | | | | | | |
| Millions of Dollars |
| 2024 | 2023 | 2022 | |
| | | | |
| Exploratory well costs capitalized for a period of one year or less | $ | 33 | | — | | 15 | | |
| Exploratory well costs capitalized for a period greater than one year | 163 | | 184 | | 512 | | |
| Ending balance | $ | 196 | | 184 | | 527 | | |
| | | | |
| Number of projects with exploratory well costs capitalized for a period greater than one year | 13 | | 14 | | 17 | | |
The following table provides a further aging of those exploratory well costs that have been capitalized for more than one year since the completion of drilling as of December 31, 2024:
| | | | | | | | | | | | | | |
| Millions of Dollars |
| | Suspended Since |
| Total | 2021-2023 | 2018-2020 | 2017 and Prior |
WL4-00—Malaysia(1) | 36 | | 12 | | 24 | | — | |
West Willow—Alaska(2) | 30 | | — | | 30 | | — | |
PL891—Norway(2) | 28 | | — | | 28 | | — | |
Narwhal Trend—Alaska(1) | 25 | | — | | 25 | | — | |
| | | | |
Montney—Canada(2) | 14 | | 7 | | 7 | | — | |
Other of $10 million or less each(1)(2) | 30 | | — | | — | | 30 | |
| Total | $ | 163 | | 19 | | 114 | | 30 | |
(1)Appraisal drilling complete; costs being incurred to assess development.
(2)Additional appraisal wells planned.
| | | | | |
| 93 | ConocoPhillips 2024 10-K |
| | | | | |
| Notes to Consolidated Financial Statements | |
Exploration Expenses
The charges discussed below are included in the “Exploration expenses” line on our consolidated income statement.
2024
In our Europe, Middle East and North Africa segment, we recorded approximately $40 million before-tax as dry hole expenses, which included $22 million for two partner operated exploration wells in the Alvheim area in the Norwegian sector of the North Sea, and $18 million for the Busta suspended discovery well on license PL782S in the North Sea.
2023
In our Europe, Middle East and North Africa segment, after further evaluation we recognized a before-tax expense of $37 million for dry hole costs associated with the suspended Warka discovery well, drilled in 2020, on license PL1009 in the Norwegian Sea.
In our Alaska segment, we recorded a before-tax expense of approximately $31 million for dry hole costs associated with the Bear-1 exploration well.
2022
In the fourth quarter, we recorded a before-tax expense of $129 million for impairment of certain aged, suspended wells associated with Surmont in our Canada segment.
In our Europe, Middle East and North Africa segment, we recorded a before-tax expense of $102 million for dry hole costs associated with four operated exploration and appraisal wells and one partner-operated well that were drilled in Norway in 2022.
| | | | | |
| ConocoPhillips 2024 10-K | 94 |
| | | | | |
| Notes to Consolidated Financial Statements | |
Note 7—Asset Retirement Obligations and Accrued Environmental Costs
Asset retirement obligations and accrued environmental costs at December 31 were:
| | | | | | | | |
| Millions of Dollars |
| 2024 | 2023 |
| | |
| Asset retirement obligations | $ | 8,215 | | 7,227 | |
| Accrued environmental costs | 206 | | 184 | |
| Total asset retirement obligations and accrued environmental costs | 8,421 | | 7,411 | |
| Asset retirement obligations and accrued environmental costs due within one year* | (332) | | (191) | |
| Long-term asset retirement obligations and accrued environmental costs | $ | 8,089 | | 7,220 | |
*Classified as a current liability on the balance sheet under “Other accruals.”
Asset Retirement Obligations
We record the fair value of a liability for an ARO when it is incurred (typically when the asset is installed at the production location). When the liability is initially recorded, we capitalize the associated asset retirement cost by increasing the carrying amount of the related PP&E. Over time, the liability increases for the change in its present value, while the capitalized cost depreciates over the useful life of the related asset. If in subsequent periods, our estimate of this liability changes, we will record an adjustment to both the liability and PP&E. Changes to estimated liabilities for assets that are no longer producing are recorded as impairment.
We have numerous AROs we are required to perform under law or contract once an asset is permanently taken out of service. Most of these obligations are not expected to be paid until several years, or decades, in the future and will be funded from general company resources at the time of removal. Our largest individual obligations involve plugging and abandonment of wells and removal and disposal of offshore oil and gas platforms around the world, as well as oil and gas production facilities and pipelines in Alaska.
During 2024 and 2023, our overall ARO changed as follows:
| | | | | | | | |
| Millions of Dollars |
| 2024 | 2023 |
| | |
| Balance at January 1 | $ | 7,227 | | 6,380 | |
| Accretion of discount | 319 | | 278 | |
| New obligations, including acquisitions | 926 | | 257 | |
| Changes in estimates of existing obligations | 140 | | 484 | |
| Spending on existing obligations | (182) | | (119) | |
| Property dispositions | (6) | | (27) | |
| Foreign currency translation | (209) | | (26) | |
| | |
| Balance at December 31 | $ | 8,215 | | 7,227 | |
Accrued Environmental Costs
Total accrued environmental costs at December 31, 2024 and 2023, were $206 million and $184 million, respectively.
We had accrued environmental costs of $139 million and $112 million at December 31, 2024 and 2023, respectively, related to remediation activities in the U.S. and Canada. We had also accrued in Corporate and Other $56 million and $55 million of environmental costs associated with sites no longer in operation at December 31, 2024 and 2023, respectively. In addition, December 31, 2024 and 2023, included a $11 million and $17 million accrual, respectively, where the company has been named a potentially responsible party under the CERCLA, or similar state laws. Accrued environmental liabilities are expected to be paid over periods extending up to 30 years.
Expected expenditures for environmental obligations acquired in various business combinations are discounted using a weighted-average 5 percent discount factor, resulting in an accrued balance for acquired environmental liabilities of $112 million at December 31, 2024. The total expected future undiscounted payments related to the portion of the accrued environmental costs that have been discounted are $158 million.
| | | | | |
| 95 | ConocoPhillips 2024 10-K |
| | | | | |
| Notes to Consolidated Financial Statements | |
Note 8—Debt
Long-term debt at December 31 was:
| | | | | | | | |
| Millions of Dollars |
| 2024 | 2023 |
| 2.125% Notes due 2024 | — | | 461 | |
| 3.35% Notes due 2024 | — | | 265 | |
| 2.4% Notes due 2025 | 366 | | 366 | |
| 8.2% Debentures due 2025 | 134 | | 134 | |
| 3.35% Notes due 2025 | 199 | | 199 | |
| 6.875% Debentures due 2026 | 67 | | 67 | |
| 7.8% Debentures due 2027 | 120 | | 203 | |
| 4.4% Notes due 2027 | 424 | | — | |
| 3.75% Notes due 2027 | 196 | | 196 | |
| 4.3% Notes due 2028 | 223 | | 223 | |
| 7.375% Debentures due 2029 | 66 | | 92 | |
| 7.0% Debentures due 2029 | 95 | | 112 | |
| 5.3% Notes due 2029 | 86 | | — | |
| 6.95% Notes due 2029 | 705 | | 1,195 | |
| 4.7% Notes due 2030 | 1,350 | | — | |
| 8.125% Notes due 2030 | 207 | | 390 | |
| 2.4% Notes due 2031 | 227 | | 227 | |
| 7.2% Notes due 2031 | 447 | | 447 | |
| 7.25% Notes due 2031 | 268 | | 400 | |
| 7.4% Notes due 2031 | 232 | | 382 | |
| 4.85% Notes due 2032 | 650 | | — | |
| 6.8% Notes due 2032 | 180 | | — | |
| 5.9% Notes due 2032 | 505 | | 505 | |
| 5.05% Notes due 2033 | 1,000 | | 1,000 | |
| 5.70% Notes due 2034 | 103 | | — | |
| 4.15% Notes due 2034 | 246 | | 246 | |
| 5.00% Notes due 2035 | 1,250 | | — | |
| 5.95% Notes due 2036 | 326 | | 326 | |
| 5.951% Notes serially maturing 2022 through 2037 | 573 | | 603 | |
| 6.6% Notes due 2037 | 335 | | — | |
| 5.9% Notes due 2038 | 350 | | 350 | |
| 6.5% Notes due 2039 | 1,588 | | 1,588 | |
| 3.758% Notes due 2042 | 785 | | 785 | |
| 4.3% Notes due 2044 | 750 | | 750 | |
| 5.20% Notes due 2045 | 186 | | — | |
| 5.95% Notes due 2046 | 329 | | 329 | |
| 7.9% Debentures due 2047 | 60 | | 60 | |
| 4.875% Notes due 2047 | 319 | | 319 | |
| 4.85% Notes due 2048 | 219 | | 219 | |
| 3.8% Notes due 2052 | 1,100 | | 1,100 | |
| 5.3% Notes due 2053 | 1,100 | | 1,100 | |
| 5.55% Notes due 2054 | 1,000 | | 1,000 | |
| 5.500% Notes due 2055 | 1,300 | | — | |
| 4.025% Notes due 2062 | 1,770 | | 1,770 | |
| 5.70% Notes due 2063 | 700 | | 700 | |
| | |
| 5.65% Notes due 2065 | 650 | | — | |
| | | | | |
| ConocoPhillips 2024 10-K | 96 |
| | | | | |
| Notes to Consolidated Financial Statements | |
| | | | | | | | |
| Marine Terminal Revenue Refunding Bonds due 2031 at 1.78% – 4.80% during 2024 and 1.65% – 4.70% during 2023 | 265 | | 265 | |
| Industrial Development Bonds due 2035 at 1.78% – 4.22% during 2024 and 1.85% – 4.70% during 2023 | 18 | | 18 | |
| | |
| | |
| | |
St. John the Baptist Parish, State of Louisiana—Revenue Refunding Bonds due 20371: $200 at 2.20%, $200 at 2.375%, $200 at 4.05%, $400 at 3.30%1 | 1,000 | | — | |
| | |
| Other | 16 | | 21 | |
| Debt at face value | 24,085 | | 18,413 | |
| Finance leases | 940 | | 1,129 | |
| Net unamortized premiums, discounts and debt issuance costs | (701) | | (605) | |
| Total debt | 24,324 | | 18,937 | |
| Short-term debt | (1,035) | | (1,074) | |
| Long-term debt | $ | 23,289 | | 17,863 | |
1Future mandatory purchase dates for these bonds: July 1, 2026 for the 2.20% bonds of $200 million, 2.375% bonds of $200 million, 4.05% bonds of $200 million and July 3, 2028 for the 3.30% bonds of $400 million. Subsequent to the mandatory purchase dates, we will also have the right to remarket
these bonds any time up to the 2037 maturity date.
The principal amounts of long-term debt, excluding finance lease obligations, maturing in 2025 through 2029 are: $735 million, $704 million, $778 million, $664 million and $997 million, respectively.
2024
In the fourth quarter of 2024, we acquired Marathon Oil and assumed its outstanding debt upon close. Shortly thereafter, we launched and completed concurrent debt transactions consisting of: tender offers to repurchase certain existing Marathon Oil and ConocoPhillips debt for cash (with priority for Marathon Oil debt assumed), an obligor exchange offer to retire certain Marathon Oil debt in exchange for new ConocoPhillips debt, new debt issuances to fund the repurchase tender offers and the remarketing of available municipal bonds. See Note 3.
Marathon Oil Debt Assumed at Fair Value
In November 2024, we completed the acquisition of Marathon Oil. As part of the acquisition, we assumed Marathon Oil's publicly traded debt, with an outstanding principal balance of $4.6 billion, which was recorded at fair value of $4.7 billion. See Note 3. •4.4% Notes due 2027 with principal amount of $1,000 million
•5.3% Notes due 2029 with principal amount of $600 million
•6.8% Notes due 2032 with principal amount of $550 million
•5.7% Notes due 2034 with principal amount of $600 million
•6.6% Notes due 2037 with principal amount of $750 million
•5.2% Notes due 2045 with principal amount of $500 million
•St. John the Baptist Parish, State of Louisiana—Revenue Refunding Bonds due 2037 with future mandatory purchase dates of July 1, 2026:
◦2.20% Bonds with principal amount of $200 million
◦2.375% Bonds with principal amount of $200 million
◦4.05% Bonds with principal amount of $200 million
| | | | | |
| 97 | ConocoPhillips 2024 10-K |
| | | | | |
| Notes to Consolidated Financial Statements | |
Repurchase Offers
In December 2024, we completed tender offers through which we repurchased a total of $3,768 million in aggregate principal amount of debt as listed below. We paid premiums above face value of $283 million to repurchase these debt instruments.
Marathon Oil Debt Repurchased:
•4.4% Notes due 2027 partial repurchase of $576 million
•5.3% Notes due 2029 partial repurchase of $514 million
•6.8% Notes due 2032 partial repurchase of $370 million
•5.7% Notes due 2034 partial repurchase of $497 million
•6.6% Notes due 2037 partial repurchase of $415 million
•5.2% Notes due 2045 partial repurchase of $314 million
ConocoPhillips Debt Repurchased:
•7.8% Debentures due 2027 with principal amount of $203 million (partial repurchase of $83 million)
•7.0% Debentures due 2029 with principal amount of $112 million (partial repurchase of $17 million)
•7.375% Debentures due 2029 with principal amount of $92 million (partial repurchase of $26 million)
•6.95% Notes due 2029 with principal amount of $1,195 million (partial repurchase of $490 million)
•8.125% Notes due 2030 with principal amount of $390 million (partial repurchase of $183 million)
•7.4% Notes due 2031 with principal amount of $382 million (partial repurchase of $151 million)
•7.25% Notes due 2031 with principal amount of $400 million (partial repurchase of $132 million)
Exchange Offer
Concurrently in December 2024, we completed a debt exchange offer through which $863 million in aggregate principal of existing Marathon Oil notes were tendered and accepted in exchange for $862 million of new ConocoPhillips notes. The debt exchange offers were treated as debt modifications for accounting purposes resulting in a portion of the unamortized debt discount and premiums of the existing notes being allocated to the new notes on the settlement dates of the exchange offers. No premiums were paid to bondholders in this exchange offer.
The notes tendered and accepted in the exchange offers were:
•4.4% Notes due 2027 partial exchange of $228 million
•5.3% Notes due 2029 partial exchange of $59 million
•6.8% Notes due 2032 partial exchange of $102 million
•5.7% Notes due 2034 partial exchange of $63 million
•6.6% Notes due 2037 partial exchange of $259 million
•5.2% Notes due 2045 partial exchange of $151 million
New Debt Issuance
In December 2024, we issued new debt of $5.2 billion through our universal shelf registration statement and prospectus supplement consisting of the following new notes and used the proceeds to repurchase existing debt as discussed:
•4.7% Notes due 2030 with principal of $1,350 million
•4.85% Notes due 2032 with principal of $650 million
•5.0% Notes due 2035 with principal of $1,250 million
•5.5% Notes due 2055 with principal of $1,300 million
•5.65% Notes due 2065 with principal of $650 million
Municipal Bonds Reoffering and Issuance
We completed a $400 million remarketing of sub-series 2017C bonds that are part of the $1 billion St. John the Baptist Parish, State of Louisiana—Revenue Refunding Bonds Series 2017. The bonds are subject to an interest rate of 3.30% and a mandatory purchase date of July 3, 2028.
As a result of the concurrent debt transactions as described above, we recognized a net loss on debt extinguishments of $173 million which is included in the "Other expenses" line on our consolidated income statement.
Other Debt Activity
Apart from the concurrent debt transactions discussed above, in November 2024, the company retired $265 million principal amount of our 3.35% Notes at maturity and in March 2024, the company retired $461 million principal amount of our 2.125% Notes at maturity.
| | | | | |
| ConocoPhillips 2024 10-K | 98 |
| | | | | |
| Notes to Consolidated Financial Statements | |
2023
In December 2023, the company retired $78 million principal amount of our 7.65 percent Notes at maturity. In the third quarter of 2023, we issued $2.7 billion in new Notes through our universal shelf registration statement and prospectus supplement. The net proceeds were used to fund the acquisition of the remaining 50 percent working interest in Surmont which closed in October 2023. See Note 3. The following Notes were issued: •5.05% Notes due 2033 with principal of $1.0 billion
•5.55% Notes due 2054 with principal of $1.0 billion
•5.70% Notes due 2063 with principal of $0.7 billion
In the second quarter of 2023, as described further below, we initiated and completed two concurrent transactions as part of our debt refinancing strategy. We issued $1.1 billion in new Notes through our universal shelf registration statement and prospectus supplement and used the proceeds to repurchase $1.1 billion of existing debt.
Debt Issuance
On May 23, 2023, we issued 5.3% Notes due 2053 with principal of $1.1 billion.
Repurchase Tender Offers
On May 25, 2023, we repurchased a total of $1,133 million aggregate principal amount of debt as listed below. We paid $33 million below face value to repurchase these debt instruments and recognized a gain on debt extinguishment of $27 million, which is included in the "Other expenses" line on our consolidated income statement.
•2.125% Notes due 2024 with principal of $900 million (partial repurchase of $439 million)
•3.350% Notes due 2024 with principal of $426 million (partial repurchase of $160 million)
•2.400% Notes due 2025 with principal of $900 million (partial repurchase of $534 million)
Revolving Credit Facility and Credit Rating Information
We have a revolving credit facility totaling $5.5 billion with an expiration date of February 2027. Our revolving credit facility may be used for direct bank borrowings, the issuance of letters of credit totaling up to $500 million, or as support for our commercial paper program. The revolving credit facility is broadly syndicated among financial institutions and does not contain any material adverse change provisions or any covenants requiring maintenance of specified financial ratios or credit ratings. The facility agreement contains a cross-default provision relating to the failure to pay principal or interest on other debt obligations of $200 million or more by ConocoPhillips, or any of its consolidated subsidiaries. The amount of the facility is not subject to redetermination prior to its expiration date.
Credit facility borrowings may bear interest at a margin above the Secured Overnight Financing Rate (SOFR). The facility agreement calls for commitment fees on available, but unused, amounts. The facility agreement also contains early termination rights if our current directors or their approved successors cease to be a majority of the Board of Directors.
The revolving credit facility supports our ability to issue up to $5.5 billion of commercial paper. Commercial paper is generally limited to maturities of 90 days and is included in short-term debt on our consolidated balance sheet. With no commercial paper outstanding and no direct borrowings or letters of credit, we had access to $5.5 billion in available borrowing capacity under our revolving credit facility at December 31, 2024 and December 31, 2023.
For information on Finance Leases, see Note 14. The current credit ratings on our long-term debt are:
•Fitch: “A” with a “stable” outlook
•S&P: “A-” with a “stable” outlook
•Moody's: "A2" with a "stable" outlook
We do not have any ratings triggers on any of our corporate debt that would cause an automatic default, and thereby impact our access to liquidity upon downgrade of our credit ratings. If our credit ratings are downgraded from their current levels, it could increase the cost of corporate debt available to us and restrict our access to the commercial paper markets. If our credit ratings were to deteriorate to a level prohibiting us from accessing the commercial paper market, we would still be able to access funds under our revolving credit facility.
| | | | | |
| 99 | ConocoPhillips 2024 10-K |
| | | | | |
| Notes to Consolidated Financial Statements | |
At both December 31, 2024 and 2023, we had $283 million of certain variable rate demand bonds (VRDBs) outstanding with maturities ranging through 2035. The VRDBs are redeemable at the option of the bondholders on any business day. If they are ever redeemed, we have the ability and intent to refinance on a long-term basis, therefore, the VRDBs are included in the “Long-term debt” line on our consolidated balance sheet.
Note 9—Guarantees
At December 31, 2024, we were liable for certain contingent obligations under various contractual arrangements as described below. We recognize a liability, at inception, for the fair value of our obligation as a guarantor for newly issued or modified guarantees. Unless the carrying amount of the liability is noted below, we have not recognized a liability because the fair value of the obligation is immaterial. In addition, unless otherwise stated, we are not currently performing with any significance under the guarantee and expect future performance to be either immaterial or have only a remote chance of occurrence.
APLNG Guarantees
At December 31, 2024, we had outstanding multiple guarantees in connection with our 47.5 percent ownership interest in APLNG. The following is a description of the guarantees with values calculated utilizing December 2024 exchange rates:
•During the third quarter of 2016, we issued a guarantee to facilitate the withdrawal of our pro-rata portion of the funds in a project finance reserve account. We estimate the remaining term of this guarantee to be six years. Our maximum exposure under this guarantee is approximately $210 million and may become payable if an enforcement action is commenced by the project finance lenders against APLNG. At December 31, 2024, the carrying value of this guarantee was approximately $14 million.
•In conjunction with our original purchase of an ownership interest in APLNG from Origin Energy Limited in October 2008, we agreed to reimburse Origin Energy Limited for our share of the existing contingent liability arising under guarantees of an existing obligation of APLNG to deliver natural gas under several sales agreements. The final guarantee expires in the fourth quarter of 2041. Our maximum potential liability for future payments, or cost of volume delivery, under these guarantees is estimated to be $610 million ($1.0 billion in the event of intentional or reckless breach) and would become payable if APLNG fails to meet its obligations under these agreements and the obligations cannot otherwise be mitigated. Future payments are considered unlikely, as the payments, or cost of volume delivery, would only be triggered if APLNG does not have enough natural gas to meet these sales commitments and if the co-venturers do not make necessary equity contributions into APLNG.
•We have guaranteed the performance of APLNG with regard to certain other contracts executed in connection with the project’s continued development. The guarantees have remaining terms of 12 to 21 years or the life of the venture. Our maximum potential amount of future payments related to these guarantees is approximately $480 million and would become payable if APLNG does not perform. At December 31, 2024, the carrying value of these guarantees was approximately $34 million.
QatarEnergy LNG Limited Guarantee
We have guaranteed our portion of certain fiscal and other joint venture obligations as a shareholder in NFE4 and NFS3. This guarantee has an approximate 30-year term with no maximum limit. At December 31, 2024, the carrying value of this guarantee was approximately $14 million.
Equatorial Guinea Guarantees
We have guaranteed payment obligations as a shareholder in both Equatorial Guinea LNG Operations, S.A., a fully owned subsidiary of Equatorial Guinea LNG Holdings Limited, and Alba Plant LLC with regard to certain agreements to process third-party gas. These guarantees have three years remaining, and the maximum potential future payments related to these guarantees is approximately $116 million. At December 31, 2024, the carrying value of these guarantees was approximately $4 million.
| | | | | |
| ConocoPhillips 2024 10-K | 100 |
| | | | | |
| Notes to Consolidated Financial Statements | |
Other Guarantees
We have other guarantees with maximum future potential payment amounts totaling approximately $570 million, which consist primarily of guarantees of the residual value of leased office buildings and guarantees of the residual value of corporate aircraft. These guarantees have remaining terms of one to five years and would become payable if certain asset values are lower than guaranteed amounts at the end of the lease or contract term, business conditions decline at guaranteed entities, or as a result of nonperformance of contractual terms by guaranteed parties. At December 31, 2024, there was no carrying value associated with these guarantees.
Indemnifications
Over the years, we have entered into agreements to sell ownership interests in certain legal entities, joint ventures and assets that gave rise to qualifying indemnifications. These agreements include indemnifications for taxes and environmental liabilities. The carrying amount recorded for these indemnifications at December 31, 2024, was approximately $20 million. Those related to environmental issues have terms that are generally indefinite and the maximum amounts of future payments are generally unlimited. Although it is reasonably possible future payments may exceed amounts recorded, due to the nature of the indemnifications, it is not possible to make a reasonable estimate of the maximum potential amount of future payments. See Note 10 for additional information about environmental liabilities. Note 10—Contingencies and Commitments
A number of lawsuits involving a variety of claims arising in the ordinary course of business have been filed against ConocoPhillips. We also may be required to remove or mitigate the effects on the environment of the placement, storage, disposal or release of certain chemical, mineral and petroleum substances at various active and inactive sites. We regularly assess the need for accounting recognition or disclosure of these contingencies. In the case of all known contingencies (other than those related to income taxes), we accrue a liability when the loss is probable and the amount is reasonably estimable. If a range of amounts can be reasonably estimated and no amount within the range is a better estimate than any other amount, then the low end of the range is accrued. We do not reduce these liabilities for potential insurance or third-party recoveries. We accrue receivables for insurance or other third-party recoveries when applicable. With respect to income tax-related contingencies, we use a cumulative probability-weighted loss accrual in cases where sustaining a tax position is less than certain. See Note 16, for additional information about income tax-related contingencies. Based on currently available information, we believe it is remote that future costs related to known contingent liability exposures will exceed current accruals by an amount that would have a material adverse impact on our consolidated financial statements. As we learn new facts concerning contingencies, we reassess our position both with respect to accrued liabilities and other potential exposures. Estimates particularly sensitive to future changes include contingent liabilities recorded for environmental remediation, tax and legal matters. Estimated future environmental remediation costs are subject to change due to such factors as the uncertain magnitude of cleanup costs, the unknown time and extent of such remedial actions that may be required, and the determination of our liability in proportion to that of other responsible parties. Estimated future costs related to tax and legal matters are subject to change as events evolve and as additional information becomes available during the administrative and litigation processes.
Environmental
We are subject to international, federal, state and local environmental laws and regulations and record accruals for environmental liabilities based on management’s best estimates. These estimates are based on currently available facts, existing technology, and presently enacted laws and regulations, taking into account stakeholder and business considerations. When measuring environmental liabilities, we also consider our prior experience in remediation of contaminated sites, other companies’ cleanup experience, and data released by the U.S. EPA or other organizations. We consider unasserted claims in our determination of environmental liabilities, and we accrue them in the period they are both probable and reasonably estimable.
| | | | | |
| 101 | ConocoPhillips 2024 10-K |
| | | | | |
| Notes to Consolidated Financial Statements | |
Although liability of those potentially responsible for environmental remediation costs is generally joint and several for federal sites and frequently so for other sites, we are usually only one of many companies cited at a particular site. Due to the joint and several liabilities, we could be responsible for all cleanup costs related to any site at which we have been designated as a potentially responsible party. We have been successful to date in sharing cleanup costs with other financially sound companies. Many of the sites at which we are potentially responsible are still under investigation by the U.S. EPA or the agency concerned. Prior to actual cleanup, those potentially responsible normally assess the site conditions, apportion responsibility and determine the appropriate remediation. In some instances, we may have no liability or may attain a settlement of liability. Where it appears that other potentially responsible parties may be financially unable to bear their proportional share, we consider this inability in estimating our potential liability, and we adjust our accruals accordingly. As a result of various acquisitions in the past, we assumed certain environmental obligations. Some of these environmental obligations are mitigated by indemnifications made by others for our benefit, and some of the indemnifications are subject to dollar limits and time limits.
We are currently participating in environmental assessments and cleanups at numerous federal Superfund and comparable state and international sites. After an assessment of environmental exposures for cleanup and other costs, we make accruals on an undiscounted basis (except those acquired in a purchase business combination, which we record on a discounted basis) for planned investigation and remediation activities for sites where it is probable future costs will be incurred and these costs can be reasonably estimated. We have not reduced these accruals for possible insurance recoveries. In the future, we may be involved in additional environmental assessments, cleanups and proceedings.
See Note 7 for a summary of our accrued environmental liabilities. Litigation and Other Contingencies
We are subject to various lawsuits and claims including but not limited to matters involving oil and gas royalty and severance tax payments, gas measurement and valuation methods, contract disputes, environmental damages, climate change, personal injury and property damage. Our primary exposures for such matters relate to alleged royalty and tax underpayments on certain federal, state and privately owned properties, claims of alleged environmental contamination and damages from historic operations, and climate change. We will continue to defend ourselves vigorously in these matters.
Our legal organization applies its knowledge, experience and professional judgment to the specific characteristics of our cases, employing a litigation management process to manage and monitor the legal proceedings against us. Our process facilitates the early evaluation and quantification of potential exposures in individual cases. This process also enables us to track those cases that have been scheduled for trial and/or mediation. Based on professional judgment and experience in using these litigation management tools and available information about current developments in all our cases, our legal organization regularly assesses the adequacy of current accruals and determines if adjustment of existing accruals, or establishment of new accruals, is required.
We have contingent liabilities resulting from throughput agreements with pipeline and processing companies not associated with financing arrangements. Under these agreements, we may be required to provide any such company with additional funds through advances and penalties for fees related to throughput capacity not utilized. In addition, at December 31, 2024, we had performance obligations secured by letters of credit of $278 million (issued as direct bank letters of credit) related to various purchase commitments for materials, supplies, commercial activities and services incident to the ordinary conduct of business.
In 2007, the government of Venezuela expropriated ConocoPhillips’ interests in the Petrozuata and Hamaca heavy oil ventures, as well as the offshore Corocoro development project. In response, ConocoPhillips initiated international arbitration proceedings before the ICSID. In March 2019, an ICSID tribunal unanimously ordered the government of Venezuela to pay ConocoPhillips approximately $8.7 billion (later reduced to $8.5 billion) plus interest for the unlawful expropriation of the projects. On January 22, 2025, an ICSID annulment committee dismissed Venezuela’s application to annul the tribunal’s decision and upheld the $8.5 billion award plus interest in full. Separate arbitrations before the ICC resulted in additional awards against PDVSA and three of its affiliates, including an award for approximately $2 billion plus interest, for the Hamaca and Petrozuata projects, and a $33 million award, for the Corocoro project, plus interest. As of December 31, 2024, the company has received approximately $787 million in connection with the first ICC award. Collection actions for all three awards are ongoing.
ConocoPhillips has ensured that all actions related to these arbitration awards meet all appropriate U.S. regulatory requirements, including those related to any applicable sanctions imposed by the U.S. against Venezuela.
| | | | | |
| ConocoPhillips 2024 10-K | 102 |
| | | | | |
| Notes to Consolidated Financial Statements | |
Beginning in 2017, governmental and other entities in several states/territories in the U.S. have filed lawsuits against oil and gas companies, including ConocoPhillips, seeking compensatory damages and equitable relief to abate alleged climate change impacts. Additional lawsuits with similar allegations are expected to be filed. The legal and factual issues are unprecedented, therefore, there is significant uncertainty about the scope of the claims and alleged damages and any potential impact on the company’s financial condition. ConocoPhillips believes these lawsuits are factually and legally meritless and are an inappropriate vehicle to address the challenges associated with climate change and will vigorously defend against such lawsuits.
Several Louisiana parishes and the State of Louisiana have filed numerous lawsuits under Louisiana’s State and Local Coastal Resources Management Act (SLCRMA) against oil and gas companies, including ConocoPhillips, seeking compensatory damages for contamination and erosion of the Louisiana coastline allegedly caused by historical oil and gas operations. ConocoPhillips entities are defendants in several of the lawsuits and will vigorously defend against them. On October 17, 2022, the Fifth Circuit affirmed remand of the lead case to state court and the subsequent request for rehearing was denied. Accordingly, the federal district courts have issued remands to state court. Because Plaintiffs’ SLCRMA theories are unprecedented, there is uncertainty about these claims (both as to scope and damages) and we continue to evaluate our exposure in these lawsuits.
In October 2020, the Bureau of Safety and Environmental Enforcement (BSEE) ordered the prior owners of Outer Continental Shelf (OCS) Lease P-0166, including ConocoPhillips, to decommission the lease facilities, including two offshore platforms located near Carpinteria, California. This order was sent after the current owner of OCS Lease P-0166 relinquished the lease and abandoned the lease platforms and facilities. BSEE’s order to ConocoPhillips is premised on its connection to Phillips Petroleum Company, a legacy company of ConocoPhillips, which held a historical 25 percent interest in this lease and operated these facilities but sold its interest over 30 years ago. ConocoPhillips continues to evaluate its exposure in this matter.
In July 2021, a federal securities class action was filed against Concho, certain of Concho’s officers, and ConocoPhillips as Concho’s successor in the United States District Court for the Southern District of Texas. On October 21, 2021, the court issued an order appointing Utah Retirement Systems and the Construction Laborers Pension Trust for Southern California as lead plaintiffs (Lead Plaintiffs). On January 7, 2022, the Lead Plaintiffs filed their consolidated complaint alleging that Concho made materially false and misleading statements regarding its business and operations in violation of the federal securities laws and seeking unspecified damages, attorneys’ fees, costs, equitable/injunctive relief and such other relief that may be deemed appropriate. The defendants filed a motion to dismiss the consolidated complaint on March 8, 2022. On June 23, 2023, the court denied defendants’ motion as to most defendants including Concho/ConocoPhillips. We believe the allegations in the action are without merit and are vigorously defending this litigation.
ConocoPhillips is involved in pending disputes with commercial counterparties relating to the propriety of its force majeure notices following Winter Storm Uri in 2021. We believe these claims are without merit and are vigorously defending them.
Long-Term Unconditional Purchase Obligations and Commitments, Including Throughput and Take-or-Pay Agreements
We have certain throughput agreements and take-or-pay agreements in support of financing arrangements. The agreements typically provide for natural gas or crude oil transportation and LNG purchase commitments. The fixed and determinable portion of the remaining estimated payments under these various agreements as of December 31, 2024 are: 2025—$6 million; 2026—$6 million; 2027—$6 million; 2028—$397 million; 2029—$558 million; and 2030 and after—$10.3 billion. Generally, variable components of these obligations include commodity futures prices and inflation rates. Purchases of LNG under these commitments are expected to be offset in the same or approximately same periods by cash received from the related sales transactions. Total payments under these agreements were $24 million in 2024, $26 million in 2023 and $26 million in 2022.
| | | | | |
| 103 | ConocoPhillips 2024 10-K |
| | | | | |
| Notes to Consolidated Financial Statements | |
Note 11—Derivative and Financial Instruments
We use futures, forwards, swaps and options in various markets to meet our customer needs, capture market opportunities and manage foreign exchange currency risk.
Commodity Derivative Instruments
Our commodity business primarily consists of natural gas, crude oil, bitumen, NGLs, LNG and power.
Commodity derivative instruments are held at fair value on our consolidated balance sheet. Where these balances have the right of setoff, they are presented on a net basis. Related cash flows are recorded as operating activities on our consolidated statement of cash flows. On our consolidated income statement, gains and losses are recognized either on a gross basis if directly related to our physical business or a net basis if held for trading. Gains and losses related to contracts that meet and are designated with the NPNS exception are recognized upon settlement. We generally apply this exception to eligible crude contracts and certain gas contracts. We do not apply hedge accounting for our commodity derivatives.
The following table presents the gross fair values of our commodity derivatives, excluding collateral, on our consolidated balance sheet:
| | | | | | | | |
| Millions of Dollars |
| 2024 | 2023 |
| Assets | | |
| Prepaid expenses and other current assets | $ | 394 | | 611 | |
| Other assets | 94 | | 113 | |
| Liabilities | | |
| Other accruals | 397 | | 567 | |
| Other liabilities and deferred credits | 83 | | 80 | |
The gains (losses) from commodity derivatives included in our consolidated income statement are presented in the following table:
| | | | | | | | | | | |
| Millions of Dollars |
| 2024 | 2023 | 2022 |
| | | |
| Sales and other operating revenues | $ | 133 | | 86 | | (88) | |
| Other income | (4) | | (6) | | (5) | |
| Purchased commodities | (133) | | (90) | | (91) | |
The table below summarizes our net exposures resulting from outstanding commodity derivative contracts:
| | | | | | | | |
| Open Position
Long/(Short) |
| 2024 | 2023 |
| Commodity | | |
| Natural gas and power (BCF equivalent) | | |
| Fixed price | (17) | | (12) | |
| Basis | — | | (2) | |
| | | | | |
| ConocoPhillips 2024 10-K | 104 |
| | | | | |
| Notes to Consolidated Financial Statements | |
Interest Rate Derivative Instruments
In 2023, PALNG executed interest rate swaps that had the effect of converting 60 percent of the projected term loans outstanding to finance the cost of development and construction of Phase 1 from floating to fixed rate. These swaps were designated and qualified for hedge accounting under ASC Topic 815, “Derivatives and Hedging,” as a cash flow hedge with changes in the fair value of the designated hedging instruments reported as a component of other comprehensive income and to be reclassified into earnings in the same periods that the hedged transactions will affect earnings.
In 2024, PALNG de-designated a portion of the interest rate swaps as a cash flow hedge. Changes in the fair value of the de-designated hedging instruments are reported in the "Equity in earnings of affiliates" line on our consolidated income statement.
For the years ended December 31, 2024, and 2023, we recognized an unrealized loss of $56 million and an unrealized gain of $78 million in other comprehensive income, respectively, related to the hedge accounted swaps. For the year ended December 31, 2024, we recognized $35 million in "Equity in earnings of affiliates" related to the de-designated swaps.
Financial Instruments
We invest in financial instruments with maturities based on our cash forecasts for the various accounts and currency pools we manage. The types of financial instruments in which we currently invest include:
•Time deposits: Interest bearing deposits placed with financial institutions for a predetermined amount of time.
•Demand deposits: Interest bearing deposits placed with financial institutions. Deposited funds can be withdrawn without notice.
•Commercial paper: Unsecured promissory notes issued by a corporation, commercial bank or government agency purchased at a discount to mature at par.
•U.S. government or government agency obligations: Securities issued by the U.S. government or U.S. government agencies.
•Foreign government obligations: Securities issued by foreign governments.
•Corporate bonds: Unsecured debt securities issued by corporations.
•Asset-backed securities: Collateralized debt securities.
The following investments are carried on our consolidated balance sheet at cost, plus accrued interest and the table reflects remaining maturities at December 31, 2024 and 2023:
| | | | | | | | | | | | | | |
| Millions of Dollars |
| Carrying Amount |
| Cash and Cash
Equivalents | Short-Term
Investments |
| 2024 | 2023 | 2024 | 2023 |
| | | | |
| Cash | $ | 770 | | 474 | | | |
| Demand Deposits | 3,211 | | 1,424 | | | |
| Time Deposits | | | | |
| 1 to 90 days | 1,364 | | 3,713 | | 1 | | 511 | |
| 91 to 180 days | | | 5 | | 22 | |
| Within one year | | | 6 | | 3 | |
| U.S. Government Obligations | | | | |
| 1 to 90 days | 260 | | 24 | | — | | — | |
| $ | 5,605 | | 5,635 | | 12 | | 536 | |
| | | | | |
| 105 | ConocoPhillips 2024 10-K |
| | | | | |
| Notes to Consolidated Financial Statements | |
The following investments in debt securities classified as available for sale are carried at fair value on our consolidated balance sheet at December 31, 2024 and 2023:
| | | | | | | | | | | | | | | | | | | | |
| Millions of Dollars |
| Carrying Amount |
| Cash and Cash
Equivalents | Short-Term
Investments | Investments and Long-Term
Receivables |
| 2024 | 2023 | 2024 | 2023 | 2024 | 2023 |
| Major Security Type | | | | | | |
| Corporate Bonds | $ | — | | — | | 338 | | 201 | | 612 | | 606 | |
| Commercial Paper | 2 | | — | | 77 | | 131 | | | |
| U.S. Government Obligations | — | | — | | 43 | | 89 | | 218 | | 189 | |
| U.S. Government Agency Obligations | | | — | | 5 | | 7 | | 7 | |
| Foreign Government Obligations | | | 4 | | 7 | | 12 | | 4 | |
| Asset-backed Securities | | | 33 | | 2 | | 205 | | 183 | |
| $ | 2 | | — | | 495 | | 435 | | 1,054 | | 989 | |
Cash and cash equivalents and Short-term investments have remaining maturities within one year. Investments and long-term receivables have remaining maturities that vary from greater than one year through four years.
The following table summarizes the amortized cost basis and fair value of investments in debt securities classified as available for sale at December 31:
| | | | | | | | | | | | | | |
| Millions of Dollars |
| Amortized Cost Basis | Fair Value |
| 2024 | 2023 | 2024 | 2023 |
| Major Security Type | | | | |
| Corporate Bonds | $ | 947 | | 806 | | 950 | | 807 | |
| Commercial Paper | 79 | | 131 | | 79 | | 131 | |
| U.S. Government Obligations | 262 | | 278 | | 261 | | 278 | |
| U.S. Government Agency Obligations | 7 | | 12 | | 7 | | 12 | |
| Foreign Government Obligations | 16 | | 11 | | 16 | | 11 | |
| Asset-backed Securities | 237 | | 184 | | 238 | | 185 | |
| $ | 1,548 | | 1,422 | | 1,551 | | 1,424 | |
As of December 31, 2024, total unrealized gains for debt securities classified as available for sale with net gains were $5 million and total unrealized losses for debt securities classified as available for sale with net losses were $1 million. As of December 31, 2023, total unrealized gains for debt securities classified as available for sale with net unrealized gains were $5 million. No allowance for credit losses has been recorded on investments in debt securities which are in an unrealized loss position.
For the years ended December 31, 2024 and 2023, proceeds from sales and redemptions of investments in debt securities classified as available for sale were $868 million and $983 million, respectively. Gross realized gains and losses included in earnings from those sales and redemptions were negligible. The cost of securities sold and redeemed is determined using the specific identification method.
| | | | | |
| ConocoPhillips 2024 10-K | 106 |
| | | | | |
| Notes to Consolidated Financial Statements | |
Credit Risk
Financial instruments potentially exposed to concentrations of credit risk consist primarily of cash equivalents, short-term investments, long-term investments in debt securities, OTC derivative contracts and trade receivables. Our cash equivalents and short-term investments are placed in high-quality commercial paper, government money market funds, U.S. government and government agency obligations, time deposits with major international banks and financial institutions, high-quality corporate bonds, foreign government obligations and asset-backed securities. Our long-term investments in debt securities are placed in high-quality corporate bonds, asset-backed securities, U.S. government and government agency obligations, foreign government obligations, and time deposits with major international banks and financial institutions.
The credit risk from our OTC derivative contracts, such as forwards, swaps and options, derives from the counterparty to the transaction. Individual counterparty exposure is managed within predetermined credit limits and includes the use of cash-call margins when appropriate, thereby reducing the risk of significant nonperformance. We also use futures, swaps and option contracts that have a negligible credit risk because these trades are cleared primarily with an exchange clearinghouse and subject to mandatory margin requirements until settled; however, we are exposed to the credit risk of those exchange brokers for receivables arising from daily margin cash calls, as well as for cash deposited to meet initial margin requirements.
Our trade receivables result primarily from our petroleum operations and reflect a broad national and international customer base, which limits our exposure to concentrations of credit risk. The majority of these receivables have payment terms of 30 days or less, and we continually monitor this exposure and the creditworthiness of the counterparties. We may require collateral to limit the exposure to loss, including letters of credit, prepayments and surety bonds, as well as master netting arrangements to mitigate credit risk with counterparties that both buy from and sell to us, as these agreements permit the amounts owed by us or owed to others to be offset against amounts due to us.
Certain of our derivative instruments contain provisions that require us to post collateral if the derivative exposure exceeds a threshold amount. We have contracts with fixed threshold amounts and other contracts with variable threshold amounts that are contingent on our credit rating. The variable threshold amounts typically decline for lower credit ratings, while both the variable and fixed threshold amounts typically revert to zero if we fall below investment grade. Cash is the primary collateral in all contracts; however, many also permit us to post letters of credit as collateral, such as transactions administered through the New York Mercantile Exchange.
The aggregate fair value of all derivative instruments with such credit risk-related contingent features that were in a liability position at December 31, 2024 and December 31, 2023, was $70 million and $181 million, respectively. For these instruments, no collateral was posted at December 31, 2024 and December 31, 2023. If our credit rating had been downgraded below investment grade at December 31, 2024, we would have been required to post $49 million of additional collateral, either with cash or letters of credit.
| | | | | |
| 107 | ConocoPhillips 2024 10-K |
| | | | | |
| Notes to Consolidated Financial Statements | |
Note 12—Fair Value Measurement
We carry a portion of our assets and liabilities at fair value that are measured at the reporting date using an exit price (i.e., the price that would be received to sell an asset or paid to transfer a liability) and disclosed according to the quality of valuation inputs under the fair value hierarchy.
The classification of an asset or liability is based on the lowest level of input significant to its fair value. Those that are initially classified as Level 3 are subsequently reported as Level 2 when the fair value derived from unobservable inputs is inconsequential to the overall fair value, or if corroborated market data becomes available. Assets and liabilities initially reported as Level 2 are subsequently reported as Level 3 if corroborated market data is no longer available. There were no material transfers into or out of Level 3 during 2024 or 2023.
Recurring Fair Value Measurement
Financial assets and liabilities reported at fair value on a recurring basis include our investments in debt securities classified as available for sale, commodity derivatives, and our contingent consideration arrangement related to the Surmont acquisition. See Note 3. •Level 1 derivative assets and liabilities primarily represent exchange-traded futures and options that are valued using unadjusted prices available from the underlying exchange. Level 1 financial assets also include our investments in U.S. government obligations classified as available for sale debt securities, which are valued using exchange prices.
•Level 2 derivative assets and liabilities primarily represent OTC swaps, options and forward purchase and sale contracts that are valued using adjusted exchange prices, prices provided by brokers or pricing service companies that are all corroborated by market data. Level 2 financial assets also include our investments in debt securities classified as available for sale including investments in corporate bonds, commercial paper, asset-backed securities, U.S. government agency obligations and foreign government obligations that are valued using pricing provided by brokers or pricing service companies that are corroborated with market data.
•Level 3 derivative assets and liabilities consist of OTC swaps, options and forward purchase and sale contracts where a significant portion of fair value is calculated from underlying market data that is not readily available. The derived value uses industry standard methodologies that may consider the historical relationships among various commodities, modeled market prices, time value, volatility factors and other relevant economic measures. The use of these inputs results in management’s best estimate of fair value. Level 3 commodity derivative activity was not material for all periods presented.
•Level 3 liabilities include the fair value of future quarterly contingent payments to Total Energies EP Canada Ltd. in connection with the acquisition of the remaining 50 percent working interest in Surmont. Contingent consideration consists of payments up to approximately $0.4 billion CAD over a five-year term ending in the fourth quarter of 2028. The contingent payments represent $2.0 million for every dollar that the monthly WCS average pricing exceeds $52 per barrel. The terms include adjustments related to not achieving certain production targets. The fair value of the contingent consideration as of December 31, 2024 is calculated using the income approach and is largely based on the estimated commodity price outlook using a combination of external pricing service companies' and our internal price outlook (unobservable input) and a discount rate consistent with those used by principal market participants (observable input). Impact of other unobservable inputs on the fair value as of December 31, 2024 was not significant.
The following table summarizes the fair value hierarchy for gross financial assets and liabilities (i.e., unadjusted where the right of setoff exists for commodity derivatives accounted for at fair value on a recurring basis):
| | | | | | | | | | | | | | | | | | | | | | | | | | | | | |
| Millions of Dollars |
| December 31, 2024 | | December 31, 2023 |
| Level 1 | Level 2 | Level 3 | Total | | Level 1 | Level 2 | Level 3 | Total |
| Assets | | | | | | | | | |
| | | | | | | | | |
| Investments in debt securities | $ | 261 | | 1,290 | | — | | 1,551 | | | 278 | | 1,146 | | — | | 1,424 | |
| Commodity derivatives | 201 | | 252 | | 35 | | 488 | | | 308 | | 301 | | 115 | | 724 | |
| Total assets | $ | 462 | | 1,542 | | 35 | | 2,039 | | | 586 | | 1,447 | | 115 | | 2,148 | |
| | | | | | | | | |
| Liabilities | | | | | | | | | |
| Commodity derivatives | $ | 275 | | 160 | | 45 | | 480 | | | 350 | | 283 | | 14 | | 647 | |
| Contingent consideration | — | | — | | 145 | | 145 | | | — | | — | | 312 | | 312 | |
| Total liabilities | $ | 275 | | 160 | | 190 | | 625 | | | 350 | | 283 | | 326 | | 959 | |
| | | | | |
| ConocoPhillips 2024 10-K | 108 |
| | | | | |
| Notes to Consolidated Financial Statements | |
The range and arithmetic average of the significant unobservable input used in the Level 3 fair value measurement was as follows:
| | | | | | | | | | | | | | |
| Fair Value
(Millions of
Dollars) | Valuation
Technique | Unobservable Input | Range (Arithmetic Average) |
Contingent Consideration - Surmont as of:
| | | | |
| December 31, 2024 | $ | 145 | | Discounted cash flow | Commodity price outlook* ($/BOE) | $48.63 - $57.53 ($53.38) |
| December 31, 2023 | 312 | | $45.48 - $63.04 ($57.45) |
*Commodity price outlook based on a combination of external pricing service companies' outlooks and our internal outlook.
The following table summarizes those commodity derivative balances subject to the right of setoff as presented on our consolidated balance sheet. We have elected to offset the recognized fair value amounts for multiple derivative instruments executed with the same counterparty in our financial statements when a legal right of setoff exists.
| | | | | | | | | | | | | | | | | | | | | | | |
| Millions of Dollars |
| | | Amounts Subject to Right of Setoff |
| Gross
Amounts
Recognized | Amounts Not
Subject to
Right of Setoff | Gross
Amounts | Gross
Amounts
Offset | Net
Amounts
Presented | Cash
Collateral | Net
Amounts |
| December 31, 2024 | | | | | | | |
| Assets | $ | 488 | | — | | 488 | | 278 | | 210 | | — | | 210 | |
| Liabilities | 480 | | — | | 480 | | 278 | | 202 | | 73 | | 129 | |
| | | | | | | |
| December 31, 2023 | | | | | | | |
| Assets | $ | 724 | | 39 | | 685 | | 375 | | 310 | | 4 | | 306 | |
| Liabilities | 647 | | 34 | | 613 | | 375 | | 238 | | 47 | | 191 | |
At December 31, 2024 and December 31, 2023, we did not present any amounts gross on our consolidated balance sheet where we had the right of setoff.
Reported Fair Values of Financial Instruments
We used the following methods and assumptions to estimate the fair value of financial instruments:
•Cash and cash equivalents and short-term investments: The carrying amount reported on the balance sheet approximates fair value. For those investments classified as available for sale debt securities, the carrying amount reported on the balance sheet is fair value.
•Accounts and notes receivable (including long-term and related parties): The carrying amount reported on the balance sheet approximates fair value.
•Investments in debt securities classified as available for sale: The fair value of investments in debt securities categorized as Level 1 in the fair value hierarchy is measured using exchange prices. The fair value of investments in debt securities categorized as Level 2 in the fair value hierarchy is measured using pricing provided by brokers or pricing service companies that are corroborated with market data. See Note 11. •Accounts payable (including related parties) and floating-rate debt: The carrying amount of accounts payable and floating-rate debt reported on the balance sheet approximates fair value.
•Fixed-rate debt: The estimated fair value of fixed-rate debt is measured using prices available from a pricing service that is corroborated by market data; therefore, these liabilities are categorized as Level 2 in the fair value hierarchy.
•Commercial paper: The carrying amount of our commercial paper instruments approximates fair value and is reported on the balance sheet as short-term debt.
| | | | | |
| 109 | ConocoPhillips 2024 10-K |
| | | | | |
| Notes to Consolidated Financial Statements | |
The following table summarizes the net fair value of financial instruments (i.e., adjusted where the right of setoff exists for commodity derivatives):
| | | | | | | | | | | | | | | | | |
| Millions of Dollars |
| Carrying Amount | | Fair Value |
| 2024 | 2023 | | 2024 | 2023 |
| Financial assets | | | | | |
| | | | | |
| Commodity derivatives | 210 | | 345 | | | 210 | | 345 | |
| Investments in debt securities | 1,551 | | 1,424 | | | 1,551 | | 1,424 | |
| | | | | |
| Financial liabilities | | | | | |
| Total debt, excluding finance leases | 23,384 | | 17,808 | | | 22,997 | | 18,621 | |
| Commodity derivatives | 129 | | 225 | | | 129 | | 225 | |
Note 13—Equity
Common Stock
The changes in our shares of common stock, as categorized in the equity section of the balance sheet, were:
| | | | | | | | | | | |
| Shares |
| 2024 | 2023 | 2022 |
| Issued | | | |
| Beginning of year | 2,103,772,516 | | 2,100,885,134 | | 2,091,562,747 | |
| Acquisition of Marathon Oil | 142,941,624 | | — | | — | |
| Distributed under benefit plans | 3,958,594 | | 2,887,382 | | 9,322,387 | |
| End of year | 2,250,672,734 | | 2,103,772,516 | | 2,100,885,134 | |
| | | |
| Held in Treasury | | | |
| Beginning of year | 925,670,961 | | 877,029,062 | | 789,319,875 | |
| Repurchase of common stock | 49,135,049 | | 48,641,899 | | 87,709,187 | |
| End of year | 974,806,010 | | 925,670,961 | | 877,029,062 | |
Preferred Stock
We have authorized 500 million shares of preferred stock, par value $0.01 per share, none of which was issued or outstanding at December 31, 2024 or 2023.
Repurchase of Common Stock
In late 2016, we initiated our current share repurchase program. In October 2024, our Board of Directors approved an increase from our prior authorization of $45 billion by a total of the lesser of $20 billion or the number of shares issued in our acquisition of Marathon Oil, such that the company is not to exceed $65 billion in aggregate purchases. Since inception of our current program, shares repurchased totaled 433 million shares at a cost of $34.3 billion through the end of December 2024.
In 2021, we began a paced monetization of our CVE common shares, the proceeds of which have been applied to share repurchases. In 2022, we sold our remaining 91 million CVE common shares.
| | | | | |
| ConocoPhillips 2024 10-K | 110 |
| | | | | |
| Notes to Consolidated Financial Statements | |
Note 14—Non-Mineral Leases
The company primarily leases office buildings and drilling equipment, as well as ocean transport vessels, tugboats, corporate aircraft, and other facilities and equipment. Certain leases include escalation clauses for adjusting rental payments to reflect changes in price indices, and other leases include payment provisions that vary based on the nature of usage of the leased asset. Additionally, the company has executed certain leases that provide it with the option to extend or renew the term of the lease, terminate the lease prior to the end of the lease term, or purchase the leased asset as of the end of the lease term. In other cases, the company has executed lease agreements that require it to guarantee the residual value of certain leased office buildings. For additional information about guarantees, see Note 9. There are no significant restrictions imposed on us by the lease agreements with regard to dividends, asset dispositions or borrowing ability. We determine if an arrangement is or contains a lease at contract inception. Certain contractual arrangements may contain both lease and non-lease components. Only the lease components of these contractual arrangements are subject to the provisions of ASC Topic 842, and any non-lease components are subject to other applicable accounting guidance; however, we have elected to adopt the optional practical expedient not to separate lease components apart from non-lease components for existing asset classes, except for crude oil and LNG Vessels. For contractual arrangements involving a new leased asset class, we determine at contract inception whether it will apply the optional practical expedient to the new leased asset class.
Leases are evaluated for classification as operating or finance leases at the commencement date of the lease and right-of-use assets and corresponding liabilities are recognized on our consolidated balance sheet based on the present value of future lease payments relating to the use of the underlying asset during the lease term. Future lease payments include variable lease payments that depend upon an index or rate using the index or rate at the commencement date and probable amounts owed under residual value guarantees. The amount of future lease payments may be increased to include additional payments related to lease extension, termination, and/or purchase options when the company has determined, at or subsequent to lease commencement, generally due to limited asset availability or operating commitments, it is reasonably certain of exercising such options. We use our incremental borrowing rate as the discount rate in determining the present value of future lease payments, unless the interest rate implicit in the lease arrangement is readily determinable. Lease payments that vary subsequent to the commencement date based on future usage levels, the nature of leased asset activities, or certain other contingencies are not included in the measurement of lease right-of-use assets and corresponding liabilities. We have elected not to record assets and liabilities on our consolidated balance sheet for lease arrangements with terms of 12 months or less.
We often enter into leasing arrangements acting in the capacity as operator for and/or on behalf of certain oil and gas joint ventures of undivided interests. If the lease arrangement can be legally enforced only against us as operator and there is no separate arrangement to sublease the underlying leased asset to our coventurers, we recognize at lease commencement a right-of-use asset and corresponding lease liability on our consolidated balance sheet on a gross basis. While we record lease costs on a gross basis in our consolidated income statement and statement of cash flows, such costs are offset by the reimbursement we receive from our coventurers for their share of the lease cost as the underlying leased asset is utilized in joint venture activities. As a result, lease cost is presented in our consolidated income statement and statement of cash flows on a proportional basis. If we are a nonoperating coventurer, we recognize a right-of-use asset and corresponding lease liability only if we were a specified contractual party to the lease arrangement and the arrangement could be legally enforced against us. In this circumstance, we would recognize both the right-of-use asset and corresponding lease liability on our consolidated balance sheet on a proportional basis consistent with our undivided interest ownership in the related joint venture.
The company has historically recorded finance lease assets and liabilities associated with certain oil and gas joint ventures on a proportional basis pursuant to accounting guidance applicable prior to the adoption date of ASC 842. In accordance with the transition provisions of ASC Topic 842, and since we have elected to adopt the package of optional transition-related practical expedients, the historical accounting treatment for these leases has been carried forward and is subject to reconsideration upon the modification or other required reassessment of the arrangements prior to lease term expiration.
| | | | | |
| 111 | ConocoPhillips 2024 10-K |
| | | | | |
| Notes to Consolidated Financial Statements | |
The following table summarizes the right-of-use assets and lease liabilities for both the operating and finance leases on our consolidated balance sheet as of December 31:
| | | | | | | | | | | | | | |
| Millions of Dollars |
| 2024 | 2023 |
| Operating
Leases | Finance
Leases | Operating
Leases | Finance
Leases |
| Right-of-Use Assets | | | | |
| Properties, plants and equipment | | | | |
| Gross | | 1,983 | | | 2,010 | |
| Accumulated DD&A | | (1,336) | | | (1,185) | |
Net PP&E* | | 647 | | | 825 | |
| | | | |
| Other assets | 1,017 | | | 691 | | |
| | | | |
| Lease Liabilities | | | | |
| Short-term debt** | | 292 | | | 291 | |
| Other accruals | 329 | | | 193 | | |
| Long-term debt*** | | 648 | | | 838 | |
| Other liabilities and deferred credits | 695 | | | 504 | | |
| Total lease liabilities | $ | 1,024 | | 940 | | 697 | | 1,129 | |
* Includes proportionately consolidated finance lease assets of $107 million at December 31, 2024 and $134 million at December 31, 2023.
** Includes proportionately consolidated finance lease liabilities of $181 million at December 31, 2024 and $175 million at December 31, 2023.
*** Includes proportionately consolidated finance lease liabilities of $259 million at December 31, 2024 and $326 million at December 31, 2023.
The following table summarizes our lease costs:
| | | | | | | | | | | |
| Millions of Dollars |
| 2024 | 2023 | 2022 |
| Lease Cost* | | | |
| Operating lease cost | $ | 325 | | 229 | | 212 | |
| Finance lease cost | | | |
| Amortization of right-of-use assets | 173 | | 180 | | 189 | |
| Interest on lease liabilities | 29 | | 35 | | 32 | |
| Short-term lease cost** | 49 | | 40 | | 94 | |
| Total lease cost*** | $ | 576 | | 484 | | 527 | |
* The amounts presented in the table above have not been adjusted to reflect amounts recovered or reimbursed from oil and gas coventurers.** Short-term leases are not recorded on our consolidated balance sheet.
*** Variable lease cost and sublease income are immaterial for the periods presented and therefore are not included in the table above.
The following table summarizes the lease terms and discount rates as of December 31:
| | | | | | | | |
| Lease Term and Discount Rate | 2024 | 2023 |
| | |
| Weighted-average term (years) | | |
| Operating leases | 4.41 | 5.83 |
| Finance leases | 4.86 | 5.73 |
| | |
| Weighted-average discount rate (percent) | | |
| Operating leases | 4.62 | | 4.13 | |
| Finance leases | 3.40 | | 3.39 | |
| | | | | |
| ConocoPhillips 2024 10-K | 112 |
| | | | | |
| Notes to Consolidated Financial Statements | Table of Contents |
The following table summarizes other lease information:
| | | | | | | | | | | |
| Millions of Dollars |
| 2024 | 2023 | 2022 |
| Other Information* | | | |
| Cash paid for amounts included in the measurement of lease liabilities | | | |
| Operating cash flows from operating leases | $ | 248 | | 173 | | 148 | |
| Operating cash flows from finance leases | 29 | | 33 | | 30 | |
| Financing cash flows from finance leases | 172 | | 169 | | 166 | |
| | | |
| Right-of-use assets obtained in exchange for operating lease liabilities | $ | 628 | | 355 | | 114 | |
| Right-of-use assets obtained in exchange for finance lease liabilities | — | | 9 | | 256 | |
*The amounts presented in the table above have not been adjusted to reflect amounts recovered or reimbursed from oil and gas coventurers. In addition, pursuant to other applicable accounting guidance, lease payments made in connection with preparing another asset for its intended use are reported in the "Cash Flows From Investing Activities" section of our consolidated statement of cash flows.
The following table summarizes future lease payments for operating and finance leases at December 31, 2024:
| | | | | | | | |
| Millions of Dollars |
| Operating Leases | Finance Leases |
| Maturity of Lease Liabilities | | |
| 2025 | $ | 382 | | 354 | |
| 2026 | 292 | | 200 | |
| 2027 | 160 | | 159 | |
| 2028 | 96 | | 177 | |
| 2029 | 55 | | 88 | |
| Remaining years | 121 | | 84 | |
| Total | 1,106 | | 1,062 | |
| Less: portion representing imputed interest | (82) | | (122) | |
| Total lease liabilities | $ | 1,024 | | $ | 940 | |
| | | | | |
| 113 | ConocoPhillips 2024 10-K |
| | | | | |
| Notes to Consolidated Financial Statements | |
Note 15—Employee Benefit Plans
Pension and Postretirement Plans
An analysis of the projected benefit obligations for our pension plans and accumulated benefit obligations for our postretirement health and life insurance plans follows:
| | | | | | | | | | | | | | | | | | | | | | | | | | |
| Millions of Dollars |
| Pension Benefits | | Other Benefits |
| 2024 | | 2023 | | 2024 | 2023 |
| U.S. | Int’l. | | U.S. | Int’l. | | | |
| Change in Benefit Obligation | | | | | | | | |
| Benefit obligation at January 1 | $ | 1,525 | | 2,866 | | | 1,478 | | 2,776 | | | 107 | | 102 | |
| Service cost | 49 | | 38 | | | 51 | | 38 | | | 1 | | 1 | |
| Interest cost | 76 | | 114 | | | 77 | | 113 | | | 5 | | 5 | |
| Plan participant contributions | — | | — | | | — | | — | | | 12 | | 14 | |
| Plan amendments | — | | 57 | | | — | | — | | | — | | — | |
| Business combinations | 237 | | | | | | | 42 | | |
| Actuarial (gain) loss | (4) | | (202) | | | 40 | | 11 | | | 5 | | 22 | |
| Benefits paid | (98) | | (134) | | | (121) | | (124) | | | (27) | | (37) | |
| Curtailment | 8 | | — | | | — | | — | | | — | | — | |
| Recognition of termination benefits | 13 | | — | | | — | | — | | | — | | — | |
| Foreign currency exchange rate change | — | | (148) | | | — | | 52 | | | — | | — | |
| Benefit obligation at December 31* | $ | 1,806 | | 2,591 | | | 1,525 | | 2,866 | | | 145 | | 107 | |
| *Accumulated benefit obligation portion of above at December 31: | $ | 1,703 | | 2,392 | | | 1,414 | | 2,642 | | | | |
| | | | | | | | |
| Change in Fair Value of Plan Assets | | | | | | | | |
| Fair value of plan assets at January 1 | $ | 1,306 | | 3,085 | | | 1,179 | | 2,879 | | | — | | — | |
| Actual return on plan assets | 66 | | 18 | | | 129 | | 199 | | | — | | — | |
| Company contributions | 83 | | 88 | | | 119 | | 58 | | | 15 | | 23 | |
| Plan participant contributions | — | | — | | | — | | — | | | 12 | | 14 | |
| Business combinations | 199 | | | | | | | | |
| Benefits paid | (98) | | (134) | | | (121) | | (124) | | | (27) | | (37) | |
| Foreign currency exchange rate change | — | | (150) | | | — | | 73 | | | — | | — | |
| Fair value of plan assets at December 31 | $ | 1,556 | | 2,907 | | | 1,306 | | 3,085 | | | — | | — | |
| Funded Status | $ | (250) | | 316 | | | (219) | | 219 | | | (145) | | (107) | |
| | | | | |
| ConocoPhillips 2024 10-K | 114 |
| | | | | |
| Notes to Consolidated Financial Statements | |
| | | | | | | | | | | | | | | | | | | | | | | | | | |
| Millions of Dollars |
| Pension Benefits | | Other Benefits |
| 2024 | | 2023 | | 2024 | 2023 |
| U.S. | Int’l. | | U.S. | Int’l. | | | |
| | | | | | | | |
| Amounts Recognized in the Consolidated Balance Sheet at December 31 | | | | | | | | |
| Noncurrent assets | $ | 1 | | 553 | | | — | | 491 | | | — | | — | |
| Current liabilities | (28) | | (10) | | | (16) | | (9) | | | (26) | | (24) | |
| Noncurrent liabilities | (223) | | (227) | | | (203) | | (263) | | | (119) | | (83) | |
| Total recognized | $ | (250) | | 316 | | | (219) | | 219 | | | (145) | | (107) | |
| | | | | | | | |
| Weighted-Average Assumptions Used to Determine Benefit Obligations at December 31 | | | | | | | | |
| Discount rate | 5.70 | % | 4.90 | | | 5.35 | | 4.10 | | | 5.60 | | 5.30 | |
| Rate of compensation increase | 5.00 | | 4.05 | | | 5.00 | | 3.65 | | | | |
| Interest crediting rate for applicable benefits | 4.30 | | | | 4.20 | | | | | |
| | | | | | | | |
| Weighted-Average Assumptions Used to Determine Net Periodic Benefit Cost for Years Ended December 31 | | | | | | | | |
| Discount rate | 5.35 | % | 4.10 | | | 5.65 | | 4.20 | | | 5.35 | | 5.65 | |
| Expected return on plan assets | 5.30 | | 5.40 | | | 5.30 | | 5.20 | | | | |
| Rate of compensation increase | 5.00 | | 3.65 | | | 5.00 | | 3.65 | | | | |
| Interest crediting rate for applicable benefits | 4.20 | | | | 3.55 | | | | | |
For both U.S. and international pension plans, the overall expected long-term rate of return is developed from the expected future return of each asset class, weighted by the expected allocation of pension assets to that asset class. We rely on a variety of independent market forecasts in developing the expected rate of return for each class of assets.
During 2024, the actuarial gains related to the benefit obligations for international plans were primarily related to an increase in the discount rates. During 2023, the actuarial losses related to the benefit obligations for U.S. and international plans were primarily related to a decrease in the discount rates.
The following tables summarize information related to the company's pension plans with projected and accumulated benefit obligations in excess of the fair value of the plans' assets:
| | | | | | | | | | | | | | | | | |
| Millions of Dollars |
| Pension Benefits |
| 2024 | | 2023 |
| U.S. | Int’l. | | U.S. | Int’l. |
| | | | | |
| Pension Plans with Projected Benefit Obligation in Excess of Plan Assets | | | | | |
| Projected benefit obligation | $ | 450 | | 242 | | | 1,525 | | 279 | |
| Fair value of plan assets | 199 | | 6 | | | 1,306 | | 6 | |
| | | | | |
| Pension Plans with Accumulated Benefit Obligation in Excess of Plan Assets | | | | | |
| Accumulated benefit obligation | $ | 425 | | 210 | | | 165 | | 243 | |
| Fair value of plan assets | 199 | | 6 | | | — | | 6 | |
| | | | | |
| 115 | ConocoPhillips 2024 10-K |
| | | | | |
| Notes to Consolidated Financial Statements | |
Included in accumulated other comprehensive income (loss) at December 31 were the following before-tax amounts that had not been recognized in net periodic benefit cost:
| | | | | | | | | | | | | | | | | | | | | | | | | | |
| Millions of Dollars |
| Pension Benefits | | Other Benefits |
| 2024 | | 2023 | | 2024 | 2023 |
| U.S. | Int’l. | | U.S. | Int’l. | | | |
| | | | | | | | |
| Unrecognized net actuarial loss (gain) | $ | 112 | | 445 | | | 123 | | 585 | | | 2 | | 3 | |
| Unrecognized prior service cost (credit) | — | | 58 | | | — | | 1 | | | (21) | | (60) | |
| | | | | | | | | | | | | | | | | | | | | | | | | | |
| Millions of Dollars |
| Pension Benefits | | Other Benefits |
| 2024 | | 2023 | | 2024 | 2023 |
| U.S. | Int’l. | | U.S. | Int’l. | | | |
| | | | | | | | |
| Sources of Change in Other Comprehensive Income (Loss) | | | | | | | | |
| Net gain (loss) arising during the period | $ | 3 | | 83 | | | 30 | | 29 | | | (5) | | (22) | |
| Amortization of actuarial loss included in income (loss)* | 8 | | 57 | | | 18 | | 67 | | | — | | (3) | |
| Net change during the period | $ | 11 | | 140 | | | 48 | | 96 | | | (5) | | (25) | |
| | | | | | | | |
| Prior service credit (cost) arising during the period | $ | — | | (57) | | | — | | — | | | — | | — | |
| Amortization of prior service (credit) included in income (loss) | — | | — | | | — | | — | | | (38) | | (38) | |
| Net change during the period | $ | — | | (57) | | | — | | — | | | (38) | | (38) | |
*Includes settlement (gains) losses recognized in 2024 and 2023.
The components of net periodic benefit cost of all defined benefit plans are presented in the following table:
| | | | | | | | | | | | | | | | | | | | | | | | | | | | | | | | | | | | | | |
| Millions of Dollars |
| Pension Benefits | | Other Benefits |
| 2024 | | 2023 | | 2022 | | 2024 | 2023 | 2022 |
| U.S. | Int’l. | | U.S. | Int’l. | | U.S. | Int’l. | | | | |
| | | | | | | | | | | | |
| Components of Net Periodic Benefit Cost | | | | | | | | | | | | |
| Service cost | $ | 49 | | 38 | | | 51 | | 38 | | | 58 | | 47 | | | 1 | | 1 | | 1 | |
| Interest cost | 76 | | 114 | | | 77 | | 113 | | | 62 | | 77 | | | 5 | | 5 | | 4 | |
| Expected return on plan assets | (66) | | (163) | | | (58) | | (148) | | | (50) | | (124) | | | — | | — | | — | |
| Amortization of prior service credit | — | | — | | | — | | — | | | — | | (1) | | | (38) | | (38) | | (38) | |
| Recognized net actuarial loss (gain) | 8 | | 58 | | | 12 | | 67 | | | 24 | | 11 | | | — | | (3) | | — | |
| Settlements loss (gain) | — | | (1) | | | 6 | | — | | | 37 | | — | | | — | | — | | — | |
| Curtailment loss (gain) | 8 | | — | | | — | | — | | | — | | — | | | — | | — | | — | |
| Net periodic benefit cost | $ | 75 | | 46 | | | 88 | | 70 | | | 131 | | 10 | | | (32) | | (35) | | (33) | |
The components of net periodic benefit cost, other than the service cost component, are included in the “Other expenses” line item on our consolidated income statement.
| | | | | |
| ConocoPhillips 2024 10-K | 116 |
| | | | | |
| Notes to Consolidated Financial Statements | |
We recognized pension settlement losses of $6 million in 2023 and $37 million in 2022 as lump-sum benefit payments from certain U.S. and international pension plans exceeded the sum of service and interest costs for those plans and led to recognition of settlement losses.
In determining net pension and other postretirement benefit costs, we amortize prior service costs on a straight-line basis over the average remaining service period of employees expected to receive benefits under the plan. For net actuarial gains and losses, we amortize 10 percent of the unamortized balance each year.
We have multiple non-pension postretirement benefit plans for health and life insurance. The health care plans are contributory and subject to various cost sharing features, most with participant and company contributions adjusted annually; the life insurance plans are noncontributory. The measurement of the U.S. pre-65 retiree medical accumulated postretirement benefit obligation assumes a health care cost trend rate of 6.5 percent in 2025 that declines to 5 percent by 2032. The measurement of the U.S. post-65 retiree medical accumulated postretirement benefit obligation assumes a health care cost trend rate of 4.6 percent in 2025 that increases to 5 percent by 2030.
Plan Assets
We follow a policy of broadly diversifying pension plan assets across asset classes and individual holdings. As a result, our plan assets have no significant concentrations of credit risk. Asset classes that are considered appropriate include U.S. equities, non-U.S. equities, U.S. fixed income, non-U.S. fixed income, real estate and private equity investments. Plan fiduciaries may consider and add other asset classes to the investment program from time to time. The target allocations for plan assets, aggregated across U.S. and international plans, are 26 percent in equity securities, 69 percent in debt securities, 4 percent in real estate and 1 percent in other. Generally, the plan investments are publicly traded; therefore, minimizing liquidity risk in the portfolio.
The following is a description of the valuation methodologies used for the pension plan assets. There have been no changes in the methodologies used at December 31, 2024 and 2023.
•Fair values of equity securities and government debt securities categorized in Level 1 are primarily based on quoted market prices in active markets for identical assets and liabilities.
•Fair values of corporate debt securities, agency and mortgage-backed securities and government debt securities categorized in Level 2 are estimated using recently executed transactions and quoted market prices for similar assets and liabilities in active markets and for identical assets and liabilities in markets that are not active. If there have been no market transactions in a particular fixed income security, its fair value is calculated by pricing models that benchmark the security against other securities with actual market prices. When observable quoted market prices are not available, fair value is based on pricing models that use something other than actual market prices (e.g., observable inputs such as benchmark yields, reported trades and issuer spreads for similar securities), and these securities are categorized in Level 3 of the fair value hierarchy.
•Fair values of investments in common/collective trusts are determined by the issuer of each fund based on the fair value of the underlying assets.
•Fair values of mutual funds are based on quoted market prices, which represent the net asset value of shares held.
•Time deposits are valued at cost, which approximates fair value.
•Cash is valued at cost, which approximates fair value. Fair values of international cash equivalents categorized in Level 2 are valued using observable yield curves, discounting and interest rates. U.S. cash balances held in the form of short-term fund units that are redeemable at the measurement date are categorized as Level 2.
•Fair values of exchange-traded derivatives classified in Level 1 are based on quoted market prices. For other derivatives classified in Level 2, the values are generally calculated from pricing models with market input parameters from third-party sources.
•Fair values of insurance contracts are valued at the present value of the future benefit payments owed by the insurance company to the plans’ participants.
•Fair values of real estate investments are valued using real estate valuation techniques and other methods that include reference to third-party sources and sales comparables where available.
| | | | | |
| 117 | ConocoPhillips 2024 10-K |
| | | | | |
| Notes to Consolidated Financial Statements | |
•A portion of U.S. pension plan assets is held as a participating interest in an insurance annuity contract, which is calculated as the market value of investments held under this contract, less the accumulated benefit obligation covered by the contract. The participating interest is classified as Level 3 in the fair value hierarchy as the fair value is determined via a combination of quoted market prices, recently executed transactions, and an actuarial present value computation for contract obligations. At December 31, 2024, the participating interest in the annuity contract was valued at $42 million and consisted of $113 million in debt securities, less $71 million for the accumulated benefit obligation covered by the contract. At December 31, 2023, the participating interest in the annuity contract was valued at $46 million and consisted of $130 million in debt securities, less $84 million for the accumulated benefit obligation covered by the contract. The participating interest is not available for meeting general pension benefit obligations in the near term. No future company contributions are required and no new benefits are being accrued under this insurance annuity contract.
The fair values of our pension plan assets at December 31, by asset class were as follows:
| | | | | | | | | | | | | | | | | | | | | | | | | | | | | | | |
| Millions of Dollars | | |
| U.S. | | International | | |
| Level 1 | Level 2 | Level 3 | Total | | Level 1 | Level 2 | Level 3 | Total | | |
| 2024 | | | | | | | | | | | |
| Equity securities | | | | | | | | | | | |
| U.S. | $ | 5 | | — | | — | | 5 | | | — | | — | | — | | — | | | |
| International | 38 | | — | | — | | 38 | | | — | | — | | — | | — | | | |
| Mutual funds | 17 | | — | | — | | 17 | | | 445 | | 77 | | — | | 522 | | | |
| Debt securities | | | | | | | | | | | |
| Corporate | — | | 1 | | — | | 1 | | | — | | — | | — | | — | | | |
| Mutual funds | — | | — | | — | | — | | | 451 | | — | | — | | 451 | | | |
| Private equity funds | | | 3 | | 3 | | | | | | | | |
| Cash and cash equivalents | — | | — | | — | | — | | | 25 | | — | | — | | 25 | | | |
| Insurance contracts | | | 4 | | 4 | | | | | | | | |
| Real estate | — | | — | | 3 | | 3 | | | — | | — | | 136 | | 136 | | | |
| Total in fair value hierarchy | $ | 60 | | 1 | | 10 | | 71 | | | 921 | | 77 | | 136 | | 1,134 | | | |
| | | | | | | | | | | |
| Investments measured at net asset value* | | | | | | | | | | | |
| Equity securities | | | | | | | | | | | |
| Common/collective trusts | | | | 479 | | | | | | 194 | | | |
| Debt securities | | | | | | | | | | | |
| Common/collective trusts | | | | 938 | | | | | | 1,575 | | | |
| Cash and cash equivalents | | | | 3 | | | | | | — | | | |
| Real estate | | | | 22 | | | | | | — | | | |
| Total** | $ | 60 | | 1 | | 10 | | 1,513 | | | 921 | | 77 | | 136 | | 2,903 | | | |
*In accordance with FASB ASC Topic 715, “Compensation—Retirement Benefits,” certain investments that are to be measured at fair value using the net asset value per share (or its equivalent) practical expedient have not been classified in the fair value hierarchy. The fair value amounts presented in this table are intended to permit reconciliation of the fair value hierarchy to the amounts presented in the Change in Fair Value of Plan Assets.
**Excludes the participating interest in the insurance annuity contract with a net asset of $42 million and net receivables related to security transactions of $5 million.
| | | | | |
| ConocoPhillips 2024 10-K | 118 |
| | | | | |
| Notes to Consolidated Financial Statements | |
The fair values of our pension plan assets at December 31, by asset class were as follows:
| | | | | | | | | | | | | | | | | | | | | | | | | | | | | |
| Millions of Dollars |
| U.S. | | International |
| Level 1 | Level 2 | Level 3 | Total | | Level 1 | Level 2 | Level 3 | Total |
| 2023 | | | | | | | | | |
| Equity securities | | | | | | | | | |
| U.S. | $ | 6 | | — | | — | | 6 | | | — | | — | | — | | — | |
| International | 35 | | — | | — | | 35 | | | — | | — | | — | | — | |
| Mutual funds | 15 | | — | | — | | 15 | | | 244 | | 276 | | — | | 520 | |
| Debt securities | | | | | | | | | |
| Corporate | — | | 1 | | — | | 1 | | | — | | — | | — | | — | |
| Mutual funds | — | | — | | — | | — | | | 421 | | — | | — | | 421 | |
| Cash and cash equivalents | — | | — | | — | | — | | | 25 | | — | | — | | 25 | |
| Derivatives | | | | | | | | | |
| Real estate | — | | — | | — | | — | | | — | | — | | 126 | | 126 | |
| Total in fair value hierarchy | $ | 56 | | 1 | | — | | 57 | | | 690 | | 276 | | 126 | | 1,092 | |
| | | | | | | | | |
| Investments measured at net asset value* | | | | | | | | | |
| Equity securities | | | | | | | | | |
| Common/collective trusts | | | | 300 | | | | | | 198 | |
| Debt securities | | | | | | | | | |
| Common/collective trusts | | | | 868 | | | | | | 1,791 | |
| Cash and cash equivalents | | | | 6 | | | | | | — | |
| Real estate | | | | 28 | | | | | | — | |
| Total** | $ | 56 | | 1 | | — | | 1,259 | | | 690 | | 276 | | 126 | | 3,081 | |
*In accordance with FASB ASC Topic 715, “Compensation—Retirement Benefits,” certain investments that are to be measured at fair value using the net asset value per share (or its equivalent) practical expedient have not been classified in the fair value hierarchy. The fair value amounts presented in this table are intended to permit reconciliation of the fair value hierarchy to the amounts presented in the Change in Fair Value of Plan Assets.
**Excludes the participating interest in the insurance annuity contract with a net asset of $46 million and net receivables related to security transactions of $5 million.
Level 3 activity was not material for all periods.
Our funding policy for U.S. plans is to contribute at least the minimum required by the Employee Retirement Income Security Act of 1974 and the Internal Revenue Code of 1986, as amended. Contributions to foreign plans are dependent upon local laws and tax regulations. In 2025, we expect to contribute approximately $190 million to our domestic qualified and nonqualified pension and postretirement benefit plans and $55 million to our international qualified and nonqualified pension and postretirement benefit plans.
| | | | | |
| 119 | ConocoPhillips 2024 10-K |
| | | | | |
| Notes to Consolidated Financial Statements | |
The following benefit payments, which are exclusive of amounts to be paid from the insurance annuity contract and which reflect expected future service, as appropriate, are expected to be paid:
| | | | | | | | | | | | | | |
| Millions of Dollars |
| Pension
Benefits | | Other
Benefits |
| U.S. | Int’l. | | |
| | | | |
| 2025 | $ | 386 | | 120 | | | 21 | |
| 2026 | 224 | | 124 | | | 19 | |
| 2027 | 213 | | 126 | | | 17 | |
| 2028 | 199 | | 128 | | | 16 | |
| 2029 | 195 | | 132 | | | 15 | |
| 2030–2034 | 769 | | 710 | | | 63 | |
The following table summarizes our severance accrual activity:
| | | | | | | | | | | |
| Millions of Dollars |
| 2024 | 2023 | 2022 |
| | | |
| Balance at January 1 | $ | 12 | | 31 | | 78 | |
| Accruals | 328 | | 1 | | 1 | |
| Benefit payments | (9) | | (20) | | (48) | |
| Balance at December 31 | $ | 331 | | 12 | | 31 | |
In 2024, accruals included severance costs associated with contractual termination benefits applicable to officers and employees of Marathon Oil as of the acquisition date. Of the remaining balance at December 31, 2024, $323 million is classified as short-term. See Note 3. Defined Contribution Plans
Most U.S. employees are eligible to participate in a defined contribution plan. Company contributions can vary based on employee compensation and contribution elections, whether the employee is accruing benefits in a defined benefit plan and company discretion. Company contributions charged to expense for U.S. defined contribution plans were $152 million in 2024, $151 million in 2023 and $140 million in 2022.
We have several defined contribution plans for our international employees, each with its own terms and eligibility depending on location. Total compensation expense recognized for these international plans was approximately $25 million in 2024, $23 million in 2023 and $24 million in 2022.
Share-Based Compensation Plans
The 2023 Omnibus Stock and Performance Incentive Plan of ConocoPhillips (Omnibus Plan) was approved by shareholders in May 2023, replacing similar prior plans and providing that no new awards shall be granted under the prior plans. Over its 10-year life, the Omnibus Plan allows the issuance of up to 36 million shares of our common stock for compensation to our employees and directors, but the available shares (i) are reduced by awards granted under the prior plan between the board adoption date (February 15, 2023) and the shareholder approval date (May 16, 2023) and (ii) are increased by any shares of common stock represented by awards granted under the Omnibus Plan or the prior plans that are forfeited, expire or are cancelled without delivery of shares of common stock or which result in the forfeiture of shares of common stock back to the company, excluding shares surrendered in payment of the exercise of a stock option or stock appreciation right, shares not issued in connection with the stock settlement of a stock appreciation right, or shares reacquired by the company using cash proceeds from the exercise of a stock option. The Human Resources and Compensation Committee of our Board of Directors is authorized to determine the types, terms, conditions and limitations of awards granted. Awards may be granted in the form of, but not limited to, stock options, RSUs and performance share units (PSU) to employees and non-employee directors who contribute to the company’s continued success and profitability.
| | | | | |
| ConocoPhillips 2024 10-K | 120 |
| | | | | |
| Notes to Consolidated Financial Statements | |
Total share-based compensation expense is measured using the grant date fair value for our equity-classified awards and the settlement date fair value for our liability-classified awards. We recognize share-based compensation expense over the shorter of the service period (i.e., the stated period of time required to earn the award) or, for awards that provide for retirement-based vesting, the period beginning at the start of the service period and ending upon the date when an employee first becomes eligible for retirement vesting under award terms. Other than certain retention awards, our share-based compensation programs generally provide accelerated vesting in whole or in part (i.e., a waiver of the remaining period of service required to earn an award) for awards held by employees at the time of their retirement. Some of our share-based awards vest ratably (i.e., portions of the award vest at different times) while some of our awards cliff vest (i.e., all of the award vests at the same time). We recognize expense on a straight-line basis over the service period for the entire award, whether the award was granted with ratable or cliff vesting.
Compensation Expense—Total share-based compensation expense recognized in net income (loss) and the associated tax benefit were:
| | | | | | | | | | | |
| Millions of Dollars |
| 2024 | 2023 | 2022 |
| | | |
| Compensation cost | $ | 268 | | 334 | | 377 | |
| Tax benefit | 67 | | 84 | | 95 | |
Stock Options—Stock options granted under the provisions of the Omnibus Plan and prior plans permit purchase of our common stock at exercise prices equivalent to the average fair market value of ConocoPhillips common stock on the date the options were granted. The options have terms of 10 years and generally vest ratably on the first, second and third anniversaries of the date of grant. Options awarded to certain employees already eligible for retirement vest within six months of the grant date, but those options do not become exercisable until the end of the normal vesting period. Beginning in 2018, stock option grants were discontinued.
The following summarizes our stock option activity for the year ended December 31, 2024:
| | | | | | | | | | | | | | | | | |
| | | | | Millions of Dollars |
| Options | | Weighted-Average
Exercise Price | | Aggregate
Intrinsic Value |
| | | | | |
| Outstanding at December 31, 2023 | 3,264,675 | | | $ | 52.55 | | | $ | 209 | |
| Exercised | (1,213,600) | | | 68.42 | | | 63 | |
| Expired or cancelled | — | | | — | | | |
| Outstanding at December 31, 2024 | 2,051,075 | | | $ | 43.16 | | | $ | 113 | |
| Vested at December 31, 2024 | 2,051,075 | | | $ | 43.16 | | | $ | 113 | |
| Exercisable at December 31, 2024 | 2,051,075 | | | $ | 43.16 | | | $ | 113 | |
The weighted-average remaining contractual term of outstanding options, vested options and exercisable options at December 31, 2024, were all 1.47 years. The aggregate intrinsic value of options exercised was $58 million in 2023 and $308 million in 2022.
During 2024, we received $83 million in cash and realized a tax benefit of $13 million from the exercise of options. At December 31, 2024, all outstanding stock options were fully vested and there was no remaining compensation cost to be recorded.
Stock Unit Programs—RSUs granted annually under the provisions of the Omnibus Plan and the general and executive RSU programs vest in one installment on the third anniversary of the grant date. RSUs granted under the Omnibus Plan for a variable long-term incentive retention program vest ratably on the first, second and third anniversaries of the grant date. RSUs are also granted ad hoc to attract or retain key personnel, or assumed as a result of an acquisition, and the terms and conditions under which these RSUs vest vary by award.
| | | | | |
| 121 | ConocoPhillips 2024 10-K |
| | | | | |
| Notes to Consolidated Financial Statements | |
Stock-Settled
Upon vesting, these RSUs are settled by issuing one share of ConocoPhillips common stock per unit. Units awarded to retirement eligible employees under the general and executive RSU programs may vest earlier; however, those units are not settled through the issuance of common stock until after the earlier of separation from the company or the end of the regularly scheduled vesting period. Until issued as stock, most recipients of the RSUs receive a cash payment of a dividend equivalent or an accrued reinvested dividend equivalent that is charged to retained earnings. The grant date fair market value of these RSUs is deemed equal to the average ConocoPhillips stock price on the grant date. The grant date fair market value of RSUs that do not receive a dividend equivalent while unvested is deemed equal to the average ConocoPhillips stock price on the grant date, less the net present value of the estimated dividends that will not be received.
The following summarizes our stock-settled stock RSU activity for the year ended December 31, 2024:
| | | | | | | | | | | | | | | | | |
| Stock Units | | Weighted-Average
Grant Date Fair Value | | Millions of Dollars |
| | | Total Fair Value |
| | | | | |
| Outstanding at December 31, 2023 | 7,093,690 | | | $ | 76.78 | | | |
| Granted | 3,161,899 | | | 109.79 | | | |
| Forfeited | (113,163) | | | 104.34 | | | |
| Issued | (3,670,653) | | | 54.79 | | | $ | 410 | |
| Outstanding at December 31, 2024 | 6,471,773 | | | $ | 104.89 | | | |
| Not Vested at December 31, 2024 | 4,508,368 | | | $ | 105.31 | | | |
At December 31, 2024, the remaining unrecognized compensation cost from the unvested stock-settled RSUs was $212 million, which will be recognized over a weighted-average period of 1.63 years, the longest period being 3 years. The weighted-average grant date fair value of stock-settled RSUs granted during 2023 and 2022 was $110.91 and 90.57, respectively. The total fair value of stock-settled RSUs issued during 2023 and 2022 was $284 million and $193 million, respectively.
Cash-Settled
Cash-settled executive RSUs granted in 2018 and 2019 replaced the stock option program. These RSUs, subject to elections to defer, were settled in cash equal to the fair market value of a share of ConocoPhillips common stock per unit on the settlement date and are classified as liabilities on the balance sheet. Executive RSUs awarded to retirement eligible employees may vest earlier; however, those units were not settled until after the earlier of separation from the company or the end of the regularly scheduled vesting period. Compensation expense was initially measured using the average fair market value of ConocoPhillips common stock and was subsequently adjusted, based on changes in the ConocoPhillips stock price through the end of each subsequent reporting period, through the settlement date. Recipients received an accrued reinvested dividend equivalent that was charged to compensation expense. The accrued reinvested dividend was paid at the time of settlement, subject to the terms and conditions of the award.
There was no cash-settled stock unit activity and no remaining unrecognized compensation cost to be recorded for the unvested cash-settled units for the year ended December 31, 2024 and December 31, 2023. The total fair value of cash-settled executive RSUs issued during 2022 was $21 million.
Performance Share Program—Under the Omnibus Plan, we also annually grant restricted PSUs to senior management. These PSUs are authorized three years prior to their effective grant date (the performance period). Compensation expense is initially measured using the average fair market value of ConocoPhillips common stock and is subsequently adjusted, based on changes in the ConocoPhillips stock price through the end of each subsequent reporting period, through the grant date for stock-settled awards and the settlement date for cash-settled awards.
| | | | | |
| ConocoPhillips 2024 10-K | 122 |
| | | | | |
| Notes to Consolidated Financial Statements | |
Stock-Settled
Stock-settled PSUs are settled by issuing one share of ConocoPhillips common stock per unit. For performance periods beginning before 2009, PSUs do not vest until the employee becomes eligible for retirement by reaching age 55 with five years of service, and restrictions do not lapse until the employee separates from the company. With respect to awards for performance periods beginning in 2009 through 2012, PSUs do not vest until the earlier of the date the employee becomes eligible for retirement by reaching age 55 with five years of service or five years after the grant date of the award, and restrictions do not lapse until the earlier of the employee’s separation from the company or five years after the grant date (although recipients can elect to defer the lapsing of restrictions until separation). We recognize compensation expense for these awards beginning on the grant date and ending on the date the PSUs are scheduled to vest. Because these awards are authorized three years prior to the effective grant date, for employees eligible for retirement by or shortly after the grant date, we recognize compensation expense over the period beginning on the date of authorization and ending on the date of grant. Until issued as stock, recipients of the stock-settled PSUs issued prior to 2013 receive a cash payment of a dividend equivalent that is charged to retained earnings. Beginning in 2013, stock-settled PSUs authorized for future grants will vest upon settlement following the conclusion of the three-year performance period. We recognize compensation expense over the period beginning on the date of authorization and ending on the conclusion of the performance period. Until issued as stock, recipients of these PSUs receive an accrued reinvested dividend equivalent that is charged to compensation expense.
The following summarizes our stock-settled Performance Share Program activity for the year ended December 31, 2024:
| | | | | | | | | | | | | | | | | |
| | | Weighted-Average
Grant Date Fair Value | | Millions of Dollars |
| Stock Units | | | Total Fair Value |
| | | | | |
| Outstanding at December 31, 2023 | 962,818 | | | $ | 50.79 | | | |
| Granted | 10,722 | | | 110.39 | | | |
| Forfeited | — | | | — | | | |
| Issued | (199,037) | | | 54.17 | | | $ | 23 | |
| Outstanding at December 31, 2024 | 774,503 | | | $ | 50.75 | | | |
| | | | | |
At December 31, 2024, there was no remaining unrecognized compensation cost to be recorded on the unvested stock-settled performance shares. The weighted-average grant date fair value of stock-settled PSUs granted during 2023 and 2022 was $112.50 and $91.58, respectively. The total fair value of stock-settled PSUs issued during 2023 and 2022 was $29 million and $21 million, respectively.
Cash-Settled
In connection with and immediately following the separation of our Downstream businesses in 2012, grants of new cash-settled PSUs, subject to a shortened performance period, were authorized. Once granted, these PSUs vest, absent employee election to defer, on the earlier of five years after the grant date of the award or the date the employee becomes eligible for retirement. For employees eligible for retirement by or shortly after the grant date, we recognize compensation expense over the period beginning on the date of authorization and ending on the date of grant. Otherwise, we recognize compensation expense beginning on the grant date and ending on the date the PSUs are scheduled to vest. These PSUs are settled in cash equal to the fair market value of a share of ConocoPhillips common stock per unit on the settlement date and thus are classified as liabilities on the balance sheet. Until settlement occurs, recipients of the PSUs receive a cash payment of a dividend equivalent that is charged to compensation expense.
Beginning in 2013, cash-settled PSUs vest upon settlement following the conclusion of the three-year performance period. We recognize compensation expense over the period beginning on the date of authorization and ending at the conclusion of the performance period. These PSUs will be settled in cash equal to the fair market value of a share of ConocoPhillips common stock per unit on the settlement date and are classified as liabilities on the balance sheet. For performance periods beginning before 2018, during the performance period, recipients of the PSUs do not receive a cash payment of a dividend equivalent, but after the performance period ends, until settlement in cash occurs, recipients of the PSUs receive a cash payment of a dividend equivalent that is charged to compensation expense. For the performance periods beginning in 2018 or later, recipients of the PSUs receive an accrued reinvested dividend equivalent that is charged to compensation expense. The accrued reinvested dividend is paid at the time of settlement, subject to the terms and conditions of the award.
| | | | | |
| 123 | ConocoPhillips 2024 10-K |
| | | | | |
| Notes to Consolidated Financial Statements | |
The following summarizes our cash-settled Performance Share Program activity for the year ended December 31, 2024:
| | | | | | | | | | | | | | | | | |
| | | Weighted-Average
Grant Date Fair Value | | Millions of Dollars |
| Stock Units | | | Total Fair Value |
| | | | | |
| Outstanding at December 31, 2023 | 100,870 | | | $ | 116.68 | | | |
| Granted | 1,535,539 | | | 110.39 | | | |
| Settled | (1,546,826) | | | 110.41 | | | $ | 171 | |
| Outstanding at December 31, 2024 | 89,583 | | | $ | 98.20 | | | |
At December 31, 2024, all outstanding cash-settled performance awards were fully vested and there was no remaining compensation cost to be recorded. The weighted-average grant date fair value of cash-settled PSUs granted during 2023 and 2022 was $112.50 and $91.58, respectively. The total fair value of cash-settled performance share awards settled during 2023 and 2022 was $111 million and $88 million, respectively.
From inception of the Performance Share Program through 2013, approved PSU awards were granted after the conclusion of performance periods. Beginning in February 2014, initial target PSU awards are issued near the beginning of new performance periods. These initial target PSU awards will terminate at the end of the performance periods and will be settled after the performance periods have ended. Also in 2014, initial target PSU awards were issued for open performance periods that began in prior years. For the open performance period beginning in 2012, the initial target PSU awards terminated at the end of the three-year performance period and were replaced with approved PSU awards. For the open performance period beginning in 2013, the initial target PSU awards terminated at the end of the three-year performance period and were settled after the performance period ended. There is no effect on recognition of compensation expense.
Other—In addition to the above active programs, we have outstanding shares of restricted stock and RSUs that were either issued as part of our non-employee director compensation program for current and former members of the company’s Board of Directors or as part of an executive compensation program that has been discontinued or assumed as a result of an acquisition. Generally, the recipients of the restricted shares or units receive a dividend or dividend equivalent.
The following summarizes the aggregate activity of these restricted shares and units for the year ended December 31, 2024:
| | | | | | | | | | | | | | | | | |
| | | Weighted-Average
Grant Date Fair Value | | Millions of Dollars |
| Stock Units | | | Total Fair Value |
| | | | | |
| Outstanding at December 31, 2023 | 894,268 | | | $ | 54.76 | | | |
| Granted | 39,750 | | | 111.91 | | | |
| Cancelled | — | | | — | | | |
| Issued | (304,337) | | | 50.91 | | | $ | 35 | |
| Outstanding at December 31, 2024 | 629,681 | | | $ | 60.22 | | | |
| | | | | |
At December 31, 2024, all outstanding restricted stock and RSUs were fully vested and there was no remaining compensation cost to be recorded. The weighted-average grant date fair value of awards granted during 2023 and 2022 was $115.88 and $96.20, respectively. The total fair value of awards issued during 2023 and 2022 was $46 million and $40 million, respectively.
| | | | | |
| ConocoPhillips 2024 10-K | 124 |
| | | | | |
| Notes to Consolidated Financial Statements | |
Note 16—Income Taxes
Components of income tax provision (benefit) were:
| | | | | | | | | | | | | | | | | |
| Millions of Dollars |
| 2024 | | 2023 | | 2022 |
| Income Taxes | | | | | |
| Federal | | | | | |
| Current | $ | 629 | | | 1,054 | | | 1,263 | |
| Deferred | 247 | | | 825 | | | 1,629 | |
| Foreign | | | | | |
| Current | 3,249 | | | 2,931 | | | 5,813 | |
| Deferred | 71 | | | 254 | | | 387 | |
| State and local | | | | | |
| Current | 182 | | | 202 | | | 386 | |
| Deferred | 49 | | | 65 | | | 70 | |
| Total tax provision (benefit) | $ | 4,427 | | | 5,331 | | | 9,548 | |
Deferred income taxes reflect the net tax effect of temporary differences between the carrying amounts of assets and liabilities for financial reporting purposes and the amounts used for tax purposes. Major components of deferred tax liabilities and assets at December 31 were:
| | | | | | | | |
| Millions of Dollars |
| 2024 | 2023 |
| Deferred Tax Liabilities | | |
| PP&E and intangibles | $ | 15,609 | | 11,992 | |
| Inventory | 91 | | 46 | |
| Other | 155 | | 216 | |
| Total deferred tax liabilities | 15,855 | | 12,254 | |
| | |
| Deferred Tax Assets | | |
| Benefit plan accruals | 432 | | 413 | |
| Asset retirement obligations and accrued environmental costs | 2,799 | | 2,608 | |
| Investments in joint ventures | 2,269 | | 2,133 | |
| Other financial accruals and deferrals | 497 | | 448 | |
| Loss and credit carryforwards | 4,910 | | 5,629 | |
| Other | 187 | | 121 | |
| Total deferred tax assets | 11,094 | | 11,352 | |
| Less: valuation allowance | (6,435) | | (7,656) | |
| Total deferred tax assets net of valuation allowance | 4,659 | | 3,696 | |
| Net deferred tax liabilities | $ | 11,196 | | 8,558 | |
At December 31, 2024, noncurrent assets and liabilities included deferred taxes of $230 million and $11,426 million, respectively. At December 31, 2023, noncurrent assets and liabilities included deferred taxes of $255 million and $8,813 million, respectively.
Our deferred tax liability increased during 2024 by $2.5 billion due to the acquisition of Marathon Oil.
At December 31, 2024, the loss and credit carryforward deferred tax assets were primarily related to U.S. foreign tax credit carryforwards of $3.3 billion and various jurisdictions net operating loss and credit carryforwards of $1.6 billion. In 2024, $1.2 billion of U.S. foreign tax credits expired. This reduction was partly offset by an increase of $700 million in our U.S. net operating loss, foreign tax credit carryforwards, and other credit carryforwards due to our acquisition of Marathon Oil. See Note 3. At December 31, 2023, the loss and credit carryforward deferred tax assets were primarily related to U.S. foreign tax credit carryforwards of $4.7 billion and various jurisdictions net operating loss and credit carryforwards of $0.9 billion.
| | | | | |
| 125 | ConocoPhillips 2024 10-K |
| | | | | |
| Notes to Consolidated Financial Statements | |
The following table shows a reconciliation of the beginning and ending deferred tax asset valuation allowance for 2024, 2023 and 2022:
| | | | | | | | | | | |
| Millions of Dollars |
| 2024 | 2023 | 2022 |
| | | |
| Balance at January 1 | $ | 7,656 | | 8,049 | | 8,342 | |
| Charged to expense (benefit) | (409) | | (2) | | 5 | |
| Other* | (812) | | (391) | | (298) | |
| Balance at December 31 | $ | 6,435 | | 7,656 | | 8,049 | |
*Represents changes due to deferred tax assets that have no impact to our effective tax rate, acquisitions/dispositions/revisions and the effect of translating foreign financial statements.
Valuation allowances have been established to reduce deferred tax assets to an amount that will, more likely than not, be realized. At December 31, 2024, we have maintained a valuation allowance with respect to substantially all U.S. foreign tax credit carryforwards, basis differences in our APLNG investment, and certain net operating loss carryforwards for various jurisdictions. During 2024, the valuation allowance movement charged to earnings primarily relates to the ability to utilize a portion of ConocoPhillips foreign tax credit carryforwards due to the acquisition of Marathon Oil. During 2022, the valuation allowance movement charged to earnings primarily related to the impact of 2022 changes to Norway’s Petroleum Tax System which is partly offset by the U.S. tax impact of the disposition of our CVE common shares. Other movements are primarily related to valuation allowances on expiring tax attributes. Based on our historical taxable income, expectations for the future and available tax-planning strategies, management expects deferred tax assets, net of valuation allowances, will primarily be realized as offsets to reversing deferred tax liabilities. See Note 3.
As a result of the acquisition of Marathon Oil, we utilized foreign tax credits previously offset by a valuation allowance. During the fourth quarter of 2024, a tax benefit of $394 million was recorded as a result of the acquisition and the subsequent utilization of the foreign tax credits. See Note 3.
During the second quarter of 2022, Norway enacted changes to the Petroleum Tax System. As a result of the enactment, a valuation allowance of $58 million was recorded during the second quarter to reflect changes to our ability to realize certain deferred tax assets under the new law.
At December 31, 2024, unremitted income considered to be permanently reinvested in certain foreign subsidiaries and foreign corporate joint ventures totaled approximately $5,226 million. Deferred income taxes have not been provided on this amount, as we do not plan to initiate any action that would require the payment of income taxes. The estimated amount of additional tax, primarily local withholding tax, that would be payable on this income if distributed is approximately $261 million.
The following table shows a reconciliation of the beginning and ending unrecognized tax benefits for 2024, 2023 and 2022:
| | | | | | | | | | | |
| Millions of Dollars |
| 2024 | 2023 | 2022 |
| | | |
| Balance at January 1 | $ | 387 | | 710 | | 1,345 | |
| Additions based on tax positions related to the current year | 3 | | 5 | | 6 | |
| Additions for tax positions of prior years | 127 | | 1 | | 6 | |
| Reductions for tax positions of prior years | — | | (9) | | (62) | |
| Settlements | (121) | | (96) | | (510) | |
| Lapse of statute | (19) | | (224) | | (75) | |
| Balance at December 31 | $ | 377 | | 387 | | 710 | |
| | | |
| | | |
| | | |
| | | |
| | | |
| | | |
| | | |
| | | |
| | | |
Included in the balance of unrecognized tax benefits for 2024, 2023 and 2022 were $368 million, $378 million and $701 million, respectively, which, if recognized, would impact our effective tax rate.
| | | | | |
| ConocoPhillips 2024 10-K | 126 |
| | | | | |
| Notes to Consolidated Financial Statements | |
The balance of the unrecognized tax benefits decreased in 2024 due to the resolution of certain items with U.S. and Norwegian taxing authorities. The balance of our unrecognized tax benefits increased in 2024 primarily due to U.S. tax credits acquired through our acquisition of Marathon Oil. See Note 3.
The balance of the unrecognized tax benefits decreased in 2023 due to the lapsing of the statute of limitations on certain of our foreign subsidiaries of $224 million as well as the closing of our 2018 Canadian domestic audit that resulted in a reduction of $92 million.
The balance of the unrecognized tax benefits decreased in 2022 due to the closing of the 2017 audit of our federal income tax return. As a result, we recognized federal and state tax benefits totaling $515 million relating to the recovery of outside tax basis previously offset by a full reserve.
At December 31, 2024, 2023 and 2022, accrued liabilities for interest and penalties totaled $26 million, $45 million and $35 million, respectively, net of accrued income taxes. Interest and penalties resulted in an increase to earnings of $19 million in 2024, a reduction to earnings of $10 million in 2023 and an increase to earnings of $12 million in 2022.
We file tax returns in the U.S. federal jurisdiction and in many foreign and state jurisdictions. Audits in major jurisdictions are generally complete as follows: Canada (2016), Norway (2023) and U.S. (2019). Issues in dispute for audited years and audits for subsequent years are ongoing and in various stages of completion in the many jurisdictions in which we operate around the world. Consequently, the balance in unrecognized tax benefits can be expected to fluctuate from period to period. Within the next twelve months, we may have audit periods close that could significantly impact our total unrecognized tax benefits. It is reasonably possible such changes could be significant when compared with our total unrecognized tax benefits, but the amount of change is not estimable.
The amounts of U.S. and foreign income (loss) before income taxes, with a reconciliation of tax at the federal statutory rate to the provision for income taxes, were:
| | | | | | | | | | | | | | | | | | | | | | | |
| Millions of Dollars | | Percent of Pre-Tax Income (Loss) |
| 2024 | 2023 | 2022 | | 2024 | 2023 | 2022 |
| Income (loss) before income taxes | | | | | | | |
| United States | $ | 6,731 | | 9,472 | | 16,739 | | | 49.2 | % | 58.2 | | 59.3 | |
| Foreign | 6,941 | | 6,816 | | 11,489 | | | 50.8 | | 41.8 | | 40.7 | |
| $ | 13,672 | | 16,288 | | 28,228 | | | 100.0 | % | 100.0 | | 100.0 | |
| | | | | | | |
| Federal statutory income tax | $ | 2,871 | | 3,421 | | 5,928 | | | 21.0 | % | 21.0 | | 21.0 | |
| Non-U.S. effective tax rates | 1,822 | | 2,063 | | 3,866 | | | 13.3 | | 12.7 | | 13.7 | |
| | | | | | | |
| | | | | | | |
| | | | | | | |
| Recovery of outside basis | (5) | | (4) | | (30) | | | — | | — | | (0.1) | |
| Adjustment to tax reserves | (57) | | (317) | | (551) | | | (0.4) | | (1.9) | | (2.0) | |
| Adjustment to valuation allowance | (409) | | (2) | | 5 | | | (3.0) | | — | | — | |
| State income tax | 187 | | 214 | | 405 | | | 1.4 | | 1.3 | | 1.4 | |
| | | | | | | |
| | | | | | | |
| Other | 18 | | (44) | | (75) | | | 0.1 | | (0.3) | | (0.2) | |
| Total | $ | 4,427 | | 5,331 | | 9,548 | | | 32.4 | % | 32.7 | | 33.8 | |
Our effective tax rate for 2024 was driven by our jurisdictional tax rates for this profit mix with a favorable impact from the acquisition of Marathon Oil enabling the utilization of foreign tax credits previously offset by a valuation allowance. See Note 3.
Our effective tax rate for 2023 was driven by our jurisdictional tax rates for this profit mix with a favorable impact from routine tax credits. The adjustment to tax reserves primarily relates to the lapsing of the statute of limitations on certain of our foreign subsidiaries and the closing of the 2018 Canadian domestic audit.
Our effective tax rate for 2022 was driven by our jurisdictional tax rates for this profit mix with net favorable impacts from routine tax credits and valuation allowance adjustments. The adjustment to tax reserves primarily relates to the closing of the audit of our 2017 U.S. federal tax return and the recognition of the U.S. federal and state tax benefits described above.
| | | | | |
| 127 | ConocoPhillips 2024 10-K |
| | | | | |
| Notes to Consolidated Financial Statements | |
On August 16, 2022, the U.S. enacted the Inflation Reduction Act of 2022, which among other things, implemented a 15 percent minimum tax on book income of certain large corporations, a one percent excise tax on net stock repurchased and several tax incentives to promote lower carbon energy. These law changes did not have a material impact to our consolidated financial statements.
Note 17—Accumulated Other Comprehensive Income (Loss)
Accumulated other comprehensive income (loss) in the equity section of the balance sheet included:
| | | | | | | | | | | | | | | | | |
| Millions of Dollars |
| Defined
Benefit Plans | Net Unrealized
Holding Gain/(Loss)
on Securities | Foreign
Currency
Translation | Unrealized Gain/(Loss) on Hedging Activities | Accumulated
Other
Comprehensive
Income/(Loss) |
| | | | | |
| December 31, 2021 | $ | (31) | | — | | (4,919) | | — | | (4,950) | |
| Other comprehensive income (loss) | (417) | | (11) | | (622) | | — | | (1,050) | |
| December 31, 2022 | (448) | | (11) | | (5,541) | | — | | (6,000) | |
| Other comprehensive income (loss) | 55 | | 13 | | 197 | | 62 | | 327 | |
| December 31, 2023 | (393) | | 2 | | (5,344) | | 62 | | (5,673) | |
| Other comprehensive income (loss) | 3 | | 1 | | (760) | | (44) | | (800) | |
| December 31, 2024 | $ | (390) | | 3 | | (6,104) | | 18 | | (6,473) | |
The following table summarizes reclassifications out of accumulated other comprehensive income (loss) during the years ended December 31:
| | | | | | | | |
| Millions of Dollars |
| 2024 | 2023 |
| | |
| Defined Benefit Plans* | $ | 19 | | 33 | |
| *Included in the computation of net periodic benefit cost and are presented net of tax expense of: | $ | 8 | | 11 | |
| | |
Note 18—Cash Flow Information
| | | | | | | | | | | | |
| Millions of Dollars | |
| 2024 | 2023 | 2022 | |
| Noncash Investing and Financing Activities | | | | |
| Increase (decrease) in PP&E related to an increase (decrease) in asset retirement obligations, excluding acquisitions | $ | 268 | | 727 | | 825 | | |
| Fair value of contingent consideration on acquisition | — | | 320 | | | |
| | | | |
| Cash Payments | | | | |
| Interest | $ | 806 | | 701 | | 873 | | |
| Income taxes | 3,621 | | 5,406 | | 7,368 | | |
| | | | |
| Net Sales (Purchases) of Investments | | | | |
| Short-term investments purchased | $ | (2,606) | | (1,463) | | (5,046) | | |
| Short-term investments sold | 3,567 | | 3,574 | | 3,102 | | |
| Long-term Investments purchased | (747) | | (867) | | (775) | | |
| Long-term Investments sold | 201 | | 129 | | 90 | | |
| $ | 415 | | 1,373 | | (2,629) | | |
For additional information on cash and non-cash changes to our consolidated balance sheet, see Note 3 and Note 12 for our acquisition of Marathon Oil and acquisition of the remaining working interest in Surmont.
| | | | | |
| ConocoPhillips 2024 10-K | 128 |
| | | | | |
| Notes to Consolidated Financial Statements | |
Note 19—Other Financial Information
| | | | | | | | | | | |
| Millions of Dollars |
| 2024 | 2023 | 2022 |
| Interest and Debt Expense | | | |
| Incurred | | | |
| Debt | $ | 941 | | 824 | | 791 | |
| Other | 90 | | 109 | | 72 | |
| 1,031 | | 933 | | 863 | |
| Capitalized | (248) | | (153) | | (58) | |
| Expensed | $ | 783 | | 780 | | 805 | |
| | | |
| Other Income | | | |
| Interest income | $ | 402 | | 412 | | 195 | |
| Gain (loss) on investment in Cenovus Energy* | — | | — | | 251 | |
| Other, net | 50 | | 73 | | 58 | |
| $ | 452 | | 485 | | 504 | |
| | | |
| | | |
Research and Development Expenditures—expensed | $ | 81 | | 81 | | 71 | |
| | | |
| Shipping and Handling Costs | $ | 1,958 | | 1,695 | | 1,595 | |
| | | |
Foreign Currency Transaction (Gains) Losses—after-tax | | | |
| Alaska | $ | — | | — | | — | |
| Lower 48 | — | | — | | — | |
| Canada | (35) | | 11 | | (20) | |
| Europe, Middle East and North Africa | (37) | | (39) | | (110) | |
| Asia Pacific | (1) | | 12 | | 30 | |
| Other International | — | | — | | (1) | |
| Corporate and Other | 36 | | 86 | | 21 | |
| $ | (37) | | 70 | | (80) | |
| | | | | | | | | |
| Millions of Dollars | |
| 2024 | 2023 | |
| Properties, Plants and Equipment | | | |
| Proved properties | $ | 155,364 | | 134,394 | | |
| Unproved properties | 15,490 | | 5,206 | | |
| Other | 4,574 | | 4,805 | | |
| Gross properties, plants and equipment | 175,428 | | 144,405 | | |
| Less: Accumulated depreciation, depletion and amortization | (81,072) | | (74,361) | | |
| Net properties, plants and equipment | $ | 94,356 | | 70,044 | | |
| | | | | |
| 129 | ConocoPhillips 2024 10-K |
| | | | | |
| Notes to Consolidated Financial Statements | |
Note 20—Related Party Transactions
Our related parties primarily include equity method investments and certain trusts for the benefit of employees. For disclosures on trusts for the benefit of employees, see Note 15. Significant transactions with our equity affiliates were:
| | | | | | | | | | | |
| Millions of Dollars |
| 2024 | 2023 | 2022 |
| | | |
| Operating revenues and other income | $ | 88 | | 90 | | 88 | |
| Purchases | — | | — | | 1 | |
| Operating expenses and selling, general and administrative expenses | 246 | | 282 | | 189 | |
| Net interest (income)/loss* | — | | — | | (1) | |
*We paid interest to, or received interest from, various affiliates. See Note 4 for additional information on loans to affiliated companies.
Note 21—Sales and Other Operating Revenues
Revenue from Contracts with Customers
The following table provides further disaggregation of our consolidated sales and other operating revenues:
| | | | | | | | | | | |
| Millions of Dollars |
| 2024 | 2023 | 2022 |
| | | |
| Revenue from contracts with customers | $ | 49,418 | | 48,522 | | 61,049 | |
| Revenue from contracts outside the scope of ASC Topic 606 | | | |
| Physical contracts meeting the definition of a derivative | 5,483 | | 8,203 | | 17,150 | |
| Financial derivative contracts | (156) | | (584) | | 295 | |
| Consolidated sales and other operating revenues | $ | 54,745 | | 56,141 | | 78,494 | |
Revenues from contracts outside the scope of ASC Topic 606 relate primarily to physical gas contracts at market prices, which qualify as derivatives accounted for under ASC Topic 815, “Derivatives and Hedging,” and for which we have not elected NPNS. There is no significant difference in contractual terms or the policy for recognition of revenue from these contracts and those within the scope of ASC Topic 606. The following disaggregation of revenues is provided in conjunction with Note 23—Segment Disclosures and Related Information: | | | | | | | | | | | |
| Millions of Dollars |
| 2024 | 2023 | 2022 |
Revenue from Contracts Outside the Scope of ASC Topic 606 by Segment | | | |
| Lower 48 | $ | 4,174 | | 6,607 | | 13,919 | |
| Canada | 522 | | 1,248 | | 2,717 | |
| Europe, Middle East and North Africa | 787 | | 348 | | 514 | |
| Physical contracts meeting the definition of a derivative | $ | 5,483 | | 8,203 | | 17,150 | |
| | | | | | | | | | | |
| Millions of Dollars |
| 2024 | 2023 | 2022 |
Revenue from Contracts Outside the Scope of ASC Topic 606 by Product | | | |
| | | |
| Crude oil | $ | 376 | | 143 | | 495 | |
| Natural gas | 3,753 | | 6,622 | | 15,368 | |
| Other | 1,354 | | 1,438 | | 1,287 | |
| Physical contracts meeting the definition of a derivative | $ | 5,483 | | 8,203 | | 17,150 | |
| | | | | |
| ConocoPhillips 2024 10-K | 130 |
| | | | | |
| Notes to Consolidated Financial Statements | |
Practical Expedients
Typically, our commodity sales contracts are less than 12 months in duration; however, in certain specific cases may extend longer, which may be out to the end of field life. We have long-term commodity sales contracts which use prevailing market prices at the time of delivery, and under these contracts, the market-based variable consideration for each performance obligation (i.e., delivery of commodity) is allocated to each wholly unsatisfied performance obligation within the contract. Accordingly, we have applied the practical expedient allowed in ASC Topic 606 and do not disclose the aggregate amount of the transaction price allocated to performance obligations or when we expect to recognize revenues that are unsatisfied as of the end of the reporting period.
Receivables and Contract Liabilities
Receivables from Contracts with Customers
At December 31, 2024, the “Accounts and notes receivable” line on our consolidated balance sheet included trade receivables of $5,398 million compared with $4,414 million at December 31, 2023, and included both contracts with customers within the scope of ASC Topic 606 and those that are outside the scope of ASC Topic 606. We typically receive payment within 30 days or less (depending on the terms of the invoice) once delivery is made. Revenues that are outside the scope of ASC Topic 606 relate primarily to physical natural gas sales contracts at market prices for which we do not elect NPNS and are therefore accounted for as a derivative under ASC Topic 815. There is little distinction in the nature of the customer or credit quality of trade receivables associated with natural gas sold under contracts for which NPNS has not been elected compared with trade receivables where NPNS has been elected.
Contract Liabilities from Contracts with Customers
We have entered into certain agreements under which we license our proprietary technology, including the Optimized Cascade® process technology, to customers to maximize the efficiency of LNG plants. These agreements typically provide for milestone payments to be made during and after the construction phases of the LNG plant. The payments are not directly related to our performance obligations under the contract and are recorded as deferred revenue to be recognized when the customer is able to benefit from their right to use the applicable licensed technology. Revenue recognized during the year ended December 31, 2024 was immaterial. We expect to recognize the outstanding contract liabilities of $45 million as of December 31, 2024, as revenue during the years 2026, 2028 and 2029.
| | | | | |
| 131 | ConocoPhillips 2024 10-K |
| | | | | |
| Notes to Consolidated Financial Statements | |
Note 22—Earnings Per Share
The following table presents the calculation of net income (loss) available to common shareholders and basic and diluted EPS for the years ended December 31, 2024, 2023, and 2022. For each of the periods with net income presented in the table below, diluted EPS calculated under the two-class method was more dilutive.
| | | | | | | | | | | |
| Millions of Dollars (except per share amounts) |
| Years Ended December 31 | 2024 | 2023 | 2022 |
| | | |
| Basic earnings per share | | | |
| | | |
| Net Income (Loss) | $ | 9,245 | | 10,957 | | 18,680 | |
| Less: Dividends and undistributed earnings | | | |
| allocated to participating securities | 27 | | 35 | | 60 | |
| Net Income (Loss) available to common shareholders | $ | 9,218 | | 10,922 | | 18,620 | |
| Average common shares outstanding (in Millions) | 1,179 | | 1,203 | | 1,274 | |
| Net Income (Loss) Per Share of Common Stock | $ | 7.82 | | 9.08 | | 14.62 | |
| | | |
| Diluted earnings per share | | | |
| | | |
| Net Income (Loss) available to common shareholders | $ | 9,218 | | 10,922 | | 18,620 | |
| Average common shares outstanding (in Millions) | 1,179 | | 1,203 | | 1,274 | |
| Add: Dilutive impact of options and unvested | | | |
| non-participating RSU/PSUs | 2 | | 3 | | 4 | |
| Average diluted shares outstanding (in Millions) | 1,181 | | 1,206 | | 1,278 | |
| Net Income (Loss) Per Share of Common Stock | $ | 7.81 | | 9.06 | | 14.57 | |
Note 23—Segment Disclosures and Related Information
We explore for, produce, transport and market crude oil, bitumen, natural gas, LNG and NGLs on a worldwide basis. We manage our operations through six operating segments, which are primarily defined by geographic region: Alaska; Lower 48 (L48); Canada; Europe, Middle East and North Africa (EMENA); Asia Pacific (AP); and Other International (OI).
Corporate and Other (Corporate) represents income and costs not directly associated with an operating segment, such as most interest expense, premiums on early retirement of debt, corporate overhead and certain technology activities, including licensing revenues. Corporate assets include all cash and cash equivalents and short-term investments.
Our chief operating decision maker (CODM) is our Chairman of the Board of Directors and Chief Executive Officer, who evaluates performance and allocates resources among our operating segments based on each segment's net income (loss). This is done through the annual budget and forecasting process.
Segment accounting policies are the same as those in Note 1. Intersegment sales are at prices that approximate market.
| | | | | |
| ConocoPhillips 2024 10-K | 132 |
| | | | | |
| Notes to Consolidated Financial Statements | |
2024 Segment level net income (loss)
| | | | | | | | | | | | | | | | | | | | | | | | | | |
| Year Ended December 31, 2024 | Millions of Dollars |
| | | | | | | | |
| Alaska | L48 | Canada | EMENA | AP | OI | Corporate | Consolidated Total |
| Segment sales and other operating revenues | | | | | | | | |
| Sales and other operating revenues | $ | 6,553 | | 37,028 | | 5,636 | | 5,788 | | 1,847 | | — | | 54 | | 56,906 | |
| Intersegment eliminations | — | | (2) | | (2,122) | | — | | — | | — | | (37) | | (2,161) | |
| Consolidated sales and other operating revenues* | 6,553 | | 37,026 | | 3,514 | | 5,788 | | 1,847 | | — | | 17 | | 54,745 | |
| | | | | | | | |
| Significant segment expenses** | | | | | | | | |
| Production and operating expenses | 1,951 | | 4,751 | | 902 | | 671 | | 384 | | — | | 92 | | 8,751 | |
| DD&A | 1,299 | | 6,442 | | 639 | | 761 | | 425 | | — | | 33 | | 9,599 | |
| Income tax provision (benefit) | 480 | | 1,462 | | 228 | | 2,854 | | 211 | | (1) | | (807) | | 4,427 | |
| Total | 3,730 | | 12,655 | | 1,769 | | 4,286 | | 1,020 | | (1) | | (682) | | 22,777 | |
| | | | | | | | |
| Other segment items | | | | | | | | |
| Equity in earnings of affiliates | 1 | | (5) | | — | | (586) | | (1,089) | | — | | (26) | | (1,705) | |
| Interest income | — | | — | | — | | — | | (8) | | — | | (394) | | (402) | |
| | | | | | | | |
| | | | | | | | |
| | | | | | | | |
| | | | | | | | |
| Interest and debt expense | — | | — | | — | | — | | — | | — | | 783 | | 783 | |
| Other*** | 1,496 | | 19,201 | | 1,033 | | 899 | | 200 | | 2 | | 1,216 | | 24,047 | |
| Total | 1,497 | | 19,196 | | 1,033 | | 313 | | (897) | | 2 | | 1,579 | | 22,723 | |
| | | | | | | | |
| Net income (loss) | $ | 1,326 | | 5,175 | | 712 | | 1,189 | | 1,724 | | (1) | | (880) | | 9,245 | |
| *In 2024, sales by our Lower 48 segment to a certain pipeline company accounted for approximately $6.7 billion or approximately 12 percent of our total consolidated sales and other operating revenues. |
| **The significant segment expense categories and amounts in the table above align with segment-level information that is regularly provided to the CODM. |
| ***Other segment items not required to be separately disclosed for each reportable segment include: |
Gain (loss) on disposition: L48, Canada, EMENA and OI |
Other income; Selling, general and administrative expenses and Exploration expenses: Alaska, L48, Canada, EMENA, AP, OI and Corporate |
Purchased commodities: Alaska, L48, Canada, EMENA and AP |
|
|
Impairments: Alaska, L48, Canada and EMENA |
Taxes other than income taxes and Accretion on discounted liabilities: Alaska, L48, Canada, EMENA, AP and Corporate |
|
Foreign currency transaction (gain) loss: Canada, EMENA and Corporate |
Other expenses: Alaska, L48, EMENA and Corporate |
|
Other segment disclosures
| | | | | | | | | | | | | | | | | | | | | | | | | | |
| Year Ended December 31, 2024 | Millions of Dollars |
| | | | | | | | |
| Alaska | L48 | Canada | EMENA | AP | OI | Corporate | Consolidated Total |
| Investment in and advances to affiliates | $ | 3 | | 123 | | — | | 1,948 | | 4,977 | | 8 | | 1,551 | | 8,610 | |
| Total Assets | 18,030 | | 66,977 | | 9,513 | | 9,770 | | 8,390 | | 8 | | 10,092 | | 122,780 | |
| Capital expenditures and investments | 3,194 | | 6,510 | | 551 | | 1,021 | | 370 | | — | | 472 | | 12,118 | |
| | | | | | | | |
| | | | | | | | |
| | | | | | | | |
| | | | | | | | |
| | | | | |
| 133 | ConocoPhillips 2024 10-K |
| | | | | |
| Notes to Consolidated Financial Statements | |
2023 Segment level net income (loss)
| | | | | | | | | | | | | | | | | | | | | | | | | | |
| Year Ended December 31, 2023 | Millions of Dollars |
| | | | | | | | |
| Alaska | L48 | Canada | EMENA | AP | OI | Corporate | Consolidated Total |
| Segment sales and other operating revenues | | | | | | | | |
| Sales and other operating revenues | $ | 7,098 | | 38,244 | | 4,873 | | 5,854 | | 1,913 | | — | | 63 | | 58,045 | |
| Intersegment eliminations | — | | (7) | | (1,867) | | — | | — | | — | | (30) | | (1,904) | |
| Consolidated sales and other operating revenues* | 7,098 | | 38,237 | | 3,006 | | 5,854 | | 1,913 | | — | | 33 | | 56,141 | |
| | | | | | | | |
| Significant segment expenses** | | | | | | | | |
| Production and operating expenses | 1,829 | | 4,199 | | 619 | | 593 | | 391 | | 1 | | 61 | | 7,693 | |
| DD&A | 1,061 | | 5,722 | | 420 | | 587 | | 455 | | — | | 25 | | 8,270 | |
| Income tax provision (benefit) | 642 | | 1,763 | | 26 | | 3,065 | | 42 | | — | | (207) | | 5,331 | |
| Total | 3,532 | | 11,684 | | 1,065 | | 4,245 | | 888 | | 1 | | (121) | | 21,294 | |
| | | | | | | | |
| Other segment items | | | | | | | | |
| Equity in earnings of affiliates | (1) | | 9 | | — | | (580) | | (1,151) | | — | | 3 | | (1,720) | |
| Interest income | — | | — | | — | | (1) | | (8) | | — | | (403) | | (412) | |
| | | | | | | | |
| | | | | | | | |
| | | | | | | | |
| | | | | | | | |
| Interest and debt expense | — | | — | | — | | — | | — | | — | | 780 | | 780 | |
| Other*** | 1,789 | | 20,083 | | 1,539 | | 1,001 | | 223 | | 12 | | 595 | | 25,242 | |
| Total | 1,788 | | 20,092 | | 1,539 | | 420 | | (936) | | 12 | | 975 | | 23,890 | |
| | | | | | | | |
| Net income (loss) | $ | 1,778 | | 6,461 | | 402 | | 1,189 | | 1,961 | | (13) | | (821) | | 10,957 | |
| *In 2023, sales by our Lower 48 segment to a certain pipeline company accounted for approximately $5.8 billion or approximately 10 percent of our total consolidated sales and other operating revenues. |
| **The significant segment expense categories and amounts in the table above align with segment-level information that is regularly provided to the CODM. |
| ***Other segment items not required to be separately disclosed for each reportable segment include: |
Gain (loss) on dispositions: Alaska, L48, AP, OI and Corporate |
Other income; Purchased commodities; Selling, general and administrative expenses and Exploration expenses: Alaska, L48, Canada, EMENA, AP, OI and Corporate |
|
|
|
Impairments: L48, Canada and Corporate |
Taxes other than income taxes and Accretion on discounted liabilities: Alaska, L48, Canada, EMENA, AP and Corporate |
|
Foreign currency transaction (gain) loss: Canada, EMENA, AP and Corporate |
Other expenses: Alaska, L48, EMENA and Corporate |
Other segment disclosures
| | | | | | | | | | | | | | | | | | | | | | | | | | |
| Year Ended December 31, 2023 | Millions of Dollars |
| | | | | | | | |
| Alaska | L48 | Canada | EMENA | AP | OI | Corporate | Consolidated Total |
| Investment in and advances to affiliates | $ | 32 | | 118 | | — | | 1,191 | | 5,419 | | — | | 1,145 | | 7,905 | |
| Total Assets | 16,174 | | 42,415 | | 10,277 | | 8,396 | | 8,903 | | — | | 9,759 | | 95,924 | |
| Capital expenditures and investments | 1,705 | | 6,487 | | 456 | | 1,111 | | 354 | | — | | 1,135 | | 11,248 | |
| | | | | | | | |
| | | | | | | | |
| | | | | | | | |
| | | | | | | | |
| | | | | |
| ConocoPhillips 2024 10-K | 134 |
| | | | | |
| Notes to Consolidated Financial Statements | |
2022 Segment level net income (loss)
| | | | | | | | | | | | | | | | | | | | | | | | | | |
| Year Ended December 31, 2022 | Millions of Dollars |
| | | | | | | | |
| Alaska | L48 | Canada | EMENA | AP | OI | Corporate | Consolidated Total |
| Segment sales and other operating revenues | | | | | | | | |
| Sales and other operating revenues | $ | 7,905 | | 52,921 | | 6,159 | | 11,271 | | 2,606 | | — | | 122 | | 80,984 | |
| Intersegment eliminations | — | | (18) | | (2,445) | | (1) | | — | | — | | (26) | | (2,490) | |
| Consolidated sales and other operating revenues* | 7,905 | | 52,903 | | 3,714 | | 11,270 | | 2,606 | | — | | 96 | | 78,494 | |
| | | | | | | | |
| Significant segment expenses** | | | | | | | | |
| Production and operating expenses | 1,703 | | 3,627 | | 591 | | 590 | | 365 | | — | | 130 | | 7,006 | |
| DD&A | 939 | | 4,865 | | 402 | | 736 | | 518 | | — | | 44 | | 7,504 | |
| Income tax provision (benefit) | 885 | | 3,088 | | 206 | | 5,445 | | 480 | | 53 | | (609) | | 9,548 | |
| Total | 3,527 | | 11,580 | | 1,199 | | 6,771 | | 1,363 | | 53 | | (435) | | 24,058 | |
| | | | | | | | |
| Other segment items | | | | | | | | |
| Equity in earnings of affiliates | (4) | | 14 | | — | | (780) | | (1,310) | | (1) | | — | | (2,081) | |
| Interest income | — | | — | | — | | (1) | | (9) | | — | | (185) | | (195) | |
| | | | | | | | |
| | | | | | | | |
| | | | | | | | |
| | | | | | | | |
| Interest and debt expense | — | | — | | — | | — | | — | | — | | 805 | | 805 | |
| Other*** | 2,030 | | 30,294 | | 1,801 | | 3,036 | | (174) | | (1) | | 241 | | 37,227 | |
| Total | 2,026 | | 30,308 | | 1,801 | | 2,255 | | (1,493) | | (2) | | 861 | | 35,756 | |
| | | | | | | | |
| Net income (loss) | $ | 2,352 | | 11,015 | | 714 | | 2,244 | | 2,736 | | (51) | | (330) | | 18,680 | |
| *In 2022, no single customer amounted to 10% of our total consolidated sales and other operating revenues. |
| **The significant segment expense categories and amounts in the table above align with segment-level information that is regularly provided to the CODM. |
| ***Other segment items not required to be separately disclosed for each reportable segment include: |
Gain (loss) on dispositions: Alaska, L48, Canada, AP, OI and Corporate |
Other income: Alaska, L48, EMENA, AP, OI and Corporate |
Purchased commodities: Alaska, L48, Canada, EMENA and AP |
Selling, general and administrative expenses: Alaska, L48, Canada, EMENA, AP, OI and Corporate |
Exploration expenses, Impairments, Taxes other than income taxes and Accretion on discounted liabilities: Alaska, L48, Canada, EMENA, AP and Corporate |
|
|
|
Foreign currency transaction (gain) loss: Canada, EMENA, AP, OI and Corporate |
Other expenses: Alaska, L48, Canada, EMENA and Corporate |
Other segment disclosures
| | | | | | | | | | | | | | | | | | | | | | | | | | |
| Year Ended December 31, 2022 | Millions of Dollars |
| | | | | | | | |
| Alaska | L48 | Canada | EMENA | AP | OI | Corporate | Consolidated Total |
| Investment in and advances to affiliates | $ | 55 | | 235 | | — | | 1,049 | | 6,154 | | — | | — | | 7,493 | |
| Total Assets | 15,126 | | 42,950 | | 6,971 | | 8,263 | | 9,511 | | — | | 11,008 | | 93,829 | |
| Capital expenditures and investments | 1,091 | | 5,630 | | 530 | | 998 | | 1,880 | | — | | 30 | | 10,159 | |
| | | | | | | | |
| | | | | | | | |
| | | | | | | | |
| | | | | | | | |
| | | | | |
| 135 | ConocoPhillips 2024 10-K |
| | | | | |
| Notes to Consolidated Financial Statements | |
| | | | | | | | | | | |
| Sales and Other Operating Revenues by Product | | | |
| Millions of Dollars |
| 2024 | 2023 | 2022 |
| Crude oil | $ | 39,010 | | 37,833 | | 41,492 | |
| Natural gas | 6,444 | | 10,725 | | 26,941 | |
| Natural gas liquids | 2,889 | | 2,609 | | 3,650 | |
| Other* | 6,402 | | 4,974 | | 6,411 | |
| Consolidated sales and other operating revenues by product | $ | 54,745 | | 56,141 | | 78,494 | |
*Includes bitumen and power.
Geographic Information
| | | | | | | | | | | | | | | | | | | | | | | |
| Millions of Dollars |
| Sales and Other Operating Revenues* | | Long-Lived Assets** |
| 2024 | 2023 | 2022 | | 2024 | 2023 | 2022 |
| | | | | | | |
| U.S. | $ | 43,480 | | 45,101 | | 60,899 | | | 79,141 | | 53,955 | | 51,200 | |
| Australia | — | | — | | — | | | 4,987 | | 5,426 | | 6,158 | |
| Canada | 3,405 | | 3,006 | | 3,714 | | | 8,773 | | 9,666 | | 6,269 | |
| China | 939 | | 952 | | 1,135 | | | 1,651 | | 1,635 | | 1,538 | |
| Equatorial Guinea | 66 | | — | | — | | | 1,593 | | — | | — | |
| Indonesia*** | — | | — | | 159 | | | — | | — | | — | |
| Libya | 1,703 | | 1,730 | | 1,582 | | | 733 | | 703 | | 714 | |
| Malaysia | 908 | | 961 | | 1,312 | | | 856 | | 939 | | 1,107 | |
| Norway | 2,405 | | 2,408 | | 3,415 | | | 3,850 | | 4,489 | | 4,369 | |
| Singapore | 37 | | — | | — | | | — | | — | | — | |
| U.K. | 1,796 | | 1,978 | | 6,273 | | | 2 | | 2 | | 1 | |
| Other foreign countries | 6 | | 5 | | 5 | | | 1,380 | | 1,134 | | 1,003 | |
| Worldwide consolidated | $ | 54,745 | | 56,141 | | 78,494 | | | 102,966 | | 77,949 | | 72,359 | |
*Sales and other operating revenues are attributable to countries based on the location of their selling operation.
** Defined as net PP&E plus equity investments and advances to affiliated companies.
Note 24—New Accounting Standards
In December 2023, the FASB issued ASU No. 2023-09, “Improvements to Income Tax Disclosures” which enhances the disclosure requirements within Topic 740 “Income Taxes.” The enhancements will impact our financial statement disclosures only and will be applied prospectively with retrospective application permitted. The ASU is effective for annual periods beginning after December 15, 2024, and early adoption is permitted. We are currently evaluating the impact of the adoption of this ASU.
In November 2024, the FASB issued ASU No. 2024-03, “Disaggregation of Income Statement Expenses” to improve the disclosures about a public business entity’s expenses (including purchases of inventory, employee compensation, depreciation, depletion and amortization) in commonly presented expense captions. The ASU will impact our financial statement disclosures only and will be applied prospectively with retrospective application permitted. The ASU is effective for annual reporting periods beginning after December 15, 2026, and interim reporting periods beginning after December 15, 2027, and early adoption is permitted. We are currently evaluating the impact of the adoption of this ASU.
| | | | | |
| ConocoPhillips 2024 10-K | 136 |
| | |
Oil and Gas Operations (Unaudited) |
In accordance with FASB ASC Topic 932, “Extractive Activities—Oil and Gas,” and regulations of the SEC, we are making certain supplemental disclosures about our oil and gas exploration and production operations.
These disclosures include information about our consolidated oil and gas activities and our proportionate share of our equity affiliates’ oil and gas activities in our operating segments. As a result, amounts reported as equity affiliates in Oil and Gas Operations may differ from those shown in the individual segment disclosures reported elsewhere in this report. Our disclosures by geographic area include the U.S., Canada, Europe, Asia Pacific/Middle East (inclusive of equity affiliates) and Africa.
As required by current authoritative guidelines, the estimated future date when an asset will be permanently shut down for economic reasons is based on historical 12-month first-of-month average prices and current costs. This estimated date when production will end affects the amount of estimated reserves. Therefore, as prices and cost levels change from year to year, the estimate of proved reserves also changes. Generally, our proved reserves decrease as prices decline and increase as prices rise.
Our proved reserves include estimated quantities related to PSCs, which are reported under the “economic interest” method, as well as variable-royalty regimes, and are subject to fluctuations in commodity prices, recoverable operating expenses and capital costs. If costs remain stable, reserve quantities attributable to recovery of costs will change inversely to changes in commodity prices. For example, if prices increase, then our applicable reserve quantities would decline. At December 31, 2024, approximately three percent of our total proved reserves were under PSCs, located in our Asia Pacific/Middle East and Africa geographic reporting areas, and seven percent of our total proved reserves were under a variable-royalty regime, located in our Canada geographic reporting area.
Reserves Governance
The recording and reporting of proved reserves are governed by criteria established by regulations of the SEC and FASB. Proved reserves are those quantities of oil and gas, which, by analysis of geoscience and engineering data, can be estimated with reasonable certainty to be economically producible—from a given date forward, from known reservoirs, and under existing economic conditions, operating methods, and government regulations—prior to the time at which contracts providing the right to operate expire, unless evidence indicates renewal is reasonably certain, regardless of whether deterministic or probabilistic methods are used for the estimation. The project to extract the hydrocarbons must have commenced or the operator must be reasonably certain it will commence the project within a reasonable time.
Proved reserves are further classified as either developed or undeveloped. Proved developed reserves are proved reserves that can be expected to be recovered through existing wells with existing equipment and operating methods, or in which the cost of the required equipment is relatively minor compared with the cost of a new well, and through installed extraction equipment and infrastructure operational at the time of the reserves estimate if the extraction is by means not involving a well. Proved undeveloped reserves are proved reserves expected to be recovered from new wells on undrilled acreage, or from existing wells where a relatively major expenditure is required for recompletion. Reserves on undrilled acreage are limited to those directly offsetting development spacing areas that are reasonably certain of production when drilled, unless evidence provided by reliable technologies exists that establishes reasonable certainty of economic producibility at greater distances. As defined by SEC regulations, reliable technologies may be used in reserve estimation when they have been demonstrated in the field to provide reasonably certain results with consistency and repeatability in the formation being evaluated or in an analogous formation. The technologies and data used in the estimation of our proved reserves include, but are not limited to, performance-based methods, volumetric-based methods, geologic maps, seismic interpretation, well logs, well test data, core data, analogy and statistical analysis.
| | | | | |
| 137 | ConocoPhillips 2024 10-K |
We have a company-wide, comprehensive, SEC-compliant internal policy that governs the determination and reporting of proved reserves. This policy is applied by the geoscientists and reservoir engineers in our business units around the world. As part of our internal control process, each business unit’s reserves processes and controls are reviewed annually by an internal team which is headed by the company’s Manager of Reserves Compliance and Reporting. This team, composed of internal reservoir engineers, geoscientists, finance personnel and a senior representative from DeGolyer and MacNaughton (D&M), a third-party petroleum engineering consulting firm, reviews the business unit's reserves for adherence to SEC guidelines and company policy through on-site visits, teleconferences and review of documentation. In addition to providing independent reviews, this internal team also ensures reserves are calculated using consistent and appropriate standards and procedures. This team is independent of business unit line management and is responsible for reporting its findings to senior management. The team is responsible for communicating our reserves policy and procedures and is available for internal peer reviews and consultation on major projects or technical issues throughout the year. All of our proved reserves held by consolidated companies and our share of equity affiliates have been estimated by ConocoPhillips.
During 2024, our processes and controls used to assess over 85 percent of proved reserves as of December 31, 2024, were reviewed by D&M. The purpose of their review was to assess whether the adequacy and effectiveness of our internal processes and controls used to determine estimates of proved reserves are in accordance with SEC regulations. In such review, ConocoPhillips’ technical staff presented D&M with an overview of the reserves data, as well as the methods and assumptions used in estimating reserves. The data presented included pertinent seismic information, geologic maps, well logs, production tests, material balance calculations, reservoir simulation models, well performance data, operating procedures and relevant economic criteria. Management’s intent in retaining D&M to review its processes and controls was to provide objective third-party input on these processes and controls. D&M’s opinion was the general processes and controls employed by ConocoPhillips in estimating its December 31, 2024 proved reserves for the properties reviewed are in accordance with the SEC reserves definitions. D&M’s report is included as Exhibit 99 of this Annual Report on Form 10-K.
The technical person primarily responsible for overseeing the processes and internal controls used in the preparation of the company’s reserves estimates is the Manager of Reserves Compliance and Reporting. This individual holds a master’s degree in reservoir engineering. He is a member of the Society of Petroleum Engineers with over 20 years of oil and gas industry experience and has held positions of increasing responsibility in reservoir engineering, subsurface and asset management in the U.S. and several international field locations.
Engineering estimates of the quantities of proved reserves are inherently imprecise. See the “Critical Accounting Estimates” section of Management’s Discussion and Analysis of Financial Condition and Results of Operations for additional discussion of the sensitivities surrounding these estimates.
| | | | | |
| ConocoPhillips 2024 10-K | 138 |
| | | | | | | | | | | | | | | | | | | | | | | | | | | | | | | | |
| Proved Reserves | | | | | | | | | | |
| | | | | | | | | | |
Years Ended
December 31 | Crude Oil |
| Millions of Barrels |
| Alaska | Lower
48 | Total
U.S. | Canada | Europe | Asia Pacific/
Middle East | Africa | Total
Consolidated Operations | Equity
Affiliates* | Total |
| Developed and Undeveloped | | | | | | | | | |
| End of 2021 | 1,035 | | 1,452 | | 2,487 | | 10 | | 161 | | 122 | | 184 | | 2,964 | | 63 | | 3,027 | |
| Revisions | (31) | | 24 | | (7) | | — | | 31 | | 19 | | (3) | | 40 | | — | | 40 | |
| Improved recovery | — | | — | | — | | — | | — | | 3 | | — | | 3 | | — | | 3 | |
| Purchases | — | | 6 | | 6 | | — | | — | | — | | 42 | | 48 | | — | | 48 | |
| Extensions and discoveries | 15 | | 250 | | 265 | | — | | 8 | | — | | — | | 273 | | 35 | | 308 | |
| Production | (64) | | (193) | | (257) | | (2) | | (25) | | (22) | | (13) | | (319) | | (5) | | (324) | |
| Sales | — | | (31) | | (31) | | — | | — | | (3) | | — | | (34) | | — | | (34) | |
| End of 2022 | 955 | | 1,508 | | 2,463 | | 8 | | 175 | | 119 | | 210 | | 2,975 | | 93 | | 3,068 | |
| Revisions | (57) | | 126 | | 69 | | 1 | | (1) | | 8 | | 10 | | 87 | | 1 | | 88 | |
| Improved recovery | — | | — | | — | | — | | — | | — | | — | | — | | — | | — | |
| Purchases | — | | 2 | | 2 | | — | | — | | — | | — | | 2 | | — | | 2 | |
| Extensions and discoveries | 219 | | 54 | | 273 | | 15 | | 3 | | 19 | | — | | 310 | | — | | 310 | |
| Production | (64) | | (202) | | (266) | | (3) | | (23) | | (22) | | (17) | | (331) | | (5) | | (336) | |
| Sales | — | | (11) | | (11) | | — | | — | | — | | — | | (11) | | — | | (11) | |
| End of 2023 | 1,053 | | 1,477 | | 2,530 | | 21 | | 154 | | 124 | | 203 | | 3,032 | | 89 | | 3,121 | |
| Revisions | 5 | | 185 | | 190 | | 5 | | (5) | | 15 | | 52 | | 257 | | — | | 257 | |
| Improved recovery | — | | — | | — | | — | | — | | — | | — | | — | | — | | — | |
| Purchases | 23 | | 364 | | 387 | | — | | — | | — | | 25 | | 412 | | — | | 412 | |
| Extensions and discoveries | 14 | | 29 | | 43 | | 9 | | — | | — | | — | | 52 | | 24 | | 76 | |
| Production | (62) | | (211) | | (273) | | (6) | | (25) | | (22) | | (18) | | (344) | | (5) | | (349) | |
| Sales | — | | (3) | | (3) | | — | | — | | — | | — | | (3) | | — | | (3) | |
| End of 2024 | 1,033 | | 1,841 | | 2,874 | | 29 | | 124 | | 117 | | 262 | | 3,406 | | 108 | | 3,514 | |
| | | | | | | | | | |
| | | | | | | | | | |
| | | | | | | | | | |
| | | | | | | | | | |
| | | | | | | | | | |
| | | | | | | | | | |
| | | | | | | | | | | | | | | | | | | | | | | | | | | | | | | | |
Years Ended
December 31 | Crude Oil |
| Millions of Barrels |
| Alaska | Lower
48 | Total
U.S. | Canada | Europe | Asia Pacific/
Middle East | Africa | Total
Consolidated Operations | Equity
Affiliates* | Total |
| Developed | | | | | | | | | | |
| | | | | | | | | |
| End of 2021 | 912 | | 916 | | 1,828 | | 4 | | 122 | | 98 | | 171 | | 2,223 | | 63 | | 2,286 | |
| End of 2022 | 867 | | 828 | | 1,695 | | 5 | | 124 | | 102 | | 191 | | 2,117 | | 58 | | 2,175 | |
| End of 2023 | 790 | | 793 | | 1,583 | | 7 | | 109 | | 91 | | 181 | | 1,971 | | 54 | | 2,025 | |
| End of 2024 | 767 | | 1,122 | | 1,889 | | 11 | | 101 | | 88 | | 208 | | 2,297 | | 49 | | 2,346 | |
| | | | | | | | | | |
| Undeveloped | | | | | | | | | | |
| | | | | | | | | |
| End of 2021 | 123 | | 536 | | 659 | | 6 | | 39 | | 24 | | 13 | | 741 | | — | | 741 | |
| End of 2022 | 88 | | 680 | | 768 | | 3 | | 51 | | 17 | | 19 | | 858 | | 35 | | 893 | |
| End of 2023 | 263 | | 684 | | 947 | | 14 | | 45 | | 33 | | 22 | | 1,061 | | 35 | | 1,096 | |
| End of 2024 | 266 | | 719 | | 985 | | 18 | | 23 | | 29 | | 54 | | 1,109 | | 59 | | 1,168 | |
| | | | | | | | | | |
*All Equity Affiliate reserves are located in our Asia Pacific/Middle East Region.
| | | | | |
| 139 | ConocoPhillips 2024 10-K |
Notable changes in proved crude oil reserves in the three years ended December 31, 2024, included:
•Revisions: In 2024, upward revisions in Lower 48 were due to development drilling of 298 million barrels and technical revisions of 28 million barrels, partially offset by downward revisions of 114 million barrels for changes in development plans, 23 million barrels due to lower prices and increasing operating costs of 4 million barrels. An upward revision of 52 million barrels in Africa was due to an increase in development plans in Libya. In the consolidated operations in Asia Pacific/Middle East, upward revisions of 15 million barrels were primarily due to the project sanction of Bohai Bay Phase 5 in China. Upward revisions of 5 million barrels in Canada were due to technical revisions. In Alaska, where future production is constrained by the Trans-Alaska Pipeline System minimum flow limit, updated total North Slope development phasing indicated that the flow limit will be reached later than previously premised, resulting in upward revisions of 22 million barrels. Further upward revisions in Alaska include development plan changes of 8 million barrels. These were partially offset by downward revisions due to increasing operating costs of 15 million barrels and 10 million barrels due to technical revisions. Downward revisions in Europe were due to technical revisions of 3 million barrels and development plan changes of 2 million barrels.
In 2023, upward revisions in Lower 48 were due to development drilling of 161 million barrels and technical revisions in the unconventional plays of 31 million barrels, partially offset by downward revisions of 52 million barrels due to lower prices and 14 million barrels for changes in development plans. An upward revision of 10 million barrels in Africa was primarily development drilling in Libya. Upward revisions of 8 million barrels in the consolidated operations in Asia Pacific/Middle East were due to technical revisions. In Alaska, where future production is constrained by the Trans-Alaska Pipeline System minimum flow limit, updated total North Slope development phasing indicated that the flow limit will be reached earlier than previously premised, resulting in downward revisions of 25 million barrels. Further downward revisions in Alaska include development plan changes of 14 million barrels, cost escalation of 13 million barrels, and 7 million barrels due to lower prices, partially offset by 2 million barrels of technical revisions.
In 2022, upward revisions in Lower 48 were due to additional development drilling in the unconventional plays of 81 million barrels and higher prices of 33 million barrels, partially offset by increasing operating costs of 72 million barrels and technical revisions of 18 million barrels. Upward revisions in Europe were primarily due to technical revisions of 23 million barrels and 8 million barrels due to higher prices. Upward revisions of 19 million barrels in our consolidated operations in Asia Pacific/Middle East were primarily due to technical revisions.
•Purchases: In 2024, our acquisition of Marathon Oil resulted in purchases for Lower 48, as well as for Africa, representing reserves in Equatorial Guinea. Purchases in Alaska represent the acquisition of additional interest in the Kuparuk River and Prudhoe Bay units.
In 2022, crude oil reserve purchases were primarily in Africa, as a result of the acquisition of additional interest in the Libya Waha Concession.
•Extensions and discoveries: In 2024, Lower 48 extensions and discoveries were primarily within unconventional plays in the Permian Basin. Alaska extensions and discoveries were primarily due to Nuna and other Western North Slope projects. Extensions and discoveries in Canada were in Montney. Extensions and discoveries in our equity affiliates were in the Middle East.
In 2023, extensions and discoveries in Alaska were driven primarily by the Willow and Nuna projects. Lower 48 extensions and discoveries were primarily within unconventional plays in the Permian Basin. Extensions and discoveries in Canada and Asia Pacific/Middle East were driven primarily by Montney and Bohai Phase 4B in China, respectively.
In 2022, extensions and discoveries in Lower 48 were primarily within unconventional plays in the Permian Basin. Extensions and discoveries in our equity affiliates were in the Middle East.
| | | | | |
| ConocoPhillips 2024 10-K | 140 |
| | | | | | | | | | | | | | | | | | | | | | | | | | | | | | | | |
Years Ended
December 31 | Natural Gas Liquids |
| Millions of Barrels |
| Alaska | Lower
48 | Total
U.S. | Canada | Europe | Asia Pacific/
Middle East | Africa | Total Consolidated Operations | Equity Affiliates* | Total |
| Developed and Undeveloped | | | | | | | | | | |
| | | | | | | | | | |
| End of 2021 | 82 | | 546 | | 628 | | 5 | | 11 | | — | | | 644 | | 33 | | 677 | |
| Revisions | 1 | | 208 | | 209 | | 1 | | 3 | | — | | | 213 | | — | | 213 | |
| Improved recovery | — | | — | | — | | — | | — | | — | | | — | | — | | — | |
| Purchases | — | | 3 | | 3 | | — | | — | | — | | | 3 | | — | | 3 | |
| Extensions and discoveries | — | | 80 | | 80 | | — | | 1 | | — | | | 81 | | 20 | | 101 | |
| Production | (5) | | (81) | | (86) | | (1) | | (2) | | — | | | (89) | | (3) | | (92) | |
| Sales | — | | (7) | | (7) | | — | | — | | — | | | (7) | | — | | (7) | |
| End of 2022 | 78 | | 749 | | 827 | | 5 | | 13 | | — | | | 845 | | 50 | | 895 | |
| Revisions | (1) | | 119 | | 118 | | — | | 2 | | — | | | 120 | | 1 | | 121 | |
| Improved recovery | — | | — | | — | | — | | — | | — | | | — | | — | | — | |
| Purchases | — | | 1 | | 1 | | — | | — | | — | | | 1 | | — | | 1 | |
| Extensions and discoveries | — | | 20 | | 20 | | 6 | | — | | — | | | 26 | | — | | 26 | |
| Production | (5) | | (90) | | (95) | | (1) | | (2) | | — | | | (98) | | (3) | | (101) | |
| Sales | — | | (2) | | (2) | | — | | — | | — | | | (2) | | — | | (2) | |
| End of 2023 | 72 | | 797 | | 869 | | 10 | | 13 | | — | | — | | 892 | | 48 | | 940 | |
| Revisions | 4 | | 123 | | 127 | | 1 | | (2) | | — | | — | | 126 | | — | | 126 | |
| Improved recovery | — | | — | | — | | — | | — | | — | | — | | — | | — | | — | |
| Purchases | 1 | | 209 | | 210 | | — | | — | | — | | 14 | | 224 | | — | | 224 | |
| Extensions and discoveries | — | | 15 | | 15 | | 3 | | — | | — | | — | | 18 | | 17 | | 35 | |
| Production | (6) | | (102) | | (108) | | (2) | | (2) | | — | | — | | (112) | | (3) | | (115) | |
| Sales | — | | (1) | | (1) | | — | | — | | — | | — | | (1) | | — | | (1) | |
| End of 2024 | 71 | | 1,041 | | 1,112 | | 12 | | 9 | | — | | 14 | | 1,147 | | 62 | | 1,209 | |
| | | | | | | | | | |
| | | | | | | | | | |
| | | | | | | | | | |
| | | | | | | | | | |
| | | | | | | | | | |
| | | | | | | | | | |
| | | | | | | | | | |
| | | | | | | | | | |
| | | | | | | | | | |
| | | | | | | | | | |
| | | | | | | | | | |
| | | | | | | | | | |
| | | | | | | | | | |
| | | | | | | | | | |
| | | | | | | | | | |
| | | | | | | | | | |
| | | | | | | | | | |
| | | | | | | | | | |
| | | | | | | | | | |
| | | | | | | | | | |
| | | | | | | | | | |
| | | | | | | | | | |
| | | | | | | | | | |
| | | | | | | | | | |
| | | | | | | | | | |
| | | | | | | | | | |
| | | | | | | | | | |
| | | | | | | | | | |
| | | | | | | | | | |
| | | | | | | | | | |
| | | | | | | | | | | | | | | | | | | | | | | | | | | | | | | | |
Years Ended
December 31 | Natural Gas Liquids |
| Millions of Barrels |
| Alaska | Lower
48 | Total
U.S. | Canada | Europe | Asia Pacific/
Middle East | Africa | Total Consolidated Operations | Equity Affiliates* | Total |
| Developed | | | | | | | | | | |
| | | | | | | | | |
| End of 2021 | 82 | | 334 | | 416 | | 3 | | 9 | | — | | | 428 | | 33 | | 461 | |
| End of 2022 | 78 | | 409 | | 487 | | 3 | | 10 | | — | | | 500 | | 31 | | 531 | |
| End of 2023 | 72 | | 426 | | 498 | | 4 | | 9 | | — | | | 511 | | 28 | | 539 | |
| End of 2024 | 71 | | 653 | | 724 | | 6 | | 7 | | — | | 13 | | 750 | | 25 | | 775 | |
| | | | | | | | | | |
| | | | | | | | | | |
| | | | | | | | | | |
| | | | | | | | | | |
| | | | | | | | | | |
| | | | | | | | | | |
| | | | | | | | | | |
| Undeveloped | | | | | | | | | | |
| | | | | | | | | |
| End of 2021 | — | | 212 | | 212 | | 2 | | 2 | | — | | | 216 | | — | | 216 | |
| End of 2022 | — | | 340 | | 340 | | 2 | | 3 | | — | | | 345 | | 19 | | 364 | |
| End of 2023 | — | | 371 | | 371 | | 6 | | 4 | | — | | | 381 | | 20 | | 401 | |
| End of 2024 | — | | 388 | | 388 | | 6 | | 2 | | — | | 1 | | 397 | | 37 | | 434 | |
| | | | | | | | | | |
| | | | | | | | | | |
| | | | | | | | | | |
| | | | | | | | | | |
| | | | | | | | | | |
| | | | | | | | | | |
*All Equity Affiliate reserves are located in our Asia Pacific/Middle East Region.
| | | | | |
| 141 | ConocoPhillips 2024 10-K |
Notable changes in proved NGL reserves in the three years ended December 31, 2024, included:
•Revisions: In 2024, upward revisions in Lower 48 were due to additional development drilling of 164 million barrels and technical revisions of 52 million barrels. This was partially offset by development plan changes of 73 million barrels and lower prices impacting 20 million barrels.
In 2023, upward revisions in Lower 48 were due to additional development drilling in the unconventional plays of 86 million barrels and technical revisions of 71 million barrels. This was partially offset by lower prices impacting 34 million barrels and development plan changes of 4 million barrels.
In 2022, upward revisions in Lower 48 were due to additional development drilling in the unconventional plays of 88 million barrels, technical revisions of 75 million barrels, continued conversion of acquired Concho Permian two-stream contracts to a three-stream (crude oil, natural gas and NGLs) basis adding 70 million barrels, and higher prices of 13 million barrels. This was partially offset by increasing operating costs of 38 million barrels.
•Purchases: Purchases in 2024 were due to our acquisition of Marathon Oil, resulting in purchases for Lower 48 as well as in Africa, representing reserves in Equatorial Guinea.
•Extensions and discoveries: In 2024, Lower 48 extensions and discoveries were primarily within unconventional plays in the Permian Basin. Extensions and discoveries in our equity affiliates were in the Middle East.
In 2023, extensions and discoveries in Lower 48 were primarily within unconventional plays in the Permian Basin. Canada extensions and discoveries were in Montney.
In 2022, extensions and discoveries in Lower 48 were primarily within unconventional plays in the Permian Basin. Extensions and discoveries in our equity affiliates were in the Middle East.
| | | | | |
| ConocoPhillips 2024 10-K | 142 |
| | | | | | | | | | | | | | | | | | | | | | | | | | | | | | | | |
Years Ended
December 31 | Natural Gas |
| Billions of Cubic Feet |
| Alaska | Lower
48 | Total
U.S. | Canada | Europe | Asia Pacific/
Middle East | Africa | Total Consolidated Operations | Equity Affiliates* | Total |
| Developed and Undeveloped | | | | | | | | | |
| | | | | | | | | | |
| End of 2021 | 2,625 | | 4,658 | | 7,283 | | 105 | | 768 | | 764 | | 217 | | 9,137 | | 3,697 | | 12,834 | |
| Revisions | (35) | | 361 | | 326 | | 8 | | 108 | | (2) | | (14) | | 426 | | 898 | | 1,324 | |
| Improved recovery | — | | — | | — | | — | | — | | — | | — | | — | | — | | — | |
| Purchases | — | | 23 | | 23 | | — | | — | | — | | 48 | | 71 | | 479 | | 550 | |
| Extensions and discoveries | — | | 505 | | 505 | | 4 | | 103 | | — | | — | | 612 | | 1,118 | | 1,730 | |
| Production | (88) | | (543) | | (631) | | (23) | | (117) | | (51) | | (10) | | (832) | | (439) | | (1,271) | |
| Sales | — | | (262) | | (262) | | — | | — | | (385) | | — | | (647) | | — | | (647) | |
| End of 2022 | 2,502 | | 4,742 | | 7,244 | | 94 | | 862 | | 326 | | 241 | | 8,767 | | 5,753 | | 14,520 | |
| Revisions | (243) | | 521 | | 278 | | 27 | | 73 | | 6 | | (57) | | 327 | | (90) | | 237 | |
| Improved recovery | — | | — | | — | | — | | — | | — | | — | | — | | — | | — | |
| Purchases | — | | 4 | | 4 | | — | | — | | — | | — | | 4 | | — | | 4 | |
| Extensions and discoveries | — | | 121 | | 121 | | 144 | | 1 | | 4 | | — | | 270 | | 58 | | 328 | |
| Production | (84) | | (570) | | (654) | | (25) | | (113) | | (24) | | (12) | | (828) | | (446) | | (1,274) | |
| Sales | — | | (97) | | (97) | | — | | — | | — | | — | | (97) | | — | | (97) | |
| End of 2023 | 2,175 | | 4,721 | | 6,896 | | 240 | | 823 | | 312 | | 172 | | 8,443 | | 5,275 | | 13,718 | |
| Revisions | 102 | | 356 | | 458 | | 15 | | 47 | | 9 | | 3 | | 532 | | (26) | | 506 | |
| Improved recovery | — | | — | | — | | — | | — | | — | | — | | — | | — | | — | |
| Purchases | 47 | | 1,177 | | 1,224 | | — | | — | | — | | 310 | | 1,534 | | — | | 1,534 | |
| Extensions and discoveries | — | | 87 | | 87 | | 67 | | 1 | | — | | — | | 155 | | 1,075 | | 1,230 | |
| Production | (78) | | (599) | | (677) | | (43) | | (125) | | (25) | | (17) | | (887) | | (454) | | (1,341) | |
| Sales | — | | (6) | | (6) | | — | | — | | — | | — | | (6) | | — | | (6) | |
| End of 2024 | 2,246 | | 5,736 | | 7,982 | | 279 | | 746 | | 296 | | 468 | | 9,771 | | 5,870 | | 15,641 | |
| | | | | | | | | | |
| | | | | | | | | | |
| | | | | | | | | | |
| | | | | | | | | | |
| | | | | | | | | | |
| | | | | | | | | | |
| | | | | | | | | | |
| | | | | | | | | | |
| | | | | | | | | | |
| | | | | | | | | | |
| | | | | | | | | | |
| | | | | | | | | | |
| | | | | | | | | | |
| | | | | | | | | | |
| | | | | | | | | | |
| | | | | | | | | | |
| | | | | | | | | | |
| | | | | | | | | | |
| | | | | | | | | | |
| | | | | | | | | | |
| | | | | | | | | | |
| | | | | | | | | | |
| | | | | | | | | | |
| | | | | | | | | | |
| | | | | | | | | | |
| | | | | | | | | | |
| | | | | | | | | | |
| | | | | | | | | | |
| | | | | | | | | | |
| | | | | | | | | | |
| | | | | | | | | | | | | | | | | | | | | | | | | | | | | | | | |
Years Ended
December 31 | Natural Gas |
| Billions of Cubic Feet |
| Alaska | Lower
48 | Total
U.S. | Canada | Europe | Asia Pacific/
Middle East | Africa | Total Consolidated Operations | Equity Affiliates* | Total |
| Developed | | | | | | | | | | |
| | | | | | | | | | |
| End of 2021 | 2,579 | | 3,100 | | 5,679 | | 52 | | 679 | | 688 | | 217 | | 7,315 | | 3,204 | | 10,519 | |
| End of 2022 | 2,474 | | 2,628 | | 5,102 | | 64 | | 641 | | 322 | | 241 | | 6,370 | | 3,974 | | 10,344 | |
| End of 2023 | 2,156 | | 2,525 | | 4,681 | | 92 | | 591 | | 305 | | 172 | | 5,841 | | 3,558 | | 9,399 | |
| End of 2024 | 2,186 | | 3,670 | | 5,856 | | 147 | | 642 | | 289 | | 457 | | 7,391 | | 3,189 | | 10,580 | |
| | | | | | | | | | |
| | | | | | | | | | |
| | | | | | | | | | |
| | | | | | | | | | |
| | | | | | | | | | |
| | | | | | | | | | |
| | | | | | | | | | |
| Undeveloped | | | | | | | | | | |
| | | | | | | | | |
| End of 2021 | 46 | | 1,558 | | 1,604 | | 53 | | 89 | | 76 | | — | | 1,822 | | 493 | | 2,315 | |
| End of 2022 | 28 | | 2,114 | | 2,142 | | 30 | | 221 | | 4 | | — | | 2,397 | | 1,779 | | 4,176 | |
| End of 2023 | 19 | | 2,196 | | 2,215 | | 148 | | 232 | | 7 | | — | | 2,602 | | 1,717 | | 4,319 | |
| End of 2024 | 60 | | 2,066 | | 2,126 | | 132 | | 104 | | 7 | | 11 | | 2,380 | | 2,681 | | 5,061 | |
| | | | | | | | | | |
| | | | | | | | | | |
| | | | | | | | | | |
| | | | | | | | | | |
| | | | | | | | | | |
| | | | | | | | | | |
*All Equity Affiliate reserves are located in our Asia Pacific/Middle East Region.
Natural gas production in the reserves table may differ from gas production (delivered for sale) in our statistics disclosure, primarily because the quantities above include gas consumed in production operations. Quantities consumed in production operations are not significant in the periods presented. The value of net production consumed in operations is not reflected in net revenues and production expenses, nor do the volumes impact the respective per unit metrics.
Reserve volumes include natural gas to be consumed in operations of 2,285 BCF, 2,263 BCF and 2,416 BCF, as of December 31, 2024, 2023 and 2022, respectively. These volumes are not included in the calculation of our Standardized Measure of Discounted Future Net Cash Flows Relating to Proved Oil and Gas Reserve Quantities.
Natural gas reserves are computed at 14.65 pounds per square inch absolute and 60 degrees Fahrenheit.
| | | | | |
| 143 | ConocoPhillips 2024 10-K |
Notable changes in proved natural gas reserves in the three years ended December 31, 2024, included:
•Revisions: In 2024, upward revisions in Lower 48 were due to were due to additional development drilling of 841 BCF, technical revisions of 113 BCF, partly offset by downward revisions of 422 BCF for changes in development plans, 127 BCF due to lower prices and 49 BCF due to increasing operating costs. Upward revisions in Alaska of 68 BCF were due to updated total North Slope development phasing, as future production of gas is dependent on the Trans-Alaska Pipeline System minimum flow limit, which will be reached later than previously premised. Further upward revisions in Alaska included 28 BCF from revised development plans and 24 BCF to be consumed in operations. Offsetting downward revisions from technical revisions and costs were 18 BCF. In Europe, technical revisions contributed 64 BCF of upward revisions, offset by 17 BCF of development plan changes. In our equity affiliates, downward revisions were due to lower prices of 81 BCF, partially offset by positive technical revisions of 55 BCF.
In 2023, upward revisions in Lower 48 were due to additional development drilling in the unconventional plays of 502 BCF, technical revisions of 268 BCF, partly offset by lower prices of 211 BCF and development plan downward revisions of 38 BCF. In Europe, technical revisions contributed 64 BCF and development drilling of 14 BCF, partially offset by lower prices of 5 BCF. In Canada, upward revisions were driven by technical revisions of 37 BCF, partially offset by lower prices of 10 BCF. In Alaska, where future production is constrained by the Trans-Alaska Pipeline System minimum flow limit, updated total North Slope development phasing indicated that the flow limit will be reached earlier than previously premised, resulting in downward revisions of 121 BCF. Further downward revisions in Alaska included 72 BCF from operating efficiencies resulting in less gas to be consumed in operations, 22 BCF due to lower prices, 14 BCF from cost escalation, and 14 BCF due to technical revisions. Downward revisions in Africa of 57 BCF due to infrastructure constraints and sales demand revisions. In our equity affiliates, downward revisions were due to lower prices of 288 BCF, offset by upward technical revisions of 198 BCF.
In 2022, upward revisions in Lower 48 were due to additional development drilling in the unconventional plays of 544 BCF, higher prices of 109 BCF, and technical revisions of 41 BCF. These were partially offset by decreases of 233 BCF due to increasing operating costs, and 100 BCF due to the continued conversion of acquired Concho Permian two-stream contracts to a three-stream (crude oil, natural gas and natural gas liquids) basis. Upward revisions in Canada were driven by higher prices of 26 BCF, partially offset by technical revisions of 18 BCF. In Europe, technical revisions contributed 96 BCF, and higher prices 12 BCF of upward revisions. Downward revisions in Africa were primarily due to technical revisions. In our equity affiliates in Asia Pacific/Middle East, upward revisions were due to higher prices of 423 BCF, changing dynamics and improved prices in the regional LNG spot market of 331 BCF, and technical revisions of 204 BCF, partially offset by downward revisions due to increasing operating costs of 60 BCF.
•Purchases: In 2024, our acquisition of Marathon Oil resulted in purchases for Lower 48, as well as for Africa, representing reserves in Equatorial Guinea. Purchases in Alaska represent the acquisition of additional interest in the Kuparuk River and Prudhoe Bay units.
In 2022, purchases in Africa were a result of the acquisition of additional interest in the Libya Waha Concession. In our equity affiliates, purchases were due to the acquisition of additional affiliate interest in Asia Pacific.
•Extensions and discoveries: In 2024, extensions and discoveries in Lower 48 were primarily within unconventional plays in the Permian Basin. Canada extensions and discoveries were in Montney. Extensions and discoveries in our equity affiliates were in the Middle East and Australia.
In 2023, extensions and discoveries in Lower 48 were primarily within unconventional plays in the Permian Basin. Canada extensions and discoveries were in Montney. Extensions and discoveries in our equity affiliates were in Australia.
In 2022, extensions and discoveries in Lower 48 were primarily within unconventional plays in the Permian Basin. In Europe, extensions and discoveries were due to additional planned development. Extensions and discoveries in our equity affiliates were primarily in the Middle East.
•Sales: In 2023, Lower 48 sales represent the disposition of noncore assets.
In 2022, Lower 48 sales represent the disposition of noncore assets. Sales in our consolidated operations in Asia Pacific/Middle East represent the disposition of our Indonesia assets.
| | | | | |
| ConocoPhillips 2024 10-K | 144 |
| | | | | | | | | | |
Years Ended
December 31 | Bitumen |
| Millions of Barrels |
| Canada | Total* | | |
| Developed and Undeveloped | | | | |
| | | | |
| End of 2021 | 257 | | 257 | | | |
| Revisions | (17) | | (17) | | | |
| Improved recovery | — | | — | | | |
| Purchases | — | | — | | | |
| Extensions and discoveries | — | | — | | | |
| Production | (24) | | (24) | | | |
| Sales | — | | — | | | |
| End of 2022 | 216 | | 216 | | | |
| Revisions | 15 | | 15 | | | |
| Improved recovery | — | | — | | | |
| Purchases | 209 | | 209 | | | |
| Extensions and discoveries | — | | — | | | |
| Production | (30) | | (30) | | | |
| Sales | — | | — | | | |
| End of 2023 | 410 | | 410 | | | |
| Revisions | 118 | | 118 | | | |
| Improved recovery | — | | — | | | |
| Purchases | — | | — | | | |
| Extensions and discoveries | — | | — | | | |
| Production | (45) | | (45) | | | |
| Sales | — | | — | | | |
| End of 2024 | 483 | | 483 | | | |
| | | | |
| | | | |
| | | | |
| | | | |
| | | | |
| | | | |
| | | | |
| | | | |
| | | | |
| | | | |
| | | | |
| | | | |
| | | | |
| | | | |
| | | | |
| | | | |
| | | | |
| | | | |
| | | | |
| | | | |
| | | | |
| | | | |
| | | | |
| | | | |
| | | | |
| | | | |
| | | | |
| | | | |
| | | | |
| | | | |
| | | | | | | | | | |
Years Ended
December 31 | Bitumen |
| Millions of Barrels |
| Canada | Total* | | |
| Developed | | | | |
| | | | |
| End of 2021 | 150 | | 150 | | | |
| End of 2022 | 127 | | 127 | | | |
| End of 2023 | 293 | | 293 | | | |
| End of 2024 | 230 | | 230 | | | |
| | | | |
| | | | |
| | | | |
| | | | |
| | | | |
| | | | |
| | | | |
| Undeveloped | | | | |
| | | | |
| End of 2021 | 107 | | 107 | | | |
| End of 2022 | 89 | | 89 | | | |
| End of 2023 | 117 | | 117 | | | |
| End of 2024 | 253 | | 253 | | | |
| | | | |
| | | | |
| | | | |
| | | | |
| | | | |
| | | | |
*There are no Bitumen reserves associated with our Equity Affiliates.
Notable changes in proved bitumen reserves in the three years ended December 31, 2024, included:
•Revisions: In 2024, upward revisions of 125 million barrels due to changes in development timing was partially offset by downward revisions due to price of 7 million barrels.
In 2023, the upward revision of 15 million barrels is primarily due to the impact of price on variable royalties.
In 2022, the impact of variable royalties on price resulted in downward revisions of 30 million barrels, partially offset by upward revisions primarily due to changes in development timing for specific pad locations from the Surmont development program.
•Purchases: In 2023, purchases in Canada were a result of the acquisition of the remaining 50 percent working interest in Surmont.
| | | | | |
| 145 | ConocoPhillips 2024 10-K |
| | | | | | | | | | | | | | | | | | | | | | | | | | | | | | | | |
Years Ended
December 31 | Total Proved Reserves |
| Millions of Barrels of Oil Equivalent |
| Alaska | Lower
48 | Total
U.S. | Canada | Europe | Asia Pacific/
Middle East | Africa | Total Consolidated Operations | Equity Affiliates* | Total |
| Developed and Undeveloped | | | | | | | | | | |
| | | | | | | | | | |
| End of 2021 | 1,555 | | 2,775 | | 4,330 | | 290 | | 299 | | 249 | | 220 | | 5,388 | | 713 | | 6,101 | |
| Revisions | (35) | | 292 | | 257 | | (15) | | 52 | | 19 | | (5) | | 308 | | 149 | | 457 | |
| Improved recovery | — | | — | | — | | — | | — | | 3 | | — | | 3 | | — | | 3 | |
| Purchases | — | | 13 | | 13 | | — | | — | | — | | 50 | | 63 | | 80 | | 143 | |
| Extensions and discoveries | 15 | | 414 | | 429 | | 1 | | 26 | | — | | — | | 456 | | 241 | | 697 | |
| Production | (85) | | (364) | | (449) | | (31) | | (46) | | (31) | | (15) | | (572) | | (81) | | (653) | |
| Sales | — | | (82) | | (82) | | — | | — | | (67) | | — | | (149) | | — | | (149) | |
| End of 2022 | 1,450 | | 3,048 | | 4,498 | | 245 | | 331 | | 173 | | 250 | | 5,497 | | 1,102 | | 6,599 | |
| Revisions | (98) | | 332 | | 234 | | 20 | | 12 | | 9 | | 1 | | 276 | | (14) | | 262 | |
| Improved recovery | — | | — | | — | | — | | — | | — | | — | | — | | — | | — | |
| Purchases | — | | 4 | | 4 | | 209 | | — | | — | | — | | 213 | | — | | 213 | |
| Extensions and discoveries | 219 | | 94 | | 313 | | 45 | | 3 | | 20 | | — | | 381 | | 10 | | 391 | |
| Production | (83) | | (387) | | (470) | | (38) | | (43) | | (26) | | (19) | | (596) | | (82) | | (678) | |
| Sales | — | | (29) | | (29) | | — | | — | | — | | — | | (29) | | — | | (29) | |
| End of 2023 | 1,488 | | 3,062 | | 4,550 | | 481 | | 303 | | 176 | | 232 | | 5,742 | | 1,016 | | 6,758 | |
| Revisions | 25 | | 367 | | 392 | | 127 | | 3 | | 16 | | 52 | | 590 | | (6) | | 584 | |
| Improved recovery | — | | — | | — | | — | | — | | — | | — | | — | | — | | — | |
| Purchases | 32 | | 768 | | 800 | | — | | — | | — | | 91 | | 891 | | — | | 891 | |
| Extensions and discoveries | 14 | | 59 | | 73 | | 23 | | — | | — | | — | | 96 | | 220 | | 316 | |
| Production | (81) | | (413) | | (494) | | (60) | | (48) | | (26) | | (21) | | (649) | | (83) | | (732) | |
| Sales | — | | (5) | | (5) | | — | | — | | — | | — | | (5) | | — | | (5) | |
| End of 2024 | 1,478 | | 3,838 | | 5,316 | | 571 | | 258 | | 166 | | 354 | | 6,665 | | 1,147 | | 7,812 | |
| | | | | | | | | | |
| | | | | | | | | | |
| | | | | | | | | | |
| | | | | | | | | | |
| | | | | | | | | | |
| | | | | | | | | | |
| | | | | | | | | | |
| | | | | | | | | | |
| | | | | | | | | | |
| | | | | | | | | | |
| | | | | | | | | | |
| | | | | | | | | | |
| | | | | | | | | | |
| | | | | | | | | | |
| | | | | | | | | | |
| | | | | | | | | | |
| | | | | | | | | | |
| | | | | | | | | | |
| | | | | | | | | | |
| | | | | | | | | | |
| | | | | | | | | | |
| | | | | | | | | | |
| | | | | | | | | | |
| | | | | | | | | | |
| | | | | | | | | | |
| | | | | | | | | | |
| | | | | | | | | | |
| | | | | | | | | | |
| | | | | | | | | | |
| | | | | | | | | | |
| | | | | | | | | | | | | | | | | | | | | | | | | | | | | | | | |
Years Ended
December 31 | Total Proved Reserves |
| Millions of Barrels of Oil Equivalent |
| Alaska | Lower
48 | Total
U.S. | Canada | Europe | Asia Pacific/
Middle East | Africa | Total Consolidated Operations | Equity Affiliates* | Total |
| Developed | | | | | | | | | | |
| | | | | | | | | | |
| End of 2021 | 1,424 | | 1,767 | | 3,191 | | 166 | | 244 | | 212 | | 207 | | 4,020 | | 631 | | 4,651 | |
| End of 2022 | 1,357 | | 1,676 | | 3,033 | | 147 | | 240 | | 155 | | 231 | | 3,806 | | 751 | | 4,557 | |
| End of 2023 | 1,222 | | 1,639 | | 2,861 | | 320 | | 216 | | 142 | | 210 | | 3,749 | | 675 | | 4,424 | |
| End of 2024 | 1,202 | | 2,387 | | 3,589 | | 272 | | 215 | | 136 | | 297 | | 4,509 | | 606 | | 5,115 | |
| | | | | | | | | | |
| | | | | | | | | | |
| | | | | | | | | | |
| | | | | | | | | | |
| | | | | | | | | | |
| | | | | | | | | | |
| | | | | | | | | | |
| Undeveloped | | | | | | | | | | |
| | | | | | | | | |
| End of 2021 | 131 | | 1,008 | | 1,139 | | 124 | | 55 | | 37 | | 13 | | 1,368 | | 82 | | 1,450 | |
| End of 2022 | 93 | | 1,372 | | 1,465 | | 98 | | 91 | | 18 | | 19 | | 1,691 | | 351 | | 2,042 | |
| End of 2023 | 266 | | 1,423 | | 1,689 | | 161 | | 87 | | 34 | | 22 | | 1,993 | | 341 | | 2,334 | |
| End of 2024 | 276 | | 1,451 | | 1,727 | | 299 | | 43 | | 30 | | 57 | | 2,156 | | 541 | | 2,697 | |
| | | | | | | | | | |
| | | | | | | | | | |
| | | | | | | | | | |
| | | | | | | | | | |
| | | | | | | | | | |
| | | | | | | | | | |
*All Equity Affiliate reserves are located in our Asia Pacific/Middle East Region.
Natural gas reserves are converted to BOE based on a 6:1 ratio: six MCF of natural gas converts to one BOE.
| | | | | |
| ConocoPhillips 2024 10-K | 146 |
Proved Undeveloped Reserves
The following table shows changes in total proved undeveloped reserves for 2024:
| | | | | |
| Proved Undeveloped Reserves |
| Millions of Barrels of Oil Equivalent |
| End of 2023 | 2,334 | |
| Revisions | 535 | |
| Improved recovery | — | |
| Purchases | 57 | |
| Extensions and discoveries | 281 | |
| Sales | (1) | |
| Transfers to Proved Developed | (509) | |
| End of 2024 | 2,697 | |
Revisions of 535 MMBOE were predominately driven by progression of development plans in the Lower 48 unconventional plays, Canada Oil Sands and Libya, partially offset by 31MMBOE due to product price changes across the portfolio.
Purchases of 57 were primarily due to our acquisition of Marathon Oil in Lower 48 and Equatorial Guinea.
Extensions and discoveries were largely driven by the continued development planned in equity affiliates in Asia Pacific/Middle East. The remaining extensions and discoveries were driven by the continued development planned in the other geographic regions, including Canada, Lower 48 unconventional plays, and Alaska.
Transfers to proved developed reserves were driven by the ongoing development of our assets. Approximately 75 percent of the transfers were from the development of our Lower 48 unconventional plays. The remainder of transfers were from development across the other geographic regions.
At both December 31, 2024 and 2023, our PUDs represented 35 percent of total proved reserves. Costs incurred for the year ended December 31, 2024, relating to the development of PUDs were $9.4 billion. A portion of our costs incurred each year relates to development projects where the PUDs will be converted to proved developed reserves in future years.
At the end of 2024, approximately 88 percent of total PUDs were under development or scheduled for development within five years of initial disclosure, including all of our Lower 48 PUDs. The PUDs to be developed beyond five years are in the Willow project in Alaska, a development that is currently underway with production anticipated in 2029 due to its large scale and remote location, as well as in major development areas which are currently producing and located in Canada and in our equity affiliate in Australia.
| | | | | |
| 147 | ConocoPhillips 2024 10-K |
Results of Operations
The company’s results of operations from oil and gas activities for the years 2024, 2023 and 2022 are shown in the following tables. Non-oil and gas activities, such as pipeline and marine operations, LNG operations, crude oil and gas marketing activities, and the profit element of transportation operations in which we have an ownership interest are excluded. Additional information about selected line items within the results of operations tables is shown below:
•Sales include sales to unaffiliated entities attributable primarily to the company’s net working interests and royalty interests. Sales are net of fees to transport our produced hydrocarbons beyond the production function to a final delivery point using transportation operations which are not consolidated.
•Transportation costs reflect fees to transport our produced hydrocarbons beyond the production function to a final delivery point using transportation operations which are consolidated.
•Other revenues include gains and losses from asset sales, certain amounts resulting from the purchase and sale of hydrocarbons, and other miscellaneous income.
•Production costs include costs incurred to operate and maintain wells, related equipment and facilities used in the production of petroleum liquids and natural gas.
•Taxes other than income taxes include production, property and other non-income taxes.
•Depreciation of support equipment is reclassified as applicable.
•Other related expenses include inventory fluctuations, foreign currency transaction gains and losses and other miscellaneous expenses.
Results of Operations
| | | | | | | | | | | | | | | | | | | | | | | | | | | | | | | | | |
Year Ended
December 31, 2024 | Millions of Dollars |
| Alaska | Lower
48 | Total
U.S. | Canada | Europe | Asia Pacific/
Middle East | Africa | Other
Areas | Total Consolidated Operations | Equity Affiliates* | |
| Consolidated operations | | | | | | | | | | |
| Sales | $ | 5,574 | | 19,028 | | 24,602 | | 2,567 | | 3,469 | | 1,847 | | 1,488 | | — | | 33,973 | | 917 | | |
| Transfers | 6 | | — | | 6 | | — | | — | | — | | — | | — | | 6 | | 3,343 | | |
| Transportation costs | (709) | | — | | (709) | | — | | — | | — | | — | | — | | (709) | | — | | |
| Other revenues | — | | 108 | | 108 | | (34) | | (69) | | 3 | | 117 | | 13 | | 138 | | 18 | | |
| Total revenues | 4,871 | | 19,136 | | 24,007 | | 2,533 | | 3,400 | | 1,850 | | 1,605 | | 13 | | 33,408 | | 4,278 | | |
| Production costs excluding taxes | 1,330 | | 4,691 | | 6,021 | | 902 | | 506 | | 350 | | 120 | | — | | 7,899 | | 543 | | |
| Taxes other than income taxes | 410 | | 1,372 | | 1,782 | | 31 | | 36 | | 108 | | 4 | | — | | 1,961 | | 1,181 | | |
| Exploration expenses | 74 | | 85 | | 159 | | 80 | | 68 | | 40 | | 8 | | 1 | | 356 | | — | | |
| Depreciation, depletion and amortization | 1,175 | | 6,422 | | 7,597 | | 594 | | 689 | | 424 | | 67 | | — | | 9,371 | | 484 | | |
| Impairments | 32 | | 42 | | 74 | | 4 | | 2 | | — | | — | | — | | 80 | | — | | |
| Other related expenses | (36) | | 49 | | 13 | | (52) | | (68) | | — | | 5 | | 14 | | (88) | | (8) | | |
| Accretion | 106 | | 79 | | 185 | | 18 | | 68 | | 28 | | — | | — | | 299 | | 19 | | |
| 1,780 | | 6,396 | | 8,176 | | 956 | | 2,099 | | 900 | | 1,401 | | (2) | | 13,530 | | 2,059 | | |
| Income tax provision (benefit) | 461 | | 1,407 | | 1,868 | | 224 | | 1,539 | | 222 | | 1,306 | | (1) | | 5,158 | | 623 | | |
| Results of operations | $ | 1,319 | | 4,989 | | 6,308 | | 732 | | 560 | | 678 | | 95 | | (1) | | 8,372 | | 1,436 | | |
| *All Equity Affiliate activity is located in our Asia Pacific/Middle East Region. |
| | | | | | | | | | | |
| | | | | | | | | | | |
| | | | | | | | | | | |
| | | | | | | | | | | |
| | | | | | | | | | | |
| | | | | | | | | | | |
| | | | | | | | | | | |
| | | | | | | | | | | |
| | | | | | | | | | | |
| | | | | | | | | | | |
| | | | | | | | | | | |
| | | | | | | | | | | |
| | | | | | | | | | | |
| | | | | | | | | | | |
| | | | | | | | | | | |
| | | | | | | | | | | |
| | | | | |
| ConocoPhillips 2024 10-K | 148 |
| | | | | | | | | | | | | | | | | | | | | | | | | | | | | | | | | |
Year Ended
December 31,2023 | Millions of Dollars |
| Alaska | Lower
48 | Total
U.S. | Canada | Europe | Asia Pacific/
Middle East | Africa | Other
Areas | Total Consolidated Operations | Equity Affiliates* | |
| Consolidated operations | | | | | | | | | | |
| Sales | $ | 5,918 | | 18,976 | | 24,894 | | 1,517 | | 3,449 | | 1,914 | | 1,447 | | — | | 33,221 | | 822 | | |
| Transfers | 5 | | — | | 5 | | — | | — | | — | | — | | — | | 5 | | 3,429 | | |
| Transportation costs | (611) | | — | | (611) | | — | | — | | — | | — | | — | | (611) | | — | | |
| Other revenues | (4) | | 142 | | 138 | | (1) | | 3 | | (1) | | 181 | | 3 | | 323 | | 14 | | |
| Total revenues | 5,308 | | 19,118 | | 24,426 | | 1,516 | | 3,452 | | 1,913 | | 1,628 | | 3 | | 32,938 | | 4,265 | | |
| Production costs excluding taxes | 1,242 | | 4,175 | | 5,417 | | 602 | | 499 | | 348 | | 74 | | 1 | | 6,941 | | 493 | | |
| Taxes other than income taxes | 442 | | 1,347 | | 1,789 | | 26 | | 35 | | 115 | | 3 | | — | | 1,968 | | 1,208 | | |
| Exploration expenses | 72 | | 153 | | 225 | | 49 | | 73 | | 44 | | 4 | | 3 | | 398 | | — | | |
| Depreciation, depletion and amortization | 938 | | 5,702 | | 6,640 | | 374 | | 532 | | 454 | | 50 | | — | | 8,050 | | 390 | | |
| Impairments | — | | 7 | | 7 | | 6 | | — | | — | | — | | — | | 13 | | — | | |
| Other related expenses | 71 | | 42 | | 113 | | 60 | | (24) | | 17 | | 3 | | 12 | | 181 | | (8) | | |
| Accretion | 94 | | 65 | | 159 | | 12 | | 61 | | 27 | | — | | — | | 259 | | 30 | | |
| 2,449 | | 7,627 | | 10,076 | | 387 | | 2,276 | | 908 | | 1,494 | | (13) | | 15,128 | | 2,152 | | |
| Income tax provision (benefit) | 640 | | 1,667 | | 2,307 | | 5 | | 1,704 | | 66 | | 1,375 | | — | | 5,457 | | 658 | | |
| Results of operations | $ | 1,809 | | 5,960 | | 7,769 | | 382 | | 572 | | 842 | | 119 | | (13) | | 9,671 | | 1,494 | | |
| *All Equity Affiliate activity is located in our Asia Pacific/Middle East Region. |
| | | | | | | | | | | |
| | | | | | | | | | | |
| | | | | | | | | | | |
| | | | | | | | | | | |
| | | | | | | | | | | |
| | | | | | | | | | | |
| | | | | | | | | | | |
| | | | | | | | | | | |
| | | | | | | | | | | |
| | | | | | | | | | | |
| | | | | | | | | | | |
| | | | | | | | | | | |
| | | | | | | | | | | |
| | | | | | | | | | | |
| | | | | | | | | | | |
| | | | | | | | | | | |
| | | | | | | | | | | | | | | | | | | | | | | | | | | | | | | | | |
Year Ended
December 31,2022 | Millions of Dollars |
| Alaska | Lower
48 | Total
U.S. | Canada | Europe | Asia Pacific/
Middle East | Africa | Other
Areas | Total Consolidated Operations | Equity Affiliates* | |
| Consolidated operations | | | | | | | | | | |
| Sales | $ | 7,210 | | 24,309 | | 31,519 | | 1,622 | | 6,594 | | 2,602 | | 1,339 | | — | | 43,676 | | 1,000 | | |
| Transfers | 6 | | — | | 6 | | — | | — | | — | | — | | — | | 6 | | 4,272 | | |
| Transportation costs | (647) | | — | | (647) | | — | | — | | — | | — | | — | | (647) | | — | | |
| Other revenues | (1) | | 115 | | 114 | | 338 | | 1 | | 536 | | 184 | | 10 | | 1,183 | | 41 | | |
| Total revenues | 6,568 | | 24,424 | | 30,992 | | 1,960 | | 6,595 | | 3,138 | | 1,523 | | 10 | | 44,218 | | 5,313 | | |
| Production costs excluding taxes | 1,160 | | 3,600 | | 4,760 | | 581 | | 511 | | 342 | | 55 | | — | | 6,249 | | 491 | | |
| Taxes other than income taxes | 1,265 | | 1,687 | | 2,952 | | 21 | | 36 | | 243 | | 2 | | — | | 3,254 | | 1,536 | | |
| Exploration expenses | 34 | | 189 | | 223 | | 149 | | 122 | | 49 | | 19 | | 2 | | 564 | | — | | |
| Depreciation, depletion and amortization | 833 | | 4,843 | | 5,676 | | 354 | | 693 | | 517 | | 36 | | — | | 7,276 | | 530 | | |
| Impairments | 2 | | (11) | | (9) | | (2) | | (1) | | — | | — | | — | | (12) | | — | | |
| Other related expenses | (19) | | 4 | | (15) | | (41) | | (178) | | 40 | | 5 | | 6 | | (183) | | (2) | | |
| Accretion | 78 | | 55 | | 133 | | 11 | | 62 | | 25 | | — | | — | | 231 | | 27 | | |
| 3,215 | | 14,057 | | 17,272 | | 887 | | 5,350 | | 1,922 | | 1,406 | | 2 | | 26,839 | | 2,731 | | |
| Income tax provision (benefit) | 866 | | 3,113 | | 3,979 | | 198 | | 4,057 | | 512 | | 1,301 | | 53 | | 10,100 | | 836 | | |
| Results of operations | $ | 2,349 | | 10,944 | | 13,293 | | 689 | | 1,293 | | 1,410 | | 105 | | (51) | | 16,739 | | 1,895 | | |
| *All Equity Affiliate activity is located in our Asia Pacific/Middle East Region. |
| | | | | | | | | | | |
| | | | | | | | | | | |
| | | | | | | | | | | |
| | | | | | | | | | | |
| | | | | | | | | | | |
| | | | | | | | | | | |
| | | | | | | | | | | |
| | | | | | | | | | | |
| | | | | | | | | | | |
| | | | | | | | | | | |
| | | | | | | | | | | |
| | | | | | | | | | | |
| | | | | | | | | | | |
| | | | | | | | | | | |
| | | | | | | | | | | |
| | | | | | | | | | | |
| | | | | |
| 149 | ConocoPhillips 2024 10-K |
Statistics
| | | | | | | | | | | |
| Net Production | 2024 | 2023 | 2022 |
| Thousands of Barrels Daily |
| Crude Oil | | | |
| Consolidated operations | | | |
| Alaska | 173 | | 173 | | 177 | |
| Lower 48 | 602 | | 569 | | 534 | |
| United States | 775 | | 742 | | 711 | |
| Canada | 17 | | 9 | | 6 | |
| Europe | 69 | | 64 | | 71 | |
| Asia Pacific | 59 | | 60 | | 61 | |
| Africa | 49 | | 48 | | 36 | |
| Total consolidated operations | 969 | | 923 | | 885 | |
| Equity affiliates—Asia Pacific/Middle East | 13 | | 13 | | 13 | |
| Total company | 982 | | 936 | | 898 | |
| Delaware Basin Area (Lower 48)* | 301 | | 274 | | 258 | |
| | | |
| | | |
| Natural Gas Liquids | | | |
| Consolidated operations | | | |
| Alaska | 15 | | 16 | | 17 | |
| Lower 48 | 279 | | 256 | | 221 | |
| United States | 294 | | 272 | | 238 | |
| Canada | 6 | | 3 | | 3 | |
| Europe | 4 | | 4 | | 3 | |
| | | |
| Total consolidated operations | 304 | | 279 | | 244 | |
| Equity affiliates—Asia Pacific/Middle East | 8 | | 8 | | 8 | |
| Total company | 312 | | 287 | | 252 | |
| Delaware Basin Area (Lower 48)* | 144 | | 135 | | 114 | |
| | | |
| | | |
| Bitumen | | | |
| Consolidated operations—Canada | 122 | | 81 | | 66 | |
| Total company | 122 | | 81 | | 66 | |
| | | |
| Natural Gas | Millions of Cubic Feet Daily |
| Consolidated operations | | | |
| Alaska | 39 | | 38 | | 34 | |
| Lower 48 | 1,625 | | 1,457 | | 1,402 | |
| United States | 1,664 | | 1,495 | | 1,436 | |
| Canada | 115 | | 65 | | 61 | |
| Europe | 329 | | 279 | | 306 | |
| Asia Pacific | 50 | | 48 | | 114 | |
| Africa | 42 | | 29 | | 22 | |
| Total consolidated operations | 2,200 | | 1,916 | | 1,939 | |
| Equity affiliates—Asia Pacific/Middle East | 1,233 | | 1,219 | | 1,191 | |
| Total company | 3,433 | | 3,135 | | 3,130 | |
| Delaware Basin Area (Lower 48)* | 884 | | 768 | | 752 | |
| | | |
*At year-end 2024, 2023 and 2022, the Delaware Basin Area in Lower 48 contained more than 15 percent of our total proved reserves.
| | | | | |
| ConocoPhillips 2024 10-K | 150 |
| | | | | | | | | | | |
| Average Sales Prices | 2024 | 2023 | 2022 |
| | | |
| Crude Oil Per Barrel | | | |
| Consolidated operations | | | |
| Alaska* | $ | 71.32 | | 74.46 | | 92.58 | |
| Lower 48 | 74.17 | | 76.19 | | 94.46 | |
| United States | 73.49 | | 75.75 | | 93.96 | |
| Canada | 64.47 | | 66.19 | | 79.94 | |
| Europe | 81.09 | | 84.56 | | 99.88 | |
| Asia Pacific | 82.42 | | 84.79 | | 105.52 | |
| Africa | 80.65 | | 83.07 | | 97.85 | |
| Total international | 79.97 | | 83.33 | | 100.75 | |
| Total consolidated operations | 74.76 | | 77.19 | | 95.27 | |
| Equity affiliates—Asia Pacific/Middle East | 76.76 | | 78.45 | | 97.31 | |
| Total operations | 74.78 | | 77.21 | | 95.30 | |
| | | |
| Natural Gas Liquids Per Barrel | | | |
| Consolidated operations | | | |
| Lower 48 | $ | 22.02 | | 21.73 | | 35.36 | |
| United States | 22.02 | | 21.73 | | 35.36 | |
| Canada | 29.59 | | 26.13 | | 37.70 | |
| Europe | 45.50 | | 41.13 | | 54.52 | |
| | | |
| Total international | 33.60 | | 34.56 | | 46.16 | |
| Total consolidated operations | 22.43 | | 22.12 | | 35.67 | |
| Equity affiliates—Asia Pacific/Middle East | 51.53 | | 47.09 | | 61.22 | |
| Total operations | 23.19 | | 22.82 | | 36.50 | |
| | | |
| Bitumen Per Barrel | | | |
| Consolidated operations—Canada | $ | 47.92 | | 42.15 | | 55.56 | |
| | | |
| Natural Gas Per Thousand Cubic Feet | | | |
| Consolidated operations | | | |
| Alaska | $ | 3.90 | | 4.47 | | 3.64 | |
| Lower 48 | 0.87 | | 2.12 | | 5.92 | |
| United States | 0.88 | | 2.13 | | 5.92 | |
| Canada** | 0.54 | | 1.80 | | 3.62 | |
| Europe | 11.11 | | 13.33 | | 35.33 | |
| Asia Pacific | 3.74 | | 3.95 | | 5.84 | |
| Africa | 7.32 | | 6.49 | | 6.59 | |
| Total international | 7.87 | | 10.01 | | 23.54 | |
| Total consolidated operations | 2.61 | | 3.89 | | 10.56 | |
| Equity affiliates—Asia Pacific/Middle East | 8.22 | | 8.46 | | 9.39 | |
| Total operations | 4.69 | | 5.69 | | 10.60 | |
*Average sales prices for Alaska crude oil above reflects a reduction for transportation costs in which we have an ownership interest that are incurred subsequent to the terminal point of the production function. Accordingly, the average sales prices differ from those discussed in Item 7 of Management's Discussion and Analysis of Financial Condition and Results of Operations.
**Average sales prices include unutilized transportation costs.
| | | | | |
| 151 | ConocoPhillips 2024 10-K |
| | | | | | | | | | | |
| 2024 | 2023 | 2022 |
| Average Production Costs Per Barrel of Oil Equivalent* | | | |
| Consolidated operations | | | |
| Alaska | $ | 18.73 | | 17.45 | | 15.89 | |
| Lower 48 | 11.13 | | 10.72 | | 9.97 | |
| United States | 12.22 | | 11.76 | | 10.97 | |
| Canada | 15.03 | | 15.86 | | 18.73 | |
| Europe | 10.80 | | 11.89 | | 11.20 | |
| Asia Pacific | 14.27 | | 14.02 | | 11.71 | |
| Africa | 5.85 | | 3.83 | | 3.77 | |
| Total international | 12.36 | | 12.28 | | 12.36 | |
| Total consolidated operations | 12.26 | | 11.87 | | 11.27 | |
| Equity affiliates—Asia Pacific/Middle East | 6.56 | | 6.03 | | 6.14 | |
| | | |
| Average Production Costs Per Barrel—Bitumen | | | |
| Consolidated operations—Canada | $ | 15.19 | | 14.42 | | 17.62 | |
| | | |
| Taxes Other Than Income Taxes Per Barrel of Oil Equivalent | | | |
| Consolidated operations | | | |
| Alaska | $ | 5.77 | | 6.21 | | 17.33 | |
| Lower 48 | 3.25 | | 3.46 | | 4.67 | |
| United States | 3.62 | | 3.88 | | 6.80 | |
| Canada | 0.52 | | 0.68 | | 0.68 | |
| Europe | 0.77 | | 0.83 | | 0.79 | |
| Asia Pacific | 4.40 | | 4.63 | | 8.32 | |
| Africa | 0.20 | | 0.16 | | 0.14 | |
| Total international | 1.18 | | 1.44 | | 2.51 | |
| Total consolidated operations | 3.04 | | 3.37 | | 5.87 | |
| Equity affiliates—Asia Pacific/Middle East | 14.28 | | 14.77 | | 19.22 | |
| | | |
| Depreciation, Depletion and Amortization Per Barrel of Oil Equivalent | | | |
| Consolidated operations | | | |
| Alaska | $ | 16.55 | | 13.18 | | 11.41 | |
| Lower 48 | 15.23 | | 14.64 | | 13.42 | |
| United States | 15.42 | | 14.42 | | 13.08 | |
| Canada | 9.90 | | 9.85 | | 11.41 | |
| Europe | 14.71 | | 12.67 | | 15.19 | |
| Asia Pacific | 17.29 | | 18.29 | | 17.71 | |
| Africa | 3.27 | | 2.58 | | 2.47 | |
| Total international | 11.68 | | 11.36 | | 13.28 | |
| Total consolidated operations | 14.54 | | 13.77 | | 13.12 | |
| Equity affiliates—Asia Pacific/Middle East | 5.85 | | 4.77 | | 6.63 | |
*Includes bitumen.
| | | | | |
| ConocoPhillips 2024 10-K | 152 |
Development and Exploration Activities
The following two tables summarize our net interest in productive and dry exploratory and development wells in the years ended December 31, 2024, 2023 and 2022. A “development well” is a well drilled within the proved area of a reservoir to the depth of a stratigraphic horizon known to be productive. An “exploratory well” is a well drilled to find and produce crude oil or natural gas in an unknown field or a new reservoir within a proven field. Exploratory wells also include wells drilled in areas near or offsetting current production, or in areas where well density or production history have not achieved statistical certainty of results. Excluded from the exploratory well count are stratigraphic-type exploratory wells, primarily relating to oil sands delineation wells located in Canada and CBM test wells located in Asia Pacific/Middle East.
| | | | | | | | | | | | | | | | | | | | | | | |
| Net Wells Completed | | | | | | | |
| Productive | | Dry |
| 2024 | 2023 | 2022 | | 2024 | 2023 | 2022 |
| Exploratory | | | | | | | |
| Consolidated operations | | | | | | | |
| Alaska | — | | — | | — | | | — | | 2 | | — | |
| Lower 48 | 39 | | 38 | | 118 | | | — | | 2 | | — | |
| United States | 39 | | 38 | | 118 | | | — | | 4 | | — | |
| Canada | 7 | | 6 | | 6 | | | — | | — | | — | |
| Europe | — | | — | | — | | | * | * | 2 | |
| Asia Pacific/Middle East | * | — | | — | | | — | | — | | 1 | |
| Africa | — | | — | | — | | | 1 | | — | | 3 | |
| Other areas | — | | — | | — | | | — | | — | | — | |
| Total consolidated operations | 46 | | 44 | | 124 | | | 1 | | 4 | | 6 | |
| Equity affiliates | | | | | | | |
| Asia Pacific/Middle East | 2 | | 3 | | * | | — | | * | — | |
| Total equity affiliates | 2 | | 3 | | * | | — | | * | — | |
| | | | | | | |
| Development | | | | | | | |
| Consolidated operations | | | | | | | |
| Alaska | 13 | | 11 | | 11 | | | — | | — | | — | |
| Lower 48 | 507 | | 494 | | 388 | | | — | | — | | — | |
| United States | 520 | | 505 | | 399 | | | — | | — | | — | |
| Canada | 38 | | 21 | | 11 | | | — | | — | | — | |
| Europe | 8 | | 4 | | 3 | | | — | | — | | — | |
| Asia Pacific/Middle East | 23 | | 20 | | 22 | | | — | | — | | — | |
| Africa | 5 | | 4 | | 2 | | | — | | — | | — | |
| Other areas | — | | — | | — | | | — | | — | | — | |
| Total consolidated operations | 594 | | 554 | | 437 | | | — | | — | | — | |
| Equity affiliates | | | | | | | |
| Asia Pacific/Middle East | 54 | | 45 | | 28 | | | — | | — | | — | |
| Total equity affiliates | 54 | | 45 | | 28 | | | — | | — | | — | |
*Our total proportionate interest was less than one.
| | | | | |
| 153 | ConocoPhillips 2024 10-K |
The table below represents the status of our wells drilling at December 31, 2024, and includes wells in the process of drilling or in active completion. It also represents gross and net productive wells, including producing wells and wells capable of production at December 31, 2024.
Wells at December 31, 2024
| | | | | | | | | | | | | | | | | | | | | | | | | | |
| | | | Productive |
| In Progress | | Oil | | Gas |
| Gross | Net | | Gross | Net | | Gross | Net |
| Consolidated operations | | | | | | | |
| Alaska | 3 | | 3 | | | 1,557 | | 936 | | | — | | — | |
| Lower 48 | 832 | | 450 | | | 21,323 | | 10,179 | | | 4,638 | | 2,782 | |
| United States | 835 | | 453 | | | 22,880 | | 11,115 | | | 4,638 | | 2,782 | |
| Canada | 62 | | 62 | | | 213 | | 213 | | | 174 | | 174 | |
| Europe | 14 | | 2 | | | 497 | | 84 | | | 65 | | 4 | |
| Asia Pacific/Middle East | 7 | | 3 | | | 491 | | 233 | | | 6 | | 2 | |
| Africa | 27 | | 6 | | | 917 | | 187 | | | 27 | | 13 | |
| Other areas | — | | — | | | — | | — | | | — | | — | |
| Total consolidated operations | 945 | | 526 | | | 24,998 | | 11,832 | | | 4,910 | | 2,975 | |
| Equity affiliates | | | | | | | | |
| Asia Pacific/Middle East | 422 | | 65 | | | — | | — | | | 5,461 | | 1,615 | |
| Total equity affiliates | 422 | | 65 | | | — | | — | | | 5,461 | | 1,615 | |
Acreage at December 31, 2024
| | | | | | | | | | | | | | | | | |
| | | | | |
| Thousands of Acres |
| Developed | | Undeveloped |
| Gross | Net | | Gross | Net |
| Consolidated operations | | | | | |
| Alaska | 741 | | 566 | | | 1,038 | | 1,012 | |
| Lower 48 | 4,773 | | 3,318 | | | 10,258 | | 8,100 | |
| United States | 5,514 | | 3,884 | | | 11,296 | | 9,112 | |
| Canada | 309 | | 286 | | | 3,396 | | 2,006 | |
| Europe | 451 | | 60 | | | 610 | | 188 | |
| Asia Pacific/Middle East | 422 | | 152 | | | 10,341 | | 7,630 | |
| Africa | 440 | | 140 | | | 12,545 | | 2,561 | |
| Other areas | — | | — | | | 156 | | 125 | |
| Total consolidated operations | 7,136 | | 4,522 | | | 38,344 | | 21,622 | |
| Equity affiliates | | | | | |
| Asia Pacific/Middle East | 1,085 | | 325 | | | 4,173 | | 1,078 | |
| Total equity affiliates | 1,085 | | 325 | | | 4,173 | | 1,078 | |
| | | | | |
| ConocoPhillips 2024 10-K | 154 |
Costs Incurred
| | | | | | | | | | | | | | | | | | | | | | | | | | | | | | | | | |
Year Ended
December 31 | Millions of Dollars | | |
| Alaska | Lower
48 | Total
U.S. | Canada | Europe | Asia Pacific/
Middle East | Africa | Other
Areas | Total Consolidated Operations | Equity Affiliates* | |
| 2024 | | | | | | | | | | | |
| Consolidated operations | | | | | | | | | | | |
| Unproved property acquisition | $ | — | | 10,985 | | 10,985 | | — | | — | | — | | — | | — | | 10,985 | | — | | |
| Proved property acquisition | 297 | | 12,118 | | 12,415 | | (46) | | — | | — | | 1,100 | | — | | 13,469 | | — | | |
| 297 | | 23,103 | | 23,400 | | (46) | | — | | — | | 1,100 | | — | | 24,454 | | — | | |
| Exploration | 98 | | 548 | | 646 | | 239 | | 49 | | 46 | | 7 | | 1 | | 988 | | 18 | | |
| Development | 2,808 | | 6,301 | | 9,109 | | 390 | | 598 | | 354 | | 91 | | — | | 10,542 | | 323 | | |
| $ | 3,203 | | 29,952 | | 33,155 | | 583 | | 647 | | 400 | | 1,198 | | 1 | | 35,984 | | 341 | | |
| | | | | | | | | | | |
| | | | | | | | | | | |
| | | | | | | | | | | |
| | | | | | | | | | | |
| | | | | | | | | | | |
| | | | | | | | | | | |
| | | | | | | | | | | |
| | | | | | | | | | | |
| | | | | | | | | | | |
| 2023 | | | | | | | | | | | |
| Consolidated operations | | | | | | | | | | |
| Unproved property acquisition | $ | — | | 157 | | 157 | | 156 | | — | | — | | — | | — | | 313 | | — | | |
| Proved property acquisition | — | | 106 | | 106 | | 2,973 | | — | | — | | — | | — | | 3,079 | | — | | |
| — | | 263 | | 263 | | 3,129 | | — | | — | | — | | — | | 3,392 | | — | | |
| Exploration | 67 | | 396 | | 463 | | 144 | | 45 | | 49 | | 4 | | 3 | | 708 | | 46 | | |
| Development | 1,884 | | 6,266 | | 8,150 | | 367 | | 843 | | 383 | | 38 | | — | | 9,781 | | 416 | | |
| $ | 1,951 | | 6,925 | | 8,876 | | 3,640 | | 888 | | 432 | | 42 | | 3 | | 13,881 | | 462 | | |
| | | | | | | | | | | |
| | | | | | | | | | | |
| | | | | | | | | | | |
| | | | | | | | | | | |
| | | | | | | | | | | |
| | | | | | | | | | | |
| | | | | | | | | | | |
| | | | | | | | | | | |
| | | | | | | | | | | |
| 2022 | | | | | | | | | | | |
| Consolidated operations | | | | | | | | | | |
| Unproved property acquisition | $ | — | | 255 | | 255 | | — | | — | | — | | — | | — | | 255 | | — | | |
| Proved property acquisition | — | | 249 | | 249 | | — | | — | | — | | 104 | | — | | 353 | | 881 | | |
| — | | 504 | | 504 | | — | | — | | — | | 104 | | — | | 608 | | 881 | | |
| Exploration | 61 | | 1,278 | | 1,339 | | 99 | | 121 | | 59 | | 3 | | 2 | | 1,623 | | 25 | | |
| Development | 1,316 | | 4,559 | | 5,875 | | 475 | | 711 | | 425 | | 4 | | — | | 7,490 | | 244 | | |
| $ | 1,377 | | 6,341 | | 7,718 | | 574 | | 832 | | 484 | | 111 | | 2 | | 9,721 | | 1,150 | | |
| *All Equity Affiliate activity is located in our Asia Pacific/Middle East Region. |
| | | | | | | | | | | |
| | | | | | | | | | | |
| | | | | | | | | | | |
| | | | | | | | | | | |
| | | | | | | | | | | |
| | | | | | | | | | | |
| | | | | | | | | | | |
Capitalized Costs | | | | | | | | | | | | | | | | | | | | | | | | | | | | | | | | | |
| At December 31 | Millions of Dollars | | |
| Alaska | Lower
48 | Total
U.S. | Canada | Europe | Asia Pacific/
Middle East | Africa | Other
Areas | Total Consolidated Operations | Equity Affiliates* | |
| 2024 | | | | | | | | | | | |
| Consolidated operations | | | | | | | | | | | |
| Proved property | $ | 29,435 | | 88,461 | | 117,896 | | 10,904 | | 12,986 | | 11,274 | | 2,304 | | — | | 155,364 | | 11,691 | | |
| Unproved property | 107 | | 13,883 | | 13,990 | | 1,256 | | 41 | | 96 | | 97 | | 10 | | 15,490 | | 2,133 | | |
| 29,542 | | 102,344 | | 131,886 | | 12,160 | | 13,027 | | 11,370 | | 2,401 | | 10 | | 170,854 | | 13,824 | | |
| Accumulated depreciation, depletion and amortization | 13,946 | | 42,089 | | 56,035 | | 3,651 | | 9,412 | | 8,842 | | 575 | | 10 | | 78,525 | | 9,246 | | |
| $ | 15,596 | | 60,255 | | 75,851 | | 8,509 | | 3,615 | | 2,528 | | 1,826 | | — | | 92,329 | | 4,578 | | |
| | | | | | | | | | | |
| | | | | | | | | | | |
| | | | | | | | | | | |
| | | | | | | | | | | |
| | | | | | | | | | | |
| | | | | | | | | | | |
| | | | | | | | | | | |
| | | | | | | | | | | |
| 2023 | | | | | | | | | | | |
| Consolidated operations | | | | | | | | | | | |
| Proved property | $ | 26,358 | | 70,621 | | 96,979 | | 11,255 | | 14,124 | | 10,923 | | 1,113 | | — | | 134,394 | | 11,159 | | |
| Unproved property | 108 | | 3,393 | | 3,501 | | 1,443 | | 65 | | 90 | | 98 | | 9 | | 5,206 | | 2,263 | | |
| 26,466 | | 74,014 | | 100,480 | | 12,698 | | 14,189 | | 11,013 | | 1,211 | | 9 | | 139,600 | | 13,422 | | |
| Accumulated depreciation, depletion and amortization | 12,789 | | 36,829 | | 49,618 | | 3,377 | | 9,978 | | 8,423 | | 508 | | 9 | | 71,913 | | 8,779 | | |
| $ | 13,677 | | 37,185 | | 50,862 | | 9,321 | | 4,211 | | 2,590 | | 703 | | — | | 67,687 | | 4,643 | | |
| | | | | | | | | | | |
| | | | | | | | | | | |
| | | | | | | | | | | |
| | | | | | | | | | | |
| | | | | | | | | | | |
| | | | | | | | | | | |
| | | | | | | | | | | |
| *All Equity Affiliate activity is located in our Asia Pacific/Middle East Region. |
| | | | | |
| 155 | ConocoPhillips 2024 10-K |
Standardized Measure of Discounted Future Net Cash Flows Relating to Proved Oil and Gas Reserve Quantities
In accordance with SEC and FASB requirements, amounts were computed using 12-month average prices (adjusted only for existing contractual terms) and end-of-year costs, appropriate statutory tax rates and a prescribed 10 percent discount factor. Twelve-month average prices are calculated as the unweighted arithmetic average of the first-day-of-the-month price for each month within the 12-month period prior to the end of the reporting period. For all years, continuation of year-end economic conditions was assumed. The calculations were based on estimates of proved reserves, which are revised over time as new data becomes available. Probable or possible reserves, which may become proved in the future, were not considered. The calculations also require assumptions as to the timing of future production of proved reserves and the timing and amount of future development costs, including dismantlement, and future production costs, including taxes other than income taxes.
While due care was taken in its preparation, we do not represent that this data is the fair value of our oil and gas properties, or a fair estimate of the present value of cash flows to be obtained from their development and production.
Discounted Future Net Cash Flows
| | | | | | | | | | | | | | | | | | | | | | | | | | | | | | | | |
| Millions of Dollars |
| Alaska | Lower
48 | Total
U.S. | Canada | Europe | Asia Pacific/
Middle East | Africa | Total Consolidated Operations | Equity Affiliates* | Total |
| 2024 | | | | | | | | | | |
| | | | | | | | | | |
| Future cash inflows | $ | 79,396 | | 164,264 | | 243,660 | | 24,685 | | 18,148 | | 10,405 | | 26,592 | | 323,490 | | 51,975 | | 375,465 | |
| Less: | | | | | | | | | | |
| Future production costs | 39,861 | | 73,663 | | 113,524 | | 9,433 | | 5,924 | | 4,189 | | 2,678 | | 135,748 | | 29,807 | | 165,555 | |
| Future development costs | 12,766 | | 21,143 | | 33,909 | | 2,370 | | 3,611 | | 1,586 | | 693 | | 42,169 | | 3,234 | | 45,403 | |
| Future income tax provisions | 5,664 | | 13,098 | | 18,762 | | 1,886 | | 6,680 | | 1,131 | | 20,750 | | 49,209 | | 5,630 | | 54,839 | |
| Future net cash flows | 21,105 | | 56,360 | | 77,465 | | 10,996 | | 1,933 | | 3,499 | | 2,471 | | 96,364 | | 13,304 | | 109,668 | |
| 10 percent annual discount | 9,742 | | 17,667 | | 27,409 | | 4,217 | | 94 | | 1,087 | | 828 | | 33,635 | | 5,170 | | 38,805 | |
| Discounted future net cash flows | $ | 11,363 | | 38,693 | | 50,056 | | 6,779 | | 1,839 | | 2,412 | | 1,643 | | 62,729 | | 8,134 | | 70,863 | |
| *All Equity Affiliate activity is located in our Asia Pacific/Middle East Region. Total Discounted future net cash flows for Asia Pacific/Middle East was $10,546. |
|
|
| | | | | | | | | | |
| | | | | | | | | | |
| | | | | | | | | | |
| | | | | | | | | | |
| | | | | | | | | | |
| | | | | | | | | | |
| | | | | | | | | | |
| | | | | | | | | | |
| | | | | | | | | | |
| | | | | | | | | | |
| | | | | | | | | | |
| | | | | | | | | | |
| | | | | | | | | | | | | | | | | | | | | | | | | | | | | | | | |
| Millions of Dollars | | |
| Alaska | Lower
48** | Total
U.S. | Canada | Europe | Asia Pacific/
Middle East | Africa | Total Consolidated Operations | Equity Affiliates* | Total** |
| 2023 | | | | | | | | | | |
| | | | | | | | | | |
| Future cash inflows | $ | 83,793 | | 141,307 | | 225,100 | | 19,937 | | 23,569 | | 11,322 | | 21,562 | | 301,490 | | 51,887 | | 353,377 | |
| Less: | | | | | | | | | | |
| Future production costs | 39,069 | | 57,303 | | 96,372 | | 8,699 | | 6,576 | | 4,586 | | 1,008 | | 117,241 | | 28,579 | | 145,820 | |
| Future development costs | 13,685 | | 21,391 | | 35,076 | | 2,058 | | 3,802 | | 1,458 | | 400 | | 42,794 | | 2,299 | | 45,093 | |
| Future income tax provisions | 7,386 | | 12,451 | | 19,837 | | 880 | | 10,140 | | 1,316 | | 18,687 | | 50,860 | | 5,647 | | 56,507 | |
| Future net cash flows | 23,653 | | 50,162 | | 73,815 | | 8,300 | | 3,051 | | 3,962 | | 1,467 | | 90,595 | | 15,362 | | 105,957 | |
| 10 percent annual discount | 11,522 | | 16,850 | | 28,372 | | 2,723 | | 432 | | 1,257 | | 570 | | 33,354 | | 5,543 | | 38,897 | |
| Discounted future net cash flows | $ | 12,131 | | 33,312 | | 45,443 | | 5,577 | | 2,619 | | 2,705 | | 897 | | 57,241 | | 9,819 | | 67,060 | |
| *All Equity Affiliate activity is located in our Asia Pacific/Middle East Region. Total Discounted future net cash flows for Asia Pacific/Middle East was $12,524. |
| **Certain amounts in Lower 48 have been revised to reflect additional Future cash inflows and Future production costs. |
|
| | | | | | | | | | |
| | | | | | | | | | |
| | | | | | | | | | |
| | | | | | | | | | |
| | | | | | | | | | |
| | | | | | | | | | |
| | | | | | | | | | |
| | | | | | | | | | |
| | | | | | | | | | |
| | | | | | | | | | |
| | | | | | | | | | |
| | | | | | | | | | |
| | | | | | | | | | | | | | | | | | | | | | | | | | | | | | | | |
| Millions of Dollars | | |
| Alaska | Lower
48 | Total
U.S. | Canada | Europe | Asia Pacific/
Middle East | Africa | Total Consolidated Operations | Equity Affiliates* | Total |
| 2022 | | | | | | | | | | |
| | | | | | | | | | |
| Future cash inflows | $ | 94,332 | | 195,605 | | 289,937 | | 13,768 | | 44,942 | | 13,458 | | 27,067 | | 389,172 | | 87,644 | | 476,816 | |
| Less: | | | | | | | | | | |
| Future production costs | 47,979 | | 63,987 | | 111,966 | | 5,722 | | 7,559 | | 5,582 | | 1,085 | | 131,914 | | 51,912 | | 183,826 | |
| Future development costs | 8,501 | | 21,379 | | 29,880 | | 960 | | 4,378 | | 1,159 | | 531 | | 36,908 | | 2,685 | | 39,593 | |
| Future income tax provisions | 8,882 | | 23,136 | | 32,018 | | 863 | | 25,416 | | 1,780 | | 23,615 | | 83,692 | | 8,988 | | 92,680 | |
| Future net cash flows | 28,970 | | 87,103 | | 116,073 | | 6,223 | | 7,589 | | 4,937 | | 1,836 | | 136,658 | | 24,059 | | 160,717 | |
| 10 percent annual discount | 13,733 | | 31,191 | | 44,924 | | 1,936 | | 1,827 | | 1,505 | | 746 | | 50,938 | | 10,787 | | 61,725 | |
| Discounted future net cash flows | $ | 15,237 | | 55,912 | | 71,149 | | 4,287 | | 5,762 | | 3,432 | | 1,090 | | 85,720 | | 13,272 | | 98,992 | |
| *All Equity Affiliate activity is located in our Asia Pacific/Middle East Region. Total Discounted future net cash flows for Asia Pacific/Middle East was $16,704. |
|
| | | | | | | | | | |
| | | | | | | | | | |
| | | | | | | | | | |
| | | | | | | | | | |
| | | | | | | | | | |
| | | | | | | | | | |
| | | | | | | | | | |
| | | | | | | | | | |
| | | | | | | | | | |
| | | | | | | | | | |
| | | | | | | | | | |
| | | | | | | | | | |
| | | | | |
| ConocoPhillips 2024 10-K | 156 |
Sources of Change in Discounted Future Net Cash Flows
| | | | | | | | | | | | | | | | | | | | | | | | | | | | | | | | | | | |
| Millions of Dollars |
| Consolidated Operations | | Equity Affiliates | | Total Company |
| 2024 | 2023* | 2022 | | 2024 | 2023 | 2022 | | 2024 | 2023* | 2022 |
| Discounted future net cash flows at the beginning of the year | $ | 57,241 | | $ | 85,720 | | 52,695 | | | $ | 9,819 | | 13,272 | | 5,000 | | | $ | 67,060 | | 98,992 | | 57,695 | |
| Changes during the year | | | | | | | | | | | |
| Revenues less production costs for the year | (23,410) | | (23,706) | | (33,532) | | | (2,536) | | (2,550) | | (3,245) | | | (25,946) | | (26,256) | | (36,777) | |
| Net change in prices, and production costs | (10,025) | | (51,887) | | 61,902 | | | (941) | | (4,519) | | 8,184 | | | (10,966) | | (56,406) | | 70,086 | |
| Extensions, discoveries and improved recovery, less estimated future costs | (1,015) | | 1,751 | | 7,882 | | | 507 | | 118 | | 1,472 | | | (508) | | 1,869 | | 9,354 | |
| Development costs for the year | 10,197 | | 9,129 | | 6,687 | | | 402 | | 326 | | 272 | | | 10,599 | | 9,455 | | 6,959 | |
| Changes in estimated future development costs | (3,512) | | (6,754) | | (4,088) | | | (274) | | (150) | | 189 | | | (3,786) | | (6,904) | | (3,899) | |
| Purchases of reserves in place, less estimated future costs | 11,068 | | 3,024 | | 3,353 | | | — | | — | | 1,282 | | | 11,068 | | 3,024 | | 4,635 | |
| Sales of reserves in place, less estimated future costs | (113) | | (446) | | (3,847) | | | — | | — | | — | | | (113) | | (446) | | (3,847) | |
| Revisions of previous quantity estimates | 14,175 | | 9,047 | | 13,080 | | | 23 | | 492 | | 2,193 | | | 14,198 | | 9,539 | | 15,273 | |
| Accretion of discount | 8,137 | | 12,414 | | 7,021 | | | 1,199 | | 1,635 | | 616 | | | 9,336 | | 14,049 | | 7,637 | |
| Net change in income taxes | (14) | | 18,949 | | (25,433) | | | (65) | | 1,195 | | (2,691) | | | (79) | | 20,144 | | (28,124) | |
| Total changes | 5,488 | | (28,479) | | 33,025 | | | (1,685) | | (3,453) | | 8,272 | | | 3,803 | | (31,932) | | 41,297 | |
| Discounted future net cash flows at year end | $ | 62,729 | | $ | 57,241 | | 85,720 | | | $ | 8,134 | | 9,819 | | 13,272 | | | $ | 70,863 | | 67,060 | | 98,992 | |
| *Certain amounts in Consolidated Operations have been revised to reflect adjustments to the discounted future net cash flows. |
•The net change in prices and production costs is the beginning-of-year reserve-production forecast multiplied by the net annual change in the per-unit sales price and production cost, discounted at 10 percent.
•Purchases and sales of reserves in place, along with extensions, discoveries and improved recovery, are calculated using production forecasts of the applicable reserve quantities for the year multiplied by the 12-month average sales prices, less future estimated costs, discounted at 10 percent.
•Revisions of previous quantity estimates are calculated using production forecast changes for the year, including changes in the timing of production, multiplied by the 12-month average sales prices, less future estimated costs, discounted at 10 percent.
•The accretion of discount is 10 percent of the prior year’s discounted future cash inflows, less future production and development costs.
•The net change in income taxes is the annual change in the discounted future income tax provisions.
| | | | | |
| 157 | ConocoPhillips 2024 10-K |
Item 9. Changes in and Disagreements with Accountants on Accounting and Financial Disclosure
None.
Item 9A. Controls and Procedures
We maintain disclosure controls and procedures designed to ensure information required to be disclosed in reports we file or submit under the Securities Exchange Act of 1934, as amended (the Act), is recorded, processed, summarized and reported within the time periods specified in Securities and Exchange Commission rules and forms, and that such information is accumulated and communicated to management, including our principal executive and principal financial officers, as appropriate, to allow timely decisions regarding required disclosure. As of December 31, 2024, with the participation of our management, our Chairman and Chief Executive Officer (principal executive officer) and our Executive Vice President and Chief Financial Officer (principal financial officer) carried out an evaluation, pursuant to Rule 13a-15(b) of the Act, of ConocoPhillips’ disclosure controls and procedures (as defined in Rule 13a-15(e) of the Act). Based upon that evaluation, our Chairman and Chief Executive Officer and our Executive Vice President and Chief Financial Officer concluded our disclosure controls and procedures were operating effectively as of December 31, 2024.
In the third quarter of 2023, we began a multi-year implementation of an updated global enterprise resource planning system (ERP). As a result, we have made corresponding changes to our business processes and information systems, updating applicable internal controls over financial reporting where necessary. As the phased implementation of the ERP system progresses, we expect to continue to modify or change certain processes and procedures which may result in further changes to our internal controls over financial reporting.
There have been no other changes in our internal control over financial reporting, as defined in Rule 13a-15(f) of the Act, in the period covered by this report that have materially affected, or are reasonably likely to materially affect, our internal control over financial reporting.
Management’s Annual Report on Internal Control Over Financial Reporting
This report is included in Item 8 on page 71 and is incorporated herein by reference. Report of Independent Registered Public Accounting Firm
This report is included in Item 8 on page 72 and is incorporated herein by reference. Item 9B. Other Information
Insider Trading Arrangements
During the three-month period ended December 31, 2024, no officer or director of the company adopted or terminated any Rule 10b5-1 trading arrangement or non-Rule 10b5-1 trading arrangement.
Item 9C. Disclosure Regarding Foreign Jurisdictions that Prevent Inspections
Not applicable.
| | | | | |
| ConocoPhillips 2024 10-K | 158 |
Part III
Item 10. Directors, Executive Officers and Corporate Governance
Information regarding our executive officers appears in Part I of this report on page 30. Code of Business Ethics and Conduct for Directors and Employees
We have a Code of Business Ethics and Conduct for Directors and Employees (Code of Ethics), including our principal executive officer, principal financial officer, principal accounting officer and persons performing similar functions. We have posted a copy of our Code of Ethics on the “Corporate Governance” section of our internet website at www.conocophillips.com (within the Investors>Corporate Governance section). Any waivers of the Code of Ethics must be approved, in advance, by our full Board of Directors. Any amendments to, or waivers from, the Code of Ethics that apply to our executive officers and directors will be posted on the “Corporate Governance” section of our internet website.
Insider Trading Policies and Procedures
We have adopted insider trading policies and procedures governing the purchase, sale and/or other dispositions of our securities by directors, officers and other personnel employed by us or any of our subsidiaries. All personnel are responsible for ensuring their “Related Parties” (as defined in the policies) comply as well. We have an additional insider trading policy that applies only to our directors, Section 16 officers and other designated officers and employees. We believe our insider trading policies are reasonably designed to promote compliance with insider trading laws, rules and regulations, the listing standards of the NYSE and Section 16 reporting requirements, as applicable.
All other information required by Item 10 of Part III will be included in our Proxy Statement relating to our 2025 Annual Meeting of Stockholders, to be filed pursuant to Regulation 14A on or before April 30, 2025, and is incorporated herein by reference.*
Item 11. Executive Compensation
Information required by Item 11 of Part III will be included in our Proxy Statement relating to our 2025 Annual Meeting of Stockholders, to be filed pursuant to Regulation 14A on or before April 30, 2025, and is incorporated herein by reference.*
Item 12. Security Ownership of Certain Beneficial Owners and Management and Related Stockholder Matters
Information required by Item 12 of Part III will be included in our Proxy Statement relating to our 2025 Annual Meeting of Stockholders, to be filed pursuant to Regulation 14A on or before April 30, 2025, and is incorporated herein by reference.*
Item 13. Certain Relationships and Related Transactions, and Director Independence
Information required by Item 13 of Part III will be included in our Proxy Statement relating to our 2025 Annual Meeting of Stockholders, to be filed pursuant to Regulation 14A on or before April 30, 2025, and is incorporated herein by reference.*
Item 14. Principal Accounting Fees and Services
Information required by Item 14 of Part III will be included in our Proxy Statement relating to our 2025 Annual Meeting of Stockholders, to be filed pursuant to Regulation 14A on or before April 30, 2025, and is incorporated herein by reference.*
_________________________
* Except for information or data specifically incorporated herein by reference under Items 10 through 14, other information and data appearing in our 2025 Proxy Statement are not deemed to be a part of this Annual Report on Form 10-K or deemed to be filed with the Commission as a part of this report.
| | | | | |
| 159 | ConocoPhillips 2024 10-K |
Part IV
Item 15. Exhibits, Financial Statement Schedules
(a)1. Financial Statements and Supplementary Data
The financial statements and supplementary information listed in the Index to Financial Statements, which appears on page 70, are filed as part of this annual report. 2. Financial Statement Schedules
All financial statement schedules are omitted because they are not required, not significant, not applicable or the information is shown in another schedule, the financial statements or the notes to consolidated financial statements.
3. Exhibits
The exhibits listed in the Index to Exhibits, which appears on pages 161 through 164, are filed as part of this annual report. | | | | | |
| ConocoPhillips 2024 10-K | 160 |
ConocoPhillips
Index to Exhibits
| | | | | | | | | | | | | | |
| | Incorporated by Reference |
Exhibit
No. | Description | Exhibit | Form | File No. |
| 2.1 | | 2.1 | 8-K | 001-32395 |
| | | | |
| 2.2†‡ | | 2.1 | 10-Q | 001-32395 |
| | | | |
| 2.3†‡ | | 2.2 | 8-K | 001-32395 |
| | | | |
| 2.4 | | 2.1 | 8-K | 001-32395 |
| | | | |
| 2.5 | | 2.1 | 8-K | 001-32395 |
| | | | |
| 3.1 | | 3.1 | 10-Q | 001-32395 |
| | | | |
| 3.2 | | 3.2 | 8-K | 000-49987 |
| | | | |
| | | | |
| | | | |
| 3.3 | | 3.4 | 10-K | 001-32395 |
| | | | |
| 3.4 | | 3.1 | 10-Q | 001-32395 |
| | | | |
| ConocoPhillips and its subsidiaries are parties to several debt instruments under which the total amount of securities authorized does not exceed 10 percent of the total assets of ConocoPhillips and its subsidiaries on a consolidated basis. Pursuant to paragraph 4(iii)(A) of Item 601(b) of Regulation S-K, ConocoPhillips agrees to furnish a copy of such instruments to the SEC upon request. | | | |
| | | | |
| 4.1 | | 4.1 | 10-K | 001-32395 |
| | | | |
| 10.1 | | 10.1 | 8-K | 001-32395 |
| | | | |
| 10.2 | | 10.2 | 8-K | 001-32395 |
| | | | |
| 10.3 | | 10.3 | 8-K | 001-32395 |
| | | | |
| 10.4 | | 10.4 | 8-K | 001-32395 |
| | | | |
| 10.5.1 | | 10.17.3 | 10-K | 001-32395 |
| | | | |
| 10.5.2 | | 10.17.4 | 10-K | 001-32395 |
| | | | |
| 10.5.3 | | 10.17.5 | 10-K | 001-32395 |
| | | | |
| | | | | |
| 161 | ConocoPhillips 2024 10-K |
| | | | | | | | | | | | | | |
| 10.5.4 | | 10.17.6 | 10-K | 001-32395 |
| | | | |
| 10.5.5 | | 10.17.7 | 10-K | 001-32395 |
| | | | |
| 10.5.6 | | 10.17.8 | 10-K | 001-32395 |
| | | | |
| 10.6.1 | | 10.1 | 10-Q | 001-32395 |
| | | | |
| 10.6.2 | | 10.2 | 10-Q | 001-32395 |
| | | | |
| 10.7 | | 10.19 | 10-K | 004-49987 |
| | | | |
| 10.8 | | 10.26 | 10-K | 000-49987 |
| | | | |
| 10.9.1 | | Schedule 14A | Proxy | 000-49987 |
| | | | |
| 10.9.2 | | 10.27 | 10-K | 001-32395 |
| | | | |
| 10.10 | | 10.30 | 10-K | 001-32395 |
| | | | |
| 10.11 | | Schedule 14A | Proxy | 001-32395 |
| | | | |
| 10.12.1 | | Schedule 14A | Proxy | 001-32395 |
| | | | |
| 10.12.2 | | 10.26.6 | 10-K | 001-32395 |
| | | | |
| 10.12.3 | | 10.1 | 10-Q | 001-32395 |
| | | | |
| 10.12.4 | | 10.3 | 10-Q | 001-32395 |
| | | | |
| 10.12.5 | | 10.5 | 10-Q | 001-32395 |
| | | | |
| 10.13.1 | | 10.1 | 8-K | 001-32395 |
| | | | |
| 10.13.2 | | 10.26.12 | 10-K | 001-32395 |
| | | | |
| 10.13.3 | | 10.26.24 | 10-K | 001-32395 |
| | | | |
| | | | | |
| ConocoPhillips 2024 10-K | 162 |
| | | | | | | | | | | | | | |
| 10.13.4 | | 10.1 | 10-Q | 001-32395 |
| | | | |
| 10.13.5 | | 10.1 | 10-Q | 001-32395 |
| | | | |
| 10.14.1 | | 10.1 | 8-K | 001-32395 |
| | | | |
| 10.14.2 | | 10.1 | 10-Q | 001-32395 |
| | | | |
| 10.14.3 | | 10.2 | 10-Q | 001-32395 |
| | | | |
| 10.14.4 | | 10.3 | 10-Q | 001-32395 |
| | | | |
| 10.14.5 | | 10.4 | 10-Q | 001-32395 |
| | | | |
| 10.14.6* | | | | |
| | | | |
| 10.14.7* | | | | |
| | | | |
| 10.15 | | 10.10.1 | 10-K | 001-32395 |
| | | | |
| 10.16.1 | | 10.11.1 | 10-K | 001-32395 |
| | | | |
| 10.16.2 | | 10.16.2 | 10-K | 001-32395 |
| | | | |
| 10.17 | | 10.17 | 10-K | 001-32395 |
| | | | |
| 10.18.1 | | 10.19.1 | 10-K | 001-32395 |
| | | | |
| 10.18.2 | | 10.18.2 | 10-K | 001-32395 |
| | | | |
| 10.19 | | 10.20.1 | 10-K | 001-32395 |
| | | | |
| 10.20.1 | | 10.3 | 10-Q | 001-32395 |
| | | | |
| 10.20.2* | | | | |
| | | | |
| | | | | |
| 163 | ConocoPhillips 2024 10-K |
| | | | | | | | | | | | | | |
| 10.21 | | 10.17 | 10-K | 001-32395 |
| | | | |
| 10.22.1 | | 10.40 | 10-K | 000-49987 |
| | | | |
| 10.22.2 | | 10 | 10-Q | 001-32395 |
| | | | |
| 10.23 | | 10.27 | 10-K | 001-32395 |
| | | | |
| 10.24 | | 10.47 | 10-K | 001-32395 |
| | | | |
| 10.25 | | 10.9 | 10-Q | 001-32395 |
| | | | |
| 10.26 | | 10.1 | 10-Q | 001-32395 |
| | | | |
| 10.27 | | 10.2 | 10-Q | 001-32395 |
| | | | |
| | | | |
| | | | |
| | | | |
| | | | |
| 10.28 | | 10.1 | 10-Q | 001-32395 |
| | | | |
| 10.29 | | 10.29 | 10-K | 001-32395 |
| | | | |
| | | | |
| | | | |
| 19* | | | | |
| | | | |
| 21* | | | | |
| | | | |
| 22* | | | | |
| | | | |
| 23.1* | | | | |
| | | | |
| 23.2* | | | | |
| | | | |
| | | | |
| | | | |
| 31.1* | | | | |
| | | | |
| 31.2* | | | | |
| | | | |
| 32** | | | | |
| | | | |
| 97 | | 97.2 | 10-K | 001-32395 |
| | | | |
| 99* | | | | |
| | | | |
| 101.INS* | Inline XBRL Instance Document. | | | |
| | | | |
| 101.SCH* | Inline XBRL Schema Document. | | | |
| | | | |
| 101.CAL* | Inline XBRL Calculation Linkbase Document. | | | |
| | | | |
| 101.DEF* | Inline XBRL Definition Linkbase Document. | | | |
| | | | |
| 101.LAB* | Inline XBRL Labels Linkbase Document. | | | |
| | | | |
| 101.PRE* | Inline XBRL Presentation Linkbase Document. | | | |
| | | | |
| 104* | Cover Page Interactive Data File (formatted as Inline XBRL and contained in Exhibit 101). |
* Filed herewith.
**Furnished herewith.
† The schedules to this exhibit have been omitted pursuant to Item 601(b)(2) of Regulation S-K. ConocoPhillips agrees to furnish a copy of any schedule omitted from this exhibit to the SEC upon request.
‡ ConocoPhillips has previously been granted confidential treatment for certain portions of this exhibit pursuant to Rule 24b-2 under the Securities Exchange Act of 1934, as amended.
| | | | | |
| ConocoPhillips 2024 10-K | 164 |
Signature
Pursuant to the requirements of Section 13 or 15(d) of the Securities Exchange Act of 1934, the registrant has duly caused this report to be signed on its behalf by the undersigned, thereunto duly authorized.
| | | | | |
| CONOCOPHILLIPS |
| |
| |
| |
| February 18, 2025 | /s/ Ryan M. Lance |
| Ryan M. Lance Chairman of the Board of Directors and Chief Executive Officer |
Pursuant to the requirements of the Securities Exchange Act of 1934, this report has been signed, as of February 18, 2025, on behalf of the registrant by the following officers in the capacity indicated and by a majority of directors.
| | | | | | | | |
| Signature | | Title |
| | |
| | |
| /s/ Ryan M. Lance | | Chairman of the Board of Directors |
| Ryan M. Lance | | and Chief Executive Officer |
| | (Principal executive officer) |
| | |
| | |
| /s/ William L. Bullock, Jr. | | Executive Vice President and |
| William L. Bullock, Jr. | | Chief Financial Officer |
| | (Principal financial officer) |
| | |
| | |
| /s/ Christopher P. Delk | | Vice President, Controller |
| Christopher P. Delk | | and General Tax Counsel |
| | (Principal accounting officer) |
| | | | | |
| 165 | ConocoPhillips 2024 10-K |
| | | | | | | | |
| /s/ Dennis V. Arriola | | Director |
| Dennis V. Arriola | | |
| | |
| | |
| /s/ Nelda J. Connors | | Director |
| Nelda J. Connors | | |
| | |
| | |
| /s/ Gay Huey Evans | | Director |
| Gay Huey Evans | | |
| | |
| | |
| | |
| | |
| | |
| | |
| /s/ Jeffrey A. Joerres | | Director |
| Jeffrey A. Joerres | | |
| | |
| | |
| /s/ Timothy A. Leach | | Director |
| Timothy A. Leach | | |
| | |
| | |
| /s/ William H. McRaven | | Director |
| William H. McRaven | | |
| | |
| | |
| /s/ Sharmila Mulligan | | Director |
| Sharmila Mulligan | | |
| | |
| | |
| | |
| | |
| | |
| | |
| /s/ Arjun N. Murti | | Director |
| Arjun N. Murti | | |
| | |
| | |
| /s/ Robert A. Niblock | | Director |
| Robert A. Niblock | | |
| | |
| | |
| /s/ David T. Seaton | | Director |
| David T. Seaton | | |
| | |
| | |
| /s/ R.A. Walker | | Director |
| R.A. Walker | | |
| | | | | |
| ConocoPhillips 2024 10-K | 166 |