Our business depends on the creditworthiness of our customers and their ability to fulfill their obligations to us. We maintain a consolidated allowance for loan losses on finance receivables that reflects management’s judgment of losses inherent in the portfolio. We regularly review our consolidated allowance for adequacy considering economic conditions and trends, collateral values, and credit quality indicators, including past charge-off experience and levels of past due loans, past due loan migration trends, and non-performing assets. Our credit losses were significantly more severe from 2007 to 2009 than in prior economic downturns, due to a significant decline in real estate values, an increase in the proportion of cash flow loans versus asset based loans in our corporate finance segment, the limited ability of borrowers to restructure their liabilities or their business, and reduced values of the collateral underlying the loans.
While our portfolio credit quality improved since mid-2010, the economic environment is dynamic, and our portfolio credit quality could decline in the future. Our allowance for loan losses may not keep pace with changes in the credit-worthiness of our customers or in collateral values. If the credit quality of our customer base declines, if the risk profile of a market, industry, or group of customers changes significantly, or if the markets for accounts receivable, equipment, real estate, or other collateral deteriorates significantly, our allowance for loan losses may prove inadequate, which could have a material adverse effect on our business, results of operations, and financial condition.
In addition to customer credit risk associated with loans and leases, we are exposed to other forms of credit risk, including counterparties to our derivative transactions, loan sales, syndications and equipment purchases. These counterparties include other financial institutions, manufacturers, and our customers. If our credit underwriting processes or credit risk judgments fail to adequately identify or assess such risks, or if the credit quality of our derivative counterparties, customers, manufacturers, or other parties with which we conduct business materially deteriorates, we may be exposed to credit risk related losses that may negatively impact our financial condition, results of operations or cash flows.
Our business depends upon our customers believing that we will be able to provide them with funding on a timely basis through a wide range of products. Many of our customers rely upon our funding to provide them with the working capital necessary to operate their business or to fund capital improvements that allow them to maintain or expand their business. In many instances, these funding requirements are time sensitive. If our customers are uncertain as to our ability to continue to provide them with funding on a timely basis or to provide the same breadth and quality of products, we may be unable to attract new customers and we may experience lower business volume or a loss of business with our existing customers.
As part of our strategy and business plan, we may consider a number of measures designed to manage our business, the products and services we offer, and our asset levels, credit exposures, or liquidity position, including potential business or asset acquisitions or sales. There can be no assurance that we will be successful in completing all or any of these transactions.
If CIT engages in business acquisitions, it may be necessary to pay a premium over book and market values to complete the transaction, which may result in some dilution of our tangible book value and net income per common share. If CIT uses substantial cash or other liquid assets or incurs substantial debt to acquire a business or assets, we could become more susceptible to economic downturns and competitive pressures. Inherent uncertainties exist when integrating the operations of an acquired entity. CIT may not be able to fully achieve its strategic objectives and planned operating efficiencies in an acquisition. CIT may also be exposed to other risks inherent in an acquisition, including potential exposure to unknown or contingent liabilities, exposure to potential asset quality issues, potential disruption of our existing business and diversion of management’s time and attention, possible loss of key employees or customers of the acquired business, potential risk that certain items were not accounted for properly by the seller in accordance with financial accounting and reporting standards. Failure to realize the expected revenue increases, cost savings, increases in geographic or product presence, and/or other projected benefits from an acquisition could have a material adverse effect on our business, financial condition, and results of operations.
As a result of economic cycles and other factors, the value of certain asset classes may fluctuate and decline below their historic cost. If CIT is holding such businesses or asset classes, we may not recover our carrying value if we sell such businesses or assets. In addition, potential purchasers may be unwilling to pay an amount equal to the face value of a loan or lease if the purchaser is concerned about the quality of the Company’s credit underwriting. There is no assurance that we will receive adequate consideration for any dispositions. These transactions, if completed, may reduce the size of our business and we may not be able to replace the volume associated with these businesses. As a result, our future disposition of assets could have a material adverse effect on our business, financial condition and results of operations.
Under the terms of the Written Agreement, we are restricted from declaring dividends on our common stock or repurchasing our common stock without prior written approval of the FRBNY. We are not currently paying dividends on our common stock and have not repurchased any common stock since our emergence from bankruptcy. Even when the Written Agreement is
CIT ANNUAL REPORT 2012 23
terminated, we may still require regulatory approval to pay dividends on our common stock or repurchase our common stock, and we cannot determine when, if ever, we will be permitted to do so. Although we recently submitted our 2013 capital plan to the Federal Reserve, which included a modest return of capital, we cannot determine whether the Federal Reserve will object to such capital return.
Uncertainties related to our business may create a distraction for employees and may otherwise materially adversely affect our ability to retain existing employees and/or attract new employees.
Our future results of operations will depend in part upon our ability to retain existing highly skilled and qualified employees and to attract new and retain qualified executive officers and management, financial, technical, marketing, sales, and support employees. Competition for qualified executive officers and employees is intense, and CIT cannot ensure success in attracting or retaining such individuals. If we fail to attract and retain qualified executive officers and employees, it could materially adversely affect our ability to compete and it could have a material adverse effect on our ability to successfully operate our business or to meet our operations, risk management, compliance, regulatory, funding and financial reporting requirements.
We may not be able to realize our entire investment in the equipment we lease to our customers.
The realization of equipment values (residual values) during the life and at the end of the term of a lease is an important element in the leasing business. At the inception of each lease, we record a residual value for the leased equipment based on our estimate of the future value of the equipment at the expected disposition date. Internal equipment management specialists, as well as external consultants, determine residual values.
If the market value of leased equipment decreases at a rate greater than we projected, whether due to rapid technological or economic obsolescence, unusual wear and tear on the equipment, excessive use of the equipment, recession or other adverse economic conditions, or other factors, it would adversely affect the current values or the residual values of such equipment.
Further, certain equipment residual values, including commercial aerospace residuals, are dependent on the manufacturers’ or vendors’ warranties, reputation, and other factors, including market liquidity. In addition, we may not realize the full market value of equipment if we are required to sell it to meet liquidity needs or for other reasons outside of the ordinary course of business. Consequently, there can be no assurance that we will realize our estimated residual values for equipment.
The degree of residual realization risk varies by transaction type. Capital leases bear the least risk because contractual payments cover approximately 90% of the equipment’s cost at the inception of the lease. Operating leases have a higher degree of risk because a smaller percentage of the equipment’s value is covered by contractual cash flows over the term of the lease. Leveraged leases bear the highest level of risk as third parties have a priority claim on equipment cash flows. A significant portion of our leasing portfolios are comprised of operating leases, and a small portion is comprised of leveraged leases, both of which increase our residual realization risk.
We are currently involved, and may from time to time in the future be involved, in a number of judicial, regulatory, and arbitration proceedings related to the conduct of our business, the results of which could have a material adverse effect on our business, financial condition, or results of operation.
We are currently involved, and from time to time in the future may be involved, in a number of judicial, regulatory, and arbitration proceedings relating to matters that arise in connection with the conduct of our business (collectively, “Litigation”). It is inherently difficult to predict the outcome of Litigation matters, particularly when such matters are in their early stages or where the claimants seek indeterminate damages. We cannot state with certainty what the eventual outcome of the pending Litigation will be, what the timing of the ultimate resolution of these matters will be, or what the eventual loss, fines, or penalties related to each pending matter will be, if any. Although we have established reserves for certain matters, the actual results of resolving such matters may be substantially higher than the amounts reserved, or judgments may be rendered, or fines or penalties assessed in matters for which we have no reserves. Adverse judgments, fines or penalties in one or more Litigation matters could have a material adverse effect on our business, financial condition, or results of operation.
We and our subsidiaries are party to various financing arrangements, commercial contracts and other arrangements that under certain circumstances give, or in some cases may give, the counterparty the ability to exercise rights and remedies under such arrangements which, if exercised, may have material adverse consequences.
We and our subsidiaries are party to various financing arrangements, commercial contracts and other arrangements, such as securitization transactions, derivatives transactions, funding facilities, and agreements for the purchase or sale of assets, that give, or in some cases may give, the counterparty the ability to exercise rights and remedies upon the occurrence of certain events. Such events may include a material adverse effect or material adverse change (or similar event), a breach of representations or warranties, a failure to disclose material information, a breach of covenants, certain insolvency events, a default under certain specified other obligations, or a failure to comply with certain financial covenants. The counterparty could have the ability, depending on the arrangement, to, among other things, require early repayment of amounts owed by us or our subsidiaries and in some cases payment of penalty amounts, or require the repurchase of assets previously sold to the counterparty. Additionally, a default under financing arrangements or derivatives transactions that exceed a certain size threshold in the aggregate may also cause a cross-default under instruments governing our other financing arrangements or derivatives transactions. If the ability of any counterparty to exercise such rights and remedies is triggered and we are unsuccessful in avoiding or minimizing the adverse consequences discussed above, such consequences could have a material adverse effect on our business, results of operations, and financial condition.
For example, in 2008, we entered into a purchase agreement (the “Purchase Agreement”) to sell our home lending business, including the related residential mortgage loan portfolio and mortgage backed securities, to a company created by a private
Item 1A: Risk Factors
24 CIT ANNUAL REPORT 2012
equity fund for the purpose of entering into the Purchase Agreement (the “Purchaser”). Prior to the sale of our home lending business to the Purchaser, we periodically had securitized a portion of the residential mortgage loans that we originated, and we sold residential mortgage loans or residential mortgage backed securities to Government Sponsored Entities, monoline home lenders, and investors. Pursuant to the Purchase Agreement with the Purchaser, we made certain representations and warranties regarding the business and portfolio, nearly all of which have since expired. In addition, the Purchaser agreed to assume all repurchase obligations for residential mortgage loans under the securitization and loan sale agreements entered into prior to the Purchase Agreement and scheduled as part of the Purchase Agreement.
The Purchaser has not given any indication that it has been subject to significant repurchase obligations or that it does not intend to honor its agreement to assume such repurchase obligations. However, if the Purchaser is subject to repurchase obligations and is unable or unwilling to accept responsibility for such repurchase obligations, and particularly if the Purchaser does not have sufficient capital to address such repurchase obligations, then we may become subject to claims under such repurchase obligations. If we become responsible for such repurchase obligations to third parties, it may have a material adverse effect on our results of operations and financial condition.
Adverse or volatile market conditions could continue to negatively impact fees and other income.
A portion of our revenue base is generated through loan syndication fees and participation income, advisory fees, servicing fees, and other types of fee income, which are recorded in other income. In addition, we also generate significant fee income from our factoring business. These revenue streams are dependent on market conditions and the confidence of clients, customers, and syndication partners in our ability to perform our obligations, and, therefore, are more volatile than interest payments on loans and rentals on leased equipment. Current market conditions, including lower liquidity levels in the syndication market, have significantly reduced our syndication activity, and have resulted in significantly lower fee income. In addition, if our clients, customers, or syndication partners become concerned about our ability to meet our obligations on a transaction, it may become more difficult for us to originate new transactions, to syndicate transactions that we originate, or to participate in syndicated transactions originated by others, which could further negatively impact our fee income and have a material adverse effect on our business. If we are unable to sell or syndicate a transaction after it is originated, we will end up holding a larger portion of the transaction and assume greater underwriting risk than we originally intended, which could increase our capital and liquidity requirements to support our business or expose us to the risk of valuation allowances for assets held for sale. If the capital markets are disrupted or if we otherwise fail to produce increased fees and other income, it could adversely affect our financial condition and results of operations.
Investment in and revenues from our foreign operations are subject to various risks and requirements associated with transacting business in foreign countries.
An economic recession or downturn, increased competition, or business disruption associated with the political or regulatory environments in the international markets in which we operate could adversely affect us.
In addition, our foreign operations generally conduct business in foreign currencies, which subject us to foreign currency exchange rate fluctuations. These exposures, if not effectively hedged could have a material adverse effect on our investment in international operations and the level of international revenues that we generate from international financing and leasing transactions. Reported results from our operations in foreign countries may fluctuate from period to period due to exchange rate movements in relation to the U.S. dollar, particularly exchange rate movements in the Canadian dollar, which is our largest non-U.S. exposure.
Foreign countries have various compliance requirements for financial statement audits and tax filings, which are required in order to obtain and maintain licenses to transact business. If we are unable to properly complete and file our statutory audit reports or tax filings, regulators or tax authorities in the applicable jurisdiction may restrict our ability to do business.
Furthermore, our international operations could expose us to trade and economic sanctions or other restrictions imposed by the United States or other governments or organizations. The U.S. Department of Justice (“DOJ”) and other federal agencies and authorities have a broad range of civil and criminal penalties they may seek to impose against corporations and individuals for violations of trade sanctions laws, the Foreign Corrupt Practices Act (“FCPA”) and other federal statutes. Under trade sanctions laws, the government may seek to impose modifications to business practices, including cessation of business activities in sanctioned countries, and modifications to compliance programs, which may increase compliance costs, and may subject us to fines, penalties and other sanctions. If any of the risks described above materialize, it could adversely impact our operating results and financial condition.
These laws also prohibit improper payments or offers of payments to foreign governments and their officials and political parties for the purpose of obtaining or retaining business. We have operations, deal with government entities and have contracts in countries known to experience corruption. Our activities in these countries create the risk of unauthorized payments or offers of payments by one of our employees, consultants, sales agents, or associates that could be in violation of various laws, including the FCPA, even though these parties are not always subject to our control. Our existing safeguards and procedures may prove to be less than fully effective, and our employees, consultants, sales agents, or associates may engage in conduct for which we may be held responsible. Violations of the FCPA may result in severe criminal or civil sanctions, and we may be subject to other liabilities, which could negatively affect our business, operating results, and financial condition.
CIT ANNUAL REPORT 2012 25
We may be adversely affected by significant changes in interest rates.
In addition to our equity capital, we rely on borrowed money from unsecured debt, secured debt, and deposits to fund our business. We derive the bulk of our income from net finance revenue, which is the difference between interest and rental income on our financing and leasing assets and interest expense on deposits and other borrowing and depreciation on our operating lease equipment. Prevailing economic conditions, the trade, fiscal, and monetary policies of the federal government and the policies of various regulatory agencies all affect market rates of interest and the availability and cost of credit, which in turn significantly affects our net finance revenue. Volatility in interest rates can also result in disintermediation, which is the flow of funds away from financial institutions into direct investments, such as federal government and corporate securities and other investment vehicles, which, because of the absence of federal insurance premiums and reserve requirements, generally pay higher rates of return than financial institutions.
Although interest rates are currently lower than usual, as interest rates rise and fall over time, any significant decrease in market interest rates may result in a change in net interest margins. A substantial portion of our loans and other financing products, as well as our deposits and other borrowings, bear interest at floating interest rates. If interest rates increase, monthly interest obligations owed by our customers to us will also increase, as will our own interest expense. Demand for our loans or other financing products may decrease as interest rates rise or if interest rates are expected to rise in the future. In addition, if prevailing interest rates increase, some of our customers may not be able to make the increased interest payments or refinance their balloon and bullet payment transactions, resulting in payment defaults and loan impairments. Conversely, if interest rates remain low, our interest expense may decrease, but our customers may refinance the loans they have with us at lower interest rates, or with others, leading to lower revenues. As interest rates rise and fall over time, any significant change in market rates may result in a decrease in net finance revenue, particularly if the interest rates we pay on our deposits and other borrowings and the interest rates we charge our customers do not change in unison, which may have a material adverse effect on our business, operating results, and financial condition.
We may be adversely affected by deterioration in economic conditions that is general in scope or affects specific industries, products or geographic areas.
Prolonged economic weakness, or other adverse economic or financial developments in the U.S. or global economies in general, or affecting specific industries, geographic locations and/or products, would likely impact credit quality as borrowers may fail to meet their debt payment obligations, particularly customers with highly leveraged loans. Adverse economic conditions have in the past and could in the future result in declines in collateral values, which also decreases our ability to fund against collateral. Accordingly, higher credit and collateral related losses could impact our financial position or operating results.
In addition, a downturn in certain industries may result in reduced demand for products that we finance in that industry or negatively impact collection and asset recovery efforts. Decreased demand for the products of various manufacturing customers due to recession may adversely affect their ability to repay their loans and leases with us. Similarly, a decrease in the level of airline passenger traffic or a decline in railroad shipping volumes due to reduced demand for certain raw materials or bulk products may adversely affect our aerospace or rail businesses, the value of our aircraft and rail assets, and the ability of our lessees to make lease payments.
We are also affected by the economic and other policies adopted by various governmental authorities in the U.S. and other jurisdictions in reaction to economic conditions. Changes in monetary policies of the Federal Reserve and non-U.S. central banking authorities directly impact our cost of funds for lending, capital raising, and investment activities, and may impact the value of financial instruments we hold. In addition, such changes may affect the credit quality of our customers. Changes in domestic and international monetary policies are beyond our control and difficult to predict.
Competition from both traditional competitors and new market entrants may adversely affect our market share, profitability, and returns.
Our markets are highly competitive and are characterized by competitive factors that vary based upon product and geographic region. We have a wide variety of competitors that include captive and independent finance companies, commercial banks and thrift institutions, industrial banks, community banks, leasing companies, hedge funds, insurance companies, mortgage companies, manufacturers and vendors.
We compete primarily on the basis of pricing, terms and structure. If we are unable to match our competitors’ terms, we could lose market share. Should we match competitors’ terms, it is possible that we could experience lower returns and/or increased losses.
We rely on our systems, employees, and certain third party vendors and service providers in conducting our operations, and certain failures, including internal or external fraud, operational errors, systems malfunctions, or cybersecurity incidents, could materially adversely affect our operations.
We are exposed to many types of operational risk, including the risk of fraud by employees and outsiders, clerical and recordkeeping errors, and computer or telecommunications systems malfunctions. Our businesses depend on our ability to process a large number of increasingly complex transactions. If any of our operational, accounting, or other data processing systems fail or have other significant shortcomings, we could be materially adversely affected. We are similarly dependent on our employees. We could be materially adversely affected if one of our employees causes a significant operational break-down or failure, either as a result of human error or intentional sabotage or fraudulent manipulation of our operations or systems. Third parties with which we do business, including vendors that provide services or security solutions for our operations, could also be sources of operational and information security risk to us, including from breakdowns, failures, or capacity constraints of their own systems or employees. Any of these occurrences could diminish our ability to operate one or more of our businesses, or cause financial loss, potential liability to clients, inability to secure
Item 1A: Risk Factors
26 CIT ANNUAL REPORT 2012
insurance, reputational damage, or regulatory intervention, which could materially adversely affect us.
We may also be subject to disruptions of our operating systems arising from events that are wholly or partially beyond our control, which may include, for example, electrical or telecommunications outages, natural or man-made disasters, such as earthquakes, hurricanes, floods, or tornados, disease pandemics, or events arising from local or regional politics, including terrorist acts. Such disruptions may give rise to losses in service to clients and loss or liability to us. In addition, there is the risk that our controls and procedures as well as business continuity and data security systems prove to be inadequate. The computer systems and network systems we and others use could be vulnerable to unforeseen problems. These problems may arise in both our internally developed systems and the systems of third-party service providers. In addition, our computer systems and network infrastructure present security risks, and could be susceptible to hacking, computer viruses, or identity theft. Any such failure could affect our operations and could materially adversely affect our results of operations by requiring us to expend significant resources to correct the defect, as well as by exposing us to litigation or losses not covered by insurance. Although we have business continuity plans and other safeguards in place, our business operations may be adversely affected by significant and widespread disruption to our physical infrastructure or operating systems that support our businesses and customers.
Information security risks for large financial institutions such as CIT have generally increased in recent years in part because of the proliferation of new technologies, the use of the Internet and telecommunications technologies to conduct financial transactions, and the increased sophistication and activities of organized crime, hackers, terrorists, activists, and other external parties. Our operations rely on the secure processing, transmission and storage of confidential information in our computer systems and networks. Our businesses rely on our digital technologies, computer and email systems, software, and networks to conduct their operations. Although we believe we have robust information security procedures and controls, our technologies, systems, networks, and our customers’ devices may become the target of cyber attacks or information security breaches that could result in the unauthorized release, gathering, monitoring, misuse, loss or destruction of CIT’s or our customers’ confidential, proprietary and other information, or otherwise disrupt CIT’s or its customers’ or other third parties’ business operations.
Since January 1, 2010, we have not experienced any material information security breaches involving either proprietary or customer information. However, in two instances, data on consumer accounts serviced by a third party provider, including certain customers of the Company, were taken by insiders of the third party provider without authorization. In both instances, the suspects were identified, the data was recovered, and there was no damage to either the Company or the customers. Although to date neither the Company nor our customers has experienced any material losses relating to cyber attacks or other information security breaches, there can be no assurance that we will not suffer such losses in the future. Our risk and exposure to these matters remains heightened because of, among other things, the evolving nature of these threats, the prominent size and scale of CIT and its role in the financial services industry, our plans to continue to implement our online banking channel strategies and develop additional remote connectivity solutions to serve our customers when and how they want to be served, our expanded geographic footprint and international presence, the outsourcing of some of our business operations, and the continued uncertain global economic environment. As a result, cyber security and the continued development and enhancement of our controls, processes and practices designed to protect our systems, computers, software, data and networks from attack, damage or unauthorized access remain a priority for CIT. As cyber threats continue to evolve, we may be required to expend significant additional resources to continue to modify or enhance our protective measures or to investigate and remediate any information security vulnerabilities.
Disruptions or failures in the physical infrastructure or operating systems that support our businesses and customers, or cyber attacks or security breaches of the networks, systems or devices that our customers use to access our products and services could result in customer attrition, regulatory fines, penalties or intervention, reputational damage, reimbursement or other compensation costs, and/or additional compliance costs, any of which could materially adversely affect our results of operations or financial condition.
Item 1B. Unresolved Staff CommentsThere are no unresolved SEC staff comments.
CIT operates in the United States, Canada, Europe, Latin America, and Asia. CIT occupies approximately 1.4 million square feet of office space, the majority of which is leased.
CIT ANNUAL REPORT 2012 27
Item 3. Legal ProceedingsCIT is currently involved, and from time to time in the future may be involved, in a number of judicial, regulatory, and arbitration proceedings relating to matters that arise in connection with the conduct of its business (collectively, “Litigation”), certain of which Litigation matters are described inNote 20 — Contingencies ofItem 8. Financial Statements and Supplementary Data. In view of the inherent difficulty of predicting the outcome of Litigation matters, particularly when such matters are in their early stages or where the claimants seek indeterminate damages, CIT cannot state with confidence what the eventual outcome of the pending Litigation will be, what the timing of the ultimate resolution of these matters will be, or what the eventual loss, fines, or penalties related to each pending matter may be, if any. In accordance with applicable accounting guidance, CIT establishes reserves for Litigation when those matters present loss contingencies as to which it is both probable that a loss will occur and the amount of such loss can be reasonably estimated. Based on currently available information, CIT believes that the results of Litigation that is currently pending, taken together, will not have a material adverse effect on the Company’s financial condition, but may be material to the Company’s operating results or cash flows for any particular period, depending in part on its operating results for that period. The actual results of resolving such matters may be substantially higher than the amounts reserved.
For more information about pending legal proceedings, including an estimate of certain reasonably possible losses in excess of reserved amounts, seeNote 20 — Contingencies ofItem 8. Financial Statements and Supplementary Data.
Item 4. Mine Safety DisclosuresNot applicable.
Item 3: Legal Proceedings
28 CIT ANNUAL REPORT 2012
PART TWO
Item 5. Market for Registrant’s Common Equity and Related Stockholder Matters and Issuer Purchases of Equity SecuritiesMarket Information – CIT’s common stock trades on the New York Stock Exchange (“NYSE”) under the symbol “CIT.”
The following tables set forth the high and low reported closing prices for CIT’s common stock.
Common Stock
| | | | 2012
| | 2011
| |
|---|
| | | | High
| | Low
| | High
| | Low
|
|---|
| | | | $ | 43.19 | | | $ | 34.84 | | | $ | 49.01 | | | $ | 41.82 | |
| | | | $ | 41.60 | | | $ | 32.57 | | | $ | 44.33 | | | $ | 39.60 | |
| | | | $ | 41.38 | | | $ | 34.20 | | | $ | 44.74 | | | $ | 30.27 | |
| | | | $ | 40.81 | | | $ | 36.12 | | | $ | 36.60 | | | $ | 29.12 | |
Holders of Common Stock – As of February 11, 2013, there were 110,598 beneficial owners of common stock.
Dividends – We have not declared nor paid any common stock dividends on the shares of common stock during 2011 and 2012.
Issuer Purchases of Equity Securities – There were no purchases of equity securities made during 2012 and there are no repurchase plans or programs under which shares may be purchased.
Return of Capital – We have requested from the Federal Reserve permission for a modest return of capital during 2013.
Securities Authorized for Issuance Under Equity Compensation Plans – Our equity compensation plans in effect following the Effective Date were approved by the Court and do not require shareholder approval. Equity awards associated with these plans are presented in the following table.
| | | | Number of Securities
to be Issued
Upon Exercise of
Outstanding Options
| | Weighted-Average
Exercise Price of
Outstanding Options
| | Number of Securities
Remaining Available for
Future Issuance Under
Equity Compensation Plans
|
|---|
Equity compensation plan
approved by the Court | | | | | 60,295 | | | $ | 31.16 | | | | 7,267,663 | * |
* Excludes the number of securities to be issued upon exercise of outstanding options and 1,997,412 shares underlying outstanding awards granted to employees and/or directors that are unvested and/or unsettled.
During 2012, we had no equity compensation plans that were not approved by the Court or by shareholders. For further information on our equity compensation plans, including the weighted average exercise price, seeItem 8. Financial Statements and Supplementary Data, Note 18 – Retirement, Other Postretirement and Other Benefit Plans.
Unregistered Sales of Equity Securities – There were no sales of common stock during 2012, however, there were issuances of common stock under equity compensation plans and an employee stock purchase plan.
On December 10, 2009, the effective date of our plan of reorganization, we provided for 600,000,000 shares of authorized common stock, par value $0.01 per share, of which 200,000,000 shares were issued, and 100,000,000 shares of authorized new preferred stock, par value $0.01 per share, of which no shares were issued. We reserved 10,526,316 shares of common stock for future issuance under the Amended and Restated CIT Group Inc. Long-Term Incentive Plan.
Based on the Confirmation Order, the Company relied on Section 1145(a)(1) of the United States Bankruptcy Code to exempt from the registration requirements of the Securities Act of 1933, as amended, the issuance of the new securities.
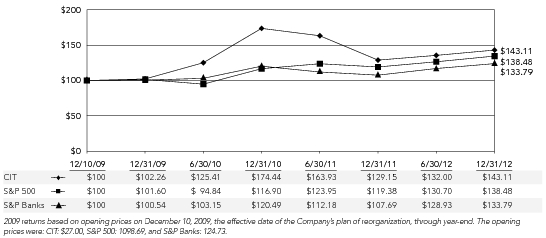
Shareholder Return – The following graph shows the semi-annual cumulative total shareholder return for common stock during the period from December 10, 2009 to December 31, 2012. Five year historical data is not presented since we emerged from bankruptcy on December 10, 2009 and the stock performance of CIT’s common stock is not comparable to the performance of pre-bankruptcy CIT’s common stock. The chart also shows the cumulative returns of the S&P 500 Index and S&P Banks Index for the same period. The comparison assumes $100 was invested on December 10, 2009 (the date our new common stock began trading on the NYSE). Each of the indices shown assumes that all dividends paid were reinvested.
CIT ANNUAL REPORT 2012 29
CIT STOCK PERFORMANCE DATA
Item 5: Market for Registrant’s Common Equity
30 CIT ANNUAL REPORT 2012
Item 6. Selected Financial DataThe following table sets forth selected consolidated financial information regarding our results of operations, balance sheets and certain ratios.
The Company has revised its total assets and total liabilities on its Balance Sheets at December 31, 2011 and 2010, and the respective quarters in 2012 and 2011, from the results released in the Company’s January 29, 2013 Earnings Release and Current Report on Form 8-K filing. The subsequent revisions reduced other assets and other liabilities and did not have any impact on tangible book value per common share for those periods or any line items in the Statement of Operations. SeeNote 27 – Selected Quarterly Financial Data inItem 8. Financial Statements and Supplementary Data.
As detailed inItem 7. Management’s Discussion and Analysis of Financial Condition and Results of Operations, upon emergence from bankruptcy on December 10, 2009, CIT adopted fresh start accounting effective December 31, 2009, which resulted in data subsequent to adoption not being comparable to data in periods prior to emergence. Therefore, balance sheet information for CIT at December 31, 2012, 2011, 2010 and 2009 and statement of operations information for the years ended December 31, 2012, 2011 and 2010 are presented separately. Data for the years ended December 2009 and 2008 and at December 2008 represent amounts for Predecessor CIT. Predecessor CIT presents the operations of the home lending business as a discontinued operation.
The data presented below is explained further in, and should be read in conjunction with,Item 7. Management’s Discussion and Analysis of Financial Condition and Results of Operations andItem 7A. Quantitative and Qualitative Disclosures about Market Risk andItem 8. Financial Statements and Supplementary Data.
Select Data (dollars in millions)
| | | | At or for the Years Ended December 31,
| |
|---|
| | | | CIT
| | Predecessor CIT
| |
|---|
| | | | 2012
| | 2011
| | 2010
| | 2009
| | 2009
| | 2008
|
|---|
Select Statement of Operations Data | | | | | | | | | | | | | | | | | | | | | | | | | | |
| | | | $ | (1,328.3 | ) | | $ | (565.7 | ) | | $ | 639.3 | | | $ | – | | | $ | (308.1 | ) | | $ | 499.1 | |
Provision for credit losses | | | | | (51.6 | ) | | | (269.7 | ) | | | (820.3 | ) | | | – | | | | (2,660.8 | ) | | | (1,049.2 | ) |
Total non-interest income | | | | | 2,437.7 | | | | 2,620.3 | | | | 2,653.3 | | | | – | | | | 1,560.2 | | | | 2,460.3 | |
| | | | | (1,512.6 | ) | | | (1,606.5 | ) | | | (1,700.9 | ) | | | – | | | | (2,795.7 | ) | | | (2,986.5 | ) |
Reorganization items and fresh start adjustments | | | | | – | | | | – | | | | – | | | | – | | | | 4,240.2 | | | | – | |
| | | | | (592.3 | ) | | | 14.8 | | | | 521.3 | | | | – | | | | (3.8 | ) | | | (2,864.2 | ) |
| | | | | | | | | | | | | | | | | | | | | | | | | | |
Diluted income (loss) per common share | | | | $ | (2.95 | ) | | $ | 0.07 | | | $ | 2.60 | | | $ | – | | | $ | (0.01 | ) | | $ | (2.69 | ) |
Book value per common share | | | | $ | 41.49 | | | $ | 44.27 | | | $ | 44.54 | | | $ | 41.99 | | | $ | – | | | $ | 13.22 | |
Tangible book value per common share | | | | $ | 39.61 | | | $ | 42.23 | | | $ | 42.17 | | | $ | 39.06 | | | $ | – | | | $ | 11.78 | |
| | | | | | | | | | | | | | | | | | | | | | | | | | |
Return on average common stockholders’ equity | | | | | (7.0 | )% | | | 0.2 | % �� | | | 6.0 | % | | | – | | | | N/M | | | | (11.0 | )% |
Net finance revenue as a percentage of average earning assets | | | | | (0.24 | )% | | | 1.53 | % | | | 3.95 | % | | | – | | | | 0.75 | % | | | 2.05 | % |
Return on average total assets | | | | | (1.34 | )% | | | 0.03 | % | | | 0.93 | % | | | – | | | | N/M | | | | (0.85 | )% |
Total ending equity to total ending assets | | | | | 18.9 | % | | | 19.6 | % | | | 17.3 | % | | | 13.9 | % | | | – | | | | 10.1 | % |
| | | | | | | | | | | | | | | | | | | | | | | | | | |
Loans including receivables pledged | | | | $ | 20,847.6 | | | $ | 19,905.9 | | | $ | 24,648.4 | | | $ | 35,185.1 | | | $ | – | | | $ | 53,126.6 | |
Allowance for loan losses | | | | | (379.3 | ) | | | (407.8 | ) | | | (416.2 | ) | | | – | | | | – | | | | (1,096.2 | ) |
Operating lease equipment, net | | | | | 12,411.7 | | | | 12,006.4 | | | | 11,155.0 | | | | 10,927.5 | | | | – | | | | 12,706.4 | |
Goodwill and intangible assets, net | | | | | 377.8 | | | | 409.5 | | | | 474.7 | | | | 586.6 | | | | – | | | | 698.6 | |
Total cash and short-term investments | | | | | 7,571.6 | | | | 8,374.0 | | | | 11,205.4 | | | | 9,826.2 | | | | – | | | | 8,365.8 | |
| | | | | 44,012.0 | | | | 45,263.4 | | | | 51,453.4 | | | | 60,561.5 | | | | – | | | | 80,448.9 | |
| | | | | 9,684.5 | | | | 6,193.7 | | | | 4,536.2 | | | | 5,177.7 | | | | – | | | | 2,626.8 | |
Total long-term borrowings | | | | | 21,961.8 | | | | 26,307.7 | | | | 34,049.3 | | | | 43,333.1 | | | | – | | | | 63,750.7 | |
Total common stockholders’ equity | | | | | 8,334.8 | | | | 8,883.6 | | | | 8,929.1 | | | | 8,400.0 | | | | – | | | | 5,138.0 | |
| | | | | | | | | | | | | | | | | | | | | | | | | | |
Non-accrual loans as a percentage of finance receivables | | | | | 1.59 | % | | | 3.53 | % | | | 6.57 | % | | | 4.47 | % | | | 6.86 | % | | | 2.66 | % |
Net charge-offs as a percentage of average finance receivables | | | | | 0.37 | % | | | 1.16 | % | | | 1.53 | % | | | – | | | | 4.04 | % | | | 0.90 | % |
Allowance for loan losses as a percentage of finance receivables | | | | | 1.82 | % | | | 2.05 | % | | | 1.69 | % | | | – | | | | 4.33 | % | | | 2.06 | % |
| | | | | | | | | | | | | | | | | | | | | | | | | | |
| | | | | 16.3 | % | | | 18.8 | % | | | 19.0 | % | | | 14.2 | % | | | – | | | | 9.4 | % |
| | | | | 17.0 | % | | | 19.7 | % | | | 19.9 | % | | | 14.2 | % | | | – | | | | 13.1 | % |
CIT ANNUAL REPORT 2012 31
The following table presents CIT’s individual components of net interest revenue and operating lease margins.
Average Balances(1)and Associated Income for the year ended: (dollars in millions)
| | | | December 31, 2012
| | December 31, 2011
| | December 31, 2010
| |
|---|
| | | | Average
Balance
| | Interest
| | Average
Rate (%)
| | Average
Balance
| | Interest
| | Average
Rate (%)
| | Average
Balance
| | Interest
| | Average
Rate (%)
|
|---|
Interest bearing deposits | | | | $ | 6,612.2 | | | $ | 21.8 | | | | 0.33 | % | | $ | 7,032.1 | | | $ | 24.2 | | | | 0.34 | % | | $ | 9,382.0 | | | $ | 19.6 | | | | 0.21 | % |
| | | | | 1,320.9 | | | | 10.5 | | | | 0.79 | % | | | 1,962.3 | | | | 10.6 | | | | 0.54 | % | | | 397.2 | | | | 12.1 | | | | 3.05 | % |
Loans (including held for sale)(2)(3) | | | | | | | | | | | | | | | | | | | | | | | | | | | | | | | | | | | | | | |
| | | | | 17,190.7 | | | | 1,131.7 | | | | 7.07 | % | | | 19,452.5 | | | | 1,608.3 | | | | 8.76 | % | | | 24,561.1 | | | | 2,732.9 | | | | 11.55 | % |
| | | | | 4,029.1 | | | | 405.1 | | | | 10.06 | % | | | 4,566.2 | | | | 585.6 | | | | 12.83 | % | | | 6,280.0 | | | | 954.4 | | | | 15.22 | % |
| | | | | 21,219.8 | | | | 1,536.8 | | | | 7.67 | % | | | 24,018.7 | | | | 2,193.9 | | | | 9.57 | % | | | 30,841.1 | | | | 3,687.3 | | | | 12.32 | % |
Total interest earning assets / interest income(2)(3) | | | | | 29,152.9 | | | | 1,569.1 | | | | 5.61 | % | | | 33,013.1 | | | | 2,228.7 | | | | 6.98 | % | | | 40,620.3 | | | | 3,719.0 | | | | 9.37 | % |
Operating lease equipment, net (including held for sale)(4) | | | | | | | | | | | | | | | | | | | | | | | | | | | | | | | | | | | | | | |
| | | | | 6,139.0 | | | | 596.9 | | | | 9.72 | % | | | 5,186.7 | | | | 428.1 | | | | 8.25 | % | | | 4,922.1 | | | | 383.9 | | | | 7.80 | % |
| | | | | 6,299.0 | | | | 654.5 | | | | 10.39 | % | | | 6,220.0 | | | | 664.3 | | | | 10.68 | % | | | 6,062.7 | | | | 588.7 | | | | 9.71 | % |
Total operating lease equipment, net(4) | | | | | 12,438.0 | | | | 1,251.4 | | | | 10.06 | % | | | 11,406.7 | | | | 1,092.4 | | | | 9.58 | % | | | 10,984.8 | | | | 972.6 | | | | 8.85 | % |
| | | | | 41,590.9 | | | $ | 2,820.5 | | | | 6.98 | % | | | 44,419.8 | | | $ | 3,321.1 | | | | 7.67 | % | | | 51,605.1 | | | $ | 4,691.6 | | | | 9.25 | % |
Non interest earning assets | | | | | | | | | | | | | | | | | | | | | | | | | | | | | | | | | | | | | | |
| | | | | 435.4 | | | | | | | | | | | | 938.8 | | | | | | | | | | | | 1,039.1 | | | | | | | | | |
Allowance for loan losses | | | | | (405.1 | ) | | | | | | | | | | | (412.0 | ) | | | | | | | | | | | (288.3 | ) | | | | | | | | |
All other non-interest earning assets | | | | | 2,671.1 | | | | | | | | | | | | 3,094.0 | | | | | | | | | | | | 3,557.1 | | | | | | | | | |
| | | | $ | 44,292.3 | | | | | | | | | | | $ | 48,040.6 | | | | | | | | | | | $ | 55,913.0 | | | | | | | | | |
| | | | | | | | | | | | | | | | | | | | | | | | | | | | | | | | | | | | | | |
| | | | | | | | | | | | | | | | | | | | | | | | | | | | | | | | | | | | | | |
| | | | $ | 7,707.9 | | | $ | 152.5 | | | | 1.98 | % | | $ | 4,796.6 | | | $ | 111.2 | | | | 2.32 | % | | $ | 4,780.1 | | | $ | 87.4 | | | | 1.83 | % |
| | | | | 24,235.5 | | | | 2,744.9 | | | | 11.33 | % | | | 30,351.5 | | | | 2,683.2 | | | | 8.84 | % | | | 38,769.3 | | | | 2,992.3 | | | | 7.72 | % |
Total interest-bearing liabilities | | | | | 31,943.4 | | | $ | 2,897.4 | | | | 9.07 | % | | | 35,148.1 | | | $ | 2,794.4 | | | | 7.95 | % | | | 43,549.4 | | | $ | 3,079.7 | | | | 7.07 | % |
Credit balances of factoring clients | | | | | 1,194.4 | | | | | | | | | | | | 1,098.1 | | | | | | | | | | | | 910.5 | | | | | | | | | |
Other non-interest bearing liabilities | | | | | 2,665.5 | | | | | | | | | | | | 2,834.1 | | | | | | | | | | | | 2,763.1 | | | | | | | | | |
| | | | | 5.0 | | | | | | | | | | | | 1.1 | | | | | | | | | | | | (3.5 | ) | | | | | | | | |
| | | | | 8,484.0 | | | | | | | | | | | | 8,959.2 | | | | | | | | | | | | 8,693.5 | | | | | | | | | |
Total Average Liabilities and Stockholders’ Equity | | | | $ | 44,292.3 | | | | | | | | | | | $ | 48,040.6 | | | | | | | | | | | $ | 55,913.0 | | | | | | | | | |
| | | | | | | | | | | | | (2.09 | )% | | | | | | | | | | | (0.28 | )% | | | | | | | | | | | 2.18 | % |
Impact of non-interest bearing sources | | | | | | | | | | | | | 1.90 | % | | | | | | | | | | | 1.50 | % | | | | | | | | | | | 1.00 | % |
Net revenue/yield on earning assets(2) | | | | | | | | $ | (76.9 | ) | | | (0.19 | )% | | | | | | $ | 526.7 | | | | (1.22 | )% | | | | | | $ | 1,611.9 | | | | 3.18 | % |
(1) | | The average balances presented are derived based on month end balances during the year. Tax exempt income was not significant in any of the years presented. Average rates are impacted by FSA accretion and amortization. |
(2) | | The rate presented is calculated net of average credit balances for factoring clients. |
(3) | | Non-accrual loans and related income are included in the respective categories. |
(4) | | Operating lease rental income is a significant source of revenue; therefore, we have presented the rental revenues net of depreciation. |
(5) | | Interest and average rates include FSA accretion, including amounts accelerated due to redemptions or extinguishments, prepayment penalties, and accelerated original issue discount on debt extinguishment related to the GSI facility. |
Item 6: Selected Financial Data
32 CIT ANNUAL REPORT 2012
The table below disaggregates CIT’s year-over-year changes (2012 versus 2011 and 2011 versus 2010) in net interest revenue and operating lease margins as presented in the preceding tables between volume (level of lending or borrowing) and rate (rates charged customers or incurred on borrowings). See‘Net Finance Revenue’ section for further discussion.
Changes in Net Finance Revenue (dollars in millions)
| | | | 2012 Compared to 2011
| | 2011 Compared to 2010
| |
|---|
| | | | Increase (decrease)
due to change in:
| | | | Increase (decrease)
due to change in:
| |
|---|
| | | | Volume
| | Rate
| | Net
| | Volume
| | Rate
| | Net
|
|---|
| | | | | | | | | | | | | | | | | | | | | | | | | | |
Loans (including held for sale) | | | | | | | | | | | | | | | | | | | | | | | | | | |
| | | | $ | (160.0 | ) | | $ | (316.5 | ) | | $ | (476.5 | ) | | $ | (447.6 | ) | | $ | (677.0 | ) | | $ | (1,124.6 | ) |
| | | | | (54.0 | ) | | | (126.6 | ) | | | (180.6 | ) | | | (219.9 | ) | | | (148.9 | ) | | | (368.8 | ) |
| | | | | (214.0 | ) | | | (443.1 | ) | | | (657.1 | ) | | | (667.5 | ) | | | (825.9 | ) | | | (1,493.4 | ) |
Interest bearing deposits | | | | | (1.4 | ) | | | (1.0 | ) | | | (2.4 | ) | | | (8.1 | ) | | | 12.7 | | | | 4.6 | |
| | | | | (5.1 | ) | | | 5.0 | | | | (0.1 | ) | | | 8.5 | | | | (10.0 | ) | | | (1.5 | ) |
| | | | | (220.5 | ) | | | (439.1 | ) | | | (659.6 | ) | | | (667.1 | ) | | | (823.2 | ) | | | (1,490.3 | ) |
Operating lease equipment, net (including held for sale)(1) | | | | | 100.8 | | | | 58.2 | | | | 159.0 | | | | 38.6 | | | | 81.2 | | | | 119.8 | |
| | | | | | | | | | | | | | | | | | | | | | | | | | |
| | | | | 57.6 | | | | (16.3 | ) | | | 41.3 | | | | 0.4 | | | | 23.4 | | | | 23.8 | |
Interest on long-term borrowings(2) | | | | | (692.7 | ) | | | 754.4 | | | | 61.7 | | | | (744.2 | ) | | | 435.1 | | | | (309.1 | ) |
| | | | | (635.1 | ) | | | 738.1 | | | | 103.0 | | | | (743.8 | ) | | | 458.5 | | | | (285.3 | ) |
| | | | $ | 515.4 | | | $ | (1,119.0 | ) | | $ | (603.6 | ) | | $ | 115.3 | | | $ | (1,200.5 | ) | | $ | (1,085.2 | ) |
(1) | | Operating lease rental income is a significant source of revenue; therefore, we have presented the net revenues. |
(2) | | Includes acceleration of FSA accretion resulting from redemptions or extinguishments, prepayment penalties, and accelerated original issue discount on debt extinguishment related to the GSI facility. |
The average long-term borrowings balances presented below, both quarterly and for the full year, were derived based on daily balances and the average rates are based on a 30 days per month day count convention. The average rates include FSA accretion, including amounts accelerated due to redemptions or extinguishments and prepayment costs. The debt coupon rates at December 31, 2012, were as follows: Senior Unsecured Notes – 4.90%, Series C Notes (other) – 5.37%, Other Debt – 6.02% (pre-FSA basis), Secured Borrowings – 2.30% (pre-FSA basis), and Revolving Credit Facility – 2.71%. The aggregate long-term borrowing weighted average rate at December 31, 2012 was 3.81%, 5.12% at December 31, 2011 and 5.54% at December 31, 2010.
Average Daily Long-term Borrowings Balances and Rates (dollars in millions)
| | | | Quarters Ended
| |
|---|
| | | | December 31, 2012
| | September 30, 2012
| | June 30, 2012
| | March 31, 2012
| |
|---|
| | | | Average
Balance
| | Interest
| | Average
Rate
| | Average
Balance
| | Interest
| | Average
Rate
| | Average
Balance
| | Interest
| | Average
Rate
| | Average
Balance
| | Interest
| | Average
Rate
|
|---|
| | | | | | | | | | | | | | | | | | | | | | | | | | | | | | | | | | | | | | | | | | | | | | | | | | |
Revolving Credit Facility | | | | $ | 113.6 | | | $ | 1.0 | | | | 3.45 | % | | $ | 354.6 | | | $ | 2.7 | | | | 3.00 | % | | $ | 457.5 | | | $ | 3.4 | | | | 2.95 | % | | $ | 210.8 | | | $ | 1.7 | | | | 3.22 | % |
| | | | | 6,500.0 | | | | 82.7 | | | | 5.09 | % | | | 5,435.5 | | | | 68.9 | | | | 5.07 | % | | | 2,766.7 | | | | 36.9 | | | | 5.34 | % | | | 266.7 | | | | 3.5 | | | | 5.25 | % |
Series C Notes (Exchanged)(1) | | | | | – | | | | – | | | | – | | | | 2,936.3 | | | | 532.9 | | | | 72.59 | % | | | 5,906.4 | | | | 410.0 | | | | 27.77 | % | | | 7,982.4 | | | | 189.6 | | | | 9.50 | % |
| | | | | 5,250.0 | | | | 70.5 | | | | 5.37 | % | | | 5,250.0 | | | | 72.3 | | | | 5.51 | % | | | 5,250.0 | | | | 72.3 | | | | 5.51 | % | | | 3,942.5 | | | | 55.4 | | | | 5.62 | % |
| | | | | 84.0 | | | | 10.7 | | | | 50.99 | % | | | 85.4 | | | | 2.7 | | | | 12.67 | % | | | 86.5 | | | | 2.6 | | | | 12.08 | % | | | 86.4 | | | | 2.7 | | | | 12.42 | % |
| | | | | 11,947.6 | | | | 164.9 | | | | 5.52 | % | | | 14,061.8 | | | | 679.5 | | | | 19.33 | % | | | 14,467.1 | | | | 525.2 | | | | 14.52 | % | | | 12,488.8 | | | | 252.9 | | | | 8.10 | % |
| | | | | | | | | | | | | | | | | | | | | | | | | | | | | | | | | | | | | | | | | | | | | | | | | | |
| | | | | 10,284.8 | | | | 159.2 | | | | 6.19 | % | | | 10,544.7 | | | | 98.1 | | | | 3.72 | % | | | 10,243.4 | | | | 73.7 | | | | 2.88 | % | | | 10,347.8 | | | | 107.6 | | | | 4.16 | % |
| | | | | – | | | | – | | | | – | | | | – | | | | – | | | | – | | | | – | | | | – | | | | – | | | | 3,424.8 | | | | 683.8 | | | | 79.86 | % |
| | | | | 10,284.8 | | | | 159.2 | | | | 6.19 | % | | | 10,544.7 | | | | 98.1 | | | | 3.72 | % | | | 10,243.4 | | | | 73.7 | | | | 2.88 | % | | | 13,772.6 | | | | 791.4 | | | | 22.99 | % |
Total Long-term Borrowings | | | | $ | 22,232.4 | | | $ | 324.1 | | | | 5.83 | % | | $ | 24,606.5 | | | $ | 777.6 | | | | 12.64 | % | | $ | 24,710.5 | | | $ | 598.9 | | | | 9.69 | % | | $ | 26,261.4 | | | $ | 1,044.3 | | | | 15.91 | % |
(1) | | See footnote 1 on next table. |
CIT ANNUAL REPORT 2012 33
Average Daily Long-term Borrowings Balances and Rates (dollars in millions)
| | | | Years Ended
| |
|---|
| | | | December 31, 2012
| | December 31, 2011
| | December 31, 2010
| |
|---|
| | | | | | | | | | | | | | | | | | | | | | | | | | | | | | | | | | | | | | |
Revolving Credit Facility | | | | $ | 284.1 | | | $ | 8.8 | | | | 3.07 | % | | $ | – | | | $ | – | | | | – | | | $ | – | | | $ | – | | | | – | |
| | | | | 3,742.2 | | | | 192.0 | | | | 5.13 | % | | | – | | | | – | | | | – | | | | – | | | | – | | | | – | |
Series C Notes (Exchanged)(1) | | | | | 4,206.3 | | | | 1,132.5 | | | | 26.92 | % | | | – | | | | – | | | | – | | | | – | | | | – | | | | – | |
| | | | | 4,923.1 | | | | 270.5 | | | | 5.49 | % | | | – | | | | – | | | | – | | | | – | | | | – | | | | – | |
| | | | | 85.6 | | | | 18.7 | | | | 21.86 | % | | | – | | | | – | | | | – | | | | – | | | | – | | | | – | |
| | | | | 13,241.3 | | | | 1,622.5 | | | | 12.25 | % | | | – | | | | – | | | | – | | | | – | | | | – | | | | – | |
| | | | | | | | | | | | | | | | | | | | | | | | | | | | | | | | | | | | | | |
| | | | | 10,355.1 | | | | 438.6 | | | | 4.24 | % | | | 10,022.3 | | | | 563.3 | | | | 5.62 | % | | | 13,006.6 | | | | 526.1 | | | | 4.04 | % |
First Lien Term Facility(1) | | | | | – | | | | – | | | | – | | | | 1,916.3 | | | | 42.9 | | | | 2.24 | % | | | 4,907.4 | | | | 455.9 | | | | 9.29 | % |
Revolving Credit Facility | | | | | – | | | | – | | | | – | | | | 479.3 | | | | 14.9 | | | | 3.11 | % | | | – | | | | – | | | | – | |
| | | | | 856.2 | | | | 683.8 | | | | 79.86 | % | | | 11,970.8 | | | | 1,538.0 | | | | 12.85 | % | | | 18,915.0 | | | | 1,779.2 | | | | 9.41 | % |
| | | | | – | | | | – | | | | – | | | | 6.3 | | | | 2.1 | | | | 16.03 | % | | | 1,944.3 | | | | 209.1 | | | | 10.75 | % |
Series C Notes (Exchanged)(1) | | | | | – | | | | – | | | | – | | | | 4,282.3 | | | | 415.3 | | | | 9.70 | % | | | – | | | | – | | | | – | |
| | | | | – | | | | – | | | | – | | | | 1,505.5 | | | | 91.1 | | | | 6.05 | % | | | – | | | | – | | | | – | |
| | | | | – | | | | – | | | | – | | | | 127.9 | | | | 15.6 | | | | 12.19 | % | | | 206.8 | | | | 22.0 | | | | 10.64 | % |
| | | | | 11,211.3 | | | | 1,122.4 | | | | 10.01 | % | | | 30,310.7 | | | | 2,683.2 | | | | 8.85 | % | | | 38,980.1 | | | | 2,992.3 | | | | 7.68 | % |
Total Long-term Borrowings | | | | $ | 24,452.6 | | | $ | 2,744.9 | | | | 11.22 | % | | $ | 30,310.7 | | | $ | 2,683.2 | | | | 8.85 | % | | $ | 38,980.1 | | | $ | 2,992.3 | | | | 7.68 | % |
(1) | | Interest expense includes accelerated FSA accretion (amortization), prepayment penalties, and accelerated original issue discount on debt extinguishment related to the GSI facility, as presented in the following table. |
| | | | Quarters Ended
| | Years Ended December 31,
| |
|---|
| | | | December 31,
2012
| | September 30,
2012
| | June 30,
2012
| | March 31,
2012
| | 2012
| | 2011
| | 2010
|
|---|
Series C Notes – (Exchanged) – accelerated FSA | | | | $ | – | | | $ | 453.9 | | | $ | 264.9 | | | $ | – | | | $ | 718.8 | | | $ | – | | | $ | – | |
Series A Notes – accelerated FSA | | | | | – | | | | – | | | | – | | | | 596.9 | | | | 596.9 | | | | 289.7 | | | | – | |
Series A Notes – prepayment penalty | | | | | – | | | | – | | | | – | | | | – | | | | – | | | | 99.2 | | | | – | |
Secured Borrowings – student lending facility – accelerated FSA | | | | | 121.5 | | | | – | | | | – | | | | – | | | | 121.5 | | | | 88.0 | | | | – | |
Secured Borrowings – student lending facility – accelerated original issue discount on debt extinguishments related to the GSI facility | | | | | (45.7 | ) | | | – | | | | – | | | | – | | | | (45.7 | ) | | | – | | | | – | |
Secured Borrowings – Transportation Finance – accelerated original issue discount on debt extinguishments related to the GSI facility | | | | | (6.9 | ) | | | – | | | | – | | | | – | | | | (6.9 | ) | | | – | | | | – | |
Other Secured Borrowings – accelerated FSA | | | | | 13.7 | | | | – | | | | – | | | | – | | | | 13.7 | | | | – | | | | – | |
First Lien Term Facility – accelerated FSA | | | | | – | | | | – | | | | – | | | | – | | | | – | | | | (85.0 | ) | | | (56.8 | ) |
First Lien Term Facility – prepayment penalty | | | | | – | | | | – | | | | – | | | | – | | | | – | | | | – | | | | 89.0 | |
Series B Notes – accelerated FSA | | | | | – | | | | – | | | | – | | | | – | | | | – | | | | (13.5 | ) | | | (29.0 | ) |
Series B Notes – prepayment penalty | | | | | – | | | | – | | | | – | | | | – | | | | – | | | | 15.0 | | | | 48.9 | |
| | | | $ | 82.6 | | | $ | 453.9 | | | $ | 264.9 | | | $ | 596.9 | | | $ | 1,398.3 | | | $ | 393.4 | | | $ | 52.1 | |
| |
| | | | | | | | | | | | | | | | | | | | | | | | | | | | | | |
Item 6: Selected Financial Data
34 CIT ANNUAL REPORT 2012
Item 7: Management’s Discussion and Analysis of Financial Condition and Results of Operations andItem 7A. Quantitative and Qualitative Disclosures about Market Risk
CIT Group Inc., together with its subsidiaries (“we”, “our”, “CIT” or the “Company”) has provided financial solutions to its clients since its formation in 1908. CIT became a bank holding company (“BHC”) in December 2008, and is regulated by the Board of Governors of the Federal Reserve System (“FRS”) and the Federal Reserve Bank of New York (“FRBNY”) under the U.S. Bank Holding Company Act of 1956 (“BHC Act”). CIT Bank, a wholly-owned subsidiary, is a state chartered bank located in Salt Lake City, Utah, that offers commercial financing and leasing products as well as deposit products, such as certificates of deposits (“CDs”) and savings accounts.
We operate primarily in North America, with locations in Europe, South America and Asia. We are a commercial lender and lessor, providing financial solutions to small businesses and middle market companies. Our clients operate in over 20 countries and in over 30 industries, including transportation, particularly aerospace and rail, manufacturing and retail. We originated over $9 billion of funded new business volume during 2012 and have nearly $34 billion of financing and leasing assets at December 31, 2012.
“Management’s Discussion and Analysis of Financial Condition and Results of Operations” and“Quantitative and Qualitative Disclosures about Market Risk” contain financial terms that are relevant to our business and a glossary of key terms used is included in Part IItem 1. Business Section.
Management uses certain non-GAAP financial measures in its analysis of the financial condition and results of operations of the Company. See “Non-GAAP Financial Measurements” for a reconciliation of these to comparable GAAP measures.
2012 PRIORITIES AND COMMENTARY
Our 2012 priorities were developed to further advance our broader strategic initiatives and were centered on improving our financial condition, enhancing our business model, and further improving our approach to risk management and control functions. During the year, we reached an important strategic milestone as we completed the refinancing and/or repayment of all of the nearly $31 billion of debt that was issued in the 2009 restructuring. The following highlights some of our accomplishments:
| 1. | | Accelerate Growth and Business Development Initiatives |
| - | | Increased commercial assets. Commercial financing and leasing assets increased each quarter throughout 2012 and 8%, or $2.3 billion, for the year to $30.2 billion, driven by growth in Corporate Finance and Vendor Finance, and expansion of our air and rail leasing portfolios. We also agreed to acquire $1.3 billion of commercial loan commitments (of which approximately $800 million was outstanding) on December 31, 2012, the purchase of which should be substantially completed during the first quarter of 2013. |
| - | | Increased new business activity. We funded new business volume of $9.6 billion during 2012, a 23% increase over 2011 on strong Corporate Finance activity. Committed volume, which totaled $11.3 billion, was up 20%. |
| 2. | | Improve Profitability While Maintaining Financial Strength |
| - | | We reported a net loss of $592 million and pre-tax loss of $455 million for 2012, which were driven by debt redemption charges. The pre-tax loss compared to pre-tax income of $178 million for 2011 and $771 million for 2010. However, pre-tax income excluding debt redemption charges and accelerated original issue discount (“OID”) on debt extinguishment related to the GSI facility(3) improved to $1.0 billion from $707 million in 2011 and $824 million in 2010, on a comparable basis. |
| - | | Lowered funding costs. The weighted average coupon rates of outstanding deposits and long-term borrowings declined to 3.18% at December 31, 2012 from 4.69% and 5.30% at December 31, 2011 and 2010, respectively. |
| - | | Increased proportion of funding provided by deposits. As of December 31, 2012, total CIT deposits were $9.7 billion and comprised 31% of total CIT funding, compared to 19% and 12% at December 31, 2011 and 2010, respectively. |
| - | | Maintained strong capital position. Tier 1 and Total Capital ratios at December 31, 2012 were 16.3% and 17.0%, respectively, well above regulatory requirements. |
| - | | Maintained strong liquidity. Liquidity to total assets was 22% at December 31, 2012, down slightly from 23% at December 31, 2011. Liquidity includes cash and short-term investments and the unused portion of the Revolving Credit Facility. |
(3) | | Pre-tax income excluding debt redemption charges and accelerated OID on debt extinguishment related to the GSI facility is a non-GAAP measure. Debt redemption charges include accelerated fresh start accounting debt discount amortization, loss on debt extinguishments and prepayment costs. See “Non-GAAP Financial Measurements” for components and for reconciliation of non-GAAP to GAAP financial information. |
CIT ANNUAL REPORT 2012 35
| 3. | | Expand CIT Bank Assets and Funding |
| - | | Increased bank assets. Total assets at CIT Bank increased to $12.2 billion at December 31, 2012, from $9.0 billion and $7.1 billion at December 31, 2011 and 2010, respectively, reflecting growth in commercial financing and leasing assets. |
| - | | Increased asset origination activity. Funded new business volume totaled $6.0 billion, which represents over 90% of total U.S. volume in 2012, up from 72% in 2011. Committed loan volume rose to $7.6 billion from $4.4 billion for 2011. |
| - | | Diversified deposit sources. Placed approximately $4.5 billion of deposits since launching online banking platform in the 2011 fourth quarter. CIT Bank began offering on-line savings accounts in March 2012 to supplement the suite of CD offerings. |
2012 FINANCIAL OVERVIEW
Our 2012 operating results reflected increased commercial business activity and debt redemption and refinancing activities. We achieved our goal of refinancing or redeeming all the approximately $31 billion of debt incurred in the 2009 restructuring, including over $15 billion in 2012, which caused acceleration of FSA debt discount accretion.
Net loss for 2012 totaled $592 million, $2.95 per diluted share, and was largely influenced by debt redemption charges. The net loss compares to net income of $15 million for 2011, or $0.07 per diluted share and $521 million for 2010, $2.60 per diluted share. The 2012 amounts included $1.5 billion of debt redemption charges, while the prior periods included debt redemption charges of $528 million and $52 million for 2011 and 2010, respectively.
Pre-tax loss totaled $455 million for 2012 compared to pre-tax income of $178 million for 2011 and $771 million in 2010. Although down on a GAAP basis, pre-tax income excluding debt redemption charges, net FSA accretion/amortization and accelerated OID on debt extinguishment related to the GSI facility(4) for 2012 was nearly $640 million, up from $292 million in 2011 and a pre-tax loss of $581 million in 2010, driven by lower funding costs and lower credit costs. 2012 included net FSA costs of $1.1 billion, primarily due to the acceleration of interest expense related to the redemption of over $15 billion of high cost debt, while 2011 and 2010 included net FSA benefits of $135 million and $1.5 billion, respectively.
The following table presents pre-tax results adjusted for debt redemption charges, net FSA accretion / amortization and accelerated OID on debt extinguishment related to the GSI facility. This is a non-GAAP measurement.
Impacts of FSA Accretion and Debt Refinancing Costs on Pre-tax Income (Loss) (dollars in millions)
| | | | Years Ended December 31,
| |
|---|
| | | | 2012
| | 2011
| | 2010
|
|---|
Pre-tax income/(loss) – reported | | | | $ | (454.8 | ) | | $ | 178.4 | | | $ | 771.4 | |
Accelerated FSA net discount/(premium) on debt extinguishments and repurchases | | | | | 1,450.9 | | | | 279.2 | | | | (85.8 | ) |
Debt related – loss on debt extinguishments | | | | | 61.2 | | | | 134.8 | | | | – | |
Accelerated OID on debt extinguishments related to the GSI facility | | | | | (52.6 | ) | | | – | | | | – | |
Debt related – prepayment costs | | | | | – | | | | 114.2 | | | | 137.9 | |
Total debt redemption charges and OID acceleration | | | | | 1,459.5 | | | | 528.2 | | | | 52.1 | |
Pre-tax income – excluding debt redemption charges and OID acceleration | | | | | 1,004.7 | | | | 706.6 | | | | 823.5 | |
Net FSA accretion (excluding debt related acceleration) | | | | | (365.2 | ) | | | (414.4 | ) | | | (1,404.7 | ) |
Pre-tax income (loss) – excluding debt redemption charges, FSA net accretion and OID acceleration | | | | $ | 639.5 | | | $ | 292.2 | | | $ | (581.2 | ) |
Net finance revenue(5) (“NFR”) continued to be impacted by accelerated interest expense related to the redemption of high cost debt during 2012. The negative NFR for 2012 was driven by the FSA discount accretion resulting from repayments of over $15 billion of high cost debt. NFR was $527 million for 2011 and $1.6 billion for 2010. Average earning assets(5) (“AEA”) were $32.5 billion in 2012, down $1.8 billion from 2011 and $8.3 billion from 2010, primarily due to student loan sales. Average commercial earning assets increased during 2012 to $27.6 billion in 2012, from $26.7 billion 2011 but was down from $31.9 billion in 2010. NFR as a percentage of AEA (“net finance margin” or “NFM”) was negative and below 2011 and 2010 reflecting debt redemption costs. Excluding net FSA accretion, debt redemption charges and accelerated OID on debt extinguishment related to the GSI facility, net finance margin was 2.95% for 2012, improved from 1.60% in 2011 and 0.74% in 2010, driven by lower funding costs and the reduction of low yielding assets. Net operating lease revenue increased compared to 2011 and 2010 on higher assets. While other institutions may use net interest margin (“NIM”), defined as interest income less interest expense, we discuss NFR, which includes operating lease rental revenue and depreciation expense, due to their significant impact on revenue and expense.
Provision for credit losses for 2012 was $52 million, down from $270 million last year and $820 million in 2010. The 2010 provision included $416 million for the establishment of loan loss reserves post the adoption of FSA. The lower trend in provisions reflects a reduction in specific reserves and the overall improvements in credit metrics, including lower net charge-offs and non-accrual balances.
(4) | | Pre-tax income excluding debt redemption charges, net FSA accretion/amortization and accelerated OID on debt extinguishment related to the GSI facility is a non-GAAP measure. See “Non-GAAP Financial Measurements” for reconciliation of non-GAAP financial information. |
(5) | | Net finance revenue and average earning assets are non-GAAP measures; see “Non-GAAP Financial Measurements” for a reconciliation of non-GAAP to GAAP financial information. |
Item 7: Management’s Discussion and Analysis
36 CIT ANNUAL REPORT 2012
Other income of $653 million decreased from $953 million in 2011 and $1.0 billion in 2010, largely due to reduced gains on assets sold and fewer recoveries of loans charged off pre-emergence and loans charged off prior to transfer to held for sale. Factoring commissions of $127 million were down from 2011 and 2010, reflecting lower factoring volume.
Operating expenses were $918 million, up from $897 million in 2011, as higher compensation and benefit costs along with costs related to raising deposits offset lower professional fees, and down from $1.0 billion in 2010 on lower compensation and benefit costs and professional fees. Headcount at December 31, 2012, 2011 and 2010 was approximately 3,560, 3,530, and 3,780, respectively.
Provision for income taxes was $134 million for 2012, compared to $159 million for 2011 and $246 million for 2010. The tax provision predominantly reflects provisions for taxable income generated by our international operations and no income tax benefit on our U.S. losses.
Total assets at December 31, 2012 were $44.0 billion, down from $45.3 billion and $51.5 billion at December 31, 2011 and 2010, respectively, as growth in commercial financing and leasing assets was offset by sales and runoff of over $4 billion of government-guaranteed student loans since 2010. Commercial financing and leasing assets increased to $30.2 billion, up $2.3 billion from a year-ago and $1.5 billion from December 31, 2010. Cash and short-term investments totaled $7.6 billion, down from $8.4 billion and $11.2 billion at December 31, 2011 and 2010, respectively.
Funded new business volume of $9.6 billion during 2012 increased 23% from 2011 on strong Corporate Finance activity, while committed new business volume of $11.3 billion increased 20%. Both metrics were significantly above 2010 levels. Trade Finance factoring volume of $25.1 billion decreased 3% from 2011 and 6% from 2010.
Credit metrics reflected favorable trends. Net charge-offs of $74 million declined from $265 million in 2011 and $465 million in 2010, essentially due to improvements in Corporate Finance and Vendor Finance. Net charge-offs in the commercial segments were 0.46%, down significantly from 1.68% in 2011 and 2.04% in 2010. Non-accrual balances declined over 50% to $332 million at December 31, 2012 from $702 million a year ago and down significantly from $1.6 billion at December 31, 2010.
PRIOR PERIOD REVISIONS
In preparing its quarterly financial statements for the first three quarters of 2012, the Company discovered, corrected and disclosed the larger amounts in those quarters immaterial errors that impacted prior periods. Additional out-of-period errors were identified in the fourth quarter. These additional out-of-period errors were individually and in the aggregate not material to the fourth quarter results but, when combined with the other out-of-period errors previously identified this year, were determined by management to be material to the full year 2012 results.
The cumulative effect of these revisions was to increase tangible book value (“TBV”) by $8 million, as accumulated deficit decreased by $9 million, accumulated other comprehensive loss decreased by $14 million and goodwill increased by $15 million. As a result of these revisions, the net loss for the quarters ended September 30 and March 31, 2012 was decreased by approximately $6 million and $20 million, respectively, and the net loss for the quarter ended June 30, 2012 was increased by $2 million, from our previously reported amounts. As a result of these revisions, the net income for the years ended December 31, 2011 and 2010 decreased by $12 million and $3 million, respectively, from previously reported amounts. As a result of our adoption of fresh start accounting, the recognition of amounts relating to periods prior to 2010 resulted in a corresponding $15 million increase to goodwill.
Management will revise in subsequent quarterly filings on Form 10-Q and has revised in Item 8 Financial Data and Supplementary Data, Note 27 – Select Quarterly Data, its previously reported financial statements for 2012, 2011 and 2010. All prior period data reflects the revised balances.
2013 PRIORITIES
During 2013, we will focus on continued progress toward profitability targets by growing earning assets, managing expenses and growing CIT Bank assets and deposits. Enhancing internal control functions and our relationships with our regulators will also remain a focus for 2013.
Specific business objectives established for 2013 include:
| - | | Prudently Grow Assets – We plan to grow earning assets, either organically or through portfolio acquisitions, by focusing on existing products and markets as well as newer initiatives, including equipment finance, real estate finance, and maritime finance. |
| - | | Execute on Expense Initiatives – In order to achieve and maintain our target pre-tax return on average earning assets of between 2.0% and 2.5%, we plan to reduce the quarterly run rate of operating expenses by $15 million to $20 million from third quarter 2012 levels. These improvements will be phased in over 2013 through improved operating efficiencies and expense reductions. |
| - | | Continue to Expand CIT Bank – CIT Bank will continue to fund virtually all of our U.S. lending and leasing volume, expand on-line deposit offerings and begin to implement a thin branch network. |
| - | | Continue Progress Towards Profitability Targets – We will focus on managing towards our return on asset targets in order to improve profitability and grow book value. |
CIT ANNUAL REPORT 2012 37
The following chart reflects key performance indicators evaluated by management and used throughout this management discussion and analysis:
| | | | |
Asset Generation – to originate new business and build earning assets. | | | | -Origination volumes; and
-Financing and leasing assets balances. |
Revenue Generation – lend money at rates in excess of cost of borrowing, earn rentals on the equipment we lease commensurate with the risk, and generate other revenue streams. | | | | -Net finance revenue and other income;
-Asset yields and funding costs;
-Net finance revenue as a percentage of average earning assets (AEA); and
-Operating lease revenue as a percentage of average operating lease equipment (AOL). |
Credit Risk Management – accurately evaluate credit worthiness of customers, maintain high-quality assets and balance income potential with loss expectations. | | | | -Net charge-offs;
-Non-accrual loans; classified assets; delinquencies; and
-Loan loss reserve. |
Equipment and Residual Risk Management – appropriately evaluate collateral risk in leasing and lending transactions and remarket equipment at lease termination. | | | | -Equipment utilization;
-Value of equipment; and
-Gains and losses on equipment sales. |
Expense Management – maintain efficient operating platforms and related infrastructure. | | | | -Operating expenses and trends; and
-Operating expenses as percentage of AEA. |
Profitability – generate income and appropriate returns to shareholders. | | | | -Net income per common share (EPS);
-Net income as a percentage of average earning assets (ROA); and
-Net income as a percentage of average common equity (ROE). |
Capital Management – maintain a strong capital position. | | | | -Tier 1 and Total capital ratio; and
-Tier 1 capital as a percentage of adjusted average assets
(“Tier 1 Leverage Ratio”). |
Liquidity Risk – maintain access to ample funding at competitive rates. | | | | -Cash and short term investment securities;
-Committed and available funding facilities;
-Debt maturity profile; and
-Debt ratings. |
Market Risk – substantially insulate profits from movements in interest and foreign currency exchange rates. | | | | -Net Interest Income Sensitivity; and
-Economic Value of Equity (EVE). |
Item 7: Management’s Discussion and Analysis
38 CIT ANNUAL REPORT 2012
The following tables present management’s view of consolidated margin and includes revenues from loans and leased equipment, net of interest expense and depreciation, in dollars and as a percent of average earning assets.
Net Finance Revenue(1) (dollars in millions)
| | | | Years Ended December 31,
| |
|---|
| | | | 2012
| | 2011
| | 2010
|
|---|
| | | | $ | 1,569.1 | | | $ | 2,228.7 | | | $ | 3,719.0 | |
Rental income on operating leases | | | | | 1,784.6 | | | | 1,667.5 | | | | 1,648.4 | |
| | | | | 3,353.7 | | | | 3,896.2 | | | | 5,367.4 | |
| | | | | (2,897.4 | ) | | | (2,794.4 | ) | | | (3,079.7 | ) |
Depreciation on operating lease equipment | | | | | (533.2 | ) | | | (575.1 | ) | | | (675.8 | ) |
| | | | $ | (76.9 | ) | | $ | 526.7 | | | $ | 1,611.9 | |
Average Earning Assets(2) (“AEA”) | | | | $ | 32,522.0 | | | $ | 34,371.6 | | | $ | 40,844.4 | |
| | | | | | | | | | | | | | |
| | | | | 4.82 | % | | | 6.48 | % | | | 9.10 | % |
Rental income on operating leases | | | | | 5.49 | % | | | 4.85 | % | | | 4.04 | % |
| | | | | 10.31 | % | | | 11.33 | % | | | 13.14 | % |
| | | | | (8.91 | )% | | | (8.13 | )% | | | (7.54 | )% |
Depreciation on operating lease equipment | | | | | (1.64 | )% | | | (1.67 | )% | | | (1.65 | )% |
| | | | | (0.24 | )% | | | 1.53 | % | | | 3.95 | % |
As a % of AEA by Segment: | | | | | | | | | | | | | | |
| | | | | 0.83 | % | | | 3.02 | % | | | 6.85 | % |
| | | | | 0.14 | % | | | 2.14 | % | | | 1.40 | % |
| | | | | (2.06 | )% | | | (1.27 | )% | | | (3.70 | )% |
| | | | | 4.08 | % | | | 6.90 | % | | | 8.60 | % |
| | | | | 0.98 | % | | | 3.18 | % | | | 4.66 | % |
| | | | | (1.06 | )% | | | (0.31 | )% | | | 1.28 | % |
(1) | | Net finance revenue and average earning assets are non-GAAP measures; see reconciliation of non-GAAP to GAAP financial information. |
(2) | | Average earning assets are less than comparable balances displayed later in this document in ‘Select Quarterly Financial Data’ (Quarterly Average Balances) due to the exclusion of deposits with banks and other investments and the inclusion of credit balances of factoring clients. |
Net finance revenue (“NFR”) and NFR as a percentage of AEA (Net Finance Margin or “NFM”) are key metrics used by management to measure the profitability of our lending and leasing assets. NFR includes interest and fee income on our loans and capital leases, interest and dividend income on cash and investments, rental revenue and depreciation from our leased equipment, as well as funding costs. Given our asset composition includes a high level of operating lease equipment (38% of average earning assets), NFM is a more appropriate metric for CIT than net interest margin (“NIM”) (a common metric used by other bank holding companies), as NIM does not fully reflect the earnings of our portfolio because it includes the impact of debt costs on all our assets but excludes the net revenue (rental revenue less depreciation) from operating leases.
NFR continued to be significantly impacted by FSA accretion in 2012. Net FSA accretion (FSA accretion included in interest income and expense, and depreciation and rental income) decreased NFR by $1.2 billion during 2012, compared to increases of $25 million in 2011 and $1.4 billion in 2010. The 2012 period included significantly higher debt FSA discount accretion resulting from repayments of high cost debt (“accelerated debt FSA accretion”) and accelerated OID on debt extinguishment related to the GSI facility (“accelerated OID accretion”), which when discussed in combination is referred to as “accelerated debt FSA and OID accretion”. SeeFresh Start Accounting section for FSA accretion details and the first table inSegments for accelerated debt FSA and OID accretion balances. As detailed in the following table, absent net FSA accretion, accelerated OID accretion and prepayment costs, adjusted NFR was $1.1 billion, up from $616 million in 2011 and $353 million in 2010. The improvement from both periods reflects lower funding costs, while the increase from 2011 also reflects a benefit from higher commercial segment average earning assets.
CIT ANNUAL REPORT 2012 39
As detailed below, NFM included significant impact from net FSA accretion, accelerated OID on debt extinguishments related to the GSI facility and debt prepayment costs.
Adjusted NFR ($) and NFM (%) (dollars in millions)
| | | | Years Ended December 31,
| |
|---|
| | | | 2012
| | 2011
| | 2010
| |
|---|
| | | | $ | (76.9 | ) | | | (0.24 | )% | | $ | 526.7 | | | | 1.53 | % | | $ | 1,611.9 | | | | 3.95 | % |
FSA impact on NFR and NFM | | | | | 1,181.8 | | | | 3.33 | % | | | (25.3 | ) | | | (0.23 | )% | | | (1,396.5 | ) | | | (3.50 | )% |
Debt related – prepayment costs | | | | | – | | | | – | | | | 114.2 | | | | 0.30 | % | | | 137.9 | | | | 0.29 | % |
Accelerated OID on debt extinguishments related to the GSI facility | | | | | (52.6 | ) | | | (0.14 | )% | | | – | | | | – | | | | – | | | | – | |
| | | | $ | 1,052.3 | | | | 2.95 | % | | $ | 615.6 | | | | 1.60 | % | | $ | 353.3 | | | | 0.74 | % |
NFR and Adjusted NFR are non-GAAP measures, see “Non-GAAP Financial Measurements” for a reconciliation of non-GAAP to GAAP financial information.
NFM was down from 2011 and 2010 reflecting accelerated debt FSA and lower net FSA, partially offset by OID accretion. Adjusted NFM, improved over the prior-year periods due to continued reduction in funding costs, a continued shift in asset mix to higher-yielding commercial assets, as well as higher amount of suspended depreciation and other yield related items. Lower funding costs resulted from our liability actions, which included paying off high cost debt and deposit growth. Suspended depreciation on operating lease equipment held for sale, described below, benefits NFM until the asset is sold. Interest recoveries, which resulted from non-accrual asset prepayments, sales and assets returning to accrual status, and certain other yield-related fees, were up in 2012.
Generally, 2012 new business yields in Corporate Finance remained relatively stable within product types. Utilization rates in air and railcar assets in Transportation Finance remained strong as discussed below. Asset yields, which vary by vendor program, geography and types of credit in Vendor Finance, were generally stable in 2012, but there was some pricing pressure.
2011 NFM excluding FSA and prepayment penalties improved over 2010 as lower funding costs and stabilizing asset yields partially offset reduced benefits from the GSI Facilities. While the benefits from the GSI Facilities were down, net finance margin continued to benefit from discount recapture stemming from collateral prepayments on the underlying securities. Excluding FSA and the effect of prepayment penalties on high-cost debt, margin during 2010 grew sequentially during the first three quarters due to a decrease in high cost debt. During the fourth quarter, our yield compressed as the sale of non-strategic consumer receivables (which carried higher yields and a higher risk profile) in Vendor Finance and the pressure on rental margins, including the impact from the return of aircraft from a bankrupt carrier, more than offset the benefits of paying down high cost debt.
NFM continued to be impacted by our changing business mix, in which cash and short-term investments and student loans continue to represent a sizable but declining portion of the overall balance sheet. Continued growth in the relative proportion of commercial loans and leases and further declines in non-accrual loan balances, contributed to the improved margin.
Interest income was down from 2011 and 2010 primarily reflecting lower FSA accretion, which totaled $268 million in 2012, $745 million in 2011 and $1.6 billion in 2010. The remaining accretable FSA discount on loans was $355 million at December 31, 2012. The decline from 2011 was partially offset by higher commercial earning assets. While total AEA was down 5% from 2011 and 20% from 2010, both primarily driven by assets sales, principally consumer loans, commercial segment AEA increased about 4% from 2011.
Interest expense included $1.6 billion of FSA accretion and accelerated OID accretion ($1.4 billion due to accelerated debt extinguishments), while 2011 and 2010 included FSA accretion and prepayment costs of $1.0 billion ($393 million due to accelerated debt extinguishments) and $533 million ($52 million due to accelerated debt extinguishments), respectively. The higher 2012 amounts resulted from repayments of over $15 billion in high cost debt in the first three quarters and $1.0 billion of secured debt in the last quarter of 2012. During 2011, CIT had $9.5 billion in debt redemptions and extinguishments.
As a result of our 2012 debt redemption activities and the increased proportion of deposits to total funding, we reduced weighted average coupon rates of outstanding deposits and long-term borrowings to 3.18% at December 31, 2012, from 4.69% at December 31, 2011 and 5.30% at December 31, 2010. The weighted average coupon rate of long-term borrowings at December 31, 2012 was 3.81%, compared to 5.12% at December 31, 2011 and 5.54% at December 31, 2010. Long-term borrowings are discussed inFunding and Liquidity. SeeSelect Financial Data section for more information on Long-term borrowing rates.
Deposits have increased, both in dollars and proportion of total CIT funding; 31% at December 31, 2012 compared to 19% at December 31, 2011 and 12% at December 31, 2010. The weighted average rate of total CIT deposits at December 31, 2012 was 1.75%, compared to 2.68% at December 31, 2011 and 3.13% at December 31, 2010.
Item 7: Management’s Discussion and Analysis
40 CIT ANNUAL REPORT 2012
The following table sets forth the details on net operating lease revenue(6), before and after the impact of FSA:
Net Operating Lease Revenue as a % of Average Operating Leases (AOL) (dollars in millions)
| | | | Years Ended December 31,
| |
|---|
| | | | 2012
| | 2011
| | 2010
|
|---|
Rental income on operating leases | | | | | 14.78 | % | | | 14.85 | % | | | 15.01 | % |
Depreciation on operating lease equipment | | | | | (4.42 | )% | | | (5.12 | )% | | | (6.15 | )% |
Net operating lease revenue % | | | | | 10.36 | % | | | 9.73 | % | | | 8.86 | % |
Net operating lease revenue %, excluding FSA | | | | | 7.20 | % | | | 6.42 | % | | | 5.68 | % |
Net operating lease revenue | | | | $ | 1,251.4 | | | $ | 1,092.4 | | | $ | 972.6 | |
Average Operating Lease Equipment (“AOL”) | | | | $ | 12,072.9 | | | $ | 11,228.9 | | | $ | 10,981.0 | |
Net operating lease revenue increased in amount compared to 2011 and 2010 on higher assets in Transportation Finance and lower depreciation expense in Vendor Finance (discussed further below). Net operating lease revenue also reflects a benefit from net FSA accretion of $189 million, $184 million and $171 million for the years ended December 31, 2012, 2011 and 2010, respectively. These factors also drove the increases in net operating lease revenue as a percent of AOL.
Net operating lease revenue was primarily generated from the aircraft and rail transportation portfolios. Net operating lease revenue from these portfolios improved from the prior years, reflecting higher asset balances and strong asset utilization. Commercial aircraft utilization rates remained strong at over 99% leased at December 31, 2012, essentially unchanged from 2011 and 2010. In the rail portfolio, fleet utilization, including commitments, was over 98%, increased from 97% and 94% at December 31, 2011 and 2010, respectively.
In addition, the 2012 results compared to 2011 and 2010 benefited from lower depreciation expense, primarily in the Vendor Finance business, as a result of certain operating lease equipment being recorded as held for sale. Once a long-lived asset is classified as held for sale, depreciation expense is no longer recognized, but the asset is evaluated for impairment with any such charge recorded in other income. As a result, net operating lease revenue includes rental income on operating lease equipment classified as held for sale, but there is no related depreciation expense. The amount of depreciation not recognized on operating lease equipment in assets held for sale totaled $96 million for 2012, $68 million for the 2011 and was not significant in 2010. The amount of impairment on operating lease assets held for sale totaled $114 million for 2012, $85 million for 2011 and $2 million for 2010. Operating lease equipment in assets held for sale totaled $344 million at December 31, 2012 and $237 million at December 31, 2011, reflecting assets relating to transportation equipment and the previously announced Dell Europe platform sale in Vendor Finance, and none at December 31, 2010.
See“Non-interest Income – Impairment on assets held for sale”, “Expenses – Depreciation on operating lease equipment” and “Concentrations – Operating Leases” for additional information.
Since the Company’s emergence from bankruptcy, management has analyzed credit trends both before and after FSA in order to provide comparability with our longer-term credit trends (which included pre-emergence / historical accounting) and credit trends experienced by other market participants. These dual comparisons are less relevant in 2012 than in prior post emergence periods, and will become even less so prospectively as FSA discount related to loans has declined to $377 million at December 31, 2012 from $5.0 billion at December 31, 2009. As a result, this dual reporting had been de-emphasized during 2012.
Our credit metrics began to improve in the latter half of 2010; a trend that has continued through the end of 2012. This positive trend is consistent with improved global economic conditions, as well as circumstances specific to our portfolio, including the liquidation of lower credit quality legacy assets that had higher expected losses. The result was continued reduction in non-accrual loans and charge-offs remaining at low levels.
Management believes that credit metrics are at, or near, cyclical lows, and does not expect sustained improving trends from these levels. Given current levels, sequential quarterly movements in non-accrual loans and charge-offs in Corporate Finance, Trade Finance and Transportation Finance are subject to volatility around longer term trends if larger accounts migrate in and out of non-accrual status or get resolved. Given the smaller ticket, flow nature of Vendor Finance, we do not expect quarter-over-quarter movement in these metrics to be as significant in this business.
As a percentage of average finance receivables, net charge-offs in the Commercial segments were 0.46% in the current year, versus 1.68% in 2011 and 2.04% in 2010. Non-accrual loans in the
(6) | | Net operating lease revenue and average operating lease equipment are non-GAAP measures; see reconciliation of non-GAAP to GAAP financial information. |
CIT ANNUAL REPORT 2012 41
Commercial segments declined 53% to $330 million (1.93% of Finance receivables) from $701 million (4.61%) at December 31, 2011. This follows a 57% improvement in non-accrual loans in 2011 from 2010, as non-accrual loans have declined from the post-emergence peak of $2.1 billion at June 30, 2010.
The provision for credit losses was $52 million for the current year, down from $270 million and $820 million in 2011 and 2010, respectively. While the improving trend was largely driven by lower charge-offs, the 2010 provision, in particular, included higher amounts to rebuild an allowance following the elimination of the previous amount as FSA was adopted in December 2009 in conjunction with the Company’s emergence from bankruptcy.
As a result of adopting FSA, the allowance for loan losses at December 31, 2009 was eliminated and effectively recorded as discounts on loans as part of the fair value of finance receivables. A portion of the discount attributable to embedded credit losses was recorded as non-accretable discount and is utilized as such losses occurred, primarily on impaired, non-accrual loans. Any incremental deterioration of loans in this group results in incremental provisions or charge-offs. Improvements or an increase in forecasted cash flows in excess of the non-accretable discount reduces any allowance on the loan established after emergence from bankruptcy. Once such allowance (if any) has been reduced and the account is returned to accruing status, the non-accretable discount is reclassified to accretable discount and is recorded as finance income over the remaining life of the account. For performing pre-emergence loans, an allowance for loan losses is established to the extent our estimate of inherent loss exceeds the FSA discount. Recoveries on pre-emergence (2009 and prior) charge-offs, and on charge-offs prior to transfer to held-for-sale, are recorded in non-interest income, and totaled $55 million, $124 million and $279 million for 2012, 2011 and 2010, respectively. These declining amounts reflect the longer period away from the emergence date.
The allowance for loan losses is intended to provide for losses inherent in the portfolio based on estimates of the ultimate outcome of collection efforts, realization of collateral values, and other pertinent factors, such as estimation risk related to performance in prospective periods. We may make adjustments to the allowance depending on general economic conditions and specific industry weakness or trends in our portfolio credit metrics, including non-accrual loans and charge-off levels and realization rates on collateral.
Our allowance for loan losses includes: (1) specific reserves for impaired loans, (2) non-specific reserves for losses inherent in non-impaired loans utilizing the Company’s internal probability of default / loss given default ratings system, generally with a two year loss emergence period assumption, to determine estimated loss levels and (3) a qualitative adjustment to the reserve for economic risks, industry and geographic concentrations, and other factors not adequately captured in our methodology. Our policy is to recognize losses through charge-offs when there is high likelihood of loss after considering the borrower’s financial condition, underlying collateral and guarantees, and the finalization of collection activities.
For all presentation periods, qualitative adjustments largely related to instances where management believed that the Company’s current risk ratings in selected portfolios did not yet fully reflect the corresponding inherent risk. The qualitative adjustments did not exceed 10% of the total allowance for any of such periods and are recorded by class and included in the allowance for loan losses.
Management updated and enhanced credit grading models in the quarter ended June 30, 2012 as part of its ongoing model development life cycle. These updates and enhancements did not have a significant impact in the period relative to other factors affecting the allowance. SeeRisk Management for additional discussion on the new model development and the allowance for loan losses.
Item 7: Management’s Discussion and Analysis
42 CIT ANNUAL REPORT 2012
The following table presents detail on our allowance for loan losses, including charge-offs and recoveries and provides summarized components of the provision and allowance:
Allowance for Loan Losses and Provision for Credit Losses (dollars in millions)
| | | | Years ended December 31
| |
|---|
| | | | CIT
| | Predecessor CIT
| |
|---|
| | | | 2012
| | 2011
| | 2010
| | 2009
| | 2008
|
|---|
Allowance – beginning of period | | | | $ | 407.8 | | | $ | 416.2 | | | $ | – | | | $ | 1,096.2 | | | $ | 574.3 | |
Provision for credit losses(1) | | | | | 51.6 | | | | 269.7 | | | | 820.3 | | | | 2,660.8 | | | | 1,049.2 | |
Change related to new accounting guidance(2) | | | | | – | | | | – | | | | 68.6 | | | | – | | | | – | |
| | | | | (5.9 | ) | | | (12.9 | ) | | | (8.2 | ) | | | (12.2 | ) | | | (36.8 | ) |
| | | | | 45.7 | | | | 256.8 | | | | 880.7 | | | | 2,648.6 | | | | 1,012.4 | |
| | | | | (141.8 | ) | | | (368.8 | ) | | | (510.3 | ) | | | (2,068.2 | ) | | | (557.8 | ) |
| | | | | 67.6 | | | | 103.6 | | | | 45.8 | | | | 109.6 | | | | 67.3 | |
| | | | | (74.2 | ) | | | (265.2 | ) | | | (464.5 | ) | | | (1,958.6 | ) | | | (490.5 | ) |
Allowance before fresh start adjustments | | | | | 379.3 | | | | 407.8 | | | | 416.2 | | | | 1,786.2 | | | | 1,096.2 | |
| | | | | – | | | | – | | | | – | | | | (1,786.2 | ) | | | – | |
Allowance – end of period | | | | $ | 379.3 | | | $ | 407.8 | | | $ | 416.2 | | | $ | – | | | $ | 1,096.2 | |
| | | | | | | | | | | | | | | | | | | | | | |
| | | | $ | 17,150.2 | | | $ | 15,223.1 | | | $ | 16,572.5 | | | $ | 25,501.4 | | | $ | 40,654.0 | |
| | | | | 3,697.4 | | | | 4,682.8 | | | | 8,075.9 | | | | 9,683.7 | | | | 12,472.6 | |
| | | | $ | 20,847.6 | | | $ | 19,905.9 | | | $ | 24,648.4 | | | $ | 35,185.1 | | | $ | 53,126.6 | |
| | | | | | | | | | | | | | | | | | | | | | |
| | | | $ | 379.3 | | | $ | 407.8 | | | $ | 416.2 | | | $ | – | | | $ | 857.9 | |
| | | | | – | | | | – | | | | – | | | | – | | | | 238.3 | |
| | | | $ | 379.3 | | | $ | 407.8 | | | $ | 416.2 | | | $ | – | | | $ | 1,096.2 | |
| | | | Provision for Credit Losses
| | Allowance for Loan Losses
| |
|---|
For the years ended/at December 31:
| | | | 2012
| | 2011
| | 2010
| | 2012
| | 2011
| | 2010
|
|---|
Specific reserves on commercial impaired loans | | | | $ | (9.4 | ) | | $ | (66.7 | ) | | $ | 121.3 | | | $ | 45.2 | | | $ | 54.6 | | | $ | 121.3 | |
Non-specific reserves–commercial | | | | | (13.2 | ) | | | 71.2 | | | | 234.5 | | | | 334.1 | | | | 353.2 | | | | 294.9 | |
Net charge-offs–commercial | | | | | 73.7 | | | | 262.1 | | | | 439.2 | | | | – | | | | – | | | | – | |
| | | | | 0.5 | | | | 3.1 | | | | 25.3 | | | | – | | | | – | | | | – | |
| | | | $ | 51.6 | | | $ | 269.7 | | | $ | 820.3 | | | $ | 379.3 | | | $ | 407.8 | | | $ | 416.2 | |
(1) | | Includes amounts related to reserves on unfunded loan commitments, letters of credit and for deferred purchase agreements, which are reflected in other liabilities, as well as foreign currency translation adjustments. |
(2) | | Reflects reserves associated with loans consolidated in accordance with 2010 adoption of accounting guidance on consolidation of variable interest entities. |
(3) | | Recoveries for the years ended December 31, 2012, 2011 and 2010 do not include $55.0 million, $124.1 million and $278.8 million, respectively, of recoveries of loans charged off pre-emergence and loans charged off prior to transfer to held for sale, which are included in Other Income. |
The allowance for loan losses as a percentage of finance receivables for the Commercial Segments (excluding U.S. government-guaranteed student loans) was 2.21%, 2.68% and 2.51% as of December 31, 2012, 2011 and 2010, respectively. The declining trend in 2012 reflects the previously-mentioned liquidation of lower credit quality legacy assets that had higher expected losses. The rate increase in 2011 also reflects the re-establishment of allowance corresponding to FSA discount accretion.
Including the U.S. government guaranteed student loans, which have no related reserves, the comparable consolidated allowance for loan loss percentages were 1.82%, 2.05% and 1.69%, as of December 31, 2012, 2011 and 2010, respectively. The declining proportion of student loans in the periods presented narrows the gap between the consolidated and commercial allowance rates, and therefore affects the comparability between the overall and commercial portfolio rate trends.
The decline in specific reserves over the past two years, particularly during 2011, is consistent with reduced non-accrual inflows and balances.
CIT ANNUAL REPORT 2012 43
FSA discount and allowance balances by segment are presented in the following tables:
Segment FSA Loans Discount and Allowance for Loan Losses (dollars in millions)
| | | | Finance
Receivables
pre-FSA
| | FSA –
Accretable
Discount
| | FSA – Non-
accretable
Discount(1)
| | Finance
Receivables
post-FSA
| | Allowance for
Loan Losses
| | Net Carrying
Value
|
|---|
| | | | | | | | | | | | | | | | | | | | | | | | | | |
| | | | $ | 8,260.8 | | | $ | (69.2 | ) | | $ | (18.6 | ) | | $ | 8,173.0 | | | $ | (229.9 | ) | | $ | 7,943.1 | |
| | | | | 1,896.0 | | | | (42.8 | ) | | | – | | | | 1,853.2 | | | | (36.3 | ) | | | 1,816.9 | |
| | | | | 2,305.3 | | | | – | | | | – | | | | 2,305.3 | | | | (27.4 | ) | | | 2,277.9 | |
| | | | | 4,841.1 | | | | (19.1 | ) | | | (3.3 | ) | | | 4,818.7 | | | | (85.7 | ) | | | 4,733.0 | |
| | | | | 17,303.2 | | | | (131.1 | ) | | | (21.9 | ) | | | 17,150.2 | | | | (379.3 | ) | | | 16,770.9 | |
| | | | | 3,921.6 | | | | (224.2 | ) | | | – | | | | 3,697.4 | | | | – | | | | 3,697.4 | |
| | | | $ | 21,224.8 | | | $ | (355.3 | ) | | $ | (21.9 | ) | | $ | 20,847.6 | | | $ | (379.3 | ) | | $ | 20,468.3 | |
| | | | | | | | | | | | | | | | | | | | | | | | | | |
| | | | $ | 7,089.2 | | | $ | (178.7 | ) | | $ | (47.8 | ) | | $ | 6,862.7 | | | $ | (262.2 | ) | | $ | 6,600.5 | |
| | | | | 1,564.0 | | | | (77.0 | ) | | | – | | | | 1,487.0 | | | | (29.3 | ) | | | 1,457.7 | |
| | | | | 2,431.4 | | | | – | | | | – | | | | 2,431.4 | | | | (29.0 | ) | | | 2,402.4 | |
| | | | | 4,516.2 | | | | (62.8 | ) | | | (11.4 | ) | | | 4,442.0 | | | | (87.3 | ) | | | 4,354.7 | |
| | | | | 15,600.8 | | | | (318.5 | ) | | | (59.2 | ) | | | 15,223.1 | | | | (407.8 | ) | | | 14,815.3 | |
| | | | | 4,989.4 | | | | (303.3 | ) | | | (3.3 | ) | | | 4,682.8 | | | | – | | | | 4,682.8 | |
| | | | $ | 20,590.2 | | | $ | (621.8 | ) | | $ | (62.5 | ) | | $ | 19,905.9 | | | $ | (407.8 | ) | | $ | 19,498.1 | |
| | | | | | | | | | | | | | | | | | | | | | | | | | |
| | | | $ | 8,995.8 | | | $ | (611.4 | ) | | $ | (311.5 | ) | | $ | 8,072.9 | | | $ | (304.0 | ) | | $ | 7,768.9 | |
| | | | | 1,537.3 | | | | (145.3 | ) | | | (1.7 | ) | | | 1,390.3 | | | | (23.7 | ) | | | 1,366.6 | |
| | | | | 2,387.4 | | | | – | | | | – | | | | 2,387.4 | | | | (29.9 | ) | | | 2,357.5 | |
| | | | | 4,945.6 | | | | (183.6 | ) | | | (40.1 | ) | | | 4,721.9 | | | | (58.6 | ) | | | 4,663.3 | |
| | | | | 17,866.1 | | | | (940.3 | ) | | | (353.3 | ) | | | 16,572.5 | | | | (416.2 | ) | | | 16,156.3 | |
| | | | | 8,584.6 | | | | (498.6 | ) | | | (10.1 | ) | | | 8,075.9 | | | | – | | | | 8,075.9 | |
| | | | $ | 26,450.7 | | | $ | (1,438.9 | ) | | $ | (363.4 | ) | | $ | 24,648.4 | | | $ | (416.2 | ) | | $ | 24,232.2 | |
(1) | | Non-accretable discount includes certain accretable discount amounts relating to non-accrual loans for which accretion has been suspended. |
Item 7: Management’s Discussion and Analysis
44 CIT ANNUAL REPORT 2012
The following table presents charge-offs, by business segment. SeeResults by Business Segment for additional information.
Charge-offs as a Percentage of Average Finance Receivables (dollars in millions)
| | | | Years Ended December 31,
| |
|---|
| | | | CIT
| | Predecessor CIT
| |
|---|
| | | | 2012
| | 2011
| | 2010
| | 2009
| | 2008
| |
|---|
| | | | | | | | | | | | | | | | | | | | | | | | | | | | | | | | | | | | | | | | |
| | | | $ | 52.7 | | | | 0.70 | % | | $ | 239.6 | | | | 3.31 | % | | $ | 257.7 | | | | 2.49 | % | | $ | 1,427.2 | | | | 7.92 | % | | $ | 186.6 | | | |
| | | | | 11.7 | | | | 0.69 | % | | | 6.6 | | | | 0.48 | % | | | 4.8 | | | | 0.29 | % | | | 3.4 | | | | 0.14 | % | | | – | | | |
| | | | | 8.6 | | | | 0.36 | % | | | 21.1 | | | | 0.85 | % | | | 29.8 | | | | 1.12 | % | | | 111.8 | | | | 2.42 | % | | | 64.1 | | | |
| | | | | 67.8 | | | | 1.49 | % | | | 97.2 | | | | 2.16 | % | | | 191.9 | | | | 2.81 | % | | | 386.4 | | | | 3.36 | % | | | 181.2 | | | |
| | | | | 140.8 | | | | 0.87 | % | | | 364.5 | | | | 2.34 | % | | | 484.2 | | | | 2.25 | % | | | 1,928.8 | | | | 5.27 | % | | | 431.9 | | | |
| | | | | 1.0 | | | | 0.02 | % | | | 4.3 | | | | 0.06 | % | | | 26.1 | | | | 0.30 | % | | | 139.4 | | | | 1.17 | % | | | 125.9 | | | |
| | | | $ | 141.8 | | | | 0.70 | % | | $ | 368.8 | | | | 1.61 | % | | $ | 510.3 | | | | 1.68 | % | | $ | 2,068.2 | | | | 4.27 | % | | $ | 557.8 | | | |
| | | | | | | | | | | | | | | | | | | | | | | | | | | | | | | | | | | | | | | | |
| | | | $ | 20.3 | | | | 0.27 | % | | $ | 33.5 | | | | 0.46 | % | | $ | 12.0 | | | | 0.12 | % | | $ | 40.4 | | | | 0.22 | % | | $ | 14.5 | | | |
| | | | | – | | | | – | | | | 0.1 | | | | 0.01 | % | | | – | | | | – | | | | 0.9 | | | | 0.04 | % | | | 1.3 | | | |
| | | | | 7.8 | | | | 0.33 | % | | | 10.9 | | | | 0.44 | % | | | 1.2 | | | | 0.04 | % | | | 3.2 | | | | 0.07 | % | | | 1.9 | | | |
| | | | | 39.0 | | | | 0.86 | % | | | 57.9 | | | | 1.29 | % | | | 31.8 | | | | 0.47 | % | | | 58.0 | | | | 0.50 | % | | | 43.6 | | | |
| | | | | 67.1 | | | | 0.41 | % | | | 102.4 | | | | 0.66 | % | | | 45.0 | | | | 0.21 | % | | | 102.5 | | | | 0.28 | % | | | 61.3 | | | |
| | | | | 0.5 | | | | 0.01 | % | | | 1.2 | | | | 0.02 | % | | | 0.8 | | | | 0.01 | % | | | 7.1 | | | | 0.06 | % | | | 6.0 | | | |
| | | | $ | 67.6 | | | | 0.33 | % | | $ | 103.6 | | | | 0.45 | % | | $ | 45.8 | | | | 0.15 | % | | $ | 109.6 | | | | 0.23 | % | | $ | 67.3 | | | |
| | | | | | | | | | | | | | | | | | | | | | | | | | | | | | | | | | | | | | | | |
| | | | $ | 32.4 | | | | 0.43 | % | | $ | 206.1 | | | | 2.85 | % | | $ | 245.7 | | | | 2.37 | % | | $ | 1,386.8 | | | | 7.70 | % | | $ | 172.1 | | | |
| | | | | 11.7 | | | | 0.69 | % | | | 6.5 | | | | 0.47 | % | | | 4.8 | | | | 0.29 | % | | | 2.5 | | | | 0.10 | % | | | (1.3 | ) | | |
| | | | | 0.8 | | | | 0.03 | % | | | 10.2 | | | | 0.41 | % | | | 28.6 | | | | 1.08 | % | | | 108.6 | | | | 2.35 | % | | | 62.2 | | | |
| | | | | 28.8 | | | | 0.63 | % | | | 39.3 | | | | 0.87 | % | | | 160.1 | | | | 2.34 | % | | | 328.4 | | | | 2.86 | % | | | 137.6 | | | |
| | | | | 73.7 | | | | 0.46 | % | | | 262.1 | | | | 1.68 | % | | | 439.2 | | | | 2.04 | % | | | 1,826.3 | | | | 4.99 | % | | | 370.6 | | | |
| | | | | 0.5 | | | | 0.01 | % | | | 3.1 | | | | 0.04 | % | | | 25.3 | | | | 0.29 | % | | | 132.3 | | | | 1.11 | % | | | 119.9 | | | |
| | | | $ | 74.2 | | | | 0.37 | % | | $ | 265.2 | | | | 1.16 | % | | $ | 464.5 | | | | 1.53 | % | | $ | 1,958.6 | | | | 4.04 | % | | $ | 490.5 | | | |
(1) | | Net charge-offs do not include recoveries of loans charged off pre-emergence and loans charged off prior to transfer to held for sale, which are recorded in Other Income. |
Gross and net charge-offs, both in amount and as a percentage of AFR, declined to their lowest levels since 2007. Net charge-offs in the Commercial segments declined to 0.46% of AFR from 1.68% in 2011, with all segments except Transportation Finance contributing to the decline. The Transportation Finance write-offs of 0.69% for the current year primarily reflected charge-offs on two loans secured by aviation equipment, which introduced short-term volatility to the trends. Recoveries, while down from 2011 in amount, remained strong in relation to gross charge-offs.
Following a spike in 2009, Vendor Finance charge-offs were high in 2010 due to a policy refinement in the third quarter, which accelerated delinquency-based charge-offs to 150 days from the previous 180 days. Charge-off trends have consistently improved since then. The decline in Consumer charge-offs over the time period above reflects the reduction in the private student loan portfolio. As of December 31, 2012, the Consumer portfolio consists of student loans that are 97%–98% guaranteed by the U.S. government, thereby mitigating our ultimate credit risk.
CIT ANNUAL REPORT 2012 45
The tables below present information on non-performing loans, which includes assets held for sale for each period:
Non-accrual and Accruing Past Due Loans at December 31 (dollars in millions)
| | | | CIT
| | Predecessor CIT
| |
|---|
| | | | 2012
| | 2011
| | 2010
| | 2009
| | 2009(1)
| | 2008
|
|---|
| | | | | | | | | | | | | | | | | | | | | | | | | | |
| | | | $ | 273.2 | | | $ | 623.3 | | | $ | 1,336.1 | | | $ | 1,465.5 | | | $ | 2,335.3 | | | $ | 1,081.7 | |
| | | | | 57.0 | | | | 77.8 | | | | 280.7 | | | | 108.8 | | | | 292.4 | | | | 138.8 | |
| | | | | 330.2 | | | | 701.1 | | | | 1,616.8 | | | | 1,574.3 | | | | 2,627.7 | | | | 1,220.5 | |
| | | | | 1.6 | | | | 0.9 | | | | 0.7 | | | | 0.1 | | | | 197.7 | | | | 194.1 | |
| | | | $ | 331.8 | | | $ | 702.0 | | | $ | 1,617.5 | | | $ | 1,574.4 | | | $ | 2,825.4 | | | $ | 1,414.6 | |
Troubled Debt Restructurings | | | | | | | | | | | | | | | | | | | | | | | | | | |
| | | | $ | 263.2 | | | $ | 427.5 | | | $ | 412.4 | | | $ | 116.5 | | | $ | 189.2 | | | $ | 107.6 | |
| | | | | 25.9 | | | | 17.7 | | | | 49.3 | | | | 4.5 | | | | 24.9 | | | | 21.7 | |
| | | | $ | 289.1 | | | $ | 445.2 | | | $ | 461.7 | | | $ | 121.0 | | | $ | 214.1 | | | $ | 129.3 | |
Accruing loans past due 90 days or more | | | | | | | | | | | | | | | | | | | | | | | | | | |
Government guaranteed accruing student loans past due 90 days or more | | | | $ | 231.4 | | | $ | 390.3 | | | $ | 433.6 | | | $ | 480.7 | | | $ | 493.7 | | | $ | 466.5 | |
Other accruing loans past due 90 days or more | | | | | 3.4 | | | | 2.2 | | | | 1.7 | | | | 89.4 | | | | 88.2 | | | | 203.1 | |
Accruing loans past due 90 days or more | | | | $ | 234.8 | | | $ | 392.5 | | | $ | 435.3 | | | $ | 570.1 | | | $ | 581.9 | | | $ | 669.6 | |
(1) | | Reflects balances pre-FSA. |
Segment Non-accrual Loans as a Percentage of Finance Receivables at December 31 (dollars in millions)
| | | | 2012
| | 2011
| | 2010
| |
|---|
| | | | $ | 211.9 | | | | 2.59 | % | | $ | 497.9 | | | | 7.26 | % | | $ | 1,225.0 | | | | 15.17 | % |
| | | | | 40.5 | | | | 2.18 | % | | | 45.0 | | | | 3.03 | % | | | 63.2 | | | | 4.55 | % |
| | | | | 6.0 | | | | 0.26 | % | | | 75.3 | | | | 3.10 | % | | | 164.4 | | | | 6.89 | % |
| | | | | 71.8 | | | | 1.49 | % | | | 82.9 | | | | 1.87 | % | | | 164.2 | | | | 3.48 | % |
| | | | | 330.2 | | | | 1.93 | % | | | 701.1 | | | | 4.61 | % | | | 1,616.8 | | | | 9.77 | % |
| | | | | 1.6 | | | | 0.04 | % | | | 0.9 | | | | 0.02 | % | | | 0.7 | | | | 0.01 | % |
| | | | $ | 331.8 | | | | 1.59 | % | | $ | 702.0 | | | | 3.53 | % | | $ | 1,617.5 | | | | 6.57 | % |
Similar to last year, non-accrual loans declined in excess of 50% from the prior year, with all commercial segments reporting reductions, both in amount and as a percentage of finance receivables. The improvement in 2012 was particularly noteworthy in Trade Finance and Corporate Finance, which reflected repayments and resolutions, as well as returns to accrual status where appropriate.
As mentioned earlier, our credit metrics have been improving since the latter half of 2010. Non-accrual levels at June 30, 2010 were at, or near, historical highs, due to the combination of continued global economic weakness and circumstances specific to the Company’s emergence from bankruptcy. This was most evident in Corporate Finance and Trade Finance. In Corporate Finance, non-accrual loans had increased significantly in the printing, publishing, commercial real estate, energy, lodging, leisure and small business sectors. The segment’s cash flow portfolio was most severely impacted. In Trade Finance, nonaccrual balances increased in 2010 from 2009 as clients and retailers remained challenged by reduced consumer demand resulting from high unemployment levels.
Approximately 80% of our non-accrual accounts were paying currently at December 31, 2012, and our impaired loan carrying value (including FSA discount, specific reserves and charge-offs) to estimated outstanding contractual balances approximated 65%. For this purpose, impaired loans are comprised principally of non-accrual loans over $500,000 and TDRs.
Total delinquency (30 days or more) in our commercial segments were flat as a percentage of finance receivables at 1.7%, but did experience a $27 million increase compared to December 31, 2011. An increase in the 30 – 59 day category of $73 million was partially offset by decreases in the 60-89 and 90+ categories, and reflected certain non-credit (administrative) delinquencies in Vendor Finance, as well as normal month to month fluctuations.
Item 7: Management’s Discussion and Analysis
46 CIT ANNUAL REPORT 2012
Foregone Interest on Non-accrual Loans and Troubled Debt Restructurings (dollars in millions)
| | | | 2012
| | 2011
| | 2010
| |
|---|
| | | | U.S.
| | Foreign
| | Total
| | U.S.
| | Foreign
| | Total
| | U.S.
| | Foreign
| | Total
|
|---|
Interest revenue that would have been earned at original terms | | | | $ | 66.5 | | | $ | 12.1 | | | $ | 78.6 | | | $ | 169.4 | | | $ | 18.6 | | | $ | 188.0 | | | $ | 244.7 | | | $ | 35.6 | | | $ | 280.3 | |
| | | | | 23.7 | | | | 3.7 | | | | 27.4 | | | | 18.7 | | | | 6.0 | | | | 24.7 | | | | 35.4 | | | | 15.0 | | | | 50.4 | |
Foregone interest revenue | | | | $ | 42.8 | | | $ | 8.4 | | | $ | 51.2 | | | $ | 150.7 | | | $ | 12.6 | | | $ | 163.3 | | | $ | 209.3 | | | $ | 20.6 | | | $ | 229.9 | |
The Company periodically modifies the terms of loans / finance receivables in response to borrowers’ difficulties. Modifications that include a financial concession to the borrower, which otherwise would not have been considered, are accounted for as troubled debt restructurings (“TDRs”). For those accounts that were modified but were not considered to be TDRs, it was determined that no concessions had been granted by CIT to the borrower. Borrower compliance with the modified terms is the primary measurement that we use to determine the success of these programs.
The tables that follow reflect loan carrying values as of December 31, 2012 and 2011 of accounts that have been modified.
Troubled Debt Restructurings and Modifications at December 31 (dollars in millions)
| | | | 2012
| | 2011
| | 2010
| |
|---|
| | | | Excluding
FSA
| | Including
FSA
| | %
Compliant(1)
| | Excluding
FSA
| | Including
FSA
| | %
Compliant(1)
| | Excluding
FSA
| | Including
FSA
| | %
Compliant(1)
|
|---|
Troubled Debt Restructurings | | | | | | | | | | | | | | | | | | | | | | | | | | | | | | | | | | | | | | |
Deferral of principal and/or interest | | | | $ | 258.2 | | | $ | 248.5 | | | | 98 | % | | $ | 461.8 | | | $ | 394.8 | | | | 94 | % | | $ | 345.8 | | | $ | 247.9 | | | | 86 | % |
| | | | | 2.8 | | | | 2.5 | | | | 95 | % | | | 17.9 | | | | 12.5 | | | | 96 | % | | | 66.1 | | | | 45.4 | | | | 96 | % |
| | | | | 14.9 | | | | 14.8 | | | | 100 | % | | | 24.6 | | | | 19.0 | | | | 100 | % | | | 9.1 | | | | 7.4 | | | | 99 | % |
Covenant relief and other | | | | | 25.4 | | | | 23.3 | | | | 80 | % | | | 27.0 | | | | 18.9 | | | | 77 | % | | | 188.8 | | | | 161.0 | | | | 55 | % |
| | | | $ | 301.3 | | | $ | 289.1 | | | | 97 | % | | $ | 531.3 | | | $ | 445.2 | | | | 94 | % | | $ | 609.8 | | | $ | 461.7 | | | | 76 | % |
| | | | | 29 | % | | | 29 | % | | | | | | | 66 | % | | | 63 | % | | | | | | | 95 | % | | | 95 | % | | | | |
Modifications(2)
| | | | Excluding
FSA
| | %
Compliant(1)
| | | | Excluding
FSA
| | %
Compliant(1)
| | | | Excluding
FSA
| | %
Compliant(1)
| | |
|---|
| | | | $ | 124.7 | | | | 97 | % | | | | | | $ | 183.6 | | | | 100 | % | | | | | | $ | 93.0 | | | | 100 | % | | | | |
| | | | | 115.5 | | | | 100 | % | | | | | | | 157.4 | | | | 100 | % | | | | | | | 61.4 | | | | 100 | % | | | | |
Interest rate increase/additional collateral | | | | | 80.3 | | | | 100 | % | | | | | | | 14.9 | | | | 100 | % | | | | | | | 126.3 | | | | 100 | % | | | | |
| | | | | – | | | | – | | | | | | | | 0.3 | | | | 100 | % | | | | | | | 19.1 | | | | 98 | % | | | | |
| | | | | 62.8 | | | | 100 | % | | | | | | | 120.4 | | | | 100 | % | | | | | | | 71.0 | | | | 63 | % | | | | |
| | | | $ | 383.3 | | | | 99 | % | | | | | | $ | 476.6 | | | | 100 | % | | | | | | $ | 370.8 | | | | 93 | % | | | | |
| | | | | 27 | % | | | | | | | | | | | 10 | % | | | | | | | | | | | 41 | % | | | | | | | | |
(1) | | % Compliant is calculated using carrying values including FSA for Troubled Debt Restructurings and carrying values excluding FSA for Modifications. |
(2) | | Table depicts the predominant element of each modification, which may contain several of the characteristics listed. |
SeeNote 2 — Loans for additional information regarding TDRs and other credit quality information.
CIT ANNUAL REPORT 2012 47
Non-interest Income (dollars in millions)
| | | | Years Ended December 31,
| |
|---|
| | | | 2012
| | 2011
| | 2010
|
|---|
Rental income on operating leases | | | | $ | 1,784.6 | | | $ | 1,667.5 | | | $ | 1,648.4 | |
| | | | | | | | | | | | | | |
| | | | $ | 126.5 | | | $ | 132.5 | | | $ | 145.0 | |
Gains on sales of leasing equipment | | | | | 117.6 | | | | 148.4 | | | | 156.3 | |
| | | | | 86.1 | | | | 97.5 | | | | 124.0 | |
Gains on loan and portfolio sales | | | | | 192.3 | | | | 305.9 | | | | 267.2 | |
Counterparty receivable accretion | | | | | 96.1 | | | | 109.9 | | | | 93.9 | |
Recoveries of loans charged off pre-emergence and loans charged off prior to transfer to held for sale | | | | | 55.0 | | | | 124.1 | | | | 278.8 | |
| | | | | 40.2 | | | | 45.7 | | | | 18.9 | |
Losses on derivatives and foreign currency exchange | | | | | (5.7 | ) | | | (5.2 | ) | | | (60.4 | ) |
Impairment on assets held for sale | | | | | (115.6 | ) | | | (113.1 | ) | | | (25.9 | ) |
| | | | | 60.6 | | | | 107.1 | | | | 7.1 | |
| | | | | 653.1 | | | | 952.8 | | | | 1,004.9 | |
| | | | $ | 2,437.7 | | | $ | 2,620.3 | | | $ | 2,653.3 | |
Non-interest Income includes Rental Income on Operating Leases and Other Income.
Rental income on operating leases from equipment we lease is recognized on a straight line basis over the lease term. Rental income is discussed in“Net Finance Revenues” and “Results by Business Segment”. See also“Note 4 — Operating Lease Equipment” and“Concentrations – Operating Leases” for additional information on operating leases.
Other income declined in 2012 and 2011 reflecting the following:
Factoring commissions declined from 2011 and 2010, reflecting lower factoring volumes.
Gains on sales of leasing equipment resulted from sales volume of $1.3 billion in 2012, $1.1 billion in 2011, and $0.9 billion in 2010. The amount of gains will vary based on volume and type of equipment sold. Equipment sales for 2012 consisted of $0.7 billion in Transportation Finance assets, with the remainder split between Vendor Finance assets and Corporate Finance assets. Equipment sales for 2011 consisted of $0.5 billion in Transportation Finance assets, $0.4 billion in Vendor Finance assets and $0.2 billion in Corporate Finance assets. Equipment sales for 2010 consisted of $0.5 billion in Vendor Finance assets, $0.2 billion in Transportation Finance assets and $0.2 billion in Corporate Finance assets.
Fee revenues include fees on lines of credit and letters of credit, syndication related fees, agent and advisory fees, and servicing fees for the loans we sell but retain servicing. Agent and advisory fees declined over the past three years due to lower deal activity, and asset management and servicing fees declined on lower asset levels. Fee revenues are mainly driven by our Corporate Finance segment, which includes fees from servicing SBL loans.
Gains on loan and portfolio sales reflected 2012 sales volume of $2.5 billion, which consisted of $2.1 billion in Consumer (student loans) and $0.4 billion in Corporate Finance. Although the majority of the assets sold were student loans, over 80% of the gains were on the Corporate Finance sales. The high gain percentage related to Corporate Finance resulted from the low carrying values as many of the loans sold were on non-accrual and included FSA adjustments. The 2011 sales volume totaled $2.5 billion, which consisted of $1.3 billion in Consumer, $0.7 billion in Corporate Finance, $0.4 billion in Vendor Finance, and approximately $0.1 billion in Transportation Finance. Corporate Finance generated over 70% of the gains. Sales volume was $4.2 billion in 2010, which consisted of $1.8 billion in Corporate Finance, $1.6 billion in Vendor Finance, $0.7 billion in Consumer, and $0.1 billion in Transportation Finance.
Counterparty receivable accretion relates to the FSA accretion of a fair value discount on the receivable from Goldman Sachs International (“GSI”) related to the GSI Facilities, which are total return swaps (as discussed inFunding and Liquidity). The discount is accreted into income over the expected term of the payout of the associated receivables. FSA accretion remaining on the counterparty receivable was $21 million at December 31, 2012. SeeFresh Start Accounting andFunding and Liquidity andNote 8 — Long-term Borrowings andNote 9 — Derivative Financial Instruments.
Recoveries of loans charged off pre-emergence and loans charged off prior to transfer to held for sale reflected repayments or other workout resolutions on loans charged off prior to emergence from bankruptcy and loans charged off prior to classification as held for sale. Unlike recoveries on loans charged off after our restructuring, these recoveries are recorded as other income, not as a reduction to the provision for loan losses. The decrease from the prior years, reflected a general downward trend as the
Item 7: Management’s Discussion and Analysis
48 CIT ANNUAL REPORT 2012
Company moves further away from its emergence date. Recoveries of loans charged off prior to transfer to held for sale increased in 2011 as Corporate Finance moved a pool of predominantly non-accrual loans to held for sale on which there was subsequent recovery activity.
Gains on investment sales reflected sales of equity investments, primarily in Corporate Finance.
Losses on derivatives and foreign currency exchange Transactional foreign currency movements resulted in gains of $37 million in 2012 and losses of $(42) million and $(64) million in 2011 and 2010, respectively. These were partially offset by losses of $(33) million in 2012, gains of $35 million in 2011 and $3 million in 2010 on derivatives that economically hedge foreign currency movements and other exposures. The 2010 losses were largely incurred in the first quarter before hedges were reestablished following our 2009 bankruptcy. In addition, derivative losses for 2012 included $(6) million related to the valuation of the derivatives within the GSI facility. Other significant amounts were losses of $(4) million in 2012 and gains of $2 million in 2011 on the realization of cumulative translation adjustment (CTA) amounts from AOCI upon the sale or substantial liquidation of a subsidiary. For additional information on the impact of derivatives on the income statement, please refer toNote 9 — Derivative Financial Instruments.
Impairment on assets held for sale in 2012 included $80 million of charges related to Vendor Finance operating lease equipment that were transferred to held for sale in 2011 and $34 million related to Transportation Finance equipment, mostly aerospace related. When a long-lived asset is classified as held for sale, depreciation expense is suspended and the asset is evaluated for impairment with any such charge recorded in other income. (SeeExpenses for related discussion ondepreciation on operating lease equipment.) The 2011 balance included $61 million of impairment charges related to Vendor Finance, $24 million related to $2.2 billion of government-guaranteed student loans and $22 million related to idle center beam railcars, which were scrapped in 2012. The 2010 balance included $11 million of impairment related to student loans and $12 million related to sale of Corporate Finance loans.
Other revenues include items that are more episodic in nature, such as proceeds received in excess of carrying value on non-accrual accounts held for sale, which were repaid or had another workout resolution, and insurance proceeds in excess of carrying value on damaged leased equipment, and also includes income from joint ventures. The 2012 amount included $8 million, down from $59 million in 2011, of proceeds received in excess of carrying value on non-accrual accounts held for sale, primarily Corporate Finance loans. Principal recovery on these accounts was reported in recoveries of loans charged off prior to transfer to held for sale. In the 2012 fourth quarter, Vendor Finance recognized a $14 million gain on a sale of a platform related to the Dell Europe transaction. Transportation Finance benefited in 2011 from $14 million related to an aircraft insurance claim and $11 million related to a change in the aircraft order book and corresponding acceleration of FSA. Other revenues in 2010 were not significant.
Other Expenses (dollars in millions)
| | | | Years Ended December 31,
| |
|---|
| | | | 2012
| | 2011
| | 2010
|
|---|
Depreciation on operating lease equipment | | | | $ | 533.2 | | | $ | 575.1 | | | $ | 675.8 | |
| | | | | | | | | | | | | | |
Compensation and benefits | | | | $ | 538.7 | | | $ | 494.8 | | | $ | 570.7 | |
| | | | | 81.6 | | | | 75.3 | | | | 75.1 | |
| | | | | 64.8 | | | | 120.9 | | | | 114.8 | |
Advertising and marketing | | | | | 36.5 | | | | 10.5 | | | | 4.6 | |
| | | | | 36.2 | | | | 39.4 | | | | 48.9 | |
Provision for severance and facilities exiting activities | | | | | 22.7 | | | | 13.1 | | | | 52.2 | |
| | | | | 137.7 | | | | 142.6 | | | | 158.8 | |
| | | | | 918.2 | | | | 896.6 | | | | 1,025.1 | |
Loss on debt extinguishments | | | | | 61.2 | | | | 134.8 | | | | – | |
| | | | $ | 1,512.6 | | | $ | 1,606.5 | | | $ | 1,700.9 | |
| | | | | 3,560 | | | | 3,530 | | | | 3,780 | |
Depreciation on operating lease equipment is recognized on owned equipment over the lease term or estimated useful life of the asset. Key influences on depreciation are asset mix and impairments. Depreciation expense is primarily driven by the Transportation Finance operating lease equipment portfolio, which includes long-lived assets such as rail cars and aircraft. Impairments recorded on equipment held in portfolio are reported as depreciation expense. Also impacting the balance
CIT ANNUAL REPORT 2012 49
are assets held for sale and FSA accretion. Depreciation expense is suspended on operating lease equipment once it is transferred to held for sale. While in held for sale, the Company tests for impairment, and charges are recorded in Other Income. The amount of depreciation not recognized on operating lease equipment in assets held for sale totaled $96 million for 2012 and $68 million for 2011, most of which related to Vendor Finance and was not significant in 2010. Depreciation expense includes a component of FSA adjustments, which reduced depreciation expense by $214 million for 2012, $240 million for 2011 and $274 million for 2010. See“Net Finance Revenues” and “Non-interest Income”.
Operating expenses include Bank deposit raising costs of approximately $35 million in 2012, which are reflected across various expense categories but mostly within advertising and marketing. Operating expenses were up 2% in 2012 and declined 13% in 2011 reflecting the following:
| - | | Compensation and benefits were up during 2012, driven by incentive compensation expense, which includes the amortization of deferred compensation, and a higher number of employees. Deferred compensation plans were re-instated annually post emergence and the costs associated with the plans are amortized over a three year period. Thus, 2012 included two years of amortization of deferred costs, which will increase to the full three years in 2013 and therafter. Compensation and benefits decreased in 2011 primarily due to headcount reduction and because 2010 included additional retention related incentive compensation costs. SeeNote 18 — Retirement, Postretirement and Other Benefit Plans. |
| - | | Professional fees includes legal and other professional fees such as tax, audit, and consulting services. The decrease in 2012 reflected amounts received on favorable legal and tax resolutions and lower (although still elevated) consulting costs for risk management and other projects. The 5% increase in 2011 was primarily due to higher risk management consulting fees and litigation-related costs. |
| - | | Advertising and marketing expenses increased, reflecting higher amounts associated with CIT Bank. CIT Bank costs totaled $24 million in 2012, up from $1 million in 2011, reflecting costs associated with raising deposits. |
| - | | Provision for severance and facilities exiting activities reflects costs associated with various organization efficiency initiatives. Severance costs include employee termination benefits incurred in conjunction with these initiatives. The facility exiting activities primarily relate to location closings and include impact of outsourcing of student loan portfolio servicing in 2011 and facility consolidation charges principally in the New York region in 2010. SeeNote 25 — Severance and Facility Exiting Liabilities for additional information. |
| - | | Other expenses includes items such as travel and entertainment, insurance, FDIC costs, office equipment and supply costs and taxes (other than income taxes). |
Losses (gains) on debt extinguishments for 2012 reflect the write-off of accelerated fees and underwriting costs related to liability management actions taken, which included the repayment of the remaining Series A Notes and all of the 7% Series C Notes. The 2011 loss is primarily due to the write-off of original issue discount and fees associated with the repayment of the first lien term loan, partially offset by a modest gain from the repurchase of approximately $400 million of Series A debt at a discount in open market transactions.
Upon emergence from bankruptcy in 2009, CIT applied Fresh Start Accounting (FSA) in accordance with generally accepted accounting principles in the United States of America (GAAP). SeeNote 1 — Business and Summary of Significant Accounting Policies. Accretion and amortization of certain FSA adjustments are reflected in operating results as briefly described below.
FSA remained a significant factor on our Net Finance Revenue in 2012, while the impact on Credit Metrics trends had lessened. Net finance revenue reflected the accretion of the FSA adjustments to the loans and leases, debt, as well as depreciation and, to a lesser extent, rental income. As the FSA remaining on debt has diminished due to the significant acceleration of debt related FSA associated with debt repayment activity, the remaining amortization of long-term borrowings FSA discount (most of which is on secured borrowings) will more closely match the accretion of FSA discount on loans, reducing volatility of net finance revenue. Therefore, the most significant remaining discount of $2.6 billion relates to operating lease equipment, which is accreted over a long period of time.
Given the impact of FSA on CIT’s financial statements and, to a lesser extent, credit metrics, the results are generally not comparable with those of other financial institutions.
Item 7: Management’s Discussion and Analysis
50 CIT ANNUAL REPORT 2012
The following table presents FSA adjustments by balance sheet caption:
Accretable Fresh Start Accounting (Discount) / Premium (dollars in millions)
| | | | December 31,
2012
| | December 31,
2011
| | December 31,
2010
|
|---|
| | | | $ | (355.3 | ) | | $ | (621.8 | ) | | $ | (1,438.9 | ) |
Operating lease equipment, net | | | | | (2,550.6 | ) | | | (2,803.1 | ) | | | (3,020.9 | ) |
| | | | | 31.9 | | | | 63.6 | | | | 119.2 | |
| | | | | (20.8 | ) | | | (117.1 | ) | | | (226.9 | ) |
| | | | $ | (2,894.8 | ) | | $ | (3,478.4 | ) | | $ | (4,567.5 | ) |
| | | | $ | 3.5 | | | $ | 14.5 | | | $ | 38.5 | |
| | | | | (369.4 | ) | | | (2,018.9 | ) | | | (2,948.5 | ) |
| | | | | 1.7 | | | | 25.7 | | | | 112.2 | |
| | | | $ | (364.2 | ) | | $ | (1,978.7 | ) | | $ | (2,797.8 | ) |
Interest income is increased by the FSA accretion on loans. Going forward, most of this will relate to Consumer as the majority of the remaining balance as of December 31, 2012 is associated with this portfolio. Due to the contractual maturity of the underlying loans, the majority of the accretion on consumer loans will be over a long time period, generally 10 years, while most commercial loan accretion income will be realized within the next 2 years. In addition to the yield related accretion on loans, the decline in accretable balance has been accelerated, primarily as a result of asset sales. There is $22 million of non-accretable discount remaining at December 31, 2012.
Interest expense is increased by the accretion of the FSA discounts on long-term borrowings, which is recognized over the time to contractual maturity of the underlying debt. We have repaid debt prior to its contractual maturity, and the repayments were accounted for as a debt extinguishment, which accelerated the accretion of the FSA discount on the underlying debt, resulting in an increase to interest expense of approximately $1.5 billion in 2012 and $279 million in 2011 and a decrease in interest expense of $86 million in 2010. If the repayments had been accounted for as a debt modification, the FSA discount would have been amortized over the term of the new financing on an effective yield method.
At December 31, 2012, long-term borrowings included approximately $330 million of remaining FSA discount on secured borrowings, consisting primarily of approximately 75% secured by student loans and 20% secured by aircraft. The maturity dates for the secured borrowings at December 31, 2012, range from 2013 – 2040. Approximately 80% of the FSA discount is expected to be recognized by the end of 2021. The remaining $39 million of FSA accretion on long term borrowings relates to other debt.
Depreciation expense is reduced by the accretion of the operating lease equipment discount, essentially all of which is related to Transportation Finance aircraft and rail operating lease assets. We estimated an economic average life before disposal of these assets of approximately 15 years for aerospace assets and 30 years for rail assets.
An intangible asset was recorded to adjust operating lease rents that were, in aggregate, above then current market rental rates. These adjustments (net) will be amortized, thereby lowering rental income (a component of Non-interest Income) over the remaining term of the lease agreements on a straight line basis. The majority of the remaining accretion has a contractual maturity of less than two years.
Other assets relates primarily to a discount on receivables from GSI in conjunction with the GSI Facilities. The discount is accreted into other income as‘counterparty receivable accretion’ over the expected payout of the associated receivables. The GSI Facilities are discussed in“Funding, Liquidity and Capital” andalso inNote 8 — Long-term Borrowings, andNote 9 — Derivative Financial Instruments inItem 8 Financial Statements and Supplementary Data.
CIT ANNUAL REPORT 2012 51
The following table summarizes the impact of accretion and amortization of FSA adjustments on the Consolidated Statement of Operations:
Accretion/(Amortization) of Fresh Start Accounting Adjustments (dollars in millions)
| | | | Corporate
Finance
| | Transportation
Finance
| | Trade
Finance
| | Vendor
Finance
| | Consumer
| | Corporate
and Other
| | Total CIT
|
|---|
| | | | Year Ended December 31, 2012
| |
|---|
| | | | $ | 136.8 | | | $ | 29.0 | | | $ | – | | | $ | 46.0 | | | $ | 55.8 | | | $ | – | | | $ | 267.6 | |
| | | | | (268.3 | ) | | | (725.0 | ) | | | (49.9 | ) | | | (211.9 | ) | | | (187.5 | ) | | | (195.9 | ) | | | (1,638.5 | ) |
Rental income on operating leases | | | | | – | | | | (24.8 | ) | | | – | | | | – | | | | – | | | | – | | | | (24.8 | ) |
| | | | | 2.5 | | | | 208.9 | | | | – | | | | 2.5 | | | | – | | | | – | | | | 213.9 | |
FSA – net finance revenue | | | | | (129.0 | ) | | | (511.9 | ) | | | (49.9 | ) | | | (163.4 | ) | | | (131.7 | ) | | | (195.9 | ) | | | (1,181.8 | ) |
| | | | | 73.9 | | | | 14.8 | | | | – | | | | – | | | | 7.4 | | | | – | | | | 96.1 | |
| | | | $ | (55.1 | ) | | $ | (497.1 | ) | | $ | (49.9 | ) | | $ | (163.4 | ) | | $ | (124.3 | ) | | $ | (195.9 | ) | | $ | (1,085.7 | ) |
| |
| | | | Year Ended December 31, 2011
|
| | | | $ | 466.5 | | | $ | 61.1 | | | $ | – | | | $ | 136.3 | | | $ | 81.5 | | | $ | – | | | $ | 745.4 | |
| | | | | (366.0 | ) | | | (230.8 | ) | | | (19.7 | ) | | | (89.5 | ) | | | (151.7 | ) | | | (46.3 | ) | | | (904.0 | ) |
Rental income on operating leases | | | | | – | | | | (56.1 | ) | | | – | | | | – | | | | – | | | | – | | | | (56.1 | ) |
| | | | | 4.5 | | | | 225.4 | | | | – | | | | 10.1 | | | | – | | | | – | | | | 240.0 | |
FSA – net finance revenue | | | | | 105.0 | | | | (0.4 | ) | | | (19.7 | ) | | | 56.9 | | | | (70.2 | ) | | | (46.3 | ) | | | 25.3 | |
| | | | | 84.6 | | | | 16.9 | | | | – | | | | – | | | | 8.4 | | | | – | | | | 109.9 | |
| | | | $ | 189.6 | | | $ | 16.5 | | | $ | (19.7 | ) | | $ | 56.9 | | | $ | (61.8 | ) | | $ | (46.3 | ) | | $ | 135.2 | |
| |
| | | | Year Ended December 31, 2010
|
| | | | $ | 1,099.6 | | | $ | 105.4 | | | $ | 15.4 | | | $ | 281.3 | | | $ | 118.8 | | | $ | – | | | $ | 1,620.5 | |
| | | | | (218.2 | ) | | | (103.9 | ) | | | (8.1 | ) | | | (41.6 | ) | | | (24.7 | ) | | | 1.8 | | | | (394.7 | ) |
Rental income on operating leases | | | | | – | | | | (103.7 | ) | | | – | | | | – | | | | – | | | | – | | | | (103.7 | ) |
| | | | | 7.6 | | | | 232.6 | | | | – | | | | 34.2 | | | | – | | | | – | | | | 274.4 | |
FSA – net finance revenue | | | | | 889.0 | | | | 130.4 | | | | 7.3 | | | | 273.9 | | | | 94.1 | | | | 1.8 | | | | 1,396.5 | |
| | | | | 72.2 | | | | 14.5 | | | | – | | | | – | | | | 7.2 | | | | 0.1 | | | | 94.0 | |
| | | | $ | 961.2 | | | $ | 144.9 | | | $ | 7.3 | | | $ | 273.9 | | | $ | 101.3 | | | $ | 1.9 | | | $ | 1,490.5 | |
| |
| | | | | | | | | | | | | | | | | | | | | | | | | | | | | | |
Income Tax Data (dollars in millions)
| | | | Years Ended December 31,
| |
|---|
| | | | 2012
| | 2011
| | 2010
|
|---|
Provision for income taxes, before discrete items | | | | $ | 93.3 | | | $ | 139.4 | | | $ | 190.4 | |
| | | | | 40.5 | | | | 19.2 | | | | 55.3 | |
Provision for income taxes | | | | $ | 133.8 | | | $ | 158.6 | | | $ | 245.7 | |
| | | | | (29.4 | )% | | | 89.0 | % | | | 31.8 | % |
The effective tax rate each year is impacted by a number of factors, including the relative mix of domestic and foreign earnings, valuation allowances in various jurisdictions, and discrete items. As a result, the effective tax rate is not indicative of the rate for near term future periods.
The 2012 provision reflects income tax expense on the earnings of certain international operations and no income tax benefit on the domestic losses. The Company has not recognized any tax benefit on its domestic losses due to uncertainties related to the ability to realize in the future its net deferred tax assets. At December 31, 2012, the Company maintains valuation allowances of approximately $187 million on the net deferred tax assets related to its foreign reporting entities. Certain foreign entities with net operating loss carry-forwards have recently generated
Item 7: Management’s Discussion and Analysis
52 CIT ANNUAL REPORT 2012
profits, however, the Company continues to record a full valuation allowance on these entities’ net deferred tax assets due to their history of losses. A sustained period of profitability in these foreign entities is required before the Company would change their judgment regarding the need for valuation allowances against the net deferred tax assets. The Company utilizes a rolling three years of actual earnings as the primary measure of assessing a need for or possible release of valuation allowances, adjusted for any non-recurring items. Continued improvement in operating results, could lead to reversal of some of the foreign reporting entities’ valuation allowances.
The Company’s 2012 tax provision of $133.8 million decreased from $158.6 million in 2011 and $245.7 million in 2010. The decreases primarily reflect a reduction in foreign tax expense driven by lower international earnings offset by several discrete charges during the year.
The 2012 tax provision includes $40.5 million of net discrete tax expense items. The discrete items include:
| - | | Incremental taxes associated with international audit settlements. |
| - | | An increase in a U.S. deferred tax liability on certain indefinite life assets that cannot be used as a source of future taxable income in the assessment of the domestic valuation allowance. |
| - | | A tax benefit of $146.5 million caused by a release of tax reserves established on an uncertain tax position taken on certain tax losses following a favorable ruling from the tax authorities and a $98.4 million tax benefit associated with a tax position taken on a prior-year restructuring transaction. Both of these benefits were fully offset by corresponding increases to the domestic valuation allowance. |
The 2011 tax provision before discrete items of $139.4 million was primarily related to income tax expense on the earnings of certain international operations and no income tax benefit on its domestic losses. The discrete items of $19.2 million included an increase to an uncertain federal and state tax position that the Company has taken with respect to the recognition of certain losses, offset by a reduction in the domestic valuation allowance. Also, in the fourth quarter of 2011, consequent to a change in the Company’s assertions regarding indefinite reinvestment for certain unremitted foreign earnings, the Company recorded deferred tax expense of $12.2 million of foreign withholding taxes.
The 2010 tax provision before discrete items of $190.4 million was primarily driven by taxes on earnings from international operations and no income tax benefit recorded on the domestic losses. The tax provision of $55.3 million for discrete items primarily related to the establishment of valuation allowances against certain international net deferred tax assets partially offset by favorable settlements of prior year international tax audits. Income tax benefits were not recognized on domestic losses due to uncertainties related to the ability to realize in the future the net deferred tax assets.
SeeNote 17 — Income Taxes for additional information.
RESULTS BY BUSINESS SEGMENTAlthough down on a GAAP basis, pre-tax income was up in each segment except Vendor Finance when excluding debt redemption charges, net FSA accretion/amortization and accelerated OID on debt extinguishment related to the GSI facility for 2012. Financing and leasing assets were up in three of the commercial segments, while Trade Finance was down slightly.
We refined our expense and capital allocation methodologies during the first quarter of 2011. For 2011 and thereafter, Corporate and other includes certain costs that had been previously allocated to the segments, including prepayment penalties on high-cost debt payments and certain corporate liquidity costs, along with other debt extinguishment costs. In addition, we refined the capital and interest allocation methodologies for the segments, which management considered changes in estimations to better refine disclosure of segment profitability for users of the financial information on a go forward basis. These changes had the most impact on Transportation Finance given the capital requirements for their forward-purchase commitments and reduced the interest expense charged to this segment. The refinement was not significant to the other segments. The 2010 balances were not conformed to the 2011 presentation, but impacts on pre-tax earnings in Transportation Finance and Corporate and Other are noted in the respective sections.
SeeNote 23 — Business Segment Information for additional details.
The following table summarizes the reported pre-tax earnings of each segment, and the impacts of certain debt redemption actions. The pre-tax amounts excluding these actions are Non-GAAP measurements. SeeNon-GAAP Financial Measurements for discussion on the use of non-GAAP measurements.
CIT ANNUAL REPORT 2012 53
Impacts of FSA Accretion and Debt Redemption Charges on Pre-tax Income (Loss) by Segment (dollars in millions)
| | | | Year Ended December 31, 2012
| |
|---|
| | | | Corporate
Finance
| | Transportation
Finance
| | Trade
Finance
| | Vendor
Finance
| | Consumer
| | Corporate
& Other
| | Total
|
|---|
Pre-tax income/(loss) – reported | | | | $ | 200.2 | | | $ | (122.7 | ) | | $ | 4.1 | | | $ | (107.9 | ) | | $ | (52.0 | ) | | $ | (376.5 | ) | | $ | (454.8 | ) |
Accelerated FSA net discount/(premium) on debt extinguishments and repurchases | | | | | 222.2 | | | | 647.1 | | | | 46.4 | | | | 198.2 | | | | 156.0 | | | | 181.0 | | | | 1,450.9 | |
Debt related – loss on debt extinguishments | | | | | – | | | | – | | | | – | | | | – | | | | – | | | | 61.2 | | | | 61.2 | |
Accelerated OID on debt extinguishments related to the GSI facility | | | | | – | | | | (6.9 | ) | | | – | | | | – | | | | (45.7 | ) | | | – | | | | (52.6 | ) |
Pre-tax income (loss) – excluding debt redemption charges and OID acceleration | | | | | 422.4 | | | | 517.5 | | | | 50.5 | | | | 90.3 | | | | 58.3 | | | | (134.3 | ) | | | 1,004.7 | |
Net FSA accretion (excluding debt related acceleration) | | | | | (167.1 | ) | | | (150.0 | ) | | | 3.5 | | | | (34.8 | ) | | | (31.7 | ) | | | 14.9 | | | | (365.2 | ) |
Pre-tax income (loss) – excluding debt redemption charges, FSA net accretion and OID acceleration | | | | $ | 255.3 | | | $ | 367.5 | | | $ | 54.0 | | | $ | 55.5 | | | $ | 26.6 | | | $ | (119.4 | ) | | $ | 639.5 | |
| |
| | | | Year Ended December 31, 2011
|
Pre-tax income/(loss) – reported | | | | $ | 368.3 | | | $ | 190.2 | | | $ | 16.9 | | | $ | 144.8 | | | $ | (90.6 | ) | | $ | (451.2 | ) | | $ | 178.4 | |
Accelerated FSA net discount/(premium) on debt extinguishments and repurchases | | | | | 43.3 | | | | 78.9 | | | | 8.2 | | | | 36.0 | | | | 93.3 | | | | 19.5 | | | | 279.2 | |
Debt related – loss on debt extinguishments | | | | | – | | | | – | | | | – | | | | – | | | | – | | | | 134.8 | | | | 134.8 | |
Debt related – prepayment costs | | | | | – | | | | – | | | | – | | | | – | | | | – | | | | 114.2 | | | | 114.2 | |
Pre-tax income (loss) – excluding debt redemption charges | | | | | 411.6 | | | | 269.1 | | | | 25.1 | | | | 180.8 | | | | 2.7 | | | | (182.7 | ) | | | 706.6 | |
Net FSA accretion (excluding debt related acceleration) | | | | | (232.9 | ) | | | (95.4 | ) | | | 11.5 | | | | (92.9 | ) | | | (31.5 | ) | | | 26.8 | | | | (414.4 | ) |
Pre-tax income (loss) – excluding debt redemption charges and FSA net accretion | | | | $ | 178.7 | | | $ | 173.7 | | | $ | 36.6 | | | $ | 87.9 | | | $ | (28.8 | ) | | $ | (155.9 | ) | | $ | 292.2 | |
| |
| | | | Year Ended December 31, 2010
|
Pre-tax income/(loss) – reported | | | | $ | 556.6 | | | $ | 69.6 | | | $ | (56.0 | ) | | $ | 275.2 | | | $ | 19.6 | | | $ | (93.6 | ) | | $ | 771.4 | |
Accelerated FSA net discount/(premium) on debt extinguishments and repurchases | | | | | (22.1 | ) | | | (22.5 | ) | | | (3.3 | ) | | | (13.6 | ) | | | (0.5 | ) | | | (23.8 | ) | | | (85.8 | ) |
Debt related – prepayment costs | | | | | – | | | | – | | | | – | | | | – | | | | – | | | | 137.9 | | | | 137.9 | |
Pre-tax income (loss) – excluding debt redemption charges | | | | | 534.5 | | | | 47.1 | | | | (59.3 | ) | | | 261.6 | | | | 19.1 | | | | 20.5 | | | | 823.5 | |
Net FSA accretion (excluding debt related acceleration) | | | | | (939.1 | ) | | | (122.4 | ) | | | (4.0 | ) | | | (260.3 | ) | | | (100.8 | ) | | | 21.9 | | | | (1,404.7 | ) |
Pre-tax income (loss) – excluding debt redemption charges and FSA net accretion | | | | $ | (404.6 | ) | | $ | (75.3 | ) | | $ | (63.3 | ) | | $ | 1.3 | | | $ | (81.7 | ) | | $ | 42.4 | | | $ | (581.2 | ) |
Item 7: Management’s Discussion and Analysis
54 CIT ANNUAL REPORT 2012
Corporate Finance
Corporate Finance provides financing for growth and working capital to middle-market companies and small businesses across the U.S. and maintains specialization in specific industries, including: Commercial & Industrial, Communications, Media & Entertainment, Healthcare, and Energy. Additionally, Corporate Finance has groups focused on small business lending in the U.S., financial sponsor coverage in the UK and Canada and project finance in Canada. Corporate Finance offers a product suite primarily composed of senior secured loans collateralized by accounts receivable, inventory, machinery & equipment and intangibles to finance various needs of our customers, such as working capital, plant expansion, acquisitions and recapitalizations. In 2011, Corporate Finance began select equipment leasing and financing secured by commercial equipment and real estate financing secured by commercial real estate. Revenue is generated primarily from interest earned on loans, supplemented by fees collected on services provided.
Corporate Finance – Financial Data and Metrics (dollars in millions)
| | | | Years Ended December 31,
| |
|---|
| | | | 2012
| | 2011
| | 2010
|
|---|
| | | | | | | | | | | | | | |
| | | | $ | 623.6 | | | $ | 923.7 | | | $ | 1,692.9 | |
| | | | | (564.6 | ) | | | (706.1 | ) | | | (976.7 | ) |
Provision for credit losses | | | | | (7.3 | ) | | | (173.3 | ) | | | (496.9 | ) |
Rental income on operating leases | | | | | 8.9 | | | | 18.0 | | | | 24.7 | |
| | | | | 387.9 | | | | 546.5 | | | | 603.6 | |
Depreciation on operating lease equipment | | | | | (4.3 | ) | | | (7.8 | ) | | | (12.0 | ) |
| | | | | (244.0 | ) | | | (232.7 | ) | | | (279.0 | ) |
Income before provision for income taxes | | | | $ | 200.2 | | | $ | 368.3 | | | $ | 556.6 | |
Pre-tax income – excluding debt redemption charges(1) | | | | $ | 422.4 | | | $ | 411.6 | | | $ | 534.5 | |
| | | | | | | | | | | | | | |
Average finance receivables (AFR) | | | | $ | 7,510.3 | | | $ | 7,225.9 | | | $ | 10,347.7 | |
Average earning assets (AEA) | | | | | 7,617.2 | | | | 7,538.7 | | | | 10,633.3 | |
| | | | | | | | | | | | | | |
Net finance revenue (interest and rental income, net of interest and depreciation expense) as a % of AEA | | | | | 0.83 | % | | | 3.02 | % | | | 6.85 | % |
Funded new business volume | | | | $ | 4,377.0 | | | $ | 2,702.6 | | | $ | 1,074.2 | |
(1) | | Non-GAAP measurement, see table at the beginning of this section for a reconciliation of non-GAAP to GAAP financial information. |
Pre-tax earnings were lowered by accelerated debt FSA accretion of $222 million in 2012, which resulted from debt prepayment activities, compared to $43 million in 2011 and an increase of $22 million in 2010. Excluding accelerated debt FSA accretion, pre-tax income rose from 2011, as lower funding costs and lower credit costs offset lower FSA net accretion, and was down from 2010, on significantly lower FSA net accretion.
Asset growth was driven by continued sequential increases in new business volumes. New business volume increased 62% in 2012 from 2011, helping drive an overall increase in financing and leasing assets. CIT Bank originated the vast majority of the 2012 U.S. funded volume, over 90%, up from 80% in 2011. Thus, at December 31, 2012, approximately 65% of its financing and leasing assets were in CIT Bank. 2012 new business yields in Corporate Finance remained relatively stable within product types, whereas in 2011, new business yields were up modestly on average. Current market conditions suggest pricing pressure on asset-based lending (“ABL”) has stabilized and there are pockets of pressure on structure and pricing in cash flow lending.
Other highlights included:
| - | | Excluding accelerated debt FSA accretion, net finance revenue was $286 million, up from $271 million in 2011 on lower funding costs (including the benefit from the increasing amount of assets in CIT Bank) and higher assets, but down from 2010 on lower net FSA accretion and lower assets. Net FSA accretion, excluding the accelerated debt FSA accretion, increased net finance revenue by $93 million for 2012, compared to increases of $148 million in 2011 and $867 million in 2010. |
| - | | Other income included $217 million of gains on asset sales (including receivables, equipment and investments) in 2012, down from $278 million in 2011 and $246 million in 2010. Contributing to the decline was lower sales volume, $0.7 billion of equipment and receivable sales in 2012 compared to $0.9 billion in 2011 and $2.0 billion in 2010. Both 2011 and 2010 included higher amounts of non-accrual loan sales. Other income also includes FSA counterparty receivable accretion of $74 million, compared to $85 million in 2011 and $72 million in 2010. Another component of other income is recoveries of loans charged off pre-emergence and loans charged off prior to transfer to held for sale, which totaled $34 million in 2012, down from $86 million in 2011 and $208 million in 2010. As we move further away from our emergence date, both the recoveries and FSA counterparty receivable accretion decline. |
| - | | Credit trends remained positive in 2012. Non-accrual loans declined to $212 million (2.59% of finance receivables) |
CIT ANNUAL REPORT 2012 55
| | from $498 million (7.26%) at December 31, 2011 and $1.2 billion (15.17%) at December 31, 2010, primarily due to sales and collections. Net charge-offs were $32 million (0.43% of average finance receivables), down significantly from $206 million (2.85%) in 2011 and $246 million (2.37%) in 2010. The 2012 provision for credit losses reflect reserves established on loan originations, which was partially offset by a reduction in the allowance for loan losses, due to improved portfolio credit quality. The decrease in the provision for credit losses in 2012 from the prior year is due mainly to the decrease in net charge-offs. |
| - | | Financing and leasing assets at December 31, 2012 totaled $8.3 billion, up from $7.1 billion at December 31, 2011, as new business volume offset sales and portfolio collections, and were essentially unchanged from December 31, 2010. Cash flow loans approximated 57% of the portfolio, while asset secured loans approximated 35%, and the remaining portfolio consisted primarily of SBA loans. |
| - | | As previously announced, on December 31, 2012, CIT Bank agreed to acquire $1.3 billion of commercial loan commitments (of which approximately $800 million was outstanding), the purchase of which should be substantially completed during the first quarter of 2013. |
Transportation Finance
Transportation Finance is among the leading providers of large ticket equipment leases and other secured financing in the aerospace and rail sectors. The principal asset within the Transportation Finance portfolio is leased equipment, whereby the business invests in equipment (primarily commercial aircraft and railcars) and leases it to commercial end-users. The typical structure for providing use of large ticket transportation assets is an operating lease. Transportation Finance operating lease clients primarily consist of global commercial airlines, and North American major railroads and material transport companies (including mining and agricultural firms). This business also provides secured lending and other financing products to companies in transportation and defense, offers financing and leasing programs for corporate and private owners of business jet aircraft, and recently announced the launch of a maritime sector. Revenue is generated from rents collected on leased assets, and to a lesser extent from interest on loans, fees, and gains from assets sold.
Transportation Finance – Financial Data and Metrics (dollars in millions)
| | | | Years Ended December 31,
| |
|---|
| | | | 2012
| | 2011
| | 2010
|
|---|
| | | | | | | | | | | | | | |
| | | | $ | 135.2 | | | $ | 155.9 | | | $ | 231.1 | |
| | | | | (1,233.5 | ) | | | (885.2 | ) | | | (972.9 | ) |
Provision for credit losses | | | | | (18.0 | ) | | | (12.8 | ) | | | (28.8 | ) |
Rental income on operating leases | | | | | 1,536.6 | | | | 1,375.6 | | | | 1,244.2 | |
| | | | | 56.3 | | | | 99.1 | | | | 82.1 | |
Depreciation on operating lease equipment | | | | | (419.7 | ) | | | (382.2 | ) | | | (334.1 | ) |
| | | | | (179.6 | ) | | | (160.2 | ) | | | (152.0 | ) |
Income (loss) before (provision) benefit for income taxes | | | | $ | (122.7 | ) | | $ | 190.2 | | | $ | 69.6 | |
Pre-tax income – excluding debt redemption charges and accelerated OID on debt extinguishment related to the GSI facility(1) | | | | $ | 517.5 | | | $ | 269.1 | | | $ | 47.1 | |
| | | | | | | | | | | | | | |
Average finance receivables (AFR) | | | | $ | 1,706.4 | | | $ | 1,378.3 | | | $ | 1,681.4 | |
Average operating leases (AOL) | | | | | 11,843.5 | | | | 10,850.2 | | | | 10,298.9 | |
Average earning assets (AEA) | | | | | 13,760.7 | | | | 12,341.0 | | | | 11,980.9 | |
| | | | | | | | | | | | | | |
Net finance revenue as a % of AEA | | | | | 0.14 | % | | | 2.14 | % | | | 1.40 | % |
Operating lease margin as a % of AOL | | | | | 9.43 | % | | | 9.16 | % | | | 8.84 | % |
Funded new business volume | | | | $ | 2,216.3 | | | $ | 2,523.6 | | | $ | 1,116.1 | |
(1) | | Non-GAAP measurement, see table at the beginning of this section for a reconciliation of non-GAAP to GAAP financial information. |
Pre-tax earnings were impacted by accelerated debt FSA and OID accretion of $640 million in 2012, which resulted from debt prepayment activities, compared to $79 million in 2011 and a benefit of $22 million in 2010. Excluding accelerated debt FSA and OID accretion, pre-tax income increased from 2011 and 2010, on lower funding costs and increased assets.
Results for 2012 reflect continued high utilization rates of our aircraft and railcars, increased asset levels, and lower funding costs. We grew financing and leasing assets $0.9 billion during 2012, with growth in both rail and aerospace units. In addition, we placed orders for 15 additional aircraft and for over 7,000 railcars.
| - | | Excluding accelerated debt FSA and OID accretion, net finance revenue was $658 million, up from $344 million in 2011 |
Item 7: Management’s Discussion and Analysis
56 CIT ANNUAL REPORT 2012
| | and $146 million in 2010. The increases generally reflect lower funding costs, the benefit from higher asset balances, and increased railcar utilization and lease rates. Excluding accelerated FSA interest expense and OID accretion, net FSA accretion added $128 million to net finance revenue in 2012, $79 million in 2011 and $108 million in 2010. FSA accretion impacts primarily included a reduction in depreciation expense and to a lesser extent reduction to rental income from amortization of lease contract intangible assets. |
| - | | Net operating lease revenue (rental income on operating leases less deprecation on operating lease equipment) reflects a net benefit from FSA accretion of $184 million in 2012, $169 million in 2011 and $129 million in 2010. FSA accretion results in a reduction in depreciation expense and reduction to rental income from amortization of lease contract intangible assets. Also, as discussed inNet Finance Revenue, depreciation is suspended on operating lease equipment held for sale. The suspended depreciation totaled $13 million in 2012, $5 million in 2011 and was not significant in 2010. |
| - | | Financing and leasing assets grew $0.9 billion during 2012 and $1.3 billion during 2011 with new business volume and a $200 million portfolio purchase partially offset by equipment sales, depreciation and other activity. |
| - | | New business volume reflects the addition of 21 operating lease aircraft and approximately 7,000 railcars, and also included over $600 million of finance receivables. Additionally, over $1.2 billion of Transportation Finance volume (54%) was funded in CIT Bank during 2012, including $0.6 billion of loans and $0.6 billion of rail operating lease equipment. |
| - | | At December 31, 2012, we had 161 aircraft on order from manufacturers, with deliveries scheduled through 2020. All but two of the 15 scheduled aircraft deliveries for 2013 have lease commitments. We also have future purchase commitments for approximately 7,050 railcars at December 31, 2012 with scheduled deliveries through 2014, essentially all of which have lease commitments. SeeNote 19 — Commitments. |
| - | | Equipment utilization remained strong at December 31, 2012, with over 99% of commercial air and over 98% of rail equipment on lease or under a commitment. Rail utilization rates improved from both 2011 and 2010, while air utilization remained consistently strong over the 3-year period. |
| - | | Other income includes $66 million of gains on $732 million of equipment and receivable sales, compared to $81 million of gains on $511 million of sales in 2011 and $61 million of gains on $381 million of sales in 2010. Other income also includes impairment on operating lease equipment held for sale, which totaled $34 million in 2012 (primarily related to commercial aircraft), $24 million in 2011 (primarily related to idle center-beam railcars that were scrapped) and $2 million in 2010. FSA accretion on counterparty receivable totaled $15 million, $17 million and $15 million for the years ended December 31, 2012, 2011 and 2010, respectively. Other income for 2011 also includes $14 million related to an aircraft insurance claim and $11 million related to a change in the aircraft order book and corresponding acceleration of FSA. |
| - | | Non-accrual loans were $40 million (2.18% of finance receivables) at December 31, 2012, down from $45 million (3.03%) at December 31, 2011 and $63 million (4.55%) at December 31, 2010. Net charge-offs were $12 million (0.69% of average finance receivables) in 2012, up from $7 million (0.47%) and $5 million (0.29%) in 2011 and 2010, respectively. The provision for credit losses increased during 2012 reflecting higher loan volumes and the establishment of specific reserves; the 2011 provision declined from 2010, which included amounts to establish an allowance for loan losses post adoption of FSA. |
| - | | In 2012, we executed $0.4 billion of secured aircraft financings including $0.2 billion backed by facilities with the European Export Credit Agency and $0.2 billion through facilities guaranteed by the Export-Import Bank of the United States. |
| - | | In 2011, we refined the capital and interest allocation methodologies for the segments. Management considers these changes in estimations to better refine segment profitability for users of the financial information on a go forward basis. These changes had the most impact on Transportation Finance given the capital requirements for their forward-purchase commitments and reduced the interest expense charged to this segment. 2011 pre-tax earnings were $190 million. On a comparable basis, pre-tax earnings would have been approximately $270 million for 2010. (SeeCorporate and Other). |
Trade Finance provides factoring, receivable management products, and secured financing to businesses (our clients, generally manufacturers or importers of goods) that operate in several industries, including apparel, textile, furniture, home furnishings and consumer electronics. Factoring entails the factor’s assumption of credit risk with respect to trade accounts receivable arising from the sale of goods by our clients (generally manufacturers or importers) to their customers (generally retailers), which have been factored (i.e. sold or assigned to the factor). Although primarily U.S.-based, Trade Finance also conducts business with clients and their customers internationally. Revenue is principally generated from commissions earned on factoring and related activities, interest on loans, and other fees for services rendered.
CIT ANNUAL REPORT 2012 57
Trade Finance – Financial Data and Metrics (dollars in millions)
| | | | Years Ended December 31,
| |
|---|
| | | | 2012
| | 2011
| | 2010
|
|---|
| | | | | | | | | | | | | | |
| | | | $ | 57.6 | | | $ | 73.3 | | | $ | 99.9 | |
| | | | | (80.0 | ) | | | (90.9 | ) | | | (162.9 | ) |
Provision for credit losses | | | | | 0.9 | | | | (11.2 | ) | | | (58.6 | ) |
Other income, commissions | | | | | 126.5 | | | | 132.5 | | | | 145.0 | |
Other income, excluding commissions | | | | | 17.5 | | | | 23.6 | | | | 43.1 | |
| | | | | (118.4 | ) | | | (110.4 | ) | | | (122.5 | ) |
Income (loss) before (provision) benefit for income taxes | | | | $ | 4.1 | | | $ | 16.9 | | | $ | (56.0 | ) |
Pre-tax income – excluding debt redemption charges(1) | | | | $ | 50.5 | | | $ | 25.1 | | | $ | (59.3 | ) |
| | | | | | | | | | | | | | |
Average finance receivables (AFR) | | | | $ | 2,356.6 | | | $ | 2,486.5 | | | $ | 2,662.1 | |
Average earning assets (AEA)(2) | | | | | 1,087.9 | | | | 1,383.9 | | | | 1,702.7 | |
| | | | | | | | | | | | | | |
Net finance revenue as a % of AEA | | | | | (2.06 | )% | | | (1.27 | )% | | | (3.70 | )% |
| | | | $ | 25,123.9 | | | $ | 25,943.9 | | | $ | 26,675.0 | |
(1) | | Non-GAAP measurement, see table at the beginning of this section for a reconciliation of non-GAAP to GAAP financial information. |
(2) | | AEA is lower than AFR as it is reduced by the average credit balances for factoring clients. |
Pre-tax income was impacted by accelerated debt FSA accretion of $46 million in 2012, as a result of debt prepayment activities, compared to $8 million last year and a benefit of $3 million in 2010. Excluding accelerated FSA interest expense, pre-tax earnings were up for 2012 reflecting improved funding costs and continued low credit costs.
| - | | Net finance revenue excluding accelerated debt FSA accretion was $24 million in 2012, improved from $(9) million during 2011 and $(66) million in 2010. The improvements from the prior year reflected lower funding costs, lower letter of credit related charges and a reduction in non-accrual loans. While there is debt FSA discount accretion, there was no FSA accretion in interest income in 2012 or 2011. |
| - | | Factoring commissions have trended lower reflecting the modest declines in factoring volume compared to 2011 and 2010. |
| - | | Other income included $5 million, $9 million and $18 million of recoveries on accounts charged off pre-emergence for the years ended December 31, 2012, 2011 and 2010, respectively. |
| - | | Non-accrual loans were $6 million (0.26% of finance receivables), down from $75 million (3.10%) at December 31, 2011 and $164 million (6.89%) at December 31, 2010, primarily due to accounts returning to accrual status and reductions in exposures. Net charge-offs were $1 million (0.03% of average finance receivables) in 2012, down from $10 million (0.41%) in 2011 and $29 million (1.08%) in 2010. The provision for credit losses decreased due to lower gross charge-offs, along with the 2010 rebuilding of loan loss reserves after the reserve was eliminated under FSA. |
| - | | Finance receivables were $2.3 billion, down from approximately $2.4 billion at both December 31, 2011 and 2010. Off-balance sheet exposures, resulting from clients with deferred purchase factoring agreements, were $1.8 billion at December 31, 2012 and 2011 and $1.7 billion at December 31, 2010. |
Vendor Finance
Vendor Finance develops financing solutions for small businesses and middle market companies for the procurement of equipment and value-added services. We create tailored equipment financing and leasing programs for manufacturers, distributors and product resellers across industries, such as information technology, telecom and office equipment, which are designed to help them increase sales. Through these programs, we provide equipment financing and value-added services, from invoicing to asset disposition, to meet their customers’ needs. Vendor Finance earns revenues from interest on loans, rents on leases, and fees and other revenue from leasing activities.
Item 7: Management’s Discussion and Analysis
58 CIT ANNUAL REPORT 2012
Vendor Finance – Financial Data and Metrics (dollars in millions)
| | | | Years Ended December 31,
| |
|---|
| | | | 2012
| | 2011
| | 2010
|
|---|
| | | | | | | | | | | | | | |
| | | | $ | 553.5 | | | $ | 788.4 | | | $ | 1,314.8 | |
| | | | | (473.6 | ) | | | (505.1 | ) | | | (715.0 | ) |
Provision for credit losses | | | | | (26.5 | ) | | | (69.3 | ) | | | (210.7 | ) |
Rental income on operating leases | | | | | 239.1 | | | | 273.9 | | | | 380.5 | |
| | | | | 27.6 | | | | 154.8 | | | | 164.9 | |
Depreciation on operating lease equipment | | | | | (109.2 | ) | | | (185.1 | ) | | | (330.1 | ) |
| | | | | (318.8 | ) | | | (312.8 | ) | | | (329.2 | ) |
Income (loss) before (provision) benefit for income taxes | | | | $ | (107.9 | ) | | $ | 144.8 | | | $ | 275.2 | |
Pre-tax income – excluding debt redemption charges(1) | | | | $ | 90.3 | | | $ | 180.8 | | | $ | 261.6 | |
| | | | | | | | | | | | | | |
Average finance receivables (AFR) | | | | $ | 4,540.3 | | | $ | 4,492.0 | | | $ | 6,826.7 | |
Average operating leases (AOL) | | | | | 208.8 | | | | 325.8 | | | | 587.1 | |
Average earning assets (AEA) | | | | | 5,136.0 | | | | 5,391.8 | | | | 7,559.3 | |
| | | | | | | | | | | | | | |
Net finance revenue as a % of AEA | | | | | 4.08 | % | | | 6.90 | % | | | 8.60 | % |
Funded new business volume | | | | $ | 3,006.9 | | | $ | 2,577.5 | | | $ | 2,320.5 | |
(1) | | Non-GAAP measurement, see table at the beginning of this section for a reconciliation of non-GAAP to GAAP financial information. |
Pre-tax earnings were impacted by accelerated debt FSA accretion of $198 million in 2012, which resulted from debt prepayment activities, compared to $36 million in 2011 and a $14 million benefit in 2010. Excluding accelerated debt FSA accretion, pre-tax earnings were down from 2011 and 2010 primarily reflecting lower gains on asset sales and lower net FSA accretion, partially offset by lower funding and credit costs.
During 2012, Vendor Finance continued to increase business with existing relationships and added new vendor partners. New business volumes were up 17% from 2011 and 30% from 2010. During the third quarter 2011 we transferred our U.S. Vendor Finance platform into the Bank. Essentially all of the 2012 U.S. volume was originated in CIT Bank, up from 52% in 2011.
Financing and leasing assets grew to $5.4 billion during 2012, an 8% increase, after declining in 2010 and 2011. Approximately $400 million of assets remain in held for sale, related to the pending sale of Dell Europe portfolio, as previously disclosed.
Other highlights included:
| - | | Excluding accelerated debt FSA accretion, net finance revenue was $408 million in 2012, unchanged from 2011 and down from $637 million in 2010, primarily due to lower FSA accretion and lower average earning assets, partially offset by reduced funding costs. Net FSA accretion, excluding the accelerated debt FSA accretion, increased net finance revenue by $35 million in 2012, compared to $93 million in 2011 and $260 million in 2010. |
| - | | Net operating lease revenue of $130 million increased from $89 million in 2011 and $50 million in 2010, reflecting lower depreciation, partially offset by lower average operating lease assets. Depreciation was lower because of operating lease equipment classified as held for sale on which depreciation is suspended. The amount suspended totaled approximately $80 million in 2012, compared to $63 million for 2011and none for 2010. These amounts are essentially offset by an impairment charge in other income. Depreciation also reflects a benefit from FSA accretion of $2 million in 2012, $10 million in 2011 and $34 million in 2010. |
| - | | Net finance revenue as a percentage of AEA declined during 2012 primarily due to FSA acceleration from debt extinguishment costs. Excluding the impact of the accelerated debt FSA accretion the ratio increased about 38 basis-points to 7.9% from 2011, primarily due to improved funding costs. |
| - | | Other income declined during 2012, primarily reflecting lower gains from asset sales as compared to the prior year periods. Gains totaled $37 million on $292 million of equipment and receivable sales, compared to $126 million on $853 million of equipment and receivable sales in 2011 and $114 million on $2 billion of sales in 2010. In 2011, we sold approximately $125 million of underperforming finance receivables in Europe and closed the sale of Dell Financial Services Canada Ltd. (“DFS Canada”) to Dell, which included financing and leasing assets of approximately $360 million and approximately 60 employees. In 2010, assets sold included our Australian and New Zealand business, significant U.S. receivables and international non-strategic portfolios, including liquidating consumer assets. In 2012, other income included a gain of approximately $14 million related to the sale of our Dell Europe operating platform to Dell. Other income also included impairment charges on operating leases recorded in held for sale, $(80 million and $61 million in 2012 and 2011, respectively), which had a nearly offsetting amount in net finance revenue related to suspended depreciation on assets held for sale. See“Non-interest Income” and“Expenses” for discussions on impairment charges and suspended depreciation on operating lease equipment held for sale. |
CIT ANNUAL REPORT 2012 59
| - | | Portfolio credit metrics remained strong with non-accrual loans and net charge-offs down from 2011 and 2010. Non-accrual loans were $72 million (1.49% of finance receivables) at December 31, 2012, down from $83 million (1.87%) at December 31, 2011 and $164 million (3.48%) at December 31, 2010. Net charge-offs were $29 million (0.63% of average finance receivables) in 2012, down from $39 million (0.87%) and $160 million (2.34%) in 2011 and 2010, respectively. The provision for credit losses was down during 2012 and 2011, reflecting lower net charge-offs. The provision for credit losses in 2010 included the rebuilding of allowance for loan losses for new originations. |
| - | | We continued to make progress on various funding initiatives. During 2012, we completed a C$515 million ($511 million based on the exchange rate at the time of the transaction) equipment receivables securitization, our first in the Canadian market since 2009 and closed a new RMB2.2 billion (approximately $345 million based on the exchange rate at the time of the transaction) committed facility to fund originations in China, which was in addition to an existing facility. We completed a $1 billion committed U.S. Vendor Finance conduit facility that provides an additional source of funding for CIT Bank’s U.S. Vendor Finance assets and renewed a £100 million (approximately $160 million based on the exchange rate at the time of the transaction) U.K. conduit facility with improved terms. We also closed a $753 million term securitization backed by Vendor Finance equipment leases in the U.S. during the second quarter. We also have deposits in Brazil of slightly more than $100 million as of December 31, 2012. |
Consumer predominately consists of our liquidating government-guaranteed student loans.
Consumer – Financial Data and Metrics (dollars in millions)
| | | | Years Ended December 31,
| |
|---|
| | | | 2012
| | 2011
| | 2010
|
|---|
| | | | | | | | | | | | | | |
| | | | $ | 179.6 | | | $ | 266.5 | | | $ | 359.6 | |
| | | | | (231.7 | ) | | | (290.6 | ) | | | (245.0 | ) |
Provision for credit losses | | | | | (0.7 | ) | | | (3.1 | ) | | | (25.3 | ) |
| | | | | 40.3 | | | | 2.0 | | | | 9.7 | |
| | | | | (39.5 | ) | | | (65.4 | ) | | | (79.4 | ) |
Income (loss) before (provision) benefit for income taxes | | | | $ | (52.0 | ) | | $ | (90.6 | ) | | $ | 19.6 | |
Pre-tax income – excluding debt redemption charges and accelerated OID on debt extinguishment related to the GSI facility(1) | | | | $ | 58.3 | | | $ | 2.7 | | | $ | 19.1 | |
| | | | | | | | | | | | | | |
Average finance receivables (AFR) | | | | $ | 4,194.3 | | | $ | 7,331.4 | | | $ | 8,791.4 | |
Average earning assets (AEA) | | | | | 4,920.2 | | | | 7,716.2 | | | | 8,968.2 | |
| | | | | | | | | | | | | | |
Net finance revenue as a % of AEA | | | | | (1.06 | )% | | | (0.31 | )% | | | 1.28 | % |
(1) | | Non-GAAP measurement, see table at the beginning of this section for a reconciliation of non-GAAP to GAAP financial information. |
Pre-tax income was impacted by accelerated debt FSA and OID accretion of $110 million in 2012, as a result of debt prepayment activities primarily driven by a repayment of ABS issued by a student lending securitization entity (see “Secured Borrowings” section inFunding and Liquidity for detail) and $93 million in 2011. In 2012, CIT sold approximately $550 million of student loans and used the proceeds to redeem the associated ABS, which decreased interest expense by approximately $6 million as a $40 million increase in interest expense from the acceleration of FSA discount was offset by $46 million in reimbursement of OID related to the GSI Facility. In addition, CIT redeemed approximately $480 million in principal amount of ABS issued by a student lending securitization entity, at par, which increased interest expense by $81 million due to the acceleration of FSA discount accretion. These actions in aggregate increased interest expense by $76 million and increased other income by $16 million. Including these activities, we sold $2.1 billion of government-guaranteed student loans in 2012. The student loan portfolio totaled $3.7 billion at December 31, 2012 and was funded through securitizations.
Other highlights included:
| - | | Excluding accelerated debt FSA and OID accretion, net finance revenue was $58 million in 2012 compared to $70 million last year and $114 million in 2010. Excluding accelerated debt FSA and OID accretion, net FSA accretion reduced net finance revenue by $21 million in 2012, and increased it by $23 million in 2011 and $94 million in 2010. |
| - | | Net charge-offs were $1 million in 2012, compared to $3 million in 2011 and $25 million in 2010. Non-accrual loans were $2 million at December 31, 2012, up slightly from 2011 and 2010. |
| - | | Other income is primarily driven by net gains on loan sales, FSA accretion on a counterparty receivable, partially offset by impairment charges on loans held for sale. Other income includes $31 million of gains on $2.1 billion of loan sales as compared to $15 million of gains on $1.3 billion of loan sales in 2011 and $8 million of gains on $0.7 billion of loan sales in 2010. Other income included FSA accretion on a counterparty receivable of $7 million, $8 million and $7 million in 2012, 2011 and 2010, respectively. Impairment on assets held for sale |
Item 7: Management’s Discussion and Analysis
60 CIT ANNUAL REPORT 2012
| | was $1 million, compared to $24 million in 2011 and $11 million in 2010. |
| - | | Operating expenses decreased by 40%, which is consistent with the decrease in AEA, as this is a run-off portfolio. |
Certain activities are not attributed to operating segments and are included in Corporate and Other. Some of the more significant items for 2012 and 2011 include net loss on debt extinguishments and costs associated with cash liquidity in excess of the amount required by the business units that management determines is prudent for the overall Company. In 2011 and 2010, Corporate and Other includes prepayment penalties associated with debt repayments (there were no such penalties in 2012). In each of 2012, 2011 and 2010 Corporate and Other includes mark-to-market adjustments on non-qualifying derivatives and restructuring charges for severance and facilities exit activities.
During 2011, we refined our expense and capital allocation methodologies for our segments. The Company did not conform 2010 periods. Had the Company conformed the 2010 periods, the changes to each of the segments would be offset in Corporate and Other, including increases to loss before provision for income taxes of $200 million for the year ended December 31, 2010 relating to increased allocations to Transportation Finance.
Corporate and Other – Financial Data (dollars in millions)
| | | | Years Ended December 31,
| |
|---|
| | | | 2012
| | 2011
| | 2010
|
|---|
| | | | | | | | | | | | | | |
| | | | $ | 19.6 | | | $ | 20.9 | | | $ | 20.7 | |
| | | | | (314.0 | ) | | | (316.5 | ) | | | (7.2 | ) |
Rental income on operating leases | | | | | – | | | | – | | | | (1.0 | ) |
| | | | | (3.0 | ) | | | (5.7 | ) | | | (43.5 | ) |
Depreciation on operating lease equipment | | | | | – | | | | – | | | | 0.4 | |
| | | | | (17.9 | ) | | | (15.1 | ) | | | (63.0 | ) |
Loss on debt extinguishments | | | | | (61.2 | ) | | | (134.8 | ) | | | – | |
Loss before provision for income taxes | | | | $ | (376.5 | ) | | $ | (451.2 | ) | | $ | (93.6 | ) |
Pre-tax income – excluding debt redemption charges(1) | | | | $ | (134.3 | ) | | $ | (182.7 | ) | | $ | 20.5 | |
(1) | | Non-GAAP measurement, see table at the beginning of this section for a reconciliation of non-GAAP to GAAP financial information. |
| - | | Interest income consists of interest and dividend income primarily from deposits held at other depository institutions and U.S. Treasury Securities. |
| - | | Interest expense in 2012 reflected accelerated FSA debt accretion of $181 million, while 2011 and 2010 included $134 million and $114 million, respectively, of combined accelerated FSA accretion and prepayment penalties. |
| - | | Other income primarily reflects gains and (losses) on derivatives and foreign currency exchange. |
| - | | Operating expenses reflects salary and general and administrative expenses in excess of amounts allocated to the business segments and litigation-related costs. |
| - | | Operating expenses include provision for severance and facilities exiting activities reflects various organization efficiency and cost reduction initiatives. The severance additions primarily relate to employee termination benefits incurred in conjunction with these initiatives. The facility exiting activities primarily relate to location closings and include the impact of outsourcing of student loan servicing in 2011 and facility consolidation charges principally in the New York region in 2010. |
| - | | The loss on debt extinguishments resulted primarily from repayments of Series C Notes in 2012 while the 2011 loss primarily resulted from the repayment of the first lien term loan. |
CIT ANNUAL REPORT 2012 61
FINANCING AND LEASING ASSETSThe following table presents our financing and leasing assets by segment.
Financing and Leasing Asset Composition (dollars in millions)
| | | | December 31,
2012
| | December 31,
2011
| | December 31,
2010
| | % Change
2012 vs 2011
| | % Change
2011 vs 2010
|
|---|
| | | | | | | | | | | | | | | | | | | | | | |
| | | | $ | 8,173.0 | | | $ | 6,862.7 | | | $ | 8,072.9 | | | | 19.1 | % | | | (15.0 | )% |
Operating lease equipment, net | | | | | 23.9 | | | | 35.0 | | | | 74.5 | | | | (31.7 | )% | | | (53.0 | )% |
| | | | | 56.8 | | | | 214.0 | | | | 219.2 | | | | (73.5 | )% | | | (2.4 | )% |
Financing and leasing assets | | | | | 8,253.7 | | | | 7,111.7 | | | | 8,366.6 | | | | 16.1 | % | | | (15.0 | )% |
| | | | | | | | | | | | | | | | | | | | | | |
| | | | | 1,853.2 | | | | 1,487.0 | | | | 1,390.3 | | | | 24.6 | % | | | 7.0 | % |
Operating lease equipment, net | | | | | 12,173.6 | | | | 11,754.2 | | | | 10,634.4 | | | | 3.6 | % | | | 10.5 | % |
| | | | | 173.6 | | | | 84.0 | | | | 2.8 | | | | 106.7 | % | | | >100 | % |
Financing and leasing assets | | | | | 14,200.4 | | | | 13,325.2 | | | | 12,027.5 | | | | 6.6 | % | | | 10.8 | % |
| | | | | | | | | | | | | | | | | | | | | | |
Loans – factoring receivables | | | | | 2,305.3 | | | | 2,431.4 | | | | 2,387.4 | | | | (5.2 | )% | | | 1.8 | % |
| | | | | | | | | | | | | | | | | | | | | | |
| | | | | 4,818.7 | | | | 4,442.0 | | | | 4,721.9 | | | | 8.5 | % | | | (5.9 | )% |
Operating lease equipment, net | | | | | 214.2 | | | | 217.2 | | | | 446.1 | | | | (1.4 | )% | | | (51.3 | )% |
| | | | | 414.5 | | | | 371.6 | | | | 757.4 | | | | 11.5 | % | | | (50.9 | )% |
Financing and leasing assets | | | | | 5,447.4 | | | | 5,030.8 | | | | 5,925.4 | | | | 8.3 | % | | | (15.1 | )% |
Total commercial financing and leasing assets | | | | | 30,206.8 | | | | 27,899.1 | | | | 28,706.9 | | | | 8.3 | % | | | (2.8 | )% |
| | | | | | | | | | | | | | | | | | | | | | |
| | | | | 3,694.5 | | | | 4,680.1 | | | | 8,035.5 | | | | (21.1 | )% | | | (41.8 | )% |
| | | | | 2.9 | | | | 2.7 | | | | 40.4 | | | | 7.4 | % | | | (93.3 | )% |
| | | | | 1.5 | | | | 1,662.7 | | | | 246.7 | | | | (99.9 | )% | | | >100 | % |
Financing and leasing assets | | | | | 3,698.9 | | | | 6,345.5 | | | | 8,322.6 | | | | (41.7 | )% | | | (23.8 | )% |
Total financing and leasing assets | | | | $ | 33,905.7 | | | $ | 34,244.6 | | | $ | 37,029.5 | | | | (1.0 | )% | | | (7.5 | )% |
| | | | | | | | | | | | | | | | | | | | | | |
Commercial financing and leasing assets increased in 2012, reversing a trend of declining asset levels, reflecting strong new business volumes, while our consumer portfolio of student loans continued to run-off, primarily through sales. Operating lease equipment increased, but at a slower rate than 2011.
Assets held for sale totaled $0.6 billion, the majority of which was in Vendor Finance and included a pending sale of Dell Europe assets.
Financing and leasing asset trends are discussed in the respective segment descriptions in “Results by Business Segment”.
Item 7: Management’s Discussion and Analysis
62 CIT ANNUAL REPORT 2012
The following table reflects the contractual maturities of our finance receivables:
Contractual Maturities of Finance Receivables on a pre-FSA basis at December 31, 2012 (dollars in millions)
| | | | U.S.
Commercial
| | U.S.
Consumer
| | Foreign
| | Total
|
|---|
| | | | | | | | | | | | | | | | | | |
| | | | $ | 2,921.3 | | | $ | – | | | $ | 1,191.2 | | | $ | 4,112.5 | |
| | | | | 778.3 | | | | – | | | | 779.9 | | | | 1,558.2 | |
| | | | | 549.2 | | | | – | | | | 563.2 | | | | 1,112.4 | |
| | | | | 346.0 | | | | – | | | | 263.1 | | | | 609.1 | |
| | | | | 162.9 | | | | – | | | | 83.8 | | | | 246.7 | |
| | | | | 1,836.4 | | | | – | | | | 1,690.0 | | | | 3,526.4 | |
| | | | | 139.9 | | | | – | | | | 77.0 | | | | 216.9 | |
| | | | | 4,897.6 | | | | – | | | | 2,958.2 | | | | 7,855.8 | |
| | | | | | | | | | | | | | | | | | |
| | | | | 999.2 | | | | 127.7 | | | | 198.5 | | | | 1,325.4 | |
| | | | | 847.1 | | | | 150.5 | | | | 98.9 | | | | 1,096.5 | |
| | | | | 1,242.7 | | | | 157.2 | | | | 156.3 | | | | 1,556.2 | |
| | | | | 1,577.4 | | | | 164.2 | | | | 83.8 | | | | 1,825.4 | |
| | | | | 1,841.8 | | | | 171.5 | | | | 147.0 | | | | 2,160.3 | |
| | | | | 5,509.0 | | | | 643.4 | | | | 486.0 | | | | 6,638.4 | |
| | | | | 2,076.1 | | | | 3,137.0 | | | | 192.1 | | | | 5,405.2 | |
| | | | | 8,584.3 | | | | 3,908.1 | | | | 876.6 | | | | 13,369.0 | |
| | | | $ | 13,481.9 | | | $ | 3,908.1 | | | $ | 3,834.8 | | | $ | 21,224.8 | |
CIT ANNUAL REPORT 2012 63
The following table presents the changes to our financing and leasing assets:
Financing and Leasing Assets Roll forward (dollars in millions)
| | | | Corporate
Finance
| | Transportation
Finance
| | Trade
Finance
| | Vendor
Finance
| | Commercial
Segments
| | Consumer
| | Total
|
|---|
Balance at December 31, 2010 | | | | $ | 8,366.6 | | | $ | 12,027.5 | | | $ | 2,387.4 | | | $ | 5,925.4 | | | $ | 28,706.9 | | | $ | 8,322.6 | | | $ | 37,029.5 | |
| | | | | 2,702.6 | | | | 2,523.6 | | | | – | | | | 2,577.5 | | | | 7,803.7 | | | | – | | | | 7,803.7 | |
| | | | | (968.7 | ) | | | (42.8 | ) | | | – | | | | (444.3 | ) | | | (1,455.8 | ) | | | (1,317.2 | ) | | | (2,773.0 | ) |
Equipment sales (pre-FSA) | | | | | (224.7 | ) | | | (598.2 | ) | | | – | | | | (456.9 | ) | | | (1,279.8 | ) | | | – | | | | (1,279.8 | ) |
| | | | | (12.3 | ) | | | (571.1 | ) | | | – | | | | (195.3 | ) | | | (778.7 | ) | | | – | | | | (778.7 | ) |
Gross charge-offs (pre-FSA) | | | | | (300.1 | ) | | | (6.6 | ) | | | (21.1 | ) | | | (105.6 | ) | | | (433.4 | ) | | | (14.2 | ) | | | (447.6 | ) |
| | | | | (3,156.1 | ) | | | (273.4 | ) | | | 65.1 | | | | (2,433.1 | ) | | | (5,797.5 | ) | | | (847.8 | ) | | | (6,645.3 | ) |
Change in finance receivable FSA discounts | | | | | 696.4 | | | | 70.0 | | | | – | | | | 149.5 | | | | 915.9 | | | | 202.1 | | | | 1,118.0 | |
Change in operating lease FSA discounts | | | | | 8.0 | | | | 196.2 | | | | – | | | | 13.6 | | | | 217.8 | | | | – | | | | 217.8 | |
Balance at December 31, 2011 | | | | $ | 7,111.7 | | | $ | 13,325.2 | | | $ | 2,431.4 | | | $ | 5,030.8 | | | $ | 27,899.1 | | | $ | 6,345.5 | | | $ | 34,244.6 | |
| | | | | 4,377.0 | | | | 2,216.3 | | | | – | | | | 3,006.9 | | | | 9,600.2 | | | | – | | | | 9,600.2 | |
| | | | | – | | | | 198.0 | | | | – | | | | – | | | | 198.0 | | | | – | | | | 198.0 | |
| | | | | (534.0 | ) | | | (17.1 | ) | | | – | | | | – | | | | (551.1 | ) | | | (2,093.2 | ) | | | (2,644.3 | ) |
Equipment sales (pre-FSA) | | | | | (287.6 | ) | | | (803.0 | ) | | | – | | | | (297.9 | ) | | | (1,388.5 | ) | | | – | | | | (1,388.5 | ) |
| | | | | (6.7 | ) | | | (608.9 | ) | | | – | | | | (111.6 | ) | | | (727.2 | ) | | | – | | | | (727.2 | ) |
Gross charge-offs (pre-FSA) | | | | | (56.9 | ) | | | (16.2 | ) | | | (8.6 | ) | | | (68.4 | ) | | | (150.1 | ) | | | (7.2 | ) | | | (157.3 | ) |
| | | | | (2,493.6 | ) | | | (373.2 | ) | | | (117.5 | ) | | | (2,166.6 | ) | | | (5,150.9 | ) | | | (628.6 | ) | | | (5,779.5 | ) |
Change in finance receivable FSA discounts | | | | | 138.7 | | | | 34.2 | | | | – | | | | 51.8 | | | | 224.7 | | | | 82.4 | | | | 307.1 | |
Change in operating lease FSA discounts | | | | | 5.1 | | | | 245.1 | | | | – | | | | 2.4 | | | | 252.6 | | | | – | | | | 252.6 | |
Balance at December 31, 2012 | | | | $ | 8,253.7 | | | $ | 14,200.4 | | | $ | 2,305.3 | | | $ | 5,447.4 | | | $ | 30,206.8 | | | $ | 3,698.9 | | | $ | 33,905.7 | |
The following tables present our business volumes and loan and equipment sales over the past three years:
Total Business Volumes (dollars in millions)
| | | | Years Ended December 31,
| |
|---|
Funded Volume
| | | | 2012
| | 2011
| | 2010
|
|---|
| | | | $ | 4,377.0 | | | $ | 2,702.6 | | | $ | 1,074.2 | |
| | | | | 2,216.3 | | | | 2,523.6 | | | | 1,116.1 | |
| | | | | 3,006.9 | | | | 2,577.5 | | | | 2,320.5 | |
| | | | $ | 9,600.2 | | | $ | 7,803.7 | | | $ | 4,510.8 | |
| | | | $ | 25,123.9 | | | $ | 25,943.9 | | | $ | 26,675.0 | |
| | | | | | | | | | | | | | |
| | | | $ | 5,916.2 | | | $ | 4,123.2 | | | $ | 1,666.2 | |
| | | | | 2,332.7 | | | | 2,659.7 | | | | 1,141.3 | |
| | | | | 3,006.9 | | | | 2,577.5 | | | | 2,320.5 | |
| | | | $ | 11,255.8 | | | $ | 9,360.4 | | | $ | 5,128.0 | |
Funded new business volume increased 23% over 2011 and was double the amount in 2010, primarily reflecting strong performances in Corporate Finance (increase of 62%) and Vendor Finance (increase of 17%). The decline in Transportation Finance is primarily due to the number of scheduled aircraft deliveries. Committed new business volume reflected similar trends.
Factoring volume was down 3% from 2011, reflecting a slow retail environment. Factoring volume in 2011 was down 3% from 2010 as growth in CIT’s ongoing factoring operations was offset by the run-off of German volume .
Business volumes are discussed in the respective segment descriptions in “Results by Business Segment”.
Item 7: Management’s Discussion and Analysis
64 CIT ANNUAL REPORT 2012
Loan Sales (Pre-FSA, dollars in millions)
| | | | Years Ended December 31,
| |
|---|
| | | | 2012
| | 2011
| | 2010
|
|---|
| | | | $ | 534.0 | | | $ | 968.7 | | | $ | 2,315.5 | |
| | | | | 17.1 | | | | 42.8 | | | | 150.6 | |
| | | | | – | | | | 444.3 | | | | 1,604.9 | |
| | | | | 551.1 | | | | 1,455.8 | | | | 4,071.0 | |
| | | | | 2,093.2 | | | | 1,317.2 | | | | 1,023.0 | |
| | | | $ | 2,644.3 | | | $ | 2,773.0 | | | $ | 5,094.0 | |
The sale of finance receivables slowed in 2012 and 2011 in the commercial segments, as we had been very active in 2010 optimizing the balance sheet and selling non-strategic assets. We continued to sell student loans periodically in 2012.
The sale of finance receivables in 2010 included loans in Europe, Canada and the U.S. The Corporate Finance sales consisted of certain energy-related assets. Vendor Finance sales included certain non-strategic portfolios, including our business in Australia and New Zealand, and a liquidating consumer portfolio. 2010 sales also included student loans in Consumer.
Equipment Sales (Pre-FSA, dollars in millions)
| | | | Years Ended December 31,
| |
|---|
| | | | 2012
| | 2011
| | 2010
|
|---|
| | | | $ | 287.6 | | | $ | 224.7 | | | $ | 176.8 | |
| | | | | 803.0 | | | | 598.2 | | | | 371.2 | |
| | | | | 297.9 | | | | 456.9 | | | | 496.6 | |
| | | | $ | 1,388.5 | | | $ | 1,279.8 | | | $ | 1,044.6 | |
The 2012 increase primarily reflects additional sales of aerospace and rail assets, which was partially offset by a decline in Vendor Finance sales from 2011, which included Dell Canada equipment.
Ten Largest Accounts
Our ten largest financing and leasing asset accounts in the aggregate represented 8.7% of our total financing and leasing assets at December 31, 2012 (the largest account was less than 2.3%). Excluding student loans, the top ten accounts in aggregate represented 9.8% of total owned assets (the largest account totaled 2.6%). The largest accounts represent Transportation Finance (airlines and rail) assets.
The top ten accounts were 8.5% (10.5% excluding student loans) at December 31, 2011 and 6.8% (8.8% excluding student loans) at December 31, 2010.
Geographic Concentrations
The following table represents the financing and leasing assets by obligor geography:
Financing and Leasing Assets by Obligor – Geographic Region (dollars in millions)
| | | | December 31, 2012
| | December 31, 2011
| | December 31, 2010
| |
|---|
| | | | $ | 5,387.7 | | | | 15.9 | % | | $ | 5,157.7 | | | | 15.1 | % | | $ | 6,029.3 | | | | 16.3 | % |
| | | | | 4,898.3 | | | | 14.4 | % | | | 5,421.7 | | | | 15.8 | % | | | 6,143.6 | | | | 16.6 | % |
| | | | | 3,862.7 | | | | 11.4 | % | | | 4,597.8 | | | | 13.4 | % | | | 5,143.1 | | | | 13.9 | % |
| | | | | 3,432.7 | | | | 10.1 | % | | | 3,831.1 | | | | 11.2 | % | | | 4,048.4 | | | | 10.9 | % |
| | | | | 3,362.2 | | | | 9.9 | % | | | 2,837.8 | | | | 8.3 | % | | | 3,217.8 | | | | 8.7 | % |
| | | | | 20,943.6 | | | | 61.7 | % | | | 21,846.1 | | | | 63.8 | % | | | 24,582.2 | | | | 66.4 | % |
| | | | | 3,721.6 | | | | 11.0 | % | | | 3,341.2 | | | | 9.8 | % | | | 2,743.0 | | | | 7.4 | % |
| | | | | 3,372.8 | | | | 10.0 | % | | | 2,996.0 | | | | 8.7 | % | | | 3,184.6 | | | | 8.6 | % |
| | | | | 2,257.6 | | | | 6.7 | % | | | 2,599.6 | | | | 7.6 | % | | | 3,582.1 | | | | 9.7 | % |
| | | | | 2,035.5 | | | | 6.0 | % | | | 1,764.5 | | | | 5.1 | % | | | 1,631.9 | | | | 4.4 | % |
| | | | | 1,574.6 | | | | 4.6 | % | | | 1,697.2 | | | | 5.0 | % | | | 1,305.7 | | | | 3.5 | % |
| | | | $ | 33,905.7 | | | | 100.0 | % | | $ | 34,244.6 | | | | 100.0 | % | | $ | 37,029.5 | | | | 100.0 | % |
CIT ANNUAL REPORT 2012 65
The following table summarizes both state concentrations greater than 5.0% and international country concentrations in excess of 1.0% of our financing and leasing assets:
Financing and Leasing Assets by Obligor – State and Country (dollars in millions)
| | | | December 31, 2012
| | December 31, 2011
| | December 31, 2010
| |
|---|
| | | | | | | | | | | | | | | | | | | | | | | | | | |
| | | | $ | 2,694.3 | | | | 7.9 | % | | $ | 2,108.5 | | | | 6.2 | % | | $ | 2,431.4 | | | | 6.6 | % |
| | | | | 2,111.5 | | | | 6.2 | % | | | 1,924.4 | | | | 5.6 | % | | | 2,314.0 | | | | 6.2 | % |
| | | | | 1,941.3 | | | | 5.7 | % | | | 2,266.0 | | | | 6.6 | % | | | 2,561.0 | | | | 6.9 | % |
| | | | | 14,196.5 | | | | 41.9 | % | | | 15,547.2 | | | | 45.4 | % | | | 17,275.8 | | | | 46.6 | % |
| | | | $ | 20,943.6 | | | | 61.7 | % | | $ | 21,846.1 | | | | 63.8 | % | | $ | 24,582.2 | | | | 66.3 | % |
| | | | | | | | | | | | | | | | | | | | | | | | | | |
| | | | $ | 2,257.6 | | | | 6.7 | % | | $ | 2,599.6 | | | | 7.6 | % | | $ | 3,582.1 | | | | 9.7 | % |
| | | | | 1,112.1 | | | | 3.3 | % | | | 959.2 | | | | 2.8 | % | | | 655.6 | | | | 1.8 | % |
| | | | | 1,042.7 | | | | 3.1 | % | | | 1,014.6 | | | | 3.0 | % | | | 917.4 | | | | 2.5 | % |
| | | | | 946.5 | | | | 2.8 | % | | | 757.6 | | | | 2.2 | % | | | 875.2 | | | | 2.4 | % |
| | | | | 940.6 | | | | 2.8 | % | | | 856.9 | | | | 2.5 | % | | | 831.4 | | | | 2.2 | % |
| | | | | 685.6 | | | | 2.0 | % | | | 574.6 | | | | 1.7 | % | | | 485.6 | | | | 1.3 | % |
| | | | | 459.0 | | | | 1.3 | % | | | 446.1 | | | | 1.3 | % | | | 422.3 | | | | 1.1 | % |
| | | | | 377.2 | | | | 1.1 | % | | | 290.5 | | | | 0.8 | % | | | 209.1 | | | | 0.6 | % |
| | | | | 340.7 | | | | 1.0 | % | | | 215.8 | | | | 0.6 | % | | | 223.0 | | | | 0.6 | % |
| | | | | 325.6 | | | | 1.0 | % | | | 316.6 | | | | 0.9 | % | | | 506.6 | | | | 1.4 | % |
| | | | | 4,474.5 | | | | 13.2 | % | | | 4,367.0 | | | | 12.8 | % | | | 3,739.0 | | | | 10.1 | % |
| | | | $ | 12,962.1 | | | | 38.3 | % | | $ | 12,398.5 | | | | 36.2 | % | | $ | 12,447.3 | | | | 33.7 | % |
In its normal course of business, CIT extends credit or leases equipment to obligors located in Spain, Italy, Ireland, Greece and Portugal. The total balance of financing and leasing assets to obligors located in these countries was $918 million and $762 million at December 31, 2012 and 2011, respectively, of which approximately 73% and 80% at December 31, 2012 and 2011, respectively, represented operating lease equipment, primarily in Transportation Finance. CIT does not have sovereign debt exposure to these countries.
Cross-Border Transactions
Cross-border transactions reflect monetary claims on borrowers domiciled in foreign countries and primarily include cash deposited with foreign banks and receivables from residents of a foreign country, reduced by amounts funded in the same currency and recorded in the same jurisdiction. The following table includes all countries that we have cross-border claims of 0.75% or greater of total consolidated assets at December 31, 2012:
Cross-border Outstandings as of December 31 (dollars in millions)
| | | | CIT
| |
|---|
| | | | 2012
| | 2011
| | 2010
| |
|---|
Country
| | | | Banks(**)
| | Government
| | Other
| | Net Local
Country
Claims
| | Total
Exposure
| | Exposure
as a
Percentage
of Total
Assets
| | Total
Exposure
| | Exposure
as a
Percentage
of Total
Assets
| | Total
Exposure
| | Exposure
as a
Percentage
of Total
Assets
|
|---|
| | | | $ | 24.0 | | | $ | – | | | $ | 108.0 | | | $ | 1,153.0 | | | $ | 1,285.0 | | | | 2.92 | % | | $ | 2,079.0 | | | | 4.59 | % | | $ | 3,368.0 | | | | 6.55 | % |
| | | | | 2.0 | | | | – | | | | 559.0 | | | | 5.0 | | | | 566.0 | | | | 1.29 | % | | | 443.0 | | | | 0.98 | % | | | 712.0 | | | | 1.38 | % |
| | | | | 28.0 | | | | – | | | | 51.0 | | | | 370.0 | | | | 449.0 | | | | 1.02 | % | | | (*) | | | | – | | | | 382.0 | | | | 0.74 | % |
| | | | | 329.0 | | | | – | | | | 35.0 | | | | – | | | | 364.0 | | | | 0.83 | % | | | (*) | | | | – | | | | (*) | | | | – | |
| | | | | – | | | | – | | | | 42.0 | | | | 293.0 | | | | 335.0 | | | | 0.76 | % | | | 360.0 | | | | 0.80 | % | | | (*) | | | | – | |
| | | | | | | | | | | | | | | | | | | | | (*) | | | | – | | | | 570.0 | | | | 1.26 | % | | | 584.0 | | | | 1.14 | % |
(*) | | Cross-border outstandings were less than 0.75% of total consolidated assets |
(**) | | Claims from Bank counterparts include claims outstanding from derivative products. |
Item 7: Management’s Discussion and Analysis
66 CIT ANNUAL REPORT 2012
Industry Concentrations
The following table represents financing and leasing assets by industry of obligor:
Financing and Leasing Assets by Obligor – Industry (dollars in millions)
| | | | December 31, 2012
| | December 31, 2011
| | December 31, 2010
| |
|---|
Commercial airlines (including regional airlines)(1) | | | | $ | 9,039.2 | | | | 26.7 | % | | $ | 8,844.7 | | | | 25.8 | % | | $ | 7,743.4 | | | | 20.9 | % |
| | | | | 5,107.6 | | | | 15.1 | % | | | 4,420.7 | | | | 12.9 | % | | | 4,813.2 | | | | 13.0 | % |
| | | | | 3,697.5 | | | | 10.9 | % | | | 6,331.7 | | | | 18.5 | % | | | 8,280.9 | | | | 22.4 | % |
| | | | | 3,057.1 | | | | 9.0 | % | | | 2,804.9 | | | | 8.2 | % | | | 3,100.8 | | | | 8.4 | % |
| | | | | 3,010.7 | | | | 8.9 | % | | | 3,252.7 | | | | 9.5 | % | | | 3,602.0 | | | | 9.7 | % |
| | | | | 2,277.9 | | | | 6.7 | % | | | 2,117.8 | | | | 6.2 | % | | | 2,170.6 | | | | 5.9 | % |
| | | | | 1,466.7 | | | | 4.3 | % | | | 1,699.4 | | | | 5.0 | % | | | 2,002.7 | | | | 5.4 | % |
| | | | | 1,391.8 | | | | 4.1 | % | | | 728.2 | | | | 2.1 | % | | | 842.3 | | | | 2.3 | % |
| | | | | 992.8 | | | | 2.9 | % | | | 779.3 | | | | 2.3 | % | | | 645.5 | | | | 1.7 | % |
Oil and gas extraction / services | | | | | 718.7 | | | | 2.1 | % | | | 444.4 | | | | 1.3 | % | | | 438.4 | | | | 1.2 | % |
| | | | | 694.5 | | | | 2.1 | % | | | 23.0 | | | | 0.0 | % | | | 211.8 | | | | 0.6 | % |
Other (no industry greater than 2%) | | | | | 2,451.2 | | | | 7.2 | % | | | 2,797.9 | | | | 8.2 | % | | | 3,177.8 | | | | 8.5 | % |
| | | | $ | 33,905.7 | | | | 100.0 | % | | $ | 34,244.7 | | | | 100.0 | % | | $ | 37,029.5 | | | | 100.0 | % |
(1) | | Includes the Commercial Aerospace Portfolio and additional financing and leasing assets that are not commercial aircraft. |
(2) | | At December 31, 2012, includes manufacturers of chemicals, including Pharmaceuticals (2.6%), food (1.8%), petroleum and coal, including refining (1.9%) and apparel (1.0%). |
(3) | | See Student Lending section for further information. |
(4) | | At December 31, 2012, includes retailers of apparel (3.5%) and general merchandise (2.1%). |
(5) | | Includes rail, bus, over-the-road trucking industries, business aircraft and shipping. |
Operating Lease Equipment
The following table represents the operating lease equipment by segment:
Operating Lease Equipment by Segment (dollars in millions)
| | | | At December 31,
| |
|---|
| | | | 2012
| | 2011
| | 2010
|
|---|
Transportation Finance – Aerospace(1) | | | | $ | 8,112.9 | | | $ | 8,242.8 | | | $ | 7,125.9 | |
Transportation Finance – Rail and Other | | | | | 4,060.7 | | | | 3,511.4 | | | | 3,508.5 | |
| | | | | 214.2 | | | | 217.2 | | | | 446.1 | |
| | | | | 23.9 | | | | 35.0 | | | | 74.5 | |
| | | | $ | 12,411.7 | | | $ | 12,006.4 | | | $ | 11,155.0 | |
(1) | | Aerospace includes commercial, regional and corporate aircraft and equipment. |
At December 31, 2012, Transportation Finance had 268 commercial aircraft, and approximately 103,000 railcars and 400 locomotives on operating lease. We also have commitments to purchase aircraft and railcars, as disclosed inNote 19 — Commitments in Item 8 Financial Statements and Supplementary Data.
The following tables present detail on our commercial and regional aerospace portfolio concentrations, which we call our Commercial Aerospace portfolio. The net investment in regional aerospace financing and leasing assets were $79.8 million, $85.0 million and $90.6 million at December 31, 2012 and 2011 and 2010, respectively; and were substantially comprised of loans and capital leases.
The information presented below by region, manufacturer, and body type, is based on our operating lease aircraft portfolio which comprises 93% of our total commercial aerospace portfolio and substantially all of our owned fleet of leased aircraft at December 31, 2012.
CIT ANNUAL REPORT 2012 67
Commercial Aerospace Portfolio (dollars in millions)
| | | | December 31, 2012
| | December 31, 2011
| | December 31, 2010
| |
|---|
| | | | Net
Investment
| | Number
| | Net
Investment
| | Number
| | Net
Investment
| | Number
|
|---|
| | | | | | | | | | | | | | | | | | | | | | | | | | |
| | | | $ | 8,238.8 | | | | 268 | | | $ | 8,243.0 | | | | 265 | | | $ | 7,064.9 | | | | 238 | |
| | | | | 666.7 | | | | 64 | | | | 394.3 | | | | 52 | | | | 494.9 | | | | 56 | |
| | | | | 40.4 | | | | 10 | | | | 61.8 | | | | 11 | | | | 96.9 | | | | 4 | |
| | | | $ | 8,945.9 | | | | 342 | | | $ | 8,699.1 | | | | 328 | | | $ | 7,656.7 | | | | 298 | |
Commercial Aerospace Operating Lease Portfolio (dollars in millions)(1)
| | | | December 31, 2012
| | December 31, 2011
| | December 31, 2010
| |
|---|
| | | | Net
Investment
| | Number
| | Net
Investment
| | Number
| | Net
Investment
| | Number
|
|---|
| | | | | | | | | | | | | | | | | | | | | | | | | | |
| | | | $ | 3,071.3 | | | | 83 | | | $ | 2,986.0 | | | | 82 | | | $ | 2,488.1 | | | | 76 | |
| | | | | 2,343.2 | | | | 86 | | | | 2,270.6 | | | | 79 | | | | 2,128.7 | | | | 75 | |
| | | | | 1,049.9 | | | | 38 | | | | 1,041.9 | | | | 37 | | | | 814.4 | | | | 31 | |
| | | | | 1,020.2 | | | | 42 | | | | 1,007.1 | | | | 43 | | | | 902.0 | | | | 36 | |
| | | | | 754.2 | | | | 19 | | | | 937.4 | | | | 24 | | | | 731.7 | | | | 20 | |
| | | | $ | 8,238.8 | | | | 268 | | | $ | 8,243.0 | | | | 265 | | | $ | 7,064.9 | | | | 238 | |
| | | | | | | | | | | | | | | | | | | | | | | | | | |
| | | | $ | 5,602.6 | | | | 162 | | | $ | 5,566.4 | | | | 158 | | | $ | 4,683.7 | | | | 143 | |
| | | | | 2,301.0 | | | | 94 | | | | 2,515.2 | | | | 102 | | | | 2,362.9 | | | | 95 | |
| | | | | 324.8 | | | | 12 | | | | 147.4 | | | | 5 | | | | – | | | | – | |
| | | | | 10.4 | | | | – | | | | 14.0 | | | | – | | | | 18.3 | | | | – | |
| | | | $ | 8,238.8 | | | | 268 | | | $ | 8,243.0 | | | | 265 | | | $ | 7,064.9 | | | | 238 | |
| | | | | | | | | | | | | | | | | | | | | | | | | | |
| | | | $ | 5,966.6 | | | | 227 | | | $ | 5,868.3 | | | | 225 | | | $ | 5,328.9 | | | | 206 | |
| | | | | 2,222.6 | | | | 39 | | | | 2,312.5 | | | | 39 | | | | 1,668.6 | | | | 31 | |
| | | | | 37.5 | | | | 1 | | | | 48.4 | | | | 1 | | | | 49.1 | | | | 1 | |
| | | | | 12.1 | | | | 1 | | | | 13.8 | | | | – | | | | 18.3 | | | | – | |
| | | | $ | 8,238.8 | | | | 268 | | | $ | 8,243.0 | | | | 265 | | | $ | 7,064.9 | | | | 238 | |
| | | | | | | | | 97 | | | | | | | | 97 | | | | | | | | 92 | |
Weighted average age of fleet (years) | | | | | | | | | 5 | | | | | | | | 5 | | | | | | | | 5 | |
(1) | | Includes operating lease equipment held for sale of $171.7 million at December 31, 2012, $58.5 million at December 31, 2011 and $1.4 million at December 31, 2010. |
(2) | | Plane count excludes aircraft in which our net investment consists of syndicated financings against multiple aircraft. The net investment associated with such financings was $50.2 million at December 31, 2012, none at December 31, 2011 and 2010. |
(3) | | Narrow body are single aisle design and consist primarily of Boeing 737 and 757 series, Airbus A320 series, and Embraer E170 and E190 aircraft. Intermediate body are smaller twin aisle design and consist primarily of Boeing 767 series and Airbus A330 series aircraft. Wide body are large twin aisle design, such as Boeing 747 and 777 series aircraft. Regional and Other includes aircraft and related equipment such as engines. |
Our top five commercial aerospace outstanding exposures totaled $1,880.8 million at December 31, 2012; all of which were to carriers outside the U.S. The largest individual outstanding exposure totaled $775.4 at December 31, 2012. The largest individual outstanding exposure to a U.S. carrier totaled $163.4 million at December 31, 2012. SeeNote 19 — Commitments for additional information regarding commitments to purchase additional aircraft.
Student Lending Receivables
Consumer includes our liquidating student loan portfolio. During 2012, 2011 and 2010 we sold $2.1 billion, $1.3 billion and $1.0 billion (pre-FSA), respectively. The remaining decrease reflects collections and FSA accretion. SeeNote 8 — Long-Term Borrowings for description of related financings.
Item 7: Management’s Discussion and Analysis
68 CIT ANNUAL REPORT 2012
Student Lending Receivables, including held for sale, by Product Type (dollars in millions)
| | | | At December 31,
| |
|---|
| | | | 2012
| | 2011
| | 2010
|
|---|
| | | | $ | 3,676.9 | | | $ | 5,315.7 | | | $ | 7,119.0 | |
Other U.S. Government guaranteed loans | | | | | 19.1 | | | | 1,014.2 | | | | 1,159.2 | |
Private (non-guaranteed) loans and other | | | | | 1.5 | | | | 1.8 | | | | 2.7 | |
| | | | $ | 3,697.5 | | | $ | 6,331.7 | | | $ | 8,280.9 | |
Delinquencies (sixty days or more) | | | | $ | 318.0 | | | $ | 513.5 | | | $ | 608.9 | |
Top state concentrations (%) | | | | | 34 | % | | | 36 | % | | | 35 | % |
| | | | California, New York,
Texas, Pennsylvania,
Florida | | California, New York, Texas,
Ohio, Pennsylvania |
| | | | | | | | | | | | | | |
We are subject to a variety of risks that can manifest themselves in the course of the business that we operate in. We consider the following to be the principal forms of risk:
| - | | Credit and asset risk (including lending, leasing, counterparty, equipment valuation and residual risk) |
| - | | Market risk (including interest rate and foreign currency) |
| - | | Legal, regulatory and compliance risks (including compliance with laws and regulations) |
| - | | Operational risks (risk of financial loss or potential damage to a firm’s reputation, or other adverse impacts resulting from inadequate or failed internal processes and systems, people or external events) |
Managing risk is essential to conducting our businesses and to our profitability. This starts with defining our risk appetite, setting risk acceptance criteria, and establishing credit authorities, limits and target performance metrics. Ensuring appropriate risk governance and oversight includes establishing and enforcing policies, procedures and processes to manage risk. Adequately identifying, monitoring and reporting on risk is essential to ensure that actions are taken to proactively manage risk. This requires appropriate data, tools, models, analytics and management information systems. Finally, ensuring the appropriate expertise through staffing and training is key to effective risk management.
During the second quarter of 2012, CIT updated and enhanced credit grading models for individually graded exposures. These updated models, which were developed using CIT’s historic data, are part of our ongoing model development life cycle. The impact of using these models was not significant to the allowance for loan losses as of December 31, 2012. Absent any changes in the current credit environment, we do not expect any adverse impact to our allowance for loan losses on existing loans as the remaining portfolio is re-graded. See “Credit Metrics” for information on the allowance for loan losses.
SUPERVISION AND OVERSIGHT
The Chief Risk Officer (“CRO”) or delegate manages credit risk and asset risk (transactional and portfolio), country risk, industry risk, operational risk, model risk and compliance risk across the Company. Together these risk disciplines form the Corporate Risk Management group. For market risk and liquidity risk management, the Chief Financial Officer or delegate manages the risk and the CRO provides independent oversight.
The Credit Risk Management (“CRM”) group, which reports to the CRO, manages and approves all credit risk throughout CIT. This group is managed by the Chief Credit Officer (“CCO”), and includes the heads of credit for each business, the head of Problem Loan Management, Credit Control and Credit Administration. The Corporate Credit Committee (“CCC”), Credit Policy Committee and Criticized Asset Committee each report into the CCO.
Loan Risk Review (“LRR”) is an independent oversight function which is responsible for performing internal credit related asset reviews for the organization as well as the ongoing monitoring, testing, and measurement of credit quality and credit process risk in enterprise-wide lending and leasing activities. LRR reports to the Risk Management Committee of the Board and administratively into the CRO.
The Credit Portfolio Risk group (“CPR”) is responsible for credit data, models, analytics and reporting. Enterprise Risk Management (“ERM”) is responsible for oversight of market risk (foreign exchange and interest rate), liquidity risk, asset risk, operational risk, counterparty risk, country and industry risk, new product risk and independent model validation.
The Asset Liability Committee (“ALCO”) has primary authority and responsibility to establish strategies regarding funding, capital, market and liquidity risks arising from CIT’s businesses.
The Compliance function reports into the Audit Committee of the Board and administratively into the CRO. Regulatory Relations reports to Internal Audit Services (“IAS”) and the Chief Audit Executive. The Risk Management Committee of the Board oversees credit, asset, market, liquidity, operational and information technology (“IT”) risk management practices. The Audit and the Special Compliance Committees of the Board oversee financial, legal, compliance and audit risk management practices.
CIT ANNUAL REPORT 2012 69
In addition to clearly assigned roles and responsibilities, the governance framework includes a core set of tools that are used for managing risks at CIT. We categorize the risks that we manage as primary and secondary. Primary risks, such as credit and assets risk, are taken proactively in the normal conduct of business activities, consistent with our core competency and focus. The objective for taking these risks is to provide positive risk-adjusted returns while limiting Company risk due to competency in managing these risk types. Secondary risks, such as interest-rate and foreign currency risks, are by-products of engaging in our primary businesses. These risks are well understood but are not proactively pursued, but rather, are proactively managed.
CIT’s governance framework includes a suite of risk monitoring tools. These tools provide a comprehensive assessment of CIT’s risks, enabling Senior Management and the Board to assess the Company’s risk profile.
CREDIT AND ASSET RISK
Lending Risk
The extension of credit through our lending and leasing activities is the fundamental purpose of our businesses. As such, CIT’s credit risk management process is centralized in the CRM group, reporting into the CCO and CRO. This group establishes the Company’s risk appetite for underwriting, approves all extensions of credit, and is responsible for portfolio management, including credit grading and problem loan management. CRM reviews and monitors credit exposures to identify, as early as possible, customers that are experiencing declining creditworthiness or financial difficulty. The CCO evaluates reserves through our Allowance for Loan and Lease Losses (“ALLL”) process for performing loans and non-accrual loans, as well as establishing nonspecific reserves to cover losses inherent in the portfolio. CIT’s portfolio is managed by setting limits and target performance metrics, and monitoring risk concentrations by borrower, industry, geography and equipment type. We set or modify credit authorities, including Risk Acceptance Criteria as conditions warrant, based on borrower risk, collateral, industry risk portfolio size and concentrations, credit concentrations and risk of substantial credit loss. We evaluate our collateral and test for asset impairment based upon collateral value and projected cash flows and relevant market data with any impairment in value charged to earnings.
Using our underwriting policies, procedures and practices, combined with credit judgment and quantitative tools, we evaluate financing and leasing assets for credit and collateral risk during the credit granting process and after the advancement of funds. We set forth our underwriting parameters based on: (1) Target Market Definitions, which delineate risk by market, industry, geography and product, (2) Risk Acceptance Criteria, which detail acceptable structures, credit profiles and risk-adjusted returns, and through our Corporate Credit Policies. We capture and analyze credit risk based on probability of obligor default (“PD”) and loss given default (“LGD”). PD is determined by evaluating borrower creditworthiness, including analyzing credit history, financial condition, cash flow adequacy, financial performance and management quality. LGD ratings, which estimate loss if an account goes into default, are predicated on transaction structure, collateral valuation and related guarantees (including recourse to manufacturers, dealers or governments).
Our policies and procedures consider restrictions on banking activities and are appropriately tailored for CIT Bank and other similarly-regulated entities.
We have executed derivative transactions with our customers in order to assist them to mitigate their interest rate and currency risks. We typically enter into offsetting derivative transactions with third parties in order to neutralize CIT’s exposure to these customer related derivative transactions. The counterparty credit exposure related to these transactions is monitored and evaluated as part of our credit risk management process. We also monitor and manage counterparty credit risk related to our cash and short-term investment portfolio.
Commercial Lending and Leasing. Commercial credit management begins with the initial evaluation of credit risk and underlying collateral at the time of origination and continues over the life of the finance receivable or operating lease, including normal collection, recovery of past due balances and liquidating underlying collateral.
Credit personnel review potential borrowers’ financial condition, results of operations, management, industry, business model, customer base, operations, collateral and other data, such as third party credit reports and appraisals, to evaluate the customer’s borrowing and repayment ability. Transactions are graded by PD and LGD, as described above. Credit facilities are subject to our overall credit approval process and underwriting guidelines and are issued commensurate with the credit evaluation performed on each borrower, as well as portfolio concentrations. Credit personnel continue to review the PD and LGD periodically. Decisions on continued creditworthiness or impairment of borrowers are determined through these periodic reviews.
Small-Ticket Lending and Leasing. For certain small-ticket lending and leasing transactions, we employ automated credit scoring models for origination (scorecards) and for re-grading (auto re-grade algorithms). These are supplemented by business rules and expert judgment. The models evaluate, among other things, financial performance metrics, length of time in business, industry category and geography, and are used to assess a potential borrower’s credit standing and repayment ability, including the value of collateral. We utilize external credit bureau scoring, when available, and behavioral models, as well as judgment in the credit adjudication, evaluation and collection processes.
We evaluate the small-ticket leasing portfolio using delinquency vintage curves and other tools to analyze trends and credit performance by transaction type, including analysis of specific credit characteristics and selected subsets of the portfolios. Adjustments to credit scorecards, auto re-grading algorithms, business rules and lending programs are made periodically based on these evaluations. Individual underwriters are assigned credit authority based upon experience, performance and understanding of underwriting policies of small-ticket leasing operations. A credit approval hierarchy is enforced to ensure that an underwriter with the appropriate level of authority reviews applications.
Counterparty Risk
We enter into interest rate and currency swaps and foreign exchange forward contracts as part of our overall risk management practices. We establish limits and evaluate and manage the counterparty risk associated with these derivative instruments through our CRM and ERM groups. External risk is defined as
Item 7: Management’s Discussion and Analysis
70 CIT ANNUAL REPORT 2012
risks outside of our direct control, including counterparty credit risk, liquidity risk, systemic risk, legal risk and market risk. Internal risk relates to operational risks within the management oversight structure and includes actions taken in contravention of CIT policy.
The primary external risk of derivative instruments is counterparty credit exposure, which is defined as the ability of a counterparty to perform financial obligations under the derivative contract. We control credit risk of derivative agreements through counterparty credit approvals, pre-established exposure limits and monitoring procedures.
The CCC, in conjunction with CRM, approves each counterparty and establishes exposure limits based on credit analysis of each counterparty. Derivative agreements are generally entered into with major financial institutions rated investment grade by nationally recognized rating agencies.
Equipment Valuation and Residual Risk
Asset risk in our leasing business is evaluated and managed in the business units and overseen by CRM. Our business process consists of: (1) setting residual values at transaction inception, (2) systematic residual value reviews, and (3) monitoring actual levels of residual realizations. Residual realizations, by business and product, are reviewed as part of our quarterly financial and asset quality review. Reviews for impairment are performed at least annually.
The risk teams closely follow the air and rail markets; monitoring traffic flows, measuring supply and demand trends, and evaluating the impact of new technology or regulatory requirements on supply and demand for different types of equipment. Demand for both passenger and freight equipment is highly correlated with the GDP growth trends for the markets the equipment serves as well as the more immediate conditions of those markets. Due to the moveable nature of commercial air equipment, air markets are global, while for CIT, the rail market is centered in North America. So cyclicality in the economy and shifts in travel and trade flows from specific events (e.g., natural disasters, conflicts, political upheaval, disease, terrorism) represent risks to the earnings from these businesses. CIT mitigates these risks by maintaining young fleets of assets with wide operator bases so that our assets can maintain relatively stronger and more stable utilization rates compared to the broader industry’s fleets of aircraft and railcars despite demand impacts from unexpected events or cyclical trends.
MARKET RISK
We monitor exposure to market risk by analyzing the impact of potential interest rate and foreign exchange rate changes on financial performance. We consider factors such as customer prepayment trends and repricing characteristics of assets and liabilities. Our asset-liability management system provides sophisticated analytical capabilities to assess and measure the effects of various market rate scenarios upon the Company’s financial performance.
Interest Rate Risk
At December 31, 2012, over 60% of the Company’s loan, lease, and investment portfolio was fixed rate, with the balance floating rate, while just over 70% of our interest-bearing liabilities were fixed rate. As a result, our portfolio is in an asset-sensitive position, mostly to moves in LIBOR, as our assets will reprice faster than our liabilities. Therefore, our net interest margin may increase if interest rates rise, or decrease if interest rates decline. The following table summarizes the composition of interest rate sensitive assets and liabilities. The increase in fixed rate assets reflects the change in portfolio mix during 2012 including a higher proportion of operating lease assets and a lower proportion of student loans.
| | | | December 31, 2012
| | December 31, 2011
| |
|---|
| | | | Fixed Rate
| | Floating Rate
| | Fixed Rate
| | Floating Rate
|
|---|
| | | | | 63 | % | | | 37 | % | | | 56 | % | | | 44 | % |
| | | | | 71 | % | | | 29 | % | | | 77 | % | | | 23 | % |
We evaluate and monitor interest rate risk through two primary metrics.
| - | | Net Interest Income Sensitivity (“NII Sensitivity”), which measures the impact of hypothetical changes in interest rates on net finance revenue; and |
| - | | Economic Value of Equity (“EVE”), which measures the net economic value of equity by assessing the market value of assets, liabilities and derivatives. |
A wide variety of potential interest rate scenarios are simulated within our asset/liability management system. All interest sensitive assets and liabilities are evaluated using discounted cash flow analysis. Rates are shocked up and down via a set of scenarios that include both parallel and non-parallel interest rate movements. Scenarios are also run to capture our sensitivity to changes in the shape of the yield curve. Furthermore, we evaluate the sensitivity of these results to a number of key assumptions, such as credit quality, spreads, and prepayments. Various holding periods of the operating lease assets are also considered. These range from the current existing lease term to longer terms which assume lease renewals consistent with management’s expected holding period of a particular asset. NII Sensitivity and EVE limits have been set and are monitored for certain of the key scenarios.
The table below summarizes the results of simulation modeling produced by our asset/liability management system. The results reflect the percentage change in the EVE and NII Sensitivity over the next twelve months assuming an immediate 100 basis point parallel increase and decrease in interest rates.
| | | | December 31, 2012
| | December 31, 2011
| |
|---|
| | | | +100 bps
| | –100 bps
| | +100 bps
| | –100 bps
|
|---|
| | | | | 7.6 | % | | | (1.9 | )% | | | 11.4 | % | | | (6.0 | )% |
| | | | | 1.8 | % | | | (1.4 | )% | | | (1.9 | )% | | | 4.7 | % |
CIT ANNUAL REPORT 2012 71
The reduction in the NII Sensitivity figures is a result of a smaller mismatch between floating rate assets and liabilities, as well as a lower interest rate environment. The change to the EVE period over period was driven by the refinancing of the remainder of high cost callable unsecured debt with non-callable issuances, which has extended the duration, or price sensitivity, of our liabilities. In addition, the methodology with which the operating lease assets are assessed in the table above reflects the existing contractual rental cash flows and the expected residual value at the end of the existing contract term. EVE figures presented in prior reports reflected an assumed hold period, which had the affect of lengthening the duration and sensitivity of the operating lease portfolio. Under this scenario, the changes would have been (2.9)% and (6.1)% for an immediate +100 bps parallel change in rates and 4.2% and 9.5% for an immediate -100 bps parallel change in rates as of December 31, 2012 and 2011, respectively. The simulation modeling for both NII Sensitivity and EVE assumes we take no action in response to the changes in interest rates.
Although we believe that these measurements provide an estimate of our interest rate sensitivity, they do not account for potential changes in credit quality, size, and prepayment characteristics of our balance sheet. They also do not account for other business developments that could affect net income, or for management actions that could affect net income or that could be taken to change our risk profile. Accordingly, we can give no assurance that actual results would not differ materially from the estimated outcomes of our simulations. Further, such simulations do not represent our current view of expected future interest rate movements.
Foreign Currency Risk
We seek to hedge the transactional exposure of our non-dollar denominated activities, comprised of foreign currency loans and leases to foreign entities, through local currency borrowings. To the extent such borrowings were unavailable, we have utilized derivative instruments (foreign currency exchange forward contracts and cross currency swaps) to hedge our non-dollar denominated activities. Additionally, we have utilized derivative instruments to hedge the translation exposure of our net investments in foreign operations.
Our non-dollar denominated loans and leases are now largely funded with U.S. dollar denominated debt and equity which, if unhedged, would cause foreign currency transactional and translational exposures. We target to hedge these exposures through derivative instruments. Approved limits are monitored to facilitate the management of our foreign currency position. Included among the limits are guidelines which measure both transactional and translational exposure based on potential currency rate scenarios. Unhedged exposures may cause changes in earnings or the equity account.
Liquidity Risk
Our liquidity risk management and monitoring process is designed to ensure the availability of adequate cash resources and funding capacity to meet our obligations. Our overall liquidity management strategy is intended to ensure ample liquidity to meet expected and contingent funding needs under both normal and stress environments. Consistent with this strategy, we maintain large pools of cash and highly liquid investments. Additional sources of liquidity include the Revolving Credit and Guaranty Agreement, (the “Revolving Credit Facility”), other committed financing facilities and cash collections generated by portfolio assets originated in the normal course of business.
We utilize a series of measurement tools to assess and monitor the level and adequacy of our liquidity position, liquidity conditions and trends. The primary tool is a cash forecast designed to identify material mismatches in cash flows. Stress scenarios are applied to measure the resiliency of the liquidity position and to identify stress points requiring remedial action. Also included among our liquidity measurement tools is an early warning system (summarized on a liquidity scorecard) that monitors key macro-environmental and company specific metrics that serve as early warning signals of potential impending liquidity stress events. The scorecard gauges the likelihood of a liquidity stress event by evaluating metrics that reflect: cash liquidity coverage of funding requirements; elevated funding needs; capital and liquidity at risk; funding sources at risk and market indicators. The Scorecard contains a short-term liquidity assessment which is derived objectively via a quantitative measurement of each metric’s severity and overall impact on liquidity. Assessments below defined thresholds trigger contingency funding actions, which are detailed in the Company’s Contingency Funding Plan.
Approved liquidity limits and guidelines are monitored to facilitate the active management of our funding and liquidity position. Among the limits and guidelines measured are minimum cash investment balances, sources of available liquidity relative to short term debt maturities and other funding commitments, cash flow coverage ratios, size of undrawn customer lines and other contingent liquidity risks, and debt maturity profile.
Integral to our liquidity management practices is our contingency funding plan, which outlines actions and protocols under liquidity stress conditions, whether they are idiosyncratic or systemic in nature. The objective of the plan is to ensure an adequately sustained level of liquidity under stress conditions.
LEGAL, REGULATORY AND COMPLIANCE RISK
Corporate Compliance is an independent function responsible for maintaining an enterprise-wide compliance risk management program commensurate with the size, scope and complexity of our businesses, operations, and the geographies in which we operate. The Compliance function oversees programs and processes to evaluate and monitor compliance with laws and regulations pertaining to our business, tests the adequacy of the compliance control environment in each business, and monitors and promotes compliance with the Company’s ethical standards as set forth in our Code of Business Conduct and compliance policies. The Company, through its executive leadership and Board of Directors drive the development of a prominent compliance culture across the Company and in every location in which it conducts business.
The Corporate Compliance function provides leadership, guidance and oversight to help business units and staff functions identify applicable laws and regulations and implement effective measures to meet the requirements and mitigate the risk of violations of or failures to meet our legal and regulatory obligations. The global compliance risk management program includes training, testing, monitoring, risk assessment, and other critical
Item 7: Management’s Discussion and Analysis
72 CIT ANNUAL REPORT 2012
disciplines necessary to effectively manage compliance and regulatory risks. The Company relies on subject matter experts in the areas of privacy, sanctions, anti-money laundering, anti-corruption compliance and other areas typically addressed by bank holding companies with large complex profiles.
Corporate Compliance has implemented comprehensive compliance policies and employs Business Unit Compliance Officers and Regional Compliance Officers who work with each business unit to advise business staff and leadership in the prudent conduct of business within a regulated environment. They advise business leadership and staff with respect to the implementation of procedures to operationalize compliance policies and other requirements. Corporate Compliance also provides and monitors adherence to mandatory employee compliance training programs.
Corporate Compliance, led by the Chief Compliance Officer, is responsible for setting the overall global compliance framework and standards, using a risk based approach to identify and manage key compliance obligations and risks. The head of each business and staff function is responsible for ensuring compliance within their respective areas of authority. Corporate Compliance, through the Chief Compliance Officer, reports administratively to the CRO and to the Audit Committee of the Board of Directors.
OPERATIONAL RISK
Operational risk is the risk of financial loss, or potential damage to a firm’s reputation, or other adverse impacts resulting from inadequate or failed internal processes and systems, people or external events. Operational Risk may result from fraud by employees or persons outside the Company, transaction processing errors, employment practices and workplace safety issues, unintentional or negligent failure to meet professional obligations to clients, business interruption due to system failures, or other external events.
Operational risk is managed within individual business units. The head of each business and functional area is responsible for maintaining an effective system of internal controls to mitigate operational risks. The business segment Chief Operating Officers (“COO”) designate Operational Risk Managers responsible for implementation of the Operational Risk framework programs. The Enterprise Operational Risk function provides oversight in managing operational risk, designs and supports the enterprise-wide Operational Risk framework programs, promotes awareness by providing training to employees and Operational Risk Managers within business units and functional areas. Additionally, Enterprise Operational Risk maintains the Loss Data Collection and Risk Assessment programs. CIT’s internal audit department monitors and tests the overall effectiveness of internal control and operational systems on an ongoing basis and reports results to senior management and to the Audit Committee of the Board. Oversight of the operational risk management function is provided by CRM, the Operational and Information Technology Risk Working Group, the Enterprise Risk Committee and the Risk Management Committee of the Board of Directors.
Portfolio collections, capital markets, securitizations and secured borrowings, various credit facilities, and deposits provide our sources of funding and liquidity.
CIT actively manages and monitors its funding and liquidity sources against key limits and guidelines to satisfy funding and other operating obligations, while also providing protection against unforeseen stress events, for instance unanticipated funding obligations, such as customer line draws, or disruptions to capital markets or other funding sources. CIT has both primary and contingent sources of liquidity. In addition to its unrestricted cash and portfolio cash inflows, liquidity sources include:
| - | | a Revolving Credit and Guaranty Agreement, (the “Revolving Credit Facility”), to meet cash needs based on underlying market conditions. CIT has a $2 billion multi-year committed revolving credit facility of which $1.9 billion is available at December 31, 2012; |
| - | | the securitization market, in the form of committed securitization facilities aggregating $4.4 billion of which $1.6 billion is available at December 31, 2012; and |
| - | | portfolio assets, which are sold via sales or loan syndications, are a means to access liquidity and manage credit exposure. |
Cash and short-term investment securities totaled $7.6 billion at December 31, 2012 $(6.8 billion of cash and $0.8 billion of short-term investments), down from $8.4 billion at December 31, 2011. Cash and short-term investment securities at December 31, 2012 consisted of $2.5 billion related to the bank holding company, $3.4 billion at CIT Bank, $0.5 billion at operating subsidiaries and $1.2 billion in restricted balances.
Our short-term investments include U.S. Treasury bills and Government Agency bonds. These investments are classified as available for sale and have maturities of 30 days or less as of the investment date. We anticipate continued investment of our cash in various types of liquid, high-grade investments.
2012 Financings and Liability Management
During 2012, CIT eliminated or refinanced $15.2 billion of high cost debt $(8.8 billion of 7% Series C Notes and $6.5 billion of 7% Series A Notes) as we completed the redemption of approximately $31 billion of high cost debt incurred during our restructuring in 2009. Additionally, CIT eliminated or refinanced approximately $1 billion of debt secured by student loans in the 2012 fourth quarter. In aggregate, these transactions reduced 2012 pre-tax income by $1.5 billion due to accelerated debt FSA and OID accretion and loss on debt extinguishment. The elimination of our remaining Series A Notes in the 2012 first quarter resulted in all of our Series C Notes becoming unsecured. In addition, the Revolving Credit Facility also became unsecured upon our completion of certain administrative requirements as set forth under the Revolving Credit Facility.
In 2012, CIT raised nearly $10 billion of term unsecured debt with an average maturity of approximately 6 years and a weighted
CIT ANNUAL REPORT 2012 73
average coupon of approximately 5%. CIT has also demonstrated consistent ability and access to fund via both the domestic as well as international securitization markets through public ABS transactions and bank conduits. During 2012, CIT entered into numerous secured financing transactions as described under theSecured Borrowings section below.
Since January 2010, CIT has entered into over $21 billion of new financings and credit facilities.
Deposits totaled $9.7 billion at December 31, 2012, up from $6.2 billion at December 31, 2011 and $4.5 billion at December 31, 2010. The weighted average interest rate on deposits was 1.75% at December 31, 2012, down from 2.68% at December 31, 2011 and 3.13% at December 31, 2010.
As a result of our continued funding and liability management initiatives, we reduced the weighted average coupon rates on outstanding deposits and long-term borrowings to 3.18% at December 31, 2012 from 4.69% and 5.30% at December 31, 2011 and December 31, 2010, respectively. We also continued to make progress towards achieving our long term targeted funding mix as detailed in the following table:
Long-term Target Funding Mix (dollars in millions)
| | | | | | December 31,
| |
|---|
| | | | Target
| | 2012
| | 2011
| | 2010
|
|---|
| | | | | 35%–45 | % | | | 31 | % | | | 19 | % | | | 12 | % |
| | | | | 25%–35 | % | | | 32 | % | | | 81 | % | | | 88 | % |
| | | | | 25%–35 | % | | | 37 | % | | | – | | | | – | |
* | | As a result of redeeming the remaining Series A Notes during the 2012 first quarter, the Revolving Credit Facility and all of our Series C Notes became unsecured. |
Unsecured Borrowings
As a result of redeeming the remaining Series A Notes during the 2012 first quarter, the Revolving Credit Facility and all of our Series C Notes became unsecured.
Revolving Credit Facility
On August 25, 2011, CIT and certain of its subsidiaries entered into a Revolving Credit Facility. The total commitment amount under the Revolving Credit Facility is $2 billion, consisting of a $1.65 billion revolving loan tranche and a $350 million revolving loan tranche that can also be utilized for issuance of letters of credit. The Revolving Credit Facility matures on August 14, 2015 and accrues interest at a per annum rate of LIBOR plus a margin of 2.00% to 2.75% (with no floor) or Base Rate plus a margin of 1.00% to 1.75% (with no floor). The applicable margin is determined by reference to the long-term senior unsecured, non-credit enhanced debt rating of the Company by S&P and Moody’s effective at relevant times during the life of the Revolving Credit Facility. The applicable margin for LIBOR loans is 2.50% and the applicable margin for Base Rate loans is 1.50% at December 31, 2012. Further improvement in CIT’s long-term senior unsecured, non-credit enhanced debt ratings to either BB by S&P or Ba2 by Moody’s would result in a reduction in the applicable margin to 2.25% for Libor based loans and to 1.25% for Base Rate loans.
The Revolving Credit Facility may be drawn and repaid from time to time at the option of CIT. The amount available to draw upon at December 31, 2012 was approximately $1.9 billion. The unutilized portion of any commitment under the Revolving Credit Facility may be reduced permanently or terminated by CIT at any time without penalty.
Once the Company redeemed all the remaining Series A Notes during the 2012 first quarter, all the collateral and subsidiary guarantees under the Revolving Credit Facility were released, except for subsidiary guarantees from eight of the Company’s domestic operating subsidiaries (“Continuing Guarantors”). Once the Revolving Credit Facility became unsecured, the collateral coverage covenant was replaced by an asset coverage covenant (based on the book value of eligible assets of the Continuing Guarantors) of 2.0x the sum of: (i) the committed facility size and (ii) all outstanding indebtedness (including, without duplication, guarantees of such indebtedness) for borrowed money (excluding subordinated intercompany indebtedness) of the Continuing Guarantors, tested monthly and upon certain dispositions or encumbrances of eligible assets of the Continuing Guarantors. At December 31, 2012, the asset coverage ratio was 2.3x.
The Revolving Credit Facility is also subject to a $6 billion minimum consolidated net worth covenant of the Company, tested quarterly, and limits the Company’s ability to create liens, merge or consolidate, sell, transfer, lease or dispose of all or substantially all of its assets, grant a negative pledge or make certain restricted payments during the occurrence and continuance of an event of default.
Senior Unsecured Notes
In March 2012, CIT filed a “shelf” registration statement. The following table presents issuances of Senior Unsecured Notes in 2012 under the Company’s shelf:
Senior Unsecured Notes (dollars in millions)
Date of Issuance
| | | | Rate (%)
| | Maturity Date
| | Par Value
|
|---|
| | | | | 5.250 | % | | | March 2018 | | | $ | 1,500.0 | |
| | | | | 5.000 | % | | | May 2017 | | | | 1,250.0 | |
| | | | | 5.375 | % | | | May 2020 | | | | 750.0 | |
| | | | | 4.250 | % | | | August 2017 | | | | 1,750.0 | |
| | | | | 5.000 | % | | | August 2022 | | | | 1,250.0 | |
| | | | | 4.90 | % | | | | | | $ | 6,500.0 | |
The proceeds of these transactions were used in conjunction with available cash, to redeem the 7% Series C Notes in 2012. These senior unsecured notes rank equal in right of payment with the Series C Notes and the Revolving Credit Facility.
Item 7: Management’s Discussion and Analysis
74 CIT ANNUAL REPORT 2012
Series C Notes
The following table presents issuances of Series C Unsecured Notes:
Series C Notes (dollars in millions)
Date of Issuance
| | | | Rate (%)
| | Maturity Date
| | Par Value
|
|---|
| | | | | 5.250 | % | | | March 2014 | | | $ | 1,300.0 | |
| | | | | 6.625 | % | | | March 2018 | | | | 700.0 | |
| | | | | 4.750 | % | | | February 2015 | | | | 1,500.0 | |
| | | | | 5.500 | % | | | February 2019 | | | | 1,750.0 | |
| | | | | 5.37 | % | | | | | | $ | 5,250.0 | |
The proceeds of the 2012 transaction were used, in conjunction with available cash, to redeem the remaining Series A Notes in March 2012.
The Indenture for the Series C Notes limits the Company’s ability to create liens, merge or consolidate, or sell, transfer, lease or dispose of all or substantially all of its assets. Upon a Change of Control Triggering Event as defined in the Series C Indenture, holders of the Series C Notes will have the right to require the Company, as applicable, to repurchase all or a portion of the Series C Notes at a purchase price equal to 101% of the principal amount, plus accrued and unpaid interest to the date of such repurchase.
Secured Borrowings
Our secured financing transactions do not meet accounting requirements for sale treatment and are recorded as secured borrowings, with the assets remaining on-balance sheet for GAAP. The debt associated with these transactions is collateralized by receivables, leases and/or equipment. Certain related cash balances are restricted.
Secured borrowings, which include securitizations, totaled $10.1 billion at December 31, 2012, essentially flat with December 31, 2011.
In April 2012, CIT closed a $753 million equipment lease securitization, secured by a pool of U.S. equipment leases from CIT’s Vendor Finance business segment. The weighted average fixed coupon was 1.45%, which represented a weighted average credit spread of 0.88% over benchmark rates for the six classes of notes. The securitization had a net advance rate of 92.5%.
In June 2012, we closed a $1 billion committed U.S. Vendor Finance conduit facility that allows the U.S. Vendor Finance business to fund both existing assets and new originations within CIT Bank, renewed a £100 million (approximately $160 million based on the June 30, 2012 exchange rate) UK Vendor Finance conduit facility with improved terms and closed an aircraft financing under our existing European Export Credit Agencies (ECA) facility.
In July 2012, CIT closed a C$515 million $(511 million based on the exchange rate at the time of the transaction) securitization secured by a pool of Canadian equipment receivables from CIT’s Vendor Finance business segment. The weighted average fixed coupon was 2.285%, which represents a weighted average credit spread of 1.31% over benchmark Government of Canada treasury rates for the three classes of notes. The securitization had a net advance rate of 96.75%.
In August and September 2012, we funded 6 Boeing aircraft under a secured facility guaranteed by the Export-Import Bank of the United States for total proceeds of approximately $200 million.
In September 2012, we renewed a $500 million committed facility secured by receivables at a lower cost and with a final maturity in November 2014 and also closed a new RMB2.2 billion (approximately $345 million based on the exchange rate at the time of the transaction) committed facility, which is in addition to an existing facility closed in 2011, that will allow CIT’s Vendor Finance business segment to fund new originations in China. The committed availability period of the Vendor China facility expires in September 2014 with a three year final maturity for each drawdown under the facility.
In mid-November 2012, CIT sold at a $16 million gain to carrying value approximately $550 million in student loans. Most of the student loans served as collateral for approximately $515 million in asset-backed securities (“ABS”) funded through the TRS and proceeds from the sale of these student loans were used to redeem the ABS on November 19, 2012 at par. The ABS redemption decreased 2012 interest expense by approximately $6 million as a $40 million increase in interest expense from the acceleration of FSA discount was more than offset by $46 million in reimbursement of original issue discount related to the TRS. The redemption also generated other income of $35 million due to acceleration of the counterparty receivable accretion.
On November 27, 2012, CIT redeemed the remaining balance of approximately $480 million in principal amount of ABS issued by Education Funding Capital Trust III (“EFCT III”), a student lending securitization entity, at par. Substantially all of the student loans underlying EFCT III were refinanced by CIT through a new $420 million ABS transaction in December 2012 that was funded through the TRS. The redemption of EFCT III increased 2012 interest expense by $81 million due to the acceleration of FSA discount amortization.
In November and December 2012, we funded five Airbus aircraft under our existing ECA facility for total proceeds of approximately $170 million. In December 2012, CIT closed a new $208 million collateralized loan obligation (“CLO”) backed by a portfolio of Corporate Finance loans. The CLO was funded through the TRS.
7% Series A Notes and 7% Series C Notes
During 2012, CIT redeemed all the remaining $6.5 billion of 7% Series A Notes and redeemed or repurchased all the remaining $8.8 billion of 7% Series C Notes. These actions resulted in the acceleration of $1.3 billion of FSA discount accretion that was recorded as additional interest expense and also resulted in a loss on debt extinguishments of $61 million.
InterNotes Retail Note Program
The balance of InterNotes retail note program (“InterNotes”) at December 31, 2012 was approximately $73 million, which includes $39 million of FSA discount. These InterNotes are callable and on December 15, 2012, CIT redeemed at par approximately $18 million in principal amount of senior debt securities issued by CIT under its pre-reorganization InterNotes retail note program. The debt securities subject to this redemption were among those debt securities that did not elect treatment under CIT’s Chapter
CIT ANNUAL REPORT 2012 75
11 plan of reorganization. As a result, these debt securities were reinstated upon confirmation of such plan. This redemption increased fourth quarter 2012 interest expense by approximately $8 million due to the acceleration of FSA discount amortization.
GSI Facilities
On October 26, 2011, CIT Group Inc. (“CIT”) amended its existing $2.125 billion total return swap facility between CIT Financial Ltd. (“CFL”) and Goldman Sachs International (“GSI”) in order to provide greater flexibility for certain assets to be funded under the facility. The size of the existing CFL Facility was reduced to $1.5 billion, and the $625 million formerly available under the existing CFL facility was transferred to a new total return swap facility between GSI and CIT TRS Funding B.V. (“BV”), a wholly-owned subsidiary of CIT. The CFL Facility and the BV Facility are together referred to below as the GSI Facilities.
At December 31, 2012, a total of $3,492 million, of financing and leasing assets, comprised of $416 million in Corporate Finance, $1,015 million in Consumer and $2,061 million in commercial aerospace and rail assets in Transportation Finance, were pledged in conjunction with $2,260 million in secured debt issued to investors under the GSI Facilities. After adjustment to the amount of actual qualifying borrowing base under terms of the GSI Facilities, this $2,260 million of secured debt provided for usage of $2,018 million of the maximum notional amount of the GSI Facilities at December 31, 2012. The remaining $107 million of the maximum notional amount represents the unused portion of the GSI Facilities and constitutes the notional amount of derivative financial instruments. Unsecured counterparty receivable of $649 million, net of FSA, is owed to CIT from GSI for debt discount, return of collateral posted to GSI and settlements resulting from market value changes to asset-backed securities underlying the structures at December 31, 2012.
The CFL Facility was originally executed on June 6, 2008, and under an October 28, 2009 amendment, the maximum notional amount of the CFL Facility was reduced from $3.0 billion to $2.125 billion. During the first half of 2008, CIT experienced significant constraints on its ability to raise funding through the debt capital markets and access the Company’s historical sources of funding. The CFL Facility provided a swapped rate on qualifying secured funding at a lower cost than available to CIT through other funding sources. The CFL Facility was structured as a TRS to satisfy the specific requirements to obtain this funding commitment from GSI. Pursuant to applicable accounting guidance, only the unutilized portion of the total return swap is accounted for as a derivative and recorded at fair value. Under the terms of the GSI Facilities, CIT raises cash from the issuance of ABS to investors designated by GSI under the total return swap, equivalent to the face amount of the ABS less an adjustment for any OID which equals the market price of the ABS. CIT is also required to deposit a portion of the face amount of the ABS with GSI as additional collateral prior to funding ABS through the GSI Facilities.
Amounts deposited with GSI can increase or decrease over time depending on the market value of the ABS and / or changes in the ratings of the ABS. CIT and GSI engage in periodic settlements based on the timing and amount of coupon, principal and any other payments actually made by CIT on the ABS. Pursuant to the terms of the total return swap, GSI is obligated to return those same amounts to CIT plus a proportionate amount of the initial deposit. Simultaneously, CIT is obligated to pay GSI (1) principal in an amount equal to the contractual market price times the amount of principal reduction on the ABS and (2) interest equal to LIBOR times the adjusted qualifying borrowing base of the ABS. On a quarterly basis, CIT pays the fixed facility fee of 2.85% per annum times the maximum facility commitment amount, currently $1.5 billion under the CFL Facility and $625 million under the BV Facility, to GSI.
Valuation of the derivatives related to the GSI Facilities is based on several factors using a discounted cash flow (DCF) methodology, including:
| - | | CIT’s funding costs for similar financings based on the current market environment; |
| - | | Forecasted usage of the long-dated GSI Facilities through the final maturity date in 2028; and |
| - | | Forecasted amortization, including prepayment assumptions, due to principal payments on the underlying ABS, which impacts the amount of the unutilized portion. |
Based on the Company’s valuation, we recorded a small liability at December 31, 2012.
Interest expense related to the GSI Facilities is affected by the following:
| - | | A fixed facility fee of 2.85% per annum times the maximum facility commitment amount, currently $1.5 billion under the CFL Facility and $625 million under the BV Facility |
| - | | A variable amount based on one-month or three-month USD LIBOR times the “utilized amount” (effectively the “adjusted qualifying borrowing base”) of the total return swap, and |
| - | | A reduction in interest expense due to the recognition of the payment of any OID from GSI on the various ABS. |
Debt Ratings
Our debt ratings at December 31, 2012 as rated by Standard & Poor’s Ratings Services (“S&P”), Moody’s Investors Service (“Moody’s”) and Dominion Bond Rating Service (“DBRS”) are presented in the following table. Changes since December 31, 2012 include: (1) On January 8, 2013, Moody’s upgraded our issuer / counterparty credit and Series C/senior unsecured debt rating by one notch to Ba3/Stable from B1/Stable and (2) On February 12, 2013 S&P changed our debt ratings outlook to positive from stable.
Debt Ratings as of December 31, 2012
| | | | S&P
| | Moody’s
| | DBRS
|
|---|
Issuer / Counterparty Credit Rating | | | | | BB– | | | | B1 | | | | BB | |
Revolving Credit Facility Rating | | | | | BB– | | | | Ba3 | | | | BBB (Low) | |
Series C Notes / Senior Unsecured Debt Rating | | | | | BB– | | | | B1 | | | | BB | |
| | | | | Stable | | | | Stable | | | | Positive | |
Item 7: Management’s Discussion and Analysis
76 CIT ANNUAL REPORT 2012
Changes since December 31, 2011 include: (1) On February 13, 2012, DBRS increased our debt ratings one notch to an issuer / counterparty credit rating and Series C/senior unsecured debt rating of “BB (Low)” and the Revolving Credit Facility rating was increased to “BB (High)”, (2) On February 16, 2012, Moody’s increased our debt ratings one notch to an issuer / counterparty credit rating and Series C/senior unsecured debt rating of “B1”, (3) On March 9, 2012 S&P increased our debt ratings one notch to an issuer / counterparty credit rating and Series C debt rating to “BB-”, lowered its rating one notch on the Revolving Credit Facility to “BB-” and changed the outlook to stable and (4) On December 17, 2012, DBRS increased our debt ratings one notch to an issuer / counterparty credit rating and Series C/senior unsecured debt rating of “BB” and the Revolving Credit Facility rating was increased to “BBB (Low)”.
Debt ratings can influence the cost and availability of short-and long-term funding, the terms and conditions on which such funding may be available, the collateral requirements, if any, for borrowings and certain derivative instruments, the acceptability of our letters of credit, and the number of investors and counterparties willing to lend to the Company. A decrease, or potential decrease, in credit ratings could impact access to the capital markets and/or increase the cost of debt, and thereby adversely affect the Company’s liquidity and financial condition.
Rating agencies indicate that they base their ratings on many quantitative and qualitative factors, including capital adequacy, liquidity, asset quality, business mix, level and quality of earnings, and the current legislative and regulatory environment, including implied government support. In addition, rating agencies themselves have been subject to scrutiny arising from the financial crisis and could make or be required to make substantial changes to their ratings policies and practices, particularly in response to legislative and regulatory changes, including as a result of provisions in Dodd-Frank. Potential changes in the legislative and regulatory environment and the timing of those changes could impact our ratings, which as noted above, could impact our liquidity and financial condition.
A debt rating is not a recommendation to buy, sell or hold securities, and the ratings are subject to revision or withdrawal at any time by the assigning rating agency. Each rating should be evaluated independently of any other rating.
Tax Implications of Cash in Foreign Subsidiaries
Cash and short term investments held by foreign subsidiaries, including cash available to the BHC and restricted cash, at December 31, 2012, 2011 and 2010 totaled $1.6 billion, $1.6 billion and $2.3 billion, respectively.
With respect to the Company’s investments in foreign subsidiaries, Management has historically asserted the intent to indefinitely reinvest the unremitted earnings of its foreign subsidiaries with very limited exceptions. However, in 2009, Management determined that it would no longer make this assertion because of certain cash flow and funding uncertainties consequent to its recent emergence from bankruptcy and the fact that Management was still in the early stages of developing its long-term strategic and liquidity plans. By 2010, the Company had a new leadership team charged with re-evaluating the Company’s long-term business and strategic plans. Their initial post-bankruptcy plan was to aggressively grow the Company’s international business. Accordingly, in 2010, with very limited exceptions, Management decided to assert indefinite reinvestment of the unremitted earnings of its foreign subsidiaries.
In the quarter ended December 31, 2011, Management decided to no longer assert its intent to indefinitely reinvest its foreign earnings, except for foreign subsidiaries in select jurisdictions. This decision was driven by events during the course of the year that culminated in Management’s conclusion during the quarter that it may need to repatriate foreign earnings to address certain long-term investment and funding strategies. Some of the significant events that impacted Management’s decision included the re-evaluation of the debt and capital structures of its subsidiaries, and the need to reduce its high cost debt in the U.S. In addition, certain restrictions on the Company’s first and second lien debt were removed during the fourth quarter of 2011 upon the repayment of the remaining 2014 Series A debt. The removal of these restrictions allows the Company to transfer and repatriate cash to repay its high cost debt in the U.S. and recapitalize certain foreign subsidiaries. All these events contributed to Management’s decision to no longer assert indefinite reinvestment of its foreign earnings, except for foreign subsidiaries in select jurisdictions. As of December 31, 2012, Management continues to maintain the position with regard to its assertion.
Contractual Payments and Commitments
The following tables summarize significant contractual payments and contractual commitment expirations at December 31, 2012. Certain amounts in the payments table are not the same as the respective balance sheet totals, because this table is before FSA, in order to better reflect projected contractual payments. Likewise, actual cash flows will vary materially from those depicted in the payments table as further explained in the table footnotes.
CIT ANNUAL REPORT 2012 77
Payments for the Twelve Months Ended December 31(1)(dollars in millions)
| | | | Total
| | 2013
| | 2014
| | 2015
| | 2016
| | 2017+
|
|---|
| | | | $ | 10,472.1 | | | $ | 1,424.7 | | | $ | 1,500.4 | | | $ | 1,043.4 | | | $ | 865.8 | | | $ | 5,637.8 | |
Unsecured – Series C Notes | | | | | 5,250.0 | | | | – | | | | 1,300.0 | | | | 1,500.0 | | | | – | | | | 2,450.0 | |
| | | | | 6,500.0 | | | | – | | | | – | | | | – | | | | – | | | | 6,500.0 | |
| | | | | 113.3 | | | | 1.2 | | | | 0.2 | | | | – | | | | – | | | | 111.9 | |
Total Long-term borrowings | | | | | 22,335.4 | | | | 1,425.9 | | | | 2,800.6 | | | | 2,543.4 | | | | 865.8 | | | | 14,699.7 | |
| | | | | 9,681.0 | | | | 4,997.9 | | | | 1,948.4 | | | | 825.7 | | | | 562.4 | | | | 1,346.6 | |
Credit balances of factoring clients | | | | | 1,256.5 | | | | 1,256.5 | | | | – | | | | – | | | | – | | | | – | |
| | | | | 214.1 | | | | 32.2 | | | | 29.7 | | | | 28.0 | | | | 25.6 | | | | 98.6 | |
Total contractual payments | | | | $ | 33,487.0 | | | $ | 7,712.5 | | | $ | 4,778.7 | | | $ | 3,397.1 | | | $ | 1,453.8 | | | $ | 16,144.9 | |
(1) | | Projected payments of debt interest expense and obligations relating to postretirement programs are excluded. |
(2) | | Includes non-recourse secured borrowings, which are generally repaid in conjunction with the pledged receivable maturities. |
Commitment Expiration by Twelve Month Periods Ended December 31 (dollars in millions)
| | | | Total
| | 2013
| | 2014
| | 2015
| | 2016
| | 2017+
|
|---|
| | | | $ | 2,979.7 | | | $ | 287.8 | | | $ | 128.6 | | | $ | 510.1 | | | $ | 1,079.3 | | | $ | 973.9 | |
Aerospace manufacturer purchase commitments(2) | | | | | 9,168.3 | | | | 493.2 | | | | 789.3 | | | | 2,145.9 | | | | 1,231.9 | | | | 4,508.0 | |
Rail and other manufacturer purchase commitments | | | | | 927.4 | | | | 492.2 | | | | 435.2 | | | | – | | | | – | | | | – | |
Commercial loan portfolio purchase commitment | | | | | 1,258.3 | | | | 1,258.3 | | | | – | | | | – | | | | – | | | | – | |
| | | | | 292.1 | | | | 101.2 | | | | 16.0 | | | | 15.7 | | | | 86.8 | | | | 72.4 | |
Deferred purchase credit protection agreements | | | | | 1,841.5 | | | | 1,841.5 | | | | – | | | | – | | | | – | | | | – | |
Guarantees, acceptances and other recourse obligations | | | | | 17.4 | | | | 12.3 | | | | 3.2 | | | | 1.9 | | | | – | | | | – | |
Liabilities for unrecognized tax obligations(3) | | | | | 317.8 | | | | 10.0 | | | | 307.8 | | | | – | | | | – | | | | – | |
Total contractual commitments | | | | $ | 16,802.5 | | | $ | 4,496.5 | | | $ | 1,680.1 | | | $ | 2,673.6 | | | $ | 2,398.0 | | | $ | 5,554.3 | |
(1) | | Financing commitments do not include certain unused, cancelable lines of credit to customers in connection with third-party vendor programs, which can be reduced or cancelled by CIT at any time without notice. |
(2) | | Aerospace commitments are net of amounts on deposit with manufacturers. |
(3) | | The balance cannot be estimated past 2014; therefore the remaining balance is reflected in 2014. |
Financing commitments increased from $2.7 billion at December 31, 2011 to $3.0 billion at December 31, 2012. At December 31, 2012, substantially all financing commitments were senior facilities, with approximately 70% secured by equipment or other assets and the remainder comprised of cash flow or enterprise value facilities. Most of our undrawn and available financing commitments are in Corporate Finance. The top ten undrawn commitments totaled $350 million at December 31, 2012.
The table above includes approximately $0.6 billion of commitments at December 31, 2012 and $0.4 billion at December 31, 2011 that were not available for draw due to requirements for collateral availability or covenant conditions.
Capital Management
CIT manages its capital position to ensure capital is adequate to support the risks of its businesses. CIT uses a complement of capital metrics and related thresholds to measure capital adequacy. The company takes into account the existing regulatory capital framework and the evolution under the proposed Basel III rules. CIT further evaluates capital adequacy through enterprise stress testing and the economic capital (“ECAP”) approach, which constitute our internal capital adequacy assessment process (ICAAP). In addition, enterprise stress testing evaluates capital adequacy dynamically through the use of forward looking forecasts under a set of specific economic scenarios.
Along with stress testing capital forecasts, CIT regularly monitors regulatory capital ratios, ECAP measures and liquidity metrics to support the capital adequacy assessment process. Regulatory capital ratios indicate CIT’s capital adequacy using regulatory definitions of available capital, such as Tier 1 Capital or Total Risk Based Capital, and regulatory measures of portfolio risk such as risk weighted assets. CIT currently reports regulatory capital
Item 7: Management’s Discussion and Analysis
78 CIT ANNUAL REPORT 2012
under the general risk-based capital rules based on the Basel I framework. If the Basel III capital framework is implemented as proposed, CIT expects to report regulatory capital ratios under the Basel III Notice of Proposed Rulemakings (“NPR”) and the Standardized Approach NPR.
ECAP is a probabilistic approach that links capital adequacy to a particular solvency standard consistent with CIT’s risk appetite and expressed as a probability over a one year time horizon. ECAP ratios provide a view of capital adequacy that better takes into account CIT’s specific risks with customized approaches to measure these risks. ECAP evaluates capital adequacy by comparing CIT’s unexpected losses under probabilistically-defined stress events to the Company’s available financial resources, or capital available to absorb losses.
CIT believes a strong liquidity and funding profile is equally important in ensuring the Company’s ability to continue its financial intermediation activities during times of stress. Accordingly, CIT monitors its liquidity position through a complement of metrics which range from cash coverage of funding needs to capital markets indicators. CIT’s regulatory capital ratio minimums are set for the Consolidated Company based on maintaining levels above regulatory minimum levels as well as ensuring the quality of our capital appropriately reflects our asset quality mix, market and balance sheet position. As such, CIT uses a complement of capital metrics and related thresholds to measure and analyze the level and composition of our capital.
As part of the capital adequacy and strategic planning processes, CIT forecasts capital adequacy under several scenarios, including three primary scenarios: Baseline, Supervisory severely adverse scenario (SA-Stress), and CIT BHC stress (C-Stress) scenario. CIT is not currently required to perform these stress tests which are prescribed for institutions above $50 billion; however, it does so as a matter of prudent capital management.
The baseline forecast represents CIT’s expected trajectory of business progression, while the stress scenarios forecast CIT’s capital position under adverse macroeconomic conditions. Scenarios include 9 quarter projections of macroeconomic factors that are used to measure and/or indicate the outlook of specific aspects of the economy. These macroeconomic projections form the basis for CIT’s capital adequacy results presented for each scenario.
Capital Composition and Ratios
The Company is subject to various regulatory capital requirements set by the Federal Reserve Board. CIT committed to its regulators to maintain a 13% Total Capital Ratio at the BHC.
CIT’s capital ratios have been consistently above required, regulatory and its policy minimums. Capital ratio trends and capital levels reflect growth in underlying assets as well as the FSA impact of accelerated refinancing and repayment of high cost debt. In 2012 and 2011, CIT refinanced or accelerated the repayment of $31 billion of high cost debt. While these actions economically benefited the Company, they resulted in the acceleration of FSA debt discount, thus increasing interest expense and contributed to the net loss.
CIT ANNUAL REPORT 2012 79
Tier 1 Capital and Total Capital Components (dollars in millions)
| | | | December 31,
| |
|---|
Tier 1 Capital
| | | | 2012
| | 2011
| | 2010
|
|---|
Total stockholders’ equity | | | | $ | 8,334.8 | | | $ | 8,883.6 | | | $ | 8,929.1 | |
Effect of certain items in accumulated other comprehensive loss excluded from Tier 1 Capital | | | | | 41.1 | | | | 54.3 | | | | (3.3 | ) |
| | | | | 8,375.9 | | | | 8,937.9 | | | | 8,925.8 | |
| | | | | (345.9 | ) | | | (353.2 | ) | | | (361.6 | ) |
Disallowed intangible assets(1) | | | | | (32.7 | ) | | | (63.6 | ) | | | (119.2 | ) |
Investment in certain subsidiaries | | | | | (34.4 | ) | | | (36.6 | ) | | | (33.4 | ) |
Other Tier 1 components(2) | | | | | (68.0 | ) | | | (58.6 | ) | | | (65.7 | ) |
| | | | | 7,894.9 | | | | 8,425.9 | | | | 8,345.9 | |
| | | | | | | | | | | | | | |
Qualifying reserve for credit losses and other reserves(3) | | | | | 402.6 | | | | 429.9 | | | | 428.2 | |
Less: Investment in certain subsidiaries | | | | | (34.4 | ) | | | (36.6 | ) | | | (33.4 | ) |
Other Tier 2 components(4) | | | | | 0.5 | | | | – | | | | 0.2 | |
| | | | $ | 8,263.6 | | | $ | 8,819.2 | | | $ | 8,740.9 | |
| | | | $ | 48,580.1 | | | $ | 44,824.1 | | | $ | 44,000.2 | |
| | | | | | | | | | | | | | |
| | | | | 16.3 | % | | | 18.8 | % | | | 19.0 | % |
| | | | | 17.0 | % | | | 19.7 | % | | | 19.9 | % |
| | | | | 18.3 | % | | | 18.8 | % | | | 16.0 | % |
| | | | | | | | | | | | | | |
| | | | | 21.5 | % | | | 36.5 | % | | | 57.4 | % |
| | | | | 22.7 | % | | | 37.5 | % | | | 57.7 | % |
| | | | | 20.2 | % | | | 24.7 | % | | | 24.2 | % |
(1) | | Goodwill and disallowed intangible assets adjustments also reflect the portion included within assets held for sale. |
(2) | | Includes the portion of net deferred tax assets that does not qualify for inclusion in Tier 1 capital based on the capital guidelines, the Tier 1 capital charge for nonfinancial equity investments and the Tier 1 capital deduction for net unrealized losses on available-for-sale marketable securities (net of tax). |
(3) | | “Other reserves” represents additional credit loss reserves for unfunded lending commitments, letters of credit, and deferred purchase agreements, all of which are recorded in Other Liabilities. |
(4) | | Banking organizations are permitted to include in Tier 2 Capital up to 45% of net unrealized pre-tax gains on available for sale equity securities with readily determinable fair values. |
For a BHC, capital adequacy is based upon risk-weighted asset ratios calculated in accordance with quantitative measures established by the Federal Reserve. Under these guidelines, certain commitments and off-balance sheet transactions are assigned asset equivalent balances, and together with on-balance sheet assets, are divided into risk categories, each of which is assigned a risk weighting ranging from 0% (for example U.S. Treasury Bonds) to 100% (for example commercial loans).
The reconciliation of balance sheet assets to risk-weighted assets is presented below:
Risk-Weighted Assets (dollars in millions)
| | | | December 31,
| |
|---|
| | | | 2012
| | 2011
| | 2010
|
|---|
| | | | $ | 44,012.0 | | | $ | 45,263.4 | | | $ | 51,453.4 | |
Risk weighting adjustments to balance sheet assets(1) | | | | | (9,960.4 | ) | | | (12,352.7 | ) | | | (16,271.8 | ) |
Off balance sheet items(2) | | | | | 14,528.5 | | | | 11,913.4 | | | | 8,818.6 | |
| | | | $ | 48,580.1 | | | $ | 44,824.1 | | | $ | 44,000.2 | |
(1) | | The decline primarily reflects the run-off of our student loan portfolio. |
(2) | | Primarily reflects commitments to purchase aircraft, unused lines of credit, letters of credit and deferred purchase agreements. For 2012, also includes purchase commitment for a portfolio of commercial loans. |
Item 7: Management’s Discussion and Analysis
80 CIT ANNUAL REPORT 2012
Regulatory Capital Guidelines and Changes
Regulatory capital guidelines are based on the Capital Accord of the Basel Committee on Banking Supervision (Basel I). We compute capital ratios in accordance with Federal Reserve capital guidelines for assessing adequacy of capital. To be well capitalized, a BHC generally must maintain Tier 1 and Total Capital Ratios of at least 6% and 10%, respectively. The Federal Reserve Board also has established minimum guidelines. The minimum ratios are: Tier 1 Capital Ratio of 4.0%, Total Capital Ratio of 8.0% and Tier 1 Leverage Ratio of 4.0%. In order to be considered a “well capitalized” depository institution under FDIC guidelines, CIT Bank must maintain a Tier 1 Capital Ratio of at least 6%, a Total Capital Ratio of at least 10%, and a Tier 1 Leverage Ratio of at least 5%.
In 2004, the Basel Committee published a new capital accord (Basel II) to replace Basel I. We do not meet the thresholds to be a “core bank” and are therefore not required to comply with the advanced approaches of Basel II.
On August 12, 2009, CIT entered into a Written Agreement with the Federal Reserve Bank of New York (the “FRBNY”). Among other requirements, the Written Agreement requires regular reporting to the FRBNY and prior written approval by the FRBNY for payment of dividends and distributions and the purchase or redemption of stock. CIT has provided the FRB with its 2013 capital plan, within which it requested permission for a modest return of capital during 2013.
Basel III
In December 2010, the Basel Committee on Banking Supervision released its final framework for strengthening international capital and liquidity regulation (“Basel III”). Basel III requirements include higher minimum capital ratios, increased limitations on qualifying capital, minimum liquidity requirements and a more constrained leverage ratio requirement. Among the NPRs implementing Basel III, CIT expects to be subject to the Basel III and Standardized Approach NPRs. CIT currently meets the regulatory requirements under Basel III. CIT is not subject to, or expected to be subject to, the Advanced Approaches NPR or the Market Risk rules.
If Basel III is fully implemented in the U.S. as currently proposed, CIT will be required to maintain risk-based capital ratios at January 1, 2019 as follows:
| | | | Minimum Capital Requirements – January 1, 2019
| |
|---|
| | | | Tier 1 Common
Equity
| | Tier 1 Capital
| | Total Capital
|
|---|
| | | | | 4.5 | % | | | 6.0 | % | | | 8.0 | % |
Capital conservation buffer | | | | | 2.5 | % | | | 2.5 | % | | | 2.5 | % |
| | | | | 7.0 | % | | | 8.5 | % | | | 10.5 | % |
In addition, Basel III also includes a countercyclical buffer of up to 2.5% that regulators could require in periods of excess credit growth.
Given our current capital ratios, capital composition and liquidity position, the Company anticipates the transition to the Basel III capital framework will have a modest impact on regulatory capital ratios. CIT’s capital stock is substantially all Tier 1 Common equity (95%) and does not include non-qualifying capital instruments subject to transitional deductions such as mortgage servicing rights. Similarly, CIT expects a modest impact to risk-weighted assets when determined under the Standard Approach NPR, which updates the general risk-based capital rules for risk-weighting assets based on Basel I. However, the final impact will not be completely known until the U.S. banking regulators finalize the rulemaking to implement Basel III.
See the “Regulation” section of Item 1 Business Overview for further detail regarding regulatory matters.
CIT Bank is a state-chartered commercial bank headquartered in Salt Lake City, Utah and is our principal bank subsidiary. CIT Bank originates and funds lending and leasing activity in the U.S. for CIT’s commercial business segments. Asset growth during 2012 and 2011 reflected increased commercial lending and leasing volume, and deposits grew in support of the increased business and additional product offerings.
Funded loan volume totaled $6.0 billion, and was up 90% over 2011 and significantly above the $0.7 billion in 2010. The increases reflected significantly higher volume in Corporate Finance, which included commercial real estate lending, Vendor Finance and Transportation Finance as the Bank increased aerospace loans and originated rail operating lease transactions. Committed volumes reflected similar increased trends.
Total assets were $12.2 billion, up from $9.0 billion at December 31, 2011 and $7.1 billion at December 31, 2010. Commercial loans totaled $8.0 billion, up from $3.9 billion at December 31, 2011 and $1.4 billion at December 31, 2010, as commercial asset growth offset the sale and run-off of consumer loans (principally student loans). Operating lease equipment of $650 million, primarily railcars, increased from $31 million at December 31, 2011 and none at December 31, 2010. Cash was $3.4 billion at December 31, 2012, up from $2.5 billion at December 31, 2011 and $1.3 billion at December 31, 2010. Cash will be utilized to fund the announced purchase of a commercial loan portfolio, expected to be substantially completed in the 2013 first quarter. CIT Bank’s capital and leverage ratios are noted below and remain well above required levels.
CIT ANNUAL REPORT 2012 81
CIT Bank deposits were $9.6 billion at December 31, 2012, up from $6.1 billion at December 31, 2011 and $4.5 billion at December 31, 2010. The weighted average interest rate was 1.6% at December 31, 2012, down from 2.5% at December 31, 2011 and 3.2% at December 31, 2010. CD terms averaged approximately three years for those placed during 2012. The primary driver of the higher balances resulted from raising on-line deposits. CIT Bank began offering on-line savings accounts in March 2012 to supplement the current range of CD offerings to consumers.
The following presents condensed financial information for CIT Bank.
CONDENSED BALANCE SHEETS (dollars in millions)
| | | | At December 31,
| |
|---|
| | | | 2012
| | 2011
| | 2010
|
|---|
| | | | | | | | | | | | | | |
Cash and deposits with banks | | | | $ | 3,351.3 | | | $ | 2,462.1 | | | $ | 1,299.1 | |
| | | | | 123.3 | | | | 166.7 | | | | 236.0 | |
| | | | | 32.9 | | | | 1,627.5 | | | | 16.6 | |
| | | | | 8,036.9 | | | | 3,912.0 | | | | 1,448.3 | |
| | | | | – | | | | 565.5 | | | | 3,786.6 | |
Allowance for loan losses | | | | | (133.7 | ) | | | (49.0 | ) | | | (10.7 | ) |
Operating lease equipment, net | | | | | 650.0 | | | | 31.3 | | | | – | |
| | | | | 164.6 | | | | 249.9 | | | | 276.8 | |
| | | | $ | 12,225.3 | | | $ | 8,966.0 | | | $ | 7,052.7 | |
| | | | | | | | | | | | | | |
| | | | $ | 9,615.8 | | | $ | 6,124.9 | | | $ | 4,544.7 | |
| | | | | 49.6 | | | | 576.7 | | | | 641.8 | |
| | | | | 122.7 | | | | 147.8 | | | | 34.0 | |
| | | | | 9,788.1 | | | | 6,849.4 | | | | 5,220.5 | |
| | | | | 2,437.2 | | | | 2,116.6 | | | | 1,832.2 | |
Total Liabilities and Equity | | | | $ | 12,225.3 | | | $ | 8,966.0 | | | $ | 7,052.7 | |
| | | | | | | | | | | | | | |
| | | | | 21.5 | % | | | 36.5 | % | | | 57.4 | % |
| | | | | 22.7 | % | | | 37.5 | % | | | 57.7 | % |
| | | | | 20.2 | % | | | 24.7 | % | | | 24.2 | % |
Financing and Leasing Assets by Segment: | | | | | | | | | | | | | | |
| | | | $ | 5,314.4 | | | $ | 2,750.6 | | | $ | 1,270.6 | |
| | | | | 1,807.8 | | | | 650.5 | | | | 193.2 | |
| | | | | 1,539.5 | | | | 529.1 | | | | – | |
| | | | | 58.1 | | | | 13.1 | | | | – | |
| | | | | – | | | | 2,193.0 | | | | 3,787.7 | |
| | | | $ | 8,719.8 | | | $ | 6,136.3 | | | $ | 5,251.5 | |
Item 7: Management’s Discussion and Analysis
82 CIT ANNUAL REPORT 2012
CONDENSED STATEMENTS OF OPERATIONS (dollars in millions)
| | | | Years Ended December 31,
| |
|---|
| | | | 2012
| | 2011
| | 2010
|
|---|
| | | | $ | 378.7 | | | $ | 272.6 | | | $ | 308.9 | |
| | | | | (195.2 | ) | | | (118.6 | ) | | | (114.9 | ) |
| | | | | 183.5 | | | | 154.0 | | | | 194.0 | |
Provision for credit losses | | | | | (93.3 | ) | | | (42.1 | ) | | | (24.1 | ) |
Net interest revenue, after credit provision | | | | | 90.2 | | | | 111.9 | | | | 169.9 | |
Rental income on operating leases | | | | | 38.7 | | | | 2.9 | | | | – | |
| | | | | 144.7 | | | | 69.6 | | | | 33.6 | |
Total net revenue, net of interest expense and credit provision | | | | | 273.6 | | | | 184.4 | | | | 203.5 | |
| | | | | (173.0 | ) | | | (69.2 | ) | | | (39.0 | ) |
Depreciation on operating lease equipment | | | | | (19.7 | ) | | | (2.5 | ) | | | – | |
Income before provision for income taxes | | | | | 80.9 | | | | 112.7 | | | | 164.5 | |
Provision for income taxes | | | | | (39.6 | ) | | | (45.5 | ) | | | (63.5 | ) |
| | | | $ | 41.3 | | | $ | 67.2 | | | $ | 101.0 | |
New business volume – funded | | | | $ | 6,024.7 | | | $ | 3,160.7 | | | $ | 693.1 | |
New business volume – committed | | | | $ | 7,569.6 | | | $ | 4,428.7 | | | $ | 1,202.8 | |
The Bank’s results include a $40 million pre-tax acceleration of FSA discount that increased interest expense, as discussed further below. The Bank’s fourth quarter provision for credit losses for the year ended December 31, 2012 included an increase of $34 million as a change in estimate. This adjustment had no impact on consolidated results. For 2012, 2011 and 2010, net charge-offs as a percentage of average finance receivables were 0.18%, 0.15% and 0.33%, respectively.
Other income was up in 2012 due to gains on student loans sold. Operating expenses increased mostly due to the transfer of employees in 2012 from the bank holding company into the bank, along with higher deposit costs reflecting growth in online deposits.
Net Finance Revenue (dollars in millions)
| | | | Years Ended December 31,
| |
|---|
| | | | 2012
| | 2011
| | 2010
|
|---|
| | | | $ | 378.7 | | | $ | 272.6 | | | $ | 308.9 | |
Rental income on operating leases | | | | | 38.7 | | | | 2.9 | | | | – | |
| | | | | 417.4 | | | | 275.5 | | | | 308.9 | |
| | | | | (195.2 | ) | | | (118.6 | ) | | | (114.9 | ) |
Depreciation on operating lease equipment | | | | | (19.7 | ) | | | (2.5 | ) | | | – | |
| | | | $ | 202.5 | | | $ | 154.4 | | | $ | 194.0 | |
Average Earning Assets (“AEA”) | | | | $ | 7,181.6 | | | $ | 5,793.2 | | | $ | 5,556.1 | |
| | | | | | | | | | | | | | |
| | | | | 5.81 | % | | | 4.76 | % | | | 5.56 | % |
Interest expense and depreciation | | | | | (2.99 | )% | | | (2.09 | )% | | | (2.07 | )% |
| | | | | 2.82 | % | | | 2.67 | % | | | 3.49 | % |
Net finance revenue is a non-GAAP measure.
As detailed in the above table, net finance revenue (“NFR”) increased primarily on commercial asset growth. Average earning assets increased, as an increase in commercial assets offset the decline in consumer assets (student loans). Partially offsetting the higher AEA was lower net FSA accretion, which decreased NFR by $15 million during 2012, compared to increases of $83 million in 2011 and $171 million in 2010. The decline was driven by the combination of lower interest income accretion and accelerated FSA discount of $40 million on debt extinguishments. During 2012 the Bank grew its operating lease portfolio, which contributed $19 million to NFR. Net operating lease margin was 6.9% of average operating leases in 2012.
NFR as a percentage of average earning assets (“Net Finance Margin” or “NFM”) increased from 2011, as the revenue earned from higher yielding commercial assets offset the decrease in FSA accretion. Excluding FSA accretion, NFM increased from
CIT ANNUAL REPORT 2012 83
both 2011 and 2010, reflecting a shift in weighting as the commercial loans grew and became a more significant proportion of the earning assets, and the lower yielding consumer assets, principally student loans, were sold or ran-off.
Adjusted Net Finance Revenue as a % of AEA (dollars in millions)
| | | | Years Ended December 31,
| |
|---|
| | | | 2012
| | 2011
| | 2010
| |
|---|
| | | | $ | 202.5 | | | | 2.82 | % | | $ | 154.4 | | | | 2.67 | % | | $ | 194.0 | | | | 3.49 | % |
FSA impact on net finance revenue | | | | | 14.8 | | | | 0.20 | % | | | (82.7 | ) | | | (1.46 | )% | | | (171.0 | ) | | | (3.10 | )% |
Adjusted net finance revenue | | | | $ | 217.3 | | | | 3.02 | % | | $ | 71.7 | | | | 1.21 | % | | $ | 23.0 | | | | 0.39 | % |
Net finance revenue is a non-GAAP measure.
The following table presents the Bank’s pre-tax income and adjusted pre-tax income:
Impacts of FSA Accretion on Pre-tax Income (Loss) (dollars in millions)
| | | | Years Ended December 31,
| |
|---|
| | | | 2012
| | 2011
| | 2010
|
|---|
| | | | $ | 80.9 | | | $ | 112.7 | | | $ | 164.5 | |
| | | | | 14.8 | | | | (82.7 | ) | | | (171.0 | ) |
Pre-tax income (loss) – Excluding FSA Net Accretion | | | | $ | 95.7 | | | $ | 30.0 | | | $ | (6.5 | ) |
Pre-tax Income – Excluding FSA Net Accretion is a non-GAAP measure.
CRITICAL ACCOUNTING ESTIMATESThe preparation of financial statements in conformity with GAAP requires management to use judgment in making estimates and assumptions that affect reported amounts of assets and liabilities, reported amounts of income and expense and the disclosure of contingent assets and liabilities. The following estimates, which are based on relevant information available at the end of each period, include inherent risks and uncertainties related to judgments and assumptions made. We consider the estimates to be critical in applying our accounting policies, due to the existence of uncertainty at the time the estimate is made, the likelihood of changes in estimates from period to period and the potential impact on the financial statements.
Management believes that the judgments and estimates utilized in the following critical accounting estimates are reasonable. We do not believe that different assumptions are more likely than those utilized, although actual events may differ from such assumptions. Consequently, our estimates could prove inaccurate, and we may be exposed to charges to earnings that could be material.
Allowance for Loan Losses – The allowance for loan losses on finance receivables reflects estimated amounts for loans originated subsequent to the Emergence Date, additional amounts required on loans that were on the balance sheet at the Emergence Date for subsequent changes in circumstances and amounts related to loans brought on balance sheet from previously unconsolidated entities. As a result of FSA, the allowance for loan losses balance at December 31, 2009 was eliminated and, together with fair value adjustments to loans and lease receivables, effectively re-characterized as either non-accretable or accretable discount. The non-accretable component represents contractually required payments receivable in excess of the amount of cash flows expected to be collected for loans with evidence of credit impairment. The accretable discount, which largely reflects the difference between contractual interest rates and market interest rates on the portfolio at the emergence date, is recognized in accordance with the effective interest method, or on a basis approximating a level rate of return, as a yield adjustment to loans and capital leases over the remaining term of the loan and reflected in interest income.
The allowance for loan losses is intended to provide for losses inherent in the portfolio, which requires the application of estimates and significant judgment as to the ultimate outcome of collection efforts and realization of collateral values, among other things. Therefore, changes in economic conditions or credit metrics, including past due and non-accruing accounts, or other events affecting specific obligors or industries, may necessitate additions or reductions to the reserve for credit losses.
The allowance for loan losses is reviewed for adequacy based on portfolio collateral values and credit quality indicators, including charge-off experience, levels of past due loans and non-performing assets, evaluation of portfolio diversification and concentration as well as economic conditions to determine the need for a qualitative adjustment. We review finance receivables periodically to determine the probability of loss, and record charge-offs after considering such factors as delinquencies, the financial condition of obligors, the value of underlying collateral, as well as third party credit enhancements such as guarantees and recourse to manufacturers. This information is reviewed on a quarterly basis with senior management, including the Chief Executive Officer, Chief Risk Officer, Chief Credit Officer, Chief Financial Officer and Controller, among others, as well as the
Item 7: Management’s Discussion and Analysis
84 CIT ANNUAL REPORT 2012
Audit and Risk Management Committees, in order to set the reserve for credit losses.
The allowance for loan losses on finance receivables originated as of or subsequent to emergence is determined based on three key components: (1) specific allowances for loans that are impaired, based upon the value of underlying collateral or projected cash flows, (2) non-specific allowances for losses inherent in non-impaired loans in the portfolio based upon estimated loss levels, and (3) a qualitative adjustment to the allowance for economic risks, industry and geographic concentrations, and other factors not adequately captured in our methodology. Consistent with the improvement in credit risk control and compliance functions, and the requirement to consider FSA in the determination of the allowance, the non-specific allowance for credit losses following the Company’s emergence from bankruptcy has been based on the Company’s internal probability of default (PD) and loss given default (LGD) ratings using loan-level data, generally with a two-year loss emergence period assumption. As of December 31, 2012, the allowance was comprised of non-specific reserves of $334.1 million and specific reserves of $45.2 million related to commercial impaired loans.
As a result, the allowance is sensitive to the risk ratings assigned to loans and leases in our portfolio. Assuming a one level PD downgrade across the 14 grade internal scale for all non-impaired loans and leases, the allowance would have increased by $247 million to $626 million at December 31, 2012. Assuming a one level LGD downgrade across the 11 grade internal scale for all non-impaired loans and leases, the allowance would have increased by $102 million to $481 million at December 31, 2012. As a percentage of finance receivables for the commercial segments, the allowance would be 3.65% under the PD hypothetical stress scenario and 2.81% under the hypothetical LGD stress scenario, compared to the reported 2.21%.
These sensitivity analyses do not represent management’s expectations of the deterioration in risk ratings, or the increases in allowance and loss rates, but are provided as hypothetical scenarios to assess the sensitivity of the allowance for loan losses to changes in key inputs. We believe the risk ratings utilized in the allowance calculations are appropriate and that the probability of the sensitivity scenarios above occurring within a short period of time is remote. The process of determining the level of the allowance for loan losses requires a high degree of judgment. Others given the same information could reach different reasonable conclusions.
SeeCredit Metrics and Notes 2 and 3 for additional information.
Loan Impairment – Loan impairment is measured based upon the difference between the recorded investment in each loan and either the present value of the expected future cash flows discounted at each loan’s effective interest rate (the loan’s contractual interest rate adjusted for any deferred fees or costs/discount or premium at the date of origination/acquisition) or if a loan is collateral dependent, the collateral’s fair value. When foreclosure or impairment is determined to be probable, the measurement will be based on the fair value of the collateral. The determination of impairment involves management’s judgment and the use of market and third party estimates regarding collateral values. Valuations of impaired loans and corresponding impairment affect the level of the reserve for credit losses.
Fair Value Determination – At December 31, 2012, only selected assets (certain debt and equity securities, trading derivatives and derivative counterparty assets) and liabilities (trading derivatives and derivative counterparty liabilities) were measured at fair value.
Debt and equity securities classified as available for sale (“AFS”) were carried at fair value, as determined either by Level 1 or Level 2 inputs. Debt securities classified as AFS included investments in U.S. Treasury and federal government agency securities and were valued using Level 2 inputs, primarily quoted prices for similar securities. Certain equity securities classified as AFS were valued using Level 1 inputs, primarily quoted prices in active markets, while other equity securities used Level 2 inputs, due to being less frequently traded or having limited quoted market prices. Assets held for sale were recorded at lower of cost or fair value on the balance sheet. Most of the assets were subject to a binding contract, current letter of intent or other third-party valuation, which are Level 3 inputs. The value of impaired loans was estimated using the fair value of collateral (on an orderly liquidation basis) if the loan was collateralized, or the present value of expected cash flows utilizing the current market rate for such loan. The estimated fair values of derivatives were calculated internally using observable market data and represent the net amount receivable or payable to terminate, taking into account current market rates, which represent Level 2 inputs.
The fair value of assets related to net employee projected benefit obligations was determined largely via level 2.
Lease Residual Values – Operating lease equipment is carried at cost less accumulated depreciation and is depreciated to estimated residual value using the straight-line method over the lease term or estimated useful life of the asset. Direct financing leases are recorded at the aggregated future minimum lease payments plus estimated residual values less unearned finance income. We generally bear greater risk in operating lease transactions (versus finance lease transactions) as the duration of an operating lease is shorter relative to the equipment useful life than a finance lease. Management performs periodic reviews of residual values, with other than temporary impairment recognized in the current period as an increase to depreciation expense for operating lease residual impairment, or as an adjustment to yield for value adjustments on finance leases. Data regarding current equipment values, including appraisals, and historical residual realization experience are among the factors considered in evaluating estimated residual values. As of December 31, 2012, our direct financing lease residual balance was $0.7 billion and our total operating lease equipment balance totaled $12.4 billion.
Liabilities for Uncertain Tax Positions – We have open tax years in the U.S. and Canada and other jurisdictions that are currently under examination by the applicable taxing authorities, and certain tax years that may in the future be subject to examination. We evaluate the adequacy of our liabilities and tax reserves in accordance with accounting standards on uncertain tax positions, taking into account open tax return positions, tax assessments received and tax law changes. The process of evaluating liabilities and tax reserves involves the use of estimates and a high degree of management judgment. The final determination of tax audits could affect our tax reserves.
CIT ANNUAL REPORT 2012 85
Realizability of Deferred Tax Assets – Deferred tax assets and liabilities are recognized for future tax consequences of transactions. Our ability to realize deferred tax assets is dependent upon the future profitability of the reporting entities and, in some cases the timing and amount of specific future transactions. Management’s judgment regarding uncertainties and the use of estimates and projections is required in assessing our ability to realize net operating loss carry forwards (“NOL’s”) as most of these assets are subject to limited carry-forward periods some of which begin to expire in 2013. In addition, the domestic NOLs are subject to annual use limitations under the Internal Revenue Code and certain state laws. Management utilizes historical and projected data in evaluating positive and negative evidence regarding recognition of deferred tax assets. SeeNotes 1 and17 for additional information regarding income taxes.
Goodwill Assets – CIT’s goodwill originated as the excess reorganization value over the fair value of tangible and identified intangible assets, net of liabilities, recorded in conjunction with fresh start accounting in 2009, and was allocated to Trade Finance, Transportation Finance and Vendor Finance. The consolidated balance totaled $346 million at December 31, 2012, or less than 1% of total assets. Though the goodwill balance is not significant compared to total assets, management believes the judgmental nature in determining the values of the units when measuring for potential impairment is significant enough to warrant additional discussion. CIT tested for impairment as of September 30, 2012, at which time CIT’s share price was $39.39, trading at a slight premium to the September 30, 2012 tangible book value (“TBV”) per share of $38.47. This is as compared to December 31, 2009, CIT’s emergence date when the Company was valued at a discount of 30% to TBV per share of $39.14. At September 30, 2012, CIT’s share price was trading at 43% above the convenience date share price of $27.61, while the TBV per share of $38.47 was approximately 2% lower than the TBV at December 31, 2009. In addition, the Company’s Price to TBV multiple of 1.024 improved 45% from the 2011 goodwill evaluation.
In accordance with ASC 350, Intangibles – Goodwill and other, goodwill is assessed for impairment at least annually, or more frequently if events occur that would indicate a potential reduction in the fair value of the reporting unit below its carrying value. Impairment exists when the carrying amount of goodwill exceeds its implied fair value. The ASC requires a two-step impairment test to be used to identify potential goodwill impairment and measure the amount of goodwill impairment. Companies can also choose to perform qualitative assessments to conclude on whether it is more likely or not that a company’s carrying amount including goodwill is greater than its fair value, commonly referred to as Step 0 before applying the two-step approach.
For 2012, CIT opted and performed a qualitative assessment for the Trade Finance goodwill. In performing this assessment, management relied on a number of factors, including operating results, business plans, economic projections, anticipated future cash flows and market place data. Based on the factors, management concluded that it was more likely than not that the fair value of the Trade Finance reporting unit was more than its carrying amount, including goodwill, indicating no impairment.
For Vendor Finance and Transportations Finance goodwill assessment, we performed Step 1 analysis utilizing estimated fair value based on peer price to earnings (“PE”) and TBV multiples. The current PE method was based on annualized pre-FSA income after taxes and actual peers multiples as of September 30, 2012. Pre-FSA income after taxes is utilized for valuations as this was considered more appropriate for determining the company’s profitability without the impact of fresh start accounting adjustment from the Company’s emergence from bankruptcy in 2009.
The TBV method is based on the reporting unit’s estimated equity carrying amount and peer ratios using TBV as of September 30, 2012. CIT estimates reporting each unit’s equity carrying amounts by applying the Company’s economic capital ratios to the unit’s risk weighted assets.
In addition, the Company applies a 20% control premium. The control premium is management’s estimate of how much a market participant would be willing to pay over the market fair value for the control of the business. Management concluded, based on performing Step 1 analysis, that the fair values of the Vendor Finance and Transportation Finance reporting units exceed their respective carrying values, including goodwill.
Estimating the fair value of reporting units involves the use of estimates and significant judgments that are based on a number of factors including actual operating results. If current conditions change from those expected, it is reasonably possible that the judgments and estimates described above could change in future periods.
SeeNote 24 — Goodwill and Intangible Assets for more detailed information.
INTERNAL CONTROLS WORKING GROUPThe Internal Controls Working Group (“ICWG”), which reports to the Disclosure Committee, is responsible for monitoring and improving internal controls over financial reporting. The ICWG is chaired by the Controller and is comprised of senior executives in Finance and the Chief Auditor. SeeItem 9A. Controls and Procedures for more information.
NON-GAAP FINANCIAL MEASUREMENTSThe SEC adopted regulations that apply to any public disclosure or release of material information that includes a non-GAAP financial measure. The accompanying Management’s Discussion and Analysis of Financial Condition and Results of Operations and Quantitative and Qualitative Disclosure about Market Risk contain certain non-GAAP financial measures. Due to the nature
Item 7: Management’s Discussion and Analysis
86 CIT ANNUAL REPORT 2012
of our financing and leasing assets, which include a higher proportion of operating lease equipment than most bank holding companies, and the impact of fresh start accounting following our 2009 restructuring, certain financial measures commonly used by other bank holding companies are not as meaningful for our Company. Therefore, management uses certain non-GAAP financial measures to evaluate our performance. We intend our non-GAAP financial measures to provide additional information and insight regarding operating results and financial position of the business and in certain cases to provide financial information that is presented to rating agencies and other users of financial information. These measures are not in accordance with, or a substitute for, GAAP and may be different from or inconsistent with non-GAAP financial measures used by other companies. See footnotes below the tables for additional explanation of non-GAAP measurements.
Total Net Revenues(1) and Net Operating Lease Revenues(2) (dollars in millions)
| | | | Years Ended December 31,
| |
|---|
| | | | 2012
| | 2011
| | 2010
|
|---|
| | | | | | | | | | | | | | |
| | | | $ | 1,569.1 | | | $ | 2,228.7 | | | $ | 3,719.0 | |
Rental income on operating leases | | | | | 1,784.6 | | | | 1,667.5 | | | | 1,648.4 | |
| | | | | 3,353.7 | | | | 3,896.2 | | | | 5,367.4 | |
| | | | | (2,897.4 | ) | | | (2,794.4 | ) | | | (3,079.7 | ) |
Depreciation on operating lease equipment | | | | | (533.2 | ) | | | (575.1 | ) | | | (675.8 | ) |
| | | | | (76.9 | ) | | | 526.7 | | | | 1,611.9 | |
| | | | | 653.1 | | | | 952.8 | | | | 1,004.9 | |
| | | | $ | 576.2 | | | $ | 1,479.5 | | | $ | 2,616.8 | |
Net Operating Lease Revenue(2) | | | | | | | | | | | | | | |
Rental income on operating leases | | | | $ | 1,784.6 | | | $ | 1,667.5 | | | $ | 1,648.4 | |
Depreciation on operating lease equipment | | | | | (533.2 | ) | | | (575.1 | ) | | | (675.8 | ) |
Net operating lease revenue | | | | $ | 1,251.4 | | | $ | 1,092.4 | | | $ | 972.6 | |
Adjusted Net Finance Revenue as a % of Average Earning Assets(3) (dollars in millions)
| | | | Years Ended December 31,
| |
|---|
| | | | 2012
| | 2011
| | 2010
| |
|---|
| | | | $ | (76.9 | ) | | | (0.24 | )% | | $ | 526.7 | | | | 1.53 | % | | $ | 1,611.9 | | | | 3.95 | % |
FSA impact on net finance revenue | | | | | 1,181.8 | | | | 3.33 | % | | | (25.3 | ) | | | (0.23 | )% | | | (1,396.5 | ) | | | (3.50 | )% |
Accelerated OID on debt extinguishments related to the TRS facility | | | | | (52.6 | ) | | | (0.14 | )% | | | – | | | | – | | | | – | | | | – | |
Debt related – prepayment costs | | | | | – | | | | – | | | | 114.2 | | | | 0.30 | % | | | 137.9 | | | | 0.29 | % |
Adjusted net finance revenue | | | | $ | 1,052.3 | | | | 2.95 | % | | $ | 615.6 | | | | 1.60 | % | | $ | 353.3 | | | | 0.74 | % |
Earning Assets(3) (dollars in millions)
| | | | Years Ended December 31,
| |
|---|
| | | | 2012
| | 2011
| | 2010
|
|---|
| | | | $ | 20,847.6 | | | $ | 19,905.9 | | | $ | 24,648.4 | |
Operating lease equipment, net | | | | | 12,411.7 | | | | 12,006.4 | | | | 11,155.0 | |
| | | | | 646.4 | | | | 2,332.3 | | | | 1,226.1 | |
Credit balances of factoring clients | | | | | (1,256.5 | ) | | | (1,225.5 | ) | | | (935.3 | ) |
| | | | $ | 32,649.2 | | | $ | 33,019.1 | | | $ | 36,094.2 | |
Commercial segments earning assets | | | | $ | 28,950.3 | | | $ | 26,673.6 | | | $ | 27,771.6 | |
CIT ANNUAL REPORT 2012 87
Tangible Book Value (dollars in millions)
| | | | Years Ended December 31,
| |
|---|
| | | | 2012
| | 2011
| | 2010
|
|---|
Total common stockholders’ equity | | | | $ | 8,334.8 | | | $ | 8,883.6 | | | $ | 8,929.1 | |
| | | | | (345.9 | ) | | | (345.9 | ) | | | (355.5 | ) |
| | | | | (31.9 | ) | | | (63.6 | ) | | | (119.2 | ) |
| | | | $ | 7,957.0 | | | $ | 8,474.1 | | | $ | 8,454.4 | |
(1) | | Total net revenues are the combination of net finance revenue and other income and is an aggregation of all sources of revenue for the Company. Total net revenues is used by management to monitor business performance. Given our asset composition includes a high level of operating lease equipment (38% of average earning assets), NFM is a more appropriate metric than net interest margin (“NIM”) (a common metric used by other bank holding companies), as NIM does not fully reflect the earnings of our portfolio because it includes the impact of debt costs of all our assets but excludes the net revenue (rental revenue less depreciation) from operating leases. |
(2) | | Total net operating lease revenue is the combination of rental income on operating leases less depreciation on operating lease equipment. Total net operating lease revenues is used by management to monitor portfolio performance. |
(3) | | Earning assets are utilized in certain revenue and earnings ratios. Earning assets are net of credit balances of factoring clients. This net amount represents the amounts we fund. |
FORWARD-LOOKING STATEMENTSCertain statements contained in this document are “forward-looking statements” within the meaning of the U.S. Private Securities Litigation Reform Act of 1995. All statements contained herein that are not clearly historical in nature are forward-looking and the words “anticipate,” “believe,” “could,” “expect,” “estimate,” “forecast,” “intend,” “plan,” “potential,” “project,” “target” and similar expressions are generally intended to identify forward-looking statements. Any forward-looking statements contained herein, in press releases, written statements or other documents filed with the Securities and Exchange Commission or in communications and discussions with investors and analysts in the normal course of business through meetings, webcasts, phone calls and conference calls, concerning our operations, economic performance and financial condition are subject to known and unknown risks, uncertainties and contingencies. Forward-looking statements are included, for example, in the discussions about:
| - | | our liquidity risk and capital management, including our capital plan, leverage, capital ratios, and credit ratings, our liquidity plan, and our plans and the potential transactions designed to enhance our liquidity and capital, and for a potential return of capital, |
| - | | our plans to change our funding mix and to access new sources of funding to broaden our use of deposit taking capabilities, |
| - | | our credit risk management and credit quality, |
| - | | our asset/liability risk management, |
| - | | accretion and amortization of FSA adjustments, |
| - | | our funding, borrowing costs and net finance revenue, |
| - | | our operational risks, including success of systems enhancements and expansion of risk management and control functions, |
| - | | our mix of portfolio asset classes, including growth initiatives, acquisitions and divestitures, new products, new business and customer retention, |
| - | | our commitments to extend credit or purchase equipment, and |
| - | | how we may be affected by legal proceedings. |
All forward-looking statements involve risks and uncertainties, many of which are beyond our control, which may cause actual results, performance or achievements to differ materially from anticipated results, performance or achievements. Also, forward-looking statements are based upon management’s estimates of fair values and of future costs, using currently available information.
Therefore, actual results may differ materially from those expressed or implied in those statements. Factors, in addition to those disclosed in “Risk Factors”, that could cause such differences include, but are not limited to:
| - | | capital markets liquidity, |
| - | | risks of and/or actual economic slowdown, downturn or recession, |
| - | | industry cycles and trends, |
| - | | uncertainties associated with risk management, including credit, prepayment, asset/liability, interest rate and currency risks, |
| - | | estimates and assumptions used to fair value the balance sheet in accordance with FSA and actual variation between the estimated fair values and the realized values, |
| - | | adequacy of reserves for credit losses, |
| - | | risks inherent in changes in market interest rates and quality spreads, |
| - | | funding opportunities, deposit taking capabilities and borrowing costs, |
| - | | risks that the Company will be unable to comply with the terms of the Written Agreement with the Federal Reserve Bank of New York, |
| - | | conditions and/or changes in funding markets and our access to such markets, including commercial paper, secured and unsecured term debt and the asset-backed securitization markets, |
| - | | risks of implementing new processes, procedures, and systems, |
| - | | risks associated with the value and recoverability of leased equipment and lease residual values, |
| - | | application of fair value accounting in volatile markets, |
Item 7: Management’s Discussion and Analysis
88 CIT ANNUAL REPORT 2012
| - | | application of goodwill accounting in a recessionary economy, |
| - | | changes in laws or regulations governing our business and operations, |
| - | | changes in competitive factors, |
| - | | customer retention rates, |
| - | | future acquisitions and dispositions of businesses or asset portfolios, and |
| - | | regulatory changes and/or developments. |
Any or all of our forward-looking statements here or in other publications may turn out to be wrong, and there are no guarantees about our performance. We do not assume the obligation to update any forward-looking statement for any reason.
CIT ANNUAL REPORT 2012 89
Item 8. Financial Statements and Supplementary Data
REPORT OF INDEPENDENT REGISTERED PUBLIC ACCOUNTING FIRMTo the Board of Directors and Stockholders of CIT Group Inc.:
In our opinion, the accompanying consolidated balance sheets as of December 31, 2012 and 2011 and the related consolidated statements of operations, of comprehensive income (loss), of stockholders’ equity and of cash flows for the years then ended present fairly, in all material respects, the financial position of CIT Group Inc. and its subsidiaries (“the Company”) at December 31, 2012 and 2011, and the results of their operations and their cash flows for the three years ended December 31, 2012 in conformity with accounting principles generally accepted in the United States of America. Also in our opinion, the Company maintained, in all material respects, effective internal control over financial reporting as of December 31, 2012, based on criteria established inInternal Control – Integrated Framework issued by the Committee of Sponsoring Organizations of the Treadway Commission (COSO). The Company’s management is responsible for these financial statements, for maintaining effective internal control over financial reporting and for its assessment of the effectiveness of internal control over financial reporting included in Management’s Report on Internal Control over Financial Reporting appearing under Item 9A. Our responsibility is to express opinions on these financial statements and on the Company’s internal control over financial reporting based on our integrated audits. We conducted our audits in accordance with the standards of the Public Company Accounting Oversight Board (United States). Those standards require that we plan and perform the audits to obtain reasonable assurance about whether the financial statements are free of material misstatement and whether effective internal control over financial reporting was maintained in all material respects. Our audits of the financial statements included examining, on a test basis, evidence supporting the amounts and disclosures in the financial statements, assessing the accounting principles used and significant estimates made by management, and evaluating the overall financial statement presentation. Our audit of internal control over financial reporting included obtaining an understanding of internal control over financial reporting, assessing the risk that a material weakness exists, and testing and evaluating the design and operating effectiveness of internal control based on the assessed risk. Our audits also included performing such other procedures as we considered necessary in the circumstances. We believe that our audits provide a reasonable basis for our opinions.
As discussed in Note 1 to the consolidated financial statements, the Company adopted new guidance in 2010 relating to transfers of financial assets and consolidation of variable interest entities.
A company’s internal control over financial reporting is a process designed to provide reasonable assurance regarding the reliability of financial reporting and the preparation of financial statements for external purposes in accordance with generally accepted accounting principles. A company’s internal control over financial reporting includes those policies and procedures that (i) pertain to the maintenance of records that, in reasonable detail, accurately and fairly reflect the transactions and dispositions of the assets of the company; (ii) provide reasonable assurance that transactions are recorded as necessary to permit preparation of financial statements in accordance with generally accepted accounting principles, and that receipts and expenditures of the company are being made only in accordance with authorizations of management and directors of the company; and (iii) provide reasonable assurance regarding prevention or timely detection of unauthorized acquisition, use, or disposition of the company’s assets that could have a material effect on the financial statements.
Because of its inherent limitations, internal control over financial reporting may not prevent or detect misstatements. Also, projections of any evaluation of effectiveness to future periods are subject to the risk that controls may become inadequate because of changes in conditions, or that the degree of compliance with the policies or procedures may deteriorate.
/s/ PricewaterhouseCoopers
New York, New York
March 1, 2013
Item 8: Financial Statements and Supplementary Data
90 CIT ANNUAL REPORT 2012
CIT GROUP INC. AND SUBSIDIARIESCONSOLIDATED BALANCE SHEETS (dollars in millions – except per share data)
| | | | December 31,
2012
| | December 31,
2011
|
|---|
| | | | | | | | | Revised | |
| | | | $ | 447.3 | | | $ | 433.2 | |
Interest bearing deposits, including restricted balances of $1,185.1 and $869.9 at December 31, 2012 and December 31, 2011(1) | | | | | 6,374.0 | | | | 7,003.6 | |
| | | | | 1,065.5 | | | | 1,257.8 | |
Trading assets at fair value – derivatives | | | | | 8.4 | | | | 42.8 | |
| | | | | 646.4 | | | | 2,332.3 | |
Loans (seeNote 8 for amounts pledged) | | | | | 20,847.6 | | | | 19,905.9 | |
Allowance for loan losses | | | | | (379.3 | ) | | | (407.8 | ) |
Total loans, net of allowance for loan losses(1) | | | | | 20,468.3 | | | | 19,498.1 | |
Operating lease equipment, net (seeNote 8 for amounts pledged)(1) | | | | | 12,411.7 | | | | 12,006.4 | |
Unsecured counterparty receivable | | | | | 649.1 | | | | 729.5 | |
| | | | | 345.9 | | | | 345.9 | |
| | | | | 31.9 | | | | 63.6 | |
| | | | | 1,563.5 | | | | 1,550.2 | |
| | | | $ | 44,012.0 | | | $ | 45,263.4 | |
| | | | | | | | | | |
| | | | $ | 9,684.5 | | | $ | 6,193.7 | |
Trading liabilities at fair value – derivatives | | | | | 81.9 | | | | 66.2 | |
Credit balances of factoring clients | | | | | 1,256.5 | | | | 1,225.5 | |
| | | | | 2,687.8 | | | | 2,584.2 | |
Long-term borrowings, including $1,425.9 and $3,203.8 contractually due within twelve months at December 31, 2012 and December 31, 2011, respectively | | | | | 21,961.8 | | | | 26,307.7 | |
| | | | | 35,672.5 | | | | 36,377.3 | |
| | | | | | | | | | |
Common stock: $0.01 par value, 600,000,000 authorized
Issued: 201,283,063 and 200,980,752 at December 31, 2012 and December 31, 2011
Outstanding: 200,868,802 and 200,660,314 at December 31, 2012 and December 31, 2011 | | | | | 2.0 | | | | 2.0 | |
| | | | | 8,501.8 | | | | 8,459.3 | |
(Accumulated deficit) / Retained earnings | | | | | (74.6 | ) | | | 517.7 | |
Accumulated other comprehensive loss | | | | | (77.7 | ) | | | (82.6 | ) |
Treasury stock: 414,261 and 320,438 shares at December 31, 2012 and December 31, 2011 at cost | | | | | (16.7 | ) | | | (12.8 | ) |
Total Common Stockholders’ Equity | | | | | 8,334.8 | | | | 8,883.6 | |
Noncontrolling minority interests | | | | | 4.7 | | | | 2.5 | |
| | | | | 8,339.5 | | | | 8,886.1 | |
Total Liabilities and Equity | | | | $ | 44,012.0 | | | $ | 45,263.4 | |
(1) | | The following table presents information on assets and liabilities related to Variable Interest Entities (VIEs) that are consolidated by the Company. The difference between VIE total assets and total liabilities represents the Company’s interest in those entities, which were eliminated in consolidation. The assets of the consolidated VIEs will be used to settle the liabilities of those entities and, except for the Company’s interest in the VIEs, are not available to the creditors of CIT or any affiliates of CIT. In the following table, certain prior period balances have been conformed to the current period presentation. |
| |
| | | | | | | | | | |
Interest bearing deposits, restricted | | | | $ | 751.5 | | | $ | 574.2 | |
| | | | | 8.7 | | | | 317.2 | |
Total loans, net of allowance for loan losses | | | | | 7,135.5 | | | | 8,523.7 | |
Operating lease equipment, net | | | | | 4,508.8 | | | | 4,285.4 | |
| | | | $ | 12,404.5 | | | $ | 13,700.5 | |
| | | | | | | | | | |
Beneficial interests issued by consolidated VIEs (classified as long-term borrowings) | | | | $ | 9,241.3 | | | $ | 9,875.5 | |
| | | | $ | 9,241.3 | | | $ | 9,875.5 | |
The accompanying notes are an integral part of these consolidated financial statements.
CIT ANNUAL REPORT 2012 91
CIT GROUP INC. AND SUBSIDIARIESCONSOLIDATED STATEMENTS OF OPERATIONS (dollars in millions – except per share data)
| | | | Years Ended December 31,
| |
|---|
| | | | 2012
| | 2011
| | 2010
|
|---|
| | | | | | Revised | | Revised |
|---|
| | | | | | | | | | | | | | |
Interest and fees on loans | | | | $ | 1,536.8 | | | $ | 2,193.9 | | | $ | 3,687.3 | |
Interest and dividends on interest bearing deposits and investments | | | | | 32.3 | | | | 34.8 | | | | 31.7 | |
| | | | | 1,569.1 | | | | 2,228.7 | | | | 3,719.0 | |
| | | | | | | | | | | | | | |
Interest on long-term borrowings | | | | | (2,744.9 | ) | | | (2,683.2 | ) | | | (2,992.3 | ) |
| | | | | (152.5 | ) | | | (111.2 | ) | | | (87.4 | ) |
| | | | | (2,897.4 | ) | | | (2,794.4 | ) | | | (3,079.7 | ) |
| | | | | (1,328.3 | ) | | | (565.7 | ) | | | 639.3 | |
Provision for credit losses | | | | | (51.6 | ) | | | (269.7 | ) | | | (820.3 | ) |
Net interest revenue, after credit provision | | | | | (1,379.9 | ) | | | (835.4 | ) | | | (181.0 | ) |
| | | | | | | | | | | | | | |
Rental income on operating leases | | | | | 1,784.6 | | | | 1,667.5 | | | | 1,648.4 | |
| | | | | 653.1 | | | | 952.8 | | | | 1,004.9 | |
Total non-interest income | | | | | 2,437.7 | | | | 2,620.3 | | | | 2,653.3 | |
Total revenue, net of interest expense and credit provision | | | | | 1,057.8 | | | | 1,784.9 | | | | 2,472.3 | |
| | | | | | | | | | | | | | |
Depreciation on operating lease equipment | | | | | (533.2 | ) | | | (575.1 | ) | | | (675.8 | ) |
| | | | | (918.2 | ) | | | (896.6 | ) | | | (1,025.1 | ) |
Loss on debt extinguishments | | | | | (61.2 | ) | | | (134.8 | ) | | | – | |
| | | | | (1,512.6 | ) | | | (1,606.5 | ) | | | (1,700.9 | ) |
Income (loss) before provision for income taxes | | | | | (454.8 | ) | | | 178.4 | | | | 771.4 | |
Provision for income taxes | | | | | (133.8 | ) | | | (158.6 | ) | | | (245.7 | ) |
Income (loss) before noncontrolling interests | | | | | (588.6 | ) | | | 19.8 | | | | 525.7 | |
Net income attributable to noncontrolling interests, after tax | | | | | (3.7 | ) | | | (5.0 | ) | | | (4.4 | ) |
| | | | $ | (592.3 | ) | | $ | 14.8 | | | $ | 521.3 | |
Basic income (loss) per common share | | | | $ | (2.95 | ) | | $ | 0.07 | | | $ | 2.60 | |
Diluted income (loss) per common share | | | | $ | (2.95 | ) | | $ | 0.07 | | | $ | 2.60 | |
Average number of common shares – basic (thousands) | | | | | 200,887 | | | | 200,678 | | | | 200,201 | |
Average number of common shares – diluted (thousands) | | | | | 200,887 | | | | 200,815 | | | | 200,575 | |
The accompanying notes are an integral part of these consolidated financial statements.
Item 8: Financial Statements and Supplementary Data
92 CIT ANNUAL REPORT 2012
CIT GROUP INC. AND SUBSIDIARIESCONSOLIDATED STATEMENTS OF COMPREHENSIVE INCOME (LOSS)(dollars in millions)
| | | | Years Ended December 31,
| |
|---|
| | | | 2012
| | 2011
| | 2010
|
|---|
| | | | | | Revised | | Revised |
|---|
Income (loss) before noncontrolling interests | | | | $ | (588.6 | ) | | $ | 19.8 | | | $ | 525.7 | |
Other comprehensive income (loss), net of tax: | | | | | | | | | | | | | | |
Foreign currency translation adjustments | | | | | (8.4 | ) | | | (23.9 | ) | | | (4.4 | ) |
Changes in fair values of derivatives qualifying as cash flow hedges | | | | | 0.6 | | | | 0.9 | | | | (1.7 | ) |
Net unrealized gains (losses) on available for sale securities | | | | | 1.0 | | | | (0.9 | ) | | | 2.2 | |
Changes in benefit plans net gain (loss) and prior service (cost)/credit | | | | | 11.7 | | | | (57.6 | ) | | | 2.8 | |
Other comprehensive income (loss), net of tax | | | | | 4.9 | | | | (81.5 | ) | | | (1.1 | ) |
Comprehensive income (loss) before noncontrolling interests | | | | | (583.7 | ) | | | (61.7 | ) | | | 524.6 | |
Comprehensive loss attributable to noncontrolling interests | | | | | (3.7 | ) | | | (5.0 | ) | | | (4.4 | ) |
Comprehensive income (loss) | | | | $ | (587.4 | ) | | $ | (66.7 | ) | | $ | 520.2 | |
The accompanying notes are an integral part of these consolidated financial statements.
CIT ANNUAL REPORT 2012 93
CIT GROUP INC. AND SUBSIDIARIESCONSOLIDATED STATEMENTS OF STOCKHOLDERS’ EQUITY (dollars in millions)
| | | | Common
Stock
| | Paid-in
Capital
| | (Accumulated
Deficit)
Retained
Earnings
| | Accumulated
Other
Comprehensive
Loss
| | Treasury
Stock
| | Noncontrolling
Minority
Interests
| | Total
Equity
|
|---|
| | | | $ | 2.0 | | | $ | 8,398.0 | | | $ | – | | | $ | – | | | $ | – | | | $ | 1.4 | | | $ | 8,401.4 | |
Adoption of new accounting pronouncement | | | | | | | | | | | | | (18.4 | ) | | | | | | | | | | | (8.4 | ) | | | (26.8 | ) |
| | | | | | | | | | | | | 521.3 | | | | | | | | | | | | 4.4 | | | | 525.7 | |
Other comprehensive loss, net of tax | | | | | | | | | | | | | | | | | (1.1 | ) | | | | | | | | | | | (1.1 | ) |
Amortization of restricted stock and stock option expenses | | | | | | | | | 36.1 | | | | | | | | | | | | (8.8 | ) | | | | | | | 27.3 | |
Distribution of earnings and capital | | | | | | | | | | | | | | | | | | | | | | | | | 0.3 | | | | 0.3 | |
December 31, 2010 – Revised | | | | $ | 2.0 | | | $ | 8,434.1 | | | $ | 502.9 | | | $ | (1.1 | ) | | $ | (8.8 | ) | | $ | (2.3 | ) | | $ | 8,926.8 | |
| | | | | | | | | | | | | 14.8 | | | | | | | | | | | | 5.0 | | | | 19.8 | |
Other comprehensive loss, net of tax | | | | | | | | | | | | | | | | | (81.5 | ) | | | | | | | | | | | (81.5 | ) |
Amortization of restricted stock and stock option expenses | | | | | | | | | 24.6 | | | | | | | | | | | | (4.0 | ) | | | | | | | 20.6 | |
Employee stock purchase plan | | | | | | | | | 0.6 | | | | | | | | | | | | | | | | | | | | 0.6 | |
Distribution of earnings and capital | | | | | | | | | | | | | | | | | | | | | | | | | (0.2 | ) | | | (0.2 | ) |
December 31, 2011 – Revised | | | | $ | 2.0 | | | $ | 8,459.3 | | | $ | 517.7 | | | $ | (82.6 | ) | | $ | (12.8 | ) | | $ | 2.5 | | | $ | 8,886.1 | |
| | | | | | | | | | | | | (592.3 | ) | | | | | | | | | | | 3.7 | | | | (588.6 | ) |
Other comprehensive income, net of tax | | | | | | | | | | | | | | | | | 4.9 | | | | | | | | | | | | 4.9 | |
Amortization of restricted stock, stock option, and performance shares expenses | | | | | | | | | 41.6 | | | | | | | | | | | | (3.9 | ) | | | | | | | 37.7 | |
Employee stock purchase plan | | | | | | | | | 1.1 | | | | | | | | | | | | | | | | | | | | 1.1 | |
Distribution of earnings and capital | | | | | | | | | (0.2 | ) | | | | | | | | | | | | | | | (1.5 | ) | | | (1.7 | ) |
| | | | $ | 2.0 | | | $ | 8,501.8 | | | $ | (74.6 | ) | | $ | (77.7 | ) | | $ | (16.7 | ) | | $ | 4.7 | | | $ | 8,339.5 | |
The accompanying notes are an integral part of these consolidated financial statements.
Item 8: Financial Statements and Supplementary Data
94 CIT ANNUAL REPORT 2012
CIT GROUP INC. AND SUBSIDIARIESCONSOLIDATED STATEMENTS OF CASH FLOWS (dollars in millions)
| | | | Years Ended December 31
| |
|---|
| | | | 2012
| | 2011
| | 2010
|
|---|
| | | | | | Revised | | Revised |
|---|
Cash Flows From Operations | | | | | | | | | | | | | | |
| | | | $ | (592.3 | ) | | $ | 14.8 | | | $ | 521.3 | |
Adjustments to reconcile net income (loss) to net cash flows from operations: | | | | | | | | | | | | | | |
Provision for credit losses | | | | | 51.6 | | | | 269.7 | | | | 820.3 | |
Net depreciation, amortization and (accretion) | | | | | 1,985.9 | | | | 751.8 | | | | (504.2 | ) |
Net gains on equipment, receivable and investment sales | | | | | (342.8 | ) | | | (502.5 | ) | | | (438.9 | ) |
Loss on debt extinguishments | | | | | 21.1 | | | | 109.8 | | | | – | |
Provision for deferred income taxes | | | | | 32.7 | | | | 57.0 | | | | 108.2 | |
(Increase) decrease in finance receivables held for sale | | | | | (54.9 | ) | | | 46.9 | | | | 31.2 | |
(Increase) decrease in other assets | | | | | (106.2 | ) | | | 503.3 | | | | (404.3 | ) |
(Decrease) increase in accrued liabilities and payables | | | | | (86.6 | ) | | | (394.8 | ) | | | 454.0 | |
Net cash flows provided by operations | | | | | 908.5 | | | | 856.0 | | | | 587.6 | |
Cash Flows From Investing Activities | | | | | | | | | | | | | | |
Loans originated and purchased | | | | | (18,983.6 | ) | | | (20,576.2 | ) | | | (18,898.5 | ) |
Principal collections of loans | | | | | 16,673.7 | | | | 21,670.7 | | | | 25,673.4 | |
Purchases of investment securities | | | | | (16,322.0 | ) | | | (14,971.8 | ) | | | (148.4 | ) |
Proceeds from maturities of investment securities | | | | | 16,580.0 | | | | 14,085.9 | | | | 191.7 | |
Proceeds from asset and receivable sales | | | | | 4,499.3 | | | | 4,315.7 | | | | 5,262.6 | |
Purchases of assets to be leased and other equipment | | | | | (1,776.6 | ) | | | (2,136.9 | ) | | | (1,286.9 | ) |
Net increase in short-term factoring receivables | | | | | 134.1 | | | | 196.8 | | | | 527.1 | |
Change in restricted cash | | | | | (314.0 | ) | | | 1,683.9 | | | | (1,134.3 | ) |
Net cash flows provided by investing activities | | | | | 490.9 | | | | 4,268.1 | | | | 10,186.7 | |
Cash Flows From Financing Activities | | | | | | | | | | | | | | |
Proceeds from the issuance of term debt | | | | | 13,523.9 | | | | 6,680.5 | | | | 3,000.6 | |
| | | | | (19,542.2 | ) | | | (15,626.3 | ) | | | (13,007.0 | ) |
| | | | | 3,499.8 | | | | 1,680.9 | | | | (597.1 | ) |
Collection of security deposits and maintenance funds | | | | | 563.4 | | | | 554.6 | | | | 660.9 | |
Use of security deposits and maintenance funds | | | | | (373.8 | ) | | | (498.5 | ) | | | (586.8 | ) |
Net cash flows used in financing activities | | | | | (2,328.9 | ) | | | (7,208.8 | ) | | | (10,529.4 | ) |
(Decrease) increase in cash and cash equivalents | | | | | (929.5 | ) | | | (2,084.7 | ) | | | 244.9 | |
Unrestricted cash and cash equivalents, beginning of period | | | | | 6,565.7 | | | | 8,650.4 | | | | 8,405.5 | |
Unrestricted cash and cash equivalents, end of period | | | | $ | 5,636.2 | | | $ | 6,565.7 | | | $ | 8,650.4 | |
Supplementary Cash Flow Disclosure | | | | | | | | | | | | | | |
| | | | $ | 1,240.0 | | | $ | 1,939.8 | | | $ | 2,688.8 | |
Federal, foreign, state and local income taxes collected, net | | | | $ | 18.4 | | | $ | 94.5 | | | $ | 25.6 | |
Supplementary Non Cash Flow Disclosure | | | | | | | | | | | | | | |
Transfer of assets from held for investment to held for sale | | | | $ | 1,421.2 | | | $ | 3,959.4 | | | $ | 2,846.0 | |
Transfer of assets from held for sale to held for investment | | | | $ | 11.0 | | | $ | 229.8 | | | $ | 64.8 | |
The accompanying notes are an integral part of these consolidated financial statements.
CIT ANNUAL REPORT 2012 95
CIT GROUP AND SUBSIDIARIES — NOTES TO CONSOLIDATED FINANCIAL STATEMENTS
NOTE 1 — BUSINESS AND SUMMARY OF SIGNIFICANT ACCOUNTING POLICIES
CIT Group Inc., together with its subsidiaries (collectively “CIT” or the “Company” has provided financial solutions to its clients since its formation in 1908. The Company provides financing and leasing capital principally for small businesses and middle market companies in a wide variety of industries and offers vendor, equipment, commercial and structured financing products, as well as factoring and management advisory services. CIT became a bank holding company (“BHC”) in December 2008, and is regulated by the Board of Governors of the Federal Reserve System (“FRS”) and the Federal Reserve Bank of New York (“FRBNY”) under the U.S. Bank Holding Company Act of 1956 (“BHC Act”). CIT Bank, a wholly-owned subsidiary, is a state-chartered bank located in Salt lake City, Utah. The Company operates primarily in North America, with locations in Europe, South America and Asia.
BASIS OF PRESENTATION
Basis of Financial Information
The accounting and financial reporting policies of CIT Group Inc. conform to generally accepted accounting principles (“GAAP”) in the United States and the preparation of the consolidated financial statements is in conformity with GAAP which requires management to make estimates and assumptions that affect reported amounts and disclosures. Actual results could differ from those estimates and assumptions. Some of the more significant estimates include: valuation of deferred tax assets; lease residual values and depreciation of operating lease equipment; and allowance for loan losses. Additionally where applicable, the policies conform to accounting and reporting guidelines prescribed by bank regulatory authorities.
Principles of Consolidation
The accompanying consolidated financial statements include financial information related to CIT Group Inc., a Delaware Corporation, and its majority owned subsidiaries, including CIT Bank (collectively, “CIT” or the “Company”), and those variable interest entities (“VIEs”) where the Company is the primary beneficiary.
On January 1, 2010, the Company implemented new consolidation accounting guidance related to variable interest entities (“VIEs”). The new guidance eliminated the concept of qualified special purpose entities (“QSPEs”) that were previously exempt from consolidation, and introduced a new framework for determining the primary beneficiary of a VIE. The primary beneficiary of a VIE is required to consolidate the assets and liabilities of the VIE. Under the new guidance, the primary beneficiary is the party that has both (1) the power to direct the activities of an entity that most significantly impact the VIE’s economic performance; and (2) through its interests in the VIE, the obligation to absorb losses or the right to receive benefits from the VIE that could potentially be significant to the VIE. As a result of applying the new consolidation accounting guidance, the Company consolidated a number of VIEs that were used primarily to securitize assets. Consolidation of these entities eliminated the retained interest and increased Cash $(134 million), Loans $(1.3 billion), Allowance for loan losses $(69 million), Long-term borrowings $(1.2 billion), and Other liabilities $(17 million) as of January 1, 2010. Equity decreased by approximately $18 million as of January 1, 2010.
The consolidated financial statements include the effects of adopting Fresh Start Accounting (“FSA”) upon the Company’s emergence from bankruptcy on December 10, 2009, based on a convenience date of December 31, 2009 (the “Convenience Date”) , as required by U.S. GAAP. Accretion and amortization of certain FSA adjustments are included in the Statements of Operations and Cash Flows.
In preparing the consolidated financial statements, all significant inter-company accounts and transactions have been eliminated. Assets held in an agency or fiduciary capacity are not included in the consolidated financial statements.
SIGNIFICANT ACCOUNTING POLICIES
Financing and Leasing Assets
CIT extends credit to customers through a variety of financing arrangements; including term loans, and revolving credit facilities, capital leases and operating leases. The amounts outstanding on loans, direct financing and leveraged leases are referred to as finance receivables and are included in Loans on the consolidated balance sheet. These finance receivables, when combined with finance receivables held for sale and the net book value of operating lease equipment, are referred to as financing and leasing assets.
It is CIT’s expectation that the majority of the loans and leases originated will be held for the foreseeable future or until maturity. In certain situations, for example to manage concentrations and/or credit risk, some or all of certain exposures are sold. Loans for which the Company has the intent and ability to hold for the foreseeable future or until maturity are classified as held for investment (“HFI”). If the Company no longer has the intent or ability to hold loans for the foreseeable future, then the loans are transferred to held for sale (“HFS”). Loans entered into with the intent to resell are classified as HFS.
For finance receivables outstanding at the time of FSA, December 31, 2009, the fair value assigned at that time established their new cost basis. The resultant discount on the finance receivables balance includes accretable and non-accretable components. Loans originated subsequent to FSA and classified as HFI are recorded at amortized cost. Loan origination fees and certain direct origination costs are deferred and recognized as adjustments to interest income over the lives of the related loans. Unearned income on leases and discounts and premiums on loans purchased are amortized to interest income using a level yield methodology. Direct financing leases originated subsequent to FSA and classified as HFI are recorded at the aggregate future minimum lease payments plus estimated residual values less unearned finance income. In leveraged lease agreements, a major portion of the funding is provided by third party lenders on a non-recourse basis, with CIT providing the balance and acquiring title to the property. Leveraged leases are recorded at the aggregate value of future minimum lease payments plus estimated residual value, less third-party debt and unearned income. Management performs periodic reviews of estimated residual values, with other than temporary impairment recognized in current period earnings.
Item 8: Financial Statements and Supplementary Data
96 CIT ANNUAL REPORT 2012
CIT GROUP AND SUBSIDIARIES — NOTES TO CONSOLIDATED FINANCIAL STATEMENTS
Operating lease equipment purchased prior to emergence was recorded at estimated fair value at emergence and is carried at that new basis less accumulated depreciation. Operating lease equipment purchased after December 31, 2009 is carried at cost less accumulated depreciation. Operating lease equipment is depreciated to its estimated residual value using the straight-line method over the lease term or estimated useful life of the asset.
In the operating lease portfolio, maintenance costs incurred that exceed maintenance funds collected for commercial aircraft are expensed if they do not provide a future economic benefit and do not extend the useful life of the aircraft. Such costs may include costs of routine aircraft operation and costs of maintenance and spare parts incurred in connection with re-leasing an aircraft and during the transition between leases. For such maintenance costs that are not capitalized, a charge is recorded in operating expense at the time the costs are incurred. Income recognition related to maintenance funds collected and not used during the life of the lease is deferred to the extent management estimates costs will be incurred by subsequent lessees performing scheduled maintenance. Upon the disposition of an aircraft, any excess maintenance funds that exist are recognized as income.
If it is determined that a loan should be transferred from HFI to HFS, then the balance is transferred at the lower of cost or fair value. At the time of transfer, a write-down of the loan is recorded as a charge-off when the carrying amount exceeds fair value and the difference relates to credit quality, otherwise the write-down is recorded as a reduction in Other Income, and any loan loss reserve is reversed. Once classified as HFS, the amount by which the carrying value exceeds fair value is recorded as a valuation allowance and is reflected as a reduction to other income.
If it is determined that a loan should be transferred from HFS to HFI, the loan is transferred at the lower of cost or fair value on the transfer date, which coincides with the date of change in management’s intent. The difference between the carrying value of the loan and the fair value, if lower, is reflected as a loan discount at the transfer date, which reduces its carrying value. Subsequent to the transfer, the discount is accreted into earnings as an increase to interest income over the life of the loan using the interest method.
Revenue Recognition
Interest income on loans (both HFI and HFS) and direct financing leases is recognized using the effective interest method or on a basis approximating a level rate of return over the life of the asset. Leveraged lease revenue is recognized on a basis calculated to achieve a constant after-tax rate of return for periods in which there is a positive investment in the transaction, net of related deferred tax liabilities. Effective January 1, 2010, interest income includes a component of accretion of the fair value discount on loans and lease receivables recorded in connection with FSA.
For finance receivables that were not considered impaired at the FSA date and for which cash flows were evaluated based on contractual terms, the discount is accreted using the effective interest method as a yield adjustment over the remaining term of the loan and recorded in Interest Income. If the finance receivable is prepaid, the remaining accretable balance is recognized in Interest Income. If the finance receivable is sold, the remaining discount is considered in the determination of the resulting gain or loss. If the finance receivable is subsequently classified as non-accrual, accretion of the discount ceases.
For finance receivables that were considered impaired at the FSA date and for which the cash flows were evaluated based on expected cash flows that are less than contractual cash flows, there is an accretable and a non-accretable discount. The accretable discount is accreted using the effective interest method as a yield adjustment over the remaining term of the loan and recorded in Interest Income. The non-accretable discount reflects the present value of the difference between the excess of cash flows contractually required to be paid and expected cash flows (i.e. credit component). The non-accretable discount is recorded as a reduction to finance receivables and serves to reduce future charge-offs or is reclassified to accretable discount should expected cash flows improve. The accretable discount on finance receivables that are on non-accrual does not accrete until the account returns to performing status.
Rental revenue on operating leases is recognized on a straight line basis over the lease term and is included in Non-interest Income. An intangible asset was recorded in FSA to adjust for carrying value of above or below market operating lease contracts to their fair value. These adjustments (net) are amortized into rental income on a straight line basis over the remaining term of the respective lease.
The recognition of interest income (including accretion) on commercial loans and finance receivables is suspended and an account is placed on non-accrual status when, in the opinion of management, full collection of all principal and interest due is doubtful. To the extent the estimated cash flows, including fair value of collateral, does not satisfy both the principal and accrued interest outstanding, accrued but uncollected interest at the date an account is placed on non-accrual status is reversed and charged against interest income. Subsequent interest received is applied to the outstanding principal balance until such time as the account is collected, charged-off or returned to accrual status. Interest on loans or capital leases that are on cash basis non-accrual do not accrue interest income; however, payments designated by the borrower as interest payments may be recorded as interest income. To qualify for this treatment, the remaining recorded investment in the loan or capital lease must be deemed fully collectable.
The recognition of interest income (including accretion) on consumer loans and certain small ticket commercial loans and lease receivables is suspended and all previously accrued but uncollected revenue is reversed, when payment of principal and/or interest is contractually delinquent for 90 days or more. Accounts, including accounts that have been modified, are returned to accrual status when, in the opinion of management, collection of remaining principal and interest is reasonably assured, and upon collection of six consecutive scheduled payments.
The Company periodically modifies the terms of finance receivables in response to borrowers’ financial difficulties. These modifications may include interest rate changes, principal forgiveness or payment deferments. The finance receivables that are modified, where a concession has been made to the borrower, are accounted for as Troubled Debt Restructurings (“TDR’s”). TDR’s are generally
CIT ANNUAL REPORT 2012 97
CIT GROUP AND SUBSIDIARIES — NOTES TO CONSOLIDATED FINANCIAL STATEMENTS
placed on non-accrual upon their restructuring and remain on non-accrual until, in the opinion of management, collection of remaining principal and interest is reasonably assured, and upon collection of six consecutive scheduled payments.
Allowance for Loan Losses on Finance Receivables
The allowance for loan losses is intended to provide for credit losses inherent in the loan and lease receivables portfolio and is periodically reviewed for adequacy considering credit quality indicators, including expected and historical losses and levels of and trends in past due loans, non-performing assets and impaired loans, collateral values and economic conditions.
As a result of FSA, the allowance for loan losses balance at December 31, 2009 was eliminated and, together with fair value adjustments to loans and lease receivables, effectively re-characterized as either non-accretable or accretable discount. The non-accretable component represents contractually required payments receivable in excess of the amount of cash flows expected to be collected for loans with evidence of credit impairment. The accretable discount, which largely reflects the difference between contractual rates and market rates on the portfolio at the emergence date, is recognized in accordance with the effective interest method or on a basis approximating a level rate of return, as a yield adjustment to loans and capital leases over the remaining term of the loan, and reflected in interest income.
The allowance for loan losses on finance receivables for CIT reflects estimated amounts for loans originated subsequent to the emergence date, and amounts required in excess of the remaining FSA discount on loans that were on the balance sheet at the emergence date. The allowance for loan losses on finance receivables originated as of or subsequent to emergence is determined based on three key components: (1) specific allowances for loans that are impaired, based upon the value of underlying collateral or projected cash flows, (2) non-specific allowances for estimated losses inherent in the portfolio based upon the expected loss over the loss emergence period projected loss levels and (3) allowances for estimated losses inherent in the portfolio based upon economic risks, industry and geographic concentrations, and other factors. Changes to the Allowance for Loan Losses are recorded in the Provision for Credit Losses. The non-specific allowance for loan losses following the Company’s emergence from bankruptcy has been based on the Company’s internal probability of default and loss given default ratings using loan-level data. CIT’s portfolio consisted primarily of loans that do not have predictable prepayments and as such, prepayments were not considered in the determination of contractual cash flows and cash flows expected to be collected in FSA.
With respect to assets transferred from HFI to HFS, a charge off is recognized to the extent carrying value exceeds the expected cash flows.
An approach similar to the allowance for loan losses is utilized to calculate a reserve for losses related to unfunded loan commitments and deferred purchase commitments associated with the Company’s factoring business. A reserve for unfunded loan commitments is maintained to absorb estimated probable losses related to these facilities. The adequacy of the reserve is determined based on periodic evaluations of the unfunded credit facilities, including an assessment of the probability of commitment usage, credit risk factors for loans outstanding to these same customers, and the terms and expiration dates of the unfunded credit facilities. The reserve for unfunded loan commitments is recorded as a liability on the Consolidated Balance Sheet. Net adjustments to the reserve for unfunded loan commitments are included in the provision for credit losses.
Finance receivables are divided into the following five portfolio segments, which correspond to the Company’s business segments; Corporate Finance; Transportation Finance; Trade Finance; Vendor Finance and Consumer. Within each portfolio segment, credit risk is assessed and monitored in the following seven classes of loans; Corporate Finance – SBL; Corporate Finance – other; Transportation Finance; Trade Finance; Vendor Finance – U.S.; Vendor Finance – International; and Consumer. The allowance is estimated based upon the finance receivables in the respective class.
The allowance policies described above related to specific and non-specific allowances, and the impaired finance receivables and charge-off policies that follow, are applied across the portfolio segments and loan classes. Given the nature of the Company’s business, the specific allowance is largely related to the Corporate Finance, Trade Finance and Transportation Finance portfolio segments. The non-specific allowance, which considers the Company’s internal system of probability of default and loss severity ratings, among other factors, is applicable to all the portfolio segments.
Impaired Finance Receivables
Impaired finance receivables (including loans or capital leases) of $500 thousand or greater that are placed on non-accrual status, largely in the Corporate Finance – other, Trade Finance and Transportation Finance loan classes, are subject to periodic individual review by the Company’s problem loan management (PLM) function. The Company excludes consumer loans and small-ticket loan and lease receivables, largely in the two Vendor Finance and Corporate Finance – SBL (Small Business Lending) loan classes, that have not been modified in a troubled debt restructuring, as well as short-term factoring receivables, from its impaired finance receivables disclosures as charge-offs are typically determined and recorded for such loans beginning at 120-150 days of contractual delinquency.
Impairment occurs when, based on current information and events, it is probable that CIT will be unable to collect all amounts due according to contractual terms of the agreement. Impairment is measured as the shortfall between estimated value and recorded investment in the finance receivable, with the estimated value determined using fair value of collateral and other cash flows if the finance receivable is collateralized, or the present value of expected future cash flows discounted at the contract’s effective interest rate.
Charge-off of Finance Receivables
Charge-offs on commercial loans are recorded after considering such factors as the borrower’s financial condition, the value of underlying collateral and guarantees (including recourse to dealers and manufacturers), and the status of collection activities.
Item 8: Financial Statements and Supplementary Data
98 CIT ANNUAL REPORT 2012
CIT GROUP AND SUBSIDIARIES — NOTES TO CONSOLIDATED FINANCIAL STATEMENTS
Such charge-offs are deducted from the carrying value of the related finance receivables. This policy is largely applicable in the Corporate Finance-other, Trade Finance and Transportation Finance loan classes. Charge-offs on consumer and certain small ticket commercial finance receivables, primarily in the Vendor Finance and Consumer segments and the Corporate Finance SBL loan class, are recorded beginning at 120 to150 days of contractual delinquency. In accordance with FSA, charge-offs on loans with an FSA discount as of the emergence date are first allocated to the respective loan’s fresh start discount. To the extent a charge-off amount exceeds such discount the difference is reported as a charge-off. Charge-offs on loans originated subsequent to emergence are reflected in the provision for credit losses. Collections on accounts previously charged off in the post-emergence period are recorded as recoveries in the provision for credit losses. Collections on accounts previously charged off in the pre-emergence period are recorded as recoveries in other income. Collections on accounts previously charged off prior to transfer to HFS are recorded as recoveries in other income.
Delinquent Finance Receivables
A loan is considered past due for financial reporting purposes if default of contractual principal or interest exists for a period of 30 days or more. Past due loans consist of both loans that are still accruing interest as well as loans on non-accrual status.
Long-Lived Assets
A review for impairment of long-lived assets, such as operating lease equipment, is performed at least annually or when events or changes in circumstances indicate that the carrying amount of long-lived assets may not be recoverable. Impairment of assets is determined by comparing the carrying amount to future undiscounted net cash flows expected to be generated. If an asset is impaired, the impairment is the amount by which the carrying amount of the asset exceeds the fair value of the asset. Fair value is based upon discounted cash flow analysis and available market data. Current lease rentals, as well as relevant and available market information (including third party sales for similar equipment, and published appraisal data), are considered both in determining undiscounted future cash flows when testing for the existence of impairment and in determining estimated fair value in measuring impairment. Depreciation expense is adjusted when projected fair value at the end of the lease term is below the projected book value at the end of the lease term. Assets to be disposed of are included in HFS and reported at the lower of the carrying amount or fair value less disposal costs.
Investments
Debt and equity securities classified as “available-for-sale” (“AFS”) are carried at fair value with changes in fair value reported in accumulated other comprehensive income (“AOCI”), net of applicable income taxes. Credit- related declines in fair value that are determined to be an other than temporary impairment (“OTTI”) are immediately recorded in earnings. Realized gains and losses on sales are included inOther income on a specific identification basis, and interest and dividend income on AFS securities is included inInterest and dividends on interest bearing deposits and investments.
Debt securities classified as “held-to-maturity” (“HTM”) represent securities that the Company has both the ability and the intent to hold until maturity, and are carried at amortized cost. Interest on such securities is included inInterest and dividends on interest bearing deposits and investments.
Equity investments without readily determinable fair values are generally carried at cost or the equity method of accounting and periodically assessed for OTTI, with the net asset values reduced when impairment is deemed to be other-than-temporary. Equity method investments are recorded at cost, adjusted to reflect the Company’s portion of income, loss or dividend of the investee.
Evaluating Investments for OTTI
The Company conducts and documents periodic reviews of all securities with unrealized losses to evaluate whether the impairment is other than temporary. The Company accounts for investment impairments in accordance with ASC 320-10-35-34,Investments – Debt and Equity Securities: Recognition of an Other-Than-Temporary Impairment. Under the guidance for debt securities, OTTI is recognized in earnings for debt securities that the Company has an intent to sell or that the Company believes it is more-likely-than-not that it will be required to sell prior to the recovery of the amortized cost basis. For those securities that the Company does not intend to sell or expect to be required to sell, credit-related impairment is recognized in earnings, while the non-credit related impairment is recorded in AOCI.
An unrealized loss exists when the current fair value of an individual security is less than its amortized cost basis. Unrealized losses that are determined to be temporary in nature are recorded, net of tax, in AOCI for AFS securities, while such losses related to HTM securities are not recorded, as these investments are carried at their amortized cost.
Amortized cost is defined as the original purchase cost, plus or minus any accretion or amortization of a purchase discount or premium. Regardless of the classification of the securities as AFS or HTM, the Company has assessed each investment for impairment.
Factors considered in determining whether a loss is temporary include:
| - | | the length of time that fair value has been below cost; |
| - | | the severity of the impairment or the extent to which fair value has been below cost; |
| - | | the cause of the impairment and the financial condition and the near-term prospects of the issuer; |
| - | | activity in the market of the issuer that may indicate adverse credit conditions; and |
| - | | the Company’s ability and intent to hold the investment for a period of time sufficient to allow for any anticipated recovery. |
The Company’s review for impairment generally includes identification and evaluation of investments that have indications of possible impairment, in addition to:
| - | | analysis of individual investments that have fair values less than amortized cost, including consideration of the length of time the investment has been in an unrealized loss position and the expected recovery period; |
CIT ANNUAL REPORT 2012 99
CIT GROUP AND SUBSIDIARIES — NOTES TO CONSOLIDATED FINANCIAL STATEMENTS
| - | | discussion of evidential matter, including an evaluation of factors or triggers that could cause individual investments to qualify as having OTTI and those that would not support OTTI; and |
| - | | documentation of the results of these analyses, as required under business policies. |
For equity securities, management considers the various factors described above. If it is determined that the security’s decline in fair value (for equity securities AFS) or cost (for equity securities carried at amortized cost) is other than temporary, the security’s fair value or cost is written down, and the charge recognized in Other income.
Goodwill and Other Identified Intangibles
The Company’s goodwill represents the excess of the reorganization equity value over the fair value of tangible and identifiable intangible assets, net of liabilities as of the emergence date.
Goodwill is assigned to segments (or “reporting units”) at the date the goodwill is initially recorded. Once goodwill has been assigned to reporting units, it no longer retains its association with a particular transaction, and all of the activities within a reporting unit, whether acquired or internally generated, are available to evaluate the value of goodwill.
Goodwill is not amortized but it is evaluated for impairment on an annual basis, or more often if events or circumstances indicate there may be impairment, and at the segment (or “reporting unit”) level. An intangible asset was recorded in FSA for net above and below market operating lease contracts. These intangible assets are amortized on a straight line basis, resulting in lower rental income (a component of Non-interest Income) over the remaining term of the lease agreements. Management evaluates definite lived intangible assets for impairment when events and circumstances indicate that the carrying amounts of those assets may not be recoverable.
In September 2011, the FASB issued Accounting Standards Update (“ASU”) 2011-08,Testing Goodwill for Impairment, that permits an entity to make a qualitative assessment of whether it is more likely than not that a reporting unit’s fair value is less than its carrying amount before applying the two-step goodwill impairment test required in FASB Account Standard Codification (“ASC”) Topic 350,Intangibles – Goodwill & Other. If an entity concludes that it is not more likely than not that the fair value of a reporting unit is less than its carrying amount, it would not be required to perform the two-step impairment test for that reporting unit. The Company adopted the ASU for the year ended December 31, 2011. SeeNote 24 for further details.
Other Assets
Assets received in satisfaction of loans are initially recorded at fair value and then assessed at the lower of carrying value or estimated fair value less selling costs, with write-downs of the pre-existing receivable reflected in the provision for credit losses. Additional impairment charges, if any, would be recorded in Other Income.
Derivative Financial Instruments
The Company manages economic risk and exposure to interest rate and foreign currency risk through derivative transactions in over-the-counter markets with other financial institutions. The Company does not enter into derivative financial instruments for speculative purposes.
Derivatives utilized by the Company may include swaps, forward settlement contracts, and options contracts. A swap agreement is a contract between two parties to exchange cash flows based on specified underlying notional amounts, assets and/or indices. Forward settlement contracts are agreements to buy or sell a quantity of a financial instrument, index, currency or commodity at a predetermined future date, and rate or price. An option contract is an agreement that gives the buyer the right, but not the obligation, to buy or sell an underlying asset from or to another party at a predetermined price or rate over a specific period of time.
The Company documents at inception all relationships between hedging instruments and hedged items, as well as the risk management objectives and strategies for undertaking various hedges. Upon executing a derivative contract, the Company designates the derivative as either a qualifying hedge or non-qualifying hedge. The designation may change based upon management’s reassessment of circumstances.
The Company utilizes cross-currency swaps and foreign currency forward contracts to hedge net investments in foreign operations. These transactions are classified as foreign currency net investment hedges with resulting gains and losses reflected in AOCI. For hedges of foreign currency net investment positions, the “forward” method is applied whereby effectiveness is assessed and measured based on the amounts and currencies of the individual hedged net investments versus the notional amounts and underlying currencies of the derivative contract. For those hedging relationships where the critical terms of the underlying net investment and the derivative are identical, and the credit-worthiness of the counterparty to the hedging instrument remains sound, there is an expectation of no hedge ineffectiveness so long as those conditions continue to be met.
The company also enters into foreign currency forward contracts to manage the foreign currency risk associated with its non US subsidiary’s funding activities and designates these as foreign currency cash flow hedges for which certain components are reflected in AOCI and others recognized in noninterest income when the underlying transaction impacts earnings.
In addition, the company uses foreign currency forward contracts, interest rate swaps, cross currency interest rate swaps, and options to hedge interest rate and foreign currency risks arising from its asset and liability mix. These are treated as economic hedges.
Derivative instruments that qualify for hedge accounting are presented in the balance sheet at their fair values in other assets or other liabilities. Derivatives that do not qualify for hedge accounting are presented in the balance sheet as trading assets or liabilities, with their resulting gains or losses recognized in Other Income. Fair value is based on dealer quotes, pricing models, discounted cash flow methodologies, or similar techniques for which the determination of fair value may require significant management judgment or estimation. The fair value of the derivative is reported on a gross-by-counterparty basis. Valuations of derivative assets and liabilities reflect the value of the instrument including the Company’s and counterparty’s credit risk.
Item 8: Financial Statements and Supplementary Data
100 CIT ANNUAL REPORT 2012
CIT GROUP AND SUBSIDIARIES — NOTES TO CONSOLIDATED FINANCIAL STATEMENTS
CIT is exposed to credit risk to the extent that the counterparty fails to perform under the terms of a derivative. The Company manages this credit risk by requiring that all derivative transactions be conducted with counterparties rated investment grade at the initial transaction by nationally recognized rating agencies, and by setting limits on the exposure with any individual counterparty. In addition, pursuant to the terms of the Credit Support Annexes between the Company and its counterparties, CIT may be required to post collateral or may be entitled to receive collateral in the form of cash or highly liquid securities depending on the valuation of the derivative instruments as measured on a daily basis.
Fair Value Measurements
The Company characterizes inputs in the determination of fair value according to the fair value hierarchy described below:
| - | | Level 1 – Quoted prices (unadjusted) in active markets for identical assets or liabilities that are accessible at the measurement date. Level 1 assets and liabilities include debt and equity securities and derivative contracts that are traded in an active exchange market, as well as certain other securities that are highly liquid and are actively traded in over-the-counter markets; |
| - | | Level 2 – Observable inputs other than Level 1 prices, such as quoted prices for similar assets or liabilities, quoted prices in markets that are not active, or other inputs that are observable or can be corroborated by observable market data for substantially the full term of the assets or liabilities. Level 2 assets and liabilities include debt securities with quoted prices that are traded less frequently than exchange-traded instruments and derivative contracts whose value is determined using a pricing model with inputs that are observable in the market or can be derived principally from or corroborated by observable market data. This category generally includes derivative contracts and certain loans held-for-sale; |
| - | | Level 3 – Unobservable inputs that are supported by little or no market activity and that are significant to the fair value of the assets or liabilities. Level 3 assets and liabilities include financial instruments whose value is determined using valuation models, discounted cash flow methodologies or similar techniques, as well as instruments for which the determination of fair value requires significant management judgment or estimation. This category generally includes highly structured or long-term derivative contracts and structured finance securities where independent pricing information cannot be obtained for a significant portion of the underlying assets or liabilities. In FSA, Level 3 inputs were used to mark substantially all the finance receivables to fair value. Historically, the finance receivables were carried at cost basis and not marked to market. |
Adoption of FSA at emergence required that all assets and liabilities, other than deferred taxes, be stated at fair value.
In May 2011, the FASB issued ASU No. 2011-04,Fair Value Measurement (Topic 820): Amendments to Achieve Common Fair Value Measurement and Disclosure Requirements in U.S. GAAP and IFRS. The new guidance results in a consistent definition of fair value and common requirements for measurement of and disclosure about fair value between U.S. GAAP and IFRS. The disclosure requirements also have been enhanced. The most significant change requires entities, for their recurring Level 3 fair value measurements, to disclose quantitative information about unobservable inputs used, a description of the valuation processes used by the entity, and a qualitative discussion about the sensitivity of the measurements. New disclosures are required about the use of a nonfinancial asset measured or disclosed at fair value if its use differs from its highest and best use. In addition, entities must report the level in the fair value hierarchy of assets and liabilities not recorded at fair value but where fair value is disclosed. The amendment became effective for fiscal years beginning after December 15, 2011, with early adoption prohibited. The adoption of the guidance during the quarter ended March 31, 2012, did not affect the Company’s financial condition and resulted in additional fair value measurement disclosures.
Income Taxes
Deferred tax assets and liabilities are recognized for the expected future taxation of events that have been reflected in the Consolidated Financial Statements. Deferred tax assets and liabilities are determined based on the differences between the book values and the tax basis of particular assets and liabilities, using tax rates in effect for the years in which the differences are expected to reverse. A valuation allowance is provided to offset any net deferred tax assets if, based upon the relevant facts and circumstances, it is more likely than not that some or all of the deferred tax assets will not be realized.
The Company is subject to the income tax laws of the United States, its states and municipalities and those of the foreign jurisdictions in which the Company operates. These tax laws are complex, and the manner in which they apply to the taxpayer’s facts is sometimes open to interpretation. Given these inherent complexities, the Company must make judgments in assessing the likelihood that a tax position will be sustained upon examination by the taxing authorities based on the technical merits of the tax position. A tax position is recognized only when, based on management’s judgment regarding the application of income tax laws, it is more likely than not that the tax position will be sustained upon examination. The amount of benefit recognized for financial reporting purposes is based on management’s best judgment of the most likely outcome resulting from examination given the facts, circumstances and information available at the reporting date. The Company adjusts the level of unrecognized tax benefits when there is new information available to assess the likelihood of the outcome. Liabilities for uncertain tax positions are included in current taxes payable, which is reflected in accrued liabilities and payables. Accrued interest and penalties for unrecognized tax positions are recorded in income tax expense.
Other Comprehensive Income/Loss
Other Comprehensive Income/Loss includes unrealized gains and losses, unless other than temporarily impaired, on AFS investments, foreign currency translation adjustments for both net investment in foreign operations and related derivatives designated as hedges of such investments, changes in fair values of derivative instruments designated as hedges of future cash flows and certain pension and postretirement benefit obligations, all net of tax.
CIT ANNUAL REPORT 2012 101
CIT GROUP AND SUBSIDIARIES — NOTES TO CONSOLIDATED FINANCIAL STATEMENTS
In June 2011, the FASB issued ASU No. 2011-05 to amend the guidance on the presentation of comprehensive income in FASB ASC Topic 220,Comprehensive Income that requires companies to present a single statement of comprehensive income or two consecutive statements. The guidance makes the financial statement presentation of other comprehensive income more prominent by eliminating the alternative to present comprehensive income within the statement of equity. The ASU became effective for annual and interim periods beginning after December 15, 2011. The adoption of the guidance during the quarter ended March 31, 2012 did not affect the Company’s financial condition but added the Consolidated Statements of Comprehensive Income (Loss).
In conjunction with the reorganization and adoption of FSA, existing balances in Other Comprehensive Income/Loss were eliminated at December 31, 2009.
Foreign Currency Translation
In addition to U.S. operations, the Company has operations in Canada, Europe and other jurisdictions. The functional currency for foreign operations is generally the local currency. The value of assets and liabilities of these operations is translated into U.S. dollars at the rate of exchange in effect at the balance sheet date. Revenue and expense items are translated at the average exchange rates during the year. The resulting foreign currency translation gains and losses, as well as offsetting gains and losses on hedges of net investments in foreign operations, are reflected in AOCI. Transaction gains and losses resulting from exchange rate changes on transactions denominated in currencies other than the functional currency are included in Other income.
Pension and Other Postretirement Benefits
CIT has both funded and unfunded noncontributory defined benefit pension and postretirement plans covering certain U.S. and non-U.S. employees, each of which is designed in accordance with the practices and regulations in the related countries. Recognition of the funded status of a benefit plan, which is measured as the difference between plan assets at fair value and the benefit obligation, is included in the balance sheet. The Company recognizes as a component of Other Comprehensive Income, net of tax, the net actuarial gains or losses and prior service cost or credit that arise during the period but are not recognized as components of net periodic benefit cost in the Statement of Operations.
Variable Interest Entities
A VIE is a corporation, partnership, limited liability company, or any other legal structure used to conduct activities or hold assets. These entities: lack sufficient equity investment at risk to permit the entity to finance its activities without additional subordinated financial support from other parties; have equity owners who either do not have voting rights or lack the ability to make significant decisions affecting the entity’s operations; and/or have equity owners that do not have an obligation to absorb the entity’s losses or the right to receive the entity’s returns.
In June 2009, the FASB issued amended accounting principles that changed the accounting for VIEs which became effective for the Company as of January 1, 2010. These principles were codified as Accounting Standards Update (ASU) No. 2009-16, “Transfers and Servicing (Topic 860) – Accounting for Transfers of Financial Assets” and ASU No. 2009-17, “Consolidations (Topic 810) – Improvements to Financial Reporting by Enterprises Involved with Variable Interest Entities.” ASU 2009-17 amended the VIEs Subsections of ASC Subtopic 810-10 to require former qualified special purpose entities (QSPEs) to be evaluated for consolidation and also changed the approach to determining a VIE’s primary beneficiary (“PB”) and required companies to more frequently reassess whether they must consolidate VIEs. Under the new guidance, the PB is the party that has both (1) the power to direct the activities of an entity that most significantly impact the VIE’s economic performance; and (2) through its interests in the VIE, the obligation to absorb losses or the right to receive benefits from the VIE that could potentially be significant to the VIE.
To assess whether the Company has the power to direct the activities of a VIE that most significantly impact the VIE’s economic performance, the Company considers all facts and circumstances, including its role in establishing the VIE and its ongoing rights and responsibilities. This assessment includes, first, identifying the activities that most significantly impact the VIE’s economic performance; and second, identifying which party, if any, has power over those activities. In general, the parties that make the most significant decisions affecting the VIE (such as asset managers, collateral managers, servicers, or owners of call options or liquidation rights over the VIE’s assets) or have the right to unilaterally remove those decision-makers are deemed to have the power to direct the activities of a VIE.
To assess whether the Company has the obligation to absorb losses of the VIE or the right to receive benefits from the VIE that could potentially be significant to the VIE, the Company considers all of its economic interests, including debt and equity investments, servicing fees, and derivative or other arrangements deemed to be variable interests in the VIE. This assessment requires that the Company apply judgment in determining whether these interests, in the aggregate, are considered potentially significant to the VIE. Factors considered in assessing significance include: the design of the VIE, including its capitalization structure; subordination of interests; payment priority; relative share of interests held across various classes within the VIE’s capital structure; and the reasons why the interests are held by the Company.
The Company performs on-going reassessments of: (1) whether any entities previously evaluated under the majority voting-interest framework have become VIEs, based on certain events, and are therefore subject to the VIE consolidation framework; and (2) whether changes in the facts and circumstances regarding the Company’s involvement with a VIE cause the Company’s consolidation conclusion regarding the VIE to change.
When in the evaluation of its interest in each VIE it is determined that the Company is considered the primary beneficiary, the VIE’s assets, liabilities and non-controlling interests are consolidated and included in the Consolidated Financial Statements. SeeNote 8 — Long Term Borrowings for further details.
Non-Interest Income
Non-interest income is recognized in accordance with relevant authoritative pronouncements and includes rental income on operating leases, and other income. Other income includes
Item 8: Financial Statements and Supplementary Data
102 CIT ANNUAL REPORT 2012
CIT GROUP AND SUBSIDIARIES — NOTES TO CONSOLIDATED FINANCIAL STATEMENTS
(1) factoring commissions, (2) gains and losses on sales of equipment (3) fee revenue such as commitment, facility, letters of credit, advisory syndication fees, and servicing fees (4) gains and losses on sales of finance receivables, (5) recoveries on loans charged-off prior to emergence and recoveries on loans charged-off prior to their transfer to HFS, (6) gains and losses on investment sales, (7) gains and losses on certain derivatives and foreign currency exchange, (8) counterparty receivable FSA accretion, (9) valuation allowance for assets held for sale, and (10) other revenues.
Other Expenses
Other expenses include (1) depreciation on operating lease equipment, (2) operating expenses, which include compensation and benefits, technology costs, professional fees, occupancy expenses, provision for severance and facilities exiting activities, and (3) gains and losses on debt extinguishments.
Stock-Based Compensation
Compensation expense associated with equity-based awards is recognized over the vesting period (requisite service period), generally three years, under the “graded vesting” attribution method, whereby each vesting tranche of the award is amortized separately as if each were a separate award. The cost of awards granted to directors in lieu of cash is recognized using the single-grant approach with immediate vesting and expense recognition. Expenses related to stock-based compensation are included in Operating Expenses.
Earnings per Share
Basic earnings per share (“EPS”) is computed by dividing net income by the weighted-average number of common shares outstanding for the period. Diluted EPS is computed by dividing net income by the weighted-average number of common shares outstanding increased by the weighted-average potential impact of dilutive securities, including stock options and restricted stock grants. The dilutive effect is computed using the treasury stock method, which assumes the conversion of stock options and restricted stock grants. However, in periods when results are negative, these shares would not be included in the EPS computation as the result would have an anti-dilutive effect.
Accounting for Costs Associated with Exit or Disposal Activities
A liability for costs associated with exit or disposal activities, other than in a business combination, is recognized when the liability is incurred. The liability is measured at fair value, with adjustments for changes in estimated cash flows recognized in earnings.
Consolidated Statements of Cash Flows
Unrestricted cash and cash equivalents includes cash and interest-bearing deposits, which primarily represent overnight money market investments of excess cash and short term investment in mutual funds. The Company maintains cash balances principally at financial institutions located in the U.S. and Canada. The balances are not insured in all cases. Cash and cash equivalents also include amounts at CIT Bank, which are only available for the bank’s funding and investment requirements. Cash inflows and outflows from deposits are not generally less than 90 days and most factoring receivables are presented on a net basis in the Statements of Cash Flows, as factoring receivables are generally less than 90 days.
Cash receipts and cash payments resulting from purchases and sales of loans, securities, and other financing and leasing assets are classified as operating cash flows in accordance with ASC 230-10-45-21 when these assets are originated/acquired and designated specifically for resale.
Activity for loans originated or acquired for investment purposes, including those subsequently transferred to HFS, is classified in the investing section of the statement of cash flows in accordance with ASC 230-10-45-12 and 230-10-45-13. The vast majority of the Company’s loan originations are for investment purposes. In the past few years, the Company has been a seller of loans as management has been optimizing the balance sheet and repaying debt obligations. These loans were initially recorded as HFI because the Company had the intent and ability to hold such loans for the foreseeable future but subsequently were reclassified to HFS. Cash receipts resulting from sales of loans, beneficial interests and other financing and leasing assets that were not specifically originated/acquired and designated for resale are classified as investing cash inflows regardless of subsequent classification.
Fresh Start Accounting
The consolidated financial statements include the effects of adopting Fresh Start Accounting (“FSA”) in accordance with the provisions of ASC 852,Reorganizations, upon the Company’s emergence from bankruptcy on December 10, 2009. In applying FSA, the fair value of assets, liabilities and equity were derived by applying market information at the Emergence Date to account balances at December 31, 2009, unless (i) those account balances were originated subsequent to December 10, 2009, in which case fair values were assigned based upon their origination value or (ii) the basis of accounting applicable to the balances was fair value, in which instance fair value was determined using market information at December 31, 2009. As such, accretion and amortization of certain FSA adjustments began on January 1, 2010.
Revisions
In preparing its quarterly financial statements for the first three quarters of 2012, the Company discovered, corrected and disclosed the larger amounts in those quarters immaterial errors that impacted prior periods. Additional out-of-period errors were identified in the fourth quarter. These additional out-of-period errors were individually and in the aggregate not material to the fourth quarter results but, when combined with the other out-of-period errors previously identified this year, were determined by management to be material to the full year 2012 results.
The cumulative effect of these revisions increased 2012 shareholders’ equity by $23 million, increased total assets by $19 million, and decreased total liabilities by $4 million. As a result of these revisions, net income for the years ended December 31, 2011 and 2010 decreased by $12 million and $3 million, respectively, from previously reported amounts. The recognition of amounts relating to periods prior to 2010 resulted in a corresponding $15 million increase to goodwill, as a result of our adoption of fresh start accounting. Management will revise in subsequent quarterly filings on Form 10-Q and has revised in this Form 10-K, its previously reported financial statements for 2012, 2011 and
CIT ANNUAL REPORT 2012 103
CIT GROUP AND SUBSIDIARIES — NOTES TO CONSOLIDATED FINANCIAL STATEMENTS
2010. SeeNote 27 — Selected Quarterly Financial Data for more information.
NEW ACCOUNTING PRONOUNCEMENTS
Balance Sheet Offsetting Disclosure Requirements
In December 2011, the FASB issued ASU 2011-11,Disclosures about Offsetting Assets and Liabilities which creates new disclosure requirements about the nature of an entity’s rights of setoff and related arrangements associated with its financial instruments and derivative instruments. The new disclosures will enable financial statement users to compare balance sheets prepared under U.S. GAAP and International Financial Reporting Standards (“IFRS”), which are subject to different offsetting models. The disclosures will be limited to financial instruments and derivatives subject to enforceable master netting arrangements or similar agreements and excludes loans unless they are netted in the statement of financial condition. The amendments will affect all entities that have financial instruments and derivatives that are either offset in the balance sheet or subject to an enforceable master netting arrangement or similar agreement regardless of whether they are offset in the balance sheet. The ASU will require entities to disclose, separately for financial assets and liabilities, including derivatives, the gross amounts of recognized financial assets and liabilities; the amounts offset under current U.S. GAAP; the net amounts presented in the balance sheet; the amounts subject to an enforceable master netting arrangement or similar agreement that were not included in the offset amount above, and the reconciling amount.
The disclosure requirements are effective for annual and interim reporting periods beginning on or after January 1, 2013, with retrospective application required. Given the Company’s limited use of master netting agreements this is not expected to have a significant impact on CIT’s financial statements or disclosures.
Indefinite-Lived Intangible Assets Impairment Test
In July 2012, the FASB issued ASU No. 2012-02,Testing Indefinite – Lived Intangible Assets for Impairment which amends the guidance in ASC Topic 350 on testing and indefinite-lived intangible assets other than goodwill for impairment. Under ASC 350-30, entities must test indefinite-lived intangible assets for impairment at least annually by calculating and comparing an asset’s fair value with its carrying amount. An impairment loss would be recorded for an amount equal to the excess of the asset’s carrying amount over its fair value. ASU No. 2012-02 provides the option of performing a qualitative assessment before calculating the fair value of the asset, when testing an indefinite-lived intangible asset for impairment. If an entity determines, on the basis of qualitative factors, that the fair value of an indefinite-lived intangible asset is not more likely than not impaired, they would not need to calculate the fair value of the asset. The ASU does not revise the requirement to test indefinite-lived intangible assets annually for impairment. In addition, the ASU does not amend the requirement to test these assets for impairment between annual tests if there is a change in events or circumstances; however, it does revise the examples of events and circumstances that an entity should consider in interim periods.
The guidance is effective for annual and interim impairment tests performed for fiscal years beginning after September 15, 2012. As the Company has no indefinite-lived intangible assets, adoption of this guidance will have no impact on the consolidated financial statements.
Reporting of Amounts Reclassified Out of Accumulated Other Comprehensive Income
On December 23, 2011, the FASB issued ASU No. 2011-12, Comprehensive Income (Topic 220): Deferral of the Effective Date for Amendments to the Presentation of Reclassifications of Items Out of Accumulated Other Comprehensive Income in Accounting Standards Update No. 2011-05. The ASU defers the requirement to present components of reclassifications of other comprehensive income on the face of the income statement, while still requiring companies to adopt the other requirements contained in ASU No. 2011-05.
In February 2013, the FASB issued ASU 2013-02 Comprehensive Income (Topic 220) Accounting Standards Update 2013-02 Comprehensive Income (Topic 220). The amendments do not change the current requirements for reporting net income or other comprehensive income in financial statements. However, the amendments require an entity to provide information about the amounts reclassified out of AOCI by component and present, either on the face of the statement where net income is presented or in the notes, significant amounts reclassified out of AOCI by the respective line items of net income but only if the amount reclassified is required under GAAP to be reclassified to net income in its entirety in the same reporting period. For other amounts that are not required under GAAP to be reclassified in their entirety to net income, an entity is required to cross-reference to other disclosures required under GAAP that provide additional detail about those amounts.
The guidance will be applied prospectively and is effective for annual and interim reporting periods beginning on or after December 15, 2012. The adoption of this will not affect the Company’s financial condition, but will result in enhanced AOCI disclosure.
Item 8: Financial Statements and Supplementary Data
104 CIT ANNUAL REPORT 2012
CIT GROUP AND SUBSIDIARIES — NOTES TO CONSOLIDATED FINANCIAL STATEMENTS
Finance receivables consist of the following:
Finance Receivables by Product (dollars in millions)
| | | | December 31, 2012
| | December 31, 2011
|
|---|
| | | | $ | 15,825.4 | | | $ | 15,663.6 | |
| | | | | 4,984.0 | | | | 4,171.1 | |
| | | | | 38.2 | | | | 71.2 | |
| | | | | 20,847.6 | | | | 19,905.9 | |
Finance receivables held for sale | | | | | 302.8 | | | | 2,088.0 | |
Finance receivables and held for sale receivables(1) | | | | $ | 21,150.4 | | | $ | 21,993.9 | |
(1) | | Assets held for sale in the balance sheet includes finance receivables and operating lease equipment. As discussed in subsequent tables, since the Company manages the credit risk and collections of finance receivables held for sale consistently with its finance receivables held for investment, the applicable amount is presented. |
The following table presents finance receivables by segment, based on obligor location:
Finance Receivables (dollars in millions)
| | | | December 31, 2012
| | December 31, 2011
| |
|---|
| | | | Domestic
| | Foreign
| | Total
| | Domestic
| | Foreign
| | Total
|
|---|
| | | | $ | 7,159.8 | | | $ | 1,013.2 | | | $ | 8,173.0 | | | $ | 5,853.5 | | | $ | 1,009.2 | | | $ | 6,862.7 | |
| | | | | 1,219.8 | | | | 633.4 | | | | 1,853.2 | | | | 1,063.2 | | | | 423.8 | | | | 1,487.0 | |
| | | | | 2,177.2 | | | | 128.1 | | | | 2,305.3 | | | | 2,299.1 | | | | 132.3 | | | | 2,431.4 | |
| | | | | 2,459.1 | | | | 2,359.6 | | | | 4,818.7 | | | | 2,389.4 | | | | 2,052.6 | | | | 4,442.0 | |
| | | | | 3,687.3 | | | | 10.1 | | | | 3,697.4 | | | | 4,671.0 | | | | 11.8 | | | | 4,682.8 | |
| | | | $ | 16,703.2 | | | $ | 4,144.4 | | | $ | 20,847.6 | | | $ | 16,276.2 | | | $ | 3,629.7 | | | $ | 19,905.9 | |
The following table presents selected components of the net investment in finance receivables.
Components of Net Investment in Finance Receivables (dollars in millions)
| | | | December 31, 2012
| | December 31, 2011
|
|---|
| | | | $ | (995.2 | ) | | $ | (1,057.5 | ) |
Equipment residual values | | | | | 694.5 | | | | 801.1 | |
| | | | | (40.5 | ) | | | (42.3 | ) |
Net unamortized deferred costs and (fees) | | | | | 51.4 | | | | 63.8 | |
Leveraged lease third party non-recourse debt payable | | | | | (227.9 | ) | | | (247.0 | ) |
Certain of the following tables present credit-related information at the “class” level in accordance with ASC 310-10-50, Disclosures about the Credit Quality of Finance Receivables and the Allowance for Credit Losses. A class is generally a disaggregation of a portfolio segment. In determining the classes, CIT considered the finance receivable characteristics and methods it applies in monitoring and assessing credit risk and performance.
Credit Quality Information
The following table summarizes finance receivables by the risk ratings that bank regulatory agencies utilize to classify credit exposure and which are consistent with indicators the Company monitors. Risk ratings are reviewed on a regular basis by Credit Risk Management and are adjusted as necessary for updated information affecting the borrowers’ ability to fulfill their obligations.
The definitions of these ratings are as follows:
| - | | Pass – finance receivables in this category do not meet the criteria for classification in one of the categories below. |
| - | | Special mention – a special mention asset exhibits potential weaknesses that deserve management’s close attention. If left uncorrected, these potential weaknesses may, at some future date, result in the deterioration of the repayment prospects. |
| - | | Classified – a classified asset ranges from: (1) assets that exhibit a well defined weakness and are inadequately protected by the current sound worth and paying capacity of the borrower, and are characterized by the distinct possibility that some loss will be sustained if the deficiencies are not corrected to (2) assets with weaknesses that make collection or liquidation in full unlikely on the basis of current facts, conditions, and values. Assets in this classification can be accruing or on non-accrual depending on the evaluation of these factors. |
CIT ANNUAL REPORT 2012 105
CIT GROUP AND SUBSIDIARIES — NOTES TO CONSOLIDATED FINANCIAL STATEMENTS
Finance Receivables(1) — By Risk Rating (dollars in millions)
Grade:
| | | | Corporate
Finance –
Other
| | Corporate
Finance –
SBL
| | Transportation
Finance
| | Trade
Finance
| | Vendor
Finance
U.S.
| | Vendor
Finance
International
| | Commercial
| | Consumer
| | Total
|
|---|
| | | | | | | | | | | | | | | | | | | | | | | | | | | | | | | | | | | | | | |
| | | | $ | 6,228.7 | | | $ | 166.1 | | | $ | 1,492.4 | | | $ | 1,913.2 | | | $ | 2,057.0 | | | $ | 2,340.5 | | | $ | 14,197.9 | | | $ | 3,254.1 | | | $ | 17,452.0 | |
| | | | | 759.5 | | | | 358.6 | | | | 184.1 | | | | 266.9 | | | | 194.0 | | | | 161.8 | | | | 1,924.9 | | | | 213.5 | | | | 2,138.4 | |
| | | | | 408.2 | | | | 96.7 | | | | 136.2 | | | | 119.2 | | | | 160.4 | | | | 77.7 | | | | 998.4 | | | | 229.8 | | | | 1,228.2 | |
| | | | | 148.9 | | | | 63.0 | | | | 40.5 | | | | 6.0 | | | | 45.5 | | | | 26.3 | | | | 330.2 | | | | 1.6 | | | | 331.8 | |
| | | | $ | 7,545.3 | | | $ | 684.4 | | | $ | 1,853.2 | | | $ | 2,305.3 | | | $ | 2,456.9 | | | $ | 2,606.3 | | | $ | 17,451.4 | | | $ | 3,699.0 | | | $ | 21,150.4 | |
| | | | | | | | | | | | | | | | | | | | | | | | | | | | | | | | | | | | | | |
| | | | $ | 4,255.6 | | | $ | 279.9 | | | $ | 1,089.3 | | | $ | 2,019.1 | | | $ | 2,038.3 | | | $ | 2,055.6 | | | $ | 11,737.8 | | | $ | 5,580.1 | | | $ | 17,317.9 | |
| | | | | 930.9 | | | | 236.9 | | | | 136.7 | | | | 263.8 | | | | 157.7 | | | | 122.8 | | | | 1,848.8 | | | | 367.5 | | | | 2,216.3 | |
| | | | | 735.6 | | | | 135.0 | | | | 216.0 | | | | 73.2 | | | | 133.8 | | | | 67.1 | | | | 1,360.7 | | | | 397.0 | | | | 1,757.7 | |
| | | | | 356.4 | | | | 141.5 | | | | 45.0 | | | | 75.3 | | | | 55.3 | | | | 27.6 | | | | 701.1 | | | | 0.9 | | | | 702.0 | |
| | | | $ | 6,278.5 | | | $ | 793.3 | | | $ | 1,487.0 | | | $ | 2,431.4 | | | $ | 2,385.1 | | | $ | 2,273.1 | | | $ | 15,648.4 | | | $ | 6,345.5 | | | $ | 21,993.9 | |
(1) | | Balances include $302.8 million and $2,088.0 million of loans in Assets Held for Sale at December 31, 2012 and 2011, respectively, which are measured at the lower of cost or fair value. ASU 2010-20 does not require inclusion of these finance receivables in the disclosures above. However, until they are disposed of, the Company manages the credit risk and collections of finance receivables held for sale consistently with its finance receivables held for investment, so that Company data are tracked and used for management purposes on an aggregated basis, as presented above. In addition to finance receivables, the total for Assets Held for Sale on the balance sheet also include operating lease equipment held for sale, which are not included in the above table. |
Past Due and Non-accrual Loans
The table that follows presents portfolio delinquency status, regardless of accrual/non-accrual classification:
Finance Receivables(1) — Delinquency Status (dollars in millions)
| | | | 30–59 Days
Past Due
| | 60–89 Days
Past Due
| | 90 Days or
Greater
| | Total Past
Due
| | Current
| | Total Finance
Receivables(1)
|
|---|
| | | | | | | | | | | | | | | | | | | | | | | | | | |
| | | | | | | | | | | | | | | | | | | | | | | | | | |
Corporate Finance – Other | | | | $ | – | | | $ | 0.3 | | | $ | 4.0 | | | $ | 4.3 | | | $ | 7,541.0 | | | $ | 7,545.3 | |
| | | | | 18.0 | | | | 2.9 | | | | 12.5 | | | | 33.4 | | | | 651.0 | | | | 684.4 | |
| | | | | 4.0 | | | | 0.9 | | | | 0.7 | | | | 5.6 | | | | 1,847.6 | | | | 1,853.2 | |
| | | | | 79.3 | | | | 3.4 | | | | 5.6 | | | | 88.3 | | | | 2,217.0 | | | | 2,305.3 | |
| | | | | 56.1 | | | | 18.0 | | | | 12.4 | | | | 86.5 | | | | 2,370.4 | | | | 2,456.9 | |
Vendor Finance – International | | | | | 55.2 | | | | 12.3 | | | | 8.2 | | | | 75.7 | | | | 2,530.6 | | | | 2,606.3 | |
| | | | | 212.6 | | | | 37.8 | | | | 43.4 | | | | 293.8 | | | | 17,157.6 | | | | 17,451.4 | |
| | | | | 135.2 | | | | 80.8 | | | | 231.7 | | | | 447.7 | | | | 3,251.3 | | | | 3,699.0 | |
| | | | $ | 347.8 | | | $ | 118.6 | | | $ | 275.1 | | | $ | 741.5 | | | $ | 20,408.9 | | | $ | 21,150.4 | |
| | | | | | | | | | | | | | | | | | | | | | | | | | |
| | | | | | | | | | | | | | | | | | | | | | | | | | |
Corporate Finance – Other | | | | $ | 5.9 | | | $ | 2.5 | | | $ | 35.6 | | | $ | 44.0 | | | $ | 6,234.5 | | | $ | 6,278.5 | |
| | | | | 7.7 | | | | 7.2 | | | | 27.7 | | | | 42.6 | | | | 750.7 | | | | 793.3 | |
| | | | | 1.8 | | | | 3.4 | | | | 0.7 | | | | 5.9 | | | | 1,481.1 | | | | 1,487.0 | |
| | | | | 60.8 | | | | 2.3 | | | | 1.2 | | | | 64.3 | | | | 2,367.1 | | | | 2,431.4 | |
| | | | | 47.7 | | | | 18.9 | | | | 15.7 | | | | 82.3 | | | | 2,302.8 | | | | 2,385.1 | |
Vendor Finance – International | | | | | 15.7 | | | | 6.0 | | | | 5.6 | | | | 27.3 | | | | 2,245.8 | | | | 2,273.1 | |
| | | | | 139.6 | | | | 40.3 | | | | 86.5 | | | | 266.4 | | | | 15,382.0 | | | | 15,648.4 | |
| | | | | 246.0 | | | | 123.0 | | | | 395.1 | | | | 764.1 | | | | 5,581.4 | | | | 6,345.5 | |
| | | | $ | 385.6 | | | $ | 163.3 | | | $ | 481.6 | | | $ | 1,030.5 | | | $ | 20,963.4 | | | $ | 21,993.9 | |
(1) | | Balances include $302.8 million and $2,088.0 million of loans in Assets Held for Sale at December 31, 2012 and December 31, 2011, respectively. In addition to finance receivables, Assets Held for Sale on the balance sheet also include operating lease equipment held for sale, which are not included in the above table. |
Item 8: Financial Statements and Supplementary Data
106 CIT ANNUAL REPORT 2012
CIT GROUP AND SUBSIDIARIES — NOTES TO CONSOLIDATED FINANCIAL STATEMENTS
The following table sets forth non-accrual loans and assets received in satisfaction of loans (repossessed assets). Non-accrual loans include loans greater than $500,000 that are individually evaluated and determined to be impaired, as well as loans less than $500,000 that are delinquent (generally for more than 90 days).
Finance Receivables on Non-accrual Status (dollars in millions)
| | | | December 31, 2012
| | December 31, 2011
| |
|---|
| | | | Held for
Investment
| | Held for
Sale
| | Total
| | Held for
Investment
| | Held for
Sale
| | Total
|
|---|
| | | | | | | | | | | | | | | | | | | | | | | | | | |
Corporate Finance – Other | | | | $ | 148.6 | | | $ | 0.3 | | | $ | 148.9 | | | $ | 225.7 | | | $ | 130.7 | | | $ | 356.4 | |
| | | | | 60.3 | | | | 2.7 | | | | 63.0 | | | | 132.0 | | | | 9.5 | | | | 141.5 | |
| | | | | 40.5 | | | | – | | | | 40.5 | | | | 45.0 | | | | – | | | | 45.0 | |
| | | | | 6.0 | | | | – | | | | 6.0 | | | | 75.3 | | | | – | | | | 75.3 | |
| | | | | 45.5 | | | | – | | | | 45.5 | | | | 55.3 | | | | – | | | | 55.3 | |
Vendor Finance – International | | | | | 24.3 | | | | 2.0 | | | | 26.3 | | | | 25.6 | | | | 2.0 | | | | 27.6 | |
| | | | | – | | | | 1.6 | | | | 1.6 | | | | 0.2 | | | | 0.7 | | | | 0.9 | |
| | | | $ | 325.2 | | | $ | 6.6 | | | $ | 331.8 | | | $ | 559.1 | | | $ | 142.9 | | | $ | 702.0 | |
| | | | | | | | | | | | | 9.9 | | | | | | | | | | | | 9.5 | |
Total non-performing assets | | | | | | | | | | | | $ | 341.7 | | | | | | | | | | | $ | 711.5 | |
Accruing loans past due 90 days or more | | | | | | | | | | | | | | | | | | | | | | | | | | |
Government guaranteed – Consumer | | | | | | | | | | | | $ | 231.4 | | | | | | | | | | | $ | 390.3 | |
| | | | | | | | | | | | | 3.4 | | | | | | | | | | | | 2.2 | |
| | | | | | | | | | | | $ | 234.8 | | | | | | | | | | | $ | 392.5 | |
| | | | | | | | | | | | | | | | | | | | | | | | | | |
Payments received on non-accrual financing receivables are generally applied against outstanding principal, though in certain instances where the remaining recorded investment is deemed fully collectible, interest income is recognized on a cash basis.
Impaired Loans
The Company’s policy is to review for impairment finance receivables greater than $500,000 that are on non-accrual status. Consumer loans and small-ticket loan and lease receivables that have not been modified in a troubled debt restructuring, as well as short-term factoring receivables, are included (if appropriate) in the reported non-accrual balances above, but are excluded from the impaired finance receivables disclosure below as charge-offs are typically determined and recorded for such loans when they are more than 120-150 days past due.
The following table contains information about impaired finance receivables and the related allowance for loan losses, exclusive of finance receivables that were identified as impaired at the Convenience Date for which the Company is applying the income recognition and disclosure guidance in ASC 310-30 (Loans and Debt Securities Acquired with Deteriorated Credit Quality), which are disclosed further below in this note.
CIT ANNUAL REPORT 2012 107
CIT GROUP AND SUBSIDIARIES — NOTES TO CONSOLIDATED FINANCIAL STATEMENTS
Impaired Loans at or for the year ended December 31, 2012 (dollars in millions)
| | | | Recorded
Investment
| | Unpaid
Principal
Balance
| | Related
Allowance
| | Average
Recorded
Investment
|
|---|
With no related allowance recorded: | | | | | | | | | | | | | | | | | | |
| | | | | | | | | | | | | | | | | | |
Corporate Finance – Other | | | | $ | 179.9 | | | $ | 231.9 | | | $ | – | | | $ | 199.8 | |
| | | | | 39.1 | | | | 52.6 | | | | – | | | | 40.7 | |
| | | | | 11.3 | | | | 29.1 | | | | – | | | | 7.8 | |
| | | | | 10.1 | | | | 13.3 | | | | – | | | | 29.7 | |
| | | | | 4.7 | | | | 12.2 | | | | – | | | | 7.7 | |
Vendor Finance – International | | | | | 8.4 | | | | 20.0 | | | | – | | | | 9.7 | |
With an allowance recorded: | | | | | | | | | | | | | | | | | | |
| | | | | | | | | | | | | | | | | | |
Corporate Finance – Other | | | | | 102.4 | | | | 106.7 | | | | 32.3 | | | | 111.0 | |
| | | | | 2.4 | | | | 2.7 | | | | 1.0 | | | | 10.4 | |
| | | | | 29.1 | | | | 29.3 | | | | 8.9 | | | | 29.0 | |
| | | | | 6.0 | | | | 6.0 | | | | 1.3 | | | | 12.2 | |
Total Commercial Impaired Loans(1) | | | | | 393.4 | | | | 503.8 | | | | 43.5 | | | | 458.0 | |
Total Loans Impaired at Convenience Date(2) | | | | | 106.7 | | | | 260.8 | | | | 1.5 | | | | 147.4 | |
| | | | $ | 500.1 | | | $ | 764.6 | | | $ | 45.0 | | | $ | 605.4 | |
(1) | | Interest income recorded for the year ended December 31, 2012 while the loans were impaired was $22.6 million of which $4.3 million was interest recognized using cash-basis method of accounting. |
(2) | | Details of finance receivables that were identified as impaired at the Convenience date are presented under Loans and Debt Securities Acquired with Deteriorated Credit Quality. |
Impaired Loans at or for the year ended December 31, 2011 (dollars in millions)
| | | | Recorded
Investment
| | Unpaid
Principal
Balance
| | Related
Allowance
| | Average
Recorded
Investment
|
|---|
With no related allowance recorded: | | | | | | | | | | | | | | | | | | |
| | | | | | | | | | | | | | | | | | |
Corporate Finance – Other | | | | $ | 197.0 | | | $ | 298.7 | | | $ | – | | | $ | 160.6 | |
| | | | | 38.3 | | | | 70.7 | | | | – | | | | 41.3 | |
| | | | | 4.6 | | | | 6.0 | | | | – | | | | 7.5 | |
| | | | | 60.1 | | | | 72.2 | | | | – | | | | 73.7 | |
| | | | | 10.5 | | | | 24.6 | | | | – | | | | 16.9 | |
Vendor Finance – International | | | | | 8.0 | | | | 20.7 | | | | – | | | | 11.6 | |
With an allowance recorded: | | | | | | | | | | | | | | | | | | |
| | | | | | | | | | | | | | | | | | |
Corporate Finance – Other | | | | | 101.0 | | | | 112.0 | | | | 31.7 | | | | 109.5 | |
| | | | | 31.9 | | | | 34.7 | | | | 7.4 | | | | 43.9 | |
| | | | | 41.0 | | | | 52.1 | | | | 9.0 | | | | 49.8 | |
| | | | | 15.1 | | | | 18.0 | | | | 5.3 | | | | 25.9 | |
Total Commercial Impaired Loans(1) | | | | | 507.5 | | | | 709.7 | | | | 53.4 | | | | 540.7 | |
Total Loans Impaired at Convenience date(2) | | | | | 186.7 | | | | 605.4 | | | | 5.4 | | | | 418.3 | |
| | | | $ | 694.2 | | | $ | 1,315.1 | | | $ | 58.8 | | | $ | 959.0 | |
(1) | | Interest income recorded while the loans were impaired was not material for the year ended December 31, 2011. |
(2) | | Details of finance receivables that were identified as impaired at the Convenience date are presented under Loans and Debt Securities Acquired with Deteriorated Credit Quality. |
Item 8: Financial Statements and Supplementary Data
108 CIT ANNUAL REPORT 2012
CIT GROUP AND SUBSIDIARIES — NOTES TO CONSOLIDATED FINANCIAL STATEMENTS
Impairment occurs when, based on current information and events, it is probable that CIT will be unable to collect all amounts due according to contractual terms of the agreement. The Company has established review and monitoring procedures designed to identify, as early as possible, customers that are experiencing financial difficulty. Credit risk is captured and analyzed based on the Company’s internal probability of obligor default (PD) and loss given default (LGD) ratings. A PD rating is determined by evaluating borrower credit-worthiness, including analyzing credit history, financial condition, cash flow adequacy, financial performance and management quality. An LGD rating is predicated on transaction structure, collateral valuation and related guarantees or recourse. Further, related considerations in determining probability of collection include the following:
| - | | Instances where the primary source of payment is no longer sufficient to repay the loan in accordance with terms of the loan document; |
| - | | Lack of current financial data related to the borrower or guarantor; |
| - | | Delinquency status of the loan; |
| - | | Borrowers experiencing problems, such as operating losses, marginal working capital, inadequate cash flow or business interruptions; |
| - | | Loans secured by collateral that is not readily marketable or that is susceptible to deterioration in realizable value; and |
| - | | Loans to borrowers in industries or countries experiencing economic instability. |
Impairment is measured as the shortfall between estimated value and recorded investment in the finance receivable. A specific allowance or charge-off is recorded for the shortfall. In instances where the estimated value exceeds the recorded investment, no specific allowance is recorded. The estimated value is determined using fair value of collateral and other cash flows if the finance receivable is collateralized, or the present value of expected future cash flows discounted at the contract’s effective interest rate. In instances when the Company measures impairment based on the present value of expected future cash flows, the change in present value is reported in the provision for credit losses.
The following summarizes key elements of the Company’s policy regarding the determination of collateral fair value in the measurement of impairment:
| - | | “Orderly liquidation value” is the basis for collateral valuation; |
| - | | Appraisals are updated annually or more often as market conditions warrant; or |
| - | | Appraisal values are discounted in the determination of impairment if the: |
| - | | appraisal does not reflect current market conditions; or |
| - | | collateral consists of inventory, accounts receivable, or other forms of collateral, which may become difficult to locate, collect or subject to pilferage in a liquidation. |
Loans and Debt Securities Acquired with Deteriorated Credit Quality
For purposes of this presentation, finance receivables that were identified as impaired at the Convenience Date are presented separately below. The Company is applying the income recognition and disclosure guidance in ASC 310-30 (Loans and Debt Securities Acquired with Deteriorated Credit Quality) to loans considered impaired under FSA at the time of emergence.
Loans Acquired with Deteriorated Credit Quality(dollars in millions)
| | | | December 31, 2012(1)
| | December 31, 2011(1)
| |
|---|
| | | | Carrying
Amount
| | Outstanding
Balance(2)
| | Allowance
| | Carrying
Amount
| | Outstanding
Balance(2)
| | Allowance
|
|---|
| | | | $ | 106.7 | | | $ | 260.8 | | | $ | 1.5 | | | $ | 185.6 | | | $ | 599.0 | | | $ | 5.4 | |
| | | | | – | | | | – | | | | – | | | | 1.1 | | | | 6.4 | | | | – | |
| | | | $ | 106.7 | | | $ | 260.8 | | | $ | 1.5 | | | $ | 186.7 | | | $ | 605.4 | | | $ | 5.4 | |
| | | | Year Ended December 31, 2012
| | Year Ended December 31, 2011
| |
|---|
| | | | Provision for
Credit Losses
| | Net
Charge-offs
(Recoveries)
| | Provision for
Credit Losses
| | Net
Charge-offs
(Recoveries)
|
|---|
| | | | $ | (4.5 | ) | | $ | (0.6 | ) | | $ | 48.4 | | | $ | 97.9 | |
| | | �� | | 0.3 | | | | 0.3 | | | | (0.3 | ) | | | (0.3 | ) |
| | | | $ | (4.2 | ) | | $ | (0.3 | ) | | $ | 48.1 | | | $ | 97.6 | |
(1) | | The table excludes amounts in Assets Held for Sale with a carrying amount of $3 million and $117 million at December 31, 2012 and December 31, 2011, respectively, and outstanding balances of $16 million and $286 million, respectively. |
(2) | | Represents the sum of contractual principal, interest and fees earned at the reporting date, calculated as pre-FSA net investment plus inception to date charge-offs. |
The following table presents the changes to the accretable discount related to all loans accounted for under ASC 310-30 (loans acquired with deteriorated credit quality).
Accretable Discount Activity for Loans Accounted for Under ASC 310-30 at Emergence Date (dollars in millions):
| | | | Years Ended December 31,
| |
|---|
| | | | 2012
| | 2011
|
|---|
Accretable discount, beginning of period | | | | $ | 80.0 | | | $ | 207.2 | |
| | | | | (8.6 | ) | | | (42.0 | ) |
| | | | | (53.5 | ) | | | (85.2 | ) |
Accretable discount, end of period | | | | $ | 17.9 | | | $ | 80.0 | |
(1) | | Amounts include transfers of non-accretable to accretable discounts, which were not material for the years ended December 31, 2012 and 2011. |
CIT ANNUAL REPORT 2012 109
CIT GROUP AND SUBSIDIARIES — NOTES TO CONSOLIDATED FINANCIAL STATEMENTS
Troubled Debt Restructurings
The Company periodically modifies the terms of finance receivables in response to borrowers’ difficulties. Modifications that include a financial concession to the borrower are accounted for as troubled debt restructurings (TDRs).
CIT uses a consistent methodology across all loans to determine if a modification is with a borrower that has been determined to be in financial difficulty and was granted a concession. Specifically, the Company’s policies on TDR identification include the following examples of indicators used to determine whether the borrower is in financial difficulty:
| - | | Borrower has declared bankruptcy |
| - | | Growing doubt about the borrower’s ability to continue as a going concern |
| - | | Borrower has insufficient cash flow to service debt |
| - | | Borrower is de-listing securities |
| - | | Borrower’s inability to obtain funds from other sources |
| - | | Breach of financial covenants by the borrower |
If the borrower is determined to be in financial difficulty, then CIT utilizes the following criteria to determine whether a concession has been granted to the borrower:
| - | | Assets used to satisfy debt are less than CIT’s recorded investment in the receivable |
| - | | Modification of terms – interest rate changed to below market rate |
| - | | Maturity date extension at an interest rate less than market rate |
| - | | The borrower does not otherwise have access to funding for debt with similar risk characteristics in the market at the restructured rate and terms |
| - | | Capitalization of interest |
| - | | Increase in interest reserves |
| - | | Conversion of credit to Payment-In-Kind (PIK) |
| - | | Delaying principal and/or interest for a period of three months or more |
| - | | Partial forgiveness of the balance |
Modified loans that are classified as TDRs are individually evaluated and measured for impairment. Modified loans that meet the definition of a TDR are subject to the Company’s standard impaired loan policy, namely that non-accrual loans in excess of $500,000 are individually reviewed for impairment, while non-accrual loans less than $500,000 are considered as part of homogenous pools and are included in the determination of the non-specific allowance.
The recorded investment of TDRs at December 31, 2012 and 2011 was $289.1 million and $445.2 million, of which 29% and 63%, respectively, were on non-accrual. Corporate Finance receivables accounted for 91% and 88% of the total TDRs at December 31, 2012 and 2011, respectively. At December 31, 2012 and 2011, there were $6.3 million and $27.8 million, respectively, of commitments to lend additional funds to borrowers whose loan terms have been modified in TDRs.
The tables that follow present additional information related to modifications qualifying as TDRs that occurred during the years ended December 31, 2012 and 2011.
Recorded investment of TDRs that occurred during the year ended December 31, 2012 and 2011(dollars in millions)
| | | | Years Ended December 31,
| |
|---|
| | | | 2012
| | 2011
|
|---|
| | | | | | | | | | |
Corporate Finance – Other | | | | $ | 31.4 | | | $ | 223.5 | |
| | | | | 15.1 | | | | 11.8 | |
| | | | | – | | | | 19.8 | |
| | | | | – | | | | 17.9 | |
| | | | | 2.1 | | | | 3.0 | |
Vendor Finance – International | | | | | 1.3 | | | | 0.9 | |
| | | | $ | 49.9 | | | $ | 276.9 | |
Recorded investment of TDRs that experience a payment default(1) at the time of default, in the period presented, and for which the payment default occurred within one year of the modification(dollars in millions)
| | | | Years Ended December 31,
| |
|---|
| | | | 2012
| | 2011
|
|---|
| | | | | | | | | | |
Corporate Finance – Other | | | | $ | 0.2 | | | $ | 12.7 | |
| | | | | 3.9 | | | | 9.6 | |
| | | | | – | | | | 25.3 | |
| | | | | 0.2 | | | | 1.4 | |
Vendor Finance – International | | | | | 0.1 | | | | 1.0 | |
| | | | $ | 4.4 | | | $ | 50.0 | |
(1) | | Payment default in the table above is one missed payment. |
Item 8: Financial Statements and Supplementary Data
110 CIT ANNUAL REPORT 2012
CIT GROUP AND SUBSIDIARIES — NOTES TO CONSOLIDATED FINANCIAL STATEMENTS
The financial impact of the various modification strategies that the Company employs in response to borrower difficulties is described below. While the discussion focuses on current year amounts, the overall nature of the modification programs were comparable in the prior year.
| - | | The nature of modifications qualifying as TDR’s, based upon recorded investment at December 31, 2012, was payment deferral of 86%, covenant relief and/or other of 8%, interest rate reductions and debt forgiveness of 6%; |
| - | | Payment deferrals, the Company’s most common type of modification program, result in lower net present value of cash flows and increased provision for credit losses to the extent applicable. The financial impact of these modifications is not significant given the reduction to recorded investment balances from FSA discount and the moderate length of deferral periods; |
| - | | Interest rate reductions result in lower amounts of interest being charged to the customer, but are a relatively small part of the Company’s restructuring programs. Additionally, in some instances, modifications improve the Company’s economic return through increased interest rates and fees, but are reported as TDRs due to assessments regarding the borrowers’ ability to independently obtain similar funding in the market and assessments of the relationship between modified rates and terms and comparable market rates and terms. The weighted average change in interest rates for all TDRs occurring during the year ended 2012 was immaterial; |
| - | | Debt forgiveness, or the reduction in amount owed by borrower, results in incremental provision for credit losses, in the form of higher charge-offs. While these types of modifications have the greatest individual impact on the allowance, the combined financial impact for TDRs occurring during 2012 approximated $1.4 million, as debt forgiveness is a relatively small component of the Company’s modification programs; and |
| - | | The other elements of the Company’s modification programs do not have a significant impact on financial results given their relative size, or do not have a direct financial impact as in the case of covenant changes. |
NOTE 3 — ALLOWANCE FOR LOAN LOSSES
The following table presents changes in the allowance for loan losses.
Allowance for Loan Losses and Recorded Investment in Finance Receivables
As of or for the Years Ended December 31, (dollars in millions)
| | | | 2012
| |
|---|
| | | | Corporate
Finance
| | Transportation
Finance
| | Trade
Finance
| | Vendor
Finance
| | Total
Commercial
| | Consumer
| | Total
|
|---|
| | | | $ | 262.2 | | | $ | 29.3 | | | $ | 29.0 | | | $ | 87.3 | | | $ | 407.8 | | | $ | – | | | $ | 407.8 | |
Provision for credit losses | | | | | 7.3 | | | | 18.0 | | | | (0.9 | ) | | | 26.5 | | | | 50.9 | | | | 0.7 | | | | 51.6 | |
| | | | | (7.2 | ) | | | 0.7 | | | | 0.1 | | | | 0.7 | | | | (5.7 | ) | | | (0.2 | ) | | | (5.9 | ) |
| | | | | (52.7 | ) | | | (11.7 | ) | | | (8.6 | ) | | | (67.8 | ) | | | (140.8 | ) | | | (1.0 | ) | | | (141.8 | ) |
| | | | | 20.3 | | | | – | | | | 7.8 | | | | 39.0 | | | | 67.1 | | | | 0.5 | | | | 67.6 | |
Allowance balance – end of period | | | | $ | 229.9 | | | $ | 36.3 | | | $ | 27.4 | | | $ | 85.7 | | | $ | 379.3 | | | $ | – | | | $ | 379.3 | |
| | | | | | | | | | | | | | | | | | | | | | | | | | | | | | |
Loans individually evaluated for impairment | | | | $ | 33.3 | | | $ | 8.9 | | | $ | 1.3 | | | $ | – | | | $ | 43.5 | | | $ | – | | | $ | 43.5 | |
Loans collectively evaluated for impairment | | | | | 195.7 | | | | 27.4 | | | | 26.1 | | | | 85.1 | | | | 334.3 | | | | – | | | | 334.3 | |
Loans acquired with deteriorated credit quality(3) | | | | | 0.9 | | | | – | | | | – | | | | 0.6 | | | | 1.5 | | | | – | | | | 1.5 | |
Allowance balance – end of period | | | | $ | 229.9 | | | $ | 36.3 | | | $ | 27.4 | | | $ | 85.7 | | | $ | 379.3 | | | $ | – | | | $ | 379.3 | |
| | | | $ | 16.4 | | | $ | 0.6 | | | $ | 6.0 | | | $ | – | | | $ | 23.0 | | | $ | 0.2 | | | $ | 23.2 | |
| | | | | | | | | | | | | | | | | | | | | | | | | | | | | | |
Loans individually evaluated for impairment | | | | $ | 323.8 | | | $ | 40.4 | | | $ | 16.1 | | | $ | 13.1 | | | $ | 393.4 | | | $ | – | | | $ | 393.4 | |
Loans collectively evaluated for impairment | | | | | 7,751.2 | | | | 1,812.8 | | | | 2,289.2 | | | | 4,796.9 | | | | 16,650.1 | | | | 3,697.4 | | | | 20,347.5 | |
Loans acquired with deteriorated credit quality(3) | | | | | 98.0 | | | | – | | | | – | | | | 8.7 | | | | 106.7 | | | | – | | | | 106.7 | |
| | | | $ | 8,173.0 | | | $ | 1,853.2 | | | $ | 2,305.3 | | | $ | 4,818.7 | | | $ | 17,150.2 | | | $ | 3,697.4 | | | $ | 20,847.6 | |
Percent of loans to total loans | | | | | 39.2 | % | | | 8.9 | % | | | 11.1 | % | | | 23.1 | % | | | 82.3 | % | | | 17.7 | % | | | 100.0 | % |
CIT ANNUAL REPORT 2012 111
CIT GROUP AND SUBSIDIARIES — NOTES TO CONSOLIDATED FINANCIAL STATEMENTS
| | | | 2011
| |
|---|
| | | | Corporate
Finance
| | Transportation
Finance
| | Trade
Finance
| | Vendor
Finance
| | Total
Commercial
| | Consumer
| | Total
|
|---|
| | | | $ | 304.0 | | | $ | 23.7 | | | $ | 29.9 | | | $ | 58.6 | | | $ | 416.2 | | | $ | – | | | $ | 416.2 | |
Provision for credit losses | | | | | 173.3 | | | | 12.8 | | | | 11.2 | | | | 69.3 | | | | 266.6 | | | | 3.1 | | | | 269.7 | |
| | | | | (9.0 | ) | | | (0.7 | ) | | | (1.9 | ) | | | (1.3 | ) | | | (12.9 | ) | | | – | | | | (12.9 | ) |
| | | | | (239.6 | ) | | | (6.6 | ) | | | (21.1 | ) | | | (97.2 | ) | | | (364.5 | ) | | | (4.3 | ) | | | (368.8 | ) |
| | | | | 33.5 | | | | 0.1 | | | | 10.9 | | | | 57.9 | | | | 102.4 | | | | 1.2 | | | | 103.6 | |
Allowance balance – end of period | | | | $ | 262.2 | | | $ | 29.3 | | | $ | 29.0 | | | $ | 87.3 | | | $ | 407.8 | | | $ | – | | | $ | 407.8 | |
| | | | | | | | | | | | | | | | | | | | | | | | | | | | | | |
Loans individually evaluated for impairment | | | | $ | 39.1 | | | $ | 9.0 | | | $ | 5.3 | | | $ | – | | | $ | 53.4 | | | $ | – | | | $ | 53.4 | |
Loans collectively evaluated for impairment | | | | | 219.3 | | | | 20.3 | | | | 23.7 | | | | 85.7 | | | | 349.0 | | | | – | | | | 349.0 | |
Loans acquired with deteriorated credit quality(3) | | | | | 3.8 | | | | – | | | | – | | | | 1.6 | | | | 5.4 | | | | – | | | | 5.4 | |
Allowance balance – end of period | | | | $ | 262.2 | | | $ | 29.3 | | | $ | 29.0 | | | $ | 87.3 | | | $ | 407.8 | | | $ | – | | | $ | 407.8 | |
| | | | $ | 14.6 | | | $ | 1.3 | | | $ | 6.1 | | | $ | – | | | $ | 22.0 | | | $ | – | | | $ | 22.0 | |
| | | | | | | | | | | | | | | | | | | | | | | | | | | | | | |
Loans individually evaluated for impairment | | | | $ | 368.2 | | | $ | 45.6 | | | $ | 75.2 | | | $ | 18.5 | | | $ | 507.5 | | | $ | – | | | $ | 507.5 | |
Loans collectively evaluated for impairment | | | | | 6,334.9 | | | | 1,441.4 | | | | 2,356.2 | | | | 4,397.5 | | | | 14,530.0 | | | | 4,681.7 | | | | 19,211.7 | |
Loans acquired with deteriorated credit quality(3) | | | | | 159.6 | | | | – | | | | – | | | | 26.0 | | | | 185.6 | | | | 1.1 | | | | 186.7 | |
| | | | $ | 6,862.7 | | | $ | 1,487.0 | | | $ | 2,431.4 | | | $ | 4,442.0 | | | $ | 15,223.1 | | | $ | 4,682.8 | | | $ | 19,905.9 | |
Percent of loans to total loans | | | | | 34.5 | % | | | 7.5 | % | | | 12.2 | % | | | 22.3 | % | | | 76.5 | % | | | 23.5 | % | | | 100.0 | % |
(1) | | “Other reserves” represents additional credit loss reserves for unfunded lending commitments, letters of credit and for deferred purchase agreements, all of which is recorded in Other Liabilities. “Other” also includes changes relating to sales and foreign currency translations. |
(2) | | Gross charge-offs included $38 million and $178 million that were charged directly to the Allowance for loan losses for the year ended December 31, 2012 and 2011, respectively. In 2012, Corporate Finance totaled $28 million, Transportation Finance $8 million and Trade Finance $2 million. In 2011, Corporate Finance totaled $154 million, Trade Finance $18 million and remainder was from Transportation Finance. |
(3) | | Represents loans considered impaired in FSA and are accounted for under the guidance in ASC 310-30 (Loans and Debt Securities Acquired with Deteriorated Credit Quality). |
NOTE 4 — OPERATING LEASE EQUIPMENT
The following table provides the net book value (net of accumulated depreciation of $1.2 billion at December 31, 2012 and $0.9 billion at December 31, 2011) of operating lease equipment, by equipment type
Operating Lease Equipment(dollars in millions)
| | | | December 31, 2012
| | December 31, 2011
|
|---|
Commercial aircraft (including regional aircraft) | | | | $ | 8,061.4 | | | $ | 8,180.7 | |
| | | | | 4,053.1 | | | | 3,498.8 | |
| | | | | 81.0 | | | | 87.0 | |
| | | | | 61.5 | | | | 69.5 | |
| | | | | 154.7 | | | | 170.4 | |
| | | | $ | 12,411.7 | | | $ | 12,006.4 | |
(1) | | Includes equipment off-lease of $202.5 million and $169.4 million at December 31, 2012 and 2011, respectively, primarily consisting of rail and aerospace assets. |
Item 8: Financial Statements and Supplementary Data
112 CIT ANNUAL REPORT 2012
CIT GROUP AND SUBSIDIARIES — NOTES TO CONSOLIDATED FINANCIAL STATEMENTS
The following table presents future minimum lease rentals due on non-cancelable operating leases at December 31, 2012. Excluded from this table are variable rentals calculated on asset usage levels, re-leasing rentals, and expected sales proceeds from remarketing equipment at lease expiration, all of which are components of operating lease profitability.
Minimum Lease Rentals Due(dollars in millions)
| | | | $ | 1,582.3 | |
| | | | | 1,314.2 | |
| | | | | 1,066.6 | |
| | | | | 853.0 | |
| | | | | 607.4 | |
| | | | | 1,431.8 | |
| | | | $ | 6,855.3 | |
NOTE 5 — INVESTMENT SECURITIES
Investments include debt and equity securities. The Company’s debt securities primarily include U.S. Treasury securities, U.S. Government Agency securities and Canadian Government securities that typically mature in 91 days or less, and the carrying value approximates fair value. Equity securities include common stock and warrants.
Investment Securities (dollars in millions)
| | | | December 31, 2012
| | December 31, 2011
|
|---|
Debt securities available-for-sale | | | | $ | 767.6 | | | $ | 937.2 | |
Equity securities available-for-sale | | | | | 14.3 | | | | 16.9 | |
Debt securities held-to-maturity(1) | | | | | 188.4 | | | | 211.3 | |
Non-marketable equity investments(2) | | | | | 95.2 | | | | 92.4 | |
Total investment securities | | | | $ | 1,065.5 | | | $ | 1,257.8 | |
(1) | | Recorded at amortized cost less impairment on securities that have credit-related impairment. |
(2) | | Non-marketable equity investments include $27.6 million and $23.0 million in limited partnerships at December 31, 2012 and 2011, respectively, accounted for under the equity method. The remaining investments are carried at cost and include qualified Community Reinvestment Act (CRA) investments, equity fund holdings and shares issued by customers during loan work out situations or as part of an original loan investment. |
Debt and equity securities are classified as available-for-sale (“AFS”) or held-to-maturity (“HTM”) based on management’s intention on the date of purchase and assessed at each reporting date. Debt securities classified as held-to-maturity represent securities that the Company has both the ability and intent to hold until maturity, and are carried at amortized cost.
Debt securities and equity securities classified as available-for-sale are carried at fair value with changes in fair value reported in other comprehensive income (“OCI”), net of applicable income taxes.
Non-marketable equity investments include ownership interests greater than 3% in limited partnership investments that are accounted for under the equity method. Equity method investments are recorded at cost, adjusted to reflect the Company’s portion of income, loss or dividends of the investee. All other non-marketable equity investments are carried at cost and periodically assessed for other-than-temporary impairment (“OTTI”).
The Company conducts and documents periodic reviews of all securities with unrealized losses to evaluate whether the impairment is OTTI. For debt securities classified as held-to-maturity that are considered to have OTTI that the Company does not intend to sell and it is more likely than not that the Company will not be required to sell before recovery, the OTTI is separated into an amount representing the credit loss, which is recognized in other income in the Consolidated Statement of Operations, and the amount related to all other factors, which is recognized in OCI. OTTI on debt securities and equity securities classified as available-for-sale and non-marketable equity investments are recognized in the Consolidated Statement of Operations in the period determined.
In addition, the Company maintained $6.4 billion and $7.0 billion of interest bearing deposits at December 31, 2012 and 2011, respectively, that are cash equivalents and are classified separately on the balance sheet.
CIT ANNUAL REPORT 2012 113
CIT GROUP AND SUBSIDIARIES — NOTES TO CONSOLIDATED FINANCIAL STATEMENTS
The following table presents interest and dividends on interest bearing deposits and investments:
Interest and Dividend Income (dollars in millions)
| | | | Year Ended December 31,
| |
|---|
| | | | 2012
| | 2011
| | 2010
|
|---|
Interest income – interest bearing deposits | | | | $ | 21.8 | | | $ | 24.2 | | | $ | 19.6 | |
Interest income – investments | | | | | 7.8 | | | | 9.3 | | | | 9.3 | |
| | | | | 2.7 | | | | 1.3 | | | | 2.8 | |
Total interest and dividends | | | | $ | 32.3 | | | $ | 34.8 | | | $ | 31.7 | |
Realized investment gains totaled $40.4 million, $53.9 million and $30.1 million for the years ended December 31, 2012, 2011 and 2010, respectively, and exclude losses from OTTI. OTTI credit-related impairments on equity securities recognized in earnings were not material for the year ended December 31, 2012 and totaled $8.2 million and $11.2 million for years ended December 31, 2011 and 2010, respectively. Impairment amounts in accumulated other comprehensive income (“AOCI”) were not material at December 31, 2012 or December 31, 2011.
Securities Available-for-Sale
The following table presents amortized cost and fair value of securities AFS at December 31, 2012 and 2011.
Securities AFS – Amortized Cost and Fair Value (dollars in millions)
| | | | Amortized
Cost
| | Gross
Unrealized
Gains
| | Gross
Unrealized
Losses
| | Fair
Value
|
|---|
|
| | | | | | | | | | | | | | | | | | |
| | | | $ | 750.3 | | | $ | – | | | $ | – | | | $ | 750.3 | |
Brazilian Government Treasuries | | | | | 17.3 | | | | – | | | | – | | | | 17.3 | |
Total debt securities AFS | | | | | 767.6 | | | | – | | | | – | | | | 767.6 | |
| | | | | 13.1 | | | | 1.2 | | | | – | | | | 14.3 | |
| | | | $ | 780.7 | | | $ | 1.2 | | | $ | – | | | $ | 781.9 | |
| | | | | | | | | | | | | | | | | | |
|
| | | | $ | 166.7 | | | $ | – | | | $ | – | | | $ | 166.7 | |
U.S. Government Agency Obligations | | | | | 672.7 | | | | – | | | | – | | | | 672.7 | |
Canadian Government Treasuries | | | | | 97.8 | | | | – | | | | – | | | | 97.8 | |
Total debt securities AFS | | | | | 937.2 | | | | – | | | | – | | | | 937.2 | |
| | | | | 15.5 | | | | 1.4 | | | | – | | | | 16.9 | |
| | | | $ | 952.7 | | | $ | 1.4 | | | $ | – | | | $ | 954.1 | |
Item 8: Financial Statements and Supplementary Data
114 CIT ANNUAL REPORT 2012
CIT GROUP AND SUBSIDIARIES — NOTES TO CONSOLIDATED FINANCIAL STATEMENTS
Debt Securities Held-to-Maturity
The carrying value and fair value of securities HTM at December 31, 2012 and December 31, 2011 were as follows:
Debt Securities HTM – Carrying Value and Fair Value (dollars in millions)
| | | | Carrying
Value
| | Gross
Unrecognized
Gains
| | Gross
Unrecognized
Losses
| | Fair
Value
|
|---|
|
Mortgage-backed securities |
U.S. government-sponsored agency guaranteed | | | | $ | 96.5 | | | $ | 2.8 | | | $ | – | | | $ | 99.3 | |
| | | | | 13.1 | | | | – | | | | – | | | | 13.1 | |
| | | | | 28.4 | | | | – | | | | – | | | | 28.4 | |
| | | | | 50.4 | | | | – | | | | – | | | | 50.4 | |
Total debt securities held-to-maturity | | | | $ | 188.4 | | | $ | 2.8 | | | $ | – | | | $ | 191.2 | |
| | | | | | | | | | | | | | | | | | |
U.S. Treasury and federal agency securities |
U.S. Government Agency Obligations | | | | $ | 92.5 | | | $ | – | | | $ | (1.1 | ) | | $ | 91.4 | |
Mortgage-backed securities |
U.S. government-sponsored agency guaranteed | | | | | 49.8 | | | | 3.2 | | | | – | | | | 53.0 | |
| | | | | 0.4 | | | | – | | | | – | | | | 0.4 | |
| | | | | 19.6 | | | | – | | | | – | | | | 19.6 | |
| | | | | 49.0 | | | | – | | | | – | | | | 49.0 | |
Total debt securities held-to-maturity | | | | $ | 211.3 | | | $ | 3.2 | | | $ | (1.1 | ) | | $ | 213.4 | |
The following table presents the amortized cost and fair value of debt securities HTM by contractual maturity dates:
Securities Held To Maturity – Amortized Cost and Fair Value Maturities (dollars in millions)
| | | | December 31, 2012
| | December 31, 2011
| |
|---|
| | | | Carrying
Cost
| | Fair
Value
| | Carrying
Cost
| | Fair
Value
|
|---|
Mortgage-backed securities(1) |
Total – Due after 10 years(2) | | | | $ | 96.5 | | | $ | 99.3 | | | $ | 49.8 | | | $ | 53.0 | |
U.S. Treasury and federal agency securities |
Total – Due within 1 year | | | | | – | | | | – | | | | 92.5 | | | | 91.4 | |
|
Due after 1 but within 5 years | | | | | 4.9 | | | | 4.9 | | | | 0.3 | | | | 0.3 | |
Due after 5 but within 10 years | | | | | 1.4 | | | | 1.4 | | | | 0.1 | | | | 0.1 | |
| | | | | 6.8 | | | | 6.8 | | | | – | | | | – | |
| | | | | 13.1 | | | | 13.1 | | | | 0.4 | | | | 0.4 | |
| | | | | | | | | | | | | | | | | | |
| | | | | 25.5 | | | | 25.4 | | | | 16.8 | | | | 16.8 | |
Due after 1 but within 5 years | | | | | 2.9 | | | | 3.0 | | | | 2.8 | | | | 2.8 | |
| | | | | 28.4 | | | | 28.4 | | | | 19.6 | | | | 19.6 | |
| | | | | | | | | | | | | | | | | | |
Total – Due after 5 but within 10 years | | | | | 50.4 | | | | 50.4 | | | | 49.0 | | | | 49.0 | |
Total debt securities held-to-maturity | | | | $ | 188.4 | | | $ | 191.2 | | | $ | 211.3 | | | $ | 213.4 | |
(1) | | Includes mortgage-backed securities of U.S. federal agencies. |
(2) | | Investments with no stated maturities are included as contractual maturities of greater than 10 years. Actual maturities may differ due to call or prepayment rights. |
CIT ANNUAL REPORT 2012 115
CIT GROUP AND SUBSIDIARIES — NOTES TO CONSOLIDATED FINANCIAL STATEMENTS
NOTE 6 — OTHER ASSETS
The following table presents the components of other assets.
Other Assets (dollars in millions)
| | | | December 31, 2012
| | December 31, 2011
|
|---|
Deposits on commercial aerospace equipment | | | | $ | 615.3 | | | $ | 463.7 | |
Deferred debt costs and other deferred charges | | | | | 172.2 | | | | 124.2 | |
Other counterparty receivables | | | | | 115.7 | | | | 94.1 | |
Executive retirement plan and deferred compensation | | | | | 109.7 | | | | 110.2 | |
Accrued interest and dividends | | | | | 93.9 | | | | 143.8 | |
Tax receivables, other than income taxes | | | | | 81.7 | | | | 57.5 | |
| | | | | 75.4 | | | | 79.5 | |
| | | | | 73.8 | | | | 84.3 | |
| | | | | 225.8 | | | | 392.9 | |
| | | | $ | 1,563.5 | | | $ | 1,550.2 | |
(1) | | Other includes investments in and receivables from non-consolidated entities, deferred federal and state tax assets, servicing assets, and other miscellaneous assets. |
NOTE 7 — DEPOSITS
The following table presents deposits detail, maturities and weighted average interest rates.
Deposits(dollars in millions)
| | | | December 31, 2012
| | December 31, 2011
|
|---|
| | | | $ | 9,684.5 | | | $ | 6,193.7 | |
Weighted average contractual interest rate | | | | | 1.75 | % | | | 2.68 | % |
Weighted average number of days to maturity | | | | | 725 days | | | | 813 days | |
Contractual Maturities and Rates | | | | | | | | | | |
| | | | $ | 4,997.9 | | | | | |
| | | | | 1,948.4 | | | | | |
| | | | | 825.7 | | | | | |
| | | | | 562.4 | | | | | |
| | | | | 851.1 | | | | | |
| | | | | 495.5 | | | | | |
Deposits outstanding, excluding fresh start adjustments | | | | $ | 9,681.0 | | | | | |
(1) | | Includes deposit accounts with no stated maturity.
|
| | | | Years Ended December 31,
| |
|---|
| | | | 2012
| | 2011
|
|---|
| | | | $ | 7,699.6 | | | | 4,712.3 | |
Maximum amount outstanding | | | | | 9,690.7 | | | | 6,181.1 | |
Weighted average contractual interest rate for the year | | | | | 1.98 | % | | | 2.79 | % |
Item 8: Financial Statements and Supplementary Data
116 CIT ANNUAL REPORT 2012
CIT GROUP AND SUBSIDIARIES — NOTES TO CONSOLIDATED FINANCIAL STATEMENTS
The following table presents the maturity profile of certificates of deposits with a denomination of $100,000 or more at December 31.
Certificates of Deposit $100,000 or More(dollars in millions)
| | | | At December 31,
| |
|---|
| | | | 2012
| | 2011
|
|---|
| | | | | | | | | | |
| | | | $ | 241.6 | | | $ | – | |
After three months through six months | | | | | 234.6 | | | | – | |
After six months through twelve months | | | | | 619.8 | | | | 127.3 | |
| | | | | 1,119.3 | | | | 138.5 | |
| | | | $ | 2,215.3 | | | $ | 265.8 | |
| | | | $ | 98.6 | | | $ | 101.4 | |
Deposits were adjusted to estimated fair value at December 31, 2009 in FSA, and the net fair value premium will be recognized as a yield adjustment over the deposit lives. During 2012 and 2011, $3.5 million and $24.0 million, respectively of the fair value premium was recognized as a reduction to Interest Expense.
NOTE 8 — LONG-TERM BORROWINGS
The following table presents outstanding long-term borrowings, net of FSA.
Long-term Borrowings(dollars in millions)
| | | | December 31, 2012
| | December 31, 2011
| |
|---|
| | | | CIT Group Inc.
| | Subsidiaries
| | Total
| | Total
|
|---|
|
| | | | $ | 5,250.0 | | | $ | – | | | $ | 5,250.0 | | | $ | – | |
| | | | | 6,500.0 | | | | – | | | | 6,500.0 | | | | – | |
| | | | | 72.6 | | | | 1.4 | | | | 74.0 | | | | – | |
| | | | $ | 11,822.6 | | | $ | 1.4 | | | $ | 11,824.0 | | | | – | |
| | | | | | | | | | | | | | | | | | |
| | | | $ | – | | | $ | 10,137.8 | | | $ | 10,137.8 | | | $ | 10,427.6 | |
| | | | | – | | | | – | | | | – | | | | 5,834.8 | |
Series C 7% Notes (exchanged) | | | | | – | | | | – | | | | – | | | | 7,959.2 | |
| | | | | – | | | | – | | | | – | | | | 2,000.0 | |
| | | | | – | | | | – | | | | – | | | | 86.1 | |
| | | | | – | | | | 10,137.8 | | | | 10,137.8 | | | | 26,307.7 | |
Total Long-term Borrowings | | | | $ | 11,822.6 | | | $ | 10,139.2 | | | $ | 21,961.8 | | | $ | 26,307.7 | |
(1) | | The previously secured Revolving Credit Facility, Series C Notes and Other Debt became unsecured upon full redemption of Series A Notes on March 9, 2012. |
CIT ANNUAL REPORT 2012 117
CIT GROUP AND SUBSIDIARIES — NOTES TO CONSOLIDATED FINANCIAL STATEMENTS
Upon emergence from bankruptcy in December 2009, all components of long-term borrowings were fair valued in FSA. The fair value adjustment is amortized as a cost adjustment over the remaining term of the respective debt and is reflected in Interest Expense. The following table summarizes contractual maturities of total long-term borrowings outstanding excluding issue discounts and FSA adjustments as of December 31, 2012:
Contractual Maturities – Long-term Borrowings (dollars in millions)
| | | | 2013
| | 2014
| | 2015
| | 2016
| | 2017
| | Thereafter
| | Contractual
Maturities
|
|---|
| | | | $ | 1,424.7 | | | $ | 1,500.4 | | | $ | 1,043.4 | | | $ | 865.8 | | | $ | 673.5 | | | $ | 4,964.3 | | | $ | 10,472.1 | |
| | | | | – | | | | 1,300.0 | | | | 1,500.0 | | | | – | | | | – | | | | 2,450.0 | | | | 5,250.0 | |
| | | | | – | | | | – | | | | – | | | | – | | | | 3,000.0 | | | | 3,500.0 | | | | 6,500.0 | |
| | | | | 1.2 | | | | 0.2 | | | | – | | | | – | | | | – | | | | 111.9 | | | | 113.3 | |
| | | | $ | 1,425.9 | | | $ | 2,800.6 | | | $ | 2,543.4 | | | $ | 865.8 | | | $ | 3,673.5 | | | $ | 11,026.2 | | | $ | 22,335.4 | |
(1) | | The presented balances are contractual and do not reflect the impact of FSA. Upon emergence from bankruptcy in December 2009, all components of long-term borrowings were fair valued in FSA. The fair value adjustment is amortized as a cost adjustment over the remaining term of the respective debt and is reflected in Interest Expense. |
Unsecured
As a result of redeeming the remaining Series A Notes during the 2012 first quarter, the Revolving Credit Facility and all of our Series C Notes became unsecured.
Revolving Credit Facility
On August 25, 2011, CIT and certain of its subsidiaries entered into a Revolving Credit and Guaranty Agreement, (the “Revolving Credit Facility”). The total commitment amount under the Revolving Credit Facility is $2 billion, consisting of a $1.65 billion revolving loan tranche and a $350 million revolving loan tranche that can also be utilized for issuance of letters of credit. The Revolving Credit Facility matures on August 14, 2015 and accrues interest at a per annum rate of LIBOR plus a margin of 2.00% to 2.75% (with no floor) or Base Rate plus a margin of 1.00% to 1.75% (with no floor). The applicable margin is determined by reference to the long-term senior unsecured, non-credit enhanced debt rating of the Company by S&P and Moody’s effective at relevant times during the life of the Revolving Credit Facility. The applicable margin for LIBOR loans is 2.50% and the applicable margin for Base Rate loans is 1.50% at December 31, 2012.
The Revolving Credit Facility may be drawn and repaid from time to time at the option of CIT. The amount available to draw upon at December 31, 2012 was approximately $1.9 billion. The unutilized portion of any commitment under the Revolving Credit Facility may be reduced permanently or terminated by CIT at any time without penalty.
Once the Company redeemed all the remaining Series A Notes during the 2012 first quarter, all the collateral and subsidiary guarantees under the Revolving Credit Facility were released, except for subsidiary guarantees from eight of the Company’s domestic operating subsidiaries (“Continuing Guarantors”). Once the Revolving Credit Facility became unsecured, the collateral coverage covenant was replaced by an asset coverage covenant (based on the book value of eligible assets of the Continuing Guarantors) of 2.0x the sum of: (i) the committed facility size and (ii) all outstanding indebtedness (including, without duplication, guarantees of such indebtedness) for borrowed money (excluding subordinated intercompany indebtedness) of the Continuing Guarantors, tested monthly and upon certain dispositions or encumbrances of eligible assets of the Continuing Guarantors.
The Revolving Credit Facility is also subject to a $6 billion minimum consolidated net worth covenant of the Company, tested quarterly, and limits the Company’s ability to create liens, merge or consolidate, sell, transfer, lease or dispose of all or substantially all of its assets, grant a negative pledge or make certain restricted payments during the occurrence and continuance of an event of default.
Senior Unsecured Notes
In March 2012, CIT filed a “shelf” registration statement. The following table presents issuances of Senior Unsecured Notes:
Senior Unsecured Notes(dollars in millions)
Date of Issuance
| | | | Rate (%)
| | Maturity
| | Par Value
|
|---|
| | | | | 5.250 | % | | | | $ | 1,500.0 | |
| | | | | 5.000 | % | | | | | 1,250.0 | |
| | | | | 5.375 | % | | | | | 750.0 | |
| | | | | 4.250 | % | | | | | 1,750.0 | |
| | | | | 5.000 | % | | | | | 1,250.0 | |
Weighted Average and Total | | | | | 4.90 | % | | | | $ | 6,500.0 | |
The proceeds of these transactions were used in conjunction with available cash, to redeem the 7% Series C Notes in 2012. These senior unsecured notes rank equal in right of payment with the Series C Notes and the Revolving Credit Facility.
Item 8: Financial Statements and Supplementary Data
118 CIT ANNUAL REPORT 2012
CIT GROUP AND SUBSIDIARIES — NOTES TO CONSOLIDATED FINANCIAL STATEMENTS
Series C Notes
The following table presents issuances of Series C Unsecured Notes:
Series C Notes(dollars in millions)
Date of Issuance
| | | | Rate (%)
| | Maturity
| | Par Value
|
|---|
| | | | | 5.250 | % | | | | $ | 1,300.0 | |
| | | | | 6.625 | % | | | | | 700.0 | |
| | | | | 4.750 | % | | | | | 1,500.0 | |
| | | | | 5.500 | % | | | | | 1,750.0 | |
Weighted Average and Total | | | | | 5.37 | % | | | | $ | 5,250.0 | |
The proceeds of the 2012 transaction were used, in conjunction with available cash, to redeem the remaining Series A Notes in March 2012.
The Indentures for the Series C Notes limit the Company’s ability to create liens, merge or consolidate, or sell, transfer, lease or dispose of all or substantially all of its assets. Upon a Change of Control Triggering Event as defined in the Series C Indentures, holders of the Series C Notes will have the right to require the Company, as applicable, to repurchase all or a portion of the Series C Notes at a purchase price equal to 101% of the principal amount, plus accrued and unpaid interest to the date of such repurchase.
At December 31, 2012, the secured borrowings had a weighted average interest rate of 2.32%, which ranged from 0.32% to 8.60% with maturities ranging from 2013 through 2043. Set forth below are borrowings and pledged assets primarily owned by consolidated variable interest entities. Creditors of these entities received ownership and/or security interests in the assets. These entities are intended to be bankruptcy remote so that such assets are not available to creditors of CIT or any affiliates of CIT until and unless the related secured borrowings have been fully discharged. These transactions do not meet accounting requirements for sales treatment and are recorded as secured borrowings. Except as otherwise noted, pledged assets listed in the following table as of December 31, 2011 were not included in the collateral available to lenders under the Revolving Credit Facility or the Series A or C Notes. At December 31, 2012, the Revolving Credit Facility and Series C Notes were unsecured and there were no Series A Notes outstanding.
Secured Borrowings and Pledged Assets Summary (dollars in millions)
| | | | December 31, 2012
| | December 31, 2011(3)
| |
|---|
| | | | Secured
Borrowing
| | Pledged
Assets
| | Secured
Borrowing
| | Pledged
Assets
|
|---|
Education trusts and conduits (student loans) | | | | $ | 2,692.0 | | | $ | 2,757.6 | | | $ | 3,445.8 | | | $ | 3,772.4 | |
GSI Facilities borrowings(1) | | | | | 1,167.3 | | | | 1,430.7 | | | | 1,257.7 | | | | 2,174.8 | |
| | | | | 350.8 | | | | 1,523.6 | | | | 483.1 | | | | 1,405.6 | |
| | | | | 238.1 | | | | 283.3 | | | | 250.4 | | | | 300.2 | |
Corporate finance – Commercial Loans | | | | | 467.4 | | | | 491.8 | | | | 467.4 | | | | 486.5 | |
Equipment Secured Facilities – U.S. Vendor | | | | | 574.6 | | | | 765.4 | | | | 823.9 | | | | 1,069.3 | |
Equipment Secured Facilities – International Vendor | | | | | 1,028.4 | | | | 1,182.9 | | | | 392.1 | | | | 559.4 | |
Subtotal – Finance Receivables | | | | | 6,518.6 | | | | 8,435.3 | | | | 7,120.4 | | | | 9,768.2 | |
Transportation Finance – Aircraft(2) | | | | | 2,131.4 | | | | 2,891.3 | | | | 1,861.0 | | | | 2,425.5 | |
Transportation Finance – Rail | | | | | 312.9 | | | | 281.8 | | | | 195.1 | | | | 194.1 | |
GSI Facilities borrowings (Aircraft and Rail)(1) | | | | | 1,092.8 | | | | 2,061.0 | | | | 1,151.4 | | | | 2,084.0 | |
Subtotal – Equipment under operating leases | | | | | 3,537.1 | | | | 5,234.1 | | | | 3,207.5 | | | | 4,703.6 | |
FHLB borrowings (Consumer) | | | | | 31.7 | | | | 32.9 | | | | 50.7 | | | | 92.5 | |
| | | | | 50.4 | | | | 50.4 | | | | 49.0 | | | | 49.0 | |
| | | | | 82.1 | | | | 83.3 | | | | 99.7 | | | | 141.5 | |
| | | | $ | 10,137.8 | | | $ | 13,752.7 | | | $ | 10,427.6 | | | $ | 14,613.3 | |
(1) | | At December 31, 2012, GSI Facilities borrowings were secured by $1.0 billion of student loans, $313.5 million of corporate loans, $102.0 million of small business lending loans, and $1.2 billion and $903.3 million of aircraft and railcar assets, respectively, on operating leases. The GSI Facilities are described in Note 9 — Derivative Financial Instruments. |
(2) | | Secured financing facilities for the purchase of aircraft. |
(3) | | Pledged Assets as of December 31, 2011 has been conformed to current presentation, which includes restricted cash and investments. |
CIT ANNUAL REPORT 2012 119
CIT GROUP AND SUBSIDIARIES — NOTES TO CONSOLIDATED FINANCIAL STATEMENTS
Series A 7% Notes and Series C 7% Notes
During 2012, CIT redeemed the remaining $6.5 billion of Series A 7% Notes and redeemed or repurchased the $8.76 billion of Series C 7% Notes. These actions resulted in the acceleration of $1.3 billion of FSA discount accretion that was recorded as additional interest expense and also resulted in a loss on debt extinguishments of $61 million.
Variable Interest Entities (“VIEs”)
The Company utilizes VIEs in the ordinary course of business to support its own and its customers’ financing needs.
The most significant types of VIEs that CIT utilizes are ‘on balance sheet’ secured financings of pools of leases and loans originated by the Company. The Company originates pools of assets and sells these to special purpose entities (“SPE’s”), which, in turn, issue debt instruments backed by the asset pools or sell individual interests in the assets to investors. CIT retains the servicing rights and participates in certain cash flows. These VIEs are typically organized as trusts or limited liability companies, and are intended to be bankruptcy remote, from a legal standpoint.
The main risks inherent in these secured borrowing structures are deterioration in the credit performance of the vehicle’s underlying asset portfolio and risk associated with the servicing of the underlying assets.
Investors typically have recourse to the assets in the VIEs and may benefit from other credit enhancements, such as: (1) a reserve or cash collateral account that requires the Company to deposit cash in an account, which will first be used to cover any defaulted obligor payments, (2) over-collateralization in the form of excess assets in the VIE, or (3) subordination, whereby the Company retains a subordinate position in the secured borrowing which would absorb losses due to defaulted obligor payments before the senior certificate holders. The VIE may also enter into derivative contracts in order to convert the debt issued by the VIEs to match the underlying assets or to limit or change the risk of the VIE.
With respect to events or circumstances that could expose CIT to a loss, as these are accounted for as on balance sheet secured financings, the Company records an allowance for loan losses for the credit risks associated with the underlying leases and loans. As these are secured borrowings, CIT has an obligation to pay the debt in accordance with the terms of the underlying agreements.
Generally, third-party investors in the obligations of the consolidated VIE’s have legal recourse only to the assets of the VIEs and do not have recourse to the Company beyond certain specific provisions that are customary for secured financing transactions, such as asset repurchase obligations for breaches of representations and warranties. In addition, the assets are generally restricted only to pay such liabilities.
NOTE 9 — DERIVATIVE FINANCIAL INSTRUMENTS
As part of managing economic risk and exposure to interest rate and foreign currency risk, the Company enters into derivative transactions in over-the-counter markets with other financial institutions. The Company does not enter into derivative financial instruments for speculative purposes.
SeeNote 1 — Business and Summary of Significant Accounting Policies for further description of its derivative transaction policies.
The following table presents fair values and notional values of derivative financial instruments:
Fair and Notional Values of Derivative Financial Instruments(1) (dollars in millions)
| | | | December 31, 2012
| | December 31, 2011
| |
|---|
| | | | Notional
Amount
| | Asset Fair
Value
| | Liability
Fair Value
| | Notional
Amount
| | Asset Fair
Value
| | Liability
Fair Value
|
|---|
|
Cross currency swaps – net investment hedges | | | | $ | 151.2 | | | $ | – | | | $ | (6.1 | ) | | $ | 406.2 | | | $ | 1.0 | | | $ | (3.3 | ) |
Foreign currency forward contracts – cash flow hedges | | | | | 10.6 | | | | – | | | | (0.9 | ) | | | 146.7 | | | | 6.9 | | | | (0.2 | ) |
Foreign currency forward contracts – net investment hedges | | | | | 1,192.6 | | | | 1.9 | | | | (31.5 | ) | | | 1,387.0 | | | | 31.0 | | | | (11.4 | ) |
| | | | $ | 1,354.4 | | | $ | 1.9 | | | $ | (38.5 | ) | | $ | 1,939.9 | | | $ | 38.9 | | | $ | (14.9 | ) |
|
| | | | $ | 551.5 | | | $ | 1.7 | | | $ | (11.0 | ) | | $ | 668.5 | | | $ | 6.1 | | | $ | (4.5 | ) |
| | | | | 809.6 | | | | 0.6 | | | | (39.3 | ) | | | 848.4 | | | | 0.9 | | | | (42.0 | ) |
| | | | | 251.4 | | | | – | | | | (0.1 | ) | | | 114.1 | | | | – | | | | (0.1 | ) |
| | | | | 502.7 | | | | 0.3 | | | | – | | | | 913.3 | | | | 1.0 | | | | – | |
Foreign currency forward contracts | | | | | 1,828.2 | | | | 5.7 | | | | (25.7 | ) | | | 2,662.9 | | | | 34.4 | | | | (19.6 | ) |
| | | | | 106.6 | | | | – | | | | (5.8 | ) | | | 70.1 | | | | – | | | | – | |
| | | | | 1.0 | | | | 0.1 | | | | – | | | | 1.0 | | | | 0.4 | | | | – | |
Total Non-qualifying Hedges | | | | $ | 4,051.0 | | | $ | 8.4 | | | $ | (81.9 | ) | | $ | 5,278.3 | | | $ | 42.8 | | | $ | (66.2 | ) |
(1) | | Presented on a gross basis |
(2) | | Non-qualifying hedges notional amount includes $23.5 million forward-starting customer interest rate swaps, which become effective on September 30, 2013. |
Item 8: Financial Statements and Supplementary Data
120 CIT ANNUAL REPORT 2012
CIT GROUP AND SUBSIDIARIES — NOTES TO CONSOLIDATED FINANCIAL STATEMENTS
Total Return Swaps (“TRS”)
Two financing facilities with Goldman Sachs International (GSI) are structured as total return swaps (TRS), under which amounts available for advances are accounted for as derivatives. Pursuant to applicable accounting guidance, only the unutilized portion of the TRS is accounted for as a derivative and recorded at its estimated fair value.
On October 26, 2011, CIT Group Inc. (“CIT”) amended its existing $2.125 billion total return swap facility between CIT Financial Ltd. (“CFL”) and Goldman Sachs International (“GSI”) in order to provide greater flexibility for certain assets to be funded under the facility. The size of the existing CFL facility was reduced to $1.5 billion, and the $625 million formerly available under the existing CFL facility was transferred to a new total return swap facility between GSI and CIT TRS Funding B.V. (“BV”), a wholly-owned subsidiary of CIT.
The aggregate “notional amounts” of the total return swaps of $106.6 million at December 31, 2012 and $70.1 million at December 31, 2011 represent the aggregate unused portions under the CFL and BV facilities and constitute derivative financial instruments. These notional amounts are calculated as the maximum aggregate facility commitment amounts, currently $2,125.0 million, less the aggregate actual adjusted qualifying borrowing base outstanding of $2,018.4 million at December 31, 2012 and $2,054.9 million at December 31, 2011 under the CFL and BV facilities. The notional amounts of the derivatives will increase as the adjusted qualifying borrowing base decreases due to repayment of the underlying asset-backed securities (ABS) to investors. If CIT funds additional ABS under the CFL or BV facilities, the aggregate adjusted qualifying borrowing base of the total return swaps will increase and the notional amount of the derivatives will decrease accordingly.
Valuation of the derivatives related to the GSI facilities is based on several factors using a discounted cash flow (DCF) methodology, including:
| - | | CIT’s funding costs for similar financings based on current market conditions; |
| - | | Forecasted usage of the long-dated CFL and BV facilities through the final maturity date in 2028; and |
| - | | Forecasted amortization, including prepayment assumptions, due to principal payments on the underlying ABS, which impacts the amount of the unutilized portion. |
Based on the Company’s valuation, a liability of $5.8 million was recorded at December 31, 2012.
The following table presents the impact of derivatives on the statements of operations:
Derivative Instrument Gains and Losses (dollars in millions)
| | | | | | Years Ended December 31,
| |
|---|
Derivative Instruments
| | | | Gain / (Loss) Recognized
| | 2012
| | 2011
| | 2010
|
|---|
| | | | | | | | | | | | | | | | |
Foreign currency forward contracts – cash flow hedges | | | | | | $ | 1.1 | | | $ | (0.9 | ) | | $ | 8.1 | |
| | | | | | | | | | | | | | | | |
| | | | | | $ | (10.5 | ) | | $ | 29.2 | | | $ | (8.1 | ) |
| | | | | | | 0.5 | | | | (15.5 | ) | | | (48.2 | ) |
Foreign currency forward contracts | | | | | | | (23.7 | ) | | | 30.0 | | | | 41.4 | |
| | | | | | | (0.3 | ) | | | (0.8 | ) | | | 5.8 | |
| | | | | | | (5.8 | ) | | | – | | | | – | |
Total Non-qualifying Hedges | | | | | | $ | (39.8 | ) | | $ | 42.9 | | | $ | (9.1 | ) |
Total derivatives-income statement impact | | | | | | $ | (38.7 | ) | | $ | 42.0 | | | $ | (1.0 | ) |
CIT ANNUAL REPORT 2012 121
CIT GROUP AND SUBSIDIARIES — NOTES TO CONSOLIDATED FINANCIAL STATEMENTS
The following table presents the changes in AOCI relating to derivatives:
Changes in AOCI Relating to Derivatives (dollars in millions)
Contract Type
| | | | Derivatives –
effective
portion
reclassified
from AOCI
to income
| | Hedge
ineffectiveness
recorded
directly to
income
| | Total
income
statement
impact
| | Derivatives –
effective
portion
recorded
in OCI
| | Total change in
OCI for period
|
|---|
Year Ended December 31, 2012
| | | | | | | | | | | | | | | | | | | | | | |
Cross currency swaps – net investment hedges | | | | $ | – | | | $ | – | | | $ | – | | | $ | (12.9 | ) | | $ | (12.9 | ) |
Foreign currency forward contracts – cash flow hedges | | | | | 1.1 | | | | – | | | | 1.1 | | | | 1.7 | | | | 0.6 | |
Foreign currency forward contracts – net investment hedges | | | | | – | | | | – | | | | – | | | | (55.4 | ) | | | (55.4 | ) |
| | | | $ | 1.1 | | | | – | | | $ | 1.1 | | | $ | (66.6 | ) | | $ | (67.7 | ) |
Year Ended December 31, 2011 | | | | | | | | | | | | | | | | | | | | | | |
Cross currency swaps – net investment hedges | | | | $ | – | | | $ | – | | | $ | – | | | $ | 9.0 | | | $ | 9.0 | |
Foreign currency forward contracts – cash flow hedges | | | | | (0.9 | ) | | | – | | | | (0.9 | ) | | | 0.1 | | | | 1.0 | |
Foreign currency forward contracts – net investment hedges | | | | | – | | | | – | | | | – | | | | 36.0 | | | | 36.0 | |
| | | | $ | (0.9 | ) | | $ | – | | | $ | (0.9 | ) | | $ | 45.1 | | | $ | 46.0 | |
Year Ended December 31, 2010 | | | | | | | | | | | | | | | | | | | | | | |
Cross currency swaps – net investment hedges | | | | $ | – | | | $ | – | | | $ | – | | | $ | (9.8 | ) | | $ | (9.8 | ) |
Foreign currency forward contracts – cash flow hedges | | | | | 8.1 | | | | – | | | | 8.1 | | | | 6.4 | | | | (1.7 | ) |
Foreign currency forward contracts – net investment hedges | | | | | – | | | | – | | | | – | | | | (65.4 | ) | | | (65.4 | ) |
| | | | $ | 8.1 | | | $ | – | | | $ | 8.1 | | | $ | (68.8 | ) | | $ | (76.9 | ) |
Estimated amount of net losses on cash flow hedges recorded in AOCI at December 31, 2012 expected to be recognized in income over the next 12 months is $0.1 million.
NOTE 10 — OTHER LIABILITIES
The following table presents components of other liabilities:
Other Liabilities (dollars in millions)
| | | | December 31, 2012
| | December 31, 2011
|
|---|
Equipment maintenance reserves | | | | $ | 850.0 | | | $ | 690.6 | |
| | | | | 440.3 | | | | 491.7 | |
| | | | | 236.9 | | | | 189.9 | |
Security and other deposits | | | | | 231.6 | | | | 199.8 | |
Valuation adjustment relating to aerospace commitments(1) | | | | | 188.1 | | | | 252.8 | |
Current taxes payable and deferred taxes | | | | | 185.5 | | | | 38.7 | |
| | | | | 129.9 | | | | 161.8 | |
| | | | | 425.5 | | | | 558.9 | |
| | | | $ | 2,687.8 | | | $ | 2,584.2 | |
(1) | | In conjunction with FSA, a liability was recorded to reflect the current fair value of aircraft purchase commitments outstanding at the time. When the aircraft are purchased, the cost basis of the assets is reduced by the associated liability. |
(2) | | Other liabilities consist of other taxes, property tax reserves and other miscellaneous liabilities. |
Item 8: Financial Statements and Supplementary Data
122 CIT ANNUAL REPORT 2012
CIT GROUP AND SUBSIDIARIES — NOTES TO CONSOLIDATED FINANCIAL STATEMENTS
NOTE 11 — FAIR VALUE
The Company is required to report fair value measurements for specified classes of assets and liabilities. SeeNote 1 — “Business and Summary of Significant Accounting Policies” for fair value measurement policy.
The Company characterizes inputs in the determination of fair value according to the fair value hierarchy. The fair value of the Company’s assets and liabilities where the measurement objective specifically requires the use of fair value are set forth in the tables below:
Assets and Liabilities Measured at Fair Value on a Recurring Basis (dollars in millions)
| | | | Total
| | Level 1
| | Level 2
| | Level 3
|
|---|
| | | | | | | | | | | | | | | | | | |
| | | | | | | | | | | | | | | | | | |
| | | | $ | 767.6 | | | $ | 17.3 | | | $ | 750.3 | | | $ | – | |
| | | | | 14.3 | | | | 14.3 | | | | – | | | | – | |
Trading assets at fair value – derivatives | | | | | 8.4 | | | | – | | | | 8.4 | | | | – | |
Derivative counterparty assets at fair value | | | | | 1.9 | | | | – | | | | 1.9 | | | | – | |
| | | | $ | 792.2 | | | $ | 31.6 | | | $ | 760.6 | | | $ | – | |
| | | | | | | | | | | | | | | | | | |
Trading liabilities at fair value – derivatives | | | | $ | (81.9 | ) | | $ | – | | | $ | (81.9 | ) | | $ | – | |
Derivative counterparty liabilities at fair value | | | | | (38.5 | ) | | | – | | | | (38.5 | ) | | | – | |
| | | | $ | (120.4 | ) | | $ | – | | | $ | (120.4 | ) | | $ | – | |
| | | | | | | | | | | | | | | | | | |
| | | | | | | | | | | | | | | | | | |
| | | | $ | 937.2 | | | $ | – | | | $ | 937.2 | | | $ | – | |
| | | | | 16.9 | | | | 14.0 | | | | 2.9 | | | | – | |
Trading assets at fair value – derivatives | | | | | 42.8 | | | | – | | | | 42.8 | | | | – | |
Derivative counterparty assets at fair value | | | | | 38.9 | | | | – | | | | 38.9 | | | | – | |
| | | | $ | 1,035.8 | | | $ | 14.0 | | | $ | 1,021.8 | | | $ | – | |
| | | | | | | | | | | | | | | | | | |
Trading liabilities at fair value – derivatives | | | | $ | (66.2 | ) | | $ | – | | | $ | (66.2 | ) | | $ | – | |
Derivative counterparty liabilities at fair value | | | | | (14.9 | ) | | | – | | | | (14.9 | ) | | | – | |
| | | | $ | (81.1 | ) | | $ | – | | | $ | (81.1 | ) | | $ | – | |
The following table presents financial instruments for which a non-recurring change in fair value has been recorded:
Assets Measured at Fair Value on a Non-recurring Basis (dollars in millions)
| | | | | | Fair Value Measurements at Reporting Date Using:
| |
|---|
| | | | Total
| | Level 1
| | Level 2
| | Level 3
| | Total Gains
and (Losses)
|
|---|
| | | | | | | | | | | | | | | | | | | | | | |
| | | | | | | | | | | | | | | | | | | | | | |
| | | | $ | 296.7 | | | $ | – | | | $ | – | | | $ | 296.7 | | | $ | (106.9 | ) |
| | | | | 61.0 | | | | – | | | | – | | | | 61.0 | | | | (40.9 | ) |
| | | | $ | 357.7 | | | $ | – | | | $ | – | | | $ | 357.7 | | | $ | (147.8 | ) |
| | | | | | | | | | | | | | | | | | | | | | |
| | | | $ | 1,830.8 | | | $ | – | | | $ | – | | | $ | 1,830.8 | | | $ | (60.7 | ) |
| | | | | 101.5 | | | | – | | | | – | | | | 101.5 | | | | (33.7 | ) |
| | | | $ | 1,932.3 | | | $ | – | | | $ | – | | | $ | 1,932.3 | | | $ | (94.4 | ) |
Loans are transferred from HFI to HFS at the lower of cost or fair value. At the time of transfer, a write-down of the loan is recorded as a charge-off, if applicable. Once classified as HFS, the amount by which the carrying value exceeds fair value is recorded as a valuation allowance.
Impaired finance receivables (including loans or capital leases) of $500 thousand or greater that are placed on non-accrual status are subject to periodic individual review in conjunction with the Company’s ongoing problem loan management (PLM) function. Impairment occurs when, based on current information and
CIT ANNUAL REPORT 2012 123
CIT GROUP AND SUBSIDIARIES — NOTES TO CONSOLIDATED FINANCIAL STATEMENTS
events, it is probable that CIT will be unable to collect all amounts due according to contractual terms of the agreement. Impairment is measured as the shortfall between estimated value and recorded investment in the finance receivable, with the estimated value determined using fair value of collateral and other cash flows if the finance receivable is collateralized, or the present value of expected future cash flows discounted at the contract’s effective interest rate.
Level 3 Gains and Losses
Changes in Fair Value of Level 3 Financial Assets and Liabilities Measured on a Recurring Basis(dollars in millions)
| | | | Total
| | Derivatives
| | Equity
Securities
Available
for Sale
|
|---|
| | | | $ | 17.6 | | | $ | (0.3 | ) | | $ | 17.9 | |
Gains or losses realized/unrealized | | | | | | | | | | | | | | |
| | | | | 5.7 | | | | 0.3 | | | | 5.4 | |
| | | | | (23.3 | ) | | | – | | | | (23.3 | ) |
| | | | $ | – | | | $ | – | | | $ | – | |
Gains or losses realized/unrealized | | | | | | | | | | | | | | |
Included in Other Income(1) | | | | $ | 5.8 | | | $ | 5.8 | | | $ | – | |
| | | | | – | | | | – | | | | – | |
| | | | $ | 5.8 | | | $ | 5.8 | | | $ | – | |
(1) | | Valuation of the derivatives related to the GSI facilities |
FAIR VALUE OF FINANCIAL INSTRUMENTS
The carrying and estimated fair values of financial instruments presented below exclude leases and certain other assets and liabilities, which are not required for disclosure. Assumptions used in valuing financial instruments at December 31, 2012 are disclosed below.
Financial Instruments(dollars in millions)
| | | | December 31, 2012
| | December 31, 2011
| |
|---|
| | | | Carrying
Value
| | Estimated
Fair Value
| | Carrying
Value
| | Estimated
Fair Value
|
|---|
| | | | | | | | | | | | | | | | | | |
Trading assets at fair value – derivatives | | | | $ | 8.4 | | | $ | 8.4 | | | $ | 42.8 | | | $ | 42.8 | |
Derivative counterparty assets at fair value | | | | | 1.9 | | | | 1.9 | | | | 38.9 | | | | 38.9 | |
Assets held for sale (excluding leases) | | | | | 58.3 | | | | 61.9 | | | | 1,871.8 | | | | 2,024.3 | |
| | | | | 15,685.0 | | | | 15,919.9 | | | | 14,927.4 | | | | 15,153.9 | |
| | | | | 1,065.5 | | | | 1,068.3 | | | | 1,250.6 | | | | 1,252.7 | |
Other assets subject to fair value disclosure and unsecured counterparty receivables(1) | | | | | 1,084.0 | | | | 1,084.0 | | | | 1,299.8 | | | | 1,299.8 | |
| | | | | | | | | | | | | | | | | | |
| | | | $ | (9,721.8 | ) | | $ | (9,931.8 | ) | | $ | (6,227.5 | ) | | $ | (6,283.8 | ) |
Trading liabilities at fair value – derivatives | | | | | (81.9 | ) | | | (81.9 | ) | | | (66.2 | ) | | | (66.2 | ) |
Derivative counterparty liabilities at fair value | | | | | (38.5 | ) | | | (38.5 | ) | | | (14.9 | ) | | | (14.9 | ) |
| | | | | (22,161.4 | ) | | | (23,180.8 | ) | | | (26,444.2 | ) | | | (27,840.1 | ) |
Other liabilities subject to fair value disclosure(3) | | | | | (1,953.1 | ) | | | (1,953.1 | ) | | | (1,999.9 | ) | | | (1,999.9 | ) |
(1) | | Other assets subject to fair value disclosure primarily include accrued interest receivable and miscellaneous receivables. These assets have carrying values that approximate fair value generally due to the short-term nature and are classified as Level 3. The unsecured counterparty receivables primarily consist of amounts owed to CIT from GSI for debt discount, return of collateral posted to GSI and settlements resulting from market value changes to asset-backed securities underlying the GSI Facilities. |
(2) | | Deposits and long-term borrowings include accrued interest, which is included in “Other liabilities” in the Balance Sheet. |
(3) | | Other liabilities subject to fair value disclosure include accounts payable, accrued liabilities, customer security and maintenance deposits and miscellaneous liabilities. The fair value of these approximates carrying value and are classified as Level 3. |
Item 8: Financial Statements and Supplementary Data
124 CIT ANNUAL REPORT 2012
CIT GROUP AND SUBSIDIARIES — NOTES TO CONSOLIDATED FINANCIAL STATEMENTS
Assumptions used in 2012 to value financial instruments are set forth below:
Derivatives – The estimated fair values of derivatives were calculated internally using observable market data and represent the net amount receivable or payable to terminate, taking into account current market rates, which represent Level 2 inputs. SeeNote 9 — Derivative Financial Instruments for notional principal amounts and fair values.
Investment Securities – Debt and equity securities classified as AFS are carried at fair value, as determined either by Level 1 or Level 2 inputs. Debt securities classified as AFS included investments in U.S. Treasury and federal government agency securities and were valued using Level 2 inputs, primarily quoted prices for similar securities. Certain equity securities classified as AFS were valued using Level 1 inputs, primarily quoted prices in active markets, while other equity securities used Level 2 inputs, due to being less frequently traded or having limited quoted market prices. Debt securities classified as HTM are securities that the Company has both the ability and the intent to hold until maturity and are carried at amortized cost and periodically assessed for OTTI, with the cost basis reduced when impairment is deemed to be other-than-temporary. Non marketable equity investments are generally recorded under the cost or equity method of accounting and are periodically assessed for OTTI, with the net asset values reduced when impairment is deemed to be other-than-temporary. For investments in limited equity partnership interests, we use the net asset value provided by the fund manager as an appropriate measure of fair value.
Assets held for sale – Assets held for sale are recorded at lower of cost or fair value on the balance sheet. Most of the assets are subject to a binding contract, current letter of intent or other third-party valuation, which are Level 3 inputs. For the remaining assets, the fair value is generally determined using internally generated valuations or discounted cash flow analysis, which are considered Level 3 inputs. Commercial loans are generally valued individually, while small-ticket commercial and consumer type loans are valued on an aggregate portfolio basis.
Loans – Since there is no liquid secondary market for most loans in the Company’s portfolio, the fair value is estimated based on discounted cash flow analyses, which are considered Level 3 inputs. In addition to the characteristics of the underlying contracts, key inputs to the analysis include interest rates, prepayment rates, and credit spreads. For the commercial loan portfolio, the market based credit spread inputs are derived from instruments with comparable credit risk characteristics obtained from independent third party vendors. For the consumer loan portfolio, the discount spread is derived based on the company’s estimate of a market participant’s required return on equity that incorporates credit loss estimates based on expected and current default rates. As these Level 3 unobservable inputs are specific to individual loans / collateral types, management does not believe that sensitivity analysis of individual inputs is meaningful, but rather that sensitivity is more meaningfully assessed through the evaluation of aggregate carrying values of the loans. The fair value of loans at December 31, 2012 was $15.9 billion, which is 101.5% of carrying value. The fair value of the commercial loans portfolio was $11.9 billion, 99.5% of carrying value, and the fair value of the consumer portfolio was $4.0 billion, 107.8% of carrying value.
Impaired Loans – The value of impaired loans is estimated using the fair value of collateral (on an orderly liquidation basis) if the loan is collateralized, or the present value of expected cash flows utilizing the current market rate for such loan. As these Level 3 unobservable inputs are specific to individual loans / collateral types, management does not believe that sensitivity analysis of individual inputs is meaningful, but rather that sensitivity is more meaningfully assessed through the evaluation of aggregate carrying values of impaired loans relative to contractual amounts owed (unpaid principal balance or “UPB”) from customers. As of December 31, 2012, the UPB related to impaired loans, including loans for which the Company is applying the income recognition and disclosure guidance in ASC 310-30 (Loans and Debt Securities Acquired with Deteriorated Credit Quality), totaled $764.6 million. Including related allowances, these loans are carried at $455.1 million, or 60% of UPB. Of these amounts, $359.1 million and $253.5 million of UPB and carrying value relate to loans with no specific allowance. The difference between UPB and carrying value reflects cumulative charge-offs on accounts remaining in process of collection, FSA discounts and allowances. SeeNote 2 — Loans for more information.
Deposits – The fair value of deposits was estimated based upon a present value discounted cash flow analysis. Discount rates used in the present value calculation are based on the Company’s average current deposit rates for similar terms, which are Level 3 inputs.
Long-term borrowings – Unsecured borrowings of approximately $11.9 billion par value at December 31, 2012, were valued based on quoted market prices, which are Level 1 inputs. Approximately $6.7 billion par value of the secured borrowings at December 31, 2012 utilized market inputs to estimate fair value, which are Level 2 inputs. Where market estimates were not available for approximately $3.8 billion par value at December 31, 2012, values were estimated using a discounted cash flow analysis with a discount rate approximating current market rates for issuances by CIT of similar term debt, which are Level 3 inputs.
CIT ANNUAL REPORT 2012 125
CIT GROUP AND SUBSIDIARIES — NOTES TO CONSOLIDATED FINANCIAL STATEMENTS
NOTE 12 — STOCKHOLDERS’ EQUITY
A roll forward of common stock activity is presented in the following table.
Number of Shares of Common Stock
| | | | Issued
| | Less Treasury
| | Outstanding
|
|---|
Common Stock – December 31, 2010 | | | | | 200,690,938 | | | | (227,741 | ) | | | 200,463,197 | |
Restricted/performance shares issued | | | | | 272,578 | | | | – | | | | 272,578 | |
Shares held to cover taxes on vesting restricted shares and other | | | | | – | | | | (92,697 | ) | | | (92,697 | ) |
Employee stock purchase plan participation | | | | | 17,236 | | | | – | | | | 17,236 | |
Common Stock – December 31, 2011 | | | | | 200,980,752 | | | | (320,438 | ) | | | 200,660,314 | |
Restricted/performance shares issued | | | | | 272,702 | | | | – | | | | 272,702 | |
Shares held to cover taxes on vesting restricted shares and other | | | | | – | | | | (93,823 | ) | | | (93,823 | ) |
Employee stock purchase plan participation | | | | | 29,609 | | | | – | | | | 29,609 | |
Common Stock – December 31, 2012 | | | | | 201,283,063 | | | | (414,261 | ) | | | 200,868,802 | |
Accumulated Other Comprehensive Income/(Loss)
Total comprehensive loss was $587.4 million for the year ended December 31, 2012, versus comprehensive loss of $66.7 million in the prior year, including accumulated other comprehensive loss of $77.7 million and $82.6 million at December 2012 and 2011, respectively. The following table details the components of Accumulated Other Comprehensive Loss, net of tax:
Components of Accumulated Other Comprehensive Income (Loss)(dollars in millions)
| | | | December 31, 2012
| | December 31, 2011
| |
|---|
| | | | Gross
Unrealized
| | Income
Taxes
| | Net
Unrealized
| | Gross
Unrealized
| | Income
Taxes
| | Net
Unrealized
|
|---|
Changes in benefit plan net gain/(loss) and prior service (cost)/credit | | | | $ | (43.5 | ) | | $ | 0.4 | | | $ | (43.1 | ) | | $ | (54.8 | ) | | $ | – | | | $ | (54.8 | ) |
Foreign currency translation adjustments | | | | | (36.6 | ) | | | – | | | | (36.6 | ) | | | (28.2 | ) | | | – | | | | (28.2 | ) |
Changes in fair values of derivatives qualifying as cash flow hedges | | | | | (0.1 | ) | | | – | | | | (0.1 | ) | | | (0.7 | ) | | | – | | | | (0.7 | ) |
Unrealized net gains (losses) on available for sale securities | | | | | 3.5 | | | | (1.4 | ) | | | 2.1 | | | | 1.5 | | | | (0.4 | ) | | | 1.1 | |
Total accumulated other comprehensive loss | | | | $ | (76.7 | ) | | $ | (1.0 | ) | | $ | (77.7 | ) | | $ | (82.2 | ) | | $ | (0.4 | ) | | $ | (82.6 | ) |
The change in benefit plan net gain/(loss) and prior service (cost)/credit was primarily driven by the October 16, 2012 decision of the Board of Directors of the Company to freeze participation and eliminate future compensation credits in the pension plans, which resulted in a plan re-measurement for each plan. The plan obligations were re-measured at October 1, 2012 using a discount rate of 3.75% which is a 75 basis point reduction from 4.5% at December 31, 2011.
The change in foreign currency translation adjustments balance during 2012 primarily reflects the change in fair value of the derivatives, offset by foreign currency movements against the U.S. dollar and realized cumulative currency translation adjustments related to the liquidation of foreign subsidiaries.
Other Comprehensive Income/(Loss)
The amounts included in the Statement of Comprehensive Income (Loss) are net of income taxes. The income taxes associated with changes in benefit plans net gain/(loss) and prior service (cost)/credit totaled $0.2 million for 2012 and was not significant in 2011 or 2010. The income taxes associated with changes in fair values of derivatives qualifying as cash flow hedges were not significant for 2012, 2011 and 2010. The change in income taxes associated with net unrealized gains on available for sale securities totaled $1.0 million for 2012 and 2011 and was not significant in 2010.
The changes in benefit plans net gain/(loss) and prior service (cost)/credit reclassification adjustments impacting net income was $1.8 million for 2012. These amounts were insignificant in 2011 and 2010. There were no reclassifications through income for 2012, 2011 or 2010 for interest expense on interest rate swaps designated as cash flow hedges. The reclassification adjustments for unrealized gains (losses) on investments recognized through income were not significant for 2012, 2011 and 2010.
The Company has operations in Canada, Europe and other countries. The functional currency for foreign operations is generally the local currency. The value of assets and liabilities of these operations is translated into U.S. dollars at the rate of exchange in effect at the balance sheet date. Revenue and expense items are translated at the average exchange rates during the year. The resulting foreign currency translation gains and losses, as well as offsetting gains and losses on hedges of net investments in foreign operations, are reflected in AOCI. Transaction gains and losses resulting from exchange rate changes on transactions denominated in currencies other than the functional currency are included in earnings.
Item 8: Financial Statements and Supplementary Data
126 CIT ANNUAL REPORT 2012
CIT GROUP AND SUBSIDIARIES — NOTES TO CONSOLIDATED FINANCIAL STATEMENTS
NOTE 13 — REGULATORY CAPITAL
The Company and CIT Bank are each subject to various regulatory capital requirements administered by the Federal Reserve Bank (“FRB”) and the Federal Deposit Insurance Corporation (“FDIC”).
Quantitative measures established by regulation to ensure capital adequacy require that the Company and CIT Bank each maintain minimum amounts and ratios of Total and Tier 1 capital to risk-weighted assets, and of Tier 1 capital to average assets, subject to any agreement with regulators to maintain higher capital levels. In connection with becoming a bank holding company in December 2008, the Company committed to maintaining a minimum Total Risk Based Capital Ratio of 13%.
The calculation of the Company’s regulatory capital ratios are subject to review and consultation with the Federal Reserve Bank, which may result in refinements to amounts reported at December 31, 2012.
Tier 1 Capital and Total Capital Components (dollars in millions)
| | | | CIT
| | CIT Bank
| |
|---|
Tier 1 Capital
| | | | December 31,
2012
| | December 31,
2011
| | December 31,
2012
| | December 31,
2011
|
|---|
Total stockholders’ equity | | | | $ | 8,334.8 | | | $ | 8,883.6 | | | $ | 2,437.2 | | | $ | 2,116.6 | |
Effect of certain items in accumulated other
comprehensive loss excluded from Tier 1 Capital | | | | | 41.1 | | | | 54.3 | | | | (0.4 | ) | | | (0.3 | ) |
| | | | | 8,375.9 | | | | 8,937.9 | | | | 2,436.8 | | | | 2,116.3 | |
| | | | | (345.9 | ) | | | (353.2 | ) | | | – | | | | – | |
Disallowed intangible assets(1) | | | | | (32.7 | ) | | | (63.6 | ) | | | – | | | | – | |
Investment in certain subsidiaries | | | | | (34.4 | ) | | | (36.6 | ) | | | – | | | | – | |
Other Tier 1 components(2) | | | | | (68.0 | ) | | | (58.6 | ) | | | (14.3 | ) | | | (91.5 | ) |
| | | | | 7,894.9 | | | | 8,425.9 | | | | 2,422.5 | | | | 2,024.8 | |
| | | | | | | | | | | | | | | | | | |
Qualifying allowance for credit losses and other reserves(3) | | | | | 402.6 | | | | 429.9 | | | | 141.2 | | | | 52.7 | |
Less: Investment in certain subsidiaries | | | | | (34.4 | ) | | | (36.6 | ) | | | – | | | | – | |
Other Tier 2 components(4) | | | | | 0.5 | | | | – | | | | 0.3 | | | | 0.2 | |
| | | | $ | 8,263.6 | | | $ | 8,819.2 | | | $ | 2,564.0 | | | $ | 2,077.7 | |
| | | | $ | 48,580.1 | | | $ | 44,824.1 | | | $ | 11,289.1 | | | $ | 5,545.9 | |
Total Capital (to risk-weighted assets): | | | | | | | | | | | | | | | | | | |
| | | | | 17.0 | % | | | 19.7 | % | | | 22.7 | % | | | 37.5 | % |
Required Ratio for Capital Adequacy Purposes | | | | | 13.0 | %(5) | | | 13.0 | %(5) | | | 8.0 | % | | | 8.0 | % |
Tier 1 Capital (to risk-weighted assets): | | | | | | | | | | | | | | | | | | |
| | | | | 16.3 | % | | | 18.8 | % | | | 21.5 | % | | | 36.5 | % |
Required Ratio for Capital Adequacy Purposes | | | | | 4.0 | % | | | 4.0 | % | | | 4.0 | % | | | 4.0 | % |
| | | | | | | | | | | | | | | | | | |
| | | | | 18.3 | % | | | 18.8 | % | | | 20.2 | % | | | 24.7 | % |
Required Ratio for Capital Adequacy Purposes | | | | | 4.0 | % | | | 4.0 | % | | | 4.0 | % | | | 4.0 | % |
(1) | | Goodwill and disallowed intangible assets adjustments also reflect the portion included within assets held for sale. |
(2) | | Includes the portion of net deferred tax assets that does not qualify for inclusion in Tier 1 capital based on the capital guidelines, the Tier 1 capital charge for nonfinancial equity investments and the Tier 1 capital deduction for net unrealized losses on available-for-sale marketable securities (net of tax). |
(3) | | “Other reserves” represents additional credit loss reserves for unfunded lending commitments, letters of credit, and deferred purchase agreements, all of which are recorded in Other Liabilities. |
(4) | | Banking organizations are permitted to include in Tier 2 Capital up to 45% of net unrealized pretax gains on available-for-sale equity securities with readily determinable fair values. |
(5) | | The Company committed to maintaining the capital ratios above regulatory minimum levels. |
CIT ANNUAL REPORT 2012 127
CIT GROUP AND SUBSIDIARIES — NOTES TO CONSOLIDATED FINANCIAL STATEMENTS
NOTE 14 — EARNINGS PER SHARE
The reconciliation of the numerator and denominator of basic EPS with that of diluted EPS is presented below:
Earnings Per Share (dollars in millions, except per share amount; shares in thousands)
| | | | Years Ended December 31,
| |
|---|
| | | | 2012
| | 2011
| | 2010
|
|---|
| | | | | | | | | | |
| | | | $ | (592.3 | ) | | $ | 14.8 | | | $ | 521.3 | |
Weighted Average Common Shares Outstanding | | | | | | | | | | | | | | |
| | | | | 200,887 | | | | 200,678 | | | | 200,201 | |
| | | | | – | | | | 137 | | | | 374 | |
Diluted shares outstanding | | | | | 200,887 | | | | 200,815 | | | | 200,575 | |
Basic Earnings Per common share data | | | | | | | | | | | | | | |
Income (loss) per common share | | | | $ | (2.95 | ) | | $ | 0.07 | | | $ | 2.60 | |
Diluted Earnings Per common share data | | | | | | | | | | | | | | |
Income (loss) per common share | | | | $ | (2.95 | ) | | $ | 0.07 | | | $ | 2.60 | |
(1) | | Represents the incremental shares from in-the-money non-qualified restricted stock awards and stock options. Weighted average options and restricted shares that were out-of-the money were excluded from diluted earnings per share and totaled 1.5 million, 0.9 million, and 0.3 million, for the December 31, 2012, 2011 and 2010 periods, respectively. Additionally, in 2012 there were approximately 0.1 million performance shares that were out of the money and also excluded from diluted earnings per share. |
NOTE 15 — NON-INTEREST INCOME
The following table sets forth the components of non-interest income:
Non-interest Income(dollars in millions)
| | | | Years Ended December 31,
| |
|---|
| | | | 2012
| | 2011
| | 2010
|
|---|
Rental income on operating leases | | | | $ | 1,784.6 | | | $ | 1,667.5 | | | $ | 1,648.4 | |
| | | | | | | | | | | | | | |
| | | | | 126.5 | | | | 132.5 | | | | 145.0 | |
Gains on sales of leasing equipment | | | | | 117.6 | | | | 148.4 | | | | 156.3 | |
| | | | | 86.1 | | | | 97.5 | | | | 124.0 | |
Gains on loan and portfolio sales | | | | | 192.3 | | | | 305.9 | | | | 267.2 | |
Counterparty receivable accretion | | | | | 96.1 | | | | 109.9 | | | | 93.9 | |
Recoveries of loans charged off pre-emergence and loans charged off prior to transfer to held for sale | | | | | 55.0 | | | | 124.1 | | | | 278.8 | |
| | | | | 40.2 | | | | 45.7 | | | | 18.9 | |
Losses on derivatives and foreign currency exchange | | | | | (5.7 | ) | | | (5.2 | ) | | | (60.4 | ) |
Impairment on assets held for sale | | | | | (115.6 | ) | | | (113.1 | ) | | | (25.9 | ) |
| | | | | 60.6 | | | | 107.1 | | | | 7.1 | |
| | | | | 653.1 | | | | 952.8 | | | | 1,004.9 | |
Total non-interest income | | | | $ | 2,437.7 | | | $ | 2,620.3 | | | $ | 2,653.3 | |
Item 8: Financial Statements and Supplementary Data
128 CIT ANNUAL REPORT 2012
CIT GROUP AND SUBSIDIARIES — NOTES TO CONSOLIDATED FINANCIAL STATEMENTS
NOTE 16 — OTHER EXPENSES
Other Expenses(dollars in millions)
| | | | Years Ended December 31,
| |
|---|
| | | | 2012
| | 2011
| | 2010
|
|---|
Depreciation on operating lease equipment | | | | $ | 533.2 | | | $ | 575.1 | | | $ | 675.8 | |
| | | | | | | | | | | | | | |
Compensation and benefits | | | | | 538.7 | | | | 494.8 | | | | 570.7 | |
| | | | | 81.6 | | | | 75.3 | | | | 75.1 | |
| | | | | 64.8 | | | | 120.9 | | | | 114.8 | |
Advertising and marketing | | | | | 36.5 | | | | 10.5 | | | | 4.6 | |
| | | | | 36.2 | | | | 39.4 | | | | 48.9 | |
Provision for severance and facilities exiting activities | | | | | 22.7 | | | | 13.1 | | | | 52.2 | |
| | | | | 137.7 | | | | 142.6 | | | | 158.8 | |
| | | | | 918.2 | | | | 896.6 | | | | 1,025.1 | |
Loss on debt extinguishments | | | | | 61.2 | | | | 134.8 | | | | – | |
| | | | $ | 1,512.6 | | | $ | 1,606.5 | | | $ | 1,700.9 | |
NOTE 17 — INCOME TAXES
The following table presents the U.S. and non-U.S. components of income (loss) before provision for income taxes:
Income (Loss) Before Provision for Income Taxes(dollars in millions)
| | | | Years Ended December 31,
| |
|---|
| | | | 2012
| | 2011
| | 2010
|
|---|
| | | | $ | (1,043.7 | ) | | $ | (660.5 | ) | | $ | (399.6 | ) |
| | | | | 588.9 | | | | 838.9 | | | | 1,171.0 | |
Income (loss) before provision for income taxes | | | | $ | (454.8 | ) | | $ | 178.4 | | | $ | 771.4 | |
The provision/(benefit) for income taxes is comprised of the following:
Provision (Benefit) for Income Taxes(dollars in millions)
| | | | Years Ended December 31,
| |
|---|
| | | | 2012
| | 2011
| | 2010
|
|---|
Current federal income tax provision (benefit) | | | | $ | 1.5 | | | $ | 1.1 | | | $ | (8.6 | ) |
Deferred federal income tax provision | | | | | 9.5 | | | | 18.6 | | | | 91.2 | |
Total federal income tax provision | | | | | 11.0 | | | | 19.7 | | | | 82.6 | |
Current state and local income tax provision | | | | | 16.1 | | | | 10.8 | | | | 8.1 | |
Deferred state and local income tax provision (benefit) | | | | | (2.1 | ) | | | 1.0 | | | | (6.7 | ) |
Total state and local income tax provision | | | | | 14.0 | | | | 11.8 | | | | 1.4 | |
Total foreign income tax provision | | | | | 108.8 | | | | 127.1 | | | | 161.7 | |
Total provision for income taxes | | | | $ | 133.8 | | | $ | 158.6 | | | $ | 245.7 | |
CIT ANNUAL REPORT 2012 129
CIT GROUP AND SUBSIDIARIES — NOTES TO CONSOLIDATED FINANCIAL STATEMENTS
A reconciliation from the U.S. Federal statutory rate to the Company’s actual effective income tax rate is as follows:
Percentage of Pretax Income Years Ended December 31(dollars in millions)
| | | | Effective Tax Rate
| |
|---|
| | | | 2012
| | 2011
| | 2010
| |
|---|
| | | | Pretax
(loss)
| | Income
tax
(benefit)
| | Percent
of
pretax
income
(loss)
| | Pretax
income
| | Income
tax
expense
| | Percent
of
pretax
income
(loss)
| | Pretax
income
| | Income
tax
expense
| | Percent
of
pretax
income
(loss)
|
|---|
| | | | $ | (454.8 | ) | | $ | (159.1 | ) | | | 35.0 | % | | $ | 178.4 | | | $ | 62.4 | | | | 35.0 | % | | $ | 771.4 | | | $ | 270.0 | | | | 35.0 | % |
Increase (decrease) due to: | | | | | | | | | | | | | | | | | | | | | | | | | | | | | | | | | | | | | | |
State and local income taxes, net of federal income tax benefit | | | | | | | | | 14.0 | | | | (3.1 | ) | | | | | | | 11.8 | | | | 6.6 | | | | | | | | 1.4 | | | | 0.2 | |
Lower tax rates applicable to non-U.S. earnings | | | | | | | | | (140.9 | ) | | | 31.0 | | | | | | | | (177.4 | ) | | | (99.5 | ) | | | | | | | (162.5 | ) | | | (21.1 | ) |
Foreign income subject to U.S. tax | | | | | | | | | 305.1 | | | | (67.1 | ) | | | | | | | 306.9 | | | | 172.1 | | | | | | | | 133.8 | | | | 17.3 | |
Unrecognized tax benefits | | | | | | | | | (227.8 | ) | | | 50.1 | | | | | | | | 101.3 | | | | 56.8 | | | | | | | | 141.9 | | | | 18.4 | |
Deferred income taxes on foreign unremitted earnings | | | | | | | | | 112.0 | | | | (24.6 | ) | | | | | | | 86.3 | | | | 48.4 | | | | | | | | (73.4 | ) | | | (9.5 | ) |
| | | | | | | | | 247.2 | | | | (54.4 | ) | | | | | | | (201.8 | ) | | | (113.2 | ) | | | | | | | 39.9 | | | | 5.2 | |
International tax settlements | | | | | | | | | – | | | | – | | | | | | | | – | | | | – | | | | | | | | (51.4 | ) | | | (6.7 | ) |
| | | | | | | | | (16.7 | ) | | | 3.7 | | | | | | | | (30.9 | ) | | | (17.2 | ) | | | | | | | (54.0 | ) | | | (7.0 | ) |
| | | | | | | | $ | 133.8 | | | | (29.4 | )% | | | | | | $ | 158.6 | | | | 89.0 | % | | | | | | $ | 245.7 | | | | 31.8 | % |
The tax effects of temporary differences that give rise to deferred income tax assets and liabilities are presented below:
Components of Deferred Income Tax Assets and Liabilities(dollars in millions)
| | | | December 31,
| |
|---|
| | | | 2012
| | 2011
|
|---|
| | | | | | | | | | |
Net operating loss (NOL) carry forwards | | | | $ | 2,552.9 | | | $ | 2,097.8 | |
Loans and direct financing leases | | | | | 232.7 | | | | 267.3 | |
Provision for credit losses | | | | | 153.4 | | | | 146.5 | |
Accrued liabilities and reserves | | | | | 116.8 | | | | 137.9 | |
FSA adjustments – aircraft and rail contracts | | | | | 73.6 | | | | 103.4 | |
Unrealized losses on derivatives and investments | | | | | 22.8 | | | | 212.2 | |
Alternative minimum tax credits | | | | | 13.6 | | | | 16.9 | |
FSA adjustments – receivables | | | | | 4.9 | | | | 26.5 | |
| | | | | 134.9 | | | | 142.4 | |
Total gross deferred tax assets | | | | | 3,305.6 | | | | 3,150.9 | |
Deferred Tax Liabilities: | | | | | | | | | | |
| | | | | (1,317.6 | ) | | | (1,064.3 | ) |
Foreign unremitted earnings | | | | | (198.4 | ) | | | (85.1 | ) |
| | | | | (115.7 | ) | | | (752.3 | ) |
| | | | | (32.8 | ) | | | (31.5 | ) |
| | | | | (152.8 | ) | | | (154.8 | ) |
Total deferred tax liabilities | | | | | (1,817.3 | ) | | | (2,088.0 | ) |
Total net deferred tax asset before valuation allowances | | | | | 1,488.3 | | | | 1,062.9 | |
Less: Valuation allowances | | | | | (1,578.9 | ) | | | (1,115.1 | ) |
Net deferred tax liability after valuation allowances | | | | $ | (90.6 | ) | | $ | (52.2 | ) |
Item 8: Financial Statements and Supplementary Data
130 CIT ANNUAL REPORT 2012
CIT GROUP AND SUBSIDIARIES — NOTES TO CONSOLIDATED FINANCIAL STATEMENTS
2009 Bankruptcy
As previously discussed, CIT filed prepackaged voluntary petitions for bankruptcy for relief under the U.S. bankruptcy Code on November 1, 2009 and emerged from bankruptcy on December 10, 2009. As a consequence of the bankruptcy, CIT realized cancellation of indebtedness income (“CODI”). The Internal Revenue Service Code generally requires CODI to be recognized and included in taxable income. However, if CODI is realized pursuant to a confirmed plan of reorganization, then CODI is not recognized in taxable income but instead reduces certain favorable tax attributes. CIT tax attribute reductions included a reduction to the Company’s federal net operating loss carry-forwards (“NOLs”) of approximately $5.1 billion and the tax bases in its assets of $2.6 billion. In 2009, the Company established a deferred tax liability of $3.1 billion to account for the future tax effects of the CODI adjustments. This deferred tax liability was applied as a reduction to our NOLs and the tax carrying value of certain assets at the beginning of 2010.
CIT’s reorganization in 2009 constituted an ownership change under Section 382 of the Code, which placed an annual dollar limit on the use of the remaining pre-bankruptcy NOL carryforwards. Under the relief provision elected by the Company, Sec. 382(l)(6), the NOLs that the Company may use annually is limited to the product of a prescribed rate of return applied against the value of equity immediately after any ownership change. Based on an equity value determined by the Company’s opening stock price on December 10, 2009, the Company’s estimated NOL usage will be limited to $230 million per annum. Post-emergence tax losses are not subject to this Section 382 limitation absent another ownership change for U.S. tax purposes.
Net Operating Loss Carry-forwards
As of December 31, 2012, CIT has deferred tax assets totaling $2.6 billion on its global NOLs. This includes a deferred tax asset of: (1) $1.7 billion relating to its cumulative U.S. Federal NOLs of $4.9 billion, after the CODI reduction described in the paragraph above; (2) $459 million relating to cumulative state NOLs of $9.3 billion, and (3) $364 million relating to cumulative foreign NOLs of $2.6 billion.
Of the $4.9 billion U.S. Federal NOLs, approximately $2.3 billion relates to the pre-emergence period which is subject to the Sec. 382 limitation discussed above. The increase in the U.S. Federal NOLs from the prior year balance of $4.0 billion is primarily attributable to the favorable resolution on uncertain tax positions mentioned in the discussion of Liabilities for Unrecognized Tax Benefits below and ongoing audit adjustments related to prior years. The U.S. Federal NOL’s will expire beginning in 2027 through 2032. $35.0 million of state NOLs will expire in 2013, and the foreign NOLs will expire over various periods, with an insignificant amount expiring in 2013.
The Company could have a legal obligation to Tyco International if it is determined that certain NOLs that originated prior to CIT’s spin-off from Tyco in 2002 survived the attribute reduction discussed above and the Company obtained cash tax benefits thereon. SeeNote 20 — Contingencies.
As a result of continuing operating losses by certain domestic and foreign reporting entities, the Company has concluded that it does not currently meet the criteria to recognize net deferred tax assets, inclusive of the deferred tax assets related to NOLs in these entities. Accordingly, the Company maintains valuation allowances of $1.6 billion and $1.1 billion against their net deferred tax assets at December 31, 2012 and 2011, respectively. Of the $1.6 billion valuation allowance, approximately $1.4 billion relates to domestic reporting entities and $187 million relates to the foreign reporting entities. Certain foreign reporting entities with NOLs have recently generated profits, however, the Company continues to record a full valuation allowance on these entities’ net deferred tax assets due to their history of losses. A sustained period of profitability in these foreign entities is required before the Company would change their judgment regarding the need for valuation allowances against the net deferred tax assets. The Company utilizes a rolling three years of actual earnings as the primary measure of assessing a need for or possible release of valuation allowances, adjusted for any non-recurring items. Continued improvement in operating results, however, could lead to reversal of some of the foreign reporting entities’ valuation allowances.
Indefinite Reinvestment Assertion
With respect to the Company’s investments in foreign subsidiaries, management has historically asserted the intent to indefinitely reinvest the unremitted earnings of its foreign subsidiaries with very limited exceptions. However, in 2009, management determined that it would no longer make this assertion because of certain cash flow and funding uncertainties consequent to its recent emergence from bankruptcy and the fact that management was still in the early stages of developing its long-term strategic and liquidity plans. By 2010, the Company had a new leadership team charged with re-evaluating the Company’s long-term business and strategic plans. Their initial post-bankruptcy plan was to aggressively grow the Company’s international business. Accordingly, in 2010, with very limited exceptions, management decided to assert indefinite reinvestment of the unremitted earnings of its foreign subsidiaries. This resulted in the reversal of certain previously established deferred income taxes including $10 million of deferred withholding taxes and $64 million of deferred domestic income tax. The latter $64 million deferred tax was fully offset by a corresponding adjustment to the domestic valuation allowance resulting in no impact to the income tax provision.
In the quarter-ended December 31, 2011, management decided to no longer assert its intent to indefinitely reinvest its foreign earnings, except for foreign subsidiaries in select jurisdictions. This decision was driven by events during 2011 that culminated in management’s conclusion during the fourth quarter of 2011 that Management may need to repatriate foreign earnings to address certain long-term investment and funding strategies. Some of the significant events that impacted management’s decision included the re-evaluation of the debt and capital structures of its subsidiaries, and the need to pay-down its high cost debt in the U.S. In addition, certain restrictions on the Company’s first and second lien debt were removed during the fourth quarter of 2011 upon the repayment of the remaining 2014 Series A Notes. The removal of these restrictions allowed the Company to transfer and repatriate cash to repay its high cost debt in the U.S. and recapitalize certain foreign subsidiaries. All these events contributed to management’s decision to no longer assert indefinite
CIT ANNUAL REPORT 2012 131
CIT GROUP AND SUBSIDIARIES — NOTES TO CONSOLIDATED FINANCIAL STATEMENTS
reinvestment of its foreign earnings with the exception of foreign subsidiaries in select jurisdictions.
As a result of the change in assertion in 2011, the Company recorded deferred tax liabilities of $12.2 million for foreign withholding taxes and $74.1 million of domestic deferred income taxes. These amounts represent the Company’s best estimate of the tax cost associated with the potential future repatriation of undistributed earnings of its foreign subsidiaries. The $74.1 million of deferred income tax was offset by a corresponding adjustment to the domestic valuation allowance resulting in no impact to the income tax provision.
As of December 31, 2012, management continues to maintain the position with regards to its assertion. During 2012, the Company reduced its deferred tax liabilities for foreign withholding taxes by $0.7 million and recorded additional domestic deferred income taxes of $112.7 million. As of December 31, 2012, the Company has recorded $11.6 million for foreign withholding taxes and $186.8 million for domestic deferred tax liabilities which represents the Company’s best estimate of the tax cost associated with the potential future repatriation of undistributed earnings of its foreign subsidiaries. The $186.8 million of deferred income tax was offset by a corresponding adjustment to the domestic valuation allowance resulting in no impact to the income tax provision.
Liabilities for Unrecognized Tax Benefits
A reconciliation of the beginning and ending amount of unrecognized tax benefits is as follows:
Unrecognized Tax Benefits(dollars in millions)
| |
Balance at December 31, 2011 | | | | $ | 549.2 | |
Additions for tax positions related to current year | | | | | 27.1 | |
Additions for tax positions related to prior years | | | | | 1.0 | |
Reductions for tax positions of prior years | | | | | (255.0 | ) |
| | | | | (3.6 | ) |
Expiration of statutes of limitations | | | | | (1.2 | ) |
Foreign currency revaluation | | | | | 0.3 | |
Balance at December 31, 2012 | | | | $ | 317.8 | |
During the year ended December 31, 2012, the Company recorded a $232.1 million income tax benefit on uncertain tax positions including interest and penalties, net of a $0.4 million increases attributable to foreign currency revaluation. The majority of the benefit related to prior years’ uncertain federal and state tax positions and was comprised of two items: (1) $146.5 million from the reduction of tax liabilities established on an uncertain tax position taken on certain tax losses following a favorable ruling from the tax authorities, and (2) a reduction of $98.4 million associated with an uncertain tax position taken on a prior-year restructuring transaction, on which the uncertainty no longer exists. Both of the aforementioned benefits were fully offset by corresponding increases to the domestic valuation allowance. As required by ASC 740, Income Taxes, the deferred tax assets shown in the deferred tax asset and liability table above do not reflect the benefits of these uncertain tax positions.
During the year ended December 31, 2012, the Company recognized a $0.6 million decrease in interest and penalties associated with uncertain tax positions, net of a $0.6 million increase attributable to foreign currency translation. As of December 31, 2012, the accrued liability for interest and penalties is $12.6 million. The Company recognizes accrued interest and penalties on unrecognized tax benefits in income tax expense.
The entire $317.8 million of unrecognized tax benefits at December 31, 2012 would lower the Company’s effective tax rate, if realized, absent a corresponding adjustment of the Company’s valuation allowance for net deferred tax assets. The Company believes that the total unrecognized tax benefits may decrease, in the range of $0 to $10 million, due to the settlements of audits and the expiration of various statutes of limitations prior to December 31, 2013.
Income Tax Audits
On April 3, 2012, the Internal Revenue Service (IRS) approved the settlement on the examination of the Company’s U.S. federal income tax returns for the taxable years ended December 31, 2005 through December 31, 2007. This approval and the related Revenue Agent Report resulted in the imposition of a $1.4 million alternative minimum tax that can be used anytime in the future as a credit to offset the Company’s regular tax liability. A new IRS examination was commenced during 2012 for the taxable years ending December 31, 2008 through December 31, 2010.
The Company and its subsidiaries are under examination in various states, provinces and countries for years ranging from 2005 through 2010. Management does not anticipate that these examination results will have any material financial impact.
NOTE 18 — RETIREMENT, POSTRETIREMENT AND OTHER BENEFIT PLANS
CIT provides various benefit programs, including defined benefit retirement and postretirement plans, and defined contribution savings incentive plans. A summary of major plans is provided below.
Retirement and Postretirement Benefit Plans
Retirement Benefits
CIT has both funded and unfunded noncontributory defined benefit pension plans covering certain U.S. and non-U.S. employees, each of which is designed in accordance with practices and regulations in the related countries. Retirement benefits under defined benefit pension plans are based on an employee’s age, years of service and qualifying compensation.
The Company’s largest plan is the CIT Group Inc. Retirement Plan (the “Plan”), which accounts for 75.2% of the Company’s total pension projected benefit obligation at December 31, 2012. The Plan covers U.S. employees who have completed one year of service and have attained the age of 21. The Plan has a “cash balance” formula that became effective January 1, 2001. The Plan also provides traditional pension benefits under the legacy portion of the Plan to employees who elected not to convert to the “cash balance” feature. Participants under the legacy
Item 8: Financial Statements and Supplementary Data
132 CIT ANNUAL REPORT 2012
CIT GROUP AND SUBSIDIARIES — NOTES TO CONSOLIDATED FINANCIAL STATEMENTS
portion represent 67.3% of the Plan’s aggregate pension benefit obligation in dollars. The majority of these people are inactive participants. Only 8% of actively employed participants are in the legacy portion.
The Company also maintains a U.S. noncontributory supplemental retirement plan, the CIT Group Inc. Supplemental Retirement Plan (the “Supplemental Plan”), for participants whose benefit in the Plan is subject to Internal Revenue Code limitations and an executive retirement plan, which is closed to new members since 2006, which together aggregate 18.7% of the total pension projected benefit obligation at December 31, 2012.
On October 16, 2012, the Board of Directors of the Company approved amendments to freeze the benefits earned under both the Plan and the Supplemental Plan. These actions became effective on December 31, 2012. These changes resulted in a gain to AOCI and will eliminate future service cost accruals.
Prior to December 31, 2012, eligible employees covered by the “cash balance” formula of the Plan were credited with a percentage (5% to 8% depending on years of service) of “Benefits Pay” (comprised of base salary, plus a three year average of certain annual cash incentives, sales incentives and commissions). The freeze discontinues credit for services after December 31, 2012; however, accumulated balances under this formula will continue to receive periodic interest, subject to certain government limits. The interest credit was 2.67%, 4.17%, and 4.40% for the years ended December 31, 2012, 2011, and 2010, respectively. Participants in the traditional formula of the Plan will continue to accrue a benefit through December 31, 2012, after which the benefit amount will be frozen, and no credits will be given.
Employees become vested in their cash balance plan accounts after completing three years of service, as defined. In addition, a participant shall be 100% vested upon attaining normal retirement age or becoming permanently and totally disabled, as defined. Upon termination or retirement, vested participants under the “cash balance” formula have the option of receiving their benefit in a lump sum, deferring their payment to age 65 or converting their vested benefit to an annuity. Traditional formula participants, upon a qualifying retirement can only receive an annuity.
During 2012, CIT offered a voluntary cash out option to Plan participants who are former employees of the Company and who have not yet started to receive monthly pension benefit payments. Approximately 900 former participants had an opportunity to roll over a lump sum distribution to an IRA or qualified employer plan, take a lump sum cash distribution or receive an immediate annuity. The payments made from the Plan as a result of this offer totaled $19.8 million.
Postretirement Benefits
CIT provides healthcare and life insurance benefits to eligible retired employees. U.S. retiree healthcare and life insurance benefits account for 48.5% and 46.7% of the total postretirement benefit obligation, respectively. For most eligible retirees, healthcare is contributory and life insurance is non-contributory. The U.S. retiree healthcare plan pays a stated percentage of most medical expenses, reduced by a deductible and any payments made by the government and other programs. The U.S. retiree healthcare benefit includes a maximum on CIT’s share of costs for employees who retired after January 31, 2002. All postretirement benefit plans are funded on a pay-as-you-go basis.
On October 16, 2012, the Board of Directors of the Company approved amendments to discontinue benefits under CIT’s postretirement benefit plans. These changes resulted in a gain to AOCI and will reduce future service cost accruals. CIT will no longer offer retiree medical, dental and life insurance benefits to those who do not meet the eligibility criteria for these benefits by December 31, 2013. Participants become eligible for postretirement benefits at the age of 60 if they have completed 10 years of continuous service. Individuals hired prior to November 1999 become eligible after becoming 55 if they have 11 years of continuous service. Employees who meet the eligibility requirements for retiree health insurance by December 31, 2013 will be offered retiree medical and dental coverage upon retirement. To receive retiree life insurance, employees must meet the eligibility criteria for retiree life insurance by December 31, 2013 and must retire from CIT on or before December 31, 2013.
CIT ANNUAL REPORT 2012 133
CIT GROUP AND SUBSIDIARIES — NOTES TO CONSOLIDATED FINANCIAL STATEMENTS
Obligations and Funded Status
The following tables set forth changes in benefit obligation, plan assets, funded status and net periodic benefit cost of the retirement plans and postretirement plans:
Obligations and Funded Status(dollars in millions)
| | | | Retirement Benefits
| | Post-Retirement Benefits
| |
|---|
| | | | 2012
| | 2011
| | 2012
| | 2011
|
|---|
Change in benefit obligation | | | | | | | | | | | | | | | | | | |
Benefit obligation at beginning of year | | | | $ | 470.3 | | | $ | 426.7 | | | $ | 50.2 | | | $ | 47.9 | |
| | | | | 14.5 | | | | 13.0 | | | | 0.8 | | | | 0.9 | |
| | | | | 19.9 | | | | 22.5 | | | | 1.9 | | | | 2.4 | |
| | | | | – | | | | – | | | | (7.7 | ) | | | – | |
| | | | | (22.2 | ) | | | (0.1 | ) | | | (0.6 | ) | | | 0.1 | |
| | | | | (0.2 | ) | | | (15.7 | ) | | | (0.7 | ) | | | – | |
| | | | | 41.7 | | | | 47.8 | | | | 1.2 | | | | 1.5 | |
| | | | | (44.7 | ) | | | (24.7 | ) | | | (4.7 | ) | | | (4.9 | ) |
| | | | | 1.5 | | | | 0.8 | | | | 1.9 | | | | 2.3 | |
Benefit obligation at end of year | | | | | 480.8 | | | | 470.3 | | | | 42.3 | | | | 50.2 | |
| | | | | | | | | | | | | | | | | | |
Fair value of plan assets at beginning of period | | | | | 324.6 | | | | 292.3 | | | | – | | | | – | |
Actual return on plan assets | | | | | 41.3 | | | | 9.4 | | | | – | | | | – | |
| | | | | 24.0 | | | | 63.1 | | | | 3.4 | | | | 2.6 | |
| | | | | (0.2 | ) | | | (15.7 | ) | | | (0.7 | ) | | | – | |
| | | | | (44.7 | ) | | | (24.7 | ) | | | (4.7 | ) | | | (4.9 | ) |
| | | | | 1.3 | | | | 0.2 | | | | 2.0 | | | | 2.3 | |
Fair value of plan assets at end of period | | | | | 346.3 | | | | 324.6 | | | | – | | | | – | |
Funded status at end of year(2)(3) | | | | $ | (134.5 | ) | | $ | (145.7 | ) | | $ | (42.3 | ) | | $ | (50.2 | ) |
(1) | | Consists of any of the following: plan participants’ contributions, termination benefits, retiree drug subsidy, and currency translation adjustments. |
(2) | | These amounts were recognized as liabilities in the Consolidated Balance Sheet at December 31, 2012 and 2011. |
(3) | | Company assets of $99.2 million and $95.9 million as of December 31, 2012 and December 31, 2011, respectively, related to the non-qualified U.S. executive retirement plan obligation are not included in plan assets but related liabilities are in benefit obligation. |
The plan changes approved on October 16, 2012 resulted in plan curtailments and amendments which reduced the liability for the affected plans as indicated in the table above. Each of the amended plans was re-measured at October 1, 2012 using a discount rate of 3.75%.
During 2011, the sale of an entity in Germany resulted in full settlement of the pension plan for that entity at the date of the transaction.
The amounts recognized in AOCI during the year ended December 31, 2012 were net gains (before taxes) of $4.8 million for retirement benefits. The net pension AOCI gains were primarily driven by a reduction in benefit obligations of $20.4 million resulting from the decision to freeze benefits under certain plans, an increase in asset values of $23.8 million due to favorable asset performance, and the settlement of obligations of approximately $8.7 million as a result of the lump sum cash out offering. These gains were largely offset by changes in assumptions, which resulted in an increase in plan obligations of approximately $48.1 million.
The postretirement AOCI net gains (before taxes) of $6.5 million were primarily driven by the reduction in benefit obligations of $8.3 million primarily due to the discontinuation of benefits under certain plans, partially offset by the impacts of assumption changes of approximately $1.8 million.
The discount rate for the majority of the U.S. pension and postretirement plans decreased by 75 basis points from 4.50% at December 31, 2011 to 3.75% at December 31, 2012. The decrease in the discount rate assumption represents the majority of the offset to the reduction of the pension and postretirement benefit obligations driven by plan changes.
The accumulated benefit obligation for all defined benefit pension plans was $477.5 million and $448.5 million, at December 31, 2012 and 2011, respectively. Information for those defined benefit plans with an accumulated benefit obligation in excess of plan assets is as follows:
Defined Benefit Plans With an Accumulated Benefit Obligation in Excess of Plan Assets (dollars in millions)
| | | | December 31,
| |
|---|
| | | | 2012
| | 2011
|
|---|
Projected benefit obligation | | | | $ | 458.8 | | | $ | 450.2 | |
Accumulated benefit obligation | | | | | 455.6 | | | | 428.5 | |
Fair value of plan assets | | | | | 319.0 | | | | 297.8 | |
Item 8: Financial Statements and Supplementary Data
134 CIT ANNUAL REPORT 2012
CIT GROUP AND SUBSIDIARIES — NOTES TO CONSOLIDATED FINANCIAL STATEMENTS
The net periodic benefit cost and other amounts recognized in AOCI consisted of the following:
| | | | Retirement Benefits
| | Post-Retirement Benefits
| |
|---|
Net Periodic Benefit Costs and Other Amounts
Recognized in AOCI(dollars in millions)
| | | | 2012
| | 2011
| | 2010
| | 2012
| | 2011
| | 2010
|
|---|
| | | | $ | 14.5 | | | $ | 13.0 | | | $ | 14.7 | | | $ | 0.8 | | | $ | 0.9 | | | $ | 1.0 | |
| | | | | 19.9 | | | | 22.5 | | | | 22.6 | | | | 1.9 | | | | 2.4 | | | | 2.6 | |
Expected return on plan assets | | | | | (18.4 | ) | | | (20.3 | ) | | | (17.6 | ) | | | – | | | | – | | | | – | |
Amortization of prior service cost | | | | | – | | | | – | | | | – | | | | (0.3 | ) | | | – | | | | – | |
Amortization of net loss/(gain) | | | | | 2.1 | | | | – | | | | – | | | | (0.4 | ) | | | (0.2 | ) | | | (0.1 | ) |
Settlement and curtailment (gain)/loss | | | | | (0.6 | ) | | | 0.9 | | | | (0.1 | ) | | | – | | | | – | | | | – | |
| | | | | 0.3 | | | | – | | | | – | | | | – | | | | – | | | | – | |
Net periodic benefit cost | | | | | 17.8 | | | | 16.1 | | | | 19.6 | | | | 2.0 | | | | 3.1 | | | | 3.5 | |
Other Changes in Plan Assets and Benefit Obligations Recognized in Other Comprehensive Income | | | | | | | | | | | | | | | | | | | | | | | | | | |
| | | | | (2.6 | ) | | | 58.0 | | | | (1.7 | ) | | | 0.6 | | | | 1.6 | | | | (2.9 | ) |
Prior service cost (credit) | | | | | – | | | | – | | | | – | | | | (7.7 | ) | | | – | | | | – | |
Amortization, settlement or curtailment recognition of net gain/(loss) | | | | | (2.2 | ) | | | (0.3 | ) | | | 0.1 | | | | 0.4 | | | | 0.2 | | | | – | |
Amortization, settlement or curtailment recognition of prior service (cost)/credit | | | | | – | | | | – | | | | – | | | | 0.2 | | | | – | | | | – | |
| | | | | (4.8 | ) | | | 57.7 | | | | (1.6 | ) | | | (6.5 | ) | | | 1.8 | | | | (2.9 | ) |
Total recognized in net periodic benefit cost and OCI | | | | $ | 13.0 | | | $ | 73.8 | | | $ | 18.0 | | | $ | (4.5 | ) | | $ | 4.9 | | | $ | 0.6 | |
Assumptions
Discount rate assumptions used for pension and post-retirement benefit plan accounting reflect prevailing rates available on high-quality, fixed-income debt instruments with maturities that match the benefit obligation. The rate of compensation used in the actuarial model is based upon the Company’s long-term plans for any increases, taking into account both market data and historical increases.
Expected long-term rate of return assumptions on assets are based on projected asset allocation and historical and expected future returns for each asset class. Independent analysis of historical and projected asset returns, inflation, and interest rates are provided by the Company’s investment consultants and actuaries as part of the Company’s assumptions process.
The weighted average assumptions used in the measurement of benefit obligations are as follows:
Weighted Average Assumptions
| | | | Retirement Benefits
| | Post-Retirement Benefits
| |
|---|
| | | | 2012
| | 2011
| | 2012
| | 2011
|
|---|
| | | | | 3.80 | % | | | 4.48 | % | | | 3.74 | % | | | 4.49 | % |
Rate of compensation increases | | | | | 3.03 | % | | | 3.00 | % | | | 3.00 | % | | | 3.00 | % |
Health care cost trend rate | | | | | | | | | | | | | | | | | | |
| | | | | n/a | | | | n/a | | | | 7.80 | % | | | 7.60 | % |
| | | | | n/a | | | | n/a | | | | 8.10 | % | | | 7.80 | % |
Ultimate health care cost trend rate | | | | | n/a | | | | n/a | | | | 4.50 | % | | | 4.50 | % |
| | | | | n/a | | | | n/a | | | | 2029 | | | | 2029 | |
The weighted average assumptions used to determine net periodic benefit costs for the years ended December 31, 2012 and 2011 are as follows:
Weighted Average Assumptions
| | | | Retirement Benefits
| | Post-Retirement Benefits
| |
|---|
| | | | 2012
| | 2011
| | 2012
| | 2011
|
|---|
| | | | | 4.30 | % | | | 5.42 | % | | | 4.31 | % | | | 5.21 | % |
Expected long-term return on plan assets | | | | | 5.56 | % | | | 6.51 | % | | | n/a | | | | n/a | |
Rate of compensation increases | | | | | 3.00 | % | | | 3.01 | % | | | 3.00 | % | | | 3.00 | % |
CIT ANNUAL REPORT 2012 135
CIT GROUP AND SUBSIDIARIES — NOTES TO CONSOLIDATED FINANCIAL STATEMENTS
Healthcare rate trends have a significant effect on healthcare plan costs. The Company uses both external and historical data to determine healthcare rate trends. An increase (decrease) of one-percentage point in assumed healthcare rate trends would increase (decrease) the postretirement benefit obligation by $1.4 million and ($1.3 million), respectively. The service and interest cost are not material.
Plan Assets
CIT maintains a “Statement of Investment Policies and Objectives” which specifies guidelines for the investment, supervision and monitoring of pension assets in order to manage the Company’s objective of ensuring sufficient funds to finance future retirement benefits. The asset allocation policy allows assets to be invested between 15% to 35% in Equities, 35% to 65% in Fixed-Income, 15% to 25% in Global Asset Allocations, and 5% to 10% in Hedge Funds. The asset allocation follows a Liability Driven Investing (“LDI”) strategy. The objective of LDI is to allocate assets in a manner that their movement will more closely track the movement in the benefit liability. The policy provides specific guidance on asset class objectives, fund manager guidelines and identification of prohibited and restricted transactions. It is reviewed periodically by the Company’s Investment Committee and external investment consultants.
Members of the Investment Committee are appointed by the Chief Executive Officer and include the Chief Financial Officer as the committee Chairman, and other senior executives.
There were no direct investments in equity securities of CIT or its subsidiaries included in pension plan assets in any of the years presented.
Plan investments are stated at fair value. Equity securities are valued at the last trade price at the primary exchange close time on the last business day of the year (Level 1). Registered Investment Companies are valued at the daily net asset value of shares held at valuation period-end (Level 1). Corporate and government debt are valued based on institutional bid data from market data sources. Investment Managers and Fund Managers use observable market-based data to evaluate prices (Level 2). All assets for which observable market-based data is not available are classified as Level 3. The valuation of Level 3 assets requires inputs that are both unobservable and significant to the overall fair value measurement, and are reflective of valuation models that are dependent upon the investment manager’s assumptions. Given the valuation of Level 3 assets is dependent upon assumptions and expectations, management, with the assistance of third party experts, periodically assesses the controls and governance employed by the investment firms that manage Level 3 assets.
The tables below set forth asset fair value measurements.
Fair Value Measurements(dollars in millions)
December 31, 2012
| | | | Quoted Prices in
Active Markets
for Identical
Assets (Level 1)
| | Significant
Observable
Inputs (Level 2)
| | Significant
Unobservable
Inputs (Level 3)
| | Total Market
Value in
Financials
|
|---|
| | | | $ | 4.4 | | | $ | – | | | $ | – | | | $ | 4.4 | |
| | | | | | | | | | | | | | | | | | |
| | | | | 11.2 | | | | – | | | | – | | | | 11.2 | |
| | | | | 8.8 | | | | – | | | | – | | | | 8.8 | |
| | | | | 15.2 | | | | – | | | | – | | | | 15.2 | |
Balanced Asset Allocation | | | | | 19.5 | | | | – | | | | – | | | | 19.5 | |
| | | | | 8.0 | | | | – | | | | – | | | | 8.0 | |
| | | | | 62.7 | | | | – | | | | – | | | | 62.7 | |
| | | | | | | | | | | | | | | | | | |
| | | | | – | | | | 15.1 | | | | – | | | | 15.1 | |
| | | | | – | | | | 13.1 | | | | – | | | | 13.1 | |
| | | | | – | | | | 134.7 | | | | – | | | | 134.7 | |
Balanced Asset Allocation | | | | | – | | | | 20.1 | | | | – | | | | 20.1 | |
Total Common Collective Trust | | | | | – | | | | 183.0 | | | | – | | | | 183.0 | |
| | | | | | | | | | | | | | | | | | |
| | | | | – | | | | 10.3 | | | | – | | | | 10.3 | |
| | | | | – | | | | 13.5 | | | | – | | | | 13.5 | |
Balanced Asset Allocation | | | | | – | | | | 20.5 | | | | – | | | | 20.5 | |
| | | | | – | | | | 44.3 | | | | – | | | | 44.3 | |
| | | | | | | | | | | | | | | | | | |
| | | | | – | | | | – | | | | 10.5 | | | | 10.5 | |
| | | | | – | | | | – | | | | 13.9 | | | | 13.9 | |
| | | | | – | | | | 27.2 | | | | – | | | | 27.2 | |
| | | | | – | | | | – | | | | 0.3 | | | | 0.3 | |
| | | | $ | 67.1 | | | $ | 254.5 | | | $ | 24.7 | | | $ | 346.3 | |
Item 8: Financial Statements and Supplementary Data
136 CIT ANNUAL REPORT 2012
CIT GROUP AND SUBSIDIARIES — NOTES TO CONSOLIDATED FINANCIAL STATEMENTS
Fair Value Measurements(dollars in millions)
December 31, 2011
| | | | Quoted Prices in
Active Markets
for Identical
Assets (Level 1)
| | Significant
Observable
Inputs (Level 2)
| | Significant
Unobservable
Inputs (Level 3)
| | Total Market
Value in
Financials
|
|---|
| | | | $ | 5.3 | | | $ | – | | | $ | – | | | $ | 5.3 | |
| | | | | | | | | | | | | | | | | | |
| | | | | 9.2 | | | | – | | | | – | | | | 9.2 | |
| | | | | 7.4 | | | | – | | | | – | | | | 7.4 | |
| | | | | 13.3 | | | | – | | | | – | | | | 13.3 | |
Balanced Asset Allocation | | | | | 17.0 | | | | – | | | | – | | | | 17.0 | |
| | | | | 46.9 | | | | – | | | | – | | | | 46.9 | |
| | | | | | | | | | | | | | | | | | |
| | | | | – | | | | 16.6 | | | | – | | | | 16.6 | |
| | | | | – | | | | 11.2 | | | | – | | | | 11.2 | |
| | | | | – | | | | 135.1 | | | | – | | | | 135.1 | |
Balanced Asset Allocation | | | | | – | | | | 18.1 | | | | – | | | | 18.1 | |
Total Common Collective Trust | | | | | – | | | | 181.0 | | | | – | | | | 181.0 | |
| | | | | | | | | | | | | | | | | | |
| | | | | – | | | | 8.2 | | | | – | | | | 8.2 | |
| | | | | – | | | | 14.2 | | | | – | | | | 14.2 | |
Balanced Asset Allocation | | | | | – | | | | 18.4 | | | | – | | | | 18.4 | |
| | | | | – | | | | 40.8 | | | | – | | | | 40.8 | |
| | | | | | | | | | | | | | | | | | |
| | | | | – | | | | – | | | | 6.1 | | | | 6.1 | |
| | | | | – | | | | – | | | | 17.4 | | | | 17.4 | |
| | | | | – | | | | 26.8 | | | | – | | | | 26.8 | |
| | | | | – | | | | – | | | | 0.3 | | | | 0.3 | |
| | | | $ | 52.2 | | | $ | 248.6 | | | $ | 23.8 | | | $ | 324.6 | |
The table below sets forth changes in the fair value of the Plan’s Level 3 assets for the year ended December 31, 2012:
Fair Value of Level 3 Assets(dollars in millions)
| | | | Total
| | Partnership
| | Hedge
Funds
| | Insurance
Contracts
|
|---|
| | | | $ | 23.8 | | | $ | 6.1 | | | $ | 17.4 | | | $ | 0.3 | |
Realized and Unrealized Gains (Losses) | | | | | 1.7 | | | | 0.5 | | | | 1.2 | | | | – | |
Purchases, sales, and settlements, net | | | | | (0.8 | ) | | | 3.9 | | | | (4.7 | ) | | | – | |
Net Transfers into and/or out of Level 3 | | | | | – | | | | – | | | | – | | | | – | |
| | | | $ | 24.7 | | | $ | 10.5 | | | $ | 13.9 | | | $ | 0.3 | |
Change in Unrealized Gains (Losses) for Investments still held at December 31, 2012 | | | | $ | 2.4 | | | $ | 0.5 | | | $ | 1.9 | | | $ | – | |
Contributions
The Company’s policy is to make contributions so that they exceed the minimum required by laws and regulations, are consistent with the Company’s objective of ensuring sufficient funds to finance future retirement benefits and are tax deductible. CIT currently expects to contribute $19.0 million to the U.S. Retirement Plan during 2013. For all other plans, CIT currently expects to contribute $9.0 million during 2013.
CIT ANNUAL REPORT 2012 137
CIT GROUP AND SUBSIDIARIES — NOTES TO CONSOLIDATED FINANCIAL STATEMENTS
Estimated Future Benefit Payments
The following table depicts benefits projected to be paid from plan assets or from the Company’s general assets calculated using current actuarial assumptions. Actual benefit payments may differ from projected benefit payments.
Projected Benefits(dollars in millions)
For the years ended December 31
| | | | Retirement
Benefits
| | Gross
Postretirement
Benefits
| | Medicare
Subsidy
|
|---|
| | | | $ | 24.8 | | | $ | 3.3 | | | $ | 0.2 | |
| | | | | 25.1 | | | | 3.3 | | | | 0.3 | |
| | | | | 25.1 | | | | 3.2 | | | | 0.3 | |
| | | | | 25.3 | | | | 3.2 | | | | 0.3 | |
| | | | | 24.7 | | | | 3.1 | | | | 0.3 | |
| | | | | 126.4 | | | | 14.1 | | | | 1.0 | |
Savings Incentive Plan
CIT has a number of defined contribution retirement plans covering certain of its U.S. and non-U.S. employees designed in accordance with conditions and practices in the respective countries. The U.S. plan, which qualifies under section 401(k) of the Internal Revenue Code, is the largest and accounts for 78% of the Company’s total defined contribution retirement expense for the year ended December 31, 2012. Generally, employees may contribute a portion of their salary and bonus, subject to regulatory limits and plan provisions, and the Company matches these contributions up to a threshold. On October 16, 2012, the Board of Directors of the Company approved plan enhancements which will provide participants with additional company contributions in the plan effective January 1, 2013. The cost of these plans aggregated $16.9 million, $15.1 million and $15.6 million for the years ended December 31, 2012, 2011, and 2010, respectively.
Stock-Based Compensation
In December 2009, the Company adopted the Amended and Restated CIT Group Inc. Long-Term Incentive Plan (the “LTIP”), which provides for grants of stock-based awards to employees, executive officers and directors, and replaced the Predecessor CIT Group Inc. Long-Term Incentive Plan (the “Prior Plan”). The number of shares of common stock that may be issued for all purposes under the LTIP is 10,526,316. The LTIP was approved pursuant to the Modified Second Amended Prepackaged Reorganization Plan of CIT Group Inc. and CIT Group Funding Company of Delaware LLC and does not require shareholder approval.
Compensation expense related to equity-based awards are measured and recorded in accordance with ASC 718, Stock Compensation. The fair value of equity-based and stock purchase equity awards are measured at the date of grant using a Black-Scholes option pricing model, and the fair value of restricted stock and unit awards is based on the fair market value of CIT’s common stock on the date of grant. Compensation expense is recognized over the vesting period (requisite service period), which is generally three years for stock options and restricted stock/units, under the graded vesting method, whereby each vesting tranche of the award is amortized separately as if each were a separate award. Valuation assumptions for new equity awards are established at the start of each fiscal year.
Operating expenses includes $41.7 million of compensation expense related to equity-based awards granted to employees or members of the Board of Directors ($24.3 million after tax, $0.12 EPS) for the year ended December 31, 2012, including $0.1 million related to stock options ($0.1 million after tax), $0.2 million related to stock purchases, and $41.5 million related to restricted and retention stock and unit awards ($24.2 million after tax, $0.12 EPS). Compensation expense related to equity-based awards included $24.5 million ($14.3 million after-tax, $0.07 EPS) in 2011 and $31.2 million ($18.2 million after-tax, $0.09 EPS) in 2010, respectively.
Stock Options
No stock options were granted to employees or directors during 2012 and 2011, and no options were exercised during 2011.
In 2012, 7,805 stock options were exercised. The intrinsic value of options outstanding and exercisable as of December 31, 2012 was $0.5 million and $0.4 million, respectively.
Item 8: Financial Statements and Supplementary Data
138 CIT ANNUAL REPORT 2012
CIT GROUP AND SUBSIDIARIES — NOTES TO CONSOLIDATED FINANCIAL STATEMENTS
The following table summarizes stock option activity for 2012 and 2011:
| | | | 2012
| | 2011
| |
|---|
| | | | Options
| | Weighted
Average
Price Per
Option
| | Options
| | Weighted
Average
Price Per
Option
|
|---|
Outstanding at beginning of period | | | | | 68,100 | | | $ | 30.76 | | | | 68,100 | | | $ | 30.76 | |
| | | | | (7,805 | ) | | | 27.73 | | | | – | | | | – | |
Outstanding at end of period | | | | | 60,295 | | | | 31.16 | | | | 68,100 | | | | 30.76 | |
Options exercisable at end of period | | | | | 48,601 | | | | 30.76 | | | | 39,714 | | | | 29.97 | |
Options unvested at end of period | | | | | 11,694 | | | $ | 32.81 | | | | 28,386 | | | $ | 31.87 | |
The following table summarizes additional information about stock options outstanding.
Stock Options Outstanding
| | | | Options Outstanding
| | Options Exercisable
| |
|---|
Range of Exercise Price
| | | | Number
Outstanding
| | Weighted
Remaining
Average
Contractual
Life
| | Weighted
Average
Exercise
Price
| | Number
Exercisable
| | Weighted
Average
Exercise
Price
|
|---|
| | | | | | | | | | | | | | | | | | | | | | |
| �� | | | | 22,518 | | | | 4.0 | | | $ | 27.50 | | | | 22,518 | | | $ | 27.50 | |
| | | | | 35,361 | | | | 4.1 | | | $ | 32.81 | | | | 23,667 | | | $ | 32.82 | |
| | | | | 1,283 | | | | 4.4 | | | $ | 38.58 | | | | 1,283 | | | $ | 38.58 | |
| | | | | 1,133 | | | | 4.8 | | | $ | 43.70 | | | | 1,133 | | | $ | 43.70 | |
| | | | | 60,295 | | | | | | | | | | | | 48,601 | | | | | |
| | | | | | | | | | | | | | | | | | | | | | |
| | | | | 30,024 | | | | 4.2 | | | $ | 27.50 | | | | 25,018 | | | $ | 27.50 | |
| | | | | 35,660 | | | | 5.0 | | | $ | 32.82 | | | | 12,280 | | | $ | 32.84 | |
| | | | | 1,283 | | | | 5.4 | | | $ | 38.58 | | | | 1,283 | | | $ | 38.58 | |
| | | | | 1,133 | | | | 5.8 | | | $ | 43.70 | | | | 1,133 | | | $ | 43.70 | |
| | | | | 68,100 | | | | | | | | | | | | 39,714 | | | | | |
Pretax compensation cost related to employee stock options was essentially fully recognized at December 31, 2012 and totaled $0.1 million.
Employee Stock Purchase Plan
In December 2010, the Company adopted the CIT Group Inc. 2011 Employee Stock Purchase Plan (the “ESPP”), which was approved by shareholders in May 2011. Eligibility for participation in the ESPP includes employees of CIT and its participating subsidiaries who are customarily employed for at least 20 hours per week, except that any employees designated as highly compensated are not eligible to participate in the ESPP. The ESPP is available to employees in the United States and to certain international employees. Under the ESPP, CIT is authorized to issue up to 2,000,000 shares of common stock to eligible employees. Eligible employees can choose to have between 1% and 10% of their base salary withheld to purchase shares quarterly, at a purchase price equal to 85% of the fair market value of CIT common stock on the last business day of the quarterly offering period. The amount of common stock that may be purchased by a participant through the ESPP is generally limited to $25,000 per year. A total of 29,609 and 17,236 shares were purchased under the plan in 2012 and 2011, respectively.
Restricted Stock / Performance Units
Under the LTIP, Restricted Stock Units (“RSUs”) are awarded at no cost to the recipient upon grant. RSUs are generally granted annually at the discretion of the Company, but may also be granted during the year to new hires or for retention or other purposes. RSUs granted to employees and restricted stocks granted to members of the Board during 2012 and 2011 generally were scheduled to vest either one third per year for three years or 100% after three years. Certain vested stock awards were scheduled to remain subject to transfer restrictions through the first
CIT ANNUAL REPORT 2012 139
CIT GROUP AND SUBSIDIARIES — NOTES TO CONSOLIDATED FINANCIAL STATEMENTS
anniversary of the grant date for members of the Board who elected to receive stock in lieu of cash compensation for their retainer. Vested stock salary awards granted to a limited number of executives were scheduled to remain subject to transfer restrictions through the first and/or third anniversaries of the grant date. Certain RSUs granted to directors, and in limited instances to employees, are designed to settle in cash and are accounted for as “liability” awards as prescribed by ASC 718. The values of these cash-settled RSUs are re-measured at the end of each reporting period until the award is settled.
During 2012, Performance Stock Units (“PSUs”) were awarded to certain senior executives. The awards become payable only if CIT achieves certain growth and margin targets over a three-year performance period. PSU share payouts may increase or decrease from the target grant based on performance against these pre-established performance measures, with the actual number of shares ranging from 0% to a maximum of 200% of the target grant. Both performance measures have a minimum threshold level of performance that must be achieved to trigger any payout; if the threshold level of performance is not achieved for either performance measure, then no portion of the PSU target will be payable. Achievement against either performance measures is calculated independently of the other performance measure and each measure is weighted equally.
The fair value of restricted stock and RSUs that vested and settled in stock during 2012 and 2011 was $10.8 million and $11.1 million, respectively. The fair value of RSUs that vested and settled in cash during 2012 and 2011 was $0.4 million and $0.2 million, respectively.
The following tables summarize restricted stock and RSU activity for 2012 and 2011:
Stock and Cash – Settled Awards Outstanding
| | | | Stock-Settled Awards
| | Cash-Settled Awards
| |
|---|
| | | | Number of
Shares
| | Weighted
Average
Grant Date
Value
| | Number of
Shares
| | Weighted
Average
Grant Date
Value
|
|---|
| | | | | | | | | | | | | | | | | | |
Unvested at beginning of period | | | | | 979,393 | | | $ | 42.40 | | | | 13,964 | | | $ | 40.12 | |
Vested / unsettled Stock Salary at beginning of period | | | | | 72,238 | | | | 39.27 | | | | – | | | | n/a | |
PSUs – granted to employees | | | | | 106,511 | | | | 41.31 | | | | – | | | | n/a | |
RSUs – granted to employees | | | | | 1,130,494 | | | | 38.90 | | | | 8,117 | | | | 39.05 | |
RSUs – granted to directors | | | | | 30,409 | | | | 35.84 | | | | 1,815 | | | | 35.80 | |
| | | | | (56,735 | ) | | | 40.28 | | | | – | | | | n/a | |
| | | | | (264,899 | ) | | | 43.68 | | | | (10,972 | ) | | | 39.42 | |
Vested / unsettled Stock Salary Awards | | | | | (114,119 | ) | | | 38.20 | | | | (3,247 | ) | | | 39.05 | |
Unvested at end of period | | | | | 1,883,292 | | | $ | 40.15 | | | | 9,677 | | | $ | 39.56 | |
| | | | | | | | | | | | | | | | | | |
Unvested at beginning of period | | | | | 470,700 | | | $ | 36.65 | | | | 14,440 | | | $ | 38.42 | |
Vested / unsettled Stock Salary at beginning of period | | | | | 121,706 | | | | 38.59 | | | | – | | | | n/a | |
Stock Salary – granted to employees | | | | | 5,853 | | | | 46.98 | | | | – | | | | n/a | |
RSUs – granted to employees | | | | | 760,274 | | | | 44.28 | | | | – | | | | n/a | |
RSUs – granted to directors | | | | | 22,517 | | | | 42.63 | | | | 5,237.0 | | | | 42.97 | |
| | | | | (56,555 | ) | | | 41.72 | | | | – | | | | n/a | |
| | | | | (272,864 | ) | | | 37.11 | | | | (5,713.0 | ) | | | 38.45 | |
Vested / unsettled Stock Salary Awards | | | | | (72,238 | ) | | | 39.27 | | | | – | | | | n/a | |
Unvested at end of period | | | | | 979,393 | | | $ | 42.40 | | | | 13,964 | | | $ | 40.12 | |
Item 8: Financial Statements and Supplementary Data
140 CIT ANNUAL REPORT 2012
CIT GROUP AND SUBSIDIARIES — NOTES TO CONSOLIDATED FINANCIAL STATEMENTS
NOTE 19 — COMMITMENTS
The accompanying table summarizes credit-related commitments, as well as purchase and funding commitments:
Commitments(dollars in millions)
| | | | December 31, 2012
| |
|---|
| | | | Due to Expire
| | | | December 31,
2011
| |
|---|
| | | | Within
One Year
| | After
One Year
| | Total
Outstanding
| | Total
Outstanding
|
|---|
| | | | | | | | | | | | | | | | | | |
Financing and leasing assets | | | | $ | 287.8 | | | $ | 2,691.9 | | | $ | 2,979.7 | | | $ | 2,746.2 | |
| | | | | | | | | | | | | | | | | | |
Standby letters of credit | | | | | 47.6 | | | | 190.9 | | | | 238.5 | | | | 209.5 | |
| | | | | 53.6 | | | | – | | | | 53.6 | | | | 89.5 | |
| | | | | | | | | | | | | | | | | | |
Deferred purchase credit protection agreements | | | | | 1,841.5 | | | | – | | | | 1,841.5 | | | | 1,816.9 | |
Guarantees, acceptances and other recourse obligations | | | | | 12.3 | | | | 5.1 | | | | 17.4 | | | | 25.6 | |
Purchase and Funding Commitments | | | | | | | | | | | | | | | | | | |
Aerospace manufacturer purchase commitments | | | | | 493.2 | | | | 8,675.1 | | | | 9,168.3 | | | | 8,033.1 | |
Rail and other manufacturer purchase commitments | | | | | 492.2 | | | | 435.2 | | | | 927.4 | | | | 738.3 | |
Commercial loan portfolio purchase commitment | | | | | 1,258.3 | | | | – | | | | 1,258.3 | | | | – | |
Financing Commitments
Financing commitments, referred to as loan commitments, or lines of credit, reflect CIT’s agreements to lend to its customers, subject to the customers’ compliance with contractual obligations. The table above includes approximately $0.6 billion of commitments at December 31, 2012 and $0.4 billion at December 31, 2011 for instances where the customer is not in compliance with contractual obligations, and therefore CIT does not have the contractual obligation to lend. As financing commitments may not be fully drawn, expire unused, be reduced or cancelled at the customer’s request, and require the customer to be in compliance with certain conditions, total commitment amounts do not necessarily reflect actual future cash flow requirements.
At December 31, 2012, substantially all financing commitments were senior facilities. Most of the Company’s undrawn and available financing commitments are in Corporate Finance.
The table above excludes uncommitted revolving credit facilities extended by Trade Finance to its clients for working capital purposes. In connection with these facilities, Trade Finance has the sole discretion throughout the duration of these facilities to determine the amount of credit that may be made available to its clients at any time and whether to honor any specific advance requests made by its clients under these credit facilities.
The table above also excludes unused cancelable lines of credit to customers in connection with select third-party vendor programs, which may be used solely to finance additional product purchases, the total of which was not material for either period presented. These uncommitted lines of credit can be reduced, canceled or denied funding by CIT at any time without notice. Management’s experience indicates that customers related to vendor programs typically exercise their line of credit only when they need to purchase new products from a vendor and do not seek to exercise their entire available line of credit at any point in time.
Letters of Credit
In the normal course of meeting the needs of clients, CIT sometimes enters into agreements to provide financing and letters of credit. Standby letters of credit obligate the issuer of the letter of credit to pay the beneficiary if a client on whose behalf the letter of credit was issued does not meet its obligation. These financial instruments generate fees and involve, to varying degrees, elements of credit risk in excess of amounts recognized in the Consolidated Balance Sheets. To minimize potential credit risk, CIT generally requires collateral and in some cases additional forms of credit support from the client.
Deferred Purchase Agreements
A Deferred Purchase Agreement (“DPA”) is provided in conjunction with factoring, whereby CIT provides a client with credit protection for trade receivables without purchasing the receivables. The trade terms are generally sixty days or less. If the client’s customer is unable to pay an undisputed receivable solely as the result of credit risk, then CIT purchases the receivable from the client. The outstanding amount of DPAs is the maximum potential exposure that CIT would be required to pay under all DPAs. This maximum amount would only occur if all receivables subject to DPAs default in the manner described above, thereby requiring CIT to purchase all such receivables from the DPA clients.
The methodology used to determine the DPA liability is similar to the methodology used to determine the allowance for loan losses associated with the finance receivables, which reflects embedded losses based on various factors, including expected losses reflecting the Company’s internal customer and facility credit ratings. The liability recorded in Other Liabilities related to the DPAs totaled $5.6 million and $5.4 million at December 31, 2012 and December 31, 2011, respectively.
CIT ANNUAL REPORT 2012 141
CIT GROUP AND SUBSIDIARIES — NOTES TO CONSOLIDATED FINANCIAL STATEMENTS
Purchase and Funding Commitments
CIT’s purchase commitments relate primarily to purchases of commercial aircraft and rail equipment. Commitments to purchase new commercial aircraft are predominantly with Airbus Industries (“Airbus”) and The Boeing Company (“Boeing”), and also includes orders with Embraer S.A. (“Embraer”). CIT may also commit to purchase an aircraft directly with an airline. Aerospace equipment purchases are contracted for specific models, using baseline aircraft specifications at fixed prices, which reflect discounts from fair market purchase prices prevailing at the time of commitment. The delivery price of an aircraft may change depending on final specifications. Equipment purchases are recorded at the delivery date. The estimated commitment amounts in the preceding table are based on contracted purchase prices reduced for pre-delivery payments to date and exclude buyer furnished equipment selected by the lessee. Pursuant to existing contractual commitments, 161 aircraft remain to be purchased from Airbus, Boeing and Embraer. Aircraft deliveries are scheduled periodically through 2020. Commitments exclude unexercised options to order additional aircraft.
In 2012, the Company’s rail business entered into commitments to purchase 7,100 railcars from multiple manufacturers with delivery dates that began in 2012 and run through 2014. Pursuant to these and remaining 2011 contractual commitments, approximately 7,050 railcars remain to be purchased. Rail equipment purchase commitments are at fixed prices subject to price increases for certain materials.
The current year amount includes $1.3 billion related to December 2012 agreement to acquire commercial loan commitments.
NOTE 20 — CONTINGENCIES
Litigation
CIT is currently involved, and from time to time in the future may be involved, in a number of judicial, regulatory, and arbitration proceedings relating to matters that arise in connection with the conduct of its business (collectively, “Litigation”). In view of the inherent difficulty of predicting the outcome of Litigation matters, particularly when such matters are in their early stages or where the claimants seek indeterminate damages, CIT cannot state with confidence what the eventual outcome of the pending Litigation will be, what the timing of the ultimate resolution of these matters will be, or what the eventual loss, fines, or penalties related to each pending matter will be, if any. In accordance with applicable accounting guidance, CIT establishes reserves for Litigation when those matters present loss contingencies as to which it is both probable that a loss will occur and the amount of such loss can be reasonably estimated. Based on currently available information, CIT believes that the results of Litigation that is currently pending, taken together, will not have a material adverse effect on the Company’s financial condition, but may be material to the Company’s operating results or cash flows for any particular period, depending in part on its operating results for that period. The actual results of resolving such matters may be substantially higher than the amounts reserved.
For certain Litigation matters in which the Company is involved, the Company is able to estimate a range of reasonably possible losses in excess of established reserves and insurance. For other matters for which a loss is probable or reasonably possible, such an estimate cannot be determined. For Litigation where losses are reasonably possible, management currently estimates the aggregate range of reasonably possible losses as up to $320 million in excess of established reserves and insurance related to those matters, if any. This estimate represents reasonably possible losses (in excess of established reserves and insurance) over the life of such Litigation, which may span a currently indeterminable number of years, and is based on information currently available as of December 31, 2012. The matters underlying the estimated range will change from time to time, and actual results may vary significantly from this estimate.
Those Litigation matters for which an estimate is not reasonably possible or as to which a loss does not appear to be reasonably possible, based on current information, are not included within this estimated range and, therefore, this estimated range does not represent the Company’s maximum loss exposure.
The foregoing statements about CIT’s Litigation are based on the Company’s judgments, assumptions, and estimates and are necessarily subjective and uncertain. One of the Company’s pending Litigation matters is described below.
TYCO TAX AGREEMENT
In connection with the Company’s separation from Tyco International Ltd (“Tyco”) in 2002, CIT and Tyco entered into a Tax Agreement pursuant to which, among other things, CIT agreed to pay Tyco for tax savings actually realized by CIT, if any, as a result of the use of certain net operating losses arising during the period that Tyco owned CIT (the “Tyco Tax Attribute”), which savings would not have been realized absent the existence of the Tyco Tax Attribute. During CIT’s bankruptcy, CIT rejected the Tax Agreement, and Tyco and CIT entered into a Standstill Agreement pursuant to which (a) CIT agreed that it would defer bringing its subordination claim against Tyco and (b) Tyco agreed that it would defer bringing its damage claim against CIT while the parties exchanged information about CIT’s tax position, including past usage and retention of the various attributes on its consolidated tax return. Notwithstanding the Standstill Agreement, Tyco filed a Notice of Arbitration during the second quarter of 2011, demanding arbitration of its alleged contractual damages resulting from rejection of the Tax Agreement. CIT filed an adversary proceeding in the United States Bankruptcy Court for the Southern District of New York (the “Bankruptcy Court”), seeking to subordinate Tyco’s interests under section 510(b) of the Bankruptcy Code, which would result in Tyco being treated like equity holders under CIT’s confirmed Plan of Reorganization and receiving no recovery in connection with the termination of the Tax Agreement. In December, 2011, the Bankruptcy Court denied the request to subordinate Tyco’s interests (the “Decision”). In September, 2012, the Second Circuit Court of Appeals affirmed the Bankruptcy Court’s decision, thus the arbitration is proceeding.
The amount of the federal Tyco Tax Attribute could be as much as approximately $794 million and the state Tyco Tax Attribute could be as much as approximately $180 million as of the separation date. CIT’s approximate federal and state tax rates are currently 35% and 6.5%, respectively. CIT has recorded a valuation allowance against its federal net deferred tax assets and substantially
Item 8: Financial Statements and Supplementary Data
142 CIT ANNUAL REPORT 2012
CIT GROUP AND SUBSIDIARIES — NOTES TO CONSOLIDATED FINANCIAL STATEMENTS
all of its state net deferred tax assets, which include the deferred tax assets associated with the Tyco Tax Attribute, as the Company does not currently meet the criteria to recognize these assets. It is CIT’s position that it has not received federal tax benefits from the Tyco Tax Attribute within the meaning of the Tax Agreement and that it is speculative as to when, if ever, any such benefits may be realized in the future.
NOTE 21 — LEASE COMMITMENTS
The following table presents future minimum rental payments under non-cancellable long-term lease agreements for premises and equipment at December 31, 2012:
Future Minimum Rentals (dollars in millions)
| |
| | | | | | |
| | | | $ | 32.2 | |
| | | | | 29.7 | |
| | | | | 28.0 | |
| | | | | 25.6 | |
| | | | | 22.5 | |
| | | | | 76.1 | |
| | | | $ | 214.1 | |
In addition to fixed lease rentals, leases generally require payment of maintenance expenses and real estate taxes, both of which are subject to escalation provisions. Minimum payments includes $96.8 million ($12.5 million for 2013) which will be recorded against the facility exiting liability when paid and therefore will not be recorded as rental expense in future periods. Minimum payments have not been reduced by minimum sublease rentals of $71.4 million due in the future under non-cancellable subleases which will be recorded against the facility exiting liability when received. SeeNote 25 — “Severance and Facility Exiting Liabilities” for the liability related to closing facilities.
Rental expense for premises, net of sublease income (including restructuring charges from exiting office space), and equipment, was as follows.
Rental Expense (dollars in millions)
| | | | Years Ended December 31,
| |
|---|
| | | | 2012
| | 2011
| | 2010
|
|---|
| | | | $ | 19.8 | | | $ | 22.7 | | | $ | 63.9 | |
| | | | | 2.9 | | | | 2.7 | | | | 3.5 | |
| | | | $ | 22.7 | | | $ | 25.4 | | | $ | 67.4 | |
NOTE 22 — CERTAIN RELATIONSHIPS AND RELATED TRANSACTIONS
CIT invests in various trusts, partnerships, and limited liability corporations established in conjunction with structured financing transactions of equipment, power and infrastructure projects. CIT’s interests in these entities were entered into in the ordinary course of business. Other assets included approximately $69 million at December 31, 2012 and $76 million at December 31, 2011 of investments in non-consolidated entities relating to such transactions that are accounted for under the equity or cost methods.
The combination of investments in and loans to non-consolidated entities represents the Company’s maximum exposure to loss, as the Company does not provide guarantees or other forms of indemnification to non-consolidated entities.
Certain shareholders of CIT provide investment management, banking and investment banking services in the normal course of business.
NOTE 23 — BUSINESS SEGMENT INFORMATION
Management’s Policy in Identifying Reportable Segments
CIT’s reportable segments are comprised of strategic business units that are aggregated into segments primarily based upon industry categories and to a lesser extent, the core competencies relating to product origination, distribution methods, operations and servicing and the nature of their regulatory environment. This segment reporting is consistent with the presentation of financial information to management.
Types of Products and Services
CIT has five reportable segments: Corporate Finance, Transportation Finance, Trade Finance, Vendor Finance and Consumer. Corporate Finance and Trade Finance offer secured lending as well as other financial products and services predominately to small and midsize companies. These include secured revolving lines of credit and term loans, accounts receivable credit protection, accounts receivable collection, import and export financing, factoring, debtor-in-possession and turnaround financing and receivable advisory services. Transportation Finance offers secured lending and leasing products to midsize and larger companies across the aerospace, rail and defense industries. Vendor Finance partners with manufacturers and distributors to offer secured lending and leasing products predominantly to small and mid-size companies primarily in information technology, telecommunication and office equipment markets. Consumer includes a liquidating portfolio of predominately government-guaranteed student loans.
Segment Profit and Assets
The Company refined its expense and capital allocation methodologies during the first quarter of 2011. For 2011, Corporate and other includes certain costs that had been previously allocated to the segments, including prepayment penalties on high-cost debt payments and certain corporate liquidity costs. In addition, the Company refined the capital and interest allocation methodologies for the segments. Management considered these as changes in estimations to better refine segment profitability for users of the financial information on a go forward basis. These changes had the most impact on Transportation Finance given the capital requirements for their forward-purchase commitments and reduced the interest expense charged to this segment. On a comparable basis, income before provision for income taxes for Transportation Finance would have been approximately $270 million for the year ended December 31, 2011. These increases would be offset by decreases in Corporate and Other for the respective periods. The refinement was not significant to the other segments. The 2010 balances are reflected as originally reported and are not conformed to the 2011 presentation.
CIT ANNUAL REPORT 2012 143
CIT GROUP AND SUBSIDIARIES — NOTES TO CONSOLIDATED FINANCIAL STATEMENTS
Corporate and Other includes cash liquidity in excess of the amount required by the business units that management determines is prudent for the overall company, losses on debt extinguishments and the prepayment penalties associated with debt repayments.
Segment Pre-tax Income (Loss)(dollars in millions)
| | | | Corporate
Finance
| | Transportation
Finance
| | Trade
Finance
| | Vendor
Finance
| | Commercial
Segments
| | Consumer
| | Total
Segments
| | Corporate
and Other
| | Total
CIT
|
|---|
For the year ended December 31, 2012 | | | | | | | | | | | | | | | | | | | | | | | | | | | | | | | | | | | | | | |
| | | | $ | 623.6 | | | $ | 135.2 | | | $ | 57.6 | | | $ | 553.5 | | | $ | 1,369.9 | | | $ | 179.6 | | | $ | 1,549.5 | | | $ | 19.6 | | | $ | 1,569.1 | |
| | | | | (564.6 | ) | | | (1,233.5 | ) | | | (80.0 | ) | | | (473.6 | ) | | | (2,351.7 | ) | | | (231.7 | ) | | | (2,583.4 | ) | | | (314.0 | ) | | | (2,897.4 | ) |
Provision for credit losses | | | | | (7.3 | ) | | | (18.0 | ) | | | 0.9 | | | | (26.5 | ) | | | (50.9 | ) | | | (0.7 | ) | | | (51.6 | ) | | | – | | | | (51.6 | ) |
Rental income on operating leases | | | | | 8.9 | | | | 1,536.6 | | | | – | | | | 239.1 | | | | 1,784.6 | | | | – | | | | 1,784.6 | | | | – | | | | 1,784.6 | |
| | | | | 387.9 | | | | 56.3 | | | | 144.0 | | | | 27.6 | | | | 615.8 | | | | 40.3 | | | | 656.1 | | | | (3.0 | ) | | | 653.1 | |
Depreciation on operating lease equipment | | | | | (4.3 | ) | | | (419.7 | ) | | | – | | | | (109.2 | ) | | | (533.2 | ) | | | – | | | | (533.2 | ) | | | – | | | | (533.2 | ) |
| | | | | (244.0 | ) | | | (179.6 | ) | | | (118.4 | ) | | | (318.8 | ) | | | (860.8 | ) | | | (39.5 | ) | | | (900.3 | ) | | | (17.9 | ) | | | (918.2 | ) |
Loss on debt extinguishments | | | | | – | | | | – | | | | – | | | | – | | | | – | | | | – | | | | – | | | | (61.2 | ) | | | (61.2 | ) |
Income (loss) before (provision) benefit for income taxes | | | | $ | 200.2 | | | $ | (122.7 | ) | | $ | 4.1 | | | $ | (107.9 | ) | | $ | (26.3 | ) | | $ | (52.0 | ) | | $ | (78.3 | ) | | $ | (376.5 | ) | | $ | (454.8 | ) |
Select Period End Balances | | | | | | | | | | | | | | | | | | | | | | | | | | | | | | | | | | | | | | |
| | | | $ | 8,173.0 | | | $ | 1,853.2 | | | $ | 2,305.3 | | | $ | 4,818.7 | | | $ | 17,150.2 | | | $ | 3,697.4 | | | $ | 20,847.6 | | | | – | | | $ | 20,847.6 | |
Credit balances of factoring clients | | | | | – | | | | – | | | | (1,256.5 | ) | | | – | | | | (1,256.5 | ) | | | – | | | | (1,256.5 | ) | | | – | | | | (1,256.5 | ) |
| | | | | 56.8 | | | | 173.6 | | | | – | | | | 414.5 | | | | 644.9 | | | | 1.5 | | | | 646.4 | | | | – | | | | 646.4 | |
Operating lease equipment, net | | | | | 23.9 | | | | 12,173.6 | | | | – | | | | 214.2 | | | | 12,411.7 | | | | – | | | | 12,411.7 | | | | – | | | | 12,411.7 | |
For the year ended December 31, 2011 | | | | | | | | | | | | | | | | | | | | | | | | | | | | | | | | | | | | | | |
| | | | $ | 923.7 | | | $ | 155.9 | | | $ | 73.3 | | | $ | 788.4 | | | $ | 1,941.3 | | | $ | 266.5 | | | $ | 2,207.8 | | | $ | 20.9 | | | $ | 2,228.7 | |
| | | | | (706.1 | ) | | | (885.2 | ) | | | (90.9 | ) | | | (505.1 | ) | | | (2,187.3 | ) | | | (290.6 | ) | | | (2,477.9 | ) | | | (316.5 | ) | | | (2,794.4 | ) |
Provision for credit losses | | | | | (173.3 | ) | | | (12.8 | ) | | | (11.2 | ) | | | (69.3 | ) | | | (266.6 | ) | | | (3.1 | ) | | | (269.7 | ) | | | – | | | | (269.7 | ) |
Rental income on operating leases | | | | | 18.0 | | | | 1,375.6 | | | | – | | | | 273.9 | | | | 1,667.5 | | | | – | | | | 1,667.5 | | | | – | | | | 1,667.5 | |
| | | | | 546.5 | | | | 99.1 | | | | 156.1 | | | | 154.8 | | | | 956.5 | | | | 2.0 | | | | 958.5 | | | | (5.7 | ) | | | 952.8 | |
Depreciation on operating lease equipment | | | | | (7.8 | ) | | | (382.2 | ) | | | – | | | | (185.1 | ) | | | (575.1 | ) | | | – | | | | (575.1 | ) | | | – | | | | (575.1 | ) |
| | | | | (232.7 | ) | | | (160.2 | ) | | | (110.4 | ) | | | (312.8 | ) | | | (816.1 | ) | | | (65.4 | ) | | | (881.5 | ) | | | (15.1 | ) | | | (896.6 | ) |
Loss on debt extinguishments | | | | | – | | | | – | | | | – | | | | – | | | | – | | | | – | | | | – | | | | (134.8 | ) | | | (134.8 | ) |
Income (loss) before (provision) benefit for income taxes | | | | $ | 368.3 | | | $ | 190.2 | | | $ | 16.9 | | | $ | 144.8 | | | $ | 720.2 | | | $ | (90.6 | ) | | $ | 629.6 | | | $ | (451.2 | ) | | $ | 178.4 | |
Select Period End Balances | | | | | | | | | | | | | | | | | | | | | | | | | | | | | | | | | | | | | | |
| | | | $ | 6,862.7 | | | $ | 1,487.0 | | | $ | 2,431.4 | | | $ | 4,442.0 | | | $ | 15,223.1 | | | $ | 4,682.8 | | | $ | 19,905.9 | | | | – | | | $ | 19,905.9 | |
Credit balances of factoring clients | | | | | – | | | | – | | | | (1,225.5 | ) | | | – | | | | (1,225.5 | ) | | | – | | | | (1,225.5 | ) | | | – | | | | (1,225.5 | ) |
| | | | | 214.0 | | | | 84.0 | | | | – | | | | 371.6 | | | | 669.6 | | | | 1,662.7 | | | | 2,332.3 | | | | – | | | | 2,332.3 | |
Operating lease equipment, net | | | | | 35.0 | | | | 11,754.2 | | | | – | | | | 217.2 | | | | 12,006.4 | | | | – | | | | 12,006.4 | | | | – | | | | 12,006.4 | |
For the year ended December 31, 2010 | | | | | | | | | | | | | | | | | | | | | | | | | | | | | | | | | | | | | | |
| | | | $ | 1,692.9 | | | $ | 231.1 | | | $ | 99.9 | | | $ | 1,314.8 | | | $ | 3,338.7 | | | $ | 359.6 | | | $ | 3,698.3 | | | $ | 20.7 | | | $ | 3,719.0 | |
| | | | | (976.7 | ) | | | (972.9 | ) | | | (162.9 | ) | | | (715.0 | ) | | | (2,827.5 | ) | | | (245.0 | ) | | | (3,072.5 | ) | | | (7.2 | ) | | | (3,079.7 | ) |
Provision for credit losses | | | | | (496.9 | ) | | | (28.8 | ) | | | (58.6 | ) | | | (210.7 | ) | | | (795.0 | ) | | | (25.3 | ) | | | (820.3 | ) | | | – | | | | (820.3 | ) |
Rental income on operating leases | | | | | 24.7 | | | | 1,244.2 | | | | – | | | | 380.5 | | | | 1,649.4 | | | | – | | | | 1,649.4 | | | | (1.0 | ) | | | 1,648.4 | |
| | | | | 603.6 | | | | 82.1 | | | | 188.1 | | | | 164.9 | | | | 1,038.7 | | | | 9.7 | | | | 1,048.4 | | | | (43.5 | ) | | | 1,004.9 | |
Depreciation on operating lease equipment | | | | | (12.0 | ) | | | (334.1 | ) | | | – | | | | (330.1 | ) | | | (676.2 | ) | | | – | | | | (676.2 | ) | | | 0.4 | | | | (675.8 | ) |
| | | | | (279.0 | ) | | | (152.0 | ) | | | (122.5 | ) | | | (329.2 | ) | | | (882.7 | ) | | | (79.4 | ) | | | (962.1 | ) | | | (63.0 | ) | | | (1,025.1 | ) |
Income (loss) before (provision) benefit for income taxes | | | | $ | 556.6 | | | $ | 69.6 | | | $ | (56.0 | ) | | $ | 275.2 | | | $ | 845.4 | | | $ | 19.6 | | | $ | 865.0 | | | $ | (93.6 | ) | | $ | 771.4 | |
Select Period End Balances | | | | | | | | | | | | | | | | | | | | | | | | | | | | | | | | | | | | | | |
| | | | $ | 8,072.9 | | | $ | 1,390.3 | | | $ | 2,387.4 | | | $ | 4,721.9 | | | $ | 16,572.5 | | | $ | 8,075.9 | | | $ | 24,648.4 | | | | – | | | $ | 24,648.4 | |
Credit balances of factoring clients | | | | | – | | | | – | | | | (935.3 | ) | | | – | | | | (935.3 | ) | | | – | | | | (935.3 | ) | | | – | | | | (935.3 | ) |
| | | | | 219.2 | | | | 2.8 | | | | – | | | | 757.4 | | | | 979.4 | | | | 246.7 | | | | 1,226.1 | | | | – | | | | 1,226.1 | |
Operating lease equipment, net | | | | | 74.5 | | | | 10,634.4 | | | | – | | | | 446.1 | | | | 11,155.0 | | | | – | | | | 11,155.0 | | | | – | | | | 11,155.0 | |
Item 8: Financial Statements and Supplementary Data
144 CIT ANNUAL REPORT 2012
CIT GROUP AND SUBSIDIARIES — NOTES TO CONSOLIDATED FINANCIAL STATEMENTS
Geographic Information
The following table presents information by major geographic region based upon the location of the Company’s legal entities.
Geographic Regions(dollars in millions)
| | | | | | Total
Assets
| | Total
Revenue
| | Income (loss)
before income
taxes
| | Income (loss)
before
noncontrolling
interests
|
|---|
| | | | | | $ | 30,829.1 | | | $ | 2,566.0 | | | $ | (1,043.7 | ) | | $ | (1,102.7 | ) |
| | | | | | | 32,338.3 | | | | 3,042.6 | | | | (660.5 | ) | | | (687.6 | ) |
| | | | | | | 36,737.4 | | | | 4,142.2 | | | | (399.6 | ) | | | (471.1 | ) |
| | | | | | | 7,274.9 | | | | 822.7 | | | | 224.7 | | | | 195.4 | |
| | | | | | | 6,938.2 | | | | 897.6 | | | | 238.8 | | | | 196.3 | |
| | | | | | | 6,749.7 | | | | 1,143.6 | | | | 457.0 | | | | 370.7 | |
| | | | | | | 5,908.0 | | | | 618.1 | | | | 364.2 | | | | 318.7 | |
| | | | | | | 5,986.9 | | | | 908.8 | | | | 600.1 | | | | 511.1 | |
| | | | | | | 7,966.3 | | | | 1,086.5 | | | | 714.0 | | | | 626.1 | |
| | | | | | | 44,012.0 | | | | 4,006.8 | | | | (454.8 | ) | | | (588.6 | ) |
| | | | | | | 45,263.4 | | | | 4,849.0 | | | | 178.4 | | | | 19.8 | |
| | | | | | | 51,453.4 | | | | 6,372.3 | | | | 771.4 | | | | 525.7 | |
(1) | | Includes Canada region results which had income before income taxes of $164.3 million in 2012, $257.7 million in 2011 and $350.7 million in 2010 and income before noncontrolling interests of $112.0 million in 2012, $207.0 million in 2011 and $303.4 million in 2010. |
(2) | | Includes Caribbean region results which had income before income taxes of $203.5 million in 2012, $230.4 million in 2011 and $225.6 million in 2010 and income before noncontrolling interests of $199.7 million in 2012, $228.2 million in 2011 and $224.1 million in 2010. |
NOTE 24 — GOODWILL AND INTANGIBLE ASSETS
The following tables summarize goodwill and intangible assets, net balances by segment:
Goodwill (dollars in millions)
| | | | Transportation
Finance
| | Trade
Finance
| | Vendor
Finance
| | Total
|
|---|
December 31, 2010 – As Reported | | | | $ | 175.5 | | | $ | 41.6 | | | $ | 123.3 | | | $ | 340.4 | |
| | | | | 7.6 | | | | 1.8 | | | | 5.7 | | | | 15.1 | |
| | | | | – | | | | – | | | | (9.6 | ) | | | (9.6 | ) |
December 31, 2011 – Revised | | | | | 183.1 | | | | 43.4 | | | | 119.4 | | | | 345.9 | |
| | | | | – | | | | – | | | | – | | | | – | |
| | | | $ | 183.1 | | | $ | 43.4 | | | $ | 119.4 | | | $ | 345.9 | |
(1) | | Revisions to Goodwill correspond to the recording of corrections that impacted pre-December 2009 results. As required by Fresh Start Accounting, stockholders’ equity was stated at fair value at December 31, 2009; therefore the net effect of the corrections discussed in Note 27 was an adjustment to Goodwill. |
Goodwill was recorded in conjunction with FSA and represented the excess of reorganization equity value over the fair value of tangible and identifiable intangible assets, net of liabilities. Such amounts were revised in 2012 as discussed inNote 27. Goodwill was allocated to the Transportation Finance, Trade Finance and Vendor Finance segments based on the respective segment’s estimated fair value of equity. Goodwill is assigned to a segment (or “reporting unit”) at the date the goodwill is initially recorded. Once goodwill has been assigned, it no longer retains its association with a particular event or acquisition, and all of the activities within a reporting unit, whether acquired or internally generated, are available to support the value of the goodwill.
The Company periodically reviews and evaluates its goodwill and intangible assets for potential impairment in accordance with ASC 350,Intangibles — Goodwill and Other. This review is conducted at a minimum annually or more frequently if circumstances indicate that impairment is possible.
The Company follows guidance in ASU 2011-08,Intangibles-Goodwill and Other (Topic 350), Testing Goodwill for Impairment that includes the option to first assess qualitative factors to determine whether the existence of events or circumstances leads to a determination that it is more likely than not that the fair value of a reporting unit is less than its carrying amount before performing the two-step impairment test as required in ASC 350, Intangibles – Goodwill and Other. Examples of qualitative factors to assess include macroeconomic conditions, industry and market considerations, market changes affecting the Company’s products and
CIT ANNUAL REPORT 2012 145
CIT GROUP AND SUBSIDIARIES — NOTES TO CONSOLIDATED FINANCIAL STATEMENTS
services, overall financial performance, and company specific events affecting operations.
For goodwill impairment testing in 2012, CIT performed a qualitative assessment for the Trade Finance goodwill. In performing this assessment, management relied on a number of factors, including operating results, business plans, economic projections, anticipated future cash flows and market place data. Based on the factors, management concluded that it was more likely than not that the fair value of the Trade Finance reporting unit was more than its carrying amount, including goodwill, indicating no impairment.
Vendor Finance and Transportation Finance 2012 goodwill impairment testing was performed using Step 1 analysis utilizing estimated fair value based on peer price to earnings (PE) and tangible book value (TBV) multiples. Management concluded, based on performing Step 1 analysis, that the fair values of the Vendor and Transportation Finance reporting units exceed their respective carrying values, including goodwill. As the results of the impairment assessment and first step test showed no indication of impairment in any of the reporting units, the Company did not perform the second step of the impairment test for any of the reporting units.
CIT performed qualitative assessments for Transportation Finance and Trade Finance goodwill impairment testing in 2011. In such assessments, the Company concluded that it is more likely than not that the fair value of the Transportation Finance and Trade Finance reporting units were more than their carrying amounts, including goodwill. The qualitative factors considered in this assessment include the Company’s market valuation, the reporting units’ profitability and the general economic outlook.
For the Vendor Finance segment, Step 1 of goodwill impairment testing was completed by comparing the segment’s estimated fair value with its carrying value, including goodwill as of December 31, 2011. The Company concluded that Vendor Finance fair value was in excess of carrying value. For the purposes of this first step impairment analysis, the Company primarily utilized valuation multiples for publicly traded companies comparable to its reporting segments to determine the fair market value of its reporting units. As the results of the impairment assessment and first step test showed no indication of impairment in any of the reporting units, the Company did not perform the second step of the impairment test for any of the reporting units.
Intangible Assets (dollars in millions)
| | | | Transportation
Finance
|
|---|
| | | | $ | 119.2 | |
| | | | | (56.1 | ) |
| | | | | 0.5 | |
| | | | | 63.6 | |
| | | | | (24.8 | ) |
| | | | | (6.9 | ) |
| | | | $ | 31.9 | |
The Transportation Finance intangible assets recorded in conjunction with FSA is comprised of amounts related to favorable (above current market rates) operating leases. The net intangible asset will be amortized as an offset to rental income over the remaining life of the leases, generally 5 years or less.
Accumulated amortization totaled $161.9 million at December 31, 2012. Projected amortization for the years ended December 31, 2013 through December 31, 2017 is approximately $11.6 million, $8.0 million, $5.6 million, $3.2 million, and $0.8 million, respectively.
NOTE 25 — SEVERANCE AND FACILITY EXITING LIABILITIES
The following table summarizes previously established liabilities (pre-tax) related to closing facilities and employee severance:
Severance and Facility Exiting Liabilities (dollars in millions)
| | | | Severance
| | Facilities
| |
|---|
| | | | Number of
Employees
| | Liability
| | Number of
Facilities
| | Liability
| | Total
Liabilities
|
|---|
| | | | | 27 | | | $ | 2.5 | | | | 16 | | | $ | 56.6 | | | $ | 59.1 | |
Additions and adjustments | | | | | 294 | | | | 11.4 | | | | 3 | | | | 3.9 | | | | 15.3 | |
| | | | | (242 | ) | | | (10.4 | ) | | | – | | | | (15.7 | ) | | | (26.1 | ) |
| | | | | 79 | | | | 3.5 | | | | 19 | | | | 44.8 | | | | 48.3 | |
Additions and adjustments | | | | | 193 | | | | 20.5 | | | | 5 | | | | 3.4 | | | | 23.9 | |
| | | | | (209 | ) | | | (16.7 | ) | | | (8 | ) | | | (9.4 | ) | | | (26.1 | ) |
| | | | | 63 | | | $ | 7.3 | | | | 16 | | | $ | 38.8 | | | $ | 46.1 | |
CIT continues to implement various organization efficiency and cost reduction initiatives. The severance additions primarily relate to employee termination benefits incurred in conjunction with these initiatives. The facility additions primarily relate to location closings and consolidations in connection with the outsourcing of SLX servicing. These additions, along with charges related to accelerated vesting of equity and other benefits, were recorded as part of the $22.7 million and $13.1 million provisions for the years ended December 31, 2012 and 2011, respectively.
Item 8: Financial Statements and Supplementary Data
146 CIT ANNUAL REPORT 2012
CIT GROUP AND SUBSIDIARIES — NOTES TO CONSOLIDATED FINANCIAL STATEMENTS
NOTE 26 — PARENT COMPANY FINANCIAL STATEMENTS
The following tables present the Parent Company only financial statements:
Condensed Parent Company Only Balance Sheet (dollars in millions)
| | | | December 31,
2012
| | December 31,
2011
|
|---|
| | | | | | | | | | |
| | | | $ | 1,307.4 | | | $ | 2,937.3 | |
Cash held at bank subsidiary | | | | | 15.2 | | | | 30.2 | |
| | | | | 750.3 | | | | 839.4 | |
Receivables from nonbank subsidiaries | | | | | 15,197.9 | | | | 16,450.7 | |
Receivables from bank subsidiaries | | | | | 15.6 | | | | 12.0 | |
Investment in nonbank subsidiaries | | | | | 6,547.2 | | | | 10,639.9 | |
Investment in bank subsidiaries | | | | | 2,437.2 | | | | 2,116.6 | |
| | | | | 345.9 | | | | 345.9 | |
| | | | | 547.7 | | | | 1,038.5 | |
| | | | $ | 27,164.4 | | | $ | 34,410.5 | |
| | | | | | | | | | |
| | | | $ | 11,822.6 | | | $ | 15,878.3 | |
Liabilities to nonbank subsidiaries | | | | | 6,386.8 | | | | 8,689.7 | |
| | | | | 620.2 | | | | 958.9 | |
| | | | | 18,829.6 | | | | 25,526.9 | |
Total Stockholders’ Equity | | | | | 8,334.8 | | | | 8,883.6 | |
Total Liabilities and Equity | | | | $ | 27,164.4 | | | $ | 34,410.5 | |
CIT ANNUAL REPORT 2012 147
CIT GROUP AND SUBSIDIARIES — NOTES TO CONSOLIDATED FINANCIAL STATEMENTS
Condensed Parent Company Only Statements of Operations and Comprehensive Income (dollars in millions)
| | | | Years Ended December 31,
| |
|---|
| | | | 2012
| | 2011
| | 2010
|
|---|
| | | | | | | | | | | | | | |
Interest income from nonbank subsidiaries | | | | $ | 737.6 | | | $ | 730.0 | | | $ | 979.9 | |
Interest and dividends on interest bearing deposits and investments | | | | | 2.6 | | | | 3.2 | | | | 2.1 | |
Dividends from nonbank subsidiaries | | | | | 834.0 | | | | – | | | | – | |
Other income from subsidiaries | | | | | 181.0 | | | | 413.7 | | | | 446.4 | |
| | | | | (37.7 | ) | | | 47.8 | | | | 58.5 | |
| | | | | 1,717.5 | | | | 1,194.7 | | | | 1,486.9 | |
| | | | | | | | | | | | | | |
| | | | | (2,345.9 | ) | | | (2,141.5 | ) | | | (1,839.9 | ) |
Interest expense on liabilities to subsidiaries | | | | | (293.6 | ) | | | (568.1 | ) | | | (600.5 | ) |
| | | | | (242.3 | ) | | | (420.4 | ) | | | (459.6 | ) |
| | | | | (2,881.8 | ) | | | (3,130.0 | ) | | | (2,900.0 | ) |
Loss before income taxes and equity in undistributed net income of subsidiaries | | | | | (1,164.3 | ) | | | (1,935.3 | ) | | | (1,413.1 | ) |
Provision for income taxes | | | | | 482.2 | | | | 656.6 | | | | 413.9 | |
Loss before equity in undistributed net income of subsidiaries | | | | | (682.1 | ) | | | (1,278.7 | ) | | | (999.2 | ) |
Equity in undistributed net income of bank subsidiaries | | | | | 41.3 | | | | 67.2 | | | | 100.9 | |
Equity in undistributed net income of nonbank subsidiaries | | | | | 48.5 | | | | 1,226.3 | | | | 1,419.6 | |
| | | | | (592.3 | ) | | | 14.8 | | | | 521.3 | |
Other Comprehensive income (loss), net of tax | | | | | 4.9 | | | | (81.5 | ) | | | (1.1 | ) |
Comprehensive income (loss) | | | | $ | (587.4 | ) | | $ | (66.7 | ) | | $ | 520.2 | |
Item 8: Financial Statements and Supplementary Data
148 CIT ANNUAL REPORT 2012
CIT GROUP AND SUBSIDIARIES — NOTES TO CONSOLIDATED FINANCIAL STATEMENTS
Condensed Parent Company Only Statements of Cash Flows (dollars in millions)
| | | | Years Ended December 31,
| |
|---|
| | | | 2012
| | 2011
| | 2010
|
|---|
Cash Flows From Operating Activities: | | | | | | | | | | | | | | |
| | | | $ | (592.3 | ) | | $ | 14.8 | | | $ | 521.3 | |
Equity in undistributed (earnings) losses of subsidiaries | | | | | (89.8 | ) | | | (1,293.5 | ) | | | (1,520.5 | ) |
Other operating activities, net | | | | | 1,524.3 | | | | 2,704.1 | | | | 159.3 | |
Net cash flows provided by (used in) operations | | | | | 842.2 | | | | 1,425.4 | | | | (839.9 | ) |
Cash Flows From Investing Activities: | | | | | | | | | | | | | | |
Decrease (Increase) in investments and advances to subsidiaries | | | | | 4,053.1 | | | | 17,291.2 | | | | (302.9 | ) |
Other investing activities, net | | | | | 89.1 | | | | (839.4 | ) | | | 229.8 | |
Net cash flows provided by (used in) investing activities | | | | | 4,142.2 | | | | 16,451.8 | | | | (73.1 | ) |
Cash Flows From Financing Activities: | | | | | | | | | | | | | | |
Proceeds from the issuance of term debt | | | | | 9,750.0 | | | | 2,000.0 | | | | – | |
| | | | | (15,239.8 | ) | | | (6,020.6 | ) | | | (307.5 | ) |
Net change in liabilities to subsidiaries | | | | | (1,139.5 | ) | | | (13,614.7 | ) | | | 2,832.8 | |
Net cash flows provided by (used in) financing activities | | | | | (6,629.3 | ) | | | (17,635.3 | ) | | | 2,525.3 | |
Net increase (decrease) in unrestricted cash and cash equivalents | | | | | (1,644.9 | ) | | | 241.9 | | | | 1,612.3 | |
Unrestricted cash and cash equivalents, beginning of period | | | | | 2,967.5 | | | | 2,725.6 | | | | 1,113.3 | |
Unrestricted cash and cash equivalents, end of period | | | | $ | 1,322.6 | | | $ | 2,967.5 | | | $ | 2,725.6 | |
| | | | | | | | | | | | | | |
CIT ANNUAL REPORT 2012 149
CIT GROUP AND SUBSIDIARIES — NOTES TO CONSOLIDATED FINANCIAL STATEMENTS
NOTE 27 — SELECTED QUARTERLY FINANCIAL DATA
Selected Quarterly Financial Data(dollars in millions)
| | | | Unaudited
| |
|---|
| | | | Fourth
Quarter
| | Third
Quarter
| | Second
Quarter
| | First
Quarter
|
|---|
| | | | | | Revised | | Revised | | Revised |
|---|
For the year ended December 31, 2012 | | | | | | | | | | | | | | | | | | |
| | | | $ | 357.0 | | | $ | 375.5 | | | $ | 410.3 | | | $ | 426.3 | |
| | | | | (366.6 | ) | | | (816.0 | ) | | | (634.2 | ) | | | (1,080.6 | ) |
Provision for credit losses | | | | | (0.1 | ) | | | – | | | | (8.9 | ) | | | (42.6 | ) |
Rental income on operating leases | | | | | 452.0 | | | | 445.8 | | | | 446.2 | | | | 440.6 | |
Other income, excluding rental income on operating leases | | | | | 171.7 | | | | 86.7 | | | | 139.4 | | | | 255.3 | |
Depreciation on operating lease equipment | | | | | (130.3 | ) | | | (134.5 | ) | | | (130.8 | ) | | | (137.6 | ) |
| | | | | (231.9 | ) | | | (235.2 | ) | | | (226.8 | ) | | | (224.3 | ) |
Loss on debt extinguishments | | | | | – | | | | (16.8 | ) | | | (21.5 | ) | | | (22.9 | ) |
Provision for income taxes | | | | | (44.2 | ) | | | (3.9 | ) | | | (45.4 | ) | | | (40.3 | ) |
Noncontrolling interests, after tax | | | | | (0.8 | ) | | | (0.8 | ) | | | (1.2 | ) | | | (0.9 | ) |
| | | | $ | 206.8 | | | $ | (299.2 | ) | | $ | (72.9 | ) | | $ | (427.0 | ) |
Net income (loss) per diluted share | | | | $ | 1.03 | | | $ | (1.49 | ) | | $ | (0.36 | ) | | $ | (2.13 | ) |
| | | | | | | | | | |
For the year ended December 31, 2011 | | | | | | | | | | | | | | | | | | |
| | | | $ | 491.3 | | | $ | 501.3 | | | $ | 598.5 | | | $ | 637.6 | |
| | | | | (690.4 | ) | | | (602.9 | ) | | | (805.4 | ) | | | (695.7 | ) |
Provision for credit losses | | | | | (15.8 | ) | | | (47.4 | ) | | | (84.1 | ) | | | (122.4 | ) |
Rental income on operating leases | | | | | 428.0 | | | | 409.4 | | | | 420.6 | | | | 409.5 | |
Other income, excluding rental income on operating leases | | | | | 206.0 | | | | 242.0 | | | | 233.1 | | | | 271.7 | |
Depreciation on operating lease equipment | | | | | (137.1 | ) | | | (124.4 | ) | | | (153.3 | ) | | | (160.3 | ) |
| | | | | (222.5 | ) | | | (227.5 | ) | | | (240.3 | ) | | | (206.3 | ) |
Gain (loss) on debt extinguishments | | | | | 11.8 | | | | (146.6 | ) | | | – | | | | – | |
(Provision) benefit for income taxes | | | | | (32.9 | ) | | | (43.6 | ) | | | (24.4 | ) | | | (57.7 | ) |
Noncontrolling interests, after tax | | | | | (2.1 | ) | | | 0.6 | | | | 0.7 | | | | (4.2 | ) |
| | | | $ | 36.3 | | | $ | (39.1 | ) | | $ | (54.6 | ) | | $ | 72.2 | |
Net income (loss) per diluted share | | | | $ | 0.18 | | | $ | (0.19 | ) | | $ | (0.27 | ) | | $ | 0.36 | |
As noted above, the amounts for prior quarters were revised. Presented below are revised quarterly and year to date financial statements, along with select notes to the quarterly financial statements that were impacted by the revisions.
In preparing its quarterly financial statements for the first three quarters of 2012, the Company discovered, corrected and disclosed the larger amounts in those quarters immaterial errors that impacted prior periods. Additional out-of-period errors were identified in the fourth quarter. These additional out-of-period errors were individually and in the aggregate not material to the fourth quarter results but, when combined with the other out-of-period errors previously identified this year, were determined by management to be material to the full year 2012 results. When reviewing the impact of these immaterial errors on prior periods, management concluded that the corrections did not, individually or in the aggregate, result in a material misstatement of the Company’s consolidated financial statements for any prior periods.
The cumulative effect of these revisions increased shareholders’ equity by $23 million, increased total assets by $19 million, and decreased total liabilities by $4 million as described in more detail in the following tables. As a result of these revisions, the net loss for the quarters ended September 30 and March 31, 2012 was decreased by approximately $6 million and $20 million, respectively, and the net loss for the quarter ended June 30, 2012 was increased by $2 million, from our previously reported amounts. As a result of these revisions, the net income for the years ended December 31, 2011 and 2010 decreased by $12 million and $3 million, respectively, from previously reported amounts. As a result of our adoption of fresh start accounting, the recognition of amounts relating to periods prior to 2010 resulted in a corresponding $15 million increase to goodwill.
The Company will revise in subsequent quarterly filings on Form 10-Q and has revised in this Form 10-K, its previously reported financial statements for 2012, 2011 and 2010.
The following tables reflect the previously reported balances, required corrections and revised amounts impacting the statements of operations, balance sheets, statement of stockholders’ equity and statement of cash flows along with descriptions of significant corrections.
Item 8: Financial Statements and Supplementary Data
150 CIT ANNUAL REPORT 2012
CIT GROUP AND SUBSIDIARIES — NOTES TO CONSOLIDATED FINANCIAL STATEMENTS
CONSOLIDATED BALANCE SHEETS (dollars in millions, except per share data)
| | | | Unaudited
| |
|---|
| | | | At September 30, 2012
| | At June 30, 2012
| | At March 31, 2012
| |
|---|
| | | | As
Reported
| | As
Revised
| | As
Reported
| | As
Revised
| | As
Reported
| | As
Revised
|
|---|
| | | | | | | | | | | | | | | | | | | | | | | | | | |
| | | | $ | 6,455.5 | | | $ | 6,455.5 | | | $ | 6,093.2 | | | $ | 6,094.3 | | | $ | 6,336.1 | | | $ | 6,337.2 | |
| | | | | 1,004.6 | | | | 1,016.2 | | | | 1,184.3 | | | | 1,194.1 | | | | 1,334.2 | | | | 1,343.0 | |
Trading assets at fair value – derivatives | | | | | 29.3 | | | | 29.3 | | | | 36.2 | | | | 36.2 | | | | 20.9 | | | | 20.9 | |
| | | | | 1,421.1 | | | | 1,421.1 | | | | 1,434.0 | | | | 1,434.0 | | | | 1,701.9 | | | | 1,701.9 | |
| | | | | 20,383.4 | | | | 20,383.4 | | | | 20,100.5 | | | | 20,097.9 | | | | 20,490.6 | | | | 20,511.5 | |
Allowance for loan losses | | | | | (397.9 | ) | | | (397.9 | ) | | | (414.2 | ) | | | (414.2 | ) | | | (420.0 | ) | | | (420.0 | ) |
Operating lease equipment, net(3) | | | | | 12,072.0 | | | | 12,086.7 | | | | 11,896.4 | | | | 11,911.2 | | | | 11,904.0 | | | | 11,918.9 | |
| | | | | 330.8 | | | | 345.9 | | | | 330.8 | | | | 345.9 | | | | 330.8 | | | | 345.9 | |
| | | | | 37.3 | | | | 37.3 | | | | 42.3 | | | | 42.3 | | | | 50.0 | | | | 50.0 | |
Unsecured counterparty receivable | | | | | 592.9 | | | | 584.4 | | | | 638.2 | | | | 629.8 | | | | 700.1 | | | | 697.4 | |
| | | | | 1,651.9 | | | | 1,638.2 | | | | 1,454.3 | | | | 1,434.7 | | | | 1,694.4 | | | | 1,674.9 | |
| | | | $ | 43,580.9 | | | $ | 43,600.1 | | | $ | 42,796.0 | | | $ | 42,806.2 | | | $ | 44,143.0 | | | $ | 44,181.6 | |
| | | | | | | | | | | | | | | | | | | | | | | | | | |
| | | | $ | 8,709.3 | | | $ | 8,709.3 | | | $ | 7,163.6 | | | $ | 7,163.6 | | | $ | 6,814.7 | | | $ | 6,814.7 | |
Trading liabilities at fair value – derivatives | | | | | 81.9 | | | | 81.9 | | | | 54.8 | | | | 54.8 | | | | 86.7 | | | | 86.7 | |
Credit balances of factoring clients | | | | | 1,224.9 | | | | 1,224.9 | | | | 1,164.1 | | | | 1,164.1 | | | | 1,109.8 | | | | 1,109.8 | |
| | | | | 2,567.4 | | | | 2,544.7 | | | | 2,494.2 | | | | 2,472.3 | | | | 2,574.4 | | | | 2,579.1 | |
Total long-term borrowings(3) | | | | | 22,906.5 | | | | 22,925.5 | | | | 23,534.3 | | | | 23,553.5 | | | | 25,101.1 | | | | 25,120.6 | |
| | | | | 35,490.0 | | | | 35,486.3 | | | | 34,411.0 | | | | 34,408.3 | | | | 35,686.7 | | | | 35,710.9 | |
| | | | | | | | | | | | | | | | | | | | | | | | | | |
| | | | | 2.0 | | | | 2.0 | | | | 2.0 | | | | 2.0 | | | | 2.0 | | | | 2.0 | |
| | | | | 8,491.0 | | | | 8,491.0 | | | | 8,481.5 | | | | 8,481.5 | | | | 8,471.7 | | | | 8,471.7 | |
(Accumulated deficit)/retained earnings(7) | | | | | (290.0 | ) | | | (281.4 | ) | | | 14.9 | | | | 17.8 | | | | 85.6 | | | | 90.7 | |
Accumulated other comprehensive (loss) income(5) | | | | | (100.3 | ) | | | (86.0 | ) | | | (101.0 | ) | | | (91.0 | ) | | | (89.6 | ) | | | (80.3 | ) |
| | | | | (16.7 | ) | | | (16.7 | ) | | | (16.5 | ) | | | (16.5 | ) | | | (16.5 | ) | | | (16.5 | ) |
Total common stockholders’ equity | | | | | 8,086.0 | | | | 8,108.9 | | | | 8,380.9 | | | | 8,393.8 | | | | 8,453.2 | | | | 8,467.6 | |
| | | | | 4.9 | | | | 4.9 | | | | 4.1 | | | | 4.1 | | | | 3.1 | | | | 3.1 | |
| | | | | 8,090.9 | | | | 8,113.8 | | | | 8,385.0 | | | | 8,397.9 | | | | 8,456.3 | | | | 8,470.7 | |
Total liabilities and equity | | | | $ | 43,580.9 | | | $ | 43,600.1 | | | $ | 42,796.0 | | | $ | 42,806.2 | | | $ | 44,143.0 | | | $ | 44,181.6 | |
Book Value Per Common Share | | | | | | | | | | | | | | | | | | | | | | | | | | |
Book value per common share | | | | $ | 40.26 | | | $ | 40.37 | | | $ | 41.73 | | | $ | 41.79 | | | $ | 42.09 | | | $ | 42.17 | |
Tangible book value per common share | | | | $ | 38.43 | | | $ | 38.47 | | | $ | 39.87 | | | $ | 39.86 | | | $ | 40.20 | | | $ | 40.19 | |
| |
The following table presents corrected balances to assets and liabilities related to Variable Interest Entities (VIEs) that are consolidated by the Company. The difference between total VIE assets and liabilities represents the Company’s interest in those entities, which were eliminated in consolidation. The assets of the consolidated VIEs will be used to settle the liabilities of those entities and, except for the Company’s interest in the VIEs, are generally not available to the creditors of CIT or any affiliates of CIT.
|
| | | | | | | | | | | | | | | | | | | | | | | | | | |
Interest bearing deposits, restricted | | | | $ | 650.9 | | | $ | 650.9 | | | $ | 615.1 | | | $ | 615.1 | | | $ | 745.3 | | | $ | 539.0 | |
| | | | | 570.5 | | | | 570.5 | | | | 617.2 | | | | 617.2 | | | | 36.6 | | | | 36.6 | |
Total loans, net of allowance for loan losses | | | | | 7,610.5 | | | | 7,610.5 | | | | 7,488.2 | | | | 7,488.2 | | | | 8,553.2 | | | | 8,553.2 | |
Operating lease equipment, net | | | | | 4,427.1 | | | | 4,427.1 | | | | 4,251.3 | | | | 4,251.3 | | | | 4,247.4 | | | | 4,247.4 | |
| | | | $ | 13,259.0 | | | $ | 13,259.0 | | | $ | 12,971.8 | | | $ | 12,971.8 | | | $ | 13,582.5 | | | $ | 13,376.2 | |
| | | | | | | | | | | | | | | | | | | | | | | | | | |
Beneficial interests issued by consolidated VIEs (classified as long-term borrowings) | | | | $ | 9,760.1 | | | $ | 9,760.1 | | | $ | 9,441.1 | | | $ | 9,441.1 | | | $ | 9,719.5 | | | $ | 9,719.5 | |
| | | | $ | 9,760.1 | | | $ | 9,760.1 | | | $ | 9,441.1 | | | $ | 9,441.1 | | | $ | 9,719.5 | | | $ | 9,719.5 | |
| | | | | | | | | | | | | | | | | | | | | | | | | | |
CIT ANNUAL REPORT 2012 151
CIT GROUP AND SUBSIDIARIES — NOTES TO CONSOLIDATED FINANCIAL STATEMENTS
| | | | | | | | Unaudited
| |
|---|
| | | | At December 31,
2011
| | At September 30,
2011
| | At June 30, 2011
| | At March 31, 2011
| | At December 31,
2010
| |
|---|
| | | | As
Reported
| | As
Revised
| | As
Reported
| | As
Revised
| | As
Reported
| | As
Revised
| | As
Reported
| | As
Revised
| | As
Reported
| | As
Revised
|
|---|
| | | | | | | | | | | | | | | | | | | | | | | | | | | | | | | | | | | | | | | | | | |
| | | | $ | 7,435.6 | | | $ | 7,436.8 | | | $ | 6,889.5 | | | $ | 6,890.6 | | | $ | 7,361.4 | | | $ | 7,362.6 | | | $ | 5,718.9 | | | $ | 5,720.1 | | | $ | 11,204.2 | | | $ | 11,205.4 | |
| | | | | 1,250.6 | | | | 1,257.8 | | | | 772.2 | | | | 779.4 | | | | 3,032.4 | | | | 3,041.1 | | | | 6,466.8 | | | | 6,474.5 | | | | 378.3 | | | | 383.9 | |
Trading assets at fair value – derivatives | | | | | 42.8 | | | | 42.8 | | | | 77.3 | | | | 77.3 | | | | 13.6 | | | | 13.6 | | | | 16.4 | | | | 16.4 | | | | 33.6 | | | | 33.6 | |
| | | | | 2,332.3 | | | | 2,332.3 | | | | 1,513.8 | | | | 1,513.8 | | | | 1,865.2 | | | | 1,865.2 | | | | 1,183.0 | | | | 1,183.0 | | | | 1,226.1 | | | | 1,226.1 | |
| | | | | 19,885.5 | | | | 19,905.9 | | | | 21,817.4 | | | | 21,838.2 | | | | 22,271.9 | | | | 22,291.5 | | | | 23,794.4 | | | | 23,814.0 | | | | 24,628.6 | | | | 24,648.4 | |
Allowance for loan losses | | | | | (407.8 | ) | | | (407.8 | ) | | | (414.5 | ) | | | (414.5 | ) | | | (424.0 | ) | | | (424.0 | ) | | | (402.5 | ) | | | (402.5 | ) | | | (416.2 | ) | | | (416.2 | ) |
Operating lease equipment, net(3) | | | | | 11,991.6 | | | | 12,006.4 | | | | 11,188.8 | | | | 11,203.8 | | | | 10,919.1 | | | | 10,934.2 | | | | 11,039.2 | | | | 11,054.4 | | | | 11,139.8 | | | | 11,155.0 | |
| | | | | 330.8 | | | | 345.9 | | | | 330.8 | | | | 345.9 | | | | 330.8 | | | | 345.9 | | | | 340.4 | | | | 355.5 | | | | 340.4 | | | | 355.5 | |
| | | | | 63.6 | | | | 63.6 | | | | 73.5 | | | | 73.5 | | | | 84.1 | | | | 84.1 | | | | 99.1 | | | | 99.1 | | | | 119.2 | | | | 119.2 | |
Unsecured counterparty receivable | | | | | 733.5 | | | | 729.5 | | | | 525.4 | | | | 523.7 | | | | 522.2 | | | | 520.5 | | | | 512.3 | | | | 510.7 | | | | 532.3 | | | | 531.0 | |
| | | | | 1,568.2 | | | | 1,550.2 | | | | 1,847.3 | | | | 1,830.1 | | | | 2,200.0 | | | | 2,178.0 | | | | 2,318.3 | | | | 2,290.7 | | | | 2,233.4 | | | | 2,211.5 | |
| | | | $ | 45,226.7 | | | $ | 45,263.4 | | | $ | 44,621.5 | | | $ | 44,661.8 | | | $ | 48,176.7 | | | $ | 48,212.7 | | | $ | 51,086.3 | | | $ | 51,115.9 | | | $ | 51,419.7 | | | $ | 51,453.4 | |
| | | | | | | | | | | | | | | | | | | | | | | | | | | | | | | | | | | | | | | | | | |
| | | | $ | 6,193.7 | | | $ | 6,193.7 | | | $ | 4,958.5 | | | $ | 4,958.5 | | | $ | 4,428.1 | | | $ | 4,428.1 | | | $ | 4,288.2 | | | $ | 4,288.2 | | | $ | 4,536.2 | | | $ | 4,536.2 | |
Trading liabilities at fair value – derivatives | | | | | 66.2 | | | | 66.2 | | | | 93.5 | | | | 93.5 | | | | 230.6 | | | | 230.6 | | | | 205.4 | | | | 205.4 | | | | 126.3 | | | | 126.3 | |
Credit balances of factoring clients | | | | | 1,225.5 | | | | 1,225.5 | | | | 1,093.5 | | | | 1,093.5 | | | | 1,075.7 | | | | 1,075.7 | | | | 1,101.5 | | | | 1,101.5 | | | | 935.3 | | | | 935.3 | |
| | | | | 2,562.2 | | | | 2,584.2 | | | | 2,532.8 | | | | 2,548.0 | | | | 2,553.8 | | | | 2,556.7 | | | | 2,754.4 | | | | 2,748.2 | | | | 2,872.2 | | | | 2,879.5 | |
Total long-term borrowings(3) | | | | | 26,288.1 | | | | 26,307.7 | | | | 27,050.1 | | | | 27,069.9 | | | | 30,940.2 | | | | 30,960.2 | | | | 33,735.7 | | | | 33,755.8 | | | | 34,028.9 | | | | 34,049.3 | |
| | | | | 36,335.7 | | | | 36,377.3 | | | | 35,728.4 | | | | 35,763.4 | | | | 39,228.4 | | | | 39,251.3 | | | | 42,085.2 | | | | 42,099.1 | | | | 42,498.9 | | | | 42,526.6 | |
| | | | | | | | | | | | | | | | | | | | | | | | | | | | | | | | | | | | | | | | | | |
| | | | | 2.0 | | | | 2.0 | | | | 2.0 | | | | 2.0 | | | | 2.0 | | | | 2.0 | | | | 2.0 | | | | 2.0 | | | | 2.0 | | | | 2.0 | |
| | | | | 8,459.3 | | | | 8,459.3 | | | | 8,453.8 | | | | 8,453.8 | | | | 8,447.4 | | | | 8,447.4 | | | | 8,440.4 | | | | 8,440.4 | | | | 8,434.1 | | | | 8,434.1 | |
(Accumulated deficit)/ retained earnings(7) | | | | | 532.1 | | | | 517.7 | | | | 488.5 | | | | 481.4 | | | | 521.3 | | | | 520.5 | | | | 571.0 | | | | 575.1 | | | | 505.4 | | | | 502.9 | |
Accumulated other comprehensive (loss) income(5) | | | | | (92.1 | ) | | | (82.6 | ) | | | (39.4 | ) | | | (27.0 | ) | | | (12.3 | ) | | | 1.6 | | | | (4.1 | ) | | | 7.5 | | | | (9.6 | ) | | | (1.1 | ) |
| | | | | (12.8 | ) | | | (12.8 | ) | | | (12.5 | ) | | | (12.5 | ) | | | (11.5 | ) | | | (11.5 | ) | | | (9.9 | ) | | | (9.9 | ) | | | (8.8 | ) | | | (8.8 | ) |
Total common stockholders’ equity | | | | | 8,888.5 | | | | 8,883.6 | | | | 8,892.4 | | | | 8,897.7 | | | | 8,946.9 | | | | 8,960.0 | | | | 8,999.4 | | | | 9,015.1 | | | | 8,923.1 | | | | 8,929.1 | |
| | | | | 2.5 | | | | 2.5 | | | | 0.7 | | | | 0.7 | | | | 1.4 | | | | 1.4 | | | | 1.7 | | | | 1.7 | | | | (2.3 | ) | | | (2.3 | ) |
| | | | | 8,891.0 | | | | 8,886.1 | | | | 8,893.1 | | | | 8,898.4 | | | | 8,948.3 | | | | 8,961.4 | | | | 9,001.1 | | | | 9,016.8 | | | | 8,920.8 | | | | 8,926.8 | |
Total liabilities and equity | | | | $ | 45,226.7 | | | $ | 45,263.4 | | | $ | 44,621.5 | | | $ | 44,661.8 | | | $ | 48,176.7 | | | $ | 48,212.7 | | | $ | 51,086.3 | | | $ | 51,115.9 | | | $ | 51,419.7 | | | $ | 51,453.4 | |
Book Value Per Common Share | | | | | | | | | | | | | | | | | | | | | | | | | | | | | | | | | | | | | | | | | | |
Book value per common share | | | | $ | 44.30 | | | $ | 44.27 | | | $ | 44.32 | | | $ | 44.35 | | | $ | 44.61 | | | $ | 44.67 | | | $ | 44.88 | | | $ | 44.96 | | | $ | 44.51 | | | $ | 44.54 | |
Tangible book value per common share | | | | $ | 42.33 | | | $ | 42.23 | | | $ | 42.31 | | | $ | 42.26 | | | $ | 42.54 | | | $ | 42.53 | | | $ | 42.69 | | | $ | 42.69 | | | $ | 42.22 | | | $ | 42.17 | |
| |
The following table presents corrected balances to assets and liabilities related to Variable Interest Entities (VIEs) that are consolidated by the Company. The difference between total VIE assets and liabilities represents the Company’s interest in those entities, which were eliminated in consolidation. The assets of the consolidated VIEs will be used to settle the liabilities of those entities and, except for the Company’s interest in the VIEs, are generally not available to the creditors of CIT or any affiliates of CIT.
|
| | | | | | | | | | | | | | | | | | | | | | | | | | | | | | | | | | | | | | | | | | |
Interest bearing deposits, restricted | | | | $ | 753.2 | | | $ | 574.3 | | | $ | 695.3 | | | $ | 540.2 | | | $ | 876.0 | | | $ | 735.1 | | | $ | 919.8 | | | $ | 796.1 | | | $ | 1,042.7 | | | $ | 835.2 | |
| | | | | 317.2 | | | | 317.2 | | | | 171.7 | | | | 171.7 | | | | 132.4 | | | | 132.4 | | | | 40.3 | | | | 40.3 | | | | 100.0 | | | | 100.0 | |
Total loans, net of allowance for loan losses | | | | | 8,523.7 | | | | 8,523.7 | | | | 9,839.9 | | | | 9,839.9 | | | | 11,030.7 | | | | 11,030.7 | | | | 11,817.7 | | | | 11,817.7 | | | | 12,041.5 | | | | 12,041.5 | |
Operating lease equipment, net | | | | | 4,285.4 | | | | 4,285.4 | | | | 2,947.9 | | | | 2,947.9 | | | | 2,974.6 | | | | 2,974.6 | | | | 2,870.7 | | | | 2,870.7 | | | | 2,900.0 | | | | 2,900.0 | |
| | | | $ | 13,879.5 | | | $ | 13,700.6 | | | $ | 13,654.8 | | | $ | 13,499.7 | | | $ | 15,013.7 | | | $ | 14,872.8 | | | $ | 15,648.5 | | | $ | 15,524.8 | | | $ | 16,084.2 | | | $ | 15,876.7 | |
| | | | | | | | | | | | | | | | | | | | | | | | | | | | | | | | | | | | | | | | | | |
Beneficial interests issued by consolidated VIEs (classified
as long-term borrowings) | | | | $ | 9,875.5 | | | $ | 9,875.5 | | | $ | 8,995.2 | | | $ | 8,995.2 | | | $ | 9,651.0 | | | $ | 9,651.0 | | | $ | 10,116.4 | | | $ | 10,116.4 | | | $ | 10,764.7 | | | $ | 10,764.7 | |
| | | | $ | 9,875.5 | | | $ | 9,875.5 | | | $ | 8,995.2 | | | $ | 8,995.2 | | | $ | 9,651.0 | | | $ | 9,651.0 | | | $ | 10,116.4 | | | $ | 10,116.4 | | | $ | 10,764.7 | | | $ | 10,764.7 | |
“As Reported” reflects balances reported in the December 31, 2011 Form 10-K and the March 31, 2012, June 30, 2012 and September 30, 2012 Form 10-Q’s.
“As Revised” reflects the corrected balances.
Item 8: Financial Statements and Supplementary Data
152 CIT ANNUAL REPORT 2012
CIT GROUP AND SUBSIDIARIES — NOTES TO CONSOLIDATED FINANCIAL STATEMENTS
Balance Sheet Corrections
| (1) | | Investment securities has been revised primarily to correct the accounting treatment for certain limited partnership investments. |
| (2) | | Loans were revised to correct the accrual of certain loan origination costs not originally recognized. |
| (3) | | Operating lease, net and long term borrowings were revised to reflect corrections for an operating lease and related borrowings in our Transportation Finance segment. |
| (4) | | Revisions to Goodwill correspond to the recording of corrections that impacted pre December 2009 results. As required by Fresh Start Accounting, stockholders equity was stated at fair value at December 31, 2009 therefore the net effect of the aforementioned corrections was an adjustment to Goodwill. |
| (5) | | Other assets and accumulated other comprehensive (loss) income were revised primarily to correct the amortization of premiums on certain derivatives entered into to hedge the Company’s foreign currency risk. |
| (6) | | Other liabilities were revised primarily to correct the amortization of premiums on derivative hedges, reflect corrections in the first quarter of 2012 that pertain to our Vendor Finance business, primarily in Mexico, establish an indemnification reserve related to pre-emergence asset sales, and correct certain tax account reconciliation items. |
| (7) | | (Accumulated deficit) retained earnings were revised due to the adjustments to net income. |
CIT ANNUAL REPORT 2012 153
CIT GROUP AND SUBSIDIARIES — NOTES TO CONSOLIDATED FINANCIAL STATEMENTS
CONSOLIDATED STATEMENTS OF OPERATIONS (dollars in millions, except per share data)
| | | | Unaudited
| |
|---|
| | | | Nine Months Ended
September 30, 2012
| | Six Months Ended
June 30, 2012
| |
|---|
| | | | As
Reported
| | Corrections
| | As
Revised
| | As
Reported
| | Corrections
| | As
Revised
|
|---|
| | | | | | | | | | | | | | | | | | | | | | | | | | |
Interest and fees on loans(1) | | | | $ | 1,171.2 | | | $ | 17.1 | | | $ | 1,188.3 | | | $ | 805.1 | | | $ | 15.7 | | | $ | 820.8 | |
Interest and dividends on interest bearing deposits and investments | | | | | 23.8 | | | | – | | | | 23.8 | | | | 15.8 | | | | – | | | | 15.8 | |
| | | | | 1,195.0 | | | | 17.1 | | | | 1,212.1 | | | | 820.9 | | | | 15.7 | | | | 836.6 | |
| | | | | | | | | | | | | | | | | | | | | | | | | | |
Interest on long-term borrowings(2) | | | | | (2,421.0 | ) | | | 0.2 | | | | (2,420.8 | ) | | | (1,647.3 | ) | | | 4.1 | | | | (1,643.2 | ) |
| | | | | (110.0 | ) | | | – | | | | (110.0 | ) | | | (71.6 | ) | | | – | | | | (71.6 | ) |
| | | | | (2,531.0 | ) | | | 0.2 | | | | (2,530.8 | ) | | | (1,718.9 | ) | | | 4.1 | | | | (1,714.8 | ) |
| | | | | (1,336.0 | ) | | | 17.3 | | | | (1,318.7 | ) | | | (898.0 | ) | | | 19.8 | | | | (878.2 | ) |
Provision for credit losses | | | | | (51.5 | ) | | | – | | | | (51.5 | ) | | | (51.5 | ) | | | – | | | | (51.5 | ) |
Net interest revenue, after credit provision | | | | | (1,387.5 | ) | | | 17.3 | | | | (1,370.2 | ) | | | (949.5 | ) | | | 19.8 | | | | (929.7 | ) |
| | | | | | | | | | | | | | | | | | | | | | | | | | |
Rental income on operating leases(3) | | | | | 1,329.2 | | | | 3.4 | | | | 1,332.6 | | | | 884.8 | | | | 2.0 | | | | 886.8 | |
| | | | | 474.6 | | | | 6.8 | | | | 481.4 | | | | 393.4 | | | | 1.3 | | | | 394.7 | |
Total non-interest income | | | | | 1,803.8 | | | | 10.2 | | | | 1,814.0 | | | | 1,278.2 | | | | 3.3 | | | | 1,281.5 | |
| | | | | | | | | | | | | | | | | | | | | | | | | | |
Depreciation on operating lease equipment(3) | | | | | (402.7 | ) | | | (0.2 | ) | | | (402.9 | ) | | | (268.2 | ) | | | (0.2 | ) | | | (268.4 | ) |
| | | | | (701.0 | ) | | | 14.7 | | | | (686.3 | ) | | | (463.5 | ) | | | 12.4 | | | | (451.1 | ) |
Loss on debt extinguishments | | | | | (61.2 | ) | | | – | | | | (61.2 | ) | | | (44.4 | ) | | | – | | | | (44.4 | ) |
| | | | | (1,164.9 | ) | | | 14.5 | | | | (1,150.4 | ) | | | (776.1 | ) | | | 12.2 | | | | (763.9 | ) |
(Loss) income before provision for income taxes | | | | | (748.6 | ) | | | 42.0 | | | | (706.6 | ) | | | (447.4 | ) | | | 35.3 | | | | (412.1 | ) |
Provision for income taxes(6) | | | | | (70.6 | ) | | | (19.0 | ) | | | (89.6 | ) | | | (67.7 | ) | | | (18.0 | ) | | | (85.7 | ) |
Net (loss) income before attribution of noncontrolling interests | | | | | (819.2 | ) | | | 23.0 | | | | (796.2 | ) | | | (515.1 | ) | | | 17.3 | | | | (497.8 | ) |
Net (income) loss attributable to noncontrolling interests, after tax | | | | | (2.9 | ) | | | – | | | | (2.9 | ) | | | (2.1 | ) | | | – | | | | (2.1 | ) |
| | | | $ | (822.1 | ) | | $ | 23.0 | | | $ | (799.1 | ) | | $ | (517.2 | ) | | $ | 17.3 | | | $ | (499.9 | ) |
Basic earnings per common share | | | | $ | (4.09 | ) | | $ | 0.11 | | | $ | (3.98 | ) | | $ | (2.57 | ) | | $ | 0.09 | | | $ | (2.49 | ) |
Diluted earnings per common share | | | | $ | (4.09 | ) | | $ | 0.11 | | | $ | (3.98 | ) | | $ | (2.57 | ) | | $ | 0.09 | | | $ | (2.49 | ) |
Average number of common shares – basic (thousands) | | | | | 200,877 | | | | – | | | | 200,877 | | | | 200,857 | | | | – | | | | 200,857 | |
Average number of common shares – diluted (thousands) | | | | | 200,877 | | | | – | | | | 200,877 | | | | 200,857 | | | | – | | | | 200,857 | |
Item 8: Financial Statements and Supplementary Data
154 CIT ANNUAL REPORT 2012
CIT GROUP AND SUBSIDIARIES — NOTES TO CONSOLIDATED FINANCIAL STATEMENTS
| | | | | | | | | | Unaudited
| |
|---|
| | | | Year Ended December 31, 2011
| | Nine Months Ended
September 30, 2011
| | Six Months Ended June 30, 2011
| |
|---|
| | | | As Reported
| | Corrections
| | As Revised
| | As Reported
| | Corrections
| | As Revised
| | As Reported
| | Corrections
| | As Revised
|
|---|
| | | | | | | | | | | | | | | | | | | | | | | | | | | | | | | | | | | | | | |
Interest and fees on loans(1) | | | | $ | 2,198.8 | | | $ | (4.9 | ) | | $ | 2,193.9 | | | $ | 1,715.6 | | | $ | (3.8 | ) | | $ | 1,711.8 | | | $ | 1,221.4 | | | $ | (2.3 | ) | | $ | 1,219.1 | |
Interest and dividends on interest bearing deposits and investments | | | | | 34.8 | | | | – | | | | 34.8 | | | | 25.6 | | | | – | | | | 25.6 | | | | 17.0 | | | | – | | | | 17.0 | |
| | | | | 2,233.6 | | | | (4.9 | ) | | | 2,228.7 | | | | 1,741.2 | | | | (3.8 | ) | | | 1,737.4 | | | | 1,238.4 | | | | (2.3 | ) | | | 1,236.1 | |
| | | | | | | | | | | | | | | | | | | | | | | | | | | | | | | | | | | | | | |
Interest on long-term borrowings(2) | | | | | (2,683.4 | ) | | | 0.2 | | | | (2,683.2 | ) | | | (2,030.2 | ) | | | 4.1 | | | | (2,026.1 | ) | | | (1,455.5 | ) | | | 3.9 | | | | (1,451.6 | ) |
| | | | | (111.2 | ) | | | – | | | | (111.2 | ) | | | (77.9 | ) | | | – | | | | (77.9 | ) | | | (49.5 | ) | | | – | | | | (49.5 | ) |
| | | | | (2,794.6 | ) | | | 0.2 | | | | (2,794.4 | ) | | | (2,108.1 | ) | | | 4.1 | | | | (2,104.0 | ) | | | (1,505.0 | ) | | | 3.9 | | | | (1,501.1 | ) |
| | | | | (561.0 | ) | | | (4.7 | ) | | | (565.7 | ) | | | (366.9 | ) | | | 0.3 | | | | (366.6 | ) | | | (266.6 | ) | | | 1.6 | | | | (265.0 | ) |
Provision for credit losses | | | | | (269.7 | ) | | | – | | | | (269.7 | ) | | | (253.9 | ) | | | – | | | | (253.9 | ) | | | (206.5 | ) | | | – | | | | (206.5 | ) |
Net interest revenue, after credit provision | | | | | (830.7 | ) | | | (4.7 | ) | | | (835.4 | ) | | | (620.8 | ) | | | 0.3 | | | | (620.5 | ) | | | (473.1 | ) | | | 1.6 | | | | (471.5 | ) |
| | | | | | | | | | | | | | | | | | | | | | | | | | | | | | | | | | | | | | |
Rental income on operating leases(3) | | | | | 1,665.7 | | | | 1.8 | | | | 1,667.5 | | | | 1,238.1 | | | | 1.4 | | | | 1,239.5 | | | | 829.1 | | | | 1.0 | | | | 830.1 | |
| | | | | 956.0 | | | | (3.2 | ) | | | 952.8 | | | | 746.6 | | | | 0.2 | | | | 746.8 | | | | 503.8 | | | | 1.0 | | | | 504.8 | |
Total non-interest income | | | | | 2,621.7 | | | | (1.4 | ) | | | 2,620.3 | | | | 1,984.7 | | | | 1.6 | | | | 1,986.3 | | | | 1,332.9 | | | | 2.0 | | | | 1,334.9 | |
| | | | | | | | | | | | | | | | | | | | | | | | | | | | | | | | | | | | | | |
Depreciation on operating lease equipment(3) | | | | | (574.8 | ) | | | (0.3 | ) | | | (575.1 | ) | | | (437.7 | ) | | | (0.3 | ) | | | (438.0 | ) | | | (313.4 | ) | | | (0.2 | ) | | | (313.6 | ) |
| | | | | (891.2 | ) | | | (5.4 | ) | | | (896.6 | ) | | | (669.8 | ) | | | (4.3 | ) | | | (674.1 | ) | | | (443.4 | ) | | | (3.2 | ) | | | (446.6 | ) |
Loss on debt extinguishments | | | | | (134.8 | ) | | | – | | | | (134.8 | ) | | | (146.6 | ) | | | – | | | | (146.6 | ) | | | – | | | | – | | | | – | |
| | | | | (1,600.8 | ) | | | (5.7 | ) | | | (1,606.5 | ) | | | (1,254.1 | ) | | | (4.6 | ) | | | (1,258.7 | ) | | | (756.8 | ) | | | (3.4 | ) | | | (760.2 | ) |
(Loss) income before provision for income taxes | | | | | 190.2 | | | | (11.8 | ) | | | 178.4 | | | | 109.8 | | | | (2.7 | ) | | | 107.1 | | | | 103.0 | | | | 0.2 | | | | 103.2 | |
Provision for income taxes(6) | | | | | (158.5 | ) | | | (0.1 | ) | | | (158.6 | ) | | | (123.8 | ) | | | (1.9 | ) | | | (125.7 | ) | | | (83.6 | ) | | | 1.5 | | | | (82.1 | ) |
Net (loss) income before attribution of noncontrolling interests | | | | | 31.7 | | | | (11.9 | ) | | | 19.8 | | | | (14.0 | ) | | | (4.6 | ) | | | (18.6 | ) | | | 19.4 | | | | 1.7 | | | | 21.1 | |
Net (income) loss attributable to noncontrolling interests, after tax | | | | | (5.0 | ) | | | – | | | | (5.0 | ) | | | (2.9 | ) | | | – | | | | (2.9 | ) | | | (3.5 | ) | | | – | | | | (3.5 | ) |
| | | | $ | 26.7 | | | $ | (11.9 | ) | | $ | 14.8 | | | $ | (16.9 | ) | | $ | (4.6 | ) | | $ | (21.5 | ) | | $ | 15.9 | | | $ | 1.7 | | | $ | 17.6 | |
Basic earnings per common share | | | | $ | 0.13 | | | $ | (0.06 | ) | | $ | 0.07 | | | $ | (0.08 | ) | | $ | (0.03 | ) | | $ | (0.11 | ) | | $ | 0.08 | | | $ | 0.01 | | | $ | 0.09 | |
Diluted earnings per common share | | | | $ | 0.13 | | | $ | (0.06 | ) | | $ | 0.07 | | | $ | (0.08 | ) | | $ | (0.03 | ) | | $ | (0.11 | ) | | $ | 0.08 | | | $ | 0.01 | | | $ | 0.09 | |
Average number of common shares – basic (thousands) | | | | | 200,678 | | | | – | | | | 200,678 | | | | 200,659 | | | | – | | | | 200,659 | | | | 200,631 | | | | – | | | | 200,631 | |
Average number of common shares – diluted (thousands) | | | | | 200,815 | | | | – | | | | 200,815 | | | | 200,659 | | | | – | | | | 200,659 | | | | 200,893 | | | | – | | | | 200,893 | |
CIT ANNUAL REPORT 2012 155
CIT GROUP AND SUBSIDIARIES — NOTES TO CONSOLIDATED FINANCIAL STATEMENTS
| | | | Unaudited
| |
|---|
| | | | Quarter Ended September 30, 2012
| | Quarter Ended June 30, 2012
| | Quarter Ended March 31, 2012
| |
|---|
| | | | As Reported
| | Corrections
| | As Revised
| | As Reported
| | Corrections
| | As Revised
| | As Reported
| | Corrections
| | As Revised
|
|---|
| | | | | | | | | | | | | | | | | | | | | | | | | | | | | | | | | | | | | | |
Interest and fees on loans(1) | | | | $ | 366.1 | | | $ | 1.4 | | | $ | 367.5 | | | $ | 401.3 | | | $ | 1.0 | | | $ | 402.3 | | | $ | 403.8 | | | $ | 14.7 | | | $ | 418.5 | |
Interest and dividends on interest bearing deposits and investments | | | | | 8.0 | | | | – | | | | 8.0 | | | | 8.0 | | | | – | | | | 8.0 | | | | 7.8 | | | | – | | | | 7.8 | |
| | | | | 374.1 | | | | 1.4 | | | | 375.5 | | | | 409.3 | | | | 1.0 | | | | 410.3 | | | | 411.6 | | | | 14.7 | | | | 426.3 | |
| | | | | | | | | | | | | | | | | | | | | | | | | | | | | | | | | | | | | | |
Interest on long-term borrowings(2) | | | | | (773.7 | ) | | | (3.9 | ) | | | (777.6 | ) | | | (603.9 | ) | | | 5.0 | | | | (598.9 | ) | | | (1,043.4 | ) | | | (0.9 | ) | | | (1,044.3 | ) |
| | | | | (38.4 | ) | | | – | | | | (38.4 | ) | | | (35.3 | ) | | | – | | | | (35.3 | ) | | | (36.3 | ) | | | – | | | | (36.3 | ) |
| | | | | (812.1 | ) | | | (3.9 | ) | | | (816.0 | ) | | | (639.2 | ) | | | 5.0 | | | | (634.2 | ) | | | (1,079.7 | ) | | | (0.9 | ) | | | (1,080.6 | ) |
| | | | | (438.0 | ) | | | (2.5 | ) | | | (440.5 | ) | | | (229.9 | ) | | | 6.0 | | | | (223.9 | ) | | | (668.1 | ) | | | 13.8 | | | | (654.3 | ) |
Provision for credit losses | | | | | – | | | | – | | | | – | | | | (8.9 | ) | | | – | | | | (8.9 | ) | | | (42.6 | ) | | | – | | | | (42.6 | ) |
Net interest revenue, after credit provision | | | | | (438.0 | ) | | | (2.5 | ) | | | (440.5 | ) | | | (238.8 | ) | | | 6.0 | | | | (232.8 | ) | | | (710.7 | ) | | | 13.8 | | | | (696.9 | ) |
| | | | | | | | | | | | | | | | | | | | | | | | | | | | | | | | | | | | | | |
Rental income on operating leases(3) | | | | | 444.4 | | | | 1.4 | | | | 445.8 | | | | 445.5 | | | | 0.7 | | | | 446.2 | | | | 439.3 | | | | 1.3 | | | | 440.6 | |
| | | | | 81.2 | | | | 5.5 | | | | 86.7 | | | | 144.0 | | | | (4.6 | ) | | | 139.4 | | | | 249.4 | | | | 5.9 | | | | 255.3 | |
Total non-interest income | | | | | 525.6 | | | | 6.9 | | | | 532.5 | | | | 589.5 | | | | (3.9 | ) | | | 585.6 | | | | 688.7 | | | | 7.2 | | | | 695.9 | |
| | | | | | | | | | | | | | | | | | | | | | | | | | | | | | | | | | | | | | |
Depreciation on operating lease equipment(3) | | | | | (134.5 | ) | | | – | | | | (134.5 | ) | | | (130.7 | ) | | | (0.1 | ) | | | (130.8 | ) | | | (137.5 | ) | | | (0.1 | ) | | | (137.6 | ) |
| | | | | (237.5 | ) | | | 2.3 | | | | (235.2 | ) | | | (240.2 | ) | | | 13.4 | | | | (226.8 | ) | | | (223.3 | ) | | | (1.0 | ) | | | (224.3 | ) |
Loss on debt extinguishments | | | | | (16.8 | ) | | | – | | | | (16.8 | ) | | | (21.5 | ) | | | – | | | | (21.5 | ) | | | (22.9 | ) | | | – | | | | (22.9 | ) |
| | | | | (388.8 | ) | | | 2.3 | | | | (386.5 | ) | | | (392.4 | ) | | | 13.3 | | | | (379.1 | ) | | | (383.7 | ) | | | (1.1 | ) | | | (384.8 | ) |
(Loss) income before provision for income taxes | | | | | (301.2 | ) | | | 6.7 | | | | (294.5 | ) | | | (41.7 | ) | | | 15.4 | | | | (26.3 | ) | | | (405.7 | ) | | | 19.9 | | | | (385.8 | ) |
Provision for income taxes(6) | | | | | (2.9 | ) | | | (1.0 | ) | | | (3.9 | ) | | | (27.8 | ) | | | (17.6 | ) | | | (45.4 | ) | | | (39.9 | ) | | | (0.4 | ) | | | (40.3 | ) |
Net (loss) income before attribution of noncontrolling interests | | | | | (304.1 | ) | | | 5.7 | | | | (298.4 | ) | | | (69.5 | ) | | | (2.2 | ) | | | (71.7 | ) | | | (445.6 | ) | | | 19.5 | | | | (426.1 | ) |
Net (income) loss attributable to noncontrolling interests, after tax | | | | | (0.8 | ) | | | – | | | | (0.8 | ) | | | (1.2 | ) | | | – | | | | (1.2 | ) | | | (0.9 | ) | | | – | | | | (0.9 | ) |
| | | | $ | (304.9 | ) | | $ | 5.7 | | | $ | (299.2 | ) | | $ | (70.7 | ) | | $ | (2.2 | ) | | $ | (72.9 | ) | | $ | (446.5 | ) | | $ | 19.5 | | | $ | (427.0 | ) |
Basic earnings per common share | | | | $ | (1.52 | ) | | $ | 0.03 | | | $ | (1.49 | ) | | $ | (0.35 | ) | | $ | (0.01 | ) | | $ | (0.36 | ) | | $ | (2.22 | ) | | $ | 0.09 | | | $ | (2.13 | ) |
Diluted earnings per common share | | | | $ | (1.52 | ) | | $ | 0.03 | | | $ | (1.49 | ) | | $ | (0.35 | ) | | $ | (0.01 | ) | | $ | (0.36 | ) | | $ | (2.22 | ) | | $ | 0.09 | | | $ | (2.13 | ) |
Average number of common shares – basic (thousands) | | | | | 200,917 | | | | – | | | | 200,917 | | | | 200,901 | | | | – | | | | 200,901 | | | | 200,812 | | | | – | | | | 200,812 | |
Average number of common shares – diluted (thousands) | | | | | 200,917 | | | | – | | | | 200,917 | | | | 200,901 | | | | – | | | | 200,901 | | | | 200,812 | | | | – | | | | 200,812 | |
Item 8: Financial Statements and Supplementary Data
156 CIT ANNUAL REPORT 2012
CIT GROUP AND SUBSIDIARIES — NOTES TO CONSOLIDATED FINANCIAL STATEMENTS
| | | | Unaudited
| |
|---|
| | | | Quarter Ended December 31, 2011
| | Quarter Ended September 30, 2011
| |
|---|
| | | | As
Reported
| | Corrections
| | As
Revised
| | As
Reported
| | Corrections
| | As
Revised
|
|---|
| | | | | | | | | | | | | | | | | | | | | | | | | | |
Interest and fees on loans(1) | | | | $ | 483.2 | | | $ | (1.1 | ) | | $ | 482.1 | | | $ | 494.2 | | | $ | (1.5 | ) | | $ | 492.7 | |
Interest and dividends on interest bearing deposits and investments | | | | | 9.2 | | | | – | | | | 9.2 | | | | 8.6 | | | | – | | | | 8.6 | |
| | | | | 492.4 | | | | (1.1 | ) | | | 491.3 | | | | 502.8 | | | | (1.5 | ) | | | 501.3 | |
| | | | | | | | | | | | | | | | | | | | | | | | | | |
Interest on long-term borrowings(2) | | | | | (653.2 | ) | | | (3.9 | ) | | | (657.1 | ) | | | (574.7 | ) | | | 0.2 | | | | (574.5 | ) |
| | | | | (33.3 | ) | | | – | | | | (33.3 | ) | | | (28.4 | ) | | | – | | | | (28.4 | ) |
| | | | | (686.5 | ) | | | (3.9 | ) | | | (690.4 | ) | | | (603.1 | ) | | | 0.2 | | | | (602.9 | ) |
| | | | | (194.1 | ) | | | (5.0 | ) | | | (199.1 | ) | | | (100.3 | ) | | | (1.3 | ) | | | (101.6 | ) |
Provision for credit losses | | | | | (15.8 | ) | | | – | | | | (15.8 | ) | | | (47.4 | ) | | | – | | | | (47.4 | ) |
Net interest revenue, after credit provision | | | | | (209.9 | ) | | | (5.0 | ) | | | (214.9 | ) | | | (147.7 | ) | | | (1.3 | ) | | | (149.0 | ) |
| | | | | | | | | | | | | | | | | | | | | | | | | | |
Rental income on operating leases(3) | | | | | 427.6 | | | | 0.4 | | | | 428.0 | | | | 409.0 | | | | 0.4 | | | | 409.4 | |
| | | | | 209.4 | | | | (3.4 | ) | | | 206.0 | | | | 242.8 | | | | (0.8 | ) | | | 242.0 | |
Total non-interest income | | | | | 637.0 | | | | (3.0 | ) | | | 634.0 | | | | 651.8 | | | | (0.4 | ) | | | 651.4 | |
| | | | | | | | | | | | | | | | | | | | | | | | | | |
Depreciation on operating lease equipment(3) | | | | | (137.1 | ) | | | – | | | | (137.1 | ) | | | (124.3 | ) | | | (0.1 | ) | | | (124.4 | ) |
| | | | | (221.4 | ) | | | (1.1 | ) | | | (222.5 | ) | | | (226.4 | ) | | | (1.1 | ) | | | (227.5 | ) |
Loss on debt extinguishments | | | | | 11.8 | | | | – | | | | 11.8 | | | | (146.6 | ) | | | – | | | | (146.6 | ) |
| | | | | (346.7 | ) | | | (1.1 | ) | | | (347.8 | ) | | | (497.3 | ) | | | (1.2 | ) | | | (498.5 | ) |
(Loss) income before provision for income taxes | | | | | 80.4 | | | | (9.1 | ) | | | 71.3 | | | | 6.8 | | | | (2.9 | ) | | | 3.9 | |
Provision for income taxes(6) | | | | | (34.7 | ) | | | 1.8 | | | | (32.9 | ) | | | (40.2 | ) | | | (3.4 | ) | | | (43.6 | ) |
Net (loss) income before attribution of noncontrolling interests | | | | | 45.7 | | | | (7.3 | ) | | | 38.4 | | | | (33.4 | ) | | | (6.3 | ) | | | (39.7 | ) |
Net (income) loss attributable to noncontrolling interests, after tax | | | | | (2.1 | ) | | | – | | | | (2.1 | ) | | | 0.6 | | | | – | | | | 0.6 | |
| | | | $ | 43.6 | | | $ | (7.3 | ) | | $ | 36.3 | | | $ | (32.8 | ) | | $ | (6.3 | ) | | $ | (39.1 | ) |
Basic earnings per common share | | | | $ | 0.22 | | | $ | (0.04 | ) | | $ | 0.18 | | | $ | (0.16 | ) | | $ | (0.03 | ) | | $ | (0.19 | ) |
Diluted earnings per common share | | | | $ | 0.22 | | | $ | (0.04 | ) | | $ | 0.18 | | | $ | (0.16 | ) | | $ | (0.03 | ) | | $ | (0.19 | ) |
Average number of common shares – basic (thousands) | | | | | 200,729 | | | | – | | | | 200,729 | | | | 200,714 | | | | – | | | | 200,714 | |
Average number of common shares – diluted (thousands) | | | | | 200,740 | | | | – | | | | 200,740 | | | | 200,714 | | | | – | | | | 200,714 | |
CIT ANNUAL REPORT 2012 157
CIT GROUP AND SUBSIDIARIES — NOTES TO CONSOLIDATED FINANCIAL STATEMENTS
| | | | Unaudited
| |
|---|
| | | | Quarter Ended June 30, 2011
| | Quarter Ended March 31, 2011
| |
|---|
| | | | As
Reported
| | Corrections
| | As
Revised
| | As
Reported
| | Corrections
| | As
Revised
|
|---|
| | | | | | | | | | | | | | | | | | | | | | | | | | |
Interest and fees on loans(1) | | | | $ | 591.0 | | | $ | (1.1 | ) | | $ | 589.9 | | | $ | 630.4 | | | $ | (1.2 | ) | | $ | 629.2 | |
Interest and dividends on interest bearing deposits and investments | | | | | 8.6 | | | | – | | | | 8.6 | | | | 8.4 | | | | – | | | | 8.4 | |
| | | | | 599.6 | | | | (1.1 | ) | | | 598.5 | | | | 638.8 | | | | (1.2 | ) | | | 637.6 | |
| | | | | | | | | | | | | | | | | | | | | | | | | | |
Interest on long-term borrowings(2) | | | | | (781.3 | ) | | | 1.0 | | | | (780.3 | ) | | | (674.2 | ) | | | 2.9 | | | | (671.3 | ) |
| | | | | (25.1 | ) | | | – | | | | (25.1 | ) | | | (24.4 | ) | | | – | | | | (24.4 | ) |
| | | | | (806.4 | ) | | | 1.0 | | | | (805.4 | ) | | | (698.6 | ) | | | 2.9 | | | | (695.7 | ) |
| | | | | (206.8 | ) | | | (0.1 | ) | | | (206.9 | ) | | | (59.8 | ) | | | 1.7 | | | | (58.1 | ) |
Provision for credit losses | | | | | (84.1 | ) | | | – | | | | (84.1 | ) | | | (122.4 | ) | | | – | | | | (122.4 | ) |
Net interest revenue, after credit provision | | | | | (290.9 | ) | | | (0.1 | ) | | | (291.0 | ) | | | (182.2 | ) | | | 1.7 | | | | (180.5 | ) |
| | | | | | | | | | | | | | | | | | | | | | | | | | |
Rental income on operating leases(3) | | | | | 420.2 | | | | 0.4 | | | | 420.6 | | | | 408.9 | | | | 0.6 | | | | 409.5 | |
| | | | | 233.4 | | | | (0.3 | ) | | | 233.1 | | | | 270.4 | | | | 1.3 | | | | 271.7 | |
Total non-interest income | | | | | 653.6 | | | | 0.1 | | | | 653.7 | | | | 679.3 | | | | 1.9 | | | | 681.2 | |
| | | | | | | | | | | | | | | | | | | | | | | | | | |
Depreciation on operating lease equipment(3) | | | | | (153.2 | ) | | | (0.1 | ) | | | (153.3 | ) | | | (160.2 | ) | | | (0.1 | ) | | | (160.3 | ) |
| | | | | (238.5 | ) | | | (1.8 | ) | | | (240.3 | ) | | | (204.9 | ) | | | (1.4 | ) | | | (206.3 | ) |
Loss on debt extinguishments | | | | | – | | | | – | | | | – | | | | – | | | | – | | | | – | |
| | | | | (391.7 | ) | | | (1.9 | ) | | | (393.6 | ) | | | (365.1 | ) | | | (1.5 | ) | | | (366.6 | ) |
(Loss) income before provision for income taxes | | | | | (29.0 | ) | | | (1.9 | ) | | | (30.9 | ) | | | 132.0 | | | | 2.1 | | | | 134.1 | |
Provision for income taxes(6) | | | | | (21.4 | ) | | | (3.0 | ) | | | (24.4 | ) | | | (62.2 | ) | | | 4.5 | | | | (57.7 | ) |
Net (loss) income before attribution of noncontrolling interests | | | | | (50.4 | ) | | | (4.9 | ) | | | (55.3 | ) | | | 69.8 | | | | 6.6 | | | | 76.4 | |
Net (income) loss attributable to noncontrolling interests, after tax | | | | | 0.7 | | | | – | | | | 0.7 | | | | (4.2 | ) | | | – | | | | (4.2 | ) |
| | | | $ | (49.7 | ) | | $ | (4.9 | ) | | $ | (54.6 | ) | | $ | 65.6 | | | $ | 6.6 | | | $ | 72.2 | |
Basic earnings per common share | | | | $ | (0.25 | ) | | $ | (0.02 | ) | | $ | (0.27 | ) | | $ | 0.33 | | | $ | 0.03 | | | $ | 0.36 | |
Diluted earnings per common share | | | | $ | (0.25 | ) | | $ | (0.02 | ) | | $ | (0.27 | ) | | $ | 0.33 | | | $ | 0.03 | | | $ | 0.36 | |
Average number of common shares – basic (thousands) | | | | | 200,658 | | | | – | | | | 200,658 | | | | 200,605 | | | | – | | | | 200,605 | |
Average number of common shares – diluted (thousands) | | | | | 200,658 | | | | – | | | | 200,658 | | | | 200,933 | | | | – | | | | 200,933 | |
“As Reported” reflects balances reported in the December 31, 2011 Form 10-K and the March 31, 2012, June 30, 2012 and September 30, 2012 Form 10-Q’s.
“Corrections” reflect changes to originally reported balances and are described below.
“As Revised” reflects the corrected balances.
Income Statement Corrections
(1) | | Interest and fees on loans have been revised primarily to reflect corrections in the 2012 first quarter that pertain to our Vendor Finance business, primarily in Mexico. |
(2) | | Interest on long-term borrowings has been revised primarily to correct the amortization of premiums on certain derivatives entered into to hedge the Company’s foreign currency risk, and to correct the amortization of capitalized debt costs relating to a particular financing structure. |
(3) | | Rental income on operating leases and depreciation were revised primarily to reflect corrections to the accounting for an operating lease in our Transportation Finance segment. |
(4) | | Other income has been revised to correct the Company’s accretion of the unsecured counterparty receivable, correcting the accounting treatment for certain limited partnership investments and corrections related to the Mexican portfolio. |
Item 8: Financial Statements and Supplementary Data
158 CIT ANNUAL REPORT 2012
CIT GROUP AND SUBSIDIARIES — NOTES TO CONSOLIDATED FINANCIAL STATEMENTS
(5) | | Operating expenses have been revised primarily relating to a $14 million correction in the 2012 second quarter for the establishment of an indemnification reserve related to pre-emergence asset sales. |
(6) | | Provision for income taxes has been revised primarily relating to a $16 million correction in the 2012 second quarter for certain foreign tax accruals relating to Mexico, corrections arising from tax account reconciliations and the tax impact of recording the aforementioned corrections. |
CONSOLIDATED STATEMENT OF STOCKHOLDERS’ EQUITY (UNAUDITED)*
| * | | Except December 31, 2011 and 2010 |
| | | | Common
Stock
| | Paid-in
Capital
| | (Accumulated
Deficit)
Retained
Earnings
| | Accumulated
Other
Comprehensive
Loss
| | Treasury
Stock
| | Noncontrolling
Minority
Interests
| | Total
Equity
|
|---|
December 31, 2010 (revised) | | | | $ | 2.0 | | | $ | 8,434.1 | | | $ | 502.9 | | | $ | (1.1 | ) | | $ | (8.8 | ) | | $ | (2.3 | ) | | $ | 8,926.8 | |
| | | | | | | | | | | | | 72.2 | | | | | | | | | | | | 4.2 | | | | 76.4 | |
Other comprehensive loss, net of tax | | | | | | | | | | | | | | | | | 8.6 | | | | | | | | | | | | 8.6 | |
Amortization of restricted stock, stock option and performance shares expenses | | | | | | | | | 6.3 | | | | | | | | | | | | (1.1 | ) | | | | | | | 5.2 | |
Distribution of earnings and capital | | | | | | | | | | | | | | | | | | | | | | | | | (0.2 | ) | | | (0.2 | ) |
| | | | | 2.0 | | | | 8,440.4 | | | | 575.1 | | | | 7.5 | | | | (9.9 | ) | | | 1.7 | | | | 9,016.8 | |
| | | | | | | | | | | | | (54.6 | ) | | | | | | | | | | | (0.7 | ) | | | (55.3 | ) |
Other comprehensive loss, net of tax | | | | | | | | | | | | | | | | | (5.9 | ) | | | | | | | | | | | (5.9 | ) |
Amortization of restricted stock and stock option expenses | | | | | | | | | 7.0 | | | | | | | | | | | | (1.6 | ) | | | | | | | 5.4 | |
Distribution of earnings and capital | | | | | | | | | | | | | | | | | | | | | | | | | 0.4 | | | | 0.4 | |
| | | | | 2.0 | | | | 8,447.4 | | | | 520.5 | | | | 1.6 | | | | (11.5 | ) | | | 1.4 | | | | 8,961.4 | |
| | | | | | | | | | | | | (39.1 | ) | | | | | | | | | | | (0.6 | ) | | | (39.7 | ) |
Other comprehensive loss, net of tax | | | | | | | | | | | | | | | | | (28.6 | ) | | | | | | | | | | | (28.6 | ) |
Amortization of restricted stock and stock option expenses | | | | | | | | | 6.1 | | | | | | | | | | | | (1.0 | ) | | | | | | | 5.1 | |
Employee stock purchase plan | | | | | | | | | 0.3 | | | | | | | | | | | | | | | | | | | | 0.3 | |
Distribution of earnings and capital | | | | | | | | | | | | | | | | | | | | | | | | | (0.1 | ) | | | (0.1 | ) |
September 30, 2011 (revised) | | | | | 2.0 | | | | 8,453.8 | | | | 481.4 | | | | (27.0 | ) | | | (12.5 | ) | | | 0.7 | | | | 8,898.4 | |
| | | | | | | | | | | | | 36.3 | | | | | | | | | | | | 2.1 | | | | 38.4 | |
Other comprehensive loss, net of tax | | | | | | | | | | | | | | | | | (55.6 | ) | | | | | | | | | | | (55.6 | ) |
Amortization of restricted stock and stock option expenses | | | | | | | | | 5.2 | | | | | | | | | | | | (0.3 | ) | | | | | | | 4.9 | |
Employee stock purchase plan | | | | | | | | | 0.3 | | | | | | | | | | | | | | | | | | | | 0.3 | |
Distribution of earnings and capital | | | | | | | | | | | | | | | | | | | | | | | | | (0.3 | ) | | | (0.3 | ) |
December 31, 2011 (revised) | | | | | 2.0 | | | | 8,459.3 | | | | 517.7 | | | | (82.6 | ) | | | (12.8 | ) | | | 2.5 | | | | 8,886.1 | |
| | | | | | | | | | | | | (427.0 | ) | | | | | | | | | | | 0.9 | | | | (426.1 | ) |
Other comprehensive loss, net of tax | | | | | | | | | | | | | | | | | 2.3 | | | | | | | | | | | | 2.3 | |
Amortization of restricted stock, stock option and performance shares expenses | | | | | | | | | 12.1 | | | | | | | | | | | | (3.7 | ) | | | | | | | 8.4 | |
Employee stock purchase plan | | | | | | | | | 0.3 | | | | | | | | | | | | | | | | | | | | 0.3 | |
Distribution of earnings and capital | | | | | | | | | | | | | | | | | | | | | | | | | (0.3 | ) | | | (0.3 | ) |
| | | | | 2.0 | | | | 8,471.7 | | | | 90.7 | | | | (80.3 | ) | | | (16.5 | ) | | | 3.1 | | | | 8,470.7 | |
| | | | | | | | | | | | | (72.9 | ) | | | | | | | | | | | 1.2 | | | | (71.7 | ) |
Other comprehensive loss, net of tax | | | | | | | | | | | | | | | | | (10.7 | ) | | | | | | | | | | | (10.7 | ) |
Amortization of restricted stock, stock option and performance shares expenses | | | | | | | | | 9.5 | | | | | | | | | | | | – | | | | | | | | 9.5 | |
Employee stock purchase plan | | | | | | | | | 0.3 | | | | | | | | | | | | | | | | | | | | 0.3 | |
Distribution of earnings and capital | | | | | | | | | | | | | | | | | | | | | | | | | (0.2 | ) | | | (0.2 | ) |
| | | | $ | 2.0 | | | $ | 8,481.5 | | | $ | 17.8 | | | $ | (91.0 | ) | | $ | (16.5 | ) | | $ | 4.1 | | | $ | 8,397.9 | |
CIT ANNUAL REPORT 2012 159
CIT GROUP AND SUBSIDIARIES — NOTES TO CONSOLIDATED FINANCIAL STATEMENTS
| | | | Common
Stock
| | Paid-in
Capital
| | (Accumulated
Deficit)
Retained
Earnings
| | Accumulated
Other
Comprehensive
Loss
| | Treasury
Stock
| | Noncontrolling
Minority
Interests
| | Total
Equity
|
|---|
| | | | $ | 2.0 | | | $ | 8,481.5 | | | $ | 17.8 | | | $ | (91.0 | ) | | $ | (16.5 | ) | | $ | 4.1 | | | $ | 8,397.9 | |
| | | | | | | | | | | | | (299.2 | ) | | | | | | | | | | | 0.8 | | | | (298.4 | ) |
Other comprehensive loss, net of tax | | | | | | | | | | | | | | | | | 5.0 | | | | | | | | | | | | 5.0 | |
Amortization of restricted stock, stock option and performance shares expenses | | | | | | | | | 9.2 | | | | | | | | | | | | (0.2 | ) | | | | | | | 9.0 | |
Employee stock purchase plan | | | | | | | | | 0.3 | | | | | | | | | | | | | | | | | | | | 0.3 | |
September 30, 2012 (revised) | | | | $ | 2.0 | | | $ | 8,491.0 | | | $ | (281.4 | ) | | $ | (86.0 | ) | | $ | (16.7 | ) | | $ | 4.9 | | | $ | 8,113.8 | |
Item 8: Financial Statements and Supplementary Data
160 CIT ANNUAL REPORT 2012
CIT GROUP AND SUBSIDIARIES — NOTES TO CONSOLIDATED FINANCIAL STATEMENTS
Consolidated Statements of Cash Flows (Unaudited) (dollars in millions)
| | | | Unaudited
| |
|---|
| | | | Nine Months Ended
September 30, 2012
| | Six Months Ended
June 30, 2012
| | Quarter Ended
March 31, 2012
| |
|---|
| | | | As
Reported
| | As
Revised
| | As
Reported
| | As
Revised
| | As
Reported
| | As
Revised
|
|---|
Cash Flows From Operations | | | | | | | | | | | | | | | | | | | | | | | | | | |
| | | | $ | (822.1 | ) | | $ | (799.1 | ) | | $ | (517.2 | ) | | $ | (499.9 | ) | | $ | (446.5 | ) | | $ | (427.0 | ) |
Adjustments to reconcile net loss to net cash flows from operations: | | | | | | | | | | | | | | | | | | | | | | | | | | |
Provision for credit losses | | | | | 51.5 | | | | 51.5 | | | | 51.5 | | | | 51.5 | | | | 42.6 | | | | 42.6 | |
Net depreciation, amortization and (accretion) | | | | | 1,712.8 | | | | 1,733.3 | | | | 1,104.5 | | | | 1,127.5 | | | | 750.7 | | | | 750.2 | |
Net gains on equipment, receivable and investment sales | | | | | (271.0 | ) | | | (271.0 | ) | | | (228.0 | ) | | | (228.0 | ) | | | (181.6 | ) | | | (181.6 | ) |
Loss on debt extinguishments | | | | | 21.1 | | | | 21.1 | | | | 10.5 | | | | 10.5 | | | | – | | | | – | |
Provision for deferred income taxes | | | | | 5.9 | | | | 22.8 | | | | 6.7 | | | | 22.0 | | | | 13.0 | | | | 13.0 | |
(Increase) decrease in finance receivables held for sale | | | | | (45.5 | ) | | | (45.5 | ) | | | (36.9 | ) | | | (36.9 | ) | | | (22.6 | ) | | | (22.6 | ) |
(Increase) decrease in other assets | | | | | (157.1 | ) | | | (174.3 | ) | | | 77.0 | | | | 67.5 | | | | (127.7 | ) | | | (137.0 | ) |
Decrease in accrued liabilities and payables | | | | | (117.2 | ) | | | (161.6 | ) | | | (156.7 | ) | | | (202.8 | ) | | | (14.6 | ) | | | (24.3 | ) |
Net cash flows provided by operations | | | | | 378.4 | | | | 377.2 | | | | 311.4 | | | | 311.4 | | | | 13.3 | | | | 13.3 | |
Cash Flows From Investing Activities | | | | | | | | | | | | | | | | | | | | | | | | | | |
Loans originated and purchased | | | | | (13,312.5 | ) | | | (13,362.6 | ) | | | (9,460.3 | ) | | | (9,510.4 | ) | | | (5,301.9 | ) | | | (5,352.0 | ) |
Principal collections of loans | | | | | 11,538.2 | | | | 11,695.4 | | | | 8,150.1 | | | | 8,250.2 | | | | 4,413.3 | | | | 4,463.4 | |
Purchases of investment securities | | | | | (13,961.2 | ) | | | (13,961.2 | ) | | | (8,286.6 | ) | | | (8,286.6 | ) | | | (4,310.0 | ) | | | (4,310.0 | ) |
Proceeds from maturities of investment securities | | | | | 14,255.2 | | | | 14,255.2 | | | | 8,376.2 | | | | 8,376.2 | | | | 4,246.8 | | | | 4,246.8 | |
Proceeds from asset and receivable sales | | | | | 3,404.6 | | | | 3,404.6 | | | | 2,978.1 | | | | 2,978.1 | | | | 1,362.0 | | | | 1,362.0 | |
Purchases of assets to be leased and other equipment | | | | | (1,228.0 | ) | | | (1,228.0 | ) | | | (807.4 | ) | | | (807.4 | ) | | | (226.0 | ) | | | (226.0 | ) |
Net increase in short-term factoring receivables | | | | | 5.8 | | | | 5.8 | | | | (2.9 | ) | | | (2.9 | ) | | | (78.1 | ) | | | (78.1 | ) |
Change in restricted cash | | | | | (213.9 | ) | | | (212.7 | ) | | | (123.9 | ) | | | (123.9 | ) | | | (37.8 | ) | | | (37.8 | ) |
Net cash flows provided by investing activities | | | | | 488.2 | | | | 596.5 | | | | 823.3 | | | | 873.3 | | | | 68.3 | | | | 68.3 | |
Cash Flows From Financing Activities | | | | | | | | | | | | | | | | | | | | | | | | | | |
Proceeds from the issuance of term debt | | | | | 12,786.6 | | | | 12,679.5 | | | | 8,730.3 | | | | 8,680.3 | | | | 5,132.0 | | | | 5,132.0 | |
| | | | | (17,509.3 | ) | | | (17,509.3 | ) | | | (12,383.2 | ) | | | (12,383.2 | ) | | | (7,016.8 | ) | | | (7,016.8 | ) |
| | | | | 2,522.9 | | | | 2,522.9 | | | | 977.6 | | | | 977.6 | | | | 625.4 | | | | 625.4 | |
Collection of security deposits and maintenance funds | | | | | 408.9 | | | | 408.9 | | | | 257.2 | | | | 257.2 | | | | 128.3 | | | | 128.3 | |
Use of security deposits and maintenance funds | | | | | (269.7 | ) | | | (269.7 | ) | | | (182.9 | ) | | | (182.9 | ) | | | (87.8 | ) | | | (87.8 | ) |
Net cash flows used in financing activities | | | | | (2,060.6 | ) | | | (2,167.7 | ) | | | (2,601.0 | ) | | | (2,651.0 | ) | | | (1,218.9 | ) | | | (1,218.9 | ) |
Decrease in cash and cash equivalents | | | | | (1,194.0 | ) | | | (1,194.0 | ) | | | (1,466.3 | ) | | | (1,466.3 | ) | | | (1,137.3 | ) | | | (1,137.3 | ) |
Unrestricted cash and cash equivalents, beginning of period | | | | | 6,565.7 | | | | 6,565.7 | | | | 6,565.7 | | | | 6,565.7 | | | | 6,565.7 | | | | 6,565.7 | |
Unrestricted cash and cash equivalents, end of period | | | | $ | 5,371.7 | | | $ | 5,371.7 | | | $ | 5,099.4 | | | $ | 5,099.4 | | | $ | 5,428.4 | | | $ | 5,428.4 | |
CIT ANNUAL REPORT 2012 161
CIT GROUP AND SUBSIDIARIES — NOTES TO CONSOLIDATED FINANCIAL STATEMENTS
| | | | Audited
| | Unaudited
| |
|---|
| | | | Twelve Months Ended
December 31, 2011
| | Nine Months Ended
September 30, 2011
| | Six Months Ended
June 30, 2011
| | Quarter Ended
March 31, 2011
| |
|---|
| | | | As
Reported
| | As
Revised
| | As
Reported
| | As
Revised
| | As
Reported
| | As
Revised
| | As
Reported
| | As
Revised
|
|---|
Cash Flows From Operations | | | | | | | | | | | | | | | | | | | | | | | | | | | | | | | | | | |
| | | | $ | 26.7 | | | $ | 14.8 | | | $ | (16.9 | ) | | $ | (21.5 | ) | | $ | 15.9 | | | $ | 17.6 | | | $ | 65.6 | | | $ | 72.2 | |
Adjustments to reconcile net loss to net cash flows from operations: | | | | | | | | | | | | | | | | | | | | | | | | | | | | | | | | | | |
Provision for credit losses | | | | | 269.7 | | | | 269.7 | | | | 253.9 | | | | 253.9 | | | | 206.5 | | | | 206.5 | | | | 122.4 | | | | 122.4 | |
Net depreciation, amortization and (accretion) | | | | | 752.0 | | | | 751.8 | | | | 415.7 | | | | 415.0 | | | | 329.2 | | | | 329.5 | | | | 121.1 | | | | 121.4 | |
Net gains on equipment, receivable and investment sales | | | | | (502.5 | ) | | | (502.5 | ) | | | (384.8 | ) | | | (384.8 | ) | | | (252.6 | ) | | | (252.6 | ) | | | (135.4 | ) | | | (135.4 | ) |
Loss on debt extinguishments | | | | | 109.8 | | | | 109.8 | | | | 121.6 | | | | 121.6 | | | | – | | | | – | | | | – | | | | – | |
Provision for deferred income taxes | | | | | 56.5 | | | | 57.0 | �� | | | 31.4 | | | | 29.9 | | | | 12.6 | | | | 10.8 | | �� | | 17.9 | | | | 17.3 | |
(Increase) decrease in finance receivables held for sale | | | | | 46.9 | | | | 46.9 | | | | 12.9 | | | | 12.9 | | | | 7.2 | | | | 7.2 | | | | (1.8 | ) | | | (1.8 | ) |
(Increase) decrease in other assets | | | | | 537.7 | | | | 503.3 | | | | 272.1 | | | | 244.9 | | | | 65.1 | | | | 46.8 | | | | (35.9 | ) | | | (46.0 | ) |
Decrease in accrued liabilities and payables | | | | | (440.8 | ) | | | (394.8 | ) | | | (305.4 | ) | | | (271.4 | ) | | | (128.1 | ) | | | (110.0 | ) | | | (20.6 | ) | | | (16.8 | ) |
Net cash flows provided by operations | | | | | 856.0 | | | | 856.0 | | | | 400.5 | | | | 400.5 | | | | 255.8 | | | | 255.8 | | | | 133.3 | | | | 133.3 | |
Cash Flows From Investing Activities | | | | | | | | | | | | | | | | | | | | | | | | | | | | | | | | | | |
Loans originated and purchased | | | | | (20,576.2 | ) | | | (20,576.2 | ) | | | (15,225.4 | ) | | | (15,225.4 | ) | | | (10,611.8 | ) | | | (10,611.8 | ) | | | (4,652.2 | ) | | | (4,652.2 | ) |
Principal collections of loans | | | | | 21,670.7 | | | | 21,670.7 | | | | 16,719.8 | | | | 16,719.8 | | | | 11,713.6 | | | | 11,713.6 | | | | 5,393.5 | | | | 5,393.5 | |
Purchases of investment securities | | | | | (14,971.8 | ) | | | (14,971.8 | ) | | | (13,928.4 | ) | | | (13,928.4 | ) | | | (12,633.4 | ) | | | (12,633.4 | ) | | | (6,125.5 | ) | | | (6,125.5 | ) |
Proceeds from maturities of investment securities | | | | | 14,085.9 | | | | 14,085.9 | | | | 13,512.2 | | | | 13,512.2 | | | | 9,956.2 | | | | 9,956.2 | | | | – | | | | – | |
Proceeds from asset and receivable sales | | | | | 4,315.7 | | | | 4,315.7 | | | | 2,524.0 | | | | 2,524.0 | | | | 1,681.4 | | | | 1,681.4 | | | | 860.6 | | | | 860.6 | |
Purchases of assets to be leased and other equipment | | | | | (2,136.9 | ) | | | (2,136.9 | ) | | | (1,080.5 | ) | | | (1,080.5 | ) | | | (546.5 | ) | | | (546.5 | ) | | | (328.4 | ) | | | (328.4 | ) |
Net increase in short-term factoring receivables | | | | | 196.8 | | | | 196.8 | | | | (39.2 | ) | | | (39.2 | ) | | | (26.4 | ) | | | (26.4 | ) | | | (73.3 | ) | | | (73.3 | ) |
Change in restricted cash | | | | | 1,683.9 | | | | 1,683.9 | | | | 528.0 | | | | 528.0 | | | | 128.0 | | | | 128.0 | | | | 1,210.1 | | | | 1,210.1 | |
Net cash flows provided by investing activities | | | | | 4,268.1 | | | | 4,268.1 | | | | 3,010.5 | | | | 3,010.5 | | | | (338.9 | ) | | | (338.9 | ) | | | (3,715.2 | ) | | | (3,715.2 | ) |
Cash Flows From Financing Activities | | | | | | | | | | | | | | | | | | | | | | | | | | | | | | | | | | |
Proceeds from the issuance of term debt | | | | | 6,680.5 | | | | 6,680.5 | | | | 4,876.1 | | | | 4,876.1 | | | | 2,692.8 | | | | 2,692.8 | | | | 2,354.5 | | | | 2,354.5 | |
| | | | | (15,626.3 | ) | | | (15,626.3 | ) | | | (12,581.6 | ) | | | (12,581.6 | ) | | | (6,285.2 | ) | | | (6,285.2 | ) | | | (2,844.4 | ) | | | (2,844.4 | ) |
| | | | | 1,680.9 | | | | 1,680.9 | | | | 441.6 | | | | 441.6 | | | | (94.0 | ) | | | (94.0 | ) | | | (233.6 | ) | | | (233.6 | ) |
Collection of security deposits and maintenance funds | | | | | 554.6 | | | | 554.6 | | | | 418.3 | | | | 418.3 | | | | 264.4 | | | | 264.4 | | | | 125.8 | | | | 125.8 | |
Use of security deposits and maintenance funds | | | | | (498.5 | ) | | | (498.5 | ) | | | (352.1 | ) | | | (352.1 | ) | | | (209.7 | ) | | | (209.7 | ) | | | (95.6 | ) | | | (95.6 | ) |
Net cash flows used in financing activities | | | | | (7,208.8 | ) | | | (7,208.8 | ) | | | (7,197.7 | ) | | | (7,197.7 | ) | | | (3,631.7 | ) | | | (3,631.7 | ) | | | (693.3 | ) | | | (693.3 | ) |
Decrease in cash and cash equivalents | | | | | (2,084.7 | ) | | | (2,084.7 | ) | | | (3,786.7 | ) | | | (3,786.7 | ) | | | (3,714.8 | ) | | | (3,714.8 | ) | | | (4,275.2 | ) | | | (4,275.2 | ) |
Unrestricted cash and cash equivalents, beginning of period | | | | | 8,650.4 | | | | 8,650.4 | | | | 8,650.4 | | | | 8,650.4 | | | | 8,650.4 | | | | 8,650.4 | | | | 8,650.4 | | | | 8,650.4 | |
Unrestricted cash and cash equivalents, end of period | | | | $ | 6,565.7 | | | $ | 6,565.7 | | | $ | 4,863.7 | | | $ | 4,863.7 | | | $ | 4,935.6 | | | $ | 4,935.6 | | | $ | 4,375.2 | | | $ | 4,375.2 | |
The Company is revising information contained in certain notes to the quarterly consolidated financial statements that were previously filed within Form 10-Q. The revised notes include Regulatory Capital and Business Segment Information to present the revised balances. Other information contained in the notes to the quarterly financial statements was not impacted by the corrections that were recorded in the revision and / or were not significantly impacted, and therefore are not presented herein.
Item 8: Financial Statements and Supplementary Data
162 CIT ANNUAL REPORT 2012
CIT GROUP AND SUBSIDIARIES — NOTES TO CONSOLIDATED FINANCIAL STATEMENTS
REGULATORY CAPITAL
| | | | CIT Group Inc.
| |
|---|
| | | | Unaudited
| | | | Unaudited
| |
|---|
| | | | September 30,
2012
| | June 30,
2012
| | March 31,
2012
| | December 31,
2011
| | September 30,
2011
| | June 30,
2011
| | March 31,
2011
|
|---|
| | | | | Revised | | | | Revised | | | | Revised | | | | Revised | | | | Revised | | | | Revised | | | | Revised | |
| | | | | | | | | | | | | | | | | | | | | | | | | | | | | | |
Total stockholders’ equity | | | | $ | 8,108.9 | | | $ | 8,393.8 | | | $ | 8,467.6 | | | $ | 8,883.6 | | | $ | 8,897.7 | | | $ | 8,960.0 | | | $ | 9,015.1 | |
Effect of certain items in accumulated other comprehensive loss excluded from Tier 1 Capital | | | | | 51.5 | | | | 52.4 | | | | 53.0 | | | | 54.3 | | | | (2.6 | ) | | | (9.5 | ) | | | (2.0 | ) |
| | | | | 8,160.4 | | | | 8,446.2 | | | | 8,520.6 | | | | 8,937.9 | | | | 8,895.1 | | | | 8,950.5 | | | | 9,013.1 | |
| | | | | (353.2 | ) | | | (353.2 | ) | | | (353.2 | ) | | | (353.2 | ) | | | (353.2 | ) | | | (355.6 | ) | | | (361.6 | ) |
Disallowed intangible assets(1) | | | | | (38.6 | ) | | | (43.6 | ) | | | (55.6 | ) | | | (63.6 | ) | | | (73.5 | ) | | | (84.1 | ) | | | (99.1 | ) |
Investment in certain subsidiaries | | | | | (34.7 | ) | | | (37.8 | ) | | | (38.5 | ) | | | (36.6 | ) | | | (32.6 | ) | | | (35.3 | ) | | | (34.4 | ) |
Other Tier 1 components(2) | | | | | (64.3 | ) | | | (65.7 | ) | | | (64.2 | ) | | | (58.6 | ) | | | (66.4 | ) | | | (63.4 | ) | | | (59.4 | ) |
| | | | | 7,669.6 | | | | 7,945.9 | | | | 8,009.1 | | | | 8,425.9 | | | | 8,369.4 | | | | 8,412.1 | | | | 8,458.6 | |
| | | | | | | | | | | | | | | | | | | | | | | | | | | | | | |
Qualifying allowance for credit losses and other reserves(3) | | | | | 420.2 | | | | 435.8 | | | | 445.7 | | | | 429.9 | | | | 437.0 | | | | 439.3 | | | | 415.3 | |
Less: Investment in certain subsidiaries | | | | | (34.7 | ) | | | (37.8 | ) | | | (38.5 | ) | | | (36.6 | ) | | | (32.6 | ) | | | (35.3 | ) | | | (34.4 | ) |
Other Tier 2 components(4) | | | | | 0.7 | | | | – | | | | – | | | | – | | | | 0.1 | | | | 2.6 | | | | 0.2 | |
| | | | $ | 8,055.8 | | | $ | 8,343.9 | | | $ | 8,416.3 | | | $ | 8,819.2 | | | $ | 8,773.9 | | | $ | 8,818.7 | | | $ | 8,839.7 | |
| | | | $ | 45,929.1 | | | $ | 44,251.2 | | | $ | 45,531.5 | | | $ | 44,824.1 | | | $ | 44,734.2 | | | $ | 44,138.8 | | | $ | 42,214.9 | |
Total Capital (to risk-weighted assets): | | | | | | | | | | | | | | | | | | | | | | | | | | | | | | |
| | | | | 17.5 | % | | | 18.9 | % | | | 18.5 | % | | | 19.7 | % | | | 19.6 | % | | | 20.0 | % | | | 20.9 | % |
Required Ratio for Capital Adequacy Purposes(5) | | | | | 13.0 | % | | | 13.0 | % | | | 13.0 | % | | | 13.0 | % | | | 13.0 | % | | | 13.0 | % | | | 13.0 | % |
Tier 1 Capital (to risk-weighted assets): | | | | | | | | | | | | | | | | | | | | | | | | | | | | | | |
| | | | | 16.7 | % | | | 18.0 | % | | | 17.6 | % | | | 18.8 | % | | | 18.7 | % | | | 19.1 | % | | | 20.0 | % |
Required Ratio for Capital Adequacy Purposes | | | | | 4.0 | % | | | 4.0 | % | | | 4.0 | % | | | 4.0 | % | | | 4.0 | % | | | 4.0 | % | | | 4.0 | % |
| | | | | | | | | | | | | | | | | | | | | | | | | | | | | | |
| | | | | 17.4 | % | | | 18.5 | % | | | 17.9 | % | | | 18.8 | % | | | 17.8 | % | | | 17.0 | % | | | 17.3 | % |
Required Ratio for Capital Adequacy Purposes | | | | | 4.0 | % | | | 4.0 | % | | | 4.0 | % | | | 4.0 | % | | | 4.0 | % | | | 4.0 | % | | | 4.0 | % |
(1) | | Goodwill and disallowed intangible assets adjustments also reflect the portion included within assets held for sale. |
(2) | | Includes the portion of net deferred tax assets that does not qualify for inclusion in Tier 1 capital based on the capital guidelines, the Tier 1 capital charge for nonfinancial equity investments and the Tier 1 capital deduction for net unrealized losses on available-for-sale marketable securities (net of tax). |
(3) | | “Other reserves” represents additional credit loss reserves for unfunded lending commitments, letters of credit, and deferred purchase agreements, all of which are recorded in Other Liabilities. |
(4) | | Banking organizations are permitted to include in Tier 2 Capital up to 45% of net unrealized pretax gains on available-for-sale equity securities with readily determinable fair values. |
(5) | | The Company committed to maintaining the capital ratio above regulatory minimum levels. |
CIT ANNUAL REPORT 2012 163
CIT GROUP AND SUBSIDIARIES — NOTES TO CONSOLIDATED FINANCIAL STATEMENTS
BUSINESS SEGMENT INFORMATION
The following tables present the impacts of revising prior period segment balances.
| | | | Unaudited
| |
|---|
| | | | Nine Months Ended September 30, 2012
| | Quarter Ended September 30, 2012
| | Six Months Ended June 30, 2012
| |
|---|
| | | | As
Reported
| | Corrections(1)
| | As
Revised
| | As
Reported
| | Corrections(1)
| | As
Revised
| | As
Reported
| | Corrections(1)
| | As
Revised
|
|---|
| | | | | | | | | | | | | | | | | | | | | | | | | | | | | | | | | | | | | | |
| | | | $ | 487.0 | | | $ | – | | | $ | 487.0 | | | $ | 140.1 | | | $ | – | | | $ | 140.1 | | | $ | 346.9 | | | $ | – | | | $ | 346.9 | |
| | | | | (496.0 | ) | | | – | | | | (496.0 | ) | | | (146.9 | ) | | | – | | | | (146.9 | ) | | | (349.1 | ) | | | – | | | | (349.1 | ) |
Provision for credit losses | | | | | (8.4 | ) | | | – | | | | (8.4 | ) | | | 22.0 | | | | – | | | | 22.0 | | | | (30.4 | ) | | | – | | | | (30.4 | ) |
Rental income on operating leases | | | | | 6.8 | | | | – | | | | 6.8 | | | | 1.7 | | | | – | | | | 1.7 | | | | 5.1 | | | | – | | | | 5.1 | |
| | | | | 302.3 | | | | 0.9 | | | | 303.2 | | | | 24.6 | | | | 1.7 | | | | 26.3 | | | | 277.7 | | | | (0.8 | ) | | | 276.9 | |
Depreciation on operating lease equipment | | | | | (3.3 | ) | | | – | | | | (3.3 | ) | | | (1.0 | ) | | | – | | | | (1.0 | ) | | | (2.3 | ) | | | – | | | | (2.3 | ) |
| | | | | (193.9 | ) | | | – | | | | (193.9 | ) | | | (65.8 | ) | | | – | | | | (65.8 | ) | | | (128.1 | ) | | | – | | | | (128.1 | ) |
Income (loss) before provision for income taxes | | | | $ | 94.5 | | | $ | 0.9 | | | $ | 95.4 | | | $ | (25.3 | ) | | $ | 1.7 | | | $ | (23.6 | ) | | $ | 119.8 | | | $ | (0.8 | ) | | $ | 119.0 | |
| | | | | | | | | | | | | | | | | | | | | | | | | | | | | | | | | | | | | | |
| | | | $ | 103.6 | | | $ | – | | | $ | 103.6 | | | $ | 34.1 | | | $ | – | | | $ | 34.1 | | | $ | 69.5 | | | $ | – | | | $ | 69.5 | |
| | | | | (1,122.0 | ) | | | 0.3 | | | | (1,121.7 | ) | | | (374.7 | ) | | | (0.4 | ) | | | (375.1 | ) | | | (747.3 | ) | | | 0.7 | | | | (746.6 | ) |
Provision for credit losses | | | | | (16.6 | ) | | | – | | | | (16.6 | ) | | | (8.9 | ) | | | – | | | | (8.9 | ) | | | (7.7 | ) | | | – | | | | (7.7 | ) |
Rental income on operating leases | | | | | 1,143.8 | | | | 2.2 | | | | 1,146.0 | | | | 386.2 | | | | 0.7 | | | | 386.9 | | | | 757.6 | | | | 1.5 | | | | 759.1 | |
| | | | | 46.2 | | | | (0.8 | ) | | | 45.4 | | | | 18.4 | | | | – | | | | 18.4 | | | | 27.8 | | | | (0.8 | ) | | | 27.0 | |
Depreciation on operating lease equipment | | | | | (316.1 | ) | | | (0.2 | ) | | | (316.3 | ) | | | (106.3 | ) | | | – | | | | (106.3 | ) | | | (209.8 | ) | | | (0.2 | ) | | | (210.0 | ) |
| | | | | (132.0 | ) | | | – | | | | (132.0 | ) | | | (43.5 | ) | | | – | | | | (43.5 | ) | | | (88.5 | ) | | | – | | | | (88.5 | ) |
Income (loss) before provision for income taxes | | | | $ | (293.1 | ) | | $ | 1.5 | | | $ | (291.6 | ) | | $ | (94.7 | ) | | $ | 0.3 | | | $ | (94.4 | ) | | $ | (198.4 | ) | | $ | 1.2 | | | $ | (197.2 | ) |
| | | | | | | | | | | | | | | | | | | | | | | | | | | | | | | | | | | | | | |
| | | | $ | 43.6 | | | $ | – | | | $ | 43.6 | | | $ | 15.0 | | | $ | – | | | $ | 15.0 | | | $ | 28.6 | | | $ | – | | | $ | 28.6 | |
| | | | | (74.2 | ) | | | – | | | | (74.2 | ) | | | (24.1 | ) | | | – | | | | (24.1 | ) | | | (50.1 | ) | | | – | | | | (50.1 | ) |
Provision for credit losses | | | | | (5.9 | ) | | | – | | | | (5.9 | ) | | | (4.3 | ) | | | – | | | | (4.3 | ) | | | (1.6 | ) | | | – | | | | (1.6 | ) |
| | | | | 108.6 | | | | – | | | | 108.6 | | | | 39.0 | | | | – | | | | 39.0 | | | | 69.6 | | | | – | | | | 69.6 | |
| | | | | (89.2 | ) | | | – | | | | (89.2 | ) | | | (28.8 | ) | | | – | | | | (28.8 | ) | | | (60.4 | ) | | | – | | | | (60.4 | ) |
Income (loss) before provision for income taxes | | | | $ | (17.1 | ) | | $ | – | | | $ | (17.1 | ) | | $ | (3.2 | ) | | $ | – | | | $ | (3.2 | ) | | $ | (13.9 | ) | | $ | – | | | $ | (13.9 | ) |
| | | | | | | | | | | | | | | | | | | | | | | | | | | | | | | | | | | | | | |
| | | | $ | 403.2 | | | $ | 17.1 | | | $ | 420.3 | | | $ | 135.1 | | | $ | 1.4 | | | $ | 136.5 | | | $ | 268.1 | | | $ | 15.7 | | | $ | 283.8 | |
| | | | | (419.4 | ) | | | – | | | | (419.4 | ) | | | (122.7 | ) | | | – | | | | (122.7 | ) | | | (296.7 | ) | | | – | | | | (296.7 | ) |
Provision for credit losses | | | | | (20.1 | ) | | | – | | | | (20.1 | ) | | | (8.8 | ) | | | – | | | | (8.8 | ) | | | (11.3 | ) | | | – | | | | (11.3 | ) |
Rental income on operating leases | | | | | 178.6 | | | | 1.2 | | | | 179.8 | | | | 56.5 | | | | 0.7 | | | | 57.2 | | | | 122.1 | | | | 0.5 | | | | 122.6 | |
| | | | | 0.3 | | | | 7.1 | | | | 7.4 | | | | (2.9 | ) | | | 3.8 | | | | 0.9 | | | | 3.2 | | | | 3.3 | | | | 6.5 | |
Depreciation on operating lease equipment | | | | | (83.3 | ) | | | – | | | | (83.3 | ) | | | (27.2 | ) | | | – | | | | (27.2 | ) | | | (56.1 | ) | | | – | | | | (56.1 | ) |
| | | | | (241.5 | ) | | | 2.1 | | | | (239.4 | ) | | | (87.0 | ) | | | 3.5 | | | | (83.5 | ) | | | (154.5 | ) | | | (1.4 | ) | | | (155.9 | ) |
Income (loss) before provision for income taxes | | | | $ | (182.2 | ) | | $ | 27.5 | | | $ | (154.7 | ) | | $ | (57.0 | ) | | $ | 9.4 | | | $ | (47.6 | ) | | $ | (125.2 | ) | | $ | 18.1 | | | $ | (107.1 | ) |
| | | | | | | | | | | | | | | | | | | | | | | | | | | | | | | | | | | | | | |
| | | | $ | 143.6 | | | $ | – | | | $ | 143.6 | | | $ | 44.9 | | | $ | – | | | $ | 44.9 | | | $ | 98.7 | | | $ | – | | | $ | 98.7 | |
| | | | | (134.9 | ) | | | – | | | | (134.9 | ) | | | (43.0 | ) | | | – | | | | (43.0 | ) | | | (91.9 | ) | | | – | | | | (91.9 | ) |
Provision for credit losses | | | | | (0.5 | ) | | | – | | | | (0.5 | ) | | | – | | | | – | | | | – | | | | (0.5 | ) | | | – | | | | (0.5 | ) |
| | | | | 21.4 | | | | (0.3 | ) | | | 21.1 | | | | 1.2 | | | | – | | | | 1.2 | | | | 20.2 | | | | (0.3 | ) | | | 19.9 | |
| | | | | (30.4 | ) | | | – | | | | (30.4 | ) | | | (10.0 | ) | | | – | | | | (10.0 | ) | | | (20.4 | ) | | | – | | | | (20.4 | ) |
Income (loss) before provision for income taxes | | | | $ | (0.8 | ) | | $ | (0.3 | ) | | $ | (1.1 | ) | | $ | (6.9 | ) | | $ | – | | | $ | (6.9 | ) | | $ | 6.1 | | | $ | (0.3 | ) | | $ | 5.8 | |
| | | | | | | | | | | | | | | | | | | | | | | | | | | | | | | | | | | | | | |
| | | | $ | 14.0 | | | $ | – | | | $ | 14.0 | | | $ | 4.9 | | | $ | – | | | $ | 4.9 | | | $ | 9.1 | | | $ | – | | | $ | 9.1 | |
| | | | | (284.5 | ) | | | (0.1 | ) | | | (284.6 | ) | | | (100.7 | ) | | | (3.5 | ) | | | (104.2 | ) | | | (183.8 | ) | | | 3.4 | | | | (180.4 | ) |
| | | | | (4.2 | ) | | | (0.1 | ) | | | (4.3 | ) | | | 0.9 | | | | – | | | | 0.9 | | | | (5.1 | ) | | | (0.1 | ) | | | (5.2 | ) |
Operating expenses / loss on debt extinguishments | | | | | (75.2 | ) | | | 12.6 | | | | (62.6 | ) | | | (19.2 | ) | | | (1.2 | ) | | | (20.4 | ) | | | (56.0 | ) | | | 13.8 | | | | (42.2 | ) |
Income (loss) before provision for income taxes | | | | $ | (349.9 | ) | | $ | 12.4 | | | $ | (337.5 | ) | | $ | (114.1 | ) | | $ | (4.7 | ) | | $ | (118.8 | ) | | $ | (235.8 | ) | | $ | 17.1 | | | $ | (218.7 | ) |
Item 8: Financial Statements and Supplementary Data
164 CIT ANNUAL REPORT 2012
CIT GROUP AND SUBSIDIARIES — NOTES TO CONSOLIDATED FINANCIAL STATEMENTS
| | | | Unaudited
| |
|---|
| | | | Quarter Ended June 30, 2012
| | Quarter Ended March 31, 2012
| |
|---|
| | | | As
Reported
| | Corrections(1)
| | As
Revised
| | As
Reported
| | Corrections(1)
| | As
Revised
|
|---|
| | | | | | | | | | | | | | | | | | | | | | | | | | |
| | | | $ | 171.1 | | | $ | – | | | $ | 171.1 | | | $ | 175.8 | | | $ | – | | | $ | 175.8 | |
| | | | | (130.9 | ) | | | – | | | | (130.9 | ) | | | (218.2 | ) | | | – | | | | (218.2 | ) |
Provision for credit losses | | | | | (7.7 | ) | | | – | | | | (7.7 | ) | | | (22.7 | ) | | | – | | | | (22.7 | ) |
Rental income on operating leases | | | | | 2.3 | | | | – | | | | 2.3 | | | | 2.8 | | | | – | | | | 2.8 | |
| | | | | 76.7 | | | | (3.3 | ) | | | 73.4 | | | | 201.0 | | | | 2.5 | | | | 203.5 | |
Depreciation on operating lease equipment | | | | | (1.2 | ) | | | – | | | | (1.2 | ) | | | (1.1 | ) | | | – | | | | (1.1 | ) |
| | | | | (60.8 | ) | | | – | | | | (60.8 | ) | | | (67.3 | ) | | | – | | | | (67.3 | ) |
Income (loss) before provision for income taxes | | | | $ | 49.5 | | | $ | (3.3 | ) | | $ | 46.2 | | | $ | 70.3 | | | $ | 2.5 | | | $ | 72.8 | |
| | | | | | | | | | | | | | | | | | | | | | | | | | |
| | | | $ | 35.5 | | | $ | – | | | $ | 35.5 | | | $ | 34.0 | | | $ | – | | | $ | 34.0 | |
| | | | | (288.4 | ) | | | 1.8 | | | | (286.6 | ) | | | (458.9 | ) | | | (1.1 | ) | | | (460.0 | ) |
Provision for credit losses | | | | | (0.1 | ) | | | – | | | | (0.1 | ) | | | (7.6 | ) | | | – | | | | (7.6 | ) |
Rental income on operating leases | | | | | 382.9 | | | | 0.8 | | | | 383.7 | | | | 374.7 | | | | 0.7 | | | | 375.4 | |
| | | | | 14.5 | | | | (1.0 | ) | | | 13.5 | | | | 13.3 | | | | 0.2 | | | | 13.5 | |
Depreciation on operating lease equipment | | | | | (101.9 | ) | | | (0.1 | ) | | | (102.0 | ) | | | (107.9 | ) | | | (0.1 | ) | | | (108.0 | ) |
| | | | | (42.7 | ) | | | – | | | | (42.7 | ) | | | (45.8 | ) | | | – | | | | (45.8 | ) |
Income (loss) before provision for income taxes | | | | $ | (0.2 | ) | | $ | 1.5 | | | $ | 1.3 | | | $ | (198.2 | ) | | $ | (0.3 | ) | | $ | (198.5 | ) |
| | | | | | | | | | | | | | | | | | | | | | | | | | |
| | | | $ | 14.1 | | | $ | – | | | $ | 14.1 | | | $ | 14.5 | | | $ | – | | | $ | 14.5 | |
| | | | | (17.7 | ) | | | – | | | | (17.7 | ) | | | (32.4 | ) | | | – | | | | (32.4 | ) |
Provision for credit losses | | | | | 2.2 | | | | – | | | | 2.2 | | | | (3.8 | ) | | | – | | | | (3.8 | ) |
| | | | | 33.3 | | | | – | | | | 33.3 | | | | 36.3 | | | | – | | | | 36.3 | |
| | | | | (28.8 | ) | | | – | | | | (28.8 | ) | | | (31.6 | ) | | | – | | | | (31.6 | ) |
Income (loss) before provision for income taxes | | | | $ | 3.1 | | | $ | – | | | $ | 3.1 | | | $ | (17.0 | ) | | $ | – | | | $ | (17.0 | ) |
| | | | | | | | | | | | | | | | | | | | | | | | | | |
| | | | $ | 135.6 | | | $ | 1.0 | | | $ | 136.6 | | | $ | 132.5 | | | $ | 14.7 | | | $ | 147.2 | |
| | | | | (110.7 | ) | | | – | | | | (110.7 | ) | | | (186.0 | ) | | | – | | | | (186.0 | ) |
Provision for credit losses | | | | | (3.1 | ) | | | – | | | | (3.1 | ) | | | (8.2 | ) | | | – | | | | (8.2 | ) |
Rental income on operating leases | | | | | 60.3 | | | | (0.1 | ) | | | 60.2 | | | | 61.8 | | | | 0.6 | | | | 62.4 | |
| | | | | 7.6 | | | | 0.1 | | | | 7.7 | | | | (4.4 | ) | | | 3.2 | | | | (1.2 | ) |
Depreciation on operating lease equipment | | | | | (27.6 | ) | | | – | | | | (27.6 | ) | | | (28.5 | ) | | | – | | | | (28.5 | ) |
| | | | | (74.2 | ) | | | (0.7 | ) | | | (74.9 | ) | | | (80.3 | ) | | | (0.7 | ) | | | (81.0 | ) |
Income (loss) before provision for income taxes | | | | $ | (12.1 | ) | | $ | 0.3 | | | $ | (11.8 | ) | | $ | (113.1 | ) | | $ | 17.8 | | | $ | (95.3 | ) |
| | | | | | | | | | | | | | | | | | | | | | | | | | |
| | | | $ | 48.5 | | | $ | – | | | $ | 48.5 | | | $ | 50.2 | | | $ | – | | | $ | 50.2 | |
| | | | | (26.4 | ) | | | – | | | | (26.4 | ) | | | (65.5 | ) | | | – | | | | (65.5 | ) |
Provision for credit losses | | | | | (0.2 | ) | | | – | | | | (0.2 | ) | | | (0.3 | ) | | | – | | | | (0.3 | ) |
| | | | | 17.9 | | | | (0.4 | ) | | | 17.5 | | | | 2.3 | | | | 0.1 | | | | 2.4 | |
| | | | | (9.5 | ) | | | – | | | | (9.5 | ) | | | (10.9 | ) | | | – | | | | (10.9 | ) |
Income (loss) before provision for income taxes | | | | $ | 30.3 | | | $ | (0.4 | ) | | $ | 29.9 | | | $ | (24.2 | ) | | $ | 0.1 | | | $ | (24.1 | ) |
| | | | | | | | | | | | | | | | | | | | | | | | | | |
| | | | $ | 4.5 | | | $ | – | | | $ | 4.5 | | | $ | 4.6 | | | $ | – | | | $ | 4.6 | |
| | | | | (65.1 | ) | | | 3.2 | | | | (61.9 | ) | | | (118.7 | ) | | | 0.2 | | | | (118.5 | ) |
| | | | | (6.0 | ) | | | – | | | | (6.0 | ) | | | 0.9 | | | | (0.1 | ) | | | 0.8 | |
Operating expenses / loss on debt extinguishments | | | | | (45.7 | ) | | | 14.1 | | | | (31.6 | ) | | | (10.3 | ) | | | (0.3 | ) | | | (10.6 | ) |
Income (loss) before provision for income taxes | | | | $ | (112.3 | ) | | $ | 17.3 | | | $ | (95.0 | ) | | $ | (123.5 | ) | | $ | (0.2 | ) | | $ | (123.7 | ) |
CIT ANNUAL REPORT 2012 165
CIT GROUP AND SUBSIDIARIES — NOTES TO CONSOLIDATED FINANCIAL STATEMENTS
| | | | | | | | | | Unaudited
| |
|---|
| | | | Year Ended
December 31, 2011
| | Quarter Ended
December 31, 2011
| | Nine Months Ended
September 30, 2011
| | Quarter Ended
September 30, 2011
| |
|---|
| | | | As
Reported
| | Corrections(1)
| | As
Revised
| | As
Reported
| | Corrections(1)
| | As
Revised
| | As
Reported
| | Corrections(1)
| | As
Revised
| | As
Reported
| | Corrections(1)
| | As
Revised
|
|---|
| | | | | | | | | | | | | | | | | | | | | | | | | | | | | | | | | | | | | | | | | | | | | | | | | | |
| | | | $ | 923.7 | | | $ | – | | | $ | 923.7 | | | $ | 206.0 | | | $ | – | | | $ | 206.0 | | | $ | 717.7 | | | $ | – | | | $ | 717.7 | | | $ | 189.0 | | | $ | – | | | $ | 189.0 | |
| | | | | (706.1 | ) | | | – | | | | (706.1 | ) | | | (151.2 | ) | | | – | | | | (151.2 | ) | | | (554.9 | ) | | | – | | | | (554.9 | ) | | | (165.7 | ) | | | – | | | | (165.7 | ) |
Provision for credit losses | | | | | (173.3 | ) | | | – | | | | (173.3 | ) | | | (10.3 | ) | | | – | | | | (10.3 | ) | | | (163.0 | ) | | | – | | | | (163.0 | ) | | | (37.7 | ) | | | – | | | | (37.7 | ) |
Rental income on operating leases | | | | | 18.0 | | | | – | | | | 18.0 | | | | 3.9 | | | | – | | | | 3.9 | | | | 14.1 | | | | – | | | | 14.1 | | | | 4.1 | | | | – | | | | 4.1 | |
| | | | | 546.9 | | | | (0.4 | ) | | | 546.5 | | | | 184.3 | | | | (1.8 | ) | | | 182.5 | | | | 362.6 | | | | 1.4 | | | | 364.0 | | | | 93.1 | | | | (1.3 | ) | | | 91.8 | |
Depreciation on operating lease equipment | | | | | (7.8 | ) | | | – | | | | (7.8 | ) | | | (1.5 | ) | | | – | | | | (1.5 | ) | | | (6.3 | ) | | | – | | | | (6.3 | ) | | | (1.7 | ) | | | – | | | | (1.7 | ) |
| | | | | (232.7 | ) | | | – | | | | (232.7 | ) | | | (63.3 | ) | | | – | | | | (63.3 | ) | | | (169.4 | ) | | | – | | | | (169.4 | ) | | | (51.5 | ) | | | – | | | | (51.5 | ) |
Income (loss) before provision for income taxes | | | | $ | 368.7 | | | $ | (0.4 | ) | | $ | 368.3 | | | $ | 167.9 | | | $ | (1.8 | ) | | $ | 166.1 | | | $ | 200.8 | | | $ | 1.4 | | | $ | 202.2 | | | $ | 29.6 | | | $ | (1.3 | ) | | $ | 28.3 | |
| | | | | | | | | | | | | | | | | | | | | | | | | | | | | | | | | | | | | | | | | | | | | | | | | | |
| | | | $ | 155.9 | | | $ | – | | | $ | 155.9 | | | $ | 32.5 | | | $ | – | | | $ | 32.5 | | | $ | 123.4 | | | $ | – | | | $ | 123.4 | | | $ | 37.3 | | | $ | – | | | $ | 37.3 | |
| | | | | (881.9 | ) | | | (3.3 | ) | | | (885.2 | ) | | | (218.3 | ) | | | (1.1 | ) | | | (219.4 | ) | | | (663.6 | ) | | | (2.2 | ) | | | (665.8 | ) | | | (202.3 | ) | | | (0.7 | ) | | | (203.0 | ) |
Provision for credit losses | | | | | (12.8 | ) | | | – | | | | (12.8 | ) | | | (4.1 | ) | | | – | | | | (4.1 | ) | | | (8.7 | ) | | | – | | | | (8.7 | ) | | | (2.2 | ) | | | – | | | | (2.2 | ) |
Rental income on operating leases | | | | | 1,372.8 | | | | 2.8 | | | | 1,375.6 | | | | 365.6 | | | | 0.7 | | | | 366.3 | | | | 1,007.2 | | | | 2.1 | | | | 1,009.3 | | | | 342.2 | | | | 0.7 | | | | 342.9 | |
| | | | | 99.4 | | | | (0.3 | ) | | | 99.1 | | | | (10.7 | ) | | | (0.4 | ) | | | (11.1 | ) | | | 110.1 | | | | 0.1 | | | | 110.2 | | | | 57.0 | | | | 0.1 | | | | 57.1 | |
Depreciation on operating lease equipment | | | | | (381.9 | ) | | | (0.3 | ) | | | (382.2 | ) | | | (101.7 | ) | | | – | | | | (101.7 | ) | | | (280.2 | ) | | | (0.3 | ) | | | (280.5 | ) | | | (90.7 | ) | | | (0.1 | ) | | | (90.8 | ) |
| | | | | (160.2 | ) | | | – | | | | (160.2 | ) | | | (39.8 | ) | | | – | | | | (39.8 | ) | | | (120.4 | ) | | | – | | | | (120.4 | ) | | | (43.3 | ) | | | – | | | | (43.3 | ) |
Income (loss) before provision for income taxes | | | | $ | 191.3 | | | $ | (1.1 | ) | | $ | 190.2 | | | $ | 23.5 | | | $ | (0.8 | ) | | $ | 22.7 | | | $ | 167.8 | | | $ | (0.3 | ) | | $ | 167.5 | | | $ | 98.0 | | | $ | – | | | $ | 98.0 | |
| | | | | | | | | | | | | | | | | | | | | | | | | | | | | | | | | | | | | | | | | | | | | | | | | | |
| | | | $ | 73.3 | | | $ | – | | | $ | 73.3 | | | $ | 16.5 | | | $ | – | | | $ | 16.5 | | | $ | 56.8 | | | $ | – | | | $ | 56.8 | | | $ | 21.8 | | | $ | – | | | $ | 21.8 | |
| | | | | (90.9 | ) | | | – | | | | (90.9 | ) | | | (16.6 | ) | | | – | | | | (16.6 | ) | | | (74.3 | ) | | | – | | | | (74.3 | ) | | | (19.1 | ) | | | – | | | | (19.1 | ) |
Provision for credit losses | | | | | (11.2 | ) | | | – | | | | (11.2 | ) | | | 0.5 | | | | – | | | | 0.5 | | | | (11.7 | ) | | | – | | | | (11.7 | ) | | | (4.4 | ) | | | – | | | | (4.4 | ) |
| | | | | 156.1 | | | | – | | | | 156.1 | | | | 35.8 | | | | – | | | | 35.8 | | | | 120.3 | | | | – | | | | 120.3 | | | | 40.9 | | | | – | | | | 40.9 | |
| | | | | (110.4 | ) | | | – | | | | (110.4 | ) | | | (27.6 | ) | | | – | | | | (27.6 | ) | | | (82.8 | ) | | | – | | | | (82.8 | ) | | | (28.6 | ) | | | – | | | | (28.6 | ) |
Income (loss) before provision for income taxes | | | | $ | 16.9 | | | $ | – | | | $ | 16.9 | | | $ | 8.6 | | | $ | – | | | $ | 8.6 | | | $ | 8.3 | | | $ | – | | | $ | 8.3 | | | $ | 10.6 | | | $ | – | | | $ | 10.6 | |
| | | | | | | | | | | | | | | | | | | | | | | | | | | | | | | | | | | | | | | | | | | | | | | | | | |
| | | | $ | 793.3 | | | $ | (4.9 | ) | | $ | 788.4 | | | $ | 169.8 | | | $ | (1.1 | ) | | $ | 168.7 | | | $ | 623.5 | | | $ | (3.8 | ) | | $ | 619.7 | | | $ | 185.2 | | | $ | (1.5 | ) | | $ | 183.7 | |
| | | | | (505.1 | ) | | | – | | | | (505.1 | ) | | | (96.7 | ) | | | (0.1 | ) | | | (96.8 | ) | | | (408.4 | ) | | | 0.1 | | | | (408.3 | ) | | | (109.9 | ) | | | – | | | | (109.9 | ) |
Provision for credit losses | | | | | (69.3 | ) | | | – | | | | (69.3 | ) | | | (1.2 | ) | | | – | | | | (1.2 | ) | | | (68.1 | ) | | | – | | | | (68.1 | ) | | | (2.5 | ) | | | – | | | | (2.5 | ) |
Rental income on operating leases | | | | | 274.9 | | | | (1.0 | ) | | | 273.9 | | | | 58.1 | | | | (0.3 | ) | | | 57.8 | | | | 216.8 | | | | (0.7 | ) | | | 216.1 | | | | 62.7 | | | | (0.3 | ) | | | 62.4 | |
| | | | | 157.1 | | | | (2.3 | ) | | | 154.8 | | | | 11.3 | | | | (1.0 | ) | | | 10.3 | | | | 145.8 | | | | (1.3 | ) | | | 144.5 | | | | 60.1 | | | | 0.4 | | | | 60.5 | |
Depreciation on operating lease equipment | | | | | (185.1 | ) | | | – | | | | (185.1 | ) | | | (33.9 | ) | | | – | | | | (33.9 | ) | | | (151.2 | ) | | | – | | | | (151.2 | ) | | | (31.9 | ) | | | – | | | | (31.9 | ) |
| | | | | (308.4 | ) | | | (4.4 | ) | | | (312.8 | ) | | | (74.1 | ) | | | (0.8 | ) | | | (74.9 | ) | | | (234.3 | ) | | | (3.6 | ) | | | (237.9 | ) | | | (78.3 | ) | | | (0.8 | ) | | | (79.1 | ) |
Income (loss) before provision for income taxes | | | | $ | 157.4 | | | $ | (12.6 | ) | | $ | 144.8 | | | $ | 33.3 | | | $ | (3.3 | ) | | $ | 30.0 | | | $ | 124.1 | | | $ | (9.3 | ) | | $ | 114.8 | | | $ | 85.4 | | | $ | (2.2 | ) | | $ | 83.2 | |
| | | | | | | | | | | | | | | | | | | | | | | | | | | | | | | | | | | | | | | | | | | | | | | | | | |
| | | | $ | 266.5 | | | $ | – | | | $ | 266.5 | | | $ | 62.3 | | | $ | – | | | $ | 62.3 | | | $ | 204.2 | | | $ | – | | | $ | 204.2 | | | $ | 64.5 | | | $ | – | | | $ | 64.5 | |
| | | | | (290.6 | ) | | | – | | | | (290.6 | ) | | | (146.6 | ) | | | – | | | | (146.6 | ) | | | (144.0 | ) | | | – | | | | (144.0 | ) | | | (42.3 | ) | | | – | | | | (42.3 | ) |
Provision for credit losses | | | | | (3.1 | ) | | | – | | | | (3.1 | ) | | | (0.7 | ) | | | – | | | | (0.7 | ) | | | (2.4 | ) | | | – | | | | (2.4 | ) | | | (0.6 | ) | | | – | | | | (0.6 | ) |
| | | | | 2.1 | | | | (0.1 | ) | | | 2.0 | | | | (8.6 | ) | | | (0.1 | ) | | | (8.7 | ) | | | 10.7 | | | | – | | | | 10.7 | | | | 4.9 | | | | – | | | | 4.9 | |
| | | | | (65.4 | ) | | | – | | | | (65.4 | ) | | | (15.7 | ) | | | – | | | | (15.7 | ) | | | (49.7 | ) | | | – | | | | (49.7 | ) | | | (16.8 | ) | | | – | | | | (16.8 | ) |
Income (loss) before provision for income taxes | | | | $ | (90.5 | ) | | $ | (0.1 | ) | | $ | (90.6 | ) | | $ | (109.3 | ) | | $ | (0.1 | ) | | $ | (109.4 | ) | | $ | 18.8 | | | $ | – | | | $ | 18.8 | | | $ | 9.7 | | | $ | – | | | $ | 9.7 | |
| | | | | | | | | | | | | | | | | | | | | | | | | | | | | | | | | | | | | | | | | | | | | | | | | | |
| | | | $ | 20.9 | | | $ | – | | | $ | 20.9 | | | $ | 5.3 | | | $ | – | | | $ | 5.3 | | | $ | 15.6 | | | $ | – | | | $ | 15.6 | | | $ | 5.0 | | | $ | – | | | $ | 5.0 | |
| | | | | (320.0 | ) | | | 3.5 | | | | (316.5 | ) | | | (57.1 | ) | | | (2.7 | ) | | | (59.8 | ) | | | (262.9 | ) | | | 6.2 | | | | (256.7 | ) | | | (63.8 | ) | | | 0.9 | | | | (62.9 | ) |
| | | | | (5.6 | ) | | | (0.1 | ) | | | (5.7 | ) | | | (2.7 | ) | | | (0.1 | ) | | | (2.8 | ) | | | (2.9 | ) | | | – | | | | (2.9 | ) | | | (13.2 | ) | | | – | | | | (13.2 | ) |
Operating expenses / loss on debt extinguishments | | | | | (148.9 | ) | | | (1.0 | ) | | | (149.9 | ) | | | 10.9 | | | | (0.3 | ) | | | 10.6 | | | | (159.8 | ) | | | (0.7 | ) | | | (160.5 | ) | | | (154.5 | ) | | | (0.3 | ) | | | (154.8 | ) |
Income (loss) before provision for income taxes | | | | $ | (453.6 | ) | | $ | 2.4 | | | $ | (451.2 | ) | | $ | (43.6 | ) | | $ | (3.1 | ) | | $ | (46.7 | ) | | $ | (410.0 | ) | | $ | 5.5 | | | $ | (404.5 | ) | | $ | (226.5 | ) | | $ | 0.6 | | | $ | (225.9 | ) |
Item 8: Financial Statements and Supplementary Data
166 CIT ANNUAL REPORT 2012
CIT GROUP AND SUBSIDIARIES — NOTES TO CONSOLIDATED FINANCIAL STATEMENTS
| | | | Unaudited
| |
|---|
| | | | Six Months Ended June 30, 2011
| | Quarter Ended June 30, 2011
| | Quarter Ended March 31, 2011
| |
|---|
| | | | As
Reported
| | Corrections(1)
| | As
Revised
| | As
Reported
| | Corrections(1)
| | As
Revised
| | As
Reported
| | Corrections(1)
| | As
Revised
|
|---|
| | | | | | | | | | | | | | | | | | | | | | | | | | | | | | | | | | | | | | |
| | | | $ | 528.7 | | | $ | – | | | $ | 528.7 | | | $ | 252.9 | | | $ | – | | | $ | 252.9 | | | $ | 275.8 | | | $ | – | | | $ | 275.8 | |
| | | | | (389.2 | ) | | | – | | | | (389.2 | ) | | | (200.7 | ) | | | – | | | | (200.7 | ) | | | (188.5 | ) | | | – | | | | (188.5 | ) |
Provision for credit losses | | | | | (125.3 | ) | | | – | | | | (125.3 | ) | | | (60.8 | ) | | | – | | | | (60.8 | ) | | | (64.5 | ) | | | – | | | | (64.5 | ) |
Rental income on operating leases | | | | | 10.0 | | | | – | | | | 10.0 | | | | 6.3 | | | | – | | | | 6.3 | | | | 3.7 | | | | – | | | | 3.7 | |
| | | | | 269.5 | | | | 2.7 | | | | 272.2 | | | | 114.2 | | | | 0.8 | | | | 115.0 | | | | 155.3 | | | | 1.9 | | | | 157.2 | |
Depreciation on operating lease equipment | | | | | (4.6 | ) | | | – | | | | (4.6 | ) | | | (2.2 | ) | | | – | | | | (2.2 | ) | | | (2.4 | ) | | | – | | | | (2.4 | ) |
| | | | | (117.9 | ) | | | – | | | | (117.9 | ) | | | (63.2 | ) | | | – | | | | (63.2 | ) | | | (54.7 | ) | | | – | | | | (54.7 | ) |
Income (loss) before provision for income taxes | | | | $ | 171.2 | | | $ | 2.7 | | | $ | 173.9 | | | $ | 46.5 | | | $ | 0.8 | | | $ | 47.3 | | | $ | 124.7 | | | $ | 1.9 | | | $ | 126.6 | |
| | | | | | | | | | | | | | | | | | | | | | | | | | | | | | | | | | | | | | |
| | | | $ | 86.1 | | | $ | – | | | $ | 86.1 | | | $ | 43.5 | | | $ | – | | | $ | 43.5 | | | $ | 42.6 | | | $ | – | | | $ | 42.6 | |
| | | | | (461.3 | ) | | | (1.5 | ) | | | (462.8 | ) | | | (250.8 | ) | | | (0.7 | ) | | | (251.5 | ) | | | (210.5 | ) | | | (0.8 | ) | | | (211.3 | ) |
Provision for credit losses | | | | | (6.5 | ) | | | – | | | | (6.5 | ) | | | (4.7 | ) | | | – | | | | (4.7 | ) | | | (1.8 | ) | | | – | | | | (1.8 | ) |
Rental income on operating leases | | | | | 665.0 | | | | 1.4 | | | | 666.4 | | | | 340.0 | | | | 0.7 | | | | 340.7 | | | | 325.0 | | | | 0.7 | | | | 325.7 | |
| | | | | 53.1 | | | | – | | | | 53.1 | | | | 29.1 | | | | – | | | | 29.1 | | | | 24.0 | | | | – | | | | 24.0 | |
Depreciation on operating lease equipment | | | | | (189.5 | ) | | | (0.2 | ) | | | (189.7 | ) | | | (93.0 | ) | | | (0.1 | ) | | | (93.1 | ) | | | (96.5 | ) | | | (0.1 | ) | | | (96.6 | ) |
| | | | | (77.1 | ) | | | – | | | | (77.1 | ) | | | (37.4 | ) | | | – | | | | (37.4 | ) | | | (39.7 | ) | | | – | | | | (39.7 | ) |
Income (loss) before provision for income taxes | | | | $ | 69.8 | | | $ | (0.3 | ) | | $ | 69.5 | | | $ | 26.7 | | | $ | (0.1 | ) | | $ | 26.6 | | | $ | 43.1 | | | $ | (0.2 | ) | | $ | 42.9 | |
| | | | | | | | | | | | | | | | | | | | | | | | | | | | | | | | | | | | | | |
| | | | $ | 35.0 | | | $ | – | | | $ | 35.0 | | | $ | 17.9 | | | $ | – | | | $ | 17.9 | | | $ | 17.1 | | | $ | – | | | $ | 17.1 | |
| | | | | (55.2 | ) | | | – | | | | (55.2 | ) | | | (29.5 | ) | | | – | | | | (29.5 | ) | | | (25.7 | ) | | | – | | | | (25.7 | ) |
Provision for credit losses | | | | | (7.3 | ) | | | – | | | | (7.3 | ) | | | (4.0 | ) | | | – | | | | (4.0 | ) | | | (3.3 | ) | | | – | | | | (3.3 | ) |
| | | | | 79.4 | | | | – | | | | 79.4 | | | | 42.7 | | | | – | | | | 42.7 | | | | 36.7 | | | | – | | | | 36.7 | |
| | | | | (54.2 | ) | | | – | | | | (54.2 | ) | | | (26.4 | ) | | | – | | | | (26.4 | ) | | | (27.8 | ) | | | – | | | | (27.8 | ) |
Income (loss) before provision for income taxes | | | | $ | (2.3 | ) | | $ | – | | | $ | (2.3 | ) | | $ | 0.7 | | | $ | – | | | $ | 0.7 | | | $ | (3.0 | ) | | $ | – | | | $ | (3.0 | ) |
| | | | | | | | | | | | | | | | | | | | | | | | | | | | | | | | | | | | | | |
| | | | $ | 438.3 | | | $ | (2.3 | ) | | $ | 436.0 | | | $ | 211.6 | | | $ | (1.1 | ) | | $ | 210.5 | | | $ | 226.7 | | | $ | (1.2 | ) | | $ | 225.5 | |
| | | | | (298.5 | ) | | | 0.1 | | | | (298.4 | ) | | | (157.5 | ) | | | – | | | | (157.5 | ) | | | (141.0 | ) | | | 0.1 | | | | (140.9 | ) |
Provision for credit losses | | | | | (65.6 | ) | | | – | | | | (65.6 | ) | | | (13.7 | ) | | | – | | | | (13.7 | ) | | | (51.9 | ) | | | – | | | | (51.9 | ) |
Rental income on operating leases | | | | | 154.1 | | | | (0.4 | ) | | | 153.7 | | | | 73.9 | | | | (0.3 | ) | | | 73.6 | | | | 80.2 | | | | (0.1 | ) | | | 80.1 | |
| | | | | 85.7 | | | | (1.7 | ) | | | 84.0 | | | | 52.5 | | | | (1.1 | ) | | | 51.4 | | | | 33.2 | | | | (0.6 | ) | | | 32.6 | |
Depreciation on operating lease equipment | | | | | (119.3 | ) | | | – | | | | (119.3 | ) | | | (58.0 | ) | | | – | | | | (58.0 | ) | | | (61.3 | ) | | | – | | | | (61.3 | ) |
| | | | | (156.0 | ) | | | (2.8 | ) | | | (158.8 | ) | | | (80.0 | ) | | | (1.5 | ) | | | (81.5 | ) | | | (76.0 | ) | | | (1.3 | ) | | | (77.3 | ) |
Income (loss) before provision for income taxes | | | | $ | 38.7 | | | $ | (7.1 | ) | | $ | 31.6 | | | $ | 28.8 | | | $ | (4.0 | ) | | $ | 24.8 | | | $ | 9.9 | | | $ | (3.1 | ) | | $ | 6.8 | |
| | | | | | | | | | | | | | | | | | | | | | | | | | | | | | | | | | | | | | |
| | | | $ | 139.7 | | | $ | – | | | $ | 139.7 | | | $ | 68.9 | | | $ | – | | | $ | 68.9 | | | $ | 70.8 | | | $ | – | | | $ | 70.8 | |
| | | | | (101.7 | ) | | | – | | | | (101.7 | ) | | | (48.7 | ) | | | – | | | | (48.7 | ) | | | (53.0 | ) | | | – | | | | (53.0 | ) |
Provision for credit losses | | | | | (1.8 | ) | | | – | | | | (1.8 | ) | | | (0.9 | ) | | | – | | | | (0.9 | ) | | | (0.9 | ) | | | – | | | | (0.9 | ) |
| | | | | 5.8 | | | | – | | | | 5.8 | | | | 2.9 | | | | – | | | | 2.9 | | | | 2.9 | | | | – | | | | 2.9 | |
| | | | | (32.9 | ) | | | – | | | | (32.9 | ) | | | (15.5 | ) | | | – | | | | (15.5 | ) | | | (17.4 | ) | | | – | | | | (17.4 | ) |
Income (loss) before provision for income taxes | | | | $ | 9.1 | | | $ | – | | | $ | 9.1 | | | $ | 6.7 | | | $ | – | | | $ | 6.7 | | | $ | 2.4 | | | $ | – | | | $ | 2.4 | |
| | | | | | | | | | | | | | | | | | | | | | | | | | | | | | | | | | | | | | |
| | | | $ | 10.6 | | | $ | – | | | $ | 10.6 | | | $ | 4.8 | | | $ | – | | | $ | 4.8 | | | $ | 5.8 | | | $ | – | | | $ | 5.8 | |
| | | | | (199.1 | ) | | | 5.3 | | | | (193.8 | ) | | | (119.2 | ) | | | 1.7 | | | | (117.5 | ) | | | (79.9 | ) | | | 3.6 | | | | (76.3 | ) |
| | | | | 10.3 | | | | – | | | | 10.3 | | | | (8.0 | ) | | | – | | | | (8.0 | ) | | | 18.3 | | | | – | | | | 18.3 | |
Operating expenses / loss on debt extinguishments | | | | | (5.3 | ) | | | (0.4 | ) | | | (5.7 | ) | | | (16.0 | ) | | | (0.3 | ) | | | (16.3 | ) | | | 10.7 | | | | (0.1 | ) | | | 10.6 | |
Income (loss) before provision for income taxes | | | | $ | (183.5 | ) | | $ | 4.9 | | | $ | (178.6 | ) | | $ | (138.4 | ) | | $ | 1.4 | | | $ | (137.0 | ) | | $ | (45.1 | ) | | $ | 3.5 | | | $ | (41.6 | ) |
(1) | | See revised Unaudited Consolidated Statements of Operations for descriptions of corrections. |
CIT ANNUAL REPORT 2012 167
Item 9: Changes in and Disagreements with Accountants on Accounting and Financial DisclosureNone
Item 9A. Controls and ProceduresEVALUATION OF DISCLOSURE CONTROLS AND PROCEDURES
Under the supervision of and with the participation of management, including our principal executive officer and principal financial officer, we evaluated the effectiveness of our disclosure controls and procedures, as such term is defined in Rules 13a-15(e) and 15d-15(e) promulgated under the Securities and Exchange Act of 1934, as amended (the “Exchange Act”) as of December 31, 2012. Based on such evaluation, the principal executive officer and the principal financial officer have concluded that the Company’s disclosure controls and procedures were effective.
MANAGEMENT’S REPORT ON INTERNAL CONTROL OVER FINANCIAL REPORTING
Management of CIT is responsible for establishing and maintaining adequate internal control over financial reporting, as such term is defined in Exchange Act Rules 13a-15(f) and 15d-15(f). Internal control over financial reporting is a process designed to provide reasonable assurance regarding the reliability of financial reporting and the preparation of financial statements for external purposes in accordance with generally accepted accounting principles. A company’s internal control over financial reporting includes those policies and procedures that: (i) pertain to the maintenance of records that, in reasonable detail, accurately and fairly reflect the transactions and dispositions of the assets of the Company; (ii) provide reasonable assurance that transactions are recorded as necessary to permit preparation of financial statements in accordance with generally accepted accounting principles, and that receipts and expenditures of the Company are being made only in accordance with authorizations of management and directors of the Company; and (iii) provide reasonable assurance regarding prevention or timely detection of unauthorized acquisition, use, or disposition of the Company’s assets that could have a material effect on the financial statements.
Because of its inherent limitations, internal control over financial reporting may not prevent or detect misstatements. Also, projections of any evaluation of effectiveness to future periods are subject to the risk that controls may become inadequate because of changes in conditions or that the degree of compliance with the policies or procedures may deteriorate.
Management of CIT, including our principal executive officer and principal financial officer, conducted an evaluation of the effectiveness of the Company’s internal control over financial reporting as of December 31, 2012 using the criteria set forth by the Committee of Sponsoring Organizations of the Treadway Commission (“COSO”) in Internal Control — Integrated Framework. Management concluded that the Company’s internal control over financial reporting was effective as of December 31, 2012, based on the criteria established in Internal Control — Integrated Framework issued by the COSO.
The effectiveness of the Company’s internal control over financial reporting as of December 31, 2012 has been audited by PricewaterhouseCoopers LLP, an independent registered public accounting firm, as stated in their report which appears herein.
CHANGES IN INTERNAL CONTROL OVER FINANCIAL REPORTING:
There were no changes in our internal control over financial reporting during the quarter ended December 31, 2012 that have materially affected, or are reasonably likely to materially affect, the Company’s internal control over financial reporting.
Item 9B. Other InformationNone
Item 9: Changes in and Disagreements with Accountants on Accounting and Financial Disclosure
168 CIT ANNUAL REPORT 2012
PART THREE
Item 10. Directors, Executive Officers and Corporate GovernanceThe information called for by Item 10 is incorporated by reference from the information under the captions “Directors”, “Corporate Governance” and “Executive Officers” in our Proxy Statement for our 2013 annual meeting of stockholders.
Item 11. Executive CompensationThe information called for by Item 11 is incorporated by reference from the information under the captions “Director Compensation”, “Executive Compensation”, including “Compensation Discussion and Analysis” and “2013 Compensation Committee Report” in our Proxy Statement for our 2013 annual meeting of stockholders.
Item 12. Security Ownership of Certain Beneficial Owners and Management and Related Stockholder MattersThe information called for by Item 12 is incorporated by reference from the information under the caption “Security Ownership of Certain Beneficial Owners and Management” in our Proxy Statement for our 2013 annual meeting of stockholders.
Item 13. Certain Relationships and Related Transactions, and Director IndependenceThe information called for by Item 13 is incorporated by reference from the information under the captions “Corporate Governance-Director Independence” and “Related Person Transactions Policy” in our Proxy Statement for our 2013 annual meeting of stockholders.
Item 14. Principal Accountant Fees and ServicesThe information called for by Item 14 is incorporated by reference from the information under the caption “Proposal 2 — Ratification of Independent Registered Public Accounting Firm” in our Proxy Statement for our 2013 annual meeting of stockholders.
CIT ANNUAL REPORT 2012 169
PART FOUR
Item 15. Exhibits and Financial Statement Schedules| (a) | | The following documents are filed with the Securities and Exchange Commission as part of this report (seeItem 8): |
| 1. | | The following financial statements of CIT and Subsidiaries:
Report of Independent Registered Public Accounting Firm Consolidated Balance Sheets at December 31, 2012 and December 31, 2011.
Consolidated Statements of Operations for the years ended December 31, 2012, 2011 and 2010.
Consolidated Statements of Stockholders’ Equity for the years ended December 31, 2012, 2011 and 2010.
Consolidated Statements of Cash Flows for the years ended December 31, 2012, 2011 and 2010.
Notes to Consolidated Financial Statements |
| 2. | | All schedules are omitted because they are not applicable or because the required information appears in the Consolidated Financial Statements or the notes thereto. |
| | | | Third Amended and Restated Certificate of Incorporation of the Company, dated December 8, 2009 (incorporated by reference to Exhibit 3.1 to Form 8-K filed December 9, 2009). |
| | | | Amended and Restated By-laws of the Company, as amended through December 8, 2009 (incorporated by reference to Exhibit 3.2 to Form 8-K filed December 9, 2009). |
| | | | Indenture dated as of January 20, 2006 between CIT Group Inc. and The Bank of New York Mellon (as successor to JPMorgan Chase Bank N.A.) for the issuance of senior debt securities (incorporated by reference to Exhibit 4.3 to Form S-3 filed January 20, 2006). |
| | | | First Supplemental Indenture dated as of February 13, 2007 between CIT Group Inc. and The Bank of New York Mellon (as successor to JPMorgan Chase Bank N.A.) for the issuance of senior debt securities (incorporated by reference to Exhibit 4.1 to Form 8-K filed on February 13, 2007). |
| | | | Third Supplemental Indenture dated as of October 1, 2009, between CIT Group Inc. and The Bank of New York Mellon (as successor to JPMorgan Chase Bank N.A.) relating to senior debt securities (incorporated by reference to Exhibit 4.4 to Form 8-K filed on October 7, 2009). |
| | | | Fourth Supplemental Indenture dated as of October 16, 2009 between CIT Group Inc. and The Bank of New York Mellon (as successor to JPMorgan Chase Bank N.A.) relating to senior debt securities (incorporated by reference to Exhibit 4.1 to Form 8-K filed October 19, 2009). |
| | | | Framework Agreement, dated July 11, 2008, among ABN AMRO Bank N.V., as arranger, Madeleine Leasing Limited, as initial borrower, CIT Aerospace International, as initial head lessee, and CIT Group Inc., as guarantor, as amended by the Deed of Amendment, dated July 19, 2010, among The Royal Bank of Scotland N.V. (f/k/a ABN AMRO Bank N.V.), as arranger, Madeleine Leasing Limited, as initial borrower, CIT Aerospace International, as initial head lessee, and CIT Group Inc., as guarantor, as supplemented by Letter Agreement No. 1 of 2010, dated July 19, 2010, among The Royal Bank of Scotland N.V., as arranger, CIT Aerospace International, as head lessee, and CIT Group Inc., as guarantor, as amended and supplemented by the Accession Deed, dated July 21, 2010, among The Royal Bank of Scotland N.V., as arranger, Madeleine Leasing Limited, as original borrower, and Jessica Leasing Limited, as acceding party, as supplemented by Letter Agreement No. 2 of 2010, dated July 29, 2010, among The Royal Bank of Scotland N.V., as arranger, CIT Aerospace International, as head lessee, and CIT Group Inc., as guarantor, relating to certain Export Credit Agency sponsored secured financings of aircraft and related assets (incorporated by reference to Exhibit 4.11 to Form 10-K filed March 10, 2011). |
| | | | Form of All Parties Agreement among CIT Aerospace International, as head lessee, Madeleine Leasing Limited, as borrower and lessor, CIT Group Inc., as guarantor, various financial institutions, as original ECA lenders, ABN AMRO Bank N.V., Paris Branch, as French national agent, ABN AMRO Bank N.V., Niederlassung Deutschland, as German national agent, ABN AMRO Bank N.V., London Branch, as British national agent, ABN AMRO Bank N.V., London Branch, as ECA facility agent, ABN AMRO Bank N.V., London Branch, as security trustee, and CIT Aerospace International, as servicing agent, relating to certain Export Credit Agency sponsored secured financings of aircraft and related assets during the 2008 and 2009 fiscal years (incorporated by reference to Exhibit 4.12 to Form 10-K filed March 10, 2011). |
Item 15: Exhibits and Financial Statement Schedules
170 CIT ANNUAL REPORT 2012
| | | | Form of ECA Loan Agreement among Madeleine Leasing Limited, as borrower, various financial institutions, as original ECA lenders, ABN AMRO Bank N.V., Paris Branch, as French national agent, ABN AMRO Bank N.V., Niederlassung Deutschland, as German national agent, ABN AMRO Bank N.V., London Branch, as British national agent, ABN AMRO Bank N.V., London Branch, as ECA facility agent, ABN AMRO Bank N.V., London Branch, as security trustee, and CIT Aerospace International, as servicing agent, relating to certain Export Credit Agency sponsored secured financings of aircraft and related assets during the 2008 and 2009 fiscal years (incorporated by reference to Exhibit 4.13 to Form 10-K filed March 10, 2011). |
| | | | Form of Aircraft Head Lease between Madeleine Leasing Limited, as lessor, and CIT Aerospace International, as head lessee, relating to certain Export Credit Agency sponsored secured financings of aircraft and related assets during the 2008 and 2009 fiscal years (incorporated by reference to Exhibit 4.14 to Form 10-K filed March 10, 2011). |
| | | | Form of Proceeds and Intercreditor Deed among Madeleine Leasing Limited, as borrower and lessor, various financial institutions, ABN AMRO Bank N.V., Paris Branch, as French national agent, ABN AMRO Bank N.V., Niederlassung Deutschland, as German national agent, ABN AMRO Bank N.V., London Branch, as British national agent, ABN AMRO Bank N.V., London Branch, as ECA facility agent, ABN AMRO Bank N.V., London Branch, as security trustee, relating to certain Export Credit Agency sponsored secured financings of aircraft and related assets during the 2008 and 2009 fiscal years (incorporated by reference to Exhibit 4.15 to Form 10-K filed March 10, 2011). |
| | | | Form of All Parties Agreement among CIT Aerospace International, as head lessee, Jessica Leasing Limited, as borrower and lessor, CIT Group Inc., as guarantor, various financial institutions, as original ECA lenders, Citibank International plc, as French national agent, Citibank International plc, as German national agent, Citibank International plc, as British national agent, The Royal Bank of Scotland N.V., London Branch, as ECA facility agent, The Royal Bank of Scotland N.V., London Branch, as security trustee, CIT Aerospace International, as servicing agent, and Citibank, N.A., as administrative agent, relating to certain Export Credit Agency sponsored secured financings of aircraft and related assets during the 2010 fiscal year (incorporated by reference to Exhibit 4.16 to Form 10-K filed March 10, 2011). |
| | | | Form of ECA Loan Agreement among Jessica Leasing Limited, as borrower, various financial institutions, as original ECA lenders, Citibank International plc, as French national agent, Citibank International plc, as German national agent, Citibank International plc, as British national agent, The Royal Bank of Scotland N.V., London Branch, as ECA facility agent, The Royal Bank of Scotland N.V., London Branch, as security trustee, and Citibank, N.A., as administrative agent, relating to certain Export Credit Agency sponsored secured financings of aircraft and related assets during the 2010 fiscal year (incorporated by reference to Exhibit 4.17 to Form 10-K filed March 10, 2011). |
| | | | Form of Aircraft Head Lease between Jessica Leasing Limited, as lessor, and CIT Aerospace International, as head lessee, relating to certain Export Credit Agency sponsored secured financings of aircraft and related assets during the 2010 fiscal year (incorporated by reference to Exhibit 4.18 to Form 10-K filed March 10, 2011). |
| | | | Form of Proceeds and Intercreditor Deed among Jessica Leasing Limited, as borrower and lessor, various financial institutions, as original ECA lenders, Citibank International plc, as French national agent, Citibank International plc, as German national agent, Citibank International plc, as British national agent, The Royal Bank of Scotland N.V., London Branch, as ECA facility agent, The Royal Bank of Scotland N.V., London Branch, as security trustee, and Citibank, N.A., as administrative agent, relating to certain Export Credit Agency sponsored secured financings of aircraft and related assets during the 2010 fiscal year (incorporated by reference to Exhibit 4.19 to Form 10-K filed March 10, 2011). |
| | | | Indenture, dated as of March 30, 2011, between CIT Group Inc. and Deutsche Bank Trust Company Americas, as trustee (incorporated by reference to Exhibit 4.1 to Form 8-K filed June 30, 2011). |
| | | | First Supplemental Indenture, dated as of March 30, 2011, between CIT Group Inc., the Guarantors named therein, and Deutsche Bank Trust Company Americas, as trustee (including the Form of 5.250% Note due 2014 and the Form of 6.625% Note due 2018) (incorporated by reference to Exhibit 4.2 to Form 8-K filed June 30, 2011). |
| | | | Registration Rights Agreement, dated as of March 30, 2011, among CIT Group Inc., the Guarantors named therein, and Merrill Lynch, Pierce, Fenner & Smith Incorporated, Barclays Capital Inc., Citigroup Global Markets Inc., Deutsche Bank Securities Inc. and J.P. Morgan Securities LLC, as representatives for the initial purchasers named therein (incorporated by reference to Exhibit 10.1 to Form 8-K filed June 30, 2011). |
| | | | Third Supplemental Indenture, dated as of February 7, 2012, between CIT Group Inc., the Guarantors named therein, and Deutsche Bank Trust Company Americas, as trustee (including the Form of Notes) (incorporated by reference to Exhibit 4.4 of Form 8-K dated February 13, 2012). |
| | | | Registration Rights Agreement, dated as of February 7, 2012, among CIT Group Inc., the Guarantors named therein, and JP Morgan Securities LLC, as representative for the initial purchasers named therein (incorporated by reference to Exhibit 10.1 of Form 8-K dated February 13, 2012). |
CIT ANNUAL REPORT 2012 171
| | | | Revolving Credit and Guaranty Agreement, dated as of August 25, 2011 among CIT Group Inc., certain subsidiaries of CIT Group Inc., the lenders party thereto from time to time and Bank of America, N.A., as Administrative Agent, Collateral Agent, and L/C Issuer (incorporated by reference to Exhibit 4.1 to Form 8-K filed August 26, 2011). |
| | | | Indenture, dated as of March 15, 2012, among CIT Group Inc., Wilmington Trust, National Association, as trustee, and Deutsche Bank Trust Company Americas, as paying agent, security registrar and authenticating agent (incorporated by reference to Exhibit 4.1 of Form 8-K filed March 16, 2012). |
| | | | First Supplemental Indenture, dated as of March 15, 2012, among CIT Group Inc., Wilmington Trust, National Association, as trustee, and Deutsche Bank Trust Company Americas, as paying agent, security registrar and authenticating agent (including the Form of 5.25% Senior Unsecured Note due 2018) (incorporated by reference to Exhibit 4.2 of Form 8-K filed March 16, 2012). |
| | | | Second Supplemental Indenture, dated as of May 4, 2012, among CIT Group Inc., Wilmington Trust, National Association, as trustee, and Deutsche Bank Trust Company Americas, as paying agent, security registrar and authenticating agent (including the Form of 5.000% Senior Unsecured Note due 2017 and the Form of 5.375% Senior Unsecured Note due 2020) (incorporated by reference to Exhibit 4.2 of Form 8-K filed May 4, 2012). |
| | | | Third Supplemental Indenture, dated as of August 3, 2012, among CIT Group Inc., Wilmington Trust, National Association, as trustee, and Deutsche Bank Trust Company Americas, as paying agent, security registrar and authenticating agent (including the Form of 4.25% Senior Unsecured Note due 2017 and the Form of 5.00% Senior Unsecured Note due 2022) (incorporated by reference to Exhibit 4.2 to Form 8-K filed August 3, 2012). |
| | | | Form of Separation Agreement by and between Tyco International Ltd. and CIT (incorporated by reference to Exhibit 10.2 to Amendment No. 3 to the Registration Statement on Form S-1 filed June 26, 2002). |
| | | | Form of Financial Services Cooperation Agreement by and between Tyco International Ltd. and CIT (incorporated by reference to Exhibit 10.3 to Amendment No. 2 to the Registration Statement on Form S-1 filed June 12, 2002). |
| | | | Amended and Restated CIT Group Inc. Long-Term Incentive Plan (as amended and restated effective December 10, 2009) (incorporated by reference to Exhibit 4.1 to Form S-8 filed January 11, 2010). |
| | | | CIT Group Inc. Supplemental Retirement Plan (As Amended and Restated Effective as of January 1, 2008) (incorporated by reference to Exhibit 10.27 to Form 10-Q filed May 12, 2008). |
| | | | CIT Group Inc. Supplemental Savings Plan (As Amended and Restated Effective as of January 1, 2008) (incorporated by reference to Exhibit 10.28 to Form 10-Q filed May 12, 2008). |
| | | | New Executive Retirement Plan of CIT Group Inc. (As Amended and Restated as of January 1, 2008) (incorporated by reference to Exhibit 10.29 to Form 10-Q filed May 12, 2008). |
| | | | Letter Agreement, effective February 8, 2010, between CIT Group Inc. and John A. Thain (incorporated by reference to Exhibit 10.1 to Form 8-K filed February 8, 2010). |
| | | | Form of CIT Group Inc. Three Year Stock Salary Award Agreement, dated February 8, 2010 (incorporated by reference to Exhibit 10.2 to Form 8-K filed February 8, 2010). |
| | | | Written Agreement, dated August 12, 2009, between CIT Group Inc. and the Federal Reserve Bank of New York (incorporated by reference to Exhibit 10.1 of Form 8-K filed August 13, 2009). |
| | | | Form of CIT Group Inc. Two Year Restricted Stock Unit Award Agreement, dated July 29, 2010 (incorporated by reference to Exhibit 10.31 to Form 10-Q filed August 9, 2010). |
| | | | Letter Agreement, dated June 2, 2010, between CIT Group Inc. and Scott T. Parker (incorporated by reference to Exhibit 99.3 to Form 8-K filed July 6, 2010). |
| | | | Form of CIT Group Inc. Long-term Incentive Plan Restricted Stock Unit Retention Award Agreement (incorporated by reference to Exhibit 10.33 to Form 10-Q filed August 9, 2010). |
| | | | Form of CIT Group Inc. Long-Term Incentive Plan Restricted Stock Unit Award Agreement (incorporated by reference to Exhibit 10.34 to Form 10-Q filed August 9, 2010). |
| | | | Form of CIT Group Inc. Long-term Incentive Plan Stock Option Award Agreement (One Year Vesting) (incorporated by reference to Exhibit 10.35 to Form 10-Q filed August 9, 2010). |
| | | | Form of CIT Group Inc. Long-term Incentive Plan Stock Option Award Agreement (Three Year Vesting) (incorporated by reference to Exhibit 10.36 to Form 10-Q filed August 9, 2010). |
Item 15: Exhibits and Financial Statement Schedules
172 CIT ANNUAL REPORT 2012
| | | | Form of CIT Group Inc. Long-term Incentive Plan Restricted Stock Award Agreement (One Year Vesting) (incorporated by reference to Exhibit 10.37 to Form 10-Q filed August 9, 2010). |
| | | | Form of CIT Group Inc. Long-term Incentive Plan Restricted Stock Award Agreement (Three Year Vesting) (incorporated by reference to Exhibit 10.38 to Form 10-Q filed August 9, 2010). |
| | | | Form of CIT Group Inc. Long-term Incentive Plan Restricted Stock Unit Director Award Agreement (Initial Grant) (incorporated by reference to Exhibit 10.39 to Form 10-Q filed August 9, 2010). |
| | | | Form of CIT Group Inc. Long-term Incentive Plan Restricted Stock Unit Director Award Agreement (Annual Grant) (incorporated by reference to Exhibit 10.40 to Form 10-Q filed August 9, 2010). |
| | | | Form of Tax Agreement by and between Tyco International Ltd. and CIT (incorporated by reference to Exhibit 10.27 to Amendment No. 2 to the Registration Statement on Form S-1 filed June 12, 2002). |
| | | | Amended and Restated Employment Agreement, dated as of May 7, 2008, between CIT Group Inc. and C. Jeffrey Knittel (incorporated by reference to Exhibit 10.35 to Form 10-K filed March 2, 2009). |
| | | | Amendment to Employment Agreement, dated December 22, 2008, between CIT Group Inc. and C. Jeffrey Knittel (incorporated by reference to Exhibit 10.37 to Form 10-K filed March 2, 2009). |
| | | | Extension of Term of Employment Agreement, dated March 14, 2011, between CIT Group Inc. and C. Jeffrey Knittel (incorporated by reference to Exhibit 10.30 of Form 10-Q filed August 9, 2011). |
| | | | Letter Agreement, dated April 21, 2010, between CIT Group Inc. and Nelson J. Chai (incorporated by reference to Exhibit 10.31 of Form 10-Q filed August 9, 2011). |
| | | | Letter Agreement, dated April 8, 2010, between CIT Group Inc. and Lisa K. Polsky (incorporated by reference to Exhibit 10.32 of Form 10-Q filed August 9, 2011). |
| | | | Form of CIT Group Inc. Long-Term Incentive Plan Restricted Stock Unit Award Agreement (with Good Reason) (incorporated by reference to Exhibit 10.33 of Form 10-Q filed August 9, 2011). |
| | | | Form of CIT Group Inc. Long-Term Incentive Plan Restricted Stock Unit Award Agreement (without Good Reason) (incorporated by reference to Exhibit 10.34 of Form 10-Q filed August 9, 2011). |
| | | | Airbus A320 NEO Family Aircraft Purchase Agreement, dated as of July 28, 2011, between Airbus S.A.S. and C.I.T. Leasing Corporation (incorporated by reference to Exhibit 10.35 of Form 10-Q/A filed February 1, 2012). |
| | | | Amended and Restated Confirmation, dated June 28, 2012, between CIT TRS Funding B.V. and Goldman Sachs International, and Credit Support Annex and ISDA Master Agreement and Schedule, each dated October 26, 2011, between CIT TRS Funding B.V. and Goldman Sachs International, evidencing a $625 billion securities based financing facility. |
| | | | Third Amended and Restated Confirmation, dated June 28, 2012, between CIT Financial Ltd. and Goldman Sachs International, and Amended and Restated ISDA Master Agreement Schedule, dated October 26, 2011 between CIT Financial Ltd. and Goldman Sachs International, evidencing a $1.5 billion securities based financing facility. |
| | | | ISDA Master Agreement and Credit Support Annex, each dated June 6, 2008, between CIT Financial Ltd. and Goldman Sachs International related to a $1.5 billion securities based financing facility (incorporated by reference to Exhibit 10.34 to Form 10-Q filed August 11, 2008). |
| | | | Letter Agreement, dated February 24, 2012, between CIT Group Inc. and Andrew T. Brandman (incorporated by reference to Exhibit 99.2 of Form 8-K dated filed April 12, 2012). |
| | | | Form of CIT Group Inc. Long-Term Incentive Plan Performance Stock Unit Award Agreement (with Good Reason) (incorporated by reference to Exhibit 10.36 to Form 10-K filed May 10, 2012). |
| | | | Form of CIT Group Inc. Long-Term Incentive Plan Performance Stock Unit Award Agreement (without Good Reason) (incorporated by reference to Exhibit 10.37 to Form 10-K filed May 10, 2012). |
| | | | Extension of Term of Employment Agreement, dated March 28, 2012, between CIT Group Inc. and C. Jeffrey Knittel (incorporated by reference to Exhibit 10.38 to Form 10-K filed May 10, 2012). |
| | | | Form of CIT Group Inc. Long-Term Incentive PIan Restricted Stock Unit Award Agreement. |
| | | | Form of CIT Group Inc. Long-Term Incentive Plan Restricted Stock Unit Award Agreement (Executives with Employment Agreements). |
| | | | CIT Group Inc. and Subsidiaries Computation of Ratio of Earnings to Fixed Charges. |
CIT ANNUAL REPORT 2012 173
| | | | Subsidiaries of CIT Group Inc. |
| | | | Consent of PricewaterhouseCoopers LLP. |
| | | | |
| | | | Certification of John A. Thain pursuant to Rules 13a-14(a) and 15d-14(a) of the Securities Exchange Commission, as promulgated pursuant to Section 13(a) of the Securities Exchange Act and Section 302 of the Sarbanes-Oxley Act of 2002. |
| | | | Certification of Scott T. Parker pursuant to Rules 13a-14(a) and 15d-14(a) of the Securities Exchange Commission, as promulgated pursuant to Section 13(a) of the Securities Exchange Act and Section 302 of the Sarbanes-Oxley Act of 2002. |
| | | | Certification of John A. Thain pursuant to 18 U.S.C. Section 1350, as adopted pursuant to Section 906 of the Sarbanes-Oxley Act of 2002. |
| | | | Certification of Scott T. Parker pursuant to 18 U.S.C. Section 1350, as adopted pursuant to Section 906 of the Sarbanes-Oxley Act of 2002. |
| | | | Senior Intercreditor and Subordination Agreement, dated as of December 10, 2009, among Bank of America, N.A., as First Lien Credit Facility Representative and First Lien Agent, Deutsche Bank Trust Company of America, as Series A Representative and Series A Collateral Agent and as Series B Representative and Series B Collateral Agent, CIT Group Funding Company of Delaware, LLC, as CIT Leasing Secured Party, and CIT Group Inc. and certain of its subsidiaries, as obligors (incorporated by reference to Exhibit 99.1 to Form 8-K/A filed May 13, 2010). |
| | | | XBRL Instance Document (Includes the following financial information included in the Company’s Quarterly Report on Form 10-Q for the quarter ended September 30, 2011, formatted in XBRL (eXtensible Business Reporting Language): (i) the Consolidated Statements of Operations, (ii) the Consolidated Balance Sheets, (iii) the Consolidated Statements of Changes in Stockholders’ Equity and Comprehensive Income, (iv) the Consolidated Statements of Cash Flows, and (v) Notes to Consolidated Financial Statements.) |
| | | | XBRL Taxonomy Extension Schema Document. |
| | | | XBRL Taxonomy Extension Calculation Linkbase Document. |
| | | | XBRL Taxonomy Extension Label Linkbase Document. |
| | | | XBRL Taxonomy Extension Presentation Linkbase Document. |
| | | | XBRL Taxonomy Extension Definition Linkbase Document. |
* | | Indicates a management contract or compensatory plan or arrangement. |
** | | Portions of this exhibit have been omitted and filed separately with the Securities and Exchange Commission as part of an application for granting confidential treatment pursuant to the Securities Exchange Act of 1934, as amended. |
*** | | This information is furnished and not filed for purposes of Section 18 of the Securities Exchange Act of 1934 and is not incorporated by reference into any filing under the Securities Act of 1933. |
Item 15: Exhibits and Financial Statement Schedules
174 CIT ANNUAL REPORT 2012
SIGNATURES
Pursuant to the requirements of Section 13 or 15(d) of the Securities Exchange Act of 1934, the Registrant has duly caused this report to be signed on its behalf by the undersigned, thereunto duly authorized.
| | | | |
| | | | |
| | | | |
| | | | Chairman and Chief Executive Officer and Director |
Pursuant to the requirements of the Securities Exchange Act of 1934, this report has been signed below by the following persons on March 1, 2013 in the capacities indicated below.
| | | | |
| |
| | | | |
John A. Thain
Chairman and Chief Executive Officer and Director | | | | |
| |
| | | | |
Michael J. Embler
Director | | | | Seymour Sternberg
Director |
| |
| | | | |
William M. Freeman
Director | | | | |
| |
| | | | |
| | | | |
| |
| | | | |
| | | | Scott T. Parker
Executive Vice President and Chief Financial Officer |
| |
| | | | |
Marianne Miller Parrs
Director | | | | E. Carol Hayles
Executive Vice President and Controller |
| |
| | | | |
| | | | James P. Shanahan
Senior Vice President,
Chief Regulatory Counsel Attorney-in-Fact |
* | | Original powers of attorney authorizing John A. Thain, Robert J. Ingato, and James P. Shanahan and each of them to sign on behalf of the above-mentioned directors are held by the Corporation and available for examination by the Securities and Exchange Commission pursuant to Item 302(b) of Regulation S-T. |