U.S. SECURITIES AND EXCHANGE COMMISSION
WASHINGTON, D. C. 20549
FORM 10-K
[X] ANNUAL REPORT PURSUANT TO SECTION 13 OR 15 (d) OF THE SECURITIES
EXCHANGE ACT OF 1934
For the fiscal year ended December 31, 2006
or
[ ] TRANSITION REPORT PURSUANT TO SECTION 13 OR 15 (d) OF THE SECURITIES
EXCHANGE ACT OF 1934
For the transition period from ________ to _________
Commission File Number 000-50055
SOMERSET HILLS BANCORP
(Exact Name of registrant as specified in its charter)
New Jersey
(State of other jurisdiction of
incorporation or organization) | | | | 22-3768777
(I. R. S. Employer
Identification No.) |
155 Morristown Road, Bernardsville, NJ
(Address of principal executive offices) | | | | 07924
(Zip Code) |
| | | (908) 221-0100
(Issuer’s telephone number) | | |
Securities registered under Section 12(b) of the Exchange Act:
Title of each class Name of each exchange on which registered
Common Stock, no par value Nasdaq
Securities registered under Section 12(g) of the Exchange Act: None
Indicate by check mark if the registrant is a well-known seasoned issuer, as defined in Rule 405of the Securities Act. Yes [ ] No [ X ]
Indicate by check mark if the registrant is not required to file reports pursuant to Section 13 or 15(d) of the Act. Yes [ ] No [ X ]
Check whether the registrant (1) has filed all reports required to be filed by Section 13 or 15(d) of the Securities and Exchange Act of 1934 during the preceding 12 months (or for such shorter period that the registrant was required to file such reports), and (2) has been subject to such filing requirements for the past 90 days. Yes [X] No [_]
Check if there is no disclosure of delinquent filers pursuant to Item 405 of Regulation S-K contained herein, and will not be contained, to the best of registrant’s knowledge, in definitive proxy or information statements incorporated by referenced in Part III of this Form 10-K or any amendment to this Form 10-K.
[ ]
Indicate by check mark whether the registrant is a large accelerated filer, an accelerated filer, or a non-accelerated filer. See definition of “accelerated filer and large accelerated filer” in Rule 12b-2 of the Exchange Act. (check one): Large accelerated filer [ ] Accelerated filer [ ] Non-accelerated filer [X]
Indicate by check mark whether the registrant is a shell company (as defined in Rule 12b-2 of the Exchange Act). Yes [ ] No [ X ]
As of June 30, 2006, the aggregate market value of voting and non-voting equity held by non-affiliates was $39.6 million.
As of March 9th, 2007 there were 4,760,425 shares of common stock, no par value per share outstanding.
DOCUMENTS INCORPORATED BY REFERENCE
| | 10-K Item
| | Document Incorporated
|
| Item 10. | | Directors and Executive Officers
of the Registrant | | Proxy Statement for 2007 Annual Meeting of Shareholders to be filed no later than April 30, 2007. |
| Item 11. | | Executive Compensation | | Proxy Statement for 2007 Annual Meeting of Shareholders to be filed no later than April 30, 2007. |
| Item 12. | | Security Ownership of Certain Beneficial Owners
and Management And Related Stockholder Matters | | Proxy Statement for 2007 Annual Meeting of Shareholders to be filed no later than April 30, 2007. |
| Item 13. | | Certain Relationships and Related
Transactions | | Proxy Statement for 2007 Annual Meeting of Shareholders to be filed no later than April 30, 2007. |
| Item 14. | | Principal Accountant Fees and Services | | Proxy Statement for 2007 Annual Meeting of Shareholders to be filed no later than April 30, 2007. |
PART I
ITEM 1. — DESCRIPTION OF BUSINESS
General
Somerset Hills Bancorp (the “Company”) is a one-bank holding company incorporated under the laws of New Jersey in January 2000 to serve as the holding company for Somerset Hills Bank (the “Bank”). We were organized at the direction of the Board of Directors of the Bank. Effective January 1, 2001, Somerset Hills Bancorp acquired all of the capital stock of the Bank and became a bank holding company under the Bank Holding Company Act of 1956, as amended. Our only significant operation is our investment in the Bank. Our main office is located at 155 Morristown Road, Bernardsville, New Jersey and our telephone number is (908) 221-0100.
The Bank is a commercial bank formed under the laws of the State of New Jersey in 1997. The Bank operates from its main office at 155 Morristown Road, Bernardsville, New Jersey, and its additional four branch offices located in Madison, Mendham, Morristown and Summit, New Jersey. The Bank operates a licensed mortgage company subsidiary, Sullivan Financial Services, Inc. (“Sullivan”). Sullivan operates out of its main office in West Orange, New Jersey. The Company considers Sullivan to be a separate business segment.
The Bank’s deposits are insured by the Bank Insurance Fund of the Federal Deposit Insurance Corporation up to applicable limits. The operations of the Bank are subject to the supervision and regulation of the Federal Deposit Insurance Corporation and the New Jersey Department of Banking and Insurance. Our mortgage company’s operations are subject to regulation by the New Jersey Department of Banking and Insurance, the Department of Banking in Florida, New York and Pennsylvania as well as the Department of Housing and Urban Development and the Veterans Administration.
We separate our business into two reporting segments: retail banking and mortgage banking. For financial information on our business segments, see Note 13 to the accompanying Financial Statements.
Business of the Bank
The Bank conducts a traditional commercial banking business and offers services including personal and business checking accounts and time deposits, money market accounts and regular savings accounts. The Bank’s lending activities are oriented to the small-to-medium sized business, high net worth individuals, professional practices and consumer and retail customers living and working primarily in the Bank’s market area of Somerset, Morris and Union Counties, New Jersey. The Bank offers the commercial, consumer, and mortgage-lending products typically offered by community banks and, through its mortgage company subsidiary, a variety of residential mortgage products.
The deposit services offered by the Bank include small business and personal checking and savings accounts and certificates of deposit. The Bank’s signature deposit account is the Paramount Checking Account, an interest paying account offering features such as free checks, telephone banking and bill payment, free safe deposit box and a refund of foreign ATM fees. Another deposit service the bank offers is the Escrow Ease product. Escrow Ease is specifically designed to meet the trust account needs of attorneys, realtors and title companies. The Escrow Ease Account offers the convenience of segregation of client funds, by sub account, within a single master trust account with detailed sub account reporting including the preparation of year-end tax documents. Sub accounts may be either interest or non-interest bearing and, for attorneys, can also be designated as IOLTA accounts. The Bank concentrates on customer
relationships in building our customer deposit base and competes aggressively in the area of transaction accounts.
In addition, the Bank has established a private banking and wealth management subsidiary pursuant to which it offers insurance services, securities brokerage and investment advisory services on a non-proprietary basis under the terms of an agreement with Mass Mutual, its affiliated securities brokerage and its locally affiliated agents. The Bank has also established a title insurance agency joint venture which offers traditional title agency services. The bank is a 50 percent owner of the joint venture.
Service Area
The service area of the Bank primarily consists of Somerset, Morris and Union Counties, New Jersey, although we make loans throughout New Jersey. The Bank operates through its main office in Bernardsville, New Jersey, and its branch offices located in Madison, Mendham, Morristown and Summit, New Jersey.
Our mortgage company subsidiary originates loans primarily throughout New Jersey, and to a lesser degree, New York, Pennsylvania and Florida. The mortgage company operates out of its main office in West Orange, New Jersey, and a loan origination office located at the Bank’s main office in Bernardsville, New Jersey.
Competition
The Bank operates in a highly competitive environment competing for deposits and loans with commercial banks, thrifts and other financial institutions, many of which have greater financial resources than the Bank. Many large financial institutions compete for business in the service area of the Bank. In addition, in November 1999, the Gramm-Leach-Bliley Financial Modernization Act of 1999 was passed into law. The Act permits insurance companies and securities firms, among others, to acquire financial institutions and has increased competition within the financial services industry. Certain of our competitors have significantly higher lending limits than we do and provide services to their customers that we do not offer.
Management believes that the Bank is able to compete favorably with our competitors because we provide responsive personalized service through management’s knowledge and awareness of our market area, customers and businesses.
Employees
At December 31, 2006 and 2005, we employed 82 and 76 full-time employees and 6 and 6 part-time employees, respectively. None of these employees are covered by a collective bargaining agreement and we believe that our employee relations are good.
Supervision and Regulation
Bank holding companies and banks are extensively regulated under both federal and state law. These laws and regulations are intended to protect depositors, not shareholders. In addition, the operations of Sullivan are subject to various state and federal regulations designed to protect consumers, not shareholders. To the extent that the following information describes statutory and regulatory provisions, it is qualified in its entirety by reference to the particular statutory and regulatory provisions. Any change in the applicable law or regulation may have a material effect on the business and prospects of the Company and the Bank.
BANK HOLDING COMPANY REGULATION
General
As a bank holding company registered under the Bank Holding Company Act, the Company is subject to the regulation and supervision applicable to bank holding companies by the Board of Governors of the Federal Reserve System. The Company is required to file with the Federal Reserve annual reports and other information regarding its business operations and those of its subsidiaries.
The Bank Holding Company Act requires, among other things, the prior approval of the Federal Reserve in any case where a bank holding company proposes to (i) acquire all or substantially all of the assets of any other bank, (ii) acquire direct or indirect ownership or control of more than 5% of the outstanding voting stock of any bank (unless it owns a majority of such company’s voting shares) or (iii) merge or consolidate with any other bank holding company. The Federal Reserve will not approve any acquisition, merger, or consolidation that would have a substantially anti-competitive effect, unless the anti-competitive impact of the proposed transaction is clearly outweighed by a greater public interest in meeting the convenience and needs of the community to be served. The Federal Reserve also considers capital adequacy and other financial and managerial resources and future prospects of the companies and the banks concerned, together with the convenience and needs of the community to be served, when reviewing acquisitions or mergers.
The Bank Holding Company Act generally prohibits a bank holding company, with certain limited exceptions, from (i) acquiring or retaining direct or indirect ownership or control of more than 5% of the outstanding voting stock of any company which is not a bank or bank holding company, or (ii) engaging directly or indirectly in activities other than those of banking, managing or controlling banks, or performing services for its subsidiaries, unless such non-banking business is determined by the Federal Reserve to be so closely related to banking or managing or controlling banks as to be properly incident thereto.
The Bank Holding Company Act was substantially amended through the Gramm-Leach Bliley Financial Modernization Act of 1999 (“Financial Modernization Act”). The Financial Modernization Act permits bank holding companies and banks, which meet certain capital, management and Community Reinvestment Act standards to engage in a broader range of non-banking activities. In addition, bank holding companies that elect to become financial holding companies may engage in certain banking and non-banking activities without prior Federal Reserve approval. Finally, the Financial Modernization Act imposes certain new privacy requirements on all financial institutions and their treatment of consumer information. At this time, the Company has elected not to become a financial holding company, as it does not engage in any activities that are not permissible for banks.
There are a number of obligations and restrictions imposed on bank holding companies and their depository institution subsidiaries by law and regulatory policy that are designed to minimize potential loss to the depositors of such depository institutions and the FDIC insurance funds in the event the depository institution becomes in danger of default. Under a policy of the Federal Reserve with respect to bank holding company operations, a bank holding company is required to serve as a source of financial strength to its subsidiary depository institutions and to commit resources to support such institutions in circumstances where it might not do so absent such policy. The Federal Reserve also has the authority under the Bank Holding Company Act to require a bank holding company to terminate any activity or to relinquish control of a non-bank subsidiary upon the Federal Reserve’s determination that such activity or control constitutes a serious risk to the financial soundness and stability of any bank subsidiary of the bank holding company.
Capital Adequacy Guidelines for Bank Holding Companies
The Federal Reserve has adopted risk-based capital guidelines for bank holding companies. The risk-based capital guidelines are designed to make regulatory capital requirements more sensitive to differences in risk profile among banks and bank holding companies to account for off-balance sheet exposure, and to minimize disincentives for holding liquid assets. Under these guidelines, assets and off-balance sheet items are assigned to broad risk categories, each with appropriate weights. The resulting capital ratios represent capital as a percentage of total risk-weighted assets and off-balance sheet items.
The minimum ratio of total capital to risk-weighted assets (including certain off-balance sheet activities, such as standby letters of credit) is 8%. At least 4% of the total capital is required to be “Tier I Capital,” consisting of common shareholders’ equity, qualifying preferred stock and certain permissible hybrid instruments, less certain goodwill items and other intangible assets. The remainder (“Tier II Capital”) may consist of (a) the allowance for loan losses of up to 1.25% of risk-weighted assets, (b) non-qualifying preferred stock, (c) hybrid capital instruments, (d) perpetual debt, (e) mandatory convertible securities, and (f) qualifying subordinated debt and intermediate-term preferred stock up to 50% of Tier I capital. Total capital is the sum of Tier I and Tier II capital less reciprocal holdings of other banking organizations’ capital instruments, investments in unconsolidated subsidiaries and any other deductions as determined by the Federal Reserve (determined on a case by case basis or as a matter of policy after formal rule-making).
Bank holding company assets are given risk-weights of 0%, 20%, 50% and 100%. In addition, certain off-balance sheet items are given similar credit conversion factors to convert them to asset equivalent amounts to which an appropriate risk-weight will apply. These computations result in the total risk-weighted assets. Most loans are assigned to the 100% risk category, except for performing first mortgage loans fully secured by residential property which carry a 50% risk-weighting and loans secured by deposits in the bank which carry a 20% risk weighting. Most investment securities (including, primarily general obligation claims of states or other political subdivisions of the United States) are assigned to the 20% category, except for municipal or state revenue bonds, which have a 50% risk-weight, and direct obligations of the U.S. Treasury or obligations backed by the full faith and credit of the U.S. Government, which have a 0% risk-weight. In converting off-balance sheet items, direct credit substitutes including general guarantees and standby letters of credit backing financial obligations are given a 100% risk weighting. Transaction related contingencies such as bid bonds, standby letters of credit backing non-financial obligations, and undrawn commitments (including commercial credit lines with an initial maturity of more than one year) have a 50% risk weighting. Short-term commercial letters of credit have a 20% risk weighting and certain short-term unconditionally cancelable commitments have a 0% risk weighting.
In addition to the risk-based capital guidelines, the Federal Reserve has adopted a minimum Tier I capital (leverage) ratio, under which a bank holding company must maintain a minimum level of Tier I capital to average total consolidated assets of at least 3% in the case of a bank holding company that has the highest regulatory examination rating and is not contemplating significant growth or expansion. All other bank holding companies are expected to maintain a leverage ratio of at least 100 to 200 basis points above the stated minimum. See “Item 7 - Management’s Discussion and Analysis of Financial Condition and Results of Operation - - Capital Ratios”.
BANK REGULATION
As a New Jersey-chartered commercial bank, the Bank is subject to the regulation, supervision, and control of the New Jersey Department of Banking and Insurance. As an FDIC-insured institution, the Bank is subject to regulation, supervision and control of the FDIC, an agency of the federal government. The regulations of the FDIC and the New Jersey Department of Banking and Insurance impact virtually all of the Bank’s activities, including the minimum level of capital
we must maintain, our ability to pay dividends, our ability to expand through new branches or acquisitions and various other matters.
Insurance of Deposits
The Bank’s deposits are insured up to a maximum of $100,000 per depositor ($250,000 per IRA account) under the Deposit Insurance Fund of the FDIC. The FDIC has established a risk-based assessment system for all insured depository institutions. Under the risk-based assessment system, deposit insurance premium rates during 2006 ranged from 0-27 basis points of assessed deposits. For the year ended December 31, 2006, we paid deposit insurance premiums of $27,462. Commencing in January 2007, the FDIC revised its deposit insurance assessment system. Under the new system, deposit insurance assessment rates will range from 5 to 43 basis points of assessed deposits.
Capital Adequacy Guidelines
The FDIC has promulgated risk-based capital guidelines, which are designed to make regulatory capital requirements more sensitive to differences in risk profile among banks, to account for off-balance sheet exposure, and to minimize disincentives for holding liquid assets. Under these guidelines, assets and off-balance sheet items are assigned to broad risk categories, each with appropriate weights. The resulting capital ratios represent capital as a percentage of total risk-weighted assets and off-balance sheet items. These guidelines are substantially similar to the Federal Reserve Board guidelines discussed above.
In addition to the risk-based capital guidelines, the FDIC has adopted a minimum Tier 1 capital (leverage) ratio. This measurement is substantially similar to the Federal Reserve leverage capital measurement discussed above.
Dividends
As long as the operations of the Bank remain our primary source of income, our ability to pay dividends will be effected by any legal or regulatory limitations on the Bank’s ability to pay dividends to us. The Bank may pay dividends as declared from time to time by the Board of Directors out of funds legally available, subject to certain restrictions. Under the New Jersey Banking Act of 1948, the Bank may not pay a cash dividend unless, following the payment, the Bank’s capital stock will be unimpaired and the Bank will have a surplus of no less than 50% of the Bank’s capital stock or, if not, the payment of the dividend will not reduce the surplus. In addition, the Bank cannot pay dividends in such amounts as would reduce the Bank’s capital below regulatory imposed minimums. During 2005, we commenced paying quarterly cash dividends of $0.02 per share and increased the dividend in 2006 to $0.03 per share. The Board will review the amount and frequency of the Company’s cash dividends on an ongoing basis, based upon the Company’s results of operations, capital needs and other appropriate factors.
REGULATION OF SULLIVAN
As a subsidiary of the Bank, Sullivan is subject to regulation and examination by the New Jersey Department of Banking and Insurance and the FDIC. In addition, as a licensed lender, Sullivan is subject to the jurisdiction of the New Jersey Department of Banking and Insurance and, as an approved Department of Housing and Urban Development and Veterans Administration lender, Sullivan is subject to examination by the Department of Housing and Urban Development and the Veterans Administration. Sullivan is also subject to regulation by the Florida Department of Financial Services as well as the Department of Banking in New York and Pennsylvania.
ITEM 1A. - RISK FACTORS
Our business, financial condition, results of operations and the trading prices of our securities can be materially and adversely affected by many events and conditions including the following:
Risks affecting Our Business:
Our continued growth may negatively affect profitability.
Our asset size has grown each year we have been in existence. Since December 31, 2002, we have grown by more than 93 percent. Our business plan calls for our continued expansion. We project opening two new branches in the next twelve months. This growth could negatively impact our future profitability in several ways, including through potential loan losses and the need for future provisions to the loan loss reserve, and an increase in operating and other non-interest expenses associated with growth.
Our continued growth and success also depends on the ability of our officers and key employees to manage our growth effectively, to attract and retain skilled employees and to expand the capabilities of our management information systems. Accordingly, there can be no assurance that we will be successful in managing our expansion and the failure to do so would adversely affect our financial position.
Our future success may be dependent upon our Chief Executive Officer.
Our future success in implementing our current business strategy is dependent on the continued services of Stewart E. McClure, Jr., our President, Chief Executive Officer and Chief Operating Officer. If Mr. McClure were to become unavailable for any reason, our operations would likely suffer. Although we have an employment agreement with Mr. McClure, no assurances can be given that we will continue to benefit from Mr. McClure’s ongoing involvement in our operations.
Defensive measures contained in the certificate of incorporation limit the ability of shareholders to exert control over the board of directors. Our board may consider issues other than price in evaluating offers.
Our certificate of incorporation contains certain provisions which have been adopted to permit the board to act in the best interests of all shareholders in the event of an unsolicited takeover bid. These provisions may also have significant effects in limiting the ability of our shareholders to effect an immediate change in the composition of the board of directors and to otherwise exercise their voting power to affect the composition of the board or to accept an offer that the shareholders may consider to be in their best interests but which the board does not accept. In general, these provisions provide (i) for a classified board of directors; (ii) that directors may not be removed by shareholders without cause; (iii) that the affirmative vote of 75% of the outstanding shares of common stock are required to approve a merger, consolidation or sale of substantially all of the company’s assets, unless the proposed transaction is approved by a majority of the board of directors; and (iv) prior notice of any shareholder nominations and proposals. In addition, our certificate of incorporation provides that when the Board of Directors evaluates a tender or exchange offer for our securities, a proposal to merge or consolidate with another entity, or a proposal to have all or substantially all of our property and assets acquired by another entity, the Board may, as permitted by New Jersey law, give due consideration to all facts that it deems relevant in evaluating what is in the best interests of the company, the bank and the shareholders.
Risks Related to the Banking Industry:
The Company is subject to interest rate risk.
The Company’s earnings and cash flows are largely dependent upon its net interest income. Net interest income is the difference between interest income earned on interest-earning assets such as loans and securities and interest expense paid on interest-bearing liabilities such as deposits and borrowed funds. Interest rates are highly sensitive to many factors that are beyond the Company’s control, including general economic conditions and policies of various governmental and regulatory agencies and, in particular, the Board of Governors of the Federal Reserve System. Changes in monetary policy, including changes in interest rates, could influence not only the interest the Company receives on loans and securities and the amount of interest it pays on deposits and borrowings, but such changes could also affect (i) the Company’s ability to originate loans and obtain deposits, (ii) the fair value of the Company’s financial assets and liabilities, and (iii) the average duration of the Company’s mortgage-backed securities portfolio. If the interest rates paid on deposits and other borrowings increase at a faster rate than the interest rates received on loans and other investments, the Company’s net interest income, and therefore earnings, could be adversely affected. Earnings could also be adversely affected if the interest rates received on loans and other investments fall more quickly than the interest rates paid on deposits and other borrowings. In addition, a flat yield curve, in which short-term deposit and borrowing rates equal longer-term investment or loan rates, could adversely impact net interest income as the spread between interest-earning assets and interest-bearing liabilities compresses.
Although management believes it has implemented effective asset and liability management strategies, to reduce the potential effects of changes in interest rates on the Company’s results of operations, any substantial, unexpected, prolonged change in market interest rates could have a material adverse effect on the Company’s financial condition and results of operations.
Changes in local economic conditions could adversely affect our loan portfolio.
Our success depends to a great extent upon the general economic conditions of the local markets that we serve. Unlike larger banks that are more geographically diversified, we provide banking and financial services primarily to customers in our northern and central New Jersey markets, so any decline in the economy of New Jersey could have an adverse impact on us.
Our loans, the ability of borrowers to repay these loans and the value of collateral securing these loans, are impacted by economic conditions. Our financial results, the credit quality of our existing loan portfolio, and the ability to generate new loans with acceptable yield and credit characteristics may be adversely affected by changes in prevailing economic conditions, including declines in real estate values, changes in interest rates, adverse employment conditions and the monetary and fiscal policies of the federal government. Although economic conditions in our primary market area are strong and have aided our recent growth, we cannot assure you that these conditions will continue to prevail.
There is a risk that we may not be repaid in a timely manner, or at all, for loans we make.
The risk of nonpayment (or deferred or delayed payment) of loans is inherent in commercial banking. Such non-payment, or delayed or deferred payment of loans to the Company, if they occur, may have a material adverse effect on our earnings and overall financial condition. Additionally, in compliance with applicable banking laws and regulations, the Company maintains an allowance for loan losses created through charges against earnings. As of December 31, 2006, the Company’s allowance for loan losses was $2.2 million. The Company’s marketing focus on small to medium-size businesses may result in the assumption by the Company of certain lending risks that are different from or greater than those which would apply to loans made to larger companies. We seek to minimize our credit risk exposure through credit controls,
which include evaluation of potential borrowers, available collateral, liquidity and cash flow. However, there can be no assurance that such procedures will actually reduce loan losses.
Our allowance for loan losses may not be adequate to cover actual losses.
Like all financial institutions, we maintain an allowance for loan losses to provide for loan defaults and nonperformance. Our allowance for loan losses may not be adequate to cover actual losses, and future provisions for loan losses could materially and adversely affect results of our operations. Risks within the loan portfolio are analyzed on a continuous basis by management, and periodically, by an independent loan review function and by the audit committee. A risk system, consisting of multiple grading categories, is utilized as an analytical tool to assess risk and the appropriate level of loss reserves. Along with the risk system, management further evaluates risk characteristics of the loan portfolio under current economic conditions and considers such factors as the financial condition of the borrowers, past and expected loan loss experience, and other factors management feels deserve recognition in establishing an adequate reserve. This risk assessment process is performed at least quarterly, and, as adjustments become necessary, they are realized in the periods in which they become known. The amount of future losses is susceptible to changes in economic, operating and other conditions, including changes in interest rates that may be beyond our control, and these losses may exceed current estimates. State and federal regulatory agencies, as an integral part of their examination process, review our loans and allowance for loan losses and may require an increase in our allowance for loan losses. Although we believe that our allowance for loan losses is adequate to cover probable and reasonably estimated losses, we cannot assure you that we will not further increase the allowance for loan losses or that regulators will not require us to increase this allowance. Either of these occurrences could adversely affect our earnings.
We are in competition with many other banks, including larger commercial banks which have greater resources than us.
The banking industry within the State of New Jersey is highly competitive. The Company’s principal market area is also served by branch offices of large commercial banks and thrift institutions. In addition, in 1999 the Gramm-Leach-Bliley Financial Modernization Act of 1999 was passed into law. The Modernization Act permits other financial entities, such as insurance companies and securities firms, to acquire or form financial institutions, thereby further increasing competition. A number of our competitors have substantially greater resources than we do to expend upon advertising and marketing, and their substantially greater capitalization enables them to make much larger loans. Our success depends a great deal upon our judgment that large and mid-size financial institutions do not adequately serve small businesses in our principal market area and our ability to compete favorably for such customers. In addition to competition from larger institutions, we also face competition for individuals and small businesses from recently formed banks seeking to compete as “home town” institutions. Most of these new institutions have focused their marketing efforts on the smaller end of the small business market we serve.
The laws that regulate our operations are designed for the protection of depositors and the public, but not our stockholders.
The federal and state laws and regulations applicable to our operations give regulatory authorities extensive discretion in connection with their supervisory and enforcement responsibilities, and generally have been promulgated to protect depositors and the deposit insurance funds and not for the purpose of protecting stockholders. These laws and regulations can materially affect our future business. Laws and regulations now affecting us may be changed at any time, and the interpretation of such laws and regulations by bank regulatory authorities is also subject to change. We can give no assurance that future changes in laws and regulations or changes in their interpretation will not adversely affect our business.
We may be subject to higher operating costs as a result of government regulation.
We are subject to extensive federal and state legislation, regulation and supervision which is intended primarily to protect depositors and the Federal Deposit Insurance Company’s Deposit Insurance Fund, rather than investors. In addition, as a publicly traded company, we are subject to regulation and supervision by the Securities and Exchange Commission (“SEC”). In recent years, new legislation such as the Sarbanes-Oxley Act of 2002 and regulation adopted by the SEC thereunder have greatly increased compliance costs and burdens on publicly traded companies. Future legislative and regulatory changes may further increase our costs of doing business or otherwise adversely affect us and create competitive advantages for competitors.
We cannot predict how changes in technology will impact our business.
The financial services market, including banking services, is increasingly affected by advances in technology, including developments in:
| • | | debit cards and so-called “smart cards.” |
Our ability to compete successfully in the future will depend on whether we can anticipate and respond to technological changes. To develop these and other new technologies we will likely have to make additional capital investments. Although we continually invest in new technology, we cannot assure you that we will have sufficient resources or access to the necessary proprietary technology to remain competitive in the future.
The Company’s information systems may experience an interruption or breach in security.
The Company relies heavily on communications and information systems to conduct its business. Any failure, interruption or breach in security of these systems could result in failures or disruptions in the Company’s customer relationship management, general ledger, deposit, loan and other systems. While the Company has policies and procedures designed to prevent or limit the effect of the failure, interruption or security breach of its information systems, there can be no assurance that any such failures, interruptions or security breaches will not occur or, if they do occur, that they will be adequately addressed. The occurrence of any failures, interruptions or security breaches of the Company’s information systems could damage the Company’s reputation, result in a loss of customer business, subject the Company to additional regulatory scrutiny, or expose the Company to civil litigation and possible financial liability, any of which could have a material adverse effect on the Company’s financial condition and results of operations.
Item 1B. Unresolved Staff Comments
There are no unresolved staff comments.
ITEM 2. — DESCRIPTION OF PROPERTY
The Bank owns its main office in Bernardsville and a proposed branch office in Long Valley, New Jersey, and leases its Madison, Mendham, Morristown and Summit, New Jersey branch offices. In addition, the Bank leases the Main office of Sullivan Financial Services, Inc. in West Orange NJ and a branch office in Edison, NJ listed below. The following table sets forth certain information regarding the properties of the Bank:
Owned Properties
|
Location
| Square Feet
|
| Bernardsville | 14,000 | |
| Long Valley | 1,200 | |
| |
| | Leased Properties
| |
Location
| Square Feet
| Monthly Rental
| Expiration of Term
|
| Madison | 4,000 | $10,000 | 2016 |
| Mendham | 2,500 | $ 8,695 | 2010 |
| Morristown | 2,379 | $ 4,361 | 2008 |
| Summit | 4,016 | $ 9,167 | 2009 |
| West Orange (1) | 5,756 | $ 9,833 | 2010 |
| Edison (2) | 1,775 | $ 2,884 | 2010 |
| (1) | | Main office of Sullivan |
| (2) | | Branch office of Sullivan |
ITEM 3. - LEGAL PROCEEDINGS
We are periodically parties to or otherwise involved in legal proceedings arising in the normal course of business, such as claims to enforce liens, claims involving the making and servicing of real property loans, and other issues incident to the business of the Company and the Bank. Management does not believe that there is any pending or threatened proceeding against the Company or the Bank, which if determined adversely, would have a material effect on the business or financial position of the Company.
ITEM 4. - SUBMISSION OF MATTERS TO A VOTE OF SECURITY HOLDERS
No matters were submitted for a vote of registrant’s shareholders during the fourth quarter of fiscal 2006.
PART II
ITEM 5. - MARKET FOR THE COMMON EQUITY AND RELATED STOCKHOLDER MATTERS
The Company’s common stock is currently traded on Nasdaq Global Market under the symbol “SOMH.”
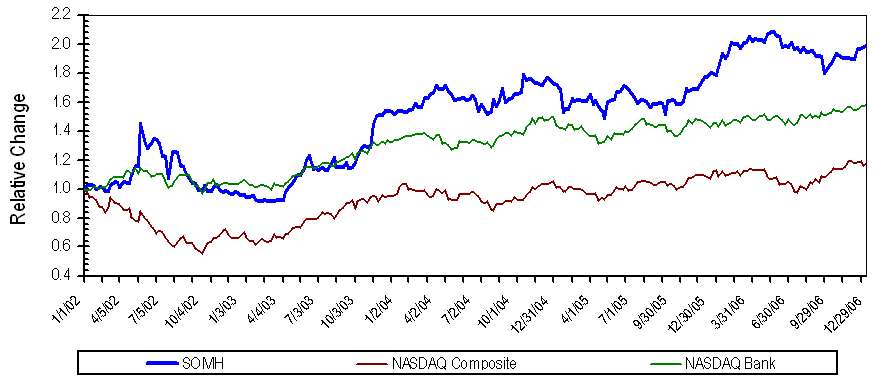
The following is a graph showing the performance of the Company’s stock verses the NASDAQ composite and the NASDAQ Bank indexes:
Fiscal Year Ending
|
| | 1/1/02
| 12/31/02
| 12/31/03
| 12/31/04
| 12/31/05
| 12/31/06
|
| Somerset Hills Bancorp | 100.00 | 98.33 | 154.87 | 175.31 | 181.88 | 201.18 |
| NASDAQ Bank Index | 100.00 | 106.98 | 141.83 | 160.89 | 157.70 | 179.22 |
| NASDAQ Composite Index | 100.00 | 68.80 | 103.64 | 113.07 | 115.43 | 127.36 |
The following table shows the high and low bid prices for the common stock as reported on the Nasdaq SmallCap Market from January 1, 2005 through December 31, 2006. High and low bid prices reflect inter-dealer quotations, without retail markup, markdown or commissions, and may not necessarily represent actual transactions.
| | Bid Price (1)
| Dividends
Declared
|
| | High
| Low
|
| | 2006
| | |
| First Quarter | $14.52 | | $11.77 | | $0.02 | |
| Second Quarter | 14.62 | | 12.82 | | 0.03 | |
| Third Quarter | 14.00 | | 12.02 | | 0.06 | |
| Fourth Quarter | 13.62 | | 12.14 | | 0.00 | |
| | 2005
| | |
| First Quarter | $11.88 | | $ 9.98 | | $0.00 | |
| Second Quarter | 11.59 | | 9.84 | | 0.02 | |
| Third Quarter | 11.19 | | 10.18 | | 0.02 | |
| Fourth Quarter | 12.27 | | 10.62 | | 0.02 | |
| (1) | | The prices quoted above have been adjusted to reflect the 5% stock dividend declared in April 2005 and paid in June 2005 and stock dividend declared in April 2006 and paid in May 2006. |
As of December 31, 2006, there were 192 record holders of our common stock.
During 2005, we commenced paying quarterly cash dividends of $0.02 per share and increased the quarterly dividend in 2006 to $0.03 per share. In 2006, the Company declared the fourth quarter dividend during the third quarter, although it was paid in the fourth quarter. The Board
will review the amount and frequency of the Company’s cash dividends on an ongoing basis, based upon the Company’s results of operations, capital needs and other appropriate factors.
We did not repurchase any of our equity securities during the fourth quarter of 2006. In February 2007, our Board of Directors adopted a stock repurchase program under which we may repurchase up to 250,000 shares of our common stock in open market or privately negotiated transactions.
ITEM 6. SELECTED CONSOLIDATED FINANCIAL DATA AND OTHER DATA
Selected Consolidated Financial Data and Other Data
(in thousands, except per share data)
Set forth below is selected historical financial data of the Company. This information is derived in part from and should be read in conjunction with the consolidated financial statements and notes thereto presented in the Annual Report to Stockholders.
| Years Ended December 31,
|
|---|
| 2006
| 2005
| 2004
| 2003
| 2002
|
|---|
| Selected Operating Data: | | | | | | | | | | |
| Total interest income | $15,782 | | $11,605 | | $8,202 | | $7,883 | | $6,759 | |
| Total interest expense | 6,054 | | 3,194 | | 2,019 | | 2,583 | | 2,773 | |
|
| |
| |
| |
| |
| |
| Net interest income | 9,728 | | 8,411 | | 6,183 | | 5,300 | | 3,986 | |
| Provision for loan losses | 201 | | 392 | | 225 | | 336 | | 448 | |
|
| |
| |
| |
| |
| |
| Net interest income after provision for |
| loan loss | 9,527 | | 8,019 | | 5,958 | | 4,964 | | 3,538 | |
| Other income | 2,869 | | 2,939 | | 2,845 | | 4,570 | | 3,268 | |
| Other expenses | 9,022 | | 8,414 | | 7,331 | | 8,217 | | 6,519 | |
|
| |
| |
| |
| |
| |
| Income before income taxes | 3,374 | | 2,544 | | 1,472 | | 1,317 | | 287 | |
| Income tax expense | 1,176 | | 429 | | 113 | | 144 | | 108 | |
|
| |
| |
| |
| |
| |
| Net income | $ 2,198 | | $ 2,115 | | $1,359 | | $1,173 | | $ 179 | |
|
| |
| |
| |
| |
| |
| (1)Net income - Basic | $ 0.58 | | $ 0.62 | | $ 0.40 | | $ 0.35 | | $ 0.09 | |
| (1)Net income - Diluted | $ 0.50 | | $ 0.54 | | $ 0.35 | | $ 0.34 | | $ 0.09 | |
| (1) | | All per share data has been restated to reflect the 5% stock dividends declared in 2002, 2003, 2004, 2005 and 2006. |
| At December 31,
|
|---|
| Selected Financial Data: | | 2006
| 2005
| 2004
| 2003
| 2002
|
| Total Assets | | $289,428 | | $245,926 | | $181,876 | | $169,679 | | $149,788 | |
| Net Loans | | 190,265 | | 165,118 | | 131,039 | | 107,374 | | 93,269 | |
| Total Deposits | | 250,221 | | 208,244 | | 154,875 | | 145,651 | | 125,444 | |
| Stockholders’ Equity | | 37,896 | | 25,305 | | 23,048 | | 21,721 | | 20,664 | |
| | | | | | | |
| Selected Financial Ratios: | | 2006
| 2005
| 2004
| 2003
| 2002
|
| Return on Average Assets (ROA) | | 0.86 | % | 1.00 | % | 0.76 | % | 0.70 | % | 0.15 | % |
| Return on Average Equity (ROE) | | 7.62 | % | 8.82 | % | 6.09 | % | 5.53 | % | 1.33 | % |
| Equity to Total Assets at Year-End | | 13.09 | % | 10.29 | % | 12.67 | % | 12.80 | % | 13.80 | % |
ITEM 7. MANAGEMENT’S DISCUSSION AND ANALYSIS OR PLAN OF OPERATIONS
SPECIAL NOTE REGARDING FORWARD-LOOKING STATEMENTS
Some of the statements in this document discuss future expectations, contain projections or results of operations or financial conditions or state other “forward-looking” information. Those statements are subject to known and unknown risk; uncertainties and other factors that could cause the actual results to differ materially from those contemplated by the statements. We based the forward-looking statements on various factors and using numerous assumptions. Important factors that may cause actual results to differ from those contemplated by forward-looking statements including those discussed under Item 1A - Risk Factors and the following factor for example:
| - | | the success or failure of our efforts to implement our business strategy; |
| - | | the effect of changing economic conditions and in particular changes in interest rates; |
| - | | changes in government regulations, tax rates and similar matters; |
| - | | our ability to attract and retain quality employees; and |
| - | | other risks which may be described in our future filings with the SEC. |
We do not promise to update forward-looking information to reflect actual results or changes in assumptions or other factors that could affect those statements other than material changes to such information.
MANAGEMENT’S DISCUSSION AND ANALYSIS OF CONSOLIDATED
FINANCIAL CONDITION AND RESULTS OF OPERATION
The following discussion and analysis of financial condition and results of operations should be read in conjunction with the Company’s consolidated financial statements and the notes thereto included herein. When necessary, reclassifications have been made to prior years’ data throughout the following discussion and analysis for purposes of comparability.
CRITICAL ACCOUNTING POLICIES AND ESTIMATES
“Management’s Discussion and Analysis of Financial Condition and Results of Operation,” is based upon the Company’s consolidated financial statements, which have been prepared in accordance with U.S. generally accepted accounting principles. The preparation of these financial statements requires the Company to make estimates and judgements that effect the reported amounts of assets, liabilities, revenues and expenses. Note 1 to the Company’s Audited Consolidated Financial Statements for the year ended December 31, 2006 contains a summary of the Company’s significant accounting policies. Management believes the Company’s policy with respect to the methodology for the determination of the allowance for loan losses involves a higher degree of complexity and requires management to make difficult and subjective judgments which often require assumptions or estimates about highly uncertain matters. Changes in these judgments, assumptions or estimates could materially impact results of operations. This critical policy and its application is periodically reviewed with the Audit Committee and the Board of Directors.
The allowance for loan losses is based upon management’s evaluation of the adequacy of the allowance, including an assessment of known and inherent risks in the portfolio, giving consideration to the size and composition of the loan portfolio, actual loan loss experience, level of delinquencies, detailed analysis of individual loans for which full collectibility may not be assured, the existence and estimated net realizable value of any underlying collateral and guarantees securing the loans, and current economic and market conditions. Although management uses the best information available, the level of the allowance for loan losses remains an estimate which is subject to significant judgement and short-term change. Various regulatory agencies, as an integral part of their examination process, periodically review the Company’s allowance for loan losses. Such agencies may require the Company to make additional provisions for loan losses based upon information available to them at the time of their examination. Furthermore, the majority of the Company’s loans are secured by real estate in the State of New Jersey. Accordingly, the collectibility of a substantial portion of the carrying value of the Company’s loan portfolio is susceptible to changes in local market conditions and may be adversely affected should real estate values decline or the northern New Jersey area experience an adverse economic shock. Future adjustments to the allowance for loan losses may be necessary due to economic, operating, regulatory and other conditions beyond the Company’s control.
OVERVIEW AND STRATEGY
The Company serves as a holding company for the Bank, which is its primary asset and only operating subsidiary. The Bank conducts a traditional banking business, making commercial loans, consumer loans, and residential and commercial real estate loans. In addition, the Bank offers various non-deposit products through non-proprietary relationships with third party vendors. The Bank relies primarily upon deposits as the funding source for its assets. The Bank offers traditional deposit products. In addition, as an alternative to traditional certificate of deposit accounts, the Bank offers its Paramount Checking Account, an interest paying checking account which also provides a suite of additional services, such as free checks, free telephone banking and free bill payment, free safe deposit box and refunds for foreign ATM fees. Although the rate the Bank pays on the Paramount Checking Account is higher than the rate offered on most interest paying checking accounts by the Bank’s competitors, management believes the account has helped to reduce the Bank’s overall cost of funds and has been an integral part of the Bank’s core account acquisition strategy. Core accounts consist of noninterest-bearing deposits-demand, now, money market and savings accounts. Paramount Checking Account balances are generally higher than other account balances, and the account helps the Bank develop an overall relationship with its customers, which frequently leads to cross-selling opportunities, which the Bank actively pursues through direct mailings and other special promotions. Another component to the Bank’s core account acquisition strategy is the generation of deposit accounts which result from new commercial loan customers who move their deposit relationship to the bank and the continued expansion of the Bank’s Escrow Ease product. Escrow Ease is specially designed to meet the trust account needs of attorney’s, realtors and title companies. At December 31, 2006, the core accounts represented 85.8% of total deposit accounts.
Through its Sullivan Financial Services subsidiary (“Sullivan”), the Bank also engages in mortgage banking operations, originating loans for resale into the secondary market. We treat the operations of Sullivan as a separate reporting segment apart from our commercial banking business. See Note 13 to the accompanying Audited Financial Statements for financial information on our business segments.
For the year ended December 31, 2006, the Company recognized net income of $2.2 million, or $0.50 per diluted share and $0.58 per basic share, compared to net income of $2.1 million, or $0.54 per diluted share and $0.62 per basic share for 2005. The Company’s performance in 2006 reflects a substantial increase in interest income from the loan portfolio due to an increase in loan volume and rate, partially offset by increased interest expense, reflecting an increase in deposits
and a substantial increase in the average cost of deposits, reflecting market increases in short term interest rates. Our 2005 results were also affected by the recognition of $449,000 in income due to the reversal of a valuation allowance for deferred taxes. There was no comparable tax benefit in 2006.
During 2006 our deposits increased significantly. Management used the resultant cash to fund the loan and investment portfolio and to pay down Federal Home Loan Bank advances.
It is management’s intention to seek additional branching opportunities in and around our existing market area. Efforts will also be made to identify acquisition opportunities in and adjacent to our market area.
RESULTS OF OPERATIONS - 2006 versus 2005
The Company’s results of operations depend primarily on its net interest income, which is the difference between the interest earned on its interest-earning assets and the interest paid on funds borrowed to support those assets, primarily deposits. Net interest margin is the difference between the weighted average rate received on interest-earning assets and the weighted average rate paid on interest-bearing liabilities, as well as the average level of interest-earning assets as compared with that of interest-bearing liabilities. Net income is also affected by the amount of non-interest income and other non-interest expenses.
NET INCOME
For the year ended December 31, 2006, the Company had net income of $2.2 million or $0.58 per basic share compared to net income of $2.1 million or $0.62 per basic share for the year ended December 31, 2005. All per share data has been restated to reflect all subsequent stock dividends. The increase in net income for 2006 compared to 2005 is a result of a 15.6% increase in net interest income to $9.7 million from $8.4 million in the prior year, partially offset by a 7.2%, or $608 thousand, increase in non-interest expense to $9.0 million from $8.4 million for 2005. In addition, our 2005 results were also effected by the recognition of $449,000 in income in the fourth quarter due to the reversal of a valuation allowance for deferred tax assets. On a per share basis, the tax benefit in 2005 accounted for $0.13 of our basic earnings per share. There was no comparable tax benefit in 2006.
NET INTEREST INCOME
The increase in net interest income is primarily the result of a 36.0% increase in total interest income from $11.6 million in 2005 to $15.8 million in 2006. This increase in interest income was partially offset by an increase of 89.5% or $2.9 million in total interest expense to $6.1 million in 2006 from $3.2 million in 2005. Total interest income benefited from strong growth in average interest earning assets and was augmented by the higher yields resulting from the rise in short-term market rates during the year. However, the same rate factors caused the average cost of the Company’s interest bearing liabilities to increase from 2.16% in 2005 to 3.35% in 2006.
Total average interest earning assets increased $39.6 million or 20.3% from an average of $195.0 million in 2005 to an average of $234.6 million in 2006. We experienced strong loan growth during 2006 with average loan balances, not including loans held for sale, increasing by $34.1 million. The increase in average volume for investment securities was $10.8 million. The increase in total interest income reflects an increase of $2.7 million due to growth in average interest earning assets augmented by an increase of $1.5 million due to an increase in yield on interest earning assets.
Average total interest-bearing liabilities increased by $32.3 million in 2006, consisting of an increase of $16.3 million in average interest bearing demand deposits and $8.7 million in average
money market deposits. The increase in interest expense of $2.9 million resulted from increases of $1.7 million due to rate factors augmented by an increase of $1.2 million due to an increase in interest-bearing liabilities.
The net interest margin for the year ended December 31, 2006 was 4.15% compared to 4.31% for 2005. The decrease in net interest margin was due primarily to a greater increase in the rate paid on our interest-bearing liabilities than the yield on interest-earning assets. The average yield on earning assets for 2006 was 6.73%, or 78 basis points higher than the 5.95% for 2005. The 2006 average cost of interest-bearing liabilities was 3.35%, or 119 basis points higher than the 2.16% for 2005. The net interest rate spread, which is the difference between the average yield on earning assets and the cost of interest-bearing funds, decreased 41 basis points from 3.79% in 2005 to 3.38% in 2006. Despite these contractions in our net interest margin and net interest spread, the growth in our earning assets led to the increase in our net interest income.
Average Balance Sheets
The following table sets forth certain information relating to the Company’s average assets and liabilities for the years ended December 31, 2006, 2005, and 2004, and reflects the average yield on assets and average cost of liabilities for the periods indicated. Such yields are derived by dividing income or expense by the average balance of assets or liabilities, respectively, for the periods shown. Securities available for sale are reflected in the following table at amortized cost. Non-accrual loans are included in the average loan balance.
For the years ended December 31,
(dollars in thousands)
| | 2006
| 2005
| 2004
|
| | Average
Balance
| Interest
| Average
Yield/Cost
| Average
Balance
| Interest
| Average
Yield/Cost
| Average
Balance
| Interest
| Average
Yield/Cost
|
ASSETS: | | | | | | | | | | | | | | | | | | |
Interest-Earning Assets: | | | | | | | | | | | | | | | | | | |
Cash and due from banks | $786 | | $38 | | 4.84 | % | $1,092 | | $33 | | 3.01 | % | $782 | | $9 | | 1.18 | % |
Loans receivable | 179,130 | | 12,974 | | 7.24 | | 145,030 | | 9,469 | | 6.53 | | 118,360 | | 6,561 | | 5.54 | |
Investment securities | 41,986 | | 1,985 | | 4.73 | | 31,159 | | 1,239 | | 3.98 | | 28,374 | | 998 | | 3.52 | |
Loans held for sale | 9,645 | | 627 | | 6.50 | | 11,468 | | 683 | | 5.96 | | 10,320 | | 567 | | 5.50 | |
Federal funds sold | 3,069 | | 158 | | 5.16 | | 6,250 | | 181 | | 2.90 | | 5,639 | | 67 | | 1.20 | |
| |
| |
| |
| |
| |
| |
| |
| |
| |
| |
Total interest earning assets | 234,616 | | 15,782 | | 6.73 | % | 194,999 | | 11,605 | | 5.95 | % | 163,475 | | 8,202 | | 5.02 | % |
Non-interest earning assets | 21,985 | | | | | | 18,745 | | | | | | 16,206 | | | | | |
Allowance for loan losses | (2,104 | ) | | | | | (1,742 | ) | | | | | (1,489 | ) | | | | |
| |
| | | | | |
| | | | | |
| | | | | |
TOTAL ASSETS | $254,497 | | | | | | $212,002 | | | | | | $178,192 | | | | | |
| |
| | | | | |
| | | | | |
| | | | | |
LIABILITIES AND STOCKHOLDERS’ EQUITY | | | | | | | | | | | | | | | | | | |
Interest-Bearing Liabilities: | | | | | | | | | | | | | | | | | | |
Interest bearing demand deposits | $116,346 | | $3,745 | | 3.22 | % | $100,048 | | $1,957 | | 1.96 | % | $84,380 | | $958 | | 1.13 | % |
Savings accounts | 6,421 | | 97 | | 1.51 | | 6,866 | | 74 | | 1.08 | | 4,963 | | 27 | | 0.55 | |
Money Market accounts | 24,255 | | 766 | | 3.16 | | 15,561 | | 263 | | 1.69 | | 8,356 | | 68 | | 0.82 | |
Certificates of deposit | 28,045 | | 1,174 | | 4.19 | | 23,182 | | 795 | | 3.43 | | 26,092 | | 909 | | 3.48 | |
FHLB advances | 5,399 | | 271 | | 5.02 | | 2,445 | | 101 | | 4.12 | | 1,576 | | 55 | | 3.49 | |
Federal funds purchased | 14 | | 1 | | 4.69 | | 84 | | 4 | | 4.53 | | 144 | | 2 | | 1.43 | |
| |
| |
| |
| |
| |
| |
| |
| |
| |
| |
Total interest bearing liabilities | 180,480 | | 6,054 | | 3.35 | % | 148,186 | | 3,194 | | 2.16 | % | 125,511 | | 2,019 | | 1.61 | % |
Non-interest bearing deposits | 43,640 | | | | | | 38,610 | | | | | | 29,630 | | | | | |
Other liabilities | 1,542 | | | | | | 1,225 | | | | | | 736 | | | | | |
| |
| | | | | |
| | | | | |
| | | | | |
Total liabilities | 225,662 | | | | | | 188,021 | | | | | | 155,877 | | | | | |
Stockholders’ Equity | 28,835 | | | | | | 23,981 | | | | | | 22,315 | | | | | |
| |
| | | | | |
| | | | | |
| | | | | |
TOTAL LIABILITIES AND STOCKHOLDERS’ EQUITY | $254,497 | | | | | | $212,002 | | | | | | $178,192 | | | | | |
| |
| |
| | | |
| |
| | | |
| |
| | | |
Net Interest Income | | | $9,728 | | | | | | $8,411 | | | | | | $6,183 | | | |
| | | |
| | | | | |
| | | | | |
| | | |
Net Interest Rate Spread (1) | | | | | 3.38 | % | | | | | 3.79 | % | | | | | 3.41 | % |
Net Interest Margin (2) | | | | | 4.15 | % | | | | | 4.31 | % | | | | | 3.78 | % |
Ratio of Average Interest-Earning Assets to
Average Interest-Bearing Liabilities | 130.00 | % | | | | | 131.59 | % | | | | | 130.25 | % | | | | |
| |
| | | | | |
| | | | | |
| | | | | |
| (1) | | Net Interest Rate Spread equals Total interest earning assets yield less Total interest bearing liabilities cost. |
| (2) | | Net Interest Margin equals Net Interest Income divided by Total average interest earning assets. |
Rate/Volume Analysis
The following table presents, by category, the major factors that contributed to the changes in net interest income on a tax equivalent basis for each of the years ended December 31, 2006 and 2005.
| Year Ended
December 31,
2006 versus
2005
| Year Ended
December 31,
2005 versus
2004
|
|---|
| (in thousands) |
|---|
| Increase (Decrease)
due to change in
Average | Increase (Decrease)
due to change in
Average |
|---|
| Volume
| Rate
| Net
| Volume
| Rate
| Net
|
|---|
| Interest Income: | | | | | | | | | | | | | |
| Cash and due from banks | | $ (15 | ) | $ 20 | | $ 5 | | $ 9 | | $ 15 | | $ 24 | |
| Loans | | 2,469 | | 1,036 | | 3,505 | | 1,742 | | 1,166 | | 2,908 | |
| Securities | | 512 | | 234 | | 746 | | 111 | | 130 | | 241 | |
| Loans held for sale | | (118 | ) | 62 | | (56 | ) | 68 | | 48 | | 116 | |
| Federal funds sold | | (164 | ) | 141 | | (23 | ) | 18 | | 96 | | 114 | |
|
| |
| |
| |
| |
| |
| |
| Total interest income | | $ 2,684 | | $ 1,493 | | $ 4,177 | | $ 1,948 | | $ 1,455 | | $ 3,403 | |
|
| |
| |
| |
| |
| |
| |
| Interest Expense: | |
| Federal funds purchased | | $ (3 | ) | $ - | | $ (3 | ) | $ (3 | ) | $ 5 | | $ 2 | |
| Interest bearing deposits | | 525 | | 1,263 | | 1,788 | | 307 | | 692 | | 999 | |
| Savings accounts | | (7 | ) | 30 | | 23 | | 21 | | 26 | | 47 | |
| Money Market accounts | | 275 | | 228 | | 503 | | 122 | | 73 | | 195 | |
| Certificates of deposit | | 204 | | 175 | | 379 | | (100 | ) | (14 | ) | (114 | ) |
| FHLB advances | | 148 | | 22 | | 170 | | 36 | | 10 | | 46 | |
|
| |
| |
| |
| |
| |
| |
| Total interest expense | | 1,142 | | 1,718 | | 2,860 | | 383 | | 792 | | 1,175 | |
|
| |
| |
| |
| |
| |
| |
| Net interest income | | $ 1,542 | | $ (225 | ) | $ 1,317 | | $ 1,565 | | $ 663 | | $ 2,228 | |
|
| |
| |
| |
| |
| |
| |
PROVISION FOR LOAN LOSSES
For the year ended December 31, 2006, the Company’s provision for loan losses was $201 thousand, a decrease of $191 thousand from the provision of $392 thousand for the year ended December 31, 2005. The decrease was the result of the Company’s low historical loss history and the seasoning of the loan portfolio as the portfolio matures. The change in the provision for loan losses reflects management’s judgment concerning the risks inherent in the Company’s existing portfolio and the size of the allowance necessary to provide for probable losses inherent in the portfolio. The provision reflects the current economic conditions, borrowers’ financial condition and loan growth as well as the strength of the Bank’s loan portfolio. The allowance for loan losses was approximately $2.2 million at December 31, 2006, representing 1.13% of total outstanding loans. The allowance for loan losses at December 31, 2005 was approximately $2.0 million or 1.21% of total outstanding loans at that date.
NON-INTEREST INCOME
Our non-interest income consists primarily of gains on sales of mortgage loans originated by our mortgage company subsidiary. For the year ended December 31, 2006, our non-interest income decreased by $70 thousand from the prior year. For the year ended December 31, 2006, we recognized $2.9 million in total non-interest income, a decrease of 2.4% from the comparable period in 2005.
Other components of non-interest income include fees on deposit accounts, which increased $10 thousand or 3.7%, to $283 thousand from $273 thousand in 2005. In addition, our other income increased by $86 thousand, or 20.6%, to $503 thousand for the year ended December 31, 2006. The increase primarily reflects income received from our investment in our joint venture title insurance agency, which increased $37 thousand or 57.8% to $101 thousand from $64 thousand in 2005. There was also a decrease of $2 thousand in gains on sales of securities, do to a $2 thousand loss in 2005 versus no loss in 2006.
NON-INTEREST EXPENSES
For the year ended December 31, 2006, our non-interest expense increased $608 thousand or 7.2% to $9.0 million compared to $8.4 million for the year ended December 31, 2005. The increase primarily reflects increases in salaries and employee benefits of $687 thousand, or 16.4%, to $4.9 million in 2006 from $4.2 million in 2005. Occupancy expense increased $206 thousand, or 14.7%, to $1.6 million in 2006 from $1.4 million in 2005. Data processing increased $56 thousand, or 14.8%, to $435 thousand in 2006 from $379 thousand in 2005. Other operating expenses decreased $364 thousand, or 22.0%, to $1.3 million in 2006 from $1.7 million in 2005. The increases in non-interest expense, primarily reflects the related costs associated with the new branch in Madison and the Bank’s two proposed new branches in Sterling and Long Valley.
INCOME TAX EXPENSE
The income tax provision for the years ended December 31, 2006 and 2005 was $1.2 million and $429 thousand, respectively. The effective tax rate for the years ended December 31, 2006 and 2005 was 34.9% and 16.9%, respectively. The income tax provision for 2005 includes the reversal of the remaining valuation allowance of $495 thousand as it became more likely than not that the gross deferred tax asset will be realized. There was no comparable item of tax benefit in 2006.
RESULTS OF OPERATIONS - 2005 versus 2004
NET INCOME
For the year ended December 31, 2005, the Company had net income of $2.1 million or $0.62 per basic share compared to net income of $1.4 million or $0.40 per basic share for the year ended December 31, 2004. All per share data has been restated to reflect all subsequent stock dividends. The increase in net income for 2005 compared to 2004 is a result of a 36.0% increase in net interest income to $8.4 million from $6.2 million in the prior year, partially offset by a 14.8%, or $1.1 million, increase in non-interest expense to $8.4 million from $7.3 million for 2004. In addition, our 2005 results were also effected by the recognition of $449,000 in income in the fourth quarter due to the reversal of a valuation allowance for deferred tax assets.
NET INTEREST INCOME
The increase in net interest income is primarily the result of a 41.5% increase in total interest income from $8.2 million in 2004 to $11.6 million in 2005. This increase in interest income was partially offset by an increase of 58.2% or $1.2 million in total interest expense to $3.2 million in 2005 from $2.0 million in 2004. Total interest income benefited from strong growth in average interest earning assets and was augmented by the higher yields resulting from the rise in short-term market rates during the year.
Total average interest earning assets increased $31.5 million or 19.3% from an average of $163.5 million in 2004 to an average of $195.0 million in 2005. We experienced strong loan growth during 2005 with average loan balances, not including loans held for sale, increasing by $26.7 million. The increase in average volume for investment securities was $2.8 million. The increase in total interest income reflects an increase of $1.9 million due to growth in average interest earning assets augmented by an increase of $1.5 million due to an increase in yield on interest earning assets.
Average total interest-bearing liabilities increased by $22.7 million in 2005, consisting of an increase of $15.7 million in average interest bearing deposits and $7.2 million in average money market deposits. The increase in interest expense of $1.2 million resulted from increases of $792 thousand due to rate factors augmented by an increase of $383 thousand due to an increase in interest-bearing liabilities.
The net interest margin for the year ended December 31, 2005 was 4.31% compared to 3.78% for 2004. The increase in net interest margin was due primarily to a greater increase in yield on interest-earning assets than the increase in the rate paid on our interest-bearing liabilities. In addition, the growth of our interest earning assets contributed to the increase in our interest income. The average yield on earning assets for 2005 was 5.95%, or 93 basis points higher than the 5.02% for 2004. The 2005 average cost of interest-bearing liabilities was 2.16%, or 55 basis points higher than the 1.61% for 2004. The net interest rate spread, which is the difference between the average yield on earning assets and the cost of interest-bearing funds, increased 38 basis points from 3.41% in 2004 to 3.79% in 2005.
PROVISION FOR LOAN LOSSES
For the year ended December 31, 2005, the Company’s provision for loan losses was $392 thousand, an increase of $167 thousand from the provision of $225 thousand for the year ended December 31, 2004. The increase was the result of an increase in loans outstanding for the year. The change in the provision for loan losses reflects management’s judgment concerning the risks inherent in the Company’s existing portfolio and the size of the allowance necessary to provide for probable losses inherent in the portfolio. The provision reflects the current economic
conditions, borrowers’ financial condition and loan growth as well as the strength of the Bank’s loan portfolio. The allowance for loan losses was approximately $2.0 million at December 31, 2005, representing 1.21% of total outstanding loans. The allowance for loan losses at December 31, 2004 was approximately $1.6 million or 1.23% of total outstanding loans at that date.
NON-INTEREST INCOME
Our non-interest income consists primarily of gains on sales of mortgage loans originated by our mortgage company subsidiary. For the year ended December 31, 2005, our non-interest income increased by $94 thousand from the prior year. For the year ended December 31, 2005, we recognized $2.9 million in total non-interest income, an increase of 3.3% over $2.8 million in total non-interest income for the comparable period in 2004.
Other components of non-interest income include fees on deposit accounts, which decreased $16 thousand or 5.5%, to $273 thousand from $289 thousand in 2004. In addition, in 2005 our other income increased by $53 thousand, or 14.6%, to $417 thousand for the year ended December 31, 2005. The increase primarily reflects income received from our investment in our Title Company, which increased $44 thousand or 220.0% to $64 thousand from $20 thousand in 2004. There was also a decrease of $11 thousand in gains on sales of securities, which was a $9 thousand gain in 2004 versus a $2 thousand loss in 2005.
NON-INTEREST EXPENSES
For the year ended December 31, 2005, our non-interest expense increased $1.1 million or 14.8% to $8.4 million compared to $7.3 million for the year ended December 31, 2004. The increase primarily reflects increases in salaries and employee benefits of $485 thousand, or 13.1%, to $4.2 million in 2005 from $3.7 million in 2004. Occupancy expense increased $155 thousand, or 12.5%, to $1.4 million in 2005 from $1.2 million in 2004. Data processing increased $91 thousand, or 31.6%, to $379 thousand in 2005 from $288 thousand in 2004 and other operating expenses increased $270 thousand, or 19.5%, to $1.7 million in 2005 from $1.4 million in 2004. The increases in non-interest expense, primarily reflects the related costs associated with the new branch in Summit and the Bank’s 3 proposed new branches in Madison, Sterling and Long Valley.
INCOME TAX EXPENSE
The income tax provision for the years ended December 31, 2005 and 2004 was $429 thousand and $113 thousand, respectively. The effective tax rate for the years ended December 31, 2005 and 2004 was 16.9% and 7.6%, respectively. The income tax provision for 2005 includes the reversal of the remaining valuation allowance of $495 thousand as it is more likely than not that the gross deferred tax asset will be realized. The income tax provision for 2004 consists of state taxes only as the federal provision was offset by the utilization of the federal operating loss carryforward.
FINANCIAL CONDITION
Total assets at December 31, 2006 increased by $43.5 million or 17.7%, to $289.4 million compared to $245.9 million at December 31, 2005. Total loans, net were $190.3 million, loans held for sale were $5.0 million, total investment securities available for sale were $38.9 million, total investment securities held to maturity were $10.5 million and total cash and cash equivalents were $28.6 million. We also had goodwill of $1.2 million associated with our purchase of Sullivan. Total deposits at December 31, 2006 increased by $42.0 million, or 20.2% to $250.2 million compared to $208.2 million at December 31, 2005. Stockholders’ equity increased $12.6 million or 49.8%, to $37.9 million in 2006 compared to $25.3 million at December 31, 2005, reflecting both retained earnings from 2006 operations and the purchase of 1,275,000 shares of common stock upon the exercise of outstanding common stock purchase warrants for aggregate proceeds of $10.1 million.
LOAN PORTFOLIO
Gross loans, not including loans held for sale, grew by $25.3 million, or 15.1%, during 2006 from $167.3 million as of December 31, 2005 to $192.6 million at year-end 2006. The composition of the loan portfolio, by category, as of December 31, 2006 is as follows: 75.6% of our loans are commercial and commercial real estate loans, 3.7% of our loans are secured by first liens on residential real estate and 20.7% of our loans are consumer or other loans to individuals, including home equity loans. Commercial and industrial loans are primarily secured by collateral, such as cash balances with the Bank, marketable securities held by or under the control of the Bank, business assets including accounts receivable, inventory and equipment and liens on commercial and residential real estate. Real estate loans consist primarily of loans secured by first mortgage liens on commercial property and may be used to finance the purchase, refinance or construction of such properties. Commercial and commercial real estate loans increased by $14.5 million or 11.1% to $145.6 million at December 31, 2006 from $131.1 million at December 31, 2005. Combined, these two categories of loans represented 75.6% of our total loan portfolio at December 31, 2006, compared to 78.4% of our total loan portfolio at year end 2005. Consumer loans primarily consist of home equity loans. The growth in our consumer loans of $9.8 million or 32.8% is primarily due to an increase in home equity loans of 32.4% or $9.5 million to $38.8 million in 2006 from $29.3 million in 2005. Our consumer installment loans increased by $333 thousand to $984 thousand in 2006 from $651 thousand in 2005.
The Bank’s lending activities are generally oriented to small-to-medium sized businesses, high net worth individuals, professional practices and consumer and retail customers living and working in the Bank’s market area of Somerset, Morris and Union Counties, New Jersey. The Bank has not made loans to borrowers outside of the United States. The Bank believes that its strategy of customer service, competitive rate structures and selective marketing have enabled it to gain market entry. Bank mergers and lending restrictions at larger banks competing with the Bank have also contributed to the Bank’s efforts to attract borrowers.
The following table sets forth the classification of our loans by major category as of December 31, 2006, 2005, 2004, 2003 and 2002, respectively:
| | 2006
| 2005
| 2004
| 2003
| 2002
|
| | Amount | Percent of
Total Loans | Amount | Percent of
Total Loans | Amount | Percent of
Total Loans | Amount | Percent of
Total Loans | Amount | Percent of
Total Loans |
|
|
|
|
|
|
|
|
|
|
|
Commercial and industrial | $78,366 | | 40.7 | % | $78,299 | | 46.8 | % | $66,552 | | 50.1 | % | $ 52,797 | | 48.5 | % | $44,460 | | 47.0 | % |
Real Estate: | | | | | | | | | | | | | | | | | | | | |
Commercial real estate properties | 67,244 | | 34.9 | | 52,802 | | 31.6 | | 32,953 | | 24.8 | | 25,828 | | 23.7 | | 23,991 | | 25.4 | |
Residential properties | 7,145 | | 3.7 | | 6,225 | | 3.7 | | 3,745 | | 2.8 | | 3,192 | | 2.9 | | 2,872 | | 3.0 | |
Consumer and installment | 984 | | 0.5 | | 651 | | 0.4 | | 1,157 | | 0.9 | | 2,674 | | 2.5 | | 7,080 | | 7.5 | |
Home equity | 38,832 | | 20.2 | | 29,324 | | 17.5 | | 28,464 | | 21.4 | | 24,437 | | 22.4 | | 16,226 | | 17.1 | |
| |
| |
| |
| |
| |
| |
| |
| |
| |
| |
| |
Gross Loans | 192,571 | | 100.0 | % | 167,301 | | 100.0 | % | 132,871 | | 100.0 | % | 108,928 | | 100.0 | % | 94,629 | | 100.0 | % |
| | | |
| | | |
| | | |
| | | |
| | | |
| |
Less: Net deferred fees | 136 | | | | 154 | | | | 198 | | | | 137 | | | | 104 | | | |
| |
| | | |
| | | |
| | | |
| | | |
| | | |
Total loans | 192,435 | | | | 167,147 | | | | 132,673 | | | | 108,791 | | | | 94,525 | | | |
Less: Allowance for loan losses | 2,170 | | | | 2,029 | | | | 1,634 | | | | 1,417 | | | | 1,256 | | | |
| |
| | | |
| | | |
| | | |
| | | |
| | | |
Net loans | $190,265 | | | | $165,118 | | | | $131,039 | | | | $107,374 | | | | $93,269 | | | |
| |
| | | |
| | | |
| | | |
| | | |
| | | |
The following table sets forth fixed and adjustable rate loans in the loan portfolio as of December 31, 2006 in terms of contractual maturity (in thousands):
| | Within
One
Year
| 1 to 5
Years
| After 5
Years
| Total
|
| Loans with Fixed Rate | $ 6,712 | 21,555 | 26,666 | $ 54,933 |
| Loans with Adjustable Rate | $37,294 | 13,228 | 87,116 | $137,638 |
ASSET QUALITY
The Company’s principal assets are its loans. Inherent in the lending function is the risk of the borrower’s inability to repay a loan under its existing terms. Risk elements include non-accrual loans, past due and restructured loans, potential problem loans, loan concentrations, and other real estate owned.
Non-performing assets include loans that are not accruing interest (non-accrual loans) because of principal or interest being in default for a period of 90 days or more. When a loan is classified as non-accrual, interest accruals discontinue and all past due interest, including interest applicable to prior years, is reversed and charged against current income. Until the loan becomes current, any payments received from the borrower are applied to outstanding principal until management determines that the financial condition of the borrower and other factors merit recognition of such payments of interest.
The Company attempts to minimize overall credit risk through loan diversification and its loan approval procedures. Due diligence begins at the time a borrower and the Company begin to discuss the origination of a loan. Documentation, including a borrower’s credit history, materials establishing the value and liquidity of potential collateral, the purpose of the loan, the source and timing of the repayment of the loan, and other factors are analyzed before a loan is submitted for approval. Loans made are also subject to periodic audit and review.
The following table sets forth information concerning the Company’s non-performing assets as of the dates indicated:
| December 31,
|
|---|
| 2006
| 2005
| 2004
| 2003
| 2002
|
|---|
| (in thousands) |
|---|
| Non-performing loans | | $282 | | $ — | | $ — | | $ — | | $137 | |
| Other real estate owned | | — | | — | | — | | — | | — | |
|
| |
| |
| |
| |
| |
| Total non-performing assets | | $282 | | $ — | | $ — | | $ — | | $137 | |
|
| |
| |
| |
| |
| |
| Non-performing assets to total loans | | 0.15 | % | 0.00 | % | 0.00 | % | 0.00 | % | 0.14 | % |
|
| |
| |
| |
| |
| |
| Non-performing loans to total assets | | 0.10 | % | 0.00 | % | 0.00 | % | 0.00 | % | 0.09 | % |
| Allowance for loan losses as a | |
| percentage of non-performing loans | | 770 | % | NM | | NM | | NM | | 917 | % |
|
| |
| |
| |
| |
| |
NM = Not Meaningful
As of December 31, 2006 the Company had two non-accrual loans that consisted of one time loan and one direct auto loan. At December 31, 2005 the Company did not have any non-accrual loans or other non-performing assets.
Other than as disclosed above, there were no loans where information about possible credit problems of borrowers causes management to have serious doubts as to the ultimate collectibility of such loans.
As of December 31, 2006 and 2005, there were no concentrations of loans exceeding 10% of the Company’s total loans. The Company’s loans are primarily to businesses and individuals located in northern New Jersey.
ALLOWANCE FOR LOAN LOSSES
The allowance for loan losses is a reserve established through charges to earnings in the form of a provision for loan losses. The Company maintains an allowance for loan losses at a sufficient level to provide for losses inherent in the loan portfolio. Loan losses are charged directly to the allowance when they occur and any recovery is credited to the allowance. The Company’s officers analyze risks within the loan portfolio on a continuous basis, by external independent loan review function, and by the Company’s Audit Committee. A risk system, consisting of multiple grading categories, is utilized as an analytical tool to assess risk and appropriate reserves. In addition to the risk system, management further evaluates risk characteristics of the loan portfolio under current and anticipated economic conditions and considers such factors as the financial condition of the borrower, past and expected loss experience, and other factors which management feels deserve recognition in establishing an appropriate reserve. These estimates are reviewed at least quarterly, and, as adjustments become necessary, they are realized in the periods in which they become known. Additions to the allowance are made by provisions charged to expense and the allowance is reduced by net-chargeoffs (i.e. loans judged to be uncollectible are charged against the reserve, less any recoveries on the loans.) Although management attempts to maintain the allowance at an adequate level, future additions to the allowance may be required based upon changes in market conditions. Additionally, various regulatory agencies periodically review the allowance for loan losses. These agencies may require additional provisions based upon their judgment about information available to them at the time of their examination.
The Company’s allowance for loan losses totaled $2.2 million and $2.0 million at December 31, 2006 and 2005, respectively. The following is a summary of the reconciliation of the allowance for loan losses for the periods indicated:
| At December 31,
|
|---|
| 2006
| 2005
| 2004
| 2003
| 2002
|
| (in thousands) |
| Balance, beginning of year | | $ 2,029 | | $ 1,634 | | $ 1,417 | | $ 1,256 | | $ 882 | |
| Charge-offs | |
| Commercial and industrial | | — | | — | | — | | (137 | ) | — | |
| Real Estate | | — | | — | | — | | — | | — | |
| Consumer | | (2 | ) | (13 | ) | (27 | ) | (73 | ) | (79 | ) |
|
| |
| |
| |
| |
| |
| Total Charge-offs | | (2 | ) | (13 | ) | (27 | ) | (210 | ) | (79 | ) |
| Recoveries | |
| Commercial and Industrial | | — | | — | | 4 | | — | | — | |
| Real Estate | | — | | — | | — | | — | | — | |
| Consumer | | — | | 16 | | 15 | | 35 | | 5 | |
|
| |
| |
| |
| |
| |
| Total Recoveries | | — | | 16 | | 19 | | 35 | | 5 | |
| | | | | | | | | | | | |
| Reclassification related to unused commitments | | (58 | ) | — | | — | | — | | — | |
| Provision charged to expense | | 201 | | 392 | | 225 | | 336 | | 448 | |
|
| |
| |
| |
| |
| |
| Balance, end of year | | $ 2,170 | | $ 2,029 | | $ 1,634 | | $ 1,417 | | $ 1,256 | |
|
| |
| |
| |
| |
| |
| Ratio of net (recoveries) charge-offs to average | |
| loans outstanding | | (0.00 | %) | (0.00 | %) | 0.01 | % | 0.17 | % | 0.09 | % |
| Balance of allowance at end of year as a | |
| percentage of loans at end of year | | 1.13 | % | 1.21 | % | 1.23 | % | 1.30 | % | 1.33 | % |
The following table sets forth, for each of the Company’s major lending areas, the amount and percentage of the Company’s allowance for loan losses attributable to such category, and the percentage of total loans represented by such category, as of the periods indicated:
Allocation of the Allowance for Loan Losses by Category
For the years ended December 31,
| | (dollars in thousands) |
|---|
| | 2006
| 2005
| 2004
| 2003
| 2002
|
|---|
| | Amount
| % of
ALL
| % of
total
loans
| Amount
| % of
ALL
| % of
total
loans
| Amount
| % of
ALL
| % of
total
loans
| Amount
| % of
ALL
| % of
total
loans
| Amount
| % of
ALL
| % of
total
loans
|
| Balance applicable to: | | | | | | | | | | | | | | | | | | | | | | | | | | | | | | | |
| Commercial and commercial real estate | | $1,698 | | 78.2 | % | 75.6 | % | $1,597 | | 78.7 | % | 78.4 | % | $1,195 | | 73.1 | % | 74.9 | % | $ 911 | | 64.3 | % | 72.2 | % | $ 915 | | 72.9 | % | 72.4 | % |
| Residential real estate | | 36 | | 1.7 | | 3.7 | | 31 | | 1.5 | | 3.7 | | 19 | | 1.2 | | 2.8 | | 16 | | 1.1 | | 2.9 | | 37 | | 2.9 | | 3.0 | |
| Consumer, installment and home equity | |
| Loans | | 398 | | 18.3 | | 20.7 | | 258 | | 12.7 | | 17.9 | | 306 | | 18.7 | | 22.3 | | 336 | | 23.7 | | 24.9 | | 304 | | 24.2 | | 24.6 | |
|
| |
| |
| |
| |
| |
| |
| |
| |
| |
| |
| |
| |
| |
| |
| |
| Sub-total | | $2,132 | | 98.2 | | 100.0 | | $1,886 | | 92.9 | | 100.0 | | $1,520 | | 93.0 | | 100.0 | | $1,263 | | 89.1 | | 100.0 | | $1,256 | | 100.0 | | 100.0 | |
| Unallocated Reserves | | 38 | | 1.8 | | — | | 143 | | 7.1 | | — | | 114 | | 7.0 | | — | | 154 | | 10.9 | | — | | — | | — | | — | |
|
| |
| |
| |
| |
| |
| |
| |
| |
| |
| |
| |
| |
| |
| |
| |
| TOTAL | | $2,170 | | 100.0 | % | 100.0 | % | $2,029 | | 100.0 | % | 100.0 | % | $1,634 | | 100.0 | % | 100.0 | % | $1,417 | | 100.0 | % | 100.0 | % | $1,256 | | 100.0 | % | 100.0 | % |
|
| |
| |
| |
| |
| |
| |
| |
| |
| |
| |
| |
| |
| |
| |
| |
INVESTMENT SECURITIES
The Company maintains an investment portfolio to fund increased loan demand or deposit withdrawals and other liquidity needs and to provide an additional source of interest income. The portfolio is composed of U.S. Treasury Securities, obligations of U.S. Government Agencies, obligations of U.S. States and Political Subdivisions and Trust Preferred Securities, stock in the Federal Home Loan Bank, and equity securities of another financial institution.
Securities are classified as “held-to-maturity” (HTM), “available for sale”(AFS), or “trading” at time of purchase. Securities classified as HTM are based upon management’s intent and the Company’s ability to hold them to maturity. Such securities are stated at cost, adjusted for unamortized purchase premiums and discounts. Securities which are bought and held principally for resale in the near term are classified as trading securities, which are carried at market value. Realized gains and losses as well as gains and losses from marking the portfolio to market value are included in trading revenue. The Company has no trading securities. Securities not classified as HTM or trading securities are classified as AFS and are stated at fair value. Unrealized gains and losses on AFS securities are excluded from results of operations, and are reported as a component of accumulated other comprehensive (loss) income, net of taxes, which is included in stockholders’ equity. Securities classified as AFS include securities that may be sold in response to changes in interest rates, changes in prepayment risks, the need to increase regulatory capital, or other similar requirements.
Management determines the appropriate classification of securities at the time of purchase. At December 31, 2006, our securities AFS totaled $38.9 million and our securities HTM totaled $10.5 million. Our investment securities portfolio increased by $8.1 million to $49.4 million at December 31, 2006 from $41.3 million at December 31, 2005. The increase reflects liquidity in excess of loan demand being invested in the securities portfolio.
The following table sets forth the carrying value of the Company’s security portfolio as of the dates indicated.
| At December 31,
(in thousands)
|
| 2006
| 2005
| 2004
|
| Amortized
Cost
| | Estimated
Fair
Value
| | Amortized
Cost
| | Estimated
Fair
Value
| | Amortized
Cost
| | Estimated
Fair
Value
|
| Available for sale | | | | | | | | | | | |
| U.S. Government sponsored |
| agency securities | $21,012 | | $20,958 | | $12,997 | | $12,820 | | $ 8,996 | | $ 8,939 |
| Mortgage backed securities | 13,734 | | 13,638 | | 13,747 | | 13,588 | | 3,423 | | 3,440 |
| Collateralized Mortgage Obligations | 4,144 | | 4,012 | | 4,939 | | 4,788 | | 4,576 | | 4,551 |
|
| |
| |
| |
| |
| |
|
| Total US Government and agency securities | 38,890 | | 38,608 | | 31,683 | | 31,196 | | 16,995 | | 16,930 |
|
| |
| |
| |
| |
| |
|
| Equity securities: |
| FHLBNY stock | 276 | | 276 | | 673 | | 673 | | 524 | | 524 |
| Other equity securities | 30 | | 30 | | 30 | | 30 | | 30 | | 30 |
|
| |
| |
| |
| |
| |
|
| Total available for sale | $39,196 | | $38,914 | | $32,386 | | $31,899 | | $17,549 | | $17,484 |
|
| |
| |
| |
| |
| |
|
| Held to Maturity |
| U.S. Government sponsored |
| agency securities | $ 1,000 | | $ 993 | | $ 1,000 | | $ 976 | | $ 2,000 | | $ 1,993 |
| Obligations of US States and |
| Political Subdivisions | 8,428 | | 8,502 | | 6,753 | | 6,802 | | 2,730 | | 2,747 |
| Corporate debt securities | 1,057 | | 1,057 | | 1,613 | | 1,594 | | 1,117 | | 1,122 |
|
| |
| |
| |
| |
| |
|
| Total held to maturity | $10,485 | | $10,552 | | $ 9,366 | | $ 9,372 | | $ 5,847 | | $ 5,862 |
|
| |
| |
| |
| |
| |
|
| Total securities | $49,681 | | $49,466 | | $41,752 | | $41,271 | | $23,396 | | $23,346 |
|
| |
| |
| |
| |
| |
|
The following table sets forth as of December 31, 2006 and December 31, 2005, the maturity distribution of the Company’s debt investment portfolio:
| Maturity of Debt Investment Securities
Securities available for sale |
| December 31, 2006
(in thousands)
| December 31, 2005
(in thousands)
|
| Amortized
Cost
| Estimated
Fair Value
| Weighted
Average
Yield
| Amortized
Cost
| Estimated
Fair Value
| Weighted
Average
Yield
|
| Within 1 year | | $ 5,000 | | $ 4,972 | | 4.23 | % | $ 3,012 | | $ 2,988 | | 2.99 | % |
| 1 to 5 years | | 5,548 | | 5,552 | | 5.54 | % | 7,540 | | 7,452 | | 4.55 | % |
| Over 5 years | | 28,342 | | 28,084 | | 5.31 | % | 21,131 | | 20,756 | | 4.90 | % |
| | |
| |
| | | |
| |
| | | |
| | | $38,890 | | $38,608 | | | | $31,683 | | $31,196 | | | |
| | |
| |
| | | |
| |
| | | |
| Maturity of Debt Investment Securities
Securities Held to Maturity
(in thousands) |
| December 31, 2006
| December 31, 2005
|
| Amortized
Cost
| Estimated
Fair Value
| Weighted
Average
Yield
| Amortized
Cost
| Estimated
Fair Value
| Weighted
Average
Yield
|
| Within 1 year | | $ 20 | | $ 20 | | 2.00 | % | $ 10 | | $ 10 | | 2.00 | % |
| 1 to 5 years | | 580 | | 574 | | 5.34 | % | 571 | | 572 | | 5.23 | % |
| Over 5 years | | 9,885 | | 9,958 | | 6.51 | % | 8,785 | | 8,790 | | 5.85 | % |
|
| |
| | | |
| |
| | | |
| | | $10,485 | | $10,552 | | | | $9,366 | | $9,372 | | | |
|
| |
| | | |
| |
| | | |
.
DEPOSITS
Deposits are the Company’s primary source of funds. The Company experienced growth in average deposit balances during 2006, as average deposits increased by $34.4 million, or 18.7% to $218.7 million for the twelve months ended December 31, 2006 compared to $184.3 million for the prior year. This growth continues to be accomplished as a result of continued market penetration combined with continued customer referrals during 2006. In addition, our fifth branch opened in Madison in September 2006. By year-end 2006, our Madison branch had approximately $20.2 million in deposits. Average non-interest bearing deposits increased by $5.0 million, or 13.0%, to $43.6 million for 2006 from $38.6 million for 2005. Average interest bearing demand deposits, which includes our Paramount and Escrow Ease Checking accounts, increased by $16.3 million, or 16.3%, to $116.3 million for 2006 from $100.0 million for 2005. Average time deposits experienced an increase of $4.8 million, from $23.2 million for 2005 to $28.0 million for 2006. The Company has no foreign deposits, nor are there any material concentrations of deposits.
| | The following table sets forth the average amount of various types of deposits for each of the periods indicated: |
| December 31,
(Dollars in Thousands) |
| 2006
| 2005
| 2004
|
| Average
Amount
| Average
Yield/Rate
| Average
Amount
| Average
Yield/Rate
| Average
Amount
| Average
Yield/Rate
|
| Non-interest Bearing Demand | | $ 43,640 | | — | | $ 38,610 | | — | | $ 29,630 | | — | |
| Interest Bearing Demand | | 116,346 | | 3.22 | % | 100,048 | | 1.96 | % | 84,380 | | 1.13 | % |
| Savings and Money Market | | 30,676 | | 2.81 | % | 22,427 | | 1.50 | % | 13,319 | | 0.72 | % |
| Time Deposits | | 28,045 | | 4.19 | % | 23,182 | | 3.43 | % | 26,092 | | 3.48 | % |
|
| |
| |
| |
| |
| |
| |
| | | $218,707 | | 2.64 | % | $184,267 | | 1.68 | % | $153,421 | | 1.28 | % |
|
| |
| |
| |
| |
| |
| |
The Company does not actively solicit short-term deposits of $100,000 or more because of the liquidity risks posed by such deposits. The following table summarizes the maturity distribution of certificates of deposit of denominations of $100,000 or more as of December 31, 2006 (in thousands).
| Three months or less | $ 5,098 |
| Over three months through six months | 4,760 |
| Over six months through twelve months | 3,897 |
| Over twelve months | 1,244 |
|
|
| Total | $14,999 |
|
|
LIQUIDITY
The Company’s liquidity is a measure of its ability to fund loans, withdrawals or maturities of deposits, and other cash outflows in a cost-effective manner. The Company’s principal sources of funds are deposits, scheduled amortization and prepayments of loan principal, maturities of investment securities, and funds provided by operations. While scheduled loan payments and maturing investments are relatively predictable sources of funds, deposit flow and loan prepayments are greatly influenced by general interest rates, economic conditions, and competition.
The Company’s total deposits equaled $250.2 million at December 31, 2006 as compared to $208.2 million at December 31, 2005. The increase in funds provided by deposit inflows during this period has been sufficient to provide for the Company’s loan demand.
Through the investment portfolio, the Company has generally sought to obtain a safe, yet slightly higher yield than would have been available to the Company as a net seller of overnight federal funds while still maintaining liquidity. Through its investment portfolio, the Company also attempts to manage its maturity gap by seeking maturities of investments, which coincide as closely as possible with maturities of deposits. The investment portfolio also includes securities held for sale to provide liquidity for anticipated loan demand and liquidity needs.
As of December 31, 2006, liquid assets (cash and due from banks, federal funds sold and investment securities available for sale) were approximately $67.5 million, which represented 23.3% of total assets and 27.0% of total deposits and borrowings. Supplementing this liquidity, we have available lines of credit from correspondent banks of approximately $21.5 million and an additional line of credit with the Federal Home Loan Bank of approximately $72.3 million (subject to available collateral, with no borrowings outstanding at December 31, 2006). At year-end, outstanding commitments to extend credit and unused lines of credit were $97.3 million. Management believes that our combined aggregate liquidity position is sufficient to meet our near term funding needs.
OFF-BALANCE SHEET ARRANGEMENTS
The Company is a party to financial instruments with off-balance-sheet risk in the normal course of business to meet the financing needs of its customers. These financial instruments include commitments to extend credit and standby letters of credit. Those instruments involve, to varying degrees, elements of credit and interest rate risk in excess of the amount recognized in the consolidated statements of financial condition. The Company’s exposure to credit loss in the event of non-performance by the other party to the financial instrument for commitments to extend credit and standby letters of credit is represented by the contractual amount of those instruments. The Company uses the same credit policies in making commitments and conditional obligations as it does for on-balance-sheet instruments.
The following table shows the amounts and expected maturities of significant commitments, as of December 31, 2006. Further discussion of these commitments is included in Note 12 to the Consolidated Financial Statements.
| One Year
or Less
| One to Three
Years
| Three to Five
Years
| Over Five
Years
| Total
|
| (in thousands) |
| Standby letters of credit | $1,490 | $— | $— | $— | $1,490 |
Commitments under standby letters of credit, both financial and performance, do not necessarily represent future cash requirements, in that these commitments often expire without being drawn upon.
CONTRACTUAL OBLIGATIONS
The following table shows the contractual obligations of the Company by expected payment period, as of December 31, 2006. Further discussion of these commitments is included in Notes 6 and 11 to the Consolidated Financial Statements.
Contractual Obligation
| Total
| Less than
one year
| 1-3 years
| 3-5 years
| More than
5 years
|
Operating Lease
Obligations | $2,702 | $545 | $1,089 | $577 | $491 |
Operating leases represent obligations entered into by the Company for the use of land, premises and equipment. The leases generally have escalation terms based upon certain defined indexes.
INTEREST RATE SENSITIVITY ANALYSIS
The principal objective of the Company’s asset and liability management function is to evaluate the interest-rate risk included in certain balance sheet accounts; determine the level of risk appropriate given the Company’s business focus, operating environment, capital and liquidity requirements; establish prudent asset concentration guidelines; and manage the risk consistent with Board approved guidelines. The Company seeks to reduce the vulnerability of its operations to changes in interest rates and to manage the ratio of interest-rate sensitive assets to interest-rate sensitive liabilities within specified maturities or repricing dates. The Company’s actions in this regard are taken under the guidance of the Investment and Asset/Liability Committee (ALCO) of the Board of Directors. The ALCO generally reviews the Company’s liquidity, cash flow needs, maturities of investments, deposits and borrowings, and current market conditions and interest rates.
One of the monitoring tools used by the ALCO is an analysis of the extent to which assets and liabilities are interest rate sensitive and measures the Company’s interest rate sensitivity “gap”. An asset or liability is said to be interest rate sensitive within a specific time period if it will mature or reprice within that time period. A gap is considered positive when the amount of interest rate sensitive assets exceeds the amount of interest rate sensitive liabilities. A gap is considered negative when the amount of interest rate sensitive liabilities exceeds the amount of interest rate sensitive assets. Accordingly, during a period of rising rates, a negative gap may result in the yield on the institution’s assets increasing at a slower rate than the increase in its cost of interest-bearing liabilities resulting in a decrease in net interest income. Conversely, during a period of falling interest rates, an institution with a negative gap would experience a repricing of its assets at a slower rate than its interest-bearing liabilities which, consequently, may result in its net interest income growing.
The following table sets forth the amounts of interest-earning assets and interest-bearing liabilities outstanding at the periods indicated which are anticipated by the Company, based upon certain assumptions, to reprice or mature in each of the future time periods presented. Except as noted, the amount of assets and liabilities which reprice or mature during a particular period were determined in accordance with the earlier of the term to repricing or the contractual terms of the asset or liability. Loans with adjustable rates are shown as being due at the end of the next upcoming adjustment period. Certificates of deposit are shown at contractual maturity dates. Interest bearing non-maturity deposit balances are allocated within the first three months of the schedule based on recent rate adjustments relative to Federal Reserve monetary policy changes. Residual balances are placed over one year. In making the “gap” computation, loans are presented based on contractual payments and repricing, and standard assumptions regarding prepayment rates on investments have been used for interest-earning assets. The interest rate sensitivity of our assets and liabilities illustrated in the following table would vary substantially if different assumptions were used or if actual experience differs from that indicated by such assumptions.
As our current position is one of being liability sensitive, we would target the following strategies: (1) reduce the level of fixed rate credits and make more floating rate commercial and home equity loans; (2) allow our investments maturing and cash flows from investments to accumulate in Federal funds sold; (3) offer longer term certificates of deposit; and (4) borrow fixed rate longer term funds from the Federal Home Loan Bank.
At December 31, 2006, our interest rate sensitivity gap is within the target gap range as established by the Investment and Asset/Liability Committee of the Board of Directors.
| Interest Rate Sensitivity Gap
December 31, 2006
(in thousands) |
| | | | | | |
| 3
Months
| 3 to 12
Months
| 1 to 5
Years
| Over 5
Years
| TOTAL
|
| Investment securities | | $ 2,129 | | $ 7,790 | | $25,464 | | $14,016 | | $ 49,399 | |
| Loans held for sale | | 5,003 | | — | | — | | — | | 5,003 | |
| Loans | | 79,763 | | 26,766 | | 67,240 | | 18,802 | | 192,571 | |
| Federal funds sold | | 5,900 | | — | | — | | — | | 5,900 | |
| Interest bearing deposits at other banks | | 1,350 | | — | | — | | — | | 1,350 | |
|
| |
| |
| |
| |
| |
| Total interest earning assets | | 94,145 | | 34,556 | | 92,704 | | 32,818 | | 254,223 | |
| Non-interest earning assets | | — | | — | | — | | — | | 35,205 | |
|
| |
| |
| |
| |
| |
| Total assets | | — | | — | | — | | — | | $289,428 | |
|
| |
| |
| |
| |
| |
| Interest bearing transactions deposits | | $ 163,590 | | $ — | | $ — | | $ — | | $163,590 | |
| Certificates of deposit | | 8,321 | | 23,478 | | 3,817 | | — | | 35,616 | |
|
| |
| |
| |
| |
| |
| Total interest bearing liabilities | | 171,911 | | 23,478 | | 3,817 | | — | | 199,206 | |
| Non-interest bearing liabilities | | — | | — | | — | | — | | 52,326 | |
|
| |
| |
| |
| |
| |
| Total liabilities | | — | | — | | — | | — | | 251,532 | |
|
| |
| |
| |
| |
| |
| Stockholders’ equity | | — | | — | | — | | — | | 37,896 | |
|
| |
| |
| |
| |
| |
| Total liabilities and stockholders’ equity | | — | | — | | — | | — | | $289,428 | |
|
| |
| |
| |
| |
| |
| Interest sensitivity gap per period | | $(77,766 | ) | $ 11,078 | | $88,887 | | $32,818 | | $ 55,017 | |
| Cumulative interest sensitivity gap | | $(77,766 | ) | $(66,688 | ) | $22,199 | | $55,017 | | $ 55,017 | |
| Cumulative gap as a percentage of total interest earning assets | | (30.6 | )% | (26.2 | )% | 8.7 | % | 21.6 | % | 21.6 | % |
| Cumulative interest earning assets as a percentage of cumulative interest bearing liabilities | | 54.8 | % | 65.9 | % | 111.1 | % | 127.6 | % | 127.6 | % |
CAPITAL
A significant measure of the strength of a financial institution is its capital base. The Company’s federal regulators have classified and defined capital into the following components: (1) Tier I Capital, which includes tangible stockholders’ equity for common stock, qualifying preferred stock and certain qualifying hybrid instruments, and (2) Tier II Capital, which includes a portion of the allowance for probable loan losses, certain qualifying long-term debt, and preferred stock which does not qualify for Tier I Capital. Minimum capital levels are regulated by risk-based capital adequacy guidelines which require certain capital as a percent of the Company’s assets and certain off-balance sheet items adjusted for predefined credit risk factors (risk-adjusted assets).
A bank holding company is required to maintain, at a minimum, Tier I Capital as a percentage of risk-adjusted assets of 4.0% and combined Tier I and Tier II Capital as a percentage of risk-adjusted assets of 8.0%.
In addition to the risk-based guidelines, the Company’s regulators require that an institution which meets the regulator’s highest performance and operation standards maintain a minimum leverage ratio (Tier I Capital as a percentage of tangible assets) of 4.0%. For those institutions with higher levels of risk or that are experiencing or anticipating significant growth, the minimum leverage ratio will be evaluated through the ongoing regulatory examination process. The Bank is subject to substantially similar regulations by its federal regulators.
The following table summarizes the risk-based and leverage capital ratios for the Company at December 31, 2006, as well as the required minimum regulatory capital ratios:
| At December 31, 2006
|
|---|
| Actual
Ratio
| Minimum
Requirement
| Well
Capitalized
Requirement
|
| Somerset Hills Bank: | | | | | | | |
| Total risk-based capital ratio | | 10.31 | % | 8.00 | % | 10.00 | % |
| Tier 1 risk-based capital ratio | | 9.39 | % | 4.00 | % | 6.00 | % |
| Leverage ratio | | 8.24 | % | 4.00 | % | 5.00 | % |
| | |
| Somerset Hills Bancorp: | |
| Total risk-based capital ratio | | 16.52 | % | 8.00 | % | 10.00 | % |
| Tier 1 risk-based capital ratio | | 15.60 | % | 4.00 | % | 6.00 | % |
| Leverage ratio | | 13.69 | % | 4.00 | % | 5.00 | % |
BORROWINGS
As an additional source of liquidity, we use advances from the Federal Home Loan Bank of New York. The company had no outstanding advances at December 31, 2006.
IMPACT OF INFLATION AND CHANGING PRICES
The consolidated financial statements of the Company and notes thereto, presented elsewhere herein, have been prepared in accordance with generally accepted accounting principles which require the measurement of financial position and operating results in terms of historical dollars without considering the change in the relative purchasing power of money over time and due to inflation. The impact of inflation is reflected in the increased cost of the Company’s operations. Unlike most industrial companies, nearly all of the assets and liabilities of the Company are monetary. Therefore, interest rates have a greater impact on the Company’s performance than do the effects of general levels of inflation. Interest rates do not necessarily move in the same direction or to the same extent as the prices of goods and services.
RECENT ACCOUNTING PRONOUNCEMENTS
In February 2006, the Financial Accounting Standards Board (FASB) issued Statement No. 155,Accounting for Certain Hybrid Financial Instruments--an amendment to FASB Statements No. 133 and 140.This Statement permits fair value re-measurement for any hybrid financial instruments, clarifies which instruments are subject to the requirements of Statement No. 133, and establishes a requirement to evaluate interests in securitized financial assets and other items. The new standard is effective for financial assets acquired or issued after the beginning of the entity’s first fiscal year that begins after September 15, 2006. Management does not expect the adoption of this statement to have a material impact on its consolidated financial position or results of operations.
In March 2006, the FASB issued Statement No. 156,Accounting for Servicing of Financial Assets--an amendment of FASB Statement No. 140.This Statement provides the following: 1) revised guidance on when a servicing asset and servicing liability should be recognized; 2) requires all separately recognized servicing assets and servicing liabilities to be initially measured at fair value, if practicable; 3) permits an entity to elect to measure servicing assets and servicing liabilities at fair value each reporting date and report changes in fair value in earnings in the period in which the changes occur; 4) upon initial adoption, permits a onetime reclassification of available-for-sale securities to trading securities for securities which are identified as offsetting the entity’s exposure to changes in the fair value of servicing assets or liabilities that a servicer elects to subsequently measure at fair value; and 5) requires separate presentation of servicing assets and servicing liabilities subsequently measured at fair value in the statement of financial position and additional footnote disclosures. This standard is effective as of the beginning of an entity’s first fiscal year that begins after September 15, 2006 with the effects of initial adoption being reported as a cumulative-effect adjustment to retained earnings. Management does not expect the adoption of this statement will have a material impact on its consolidated financial position or results of operations.
In September 2006, the FASB issued Statement No. 157,Fair Value Measurements.This Statement defines fair value, establishes a framework for measuring fair value and expands disclosures about fair value measurements. This Statement establishes a fair value hierarchy about the assumptions used to measure fair value and clarifies assumptions about risk and the effect of a restriction on the sale or use of an asset. The standard is effective for fiscal years beginning after November 15, 2007. The Company has not completed its evaluation of the impact of the adoption of this standard.
In July 2006, the FASB issued FASB Interpretation No. 48,Accounting for Uncertainty in Income Taxes - an interpretation of FASB Statement No. 109(FIN 48), which prescribes a recognition threshold and measurement attribute for a tax position taken or expected to be taken in a tax return. FIN 48 also provides guidance on derecognition, classification, interest and penalties, accounting in interim periods, disclosure and transition. FIN 48 is effective for fiscal years beginning after December 15, 2006. The Company has determined that the adoption of FIN 48 will not have a material effect on the financial statements.
In September 2006, the FASB Emerging Issues Task Force finalized Issue No. 06-4,Accounting for Deferred Compensation and Postretirement Benefit Aspects of Endorsement Split-Dollar Life Insurance Arrangements.This issue requires that a liability be recorded during the service period when a split-dollar life insurance agreement continues after participants’ employment or retirement. The required accrued liability will be based on either the post-employment benefit cost for the continuing life insurance or based on the future death benefit depending on the contractual terms of the underlying agreement. This issue is effective for fiscal years beginning after December 15, 2007. The Company has not completed its evaluation of the impact of adoption of EITF 06-4.
In September 2006, the FASB Emerging Issues Task Force finalized Issue No. 06-5,Accounting for Purchases of Life Insurance - Determining the Amount That Could Be Realized in Accordance with FASB Technical Bulletin No. 85-4 (Accounting for Purchases of Life Insurance).This issue requires that a policyholder consider contractual terms of a life insurance policy in determining the amount that could be realized under the insurance contract. It also requires that if the contract provides for a greater surrender value if all individual policies in a group are surrendered at the same time, that the surrender value be determined based on the assumption that policies will be surrendered on an individual basis. Lastly, the issue discusses whether the cash surrender value should be discounted when the policyholder is contractually limited in its ability to surrender a policy. This issue is effective for fiscal years beginning after December 15, 2006. The Company does not believe the adoption of this issue will have a material impact on the financial statements.
ITEM 7A. — QUANTITATIVE AND QUALITATIVE DISCLOSURES ABOUT MARKET RISK
Based upon the Company’s business, its two largest risks are interest rate risk and credit risk. For a discussion of each, see the “Interest Rate Sensitivity Analysis” and “Asset Quality” discussion in Item 7 hereof.
ITEM 8. — FINANCIAL STATEMENTS
The information required by this item is filed as an exhibit here to.
ITEM 9 -CHANGES IN AND DISAGREEMENTS WITH ACCOUNTANTS ON ACCOUNTING AND FINANCIAL DISCLOSURE
On March 30, 2006, the Audit Committee of the Company’s Board of Directors (“the Audit Committee”) dismissed KPMG, LLP (“KPMG”) as the Company’s independent registered public accounting firm. This dismissal followed the Audit Committee’s receipt of proposals from other independent auditors to audit the Company’s consolidated financial statements for the fiscal year ended December 31, 2006. The reports of KPMG on the financial statements of the Company for each of the past two fiscal years contained no adverse opinion or disclaimer of opinion and were not qualified or modified as to uncertainty, audit scope or accounting principle. During the Company’s two most recent fiscal years and through March 30, 2006 there were no disagreements with KPMG on any matter of accounting principles or practices, financial statement disclosure or auditing scope or procedure, which disagreements if not resolved to the satisfaction of KPMG would have caused them to make reference thereto in their reports on the financial statements of the Company for such years.
On March 30, 2006, the Audit Committee engaged Crowe Chizek and Company LLC as the Company’s independent auditors with respect to the audit of the Company’s consolidated financial statements for the fiscal year ended December 31, 2006.
ITEM 9A. —CONTROLS AND PROCEDURES
(a) Evaluation of disclosure controls and procedures
The Company carried out an evaluation, under the supervision and with the participation of the Company’s management, including the Company’s Chief Executive Officer and Chief Financial Officer, of the effectiveness of the design and operation of the Company’s disclosure controls and
procedures pursuant to Exchange Act Rule 13a-15. Based upon that evaluation, the Chief Executive Officer and Chief Financial Officer concluded that, as of the end of the period covered by this report, the Company’s disclosure controls and procedures are effective in timely alerting them to material information relating to the Company (including its consolidated subsidiaries) required to be included in the Company’s periodic SEC filings.
(b) Changes in internal controls.
None
ITEM 9B. -OTHER INFORMATION
Not applicable
PART III
ITEM 10. — DIRECTORS AND EXECUTIVE OFFICERS OF THE REGISTRANT; COMPLIANCE WITH SECTION 16(A)
Information required by this part is included in the definitive Proxy Statement for the Company’s 2007 Annual Meeting under the captions “ELECTION OF DIRECTORS”,“COMPLIANCE WITH SECTION 16(A) OF THE SECURITIES EXCHANGE ACT OF 1934,” each of which is incorporated herein by reference. It is expected that such Proxy Statement will be filed with the Securities and Exchange Commission no later than April 30, 2007.
ITEM 11. — EXECUTIVE COMPENSATION
Information concerning executive compensation is included in the definitive Proxy Statement for the Company's 2007 Annual Meeting under the captions “EXECUTIVE COMPENSATION AND ALL OTHER COMPENSATION” and “COMPENSATION OF DIRECTORS”, which is incorporated by reference herein. It is expected that such Proxy Statement will be filed with the Securities and Exchange Commission no later than April 30, 2007.
ITEM 12. — SECURITY OWNERSHIP OF CERTAIN
BENEFICIAL OWNERS AND MANAGEMENT AND RELATED STOCKHOLDER
MATTERS
Information concerning security ownership of certain beneficial owners and management is included in the definitive Proxy statement for the Company’s 2007 Annual Meeting under the caption “SECURITY OWNERSHIP OF CERTAIN BENEFICIAL OWNERS AND MANAGEMENT”, which is incorporated herein by reference. It is expected that such Proxy statement will be filed with the Securities and Exchange Commission no later than April 30, 2007.
The following table sets forth information with respect to the Company’s equity compensation plans as of the end of the most recently completed fiscal year.
Equity Compensation Plan Information
| Plan category | Number of
securities
to
be issued
upon
exercise of
outstanding
options,
warrants
and rights
(a) | Weighted-
average
exercise
price of
outstanding
options,
warrants
and rights
(b) | Number of
securities
remaining
available
for
future
issuance
under
equity
compensation
plans
(excluding
securities
reflected
in
column
(a))
(c) |
Equity compensation plans
approved
by security holders | 569,122 | $8.18 | 4,600 |
Equity compensation plans not
approved by security holders | 0 | $ 0 | 0 |
| Total | 569,122 | $8.18 | 4,600 |
ITEM 13. — CERTAIN RELATIONSHIPS AND RELATED TRANSACTIONS
Information concerning certain relationships and related transactions is included in the definitive Proxy Statement for the Company’s 2007 Annual Meeting under the caption “INTEREST OF MANAGEMENT AND OTHERS IN CERTAIN TRANSACTIONS”, which is incorporated herein by reference. It is expected that such Proxy statement will be filed with the Securities and Exchange Commission no later than April 30, 2007.
ITEM 14. - PRINCIPAL ACCOUNTANT FEES AND SERVICES
The information concerning principal accountant fees and services as well as related pre-approval policies under the caption “Appointment of Auditors for Fiscal 2007” in the Proxy Statement for the Company’s 2007 Annual Meeting of Shareholders is incorporated by reference herein. It is expected that such Proxy Statement will be filed with the Securities and Exchange Commission no later than April 30, 2007.
ITEM 15. — EXHIBITS
(a) Exhibits
Exhibit number
| Description of Exhibits
| |
| 3.1 | Certificate of Incorporation of Somerset Hills Bancorp (1) |
| 3.2 | Bylaws of Somerset Hills Bancorp (1) |
| 3.3 | Certificate of Incorporation for Somerset Hills Bank (1) |
| 3.4 | Bylaws of Somerset Hills Bank (1) |
| 4.1 | Specimen Common Stock Certificate (1) |
| 4.2 | Specimen of Warrant (1) |
| 4.3 | Warrant Agreement (1) |
| 10.1 | 1998 Combined Stock Option Plan (1) |
| 10.2 | 1998 Non-Qualified Stock Option Plan (1) |
| 10.3 | 2001 Combined Stock Option Plan (1) |
| 10.4 | Employment Agreement of Stewart E. McClure, Jr. (1) |
| 10.5 | Employment Agreement of Gerard Riker (1) |
| 14 | Code of Ethics (2) |
| 21 | Subsidiaries of Somerset Hills Bancorp |
| 23 | Consent of KPMG LLP and consent of Crowe Chizek and Company LLC |
| 31 | Rule 13a-14(a)/15d-14(a) Certifications |
| 32 | Section 1350 Certification |
| (1) | | Incorporated by reference from the Registrant’s Registration Statement on Form SB-2, as amended, File No. 333-99647, declared effective on November 12, 2002. |
| (2) | | Incorporated by reference from Exhibit 14 from the Registrant’s Annual Report on Form10-KSB for the year ended December 31, 2003. |
SOMERSET HILLS BANCORP AND SUBSIDIARY
INDEX TO CONSOLIDATED FINANCIAL STATEMENTS
| Page
|
| Reports of Independent Registered Public Accounting Firms | 45-46 |
| |
| Consolidated Statements of Financial Condition |
| as of December 31, 2006 and 2005 | 47 |
| |
| Consolidated Statements of Income for the years |
| ended December 31, 2006, 2005, and 2004 | 48 |
| |
| Consolidated Statements of Stockholders’ Equity |
| for the years ended December 31, 2006, |
| 2005, and 2004 | 49 |
| |
| Consolidated Statements of Cash Flows for the years |
| ended December 31, 2006, 2005, and 2004 | 50 |
| | |
| Notes to Consolidated Financial Statements | 51 |
Report of Independent Registered Public Accounting Firm
The Board of Directors and Stockholders of
Somerset Hills Bancorp
Bernardsville, New Jersey
We have audited the accompanying consolidated statement of financial condition of Somerset Hills Bancorp of December 31, 2006, and the related consolidated statements of income and stockholders’ equity and cash flows for the year then ended. These financial statements are the responsibility of the Company’s management. Our responsibility is to express an opinion on these financial statements based on our audit.
We conducted our audit in accordance with the standards of the Public Company Accounting Oversight Board (United States). Those standards require that we plan and perform the audit to obtain reasonable assurance about whether the financial statements are free of material misstatement. An audit includes examining, on a test basis, evidence supporting the amounts and disclosures in the financial statements. An audit also includes assessing the accounting principles used and significant estimates made by management, as well as evaluating the overall financial statement presentation. We believe that our audit provides a reasonable basis for our opinion.
In our opinion, the financial statements referred to above present fairly, in all material respects, the financial position of Somerset Hills Bancorp as of December 31, 2006, and the results of its operations and its cash flows for the year then ended in conformity with accounting principles generally accepted in the United States of America.
| | /s/ Crowe Chizek and Company LLC |
Livingston, New Jersey
March 5, 2007
Report of Independent Registered Public Accounting Firm
The Board of Directors and Stockholders
Somerset Hills Bancorp:
We have audited the accompanying consolidated statement of financial condition of Somerset Hills Bancorp and subsidiary (the Company) as of December 31, 2005, and the related consolidated statements of income, stockholders’ equity, and cash flows for each of the years in the two-year period ended December 31, 2005. These consolidated financial statements are the responsibility of the Company’s management. Our responsibility is to express an opinion on these consolidated financial statements based on our audits.
We conducted our audits in accordance with the standards of the Public Company Accounting Oversight Board (United States). Those standards require that we plan and perform the audit to obtain reasonable assurance about whether the financial statements are free of material misstatement. An audit includes examining, on a test basis, evidence supporting the amounts and disclosures in the financial statements. An audit also includes assessing the accounting principles used and significant estimates made by management, as well as evaluating the overall financial statement presentation. We believe that our audits provide a reasonable basis for our opinion.
In our opinion, the consolidated financial statements referred to above present fairly, in all material respects, the financial position of Somerset Hills Bancorp and subsidiary as of December 31, 2005, and the results of their operations and their cash flows for each of the years in the two-year period ended December 31, 2005, in conformity with U.S. generally accepted accounting principles.
Short Hills, New Jersey
March 3, 2006
SOMERSET HILLS BANCORP AND SUBSIDIARY
Consolidated Statements of Financial Condition
December 31, 2006 and 2005
(Dollars in Thousands)
| 2006
| 2005
|
| ASSETS | | | | | |
| Cash and due from banks | | $ 22,662 | | $ 10,321 | |
| Federal funds sold | | 5,900 | | — | |
|
| |
| |
| Total cash and cash equivalents | | 28,562 | | 10,321 | |
| Loans held for sale | | 5,003 | | 15,380 | |
| Investment securities held to maturity (Approximate | |
| market value of $10,552 in 2006 and $9,372 in 2005) | | 10,485 | | 9,366 | |
| Investment securities available- for- sale | | 38,914 | | 31,899 | |
| Loans receivable | | 192,571 | | 167,301 | |
| Less allowance for loan losses | | (2,170 | ) | (2,029 | ) |
| Deferred fees | | (136 | ) | (154 | ) |
|
| |
| |
| Net loans receivable | | 190,265 | | 165,118 | |
| Premises and equipment, net | | 6,295 | | 4,679 | |
| Goodwill, net | | 1,191 | | 1,191 | |
| Bank owned life insurance | | 5,801 | | 5,533 | |
| Accrued interest receivable | | 1,508 | | 1,135 | |
| Deferred tax asset | | 805 | | 889 | |
| Other assets | | 599 | | 415 | |
|
| |
| |
| Total assets | | $ 289,428 | | $ 245,926 | |
|
| |
| |
| LIABILITIES AND STOCKHOLDERS’ EQUITY | |
| LIABILITIES | |
| Deposits | |
| Noninterest-bearing deposits-demand | | $ 51,015 | | $ 45,667 | |
| Interest bearing deposits | |
| Now money market and savings | | 163,590 | | 141,846 | |
| Certificates of deposit, under $100,000 | | 20,617 | | 14,034 | |
| Certificates of deposit, $100,000 and over | | 14,999 | | 6,697 | |
|
| |
| |
| Total deposits | | 250,221 | | 208,244 | |
|
| |
| |
| Federal Home Loan Bank advances | | — | | 10,600 | |
| Accrued interest payable | | 697 | | 252 | |
| Taxes payable | | 34 | | 760 | |
| Other liabilities | | 580 | | 765 | |
|
| |
| |
| Total liabilities | | 251,532 | | 220,621 | |
|
| |
| |
| Commitments and contingencies (notes 11 and 12) | |
| | |
| STOCKHOLDERS’ EQUITY | |
| Preferred stock-1,000,000 shares authorized; none issued | | — | | — | |
| Common stock-authorized, 9,000,000 shares | |
| of no par value; issued and outstanding, | |
| 4,759,514 in 2006 and 3,426,289 in 2005 | | 36,916 | | 24,389 | |
| Retained earnings | | 1,166 | | 1,223 | |
| Accumulated other comprehensive loss | | (186 | ) | (307 | ) |
|
| |
| |
| Total stockholders’ equity | | 37,896 | | 25,305 | |
|
| |
| |
| Total liabilities and stockholders’ equity | | $ 289,428 | | $ 245,926 | |
|
| |
| |
See accompanying notes to consolidated financial statements.
SOMERSET HILLS BANCORP AND SUBSIDIARY
Consolidated Statements of Income
Years ended December 31, 2006, 2005 and 2004
(Dollars in thousands, except per share data)
| 2006
| 2005
| 2004
|
| INTEREST INCOME | | | | | | | |
| Loans, including fees | | $ 13,601 | | $ 10,152 | | $ 7,128 | |
| Federal funds sold | | 158 | | 181 | | 67 | |
| Investment securities | | 1,985 | | 1,239 | | 998 | |
| Cash and due from banks | | 38 | | 33 | | 9 | |
|
| |
| |
| |
| Total interest income | | 15,782 | | 11,605 | | 8,202 | |
| INTEREST EXPENSE | |
| Deposits | | 5,782 | | 3,089 | | 1,962 | |
| Federal funds purchased | | 1 | | 4 | | 2 | |
| Borrowings | | 271 | | 101 | | 55 | |
|
| |
| |
| |
| Total interest expense | | 6,054 | | 3,194 | | 2,019 | |
|
| |
| |
| |
| Net interest income | | 9,728 | | 8,411 | | 6,183 | |
| PROVISION FOR LOAN LOSSES | | 201 | | 392 | | 225 | |
|
| |
| |
| |
| Net interest income after provision for loan losses | | 9,527 | | 8,019 | | 5,958 | |
|
| |
| |
| |
| NON-INTEREST INCOME | |
| Service fees on deposit accounts | | 283 | | 273 | | 289 | |
| Gains on sales of mortgage loans and fees, net | | 2,083 | | 2,251 | | 2,183 | |
| Other income | | 503 | | 417 | | 364 | |
| (Loss) gains on sales of investment securities, net | | — | | (2 | ) | 9 | |
|
| |
| |
| |
| Total non-interest income | | 2,869 | | 2,939 | | 2,845 | |
|
| |
| |
| |
| NON-INTEREST EXPENSE | |
| Salaries and employee benefits | | 4,879 | | 4,192 | | 3,707 | |
| Occupancy expense | | 1,603 | | 1,397 | | 1,242 | |
| Advertising and business promotion | | 552 | | 540 | | 504 | |
| Stationery and supplies | | 261 | | 250 | | 204 | |
| Data processing | | 435 | | 379 | | 288 | |
| Other operating expenses | | 1,292 | | 1,656 | | 1,386 | |
|
| |
| |
| |
| Total non-interest expense | | 9,022 | | 8,414 | | 7,331 | |
|
| |
| |
| |
| Income before income taxes | | 3,374 | | 2,544 | | 1,472 | |
| PROVISION FOR INCOME TAXES | | 1,176 | | 429 | | 113 | |
|
| |
| |
| |
| NET INCOME | | $ 2,198 | | $ 2,115 | | $ 1,359 | |
|
| |
| |
| |
| Per share data | |
| Net income basic | | $ 0.58 | | $ 0.62 | | $ 0.40 | |
|
| |
| |
| |
| Net income diluted | | $ 0.50 | | $ 0.54 | | $ 0.35 | |
|
| |
| |
| |
| Weighted average shares outstanding-basic | | 3,771,110 | | 3,400,067 | | 3,362,016 | |
| Weighted average shares outstanding-diluted | | 4,358,155 | | 3,950,511 | | 3,904,870 | |
See accompanying notes to consolidated financial statements.
SOMERSET HILLS BANCORP AND SUBSIDIARY
Consolidated Statements of Stockholders’ Equity
Years ended December 31, 2006, 2005 and 2004
(Dollars in Thousands)
| Common
Stock
| Retained
Earnings
(Accumulated
Deficit)
| AccumulatedOther
Comprehensive
Income (loss),
Net of tax
| Comprehensive
Income
| Total
|
| Balance at December 31, 2003 | | $ 23,853 | | $(2,186 | ) | $ 54 | | | | $ 21,721 | |
Exercise of common stock warrants and
options | | 87 | | — | | — | | — | | 87 | |
| Net income | | — | | 1,359 | | — | | $ 1,359 | | 1,359 | |
| Other comprehensive loss, net of | |
| reclassifications adjustments | | — | | — | | (119 | ) | (119 | ) | (119 | ) |
| | |
| |
| |
| |
| |
| |
| Total comprehensive income | | | | | | | | 1,240 | | | |
| | | | | | | | |
| | | |
| Balance at December 31, 2004 | | 23,940 | | (827 | ) | (65 | ) | | | 23,048 | |
| Net income | | — | | 2,115 | | — | | 2,115 | | 2,115 | |
| Other comprehensive loss, net of tax | | — | | — | | (242 | ) | (242 | ) | (242 | ) |
| Cash dividend paid | | (61 | ) | (65 | ) | — | | — | | (126 | ) |
| Exercise of common stock warrants and options | | 510 | | — | | — | | — | | 510 | |
| | |
| |
| |
| |
| |
| |
| Total comprehensive income | | | | | | | | 1,873 | | | |
| | | | | | | | |
| | | |
| Balance December 31, 2005 | | 24,389 | | 1,223 | | (307 | ) | | | 25,305 | |
| Exercise of common stock warrants | | 10,138 | | — | | — | | — | | 10,138 | |
| Exercise of common stock options | | 547 | | — | | — | | — | | 547 | |
| Net income | | — | | 2,198 | | — | | 2,198 | | 2,198 | |
| Stock dividend paid (5.00%) | | 1,842 | | (1,842 | ) | — | | — | | — | |
| Cash dividend paid | | — | | (413 | ) | — | | — | | (413 | ) |
| Other comprehensive income, net of tax | | — | | — | | 121 | | 121 | | 121 | |
| | |
| |
| |
| |
| |
| |
| Total comprehensive income | | | | | | | | $ 2,319 | | | |
| | | | | | | | |
| | | |
| Balance December 31, 2006 | | $ 36,916 | | $ 1,166 | | $(186 | ) | | | $ 37,896 | |
See accompanying notes to consolidated financial statements.
SOMERSET HILLS BANCORP AND SUBSIDIARY
Consolidated Statements of Cash Flows
Years ended December 31, 2006, 2005 and 2004
(Dollars in Thousands)
| 2006
| 2005
| 2004
|
| OPERATING ACTIVITIES | | | | | | | |
| Net income | | $ 2,198 | | $ 2,115 | | $ 1,359 | |
| Adjustments to reconcile net income to net cash provided by (used | |
| in) operating activities | |
| Depreciation and amortization | | 597 | | 573 | | 613 | |
| Provision for loan losses | | 201 | | 392 | | 225 | |
| Loss (gains) on sales of investment securities, net | | — | | 2 | | (9 | ) |
| Mortgage loans originated for sale | | (293,328 | ) | (311,273 | ) | (270,803 | ) |
| Proceeds from mortgage loan sales | | 305,788 | | 308,472 | | 267,768 | |
| Gain on sale of mortgage loans and fees, net | | (2,083 | ) | (2,251 | ) | (2,183 | ) |
| Increase in accrued interest receivable | | (373 | ) | (483 | ) | (164 | ) |
| Deferred taxes | | — | | (560 | ) | (149 | ) |
| Increase in bank owned life insurance | | (268 | ) | (192 | ) | (219 | ) |
| (Increase) decrease in other assets | | (184 | ) | 114 | | (259 | ) |
| Increase in accrued interest payable | | 445 | | 164 | | 5 | |
| (Decrease) increase in other liabilities | | (911 | ) | 860 | | (559 | ) |
|
| |
| |
| |
| Net cash provided by (used in) operating activities | | 12,082 | | (2,067 | ) | (4,375 | ) |
|
| |
| |
| |
| INVESTING ACTIVITIES | |
| Maturity and payments of investment securities held to maturity | | 509 | | 998 | | 3,497 | |
| Purchases of investment securities available-for-sale | | (21,391 | ) | (21,429 | ) | (19,286 | ) |
| Purchases of investment securities held to maturity | | (1,675 | ) | (5,053 | ) | (3,262 | ) |
| Maturity and payments of investment securities available-for-sale | | 14,565 | | 6,568 | | 15,090 | |
| Proceeds from sale of investment securities available-for-sale | | — | | — | | 2,005 | |
| Proceeds from sale of investment securities held to maturity | | — | | 486 | | — | |
| Net increase in loans receivable | | (25,348 | ) | (34,471 | ) | (23,890 | ) |
| Purchases of premises and equipment | | (2,150 | ) | (949 | ) | (972 | ) |
|
| |
| |
| |
| Net cash used in investing activities | | (35,490 | ) | (53,850 | ) | (26,818 | ) |
|
| |
| |
| |
| FINANCING ACTIVITIES | |
| Net proceeds from exercise of common stock, options and warrants | | 10,685 | | 510 | | 87 | |
| Cash dividends paid | | (413 | ) | (126 | ) | — | |
| Federal Home Loan Bank advances | | 1,212,950 | | 222,400 | | 146,600 | |
| Repayments of Federal Home Loan Bank advances | | (1,223,550 | ) | (215,000 | ) | (144,400 | ) |
| Net increase in demand deposits and savings accounts | | 27,092 | | 56,386 | | 16,021 | |
| Net increase (decrease) in certificates of deposit | | 14,885 | | (3,017 | ) | (6,797 | ) |
|
| |
| |
| |
| Net cash provided by financing activities | | 41,649 | | 61,153 | | 11,511 | |
|
| |
| |
| |
| Net increase (decrease) in cash and cash equivalents | | 18,241 | | 5,236 | | (19,682 | ) |
| Cash and cash equivalents at beginning of period | | 10,321 | | 5,085 | | 24,767 | |
|
| |
| |
| |
| Cash and cash equivalents at end of period | | $ 28,562 | | $ 10,321 | | $ 5,085 | |
|
| |
| |
| |
| Supplemental information: | |
| Cash paid during the year for: | |
| Interest | | $ 5,609 | | $ 3,031 | | $ 2,013 | |
| Income taxes | | 1,953 | | 342 | | 178 | |
|
| |
| |
| |
See accompanying notes to consolidated financial statements.
SOMERSET HILLS BANCORP AND SUBSIDIARY
Notes to Consolidated Financial Statements
December 31, 2006 and 2005
NOTE 1- SUMMARY OF SIGNIFICANT ACCOUNTING POLICIES
| | a) Basis of Financial Statement Presentation |
| | The accounting and reporting policies of the Company conform to U.S. generally accepted accounting principles (US GAAP). The financial statements include the accounts of the Company and its wholly-owned subsidiary, Somerset Hills Bank (the “Bank”) and its wholly-owned subsidiary, Sullivan Financial Services, Inc. All material intercompany balances and transactions have been eliminated in the financial statements. |
| | In preparing the financial statements, management is required to make estimates and assumptions that affect the reported amounts of assets and liabilities and disclosure of contingent assets and liabilities at the date of the balance sheet and the reported amounts of revenues and expenses during the reporting periods. Therefore, actual results could differ from those estimates. |
| | The principal estimate that is particularly susceptible to significant change in the near term relates to the allowance for loan losses. The evaluation of the adequacy of the allowance for loan losses includes an analysis of the individual loans and overall risk characteristics and size of the different loan portfolios, and takes into consideration current economic and market conditions, the capability of specific borrowers to pay specific loan obligations, and current loan collateral values. However, actual losses on specific loans, which also are encompassed in the analysis, may vary from estimated losses. |
| | Operating segments are components of an enterprise about which separate financial information is available that is evaluated regularly by the chief operating decision maker in deciding how to allocate resources and assess performance. The Company has two reportable segments: community banking and mortgage banking. |
| | Goodwill and intangible assets with indefinite useful lives are no longer being amortized, but instead tested for impairment at least annually in accordance with SFAS No. 142. |
| | As of each of December 31, 2006 and 2005 the Company had unamortized goodwill in the amount of $1,191,000 as a result of the acquisition of Sullivan Financial Services Inc. for which the amortization ceased upon the adoption of Statement No. 142. |
| | c) Cash and Cash Equivalents |
| | Cash and cash equivalents include cash on hand, amounts due from banks and federal funds sold. Included in Cash and due from banks at December 31, 2006 and 2005 is $1,342,000 and $1,376,000 respectively, representing reserves required by banking regulations. |
| | Debt securities for which the Company does not have the positive intent to hold to maturity and all marketable equity securities are classified as available-for-sale. Debt and equity securities classified as available-for-sale are reported at fair value, with unrealized gains and losses excluded from earnings and reported as a separate component of stockholders’ equity, net of income taxes. The net effect of unrealized gains or losses, caused by marking an available-for-sale portfolio to market, could cause fluctuations in the level of equity and equity-related financial ratios as market interest rates cause the fair value of fixed-rate securities to fluctuate. |
| | Investment and mortgage-backed securities which the Company has the ability and intent to hold to maturity are held for investment purposes and carried at cost, adjusted for amortization of premium and accretion of discount over the terms of the maturity in a manner which approximates the interest method. At the time of purchase, the Company makes a determination as to whether or not it will hold the investment securities to maturity. Gains or losses on the sales of securities available-for-sale are recognized upon realization utilizing the specific identification method. |
| | Such securities are stated at cost, adjusted for amortization of premium and accretion of discount on the level-yield method, over the term of the investments. |
| | A decline in the estimated market value of any security below cost that is deemed other-than-temporary results in a reduction in the carrying amount to estimated market value. In determining whether an impairment is other-than-temporary, the Company considers, among other things, the duration of the impairment, changes in value subsequent to year end, forecasted performance of the issuer and the Company’s intent and ability to hold the security until a market price recovery. |
| | e) Stock-Based Compensation |
| | At December 31, 2006, the Company has three stock-based plans, which are described more fully in note 10. For 2005 and 2004 the Company accounted for those plans under the recognition and measurements principles of APB Opinion No. 25, Accounting for Stock Issued to Employees, and related Interpretations. No stock-based employee compensation cost was reflected in net income for 2005 and 2004, as all options granted under those plans had an exercise price equal to the market value of the underlying common stock on the date of grant. In December 2005 the Company amended the stock option grant agreements evidencing outstanding grants to accelerate the vesting period, making the options 100% vested. This acceleration affected 74,661 shares granted under the plan. The primary purpose of accelerating vesting was to eliminate future compensation expense the Company would otherwise recognize in its future income statements with respect to the options under Statement of Financial Accounting Standards No. 123, “Share Based Payment (revised 2004)” (“SFAS 123(R)”). The Company estimated that the future pre-tax expense eliminated as a result of acceleration of vesting of outstanding options was approximately $180,000 to 2008 during which the options otherwise would have vested. The following table illustrates the effect on net income and earnings per share if the Company had applied the fair value recognition provisions of FASB Statement No. 123, Accounting for Stock-Based Compensation, as amended, to stock-based employee compensation. |
| Years Ended December 31, |
| 2005
| 2004
|
| Net income, as reported | | $ 2,115 | | $ 1,359 | |
| Deduct: Total stock-based | |
| compensation expense determined under fair | |
| value based method for all awards, net of | |
| related tax effect | | (299 | ) | (81 | ) |
|
| |
| |
| Pro forma net income | | $ 1,816 | | $ 1,278 | |
| Net income per share: | |
| Basic--as reported | | $ 0.62 | | $ 0.40 | |
| Basic--pro forma | | $ 0.53 | | $ 0.38 | |
| Diluted--as reported | | $ 0.54 | | $ 0.35 | |
| Diluted--pro forma | | $ 0.46 | | $ 0.33 | |
| | Effective January 1, 2006 the Company adopted SFAS 123(R). The Company now recognizes compensation expense related to stock options granted after December 31, 2005 based on the fair value of such awards at the date of the grant over the period the awards are earned. The impact of adopting this statement was immaterial to the financial statements in 2006. |
| | The per share weighted-average fair values of stock options granted during 2006, 2005 and 2004 were $4.38, $4.24 and $4.18, respectively, on the date of grant using the Black Scholes option-pricing model with the following weighted-average assumptions for 2006, 2005 and 2004, respectively: expected dividend yields of 0.21%, 0.00% and 0.00%, risk-free interest rates of 4.70%, 4.29% and 3.49%, volatility rate of 18.24%, 25.00% and 25.00%, and expected lives of 7 years for each period. Expected volatilities are based on historical volatilities of the Company’s common stock. The Company uses historical data to estimate option exercise and post-vesting termination behavior. The expected term of options granted is based on historical data and represents the period of time that options granted are expected to be outstanding, which takes into account that the options are not transferable. The risk-free interest rate for the expected term of the option is based on the U.S. Treasury yield curve in effect at the time of the grant. |
| | f) Loans and Allowance for Loan Losses |
| | Loans that management has the intent and ability to hold for the foreseeable future or until maturity or payoff are reported at their outstanding principal, adjusted for any charge-offs, the allowance for loan losses, and any deferred fees or costs on originated loans. Interest on loans is accrued and credited to operations based upon the principal amounts outstanding. The allowance for loan losses is maintained at an amount management deems adequate to cover estimated losses. In determining the level to be maintained, management evaluates many factors, including current economic trends, industry experience, historical loss experience, industry loan concentrations, the borrowers’ ability to repay and repayment performance, and estimated collateral values. In the opinion of management, the present allowance is adequate to absorb probable loan losses inherent in the portfolio. |
| | While management uses available information to recognize losses on loans, future additions to the allowance may be necessary based on changes in economic conditions or any of the other factors used in management’s determination. In addition, various regulatory agencies, as an integral part of their examination process, periodically review |
| | the Company’s allowance for losses on loans. Such agencies may require the Company to recognize additions to the allowance based on their judgments about information available to them at the time of their examination. |
| | Our primary market area is Morris, Somerset and Union Counties, New Jersey. Negative economic conditions in our market area could affect both depositors and borrowers, and thereby adversely affect our performance. |
| | Interest on loans is accrued and credited to operations based upon the principal amounts outstanding. Loans are considered delinquent when they become 30 or more days past due. Loans are placed on non-accrual when a loan is specifically determined to be impaired or when principal or interest is delinquent for 90 days or more. Any unpaid interest previously accrued on those loans is reversed from income. Interest income generally is not recognized on specific impaired loans unless the likelihood of further loss is remote. Interest payments received on such loans are applied as a reduction of the loan principal balance. Interest income on other non-accrual loans is recognized only to the extent of interest payments received. |
| | A loan is considered impaired when, based on current information, it is probable that the Company will be unable to collect all amounts due including interest according to the contractual terms of the loan agreement. Impaired loans are measured based on the present value of expected cash flows or as a practical expedient, at the loans’ observable market price, or the fair value of the underlying collateral. Loans are charged off when the probability of collecting the amounts due is unlikely. At December 31, 2006 and 2005, the Company had impaired loans of $282 thousand and $0, respectively. |
| | Mortgage loans originated and intended for sale in the secondary market are carried at the lower of aggregate cost or estimated fair value. Market value is determined by purchase commitments from investors and prevailing market prices. Loans are sold with servicing released; the gain or loss on sale is recorded on the settlement date. |
| | h) Premises and Equipment |
| | Land is stated at cost. Buildings and improvements and furniture, fixtures and equipment are stated at cost, less accumulated depreciation computed on the straight-line method over the estimated lives of each type of asset. Estimated useful lives are five to thirty- nine and one half years for buildings and improvements and three to five years for furniture, fixtures and equipment. Leasehold improvements are stated at cost less accumulated amortization computed on the straight-line method over the shorter of the term of the lease or useful life. Significant renewals and improvements are capitalized. Maintenance and repairs are charged to operations as incurred. |
| | The Company uses the asset and liability method of accounting for income taxes. Under the asset and liability method, deferred income taxes are recognized for the tax consequences of temporary differences by applying enacted statutory tax rates applicable to future years to temporary differences between the financial statement carrying amounts and tax bases of existing assets and liabilities. The effect on deferred taxes of a change in tax rates is recognized in income tax expense in the period that includes the enactment date. |
| | Basic income per share excludes dilution and is computed by dividing income available to common shareholders by the weighted average common shares outstanding during the period. Diluted income per share takes into account the potential dilution that could occur if securities or other contracts to issue common stock were exercised and converted into common stock. Income per share is computed based on the weighted average number of shares of common stock outstanding. All per share amounts have been restated for the effect of the 5% stock distribution made on June 30, 2005 and May 31, 2006. |
| | Comprehensive income includes net income and unrealized gains and losses on investment securities available for sale. |
| | l) Recent Accounting Pronouncements |
In February 2006, the Financial Accounting Standards Board (FASB) issued Statement No. 155,Accounting for Certain Hybrid Financial Instruments--an amendment to FASB Statements No. 133 and 140.This Statement permits fair value re-measurement for any hybrid financial instruments, clarifies which instruments are subject to the requirements of Statement No. 133, and establishes a requirement to evaluate interests in securitized financial assets and other items. The new standard is effective for financial assets acquired or issued after the beginning of the entity’s first fiscal year that begins after September 15, 2006. Management does not expect the adoption of this statement to have a material impact on its consolidated financial position or results of operations.
In March 2006, the FASB issued Statement No. 156,Accounting for Servicing of Financial Assets--an amendment of FASB Statement No. 140.This Statement provides the following: 1) revised guidance on when a servicing asset and servicing liability should be recognized; 2) requires all separately recognized servicing assets and servicing liabilities to be initially measured at fair value, if practicable; 3) permits an entity to elect to measure servicing assets and servicing liabilities at fair value each reporting date and report changes in fair value in earnings in the period in which the changes occur; 4) upon initial adoption, permits a onetime reclassification of available-for-sale securities to trading securities for securities which are identified as offsetting the entity’s exposure to changes in the fair value of servicing assets or liabilities that a servicer elects to subsequently measure at fair value; and 5) requires separate presentation of servicing assets and servicing liabilities subsequently measured at fair value in the statement of financial position and additional footnote disclosures. This standard is effective as of the beginning of an entity’s first fiscal year that begins after September 15, 2006 with the effects of initial adoption being reported as a cumulative-effect adjustment to retained earnings. Management does not expect the adoption of this statement will have a material impact on its consolidated financial position or results of operations.
In September 2006, the FASB issued Statement No. 157,Fair Value Measurements.This Statement defines fair value, establishes a framework for measuring fair value and expands disclosures about fair value measurements. This Statement establishes a fair value hierarchy about the assumptions used to measure fair value and clarifies assumptions about risk and the effect of a restriction on the sale or use of an asset. The standard is effective for fiscal years beginning after November 15, 2007. The Company has not completed its evaluation of the impact of the adoption of this standard.
In July 2006, the FASB issued FASB Interpretation No. 48,Accounting for Uncertainty in Income Taxes - an interpretation of FASB Statement No. 109(FIN 48), which prescribes a recognition threshold and measurement attribute for a tax position taken or expected to be taken in a tax return. FIN 48 also provides guidance on derecognition, classification, interest and penalties, accounting in interim periods, disclosure and transition. FIN 48 is effective for fiscal years beginning after
December 15, 2006. The Company has determined that the adoption of FIN 48 will not have a material effect on the financial statements.
In September 2006, the FASB Emerging Issues Task Force finalized Issue No. 06-4,Accounting for Deferred Compensation and Postretirement Benefit Aspects of Endorsement Split-Dollar Life Insurance Arrangements.This issue requires that a liability be recorded during the service period when a split-dollar life insurance agreement continues after participants’ employment or retirement. The required accrued liability will be based on either the post-employment benefit cost for the continuing life insurance or based on the future death benefit depending on the contractual terms of the underlying agreement. This issue is effective for fiscal years beginning after December 15, 2007. The Company has not completed its evaluation of the impact of adoption of EITF 06-4.
In September 2006, the FASB Emerging Issues Task Force finalized Issue No. 06-5,Accounting for Purchases of Life Insurance - Determining the Amount That Could Be Realized in Accordance with FASB Technical Bulletin No. 85-4 (Accounting for Purchases of Life Insurance).This issue requires that a policyholder consider contractual terms of a life insurance policy in determining the amount that could be realized under the insurance contract. It also requires that if the contract provides for a greater surrender value if all individual policies in a group are surrendered at the same time, that the surrender value be determined based on the assumption that policies will be surrendered on an individual basis. Lastly, the issue discusses whether the cash surrender value should be discounted when the policyholder is contractually limited in its ability to surrender a policy. This issue is effective for fiscal years beginning after December 15, 2006. The Company does not believe the adoption of this issue will have a material impact on the financial statements.
NOTE 2- INVESTMENT SECURITIES
| | The amortized cost, gross unrealized gains and losses, and fair value of the Company’s investment securities held to maturity and available-for-sale are as follows (in thousands): |
Held to Maturity
| Amortized
Cost
| Gross
Unrealized
Gains
| Gross
Unrealized
Losses
| Estimated
Market
Value
|
2006
| | | | | | | | | |
| U.S. Government sponsored | |
| Agency Securities | | $ 1,000 | | $ — | | $ (7 | ) | $ 993 | |
| Obligations of US States and Political | |
| Subdivisions | | 8,428 | | 91 | | (17 | ) | 8,502 | |
| Corporate debt securities | | 1,057 | | — | | — | | 1,057 | |
|
| |
| |
| |
| |
| Total held to maturity | | $10,485 | | $91 | | $ (24 | ) | $10,552 | |
|
| |
| |
| |
| |
2005
| | | |
| U.S. Government sponsored | |
| Agency Securities | | $ 1,000 | | $ — | | $ (24 | ) | $ 976 | |
| Obligations of US States and Political | |
| Subdivisions | | 6,753 | | 64 | | (15 | ) | 6,802 | |
| Corporate debt securities | | 1,613 | | — | | (19 | ) | 1,594 | |
|
| |
| |
| |
| |
| Total held to maturity | | $ 9,366 | | $64 | | $ (58 | ) | $ 9,372 | |
|
| |
| |
| |
| |
Available for Sale
| |
2006
| | | |
| U.S. Government sponsored | |
| Agency Securities | | $21,012 | | $44 | | $ (98 | ) | $20,958 | |
| Mortgage Backed Securities | | 13,734 | | 31 | | (127 | ) | 13,638 | |
| Collaterized Mortgage Obligations | | 4,144 | | — | | (132 | ) | 4,012 | |
| FHLBNY stock | | 276 | | — | | — | | 276 | |
| Other equity securities | | 30 | | — | | — | | 30 | |
|
| |
| |
| |
| |
| Total available-for-sale | | $39,196 | | $75 | | $(357 | ) | $38,914 | |
|
| |
| |
| |
| |
2005
| | | | | | | | | |
| U.S. Government sponsored | |
| Agency Securities | | $12,997 | | $— | | $(177 | ) | $12,820 | |
| Mortgage Backed Securities | | 13,747 | | 7 | | (166 | ) | 13,588 | |
| Collaterized Mortgage Obligations | | 4,939 | | — | | (151 | ) | 4,788 | |
| FHLBNY stock | | 673 | | — | | — | | 673 | |
| Other equity securities | | 30 | | — | | — | | 30 | |
|
| |
| |
| |
| |
| Total available-for-sale | | $32,386 | | $7 | | $(494 | ) | $31,899 | |
|
| |
| |
| |
| |
| | The amortized cost and fair value of the Company’s investment securities held to maturity and available-for-sale at December 31, 2006, by contractual maturity, are shown below. Expected maturities will differ from contractual maturities because borrowers may have the right to call or prepay obligations with or without call or prepayment penalties (in thousands). |
Held to Maturity
| Amortized
Cost
| Estimated
Market
Value
|
| Due in one year or less | $ 20 | | $ 20 | |
| Due in one to five years | 580 | | 574 | |
| Due in five years to ten years | 586 | | 579 | |
| Due after ten years | 9,299 | | 9,379 | |
|
| |
| |
| | $10,485 | | $10,552 | |
|
| |
| |
Available for Sale
|
| Due in one year or less | $ 5,000 | | $ 4,972 | |
| Due in one year to five years | 5,548 | | 5,552 | |
| Due in five years to ten years | 9,696 | | 9,630 | |
| Due after ten years | 18,646 | | 18,454 | |
| Equity securities | 306 | | 306 | |
|
| |
| |
| | $39,196 | | $38,914 | |
|
| |
| |
Gross unrealized losses on securities and the estimated market value of the related securities aggregated by security category and length of time that individual securities have been in a continuous unrealized loss position at December 31, 2006 and 2005 are as follows:
2006
| Less than 12 months
| 12 Months or longer
| Total
|
Held to Maturity
| Estimated
Market
Value
| Unreal-
ized
Losses
| Estimated
Market
Value
| Unreal-
ized
Losses
| Estimated
Market
Value
| Unreal-
ized
Losses
|
| U.S. Government sponsored Agency Securities | $ — | | $— | | $ 994 | | $ 7 | | $ 994 | | $ 7 | |
| Municipal securities | 699 | | 4 | | 942 | | 13 | | 1,641 | | 17 | |
| Corporate debt securities | — | | — | | 520 | | — | | 520 | | — | |
|
| |
| |
| |
| |
| |
| |
| Total | $699 | | $ 4 | | $2,456 | | $20 | | $3,155 | | $24 | |
|
| |
| |
| |
| |
| |
| |
2005
| Less than 12 months
| 12 Months or longer
| Total
|
Held to Maturity
| Estimated
Market
Value
| Unreal-
ized
Losses
| Estimated
Market
Value
| Unreal-
ized
Losses
| Estimated
Market Value
| Unreal-
ized
Losses
|
| U.S. Government sponsored Agency Securities | $ 976 | | $24 | | $ — | | $ — | | $ 976 | | $24 | |
| Municipal securities | 1,322 | | 15 | | — | | — | | 1,322 | | 15 | |
| Corporate debt securities | 1,059 | | 7 | | 526 | | 12 | | 1,585 | | 19 | |
|
| |
| |
| |
| |
| |
| |
| Total | $3,357 | | $46 | | $526 | | $12 | | $3,883 | | $58 | |
|
| |
| |
| |
| |
| |
| |
2006
| Less than 12 months
| 12 Months or longer
| Total
|
Available for Sale
| Estimated
Market
Value
| Unreal-
ized
Losses
| Estimated
Market
Value
| Unreal-
ized
Losses
| Estimated
Market
Value
| Unreal-
ized
Losses
|
| U.S. Government sponsored Agency Securities | $5,993 | | $ 7 | | $ 7,909 | | $ 91 | | $13,902 | | $ 98 | |
| Mortgage Backed Securities | 3,449 | | 12 | | 7,153 | | 115 | | 10,602 | | 127 | |
| Collateralized Mortgage Obligations | — | | — | | 4,012 | | 132 | | 4,012 | | 132 | |
| |
| |
| |
| |
| |
| |
| |
| Total | $9,442 | | $19 | | $19,074 | | $338 | | $28,516 | | $357 | |
| |
| |
| |
| |
| |
| |
| |
2005
| Less than 12 months
| 12 Months or longer
| Total
|
Available for Sale
| Estimated
Market
Value
| Unreal-
ized
Losses
| Estimated
Market
Value
| Unreal-
ized
Losses
| Estimated
Market
Value
| Unreal-
ized
Losses
|
| U.S. Government sponsored Agency Securities | $ 6,878 | | $119 | | $4,942 | | $ 58 | | $11,820 | | $177 | |
| Mortgage Backed Securities | 7,756 | | 150 | | 515 | | 16 | | 8,271 | | 166 | |
| Collateralized Mortgage Obligations | 1,780 | | 22 | | 3,008 | | 129 | | 4,788 | | 151 | |
|
| |
| |
| |
| |
| |
| |
| Total | $16,414 | | $291 | | $8,465 | | $203 | | $24,879 | | $494 | |
|
| |
| |
| |
| |
| |
| |
At December 31, 2006, there are $19.1 million in securities available for sale and $2.5 million in held to maturity with gross unrealized losses that have been in a continuous unrealized loss position for twelve or more months. Additionally, management does not consider any impairment in the value of its securities to be other than temporary in nature. Impairment that exists within the Company’s investment portfolios is due primarily to interest rate fluctuations. The Company has the ability to hold these securities until maturity at which time the Company expects to receive the fully amortized cost.
For the years ended December 31, 2006, 2005 and 2004 the gross proceeds on sales of securities were approximately $0, $486 thousand and $2.0 million, respectively. For the years ended December 31, 2006, 2005 and 2004 the gross gain on sales of securities were approximately $0, $0 and $9,000, respectively. There was $2,000 in gross losses on sales of securities for the year ended December 31, 2005 and no gross losses on sales of securities for the years ended December 31, 2006 and 2004.
Securities with an amortized cost of $997 thousand and $989 thousand, respectively, were pledged to secure public funds on deposit at December 31, 2006 and 2005.
The Company is a member of the Federal Home Loan Bank of New York (FHLBNY) and Atlantic Central Bankers Bank. As a result, the Company is required to hold shares of capital stock of FHLBNY as well as Atlantic Central Bankers Bank, which are carried at cost, based upon a specified formula.
NOTE 3 - LOANS
| | Loans are summarized as follows (in thousands): |
| | December 31,
|
| | | 2006
| 2005
|
| Commercial and commercial real estate | | $ 145,610 | | $ 131,101 | |
| Residential real estate | | 7,145 | | 6,225 | |
| Consumer, installment and home equity | | 39,816 | | 29,975 | |
|
| |
| |
| | | $ 192,571 | | $ 167,301 | |
| Less | |
| Allowance for loan losses | | (2,170 | ) | (2,029 | ) |
| Deferred fees | | (136 | ) | (154 | ) |
|
| |
| |
| | | $ 190,265 | | $ 165,118 | |
|
| |
| |
| | There were $282 thousand and $0 in loans classified as non-performing (past due 90 days or more) as of December 31, 2006 and 2005, respectively. |
| | Individually impaired loans were as follows (in thousands): |
| | 2006
| 2005
|
Year-end loans with no allocated
allowance for loan losses | $ — | | $— | |
Year-end loans with allocated allowance
for loan losses | 282 | | — | |
|
| |
| |
| Total | $282 | | $— | |
|
| |
| |
| | 2006
| 2005
| 2004
|
| Average of individually impaired loans during year | $109 | | $12 | | $— | |
| Interest income recognized during impairment | — | | — | | — | |
| Cash-basis interest income recognized | — | | — | | — | |
| | Nonperforming loans were as follows (in thousands): |
| | 2006
| 2005
|
| Loans past due over 90 days still on accrual | $202 | | $— | |
| Nonaccrual loans | 282 | | — | |
Nonperforming loans includes both smaller balance homogeneous loans that are collectively evaluated for impairment and individually classified impaired loans.
| | In the ordinary course of business, the Company grants loans to stockholders, officers, directors, and their affiliates. The aggregate amount of these loans outstanding at December 31, 2006 and 2005 was approximately $2.9 million and $3.6 million |
| | respectively. During 2006, new loans to such related parties amounted to approximately $1.3 million and repayments amounted to approximately $2.0 million. |
Changes in the allowance for loan losses, were as follows (in thousands):
| | December 31,
|
| | 2006 | | 2005 | | 2004 | |
|
| |
| |
| |
| Balance at beginning of year | $ 2,029 | | $ 1,634 | | $ 1,417 | |
| Chargeoffs | (2 | ) | (13 | ) | (27 | ) |
| Recoveries | — | | 16 | | 19 | |
| Reclassification related to unused |
| commitments | (58 | ) | — | | — | |
| Provision charged to operations | 201 | | 392 | | 225 | |
|
| |
| |
| |
| Balance at end of year | $ 2,170 | | $ 2,029 | | $ 1,634 | |
|
| |
| |
| |
NOTE 4 - PREMISES AND EQUIPMENT
| | Premises and equipment are as follows (in thousands): |
| | December 31,
|
| | 2006 | | 2005 | |
|
| |
| |
| Land | $ 693 | | $ 693 | |
| Buildings and improvement | 4,966 | | 3,412 | |
| Furniture, fixtures and equipment | 2,009 | | 1,613 | |
| Leasehold improvements | 992 | | 965 | |
| Computer equipment and software | 1,114 | | 941 | |
|
| |
| |
| | 9,774 | | 7,624 | |
| Less accumulated depreciation and amortization | (3,479 | ) | (2,945 | ) |
|
| |
| |
| Total premises and equipment, net | $ 6,295 | | $ 4,679 | |
|
| |
| |
| | Depreciation charged to operations amounted to approximately $534 thousand, $501 thousand and $527 thousand for the years ended December 31, 2006, 2005 and 2004, respectively. |
NOTE 5 - CERTIFICATES OF DEPOSIT
| | At December 31, 2006, a summary of the maturity of certificates of deposit is as follows (in thousands): |
| 2007 | $31,799 | |
| 2008 | 3,037 | |
| 2009 | 522 | |
| 2010 | 164 | |
| 2011 | 94 | |
|
| |
| $35,616 | |
|
| |
| | Deposits held at the Company by related parties, which include executive officers, directors, and companies in which directors of the Board have a significant ownership interest, approximated $13.1 million and $21.5 million at December 31, 2006 and 2005, respectively. |
NOTE 6 - BORROWINGS
| | a) Federal Home Loan Bank Borrowing |
| | As of December 31, 2006 and 2005, the Company had an approved borrowing capacity of approximately $72.3 million and $61.5 million, respectively, with the Federal Home Loan Bank of New York (FHLB), based on total assets and collateral available, collateralized by FHLB stock investment securities and qualifying mortgage loans. Borrowings under this arrangement have interest rates that range from 4.30% to 4.60% at December 31, 2005. At December 31, 2006 and 2005, $0 and $10.6 million, respectively, in borrowings were outstanding with the FHLB. |
| | b) Credit Lines and Borrowings |
| | The Company has five lines of credit with financial institutions aggregating $21.5 million at December 31, 2006. Borrowings under these agreements have interest rates that fluctuate based on market conditions. The Company also purchases Federal Funds on an overnight basis. The Company had no borrowings outstanding under these lines as of December 31, 2006 and 2005, respectively. |
NOTE 7 - INCOME TAXES
| | Deferred income taxes are provided for the temporary difference between the financial reporting basis and the tax basis of the Company’s assets and liabilities. |
The components of income taxes (benefit) are summarized as follows (in thousands):
| December 31,
|
| | | 2006
| | 2005
| | 2004
| |
| Current Tax Expense: | |
| Federal | | $ 1,131 | | $ 742 | | $ 149 | |
| State | | 45 | | 247 | | 113 | |
|
| |
| |
| |
| | | 1,176 | | 989 | | 262 | |
| Deferred Tax (Benefit): | |
| Federal | | (188 | ) | (420 | ) | (120 | ) |
| State | | 188 | | (140 | ) | (29 | ) |
|
| |
| |
| |
| | | — | | (560 | ) | (149 | ) |
|
| |
| |
| |
| | | $ 1,176 | | $ 429 | | $ 113 | |
|
| |
| |
| |
| | The following table presents a reconciliation between the reported income taxes and the income taxes, which would be computed by applying the normal tax rate (34%) to income before taxes (in thousands): |
| | December 31,
|
| | | 2006
| | 2005
| | 2004
| |
| Federal income tax | | $ 1,147 | | $ 865 | | $ 501 | |
| Add (deduct) effect of: | |
| State income taxes net of federal income tax effect | | 154 | | 146 | | 55 | |
| Change in valuation reserve | | — | | (495 | ) | (419 | ) |
| Meals and entertainment | | 35 | | 35 | | 32 | |
| Increase in cash surrender value life insurance | | (71 | ) | — | | — | |
| Tax-exempt income | | (95 | ) | (116 | ) | (90 | ) |
| Other | | 6 | | (6 | ) | 34 | |
|
| |
| |
| |
| | | $ 1,176 | | $ 429 | | $ 113 | |
|
| |
| |
| |
| | The tax effects of existing temporary differences that give rise to significant portions of the deferred tax assets and deferred tax liabilities are as follows (in thousands): |
| | 2006 | | 2005 |
|
| |
|
| Deferred tax assets: |
| Allowance for loan losses | $528 | | $469 |
| Federal AMT Tax | — | | 27 |
| Mark to market - loans | 2 | | 2 |
| Charitable contribution carryover | — | | 3 |
| Non accrual loan income | 6 | | — |
| Depreciation | 142 | | 58 |
| Unrealized Loss - AFS | 96 | | 180 |
| NOL carryover and other | 31 | | 150 |
|
| |
|
| Net deferred tax assets | $805 | | $889 |
|
| |
|
| | The valuation allowance for deferred taxes as of December 31, 2006 and 2005 was $0. The net change in the total valuation allowance for the year ended December 31, 2005 was |
| | a net decrease of $495,000. Based upon the level of historical taxable income and projections for future taxable income over the periods in which the deferred tax assets are deductible, management believes it is more likely than not that the Company will realize the benefits of these deductible differences. |
| | At December 31, 2006, the bank has state income tax loss carryforwards of approximately $215,000 which expire through 2011. Under a temporary moratorium in effect in New Jersey, the Company is only permitted to use half of these net-operating losses for state tax purposes in 2005. New Jersey taxable income in 2005 was reduced 50% by net operating loss carryforwards. In 2006 the Company was permitted to use all of these net-operating loss carryforwards for state tax purposes. |
NOTE 8 - RELATED PARTY TRANSACTIONS
| | A director of the Company is a member of the law firm, which represents the Company as general counsel. The Company paid fees to this law firm, relating to general corporate matters, of approximately $43,000, $76,000 and $94,000 during the years ended December 31, 2006, 2005 and 2004, respectively. This law firm had approximately $10,839,000 and $18,135,000 of deposits held with the Company as of December 31, 2006 and 2005, respectively. The law firm had outstanding loan balances of $397,000 and $559,000 at December 31, 2006 and 2005, respectively, in connection with one term loan made by the Bank in 2003 and two term loans made by the Bank in 2001 and 2003. |
| | A director of the Company is an owner of a restaurant, which the Company uses for entertainment purposes. The Company paid this restaurant approximately $12,000, $3,000 and $4,000 during the years ended December 31, 2006, 2005 and 2004, respectively. |
NOTE 9 - NET INCOME PER SHARE
| | The Company’s calculation of net income per share is as follows: |
| | Year Ended December 31,
(in thousands, except
per share data) |
| | 2006 | | 2005 | | 2004 |
|
| |
| |
|
| Basic earnings per share: |
| Net income | $2,198 | | $2,115 | | $1,359 |
| Average number of shares outstanding | 3,771 | | 3,400 | | 3,362 |
|
| |
| |
|
| Basic earnings per share | $ 0.58 | | $ 0.62 | | $ 0.40 |
|
| |
| |
|
| Diluted earnings per share: |
| Net income | $2,198 | | $2,115 | | $1,359 |
| Average number of shares of common stock and equivalents outstanding: |
| Average common shares outstanding | 3,771 | | 3,400 | | 3,362 |
| Additional shares considered in diluted computation assuming: |
| Exercise of options and warrants | 587 | | 550 | | 543 |
|
| |
| |
|
| Average number of shares outstanding |
| On a diluted basis | 4,358 | | 3,950 | | 3,905 |
|
| |
| |
|
| Diluted earnings per share | $ 0.50 | | $ 0.54 | | $ 0.35 |
|
| |
| |
|
NOTE 10 - STOCK OPTION PLANS AND WARRANTS
| | The Board of Directors of the Company adopted three stock option plans, for the members of the board of directors, executive officers, and certain employees of the Bank. |
| | The Company’s 1998 Combined Stock Option Plan (the Combined Plan) and Non-Qualified Stock Option Plan provides for the granting of options to acquire up to 382,885 shares of the Company’s common stock. The Company’s 2001 Combined Stock Option Plan (2001 Combined Plan) provides for the granting of 255,256 shares of the Company’s common stock. Both incentive stock options (ISOs) and non-qualified options (NQOs) may be granted under the plans. The shares of common stock that may be purchased pursuant to ISOs granted under the Combined Plan is limited to 191,442. The number of shares of common stock that may be purchased pursuant to NQOs granted under the Combined Plan is 95,721. Only key employees of the Company may receive ISOs under the Combined Plan and the 2001 Combined Plan. Only NQOs may be granted under the NQO Plan. |
| | Options granted pursuant to the Combined Plan, the NQO Plan and the 2001 Combined Stock Option Plan must be exercisable at a price greater than or equal to the par value of the Common Stock, but in no event may the option price be lower than (i) in the case of an ISO, the fair market value of the shares subject to the ISO on the date of grant, (ii) in the case of an NQO issued to a Director as compensation for serving as a Director or as a member of the advisory boards of the Bank, the fair market value of the shares subject to the NQO on the date of grant, and (iii) in the case of an NQO issued to a grantee as employment compensation, eighty-five percent (85%) of the fair market value of the shares subject to the NQO on the date of grant. In addition, no ISO may be granted to an employee who owns common stock possessing more than ten percent (10%) of the total combined voting power of the Bank’s common stock unless the price is at least 110% of the fair market value (on the date of grant) of the common stock. |
| | A summary of the status of the Company’s stock option plans as of December 31, 2006, 2005 and 2004 and the change during the years ended is represented below: |
| | Number of
Shares
| Weighted
average
exercise
price
|
| Outstanding at December 31, 2003 | | 567,759 | | $ 7.74 | |
| Granted | | 41,256 | | 11.30 | |
| Exercised | | (5,107 | ) | 8.07 | |
| Forfeited | | (6,727 | ) | 8.17 | |
|
| |
| |
| Outstanding at December 31, 2004 | | 597,181 | | 7.99 | |
|
| |
| |
| Granted | | 39,809 | | 10.78 | |
| Exercised | | (7,608 | ) | 7.09 | |
| Forfeited | | (8,763 | ) | 8.61 | |
|
| |
| |
| Outstanding at December 31, 2005 | | 620,619 | | 8.18 | |
| | | | | | |
| Granted | | 2,625 | | 13.44 | |
| Exercised | | (51,704 | ) | 8.31 | |
| Forfeited | | (2,418 | ) | 10.84 | |
|
| |
| |
| Outstanding at December 31, 2006 | | 569,122 | | $ 8.18 | |
|
| |
| |
| | At December 31, 2006, 2005 and 2004, the number of options exercisable was 566,497, 620,619 and 532,366, respectively, and the weighted-average price of those options was $8.18, $8.18 and $7.80, respectively. |
| | At December 31, 2006 and 2005, there were 4,600 and 4,806 additional shares available for grant under the Plans. During 2006, 2,625 options were granted. During 2005, 39,809 options were granted. |
| | The following table summarizes information about options outstanding at December 31, 2006: |
| Options outstanding
| | Options exercisable
| |
Number
outstanding at
December 31, 2006
| Weighted
average
remaining
contractual
life
| Weighted
average
exercise
price
| Number
outstanding
at December
31, 2006
| Weighted
average
exercise
price
|
| 569,122 | 3.50 years | $8.18 | 566,497 | $8.18 |
| | Information related to the stock option plan during each year follows (in thousands): |
| | 2006 | 2005 | 2004 |
|
|
|
|
| Intrinsic value of options exercised | $274 | $ 30 | $ 19 |
| Cash received from options exercised | 429 | 54 | $ 41 |
| Tax benefit realized from option exercises | 106 | — | — |
| Weighted average fair value of options granted | $ 12 | $161 | $165 |
| | In November of 2002, the Company sold 1,104,000 units in a public offering. Each unit consisted of one share of common stock and one warrant to purchase 1.22 shares of common stock at a price per share of $7.93 (both as adjusted for subsequent stock dividends) at any time until November 30, 2006. As of December 31, 2006 all warrants had been exercised or forfeited. |
| | The Company has a 401(k) profit sharing plan for eligible employees. The Company matches employee contributions equal to 40% of the amount of the salary reduction the employee elects to defer up to a maximum of 5% of eligible compensation. The Company may also contribute a discretionary amount each year as determined by the Company. The Company’s contribution to the Plan was approximately $76 thousand, $51 thousand and $28 thousand for the years ended December 31, 2006, 2005 and 2004, respectively. |
NOTE 11 - COMMITMENTS
| | The Company leases certain office space and equipment under non-cancelable lease agreements, which have expiration dates through 2015. Rental expense was approximately $560 thousand, $528 thousand and $397 thousand for the years ended December 31, 2006, 2005 and 2004, respectively. |
| | The following is a schedule of minimum rental commitments under operating leases at December 31, 2006 (in thousands): |
| 2007 | $ 545 | |
| 2008 | 554 | |
| 2009 | 535 | |
| 2010 | 370 | |
| 2011 | 207 | |
| Thereafter | 491 | |
|
| |
| Total | $2,702 | |
|
| |
| | The Company has entered into employment agreements with two key executives. These agreements provide for terms through March 2008. Pursuant to these agreements, the named individuals will receive base salaries and certain increases as defined in these agreements. |
| | c) Commitment to Extend Credit |
| | Sullivan Financial Services, Inc. (Sullivan) is a mortgage banking entity engaged in extending mortgage commitments to customers on behalf of investor companies. Sullivan also directly issues mortgage commitments to extend financing for FHA and VA mortgages. In certain instances the mortgage commitments Sullivan directly issues are closed in Sullivan’s name as lender and simultaneously assigned at closing to a mortgage banker who finances the mortgage. In other instances, Sullivan closes the qualifying mortgage on its warehouse line and later sells and/or assigns the mortgage loan to an investor company. Sullivan also brokers loans, which are funded by a mortgage banker. |
| | The Company’s certificate of incorporation authorizes it to issue up to 1,000,000 shares of preferred stock, in one or more series, with such designations and such relative voting, dividend and liquidation, conversion and other rights, preferences and limitations as shall be resolved by the Board of Directors. No shares of preferred stock have ever been issued. |
| | The Company is involved in legal proceedings incurred in the normal course of business. In the opinion of management, none of these proceedings are expected to have a material affect on the financial position or results of operations of the Company. |
NOTE 12 - FINANCIAL INSTRUMENTS WITH OFF-BALANCE-SHEET RISK AND CONCENTRATIONS OF CREDIT RISK
| | The Company is a party to financial instruments with off-balance-sheet risk in the normal course of business to meet the financing needs of its customers. These financial instruments include commitments to extend credit and standby letters of credit. Those instruments involve, to varying degrees, elements of credit and interest rate risk in excess of the amount recognized in the financial statements. The Company’s exposure to credit loss in the event of non-performance by the other party to the financial instrument for commitments to extend credit and standby letters of credit is represented by the contractual amount of those instruments. The Company uses the same credit policies in making commitments and conditional obligations as it does for on-balance-sheet instruments. |
| | The Company had the following approximate off-balance-sheet financial instruments whose contract amounts represent credit risk (in thousands): |
| | December 31,
|
| | 2006
| | 2005
|
| | | |
| Commitments to extend credit and unused lines |
| of credit | $97,252 | | $87,727 |
| Letters of credit—-standby and performance | 1,490 | | 1,527 |
|
| |
|
| Total | $98,742 | | $89,254 |
|
| |
|
| | Commitments to extend credit are agreements to lend to a customer so long as there is no violation of any condition established in the contract. Commitments generally have fixed expiration dates or other termination clauses and may require payment of a fee. Since many of the commitments are expected to expire without being drawn upon, the total commitment amounts do not necessarily represent future cash requirements. The Company evaluates each customer’s creditworthiness on a case-by-case-basis. The amount of collateral obtained, if deemed necessary by the Company upon extension of credit, is based on management’s credit evaluation of the customer. Collateral held varies but may include guarantees, marketable securities, residential or commercial real estate, accounts receivable, inventory or equipment. The Company had extensions of credit to related parties for approximately $3.0 million and $3.7 million at December 31, 2006 and 2005, respectively. |
| | Standby letters of credit are conditional commitments issued by the Company to guarantee the performance of a customer to a third party. Those guarantees are primarily issued to support contracts entered into by customers. Most guarantees extend for one year. The credit risk involved in issuing letters of credit is essentially the same as that involved in extending loan facilities to customers. |
NOTE 13 - REPORTABLE SEGMENTS
| | The Company has identified reportable operating segments in accordance with the provisions of SFAS No, 131, Disclosure About Segments of an Enterprise and Related Information. |
| | The primary activities of the Company include acceptance of deposits from the general public, origination of mortgage loans on residential and commercial real estate, commercial and consumer loans, and investment in debt securities, mortgage-backed securities and other financial instruments (community banking). Sullivan Financial Services, Inc. provides mortgage-banking services to customers on behalf of investor companies (mortgage banking). |
| | The Company follows U.S. generally accepted accounting principles as described in the summary of significant accounting policies. Consolidation adjustments reflect elimination of intersegment revenue and expenses and statement of financial condition. |
| | The following table sets forth certain information about the reconciliation of reported net income for each of the reportable segments as of and for the year ended December 31, 2006 (in thousands). |
| The Bank
and Bancorp
| Sullivan
Financial
Services, Inc.
| Eliminating
entries
| Consolidated
|
| Interest income | | $ 15,910 | | $ 627 | | $ (755 | ) | $ 15,782 | |
| Interest expense | | 6,054 | | 755 | | (755 | ) | 6,054 | |
| Provision for loan losses | | 201 | | — | | — | | 201 | |
| Non-interest income | | 870 | | 2,083 | | (84 | ) | 2,869 | |
| Non-interest expense | | 8,286 | | 1,996 | | (84 | ) | 10,198 | |
| Net Income | | 2,239 | | (41 | ) | — | | 2,198 | |
| Total assets | | $287,955 | | $ 9,178 | | $(7,705 | ) | $289,428 | |
| | The following table sets forth certain information about and the reconciliation of reported net income for each of the reportable segments as of and for the year ended December 31, 2005 (in thousands). |
| | The Bank
and Bancorp
| Sullivan
Financial
Services, Inc.
| Eliminating
entries
| Consolidated
|
| Interest income | | $ 11,634 | | $ 683 | | $ (712 | ) | $ 11,605 | |
| Interest expense | | 3,194 | | 712 | | (712 | ) | 3,194 | |
| Provision for loan losses | | 392 | | — | | — | | 392 | |
| Non-interest income | | 771 | | 2,252 | | (84 | ) | 2,939 | |
| Non-interest expense | | 6,789 | | 2,138 | | (84 | ) | 8,843 | |
| Net Income | | 2,030 | | 85 | | — | | 2,115 | |
| Total assets | | $246,556 | | $19,454 | | $(20,084 | ) | $245,926 | |
| | The following table sets forth certain information about and the reconciliation of reported net income for each of the reportable segments as of and for the year ended December 31, 2004 (in thousands). |
| The Bank
and Bancorp
| Sullivan
Financial
Services, Inc.
| Eliminating
entries
| Consolidated
|
| Interest income | | $ 8,078 | | $ 568 | | $ (444 | ) | $ 8,202 | |
| Interest expense | | 2,019 | | 444 | | (444 | ) | 2,019 | |
| Provision for loan losses | | 225 | | — | | — | | 225 | |
| Non-interest income | | 744 | | 2,185 | | (84 | ) | 2,845 | |
| Non-interest expense | | 5,362 | | 2,166 | | (84 | ) | 7,444 | |
| Net income | | 1,216 | | 143 | | — | | 1,359 | |
| Total assets | | $182,463 | | $14,651 | | $(15,238 | ) | $181,876 | |
NOTE 14 - REGULATORY MATTERS
| | The Company and the Bank are subject to various regulatory capital requirements administered by the federal banking agencies. Failure to meet minimum capital requirements can initiate certain mandatory—and possibly additional discretionary—actions by regulators that, if undertaken, could have a direct material effect on the Company’s financial statements. Under capital adequacy guidelines and the regulatory framework for prompt corrective action, the Company and the Bank must meet specific capital guidelines that involve quantitative measures of their respective assets, liabilities and certain off- |
| | balance-sheet items as calculated under regulatory accounting practices. The capital amounts and classification are also subject to qualitative judgments by the regulators about components, risk weightings and other factors. |
| | Quantitative measures established by regulations to ensure capital adequacy require the Bank to maintain minimum amounts and ratios (set forth in the table below) of total and Tier I capital (as defined in the regulations) to risk-weighted assets (as defined), and of Tier I capital (as defined) to average assets (as defined). As of December 31, 2006, management believes that both the Company and the Bank meet all capital adequacy requirements to which they are subject. |
The Bank’s actual capital amounts and ratios are presented in the tables (in thousands):
| | Actual
| For capital
Adequacy purposes
| For classification
as Well Capitalized
|
| | Amount
| Ratio
| Amount
| Ratio
| Amount
| Ratio
|
| December 31, 2006: | | | | | | | | | | | | | |
| | | | | | | | | | | | | | |
| Total capital (to risk-weighted assets) | | $24,365 | | 10.31 | % | $18,908 | | ≥8.00% | | $23,634 | | ≥10.00% | |
| Tier I capital (to risk-weighted assets) | | 22,195 | | 9.39 | % | 9,454 | | ≥4.00% | | 14,181 | | ≥6.00% | |
| Tier I capital (to average assets) | | 22,195 | | 8.24 | % | 10,780 | | ≥4.00% | | 13,475 | | ≥5.00% | |
| | |
| December 31, 2005: | |
| | | | | | | | | | | | | | |
| Total capital (to risk-weighted assets) | | $22,003 | | 10.59 | % | $16,618 | | ≥8.00% | | $20,772 | | ≥10.00% | |
| Tier I capital (to risk-weighted assets) | | 19,974 | | 9.62 | % | 8,309 | | ≥4.00% | | 12,463 | | ≥6.00% | |
| Tier I capital (to average assets) | | 19,974 | | 8.51 | % | 9,391 | | ≥4.00% | | 11,739 | | ≥5.00% | |
| | As of December 31, 2006 and 2005, the Bank’s ratio of equity capital to total assets was 8.02% and 8.48%, respectively. |
The Company’s actual capital amounts and ratios are presented in the tables (in thousands):
| | Actual
| For capital
Adequacy purposes
| For classification
as Well Capitalized
|
| | Amount
| Ratio
| Amount
| Ratio
| Amount
| Ratio
|
| December 31, 2006: | | | | | | | | | | | | | |
| | | | | | | | | | | | | | |
| Total capital (to risk-weighted assets) | | $39,063 | | 16.52 | % | $18,916 | | ≥8.00% | | $23,645 | | ≥10.00% | |
| Tier I capital (to risk-weighted assets) | | 36,893 | | 15.60 | % | 9,458 | | ≥4.00% | | 14,187 | | ≥6.00% | |
| Tier I capital (to average assets) | | 36,893 | | 13.69 | % | 10,780 | | ≥4.00% | | 13,475 | | ≥5.00% | |
| | |
| December 31, 2005: | |
| | | | | | | | | | | | | | |
| Total capital (to risk-weighted assets) | | $26,450 | | 12.73 | % | $16,618 | | ≥8.00% | | $20,772 | | ≥10.00% | |
| Tier I capital (to risk-weighted assets) | | 24,421 | | 11.76 | % | 8,309 | | ≥4.00% | | 12,463 | | ≥6.00% | |
| Tier I capital (to average assets) | | 24,421 | | 10.40 | % | 9,391 | | ≥4.00% | | 11,739 | | ≥5.00% | |
| | As of December 31, 2006 and 2005, the Company’s ratio of equity capital to total assets was 13.09% and 10.29%, respectively. |
NOTE 15 - FAIR VALUE OF FINANCIAL INSTRUMENTS
| | For the Company, as for most financial institutions, the majority of its assets and liabilities are considered financial instruments. However, many such instruments lack an available trading market, as characterized by a willing buyer and seller engaging in an exchange |
| | transaction. Therefore, the Company uses significant estimations and present value calculations to prepare this disclosure. Accordingly, the information presented below does not purport to represent the aggregate net fair value of the Company. |
| | Changes in the assumptions or methodologies used to estimate fair values may materially affect the estimated amounts. Also, management is concerned that there may not be reasonable comparability between institutions due to the wide range of permitted assumptions and methodologies in the absence of active markets. This lack of uniformity gives rise to a high degree of subjectivity in estimating financial instrument fair values. |
| | Estimated fair values have been determined by the Company using the best available data and an estimation methodology suitable for each category of financial institutions. The estimation methodologies used, the estimated fair values, and recorded book balances at December 31, 2006 and 2005 are outlined below. For cash and due from banks, and federal funds sold, the recorded book value of approximately $28.6 million and $10.3 million approximates fair value at December 31, 2006 and 2005, respectively. |
| | The estimated fair values of investment securities are based on quoted market prices, if available. Estimated fair values are based on quoted market prices of comparable instruments if quoted market prices are not available. The recorded value of loans held for sale is approximately $5.0 million and $15.4 million at December 31, 2006 and 2005, respectively, and approximates their fair value. |
| | The fair values of loans are estimated based on a discounted cash flow analysis using interest rates currently offered for loans with similar terms to borrowers of similar credit quality. |
| | 2006
| 2005
|
| Carrying
amount
| Estimated
Fair value
| Carrying
amount
| Estimated
Fair value
|
| Investment securities - held to maturity | $ 10,485 | $ 10,552 | $ 9,366 | $ 9,372 |
| Investment securities- available for sale | $ 38,914 | $ 38,914 | $ 31,899 | $ 31,899 |
| Loans held for sale | $ 5,003 | $ 5,087 | $ 15,380 | $ 15,586 |
| Loans, net of deferred fees | $192,435 | $191,617 | $167,147 | $166,963 |
| | The estimated fair values of demand deposits (i.e., interest and non-interest bearing checking accounts, passbook savings, and certain types of money market accounts) are, by definition, equal to the amount payable on demand at the reporting date (i.e., their carrying amounts). The carrying amounts of variable rate, fixed-term money market accounts, and certificates of deposit approximate their fair values at the reporting date. The fair values of fixed-rate certificates of deposit are estimated using a discounted cash flow calculation that applies interest rates currently being offered to a schedule of aggregated expected monthly time deposit maturities. |
| | 2006
| 2005
|
| | Carrying
amount
| Estimated
Fair value
| Carrying
amount
| Estimated
Fair value
|
| Time deposits | $35,616 | $35,415 | $20,731 | $20,462 |
| | The fair values of fixed-rate Federal Home Loan Bank borrowings are estimated using a discounted cash flow calculation that applies interest rates currently being offered to a schedule of aggregated expected monthly Federal Home Loan borrowings maturities. |
| | 2006
| 2005
|
| Carrying
amount
| Estimated
Fair value
| Carrying
amount
| Estimated
Fair value
|
| Federal Home Loan Bank Borrowings | $0 | $0 | $10,600 | $10,603 |
| | The fair value of commitments to extend credit is estimated based on the amount of unamortized deferred loan commitment fees. The fair value of letters of credit is based on the amount of unearned fees plus the estimated costs to terminate the letters of credit. Fair values of unrecognized financial instruments including commitments to extend credit and the fair value of letters of credit are considered immaterial. |
NOTE 16 - PARENT COMPANY ONLY
| | The following information on the parent only financial statements as of December 31, 2006 and 2005 and for the years ended December 31, 2006, 2005 and 2004 should be read in conjunction with the notes to the consolidated financial statements (in thousands). |
Statements of Financial Condition
| | | 2006 | | 2005 | |
|
| |
| |
| Assets: | |
| Cash and due from subsidiaries | | $ 14,591 | | $ 4,448 | |
| Investment in subsidiaries | | 23,199 | | 20,857 | |
| Other assets | | 106 | | — | |
|
| |
| |
| Total assets | | $ 37,896 | | $ 25,305 | |
|
| |
| |
| Liabilities: | |
| Other liabilities | | $ — | | $ — | |
|
| |
| |
| Stockholders’ equity: | |
| Common stock | | 35,074 | | 24,389 | |
| Other comprehensive loss, net of taxes | | (186 | ) | (307 | ) |
| Retained earnings | | 3,008 | | 1,223 | |
|
| |
| |
| Total stockholders’ equity | | 37,896 | | 25,305 | |
|
| |
| |
| Total liabilities and stockholders’ equity | | $ 37,896 | | $ 25,305 | |
|
| |
| |
| | The following information on the parent only operating statements and cash flows as of December 31, 2006, 2005 and 2004 and for the years then ended should be read in conjunction with the notes to the consolidated financial statements (in thousands). |
Statements of Operations
| | | 2006 | | 2005 | | 2004 | |
|
| |
| |
| |
| Equity in undistributed income of subsidiaries | | $ 2,221 | | $ 2,125 | | $ 1,359 | |
|
| |
| |
| |
| Other expenses | | 23 | | 10 | | — | |
|
| |
| |
| |
| Net income | | $ 2,198 | | $ 2,115 | | $ 1,359 | |
|
| |
| |
| |
| Statements of Cash Flows | |
| | |
| Cash flows from operating activities: | |
| Net income | | $ 2,198 | | $ 2,115 | | $ 1,359 | |
| Equity in undistributed income of | |
| the subsidiaries | | (2,221 | ) | (2,125 | ) | (1,359 | ) |
| Increase in other assets | | (106 | ) | — | | — | |
| Decrease in other liabilities | | — | | — | | — | |
|
| |
| |
| |
| Net cash used in operating activities | | (129 | ) | (10 | ) | — | |
|
| |
| |
| |
| Cash flows from financing activities: | |
| Proceeds from sale of stock, net | | 10,685 | | 509 | | 88 | |
| Cash dividend paid | | (413 | ) | (126 | ) | — | |
|
| |
| |
| |
| Net cash provided by financing activities | | 10,272 | | 383 | | 88 | |
|
| |
| |
| |
| Net change in cash for the period | | 10,143 | | 373 | | 88 | |
| Net cash at beginning of year | | 4,448 | | 4,075 | | 3,987 | |
|
| |
| |
| |
| Net cash at end of year | | $ 14,591 | | $ 4,448 | | $ 4,075 | |
|
| |
| |
| |
NOTE 17 - QUARTERLY FINANCIAL DATA (unaudited)
Selected Consolidated Quarterly Financial Data
2006 Quarter Ended,
(In thousands, except per share data) | March 31,
| | June 30,
| | September 30,
| | December 31,
| |
| Total interest income | $3,551 | | $3,828 | | $4,126 | | $4,277 | |
| Total interest expense | 1,226 | | 1,388 | | 1,689 | | 1,751 | |
|
| |
| |
| |
| |
| Net interest income | 2,325 | | 2,440 | | 2,437 | | 2,526 | |
| Provision for loan losses | 76 | | 50 | | 75 | | — | |
|
| |
| |
| |
| |
| Net interest income after provision for loan loss | 2,249 | | 2,390 | | 2,362 | | 2,526 | |
| Other income | 656 | | 528 | | 841 | | 844 | |
| Other expenses | 2,160 | | 2,178 | | 2,334 | | 2,350 | |
|
| |
| |
| |
| |
| Income before income taxes | 745 | | 740 | | 869 | | 1,020 | |
| Income tax expense | 270 | | 255 | | 296 | | 355 | |
|
| |
| |
| |
| |
| Net income | $ 475 | | $ 485 | | $ 573 | | $ 665 | |
|
| |
| |
| |
| |
| (1)Net income - Basic | $ 0.14 | | $ 0.14 | | $ 0.15 | | $ 0.15 | |
|
| |
| |
| |
| |
| (1)Net income - Diluted | $ 0.11 | | $ 0.11 | | $ 0.13 | | $ 0.14 | |
|
| |
| |
| |
| |
| | | | | |
2005 Quarter Ended,
(In thousands, except per share data) | March 31,
| | June 30,
| | September 30,
| | December 31,
| |
| | | | | | | | | |
| Total interest income | $2,342 | | $2,683 | | $3,105 | | $ 3,475 | |
| Total interest expense | 578 | | 705 | | 897 | | 1,014 | |
|
| |
| |
| |
| |
| Net interest income | 1,764 | | 1,978 | | 2,208 | | 2,461 | |
| Provision for loan losses | — | | 57 | | 192 | | 143 | |
|
| |
| |
| |
| |
| Net interest income after provision for loan loss | 1,764 | | 1,921 | | 2,016 | | 2,318 | |
| Other income | 581 | | 700 | | 849 | | 809 | |
| Other expenses | 2,033 | | 2,073 | | 2,135 | | 2,173 | |
| |
| |
| |
| |
| |
| Income before income taxes | 312 | | 548 | | 730 | | 954 | |
| Income tax expense (benefit) | 50 | | 203 | | 273 | | (97 | ) |
|
| |
| |
| |
| |
| Net income | $ 262 | | $ 345 | | $ 457 | | $ 1,051 | |
|
| |
| |
| |
| |
| (1)Net income - Basic | $ 0.07 | | $ 0.10 | | $ 0.13 | | $ 0.31 | |
|
| |
| |
| |
| |
| (1)Net income - Diluted | $ 0.06 | | $ 0.09 | | $ 0.12 | | $ 0.27 | |
|
| |
| |
| |
| |
| | | | | | | | |
| (1) | | The earnings per share quoted above have been adjusted to reflect the 5% stock dividend declared in April 2005 and paid in June 2005 and stock dividend declared in April 2006 and paid in May 2006. |
SIGNATURES
Pursuant to the requirements of Section 13 or 15(d) of the Securities Exchange Act of 1934, the Registrant has duly caused this report to be signed on its behalf by the undersigned, thereunto duly authorized in the Borough of Bernardsville, State of New Jersey, on March 21, 2007.
| | By:/s/ Stewart E. McClure, Jr.
Stewart E. McClure, Jr.
President, Chief Executive Officer
and Chief Operating Officer |
Pursuant to the requirements of the Securities Exchange Act of 1934, this report has been signed below by the following persons on behalf of the Registrant and in the capacities indicated below on March 21, 2007.
/s/ Stewart E. McClure, Jr.
Stewart E. McClure, Jr.
President, Chief Executive Officer, and Chief Operating
Officer
/s/ Gerard Riker
Gerard Riker
Executive Vice President and Chief Financial Officer
/s/ Edward B. Deutsch
Edward B. Deutsch
Chairman
/s/ Cornelius E. Golding
Cornelius E. Golding
Director
/s/ Jerome J. Graham, Jr.
Jerome J. Graham, Jr.
Director
/s/ Desmond V. Lloyd
Desmond V. Lloyd
Director
/s/ Paul F. Lozier
Paul F. Lozier
Director
/s/ Thomas J. Marino
Thomas J. Marino
Director
/s/ Thompson H. McDaniel
Thompson H. McDaniel
Director
/s/ Gerald B. O’Connor
Gerald B. O’Connor
Director
/s/ M. Gerald Sedam, II
M. Gerald Sedam, II
Director