UNITED STATES
SECURITIES AND EXCHANGE COMMISSION
Washington, D.C. 20549
FORM 10-Q
☑ QUARTERLY REPORT PURSUANT TO SECTION 13 OR 15(d) OF THE SECURITIES EXCHANGE ACT OF 1934
For the quarterly period ended December 31, 2024
or
☐ TRANSITION REPORT PURSUANT TO SECTION 13 OR 15(d) OF THE SECURITIES EXCHANGE ACT OF 1934
For the transition period from _______________________ to __________________________
Commission File Number 001-31921
Compass Minerals International, Inc.
(Exact name of registrant as specified in its charter)
| | | | | |
| Delaware | 36-3972986 |
(State or other jurisdiction of incorporation or organization) | (I.R.S. Employer
Identification Number) |
9900 West 109th Street
Suite 100
Overland Park, KS 66210
(913) 344-9200
(Address of principal executive offices, zip code and telephone number, including area code)
Securities registered pursuant to Section 12(b) of the Act:
| | | | | | | | | | | | | | |
| Title of each class | | Trading Symbol | | Name of each exchange on which registered |
| Common stock, $0.01 par value | | CMP | | The New York Stock Exchange |
| | | | | | | | | | | | | | |
| Indicate by check mark whether the registrant (1) has filed all reports required to be filed by Section 13 or 15(d) of the Securities Exchange Act of 1934 during the preceding 12 months (or for such shorter period that the registrant was required to file such |
| reports), and (2) has been subject to such filing requirements for the past 90 days. | Yes | ☑ | No | ☐ |
| | | | | | | | | | | | | | |
| Indicate by check mark whether the registrant has submitted electronically every Interactive Data File required to be submitted pursuant to Rule 405 of Regulation S-T (§232.405 of this chapter) during the preceding 12 months (or for such shorter period that |
| the registrant was required to submit such files). | Yes | ☑ | No | ☐ |
| | | | | | | | | | | | | | | | | | | | | | | |
| Indicate by check mark whether the registrant is a large accelerated filer, an accelerated filer, a non-accelerated filer, a smaller reporting company, or an emerging growth company. See the definitions of “large accelerated filer,” “accelerated filer,” “smaller reporting company,” and “emerging growth company” in Rule 12b-2 of the Exchange Act. |
| Large accelerated filer | ☐ | Accelerated filer | ☑ | Non-accelerated filer | ☐ | Smaller reporting company | ☐ |
| | | | | | Emerging growth company | ☐ |
| | | | | | | | | | | | | | |
| If an emerging growth company, indicate by check mark if the registrant has elected not to use the extended transition period for complying with any new or revised financial accounting standards provided pursuant to Section 13(a) of the Exchange Act. | ☐ |
| | | | |
| | | | | | | | | | | | | | |
| Indicate by check mark whether the registrant is a shell company (as defined in Rule 12b-2 of the Exchange Act). | Yes | ☐ | No | ☑ |
The number of shares outstanding of the registrant’s common stock, $0.01 par value per share, as of February 5, 2025, was 41,504,100 shares.
| | | | | | | | |
| | COMPASS MINERALS INTERNATIONAL, INC. |
TABLE OF CONTENTS
| | | | | | | | |
| PART I. FINANCIAL INFORMATION | Page |
| | |
| | |
| | |
| | |
| | |
| | |
| | |
| | |
| | |
| | |
| | |
| | |
| | |
| | |
| | |
| | |
| | |
| | |
| | |
| | |
| | |
| PART II. OTHER INFORMATION | |
| | |
| | |
| | |
| | |
| | |
| | |
| | |
| | |
| | |
| | |
| | |
| | |
| | |
| | |
| | |
| |
| | | | | | | | |
| | COMPASS MINERALS INTERNATIONAL, INC. |
PART I. FINANCIAL INFORMATION
Item 1. Financial Statements
CONSOLIDATED BALANCE SHEETS
(in millions, except share data)
| | | | | | | | | | | |
| (Unaudited) | | |
| | December 31,
2024 | | September 30,
2024 |
| ASSETS |
| Current assets: | | | |
| Cash and cash equivalents | $ | 45.8 | | | $ | 20.2 | |
| Receivables, less allowance for doubtful accounts of $3.1 and $3.6 at December 31, 2024 and September 30, 2024, respectively | 261.7 | | | 126.1 | |
| Inventories, less allowance of $14.5 and $11.4 at December 31, 2024 and September 30, 2024, respectively | 367.1 | | | 414.1 | |
| | | |
| Other current assets | 23.0 | | | 26.9 | |
| Total current assets | 697.6 | | | 587.3 | |
| Property, plant and equipment, net | 778.6 | | | 806.5 | |
| Intangible assets, net | 80.1 | | | 82.5 | |
| Goodwill | 5.8 | | | 6.0 | |
| | | |
| Other noncurrent assets | 158.8 | | | 157.8 | |
| Total assets | $ | 1,720.9 | | | $ | 1,640.1 | |
| | | |
| LIABILITIES AND STOCKHOLDERS’ EQUITY |
| Current liabilities: | | | |
| Current portion of long-term debt | $ | 8.7 | | | $ | 7.5 | |
| Accounts payable | 96.2 | | | 82.1 | |
| Accrued salaries and wages | 15.5 | | | 22.6 | |
| Income taxes payable | 6.0 | | | 13.1 | |
| Accrued interest | 6.0 | | | 13.3 | |
| | | |
| Accrued expenses and other current liabilities | 162.4 | | | 78.4 | |
| Total current liabilities | 294.8 | | | 217.0 | |
| Long-term debt, net of current portion | 965.7 | | | 910.0 | |
| Deferred income taxes, net | 56.0 | | | 56.5 | |
| Other noncurrent liabilities | 141.4 | | | 140.0 | |
Commitments and contingencies (Note 8) | | | |
| Stockholders’ equity: | | | |
| Common stock: $0.01 par value, 200,000,000 authorized shares; 42,197,964 issued shares at December 31, 2024 and September 30, 2024 | 0.4 | | | 0.4 | |
| Additional paid-in capital | 424.3 | | | 420.6 | |
| Treasury stock, at cost — 732,721 shares at December 31, 2024 and 816,013 shares at September 30, 2024 | (10.4) | | | (10.2) | |
| Retained (loss) earnings | (21.4) | | | 2.2 | |
| Accumulated other comprehensive loss | (129.9) | | | (96.4) | |
| Total stockholders’ equity | 263.0 | | | 316.6 | |
| Total liabilities and stockholders’ equity | $ | 1,720.9 | | | $ | 1,640.1 | |
The accompanying notes are an integral part of the consolidated financial statements.
| | | | | | | | |
| | COMPASS MINERALS INTERNATIONAL, INC. |
CONSOLIDATED STATEMENTS OF OPERATIONS
(Unaudited, in millions, except share and per share data)
| | | | | | | | | | | | | | | |
| | Three Months Ended
December 31, | | |
| | 2024 | | 2023 | | | | |
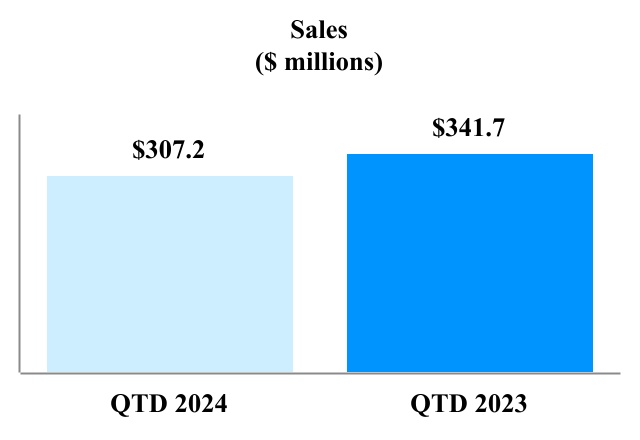
| Sales | $ | 307.2 | | | $ | 341.7 | | | | | |
| Shipping and handling cost | 80.6 | | | 91.3 | | | | | |
| Product cost | 192.3 | | | 179.3 | | | | | |
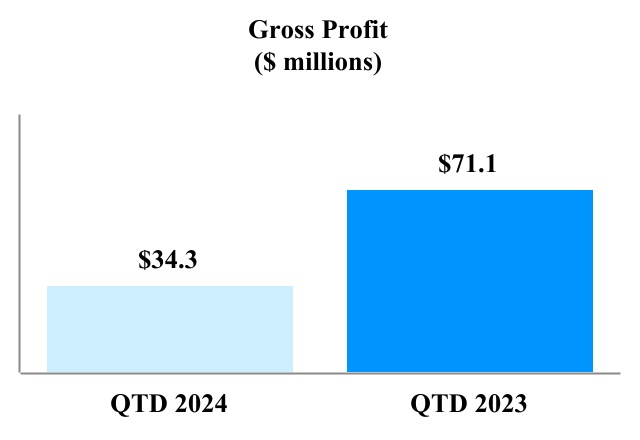
| Gross profit | 34.3 | | | 71.1 | | | | | |
| Selling, general and administrative expenses | 33.3 | | | 45.7 | | | | | |
| Loss on impairments | — | | | 74.8 | | | | | |
| Other operating expense | 0.5 | | | 4.2 | | | | | |
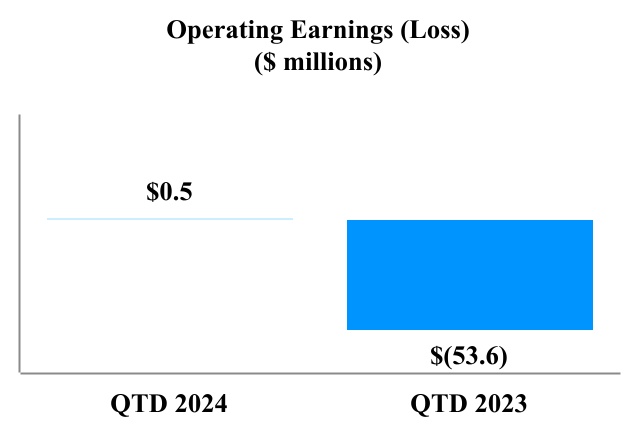
| Operating earnings (loss) | 0.5 | | | (53.6) | | | | | |
| | | | | | | |
| Other (income) expense: | | | | | | | |
| Interest income | (0.4) | | | (0.4) | | | | | |
| Interest expense | 16.9 | | | 15.9 | | | | | |
| (Gain) loss on foreign exchange | (5.2) | | | 1.9 | | | | | |
| | | | | | | |
| | | | | | | |
| Other expense, net | 3.1 | | | 0.7 | | | | | |
| Loss before income taxes | (13.9) | | | (71.7) | | | | | |
| Income tax expense | 9.7 | | | 3.6 | | | | | |
| Net loss | $ | (23.6) | | | $ | (75.3) | | | | | |
| | | | | | | |
| | | | | | | |
| | | | | | | |
| | | | | | | |
| | | | | | | |
| Basic net loss per common share | $ | (0.57) | | | $ | (1.83) | | | | | |
| | | | | | | |
| | | | | | | |
| | | | | | | |
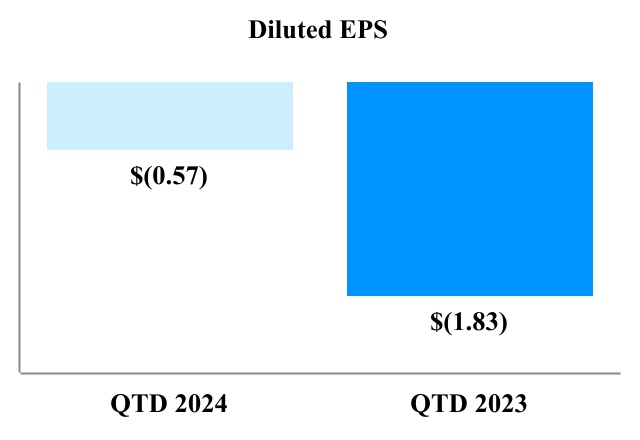
| Diluted net loss per common share | $ | (0.57) | | | $ | (1.83) | | | | | |
| | | | | | | |
| Weighted-average common shares outstanding (in thousands): | | | | | | | |
| Basic | 41,441 | | | 41,205 | | | | | |
| Diluted | 41,441 | | | 41,205 | | | | | |
The accompanying notes are an integral part of the consolidated financial statements.
| | | | | | | | |
| | COMPASS MINERALS INTERNATIONAL, INC. |
CONSOLIDATED STATEMENTS OF COMPREHENSIVE LOSS
(Unaudited, in millions)
| | | | | | | | | | | | | | | |
| | Three Months Ended
December 31, | | |
| | 2024 | | 2023 | | | | |
| Net loss | $ | (23.6) | | | $ | (75.3) | | | | | |
| Other comprehensive income (loss): | | | | | | | |
| Unrealized gain from change in pension obligations, net of tax of $(0.1) for the three months ended December 31, 2024 and 2023, respectively | 0.2 | | | 0.2 | | | | | |
| Unrealized loss from change in other postretirement benefits, net of tax of $0.0 for the three months ended December 31, 2024 and 2023 | (0.1) | | | — | | | | | |
| Unrealized loss on cash flow hedges, net of tax of $0.0 for the three months ended December 31, 2024 and 2023, respectively | (0.3) | | | (1.8) | | | | | |
| Cumulative translation adjustment | (33.3) | | | 14.6 | | | | | |
| Comprehensive loss | $ | (57.1) | | | $ | (62.3) | | | | | |
The accompanying notes are an integral part of the consolidated financial statements.
| | | | | | | | |
| | COMPASS MINERALS INTERNATIONAL, INC. |
CONSOLIDATED STATEMENTS OF STOCKHOLDERS’ EQUITY
For the three months ended December 31, 2024 and 2023
(Unaudited, in millions)
| | | | | | | | | | | | | | | | | | | | | | | | | | | | | | | | | | | |
| | Common
Stock | | Additional
Paid-In
Capital | | Treasury
Stock | | Retained Earnings (Loss) | | Accumulated
Other
Comprehensive
Loss | | Total |
| Balance, September 30, 2024 | $ | 0.4 | | | $ | 420.6 | | | $ | (10.2) | | | $ | 2.2 | | | $ | (96.4) | | | $ | 316.6 | |
| Comprehensive loss | — | | | — | | | — | | | (23.6) | | | (33.5) | | | (57.1) | |
| | | | | | | | | | | |
| Shares issued for stock units, net of shares withheld for taxes | — | | | (0.2) | | | (0.2) | | | — | | | — | | | (0.4) | |
| | | | | | | | | | | |
| Stock-based compensation | — | | | 3.9 | | | — | | | — | | | — | | | 3.9 | |
| Balance, December 31, 2024 | $ | 0.4 | | | $ | 424.3 | | | $ | (10.4) | | | $ | (21.4) | | | $ | (129.9) | | | $ | 263.0 | |
| | | | | | | | | | | |
| | | | | | | | | | | |
| | | | | | | | | | | |
| | | | | | | | | | | |
| | | | | | | | | | | |
| | | | | | | | | | | |
| | | | | | | | | | | |
| | | | | | | | | | | |
| | | | | | | | | | | |
| | | | | | | | | | | |
| | | | | | | | | | | |
| | | | | | | | | | | | | | | | | | | | | | | | | | | | | | | | | | | |
| | Common
Stock | | Additional
Paid-In
Capital | | Treasury
Stock | | Retained
Earnings | | Accumulated
Other
Comprehensive
Loss | | Total |
| Balance, September 30, 2023 | $ | 0.4 | | | $ | 413.1 | | | $ | (8.7) | | | $ | 220.9 | | | $ | (104.7) | | | $ | 521.0 | |
| Comprehensive (loss) income | — | | | — | | | — | | | (75.3) | | | 13.0 | | | (62.3) | |
| Dividends on common stock ($0.15 per share) | — | | | — | | | — | | | (6.4) | | | — | | | (6.4) | |
| Shares issued for stock units, net of shares withheld for taxes | — | | | (0.2) | | | (0.6) | | | — | | | — | | | (0.8) | |
| | | | | | | | | | | |
| Stock-based compensation | — | | | 11.9 | | | — | | | — | | | — | | | 11.9 | |
| Balance, December 31, 2023 | $ | 0.4 | | | $ | 424.8 | | | $ | (9.3) | | | $ | 139.2 | | | $ | (91.7) | | | $ | 463.4 | |
| | | | | | | | | | | |
| | | | | | | | | | | |
| | | | | | | | | | | |
| | | | | | | | | | | |
| | | | | | | | | | | |
| | | | | | | | | | | |
| | | | | | | | | | | |
| | | | | | | | | | | |
| | | | | | | | | | | |
The accompanying notes are an integral part of the consolidated financial statements.
| | | | | | | | |
| | COMPASS MINERALS INTERNATIONAL, INC. |
CONSOLIDATED STATEMENTS OF CASH FLOWS
(Unaudited, in millions)
| | | | | | | | | | | |
| | Three Months Ended
December 31, |
| | 2024 | | 2023 |
| Cash flows from operating activities: | | | |
| Net loss | $ | (23.6) | | | $ | (75.3) | |
| Adjustments to reconcile net loss to net cash flows provided by operating activities: | | | |
| Depreciation, depletion and amortization | 26.8 | | | 25.5 | |
| Amortization of deferred financing costs | 0.8 | | | 0.6 | |
| | | |
| Stock-based compensation | 3.9 | | | 11.9 | |
| Deferred income taxes | 2.7 | | | 0.6 | |
| Unrealized foreign exchange (gain) loss | (5.7) | | | 1.7 | |
| Loss on impairments | — | | | 74.8 | |
| | | |
| | | |
| | | |
| Other, net | (0.9) | | | 1.5 | |
| Changes in operating assets and liabilities: | | | |
| Receivables | (61.3) | | | (37.6) | |
| Inventories | 39.1 | | | 7.8 | |
| Other assets | (2.0) | | | 4.0 | |
| Accounts payable and accrued expenses and other current liabilities | 9.1 | | | (65.4) | |
| Other liabilities | 7.0 | | | (2.4) | |
| Net cash used in operating activities | (4.1) | | | (52.3) | |
| Cash flows from investing activities: | | | |
| Capital expenditures | (21.8) | | | (48.6) | |
| | | |
| | | |
| | | |
| Other, net | (0.4) | | | (0.7) | |
| Net cash used in investing activities | (22.2) | | | (49.3) | |
| Cash flows from financing activities: | | | |
| Proceeds from revolving credit facility borrowings | 140.3 | | | 102.4 | |
| Principal payments on revolving credit facility borrowings | (100.8) | | | (31.5) | |
| Proceeds from issuance of long-term debt | 19.6 | | | 38.4 | |
| Principal payments on long-term debt | (1.6) | | | (1.2) | |
| | | |
| | | |
| Dividends paid | — | | | (6.4) | |
| Deferred financing costs | (2.4) | | | — | |
| | | |
| Shares withheld to satisfy employee tax obligations | (0.4) | | | (0.8) | |
| Other, net | (1.6) | | | — | |
| Net cash provided by financing activities | 53.1 | | | 100.9 | |
| Effect of exchange rate changes on cash and cash equivalents | (1.2) | | | 0.3 | |
| Net change in cash and cash equivalents | 25.6 | | | (0.4) | |
| Cash and cash equivalents, beginning of the year | 20.2 | | | 38.7 | |
| Cash and cash equivalents, end of period | $ | 45.8 | | | $ | 38.3 | |
| | | |
| | | |
| | | |
| | | |
| | | | | | | | | | | |
| Supplemental cash flow information: | | | |
| Interest paid, net of amounts capitalized | $ | 23.4 | | | $ | 23.6 | |
| Income taxes paid, net of refunds | $ | 8.0 | | | $ | 12.8 | |
| Net change to property, plant and equipment through accounts payable and accrued expenses and other current liabilities | $ | 9.0 | | | $ | 17.7 | |
The accompanying notes are an integral part of the consolidated financial statements.
| | | | | | | | |
| | COMPASS MINERALS INTERNATIONAL, INC. |
NOTES TO CONSOLIDATED FINANCIAL STATEMENTS
(Unaudited)
1. Accounting Policies and Basis of Presentation:
Compass Minerals International, Inc. (“CMI”), through its subsidiaries (collectively, the “Company”), is a leading global provider of essential minerals focused on safely delivering where and when it matters to help solve nature’s challenges for customers and communities. The Company’s salt products help keep roadways safe during winter weather and are used in numerous other consumer, industrial, chemical and agricultural applications. Its plant nutrition business is the leading North American producer of sulfate of potash (“SOP”), which is used in the production of specialty fertilizers for high-value crops and turf and helps improve the quality and yield of crops, while supporting sustainable agriculture. The Company’s principal products are salt, consisting of sodium chloride and magnesium chloride, and SOP. The Company is also working to develop long-term fire-retardant solutions to help combat wildfires. The Company’s production sites are located in the United States (“U.S.”), Canada and the United Kingdom (“U.K.”). The Company also provides records management services in the U.K. Except where otherwise noted, references to North America include only the continental U.S. and Canada, and references to the U.K. include only England, Scotland and Wales. References to “Compass Minerals,” “our,” “us” and “we” refer to CMI and its consolidated subsidiaries.
CMI is a holding company with no significant operations other than those of its wholly-owned subsidiaries. The consolidated financial statements include the accounts of CMI and its wholly-owned domestic and foreign subsidiaries. All significant intercompany balances and transactions have been eliminated in consolidation.
The accompanying unaudited consolidated financial statements have been prepared in accordance with U.S. generally accepted accounting principles (“U.S. GAAP”) for interim financial information and with the instructions to Form 10-Q and Article 10 of Regulation S-X. Accordingly, they do not include all of the information and footnotes required by U.S. GAAP for complete consolidated financial statements. These unaudited consolidated financial statements should be read in conjunction with the consolidated financial statements of the Company for the annual period ended September 30, 2024, as filed with the Securities and Exchange Commission (the “SEC”) in its Annual Report on Form 10-K on December 16, 2024 (“2024 Form 10-K”). In the opinion of management, all adjustments, consisting of normal recurring adjustments considered necessary for a fair presentation, have been included.
The Company experiences a substantial amount of seasonality in its sales, including its salt deicing product sales. Consequently, Salt segment sales and operating income are generally higher in the first and second fiscal quarters (ending December 31 and March 31) and lower during the third and fourth fiscal quarters (ending June 30 and September 30). In particular, sales of highway and consumer deicing salt and magnesium chloride products vary based on the severity of the winter conditions in areas where the products are used. Following industry practice in North America and the U.K., the Company seeks to stockpile sufficient quantities of deicing salt throughout the first, third and fourth fiscal quarters (ending December 31, June 30 and September 30) to meet the estimated requirements for the winter season. Production of deicing salt can also vary based on the severity or mildness of the preceding winter season. Due to the seasonal nature of the deicing product lines, operating results for the interim periods are not necessarily indicative of the results that may be expected for the full fiscal year. The Company’s plant nutrition business is also seasonal. As a result, the Company and its customers generally build inventories during the plant nutrition business’ low demand periods of the year (which are typically winter and summer, but can vary due to weather and other factors) to ensure timely product availability during the peak sales seasons (which are typically spring and autumn, but can also vary due to weather and other factors). Lastly, any expected results of the Company’s fire retardant business are also seasonal with peak demand for fire retardant products and services occurring from June through September. The Company does not yet have a contract for fiscal 2025.
Significant Accounting Policies
The Company’s significant accounting policies are detailed in “Note 2 – Summary of Significant Accounting Policies” within Part II, Item 8 of its 2024 Form 10-K. There were no material changes in the Company’s significant accounting policies from those described in its 2024 Form 10-K.
Recent Accounting Pronouncements
In November 2023, the Financial Accounting Standards Board (“FASB”) issued Accounting Standards Update (“ASU”) 2023-07, “Segment Reporting (Topic 280): Improvements to Reportable Segment Disclosures”, which updates reportable segment disclosure requirements primarily to include enhanced disclosures about significant segment expenses. The amendments are effective for fiscal years beginning after December 15, 2023, and for interim periods within fiscal years
| | | | | | | | |
| | COMPASS MINERALS INTERNATIONAL, INC. |
beginning after December 15, 2024. Early adoption is permitted. The amendments should be applied retrospectively to all prior periods presented in the financial statements. Management is currently evaluating this ASU to determine its impact on the Company's disclosures.
In December 2023, the FASB issued ASU 2023-09, “Income Taxes (Topic 740): Improvements to Income Tax Disclosures”, which updates income tax disclosures by requiring consistent categories and additional disaggregation of information in the rate reconciliation and income taxes paid by jurisdiction. The amendments are effective for fiscal years beginning after December 15, 2024. Early adoption is permitted. The amendments should be applied prospectively; however, retrospective application is permitted. Management is currently evaluating this ASU to determine its impact on the Company’s disclosures.
In November 2024, the FASB issued amended guidance related to disclosure of disaggregated expenses (“ASU 2024-03”). This amendment requires public business entities to provide detailed disclosures in the notes to financial statements disaggregating specific expense categories, including employee compensation, depreciation, and intangible asset amortization, as well as certain other disclosures to provide enhanced transparency into the nature and function of expenses. This new guidance is effective for annual periods beginning in the Company’s fiscal 2028 and interim periods following annual adoption, with early adoption permitted. This guidance will be applied on a prospective basis with retrospective application permitted. Management is currently evaluating this ASU to determine its impact on the Company’s disclosures.
2. Revenues:
Deferred Revenue
Deferred revenue represents collections under non-cancellable contracts before the related product or service is transferred to the customer. The portion of deferred revenue that is anticipated to be recognized as revenue during the succeeding twelve-month period is recorded in accrued expenses and other current liabilities on the Consolidated Balance Sheets. Deferred revenue as of both December 31, 2024 and September 30, 2024 was approximately $3.6 million.
See Note 9 for a disaggregation of sales by segment, type and geographical region.
3. Inventories:
Inventories consist of the following (in millions):
| | | | | | | | | | | |
| | December 31,
2024 | | September 30,
2024 |
| Finished goods | $ | 286.8 | | | $ | 336.5 | |
| Work in process | 6.4 | | | 6.4 | |
Raw materials and supplies(a) | 73.9 | | | 71.2 | |
| Total inventories | $ | 367.1 | | | $ | 414.1 | |
| | | |
| | | |
(a)Excludes certain raw materials and supplies of $41.1 million and $42.2 million as of December 31, 2024 and September 30, 2024, respectively, that are not expected to be consumed within the next twelve months, included in Other noncurrent assets in the Consolidated Balance Sheets.
| | | | | | | | |
| | COMPASS MINERALS INTERNATIONAL, INC. |
4. Property, Plant and Equipment, Net:
Property, plant and equipment, net, consists of the following (in millions):
| | | | | | | | | | | |
| | December 31,
2024 | | September 30,
2024 |
| Land, buildings and structures, and leasehold improvements | $ | 550.2 | | | $ | 559.8 | |
| Machinery and equipment | 1,120.2 | | | 1,149.5 | |
| Office furniture and equipment | 23.9 | | | 24.1 | |
| Mineral interests | 166.5 | | | 170.4 | |
| Construction in progress | 57.5 | | | 56.0 | |
| | 1,918.3 | | | 1,959.8 | |
| Less: accumulated depreciation and depletion | (1,139.7) | | | (1,153.3) | |
| Property, plant and equipment, net | $ | 778.6 | | | $ | 806.5 | |
5. Goodwill and Intangible Assets:
Changes in the carrying amount of goodwill are summarized as follows (in millions):
| | | | | | | | | | | | |
| | | | Corporate & Other | | |
| Balance as of September 30, 2024 | | | | $ | 6.0 | | | |
| Foreign currency translation adjustment | | | | (0.2) | | | |
| Balance as of December 31, 2024 | | | | $ | 5.8 | | | |
6. Income Taxes:
The Company’s effective income tax rate differs from the U.S. statutory federal income tax rate primarily due to U.S. statutory depletion, state income taxes (net of federal tax benefit), nondeductible executive compensation over $1 million, foreign income, mining and withholding taxes, base erosion and anti-abuse tax, and valuation allowances recorded on deferred tax assets.
The effective tax rates applied to the three months ended December 31, 2024 were determined by excluding the U.S. losses from the overall estimated annual effective tax rate computations and a separate estimated annual effective tax rate was computed and applied to the ordinary U.S. losses.
Management assesses the available positive and negative evidence to estimate whether sufficient future taxable income will be generated to permit use of the existing deferred tax assets. A significant piece of objective negative evidence evaluated was the cumulative loss incurred in the U.S. over the three-year period ended December 31, 2024. Such objective evidence limits the ability to consider other subjective evidence, such as the Company’s projections for future income. On the basis of this evaluation, during the three months ended December 31, 2024, an additional valuation allowance of $9.5 million has been recorded to recognize only the portion of the U.S. deferred tax assets that is more likely than not to be realized. The amount of the deferred tax assets considered realizable, however, could be adjusted if objective negative evidence in the form of cumulative losses is no longer present and additional weight is given to subjective evidence such as the Company’s projections for income.
As of December 31, 2024 and September 30, 2024, the Company had $78.4 million and $76.4 million, respectively of gross federal NOL carryforwards that have no expiration date and $6.6 million and $6.1 million at December 31, 2024 and September 30, 2024, respectively of net operating tax-effected state NOL carryforwards which expire beginning in 2031.
Canadian provincial tax authorities have challenged tax positions claimed by one of the Company’s Canadian subsidiaries and have issued tax reassessments for fiscal years 2002-2019. The reassessments are a result of ongoing audits and total $192.8 million, including interest, through December 31, 2024. The Company disputes these reassessments and will continue to work with the appropriate authorities in Canada to resolve the dispute. There is a reasonable possibility that the ultimate resolution of this dispute, and any related disputes for other open tax years, may be materially higher or lower than the amounts the Company has reserved for such disputes. In connection with this dispute, local regulations require the Company to post security with the tax authority until the dispute is resolved. The Company has posted collateral in the form of a $152.3 million performance bond
| | | | | | | | |
| | COMPASS MINERALS INTERNATIONAL, INC. |
and has paid $34.6 million to the Canadian tax authorities (most of which is recorded in other assets in the Consolidated Balance Sheets at December 31, 2024, and September 30, 2024), which is necessary to proceed with future appeals or litigation.
The Company expects that it will be required by local regulations to provide security for additional interest on the above unresolved disputed amounts and for any future reassessments issued by these Canadian tax authorities in the form of cash, letters of credit, performance bonds, asset liens or other arrangements agreeable with the tax authorities until the disputes are resolved.
The Company expects that the ultimate outcome of these matters will not have a material impact on its results of operations or financial condition. However, the Company can provide no assurance as to the ultimate outcome of these matters, and the impact could be material if they are not resolved in the Company’s favor. As of December 31, 2024, the Company believes it has adequately reserved for these reassessments.
Additionally, the Company has other uncertain tax positions as well as assessments and disputed positions with taxing authorities in its various jurisdictions, which are consistent with those matters disclosed in the Company’s 2024 Form 10-K.
7. Long-Term Debt:
Long-term debt consists of the following (in millions):
| | | | | | | | | | | |
| | December 31,
2024 | | September 30,
2024 |
| 6.75% Senior Notes due December 2027 | $ | 500.0 | | | $ | 500.0 | |
| Term Loan due May 2028 | 192.5 | | | 193.8 | |
| Revolving Credit Facility due May 2028 | 229.6 | | | 190.1 | |
| AR Securitization Facility expires March 2027 | 58.2 | | | 38.9 | |
| 980.3 | | | 922.8 | |
| Less unamortized debt issuance costs | (5.9) | | | (5.3) | |
| Total debt | 974.4 | | | 917.5 | |
| Less current portion | (8.7) | | | (7.5) | |
| Long-term debt | $ | 965.7 | | | $ | 910.0 | |
| | | |
| | | |
| | | |
On December 12, 2024, the Company entered into an amendment to its 2023 Credit Agreement, which, among other things, eased the restrictions of certain covenants contained in the agreement. The amendment included increasing the maximum allowed consolidated total net leverage ratio (as defined and calculated under the terms of the amended 2023 Credit Agreement) to 6.5x as of the last day of any quarter through the fiscal quarter ended September 30, 2025, then gradually stepping down to 4.50x for the fiscal quarter ended December 31, 2026 and thereafter. The amendment also decreased the Revolving Commitments (as defined in the Existing Credit Agreement) from $375 million to $325 million with additional reductions stepping down to $250 million on July 1, 2026. In connection with this amendment, the Company paid fees totaling $2.0 million which were capitalized as deferred financing costs. Additional arrangement and legal fees of $1.0 million were expensed as of December 31, 2024.
As of December 31, 2024, the term loan and revolving credit facility under the 2023 Credit Agreement were secured by substantially all existing and future U.S. assets of the Company, the Goderich mine in Ontario, Canada and capital stock of certain subsidiaries. As of December 31, 2024 and September 30, 2024, the weighted average interest rate on all borrowings outstanding under the 2023 Credit Agreement was approximately 7.3% and 7.7%, respectively. Depending on the type, borrowings under the 2023 Credit Agreement accrue interest at a rate per annum equal to the Adjusted Term SOFR Rate, the Adjusted EURIBO Rate, Prime Rate or the CDO Rate (as defined in the credit agreement), as applicable, plus Applicable Margins (as defined in the credit agreement) which resulted in interest rates between 7.2% and 7.6% as of December 31, 2024, and 7.3% and 9.5% as of September 30, 2024.
Outstanding letters of credit totaling $14.9 million as of December 31, 2024 further reduced available borrowing capacity under the Company’s $325 million revolving credit facility to $80.5 million. The 2023 Credit Agreement requires the Company to maintain certain financial ratios, including a minimum interest coverage ratio and a maximum total net leverage ratio. The Company was in compliance as of December 31, 2024 with its debt covenants under the 2023 Credit Agreement and its AR Securitization Facility. The consolidated total net leverage ratio represents the ratio of (a) consolidated total net debt to (b)
| | | | | | | | |
| | COMPASS MINERALS INTERNATIONAL, INC. |
consolidated adjusted earnings before interest, taxes, depreciation and amortization. Consolidated total net debt includes the aggregate principal amount of total debt, net of unrestricted cash not to exceed $75.0 million.
8. Commitments and Contingencies:
On October 21, 2022, a putative securities class was filed in the United States District Court for the District of Kansas. The lawsuit alleges that the Company and certain former executives of the Company made misleading statements and that shareholders were damaged by these statements. Plaintiffs filed an Amended Complaint on March 13, 2023; the Company filed
a Motion to Dismiss on May 12, 2023. On December 12, 2023, the court granted and denied in part the Company’s Motion to Dismiss. On December 29, 2023, the Company filed a request for an interlocutory appeal and a request for a stay of discovery. On March 15, 2024, the Court denied the Company’s request for an interlocutory appeal. The parties participated in a mediation on November 19, 2024; the parties did not resolve the matter at mediation. On February 7, 2024, the parties reached an agreement in principle to resolve the matter and filed a motion to stay discovery. The agreement is preliminary and subject to final documentation, preliminary court approval and final approval after a court hearing. At this time, based on currently available information and its applicable insurance coverage, the Company believes any settlement to be paid will be covered by insurance and does not believe any losses will have a material adverse effect on its results of operations or cash flows in future periods. Additionally, the Company has recorded an estimated liability and estimated insurance recoveries in its Consolidated Balance Sheets as of December 31, 2024.
On February 1, 2023, a shareholder derivative lawsuit was filed in the District of Kansas by an individual shareholder, purportedly on behalf of the Company. The lawsuit alleges that certain directors and executives breached their fiduciary duties to shareholders by failing to prevent the dissemination of misstatements and omissions from October 30, 2017, to November 18, 2018. The parties have stipulated to stay this matter through the discovery stage of the putative securities class action. On October 30, 2024, an additional shareholder derivative lawsuit was filed in the District of Kansas by an individual shareholder, purportedly on behalf of the Company. The lawsuit alleges that certain directors and executives breached their fiduciary duties to shareholders by willfully or recklessly causing the Company to make false and/or misleading statements and/or omissions of material fact from October 31, 2017, to October 21, 2022.
The Company is also involved in legal and administrative proceedings and claims of various types from the ordinary course of the Company’s business.
Management cannot predict the outcome of legal claims and proceedings with certainty. Nevertheless, management believes that the outcome of legal proceedings and claims, which are pending or known to be threatened, even if determined adversely, will not, individually or in the aggregate, have a material adverse effect on the Company’s results of operations, cash flows or financial position, except as otherwise described in Note 6 and this Note 8.
The Company also has contingent consideration liabilities related to the Fortress North America, LLC (“Fortress”) acquisition. Refer to Note 12 for additional information.
On October 25, 2024, the Company issued a recall for nine production lots of food-grade salt produced at its Goderich Plant following a customer report of a non-organic, foreign material in its product. The products recalled included both products sold prior and subsequent to September 30, 2024. The Company followed recall protocol and notified its BRCGS Global Standard for Food Safety certifying body, the Canadian Food Inspection Agency (“CFIA”) and the U.S. Food and Drug Administration (“FDA”). The Company has been working to obtain and assess the reported foreign material, complete the necessary investigation, and determine the next steps. For the three months ended December 31, 2024, the Company recognized $0.9 million for costs related to the recall on the Consolidated Statements of Operations, a portion of which the Company believes is reimbursable by insurance. Additionally, as of December 31, 2024, the Company has recorded a liability of $35.0 million and estimated insurance recoveries of $35.0 million in its Consolidated Balance Sheets associated with customer claims.
The Company continues to assess the scope and magnitude of additional customer claims. At this time, based on currently available information and its applicable insurance coverage, the Company does not believe any incremental losses will have a material adverse effect on its results of operations or cash flows in future periods.
| | | | | | | | |
| | COMPASS MINERALS INTERNATIONAL, INC. |
9. Operating Segments:
The Company’s reportable segments are strategic business units that offer different products and services, and each business requires different technology and marketing strategies. For the three months ended December 31, 2024 and 2023, the Company has presented two reportable segments in its Consolidated Financial Statements: Salt and Plant Nutrition. The Salt segment produces and markets salt, consisting of sodium chloride and magnesium chloride, for use in road deicing for winter roadway safety and for dust control, food processing, water softening and other consumer, agricultural and industrial applications. The Plant Nutrition segment produces and markets various grades of SOP. The results of operations for the Company’s fire retardant and records management businesses are included in Corporate and Other in the tables below.
Segment information is as follows (in millions):
| | | | | | | | | | | | | | | | | | | | | | | | | | |
| Three Months Ended December 31, 2024 | | Salt | | Plant
Nutrition | | Corporate & Other(a) | | Total |
| Sales to external customers | | $ | 242.2 | | | $ | 61.4 | | | $ | 3.6 | | | $ | 307.2 | |
| Intersegment sales | | — | | | 3.2 | | | (3.2) | | | — | |
| Shipping and handling cost | | 71.3 | | | 9.3 | | | — | | | 80.6 | |
Operating earnings (loss)(b) | | 29.4 | | | (3.1) | | | (25.8) | | | 0.5 | |
| Depreciation, depletion and amortization | | 17.5 | | | 7.5 | | | 1.8 | | | 26.8 | |
| Total assets (as of end of period) | | 1,092.4 | | | 388.1 | | | 240.4 | | | 1,720.9 | |
| | | | | | | | | | | | | | | | | | | | | | | | | | |
| Three Months Ended December 31, 2023 | | Salt | | Plant
Nutrition | | Corporate & Other(a) | | Total |
| Sales to external customers | | $ | 274.3 | | | $ | 49.7 | | | $ | 17.7 | | | $ | 341.7 | |
| Intersegment sales | | — | | | 3.1 | | | (3.1) | | | — | |
| Shipping and handling cost | | 83.7 | | | 7.0 | | | 0.6 | | | 91.3 | |
Operating earnings (loss)(b)(c) | | 50.9 | | | (2.3) | | | (102.2) | | | (53.6) | |
| Depreciation, depletion and amortization | | 15.2 | | | 8.4 | | | 1.9 | | | 25.5 | |
| Total assets (as of end of period) | | 1,056.6 | | | 469.7 | | | 278.9 | | | 1,805.2 | |
Disaggregated revenue by product type is as follows (in millions):
| | | | | | | | | | | | | | | | | | | | | | | | | | |
| Three Months Ended December 31, 2024 | | Salt | | Plant
Nutrition | | Corporate & Other(a) | | Total |
| Highway Deicing Salt | | $ | 138.1 | | | $ | — | | | $ | — | | | $ | 138.1 | |
| Consumer & Industrial Salt | | 104.1 | | | — | | | — | | | 104.1 | |
| | | | | | | | |
| | | | | | | | |
| SOP | | — | | | 64.6 | | | — | | | 64.6 | |
| | | | | | | | |
| | | | | | | | |
| Eliminations & Other | | — | | | (3.2) | | | 3.6 | | | 0.4 | |
| Sales to external customers | | $ | 242.2 | | | $ | 61.4 | | | $ | 3.6 | | | $ | 307.2 | |
| | | | | | | | |
| | COMPASS MINERALS INTERNATIONAL, INC. |
| | | | | | | | | | | | | | | | | | | | | | | | | | |
| Three Months Ended December 31, 2023 | | Salt | | Plant
Nutrition | | Corporate & Other(a) | | Total |
| Highway Deicing Salt | | $ | 159.4 | | | $ | — | | | $ | — | | | $ | 159.4 | |
| Consumer & Industrial Salt | | 114.9 | | | — | | | — | | | 114.9 | |
| | | | | | | | |
| | | | | | | | |
| SOP | | — | | | 52.8 | | | — | | | 52.8 | |
| Fire Retardant | | — | | | — | | | 14.0 | | | 14.0 | |
| Revenue from Services | | — | | | — | | | 0.5 | | | 0.5 | |
| Eliminations & Other | | — | | | (3.1) | | | 3.2 | | | 0.1 | |
| Sales to external customers | | $ | 274.3 | | | $ | 49.7 | | | $ | 17.7 | | | $ | 341.7 | |
(a)Corporate and Other includes corporate entities, records management operations, the Fortress fire retardant business, equity method investments, prior-year lithium costs and other incidental operations and eliminations. Operating earnings (loss) for corporate and other includes indirect corporate overhead, including costs for general corporate governance and oversight, prior-year lithium-related expenses, as well as costs for the human resources, information technology, legal and finance functions.
(b)Corporate operating results were impacted by costs related to a product recall of $0.9 million for the three months ended December 31, 2024. Corporate operating results were also impacted by a net loss of $1.6 million related to an increase in the valuation of the Fortress contingent consideration for the three months ended Dec. 31, 2023.
(c)As a result of the Company’s decision to cease the pursuit of the lithium development, the Company recognized an impairment of long-lived assets of $74.8 million for the three months ended December 31, 2023. The Company also recognized severance of $2.5 million related to the termination of the lithium development and $1.1 million related to other restructuring, which impacted operating results for the three months ended December 31, 2023.
The Company’s revenue by geographic area is as follows (in millions):
| | | | | | | | | | | | | | | |
| Three Months Ended
December 31, | | |
| Revenue | 2024 | | 2023 | | | | |
United States(a) | $ | 212.7 | | | $ | 250.9 | | | | | |
| Canada | 79.3 | | | 77.6 | | | | | |
| United Kingdom | 11.2 | | | 13.0 | | | | | |
| Other | 4.0 | | | 0.2 | | | | | |
| Total revenue | $ | 307.2 | | | $ | 341.7 | | | | | |
(a)United States sales exclude product sold to foreign customers at U.S. ports.
10. Stockholders’ Equity and Equity Instruments:
Equity Compensation Awards
In May 2020, the Company’s stockholders approved the 2020 Incentive Award Plan (as amended, the “2020 Plan”), which authorized the issuance of 2,977,933 shares of Company common stock. In February 2022, the Company’s stockholders approved an amendment to the 2020 Plan authorizing an additional 750,000 shares of Company stock. In March 2024, the Company’s stockholders approved an amendment to the 2020 Plan authorizing an additional 3,000,000 shares of Company stock. Since the date the 2020 Plan was approved, the Company ceased issuing equity awards under the 2015 Incentive Award Plan (as amended, the “2015 Plan”). Since the approval of the 2015 Plan in May 2015, the Company ceased issuing equity awards under the 2005 Incentive Award Plan (as amended, the “2005 Plan”). The 2005 Plan, the 2015 Plan and the 2020 Plan allow for grants of equity awards to executive officers, other employees and directors, including restricted stock units (“RSUs”), performance stock units (“PSUs”), stock options and deferred stock units. For additional information regarding equity awards issued under the Company’s incentive plans refer to “Note 15 – Stockholder’s Equity and Equity Instruments” within Part II, Item 8 of its 2024 Form 10-K.
During the three months ended December 31, 2024, the Company reissued the following number of shares from treasury stock: 108,023 shares related to the release of RSUs which vested and 10,224 shares issued for Board of Director compensation. In fiscal 2024, the Company issued 222,155 net shares from treasury stock. The Company withheld a total of 34,955 shares with a fair value of $0.5 million related to the vesting of RSUs during the three months ended December 31, 2024. The fair value of the shares was valued at the closing price at the vesting date and represent the employee tax withholding for the employee’s compensation. The Company recognized tax expense of $0.5 million from its equity compensation awards during the three months ended December 31, 2024. During the three months ended December 31, 2024 and 2023, the Company recorded
| | | | | | | | |
| | COMPASS MINERALS INTERNATIONAL, INC. |
$3.9 million and $11.9 million, respectively, of compensation expense pursuant to its stock-based compensation plans. No amounts have been capitalized.
PSUs
During the three months ended December 31, 2024, the Company issued new PSUs based upon performance criteria and metrics (“Scorecard PSUs”). The actual number of shares of common stock that may be earned with respect to Scorecard PSUs is calculated based upon the attainment of certain thresholds for free cash flow and return on capital employed during each year of the three-year performance period and may range from 0% to 200% for each measure. Additionally, a modifier will increase or decrease the payout by 20% based upon relative total shareholder return against the Company’s peer group.
The following table summarizes stock-based compensation activity during the three months ended December 31, 2024:
| | | | | | | | | | | | | | | | | | | | | | | | | | | | | | | | | | | | | | |
| | | Stock Options | | RSUs | | PSUs(a) |
| | | Number | | Weighted-average
exercise price | | Number | | Weighted-average
fair value | | Number | | Weighted-average
fair value |
| Outstanding at September 30, 2024 | | 187,023 | | | $ | 62.85 | | | 451,091 | | | $ | 27.93 | | | 229,469 | | | $ | 40.26 | |
| Granted | | — | | | — | | | 749,627 | | | 12.83 | | | 214,673 | | | 16.57 | |
Exercised(b) | | — | | | — | | | — | | | — | | | — | | | — | |
Released from restriction(b) | | — | | | — | | | (108,023) | | | 32.70 | | | — | | | — | |
| Cancelled/expired | | (3,279) | | | 64.12 | | | (5,843) | | | 18.03 | | | — | | | — | |
| Outstanding at December 31, 2024 | | 183,744 | | | $ | 62.83 | | | 1,086,852 | | | $ | 17.09 | | | 444,142 | | | $ | 28.81 | |
(a)Until the performance period is completed, PSUs are included in the table at the target level at their grant date and at that level represent one share of common stock per PSU.
(b)Common stock issued for exercised options and for vested and earned RSUs and PSUs was issued from treasury stock.
Accumulated Other Comprehensive Loss (“AOCL”)
The Company’s comprehensive income (loss) is comprised of net loss, net amortization of the unrealized loss of the pension obligation, the change in the unrealized gain in other postretirement benefits, the change in the unrealized gain (loss) on natural gas and foreign currency cash flow hedges and currency translation adjustment (“CTA”). The components of and changes in AOCL are as follows (in millions):
| | | | | | | | | | | | | | | | | | | | | | | | | | | | | | | |
Three Months Ended December 31, 2024(a) | Gains and (Losses) on Cash Flow Hedges | | Defined Benefit Pension | | Other Post-Employment Benefits | | | | Foreign Currency | | Total |
| Beginning balance | $ | (1.3) | | | $ | (6.2) | | | $ | 1.4 | | | | | $ | (90.3) | | | $ | (96.4) | |
Other comprehensive loss before reclassifications(b) | (0.9) | | | — | | | — | | | | | (33.3) | | | (34.2) | |
| Amounts reclassified from AOCL | 0.6 | | | 0.2 | | | (0.1) | | | | | — | | | 0.7 | |
| Net current period other comprehensive income (loss) | (0.3) | | | 0.2 | | | (0.1) | | | | | (33.3) | | | (33.5) | |
| Ending balance | $ | (1.6) | | | $ | (6.0) | | | $ | 1.3 | | | | | $ | (123.6) | | | $ | (129.9) | |
| | | | | | | | | | | | | | | | | | | | | | | | | | | | | |
Three Months Ended December 31, 2023(a) | Gains and (Losses) on Cash Flow Hedges | | Defined Benefit Pension | | Other Post-Employment Benefits | | Foreign Currency | | Total |
| Beginning balance | $ | (1.4) | | | $ | (6.6) | | | $ | 1.7 | | | $ | (98.4) | | | $ | (104.7) | |
Other comprehensive income before reclassifications(b) | (2.6) | | | — | | | — | | | 14.6 | | | 12.0 | |
| Amounts reclassified from AOCL | 0.8 | | | 0.2 | | | — | | | — | | | 1.0 | |
| Net current period other comprehensive income | (1.8) | | | 0.2 | | | — | | | 14.6 | | | 13.0 | |
| Ending balance | $ | (3.2) | | | $ | (6.4) | | | $ | 1.7 | | | $ | (83.8) | | | $ | (91.7) | |
(a)With the exception of the CTA, for which no tax effect is recorded, the changes in the components of AOCL presented in the tables above are reflected net of applicable income taxes.
(b)The Company recorded foreign exchange gain (loss) of $5.4 million and $(2.3) million in the three months ended December 31, 2024 and 2023, respectively, in AOCL related to intercompany notes which were deemed to be of a long-term investment nature.
| | | | | | | | |
| | COMPASS MINERALS INTERNATIONAL, INC. |
The amounts reclassified from AOCL to expense (income) for the three months ended December 31, 2024 and 2023, are shown below (in millions):
| | | | | | | | | | | | | | | | | | | | | |
| Amount Reclassified from AOCL | | |
| | Three Months Ended
December 31, | | | | Line Item Impacted in the
Consolidated Statements of Operations |
| 2024 | | 2023 | | | | | | |
| Loss (gain) on cash flow hedges: | | | | | | | | | |
| Natural gas instruments | $ | 0.6 | | | $ | 0.8 | | | | | | | Product cost |
| | | | | | | | | |
| Income tax expense | — | | | — | | | | | | | |
| Reclassifications, net of income taxes | 0.6 | | | 0.8 | | | | | | | |
| Amortization of defined benefit pension: | | | | | | | | | |
| Amortization of loss | 0.3 | | | 0.3 | | | | | | | Product cost |
| Income tax benefit | (0.1) | | | (0.1) | | | | | | | |
| Reclassifications, net of income taxes | 0.2 | | | 0.2 | | | | | | | |
| Amortization of other post-employment benefits: | | | | | | | | | |
| Amortization of gain | (0.1) | | | — | | | | | | | Product cost |
| Income tax expense | — | | | — | | | | | | | |
| Reclassifications, net of income taxes | (0.1) | | | — | | | | | | | |
| | | | | | | | | |
| Total reclassifications, net of income taxes | $ | 0.7 | | | $ | 1.0 | | | | | | | |
11. Derivative Financial Instruments:
The Company is subject to various types of market risks, including interest rate risk, foreign currency exchange rate transaction and translation risk and commodity pricing risk. Management may take actions to mitigate the exposure to these types of risks, including entering into forward purchase contracts and other financial instruments. The Company manages a portion of its commodity pricing risks and foreign currency exchange rate risks by using derivative instruments. From time to time, the Company may enter into foreign exchange contracts to mitigate foreign exchange risk. The Company does not seek to engage in trading activities or take speculative positions with any financial instrument arrangement. The Company enters into natural gas derivative instruments and foreign currency derivative instruments with counterparties it views as creditworthy. However, the Company does attempt to mitigate its counterparty credit risk exposures by, among other things, entering into master netting agreements with some of these counterparties. The Company records derivative financial instruments as either assets or liabilities at fair value in its Consolidated Balance Sheets. The assets and liabilities recorded as of December 31, 2024 and September 30, 2024 were not material.
Derivatives qualify for treatment as hedges when there is a high correlation between the change in fair value of the derivative instrument and the related change in value of the underlying hedged item. Depending on the exposure being hedged, the Company must designate the hedging instrument as a fair value hedge, a cash flow hedge or a net investment in foreign operations hedge. For the qualifying derivative instruments that have been designated as cash flow hedges, the effective portion of the change in fair value is recognized through earnings when the underlying transaction being hedged affects earnings, allowing a derivative’s gains and losses to offset related results from the hedged item in the Consolidated Statements of Operations. Any ineffectiveness related to these instruments accounted for as hedges was not material for any of the periods presented. For derivative instruments that have not been designated as hedges, the entire change in fair value is recorded through earnings in the period of change.
Natural Gas Derivative Instruments
Natural gas is consumed at several of the Company’s production facilities, and changes in natural gas prices impact the Company’s operating margin. The Company seeks to reduce the earnings and cash flow impacts of changes in market prices of natural gas by fixing the purchase price of up to 90% of its forecasted natural gas usage. It is the Company’s policy to consider hedging portions of its natural gas usage up to 36 months in advance of the forecasted purchase. As of December 31, 2024, the Company had entered into natural gas derivative instruments to hedge a portion of its natural gas purchase requirements through September 2026. As of December 31, 2024 and September 30, 2024, the Company had agreements in place to hedge forecasted natural gas purchases of 2.6 million and 2.3 million MMBtus, respectively. All natural gas derivative instruments held by the Company as of December 31, 2024 and September 30, 2024 qualified and were designated as cash flow hedges. As
| | | | | | | | |
| | COMPASS MINERALS INTERNATIONAL, INC. |
of December 31, 2024, the Company expects to reclassify from AOCL to earnings during the next twelve months $1.7 million of net losses on derivative instruments related to its natural gas hedges. Refer to Note 12 for the estimated fair value of the Company’s natural gas derivative instruments as of December 31, 2024 and September 30, 2024.
The following tables present the fair value of the Company’s derivatives (in millions):
| | | | | | | | | | | | | | | | | | | | | | | | | | |
| | | Asset Derivatives | | Liability Derivatives |
| | Consolidated Balance Sheet Location | | December 31, 2024 | | Consolidated Balance Sheet Location | | December 31, 2024 |
| Derivatives designated as hedging instruments: | | | | | | | | |
| Commodity contracts | | Other current assets | | $ | 0.3 | | | Accrued expenses and other current liabilities | | $ | 2.0 | |
| Commodity contracts | | Other assets | | 0.3 | | | Other noncurrent liabilities | | 0.2 | |
Total derivatives(a) | | | | $ | 0.6 | | | | | $ | 2.2 | |
(a)The Company has master netting agreements with its commodity hedge counterparties and accordingly has netted in its Consolidated Balance Sheets $0.6 million of its commodity contracts that are in receivable positions against its contracts in payable positions.
| | | | | | | | | | | | | | | | | | | | | | | | | | |
| | | Asset Derivatives | | Liability Derivatives |
| | Consolidated Balance Sheet Location | | September 30, 2024 | | Consolidated Balance Sheet Location | | September 30, 2024 |
| Derivatives designated as hedging instruments: | | | | | | | | |
| Commodity contracts | | Other current assets | | $ | 0.5 | | | Accrued expenses and other current liabilities | | $ | 1.7 | |
| Commodity contracts | | Other assets | | 0.1 | | | Other noncurrent liabilities | | 0.2 | |
Total derivatives(a) | | | | $ | 0.6 | | | | | $ | 1.9 | |
(a)The Company has master netting agreements with its commodity hedge counterparties and accordingly has netted in its Consolidated Balance Sheets $0.6 million of its commodity contracts that are in receivable positions against its contracts in payable positions.
12. Fair Value Measurements:
The Company’s financial instruments are measured and reported at their estimated fair values. Fair value is the price that would be received to sell an asset or paid to transfer a liability in an orderly transaction. When available, the Company uses quoted prices in active markets to determine the fair values for its financial instruments (Level 1 inputs) or, absent quoted market prices, observable market-corroborated inputs over the term of the financial instruments (Level 2 inputs). The Company does not have any unobservable inputs that are not corroborated by market inputs (Level 3 inputs), except as stated below.
The Company holds marketable securities associated with its defined contribution and pre-tax savings plans, which are valued based on readily available quoted market prices. The Company utilizes derivative instruments to manage its risk of changes in natural gas prices and foreign exchange rates (see Note 11). The fair values of the natural gas and foreign currency derivative instruments are determined using market data of forward prices for all of the Company’s contracts.
| | | | | | | | |
| | COMPASS MINERALS INTERNATIONAL, INC. |
The estimated fair values for each type of instrument are presented below (in millions):
| | | | | | | | | | | | | | | | | | | | | | | |
| | December 31,
2024 | | Level One | | Level Two | | Level Three |
| Asset Class: | | | | | | | |
Mutual fund investments in a non-qualified savings plan(a) | $ | 3.4 | | | $ | 3.4 | | | $ | — | | | $ | — | |
| Derivatives – natural gas instruments, net | 0.6 | | | — | | | 0.6 | | | — | |
| Total Assets | $ | 4.0 | | | $ | 3.4 | | | $ | 0.6 | | | $ | — | |
| Liability Class: | | | | | | | |
| Derivatives - natural gas instruments, net | $ | (2.2) | | | $ | — | | | $ | (2.2) | | | $ | — | |
| | | | | | | |
| Liabilities related to non-qualified savings plan | (3.4) | | | (3.4) | | | — | | | — | |
| | | | | | | |
| Total Liabilities | $ | (5.6) | | | $ | (3.4) | | | $ | (2.2) | | | $ | — | |
(a)Includes mutual fund investments of approximately 25% in common stock of large-cap U.S. companies, 5% in common stock of small to mid-cap U.S. companies, 10% in bond funds, 20% in short-term investments and 40% in blended funds.
| | | | | | | | | | | | | | | | | | | | | | | |
| | September 30,
2024 | |
Level One | |
Level Two | |
Level Three |
| Asset Class: | | | | | | | |
Mutual fund investments in a non-qualified savings plan(a) | $ | 3.1 | | | $ | 3.1 | | | $ | — | | | $ | — | |
| Derivatives - natural gas instruments, net | 0.6 | | | — | | | 0.6 | | | — | |
| Total Assets | $ | 3.7 | | | $ | 3.1 | | | $ | 0.6 | | | $ | — | |
| Liability Class: | | | | | | | |
| Derivatives - natural gas instruments, net | $ | (1.9) | | | $ | — | | | $ | (1.9) | | | $ | — | |
| Liabilities related to non-qualified savings plan | (3.1) | | | (3.1) | | | — | | | — | |
| Total Liabilities | $ | (5.0) | | | $ | (3.1) | | | $ | (1.9) | | | $ | — | |
(a)Includes mutual fund investments of approximately 35% in the common stock of large-cap U.S. companies, 5% in the common stock of small to mid-cap U.S. companies, 5% in the common stock of international companies, 10% in bond funds, 5% in short-term investments and 40% in blended funds.
Cash and cash equivalents, receivables (net of allowance for doubtful accounts) and accounts payable are carried at cost, which approximates fair value due to their liquid and short-term nature. The Company’s investments related to its non-qualified retirement plan of $3.4 million at December 31, 2024 and $3.1 million at September 30, 2024, are stated at fair value based on quoted market prices. As of December 31, 2024 and September 30, 2024, the estimated fair value of the Company’s fixed-rate 6.75% Senior Notes due December 2027, based on available trading information (Level 2), totaled $492.5 million and $497.0 million, respectively, compared with the aggregate principal amount at maturity of $500.0 million. The fair value at December 31, 2024 and September 30, 2024 of amounts outstanding under the Company’s term loans and revolving credit facility, based upon available bid information received from the Company’s lender (Level 2), totaled approximately $416.8 million and $379.1 million, respectively, compared with the aggregate principal amount at maturity of $422.1 million and $383.9 million, respectively.
In connection with the acquisition of Fortress on May 5, 2023, the Company entered into a contingent consideration arrangement for up to $28 million to be paid in cash and/or Compass Minerals common stock upon the achievement of certain performance measures over the next five years, and a cash earn-out based on volumes of certain Fortress fire retardant products sold over a 10-year period. The fair value of the milestone contingent consideration is estimated using a probability-weighted discounted cash flow model with significant inputs not observable in the market and is therefore considered a Level 3 measurement while the earn-out is valued using a Monte Carlo simulation, also a Level 3 measurement. For the three months ended December 31, 2024, the total fair value of the contingent consideration did not change. For the three months ended December 31, 2023, the Company recorded an expense of $1.6 million. The change in the three months ended December 31, 2023 was reflective of updated financial performance, changes in discount rates and the passage of time. The change is recorded in other operating (income) expense in the Consolidated Statements of Operations to reflect the contingent consideration liability at its fair value as of December 31, 2023. The Company will continue to recognize remeasurement changes in the estimated fair value of contingent consideration in earnings at each reporting date until all contingencies are resolved.
| | | | | | | | |
| | COMPASS MINERALS INTERNATIONAL, INC. |
The following table presents the fair value of the Company’s total contingent consideration arrangement (in millions):
| | | | | | | | | | | | | | |
| Consolidated Balance Sheet Location | | December 31, 2024 | | September 30, 2024 |
| Accrued expenses and other current liabilities | | $ | 0.1 | | | $ | — | |
| Other noncurrent liabilities | | 7.8 | | | 7.9 | |
| Total contingent consideration | | $ | 7.9 | | | $ | 7.9 | |
The Company has certain assets, including goodwill and other intangible assets, which are measured at fair value on a non-recurring basis and are adjusted to fair value only if an impairment charge is recognized. The categorization of the framework used to measure fair value of the assets is considered to be within the Level 3 valuation hierarchy due to the subjective nature of the unobservable inputs used. Refer to Note 5 for details of the Company’s remaining goodwill.
13. Earnings per Share:
On April 22, 2024, the Board of Directors determined not to declare dividends for the foreseeable future in order to align the Company’s capital allocation priorities with its corporate focus on accelerating cash flow generation and debt reduction. The Company calculated earnings per share using the treasury stock method during the three months ended December 31, 2024. The following table sets forth the computation of basic and diluted earnings per common share (in millions, except for share and per-share data):
| | | | | | | | | | | | | | | |
| | Three Months Ended
December 31, | | |
| | 2024 | | 2023 | | | | |
| Numerator: | | | | | | | |
| Net loss | $ | (23.6) | | | $ | (75.3) | | | | | |
Less: net earnings allocated to participating securities(a) | — | | | (0.1) | | | | | |
| | | | | | | |
| | | | | | | |
| Net loss available to common stockholders | $ | (23.6) | | | $ | (75.4) | | | | | |
| | | | | | | |
| Denominator (in thousands): | | | | | | | |
Weighted-average common shares outstanding, shares for basic earnings per share(b) | 41,441 | | | 41,205 | | | | | |
| Weighted-average awards outstanding | — | | | — | | | | | |
| Shares for diluted earnings per share | 41,441 | | | 41,205 | | | | | |
| | | | | | | |
| | | | | | | |
| | | | | | | |
| Basic net loss per common share | $ | (0.57) | | | $ | (1.83) | | | | | |
| | | | | | | |
| | | | | | | |
| | | | | | | |
| Diluted net loss per common share | $ | (0.57) | | | $ | (1.83) | | | | | |
(a)Weighted participating securities include RSUs and PSUs that receive non-forfeitable dividends and consist of 1,116,000 weighted participating securities for the three months ended December 31, 2024 and 777,000 weighted participating securities for the three months ended December 31, 2023.
(b)For the calculation of diluted net earnings (loss) per share, the Company uses the more dilutive of either the treasury stock method or the two-class method to determine the weighted-average number of outstanding common shares. In addition, the Company had 1,184,000 weighted-average equity awards outstanding for the three months ended December 31, 2024, and 1,572,000 weighted-average equity awards outstanding for the three months ended December 31, 2023, that were anti-dilutive.
14. Related Party Transactions:
During both the three months ended December 31, 2024 and 2023, the Company recorded SOP sales of approximately $1.1 million and $0.8 million, respectively, to certain subsidiaries of Koch Industries, Inc. As of December 31, 2024 and September 30, 2024, the Company had approximately $0.6 million and $0.3 million, respectively, of receivables from related parties on its Consolidated Balance Sheets. There were no amounts payable outstanding as of December 31, 2024.
| | | | | | | | |
| | COMPASS MINERALS INTERNATIONAL, INC. |
Item 2. Management’s Discussion and Analysis of Financial Condition and Results of Operations
All statements, other than statements of historical fact, contained in this Quarterly Report on Form 10-Q constitute “forward-looking statements” within the meaning of the Private Securities Litigation Reform Act of 1995.
Forward-looking statements relate to future events or our future financial performance, and involve known and unknown risks, uncertainties, and other factors that may cause our actual results, levels of activity, performance or achievements to be materially different from future results, levels of activity, performance or achievements expressed or implied by these forward-looking statements. Factors that could cause actual results to differ materially from those expressed or implied by the forward-looking statements include, but are not limited to, the following: our mining and industrial operations; geological conditions; weather conditions; our continued ability to access ambient lake brine in the Great Salt Lake; dependency on a limited number of key production and distribution facilities and critical equipment; the inability to fund necessary capital expenditures or successfully complete capital projects; uncertainties in estimating our economically recoverable reserves and resources; the useful life of our mine properties; conversion of mineral resources into mineral reserves; strikes, other forms of work stoppage or slowdown or other union activities; supply constraints or price increases for energy and raw materials used in our production processes; our indebtedness and inability to pay our indebtedness; restrictions in our debt agreements that may limit our ability to operate our business or require accelerated debt payments; tax liabilities; the inability of our customers to access credit or a default by our customers of trade credit extended by us; our payment of any dividends; financial assurance requirements; the seasonal demand for our products; the impact of anticipated changes in potash product prices and customer application rates; the impact of competition on the sales of our products; inflation risks; increasing costs or a lack of availability of transportation services; risks associated with our international operations and sales, including changes in currency exchange rates; conditions in the sectors where we sell products and supply and demand imbalances for competing products; our rights and governmental authorizations to mine and operate our properties; risks related to unanticipated litigation or investigations or pending litigation or investigations or other contingencies; compliance with environmental, health and safety laws and regulations; environmental liabilities; compliance with foreign and United States (“U.S.”) laws and regulations related to import and export requirements and anti-corruption laws; changes in laws, industry standards and regulatory requirements; product liability claims and product recalls; misappropriation or infringement claims relating to intellectual property; inability to obtain required product registrations or increased regulatory requirements; our ability to successfully implement our strategies; risks related to labor shortages and the loss of key personnel; a compromise of our computer systems, information technology or operations technology or the inability to protect confidential or proprietary data; climate change and related laws and regulations; our ability to expand our business through acquisitions and investments, realize anticipated benefits from acquisitions and investments and integrate acquired businesses; outbreaks of contagious disease or similar public health threats; domestic and international general business and economic conditions; our ability to successfully remediate the material weakness in our internal controls over financial reporting disclosed in this Form 10-Q; and other risks referenced from time to time in this report and our other filings with the Securities and Exchange Commission (the “SEC”), including Part I, Item 1A, “Risk Factors” of our Annual Report on Form 10-K for the annual period ended September 30, 2024 (“2024 Form 10-K”).
In some cases, you can identify forward-looking statements by terminology such as “may,” “might,” “will,” “should,” “could,” “expects,” “intends,” “plans,” “anticipates,” “believes,” “estimates,” “predicts,” “potential,” “continue,” the negative of these terms or other comparable terminology. Forward-looking statements include without limitation statements about our outlook, including expected sales volumes and costs; existing or potential capital expenditures; capital projects and investments; the industry and our competition; projected sources of cash flow; potential legal liability; proposed or recently enacted legislation and regulatory action; the seasonal distribution of working capital requirements; our reinvestment of foreign earnings outside the U.S.; payment of future dividends and ability to reinvest in our business; our ability to optimize cash accessibility, minimize tax expense and meet debt service requirements; future tax payments, tax refunds and valuation allowances; leverage ratios; realization of potential savings from our restructuring activities; outcomes of matters with taxing authorities; the effects of currency fluctuations and inflation, including our ability to recover inflation-based cost increases; the seasonality of our business; and the effects of climate change. These forward-looking statements are only predictions. Actual events or results may differ materially.
Although we believe that the expectations reflected in the forward-looking statements are reasonable, we cannot guarantee future results, levels of activity, performance or achievements. We undertake no duty to update any of the forward-looking statements after the date hereof or to reflect the occurrence of unanticipated events.
Unless the context requires otherwise, references to the “Company,” “Compass Minerals,” “our,” “us” and “we” refer to Compass Minerals International, Inc. (“CMI,” the parent holding company) and its consolidated subsidiaries. Except where otherwise noted, references to North America include only the continental U.S. and Canada, and references to the United Kingdom (“U.K.”) include only England, Scotland and Wales. Except where otherwise noted, all references to tons refer to “short tons” and all amounts are in U.S. dollars. One short ton equals 2,000 pounds and one metric ton equals 2,204.6 pounds.
| | | | | | | | |
| | COMPASS MINERALS INTERNATIONAL, INC. |
Compass Minerals and Protassium+ and combinations thereof, are trademarks of CMI or its subsidiaries in the U.S. and other countries.
Critical Accounting Estimates
The preparation of the consolidated financial statements in conformity with U.S. GAAP requires management to make estimates and assumptions that affect the reported amounts of assets and liabilities as of the reporting date and the reported amounts of revenue and expenses during the reporting period. Actual results could vary from these estimates. We have identified the critical accounting policies and estimates that we believe are most important to the portrayal of our financial condition and results of operations. The policies set forth below require significant subjective or complex judgments by management, often as a result of the need to make estimates about the effect of matters that are inherently uncertain.
A discussion of our critical accounting estimates used in preparation of our consolidated financial statements is presented under the heading "Management’s Discussion of Critical Accounting Policies and Estimates" in Part II, Item 7, “Management’s Discussion and Analysis of Financial Condition and Results of Operations” included in our 2024 Form 10-K.
Company Overview
Compass Minerals is a leading global provider of essential minerals, including salt, sulfate of potash (“SOP”) specialty fertilizer and magnesium chloride. As of December 31, 2024, we operate 12 production and packaging facilities, including:
•The largest rock salt mine in the world in Goderich, Ontario, Canada;
•The largest dedicated rock salt mine in the U.K. in Winsford, Cheshire;
•A solar evaporation facility located near Ogden, Utah, which is both the largest sulfate of potash specialty fertilizer production site and the largest solar salt production site in the Western Hemisphere; and
•Several mechanical evaporation facilities producing consumer and industrial salt.
Our Salt segment provides highway deicing salt to customers in North America and the U.K. as well as consumer deicing and water conditioning products, ingredients used in consumer and commercial food preparation, and other salt-based products for consumer, industrial, chemical and agricultural applications in North America. In the U.K., we operate a records management business utilizing excavated areas of our Winsford salt mine with one other location in London, England.
Our Plant Nutrition segment produces and markets SOP products in various grades worldwide to distributors and retailers of crop inputs, as well as growers and for industrial uses. We market our SOP under the trade name Protassium+®.
In May 2023, we completed the purchase of Fortress North America, LLC (“Fortress”), a fire retardant company working to develop long-term aerial and ground fire retardant products to help combat wildfires.
| | | | | | | | |
| | COMPASS MINERALS INTERNATIONAL, INC. |
Consolidated Results of Continuing Operations
The following is a summary of our consolidated results of continuing operations for the three months ended December 31, 2024 and 2023, respectively. The following discussion should be read in conjunction with the information contained in our consolidated financial statements and the notes thereto included in this Quarterly Report on Form 10-Q.
THREE MONTHS ENDED DECEMBER 31
Commentary: Three Months Ended December 31, 2024 Compared to Three Months Ended December 31, 2023
•Total sales decreased 10%, or $34.5 million, due to lower Salt segment sales, which was partially offset by higher Plant Nutrition segment sales. The decrease in sales for Salt reflected lower deicing sales volumes, which was partially offset by slightly higher average sales prices. We recognized $14.5 million in sales related to the completion of our 2023 contract with the U.S. Forest Service (“USFS”) in the prior-year period. Fortress has not been awarded a contract for either the 2024 or 2025 fire seasons. Plant Nutrition sales increased from the prior year due to a substantial increase in sales volumes, partially offset by lower average sales prices.
•Operating earnings of $0.5 million improved $54.1 million from an operating loss of $53.6 million in the prior-year period, primarily reflecting the lithium asset impairment in the prior-year period and lower corporate SG&A expenses in the current period, which was partially offset by lower Salt operating earnings and Fortress earnings in the current period. Salt earnings decreased due to lower sales volumes and higher per-unit product costs. Plant Nutrition operating loss was essentially flat compared to the prior period as higher sales volumes and lower per-unit product costs were offset by lower average sales prices.
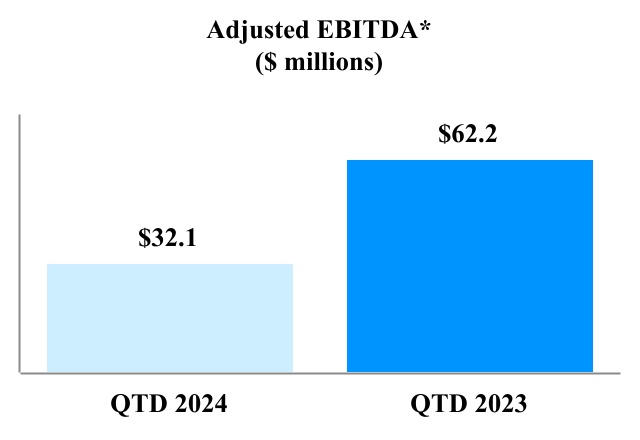
•Earnings before interest, taxes, depreciation and amortization (“EBITDA”)* adjusted for items management believes are not indicative of our ongoing operating performance (“Adjusted EBITDA”)* decreased 48.4%, or $30.1 million.
•Diluted net loss per common share of $0.57 changed by $1.26 from net loss of $1.83 per common share in the prior-year period.
| | | | | | | | |
| | COMPASS MINERALS INTERNATIONAL, INC. |
THREE MONTHS ENDED DECEMBER 31
Commentary: Three Months Ended December 31, 2024 Compared to Three Months Ended December 31, 2023
Gross Profit: Decreased 52%, or $36.8 million; Gross Margin decreased 10 percentage points to 11%
•Salt segment gross profit decreased $22.1 million primarily due to lower sales volumes and higher per-unit product costs, which were partially offset by slightly higher average sales prices (see Salt operating results).
•The gross profit of the Plant Nutrition segment decreased $1.3 million as lower average sales prices were mostly offset by higher sales volumes and lower per-unit product costs (see Plant Nutrition operating results).
•Gross profit was also negatively impacted by earnings in the prior period related to the Fortress fire retardant business acquired in May 2023.
OTHER EXPENSES AND INCOME
Commentary: Three Months Ended December 31, 2024 Compared to Three Months Ended December 31, 2023
SG&A: Decreased $12.4 million; Decreased 2.6 percentage points as a percentage of sales from 13.4% to 10.8%
•The decrease in SG&A expense was primarily due to lower corporate incentive compensation, lithium and Fortress expenses.
Other Operating Expense: Decreased $3.7 million from $4.2 million to $0.5 million
•The decrease in other operating expense was primarily the result of higher contingent consideration related to the Fortress acquisition and severance costs resulting from the decision to discontinue lithium development in the prior period.
Interest Expense: Increased $1.0 million to $16.9 million
•Interest expense increased $1.0 million due to higher interest rates and debt levels in the current period.
(Gain) Loss on Foreign Exchange: Increased $7.1 million from a loss of $1.9 million to a gain of $5.2 million
•We realized a gain on foreign exchange of $5.2 million in the first quarter of fiscal 2025 compared to a loss of $1.9 million in the same quarter of the prior-year period, primarily reflecting the translation of our intercompany loans from Canadian dollars to U.S. dollars.
Other Expense, net: Increased $2.4 million to $3.1 million
•The increase is due primarily to fees paid to modify our debt agreements in the current period, which was partially offset by losses on cash flow hedges in the prior period.
Income Tax Expense: Increased $6.1 million from $3.6 million to $9.7 million
•Tax expense increased by $6.1 million for the three months ended December 31, 2024 versus the 3 months ended December 31, 2023 despite a decrease in pretax book losses of $57.8 million primarily due to the significant Lithium impairment in the three months ended December 31, 2023 for which a full valuation allowance was recorded.
•Our effective tax rate was (70%) for the three months ended December 31, 2024, which is primarily driven by the income mix by country with income recognized in foreign jurisdictions, for which tax expense was recorded, offset by
| | | | | | | | |
| | COMPASS MINERALS INTERNATIONAL, INC. |
losses recognized in the U.S. for which a valuation allowance has been recorded against the U.S. tax benefit carryforward.
•Our income tax provision for the three months ended December 31, 2024 and 2023 differs from the U.S. statutory rate primarily due to U.S. statutory depletion, state income taxes, nondeductible executive compensation, foreign income, mining and withholding taxes and valuation allowance expense. The income tax provision for the three months ended December 31, 2024 also included base erosion and anti-abuse tax.
Operating Segment Performance
The following financial results represent consolidated financial information with respect to the operations of our Salt and Plant Nutrition segments. Sales primarily include revenue from the sales of our products, or “product sales,” and the impact of shipping and handling costs incurred to deliver our salt and plant nutrition products to our customers.
The results of operations of the Fortress business include sales of $14.5 million for the three months ended December 31, 2023. The results of operations of the consolidated records management business and other incidental revenues include sales of $3.6 million and $3.2 million for the three months ended December 31, 2024 and 2023, respectively. These sales are not material to our consolidated financial results and are not included in the following operating segment financial data.
Salt Results
| | | | | | | | | | | | | | | |
| QTD 2024 | | QTD 2023 | | | | |
Salt Sales (in millions) | $ | 242.2 | | | $ | 274.3 | | | | | |
Salt Operating Earnings (in millions) | $ | 29.4 | | | $ | 50.9 | | | | | |
Salt Sales Volumes (thousands of tons) | | | | | | | |
| Highway deicing | 1,987 | | | 2,266 | | | | | |
| Consumer and industrial | 506 | | | 589 | | | | | |
| Total tons sold | 2,493 | | | 2,855 | | | | | |
Average Salt Sales Price (per ton) | | | | | | | |
| Highway deicing | $ | 69.50 | | | $ | 70.36 | | | | | |
| Consumer and industrial | $ | 205.74 | | | $ | 194.94 | | | | | |
| Combined | $ | 97.16 | | | $ | 96.08 | | | | | |
Commentary: Three Months Ended December 31, 2024 Compared to Three Months Ended December 31, 2023
•Salt sales decreased $32.1 million, or 12%, primarily due to lower sales volumes, which was partially offset by higher average sales prices for our consumer and industrial products.
•Salt sales volumes decreased 13% in total, or 362,000 tons, reducing sales by approximately $35.9 million. Highway deicing sales volumes decreased 12%, reflecting a decrease in deicing sales volumes in both the highway and consumer and industrial products. Consumer and industrial sales volumes decreased 14% primarily due to lower non-deicing volumes.
•Average sales prices increased 1% partially offsetting the volume decline by approximately $3.8 million with increases in consumer and industrial average sales prices.
•Highway deicing average sales price decreased 1% across all product categories. Consumer and industrial average sales price increased 6% due to price increases taken to offset inflation realized in prior years. The higher average sales prices are also reflective of sales mix.
•Salt operating earnings decreased 42%, or $21.5 million, due primarily to lower sales volumes and higher per-unit product costs, which were partially offset by slightly higher average sales prices.
Plant Nutrition Results
| | | | | | | | | | | | | | | |
| QTD 2024 | | QTD 2023 | | | | |
Plant Nutrition Sales (in millions) | $ | 61.4 | | | $ | 49.7 | | | | | |
Plant Nutrition Operating Loss (in millions) | $ | (3.1) | | | $ | (2.3) | | | | | |
Plant Nutrition Sales Volumes (thousands of tons) | 102 | | | 75 | | | | | |
Plant Nutrition Average Sales Price (per ton) | $ | 603 | | | $ | 660 | | | | | |
| | | | | | | | |
| | COMPASS MINERALS INTERNATIONAL, INC. |
Commentary: Three Months Ended December 31, 2024 Compared to Three Months Ended December 31, 2023
•Plant Nutrition sales increased 24%, or $11.7 million, due to higher sales volumes, which were partially offset by lower average sales prices.
•Plant Nutrition sales volumes increased 36% year over year driven by a return to more normalized sales volumes following a year in which customers delayed or reduced purchases. The higher sales volumes increased sales by approximately $17.5 million.
•Plant Nutrition average sales prices decreased 9%, which contributed approximately $5.8 million to the decrease in sales. Average sales prices decreased throughout fiscal 2024 and into 2025 due to global supply and demand dynamics for fertilizer products resulting in weakening pricing versus the comparable prior year period.
•Plant Nutrition operating loss increased $0.8 million to $3.1 million primarily due to lower average sales prices, which was mostly offset by higher sales volumes and lower per-unit product costs.
Outlook
•Following one of weakest winters in our served markets in nearly a quarter century, committed volumes for fiscal year 2025 in the North American highway deicing business are down approximately 9%. Despite these lower volume commitments, we expect Salt segment sales volumes to increase by approximately 7% year over year at the mid-point of our guidance range based on a reversion to more normalized weather. Pricing for the Salt segment is expected to decline slightly year over year, driven by lower North American highway deicing bid season results that saw average pricing contract due to excess supply across the system. Accordingly, we expect Salt segment sales volumes and adjusted EBITDA to range from 9.4 million to 10.5 million tons and $205 million to $230 million, respectively, in fiscal year 2025.
•Plant Nutrition segment sales volumes are expected to improve to a range of 295,000 to 315,000 tons in fiscal year 2025, improving from levels in fiscal year 2024. We expect lower average selling prices throughout fiscal 2025 due to anticipated weakness in global potash prices. For fiscal year 2025, we expect adjusted EBITDA in a range of $17 million to $24 million.
•Fiscal year 2025 capital expenditures are expected to be in the $75 million to $85 million range.
Liquidity and Capital Resources
Historically, our cash flows from operating activities have generally been adequate to fund our basic operating requirements, ongoing debt service and sustaining investment in our property, plant and equipment. We have also used cash generated from operations to fund capital expenditures, pay dividends, fund smaller acquisitions and repay our debt. To a certain extent, our ability to meet our short- and long-term liquidity and capital needs is subject to general economic, financial, competitive and weather conditions, effects of climate change, geological variations in our mine deposits and other factors that are beyond our control. Historically, our working capital requirements have been the highest in the first fiscal quarter (ending December 31) and lowest in the third fiscal quarter (ending June 30). When needed, we may fund short-term working capital requirements by accessing our $325 million revolving credit facility and our $100.0 million revolving AR Securitization Facility. As of December 31, 2024, we had liquidity of approximately $126.3 million, comprised of $45.8 million of cash and cash equivalents and $80.5 million of availability under our $325 million revolving credit facility.
We have been able to manage our cash flows generated and used across Compass Minerals to indefinitely reinvest earnings in our foreign jurisdictions or efficiently repatriate those funds to the U.S. As of December 31, 2024, we had $16.4 million of cash and cash equivalents that was either held directly or indirectly by foreign subsidiaries. In fiscal 2024 we did not repatriate any unremitted foreign earnings. It is our current intention to continue to reinvest undistributed earnings of our foreign subsidiaries indefinitely. We review our tax circumstances on a regular basis with the intent of optimizing cash accessibility and minimizing tax expense.
In addition, the amount of permanently reinvested earnings is influenced by, among other things, the profits generated by our foreign subsidiaries and the amount of investment in those same subsidiaries. The profits generated by our U.S. and foreign subsidiaries are impacted by the transfer price charged on the transfer of our products between them. Canadian provincial taxing authorities continue to challenge our transfer prices of certain items. The final resolution of these challenges may not occur for several years. We currently expect the outcome of these matters will not have a material impact on our results of operations. However, it is possible the resolution could materially impact the amount of earnings attributable to our foreign subsidiaries, which could impact the amount of permanently reinvested foreign earnings. See Item 1, Note 6 of our Consolidated Financial Statements for a discussion regarding our Canadian tax reassessments.
| | | | | | | | |
| | COMPASS MINERALS INTERNATIONAL, INC. |
Management assesses the available positive and negative evidence to estimate whether sufficient future taxable income will be generated to permit use of the existing deferred tax assets. A significant piece of objective negative evidence evaluated was the cumulative loss incurred in the U.S. over the three-year period ended December 31, 2024. Such objective evidence limits the ability to consider other subjective evidence, such as our projections for future income. On the basis of this evaluation, during the three months ended December 31, 2024, an additional valuation allowance of $9.5 million has been recorded to recognize only the portion of the U.S. deferred tax assets that are more likely than not to be realized. The amount of the deferred tax assets considered realizable, however, could be adjusted if estimates of future taxable income during the carryforward period are increased or reduced or if objective negative evidence in the form of cumulative losses is no longer present and additional weight is given to subjective evidence such as our projections for income.
Indebtedness
As of December 31, 2024, we had $980.3 million of outstanding indebtedness, consisting of $500.0 million outstanding under our 6.75% Senior Notes due 2027, $422.1 million of borrowings outstanding under our senior secured credit facilities under the Credit Agreement, consisting of $192.5 million of term loans and $229.6 million borrowed against our revolving credit facility, and $58.2 million of outstanding loans under the accounts receivable financing facility (see Item 1, Note 7 of our Consolidated Financial Statements for more detail regarding our debt). Outstanding letters of credit totaling $14.9 million as of December 31, 2024 further reduced available borrowing capacity under our revolving credit facility to $80.5 million.
We may borrow amounts under the revolving credit facility or enter into additional financing to fund our working capital requirements, potential acquisitions and capital expenditures and for other general corporate purposes.
Our ability to make scheduled interest and principal payments on our indebtedness, to modify our indebtedness, to fund planned capital expenditures and to fund acquisitions will depend on our ability to generate cash in the future. This, to a certain extent, is subject to general economic, financial, competitive, legislative, climate-related, regulatory and other factors that are beyond our control. Based on our current level of operations, we believe that cash flow from operations and available cash, together with available borrowings under our revolving credit facility, will be adequate to meet our liquidity needs over the next 12 months.
Our debt service obligations could, under certain circumstances, materially affect our financial condition and prevent us from fulfilling our debt obligations. As a holding company, CMI’s investments in its operating subsidiaries constitute substantially all of its assets. Consequently, our subsidiaries conduct substantially all of our consolidated operating activities and own substantially all of our operating assets. The principal source of the cash needed to pay our obligations is the cash generated from our subsidiaries’ operations and their borrowings. Furthermore, we must remain in compliance with the terms of the 2023 Credit Agreement governing our credit facilities, including the consolidated total net leverage ratio and interest coverage ratio, in order to pay dividends to our stockholders. We must also comply with the terms of our indenture governing our 6.75% Senior Notes due December 2027, which limit the amount of dividends we can pay to our stockholders.
On December 12, 2024, we entered into an amendment to our 2023 Credit Agreement, which, among other things, eased the restrictions of certain covenants contained in the agreement. The amendment included increasing the maximum allowed consolidated total net leverage ratio (as defined and calculated under the terms of the amended 2023 Credit Agreement) to 6.5x as of the last day of any quarter through the fiscal quarter ended September 30, 2025, then gradually stepping down to 4.50x for the fiscal quarter ended December 31, 2026 and thereafter. The amendment also decreased the Revolving Commitments (as defined in the Existing Credit Agreement) from $375 million to $325 million with additional reductions stepping down to $250 million on July 1, 2026. In connection with this amendment, we paid fees totaling $2.0 million which were capitalized as deferred financing costs. Additional arrangement and legal fees of $1.0 million were expensed as of December 31, 2024. As of December 31, 2024, our consolidated total net leverage ratio was approximately 5.9x.
Although we are in compliance with our debt covenants as of December 31, 2024, we can make no assurance that we will remain in compliance with these ratios. Furthermore, we may need to modify all or a portion of our indebtedness on or before maturity; however, we cannot provide assurance that we will be able to modify any of our indebtedness on commercially reasonable terms or at all.
Capital Allocation
Principally due to the nature of our deicing business, our cash flows from operations have historically been seasonal, with the majority of our cash flows from operations generated during the first half of the calendar year. When we have not been able to meet our short-term liquidity or capital needs with cash from operations, whether as a result of the seasonality of our business or other causes, we have met those needs with borrowings under our revolving credit facility. We expect to meet the ongoing
| | | | | | | | |
| | COMPASS MINERALS INTERNATIONAL, INC. |
requirements for debt service, any declared dividends and capital expenditures from these sources. This, to a certain extent, is subject to general economic, financial, competitive, legislative, regulatory and other factors that are beyond our control.
We manage our capital allocation considering our long-term strategic objectives, required spending to sustain our business and focus on generating adequate returns on capital. On April 22, 2024, our Board of Directors determined not to declare dividends for the foreseeable future in order to align our capital allocation policy with our corporate focus on accelerating cash flow generation and debt reduction. While our equipment and facilities are generally not impacted by rapid technology changes, our operations require refurbishments and replacements to maintain structural integrity and reliable production and shipping capabilities. When possible, we incorporate efficiency, environmental and safety improvement capabilities into our routine capital projects and we plan the timing of larger projects to balance with our liquidity and capital resources. Changes in our operating cash flows may affect our future capital allocation and spending.
The table below provides a summary of our cash flows by category:
| | | | | |
| THREE MONTHS ENDED DECEMBER 31, 2024 | THREE MONTHS ENDED DECEMBER 31, 2023 |
| Operating Activities: |
| Net cash used in operating activities were $4.1 million | Net cash used in operating activities were $52.3 million |
| » Net loss was $23.6 million. | » Net loss was $75.3 million. |
| » Non-cash depreciation and amortization expense was $26.8 million. | » Non-cash depreciation and amortization expense was $25.5 million. |
| » Non-cash stock-based compensation expense was $3.9 million. | » Non-cash stock-based compensation expense was $11.9 million. |
| » Unrealized foreign exchange gain of $5.7 million. | » Non-cash loss on impairments was $74.8 million. |
| » Working capital items were a use of operating cash flows of $8.1 million. | » Working capital items were a use of operating cash flows of $93.6 million. |
Investing Activities: |
| Net cash flows used in investing activities were $22.2 million. | Net cash flows used in investing activities were $49.3 million. |
| » Net cash flows used in investing activities included $21.8 million of capital expenditures. | » Net cash flows used in investing activities included $48.6 million of capital expenditures. |
Financing Activities: |
| Net cash flows provided by financing activities were $53.1 million. | Net cash flows provided by financing activities were $100.9 million. |
| » Included net proceeds from the issuance of debt of $57.5 million. | » Included net borrowings on our debt of $108.1 million. |
| » Included the payment of deferred financing costs of $2.4 million. | » Included the payment of dividends of $6.4 million. |
As mentioned above, our Salt segment’s business is seasonal and our Salt segment results and working capital needs are heavily impacted by the severity and timing of the winter weather, which generally occurs from December through March of each year. Customers tend to replenish their inventory prior to the start of the winter season and following snow events; consequently, the number and timing of snow events during the winter season will impact the amount of our accounts receivable and inventory at the end of each quarter. Our operating cash flows for the three months ended December 31, 2024, reflect the seasonal increase in accounts receivable and accounts payable and decrease in inventories due to the beginning of the winter season. Our operating cash flows during the three months ended December 31, 2023, reflect the seasonal increase in accounts receivable due to the beginning of the winter season. During the first quarter of fiscal 2024, we also paid liabilities accrued as of September 30, 2023, including the remaining $10 million settlement payment to the SEC, accrued incentive compensation, interest on our debt, income taxes and other liabilities. Additionally, at the end of Fortress’ contract term with the USFS, we recognized revenue previously deferred in accrued liabilities.
Product Recall
On October 25, 2024, we issued a recall for nine production lots of food-grade salt produced at our Goderich Plant following a customer report of a non-organic, foreign material in its product. The products recalled included both products sold prior and subsequent to September 30, 2024. We followed recall protocol and notified our BRCGS Global Standard for Food Safety certifying body, the Canadian Food Inspection Agency (“CFIA”) and the U.S. Food and Drug Administration (“FDA”). We have been working to obtain and assess the reported foreign material, complete the necessary investigation, and determine the next steps. For the three months ended December 31, 2024, we recognized $0.9 million for costs related to the recall on the
| | | | | | | | |
| | COMPASS MINERALS INTERNATIONAL, INC. |
Consolidated Statements of Operations, a portion of which we believe is reimbursable by insurance. Additionally, as of December 31, 2024, we have recorded reserves of $35.0 million and estimated insurance recoveries of $35.0 million in our Consolidated Balance Sheets associated with customer claims.
We continue to assess the scope and magnitude of additional customer claims. At this time, based on currently available information and our applicable insurance coverage, we do not believe any incremental losses will have a material adverse effect on our results of operations or cash flows in future periods.
Other Matters
See Item 1, Notes 6 and 8 of our Consolidated Financial Statements for a discussion regarding labor, environmental and litigation matters.
Reconciliation of Net Earnings (Loss) from Continuing Operations to EBITDA and Adjusted EBITDA
Management uses a variety of measures to evaluate our performance. While our consolidated financial statements, taken as a whole, provide an understanding of our overall results of operations, financial condition and cash flows, we analyze components of the consolidated financial statements to identify certain trends and evaluate specific performance areas. In addition to using U.S. GAAP financial measures, such as gross profit, net earnings and cash flows generated by operating activities, management uses EBITDA and Adjusted EBITDA. Both EBITDA and Adjusted EBITDA are non-GAAP financial measures used to evaluate the operating performance of our core business operations because our resource allocation, financing methods, cost of capital and income tax positions are managed at a corporate level, apart from the activities of the operating segments, and our operating facilities are located in different taxing jurisdictions, which can cause considerable variation in net earnings. We also use EBITDA and Adjusted EBITDA to assess our operating performance and return on capital against other companies, and to evaluate potential acquisitions or other capital projects. EBITDA and Adjusted EBITDA are not calculated under U.S. GAAP and should not be considered in isolation or as a substitute for net earnings, cash flows or other financial data prepared in accordance with U.S. GAAP or as a measure of our overall profitability or liquidity.
EBITDA and Adjusted EBITDA exclude interest expense, income taxes and depreciation and amortization, each of which are an essential element of our cost structure and cannot be eliminated. Furthermore, Adjusted EBITDA excludes other cash and non-cash items, including stock-based compensation, interest income, (gain) loss on foreign exchange, other (income) expense, net and other significant items that management does not consider indicative of normal operations. Other significant items, such as executive transition costs, restructuring charges and impairment charges involve distinct initiatives that are not reflective of core operating activities and affect the comparability of our operational results across reporting periods. Our borrowings are a significant component of our capital structure and interest expense is a continuing cost of debt. We are also required to pay income taxes, a required and ongoing consequence of our operations. We have a significant investment in capital assets and depreciation and amortization reflect the utilization of those assets in order to generate revenues. Our employees are vital to our operations and we utilize various stock-based awards to compensate and incentivize our employees. Consequently, any measure that excludes these elements has material limitations. While EBITDA and Adjusted EBITDA are frequently used as measures of operating performance, these terms are not necessarily comparable to similarly titled measures of other companies due to the potential inconsistencies in the method of calculation.
| | | | | | | | |
| | COMPASS MINERALS INTERNATIONAL, INC. |
The calculation of EBITDA and Adjusted EBITDA as used by management is set forth in the table below (in millions):
| | | | | | | | | | | | | | | |
| | Three Months Ended
December 31, | | |
| | 2024 | | 2023 | | | | |
| Net loss | $ | (23.6) | | | $ | (75.3) | | | | | |
| Interest expense | 16.9 | | | 15.9 | | | | | |
| Income tax expense | 9.7 | | | 3.6 | | | | | |
| Depreciation, depletion and amortization | 26.8 | | | 25.5 | | | | | |
| EBITDA | 29.8 | | | (30.3) | | | | | |
| Adjustments to EBITDA: | | | | | | | |
| Stock-based compensation - non-cash | 3.9 | | | 11.9 | | | | | |
| Interest income | (0.4) | | | (0.4) | | | | | |
| (Gain) loss on foreign exchange | (5.2) | | | 1.9 | | | | | |
| | | | | | | |
| | | | | | | |
Product recall costs(a) | 0.9 | | | — | | | | | |
Restructuring charges(b) | — | | | 3.6 | | | | | |
Loss on impairments(b) | — | | | 74.8 | | | | | |
| | | | | | | |
| Other expense, net | 3.1 | | | 0.7 | | | | | |
| Adjusted EBITDA | $ | 32.1 | | | $ | 62.2 | | | | | |
| | | | | | | |
| | | | | | | |
(a)We recognized costs related to a recall for food-grade salt produced at our Goderich Plant. Refer to Item 1, Note 8 for additional details. (b)As a result of the decision to cease the pursuit of the lithium development, we recognized severance of $2.5 million related to the termination of the lithium development and $1.1 million related to other restructuring. We also recognized an impairment of lithium long-lived assets, which were determined to be no longer probable of recovery.
Recent Accounting Pronouncements
See Part 1, Note 1 of our Consolidated Financial Statements for a discussion of recent accounting pronouncements.
Effects of Currency Fluctuations and Inflation
Our operations outside of the U.S. are conducted primarily in Canada and the U.K. Therefore, our results of operations are subject to both currency transaction risk and currency translation risk. We incur currency transaction risk whenever we or one of our subsidiaries enters into either a purchase or sales transaction using a currency other than the local currency of the transacting entity. With respect to currency translation risk, our financial condition and results of operations are measured and recorded in the relevant local currency and then translated into U.S. dollars for inclusion in our historical consolidated financial statements. Exchange rates between these currencies and the U.S. dollar have fluctuated significantly from time to time and may do so in the future. The majority of revenues and costs are denominated in U.S. dollars, with Canadian dollars and British pounds sterling also being significant. Significant changes in the value of the Canadian dollar or British pound sterling relative to the U.S. dollar could have a material adverse effect on our financial condition and our ability to meet interest and principal payments on U.S. dollar-denominated debt, including borrowings under our senior secured credit facilities.
Although inflation has not had a significant impact on our operations in the current period, our efforts to recover inflation-based cost increases from our customers may be hampered as a result of the structure of our contracts and the contract bidding process as well as the competitive industries, economic conditions and countries in which we operate. For more information, see Part I, Item 1A, “Risk Factors” in our 2024 Form 10-K.
Seasonality
We experience a substantial amount of seasonality in our sales, including our salt deicing product sales. Consequently, our Salt segment sales and operating income are generally higher in the first and second fiscal quarters (ending December 31 and March 31) and lower during the third and fourth fiscal quarters of each year (ending June 30 and September 30). In particular, sales of highway and consumer deicing salt and magnesium chloride products vary based on the severity of the winter conditions in areas where the product is used. Following industry practice in North America and the U.K., we seek to stockpile sufficient quantities of deicing salt throughout the first, third and fourth fiscal quarters (ending December 31, June 30 and September 30) to meet the estimated requirements for the winter season. Our Plant Nutrition business is also seasonal. As a result, we and our
| | | | | | | | |
| | COMPASS MINERALS INTERNATIONAL, INC. |
customers generally build inventories during the Plant Nutrition business’ low demand periods of the year (which are typically winter and summer, but can vary due to weather and other factors) to ensure timely product availability during the peak sales seasons (which are typically spring and autumn, but can also vary due to weather and other factors). Lastly, any expected results of our fire retardant business are also seasonal with peak demand for fire retardant products and services occurring from June through September.
Climate Change
The potential impact of climate change on our operations, product demand and the needs of our customers remains uncertain. Significant changes to weather patterns, a reduction in average snowfall or regional drought within our served markets or at our Ogden facility could negatively impact customer demand for our products and our costs, as well as our ability to produce our products. For example, prolonged periods of mild winter weather could reduce the demand for our deicing products. Drought or excessive precipitation could similarly impact demand for our SOP products, as well as continue to impact the amount and quality of feedstock used to produce SOP at our Ogden facility due to changes in brine levels, mineral concentrations or other factors, which could have a material impact on our Plant Nutrition results of operations. Climate change could also lead to disruptions in the production or distribution of our products due to major storm events or prolonged adverse conditions, changing temperature levels, lake level fluctuations or flooding from sea level changes. Climate change or governmental initiatives to address climate change may affect our operations and necessitate capital expenditures in the future, although capital expenditures for climate-related projects are not expected to be material in fiscal 2025. For more information, see Part I, Item 1A, “Risk Factors” and Part I, Item 1 “Business—Environmental, Health and Safety and Other Regulatory Matters” in our 2024 Form 10-K.
Item 3. Quantitative and Qualitative Disclosures About Market Risk
Our business is subject to various types of market risks that include interest rate risk, foreign currency exchange rate risk and commodity pricing risk. Management has taken actions to mitigate our exposure to commodity pricing and foreign currency exchange rate risk by entering into natural gas derivative instruments and foreign currency contracts. We may take further actions to mitigate our exposure to interest rates, exchange rates and changes in the cost of fuel consumed at our production locations or the cost of transporting our products due to variations in our contracted carriers’ cost of fuel, which is typically diesel fuel. However, there can be no assurance that our hedging activities will eliminate or substantially reduce these risks. We do not enter into any financial instrument arrangements for speculative purposes. Our market risk exposure related to these items has not changed materially since September 30, 2024.
Item 4. Controls and Procedures
Disclosure Controls and Procedures
Our Chief Executive Officer and Chief Financial Officer have conducted an evaluation of the effectiveness of the design and operation of the Company’s disclosure controls and procedures (as defined in Rule 13a-15(e) and 15d-15(e) under the Securities Exchange Act of 1934) as amended (the Exchange Act) under the supervision and with the participation of the Company’s management. Based on that evaluation, the Chief Executive Officer and Chief Financial Officer concluded that as a result of the material weaknesses in internal control over financial reporting as described below, the Company’s disclosure controls and procedures were ineffective as of December 31, 2024.
Per Rules 13a-15(e) and 15d-15(e), the term disclosure controls and procedures means controls and other procedures of an issuer that are designed to ensure that information required to be disclosed by the issuer in the reports that it files or submits under the Exchange Act (15 U.S.C. 78a et seq.) is recorded, processed, summarized, and reported within the time periods specified in the SEC’s rules and forms. Disclosure controls and procedures include, without limitation, controls and procedures designed to ensure that information required to be disclosed by an issuer in the reports that it files or submits under the Exchange Act is accumulated and communicated to the issuer’s management, including its Chief Executive Officer and Chief Financial Officer, or persons performing similar functions, as appropriate to allow timely decisions regarding required disclosure.
Our management, including our Chief Executive Officer and Chief Financial officer, does not expect that our disclosure controls and procedures or our internal control over financial reporting will prevent all errors and all fraud due to inherent limitations of internal controls. Because of such limitations, there is a risk that material misstatements will not be prevented or detected on a timely basis by internal control over financial reporting. However, these inherent limitations are known features of the financial reporting process. Therefore, it is possible to design into the process safeguards to reduce, though not eliminate, this risk.
| | | | | | | | |
| | COMPASS MINERALS INTERNATIONAL, INC. |
In light of the material weaknesses described below, management performed additional analysis and other procedures to ensure that our consolidated financial statements were prepared in accordance with U.S. generally accepted accounting principles (GAAP). Accordingly, our Chief Executive Officer and Chief Financial Officer have concluded that the Company’s Consolidated Financial Statements included in this Form 10-Q present fairly, in all material respects, our financial position, results of operations and cash flows for the periods presented in conformity with U.S. GAAP.
Because of its inherent limitations, internal control over financial reporting may not prevent or detect misstatements. Also, projections of any evaluation of effectiveness to future periods are subject to the risk that controls may become inadequate because of changes in conditions, or that the degree of compliance with the policies or procedures may deteriorate.
A material weakness, as defined in Rule 12b-2 under the Exchange Act, is a deficiency, or combination of control deficiencies, in internal control over financial reporting, such that there is a reasonable possibility that a material misstatement of the Company’s annual or interim consolidated financial statements will not be prevented or detected on a timely basis.
As disclosed in our Annual Report on Form 10-K for the fiscal year ended September 30, 2024, we previously identified material weaknesses in our internal control over financial reporting. The Company, due to a limited allocation of trained, knowledgeable resources, did not conduct an effective risk assessment process to identify and evaluate at a sufficient level of detail all relevant risks of material misstatement, including fraud risks associated with the necessary approval of transactions. Additionally, the Company did not have an effective information and communication process that identified and assessed the source of and controls necessary to ensure the reliability of information used in financial reporting and that ensured complete, reliable information was made available to financial reporting personnel on a timely basis to fulfill their roles and responsibilities. As a consequence of the material weaknesses described above, internal control deficiencies related to the design and operation of process-level controls were determined to be ineffective throughout the Company’s financial reporting processes.
Remediation Efforts and Status of Material Weakness
The material weaknesses identified as of September 30, 2024, noted above were not remediated and the Company determined there were inadequate controls in place to conduct an effective risk assessment process or to effectively identify and assess the controls necessary to ensure reliable information used in financial reporting.
Management is in the process of developing a remediation plan to address the material weaknesses discussed above, including the development and implementation of processes and controls over financial reporting. Remediation will not occur until the plan is implemented, the applicable controls have operated for a sufficient period of time and management has concluded, through testing, that the controls are designed and operating effectively.
We will monitor the effectiveness of our remediation measures in connection with our future assessments of the effectiveness of internal control over financial reporting and disclosure controls and procedures, and we will make any changes to the design of our plan and take such other actions that we deem appropriate given the circumstances.
Changes in Internal Control Over Financial Reporting
Other than the remediation efforts noted above, there were no changes in the Company’s internal control over financial reporting during the most recently completed fiscal quarter that have materially affected, or are reasonably likely to materially affect, the Company’s internal control over financial reporting.
| | | | | | | | |
| | COMPASS MINERALS INTERNATIONAL, INC. |
PART II. OTHER INFORMATION
Item 1. Legal Proceedings
We are involved in the legal proceedings described in Part I, Item 1, Note 6 and Part I, Item 1, Note 8 of our Consolidated Financial Statements and, from time to time, various routine legal proceedings and claims arising from the ordinary course of our business. These primarily involve tax assessments, disputes with former employees and contract labor, commercial claims, product liability claims, personal injury claims and workers’ compensation claims. Management cannot predict the outcome of legal proceedings and claims with certainty. Nevertheless, management believes that the outcome of legal proceedings and claims, which are pending or known to be threatened, even if determined adversely, will not, either individually or in the aggregate, have a material adverse effect on our results of operations, cash flows or financial condition, except as otherwise described in Part I, Item 1, Note 6 and Part I, Item 1, Note 8 of our Consolidated Financial Statements. There have been no material developments since September 30, 2024 with respect to our legal proceedings, except as described in Part I, Item 1, Note 6 and Part I, Item 1, Note 8 of our Consolidated Financial Statements.
Item 1A. Risk Factors
For a discussion of the risk factors applicable to Compass Minerals, please refer to Part I, Item 1A, “Risk Factors” in our Annual Report on Form 10-K for the annual period ended September 30, 2024.
Item 2. Unregistered Sales of Equity Securities and Use of Proceeds
(a)None.
(b)None.
(c)None.
Item 3. Defaults Upon Senior Securities
None.
Item 4. Mine Safety Disclosures
Information concerning mine safety violations or other regulatory matters required by Section 1503(a) of the Dodd-Frank Wall Street Reform and Consumer Protection Act and Item 104 of Regulation S-K is included in Exhibit 95 to this Quarterly Report on Form 10-Q.
Item 5. Other Information
Rule 10b5-1 Trading Plans
During the three months ended December 31, 2024, none of our directors or officers (as defined in Rule 16a-1(f) under the Exchange Act) adopted or terminated any contract, instruction or written plan for the purchase or sale of our securities that was intended to satisfy the affirmative defense conditions of Rule 10b5-1(c) under the Exchange Act or any “non-Rule 10b5-1 trading arrangement” as defined in Item 408(c) of Regulation S-K.
| | | | | | | | |
| | COMPASS MINERALS INTERNATIONAL, INC. |
Item 6. Exhibits
| | | | | | | | |
Exhibit
No. | | Exhibit Description |
| | |
| | |
| | |
| | |
| | |
| | |
| 101** | | The following financial statements from the Company’s Quarterly Report on Form 10-Q for the quarter ended December 31, 2024, formatted in Inline Extensible Business Reporting Language (iXBRL): (i) Consolidated Balance Sheets, (ii) Consolidated Statements of Operations, (iii) Consolidated Statements of Comprehensive Loss, (iv) Consolidated Statements of Stockholders’ Equity, (v) Consolidated Statements of Cash Flows, and (vi) the Notes to the Consolidated Financial Statements. |
| 104 | | Cover Page Interactive Data File (contained in Exhibit 101). |
| * Filed herewith |
| ** Furnished herewith |
| | | | | | | | |
| | COMPASS MINERALS INTERNATIONAL, INC. |
SIGNATURES
Pursuant to the requirements of the Securities Exchange Act of 1934, the registrant has duly caused this report to be signed on its behalf by the undersigned, thereunto duly authorized.
| | | | | | | | | | | |
| | COMPASS MINERALS INTERNATIONAL, INC. | |
| | | | |
| Date: February 10, 2025 | By: | /s/ Peter Fjellman | |
| | | Peter Fjellman | |
| | | Chief Financial Officer | |
| | | (Principal Financial Officer) | |