UNITED STATES
SECURITIES AND EXCHANGE COMMISSION
WASHINGTON, D.C. 20549
FORM 10-Q
(Mark One) | | | | | |
| ☒ | QUARTERLY REPORT PURSUANT TO SECTION 13 OR 15(d) OF THE SECURITIES EXCHANGE ACT OF 1934 |
For the quarterly period ended September 30, 2024
or | | | | | |
| ☐ | TRANSITION REPORT PURSUANT TO SECTION 13 OR 15(d) OF THE SECURITIES EXCHANGE ACT OF 1934 |
For the transition period from to .
Commission File Number: 001-31924
NELNET, INC.
(Exact name of registrant as specified in its charter) | | | | | | | | | | | |
| Nebraska | 84-0748903 |
| (State or other jurisdiction of incorporation or organization) | (I.R.S. Employer Identification No.) |
| | | |
| 121 South 13th Street, Suite 100 | | |
| Lincoln, | Nebraska | 68508 |
| (Address of principal executive offices) | (Zip Code) |
(402) 458-2370
(Registrant’s telephone number, including area code)
Securities registered pursuant to Section 12(b) of the Act:
| | | | | | | | |
| Title of each class | Trading Symbol | Name of each exchange on which registered |
| Class A Common Stock, Par Value $0.01 per Share | NNI | New York Stock Exchange |
Indicate by check mark whether the registrant (1) has filed all reports required to be filed by Section 13 or 15(d) of the Securities Exchange Act of 1934 during the preceding 12 months (or for such shorter period that the registrant was required to file such reports), and (2) has been subject to such filing requirements for the past 90 days. Yes ☒ No ☐
Indicate by check mark whether the registrant has submitted electronically every Interactive Data File required to be submitted pursuant to Rule 405 of Regulation S-T (§232.405 of this chapter) during the preceding 12 months (or for such shorter period that the registrant was required to submit such files). Yes ☒ No ☐
Indicate by check mark whether the registrant is a large accelerated filer, an accelerated filer, a non-accelerated filer, a smaller reporting company, or an emerging growth company. See the definitions of “large accelerated filer,” “accelerated filer,” “smaller reporting company,” and "emerging growth company" in Rule 12b-2 of the Exchange Act.
Large accelerated filer ☒ Accelerated filer ☐
Non-accelerated filer ☐ Smaller reporting company ☐
Emerging growth company ☐
If an emerging growth company, indicate by check mark if the registrant has elected not to use the extended transition period for complying with any new or revised financial accounting standards provided pursuant to Section 13(a) of the Exchange Act. ☐
Indicate by check mark whether the registrant is a shell company (as defined in Rule 12b-2 of the Exchange Act). Yes ☐ No ☒
As of October 31, 2024, there were 25,625,046 and 10,663,088 shares of Class A Common Stock and Class B Common Stock, par value $0.01 per share, outstanding, respectively (excluding 11,305,731 shares of Class A Common Stock held by wholly owned subsidiaries).
NELNET, INC.
FORM 10-Q
INDEX
September 30, 2024
| | | | | | | | | | | |
| |
| | Item 1. | | |
| | Item 2. | | |
| | Item 3. | | |
| | Item 4. | | |
| | | | |
| |
| Item 1. | | |
| | Item 1A. | | |
| | Item 2. | | |
| Item 5. | Other Information | |
| | Item 6. | | |
| | | | |
| | |
PART I. FINANCIAL INFORMATION
ITEM 1. FINANCIAL STATEMENTS
| | | | | | | | | | | |
| NELNET, INC. AND SUBSIDIARIES |
| CONSOLIDATED BALANCE SHEETS |
| (Dollars in thousands, except share data) |
| (unaudited) |
| | As of | | As of |
| | September 30, 2024 | | December 31, 2023 |
| Assets: | | | |
| Loans and accrued interest receivable (net of allowance for loan losses of $102,142 and $104,643, respectively) | $ | 10,572,881 | | | 13,108,204 | |
| Cash and cash equivalents: | | | |
| Cash and cash equivalents - not held at a related party | 90,731 | | | 34,912 | |
| Cash and cash equivalents - held at a related party | 128,953 | | | 133,200 | |
| Total cash and cash equivalents | 219,684 | | | 168,112 | |
| Investments and notes receivable (including investments at fair value of $996,385 and $988,841, respectively) | 1,903,561 | | | 1,846,707 | |
| Restricted cash | 344,366 | | | 488,723 | |
| Restricted cash - due to customers | 334,968 | | | 368,656 | |
| Restricted investments | 49,755 | | | 17,969 | |
| Accounts receivable (net of allowance for doubtful accounts of $3,675 and $4,304, respectively) | 153,638 | | | 196,200 | |
| Goodwill | 158,029 | | | 158,029 | |
| Intangible assets, net | 38,371 | | | 44,819 | |
| Property and equipment, net | 124,575 | | | 127,008 | |
| Other assets | 184,300 | | | 187,957 | |
| | | |
| Total assets | $ | 14,084,128 | | | 16,712,384 | |
| Liabilities: | | | |
| Bonds and notes payable | $ | 8,938,446 | | | 11,828,393 | |
| Accrued interest payable | 25,389 | | | 35,391 | |
| Bank deposits | 1,070,758 | | | 743,599 | |
| Other liabilities | 434,938 | | | 479,387 | |
| Due to customers | 404,459 | | | 425,507 | |
| | | |
| Total liabilities | 10,873,990 | | | 13,512,277 | |
| Commitments and contingencies | | | |
| Equity: | | | |
| Nelnet, Inc. shareholders' equity: | | | |
| Preferred stock, $0.01 par value. Authorized 50,000,000 shares; no shares issued or outstanding | — | | | — | |
| Common stock: | | | |
Class A, $0.01 par value. Authorized 600,000,000 shares; issued and outstanding 25,627,446 shares and 26,400,630 shares, respectively | 256 | | | 264 | |
Class B, convertible, $0.01 par value. Authorized 60,000,000 shares; issued and outstanding 10,663,088 shares | 107 | | | 107 | |
| Additional paid-in capital | 4,179 | | | 3,096 | |
| Retained earnings | 3,287,541 | | | 3,270,403 | |
| Accumulated other comprehensive loss, net | (1,431) | | | (20,119) | |
| Total Nelnet, Inc. shareholders' equity | 3,290,652 | | | 3,253,751 | |
| Noncontrolling interests | (80,514) | | | (53,644) | |
| Total equity | 3,210,138 | | | 3,200,107 | |
| Total liabilities and equity | $ | 14,084,128 | | | 16,712,384 | |
Supplemental information - assets and liabilities of consolidated education and other lending
variable interest entities: | | | |
| Loans and accrued interest receivable | $ | 9,842,750 | | | 12,676,932 | |
| Restricted cash | 323,936 | | | 451,932 | |
| | | |
| Bonds and notes payable | (9,182,445) | | | (12,006,170) | |
| Accrued interest payable and other liabilities | (98,744) | | | (135,748) | |
| | | |
| Net assets of consolidated education and other lending variable interest entities | $ | 885,497 | | | 986,946 | |
See accompanying notes to consolidated financial statements.
| | | | | | | | | | | | | | | | | | | | | | | |
| NELNET, INC. AND SUBSIDIARIES |
| CONSOLIDATED STATEMENTS OF INCOME |
| (Dollars in thousands, except share data) |
| (unaudited) |
| | Three months ended | | Nine months ended |
| | September 30, | | September 30, |
| | 2024 | | 2023 | | 2024 | | 2023 |
| Interest income: | | | | | | | |
| Loan interest | $ | 190,211 | | | 236,423 | | | 609,064 | | | 704,712 | |
| Investment interest | 50,272 | | | 48,128 | | | 143,086 | | | 129,835 | |
| Total interest income | 240,483 | | | 284,551 | | | 752,150 | | | 834,547 | |
| Interest expense on bonds and notes payable and bank deposits | 168,328 | | | 207,159 | | | 539,367 | | | 639,756 | |
| Net interest income | 72,155 | | | 77,392 | | | 212,783 | | | 194,791 | |
| Less provision for loan losses | 18,111 | | | 4,275 | | | 32,551 | | | 5,065 | |
| Net interest income after provision for loan losses | 54,044 | | | 73,117 | | | 180,232 | | | 189,726 | |
| Other income (expense): | | | | | | | |
| Loan servicing and systems revenue | 108,175 | | | 127,892 | | | 344,428 | | | 389,138 | |
| Education technology services and payments revenue | 118,179 | | | 113,796 | | | 378,627 | | | 357,258 | |
| Solar construction revenue | 19,321 | | | 6,301 | | | 42,741 | | | 19,687 | |
| Other, net | 32,325 | | | (3,062) | | | 78,057 | | | (27,297) | |
| Loss on sale of loans | (107) | | | (1,022) | | | (1,685) | | | (16,776) | |
| Impairment expense and provision for beneficial interests | (29,052) | | | (4,974) | | | (36,865) | | | (4,974) | |
| Derivative market value adjustments and derivative settlements, net | (11,525) | | | 3,957 | | | 1,378 | | | (8,047) | |
| Total other income (expense), net | 237,316 | | | 242,888 | | | 806,681 | | | 708,989 | |
| Cost of services: | | | | | | | |
| | | | | | | |
| Cost to provide education technology services and payments | 45,273 | | | 43,694 | | | 134,106 | | | 131,804 | |
| Cost to provide solar construction services | 26,815 | | | 7,783 | | | 49,115 | | | 25,204 | |
| Total cost of services | 72,088 | | | 51,477 | | | 183,221 | | | 157,008 | |
| Operating expenses: | | | | | | | |
| Salaries and benefits | 146,192 | | | 141,204 | | | 429,701 | | | 438,620 | |
| Depreciation and amortization | 13,661 | | | 21,835 | | | 45,572 | | | 57,114 | |
| Other expenses | 61,642 | | | 51,370 | | | 178,278 | | | 138,154 | |
| Total operating expenses | 221,495 | | | 214,409 | | | 653,551 | | | 633,888 | |
| (Loss) income before income taxes | (2,223) | | | 50,119 | | | 150,141 | | | 107,819 | |
| Income tax (benefit) expense | (282) | | | 10,512 | | | 37,653 | | | 28,785 | |
| Net (loss) income | (1,941) | | | 39,607 | | | 112,488 | | | 79,034 | |
| Net loss attributable to noncontrolling interests | 4,329 | | | 4,747 | | | 8,398 | | | 18,705 | |
| Net income attributable to Nelnet, Inc. | $ | 2,388 | | | 44,354 | | | 120,886 | | | 97,739 | |
| Earnings per common share: | | | | | | | |
| Net income attributable to Nelnet, Inc. shareholders - basic and diluted | $ | 0.07 | | | 1.18 | | | 3.29 | | | 2.61 | |
| Weighted average common shares outstanding - basic and diluted | 36,430,485 | | | 37,498,073 | | | 36,703,314 | | | 37,437,587 | |
See accompanying notes to consolidated financial statements.
| | | | | | | | | | | | | | | | | | | | | | | | | | | | | | | | | | | | | | | | | | | | | | | |
| NELNET, INC. AND SUBSIDIARIES |
| CONSOLIDATED STATEMENTS OF COMPREHENSIVE INCOME |
| (Dollars in thousands) |
| (unaudited) |
| Three months ended September 30, | | Nine months ended September 30, |
| 2024 | | 2023 | | 2024 | | 2023 |
| Net (loss) income | | | $ | (1,941) | | | | | 39,607 | | | | | 112,488 | | | | | 79,034 | |
| Other comprehensive income (loss): | | | | | | | | | | | | | | | |
| Net changes related to foreign currency translation adjustments | $ | | 23 | | | | | (8) | | | | | 6 | | | | | (11) | |
| Net changes related to available-for-sale debt securities: | | | | | | | | | | | | | | | |
| Unrealized holding gains (losses) arising during period, net | 2,656 | | | | | (4,566) | | | | | 28,291 | | | | | 12,734 | | | |
| Reclassification of (gains) losses recognized in net income, net | (1,721) | | | | | (1,064) | | | | | (3,326) | | | | | 3,001 | | | |
| Amortization of net unrealized loss on securities transferred from available-for-sale to held-to-maturity | 64 | | | | | 66 | | | | | 186 | | | | | 136 | | | |
| Income tax effect | (240) | | | 759 | | | 1,335 | | | (4,229) | | | (6,036) | | | 19,115 | | | (3,810) | | | 12,061 | |
| Net changes related to equity method investee's other comprehensive income: | | | | | | | | | | | | | | | |
| Gain (loss) on cash flow hedge | 62 | | | | | 336 | | | | | (570) | | | | | (163) | | | |
| Income tax effect | (15) | | | 47 | | | (80) | | | 256 | | | 137 | | | (433) | | | 40 | | | (123) | |
| Other comprehensive income (loss) | | | 829 | | | | | (3,981) | | | | | 18,688 | | | | | 11,927 | |
| Comprehensive (loss) income | | | (1,112) | | | | | 35,626 | | | | | 131,176 | | | | | 90,961 | |
| Comprehensive loss attributable to noncontrolling interests | | | 4,329 | | | | | 4,747 | | | | | 8,398 | | | | | 18,705 | |
| Comprehensive income attributable to Nelnet, Inc. | | | $ | 3,217 | | | | | 40,373 | | | | | 139,574 | | | | | 109,666 | |
See accompanying notes to consolidated financial statements.
| | | | | | | | | | | | | | | | | | | | | | | | | | | | | | | | | | | | | | | | | | | | | | | | | | | | | | | | | | | | | | | | | |
| NELNET, INC. AND SUBSIDIARIES |
| CONSOLIDATED STATEMENTS OF SHAREHOLDERS' EQUITY |
| (Dollars in thousands, except share data) |
| (unaudited) |
| | Nelnet, Inc. Shareholders | | | |
| | Preferred stock shares | | Common stock shares | | Preferred stock | | Class A common stock | | Class B common stock | | Additional paid-in capital | | Retained earnings | | Accumulated other comprehensive loss | | Noncontrolling interests | | Total equity |
| | | Class A | | Class B | | | | | | | | |
| Balance as of June 30, 2023 | — | | 26,646,490 | | 10,668,460 | | $ | — | | | 266 | | | 107 | | | 10,114 | | | 3,261,717 | | | (21,458) | | | (22,619) | | | 3,228,127 | |
| Net income (loss) | — | | — | | — | | — | | | — | | | — | | | — | | | 44,354 | | | — | | | (4,747) | | | 39,607 | |
| Other comprehensive loss | — | | — | | — | | — | | | — | | | — | | | — | | | — | | | (3,981) | | | — | | | (3,981) | |
| Issuance of noncontrolling interests | — | | — | | — | | — | | | — | | | — | | | — | | | — | | | — | | | 19,092 | | | 19,092 | |
| Distribution to noncontrolling interests | — | | — | | — | | — | | | — | | | — | | | — | | | — | | | — | | | (40,057) | | | (40,057) | |
| Cash dividends on Class A and Class B common stock - $0.26 per share | — | | — | | — | | — | | | — | | | — | | | — | | | (9,701) | | | — | | | — | | | (9,701) | |
| Issuance of common stock, net of forfeitures | — | | 15,109 | | — | | — | | | 1 | | | — | | | 499 | | | — | | | — | | | — | | | 500 | |
| Compensation expense for stock based awards | — | | — | | — | | — | | | — | | | — | | | 4,095 | | | — | | | — | | | — | | | 4,095 | |
| Repurchase of common stock | — | | (5,948) | | — | | — | | | — | | | — | | | (543) | | | — | | | — | | | — | | | (543) | |
| | | | | | | | | | | | | | | | | | | | | |
| | | | | | | | | | | | | | | | | | | | | |
| | | | | | | | | | | | | | | | | | | | | |
| | | | | | | | | | | | | | | | | | | | | |
| | | | | | | | | | | | | | | | | | | | | |
| | | | | | | | | | | | | | | | | | | | | |
| Balance as of September 30, 2023 | — | | 26,655,651 | | 10,668,460 | | $ | — | | | 267 | | | 107 | | | 14,165 | | | 3,296,370 | | | (25,439) | | | (48,331) | | | 3,237,139 | |
| | | | | | | | | | | | | | | | | | | | | |
| Balance as of June 30, 2024 | — | | 25,585,840 | | 10,663,088 | | $ | — | | | 256 | | | 107 | | | 657 | | | 3,295,301 | | | (2,260) | | | (74,039) | | | 3,220,022 | |
| Net income (loss) | — | | — | | — | | — | | | — | | | — | | | — | | | 2,388 | | | — | | | (4,329) | | | (1,941) | |
| Other comprehensive income | — | | — | | — | | — | | | — | | | — | | | — | | | — | | | 829 | | | — | | | 829 | |
| Issuance of noncontrolling interests | — | | — | | — | | — | | | — | | | — | | | — | | | — | | | — | | | 20,999 | | | 20,999 | |
| Distribution to noncontrolling interests | — | | — | | — | | — | | | — | | | — | | | — | | | — | | | — | | | (23,145) | | | (23,145) | |
| Cash dividends on Class A and Class B common stock - $0.28 per share | — | | — | | — | | — | | | — | | | — | | | — | | | (10,148) | | | — | | | — | | | (10,148) | |
| Issuance of common stock, net of forfeitures | — | | 46,865 | | — | | — | | | — | | | — | | | 1,230 | | | — | | | — | | | — | | | 1,230 | |
| Compensation expense for stock based awards | — | | — | | — | | — | | | — | | | — | | | 2,868 | | | — | | | — | | | — | | | 2,868 | |
| Repurchase of common stock | — | | (5,259) | | — | | — | | | — | | | — | | | (576) | | | — | | | — | | | — | | | (576) | |
| | | | | | | | | | | | | | | | | | | | | |
| | | | | | | | | | | | | | | | | | | | | |
| | | | | | | | | | | | | | | | | | | | | |
| | | | | | | | | | | | | | | | | | | | | |
| | | | | | | | | | | | | | | | | | | | | |
| Balance as of September 30, 2024 | — | | 25,627,446 | | 10,663,088 | | $ | — | | | 256 | | | 107 | | | 4,179 | | | 3,287,541 | | | (1,431) | | | (80,514) | | | 3,210,138 | |
See accompanying notes to consolidated financial statements.
| | | | | | | | | | | | | | | | | | | | | | | | | | | | | | | | | | | | | | | | | | | | | | | | | | | | | | | | | | | | | | | | | |
| | | | | | | | | | | | | | | | | | | | | |
|
| NELNET, INC. AND SUBSIDIARIES |
| CONSOLIDATED STATEMENTS OF SHAREHOLDERS' EQUITY |
| (Dollars in thousands, except share data) |
| (unaudited) |
| Nelnet, Inc. Shareholders | | | |
| Preferred stock shares | | Common stock shares | | Preferred stock | | Class A common stock | | Class B common stock | | Additional paid-in capital | | Retained earnings | | Accumulated other comprehensive loss | | Noncontrolling interests | | Total equity |
| | Class A | | Class B | | | | | | | | |
| Balance as of December 31, 2022 | — | | 26,461,651 | | 10,668,460 | | $ | — | | | 265 | | | 107 | | | 1,109 | | | 3,227,680 | | | (37,366) | | | (8,596) | | | 3,183,199 | |
| Net income (loss) | — | | — | | — | | — | | | — | | | — | | | — | | | 97,739 | | | — | | | (18,705) | | | 79,034 | |
| Other comprehensive income | — | | — | | — | | — | | | — | | | — | | | — | | | — | | | 11,927 | | | — | | | 11,927 | |
| Issuance of noncontrolling interests | — | | — | | — | | — | | | — | | | — | | | — | | | — | | | — | | | 31,996 | | | 31,996 | |
| Distribution to noncontrolling interests | — | | — | | — | | — | | | — | | | — | | | — | | | — | | | — | | | (53,026) | | | (53,026) | |
| Cash dividends on Class A and Class B common stock - $0.78 per share | — | | — | | — | | — | | | — | | | — | | | — | | | (29,049) | | | — | | | — | | | (29,049) | |
| Issuance of common stock, net of forfeitures | — | | 241,195 | | — | | — | | | 2 | | | — | | | 5,618 | | | — | | | — | | | — | | | 5,620 | |
| Compensation expense for stock based awards | — | | — | | — | | — | | | — | | | — | | | 11,748 | | | — | | | — | | | — | | | 11,748 | |
| Repurchase of common stock | — | | (47,195) | | — | | — | | | — | | | — | | | (4,310) | | | — | | | — | | | — | | | (4,310) | |
| | | | | | | | | | | | | | | | | | | | | |
| | | | | | | | | | | | | | | | | | | | | |
| | | | | | | | | | | | | | | | | | | | | |
| | | | | | | | | | | | | | | | | | | | | |
| | | | | | | | | | | | | | | | | | | | | |
| Balance as of September 30, 2023 | — | | 26,655,651 | | 10,668,460 | | $ | — | | | 267 | | | 107 | | | 14,165 | | | 3,296,370 | | | (25,439) | | | (48,331) | | | 3,237,139 | |
| | | | | | | | | | | | | | | | | | | | | |
| Balance as of December 31, 2023 | — | | 26,400,630 | | 10,663,088 | | $ | — | | | 264 | | | 107 | | | 3,096 | | | 3,270,403 | | | (20,119) | | | (53,644) | | | 3,200,107 | |
| Net income (loss) | — | | — | | — | | — | | | — | | | — | | | — | | | 120,886 | | | — | | | (8,398) | | | 112,488 | |
| Other comprehensive income | — | | — | | — | | — | | | — | | | — | | | — | | | — | | | 18,688 | | | — | | | 18,688 | |
| Issuance of noncontrolling interests | — | | — | | — | | — | | | — | | | — | | | — | | | — | | | — | | | 29,150 | | | 29,150 | |
| Distribution to noncontrolling interests | — | | — | | — | | — | | | — | | | — | | | — | | | — | | | — | | | (49,715) | | | (49,715) | |
| Cash dividends on Class A and Class B common stock - $0.84 per share | — | | — | | — | | — | | | — | | | — | | | — | | | (30,676) | | | — | | | — | | | (30,676) | |
| Issuance of common stock, net of forfeitures | — | | 116,779 | | — | | — | | | 1 | | | — | | | 4,526 | | | — | | | — | | | — | | | 4,527 | |
| Compensation expense for stock based awards | — | | — | | — | | — | | | — | | | — | | | 8,703 | | | — | | | — | | | — | | | 8,703 | |
| Repurchase of common stock | — | | (889,963) | | — | | — | | | (9) | | | — | | | (12,146) | | | (70,732) | | | — | | | — | | | (82,887) | |
| | | | | | | | | | | | | | | | | | | | | |
| Acquisition of remaining 20% of GRNE Solar, net of tax | — | | — | | — | | — | | | — | | | — | | | — | | | (2,340) | | | — | | | 2,093 | | | (247) | |
| | | | | | | | | | | | | | | | | | | | | |
| | | | | | | | | | | | | | | | | | | | | |
| | | | | | | | | | | | | | | | | | | | | |
| | | | | | | | | | | | | | | | | | | | | |
| Balance as of September 30, 2024 | — | | 25,627,446 | | 10,663,088 | | $ | — | | | 256 | | | 107 | | | 4,179 | | | 3,287,541 | | | (1,431) | | | (80,514) | | | 3,210,138 | |
See accompanying notes to consolidated financial statements.
| | | | | | | | | | | |
| NELNET, INC. AND SUBSIDIARIES |
| CONSOLIDATED STATEMENTS OF CASH FLOWS |
| (Dollars in thousands) |
| (unaudited) |
| | Nine months ended |
| September 30, |
| | 2024 | | 2023 |
| Net income attributable to Nelnet, Inc. | $ | 120,886 | | | 97,739 | |
| Net loss attributable to noncontrolling interests | (8,398) | | | (18,705) | |
| Net income | 112,488 | | | 79,034 | |
| Adjustments to reconcile net income to net cash provided by operating activities: | | | |
| Depreciation and amortization, including debt discounts and loan premiums and deferred origination costs | 106,022 | | | 128,658 | |
| Loan discount and deferred lender fees accretion | (36,838) | | | (22,527) | |
| Provision for loan losses | 32,551 | | | 5,065 | |
| Derivative market value adjustments | 3,668 | | | 32,266 | |
| | | |
| Proceeds from termination of derivative instruments | — | | | 164,079 | |
| | | |
| Payments to clearinghouse - initial and variation margin, net | (4,404) | | | (210,168) | |
| | | |
| Loss on sale of loans | 1,685 | | | 16,776 | |
| Loss on investments, net | 6,595 | | | 73,296 | |
| | | |
| | | |
| | | |
| | | |
| Deferred income tax benefit | (22,707) | | | (25,403) | |
| Non-cash compensation expense | 8,954 | | | 11,981 | |
| Impairment expense and provision for beneficial interests | 36,865 | | | 2,588 | |
| Decrease in loan and investment accrued interest receivable | 168,795 | | | 5,613 | |
| Decrease in accounts receivable | 42,553 | | | 64,738 | |
| Decrease in other assets, net | 48,059 | | | 7,069 | |
| Decrease in the carrying amount of ROU asset, net | 2,857 | | | 3,859 | |
| (Decrease) increase in accrued interest payable | (10,002) | | | 342 | |
| (Decrease) increase in other liabilities | (11,435) | | | 19,132 | |
| Decrease in the carrying amount of lease liability | (2,868) | | | (3,908) | |
| Other | (481) | | | 75 | |
| Net cash provided by operating activities | 482,357 | | | 352,565 | |
| Cash flows from investing activities: | | | |
| Purchases and originations of loans | (611,595) | | | (556,255) | |
| Purchases of loans from a related party | (104,198) | | | (467,554) | |
| Net proceeds from loan repayments, claims, and capitalized interest | 2,745,084 | | | 1,910,379 | |
| Proceeds from sale of loans | 291,693 | | | 341,760 | |
| Purchases of available-for-sale securities | (391,018) | | | (510,804) | |
| Purchases of restricted available-for-sale securities | (23,288) | | | — | |
| Proceeds from sales of available-for-sale securities | 370,896 | | | 776,096 | |
| Proceeds from sales of restricted available-for-sale securities | 1,280 | | | — | |
| Proceeds from beneficial interest in loan securitizations | 33,898 | | | 23,753 | |
| Purchases of other investments and issuance of notes receivable | (287,590) | | | (179,632) | |
| Proceeds from other investments and repayments of notes receivable | 79,095 | | | 30,417 | |
| Purchases of held-to-maturity debt securities | — | | | (11,325) | |
| Redemption of held-to-maturity debt securities | 11,890 | | | 2,893 | |
| Purchases of property and equipment | (38,280) | | | (52,604) | |
| | | |
| | | |
| | | |
| Net cash provided by investing activities | $ | 2,077,867 | | | 1,307,124 | |
| | | |
| | | |
| | | | | | | | | | | |
| NELNET, INC. AND SUBSIDIARIES |
| CONSOLIDATED STATEMENTS OF CASH FLOWS (Continued) |
| Nine months ended |
| September 30, |
| 2024 | | 2023 |
| Cash flows from financing activities: | | | |
| Payments on bonds and notes payable | $ | (3,010,914) | | | (2,996,916) | |
| Proceeds from issuance of bonds and notes payable | 85,037 | | | 756,268 | |
| Payments of debt issuance costs | (2,191) | | | (2,233) | |
| | | |
| | | |
| Increase in bank deposits, net | 327,159 | | | 26,731 | |
| Decrease in due to customers | (21,185) | | | (6,422) | |
| Dividends paid | (30,676) | | | (29,049) | |
| Repurchases of common stock | (82,887) | | | (4,310) | |
| Proceeds from issuance of common stock | 1,424 | | | 1,315 | |
| Acquisition of noncontrolling interest | (325) | | | — | |
| Issuance of noncontrolling interests | 51,245 | | | 32,581 | |
| Distribution to noncontrolling interests | (3,587) | | | (2,519) | |
| Net cash used in financing activities | (2,686,900) | | | (2,224,554) | |
| Effect of exchange rate changes on cash and restricted cash | 203 | | | (206) | |
| Net decrease in cash, cash equivalents, and restricted cash | (126,473) | | | (565,071) | |
| Cash, cash equivalents, and restricted cash, beginning of period | 1,025,491 | | | 1,357,616 | |
| Cash, cash equivalents, and restricted cash, end of period | $ | 899,018 | | | 792,545 | |
| | | | | | | | | | | |
| Supplemental disclosures of cash flow information: | | | |
| Cash disbursements made for interest | $ | 511,247 | | | 585,482 | |
| Cash disbursements made for income taxes, net of refunds and credits received (a) | $ | 13,441 | | | 45,444 | |
| Cash disbursements made for operating leases | $ | 3,615 | | | 5,029 | |
| Non-cash operating, investing, and financing activity: | | | |
| | | |
| ROU assets obtained in exchange for lease obligations | $ | 1,048 | | | 18,860 | |
| Receipt of beneficial interest in consumer loan securitizations as consideration from sale of loans | $ | 13,799 | | | 63,878 | |
| Receipt of asset-backed investment securities as consideration from sale of loans | $ | 20,250 | | | 58,182 | |
| Transfer of available-for-sale securities to restricted investments | $ | 8,262 | | | — | |
| Distribution to noncontrolling interests | $ | 46,128 | | | 50,508 | |
| Issuance of noncontrolling interests | $ | 22,095 | | | 585 | |
(a) The Company utilized $34.0 million and $49.0 million of federal and state tax credits related primarily to renewable energy during the nine months ended September 30, 2024 and 2023, respectively.
The following table presents a reconciliation of cash, cash equivalents, and restricted cash reported in the consolidated balance sheets to the total of the amounts reported in the consolidated statements of cash flows.
| | | | | | | | | | | | | | | | | | | | | | | |
| As of | | As of | | As of | | As of |
| September 30, 2024 | | December 31, 2023 | | September 30, 2023 | | December 31, 2022 |
| Total cash and cash equivalents | $ | 219,684 | | | 168,112 | | | 187,690 | | | 118,146 | |
| Restricted cash | 344,366 | | | 488,723 | | | 445,983 | | | 945,159 | |
| Restricted cash - due to customers | 334,968 | | | 368,656 | | | 158,872 | | | 294,311 | |
| Cash, cash equivalents, and restricted cash | $ | 899,018 | | | 1,025,491 | | | 792,545 | | | 1,357,616 | |
See accompanying notes to consolidated financial statements.
NELNET, INC. AND SUBSIDIARIES
NOTES TO CONSOLIDATED FINANCIAL STATEMENTS
(Dollars in thousands, except per share amounts, unless otherwise noted)
(unaudited)
1. Basis of Financial Reporting
The accompanying unaudited consolidated financial statements of Nelnet, Inc. and subsidiaries (the “Company”) as of September 30, 2024 and for the three and nine months ended September 30, 2024 and 2023 have been prepared on the same basis as the audited consolidated financial statements for the year ended December 31, 2023 and, in the opinion of the Company’s management, the unaudited consolidated financial statements reflect all adjustments, consisting of normal recurring adjustments, necessary for a fair presentation of results of operations for the interim periods presented. The preparation of financial statements in conformity with U.S. generally accepted accounting principles (GAAP) requires management to make estimates and assumptions that affect the amounts reported in the consolidated financial statements and accompanying notes. Actual results could differ from those estimates. Operating results for the three and nine months ended September 30, 2024 are not necessarily indicative of the results for the year ending December 31, 2024. The unaudited consolidated financial statements should be read in conjunction with the Company’s Annual Report on Form 10-K for the year ended December 31, 2023 (the "2023 Annual Report").
2. Reclassifications and Immaterial Error Corrections
During the second quarter of 2024, the Company identified certain immaterial errors in the previously issued consolidated financial statements that have been corrected to conform to the September 30, 2024 presentation.
Loan Sales
The Company determined the reversal of provision for loan losses resulting from the sale of loans should be presented as a reduction to the provision for loan losses rather than the historical presentation as a gain/(loss) on sale of loans included in "other income (expense)" on the consolidated statements of income. Prior period amounts have been corrected to conform to the current period presentation resulting in a reclassification of $6.4 million and $49.5 million for the three and nine months ended September 30, 2023, respectively. This correction had no impact on previously reported consolidated assets, liabilities, equity, net income, and cash flows from operating activities.
Solar Tax Equity Investments
The Company relies on audited financial statements provided by third parties to record its share of earnings or losses on its solar tax equity investments. The Company determined that the Hypothetical Liquidation at Book Value (HLBV) method of accounting was not consistently adopted by all third parties in such audited financial statements for those solar tax equity investments made under a lease pass-through structure. The adoption of the HLBV method of accounting accelerates accounting losses in the initial years of the investment but has no impact on the overall economics of the transaction. During the second quarter of 2024, the Company fully adopted HLBV accounting for these investments and prior period amounts have been corrected, resulting in an increase in solar investment losses included in "other, net" in "other income (expense)" on the consolidated statements of income of $2.9 million and $6.0 million for the three and nine months ended September 30, 2023, respectively, partially offset by an increase in "net loss attributable to noncontrolling interests" of $1.7 million and $3.0 million for the three and nine months ended September 30, 2023, respectively. The after-tax net income impact to Nelnet, Inc. was a reduction of $1.0 million and $2.3 million for the three and nine months ended September 30, 2023, respectively. Consolidated "total equity" on the consolidated balance sheet was reduced $21.8 million as of December 31, 2023 and $16.7 million as of December 31, 2022, with the 2022 impact reflecting the cumulative impact of this correction through such date.
3. Loans and Accrued Interest Receivable and Allowance for Loan Losses
Loans and accrued interest receivable consisted of the following:
| | | | | | | | | | | |
| As of | | As of |
| | September 30, 2024 | | December 31, 2023 |
| Non-Nelnet Bank: | | | |
| Federally insured loans: | | | |
| Stafford and other | $ | 2,202,590 | | | 2,936,174 | |
| Consolidation | 6,868,152 | | | 8,750,033 | |
| Total | 9,070,742 | | | 11,686,207 | |
| Private education loans | 234,295 | | | 277,320 | |
| Consumer and other loans | 244,552 | | | 85,935 | |
| Non-Nelnet Bank loans | 9,549,589 | | | 12,049,462 | |
| Nelnet Bank: | | | |
| | | |
| | | |
| | | |
| | | |
| Private education loans | 352,654 | | | 360,520 | |
| Consumer and other loans | 207,218 | | | 72,352 | |
| Nelnet Bank loans | 559,872 | | | 432,872 | |
| | | |
| Accrued interest receivable | 600,097 | | | 764,385 | |
| Loan discount and deferred lender fees, net of unamortized loan premiums and deferred origination costs | (34,535) | | | (33,872) | |
| Allowance for loan losses: | | | |
| Non-Nelnet Bank: | | | |
| Federally insured loans | (50,834) | | | (68,453) | |
| Private education loans | (11,744) | | | (15,750) | |
| Consumer and other loans | (22,380) | | | (11,742) | |
| Non-Nelnet Bank allowance for loan losses | (84,958) | | | (95,945) | |
| Nelnet Bank: | | | |
| | | |
| Private education loans | (3,670) | | | (3,347) | |
| Consumer and other loans | (13,514) | | | (5,351) | |
| Nelnet Bank allowance for loan losses | (17,184) | | | (8,698) | |
| | $ | 10,572,881 | | | 13,108,204 | |
The following table summarizes the allowance for loan losses as a percentage of the ending loan balance for each of the Company's loan portfolios.
| | | | | | | | | | | |
| As of | | As of |
| September 30, 2024 | | December 31, 2023 |
| Non-Nelnet Bank: | | | |
| Federally insured loans (a) | 0.56 | % | | 0.59 | % |
| Private education loans | 5.01 | % | | 5.68 | % |
| Consumer and other loans (b) | 9.15 | % | | 13.66 | % |
| Nelnet Bank: | | | |
| | | |
| Private education loans | 1.04 | % | | 0.93 | % |
| Consumer and other loans (b) | 6.52 | % | | 7.40 | % |
(a) As of September 30, 2024 and December 31, 2023, the allowance for loan losses as a percent of the risk sharing component of federally insured student loans not covered by the federal guaranty was 20.7% and 21.8%, respectively.
(b) Decrease as of September 30, 2024 compared with December 31, 2023 is due to the change in the mix of loans outstanding at the end of each period reported.
Loan Sales
During the three months ended September 30, 2024 and 2023, the Company sold $1.1 million and $61.8 million, respectively, of consumer loans, and recognized losses from such sales of $0.1 million and $1.0 million, respectively. During the nine months ended September 30, 2024 and 2023, the Company sold $335.0 million and $482.0 million, respectively, of FFELP and consumer loans, and recognized losses from such sales of $1.7 million and $16.8 million, respectively. For certain of these loan sales, the Company has sold portfolios of loans to unrelated third parties who securitized such loans. As partial consideration received for the loans sold, the Company received residual interest in the loan securitizations and asset-backed investment securities that are included in "investments and notes receivable" on the Company's consolidated balance sheets.
Activity in the Allowance for Loan Losses
The following table presents the activity in the allowance for loan losses by portfolio segment.
| | | | | | | | | | | | | | | | | | | | | | | | | | | | | | | | | |
| Balance at beginning of period | | Provision (negative provision) for loan losses (a) | | Charge-offs | | Recoveries | | | | | | Balance at end of period |
| Three months ended September 30, 2024 |
| Non-Nelnet Bank: | | | | | | | | | | | | | |
| Federally insured loans | $ | 54,180 | | | 1,247 | | | (4,593) | | | — | | | | | | | 50,834 | |
| Private education loans | 13,065 | | | (126) | | | (1,414) | | | 219 | | | | | | | 11,744 | |
| Consumer and other loans | 14,135 | | | 10,847 | | | (2,981) | | | 379 | | | | | | | 22,380 | |
| Nelnet Bank: | | | | | | | | | | | | | |
| | | | | | | | | | | | | |
| Private education loans | 3,559 | | | 565 | | | (892) | | | 438 | | | | | | | 3,670 | |
| Consumer and other loans | 11,825 | | | 5,326 | | | (3,830) | | | 193 | | | | | | | 13,514 | |
| $ | 96,764 | | | 17,859 | | | (13,710) | | | 1,229 | | | | | | | 102,142 | |
| | | | | | | | | | | | | |
| Three months ended September 30, 2023 |
| Non-Nelnet Bank: | | | | | | | | | | | | | |
| Federally insured loans | $ | 74,061 | | | 1,641 | | | (3,659) | | | — | | | | | | | 72,043 | |
| Private education loans | 14,322 | | | 3,009 | | | (571) | | | 184 | | | | | | | 16,944 | |
| Consumer and other loans | 20,005 | | | (2,302) | | | (4,115) | | | 434 | | | | | | | 14,022 | |
| Nelnet Bank: | | | | | | | | | | | | | |
| Federally insured loans | 154 | | | (2) | | | (4) | | | — | | | | | | | 148 | |
| Private education loans | 2,905 | | | 220 | | | (42) | | | — | | | | | | | 3,083 | |
| Consumer and other loans | 2,816 | | | 1,554 | | | (517) | | | — | | | | | | | 3,853 | |
| $ | 114,263 | | | 4,120 | | | (8,908) | | | 618 | | | | | | | 110,093 | |
| | | | | | | | | | | | | |
| Nine months ended September 30, 2024 |
| Non-Nelnet Bank: | | | | | | | | | | | | | |
| Federally insured loans | $ | 68,453 | | | (2,593) | | | (15,026) | | | — | | | | | | | 50,834 | |
| Private education loans | 15,750 | | | (392) | | | (4,254) | | | 640 | | | | | | | 11,744 | |
| Consumer and other loans | 11,742 | | | 17,184 | | | (7,567) | | | 1,021 | | | | | | | 22,380 | |
| Nelnet Bank: | | | | | | | | | | | | | |
| | | | | | | | | | | | | |
| Private education loans | 3,347 | | | 1,576 | | | (1,796) | | | 543 | | | | | | | 3,670 | |
| Consumer and other loans | 5,351 | | | 16,563 | | | (8,635) | | | 235 | | | | | | | 13,514 | |
| $ | 104,643 | | | 32,338 | | | (37,278) | | | 2,439 | | | | | | | 102,142 | |
| | | | | | | | | | | | | |
| Nine months ended September 30, 2023 |
| Non-Nelnet Bank: | | | | | | | | | | | | | |
| Federally insured loans | $ | 83,593 | | | 4,052 | | | (15,602) | | | — | | | | | | | 72,043 | |
| Private education loans | 15,411 | | | 3,249 | | | (2,279) | | | 563 | | | | | | | 16,944 | |
| Consumer and other loans | 30,263 | | | (8,073) | | | (9,264) | | | 1,096 | | | | | | | 14,022 | |
| Nelnet Bank: | | | | | | | | | | | | | |
| Federally insured loans | 170 | | | (15) | | | (7) | | | — | | | | | | | 148 | |
| Private education loans | 2,390 | | | 1,350 | | | (657) | | | — | | | | | | | 3,083 | |
| Consumer and other loans | — | | | 4,370 | | | (517) | | | — | | | | | | | 3,853 | |
| $ | 131,827 | | | 4,933 | | | (28,326) | | | 1,659 | | | | | | | 110,093 | |
(a) The following table presents the reduction to provision for loan losses as a result of the loan sales described under "Loan Sales" above.
| | | | | | | | | | | | | | | | | |
| Provision for current period | | Loan sale reduction to provision | | Provision
(negative provision) for loan losses |
| Three months ended September 30, 2024 |
| Non-Nelnet Bank | | | | | |
| Consumer and other loans | $ | 11,026 | | | (179) | | | 10,847 | |
| | | | | |
| Three months ended September 30, 2023 |
| Non-Nelnet Bank | | | | | |
| Consumer and other loans | $ | 4,082 | | | (6,384) | | | (2,302) | |
| | | | | |
| Nine months ended September 30, 2024 |
| Non-Nelnet Bank | | | | | |
| Consumer and other loans | $ | 30,058 | | | (12,874) | | | 17,184 | |
| | | | | |
| Nine months ended September 30, 2023 |
| Non-Nelnet Bank | | | | | |
| Consumer and other loans | $ | 41,388 | | | (49,461) | | | (8,073) | |
The following table summarizes annualized net charge-offs as a percentage of average loans for each of the Company's loan portfolios.
| | | | | | | | | | | | | | | | | | | | | | | |
| Three months ended September 30, | | Nine months ended September 30, |
| 2024 | | 2023 | | 2024 | | 2023 |
| Non-Nelnet Bank: | | | | | | | |
| Federally insured loans | 0.19 | % | | 0.11 | % | | 0.19 | % | | 0.16 | % |
| Private education loans | 1.97 | % | | 0.61 | % | | 1.89 | % | | 0.94 | % |
| Consumer and other loans | 4.81 | % | | 9.57 | % | | 4.92 | % | | 4.59 | % |
| Nelnet Bank: | | | | | | | |
| Federally insured loans | — | | | 0.03 | % | | — | | | 0.01 | % |
| Private education loans | 0.51 | % | | 0.05 | % | | 0.46 | % | | 0.25 | % |
| Consumer and other loans | 7.28 | % | | 5.69 | % | | 7.49 | % | | 3.00 | % |
The primary items impacting provision for loan losses during the periods presented above were the establishment of an initial allowance for consumer and other loans originated and acquired and the reversal of provision for consumer and other loans sold.
Unfunded Loan Commitments
As of September 30, 2024 and December 31, 2023, Nelnet Bank had a liability of approximately $371,000 and $158,000, respectively, related to $29.9 million and $12.3 million, respectively, of unfunded private education, consumer, and other loan commitments. When a new loan commitment is made, the Company records an allowance that is included in "other liabilities" on the consolidated balance sheet by recording a provision for loan losses. When the loan is funded, the Company transfers the liability to the allowance for loan losses. Below is a reconciliation of the provision for loan losses reported in the consolidated statements of income.
| | | | | | | | | | | | | | | | | | | | | | | |
| Three months ended | | Nine months ended |
| September 30, | | September 30, |
| 2024 | | 2023 | | 2024 | | 2023 |
| Provision for loan losses from allowance activity table above | $ | 17,859 | | | 4,120 | | | 32,338 | | | 4,933 | |
| Provision for unfunded loan commitments | 252 | | | 155 | | | 213 | | | 132 | |
| Provision for loan losses reported in consolidated statements of income | $ | 18,111 | | | 4,275 | | | 32,551 | | | 5,065 | |
Key Credit Quality Indicators
Loan Status and Delinquencies
Key credit quality indicators for the Company’s federally insured, private education, consumer, and other loan portfolios are loan status, including delinquencies. The impact of changes in loan status is incorporated into the allowance for loan losses calculation. Delinquencies have the potential to adversely impact the Company’s earnings through increased servicing and collection costs and account charge-offs. Loans in repayment include loans on which borrowers are making interest only or fixed payments, as well as loans that have entered full principal and interest repayment status after any applicable grace period (but, for purposes of the following tables, do not include those loans while they are in forbearance). The following table presents the Company’s loan status and delinquency amounts.
| | | | | | | | | | | | | | | | | | | | | | | | | | | | | | | | | | | | | | | | | | | | | | | | | | | | | |
| As of September 30, 2024 | | As of December 31, 2023 | | As of September 30, 2023 |
| Federally insured loans - Non-Nelnet Bank: | | | | | | | | | | | | | | | | | |
| Loans in-school/grace/deferment | $ | 428,013 | | | 4.7 | % | | | | $ | 522,304 | | | 4.5 | % | | | | $ | 562,754 | | | 4.6 | % | | |
| Loans in forbearance | 647,797 | | | 7.2 | | | | | 979,588 | | | 8.4 | | | | | 906,060 | | | 7.4 | | | |
| Loans in repayment status: | | | | | | | | | | | | | | | | | |
| Loans current | 6,702,079 | | | | | 83.8 | % | | 8,416,624 | | | | | 82.6 | % | | 9,014,731 | | | | | 83.2 | % |
| Loans delinquent 31-60 days | 348,833 | | | | | 4.4 | | | 377,108 | | | | | 3.7 | | | 441,016 | | | | | 4.1 | |
| Loans delinquent 61-90 days | 190,379 | | | | | 2.4 | | | 254,553 | | | | | 2.5 | | | 301,028 | | | | | 2.8 | |
| Loans delinquent 91-120 days | 148,417 | | | | | 1.9 | | | 187,145 | | | | | 1.9 | | | 213,245 | | | | | 2.0 | |
| Loans delinquent 121-270 days | 419,730 | | | | | 5.2 | | | 685,829 | | | | | 6.7 | | | 648,924 | | | | | 6.0 | |
| Loans delinquent 271 days or greater | 185,494 | | | | | 2.3 | | | 263,056 | | | | | 2.6 | | | 211,226 | | | | | 1.9 | |
| Total loans in repayment | 7,994,932 | | | 88.1 | | | 100.0 | % | | 10,184,315 | | | 87.1 | | | 100.0 | % | | 10,830,170 | | | 88.0 | | | 100.0 | % |
| Total federally insured loans | 9,070,742 | | | 100.0 | % | | | | 11,686,207 | | | 100.0 | % | | | | 12,298,984 | | | 100.0 | % | | |
| Accrued interest receivable | 592,250 | | | | | | | 757,713 | | | | | | | 798,102 | | | | | |
| Loan discount, net of unamortized premiums and deferred origination costs | (22,807) | | | | | | | (28,963) | | | | | | | (30,979) | | | | | |
| Allowance for loan losses | (50,834) | | | | | | | (68,453) | | | | | | | (72,043) | | | | | |
| Total federally insured loans and accrued interest receivable, net of allowance for loan losses | $ | 9,589,351 | | | | | | | $ | 12,346,504 | | | | | | | $ | 12,994,064 | | | | | |
| | | | | | | | | | | | | | | | | |
| | | | | | | | | | | | | | | | | |
| | | | | | | | | | | | | | | | | |
| | | | | |
| Private education loans - Non-Nelnet Bank: | | | | | | | | | | | | | | | | | |
| Loans in-school/grace/deferment | $ | 7,504 | | | 3.2 | % | | | | $ | 9,475 | | | 3.4 | % | | | | $ | 11,373 | | | 3.9 | % | | |
| Loans in forbearance | 1,979 | | | 0.8 | | | | | 2,529 | | | 0.9 | | | | | 2,280 | | | 0.8 | | | |
| Loans in repayment status: | | | | | | | | | | | | | | | | | |
| Loans current | 218,425 | | | | | 97.2 | % | | 257,639 | | | | | 97.1 | % | | 271,948 | | | | | 97.4 | % |
| Loans delinquent 31-60 days | 3,013 | | | | | 1.3 | | | 3,395 | | | | | 1.3 | | | 3,485 | | | | | 1.2 | |
| Loans delinquent 61-90 days | 1,301 | | | | | 0.6 | | | 1,855 | | | | | 0.7 | | | 1,424 | | | | | 0.5 | |
| Loans delinquent 91 days or greater | 2,073 | | | | | 0.9 | | | 2,427 | | | | | 0.9 | | | 2,494 | | | | | 0.9 | |
| Total loans in repayment | 224,812 | | | 96.0 | | | 100.0 | % | | 265,316 | | | 95.7 | | | 100.0 | % | | 279,351 | | | 95.3 | | | 100.0 | % |
| Total private education loans | 234,295 | | | 100.0 | % | | | | 277,320 | | | 100.0 | % | | | | 293,004 | | | 100.0 | % | | |
| Accrued interest receivable | 2,248 | | | | | | | 2,653 | | | | | | | 2,750 | | | | | |
| Loan discount, net of unamortized premiums | (6,772) | | | | | | | (8,037) | | | | | | | (8,069) | | | | | |
| Allowance for loan losses | (11,744) | | | | | | | (15,750) | | | | | | | (16,944) | | | | | |
| Total private education loans and accrued interest receivable, net of allowance for loan losses | $ | 218,027 | | | | | | | $ | 256,186 | | | | | | | $ | 270,741 | | | | | |
| | | | | | | | | | | | | | | | | |
| | | | | |
| Consumer and other loans - Non-Nelnet Bank: | | | | | | | | | | | | | | | | | |
| Loans in deferment | $ | 315 | | | 0.1 | % | | | | $ | 146 | | | 0.2 | % | | | | $ | 20 | | | 0.0 | % | | |
| Loans in repayment status: | | | | | | | | | | | | | | | | | |
| Loans current | 239,128 | | | | | 97.9 | % | | 81,195 | | | | | 94.6 | % | | 137,744 | | | | | 95.9 | % |
| Loans delinquent 31-60 days | 2,032 | | | | | 0.8 | | | 2,035 | | | | | 2.4 | | | 1,987 | | | | | 1.4 | |
| Loans delinquent 61-90 days | 1,515 | | | | | 0.6 | | | 1,189 | | | | | 1.4 | | | 1,293 | | | | | 0.9 | |
| Loans delinquent 91 days or greater | 1,562 | | | | | 0.7 | | | 1,370 | | | | | 1.6 | | | 2,589 | | | | | 1.8 | |
| Total loans in repayment | 244,237 | | | 99.9 | | | 100.0 | % | | 85,789 | | | 99.8 | | | 100.0 | % | | 143,613 | | | 100.0 | | | 100.0 | % |
| Total consumer and other loans | 244,552 | | | 100.0 | % | | | | 85,935 | | | 100.0 | % | | | | 143,633 | | | 100.0 | % | | |
| Accrued interest receivable | 1,115 | | | | | | | 861 | | | | | | | 1,716 | | | | | |
| Loan discount and deferred lender fees, net of unamortized premiums | (10,789) | | | | | | | (2,474) | | | | | | | (180) | | | | | |
| Allowance for loan losses | (22,380) | | | | | | | (11,742) | | | | | | | (14,022) | | | | | |
| Total consumer and other loans and accrued interest receivable, net of allowance for loan losses | $ | 212,498 | | | | | | | $ | 72,580 | | | | | | | $ | 131,147 | | | | | |
| | | | | | | | | | | | | | | | | |
| | | | | | | | | | | | | | | | | |
| | | | | | | | | | | | | | | | | |
| | | | | |
| | | | | | | | | | | | | | | | | |
| | | | | | | | | | | | | | | | | |
| | | | | | | | | | | | | | | | | |
| | | | | | | | | | | | | | | | | |
| | | | | | | | | | | | | | | | | |
| | | | | | | | | | | | | | | | | |
| | | | | | | | | | | | | | | | | |
| | | | | | | | | | | | | | | | | |
| | | | | | | | | | | | | | | | | |
| | | | | | | | | | | | | | | | | |
| | | | | | | | | | | | | | | | | |
| | | | | | | | | | | | | | | | | |
| | | | | | | | | | | | | | | | | |
| | | | | | | | | | | | | | | | | |
| | | | | | | | | | | | | | | | | |
| | | | | | | | | | | | | | | | | |
| | | | | | | | | | | | | | | | | |
| | | | | | | | | | | | | | | | | | | | | | | | | | | | | | | | | | | | | | | | | | | | | | | | | | | | | |
| | | | | | | | | | | | | | | | | |
| As of September 30, 2024 | | As of December 31, 2023 | | As of September 30, 2023 |
| Private education loans - Nelnet Bank (a): | | | | | | | | | | | | | | | | | |
| Loans in-school/grace/deferment | $ | 29,396 | | | 8.3 | % | | | | $ | 19,089 | | | 5.3 | % | | | | $ | 20,537 | | | 5.7 | % | | |
| Loans in forbearance | 2,364 | | | 0.7 | | | | | 1,285 | | | 0.4 | | | | | 1,169 | | | 0.3 | | | |
| Loans in repayment status: | | | | | | | | | | | | | | | | | |
| Loans current | 318,090 | | | | | 99.2 | % | | 338,448 | | | | | 99.5 | % | | 336,602 | | | | | 99.5 | % |
| Loans delinquent 30-59 days | 1,075 | | | | | 0.3 | | | 839 | | | | | 0.2 | | | 691 | | | | | 0.2 | |
| Loans delinquent 60-89 days | 723 | | | | | 0.2 | | | 253 | | | | | 0.1 | | | 428 | | | | | 0.1 | |
| Loans delinquent 90 days or greater | 1,006 | | | | | 0.3 | | | 606 | | | | | 0.2 | | | 514 | | | | | 0.2 | |
| Total loans in repayment | 320,894 | | | 91.0 | | | 100.0 | % | | 340,146 | | | 94.3 | | | 100.0 | % | | 338,235 | | | 94.0 | | | 100.0 | % |
| Total private education loans | 352,654 | | | 100.0 | % | | | | 360,520 | | | 100.0 | % | | | | 359,941 | | | 100.0 | % | | |
| Accrued interest receivable | 3,098 | | | | | | | 2,023 | | | | | | | 1,905 | | | | | |
| Deferred origination costs, net of unaccreted discount | 5,786 | | | | | | | 5,608 | | | | | | | 5,578 | | | | | |
| Allowance for loan losses | (3,670) | | | | | | | (3,347) | | | | | | | (3,083) | | | | | |
| Total private education loans and accrued interest receivable, net of allowance for loan losses | $ | 357,868 | | | | | | | $ | 364,804 | | | | | | | $ | 364,341 | | | | | |
| | | | | | | | | | | | | | | | | |
| | | | | |
| Consumer and other loans - Nelnet Bank (a): | | | | | | | | | | | | | | | | | |
| Loans in deferment | $ | 3,073 | | | 1.5 | % | | | | $ | 103 | | | 0.1 | % | | | | $ | 95 | | | 0.2 | % | | |
| Loans in forbearance | — | | | — | | | | | — | | | — | | | | | 32 | | | 0.1 | | | |
| Loans in repayment status: | | | | | | | | | | | | | | | | | |
| Loans current | 198,613 | | | | | 97.3 | % | | 69,584 | | | | | 96.3 | % | | 48,358 | | | | | 97.7 | % |
| Loans delinquent 30-59 days | 2,251 | | | | | 1.1 | | | 1,075 | | | | | 1.5 | | | 527 | | | | | 1.1 | |
| Loans delinquent 60-89 days | 1,497 | | | | | 0.7 | | | 941 | | | | | 1.3 | | | 306 | | | | | 0.6 | |
| Loans delinquent 90 days or greater | 1,784 | | | | | 0.9 | | | 649 | | | | | 0.9 | | | 293 | | | | | 0.6 | |
| Total loans in repayment | 204,145 | | | 98.5 | | | 100.0 | % | | 72,249 | | | 99.9 | | | 100.0 | % | | 49,484 | | | 99.7 | | | 100.0 | % |
| Total consumer and other loans | 207,218 | | | 100.0 | % | | | | 72,352 | | | 100.0 | % | | | | 49,611 | | | 100.0 | % | | |
| Accrued interest receivable | 1,386 | | | | | | | 575 | | | | | | | 373 | | | | | |
| Loan premium, net of unaccreted discount | 47 | | | | | | | (6) | | | | | | | (7) | | | | | |
| Allowance for loan losses | (13,514) | | | | | | | (5,351) | | | | | | | (3,853) | | | | | |
| Total consumer and other loans and accrued interest receivable, net of allowance for loan losses | $ | 195,137 | | | | | | | $ | 67,570 | | | | | | | $ | 46,124 | | | | | |
(a) For the periods presented for Nelnet Bank, the delinquency bucket periods conform with the delinquency bucket periods reflected in Nelnet Bank's Call Reports filed with the Federal Deposit Insurance Corporation.
FICO Scores
An additional key credit quality indicator for Nelnet Bank private education and consumer loans is FICO scores at the time of origination. The following tables highlight the gross principal balance of Nelnet Bank's portfolios, by year of origination, stratified by FICO score at the time of origination.
Nelnet Bank Private Education Loans
| | | | | | | | | | | | | | | | | | | | | | | | | | | | | | | | | | | |
| Loan balance as of September 30, 2024 |
| Nine months ended September 30, 2024 | | 2023 | | 2022 | | 2021 | | 2020 | | Total |
| FICO at origination: | | | | | | | | | | | |
| Less than 705 | $ | 1,090 | | | 3,793 | | | 4,964 | | | 4,302 | | | 334 | | | 14,483 | |
| 705 - 734 | 2,209 | | | 9,425 | | | 20,475 | | | 7,739 | | | 432 | | | 40,280 | |
| 735 - 764 | 2,720 | | | 8,973 | | | 30,669 | | | 13,177 | | | 1,260 | | | 56,799 | |
| 765 - 794 | 2,715 | | | 6,368 | | | 47,803 | | | 24,872 | | | 1,197 | | | 82,955 | |
| Greater than 794 | 7,079 | | | 16,546 | | | 70,172 | | | 51,544 | | | 4,589 | | | 149,930 | |
| No FICO score available or required (a) | 2,553 | | | 5,654 | | | — | | | — | | | — | | | 8,207 | |
| $ | 18,366 | | | 50,759 | | | 174,083 | | | 101,634 | | | 7,812 | | | 352,654 | |
| | | | | | | | | | | | | | | | | | | | | | | | | | | | | |
| Loan balance as of December 31, 2023 |
| 2023 | | 2022 | | 2021 | | 2020 | | Total |
| FICO at origination: | | | | | | | | | |
| Less than 705 | $ | 3,840 | | | 5,495 | | | 4,647 | | | 386 | | | 14,368 | |
| 705 - 734 | 9,534 | | | 21,961 | | | 8,805 | | | 525 | | | 40,825 | |
| 735 - 764 | 8,648 | | | 32,969 | | | 14,910 | | | 1,358 | | | 57,885 | |
| 765 - 794 | 5,776 | | | 52,045 | | | 27,221 | | | 1,374 | | | 86,416 | |
| Greater than 794 | 15,057 | | | 77,996 | | | 58,695 | | | 5,226 | | | 156,974 | |
| No FICO score available or required (a) | 4,052 | | | — | | | — | | | — | | | 4,052 | |
| $ | 46,907 | | | 190,466 | | | 114,278 | | | 8,869 | | | 360,520 | |
Nelnet Bank Consumer and Other Loans
| | | | | | | | | | | | | | | | | | | | | | | | | | | | | | | | | | | | | | | | | |
| Loan balance as of September 30, 2024 |
| Nine months ended September 30, 2024 | | 2023 | | 2022 | | 2021 | | 2020 | | Prior years | | Total |
| FICO at origination: | | | | | | | | | | | | | |
| Less than 720 | $ | 18,676 | | | 13,850 | | | — | | | 1,274 | | | 1,574 | | | 1,569 | | | 36,943 | |
| 720 - 769 | 49,525 | | | 25,932 | | | 19 | | | 6,782 | | | 5,559 | | | 3,266 | | | 91,083 | |
| Greater than 769 | 50,565 | | | 16,902 | | | 104 | | | 4,737 | | | 2,156 | | | 975 | | | 75,439 | |
| No FICO score available or required (a) | 2,981 | | | 438 | | | 280 | | | 54 | | | — | | | — | | | 3,753 | |
| $ | 121,747 | | | 57,122 | | | 403 | | | 12,847 | | | 9,289 | | | 5,810 | | | 207,218 | |
| | | | | | | | | | | | | | | | | | | | | | | | | | | | | | | | | | | |
| Loan balance as of December 31, 2023 |
| 2023 | | 2022 | | 2021 | | 2020 | | Prior years | | Total |
| FICO at origination: | | | | | | | | | | | |
| Less than 720 | $ | 21,412 | | | — | | | — | | | — | | | — | | | 21,412 | |
| 720 - 769 | 33,571 | | | 51 | | | — | | | — | | | — | | | 33,622 | |
| Greater than 769 | 16,484 | | | 109 | | | — | | | — | | | — | | | 16,593 | |
| No FICO score available or required (a) | 386 | | | 284 | | | 55 | | | — | | | — | | | 725 | |
| $ | 71,853 | | | 444 | | | 55 | | | — | | | — | | | 72,352 | |
(a) Loans with no FICO score available or required refers to loans issued to borrowers for which the Company cannot obtain a FICO score or are not required to under a special purpose credit program. Management proactively assesses the risk and size of this loan category and, when necessary, takes actions to mitigate the credit risk.
Nonaccrual Status
The Company does not place federally insured loans on nonaccrual status due to the government guaranty. The amortized cost of private education, consumer, and other loans on nonaccrual status, as well as the allowance for loan losses related to such loans, as of September 30, 2024 and December 31, 2023, was not material.
Amortized Cost Basis by Origination Year
The following table presents the amortized cost of the Company's private education, consumer, and other loans by loan status and delinquency amount as of September 30, 2024 based on year of origination. Effective July 1, 2010, no new loan originations can be made under the FFEL Program and all new federal loan originations must be made under the Federal Direct Loan Program. As such, all of the Company’s federally insured loans were originated prior to July 1, 2010.
| | | | | | | | | | | | | | | | | | | | | | | | | | | | | | | | | | | | | | | | | |
| Nine months ended September 30, 2024 | | 2023 | | 2022 | | 2021 | | 2020 | | Prior years | | Total |
| Private education loans - Non-Nelnet Bank: | | | | | | | | | | | | | |
| Loans in-school/grace/deferment | $ | — | | | — | | | 685 | | | 3,364 | | | 769 | | | 2,686 | | | 7,504 | |
| Loans in forbearance | — | | | — | | | 29 | | | 185 | | | 422 | | | 1,343 | | | 1,979 | |
| Loans in repayment status: | | | | | | | | | | | | | |
| Loans current | — | | | 200 | | | 4,211 | | | 4,737 | | | 40,986 | | | 168,291 | | | 218,425 | |
| Loans delinquent 31-60 days | — | | | — | | | 21 | | | 32 | | | 398 | | | 2,562 | | | 3,013 | |
| Loans delinquent 61-90 days | — | | | — | | | 8 | | | 46 | | | 3 | | | 1,244 | | | 1,301 | |
| Loans delinquent 91 days or greater | — | | | — | | | — | | | 12 | | | 114 | | | 1,947 | | | 2,073 | |
| Total loans in repayment | — | | | 200 | | | 4,240 | | | 4,827 | | | 41,501 | | | 174,044 | | | 224,812 | |
| Total private education loans | $ | — | | | 200 | | | 4,954 | | | 8,376 | | | 42,692 | | | 178,073 | | | 234,295 | |
| Accrued interest receivable | | | | | | | | | | | | | 2,248 | |
| Loan discount, net of unamortized premiums | | | | | | | | | | | | | (6,772) | |
| Allowance for loan losses | | | | | | | | | | | | | (11,744) | |
| Total private education loans and accrued interest receivable, net of allowance for loan losses | | | | | | | | | | | | | $ | 218,027 | |
| Gross charge-offs - nine months ended September 30, 2024 | $ | — | | | — | | | — | | | 84 | | | 208 | | | 3,962 | | | 4,254 | |
| | | | | | | | | | | | | |
| | | | | | | | | | | | | |
| | | | | | | | | | | | | |
| Consumer and other loans - Non-Nelnet Bank: | | | | | | | | | | | | | |
| Loans in deferment | $ | — | | | 315 | | | — | | | — | | | — | | | — | | | 315 | |
| Loans in repayment status: | | | | | | | | | | | | | |
| Loans current | 204,317 | | | 31,099 | | | 3,002 | | | 379 | | | 254 | | | 77 | | | 239,128 | |
| Loans delinquent 31-60 days | 856 | | | 960 | | | 163 | | | 45 | | | 6 | | | 2 | | | 2,032 | |
| Loans delinquent 61-90 days | 409 | | | 951 | | | 145 | | | 10 | | | — | | | — | | | 1,515 | |
| Loans delinquent 91 days or greater | 187 | | | 841 | | | 426 | | | 103 | | | — | | | 5 | | | 1,562 | |
| Total loans in repayment | 205,769 | | | 33,851 | | | 3,736 | | | 537 | | | 260 | | | 84 | | | 244,237 | |
| Total consumer and other loans | $ | 205,769 | | | 34,166 | | | 3,736 | | | 537 | | | 260 | | | 84 | | | 244,552 | |
| Accrued interest receivable | | | | | | | | | | | | | 1,115 | |
| Loan discount and deferred lender fees, net of unamortized premiums | | | | | | | | | | | | | (10,789) | |
| Allowance for loan losses | | | | | | | | | | | | | (22,380) | |
| Total consumer and other loans and accrued interest receivable, net of allowance for loan losses | | | | | | | | | | | | | $ | 212,498 | |
| Gross charge-offs - nine months ended September 30, 2024 | $ | 56 | | | 5,389 | | | 1,793 | | | 227 | | | 40 | | | 62 | | | 7,567 | |
| | | | | | | | | | | | | |
| | | | | | | | | | | | | |
| | | | | | | | | | | | | |
| Private education loans - Nelnet Bank (a): | | | | | | | | | | | | | |
| Loans in-school/grace/deferment | $ | 9,440 | | | 11,529 | | | 7,434 | | | 587 | | | 406 | | | — | | | 29,396 | |
| Loans in forbearance | 22 | | | 139 | | | 1,444 | | | 759 | | | — | | | — | | | 2,364 | |
| Loans in repayment status: | | | | | | | | | | | | | |
| Loans current | 8,674 | | | 37,936 | | | 164,277 | | | 99,922 | | | 7,281 | | | — | | | 318,090 | |
| Loans delinquent 30-59 days | 133 | | | 460 | | | 194 | | | 163 | | | 125 | | | — | | | 1,075 | |
| Loans delinquent 60-89 days | 53 | | | 279 | | | 255 | | | 136 | | | — | | | — | | | 723 | |
| Loans delinquent 90 days or greater | 44 | | | 416 | | | 479 | | | 67 | | | — | | | — | | | 1,006 | |
| Total loans in repayment | 8,904 | | | 39,091 | | | 165,205 | | | 100,288 | | | 7,406 | | | — | | | 320,894 | |
| Total private education loans | $ | 18,366 | | | 50,759 | | | 174,083 | | | 101,634 | | | 7,812 | | | — | | | 352,654 | |
| Accrued interest receivable | | | | | | | | | | | | | 3,098 | |
| Deferred origination costs, net of unaccreted discount | | | | | | | | | | | | | 5,786 | |
| Allowance for loan losses | | | | | | | | | | | | | (3,670) | |
| Total private education loans and accrued interest receivable, net of allowance for loan losses | | | | | | | | | | | | | $ | 357,868 | |
| Gross charge-offs - nine months ended September 30, 2024 | $ | 48 | | | 816 | | | 600 | | | 285 | | | 47 | | | — | | | 1,796 | |
| | | | | | | | | | | | | |
| | | | | | | | | | | | | | | | | | | | | | | | | | | | | | | | | | | | | | | | | |
| | | | | | | | | | | | | |
| Nine months ended September 30, 2024 | | 2023 | | 2022 | | 2021 | | 2020 | | Prior years | | Total |
| Consumer and other loans - Nelnet Bank (a): | | | | | | | | | | | | | |
| Loans in deferment | $ | 3,029 | | | 44 | | | — | | | — | | | — | | | — | | | 3,073 | |
| | | | | | | | | | | | | |
| Loans in repayment status: | | | | | | | | | | | | | |
| Loans current | 117,453 | | | 53,106 | | | 403 | | | 12,642 | | | 9,249 | | | 5,760 | | | 198,613 | |
| Loans delinquent 30-59 days | 787 | | | 1,320 | | | — | | | 87 | | | 19 | | | 38 | | | 2,251 | |
| Loans delinquent 60-89 days | 272 | | | 1,081 | | | — | | | 118 | | | 21 | | | 5 | | | 1,497 | |
| Loans delinquent 90 days or greater | 206 | | | 1,571 | | | — | | | — | | | — | | | 7 | | | 1,784 | |
| Total loans in repayment | 118,718 | | | 57,078 | | | 403 | | | 12,847 | | | 9,289 | | | 5,810 | | | 204,145 | |
| Total consumer and other loans | $ | 121,747 | | | 57,122 | | | 403 | | | 12,847 | | | 9,289 | | | 5,810 | | | 207,218 | |
| Accrued interest receivable | | | | | | | | | | | | | 1,386 | |
| Loan premium, net of unaccreted discount | | | | | | | | | | | | | 47 | |
| Allowance for loan losses | | | | | | | | | | | | | (13,514) | |
| Total consumer and other loans and accrued interest receivable, net of allowance for loan losses | | | | | | | | | | | | | $ | 195,137 | |
| Gross charge-offs - nine months ended September 30, 2024 | $ | 503 | | | 7,811 | | | — | | | 221 | | | 20 | | | 80 | | | 8,635 | |
(a) For the periods presented for Nelnet Bank, the delinquency bucket periods conform with the delinquency bucket periods reflected in Nelnet Bank's Call Reports filed with the Federal Deposit Insurance Corporation.
4. Bonds and Notes Payable
The following tables summarize the Company’s outstanding debt obligations by type of instrument:
| | | | | | | | | | | | | | | | | |
| | As of September 30, 2024 |
| Carrying amount | | Interest rate range | | Final maturity |
| Variable-rate bonds and notes issued in FFELP loan asset-backed securitizations: | | | | | |
| Bonds and notes based on indices | $ | 7,346,522 | | | 5.41% - 6.97% | | 8/26/30 - 9/25/69 |
| Bonds and notes based on auction | 70,220 | | | 0.00% - 6.46% | | 3/22/32 - 11/26/46 |
| Total FFELP variable-rate bonds and notes | 7,416,742 | | | | | |
Fixed-rate bonds and notes issued in FFELP loan asset-backed
securitizations | 360,044 | | | 1.42% - 3.45% | | 10/25/67 - 8/27/68 |
| FFELP loan warehouse facilities | 889,092 | | | 4.93% - 5.19% | | 1/31/26 / 4/1/26 |
| | | | | |
| Consumer loan warehouse facilities | 90,277 | | | 5.15% / 7.35% | | 11/14/25 / 8/1/26 |
| Variable-rate bonds and notes issued in private education loan asset-backed securitizations | 60,222 | | | 6.40% / 7.53% | | 6/25/49 / 11/25/53 |
| Fixed-rate bonds and notes issued in private education loan asset-backed securitizations | 56,599 | | | 5.35% / 7.15% | | 12/28/43 / 11/25/53 |
| Unsecured line of credit | — | | | — | | 9/22/26 |
| Participation agreements | 6,434 | | | 5.58% - 6.08% | | 5/4/25 / 1/30/33 |
| Repurchase agreement | 108,182 | | | 5.54% - 6.75% | | 11/27/24 / 12/20/24 |
| | | | | |
| Other - due to related party | 4,669 | | | 5.00% | | 11/15/28 - 11/15/30 |
| 8,992,261 | | | | | |
| Discount on bonds and notes payable and debt issuance costs | (53,815) | | | | | |
| Total | $ | 8,938,446 | | | | | |
| | | | | | | | | | | | | | | | | |
| | As of December 31, 2023 |
| Carrying amount | | Interest rate range | | Final maturity |
| Variable-rate bonds and notes issued in FFELP loan asset-backed securitizations: | | | | | |
| Bonds and notes based on indices | $ | 9,552,667 | | | 5.45% - 7.47% | | 8/26/30 - 9/25/69 |
| Bonds and notes based on auction | 87,360 | | | 0.00% - 6.45% | | 3/22/32 - 11/26/46 |
| Total FFELP variable-rate bonds and notes | 9,640,027 | | | | | |
| Fixed-rate bonds and notes issued in FFELP loan asset-backed securitizations | 471,427 | | | 1.42% - 3.45% | | 10/25/67 - 8/27/68 |
| FFELP loan warehouse facilities | 1,398,485 | | | 5.41% - 5.70% | | 4/2/25 / 5/22/25 |
| | | | | |
| Consumer loan warehouse facility | 23,691 | | | 5.70% | | 11/14/25 |
| Variable-rate bonds and notes issued in private education loan asset-backed securitizations | 80,393 | | | 6.90% / 7.57% | | 6/25/49 / 11/25/53 |
| Fixed-rate bonds and notes issued in private education loan asset-backed securitizations | 80,130 | | | 5.35% / 7.15% | | 12/28/43 / 11/25/53 |
| Unsecured line of credit | — | | | — | | 9/22/26 |
| Participation agreements | 10,063 | | | 5.58% - 6.08% | | 3/12/24 / 5/4/24 |
| Repurchase agreement | 208,164 | | | 6.35% - 6.81% | | 1/22/24 - 12/20/24 |
| | | | | |
| Other - due to related party | 5,778 | | | 5.00% - 6.05% | | 3/1/24 - 11/15/30 |
| 11,918,158 | | | | | |
| Discount on bonds and notes payable and debt issuance costs | (89,765) | | | | | |
| Total | $ | 11,828,393 | | | | | |
Warehouse Facilities
The Company funds a portion of its loan acquisitions using warehouse facilities. Loan warehousing allows the Company to buy and manage loans prior to transferring them into more permanent financing arrangements. The following table summarizes the Company's warehouse facilities as of September 30, 2024.
| | | | | | | | | | | | | | | | | | | | | | | | | | | | | | | | | | | | | | | | | | | | | |
| Type of loans | | Maximum financing amount | | Amount outstanding | | Amount available | | Expiration of liquidity provisions | | Final maturity date | | Advance rate | | Advanced as equity support |
| FFELP (a) | | $ | 800,000 | | | 589,303 | | | 210,697 | | | 1/31/2025 | | 1/31/2026 | | note (b) | | $ | 42,542 | |
| FFELP (c) | | 375,000 | | | 299,789 | | | 75,211 | | | 4/1/2025 | | 4/1/2026 | | 92 | % | | 25,106 | |
| | | $ | 1,175,000 | | | 889,092 | | | 285,908 | | | | | | | | | $ | 67,648 | |
| | | | | | | | | | | | | | | |
| Consumer (d) | | $ | 100,000 | | | 5,277 | | | 94,723 | | | 11/14/2024 | | 11/14/2025 | | 70 | % | | $ | 2,364 | |
| Consumer (e) | | 125,000 | | | 85,000 | | | 40,000 | | | 1/1/2026 | | 8/1/2026 | | 60% - 80% | | 19,681 | |
| | | $ | 225,000 | | | 90,277 | | | 134,723 | | | | | | | | | $ | 22,045 | |
(a) Effective March 6, 2024, the maximum financing amount on this facility was reduced from $1.25 billion to $950 million. On May 17, 2024, this facility was amended to reduce the maximum financing amount from $950 million to $875 million, and to extend the expiration of liquidity provisions and final maturity date to July 15, 2024 and July 15, 2025, respectively. On July 15, 2024, this facility was amended to reduce the maximum financing amount from $875 million to $800 million, and to extend the expiration of liquidity provisions and final maturity date to January 31, 2025 and January 31, 2026, respectively. On October 3, 2024, this facility was amended to reduce the maximum financing amount from $800 million to $600 million.
(b) This facility has a static advance rate until the expiration date of the liquidity provisions. The maximum advance rates for this facility are 90% to 96%, and the minimum advance rates are 84% to 90%. In the event the liquidity provisions are not extended, the valuation agent has the right to perform a one-time mark to market on the underlying loans funded in this facility, subject to a floor. The loans would then be funded at this new advance rate until the final maturity date of the facility.
(c) On April 2, 2024, this facility was amended to reduce the maximum financing amount from $432 million to $375 million, and to extend the expiration of liquidity provisions and final maturity date to April 1, 2025 and April 1, 2026, respectively.
(d) On March 11, 2024, this facility was amended to reduce the maximum financing amount from $200 million to $150 million. On September 6, 2024, this facility was amended to reduce the maximum financing amount from $150 million to $100 million.
(e) On July 1, 2024, the Company closed on this $125 million consumer loan facility.
Unsecured Line of Credit
The Company has a $495.0 million unsecured line of credit that has a maturity date of September 22, 2026. As of September 30, 2024, no amount was outstanding on the line of credit and $495.0 million was available for future use.
Repurchase Agreement
The Company has a repurchase agreement with a non-affiliated third party, the proceeds of which are collateralized by certain private education loan asset-backed securities (bond investments). The outstanding balance under this agreement as of September 30, 2024 was $108.2 million. The agreement has various maturity dates through December 20, 2024 and the Company is subject to margin deficit payment requirements if the fair value of the securities subject to the agreement is less than the original purchase price of such securities on any scheduled reset date. See note 6 for additional information about the private education loan asset-backed securities investments serving as collateral for this repurchase agreement.
Debt Repurchases
The Company has repurchased certain of its own asset-backed securities (bonds and notes payable) in the secondary market. For accounting purposes, these notes are eliminated in consolidation and are not included in the Company's consolidated financial statements. However, these securities remain legally outstanding at the trust level and the Company could sell these notes to third parties or redeem the notes at par as cash is generated by the trust estate. Upon a sale of these notes to third parties, the Company would obtain cash proceeds equal to the market value of the notes on the date of such sale. As of September 30, 2024, the Company holds $309.5 million (par value) of its own FFELP asset-backed securities.
Debt Redemptions
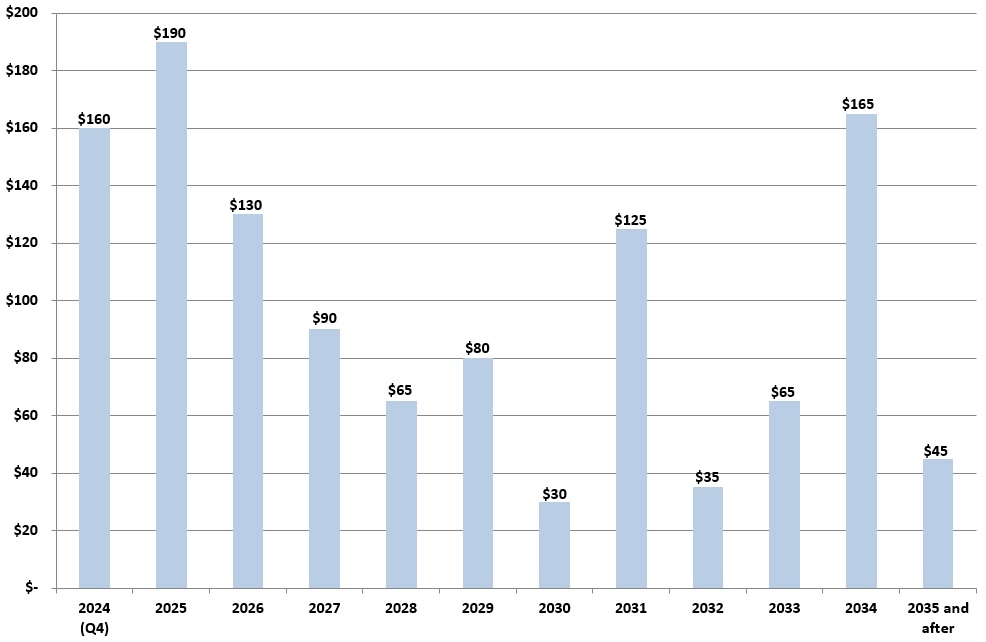
Subsequent to September 30, 2024, in October 2024, the Company redeemed $169.3 million of FFELP loan asset-backed debt securities (bonds and notes payable) prior to their maturity. The Company had the ability and intention to redeem these asset-
backed debt securities as of September 30, 2024. As such, the remaining unamortized debt discount associated with these bonds as of September 30, 2024 was written-off, resulting in a $5.6 million non-cash expense recognized in September 2024.
In April 2023, the Company redeemed $188.6 million of FFELP loan asset-backed debt securities (bonds and notes payable) prior to their maturity. The remaining unamortized debt discount associated with these bonds at the time of redemption was written-off, resulting in a $25.9 million non-cash expense recognized in April 2023.
The expense related to the acceleration of unamortized debt discount costs described above is included in "interest expense on bonds and notes payable and bank deposits" on the consolidated statements of income.
5. Derivative Financial Instruments
Non-Nelnet Bank Derivatives
The Company uses settled-to-market derivative financial instruments to manage interest rate risk. Derivative instruments used as part of the Company's interest rate risk management strategy are further described in note 5 of the notes to consolidated financial statements included in the 2023 Annual Report.
Basis Swaps
The following table summarizes the Company’s outstanding basis swaps, in which the Company receives and pays the term adjusted Secured Overnight Financing Rate (SOFR) plus the tenor spread adjustment to LIBOR. Prior to the discontinuation of LIBOR on June 30, 2023, the Company received three-month LIBOR set discretely in advance and paid one-month LIBOR plus or minus a spread as defined in the agreements (the "1:3 Basis Swaps").
| | | | | | | | | | | | | | |
| Maturity | | Notional amount |
| | As of | | As of |
| | September 30, 2024 | | December 31, 2023 |
| 2024 | | $ | — | | | 1,750,000 | |
| 2026 | | 1,150,000 | | | 1,150,000 | |
| 2027 | | 250,000 | | | 250,000 | |
| | | | |
| | | | |
| | | | |
| | | | |
| | | | |
| | | | |
| | | | |
| | | | |
| | | | |
| | $ | 1,400,000 | | | 3,150,000 | |
The weighted average rate paid by the Company on the 1:3 Basis Swaps as of September 30, 2024 and December 31, 2023 was the term adjusted SOFR (plus the tenor spread adjustment relating to LIBOR) plus 10.4 basis points and 10.1 basis points, respectively.
Interest Rate Swaps – Floor Income Hedges
The following table summarizes the outstanding derivative instruments used by the Company as of September 30, 2024 and December 31, 2023 to economically hedge loans earning fixed rate floor income.
| | | | | | | | | | | | | | | | | | |
| | | | |
| Maturity | | Notional amount | | Weighted average fixed rate paid by the Company (a) | | | | |
| 2026 | | $ | 200,000 | | | 3.92 | % | | | | |
| 2028 | | 50,000 | | | 3.56 | | | | | |
| 2029 (b) | | 50,000 | | | 3.17 | | | | | |
| 2030 (c) | | 100,000 | | | 3.63 | | | | | |
| | | | | | | | |
| | | | | | | | |
| | | | | | | | |
| | | | | | | | |
| | | | | | | | |
| | | $ | 400,000 | | | 3.71 | % | | | | |
(a) For all interest rate derivatives, the Company receives payments based on SOFR, the majority of which reset quarterly.
(b) This $50 million notional amount derivative has a forward effective start date in January 2026.
(c) A $50 million notional amount derivative maturing in 2030 has a forward effective start date in November 2025.
During the first quarter of 2023, the Company received $183.2 million, which included $19.1 million related to 2023 settlements, to terminate $2.8 billion in notional amount of floor income interest rate swaps prior to their final maturity.
Nelnet Bank Derivatives
Interest Rate Swaps
The following table summarizes the outstanding non-centrally cleared derivative instruments used by Nelnet Bank to hedge exposure to variability in cash flows related to variable rate intercompany deposits.
| | | | | | | | | | | | | | | | | | | | | | | | | | |
| | As of September 30, 2024 | | As of December 31, 2023 |
| Maturity | | Notional amount | | Weighted average fixed rate paid by the Company (a) | | Notional amount | | Weighted average fixed rate paid by the Company (a) |
| 2028 | | $ | 40,000 | | | 3.33 | % | | $ | 40,000 | | | 3.33 | % |
| 2029 | | 25,000 | | | 3.37 | | | — | | | — | |
| 2030 (b) | | 50,000 | | | 3.06 | | | 50,000 | | | 3.06 | |
| 2032 (c) | | 25,000 | | | 4.03 | | | 25,000 | | | 4.03 | |
| 2033 (d) | | 25,000 | | | 3.90 | | | 25,000 | | | 3.90 | |
| | | | | | | | |
| | | | | | | | |
| | | | | | | | |
| | | $ | 165,000 | | | 3.44 | % | | $ | 140,000 | | | 3.46 | % |
(a) For all interest rate derivatives, the Company receives monthly or quarterly payments based on SOFR that resets daily.
(b) These $25 million notional amount derivatives have forward effective start dates in April 2026 and May 2026, respectively.
(c) This $25 million notional amount derivative has a forward effective start date in February 2027.
(d) This $25 million notional amount derivative has a forward effective start date in November 2025.
Consolidated Financial Statement Impact Related to Derivatives
Balance Sheets
Unlike the Company's Non-Nelnet Bank derivatives, Nelnet Bank's derivatives are not cleared post-execution at a regulated clearinghouse. As such, the Company records these derivative instruments in the consolidated balance sheets on a gross basis as either an asset (included in "other assets") or liability (included in "other liabilities") measured at fair value. The following table summarizes the fair value of the Company's Nelnet Bank derivatives as reflected in the consolidated balance sheets.
| | | | | | | | | | | | | | | | | | | | | | | |
| Fair value of asset derivatives | | Fair value of liability derivatives |
| As of September 30, 2024 | | As of December 31, 2023 | | As of September 30, 2024 | | As of December 31, 2023 |
| Interest rate swaps - Nelnet Bank | $ | 118 | | | 452 | | | 2,434 | | | 1,976 | |
Statements of Income
The following table summarizes the components of "derivative market value adjustments and derivative settlements, net" included in the consolidated statements of income.
| | | | | | | | | | | | | | | | | | | | | | | |
| Three months ended September 30, | | Nine months ended September 30, |
| | 2024 | | 2023 | | 2024 | | 2023 |
| Settlements: | | | | | | | |
| 1:3 basis swaps | $ | 159 | | | 386 | | | 773 | | | 1,180 | |
| Interest rate swaps - floor income hedges | 1,200 | | | 235 | | | 3,583 | | | 22,760 | |
| Interest rate swaps - Nelnet Bank | 281 | | | 196 | | | 690 | | | 279 | |
| | | | | | | |
| Total settlements - income | 1,640 | | | 817 | | | 5,046 | | | 24,219 | |
| Change in fair value: | | | | | | | |
| 1:3 basis swaps | (125) | | | (464) | | | (710) | | | (253) | |
| Interest rate swaps - floor income hedges | (9,393) | | | 1,656 | | | (2,165) | | | (35,070) | |
| | | | | | | |
| Interest rate swaps - Nelnet Bank | (3,647) | | | 1,948 | | | (793) | | | 3,057 | |
| | | | | | | |
| | | | | | | |
| Total change in fair value - (expense) income | (13,165) | | | 3,140 | | | (3,668) | | | (32,266) | |
| Derivative market value adjustments and derivative settlements, net - (expense) income | $ | (11,525) | | | 3,957 | | | 1,378 | | | (8,047) | |
6. Investments and Notes Receivable
"Restricted investments" and “investments and notes receivable” consisted of the following:
| | | | | | | | | | | | | | | | | | | | | | | | | | | | | | | | | | | | | | | | | | | | | | | |
| As of September 30, 2024 | | As of December 31, 2023 |
| Amortized cost | | Gross unrealized gains | | Gross unrealized losses | | Fair value | | Amortized cost | | Gross unrealized gains | | Gross unrealized losses | | Fair value |
| Restricted available-for-sale investments (at fair value): | | | | | | | | | | | | | | | |
| FFELP loan and other debt securities | $ | 47,799 | | | 2,044 | | | (88) | | | 49,755 | | | 16,993 | | | 1,069 | | | (93) | | | 17,969 | |
| Non-restricted available-for-sale investments (at fair value): | | | | | | | | | | | | | | | |
| | | | | | | | | | | | | | | |
| Non-Nelnet Bank: | | | | | | | | | | | | | | | |
| FFELP loan | $ | 203,260 | | | 6,396 | | | (1,395) | | | 208,261 | | | 271,479 | | | 4,883 | | | (5,393) | | | 270,969 | |
| Private education loan (a) | 247,633 | | | — | | | (20,344) | | | 227,289 | | | 281,791 | | | — | | | (28,874) | | | 252,917 | |
| Other debt securities | 39,685 | | | 2,280 | | | — | | | 41,965 | | | 41,693 | | | 2,020 | | | (1,275) | | | 42,438 | |
| Total Non-Nelnet Bank | 490,578 | | | 8,676 | | | (21,739) | | | 477,515 | | | 594,963 | | | 6,903 | | | (35,542) | | | 566,324 | |
| Nelnet Bank: | | | | | | | | | | | | | | | |
| FFELP loan (b) | 226,522 | | | 6,011 | | | (299) | | | 232,234 | | | 304,555 | | | 4,488 | | | (2,286) | | | 306,757 | |
| Private education loan | 2,063 | | | — | | | — | | | 2,063 | | | 17,083 | | | 20 | | | (10) | | | 17,093 | |
| Other debt securities | 214,211 | | | 1,214 | | | (1,197) | | | 214,228 | | | 49,284 | | | 117 | | | (1,641) | | | 47,760 | |
| Total Nelnet Bank | 442,796 | | | 7,225 | | | (1,496) | | | 448,525 | | | 370,922 | | | 4,625 | | | (3,937) | | | 371,610 | |
| Total available-for-sale asset-backed securities | $ | 933,374 | | | 15,901 | | | (23,235) | | | 926,040 | | | 965,885 | | | 11,528 | | | (39,479) | | | 937,934 | |
| Equity securities | | | | | | | 70,345 | | | | | | | | | 50,907 | |
| Total investments at fair value | | | | | | | 996,385 | | | | | | | | | 988,841 | |
| Other Investments and Notes Receivable (not measured at fair value): | | | | | | | | | | | | | | | |
| Held-to-maturity investments | | | | | | | | | | | | | | | |
| Non-Nelnet Bank: | | | | | | | | | | | | | | | |
| Debt securities | | | | | | | — | | | | | | | | | 4,700 | |
| Nelnet Bank: | | | | | | | | | | | | | | | |
| FFELP loan asset-backed securities (b) | | | | | | | 214,380 | | | | | | | | | 149,938 | |
| Private education loan asset-backed securities | | | | | | | 8,100 | | | | | | | | | 8,100 | |
| Total Nelnet Bank | | | | | | | 222,480 | | | | | | | | | 158,038 | |
| Total held-to-maturity investments | | | | | | | 222,480 | | | | | | | | | 162,738 | |
| Venture capital and funds: | | | | | | | | | | | | | | | |
| Measurement alternative | | | | | | | 197,515 | | | | | | | | | 194,084 | |
| Equity method | | | | | | | 107,812 | | | | | | | | | 91,464 | |
| Total venture capital and funds | | | | | | | 305,327 | | | | | | | | | 285,548 | |
| Real estate: | | | | | | | | | | | | | | | |
| Equity method | | | | | | | 125,424 | | | | | | | | | 103,811 | |
| Investment in ALLO: | | | | | | | | | | | | | | | |
| Voting interest/equity method (c) | | | | | | | — | | | | | | | | | 10,693 | |
| Preferred membership interest and accrued and unpaid preferred return (d) | | | | | | | 195,353 | | | | | | | | | 155,047 | |
| Total investment in ALLO | | | | | | | 195,353 | | | | | | | | | 165,740 | |
| Beneficial interest in loan securitizations (e): | | | | | | | | | | | | | | | |
| Consumer loans, net of allowance for credit losses of $32,997 as of September 30, 2024 | | | | | | | 145,238 | | | | | | | | | 134,113 | |
| Private education loans, net of allowance for credit losses of $901 as of September 30, 2024 | | | | | | | 55,211 | | | | | | | | | 68,372 | |
| Federally insured student loans, net of allowance for credit losses of $965 as of September 30, 2024 | | | | | | | 18,210 | | | | | | | | | 22,594 | |
| Total beneficial interest in loan securitizations, net of allowance | | | | | | | 218,659 | | | | | | | | | 225,079 | |
| Solar (f) | | | | | | | (197,582) | | | | | | | | | (146,040) | |
| Notes receivable | | | | | | | 27,778 | | | | | | | | | 53,747 | |
| Tax liens, affordable housing, and other | | | | | | | 9,737 | | | | | | | | | 7,243 | |
| Total investments (not measured at fair value) | | | | | | | 907,176 | | | | | | | | | 857,866 | |
| Total investments and notes receivable | | | | | | | $ | 1,903,561 | | | | | | | | | $ | 1,846,707 | |
(a) A portion of the private education loan asset-backed securities were subject to a repurchase agreement with a third party, as discussed in note 4 under "Repurchase Agreement." As of September 30, 2024, the par value and fair value of the securities subject to this agreement was $144.4 million and $128.5 million, respectively.
(b) On May 22, 2024, securities at Nelnet Bank with a fair value of $70.6 million were transferred from available-for-sale to held-to-maturity. The securities were reclassified at fair value at the time of the transfer, and such transfer represented a non-cash transaction. Accumulated other comprehensive income as of May 22, 2024 included pre-tax unrealized gains of $3.4 million related to the transfer. These unrealized gains are being amortized, consistent with the amortization of any premiums on such securities, over the remaining lives of the respective securities as an adjustment of yield.
(c) The Company accounts for its voting membership interests in ALLO under the Hypothetical Liquidation at Book Value (HLBV) method of accounting. Under the HLBV method of accounting on its ALLO voting membership interests investment, the Company recognized no losses and $17.3 million of losses during the three months ended September 30, 2024 and 2023, respectively, and losses of $10.7 million and $49.7 million during the nine months ended September 30, 2024 and 2023, respectively. Losses from the Company's investment in ALLO are included in "other, net" in "other income (expense)" on the consolidated statements of income. Absent additional equity contributions with respect to ALLO's voting membership interests, the Company will not recognize additional losses for its voting membership interests in ALLO.
(d) As of September 30, 2024, the outstanding preferred membership interests and accrued and unpaid preferred return of ALLO held by the Company was $184.0 million and $11.4 million, respectively. The Company historically earned a preferred annual return of 6.25% that increased to 10.00% on April 1, 2024 for $155.0 million of preferred membership interests of ALLO held by the Company. During the second and third quarter of 2024, the Company purchased an additional $29.0 million of preferred membership interests of ALLO, which earn a preferred annual return of 20.0%. The Company recognized income on its ALLO preferred membership interests of $4.8 million and $2.3 million during the three months ended September 30, 2024 and 2023, respectively, and $11.4 million and $6.8 million during the nine months ended September 30, 2024 and 2023, respectively. This income is included in "other, net" in "other income (expense)" on the consolidated statements of income.
(e) The Company has partial ownership in certain consumer, private education, and federally insured student loan securitizations, which are accounted for as held-to-maturity beneficial interest investments. As of the latest remittance reports filed by the various trusts prior to or as of September 30, 2024, the Company's ownership correlates to approximately $1.19 billion, $480 million, and $315 million of consumer, private education, and federally insured student loans, respectively, included in these securitizations.
An increase in cumulative loss expectations on certain securitizations and loan vintages caused a change in estimate of future cash flows related to certain of the Company's beneficial interest securitization investments. As a result, during the second and third quarter of 2024, the Company recorded a $5.9 million and $29.0 million allowance for credit losses (and related provision expense), respectively, related to these investments.
(f) The Company invests in solar tax equity investments. Due to the management and control of each of these investment partnerships, such partnerships that invest in tax equity investments are consolidated on the Company’s consolidated financial statements, with the co-investor’s (syndication partner's) portion being presented as noncontrolling interests. As of September 30, 2024, the Company has funded a total of $543.7 million in solar investments that remain outstanding, which includes $241.4 million funded by syndication partners. The carrying value of the Company’s investment in a solar project is reduced by tax credits earned when the solar project is placed-in-service. As of September 30, 2024, the Company has earned a total of $524.6 million of tax credits on those projects that remain outstanding, which includes $238.7 million earned by syndication partners. The solar investment negative carrying value on the consolidated balance sheet of $197.6 million as of September 30, 2024 represents the sum of total tax credits earned on solar projects placed-in-service through September 30, 2024 and the calculated HLBV cumulative net losses being larger than the total investment contributions made by the Company and its syndication partners on such projects. The solar investment negative carrying value as of September 30, 2024, excluding the portion owned by syndication partners that is reflected as "noncontrolling interests" on the consolidated balance sheet, was $95.4 million.
The Company accounts for its solar investments using the HLBV method of accounting. For the majority of the Company’s solar investments, the HLBV method of accounting results in accelerated losses in the initial years of investment. The following table presents (i) the Company's recognized net losses, which include net losses attributable to third-party noncontrolling interest investors (syndication partners), included in “other, net” in "other income (expense)" on the consolidated statements of income, (ii) solar net losses attributed to noncontrolling interest investors included in “net loss attributable to noncontrolling interests” on the consolidated statements of income, and (iii) the Company's recognized net losses excluding net losses attributed to noncontrolling interest investors (such amount reflecting the before tax net income impact of such solar tax equity investments to the Company).
| | | | | | | | | | | | | | | | | | | | | | | |
| Three months ended September 30, | | Nine months ended September 30, |
| 2024 | | 2023 | | 2024 | | 2023 |
| Net losses | $ | (11,238) | | | (6,456) | | | (11,068) | | | (19,485) | |
| Less: net losses attributed to noncontrolling interest investors (syndication partners) | 3,936 | | | 3,278 | | | 5,568 | | | 14,706 | |
| Net losses, excluding activity attributed to noncontrolling interest investors | $ | (7,302) | | | (3,178) | | | (5,500) | | | (4,779) | |
As of September 30, 2024, the Company is committed to fund an additional $107.9 million on solar investments, of which $89.5 million is expected to be provided by syndication partners.
The following table presents, by remaining contractual maturity, the amortized cost and fair value of debt securities as of September 30, 2024:
| | | | | | | | | | | | | | | | | | | | | | | | | | | | | |
| As of September 30, 2024 |
| 1 year or less | | After 1 year through 5 years | | After 5 years through 10 years | | After 10 years | | Total |
| Available-for-sale asset-backed securities | | | | | | | | | |
| Restricted Investments: | | | | | | | | | |
| FFELP loan and other debt securities | $ | — | | | 10,258 | | | 3,015 | | | 34,526 | | | 47,799 | |
| Fair value | — | | | 10,331 | | | 3,041 | | | 36,383 | | | 49,755 | |
| Non-Nelnet Bank: | | | | | | | | | |
| FFELP loan | — | | | 370 | | | 12,466 | | | 190,424 | | | 203,260 | |
| Private education loan | — | | | — | | | — | | | 247,633 | | | 247,633 | |
| Other debt securities | — | | | 100 | | | 4,000 | | | 35,585 | | | 39,685 | |
| Total Non-Nelnet Bank | — | | | 470 | | | 16,466 | | | 473,642 | | | 490,578 | |
| Fair value | — | | | 501 | | | 16,365 | | | 460,649 | | | 477,515 | |
| Nelnet Bank: | | | | | | | | | |
| FFELP loan | 47,185 | | | 19,619 | | | 21,154 | | | 138,564 | | | 226,522 | |
| Private education loan | — | | | — | | | — | | | 2,063 | | | 2,063 | |
| Other debt securities | — | | | 41,741 | | | 33,154 | | | 139,316 | | | 214,211 | |
| Total Nelnet Bank | 47,185 | | | 61,360 | | | 54,308 | | | 279,943 | | | 442,796 | |
| Fair value | 47,499 | | | 61,411 | | | 54,402 | | | 285,213 | | | 448,525 | |
| Total available-for-sale asset-backed securities at amortized cost | $ | 47,185 | | | 72,088 | | | 73,789 | | | 788,111 | | | 981,173 | |
| Total available-for-sale asset-backed securities at fair value | $ | 47,499 | | | 72,243 | | | 73,808 | | | 782,245 | | | 975,795 | |
| Held-to-maturity investments | | | | | | | | | |
| | | | | | | | | |
| | | | | | | | | |
| | | | | | | | | |
| Nelnet Bank: | | | | | | | | | |
| FFELP loan asset-backed securities | $ | — | | | 2,807 | | | 1,154 | | | 210,419 | | | 214,380 | |
| Private education loan asset-backed securities | — | | | — | | | — | | | 8,100 | | | 8,100 | |
| | | | | | | | | |
| | | | | | | | | |
| Total held-to-maturity investments at amortized cost | $ | — | | | 2,807 | | | 1,154 | | | 218,519 | | | 222,480 | |
| Total held-to-maturity investments at fair value | $ | — | | | 2,876 | | | 1,177 | | | 223,533 | | | 227,586 | |
| Beneficial interest in loan securitizations (a): | | | | | | | | | |
| Amortized cost | $ | — | | | — | | | — | | | — | | | 218,659 | |
| Fair value | $ | — | | | — | | | — | | | — | | | 232,654 | |
(a) The Company's beneficial interest in loan securitizations are not due at a single maturity date.
The following table summarizes the unrealized positions for held-to-maturity investments and the beneficial interest in loan securitizations as of September 30, 2024:
| | | | | | | | | | | | | | | | | | | | | | | |
| Carrying value | | Gross unrealized gains | | Gross unrealized losses | | Fair value |
| Asset-backed and other securities | $ | 222,480 | | | 5,106 | | | — | | | 227,586 | |
| Beneficial interest in loan securitizations | 218,659 | | | 14,154 | | | (159) | | | 232,654 | |
The following table presents securities classified as available-for-sale that have gross unrealized losses at September 30, 2024 and the fair value of such securities as of September 30, 2024. These securities are segregated between investments that had been in a continuous unrealized loss position for less than twelve months and twelve months or more, based on the point in time that the fair value declined below the amortized cost basis. All securities in the table below have been evaluated to determine if a credit loss exists. As part of that assessment, the Company concluded it currently has the intent and ability to retain these investments, and none of the unrealized losses were due to credit losses.
| | | | | | | | | | | | | | | | | | | | | | | | | | | | | | | | | | | |
| As of September 30, 2024 |
| Unrealized loss position less than 12 months | | Unrealized loss position 12 months or more | | Total |
| Unrealized loss | | Fair value | | Unrealized loss | | Fair value | | Unrealized loss | | Fair value |
| Available-for-sale asset-backed securities | | | | | | | | | | | |
| Restricted Investments: | | | | | | | | | | | |
| FFELP loan and other debt securities | $ | (88) | | | 8,160 | | | — | | | — | | | (88) | | | 8,160 | |
| Non-Nelnet Bank: | | | | | | | | | | | |
| FFELP loan | (15) | | | 6,508 | | | (1,380) | | | 68,960 | | | (1,395) | | | 75,468 | |
| Private education loan | — | | | — | | | (20,344) | | | 227,288 | | | (20,344) | | | 227,288 | |
| | | | | | | | | | | |
| Total Non-Nelnet Bank | (15) | | | 6,508 | | | (21,724) | | | 296,248 | | | (21,739) | | | 302,756 | |
| Nelnet Bank: | | | | | | | | | | | |
| FFELP loan | (71) | | | 14,372 | | | (228) | | | 14,122 | | | (299) | | | 28,494 | |
| | | | | | | | | | | |
| Other debt securities | (48) | | | 13,081 | | | (1,149) | | | 14,555 | | | (1,197) | | | 27,636 | |
| Total Nelnet Bank | (119) | | | 27,453 | | | (1,377) | | | 28,677 | | | (1,496) | | | 56,130 | |
| Total available-for-sale asset-backed securities | $ | (222) | | | 42,121 | | | (23,101) | | | 324,925 | | | (23,323) | | | 367,046 | |
The following table summarizes the gross proceeds received and gross realized gains and losses related to sales of available-for-sale asset-backed securities.
| | | | | | | | | | | | | | | | | | | | | | | |
| Three months ended | | Nine months ended |
| September 30, | | September 30, |
| 2024 | | 2023 | | 2024 | | 2023 |
| Gross proceeds from sales | $ | 105,628 | | | 198,548 | | | 372,176 | | | 776,096 | |
| | | | | | | |
| Gross realized gains | $ | 1,791 | | | 1,257 | | | 4,362 | | | 3,451 | |
| Gross realized losses | (70) | | | (193) | | | (1,036) | | | (6,452) | |
| Net gains (losses) | $ | 1,721 | | | 1,064 | | | 3,326 | | | (3,001) | |
7. Intangible Assets
Intangible assets consisted of the following:
| | | | | | | | | | | | | | | | | |
| Weighted average remaining useful life as of September 30, 2024 (months) | | | | |
| As of | As of |
| | September 30, 2024 | | December 31, 2023 |
| Amortizable intangible assets, net: | | | |
| Customer relationships (net of accumulated amortization of $52,706 and $46,573, respectively) | 98 | | $ | 36,898 | | | 43,031 | |
| Trade names (net of accumulated amortization of $186 and $8,268, respectively) | 91 | | 584 | | | 642 | |
| Computer software (net of accumulated amortization of $831 and $574, respectively) | 31 | | 889 | | | 1,146 | |
| | | | | |
| Total amortizable intangible assets, net | 97 | | $ | 38,371 | | | 44,819 | |
The Company recorded amortization expense on its intangible assets of $2.1 million and $5.4 million for the three months ended September 30, 2024 and 2023, respectively, and $6.4 million and $11.6 million during the nine months ended September 30, 2024 and 2023, respectively. The Company will continue to amortize intangible assets over their remaining useful lives. As of September 30, 2024, the Company estimates it will record amortization expense as follows:
| | | | | |
| 2024 (October 1 - December 31) | $ | 2,043 | |
| 2025 | 6,099 | |
| 2026 | 6,012 | |
| 2027 | 5,714 | |
| 2028 | 5,354 | |
| 2029 and thereafter | 13,149 | |
| | $ | 38,371 | |
8. Goodwill
The following table presents the carrying amount of goodwill as of September 30, 2024 and December 31, 2023 by reportable operating segment:
| | | | | | | | | | | | | | | | | | | | | | | | | | | | | | | | | | | | | | | | | |
| | | | | Nelnet Financial Services | | | | |
| Loan Servicing and Systems | | Education Technology Services and Payments | | Asset
Generation and
Management | | Nelnet Bank | | NFS Other Operating Segments | | Corporate and Other Activities | | Total |
| Total goodwill | $ | 23,639 | | | 92,507 | | | 41,883 | | | — | | | — | | | — | | | 158,029 | |
| | | | | | | | | | | | | |
| | | | | | | | | | | | | |
| | | | | | | | | | | | | |
| | | | | | | | | | | | | |
| | | | | | | | | | | | | |
| | | | | | | | | | | | | |
| | | | | | | | | | | | | |
| | | | | | | | | | | | | |
| | | | | | | | | | | | | |
| | | | | | | | | | | | | |
| | | | | | | | | | | | | |
| | | | | | | | | | | | | |
9. Impairment Expense, Provision for Beneficial Interests, and Restructure Charges
Impairment Expense and Provision for Beneficial Interests
The following table presents the impairment charges and provision for beneficial interests by asset and reportable operating segment recognized by the Company. These expense items are included in “impairment expense and provision for beneficial interests” in the consolidated statements of income.
| | | | | | | | | | | | | | | | | | | | | | | | | | | | | | | | | | | | | | | | | |
| | | | | Nelnet Financial Services | | | | |
| Loan Servicing and Systems | | Education Technology Services and Payments | | Asset
Generation and
Management | | Nelnet Bank | | NFS Other Operating Segments | | Corporate and Other Activities | | Total |
| Three months ended September 30, 2024 |
| Investments - beneficial interest in loan securitizations (a) | $ | — | | | — | | | 28,952 | | | — | | | — | | | — | | | 28,952 | |
| Investments - venture capital | — | | | — | | | — | | | — | | | — | | | 100 | | | 100 | |
| | | | | | | | | | | | | |
| | | | | | | | | | | | | |
| $ | — | | | — | | | 28,952 | | | — | | | — | | | 100 | | | 29,052 | |
| Three months ended September 30, 2023 |
| Leases, buildings, and associated improvements (b) | $ | 296 | | | — | | | — | | | — | | | — | | | 4,678 | | | 4,974 | |
| | | | | | | | | | | | | |
| | | | | | | | | | | | | |
| | | | | | | | | | | | | |
| | | | | | | | | | | | | |
| Nine months ended September 30, 2024 |
| Investments - beneficial interest in loan securitizations (a) | $ | — | | | — | | | 34,863 | | | — | | | — | | | — | | | 34,863 | |
| Investments - venture capital | — | | | — | | | — | | | — | | | — | | | 137 | | | 137 | |
| Property and equipment - solar facilities (c) | — | | | — | | | — | | | — | | | — | | | 1,170 | | | 1,170 | |
| Other assets - solar inventory (c) | — | | | — | | | — | | | — | | | — | | | 695 | | | 695 | |
| $ | — | | | — | | | 34,863 | | | — | | | — | | | 2,002 | | | 36,865 | |
| Nine months ended September 30, 2023 |
| Leases, buildings, and associated improvements (b) | $ | 296 | | | — | | | — | | | — | | | — | | | 4,678 | | | 4,974 | |
| | | | | | | | | | | | | |
| | | | | | | | | | | | | |
| | | | | | | | | | | | | |
| | | | | | | | | | | | | |
(a) The Company recorded a non-cash allowance for credit losses (and related provision expense) related to the Company's beneficial interest in certain loan securitizations. See note 6 for additional information.
(b) In 2023, the Company recorded impairment charges related to operating lease assets and associated leasehold improvements, which included a $2.4 million lease termination fee paid to Union Bank, a related party. The Company recorded this impairment as a result of its on-going evaluation of the use of office space when a large number of associates continued to work from home.
(c) In April 2024, the Company announced a change in its solar engineering, procurement, and construction (EPC) operations to focus exclusively on the commercial solar market and will discontinue its residential solar operations. As a result, the Company recognized non-cash impairment charges on certain solar facilities and inventory related to the residential solar operations.
Restructure Charges
GRNE Solar
In April 2024, the Company announced a change in its solar EPC operations to focus exclusively on the commercial solar market and will discontinue its residential solar operations. The restructuring plan included a reduction in headcount of approximately 40 associates. The Company incurred a restructure charge of $1.6 million related to these staff reductions and commissions paid for canceled contracts, which is included in "salaries and benefits" in the consolidated statements of income.
Loan Servicing and Systems (LSS)
In June 2024, the Company announced a reduction in headcount after the completion of the transfer of direct loan servicing volume to one platform and the required servicing platform enhancements for the Company's new student loan servicing contract with the Department of Education. Approximately 220 associates who work in LSS, including some in related shared services that support LSS, were notified their positions were being eliminated. The Company estimates incurring a charge of $7.1 million related to these staff reductions, of which $2.1 million and $4.1 million was recognized in the second and third quarter of 2024, respectively, which is included in "salaries and benefits" in the consolidated statements of income. The remaining expense will be recognized during the fourth quarter of 2024.
10. Bank Deposits
The following table summarizes Nelnet Bank’s interest-bearing deposits, excluding intercompany deposits:
| | | | | | | | | | | |
| As of | | As of |
| September 30, 2024 | | December 31, 2023 |
| Retail and other savings | $ | 801,170 | | | 520,017 | |
| Brokered CDs, net of brokered deposit fees | 247,802 | | | 203,522 | |
| Retail and other CDs, net of issuance fees | 21,786 | | | 20,060 | |
| | | |
| Total interest-bearing deposits | $ | 1,070,758 | | | 743,599 | |
As of September 30, 2024 and December 31, 2023, Nelnet Bank had intercompany deposits from Nelnet, Inc. and its subsidiaries totaling $77.7 million and $104.0 million, respectively, including a $40.0 million pledged deposit from Nelnet, Inc. as required under a Capital and Liquidity Maintenance Agreement with the FDIC. All intercompany deposits held at Nelnet Bank are eliminated for consolidated financial reporting purposes.
The following table presents certificates of deposit remaining maturities as of September 30, 2024:
| | | | | |
| One year or less | $ | 995 | |
| After one year to two years | 148,591 | |
| After two years to three years | 75,215 | |
| After three years to four years | 348 | |
| After four years to five years | 44,439 | |
| After five years | — | |
| Total | $ | 269,588 | |
Retail and other savings deposits include deposits from Educational 529 College Savings and Health Savings plans, Short Term Federal Investment Trust (STFIT), and commercial and consumer savings. These deposits are large interest-bearing omnibus accounts structured to allow FDIC insurance to flow through to underlying individual depositors. The deposits exceeding the FDIC insurance limits as of September 30, 2024 was $44.5 million, the majority of which are intercompany deposits from Nelnet, Inc. and its subsidiaries.
11. Earnings per Common Share
The following table presents the components used to calculate basic and diluted earnings per share. The Company applies the two-class method in computing both basic and diluted earnings per share, which requires the calculation of separate earnings per share amounts for common stock and unvested share-based awards. Unvested share-based awards that contain nonforfeitable rights to dividends are considered securities which participate in undistributed earnings with common stock.
| | | | | | | | | | | | | | | | | | | | | | | | | | | | | | | | | | | |
| | Three months ended September 30, |
| 2024 | | 2023 |
| Common shareholders | | Unvested restricted stock shareholders | | Total | | Common shareholders | | Unvested restricted stock shareholders | | Total |
| Numerator: | | | | | | | | | | | |
| Net income attributable to Nelnet, Inc. | $ | 2,343 | | | 45 | | | 2,388 | | | 43,409 | | | 945 | | | 44,354 | |
| Denominator: | | | | | | | | | | | |
| Weighted-average common shares outstanding - basic and diluted | 35,743,895 | | | 686,590 | | | 36,430,485 | | | 36,699,510 | | | 798,563 | | | 37,498,073 | |
| Earnings per share - basic and diluted | $ | 0.07 | | | 0.07 | | | 0.07 | | | 1.18 | | | 1.18 | | | 1.18 | |
| Nine months ended September 30, |
| 2024 | | 2023 |
| Common shareholders | | Unvested restricted stock shareholders | | Total | | Common shareholders | | Unvested restricted stock shareholders | | Total |
| Numerator: | | | | | | | | | | | |
| Net income attributable to Nelnet, Inc. | $ | 118,549 | | | 2,337 | | | 120,886 | | | 95,685 | | | 2,054 | | | 97,739 | |
| Denominator: | | | | | | | | | | | |
| Weighted-average common shares outstanding - basic and diluted | 35,993,634 | | | 709,680 | | | 36,703,314 | | | 36,650,653 | | | 786,934 | | | 37,437,587 | |
| Earnings per share - basic and diluted | $ | 3.29 | | | 3.29 | | | 3.29 | | | 2.61 | | | 2.61 | | | 2.61 | |
12. Segment Reporting
See note 16 of the notes to consolidated financial statements included in the 2023 Annual Report for a description of the Company's operating segments. The following tables present the results of each of the Company's reportable operating segments reconciled to the consolidated financial statements.
| | | | | | | | | | | | | | | | | | | | | | | | | | | | | | | | | | | | | | | | | | | | | | | |
| | Three months ended September 30, 2024 |
| | | | | Nelnet Financial Services | | | | | |
| Loan Servicing and Systems | | Education Technology Services and Payments | | Asset
Generation and
Management | | Nelnet Bank | | NFS Other Operating Segments | | Corporate and Other Activities | | Eliminations | | Total |
| Interest income: | | | | | | | | | | | | | | | |
| Loan interest | $ | — | | | — | | | 180,571 | | | 9,639 | | | — | | | — | | | — | | | 190,211 | |
| Investment interest | 894 | | | 9,734 | | | 18,970 | | | 12,522 | | | 12,415 | | | 3,105 | | | (7,368) | | | 50,272 | |
| Total interest income | 894 | | | 9,734 | | | 199,541 | | | 22,161 | | | 12,415 | | | 3,105 | | | (7,368) | | | 240,483 | |
| Interest expense | — | | | — | | | 161,142 | | | 11,606 | | | 2,245 | | | 704 | | | (7,368) | | | 168,328 | |
| Net interest income | 894 | | | 9,734 | | | 38,399 | | | 10,555 | | | 10,170 | | | 2,401 | | | — | | | 72,155 | |
| Less provision (negative provision) for loan losses | — | | | — | | | 11,968 | | | 6,143 | | | — | | | — | | | — | | | 18,111 | |
| Net interest income after provision for loan losses | 894 | | | 9,734 | | | 26,431 | | | 4,412 | | | 10,170 | | | 2,401 | | | — | | | 54,044 | |
| Other income (expense): | | | | | | | | | | | | | | | |
| Loan servicing and systems revenue | 108,175 | | | — | | | — | | | — | | | — | | | — | | | — | | | 108,175 | |
| Intersegment revenue | 5,428 | | | 60 | | | — | | | — | | | — | | | — | | | (5,488) | | | — | |
| Education technology services and payments revenue | — | | | 118,179 | | | — | | | — | | | — | | | — | | | — | | | 118,179 | |
| Solar construction revenue | — | | | — | | | — | | | — | | | — | | | 19,321 | | | — | | | 19,321 | |
| Other, net | 690 | | | — | | | 4,918 | | | 841 | | | 22,370 | | | 3,506 | | | — | | | 32,325 | |
| Loss on sale of loans | — | | | — | | | (107) | | | — | | | — | | | — | | | — | | | (107) | |
| Impairment expense and provision for beneficial interests | — | | | — | | | (28,952) | | | — | | | — | | | (100) | | | — | | | (29,052) | |
| Derivative settlements, net | — | | | — | | | 1,359 | | | 281 | | | — | | | — | | | — | | | 1,640 | |
| Derivative market value adjustments, net | — | | | — | | | (9,518) | | | (3,647) | | | — | | | — | | | — | | | (13,165) | |
| Total other income (expense), net | 114,293 | | | 118,239 | | | (32,300) | | | (2,525) | | | 22,370 | | | 22,727 | | | (5,488) | | | 237,316 | |
| Cost of services: | | | | | | | | | | | | | | | |
| | | | | | | | | | | | | | | |
| Cost to provide education technology services and payments | — | | | 45,273 | | | — | | | — | | | — | | | — | | | — | | | 45,273 | |
| Cost to provide solar construction services | — | | | — | | | — | | | — | | | — | | | 26,815 | | | — | | | 26,815 | |
| Total cost of services | — | | | 45,273 | | | — | | | — | | | — | | | 26,815 | | | — | | | 72,088 | |
| Operating expenses: | | | | | | | | | | | | | | | |
| Salaries and benefits | 76,820 | | | 41,053 | | | 1,220 | | | 2,973 | | | 398 | | | 23,852 | | | (124) | | | 146,192 | |
| Depreciation and amortization | 4,854 | | | 2,616 | | | — | | | 343 | | | — | | | 5,848 | | | — | | | 13,661 | |
| Other expenses | 19,663 | | | 7,614 | | | 2,775 | | | 2,570 | | | 17,904 | | | 11,116 | | | — | | | 61,642 | |
| Intersegment expenses, net | 18,399 | | | 4,604 | | | 6,482 | | | 759 | | | 200 | | | (25,080) | | | (5,364) | | | — | |
| Total operating expenses | 119,736 | | | 55,887 | | | 10,477 | | | 6,645 | | | 18,502 | | | 15,736 | | | (5,488) | | | 221,495 | |
| Income (loss) before income taxes | (4,549) | | | 26,813 | | | (16,346) | | | (4,758) | | | 14,038 | | | (17,423) | | | — | | | (2,223) | |
| Income tax (expense) benefit | 1,092 | | | (6,450) | | | 3,923 | | | 1,143 | | | (3,341) | | | 3,915 | | | — | | | 282 | |
| Net income (loss) | (3,457) | | | 20,363 | | | (12,423) | | | (3,615) | | | 10,697 | | | (13,508) | | | — | | | (1,941) | |
| Net loss (income) attributable to noncontrolling interests | — | | | 54 | | | — | | | — | | | (117) | | | 4,392 | | | — | | | 4,329 | |
| Net income (loss) attributable to Nelnet, Inc. | $ | (3,457) | | | 20,417 | | | (12,423) | | | (3,615) | | | 10,580 | | | (9,116) | | | — | | | 2,388 | |
| | | | | | | | | | | | | | | |
| Total assets as of September 30, 2024 | $ | 202,366 | | | 556,897 | | | 10,707,442 | | | 1,328,808 | | | 1,020,732 | | | 763,310 | | | (495,427) | | | 14,084,128 | |
| | | | | | | | | | | | | | | | | | | | | | | | | | | | | | | | | | | | | | | | | | | | | | | |
| | Three months ended September 30, 2023 |
| | | | | Nelnet Financial Services | | | | | |
| Loan Servicing and Systems | | Education Technology Services and Payments | | Asset
Generation and
Management | | Nelnet Bank | | NFS Other Operating Segments | | Corporate and Other Activities | | Eliminations | | Total |
| Interest income: | | | | | | | | | | | | | | | |
| Loan interest | $ | — | | | — | | | 230,816 | | | 5,608 | | | — | | | — | | | — | | | 236,423 | |
| Investment interest | 1,098 | | | 8,934 | | | 18,062 | | | 9,563 | | | 13,021 | | | 3,232 | | | (5,783) | | | 48,128 | |
| Total interest income | 1,098 | | | 8,934 | | | 248,878 | | | 15,171 | | | 13,021 | | | 3,232 | | | (5,783) | | | 284,551 | |
| Interest expense | — | | | — | | | 197,393 | | | 9,456 | | | 5,661 | | | 432 | | | (5,783) | | | 207,159 | |
| Net interest income | 1,098 | | | 8,934 | | | 51,485 | | | 5,715 | | | 7,360 | | | 2,800 | | | — | | | 77,392 | |
| Less provision (negative provision) for loan losses | — | | | — | | | 2,348 | | | 1,927 | | | — | | | — | | | — | | | 4,275 | |
| Net interest income after provision for loan losses | 1,098 | | | 8,934 | | | 49,137 | | | 3,788 | | | 7,360 | | | 2,800 | | | — | | | 73,117 | |
| Other income (expense): | | | | | | | | | | | | | | | |
| Loan servicing and systems revenue | 127,892 | | | — | | | — | | | — | | | — | | | — | | | — | | | 127,892 | |
| Intersegment revenue | 6,944 | | | 77 | | | — | | | — | | | — | | | — | | | (7,021) | | | — | |
| Education technology services and payments revenue | — | | | 113,796 | | | — | | | — | | | — | | | — | | | — | | | 113,796 | |
| Solar construction revenue | — | | | — | | | — | | | — | | | — | | | 6,301 | | | — | | | 6,301 | |
| Other, net | 687 | | | — | | | 2,776 | | | 565 | | | 9,861 | | | (16,950) | | | — | | | (3,062) | |
| Loss on sale of loans | — | | | — | | | (1,022) | | | — | | | — | | | — | | | — | | | (1,022) | |
| Impairment expense and provision for beneficial interests | (296) | | | — | | | — | | | — | | | — | | | (4,678) | | | — | | | (4,974) | |
| Derivative settlements, net | — | | | — | | | 621 | | | 196 | | | — | | | — | | | — | | | 817 | |
| Derivative market value adjustments, net | — | | | — | | | 1,192 | | | 1,948 | | | — | | | — | | | — | | | 3,140 | |
| Total other income (expense), net | 135,227 | | | 113,873 | | | 3,567 | | | 2,709 | | | 9,861 | | | (15,327) | | | (7,021) | | | 242,888 | |
| Cost of services: | | | | | | | | | | | | | | | |
| | | | | | | | | | | | | | | |
| Cost to provide education technology services and payments | — | | | 43,694 | | | — | | | — | | | — | | | — | | | — | | | 43,694 | |
| Cost to provide solar construction services | — | | | — | | | — | | | — | | | — | | | 7,783 | | | — | | | 7,783 | |
| Total cost of services | — | | | 43,694 | | | — | | | — | | | — | | | 7,783 | | | — | | | 51,477 | |
| Operating expenses: | | | | | | | | | | | | | | | |
| Salaries and benefits | 73,310 | | | 39,776 | | | 1,242 | | | 2,520 | | | 288 | | | 24,731 | | | (663) | | | 141,204 | |
| Depreciation and amortization | 5,023 | | | 3,030 | | | — | | | 259 | | | — | | | 13,522 | | | — | | | 21,835 | |
| Other expenses | 15,629 | | | 8,309 | | | 2,952 | | | 1,290 | | | 7,522 | | | 15,670 | | | — | | | 51,370 | |
| Intersegment expenses, net | 17,894 | | | 5,875 | | | 7,948 | | | 129 | | | 191 | | | (25,679) | | | (6,358) | | | — | |
| Total operating expenses | 111,856 | | | 56,990 | | | 12,142 | | | 4,198 | | | 8,001 | | | 28,244 | | | (7,021) | | | 214,409 | |
| Income (loss) before income taxes | 24,469 | | | 22,123 | | | 40,562 | | | 2,299 | | | 9,220 | | | (48,554) | | | — | | | 50,119 | |
| Income tax (expense) benefit | (5,872) | | | (5,307) | | | (9,735) | | | (552) | | | (2,177) | | | 13,131 | | | — | | | (10,512) | |
| Net income (loss) | 18,597 | | | 16,816 | | | 30,827 | | | 1,747 | | | 7,043 | | | (35,423) | | | — | | | 39,607 | |
| Net loss (income) attributable to noncontrolling interests | — | | | (6) | | | — | | | — | | | (149) | | | 4,902 | | | — | | | 4,747 | |
| Net income (loss) attributable to Nelnet, Inc. | $ | 18,597 | | | 16,810 | | | 30,827 | | | 1,747 | | | 6,894 | | | (30,521) | | | — | | | 44,354 | |
| | | | | | | | | | | | | | | |
| Total assets as of September 30, 2023 | $ | 243,697 | | | 444,631 | | | 14,111,517 | | | 1,089,565 | | | 1,096,494 | | | 931,853 | | | (719,868) | | | 17,197,889 | |
| | | | | | | | | | | | | | | | | | | | | | | | | | | | | | | | | | | | | | | | | | | | | | | |
| Nine months ended September 30, 2024 |
| | | | | Nelnet Financial Services | | | | | | |
| Loan Servicing and Systems | | Education Technology Services and Payments | | Asset
Generation and
Management | | Nelnet Bank | | NFS Other Operating Segments | | Corporate and Other Activities | | Eliminations | | Total |
| Interest income: | | | | | | | | | | | | | | | |
| Loan interest | $ | — | | | — | | | 583,907 | | | 25,157 | | | — | | | — | | | — | | | 609,064 | |
| Investment interest | 4,046 | | | 23,315 | | | 54,513 | | | 33,301 | | | 43,910 | | | 9,566 | | | (25,565) | | | 143,086 | |
| Total interest income | 4,046 | | | 23,315 | | | 638,420 | | | 58,458 | | | 43,910 | | | 9,566 | | | (25,565) | | | 752,150 | |
| Interest expense | — | | | — | | | 523,678 | | | 31,872 | | | 7,268 | | | 2,114 | | | (25,565) | | | 539,367 | |
| Net interest income | 4,046 | | | 23,315 | | | 114,742 | | | 26,586 | | | 36,642 | | | 7,452 | | | — | | | 212,783 | |
| Less provision (negative provision) for loan losses | — | | | — | | | 14,199 | | | 18,352 | | | — | | | — | | | — | | | 32,551 | |
| Net interest income after provision for loan losses | 4,046 | | | 23,315 | | | 100,543 | | | 8,234 | | | 36,642 | | | 7,452 | | | — | | | 180,232 | |
| Other income (expense): | | | | | | | | | | | | | | | |
| Loan servicing and systems revenue | 344,428 | | | — | | | — | | | — | | | — | | | — | | | — | | | 344,428 | |
| Intersegment revenue | 18,419 | | | 166 | | | — | | | — | | | — | | | — | | | (18,585) | | | — | |
| Education technology services and payments revenue | — | | | 378,627 | | | — | | | — | | | — | | | — | | | — | | | 378,627 | |
| Solar construction revenue | — | | | — | | | — | | | — | | | — | | | 42,741 | | | — | | | 42,741 | |
| Other, net | 2,085 | | | — | | | 11,239 | | | 1,991 | | | 51,013 | | | 11,730 | | | — | | | 78,057 | |
| Loss on sale of loans | — | | | — | | | (1,685) | | | — | | | — | | | — | | | — | | | (1,685) | |
| Impairment expense and provision for beneficial interests | — | | | — | | | (34,863) | | | — | | | — | | | (2,002) | | | — | | | (36,865) | |
| Derivative settlements, net | — | | | — | | | 4,356 | | | 690 | | | — | | | — | | | — | | | 5,046 | |
| Derivative market value adjustments, net | — | | | — | | | (2,875) | | | (793) | | | — | | | — | | | — | | | (3,668) | |
| Total other income (expense), net | 364,932 | | | 378,793 | | | (23,828) | | | 1,888 | | | 51,013 | | | 52,469 | | | (18,585) | | | 806,681 | |
| Cost of services: | | | | | | | | | | | | | | | |
| | | | | | | | | | | | | | | |
| Cost to provide education technology services and payments | — | | | 134,106 | | | — | | | — | | | — | | | — | | | — | | | 134,106 | |
| Cost to provide solar construction services | — | | | — | | | — | | | — | | | — | | | 49,115 | | | — | | | 49,115 | |
| Total cost of services | — | | | 134,106 | | | — | | | — | | | — | | | 49,115 | | | — | | | 183,221 | |
| Operating expenses: | | | | | | | | | | | | | | | |
| Salaries and benefits | 224,172 | | | 121,956 | | | 3,529 | | | 8,491 | | | 1,129 | | | 72,159 | | | (1,735) | | | 429,701 | |
| Depreciation and amortization | 15,304 | | | 8,012 | | | — | | | 944 | | | — | | | 21,312 | | | — | | | 45,572 | |
| Other expenses | 59,861 | | | 23,772 | | | 9,985 | | | 5,765 | | | 41,536 | | | 37,359 | | | — | | | 178,278 | |
| Intersegment expenses, net | 55,955 | | | 14,216 | | | 21,491 | | | 2,252 | | | 665 | | | (77,729) | | | (16,850) | | | — | |
| Total operating expenses | 355,292 | | | 167,956 | | | 35,005 | | | 17,452 | | | 43,330 | | | 53,101 | | | (18,585) | | | 653,551 | |
| Income (loss) before income taxes | 13,686 | | | 100,046 | | | 41,710 | | | (7,330) | | | 44,325 | | | (42,295) | | | — | | | 150,141 | |
| Income tax (expense) benefit | (3,284) | | | (24,035) | | | (10,010) | | | 1,800 | | | (10,550) | | | 8,426 | | | — | | | (37,653) | |
| Net income (loss) | 10,402 | | | 76,011 | | | 31,700 | | | (5,530) | | | 33,775 | | | (33,869) | | | — | | | 112,488 | |
| Net loss (income) attributable to noncontrolling interests | — | | | 101 | | | — | | | — | | | (366) | | | 8,663 | | | — | | | 8,398 | |
| Net income (loss) attributable to Nelnet, Inc. | $ | 10,402 | | | 76,112 | | | 31,700 | | | (5,530) | | | 33,409 | | | (25,206) | | | — | | | 120,886 | |
| | | | | | | | | | | | | | | |
| Total assets as of September 30, 2024 | $ | 202,366 | | | 556,897 | | | 10,707,442 | | | 1,328,808 | | | 1,020,732 | | | 763,310 | | | (495,427) | | | 14,084,128 | |
| | | | | | | | | | | | | | | | | | | | | | | | | | | | | | | | | | | | | | | | | | | | | | | |
| Nine months ended September 30, 2023 |
| | | | | Nelnet Financial Services | | | | | | |
| Loan Servicing and Systems | | Education Technology Services and Payments | | Asset
Generation and
Management | | Nelnet Bank | | NFS Other Operating Segments | | Corporate and Other Activities | | Eliminations | | Total |
| Interest income: | | | | | | | | | | | | | | | |
| Loan interest | $ | — | | | — | | | 689,633 | | | 15,079 | | | — | | | — | | | — | | | 704,712 | |
| Investment interest | 3,193 | | | 20,237 | | | 47,726 | | | 26,013 | | | 54,481 | | | 8,826 | | | (30,643) | | | 129,835 | |
| Total interest income | 3,193 | | | 20,237 | | | 737,359 | | | 41,092 | | | 54,481 | | | 8,826 | | | (30,643) | | | 834,547 | |
| Interest expense | — | | | — | | | 618,905 | | | 24,841 | | | 24,860 | | | 1,793 | | | (30,643) | | | 639,756 | |
| Net interest income | 3,193 | | | 20,237 | | | 118,454 | | | 16,251 | | | 29,621 | | | 7,033 | | | — | | | 194,791 | |
| Less provision (negative provision) for loan losses | — | | | — | | | (772) | | | 5,837 | | | — | | | — | | | — | | | 5,065 | |
| Net interest income after provision for loan losses | 3,193 | | | 20,237 | | | 119,226 | | | 10,414 | | | 29,621 | | | 7,033 | | | — | | | 189,726 | |
| Other income (expense): | | | | | | | | | | | | | | | |
| Loan servicing and systems revenue | 389,138 | | | — | | | — | | | — | | | — | | | — | | | — | | | 389,138 | |
| Intersegment revenue | 21,980 | | | 198 | | | — | | | — | | | — | | | — | | | (22,178) | | | — | |
| Education technology services and payments revenue | — | | | 357,258 | | | — | | | — | | | — | | | — | | | — | | | 357,258 | |
| Solar construction revenue | — | | | — | | | — | | | — | | | — | | | 19,687 | | | — | | | 19,687 | |
| Other, net | 1,900 | | | — | | | 6,939 | | | 1,395 | | | 15,087 | | | (52,617) | | | — | | | (27,297) | |
| Loss on sale of loans | — | | | — | | | (16,776) | | | — | | | — | | | — | | | — | | | (16,776) | |
| Impairment expense and provision for beneficial interests | (296) | | | — | | | — | | | — | | | — | | | (4,678) | | | — | | | (4,974) | |
| Derivative settlements, net | — | | | — | | | 23,940 | | | 279 | | | — | | | — | | | — | | | 24,219 | |
| Derivative market value adjustments, net | — | | | — | | | (35,323) | | | 3,057 | | | — | | | — | | | — | | | (32,266) | |
| Total other income (expense), net | 412,722 | | | 357,456 | | | (21,220) | | | 4,731 | | | 15,087 | | | (37,608) | | | (22,178) | | | 708,989 | |
| Cost of services: | | | | | | | | | | | | | | | |
| | | | | | | | | | | | | | | |
| Cost to provide education technology services and payments | — | | | 131,804 | | | — | | | — | | | — | | | — | | | — | | | 131,804 | |
| Cost to provide solar construction services | — | | | — | | | — | | | — | | | — | | | 25,204 | | | — | | | 25,204 | |
| Total cost of services | — | | | 131,804 | | | — | | | — | | | — | | | 25,204 | | | — | | | 157,008 | |
| Operating expenses: | | | | | | | | | | | | | | | |
| Salaries and benefits | 234,012 | | | 116,040 | | | 3,093 | | | 6,881 | | | 717 | | | 78,686 | | | (808) | | | 438,620 | |
| Depreciation and amortization | 14,400 | | | 8,424 | | | — | | | 315 | | | — | | | 33,976 | | | — | | | 57,114 | |
| Other expenses | 42,760 | | | 26,063 | | | 12,083 | | | 3,696 | | | 12,223 | | | 41,327 | | | — | | | 138,154 | |
| Intersegment expenses, net | 58,030 | | | 17,559 | | | 24,789 | | | 302 | | | 447 | | | (79,757) | | | (21,370) | | | — | |
| Total operating expenses | 349,202 | | | 168,086 | | | 39,965 | | | 11,194 | | | 13,387 | | | 74,232 | | | (22,178) | | | 633,888 | |
| Income (loss) before income taxes | 66,713 | | | 77,803 | | | 58,041 | | | 3,951 | | | 31,321 | | | (130,011) | | | — | | | 107,819 | |
| Income tax (expense) benefit | (16,011) | | | (18,700) | | | (13,930) | | | (913) | | | (7,417) | | | 28,188 | | | — | | | (28,785) | |
| Net income (loss) | 50,702 | | | 59,103 | | | 44,111 | | | 3,038 | | | 23,904 | | | (101,823) | | | — | | | 79,034 | |
| Net loss (income) attributable to noncontrolling interests | — | | | 113 | | | — | | | — | | | (418) | | | 19,010 | | | — | | | 18,705 | |
| Net income (loss) attributable to Nelnet, Inc. | $ | 50,702 | | | 59,216 | | | 44,111 | | | 3,038 | | | 23,486 | | | (82,813) | | | — | | | 97,739 | |
| | | | | | | | | | | | | | | |
| Total assets as of September 30, 2023 | $ | 243,697 | | | 444,631 | | | 14,111,517 | | | 1,089,565 | | | 1,096,494 | | | 931,853 | | | (719,868) | | | 17,197,889 | |
13. Disaggregated Revenue
The following tables present disaggregated revenue by service offering or customer type for the Company's fee-based operating segments.
Loan Servicing and Systems
| | | | | | | | | | | | | | | | | | | | | | | |
| | Three months ended September 30, | | Nine months ended September 30, |
| | 2024 | | 2023 | | 2024 | | 2023 |
| Government loan servicing | $ | 85,215 | | | 100,154 | | | 277,705 | | | 304,769 | |
| Private education and consumer loan servicing | 13,057 | | | 12,330 | | | 38,634 | | | 36,556 | |
| FFELP loan servicing | 2,945 | | | 3,304 | | | 9,570 | | | 10,226 | |
| Software services | 5,197 | | | 9,416 | | | 14,617 | | | 25,076 | |
| Outsourced services | 1,761 | | | 2,688 | | | 3,902 | | | 12,511 | |
| Loan servicing and systems revenue | $ | 108,175 | | | 127,892 | | | 344,428 | | | 389,138 | |
Education Technology Services and Payments
| | | | | | | | | | | | | | | | | | | | | | | |
| | Three months ended September 30, | | Nine months ended September 30, |
| | 2024 | | 2023 | | 2024 | | 2023 |
| Tuition payment plan services | $ | 31,659 | | | 30,223 | | | 104,702 | | | 95,235 | |
| Payment processing | 55,813 | | | 50,848 | | | 137,926 | | | 126,716 | |
| Education technology services | 30,080 | | | 31,793 | | | 133,306 | | | 132,796 | |
| Other | 627 | | | 932 | | | 2,693 | | | 2,511 | |
| Education technology services and payments revenue | $ | 118,179 | | | 113,796 | | | 378,627 | | | 357,258 | |
Solar Construction
| | | | | | | | | | | | | | | | | | | | | | | |
| Three months ended September 30, | | Nine months ended September 30, |
| 2024 | | 2023 | | 2024 | | 2023 |
| | | | | | | |
| | | | | | | |
| | | | | | | |
| | | | | | | |
| Commercial revenue | $ | 18,764 | | | 4,221 | | | 39,477 | | | 12,426 | |
| Residential revenue (a) | 557 | | | 2,080 | | | 3,264 | | | 7,261 | |
| | | | | | | |
| Solar construction revenue | $ | 19,321 | | | 6,301 | | | 42,741 | | | 19,687 | |
(a) In April 2024, the Company announced a change in its solar engineering, procurement, and construction operations to focus exclusively on the commercial solar market and will discontinue its residential solar operations. As a result, residential revenue will continue to decline from historical amounts as existing customer contracts are completed.
Other Income (Expense)
The following table presents the components of "other, net" in "other income (expense)" on the consolidated statements of income:
| | | | | | | | | | | | | | | | | | | | | | | |
| Three months ended September 30, | | Nine months ended September 30, |
| 2024 | | 2023 | | 2024 | | 2023 |
| Reinsurance premiums | $ | 16,619 | | | 6,287 | | | 44,250 | | | 10,638 | |
| Investment activity, net | 8,529 | | | (1,003) | | | 7,447 | | | (8,155) | |
| ALLO preferred return | 4,783 | | | 2,299 | | | 11,353 | | | 6,822 | |
| Borrower late fee income | 1,741 | | | 2,220 | | | 7,460 | | | 6,635 | |
| Administration/sponsor fee income | 1,420 | | | 1,712 | | | 4,448 | | | 5,180 | |
| Investment advisory services (WRCM) | 1,394 | | | 1,633 | | | 4,427 | | | 4,884 | |
| Loss from ALLO voting membership interest investment | — | | | (17,293) | | | (10,693) | | | (49,676) | |
| | | | | | | |
| | | | | | | |
| Loss from solar investments, net | (11,238) | | | (6,456) | | | (11,068) | | | (19,485) | |
| Other | 9,077 | | | 7,539 | | | 20,433 | | | 15,860 | |
| Other, net | $ | 32,325 | | | (3,062) | | | 78,057 | | | (27,297) | |
14. Major Customer
Government Loan Servicing
Nelnet Servicing, a subsidiary of the Company, earns loan servicing revenue from a servicing contract with the Department of Education (the "Department"). Revenue earned by the Company related to this contract was $85.2 million and $100.2 million for the three months ended September 30, 2024 and 2023, respectively, and $277.7 million and $304.8 million for the nine months ended September 30, 2024 and 2023, respectively.
The Company's legacy student loan servicing contract with the Department was scheduled to expire on December 14, 2023. In April 2023, Nelnet Servicing received a contract award from the Department, pursuant to which it was selected to provide continued servicing capabilities for the Department's student aid recipients under a new Unified Servicing and Data Solution (USDS) contract (the "New Government Servicing Contract") which replaced the legacy Department student loan servicing contract.
The New Government Servicing Contract became effective April 24, 2023 and has a five year base period, with 2 two-year and 1 one-year possible extensions. The Department's total loan servicing volume of existing borrowers was allocated by the Department to Nelnet Servicing and four other third-party servicers that were awarded a USDS contract. Under the New Government Servicing Contract, Nelnet Servicing immediately began to make required servicing platform enhancements, for which it will be compensated from the Department on certain of these investments. Servicing under the New Government Servicing Contract went live on April 1, 2024 and the Company recognized revenue in accordance with this new contract beginning in the second quarter of 2024. The Company earned revenue for servicing borrowers under the legacy servicing contract with the Department through March 31, 2024.
The New Government Servicing Contract has multiple revenue components with tiered pricing based on borrower volume, while revenue earned under the legacy servicing contract was primarily based on borrower status. Assuming borrower volume remains consistent under the New Government Servicing Contract, the Company expects revenue earned on a per borrower blended basis will decrease under the New Government Servicing Contract versus the legacy contract. However, consistent with the legacy contract, the Company expects to earn additional revenue from the Department under the New Government Servicing Contract for change requests and other support services. In addition, the Company has executed an agreement with a third-party servicer awarded a USDS contract to license its servicing software to such entity. The Company began earning remote hosted servicing revenue from this new customer during the second quarter of 2024. The amount of revenue earned by the Company from this new customer will depend on the number of servicing borrowers allocated by the Department to this servicer.
15. Fair Value
The following tables present the Company’s financial assets and liabilities that are measured at fair value on a recurring basis.
| | | | | | | | | | | | | | | | | | | | | | | | | | | | | | | | | | | | | | | |
| | As of September 30, 2024 | | As of December 31, 2023 |
| | Level 1 | | Level 2 | | | | Total | | Level 1 | | Level 2 | | | | Total |
| Assets: | | | | | | | | | | | | | | | |
| Investments: | | | | | | | | | | | | | | | |
| Asset-backed debt securities - available-for-sale | $ | 100 | | | 975,695 | | | | | 975,795 | | | 99 | | | 955,804 | | | | | 955,903 | |
| Equity securities | 186 | | | — | | | | | 186 | | | 73 | | | — | | | | | 73 | |
| Equity securities measured at net asset value (a) | | | | | | | 70,159 | | | | | | | | | 50,834 | |
| Total investments | 286 | | | 975,695 | | | | | 1,046,140 | | | 172 | | | 955,804 | | | | | 1,006,810 | |
| Derivative instruments | — | | | 118 | | | | | 118 | | | — | | | 452 | | | | | 452 | |
| Total assets | $ | 286 | | | 975,813 | | | | | 1,046,258 | | | 172 | | | 956,256 | | | | | 1,007,262 | |
| Liabilities: | | | | | | | | | | | | | | | |
| Derivative instruments | $ | — | | | 2,434 | | | | | 2,434 | | | — | | | 1,976 | | | | | 1,976 | |
| Total liabilities | $ | — | | | 2,434 | | | | | 2,434 | | | — | | | 1,976 | | | | | 1,976 | |
(a) In accordance with the Fair Value Measurements Topic of the FASB Accounting Standards Codification, certain investments that are measured at fair value using the net asset value per share (or its equivalent) practical expedient have not been classified in the fair value hierarchy.
The following table summarizes the fair values of all of the Company’s financial instruments on the consolidated balance sheets. The methodologies for estimating the fair value of financial assets and liabilities are described in note 23 of the notes to consolidated financial statements included in the 2023 Annual Report.
| | | | | | | | | | | | | | | | | | | | | | | | | | | | | |
| | As of September 30, 2024 |
| | Fair value | | Carrying value | | Level 1 | | Level 2 | | Level 3 |
| Financial assets: | | | | | | | | | |
| Loans receivable | $ | 10,502,403 | | | 9,972,784 | | | — | | | — | | | 10,502,403 | |
| Accrued loan interest receivable | 600,097 | | | 600,097 | | | — | | | 600,097 | | | — | |
| Cash and cash equivalents | 219,684 | | | 219,684 | | | 219,684 | | | — | | | — | |
| Investments (at fair value) | 1,046,140 | | | 1,046,140 | | | 286 | | | 975,695 | | | — | |
| Investments - held-to-maturity asset-backed securities | 227,586 | | | 222,480 | | | — | | | 227,586 | | | — | |
| Notes receivable | 27,778 | | | 27,778 | | | — | | | 27,778 | | | — | |
| Beneficial interest in loan securitizations | 232,654 | | | 218,659 | | | — | | | — | | | 232,654 | |
| Restricted cash | 344,366 | | | 344,366 | | | 344,366 | | | — | | | — | |
| Restricted cash – due to customers | 334,968 | | | 334,968 | | | 334,968 | | | — | | | — | |
| | | | | | | | | |
| Derivative instruments | 118 | | | 118 | | | — | | | 118 | | | — | |
| Financial liabilities: | | | | | | | | | |
| Bonds and notes payable | 8,901,588 | | | 8,938,446 | | | — | | | 8,901,588 | | | — | |
| Accrued interest payable | 25,389 | | | 25,389 | | | — | | | 25,389 | | | — | |
| Bank deposits | 1,058,023 | | | 1,070,758 | | | 754,116 | | | 303,907 | | | — | |
| Due to customers | 404,459 | | | 404,459 | | | 404,459 | | | — | | | — | |
| Derivative instruments | 2,434 | | | 2,434 | | | — | | | 2,434 | | | — | |
| | | | | | | | | | | | | | | | | | | | | | | | | | | | | |
| | As of December 31, 2023 |
| | Fair value | | Carrying value | | Level 1 | | Level 2 | | Level 3 |
| Financial assets: | | | | | | | | | |
| Loans receivable | $ | 12,800,638 | | | 12,343,819 | | | — | | | — | | | 12,800,638 | |
| Accrued loan interest receivable | 764,385 | | | 764,385 | | | — | | | 764,385 | | | — | |
| Cash and cash equivalents | 168,112 | | | 168,112 | | | 168,112 | | | — | | | — | |
| Investments (at fair value) | 1,006,810 | | | 1,006,810 | | | 172 | | | 955,804 | | | — | |
| Investments - held-to-maturity asset-backed securities | 163,622 | | | 162,738 | | | — | | | 163,622 | | | — | |
| Notes receivable | 53,747 | | | 53,747 | | | — | | | 53,747 | | | — | |
| Beneficial interest in loan securitizations | 262,093 | | | 225,079 | | | — | | | — | | | 262,093 | |
| Restricted cash | 488,723 | | | 488,723 | | | 488,723 | | | — | | | — | |
| Restricted cash – due to customers | 368,656 | | | 368,656 | | | 368,656 | | | — | | | — | |
| | | | | | | | | |
| Derivative instruments | 452 | | | 452 | | | — | | | 452 | | | — | |
| Financial liabilities: | | | | | | | | | |
| Bonds and notes payable | 11,629,359 | | | 11,828,393 | | | — | | | 11,629,359 | | | — | |
| Accrued interest payable | 35,391 | | | 35,391 | | | — | | | 35,391 | | | — | |
| Bank deposits | 722,973 | | | 743,599 | | | 467,420 | | | 255,553 | | | — | |
| Due to customers | 425,507 | | | 425,507 | | | 425,507 | | | — | | | — | |
| Derivative instruments | 1,976 | | | 1,976 | | | — | | | 1,976 | | | — | |
ITEM 2. MANAGEMENT’S DISCUSSION AND ANALYSIS OF FINANCIAL CONDITION AND RESULTS OF OPERATIONS
(Management’s Discussion and Analysis of Financial Condition and Results of Operations is for the three and nine months ended September 30, 2024 and 2023. All dollars are in thousands, except per share amounts, unless otherwise noted.)
The following discussion and analysis provides information that the Company’s management believes is relevant to an assessment and understanding of the consolidated results of operations and financial condition of the Company. The discussion should be read in conjunction with the Company’s consolidated financial statements included in the 2023 Annual Report.
Forward-looking and cautionary statements
This report contains forward-looking statements and information that are based on management's current expectations as of the date of this document. Statements that are not historical facts, including statements about the Company's plans and expectations for future financial condition, results of operations or economic performance, or that address management's plans and objectives for future operations, and statements that assume or are dependent upon future events, are forward-looking statements. The words “anticipate,” “assume,” “believe,” “continue,” “could,” “ensure,” “estimate,” “expect,” “forecast,” “future,” “intend,” “may,” “plan,” “potential,” “predict,” “scheduled,” “should,” “will,” “would,” and similar expressions, as well as statements in future tense, are intended to identify forward-looking statements.
The forward-looking statements are based on assumptions and analyses made by management in light of management's experience and its perception of historical trends, current conditions, expected future developments, and other factors that management believes are appropriate under the circumstances. These statements are subject to known and unknown risks, uncertainties, assumptions, and other factors that may cause the actual results and performance to be materially different from any future results or performance expressed or implied by such forward-looking statements. These factors include, among others, the risks and uncertainties set forth in the “Risk Factors” section of the 2023 Annual Report and include such risks and uncertainties as:
•risks related to the ability to successfully maintain and increase allocated volumes of student loans serviced by the Company under existing and future servicing contracts with the Department, risks related to unfavorable contract modifications or interpretations, and risks related to the Company's ability to comply with agreements with third-party customers for the servicing of Federal Direct Loan Program, Federal Family Education Loan Program (the "FFEL Program" or FFELP), private education, and consumer loans;
•loan portfolio risks such as prepayment risk, credit risk, interest rate basis and repricing risk, risks related to the use of derivatives to manage exposure to interest rate fluctuations, uncertainties regarding the expected benefits from purchased securitized and unsecuritized FFELP, private education, consumer, and other loans, or investment interests therein, and initiatives to purchase additional FFELP, private education, consumer, and other loans;
•financing and liquidity risks, including risks of changes in the interest rate environment;
•risks from changes in the terms of education loans and in the educational credit and services markets resulting from changes in applicable laws, regulations, and government programs and budgets;
•risks related to a breach of or failure in the Company's operational or information systems or infrastructure, or those of third-party vendors, including disclosure of confidential or personal information and/or damage to reputation resulting from cyber breaches;
•risks related to use of artificial intelligence;
•uncertainties inherent in forecasting future cash flows from student loan assets and related asset-backed securitizations;
•risks related to the ability of Nelnet Bank to achieve its business objectives and effectively deploy loan and deposit strategies and achieve expected market penetration;
•risks related to the expected benefits to the Company from its continuing investment in ALLO Holdings, LLC (referred to collectively with its subsidiary ALLO Communications LLC as "ALLO"), and risks related to investments in solar projects, including risks of not being able to realize tax credits which remain subject to recapture by taxing authorities and rising construction costs;
•risks and uncertainties related to other initiatives to pursue additional strategic investments (and anticipated income therefrom) including venture capital and real estate investments, reinsurance, acquisitions, and other activities (including risks associated with errors that occasionally occur in converting loan servicing portfolios to a new servicing platform), including activities that are intended to diversify the Company both within and outside of its historical core education-related businesses;
•risks and uncertainties associated with climate change; and
•risks and uncertainties associated with litigation matters and maintaining compliance with the extensive regulatory requirements applicable to the Company's businesses, and uncertainties inherent in the estimates and assumptions about future events that management is required to make in the preparation of the Company’s consolidated financial statements.
All forward-looking statements contained in this report are qualified by these cautionary statements and are made only as of the date of this document. Although the Company may from time to time voluntarily update or revise its prior forward-looking statements to reflect actual results or changes in the Company's expectations, the Company disclaims any commitment to do so except as required by law.
OVERVIEW
The Company is a diversified hybrid holding company with primary businesses being consumer lending, loan servicing, payments, and technology - all with a large customer emphasis in the education space. The largest operating businesses engage in loan servicing and education technology services and payments. A significant portion of the Company's revenue is net interest income earned on a portfolio of federally insured student loans. The Company also makes investments to further diversify both within and outside of its historical core education-related businesses including, but not limited to, investments in a fiber communications company (ALLO), early-stage and emerging growth companies (venture capital investments), real estate, reinsurance, and renewable energy (solar). The Company is also actively expanding its private education, consumer, and other loan portfolios, and in November 2020 launched Nelnet Bank.
Reclassifications and Immaterial Error Corrections
The accompanying Management's Discussion and Analysis of Financial Condition and Results of Operations gives effect to the immaterial error corrections made to the previously reported consolidated financial statements for the three and nine months ended September 30, 2023. For additional information, see note 2 of the notes to consolidated financial statements included under Part I, Item 1 of this report.
GAAP Net Income and Non-GAAP Net Income, Excluding Adjustments
The Company prepares its financial statements and presents its financial results in accordance with GAAP. However, it also provides additional non-GAAP financial information related to specific items management believes to be important in the evaluation of its operating results and performance. A reconciliation of the Company's GAAP net income to Non-GAAP net income, excluding derivative market value adjustments, and a discussion of why the Company believes providing this additional information is useful to investors, is provided below.
| | | | | | | | | | | | | | | | | | | | | | | |
| Three months ended September 30, | | Nine months ended September 30, |
| 2024 | | 2023 | | 2024 | | 2023 |
| GAAP net income attributable to Nelnet, Inc. | $ | 2,388 | | | 44,354 | | | 120,886 | | | 97,739 | |
| Realized and unrealized derivative market value adjustments (a) | 13,165 | | | (3,140) | | | 3,668 | | | 32,266 | |
| Tax effect (b) | (3,160) | | | 754 | | | (880) | | | (7,744) | |
| Non-GAAP net income attributable to Nelnet, Inc., excluding derivative market value adjustments | $ | 12,393 | | | 41,968 | | | 123,674 | | | 122,261 | |
| | | | | | | |
| Earnings per share: | | | | | | | |
| GAAP net income attributable to Nelnet, Inc. | $ | 0.07 | | | 1.18 | | | 3.29 | | | 2.61 | |
| Realized and unrealized derivative market value adjustments (a) | 0.36 | | | (0.08) | | | 0.10 | | | 0.86 | |
| Tax effect (b) | (0.09) | | | 0.02 | | | (0.02) | | | (0.20) | |
| Non-GAAP net income attributable to Nelnet, Inc., excluding derivative market value adjustments | $ | 0.34 | | | 1.12 | | | 3.37 | | | 3.27 | |
(a) "Derivative market value adjustments" includes both the realized portion of gains and losses (corresponding to variation margin received or paid on derivative instruments that are settled daily at a central clearinghouse) and the unrealized portion of gains and losses that are caused by changes in fair values of derivatives which do not qualify for "hedge treatment" under GAAP. "Derivative market value adjustments" does not include "derivative settlements" that represent the cash paid or received during the respective period to settle with derivative instrument counterparties the economic effect of the Company's derivative instruments based on their contractual terms.
The accounting for derivatives requires that changes in the fair value of derivative instruments be recognized currently in earnings, with no fair value adjustment of the hedged item, unless specific hedge accounting criteria is met. Management has structured all of the Company’s derivative transactions with the intent that each is economically effective; however, the Company’s derivative instruments do not qualify for hedge accounting in the consolidated financial statements. As a result, the change in fair value of derivative instruments is reported in current period earnings with no consideration for the corresponding change in fair value of the hedged item. Under GAAP, the cumulative net realized and unrealized gain or loss caused by changes in fair values of derivatives in which the Company plans to hold to maturity will equal zero over the life of the contract. However, the net realized and unrealized gain or loss during any given reporting period fluctuates significantly from period to period.
The Company believes these point-in-time estimates of asset and liability values related to its derivative instruments that are subject to interest rate fluctuations are subject to volatility mostly due to timing and market factors beyond the control of management, and affect the period-to-period comparability of the results of operations. Accordingly, the Company’s management utilizes operating results excluding these items for comparability purposes when making decisions regarding the Company’s performance and in presentations with credit rating agencies, lenders, and investors. Consequently, the Company reports this non-GAAP information because the Company believes that it provides additional information regarding operational and performance indicators that are closely assessed by management. There is no comprehensive, authoritative guidance for the presentation of such non-GAAP information, which is only meant to supplement GAAP results by providing additional information that management utilizes to assess performance.
(b) The tax effects are calculated by multiplying the realized and unrealized derivative market value adjustments by the applicable statutory income tax rate.
Operating Segments
The Company's reportable operating segments are described in note 1 of the notes to consolidated financial statements included in the 2023 Annual Report. They include:
•Loan Servicing and Systems (LSS) - referred to as Nelnet Diversified Services (NDS)
•Education Technology Services and Payments (ETSP) - referred to as Nelnet Business Services (NBS)
•Asset Generation and Management (AGM), part of the Nelnet Financial Services (NFS) division
•Nelnet Bank, part of the NFS division
The Company earns fee-based revenue through its NDS and NBS reportable operating segments. The Company earns net interest income on its loan portfolio, consisting primarily of FFELP loans, through its AGM reportable operating segment. This segment is expected to generate significant amounts of cash as the FFELP portfolio amortizes. The Company actively works to maximize the amount and timing of cash flows generated from its FFELP portfolio and seeks to acquire additional loan assets to leverage its servicing scale and expertise to generate incremental earnings and cash flow. Nelnet Bank operates as an internet industrial bank franchise focused on the private education and unsecured consumer loan markets, with a home office in Salt Lake City, Utah. Other operating segments included in the NFS division include the Company's U.S. Securities and Exchange Commission (SEC)-registered investment advisor subsidiary, property and casualty reinsurance activities, investment activities in real estate, and investment debt securities (primarily student loan and other asset-backed securities) and interest expense incurred on debt used to finance such investments.
Other business activities and operating segments that are not reportable and not part of the NFS division are combined and included in Corporate and Other Activities ("Corporate"). Corporate also includes interest income earned on cash balances held at the corporate level and interest expense incurred on unsecured and secured corporate related debt transactions, certain investment activities including its investment in ALLO and early-stage and emerging growth companies (venture capital investments), and certain shared service activities that are allocated to each operating segment based on estimated use of such activities and services. In addition, Corporate includes corporate costs and overhead functions not allocated to operating segments, including executive management, investments in innovation, and other holding company organizational costs.
The information below presents the operating results (net income (loss) before taxes) for each of the Company's reportable and certain other operating segments reconciled to the consolidated financial statements for the three and nine months ended September 30, 2024 and 2023. See "Results of Operations" for additional detail regarding each reportable operating segment, the NFS operating segments, and Corporate and Other Activities under this Item 2.
| | | | | | | | | | | | | | | | | | | | | | | | | | | | | |
| Three months ended September 30, | | Nine months ended September 30, | | Certain Items Impacting Comparability
(All dollar amounts below are pre-tax) |
| 2024 | | 2023 | | 2024 | | 2023 | |
| NDS | $ | (4,549) | | | 24,469 | | | 13,686 | | | 66,713 | | | •2024 results have been negatively impacted by a decrease in revenue and increase in expenses. Revenue has been adversely impacted based on the Company earning less revenue under the new government servicing contract that began on April 1, 2024, in addition to servicing fewer borrowers. Operating expenses have been elevated due to costs incurred for the completion of the transfer of direct loan servicing volume to one platform, making platform enhancements for the new student loan servicing contract, preparation of the conversion of the Discover private education student loan servicing portfolio, which is expected to be completed during the fourth quarter of 2024, and increase in postage and communication costs due to borrowers returning to repayment on September 1, 2023. The Company expects this segment's operating results will improve in future periods as the full impact of its cost-saving measures take effect and new third-party servicing opportunities convert to the Company's platform. |
| NBS | 26,813 | | | 22,123 | | | 100,046 | | | 77,803 | | | •An increase in before tax operating margin due to increased revenue while maintaining a consistent cost structure. |
| Nelnet Financial Services division: | | | | | | | | | |
| AGM | (16,346) | | | 40,562 | | | 41,710 | | | 58,041 | | | •The recognition of $29.0 million and $5.9 million in provision for beneficial interest related to certain loan securitization investments in the three months ended September 30, 2024 and June 30, 2024, respectively. Over the life of these securitizations, the Company still anticipates attractive returns on the overall pool of these investments. •The recognition of a non-cash expense of $5.6 million and $25.9 million in the three months ended September 30, 2024 and June 30, 2023, respectively, as the result of writing off the remaining unamortized debt discount in connection with the redemption of certain asset-backed debt securities prior to their maturity. •The recognition of $12.0 million and $2.3 million in provision for loan losses for the three months ended September 30, 2024 and 2023, respectively, and provision of $14.2 million and negative provision of $1.0 million for the nine months ended September 30, 2024 and 2023, respectively. •A decrease of $5.9 million in net loan interest income, including derivative settlements (core loan interest income), for the three months ended September 30, 2024 compared with the same period in 2023 due to a decrease in the average balance of loans partially offset by an increase in core loan spread, and a decrease of $55.4 million for the nine months ended September 30, 2024 compared with the same period in 2023 due to a decrease in the average balance of loans and core loan spread. •A net loss of $9.5 million and net income of $1.2 million related to changes in the fair values of derivative instruments that do not qualify for hedge accounting for the three months ended September 30, 2024 and 2023, respectively, and a net loss of $2.9 million and $35.3 million for the nine months ended September 30, 2024 and 2023, respectively. •The recognition of $1.7 million in losses from the sale of loans for the nine months ended September 30, 2024 compared with $16.8 million in the same period of 2023. |
| Nelnet Bank | (4,758) | | | 2,299 | | | (7,330) | | | 3,951 | | | •The recognition of provision for loan losses of $6.1 million for the three months ended September 30, 2024 compared with $1.9 million for the same period in 2023, and $18.4 million for the nine months ended September 30, 2024 compared with $5.8 million for the same period in 2023. •A net loss of $3.6 million and net income of $1.9 million related to changes in the fair values of derivative instruments that do not qualify for hedge accounting for the three months ended September 30, 2024 and 2023, respectively, and a net loss of $0.8 million and net income of $3.1 million for the nine months ended September 30, 2024 and 2023, respectively. |
| NFS other operating segments | 14,038 | | | 9,220 | | | 44,325 | | | 31,321 | | | •An increase in net interest income and net gains related to the Company's investment securities. |
| Corporate: | | | | | | | | | |
| Unallocated corporate costs | (10,287) | | | (20,915) | | | (29,389) | | | (47,986) | | | •Decrease due to the Company's focus on reducing its cost structure and continued focus on allocating costs to operating segments based on use of such services. |
| | | | | | | | | | | | | | | | | | | | | | | | | | | | | |
| ALLO investment | 6,606 | | | (15,559) | | | 1,953 | | | (44,528) | | | •The recognition of no loss in the three months ended September 30, 2024 compared with a loss of $17.3 million for the same period in 2023 and a loss of $10.7 million in the nine months ended September 30, 2024 compared with $49.7 million for the same period in 2023 from the ALLO voting membership interest investment. Absent additional equity contributions with respect to ALLO's voting membership interests, the Company will not recognize additional losses for its voting membership interests in ALLO. •The recognition of income of $4.8 million on the Company's preferred membership interests in ALLO for the three months ended September 30, 2024 compared with $2.3 million for the same period in 2023 and $11.4 million for the nine months ended September 30, 2024 compared with $6.8 million for the same period in 2023. |
| Nelnet Renewable Energy - GRNE | (10,125) | | | (4,864) | | | (18,913) | | | (16,169) | | | •Since the acquisition of GRNE Solar in 2022, it has incurred low and, in some cases, negative margins on certain solar construction projects. During the third quarter of 2024, the Company recorded an expense of $8.8 million related to estimated losses on legacy construction projects. The Company has a handful of remaining legacy construction contracts to complete, down from over 30 at the beginning of 2024. Due to the complexity and long-term nature of existing construction contracts, the Company may continue to incur low and/or negative margins to complete these projects. •In April 2024, the Company announced a change in its solar construction operations to focus exclusively on the commercial solar market and will discontinue its residential solar operations. During the second quarter of 2024, the Company recognized non-cash impairment charges of $1.9 million on certain assets related to the residential operations and $1.6 million in severance costs and commissions paid for cancelled contracts. •The Company believes its solar construction business is making progress in repositioning the business for long-term profitable success. |
| Nelnet Renewable Energy - Tax equity investments/ syndication/ administration | (8,509) | | | (8,736) | | | (8,775) | | | (24,237) | | | •The recognition of net losses from tax solar investments of $11.3 million in the three months ended September 30, 2024 compared with $6.5 million for the same period in 2023 and $11.1 million in the nine months ended September 30, 2024 compared with $19.5 million for the same period in 2023. These losses include losses attributable to third-party non-controlling interest investors. See note 6 of the notes to consolidated financial statements included under Part I, Item 1 of this report for additional information. These losses are partially offset by revenue earned by the Company related to management, consulting, and performance fees provided on tax equity investments made by third parties. |
| Other corporate activities | 4,892 | | | 1,520 | | | 12,829 | | | 2,909 | | | •Includes operating results of the Company's venture capital investments and other corporate activities. Increase in 2024 compared with 2023 was due to venture capital activities. |
| Net (loss) income before taxes | (2,223) | | | 50,119 | | | 150,141 | | | 107,819 | | | |
| Income tax benefit (expense) | 282 | | | (10,512) | | | (37,653) | | | (28,785) | | | |
| Net loss attributable to noncontrolling interests | 4,329 | | | 4,747 | | | 8,398 | | | 18,705 | | | •The majority of noncontrolling interests represents losses attributed to noncontrolling membership interests in the Company’s Nelnet Renewable Energy operating segment. |
| Net income | $ | 2,388 | | | 44,354 | | | 120,886 | | | 97,739 | | | |
CONSOLIDATED RESULTS OF OPERATIONS
An analysis of the Company's consolidated operating results for the three and nine months ended September 30, 2024 compared with the same periods in 2023 is provided below.
The Company operates as distinct reportable operating segments as described above. For a reconciliation of the reportable segment operating results to the consolidated results of operations, see note 12 of the notes to consolidated financial statements included under Part I, Item 1 of this report. Since the Company monitors and assesses its operations and results based on these segments, the discussion following the consolidated results of operations is presented on a reportable segment basis.
| | | | | | | | | | | | | | | | | | | | | | | | | | | | | |
| | Three months ended | | Nine months ended | | |
| | September 30, | | September 30, | | |
| | 2024 | | 2023 | | 2024 | | 2023 | | Additional information |
| Loan interest | $ | 190,211 | | | 236,423 | | | 609,064 | | | 704,712 | | | Decrease was due to decreases in the average balance of loans partially offset by an increase in the gross yield earned on loans. |
| Investment interest | 50,272 | | | 48,128 | | | 143,086 | | | 129,835 | | | Includes income from unrestricted interest-earning deposits and investments, and restricted cash in asset-backed securitizations. Increase was due to an increase in the average balances and interest rates and, for the nine months ended September 30, 2024, an increase in interest earned on the Company's partial ownership in loan securitizations that are accounted for as held-to-maturity beneficial interest investments. |
| Total interest income | 240,483 | | | 284,551 | | | 752,150 | | | 834,547 | | | |
| Interest expense | 168,328 | | | 207,159 | | | 539,367 | | | 639,756 | | | Decrease was due to a decrease in the average balance of debt outstanding partially offset by an increase in cost of funds. In addition, the Company recognized a $5.6 million and $25.9 million non-cash expense during the third quarter of 2024 and the second quarter of 2023, respectively, as the result of writing off the remaining unamortized debt discount related to the redemption of certain asset-backed debt securities prior to their maturity. |
| Net interest income | 72,155 | | | 77,392 | | | 212,783 | | | 194,791 | | | |
| Less provision for loan losses | 18,111 | | | 4,275 | | | 32,551 | | | 5,065 | | | Represents the current period provision to reflect the lifetime expected credit losses related to the Company's loan portfolio. See note 3 of the notes to consolidated financial statements included under Part I, Item 1 of this report for the factors impacting provision for loan losses for the periods presented. |
| Net interest income after provision for loan losses | 54,044 | | | 73,117 | | | 180,232 | | | 189,726 | | | |
| Other income (expense): | | | | | | | | | |
| LSS revenue | 108,175 | | | 127,892 | | | 344,428 | | | 389,138 | | | See LSS operating segment - results of operations. |
| ETSP revenue | 118,179 | | | 113,796 | | | 378,627 | | | 357,258 | | | See ETSP operating segment - results of operations. |
| Solar construction revenue | 19,321 | | | 6,301 | | | 42,741 | | | 19,687 | | | Represents revenue earned from GRNE Solar providing solar construction services, including design and installations of residential and commercial solar systems. In April 2024, the Company announced a change in its solar EPC operations to focus exclusively on the commercial solar market and will discontinue its residential solar operations. As a result, residential revenue will continue to decline in future periods as existing customer contracts are completed. |
| Other, net | 32,325 | | | (3,062) | | | 78,057 | | | (27,297) | | | See table below for the components of "other, net." |
| Loss on sale of loans | (107) | | | (1,022) | | | (1,685) | | | (16,776) | | | The Company recognized losses from selling portfolios of loans. See note 3 of the notes to consolidated financial statements included under Part I, Item 1 of this report for additional information. |
| Impairment expense and provision for beneficial interests | (29,052) | | | (4,974) | | | (36,865) | | | (4,974) | | | The Company established a provision of $29.0 million and $5.9 million for beneficial interest in loan securitization investments during the third quarter and second quarter of 2024, respectively. The Company also recognized a non-cash impairment charge of $1.9 million during the second quarter of 2024 related to the discontinuation of residential solar operations. During the third quarter of 2023, the Company recognized an expense of $5.0 million related to operating lease assets and associated leasehold improvements. See note 9 of the notes to consolidated financial statements included under Part I, Item 1 of this report for additional information. |
| Derivative settlements, net | 1,640 | | | 817 | | | 5,046 | | | 24,219 | | | The Company maintains an overall risk management strategy that incorporates the use of derivative instruments to reduce the economic effect of interest rate volatility. Derivative settlements for each applicable period should be evaluated with the Company's net interest income. The majority of derivative settlements received in the periods presented was from the Company's derivatives used to hedge loans earning fixed rate floor income. To minimize the Company's exposure to market volatility and increase liquidity, the Company terminated this derivative portfolio ($2.8 billion notional amount) on March 15, 2023. Subsequent to terminating these derivatives, during the second and fourth quarters of 2023, the Company entered into a total of $400 million notional amount of derivatives to hedge loans earning fixed rate floor income and other loans and investments in which the Company receives a fixed rate. See AGM operating segment - results of operations for additional information. |
| | | | | | | | | | | | | | | | | | | | | | | | | | | | | |
| Derivative market value adjustments, net | (13,165) | | | 3,140 | | | (3,668) | | | (32,266) | | | Includes the realized and unrealized gains and losses that are caused by changes in fair values of derivatives which do not qualify for "hedge treatment" under GAAP. The majority of the derivative market value adjustments during the periods presented related to the changes in fair value of the Company's floor income interest rate swaps. Such changes reflect that a decrease in the forward yield curve during a reporting period results in a decrease in the fair value of the Company's floor income interest rate swaps, and an increase in the forward yield curve during a reporting period results in an increase in the fair value of such swaps. To minimize the Company's exposure to market volatility and increase liquidity, the Company terminated this derivative portfolio ($2.8 billion notional amount) on March 15, 2023. As such, the Company expects the derivative market value adjustments in future periods will be less substantial. |
| | | | | | | | | |
| | | | | | | | | |
| Total other income (expense), net | 237,316 | | | 242,888 | | | 806,681 | | | 708,989 | | | |
| | | | | | | | | |
| Cost of services: | | | | | | | | | |
| | | | | | | | | |
| Cost to provide education technology services and payments | 45,273 | | | 43,694 | | | 134,106 | | | 131,804 | | | Represents direct costs to provide payment processing and instructional services in ETSP. See ETSP operating segment - results of operations. |
| Cost to provide solar construction services | 26,815 | | | 7,783 | | | 49,115 | | | 25,204 | | | Represents direct costs to provide solar construction services. Since the acquisition of GRNE Solar in 2022, it has incurred low and, in some cases, negative margins on certain projects. During the third quarter of 2024, the Company recorded an expense of $8.8 million related to estimated losses on legacy construction projects. The Company has a handful of remaining legacy construction contracts to complete, down from over 30 at the beginning of 2024. Due to the complexity and long-term nature of existing construction contracts, the Company may continue to incur low and/or negative margins to complete these projects. |
| Total cost of services | 72,088 | | | 51,477 | | | 183,221 | | | 157,008 | | | |
| | | | | | | | | |
| | | | | | | | | |
| Operating expenses: | | | | | | | | | |
| Salaries and benefits | 146,192 | | | 141,204 | | | 429,701 | | | 438,620 | | | Increase for the quarterly period was primarily due to the recognition of $4.1 million restructuring charge related to staff reductions announced in June 2024 in LSS. Decrease for the nine month period was primarily due to staff reductions in the first half of 2023 in LSS to manage expenses due to delays in the government's student debt relief and return to repayment programs and lower pricing and reduced servicing volume for LSS's Department servicing contract, partially offset by an increase in ETSP due to annual merit pay increases and an increase in headcount to support the growth of the customer base and the investment in the development of new technologies. |
| Depreciation and amortization | 13,661 | | | 21,835 | | | 45,572 | | | 57,114 | | | Includes depreciation of property and equipment and the amortization of intangibles from prior business acquisitions. |
| Other expenses | 61,642 | | | 51,370 | | | 178,278 | | | 138,154 | | | Includes expenses such as postage and distribution, consulting and professional fees, occupancy, communications, reinsurance loss reserve and acquisitions costs, and certain information technology-related costs. Increase was driven by an increase in NFS due to reinsurance loss reserve and acquisition costs as a result of growth in reinsurance policies and in LSS due to additional postage and communication costs as a result of borrowers returning to repayment on September 1, 2023. |
| Total operating expenses | 221,495 | | | 214,409 | | | 653,551 | | | 633,888 | | | |
| (Loss) income before income taxes | (2,223) | | | 50,119 | | | 150,141 | | | 107,819 | | | |
| Income tax (benefit) expense | (282) | | | 10,512 | | | 37,653 | | | 28,785 | | | The year to date effective tax rate was 23.75% for the nine months ended September 30, 2024 compared with 22.75% for the same period in 2023. |
| Net (loss) income | (1,941) | | | 39,607 | | | 112,488 | | | 79,034 | | | |
| Net loss attributable to noncontrolling interests | 4,329 | | | 4,747 | | | 8,398 | | | 18,705 | | | Represents the net income/loss attributable to the holders of noncontrolling membership interests. The majority is attributed to noncontrolling membership interests in the Company's Nelnet Renewable Energy operating segment. |
| Net income attributable to Nelnet, Inc. | $ | 2,388 | | | 44,354 | | | 120,886 | | | 97,739 | | | |
| Additional information: | | | | | | | | | See "Overview - GAAP Net Income and Non-GAAP Net Income, Excluding Adjustments" above for additional information about non-GAAP financial information. |
| Net income attributable to Nelnet, Inc. | $ | 2,388 | | | 44,354 | | | 120,886 | | | 97,739 | | |
| Derivative market value adjustments, net | 13,165 | | | (3,140) | | | 3,668 | | | 32,266 | | |
| Tax effect | (3,160) | | | 754 | | | (880) | | | (7,744) | | |
| Non-GAAP net income attributable to Nelnet, Inc., excluding derivative market value adjustments | $ | 12,393 | | | 41,968 | | | 123,674 | | | 122,261 | | |
The following table summarizes the components of "other, net" in "other income (expense)" on the consolidated statements of income.
| | | | | | | | | | | | | | | | | | | | | | | | | | | | | |
| | Three months ended September 30, | | Nine months ended September 30, | | |
| | 2024 | | 2023 | | 2024 | | 2023 | | Additional information |
| Reinsurance premiums | $ | 16,619 | | | 6,287 | | | 44,250 | | | 10,638 | | | See NFS division - results of operations - NFS other operating segments. |
| Investment activity, net (a) | 8,529 | | | (1,003) | | | 7,447 | | | (8,155) | | | See note (b) below for additional information. |
| ALLO preferred return | 4,783 | | | 2,299 | | | 11,353 | | | 6,822 | | | See Corporate - results of operations. |
| Borrower late fee income | 1,741 | | | 2,220 | | | 7,460 | | | 6,635 | | | See NFS division - results of operations - AGM operating segment. |
| Administration/sponsor fee income | 1,420 | | | 1,712 | | | 4,448 | | | 5,180 | | | See NFS division - results of operations - AGM operating segment. |
| Investment advisory services (WRCM) | 1,394 | | | 1,633 | | | 4,427 | | | 4,884 | | | See NFS division - results of operations - NFS other operating segments. |
| Loss from ALLO voting membership interest investment (a) | — | | | (17,293) | | | (10,693) | | | (49,676) | | | See Corporate - results of operations. |
| | | | | | | | | |
| | | | | | | | | |
| Loss from solar investments, net (a) | (11,238) | | | (6,456) | | | (11,068) | | | (19,485) | | | See Corporate - results of operations. |
| Other | 9,077 | | | 7,539 | | | 20,433 | | | 15,860 | | | |
| Other, net | $ | 32,325 | | | (3,062) | | | 78,057 | | | (27,297) | | | |
(a) The Company anticipates fluctuations in future periodic earnings resulting from investment purchases, sales, and valuation adjustments.
(b) Investment activity by operating segment and investment type follows:
| | | | | | | | | | | | | | | | | | | | | | | | | | | | | | | | | | | | | | | | | | | | | | | |
| Real Estate | | Venture Capital and Funds | | Equity / Bonds | | Total | | Real Estate | | Venture Capital and Funds | | Equity / Bonds | | Total |
| Three months ended September 30, |
| 2024 | | 2023 |
| NFS - AGM | $ | — | | | 1,778 | | | — | | | 1,778 | | | — | | | (1,883) | | | — | | | (1,883) | |
| NFS - Nelnet Bank | — | | | 219 | | | 589 | | | 808 | | | — | | | (16) | | | 565 | | | 549 | |
| NFS - Other Operating Segments | 2,116 | | | — | | | 1,349 | | | 3,465 | | | 75 | | | — | | | 885 | | | 960 | |
| Corporate | — | | | 2,478 | | | — | | | 2,478 | | | — | | | (629) | | | — | | | (629) | |
| $ | 2,116 | | | 4,475 | | | 1,938 | | | 8,529 | | | 75 | | | (2,528) | | | 1,450 | | | (1,003) | |
| | | | | | | | | | | | | | | |
| | | | | | | | | | | | | | | |
| Nine months ended September 30, |
| 2024 | | 2023 |
| NFS - AGM | $ | — | | | (600) | | | — | | | (600) | | | — | | | (4,532) | | | (476) | | | (5,008) | |
| NFS - Nelnet Bank | — | | | 31 | | | 1,874 | | | 1,905 | | | — | | | (288) | | | 1,651 | | | 1,363 | |
| NFS - Other Operating Segments | (1,510) | | | — | | | 1,872 | | | 362 | | | 502 | | | — | | | (2,732) | | | (2,230) | |
| Corporate | — | | | 5,780 | | | — | | | 5,780 | | | — | | | (2,280) | | | — | | | (2,280) | |
| $ | (1,510) | | | 5,211 | | | 3,746 | | | 7,447 | | | 502 | | | (7,100) | | | (1,557) | | | (8,155) | |
LOAN SERVICING AND SYSTEMS OPERATING SEGMENT – RESULTS OF OPERATIONS
Loan Servicing Volumes
| | | | | | | | | | | | | | | | | | | | | | | | | | | | | | | | | | | | | | | | | | | | | | | |
| As of |
| September 30,
2024 | | June 30,
2024 | | March 31,
2024 | | December 31,
2023 | | September 30,
2023 | | June 30,
2023 | | March 31,
2023 | | December 31,
2022 |
Servicing volume
(dollars in millions): | | | | | | | | | | | | | | | |
| Government | $ | 492,142 | | | $ | 489,298 | | | 495,409 | | | 494,691 | | | 500,554 | | | 519,308 | | | 537,291 | | | 545,373 | |
| FFELP | 13,745 | | | 14,576 | | | 15,783 | | | 17,462 | | | 18,400 | | | 19,021 | | | 19,815 | | | 20,226 | |
| Private and consumer | 20,666 | | | 19,876 | | | 21,015 | | | 20,493 | | | 20,394 | | | 20,805 | | | 21,484 | | | 21,866 | |
| Total | $ | 526,553 | | | $ | 523,750 | | | 532,207 | | | 532,646 | | | 539,348 | | | 559,134 | | | 578,590 | | | 587,465 | |
| | | | | | | | | | | | | | | |
| Number of servicing borrowers: | | | | | | | | | | | | | | | |
| Government | 14,114,468 | | | 14,096,152 | | | 14,328,013 | | | 14,503,057 | | | 14,543,382 | | | 14,898,901 | | | 15,518,751 | | | 15,777,328 | |
| FFELP | 574,979 | | | 610,745 | | | 656,814 | | | 725,866 | | | 764,660 | | | 788,686 | | | 819,791 | | | 829,939 | |
| Private and consumer | 851,747 | | | 829,072 | | | 882,256 | | | 894,703 | | | 896,613 | | | 899,095 | | | 925,861 | | | 951,866 | |
| Total | 15,541,194 | | | 15,535,969 | | | 15,867,083 | | | 16,123,626 | | | 16,204,655 | | | 16,586,682 | | | 17,264,403 | | | 17,559,133 | |
| | | | | | | | | | | | | | | |
| Number of remote hosted borrowers: | 662,075 | | | 133,681 | | | 65,295 | | | 70,580 | | | 103,396 | | | 716,908 | | | 5,048,324 | | | 6,135,760 | |
Government Loan Servicing
Nelnet Servicing earns loan servicing revenue from a servicing contract with the Department. The Company's legacy student loan servicing contract with the Department was scheduled to expire on December 14, 2023. In April 2023, Nelnet Servicing received a contract award from the Department, pursuant to which it was selected to provide continued servicing capabilities for the Department's student aid recipients under a new Unified Servicing and Data Solution (USDS) contract (the "New Government Servicing Contract") which replaced the legacy Department student loan servicing contract.
The New Government Servicing Contract became effective April 24, 2023 and has a five year base period, with 2 two-year and 1 one-year possible extensions. The Department's total loan servicing volume of existing borrowers was allocated by the Department to Nelnet Servicing and four other third-party servicers that were awarded a USDS contract. Under the New Government Servicing Contract, Nelnet Servicing immediately began to make required servicing platform enhancements, for which it will be compensated from the Department on certain of these investments. Servicing under the New Government Servicing Contract went live on April 1, 2024 and the Company recognized revenue in accordance with this new contract beginning in the second quarter of 2024. The Company earned revenue for servicing borrowers under the legacy servicing contract with the Department through March 31, 2024.
The New Government Servicing Contract has multiple revenue components with tiered pricing based on borrower volume, while revenue earned under the legacy servicing contract was primarily based on borrower status. Assuming borrower volume remains consistent under the New Government Servicing Contract, the Company expects revenue earned on a per borrower blended basis will decrease under the New Government Servicing Contract versus the legacy contract. However, consistent with the legacy contract, the Company expects to earn additional revenue from the Department under the New Government Servicing Contract for change requests and other support services. In addition, the Company has executed an agreement with a third-party servicer awarded a USDS contract to license its servicing software to such entity. The Company began earning remote hosted servicing revenue from this new customer during the second quarter of 2024. The amount of revenue earned by the Company from this new customer will depend on the number of servicing borrowers allocated by the Department to this servicer.
Department of Education Debt Relief
In August 2022, the Department announced a broad-based student debt relief plan that would have provided up to $20,000 in one-time debt relief to income-qualified recipients with Department held student loans. On June 30, 2023, the Supreme Court ruled that the Department was prohibited from implementing this plan. After the invalidation of this broad-based relief plan, the Department announced plans to enter into a negotiated rulemaking process to achieve debt relief for federal student loan borrowers using provisions of the Higher Education Act (HEA). The Company cannot predict the timing, nature, or ultimate outcome of any student debt relief program as a result of the negotiated rulemaking process. Revenue earned under the New
Government Servicing Contract will decrease in future periods if the Department successfully implements its debt relief plan and/or if the Department initiates additional loan forgiveness or cancellation programs in the future.
Private Education Loan Servicing
On July 17, 2024, Discover Financial Services (Discover) announced the sale of its approximately $10 billion private education student loan portfolio, representing approximately 400,000 borrowers, to partnerships managed by two global investment firms, with Firstmark Services, a division of the Company, assuming responsibility for servicing the portfolio upon the sale. The conversion of these loans to the Company’s platform began in September 2024 with the majority of loan conversions anticipated to be completed in the fourth quarter of 2024.
Summary and Comparison of Operating Results
| | | | | | | | | | | | | | | | | | | | | | | | | | | | | |
| | Three months ended September 30, | | Nine months ended September 30, | | |
| | 2024 | | 2023 | | 2024 | | 2023 | | Additional information |
| Interest income | $ | 894 | | 1,098 | | 4,046 | | 3,193 | | Decrease in the three months ended September 30, 2024 compared with the same period in 2023 was due to decrease in average balance of loan repayment funds held in custody for lenders. Increase in the nine months ended September 30, 2024 compared with the same period in 2023 was due to higher interest rates partially offset by a decrease in average balance of loan repayment funds held in custody for lenders. |
| Loan servicing and systems revenue | 108,175 | | 127,892 | | 344,428 | | 389,138 | | See table below for additional information. |
| Intersegment servicing revenue | 5,428 | | 6,944 | | 18,419 | | 21,980 | | Represents revenue earned by LSS from servicing loans for AGM and Nelnet Bank. Decrease was due to the continued amortization of AGM's FFELP portfolio. FFELP intersegment servicing revenue will continue to decrease as AGM's FFELP portfolio pays off. |
| Other income | 690 | | 687 | | 2,085 | | 1,900 | | Represents revenue earned from providing administrative support services. |
| Impairment expense | — | | (296) | | — | | (296) | | The Company recorded an impairment charge in the third quarter of 2023 related to certain facilities, as a result of the Company's on-going evaluation of the use of office space when a large number of associates continued to work remotely. |
| Total other income | 114,293 | | 135,227 | | 364,932 | | 412,722 | | |
| | | | | | | | | |
| Salaries and benefits | 76,820 | | 73,310 | | 224,172 | | 234,012 | | Decrease in the nine months ended September 30, 2024 compared with the same period in 2023 was due to the Company being fully staffed at the beginning of 2023 with contact center operations and support associates as the Company prepared for expiration of the federal student loan payment pause under the CARES Act. In the first half of 2023, the Company reduced staff to manage expenses due to delays in the government's student debt relief and return to repayment programs and lower pricing and reduced servicing volume for LSS's Department servicing contract. In June 2024, the Company announced an additional reduction in headcount after the completion of the transfer of direct loan servicing volume to one platform and the required servicing platform enhancements for the New Government Servicing Contract. Approximately 220 associates were notified their positions were being eliminated. The Company estimates incurring a charge of $7.1 million related to these staff reductions, of which $2.1 million and $4.1 million was recognized during the second and third quarters of 2024, respectively. The remaining expense will be recognized during the fourth quarter of 2024. Increase in the three months ended September 30, 2024 compared with the same period in 2023 was due to the recognition of the $4.1 million restructure charge related to staff reductions announced in June 2024. |
| Depreciation and amortization | 4,854 | | 5,023 | | 15,304 | | 14,400 | | |
| Other expenses | 19,663 | | 15,629 | | 59,861 | | 42,760 | | Increase was due to additional postage and communication costs due to borrowers returning to repayment on September 1, 2023, and an increase in computer services and subscription costs. |
| Intersegment expenses | 18,399 | | 17,894 | | 55,955 | | 58,030 | | Represents costs for certain corporate activities and services that are allocated to each operating segment based on estimated use of such activities and services. |
| Total operating expenses | 119,736 | | 111,856 | | 355,292 | | 349,202 | | |
| (Loss) income before income taxes | (4,549) | | 24,469 | | 13,686 | | 66,713 | | |
| Income tax benefit (expense) | 1,092 | | (5,872) | | (3,284) | | (16,011) | | Represents income tax expense/benefit at an effective tax rate of 24%. |
| Net (loss) income | $ | (3,457) | | 18,597 | | 10,402 | | 50,702 | |
|
| | | | | | | | | |
| | | | | | | | | |
| | | | | | | | | |
| | | | | | | | | | | | | | | | | | | | | | | | | | | | | |
| | | | | | | | | |
| | | | | | | | | |
| Before tax operating margin | (4.0) | % | | 18.1 | % | | 3.8 | % | | 16.2 | % | | Before tax operating margin represents before tax operating profitability as a percentage of revenue, and for LSS is calculated as income before income taxes divided by the total of loan servicing and systems revenue, intersegment servicing revenue, and other income. The Company uses this metric to monitor and assess the segment’s performance, manage operating costs, identify and evaluate business trends affecting the segment, and make strategic decisions, and believes that it provides additional information to facilitate an understanding of the operating performance of the segment and provides a meaningful comparison of the results of operations between periods. Before tax operating margin decreased in 2024 compared with 2023 due primarily to a decrease in loan servicing and systems revenue as described in the table below, while operating expenses increased period over period. Operating expenses have been elevated due to costs incurred for the completion of the transfer of direct loan servicing volume to one platform, making platform enhancements for the new student loan servicing contract with the Department, preparation of the conversion of the Discover portfolio, and an increase in postage and communication costs due to borrowers returning to repayment on September 1, 2023. The Company expects before tax operating margin to continue to be lower than historical prior year results for the remainder of 2024 until the full impact of its cost-saving measures take effect and revenue is generated from servicing the entire Discover portfolio after its full conversion to the Company's platform during the fourth quarter of 2024. |
| | | | | | | | |
| | | | | | | | |
| | | | | | | | |
Loan servicing and systems revenue
The following table presents disaggregated revenue by service offering for each reporting period.
| | | | | | | | | | | | | | | | | | | | | | | | | | | | | |
| Three months ended September 30, | | Nine months ended September 30, | | |
| | 2024 | | 2023 | | 2024 | | 2023 | | Additional information |
| Government loan servicing | $ | 85,215 | | | 100,154 | | | 277,705 | | | 304,769 | | | Represents revenue from the Company's servicing contracts with the Department. The Company recognized revenue under the New Government Servicing Contract beginning April 1, 2024. Decrease in the three months ended September 30, 2024 compared with the same period in 2023 was due to lower revenue earned on a per borrower blended basis under the new contract and a decrease in the number of borrowers serviced. Decrease in the nine months ended September 30, 2024 compared with the same period in 2023 was also due to the legacy servicing contract reduction of the monthly fee earned per borrower on certain borrower statuses by $0.19 effective April 1, 2023 and a decrease of borrowers serviced due to the Department transferring one million of the Company's existing borrowers to another third-party servicer during the second and third quarters of 2023. These decreases were partially offset by an increase in the average revenue earned on a per borrower blended basis as a result of borrowers moving to a repayment status on September 1, 2023. |
| Private education and consumer loan servicing | 13,057 | | | 12,330 | | | 38,634 | | | 36,556 | | | Increase in the three months ended September 30, 2024 compared with the same period in 2023 was due to an increase in backup servicing volume and conversion revenue recognized from the Discover portfolio. Increase in the nine months ended September 30, 2024 compared with the same period in 2023 was also due to rate increases based on contractual consumer price index changes. |
| FFELP loan servicing | 2,945 | | | 3,304 | | | 9,570 | | | 10,226 | | | Represents revenue from servicing third-party customers' FFELP portfolios. Over time, FFELP servicing revenue will decrease as third-party customers' FFELP portfolios pay off. |
| Software services | 5,197 | | | 9,416 | | | 14,617 | | | 25,076 | | | Represents revenue from providing remote hosted servicing software to certain Department and other servicers and providing diversified technology services. Decrease was primarily due to (i) the transfer of all Department remote hosted borrowers to other third-party servicers throughout 2023 under the Department's legacy servicing contracts and (ii) the recognition of $4.8 million of revenue in the third quarter of 2023 associated with deconversion of remote hosted borrowers from a customer leaving the Company's platform. This decrease was partially offset by the Company beginning to recognize revenue in the second quarter of 2024 from a new remote hosted servicing customer awarded a USDS contract. |
| Outsourced services | 1,761 | | | 2,688 | | | 3,902 | | | 12,511 | | | Represents revenue from providing contact center and back office operational outsourcing services. Decrease was due to the contracts for support provided to certain Department servicers expiring in July 2023. |
| Loan servicing and systems revenue | $ | 108,175 | | | 127,892 | | | 344,428 | | | 389,138 | | | |
| | | | | | | | | |
| | | | | | | | | |
EDUCATION TECHNOLOGY SERVICES AND PAYMENTS OPERATING SEGMENT – RESULTS OF OPERATIONS
As discussed further in the Company's 2023 Annual Report, this segment of the Company’s business is subject to seasonal fluctuations which correspond, or are related to, the traditional school year. Based on the timing of revenue recognition and when expenses are incurred, revenue and before tax operating margin are higher in the first quarter compared with the remainder of the year.
Summary and Comparison of Operating Results
| | | | | | | | | | | | | | | | | | | | | | | | | | | | | |
| | Three months ended September 30, | | Nine months ended September 30, | | |
| | 2024 | | 2023 | | 2024 | | 2023 | | Additional information |
| Interest income | $ | 9,734 | | | 8,934 | | | 23,315 | | | 20,237 | | | Represents interest income on tuition funds held in custody for schools. Increase was due to higher balances and interest rates. |
| Education technology services and payments revenue | 118,179 | | | 113,796 | | | 378,627 | | | 357,258 | | | See table below for additional information. |
| Intersegment revenue | 60 | | | 77 | | | 166 | | | 198 | | | |
| | | | | | | | | |
| | | | | | | | | |
| Total other income | 118,239 | | | 113,873 | | | 378,793 | | | 357,456 | | | |
| Cost of services | 45,273 | | | 43,694 | | | 134,106 | | | 131,804 | | | See table below for additional information. |
| Salaries and benefits | 41,053 | | | 39,776 | | | 121,956 | | | 116,040 | | | Increase in the three months ended September 30, 2024 compared with the same period in 2023 was due to annual merit pay increases. Increase in the nine months ended September 30, 2024 compared with the same period in 2023 was also due to an increase in headcount to support the growth of the customer base and the investment in the development of new technologies. |
| Depreciation and amortization | 2,616 | | | 3,030 | | | 8,012 | | | 8,424 | | | |
| Other expenses | 7,614 | | | 8,309 | | | 23,772 | | | 26,063 | | | Decrease was due to a decrease in consulting and professional services resulting from reduced outsourced work and an improvement in allowance for doubtful accounts period over period. Decrease was partially offset by an increase in technology services. |
| Intersegment expenses, net | 4,604 | | | 5,875 | | | 14,216 | | | 17,559 | | | Represents costs for certain corporate activities and services that are allocated to each operating segment based on estimated use of such activities and services. |
| Total operating expenses | 55,887 | | | 56,990 | | | 167,956 | | | 168,086 | | | |
| Income before income taxes | 26,813 | | | 22,123 | | | 100,046 | | | 77,803 | | | |
| Income tax expense | (6,450) | | | (5,307) | | | (24,035) | | | (18,700) | | | Represents income tax expense at an effective tax rate of 24%. |
| Net income | 20,363 | | | 16,816 | | | 76,011 | | | 59,103 | | | |
| Net loss (income) attributable to noncontrolling interests | 54 | | | (6) | | | 101 | | | 113 | | | |
| Net income | $ | 20,417 | | | 16,810 | | | 76,112 | | | 59,216 | | | |
Education technology services and payments revenue
The following table presents disaggregated revenue by service offering and before tax operating margin for each reporting period.
| | | | | | | | | | | | | | | | | | | | | | | | | | | | | |
| | Three months ended September 30, | | Nine months ended September 30, | | |
| | 2024 | | 2023 | | 2024 | | 2023 | | Additional information |
| Tuition payment plan services | $ | 31,659 | | 30,223 | | 104,702 | | 95,235 | | Increase was due to a higher number of payment plans in the K-12 and higher education markets for both new and existing customers. |
| Payment processing | 55,813 | | 50,848 | | 137,926 | | 126,716 | | Increase was due to increase in payment volumes for both the K-12 and higher education markets due to new customers and an increase in volume from existing customers. |
| Education technology services | 30,080 | | 31,793 | | 133,306 | | 132,796 | | Decrease in the three months ended September 30, 2024 compared with the same period in 2023 was due to a decrease in FACTS learning management services revenue as a result of the wind down of economic aid provided to private schools in response to the COVID 19 pandemic. Learning management instructional services revenue provided to private schools has been funded by the CARES Act and the Emergency Assistance to Non-Public Schools (EANS) programs. The EANS I program funding ended on September 30, 2023 and EANS II program funding ended on September 30, 2024. Future instructional services revenue will be adversely impacted compared to recent historical results as a result of the EANS programs ending. Revenue earned under the EANS programs was $2.4 million and $21.4 million for the three and nine month ended September 30, 2024 compared with $8.1 million and $40.3 million for the same periods in 2023, respectively. The decrease in FACTS learning management services revenue as a result of the decrease in EANS revenue was partially offset by an increase in non-EANS professional development and instructional services provided to both new and existing customers. Increase in the nine months ended September 30, 2024 compared with the same period in 2023 was due to an increase in revenue from the Company’s school information system software and application and enrollment services. This increase was partially offset by a decrease in FACTS learning management services revenue as described above. |
| Other | 627 | | 932 | | 2,693 | | 2,511 | | |
| Education technology services and payments revenue | 118,179 | | 113,796 | | 378,627 | | 357,258 | | |
| Cost of services | 45,273 | | 43,694 | | 134,106 | | 131,804 | | Represents direct costs to provide payment processing revenue and such costs decrease/increase in relationship to payment volumes. Costs to provide instructional services are also a component of this expense and decrease/increase in relationship to instructional services revenues. |
| Net revenue | $ | 72,906 | | 70,102 | | 244,521 | | 225,454 | | |
| GAAP before tax operating margin | 36.8 | % | | 31.6 | % | | 40.9 | % | | 34.5 | % | | Before tax operating margin, excluding net interest income, is a non-GAAP measure of before tax operating profitability as a percentage of revenue, and for the ETSP segment is calculated as income before income taxes less net interest income divided by net revenue. The Company uses this metric to monitor and assess the segment’s performance, manage operating costs, identify and evaluate business trends affecting the segment, and make strategic decisions, and believes that it facilitates an understanding of the operating performance of the segment and provides a meaningful comparison of the results of operations between periods. Before tax operating margin, excluding net interest income, increased due to increased net revenue while maintaining a consistent cost structure. |
| Net interest income | (13.4) | | | (12.7) | | | (9.5) | | | (9.0) | | |
| Non-GAAP before tax operating margin, excluding net interest income | 23.4 | % | | 18.9 | % | | 31.4 | % | | 25.5 | % | |
NELNET FINANCIAL SERVICES DIVISION - RESULTS OF OPERATIONS
Asset Generation and Management Operating Segment
Loan Portfolio
As of September 30, 2024, the AGM operating segment had a $9.5 billion loan portfolio, consisting primarily of federally insured loans. For a summary of the Company’s loan portfolio as of September 30, 2024 and December 31, 2023, see note 3 of the notes to consolidated financial statements included under Part I, Item 1 of this report.
Loan Activity
The following table sets forth the activity of loans in the AGM operating segment:
| | | | | | | | | | | | | | | | | | | | | | | |
| | Three months ended September 30, | | Nine months ended September 30, |
| | 2024 | | 2023 | | 2024 | | 2023 |
| Beginning balance | $ | 9,910,617 | | | 13,239,125 | | | 12,049,462 | | | 14,169,771 | |
| Loan acquisitions: | | | | | | | |
| Federally insured student loans | 104,914 | | | 2,880 | | | 104,914 | | | 518,471 | |
| Private education loans | — | | | 77,365 | | | — | | | 77,365 | |
| Consumer and other loans | 129,202 | | | 29,413 | | | 405,211 | | | 340,091 | |
| Total loan acquisitions | 234,116 | | | 109,658 | | | 510,125 | | | 935,927 | |
| Repayments, claims, capitalized interest, participations, and other, net | (386,204) | | | (322,013) | | | (1,112,682) | | | (1,175,320) | |
| Loans lost to external parties | (207,794) | | | (229,342) | | | (1,562,283) | | | (712,772) | |
| Loans sold | (1,146) | | | (61,807) | | | (335,033) | | | (481,985) | |
| | | | | | | |
| Ending balance | $ | 9,549,589 | | | 12,735,621 | | | 9,549,589 | | | 12,735,621 | |
The Company has partial ownership in certain consumer, private education, and federally insured student loan securitizations that are accounted for as held-to-maturity beneficial interest investments and included in "investments and notes receivable" in the Company's consolidated financial statements. As of the latest remittance reports filed by the various trusts prior to or as of September 30, 2024, the Company’s ownership correlates to approximately $1.99 billion of loans included in these securitizations. The loans held in these securitizations are not included in the above table. Investment interest income earned by the Company from the beneficial interest in loan securitizations is included in "investment interest" on the Company's consolidated statements of income and is not a component of the Company's loan interest income.
Since late 2021, the Company has experienced accelerated run-off of its FFELP portfolio due to FFELP borrowers consolidating their loans into Federal Direct Loan Program loans as a result of multiple extensions of the CARES Act payment pause on Department held loans and the initiatives offered by the Department for FFELP borrowers to consolidate their loans to qualify for loan forgiveness under the Public Service Loan Forgiveness and other programs. After multiple extensions of the student loans payment pause under the CARES Act, the payment and interest accrual suspension ended August 31, 2023, and Federal Direct Loan Program borrowers returned to repayment on September 1, 2023.
In August 2022, the Department announced a broad-based student debt relief plan that would have provided up to $20,000 in one-time debt relief to income-qualified recipients with Department held student loans. On June 30, 2023, the Supreme Court ruled that the Department was prohibited from implementing this plan. After the invalidation of this broad-based relief plan, the Department announced plans to enter into a negotiated rulemaking process to achieve debt relief for federal student loan borrowers using provisions of the Higher Education Act (HEA). The Department released proposed regulatory text prior to holding its statutorily-required negotiated rulemaking sessions. Notably, the Department proposed forgiveness for certain groups of borrowers with privately-held FFELP loans without consolidation into the Federal Direct Loan Program as a prerequisite requirement for such forgiveness. Publicly available negotiated rulemaking sessions occurred in the fourth quarter of 2023 and the first quarter of 2024, including a session to discuss broad forgiveness for borrowers “experiencing financial hardship” (financial hardship). The Department published draft regulations for public comment in April 2024, including regulations that would grant automatic discharge for all federal student loans, including privately-held FFELP loans, older than 20 or 25 years. Final publication and effective date for all pending forgiveness regulations pursuant to the HEA are expected in late 2024. The April 2024 draft publication did not include financial hardship regulations to provide forgiveness for borrowers (including borrowers with privately-held FFELP loans); however, the Biden-Harris Administration released the text of the financial hardship Notice of Proposed Rulemaking on October 25, 2024. The proposed rule is expected to be included in the Code of Federal Regulations in the coming weeks with a 30-day comment period. Publication of the final rule will likely
depend on the outcome of the November 2024 election. As of the date of this filing, the Biden-Harris Administration is preemptively prohibited from implementing any final rules born of the April 2024 draft publication due to an injunction ordered by the 8th Circuit Court of Appeals.
In addition, during 2023, the Department issued final regulations on the Saving on a Valuable Education (SAVE) income-driven repayment (IDR) plan. The SAVE plan makes significant changes to IDR to lower monthly payment amounts, subsidize interest, and accelerate time to forgiveness for some borrowers. FFELP borrowers can access the new income-driven repayment changes by consolidating their loans into the Federal Direct Loan Program. The benefits of the SAVE plan are not conferred exclusively on a go-forward basis, as has been the case with previous IDR rulemaking, meaning borrowers who consolidate into the Federal Direct Loan Program receive credit toward forgiveness for months in repayment prior to consolidation. The new income-driven repayment regulations were effective July 1, 2024; however, the Biden-Harris Administration announced implementation for some features starting July 30, 2023 and SAVE forgiveness starting February 2024. Two groups of states sued to block implementation of the SAVE program. As of the date of this filing, SAVE is not operational due to an injunction ordered by the 8th Circuit Court of Appeals. In response to the injunction, the Biden-Harris Administration placed approximately 8 million borrowers enrolled in the SAVE program into administrative forbearance. During the forbearance period, borrowers will not have to make student loan payments, and no interest will accrue, however, the months in forbearance will not count toward any forgiveness. The Biden-Harris Administration announced a six-month extension of the SAVE forbearance in late October 2024.
The proposed forgiveness regulations and implementation of the SAVE IDR plan regulations have increased, and may continue to increase, consolidation and prepayment activity as FFELP borrowers (i) consolidate their loans into the Federal Direct Loan Program in order to be eligible for potential debt relief for Department borrowers and the SAVE plan and (ii) begin receiving automatic forgiveness for loans older than 20 or 25 years. Prepayments could significantly increase if the federal government and/or the Department initiate servicing contract modifications that impede the standing of States to challenge administrative actions, additional loan forgiveness or cancellation, other repayment options or plans, or consolidation loan programs.
Allowance for Loan Losses, Loan Delinquencies, and Loan Charge-offs
For a summary of the allowance as a percentage of the ending balance and loan status and delinquency amounts for each of AGM's loan portfolios as of September 30, 2024 and December 31, 2023; and the activity in AGM's allowance for loan losses and net charge-offs as a percentage of average loans for the three and nine months ended September 30, 2024 and 2023, see note 3 of the notes to consolidated financial statements included under Part I, Item 1 of this report.
Loan Spread Analysis
The following table analyzes the loan spread on AGM’s portfolio of loans, which represents the spread between the yield earned on loan assets and the costs of the liabilities and derivative instruments used to fund the assets. The spread amounts included in the following table are calculated by using the notional dollar values found in the table under the caption "Net loan interest income, including settlements on derivatives" below, divided by the average balance of loans or debt outstanding.
| | | | | | | | | | | | | | | | | | | | | | | |
| | Three months ended September 30, | | Nine months ended September 30, |
| 2024 | | 2023 | | 2024 | | 2023 |
| Variable loan yield, gross | 8.16 | % | | 7.70 | % | | 8.10 | % | | 7.51 | % |
| Consolidation rebate fees | (0.80) | | | (0.80) | | | (0.80) | | | (0.80) | |
| | | | | | | |
| Premium and deferred origination costs amortization, net of discount accretion | (0.02) | | | 0.06 | | | 0.04 | | | 0.05 | |
| Variable loan yield, net | 7.34 | | | 6.96 | | | 7.34 | | | 6.76 | |
| Loan cost of funds - interest expense (a) | (6.44) | | | (6.14) | | | (6.48) | | | (5.86) | |
| Loan cost of funds - derivative settlements (b) (c) | 0.01 | | | 0.01 | | | 0.01 | | | 0.01 | |
| Variable loan spread | 0.91 | | | 0.83 | | | 0.87 | | | 0.91 | |
| Fixed rate floor income, gross | 0.01 | | | 0.01 | | | 0.01 | | | 0.02 | |
| Fixed rate floor income - derivative settlements (b) (d) | 0.05 | | | 0.01 | | | 0.04 | | | 0.23 | |
| Fixed rate floor income, net of settlements on derivatives | 0.06 | | | 0.02 | | | 0.05 | | | 0.25 | |
| Core loan spread | 0.97 | % | | 0.85 | % | | 0.92 | % | | 1.16 | % |
| | | | | | | |
| Average balance of AGM's loans | $ | 9,792,095 | | | 13,157,152 | | | 10,612,686 | | | 13,588,427 | |
| Average balance of AGM's debt outstanding | 9,296,236 | | | 12,527,771 | | | 10,280,527 | | | 12,964,890 | |
(a) The Company recognized $5.6 million and $25.9 million in non-cash interest expense during the third quarter of 2024 and the second quarter of 2023, respectively, as a result of writing off the remaining unamortized debt discount related to the redemption of certain asset-backed debt securities prior to their maturity. This non-cash expense was excluded from the respective periods in the table above.
(b) Derivative settlements represent the cash paid or received during the respective period to settle with derivative instrument counterparties the economic effect of the Company's derivative instruments based on their contractual terms. Derivative accounting requires that net settlements with respect to derivatives that do not qualify for "hedge treatment" under GAAP be recorded in a separate income statement line item below net interest income. The Company maintains an overall risk management strategy that incorporates the use of derivative instruments to reduce the economic effect of interest rate volatility. As such, management believes derivative settlements for each applicable period should be evaluated with the Company’s net interest income (loan spread) as presented in this table. The Company reports this non-GAAP information because the Company believes that it provides additional information regarding operational and performance indicators that are closely assessed by management. There is no comprehensive, authoritative guidance for the presentation of such non-GAAP information, which is only meant to supplement GAAP results by providing additional information that management utilizes to assess performance. See note 5 of the notes to consolidated financial statements included under Part I, Item 1 of this report for additional information on the Company's Non-Nelnet Bank derivative instruments, including the net settlement activity recognized by the Company for each type of derivative for the 2024 and 2023 periods presented in the table under the caption "Consolidated Financial Statement Impact Related to Derivatives - Statements of Income" in note 5 and in this table.
A reconciliation of core loan spread, which includes the impact of derivative settlements on loan spread, to loan spread without derivative settlements follows.
| | | | | | | | | | | | | | | | | | | | | | | |
| Three months ended September 30, | | Nine months ended September 30, |
| 2024 | | 2023 | | 2024 | | 2023 |
| Core loan spread | 0.97 | % | | 0.85 | % | | 0.92 | % | | 1.16 | % |
| Derivative settlements (1:3 basis swaps) | (0.01) | | | (0.01) | | | (0.01) | | | (0.01) | |
| Derivative settlements (fixed rate floor income) | (0.05) | | | (0.01) | | | (0.04) | | | (0.23) | |
| Loan spread | 0.91 | % | | 0.83 | % | | 0.87 | % | | 0.92 | % |
(c) Derivative settlements consist of net settlements received related to the Company’s 1:3 basis swaps.
(d) Derivative settlements consist of net settlements received related to the Company’s floor income interest rate swaps.
The relationship between the indices in which AGM earns interest on its loans and funds such loans has a significant impact on loan spread. See Item 3, “Quantitative and Qualitative Disclosures About Market Risk - Interest Rate Risk - AGM Operating Segment,” which provides additional detail on AGM’s FFELP student loan assets and related funding for those assets. In an increasing interest rate environment, student loan spread on FFELP loans increases in the short term because of the timing of interest rate resets on the Company's assets occurring daily in contrast to the timing of the interest rate resets on the Company's debt occurring either monthly or quarterly. This also results in student loan spread decreasing in the short term in a decreasing interest rate environment.
The difference between variable loan spread and core loan spread is fixed rate floor income earned on a portion of AGM's federally insured student loan portfolio. A summary of fixed rate floor income and its contribution to core loan spread follows:
| | | | | | | | | | | | | | | | | | | | | | | |
| | Three months ended September 30, | | Nine months ended September 30, |
| 2024 | | 2023 | | 2024 | | 2023 |
| Fixed rate floor income, gross | $ | 225 | | | 450 | | | 563 | | | 2,016 | |
| Derivative settlements (a) | 1,200 | | | 235 | | | 3,583 | | | 22,760 | |
| Fixed rate floor income, net | $ | 1,425 | | | 685 | | | 4,146 | | | 24,776 | |
| Fixed rate floor income contribution to spread, net | 0.06 | % | | 0.02 | % | | 0.05 | % | | 0.25 | % |
(a) Derivative settlements consist of net settlements received related to the Company's derivatives used to hedge student loans earning fixed rate floor income.
The decrease in gross fixed rate floor income for the three and nine months ended September 30, 2024 compared with the same periods in 2023 was due to higher interest rates in 2024 compared with 2023.
The Company had a significant portfolio of derivative instruments in which the Company paid a fixed rate and received a floating rate to economically hedge loans earning fixed rate floor income. On March 15, 2023, to minimize the Company's exposure to market volatility and increase liquidity, the Company terminated its derivative portfolio hedging loans earning fixed rate floor income ($2.8 billion in notional amount of derivatives). Through March 15, 2023, the Company had received cash or had a receivable from its clearinghouse related to variation margin equal to the fair value of the $2.8 billion notional amount of fixed rate floor derivatives as of March 15, 2023 of $183.2 million, which included $19.1 million related to 2023 settlements. Subsequent to terminating these derivatives, during the second and fourth quarters of 2023, the Company entered into a total of
$400.0 million notional amount of derivatives to hedge loans earning fixed rate floor income and other loans and investments in which the Company receives a fixed rate.
The increase in net derivative settlements received by the Company in the three months ended September 30, 2024, compared with the same period in 2023, was due to an increase in the notional amount of derivatives outstanding. The decrease in net derivative settlements received by the Company during the nine months ended September 30, 2024, compared with the same period in 2023, was due to a decrease in the notional amount of derivatives outstanding and less favorable terms on the $400.0 million of notional derivatives entered into in 2023 compared with the $2.8 billion notional derivatives that were terminated due to an increase in interest rates from when the terminated derivatives were initially executed.
Summary and Comparison of Operating Results
| | | | | | | | | | | | | | | | | | | | | | | | | | | | | |
| Three months ended September 30, | | Nine months ended September 30, | | |
| | 2024 | | 2023 | | 2024 | | 2023 | | Additional information |
| Interest income: | | | | | | | | | |
| Loan interest | $ | 180,571 | | | 230,816 | | | 583,907 | | | 689,633 | | | See table below for additional analysis. |
| Investment interest | 18,970 | | | 18,062 | | | 54,513 | | | 47,726 | | | Increase in the three and nine months ended September 30, 2024 compared with the same periods in 2023 was due to an increase of interest earned on restricted cash due to higher balances and interest rates. Increase in the nine months ended September 30, 2024 compared with the same period in 2023 was also due to an increase of interest earned on the Company's beneficial interest investments. |
| Total interest income | 199,541 | | | 248,878 | | | 638,420 | | | 737,359 | | | |
| Loan interest expense | 156,050 | | | 194,098 | | | 504,509 | | | 594,764 | | | See table below for additional analysis. |
| Intercompany interest expense | 5,092 | | | 3,295 | | | 19,169 | | | 24,141 | | | Represents interest paid by AGM to Nelnet, Inc. (parent company) related to (i) internal borrowings to fund equity advances on certain AGM debt facilities; and (ii) AGM issued bonds held by Nelnet, Inc. Increase in the three months ended September 30, 2024 compared with the same period in 2023 was due to an increase in interest rates and an increase in the weighted average balance of outstanding AGM issued bonds held by Nelnet, Inc. Decrease for the nine months ended September 30, 2024 compared with the same period in 2023 was due to a decrease in the weighted average balance of outstanding AGM issued bonds held by Nelnet, Inc., partially offset by an increase in interest rates. Intercompany interest is eliminated for consolidated financial reporting purposes. |
| Net interest income | 38,399 | | | 51,485 | | | 114,742 | | | 118,454 | | | |
| Less provision (negative provision) for loan losses | 11,968 | | | 2,348 | | | 14,199 | | | (772) | | | See note 3 of the notes to consolidated financial statements included under Part I, Item 1 of this report for factors impacting provision (negative provision) for loan losses for the periods presented. |
| Net interest income after provision for loan losses | 26,431 | | | 49,137 | | | 100,543 | | | 119,226 | | | |
| Other income, net | 4,918 | | | 2,776 | | | 11,239 | | | 6,939 | | | Represents primarily borrower late fees, income from providing administration activities for third parties, sponsor fee income, and income/losses from AGM's investment in joint ventures. See "Overview - Consolidated Results of Operations" for further detail included in other income. |
| Loss on sale of loans | (107) | | | (1,022) | | | (1,685) | | | (16,776) | | | The Company recognized losses from selling portfolios of loans. See note 3 of the notes to consolidated financial statements included under Part I, Item 1 of this report for additional information. |
| Provision for beneficial interests | (28,952) | | | — | | | (34,863) | | | — | | | During the second and third quarters of 2024, the Company recorded an allowance for credit losses (and related provision expense) related to the Company's beneficial interest in certain loan securitizations. See note 6 of the notes to consolidated financial statements included under Part I, Item 1 of this report for additional information. |
| Derivative settlements, net | 1,359 | | | 621 | | | 4,356 | | | 23,940 | | | The Company maintains an overall risk management strategy that incorporates the use of derivative instruments to reduce the economic effect of interest rate volatility. Derivative settlements for each applicable period should be evaluated with the Company's net interest income as reflected in the table below. The majority of derivative settlements received in the periods presented was from the Company's derivative portfolio used to hedge loans earning fixed rate floor income. The decrease in net derivative settlements received by the Company for the nine months ended September 30, 2024 compared with the same period in 2023 was due to the termination of the floor income interest rate swaps ($2.8 billion notional amount) in March 2023. See above under "Loan Spread Analysis" for further information. |
| | | | | | | | | | | | | | | | | | | | | | | | | | | | | |
| Derivative market value adjustments, net | (9,518) | | | 1,192 | | | (2,875) | | | (35,323) | | | Includes the realized and unrealized gains and losses that are caused by changes in fair values of derivatives which do not qualify for "hedge treatment" under GAAP. The majority of the derivative market value adjustments during the periods presented related to the changes in fair value of the Company's floor income interest rate swaps. Such changes reflect that a decrease in the forward yield curve during a reporting period results in a decrease in the fair value of the Company's floor income interest rate swaps, and an increase in the forward yield curve during a reporting period results in an increase in the fair value of such swaps. To minimize the Company's exposure to market volatility and increase liquidity, AGM terminated its portfolio of floor income interest rate swaps ($2.8 billion notional amount) in March 2023. As such, the Company expects the derivative market value adjustments in future periods will be less substantial. See above under "Loan Spread Analysis" for further information. |
| Total other income, net | (32,300) | | | 3,567 | | | (23,828) | | | (21,220) | | | |
| | | | | | | | | |
| Salaries and benefits | 1,220 | | | 1,242 | | | 3,529 | | | 3,093 | | | Increase in the nine months ended September 30, 2024 compared with the same period in 2023 was due to additional headcount as the Company actively expands into new asset loan classes. |
| Other expenses | 2,775 | | | 2,952 | | | 9,985 | | | 12,083 | | | Represents primarily servicing fees paid to third parties. Decrease in servicing fees was due to the amortization of the FFELP student loan portfolio. |
| Intersegment expenses | 6,482 | | | 7,948 | | | 21,491 | | | 24,789 | | | Represents fees paid to LSS for the servicing of the majority of AGM’s loans. These amounts exceed the actual cost of servicing the loans. Intersegment expenses also includes costs for certain corporate activities and services that are allocated to each operating segment based on estimated use of such activities and services. Decrease was due to a decrease in servicing fees due to the amortization of the FFELP student loan portfolio serviced by LSS. |
| | | | | | | | | |
| Total operating expenses | 10,477 | | | 12,142 | | | 35,005 | | | 39,965 | | | |
| (Loss) income before income taxes | (16,346) | | | 40,562 | | | 41,710 | | | 58,041 | | | |
| Income tax benefit (expense) | 3,923 | | | (9,735) | | | (10,010) | | | (13,930) | | | Represents income tax expense at an effective tax rate of 24%. |
| Net (loss) income | $ | (12,423) | | | 30,827 | | | 31,700 | | | 44,111 | | | |
| Additional information: | | | | | | | | | |
| GAAP net (loss) income | $ | (12,423) | | | 30,827 | | | 31,700 | | | 44,111 | | | See "Overview - GAAP Net Income and Non-GAAP Net Income, Excluding Adjustments" above for additional information about non-GAAP financial information. |
| Derivative market value adjustments, net | 9,518 | | | (1,192) | | | 2,875 | | | 35,323 | | | |
| Tax effect | (2,284) | | | 286 | | | (690) | | | (8,478) | | | |
| Non-GAAP net (loss) income, excluding derivative market value adjustments | $ | (5,189) | | | 29,921 | | | 33,885 | | | 70,956 | | | |
| | | | | | | | | |
Net loan interest income, including settlements on derivatives
The following table summarizes the components of "loan interest," "loan interest expense" and "derivative settlements, net."
| | | | | | | | | | | | | | | | | | | | | | | | | | | | | |
| | Three months ended September 30, | | Nine months ended September 30, | | |
| | 2024 | | 2023 | | 2024 | | 2023 | | Additional information |
| Variable interest income, gross | $ | 200,528 | | | 254,569 | | | 643,714 | | | 763,933 | | | Decrease was due to a decrease in the average balance of loans partially offset by an increase in the gross yield earned on loans. |
| Consolidation rebate fees | (19,687) | | | (26,143) | | | (63,870) | | | (81,753) | | | Decrease was due to a decrease in the average consolidation loan balance. |
| | | | | | | | | |
| Premium and deferred origination costs amortization, net of discount accretion | (495) | | | 1,940 | | | 3,500 | | | 5,437 | | | Net premium amortization in the three months ended September 30, 2024 was due to consumer loans purchased at a premium during the third quarter of 2024. Net discount accretion for the other periods presented was due to the Company's purchases of loans at a net discount over the last several years. |
| Variable interest income, net | 180,346 | | | 230,366 | | | 583,344 | | | 687,617 | | | |
| Interest on bonds and notes payable | (156,050) | | | (194,098) | | | (504,509) | | | (594,764) | | | Decrease was due to a decrease in the average balance of debt outstanding, partially offset by an increase in cost of funds. In addition, the Company recognized a $5.6 million and $25.9 million non-cash expense during the third quarter of 2024 and second quarter of 2023, respectively, as the result of writing off the remaining unamortized debt discount related to the redemption of certain asset-backed debt securities prior to their maturity. |
| Derivative settlements, net (a) | 159 | | | 386 | | | 773 | | | 1,180 | | | Represents net derivative settlements received related to the Company’s 1:3 basis swaps. |
| Variable loan interest margin, net of settlements on derivatives | 24,455 | | | 36,654 | | | 79,608 | | | 94,033 | | | |
| Fixed rate floor income, gross | 225 | | | 450 | | | 563 | | | 2,016 | | | Decrease was due to higher interest rates. |
| Derivative settlements, net (a) | 1,200 | | | 235 | | | 3,583 | | | 22,760 | | | Represents net derivative settlements received related to the Company's floor income interest rate swaps. |
| Fixed rate floor income, net of settlements on derivatives | 1,425 | | | 685 | | | 4,146 | | | 24,776 | | | |
| Net loan interest income, including derivative settlements (core loan interest income) (a) | $ | 25,880 | | | 37,339 | | | 83,754 | | | 118,809 | | | |
| | | | | | | | | |
| | | | | | | | | |
| | | | | | | | | |
| | | | | | | | | |
| | | | | | | | |
| | | | | | | | |
| | | | | | | | | |
(a) Net loan interest income, including derivative settlements (core loan interest income) is a non-GAAP financial measure. For an explanation of GAAP accounting for derivative settlements and the reasons why the Company reports these non-GAAP measures (and the limitations thereof), see footnote (b) to the table immediately under the caption “Loan Spread Analysis” above. See note 5 of the notes to consolidated financial statements included under Part I, Item 1 of this report for additional information on the Company's derivative instruments, including the net settlement activity recognized by the Company for each type of derivative referred to in the "Additional information" column of this table, for the 2024 and 2023 periods presented in the table under the caption "Consolidated Financial Statement Impact Related to Derivatives - Statements of Income" in note 5 and in this table.
Nelnet Bank Operating Segment
Loan Portfolio
As of September 30, 2024, Nelnet Bank had a $559.9 million loan portfolio, consisting of $352.7 million of private education loans and $207.2 million of consumer and other loans. For a summary of the Company’s loan portfolio as of September 30, 2024 and December 31, 2023, see note 3 of the notes to consolidated financial statements included under Part I, Item 1 of this report.
Loan Activity
The following table sets forth the activity of loans in the Nelnet Bank operating segment:
| | | | | | | | | | | | | | | | | | | | | | | |
| | Three months ended September 30, | | Nine months ended September 30, |
| 2024 | | 2023 | | 2024 | | 2023 |
| Beginning balance | $ | 542,351 | | | 444,488 | | | 432,872 | | | 419,795 | |
| Loan acquisitions and originations: | | | | | | | |
| | | | | | | |
| | | | | | | |
| Private education loans | 10,843 | | | 19,756 | | | 28,948 | | | 41,341 | |
| Consumer and other loans | 36,409 | | | 22,966 | | | 176,257 | | | 55,766 | |
| Total loan acquisitions and originations | 47,252 | | | 42,722 | | | 205,205 | | | 97,107 | |
| Repayments | (29,731) | | | (18,382) | | | (78,205) | | | (47,957) | |
| | | | | | | |
| Loans sold to AGM | — | | | (15) | | | — | | | (132) | |
| | | | | | | |
| Ending balance | $ | 559,872 | | | 468,813 | | | 559,872 | | | 468,813 | |
Subsequent to the end of the third quarter, on October 4, 2024, Nelnet Bank purchased a residual trust that included $133 million of private education loans, $7 million in cash and other assets, and $54 million of debt that finances the assets. Nelnet Bank used deposits to fund the approximately $74 million acquisition price. The trust will be consolidated as part of the bank's financial statements.
Allowance for Loan Losses, Loan Delinquencies, and Loan Charge-offs
For a summary of the allowance as a percentage of the ending balance and loan status, delinquency amounts, and other key credit quality indicators for each of Nelnet Bank's loan portfolios as of September 30, 2024 and December 31, 2023; and the activity in Nelnet Bank's allowance for loan losses and net charge-offs as a percentage of average loans for the three and nine months ended September 30, 2024 and 2023, see note 3 of the notes to consolidated financial statements included under Part I, Item 1 of this report.
Deposits
As of September 30, 2024, Nelnet Bank had $1.15 billion of deposits. All of Nelnet Bank’s deposits are interest-bearing and primarily consist of brokered certificates of deposit (CDs), retail and other savings deposits and CDs, and intercompany deposits. Retail and other savings deposits and CDs include deposits from Educational 529 College Savings and Health Savings plans, Short Term Federal Investment Trust (STFIT), commercial and consumer savings, and commercial, institutional, and consumer CDs. Union Bank, a related party, is the program manager for the Educational 529 College Savings plans and trustee for the STFIT.
As of September 30, 2024, Nelnet Bank’s deposits included $77.7 million from Nelnet, Inc. (parent company) and its subsidiaries (intercompany), and thus have been eliminated for consolidated financial reporting purposes. The intercompany deposits include a pledged deposit of $40.0 million from Nelnet, Inc. as required under the Capital and Liquidity Maintenance Agreement with the FDIC, deposits required for intercompany transactions, operating deposits, and NBS custodial deposits consisting of tuition payments collected which are subsequently remitted to the appropriate school.
Average Balance Sheet
The following table reflects the rates earned on interest-earning assets and paid on interest-bearing liabilities.
| | | | | | | | | | | | | | | | | | | | | | | | | | | | | | | | | | | | | | | | | | | | | | | |
| Three months ended September 30, (a) | | Nine months ended September 30, (a) |
| 2024 | | 2023 | | 2024 | | 2023 |
| Balance | | Rate | | Balance | | Rate | | Balance | | Rate | | Balance | | Rate |
| Average assets | | | | | | | | | | | | | | | |
| Federally insured student loans | $ | — | | | — | % | | $ | 60,505 | | | 6.58 | % | | $ | — | | | — | % | | $ | 62,531 | | | 6.29 | % |
| Private education loans | 351,468 | | | 4.37 | | | 353,749 | | | 3.85 | | | 359,242 | | | 4.33 | | | 354,513 | | | 3.74 | |
| Consumer and other loans | 198,337 | | | 11.58 | | | 36,031 | | | 12.91 | | | 149,414 | | | 12.07 | | | 23,064 | | | 12.92 | |
| Cash and investments | 650,951 | | | 7.65 | | | 585,877 | | | 6.48 | | | 618,130 | | | 7.20 | | | 556,754 | | | 6.25 | |
| Total interest-earning assets | 1,200,756 | | | 7.34 | % | | 1,036,162 | | | 5.81 | % | | 1,126,786 | | | 6.93 | % | | 996,862 | | | 5.51 | % |
| Non-interest-earning assets | 16,379 | | | | | 10,511 | | | | | 15,667 | | | | | 8,695 | | | |
| Total assets | $ | 1,217,135 | | | | | $ | 1,046,673 | | | | | $ | 1,142,453 | | | | | $ | 1,005,557 | | | |
| Average liabilities and equity | | | | | | | | | | | | | | | |
| Brokered deposits | $ | 247,726 | | | 1.95 | % | | $ | 204,050 | | | 1.38 | % | | $ | 229,698 | | | 1.74 | % | | $ | 204,535 | | | 1.38 | % |
| Intercompany deposits | 168,639 | | | 4.71 | | | 184,829 | | | 4.92 | | | 158,628 | | | 4.80 | | | 173,929 | | | 4.78 | |
| Retail and other deposits | 644,051 | | | 5.01 | | | 521,357 | | | 4.76 | | | 603,292 | | | 4.98 | | | 493,952 | | | 4.39 | |
| | | | | | | | | | | | | | | |
| Total interest-bearing liabilities | 1,060,416 | | | 4.25 | % | | 910,236 | | | 4.04 | % | | 991,618 | | | 4.20 | % | | 872,416 | | | 3.76 | % |
| Non-interest-bearing liabilities | 8,507 | | | | | 5,363 | | | | | 7,786 | | | | | 5,277 | | | |
| Equity | 148,212 | | | | | 131,074 | | | | | 143,049 | | | | | 127,864 | | | |
| Total liabilities and equity | $ | 1,217,135 | | | | | $ | 1,046,673 | | | | | $ | 1,142,453 | | | | | $ | 1,005,557 | | | |
| | | | | | | | | | | | | | | |
(a) Calculated using average daily balances.
Summary and Comparison of Operating Results
| | | | | | | | | | | | | | | | | | | | | | | | | | | | | |
| | Three months ended September 30, | | Nine months ended September 30, | | |
| | 2024 | | 2023 | | 2024 | | 2023 | | Additional information |
| Interest income: | | | | | | | | | |
| Loan interest | $ | 9,639 | | | 5,608 | | | 25,157 | | | 15,079 | | | Represents interest earned on loans. Increase was due to an increase in the balance of loans and interest rates. |
| Investment interest | 12,522 | | | 9,563 | | | 33,301 | | | 26,013 | | | Represents interest earned on cash and investments. Increase was due to an increase of these balances and interest rates. |
| Total interest income | 22,161 | | | 15,171 | | | 58,458 | | | 41,092 | | | |
| Interest expense | 11,606 | | | 9,456 | | | 31,872 | | | 24,841 | | | Represents interest expense on deposits. Increase was due to an increase of deposits and interest rates. |
| Net interest income | 10,555 | | | 5,715 | | | 26,586 | | | 16,251 | | | |
| Provision for loan losses | 6,143 | | | 1,927 | | | 18,352 | | | 5,837 | | | Increase in provision for loan losses was due to the mix of loans and an increase in the notional amount of loans acquired and originated in 2024 compared with 2023. See note 3 of the notes to consolidated financial statements included under Part I, Item 1 of this report for additional information. |
| Net interest income after provision for loan losses | 4,412 | | | 3,788 | | | 8,234 | | | 10,414 | | | |
| Other income, net | 841 | | | 565 | | | 1,991 | | | 1,395 | | | Represents primarily net gains and income from investments. |
| | | | | | | | | |
| Derivative settlements, net | 281 | | | 196 | | | 690 | | | 279 | | | Nelnet Bank's use of derivatives is to hedge its exposure related to variable rate intercompany deposits to minimize volatility from future changes in interest rates. Nelnet Bank has designated its derivative instruments as cash flow hedges; however, because the hedged items are intercompany deposits, the derivative instruments are not eligible for hedge accounting in the consolidated financial statements. Accordingly, all changes in fair value of such derivatives are recorded through earnings and presented as "derivative market value adjustments, net" in the statements of operations. "Derivative settlements" represent the cash paid or received during the respective period to settle with derivative instrument counterparties the economic effect of the Company's derivative instruments based on their contractual terms. For additional information on Nelnet Bank's derivative portfolio, see note 5 of the notes to consolidated financial statements included under Part I, Item 1 of this report. |
| Derivative market value adjustments, net | (3,647) | | | 1,948 | | | (793) | | | 3,057 | | |
| Total other income, net | (2,525) | | | 2,709 | | | 1,888 | | | 4,731 | | | |
| Salaries and benefits | 2,973 | | | 2,520 | | | 8,491 | | | 6,881 | | | Represents salaries and benefits of Nelnet Bank associates and third-party contract labor. Increase was due to the overall growth of Nelnet Bank activities. |
| Depreciation | 343 | | | 259 | | | 944 | | | 315 | | | |
| Other expenses | 2,570 | | | 1,290 | | | 5,765 | | | 3,696 | | | Represents various expenses such as consulting and professional fees, Nelnet Bank director fees, occupancy, certain technology-related costs, insurance, and marketing. Increase was due to the overall growth of Nelnet Bank activities. |
| Intersegment expenses | 759 | | | 129 | | | 2,252 | | | 302 | | | Represents fees paid to LSS for servicing certain of Nelnet Bank's loans. Intersegment expenses also include costs for certain corporate activities and services that are allocated to each operating segment based on estimated use of such activities and services. The majority of shared service costs incurred by the Company to support Nelnet Bank were not allocated to Nelnet Bank through the bank’s de novo period which ended at the end of 2023. The shared service and support costs incurred by the Company related to Nelnet Bank and not allocated to Nelnet Bank were $1.6 million and $5.1 million for the three and nine months ended September 30, 2023, respectively. |
| Total operating expenses | 6,645 | | | 4,198 | | | 17,452 | | | 11,194 | | | |
| (Loss) income before income taxes | (4,758) | | | 2,299 | | | (7,330) | | | 3,951 | | | |
| Income tax benefit (expense) | 1,143 | | | (552) | | | 1,800 | | | (913) | | | Represents income tax expense at an effective tax rate of 24.0% for the three months ended September 30, 2024 and 2023, respectively, and 24.6% and 23.1% for the nine months ended September 30, 2024 and 2023, respectively. |
| Net (loss) income | $ | (3,615) | | | 1,747 | | | (5,530) | | | 3,038 | | | |
| Additional information: | | | | | | | | | |
| Net (loss) income | $ | (3,615) | | | 1,747 | | | (5,530) | | | 3,038 | | |
See "Overview - GAAP Net Income and Non-GAAP Net Income, Excluding Adjustments" above for additional details about non-GAAP financial information. |
| Derivative market value adjustments, net | 3,647 | | | (1,948) | | | 793 | | | (3,057) | | |
| Tax effect | (875) | | | 468 | | | (190) | | | 734 | | |
| Net (loss) income, excluding derivative market value adjustments | $ | (843) | | | 267 | | | (4,927) | | | 715 | | |
NFS Other Operating Segments
The following table summarizes the operating results of other operating segments included in NFS that are not reportable. Income taxes are allocated based on 24% of income (loss) before taxes for each activity.
Summary and Comparison of Operating Results
| | | | | | | | | | | | | | | | | | | | | | | | | | | | | |
| WRCM (a) | | Nelnet Insurance Services (b) | | Real estate investments (c) | | Investment securities (d) | | Total |
| Three months ended September 30, 2024 |
| Investment interest | $ | 4 | | | 1,354 | | | 95 | | | 10,962 | | | 12,415 | |
| Interest expense | — | | | (463) | | | — | | | (1,782) | | | (2,245) | |
| Net interest income | 4 | | | 891 | | | 95 | | | 9,180 | | | 10,170 | |
| Other income, net | 1,399 | | | 18,046 | | | 2,116 | | | 809 | | | 22,370 | |
| | | | | | | | | |
| Salaries and benefits | (54) | | | (138) | | | (206) | | | — | | | (398) | |
| | | | | | | | | |
| Other expenses | (69) | | | (17,803) | | | (31) | | | (1) | | | (17,904) | |
| Intersegment expenses, net | (4) | | | (52) | | | (109) | | | (35) | | | (200) | |
| Income (loss) before income taxes | 1,276 | | | 944 | | | 1,865 | | | 9,953 | | | 14,038 | |
| Income tax (expense) benefit | (276) | | | (227) | | | (450) | | | (2,388) | | | (3,341) | |
| Net loss (income) attributable to noncontrolling interests | (128) | | | — | | | 11 | | | — | | | (117) | |
| Net income (loss) | $ | 872 | | | 717 | | | 1,426 | | | 7,565 | | | 10,580 | |
| Three months ended September 30, 2023 |
| Investment interest | $ | 3 | | | 411 | | | 141 | | | 12,466 | | | 13,021 | |
| Interest expense | — | | — | | | — | | | (5,661) | | | (5,661) | |
| Net interest income | 3 | | | 411 | | | 141 | | | 6,805 | | | 7,360 | |
| Other income, net | 1,639 | | | 7,277 | | | 75 | | | 870 | | | 9,861 | |
| | | | | | | | | |
| Salaries and benefits | (54) | | | (89) | | | (145) | | | — | | | (288) | |
| | | | | | | | | |
| Other expenses | (83) | | | (7,441) | | | 4 | | | (2) | | | (7,522) | |
| Intersegment expenses, net | (3) | | | (82) | | | (106) | | | — | | | (191) | |
| Income (loss) before income taxes | 1,502 | | | 76 | | | (31) | | | 7,673 | | | 9,220 | |
| Income tax (expense) benefit | (325) | | | (18) | | | 7 | | | (1,841) | | | (2,177) | |
| Net loss (income) attributable to noncontrolling interests | (150) | | | — | | | 1 | | | — | | | (149) | |
| Net income (loss) | $ | 1,027 | | | 58 | | | (23) | | | 5,832 | | | 6,894 | |
| | | | | | | | | | | | | | | | | | | | | | | | | | | | | |
| | | | | | | | | |
| Nine months ended September 30, 2024 |
| Investment interest | $ | 11 | | | 3,693 | | | 380 | | | 39,826 | | | 43,910 | |
| Interest expense | — | | | (1,052) | | | — | | | (6,216) | | | (7,268) | |
| Net interest income | 11 | | | 2,641 | | | 380 | | | 33,610 | | | 36,642 | |
| Other income, net | 4,408 | | | 47,023 | | | (1,510) | | | 1,092 | | | 51,013 | |
| | | | | | | | | |
| Salaries and benefits | (161) | | | (375) | | | (593) | | | — | | | (1,129) | |
| | | | | | | | | |
| Other expenses | (214) | | | (41,166) | | | (152) | | | (4) | | | (41,536) | |
| Intersegment expenses, net | (11) | | | (198) | | | (348) | | | (108) | | | (665) | |
| Income (loss) before income taxes | 4,033 | | | 7,925 | | | (2,223) | | | 34,590 | | | 44,325 | |
| Income tax (expense) benefit | (871) | | | (1,902) | | | 525 | | | (8,302) | | | (10,550) | |
| Net loss (income) attributable to noncontrolling interests | (403) | | | — | | | 37 | | | — | | | (366) | |
| Net income (loss) | $ | 2,759 | | | 6,023 | | | (1,661) | | | 26,288 | | | 33,409 | |
| Nine months ended September 30, 2023 |
| Investment interest | $ | 8 | | | 1,101 | | | 423 | | | 52,949 | | | 54,481 | |
| Interest expense | — | | | — | | | — | | | (24,860) | | | (24,860) | |
| Net interest income | 8 | | | 1,101 | | | 423 | | | 28,089 | | | 29,621 | |
| Other income, net | 4,880 | | | 12,589 | | | 502 | | | (2,884) | | | 15,087 | |
| | | | | | | | | |
| Salaries and benefits | (162) | | | (274) | | | (281) | | | — | | | (717) | |
| | | | | | | | | |
| Other expenses | (246) | | | (11,929) | | | (43) | | | (5) | | | (12,223) | |
| Intersegment expenses, net | (9) | | | (144) | | | (294) | | | — | | | (447) | |
| Income (loss) before income taxes | 4,471 | | | 1,343 | | | 307 | | | 25,200 | | | 31,321 | |
| Income tax (expense) benefit | (966) | | | (323) | | | (81) | | | (6,047) | | | (7,417) | |
| Net loss (income) attributable to noncontrolling interests | (447) | | | — | | | 29 | | | — | | | (418) | |
| Net income (loss) | $ | 3,058 | | | 1,020 | | | 255 | | | 19,153 | | | 23,486 | |
(a) The Company provides investment advisory services through Whitetail Rock Capital Management, LLC (WRCM), the Company's SEC-registered investment advisor subsidiary, under various arrangements. WRCM earned management and performance fees of $1.4 million and $1.6 million for the three months ended September 30, 2024 and 2023, respectively, and $4.4 million and $4.9 million for the nine months ended September 30, 2024 and 2023, respectively. Fees earned by WRCM are included in "other income, net" in the table above.
(b) Represents the operating results of the Company’s reinsurance treaties on property and casualty policies and the Company’s Nebraska chartered life and health company, which is in run-off mode and reinsures a decreasing term life insurance product distributed to FACTS. The following table presents net premiums, which are included in "other income, net" in the table above, and net loss reserve, commissions, and broker fees, which are included in "other expenses" in the table above:
| | | | | | | | | | | | | | | | | | | | | | | |
| Three months ended | | Nine months ended |
| September 30, | | September 30, |
| 2024 | | 2023 | | 2024 | | 2023 |
| Reinsurance assumed | $ | 33,585 | | | 12,965 | | | 88,978 | | | 21,994 | |
| Reinsurance ceded | (16,966) | | | (6,678) | | | (44,728) | | | (11,356) | |
| Net premiums | $ | 16,619 | | | 6,287 | | | 44,250 | | | 10,638 | |
| Reinsurance assumed | $ | 33,195 | | | 12,349 | | | 77,712 | | | 19,876 | |
| Reinsurance ceded | (16,433) | | | (6,335) | | | (38,646) | | | (10,179) | |
| Net loss reserve, commissions, and broker fees | $ | 16,762 | | | 6,014 | | | 39,066 | | | 9,697 | |
(c) Represents the operating results of the Company’s real estate investments and the administrative costs to manage this portfolio. The Company recognized net gains from its real estate investments of $2.1 million and $0.1 million for the three months ended September 30, 2024 and 2023, respectively, and net losses of $1.5 million for the nine months ended September 30, 2024 compared with a gain of $0.5 million for the same period in 2023, which are included in "other income, net" in the table above. The net results recognized relates primarily to the Company's proportionate share of certain real estate investments accounted for under the equity method. The net gain for the third quarter of 2024 also includes a $2.8 million gain from the sale of a real estate investment.
(d) Represents interest income earned on investment debt securities (primarily student loan and other asset-backed securities, including Nelnet-owned asset-backed securities which it has repurchased and are eliminated in consolidation), unrealized gains/losses on marketable equity securities, realized gains/losses on marketable equity securities and investment debt securities, and other costs to manage these investments. Also includes interest expense incurred on debt used to finance such investments. The decrease in interest income and interest expense in 2024 compared with 2023 was due to a decrease in the average balance of investments and debt outstanding, respectively. See Item 3, "Quantitative and Qualitative Disclosures About Market Risk - Interest Rate and Market Risk - Investments," which provides additional detail on the Company's investment portfolio and debt used to finance such investments.
CORPORATE AND OTHER ACTIVITIES – RESULTS OF OPERATIONS
Other business activities and operating segments that are not reportable and not part of the NFS division are combined and included in Corporate and Other Activities (“Corporate”). The following table summarizes the operating results of these activities.
Income taxes are allocated based on 24% of income (loss) before taxes for each activity. The difference between the Corporate income tax expense and the sum of taxes calculated for each activity is included in income taxes in “other” in the table below.
Summary and Comparison of Operating Results
| | | | | | | | | | | | | | | | | | | | | | | | | | | | | | | | | | | | | | | | | |
| | | Nelnet Renewable Energy (b) | | | | | | | | |
| Shared services (a) | | Tax equity investments / syndication / administration | | GRNE Solar | | ALLO investment (c) | | Venture capital investments (d) | | Other | | Total |
| Three months ended September 30, 2024 |
| Investment interest | $ | — | | | 1 | | | 1 | | | — | | | — | | | 3,103 | | | 3,105 | |
| Interest expense | — | | | — | | | (103) | | | — | | | — | | | (601) | | | (704) | |
| Net interest income (expense) | — | | | 1 | | | (102) | | | — | | | — | | | 2,502 | | | 2,401 | |
| Solar construction revenue | — | | | — | | | 19,321 | | | — | | | — | | | — | | | 19,321 | |
| Other income, net | 714 | | | (7,640) | | | 43 | | | 4,503 | | | 2,478 | | | 3,408 | | | 3,506 | |
| Impairment expense | — | | | — | | | — | | | — | | | (100) | | | — | | | (100) | |
| Cost to provide solar construction services | — | | | — | | | (26,815) | | | — | | | — | | | — | | | (26,815) | |
| Salaries and benefits | (19,411) | | | (621) | | | (1,375) | | | — | | | (187) | | | (2,258) | | | (23,852) | |
| Depreciation and amortization | (5,463) | | | — | | | (284) | | | — | | | (8) | | | (93) | | | (5,848) | |
| Other expenses | (11,761) | | | (205) | | | (535) | | | 2,104 | | | (26) | | | (693) | | | (11,116) | |
| Intersegment expenses, net | 25,634 | | | (44) | | | (378) | | | (1) | | | (21) | | | (110) | | | 25,080 | |
| (Loss) income before income taxes | (10,287) | | | (8,509) | | | (10,125) | | | 6,606 | | | 2,136 | | | 2,756 | | | (17,423) | |
| Income tax benefit (expense) | 2,469 | | | 988 | | | 2,430 | | | (1,585) | | | (513) | | | 126 | | | 3,915 | |
| Net loss attributable to noncontrolling interests | — | | | 4,392 | | | — | | | — | | | — | | | — | | | 4,392 | |
| Net (loss) income | $ | (7,818) | | | (3,129) | | | (7,695) | | | 5,021 | | | 1,623 | | | 2,882 | | | (9,116) | |
| | | | | | | | | | | | | |
| Three months ended September 30, 2023 |
| Investment interest | $ | — | | | — | | | 36 | | | — | | | — | | | 3,196 | | | 3,232 | |
| Interest expense | — | | | — | | | (108) | | | — | | | — | | | (324) | | | (432) | |
| Net interest income (expense) | — | | | — | | | (72) | | | — | | | — | | | 2,872 | | | 2,800 | |
| Solar construction revenue | — | | | — | | | 6,301 | | | — | | | — | | | — | | | 6,301 | |
| Other income, net | 728 | | | (5,153) | | | 48 | | | (14,908) | | | (629) | | | 2,964 | | | (16,950) | |
| Impairment expense | (4,678) | | | — | | | — | | | — | | | — | | | — | | | (4,678) | |
| Cost to provide solar construction services | — | | | — | | | (7,783) | | | — | | | — | | | — | | | (7,783) | |
| Salaries and benefits | (21,537) | | | (686) | | | (971) | | | — | | | (237) | | | (1,300) | | | (24,731) | |
| Depreciation and amortization | (9,917) | | | — | | | (3,501) | | | — | | | — | | | (104) | | | (13,522) | |
| Other expenses | (12,110) | | | (276) | | | (892) | | | (651) | | | (16) | | | (1,725) | | | (15,670) | |
| Intersegment expenses, net | 26,599 | | | (2,621) | | | 2,006 | | | — | | | (18) | | | (287) | | | 25,679 | |
| (Loss) income before income taxes | (20,915) | | | (8,736) | | | (4,864) | | | (15,559) | | | (900) | | | 2,420 | | | (48,554) | |
| Income tax benefit (expense) | 5,020 | | | 1,134 | | | 954 | | | 3,734 | | | 216 | | | 2,073 | | | 13,131 | |
| Net loss attributable to noncontrolling interests | — | | | 4,011 | | | 891 | | | — | | | — | | | — | | | 4,902 | |
| Net (loss) income | $ | (15,895) | | | (3,591) | | | (3,019) | | | (11,825) | | | (684) | | | 4,493 | | | (30,521) | |
| | | | | | | | | | | | | | | | | | | | | | | | | | | | | | | | | | | | | | | | | |
| | | | | | | | | | | | | |
| | | Nelnet Renewable Energy (b) | | | | | | | | |
| Shared services (a) | | Tax equity investments / syndication / administration | | GRNE Solar | | ALLO investment (c) | | Venture capital investments (d) | | Other | | Total |
| Nine months ended September 30, 2024 |
| Investment interest | $ | — | | | 2 | | | 32 | | | — | | | — | | | 9,532 | | | 9,566 | |
| Interest expense | — | | | — | | | (811) | | | — | | | — | | | (1,303) | | | (2,114) | |
| Net interest income (expense) | — | | | 2 | | | (779) | | | — | | | — | | | 8,229 | | | 7,452 | |
| Solar construction revenue | — | | | — | | | 42,741 | | | — | | | — | | | — | | | 42,741 | |
| Other income, net | 2,170 | | | (6,398) | | | 136 | | | 459 | | | 5,780 | | | 9,583 | | | 11,730 | |
| Impairment expense | — | | | — | | | (1,865) | | | — | | | (137) | | | — | | | (2,002) | |
| Cost to provide solar construction services | — | | | — | | | (49,115) | | | — | | | — | | | — | | | (49,115) | |
| Salaries and benefits | (58,654) | | | (1,905) | | | (6,006) | | | — | | | (663) | | | (4,931) | | | (72,159) | |
| Depreciation and amortization | (20,191) | | | — | | | (823) | | | — | | | (21) | | | (277) | | | (21,312) | |
| Other expenses | (32,093) | | | (573) | | | (1,763) | | | 1,498 | | | (52) | | | (4,376) | | | (37,359) | |
| Intersegment expenses, net | 79,379 | | | 99 | | | (1,439) | | | (4) | | | (59) | | | (247) | | | 77,729 | |
| (Loss) income before income taxes | (29,389) | | | (8,775) | | | (18,913) | | | 1,953 | | | 4,848 | | | 7,981 | | | (42,295) | |
| Income tax benefit (expense) | 7,053 | | | 424 | | | 4,142 | | | (469) | | | (1,164) | | | (1,560) | | | 8,426 | |
| Net loss attributable to noncontrolling interests | — | | | 7,009 | | | 1,654 | | | — | | | — | | | — | | | 8,663 | |
| Net (loss) income | $ | (22,336) | | | (1,342) | | | (13,117) | | | 1,484 | | | 3,684 | | | 6,421 | | | (25,206) | |
| | | | | | | | | | | | | |
| Nine months ended September 30, 2023 |
| Investment interest | $ | — | | | — | | | 136 | | | — | | | — | | | 8,690 | | | 8,826 | |
| Interest expense | — | | | — | | | (805) | | | — | | | — | | | (988) | | | (1,793) | |
| Net interest income (expense) | — | | | — | | | (669) | | | — | | | — | | | 7,702 | | | 7,033 | |
| Solar construction revenue | — | | | — | | | 19,687 | | | — | | | — | | | — | | | 19,687 | |
| Other income, net | 2,130 | | | (18,183) | | | 112 | | | (42,483) | | | (2,280) | | | 8,087 | | | (52,617) | |
| Impairment expense | (4,678) | | | — | | | — | | | — | | | — | | | — | | | (4,678) | |
| Cost to provide solar construction services | — | | | — | | | (25,204) | | | — | | | — | | | — | | | (25,204) | |
| Salaries and benefits | (67,923) | | | (2,356) | | | (3,638) | | | (30) | | | (643) | | | (4,096) | | | (78,686) | |
| Depreciation and amortization | (27,965) | | | — | | | (5,696) | | | — | | | — | | | (315) | | | (33,976) | |
| Other expenses | (31,958) | | | (1,116) | | | (1,679) | | | (2,014) | | | (201) | | | (4,359) | | | (41,327) | |
| Intersegment expenses, net | 82,408 | | | (2,582) | | | 918 | | | (1) | | | (39) | | | (947) | | | 79,757 | |
| (Loss) income before income taxes | (47,986) | | | (24,237) | | | (16,169) | | | (44,528) | | | (3,163) | | | 6,072 | | | (130,011) | |
| Income tax benefit (expense) | 11,517 | | | 1,985 | | | 3,150 | | | 10,687 | | | 759 | | | 90 | | | 28,188 | |
| Net loss attributable to noncontrolling interests | — | | | 15,967 | | | 3,043 | | | — | | | — | | | — | | | 19,010 | |
| Net (loss) income | $ | (36,469) | | | (6,285) | | | (9,976) | | | (33,841) | | | (2,404) | | | 6,162 | | | (82,813) | |
(a) Includes corporate activities related to internal audit, human resources, accounting, legal, enterprise risk management, information technology, occupancy, and marketing. These costs are allocated to each operating segment based on estimated use of such activities and services. The amount allocated to operating segments is reflected as “intersegment expenses, net” in the table above. Also includes corporate costs and overhead functions not allocated to operating segments, including executive management, investments in innovation, and other holding company organizational costs.
(b) Nelnet Renewable Energy includes solar tax equity investments made by the Company, administrative and management services provided by the Company on tax equity investments made by third parties, and solar construction and development. As of September 30, 2024, the Company has invested a total of $543.7 million (which includes $241.4 million syndicated to third-party investors) in solar tax equity investments that remain outstanding. Due to the management and control of each of these investment partnerships, such partnerships that invest in tax equity investments are consolidated on the Company’s consolidated financial statements, with the co-investor’s portion being presented as noncontrolling interests.
Included in tax equity investments in the table above is the Company's share of income or loss from solar investments accounted for under the Hypothetical Liquidation at Book Value (HLBV) method of accounting. For the majority of the Company's solar investments, the HLBV method of accounting results in accelerated losses in the initial years of investment. Nelnet Renewable Energy recognized net losses on its tax equity investments of $11.2 million and $6.5 million for the three months ended September 30, 2024 and 2023, respectively, and $11.1 million and $19.5 million for the nine months ended September 30, 2024 and 2023, respectively. These income statement amounts, which include amounts attributable to third-party noncontrolling interest investors, are included in “other income, net” in the table above. The amount of net losses attributable to third-party noncontrolling interest investors for the three months ended September 30, 2024 and 2023 was $3.9 million and $3.3 million, respectively, and $5.6 million and $14.7 million for the nine months
ended September 30, 2024 and 2023, respectively. Amounts applicable to noncontrolling interest investors are reflected in “net loss attributable to noncontrolling interests” in the table above.
Nelnet Renewable Energy syndicates tax equity investments to third parties and earns management and performance fees. Management fee income recognized by Nelnet Renewable Energy was $0.9 million and $0.6 million for the three months ended September 30, 2024 and 2023, respectively, and $2.5 million and $1.3 million for the nine months ended September 30, 2024 and 2023, respectively, which is included in "other income, net" in the table above. During the third quarter of 2024, Nelnet Renewable Energy also recognized solar consulting revenue of $4.2 million.
In addition to solar tax equity investments, the Company has a solar construction company (GRNE Solar) that provides full-service engineering, procurement, and construction (EPC) services to residential homes and commercial entities. Since the acquisition of 80% of GRNE Solar's ownership interests in 2022, it has incurred low and, in some cases, negative margins on certain projects. During the third quarter of 2024, the Company recorded an expense of $8.8 million related to estimated losses on legacy construction projects. The Company has a handful of remaining legacy construction contracts to complete, down from over 30 at the beginning of 2024. Due to the complexity and long-term nature of existing construction contracts, the Company may continue to incur low and/or negative margins to complete these projects.
In April 2024, the Company announced a change in its solar EPC operations to focus exclusively on the commercial solar market and will discontinue its residential solar operations. As a result, residential revenue will continue to decline from recent historical amounts as existing customer contracts are completed. Residential solar construction revenue was $0.6 million and $2.1 million for the three months ended September 30, 2024 and 2023, respectively, and $3.3 million and $7.3 million for the nine months ended September 30, 2024 and 2023, respectively. In addition, during the second quarter of 2024, the Company recognized non-cash impairment charges of $1.9 million on certain solar facilities and inventory related to the residential solar operations, which is reflected in "impairment expense" in the table above, and $1.6 million in severance costs and commissions paid for cancelled projects, which is included in "salaries and benefits" in the table above. For additional information, see note 9 of the notes to consolidated financial statements included under Part I, Item 1 of this report.
On June 30, 2024, the Company acquired the remaining 20% of GRNE Solar for $0.3 million.
(c) Represents primarily the Company's share of loss on its voting membership interests and income on its preferred membership interest in ALLO.
The Company accounts for its approximately 45% voting membership interests in ALLO under the HLBV method of accounting. Under the HLBV method of accounting on its ALLO voting membership interests investment, the Company recognized no losses in the third quarter of 2024 compared with losses of $17.3 million for the same period in 2023 and losses of $10.7 million for the nine months ended September 30, 2024 compared with $49.7 million for the same period in 2023. These amounts are reflected in “other income, net” in the table above. Absent additional equity contributions with respect to ALLO's voting membership interests, the Company will not recognize additional losses for its voting membership interests in ALLO.
As of September 30, 2024, the outstanding preferred membership interests and accrued and unpaid preferred return of ALLO held by the Company was $184.0 million and $11.4 million, respectively. The Company historically earned a preferred annual return of 6.25% that increased to 10.00% on April 1, 2024 for $155.0 million of preferred membership interests of ALLO held by the Company. During the second and third quarter of 2024, the Company purchased an additional $29.0 million of preferred membership interests of ALLO, which earn a preferred annual return of 20.0%. The Company recognized income on its ALLO preferred membership interests of $4.8 million and $2.3 million for the three months ended September 30, 2024 and 2023, respectively, and $11.4 million and $6.8 million for the nine months ended September 30, 2024 and 2023, respectively. These amounts are reflected in “other income, net” in the table above.
As part of the ALLO recapitalization transaction completed in 2020, the Company and SDC (a third-party global digital infrastructure investor and member of ALLO) entered into an agreement, in which the Company has a contingent payment obligation to pay SDC a contingent payment amount of up to $35.0 million in the event the Company disposes of its voting membership interests of ALLO that it holds and realizes from such disposition certain targeted return levels. The Company adjusts the balance of this contingent liability each reporting period. For the three and nine months ended September 30, 2024, the Company reduced the obligation resulting in an expense reduction of $2.1 million and $1.5 million, respectively, and for the three and nine months ended September 30, 2023, recognized expense of $0.7 million and $2.0 million, respectively, which is included in “other expenses” in the table above.
(d) Represents the operating results of the Company’s venture capital investments, including Hudl, which the Company accounts for using the measurement alternative method, and the administrative costs to manage this portfolio.
LIQUIDITY AND CAPITAL RESOURCES
The Company’s Loan Servicing and Systems, and Education Technology Services and Payments operating segments are non-capital intensive and both produce positive operating cash flows. As such, a minimal amount of debt and equity capital is allocated to these segments and any liquidity or capital needs are satisfied using cash flow from operations.
Nelnet Bank was funded by the Company with an initial capital contribution of $100.0 million in November 2020 and the Company has contributed an additional $65.0 million to Nelnet Bank since its inception, including $30.0 million year to date through November 7, 2024. Based on Nelnet Bank's business plan for growth and current financial condition, the Company believes it will make additional capital contributions to the bank in future periods. Cash and investments held at Nelnet Bank are generally not available for Company activities outside of Nelnet Bank. See “Liquidity Impact Related to Nelnet Bank” included below for additional information.
Therefore, the Liquidity and Capital Resources discussion is concentrated on the Company’s liquidity and capital needs to meet existing debt obligations in the Asset Generation and Management operating segment and the Company's other initiatives to pursue additional strategic investments.
Sources of Liquidity
As of September 30, 2024, the Company's sources of liquidity included:
| | | | | | | | |
| Cash and cash equivalents | | $ | 219,684 | |
| Less: Cash and cash equivalents held at Nelnet Bank (a) | | (81,714) | |
| Net cash and cash equivalents | | 137,970 | |
| | |
| Available-for-sale (AFS) debt securities (investments) - at fair value | | 975,795 | |
| Less: AFS debt securities held at Nelnet Bank - at fair value (a) | | (448,525) | |
| AFS private education loan debt securities - held as risk retention - at fair value (b) | | (227,289) | |
| Restricted investments | | (49,755) | |
| Unencumbered AFS debt securities (investments) - at fair value | | 250,226 | |
| | |
| Unencumbered private, consumer, and other loans (Non-Nelnet Bank) - at par | | 249,154 | |
| | |
| Unencumbered repurchased Nelnet issued asset-backed debt securities - at par (not included on consolidated financial statements) (c) | | 309,469 | |
| | |
| | |
| | |
| Unused capacity on unsecured line of credit (d) | | 495,000 | |
| | |
| Sources of liquidity as of September 30, 2024 | | $ | 1,441,819 | |
(a) Cash and investments held at Nelnet Bank are generally not available for Company activities outside of Nelnet Bank.
(b) The Company is sponsor for certain securitizations and as sponsor, is required to provide a certain level of risk retention. To satisfy this requirement, the Company has purchased bonds issued in the securitizations. The Company is required to retain these bonds as described under the caption “Repurchase Agreement” below.
(c) The Company has repurchased certain of its own asset-backed securities (bonds and notes payable) in the secondary market. For accounting purposes, these notes are eliminated in consolidation and are not included in the Company's consolidated financial statements. However, these securities remain legally outstanding at the trust level and the Company could sell these notes to third parties, redeem the notes at par as cash is generated by the trust estate, or pledge the securities as collateral on repurchase agreements. Upon a sale of these notes to third parties, the Company would obtain cash proceeds equal to the market value of the notes on the date of such sale.
(d) The Company has a $495.0 million unsecured line of credit that matures on September 22, 2026. As of September 30, 2024, there was no amount outstanding on the unsecured line of credit and $495.0 million was available for future use.
The Company intends to use its liquidity position to capitalize on market opportunities, including FFELP, private education, consumer, and other loan acquisitions (or investment interests therein); strategic acquisitions and investments; and capital management initiatives, including stock repurchases, debt repurchases, and dividend distributions. The timing and size of these opportunities will vary and will have a direct impact on the Company's cash and investment balances.
Cash Flows
The Company has historically generated positive cash flow from operations. During the nine months ended September 30, 2024 and 2023, the Company generated $482.4 million and $352.6 million, respectively, in cash from operating activities. The increase in 2024 compared with 2023 was due to:
•An increase in net income;
•Payments of $4.4 million to the Company's clearinghouse for margin payments on derivatives during the nine months ended September 30, 2024 compared with payments of $210.2 million for the same period in 2023;
•Adjustments to net income for the impact of provision for beneficial interests and provision for loan losses; and
•The impact of changes to accrued interest receivable and other assets during the nine months ended September 30, 2024 compared with the same period in 2023.
These factors were partially offset by:
•Adjustments to net income for the non-cash change in loss on investments, derivative market value adjustments, loan discount and deferred lender fees accretion, and depreciation and amortization;
•No proceeds from the termination of derivative instruments during the nine months ended September 30, 2024 compared with $164.1 million for the same period in 2023; and
•The impact of changes to other liabilities, accrued interest payable, and accounts receivable during the nine months ended September 30, 2024 compared with the same period in 2023.
The primary items included in the statement of cash flows for investing activities are the purchase, origination, repayment, and sale of loans, the purchase and sale of available-for-sale securities, and the purchase of other investments (primarily solar investments). The primary items included in financing activities are proceeds from the issuance of and payments on bonds and notes payable, the change in deposits at Nelnet Bank used to fund loans and investment activity, and repurchases of common stock. Cash provided by investing activities and used in financing activities for the nine months ended September 30, 2024 was $2.1 billion and $2.7 billion, respectively. Cash provided by investing activities and used in financing activities for the nine months ended September 30, 2023 was $1.3 billion and $2.2 billion, respectively. Investing and financing activities are further addressed in the discussion that follows.
Liquidity Needs and Sources of Liquidity Available to Satisfy Debt Obligations Secured by Loan Assets and Related Collateral
The following table shows AGM's debt obligations outstanding that are secured by loan assets and related collateral.
| | | | | | | | | | | |
| | As of September 30, 2024 |
| Carrying amount | | Final maturity |
| Bonds and notes issued in asset-backed securitizations | $ | 7,893,607 | | | 8/26/30 - 9/25/69 |
| FFELP and consumer loan warehouse facilities | 979,369 | | | 11/14/25 - 8/1/26 |
| | $ | 8,872,976 | | | |
Bonds and Notes Issued in Asset-backed Securitizations
The majority of AGM’s portfolio of student loans is funded in asset-backed securitizations that are structured to substantially match the maturity of the funded assets, thereby minimizing liquidity risk. Cash generated from student loans funded in asset-backed securitizations provide the sources of liquidity to satisfy all obligations related to the outstanding bonds and notes issued in such securitizations. In addition, due to (i) the difference between the yield AGM receives on the loans and cost of financing within these transactions, and (ii) the servicing and administration fees AGM earns from these transactions, AGM has created a portfolio that will generate earnings and significant cash flow over the life of these transactions.
As of September 30, 2024, based on cash flow models developed to reflect management’s current estimate of, among other factors, prepayments, defaults, deferment, forbearance, and interest rates, AGM currently expects future undiscounted cash flows from its portfolio to be approximately $1.18 billion as detailed below. The actual timing of cash flows released from the securitizations could be impacted based on when and if the Company terminates a securitization by exercising clean-up calls on the underlying securities when the assets in such securitization reach a certain threshold.
The forecasted cash flow presented below includes loans funded in asset-backed securitizations as of September 30, 2024, the majority of which are federally insured student loans. As of September 30, 2024, AGM had $8.4 billion of loans included in
asset-backed securitizations, which represented 87.6% of its total loan portfolio. The forecasted cash flow does not include cash flows that the Company expects to receive related to loans funded in its warehouse facilities, unencumbered private education, consumer, and other loans funded with operating cash, its ownership of beneficial interest in loan securitizations (such beneficial interest investments are classified as "investments and notes receivable" on the Company's consolidated balance sheets), loans acquired subsequent to September 30, 2024, and loans owned by Nelnet Bank.
Asset-backed Securitization Cash Flow Forecast
$1.18 billion
(dollars in millions)
The forecasted future undiscounted cash flows of approximately $1.18 billion include approximately $0.74 billion (as of September 30, 2024) of overcollateralization included in the asset-backed securitizations. These excess net asset positions are included in the consolidated balance sheets in the balances of "loans and accrued interest receivable, net" and "restricted cash." The difference between the total estimated future undiscounted cash flows and the overcollateralization of approximately $0.44 billion, or approximately $0.33 billion after income taxes based on the estimated effective tax rate, represents estimated future net interest income (earnings) from the portfolio and is expected to be accretive to the Company's balance of consolidated shareholders' equity from the September 30, 2024 balance.
The Company uses various assumptions, including prepayments and future interest rates, when preparing its cash flow forecast. These assumptions are further discussed below.
Prepayments: The primary variable in establishing a life of loan estimate is the level and timing of prepayments. Prepayment rates equal the amount of loans that prepay annually as a percentage of the beginning of period balance, net of scheduled principal payments. A number of factors can affect estimated prepayment rates, including the level of consolidation activity, borrower default rates, and utilization of debt management options such as income-based repayment, deferments, and forbearance. Should any of these factors change, management may revise its assumptions, which in turn would impact the projected future cash flow. The Company’s cash flow forecast above assumes prepayment rates of 6% for both federally insured consolidation and Stafford loans. Prepayment rates for private education loans range from 11% to 20%.
Since late 2021, the Company has experienced accelerated run-off (prepayments) of its FFELP portfolio due to FFELP borrowers consolidating their loans into Federal Direct Loan Program loans to qualify for loan forgiveness under various initiatives and programs offered by the federal government and the Department. See "Nelnet Financial Services Division -
Results of Operations - Asset Generation and Management Operating Segment - Loan Activity" included in this report's Management's Discussion and Analysis of Financial Condition and Results of Operations for additional information related to the federal government and the Department's initiatives for debt relief that has increased, and may continue to increase, prepayment activity. Prepayments could significantly increase if the federal government and the Department initiate additional loan forgiveness or cancellation, other repayment options or plans, or consolidation loan programs. In addition, see Part I, Item 1A, "Risk Factors - Loan Portfolio - Prepayments risk" in the Company's 2023 Annual Report for additional information related to risks associated with loan prepayments.
The following table summarizes the estimated impact to the above forecasted cash flows if prepayments were greater than the prepayment rate assumptions used to calculate the forecasted cash flows.
| | | | | | | | | | | | | | |
| Increase in prepayment rate | | Reduction in forecasted cash flow from table above | | Forecasted cash flow using increased prepayment rate |
| 2x | | $0.09 billion | | $1.09 billion |
| 4x | | $0.26 billion | | $0.92 billion |
| 10x | | $0.43 billion | | $0.75 billion |
If the entire AGM student loan portfolio prepaid, the Company would receive the full amount of overcollateralization included in the asset-backed securitizations of approximately $0.74 billion (as of September 30, 2024); however, the Company would not receive the $0.44 billion ($0.33 billion after tax) of estimated future earnings from the portfolio.
Interest rates: The Company funds a portion of its student loans with floating rate securities that are indexed to 90-day SOFR. Meanwhile, the interest earned on the Company’s student loan assets is indexed primarily to the 30-day average SOFR in effect for each day in a calendar quarter. The different interest rate characteristics of the Company’s loan assets and liabilities funding these assets result in basis risk. The Company’s cash flow forecast assumes, for the life of the portfolio, a relationship between the various SOFR indices that is implied by the current forward SOFR curves. If the forecast is computed assuming a spread of an additional 12 basis points between Term SOFR and 30-day average SOFR for the life of the portfolio, the cash flow forecast would be reduced by approximately $10 million to $15 million.
The Company uses the current forward interest rate yield curve to forecast cash flows. A change in the forward interest rate curve would impact the future cash flows generated from the portfolio. See Item 3, "Quantitative and Qualitative Disclosures About Market Risk - Interest Rate Risk - AGM Operating Segment" for additional information about various interest rate risks which may impact future cash flows from AGM's loan assets.
Warehouse Facilities
Warehousing allows the Company to buy and manage loans prior to transferring them into more permanent financing arrangements. For a summary of the Company's warehouse facilities outstanding as of September 30, 2024, see note 4 of the notes to consolidated financial statements included under Part I, Item 1 of this report. The Company has been reducing its warehouse capacity based on its estimated future loan purchases and to save on unused facility costs.
Upon termination or expiration of the warehouse facilities, the Company would expect to access the securitization market, obtain replacement warehouse facilities, use operating cash, consider the sale of assets, or transfer collateral to satisfy any remaining obligations.
Asset-backed Securities Transactions
The Company, through its subsidiaries, has historically funded loans by completing asset-backed securitizations. Depending on market conditions, the Company anticipates continuing to access the asset-backed securitization market. Such asset-backed securitization transactions would be used to refinance loans included in its warehouse facilities and existing asset-backed securitizations and/or finance loans purchased from third parties and loans that are currently unencumbered.
There were no asset-backed securitization transactions completed during the nine months ended September 30, 2024.
Other Uses of Liquidity
The Company no longer originates FFELP loans, but continues to acquire FFELP loan portfolios from third parties and believes additional loan purchase opportunities exist, including opportunities to purchase private education, consumer, and other loans (or investment interests therein).
The Company plans to fund additional loan acquisitions and related investments using current cash; cash provided by operating activities; proceeds from the sale of certain investments; its unsecured line of credit, its Union Bank student loan participation agreement, its Union Bank student loan asset-backed securities participation agreement, and its third-party repurchase agreement (each as described below), and/or establishing similar secured and unsecured borrowing facilities; using its existing warehouse facilities (as described above); increasing the capacity under existing and/or establishing new warehouse facilities; and continuing to access the asset-backed securities market.
Repurchase Agreement
In December 2020, Wells Fargo announced the sale of its approximately $10.0 billion portfolio of private education loans representing approximately 445,000 borrowers. The Company entered into a joint venture with other investors to acquire the loans, and under the joint venture, the Company had an approximately 8% interest in the loans and has a corresponding 8% interest in residual interests in the 2021 securitizations of the loans discussed below.
During 2021, the Company sponsored four asset-backed securitization transactions to permanently finance a total of $8.7 billion of private education loans sold by Wells Fargo (which represented the total remaining loans originally purchased from Wells Fargo, factoring in borrower payments from the date of purchase). As sponsor, the Company is required to provide a certain level of risk retention, and has purchased bonds issued in such securitizations to satisfy this requirement. The bonds purchased to satisfy the risk retention requirement are reflected on the Company's consolidated balance sheets as "investments and notes receivable" and as of September 30, 2024, the fair value of these bonds was $227.3 million. The Company must retain these investment securities until the latest of (i) the date the aggregate outstanding principal balance of the loans in the securitization is 33% or less of the initial loan balance and (ii) the date the aggregate outstanding principal balance of the bonds is 33% or less of the aggregate initial outstanding principal balance of the bonds, at which time the Company can sell its investment securities (bonds) to a third party.
The Company entered into a repurchase agreement with a third party in which a portion of the risk retention investments serve as collateral on the repurchase obligations. As of September 30, 2024, $108.2 million was outstanding on the Company's repurchase agreement and the maturity dates on this facility vary from November 27, 2024 through December 20, 2024. The Company is subject to cash margin deficit payment requirements in the event the fair value of the securities subject to the repurchase agreement becomes less than the original purchase price of such securities.
Upon termination or maturity of the repurchase agreement, there can be no assurance that the Company will be able to maintain this or a similar agreement, or find alternative funding if necessary. If necessary, the Company would expect to use operating cash, consider the sale of unencumbered investments, or borrow on its unsecured line of credit to satisfy any remaining obligations.
Union Bank Participation Agreements
The Company maintains an agreement with Union Bank, a related party, as trustee for various grantor trusts, under which Union Bank has agreed to purchase from the Company participation interests in student loans. As of September 30, 2024, $326.2 million of loans were subject to outstanding participation interests held by Union Bank, as trustee, under this agreement. The agreement automatically renews annually and is terminable by either party upon five business days' notice. This agreement provides beneficiaries of Union Bank’s grantor trusts with access to investments in interests in student loans, while providing liquidity to the Company. The Company can participate loans to Union Bank to the extent of availability under the grantor trusts, up to $900.0 million or an amount in excess of $900.0 million if mutually agreed to by both parties. Loans participated under this agreement have been accounted for by the Company as loan sales. Accordingly, the participation interests sold are not included on the Company’s consolidated balance sheets.
The Company also has an agreement with Union Bank under which Union Bank has agreed to purchase from the Company participation interests in FFELP loan asset-backed securities (bond investments). The agreement automatically renews annually and is terminable by either party upon five business days' notice. The Company can participate FFELP loan asset-backed securities to Union Bank to the extent of availability under the grantor trusts, up to $400.0 million or an amount in excess of $400.0 million if mutually agreed to by both parties. The Company maintains legal ownership of the FFELP loan asset-backed securities and, in its discretion, approves and accomplishes any sale, assignment, transfer, encumbrance, or other disposition of the securities. As such, the FFELP loan asset-backed securities subject to this agreement are included on the Company's consolidated balance sheets as "investments and notes receivable" and the participation interests outstanding have been accounted for by the Company as a secured borrowing. As of September 30, 2024, $0.1 million (par value) of FFELP loan asset-backed securities were subject to outstanding participation interests held by Union Bank, as trustee, under this agreement.
Liquidity Impact Related to Beneficial Interest in Loan Securitizations
The Company has partial ownership in consumer, private education, and federally insured student loan third-party securitizations that are classified as "beneficial interest in loan securitizations" and included in "investments and notes receivable" on the Company's consolidated balance sheets. These residual interests were acquired by the Company or have been received by the Company as consideration from selling portfolios of loans to unrelated third parties who securitized such loans. As of the latest remittance reports filed by the various trusts prior to or as of September 30, 2024, the Company's ownership correlates to approximately $1.99 billion of loans included in these securitizations. Investment interest income earned by the Company from the beneficial interest in loan securitizations is included in "investment income" on the Company's consolidated statements of income and is not a component of the Company's loan interest income.
As of September 30, 2024, the investment balance on the Company's consolidated balance sheet of its beneficial interest in loan securitizations was $218.7 million. For a summary of this investment balance, see note 6 of the notes to consolidated financial statements included under Part I, Item 1 of this report.
The Company's partial ownership percentage in each loan securitization grants the Company the right to receive the corresponding percentage of cash flows generated by the securitization. As of September 30, 2024, based on cash flow models developed to reflect management’s current estimate of, among other factors, prepayments, defaults, deferment, forbearance, and interest rates, the Company currently expects future undiscounted cash flows from its partial ownership in these securitizations to be approximately $328.2 million. The vast majority of these cash flows are expected to be received over the next 5 years.
The difference between the total estimated future undiscounted cash flows from these residual interests ($328.2 million) and the investment carrying value ($218.7 million) of $109.5 million, or $83.2 million after income taxes based on the estimated effective tax rate, represents estimated future investment interest income (earnings) from these investments and is expected to be accretive to the Company's balance of consolidated shareholders' equity from the September 30, 2024 balance.
The undiscounted future cash flows from the consumer and private education loan securitizations are highly subject to credit risk (defaults). If defaults are higher than management's current estimate, the forecasted cash flows and estimated future investment interest income (earnings) from these securitizations would be adversely impacted. For example, the Company established an allowance of $5.9 million and $29.0 million during the second and third quarter of 2024, respectively, related to certain of the Company's beneficial interest securitization investments. The Company's change in estimate of future cash flows from the beneficial interest in certain loan securitizations was lower than previously anticipated due to actual and estimated loan defaults within such securitizations.
Liquidity Impact Related to Nelnet Bank
Nelnet Bank launched operations in November 2020. Nelnet Bank was funded by the Company with an initial capital contribution of $100.0 million. In addition, the Company made a pledged deposit of $40.0 million with Nelnet Bank, as required under an agreement with the FDIC discussed below.
Prior to Nelnet Bank’s launch of operations, Nelnet Bank, Nelnet, Inc. (the parent), and Michael S. Dunlap (Nelnet, Inc.’s controlling shareholder) entered into a Capital and Liquidity Maintenance Agreement and a Parent Company Agreement with the FDIC in connection with Nelnet, Inc.’s role as a source of financial strength for Nelnet Bank. As part of the Capital and Liquidity Maintenance Agreement, Nelnet, Inc. is obligated to (i) contribute capital to Nelnet Bank for it to maintain capital levels that meet FDIC requirements for a “well capitalized” bank, including a leverage ratio of capital to total assets of at least 12%; (ii) provide and maintain an irrevocable asset liquidity takeout commitment for the benefit of Nelnet Bank in an amount equal to the greater of either 10% of Nelnet Bank’s total assets or such additional amount as agreed to by Nelnet Bank and Nelnet, Inc.; (iii) provide additional liquidity to Nelnet Bank in such amount and duration as may be necessary for Nelnet Bank to meet its ongoing liquidity obligations; and (iv) establish and maintain a pledged deposit of $40.0 million with Nelnet Bank.
Under the regulatory framework for prompt corrective action, Nelnet Bank is subject to various regulatory capital requirements administered by the FDIC and the UDFI and must meet specific capital standards. Failure to meet minimum capital requirements can initiate certain mandatory and possibly additional discretionary actions by regulators that, if undertaken, could have a direct material adverse effect on Nelnet Bank’s business, results of operations, or financial condition. On January 1, 2020, the Community Bank Leverage Ratio (CBLR) framework, as issued jointly by the Office of the Comptroller of the Currency, the Federal Reserve Board, and the FDIC, became effective. Any banking organization with total consolidated assets of less than $10 billion, limited amounts of certain types of assets and off-balance sheet exposures, and a community bank leverage ratio greater than 9% may opt into the CBLR framework quarterly. The CBLR framework allows banks to satisfy capital standards and be considered "well capitalized" under the prompt corrective action framework if their leverage ratio is greater than 9%, unless the banking organization's federal banking agency determines that the banking organization's risk profile warrants a more stringent leverage ratio. The FDIC has ordered Nelnet Bank to maintain at least a 12% leverage ratio.
Nelnet Bank has opted into the CBLR framework for the quarter ended September 30, 2024 with a leverage ratio of 12.4%. Nelnet Bank intends to maintain at all times regulatory capital levels that meet both the minimum level necessary to be considered “well capitalized” under the FDIC’s prompt corrective action framework and the minimum level required by the FDIC.
Since inception, the Company has made additional contributions of $65.0 million to Nelnet Bank, including $30.0 million year to date through November 7, 2024. Based on Nelnet Bank's business plan for growth and current financial condition, the Company believes it will make additional capital contributions to the bank in future periods.
Liquidity Impact Related to Nelnet Renewable Energy
The Company’s Nelnet Renewable Energy business makes solar tax equity investments in renewable energy solar partnerships. Through September 30, 2024, the Company has invested a total of $543.7 million (which includes $241.4 million syndicated to third-party investors) in tax equity investments that remain outstanding. These investments provide a federal income tax credit under the Internal Revenue Code, equaling 30% to 40% of the eligible project cost, with the tax credit available when the project is placed-in-service. The Company is allowed to reduce its tax estimates paid to the U.S. Treasury based on the credits earned. Based on the timing of when the Company funds a project and decreases its tax estimate to the U.S. Treasury due to earning of the tax credit, the amount of capital funded to solar tax equity investments at any point in time is not significant and has a minimal impact on the Company’s liquidity. As of September 30, 2024, the Company is committed to fund an additional $107.9 million on tax equity investments, of which $89.5 million is expected to be provided by syndication partners.
In addition to solar tax equity investments, the Company has a strategy to own solar energy project assets. The Company plans to fund a portion of its current growth plans in owning solar energy projects using third-party debt and third-party tax equity. The collateral on any third-party debt would be limited to the assets of the specific solar projects. Any capital requirements for the origination or purchase of solar projects not funded by third-party debt and third-party tax equity would be provided by the Company using operating cash, borrowings on its unsecured line of credit, and/or the sale of investments.
Liquidity Impact Related to ALLO
Upon the deconsolidation of ALLO on December 21, 2020, the Company recorded its 45% voting membership interests in ALLO at fair value, and accounts for such investment under the HLBV method of accounting. In addition, the Company recorded its remaining non-voting preferred membership units of ALLO at fair value, and accounts for such investment as a separate equity investment. The Company historically earned a preferred annual return of 6.25% that increased to 10.00% on April 1, 2024 for $155.0 million of preferred membership interests of ALLO. On January 1, 2025, the preferred annual return on the $155.0 million of preferred membership interests of ALLO will increase to 13.5%, commencing July 1, 2025, the return will increase to 15.0%, commencing January 1, 2026, the preferred return will increase to 17.5%, and beginning on January 1, 2027 and on each January 1 of each calendar year thereafter, the annual return will increase by an additional 2.5%. During the second and third quarter of 2024, the Company purchased an additional $29.0 million of preferred membership interests in ALLO, which earn a preferred annual return of 20.0%. Accrued and unpaid preferred returns are converted to additional preferred membership interests each December 31. As of September 30, 2024, the accrued and unpaid preferred return was $11.4 million.
If ALLO needs additional capital to support its growth in existing or new markets, the Company has the option to contribute additional capital to maintain its voting equity interest and/or may purchase additional preferred membership interests that include a preferred return. Based on ALLO's business plan for growth and current financial condition, the Company believes it will make additional capital contributions to ALLO in future periods.
In addition to equity contributions, ALLO has issued debt to fund its growth. As of September 30, 2024, ALLO has $1.1 billion (par value) of debt outstanding.
As part of the ALLO recapitalization transaction in December 2020, the Company and SDC entered into an agreement, in which the Company has a contingent payment obligation to pay SDC a contingent payment amount of up to $35.0 million in the event the Company disposes of its voting membership interests of ALLO that it holds and realizes from such disposition certain targeted return levels. As of September 30, 2024, the estimated fair value of the contingent payment is $8.3 million.
Liquidity Impact Related to Hedging Activities
The Company utilizes derivative instruments to manage interest rate sensitivity. By using derivative instruments, the Company is exposed to market risk which could impact its liquidity.
All Non-Nelnet Bank over-the-counter derivative contracts executed by the Company are cleared post-execution at a regulated clearinghouse. Clearing is a process by which a third party, the clearinghouse, steps in between the original counterparties and
guarantees the performance of both, by requiring that each post liquid collateral on an initial (initial margin) and mark-to-market (variation margin) basis to cover the clearinghouse’s potential future exposure in the event of default.
Based on the derivative portfolio outstanding as of September 30, 2024, the Company does not anticipate any movement in interest rates having a material impact on its capital or liquidity profile, nor does the Company expect that any movement in interest rates would have a material impact on its ability to make variation margin payments to its third-party clearinghouse and/or payments to its counterparties for its non-centrally cleared derivatives used by Nelnet Bank.
Unsecured Line of Credit
As discussed above, the Company has a $495.0 million unsecured line of credit with a maturity date of September 22, 2026. As of September 30, 2024, the unsecured line of credit had no amount outstanding and $495.0 million was available for future use. Upon the maturity date of this facility, there can be no assurance that the Company will be able to maintain this line of credit, increase or maintain the amount outstanding under the line, or find alternative funding if necessary.
Stock Repurchases
The Board of Directors has authorized a stock repurchase program to repurchase up to a total of five million shares of the Company's Class A common stock during the three-year period ending May 8, 2025. As of September 30, 2024, 3,341,735 shares remained authorized for repurchase under the Company's stock repurchase program. Shares may be repurchased from time to time on the open market, in private transactions (including with related parties), or otherwise, depending on various factors, including share prices and other potential uses of liquidity.
Shares repurchased by the Company during the first three quarters of 2024 are shown below, and include shares repurchased under the Company's stock repurchase program and shares owned and tendered by employees to satisfy tax withholding obligations upon the vesting of restricted shares. Certain of these repurchases were made pursuant to trading plans adopted by the Company in accordance with Rule 10b5-1 under the Securities Exchange Act of 1934. For additional information on stock repurchases during the third quarter of 2024, see "Stock Repurchases" under Part II, Item 2 of this report.
| | | | | | | | | | | | | | | | | |
| Total shares repurchased | | Purchase price (in thousands) | | Average price of shares repurchased (per share) (a) |
| | |
| Quarter ended March 31, 2024 | 396,724 | | | $ | 35,469 | | | 89.41 | |
| Quarter ended June 30, 2024 | 487,980 | | | 46,842 | | | 95.99 | |
| Quarter ended September 30, 2024 | 5,259 | | | 576 | | | 109.62 | |
| Total | 889,963 | | | $ | 82,887 | | | 93.14 | |
(a) The average price of shares repurchased includes excise taxes.
Dividends
On September 13, 2024, the Company paid a third quarter 2024 cash dividend on the Company's Class A and Class B common stock of $0.28 per share. In addition, the Company's Board of Directors has declared a fourth quarter 2024 cash dividend on the Company's outstanding shares of Class A and Class B common stock of $0.28 per share. The fourth quarter cash dividend will be paid on December 16, 2024 to shareholders of record at the close of business on December 2, 2024.
The Company plans to continue making regular quarterly dividend payments, subject to future earnings, capital requirements, financial condition, and other factors.
CRITICAL ACCOUNTING POLICIES AND ESTIMATES
This Management’s Discussion and Analysis of Financial Condition and Results of Operations discusses the Company’s consolidated financial statements, which have been prepared in accordance with accounting principles generally accepted in the United States. The preparation of these financial statements requires management to make estimates and assumptions that affect the reported amounts of assets and liabilities and the reported amounts of income and expenses during the reporting periods. The Company bases its estimates and judgments on historical experience and on various other factors that the Company believes are reasonable under the circumstances. Actual results may differ from these estimates under varying assumptions or conditions. Note 2 of the notes to consolidated financial statements included in the Company’s 2023 Annual Report includes a summary of the significant accounting policies and methods used in the preparation of the consolidated financial statements.
On an on-going basis, management evaluates its estimates and judgments, particularly as they relate to accounting policies that management believes are most “critical” - that is, they are most important to the portrayal of the Company’s financial condition and results of operations and they require management’s most difficult, subjective, or complex judgments, often as a result of
the need to make estimates about the effect of matters that are inherently uncertain. Management has identified the allowance for loan losses as a critical accounting policy and estimate, as discussed further under Part II, Item 7, “Management’s Discussion and Analysis of Financial Condition and Results of Operations – Critical Accounting Policies and Estimates – Allowance for Loan Losses” in the Company’s 2023 Annual Report. For additional information regarding changes in the Company’s allowance for loan losses for the three and nine months ended September 30, 2024 and 2023, see the caption “Activity in the Allowance for Loan Losses” in note 3 of the notes to consolidated financial statements included under Part I, Item 1 of this report. There have been no material changes to the Company’s critical accounting policy and estimate since December 31, 2023.
RECENT ACCOUNTING PRONOUNCEMENTS
In November 2023, the FASB issued accounting guidance which improves reportable segment disclosure requirements primarily through enhanced disclosures about significant segment expenses that are regularly provided to the chief operating decision maker and included within each reported measure of segment profit (referred to as the “significant expense principle”). This guidance will be effective for the Company for the year ending December 31, 2024 annual financial statements, with early adoption permitted. The guidance will be applied retrospectively for all prior periods presented in the financial statements. The Company intends to adopt the standard when it becomes effective for the year ending December 31, 2024 annual financial statements. While the Company is continuing to evaluate the impact this pronouncement will have on its ongoing financial reporting, it currently believes there will be limited impacts to the disclosures included in the notes to consolidated financial statements due to the segment expense detail already disclosed for each reportable segment.
In December 2023, the FASB issued accounting guidance to address investor requests for more transparency about income tax information through improvements to income tax disclosures primarily related to the rate reconciliation and income taxes paid information. This guidance will be effective for the Company for the year ending December 31, 2025 annual financial statements, with early adoption permitted. The guidance will be applied on a prospective basis. The Company intends to adopt the standard when it becomes effective for the year ending December 31, 2025. Management is currently evaluating the impact this guidance will have on the disclosures included in the notes to consolidated financial statements.
ITEM 3. QUANTITATIVE AND QUALITATIVE DISCLOSURES ABOUT MARKET RISK
(All dollars are in thousands, except share amounts, unless otherwise noted)
Interest Rate Risk - AGM Operating Segment
AGM’s primary market risk exposure arises from fluctuations in its borrowing and lending rates, the spread between which could impact AGM due to shifts in market interest rates.
The following table sets forth AGM’s loan assets and debt instruments by rate characteristics:
| | | | | | | | | | | | | | | | | | | | | | | |
| | As of September 30, 2024 | | As of December 31, 2023 |
| | Dollars | | Percent | | Dollars | | Percent |
| Fixed-rate loan assets | $ | 607,689 | | | 6.4 | % | | $ | 510,666 | | | 4.2 | % |
| Variable-rate loan assets | 8,941,900 | | | 93.6 | | | 11,538,796 | | | 95.8 | |
| Total | $ | 9,549,589 | | | 100.0 | % | | $ | 12,049,462 | | | 100.0 | % |
| | | | | | | |
| Fixed-rate debt instruments | $ | 422,977 | | | 4.8 | % | | $ | 561,557 | | | 4.8 | % |
| Variable-rate debt instruments | 8,456,333 | | | 95.2 | | | 11,142,596 | | | 95.2 | |
| Total | $ | 8,879,310 | | | 100.0 | % | | $ | 11,704,153 | | | 100.0 | % |
FFELP loans originated prior to April 1, 2006 generally earn interest at the higher of the borrower rate, which is fixed over a period of time, or a floating rate based on the special allowance payment (SAP) formula set by the Department. The SAP rate is based on an applicable index plus a fixed spread that depends on loan type, origination date, and repayment status. The Company generally finances its FFELP student loan portfolio with variable rate debt. In low and/or declining interest rate environments, when the fixed borrower rate is higher than the SAP rate, the Company’s FFELP student loans earn at a fixed rate while the interest on the variable rate debt typically continues to reflect the low and/or declining interest rates. In these interest rate environments, the Company may earn additional spread income that it refers to as floor income.
Depending on the type of loan and when it was originated, the borrower rate is either fixed to term or is reset to an annual rate each July 1. As a result, for loans where the borrower rate is fixed to term, the Company may earn floor income for an extended period of time, which the Company refers to as fixed rate floor income, and for those loans where the borrower rate is reset annually on July 1, the Company may earn floor income to the next reset date, which the Company refers to as variable rate
floor income. All FFELP loans first originated on or after April 1, 2006 effectively earn at the SAP rate, since lenders are required to rebate fixed rate floor income and variable rate floor income for those loans to the Department.
Absent the use of derivative instruments, a rise in interest rates will reduce the amount of floor income received and has an impact on earnings due to interest margin compression caused by increasing financing costs, until such time as the federally insured loans earn interest at a variable rate in accordance with their SAP formulas. In higher interest rate environments, where the interest rate rises above the borrower rate and fixed rate loans effectively become variable rate loans, the impact of the rate fluctuations is reduced.
No variable-rate floor income was earned by the Company in 2024 or 2023.
A summary of fixed rate floor income earned by the AGM operating segment follows.
| | | | | | | | | | | | | | | | | | | | | | | |
| Three months ended September 30, | | Nine months ended September 30, |
| 2024 | | 2023 | | 2024 | | 2023 |
| Fixed rate floor income, gross | $ | 225 | | | 450 | | | $ | 563 | | | 2,016 | |
| Derivative settlements (a) | 1,200 | | | 235 | | | 3,583 | | | 22,760 | |
| Fixed rate floor income, net | $ | 1,425 | | | 685 | | | $ | 4,146 | | | 24,776 | |
(a) Derivative settlements consist of settlements received related to the Company's derivatives used to hedge student loans earning fixed rate floor income.
Gross fixed rate floor income decreased for the three and nine months ended September 30, 2024 compared with the same periods in 2023 due to higher interest rates in 2024 compared with 2023.
The Company had a significant portfolio of derivative instruments in which the Company paid a fixed rate and received a floating rate to economically hedge loans earning fixed rate floor income. During the first quarter of 2023, to minimize the Company's exposure to market volatility and increase liquidity, the Company terminated its derivative portfolio hedging loans earning fixed rate floor income ($2.8 billion in notional amount of derivatives). Through March 15, 2023, the Company had received cash or had a receivable from its clearinghouse related to variation margin equal to the fair value of the $2.8 billion notional amount of fixed rate floor derivatives as of March 15, 2023 of $183.2 million, which included $19.1 million related to 2023 settlements. Subsequent to terminating these derivatives, during the second and fourth quarters of 2023, the Company entered into a total of $400.0 million notional amount of derivatives to hedge loans earning fixed rate floor income and other loans and investments in which the Company receives a fixed rate.
The increase in net derivative settlements received by the Company during the three months ended September 30, 2024, compared with the same period in 2023, was due to an increase in the notional amount of derivatives outstanding. The decrease in net derivative settlements received by the Company during the nine months ended September 30, 2024, compared with the same period in 2023, was due to a decrease in the notional amount of derivatives outstanding and less favorable terms on the $400.0 million of notional derivatives entered into in 2023 compared with the $2.8 billion notional derivatives that were terminated due to an increase in interest rates from when the terminated derivatives were initially executed.
For further details of the Company’s derivatives used to hedge fixed rate loans, see note 5 of the notes to consolidated financial statements included in Part I, Item 1 of this report.
The following table shows AGM’s federally insured student loan assets that were earning fixed rate floor income as of September 30, 2024.
| | | | | | | | | | | | | | | | | | | | |
| Fixed interest rate range | | Borrower/lender weighted average yield | | Estimated variable conversion rate (a) | | Loan balance |
| | | | | | |
| | | | | | |
| | | | | | |
| | | | | | |
| | | | | | |
| | | | | | |
| | | | | | |
| | | | | | |
| | | | | | |
| | | | | | |
| | | | | | |
| 8.0 - 8.99% | | 8.25% | | 5.61% | | $ | 163,939 | |
> 9.0% | | 9.06% | | 6.42% | | 93,691 | |
| | | | | | $ | 257,630 | |
(a) The estimated variable conversion rate is the estimated short-term interest rate at which loans would convert to a variable rate. As of September 30, 2024, the weighted average estimated variable conversion rate was 5.90% and the short-term interest rate was 556 basis points.
AGM is also exposed to interest rate risk in the form of repricing risk and basis risk because the interest rate characteristics of AGM’s assets do not match the interest rate characteristics of the funding for those assets. The following table presents AGM’s FFELP student loan assets and related funding for those assets arranged by underlying indices as of September 30, 2024.
| | | | | | | | | | | | | | | | | | | | |
| Index | | Frequency of variable resets | | Assets | | Funding of student loan assets |
| 30-day average SOFR (a) | | Daily | | $ | 8,510,187 | | | — | |
| 3-month H15 financial commercial paper | | Daily | | 283,164 | | | — | |
| 3-month Treasury bill | | Daily | | 277,391 | | | — | |
| 30-day average SOFR / 1-month CME Term SOFR | | Monthly | | — | | | 5,230,428 | |
| 90-day average SOFR / 3-month CME Term SOFR (a) | | Quarterly | | — | | | 2,116,094 | |
| Asset-backed commercial paper / SOFR (b) | | Varies | | — | | | 889,092 | |
| Fixed rate | | — | | — | | | 360,044 | |
| Auction-rate (c) | | Varies | | — | | | 70,220 | |
| Other (d) | | — | | 881,427 | | | 1,286,291 | |
| | | | | $ | 9,952,169 | | | 9,952,169 | |
(a) The Company has certain basis swaps outstanding in which the Company receives and pays the term adjusted SOFR plus the tenor spread adjustment to LIBOR. Prior to the discontinuation of LIBOR on June 30, 2023, the Company received three-month LIBOR set discretely in advance and paid one-month LIBOR plus or minus a spread as defined in the agreements (the "1:3 Basis Swaps"). The Company entered into these derivative instruments to better match the interest rate characteristics on its student loan assets and the debt funding such assets. The following table summarizes the 1:3 Basis Swaps outstanding as of September 30, 2024.
| | | | | | | | |
| Maturity | | Notional amount (i) |
| | |
| 2026 | | $ | 1,150,000 | |
| 2027 | | 250,000 | |
| | |
| | |
| | |
| | |
| | |
| | |
| | |
| | |
| | |
| | $ | 1,400,000 | |
(i) The weighted average rate paid by the Company on the 1:3 Basis Swaps as of September 30, 2024 was the term adjusted SOFR (plus the tenor spread adjustment relating to LIBOR) plus 10.4 basis points.
(b) The interest rate on the Company's FFELP warehouse facilities is indexed to asset-backed commercial paper rates and daily SOFR.
(c) As of September 30, 2024, the Company was sponsor for $70.2 million of outstanding asset-backed securities that were set and provide for interest rates to be periodically reset via a "dutch auction" (the “Auction Rate Securities”). Since the auction feature has essentially been inoperable for substantially all auction rate securities since 2008, the Auction Rate Securities generally pay interest to the holder at a maximum rate as defined by the indenture. While these rates will vary, they will generally be based on a spread to SOFR or Treasury Securities, or the Net Loan Rate as defined in the financing documents.
(d) Assets include accrued interest receivable and restricted cash. Funding represents overcollateralization (equity) and other liabilities included in FFELP loan asset-backed securitizations and warehouse facilities.
Sensitivity Analysis
The following tables summarize the effect on the Company’s consolidated earnings, based upon a sensitivity analysis performed on AGM’s assets and liabilities assuming hypothetical increases and decreases in interest rates of 100 basis points and 300 basis points while funding spreads remain constant. In addition, a sensitivity analysis was performed assuming the funding index increases 10 basis points and 30 basis points while holding the asset index constant, if the funding index is different than the asset index. The sensitivity analysis was performed on AGM’s variable rate assets (including loans earning fixed rate floor income) and liabilities.
| | | | | | | | | | | | | | | | | | | | | | | | | | | | | | | | | | | | | | | | | | | | | | | |
| | Interest rates |
| Change from increase of
100 basis points | | Change from increase of
300 basis points | | Change from decrease of
100 basis points | | Change from decrease of
300 basis points |
| | Dollars | | Percent | | Dollars | | Percent | | Dollars | | Percent | | Dollars | | Percent |
| | Three months ended September 30, 2024 |
| Effect on earnings: | | | | | | | | | | | | | | | |
| Increase in pre-tax net income before impact of derivative settlements | $ | 261 | | | 11.7 | % | | $ | 2,017 | | | 90.7 | % | | $ | 1,674 | | | 75.3 | % | | $ | 6,812 | | | 306.4 | % |
| Impact of derivative settlements | 754 | | | 33.9 | | | 2,262 | | | 101.8 | | | (754) | | | (33.9) | | | (2,262) | | | (101.8) | |
| Increase in net income before taxes | $ | 1,015 | | | 45.6 | % | | $ | 4,279 | | | 192.5 | % | | $ | 920 | | | 41.4 | % | | $ | 4,550 | | | 204.6 | % |
| Increase in basic and diluted earnings per share | $ | 0.02 | | | | | $ | 0.09 | | | | | $ | 0.02 | | | | | $ | 0.09 | | | |
| | Three months ended September 30, 2023 |
| Effect on earnings: | | | | | | | | | | | | | | | |
| Increase in pre-tax net income before impact of derivative settlements | $ | 522 | | | 1.0 | % | | $ | 2,093 | | | 4.0 | % | | $ | 2,166 | | | 4.1 | % | | $ | 9,199 | | | 17.4 | % |
| Impact of derivative settlements | 126 | | | 0.2 | | | 378 | | | 0.7 | | | (126) | | | (0.2) | | | (378) | | | (0.7) | |
| Increase in net income before taxes | $ | 648 | | | 1.2 | % | | $ | 2,471 | | | 4.7 | % | | $ | 2,040 | | | 3.9 | % | | $ | 8,821 | | | 16.7 | % |
| Increase in basic and diluted earnings per share | $ | 0.01 | | | | | $ | 0.05 | | | | | $ | 0.04 | | | | | $ | 0.18 | | | |
| | Nine months ended September 30, 2024 |
| Effect on earnings: | | | | | | | | | | | | | | | |
| Increase in pre-tax net income before impact of derivative settlements | $ | 1,834 | | | 1.2 | % | | $ | 7,427 | | | 4.9 | % | | $ | 5,094 | | | 3.4 | % | | $ | 22,227 | | | 14.8 | % |
| Impact of derivative settlements | 2,246 | | | 1.5 | | | 6,738 | | | 4.5 | | | (2,246) | | | (1.5) | | | (6,738) | | | (4.5) | |
| Increase in net income before taxes | $ | 4,080 | | | 2.7 | % | | $ | 14,165 | | | 9.4 | % | | $ | 2,848 | | | 1.9 | % | | $ | 15,489 | | | 10.3 | % |
| Increase in basic and diluted earnings per share | $ | 0.08 | | | | | $ | 0.29 | | | | | $ | 0.06 | | | | | $ | 0.32 | | | |
| | Nine months ended September 30, 2023 |
| Effect on earnings: | | | | | | | | | | | | | | | |
| Increase in pre-tax net income before impact of derivative settlements | $ | 2,006 | | | 1.8 | % | | $ | 9,525 | | | 8.4 | % | | $ | 2,556 | | | 2.2 | % | | $ | 16,611 | | | 14.6 | % |
| Impact of derivative settlements (a) | 159 | | | 0.1 | | | 477 | | | 0.4 | | | (159) | | | (0.1) | | | (477) | | | (0.4) | |
| Increase in net income before taxes | $ | 2,165 | | | 1.9 | % | | $ | 10,002 | | | 8.8 | % | | $ | 2,397 | | | 2.1 | % | | $ | 16,134 | | | 14.2 | % |
| Increase in basic and diluted earnings per share | $ | 0.04 | | | | | $ | 0.20 | | | | | $ | 0.05 | | | | | $ | 0.33 | | | |
(a)On March 15, 2023, the Company terminated its derivative portfolio hedging loans earning fixed rate floor income. The table above excludes the impact of these derivatives for the entire period.
| | | | | | | | | | | | | | | | | | | | | | | | | | | | | | | | | | | | | | | | | | | | | | | | | | | | | | | |
| | Asset and funding index mismatches |
| Increase of
10 basis points | | Increase of
30 basis points | | Increase of
10 basis points | | Increase of
30 basis points | | | | |
| | Dollars | | Percent | | Dollars | | Percent | | Dollars | | Percent | | Dollars | | Percent | | | | | | | | |
| | Three months ended September 30, 2024 | | Three months ended September 30, 2023 | | | | | | | | |
| Effect on earnings: | | | | | | | | | | | | | | | | | | | | | | | |
| Decrease in pre-tax net income before impact of derivative settlements | $ | (819) | | | (36.8) | % | | $ | (2,457) | | | (110.5) | % | | $ | (1,167) | | | (2.2) | % | | $ | (3,501) | | | (6.6) | % | | | | | | | | |
| Impact of derivative settlements | 352 | | | 15.8 | | | 1,056 | | | 47.5 | | | 794 | | | 1.5 | | | 2,382 | | | 4.5 | | | | | | | | | |
| Decrease in net income before taxes | $ | (467) | | | (21.0) | % | | $ | (1,401) | | | (63.0) | % | | $ | (373) | | | (0.7) | % | | $ | (1,119) | | | (2.1) | % | | | | | | | | |
| Decrease in basic and diluted earnings per share | $ | (0.01) | | | | | $ | (0.03) | | | | | $ | (0.01) | | | | | $ | (0.02) | | | | | | | | | | | |
| | | | | | | | | | | | | | | | | | | | | | | |
| | | | | | | | | | | | | | | | | | | | | | | |
| | | | | | | | | | | | | | | | | | | | | | | |
| | | | | | | | | | | | | | | | | | | | | | | |
| | | | | | | | | | | | | | | | | | | | | | | |
| | | | | | | | | | | | | | | | | | | | | | | |
| | Nine months ended September 30, 2024 | | Nine months ended September 30, 2023 | | | | | | | | |
| Effect on earnings: | | | | | | | | | | | | | | | | | | | | | | | |
| Decrease in pre-tax net income before impact of derivative settlements | $ | (2,714) | | | (1.8) | % | | $ | (8,140) | | | (5.4) | % | | $ | (3,462) | | | (3.0) | % | | $ | (10,387) | | | (9.1) | % | | | | | | | | |
| Impact of derivative settlements | 1,483 | | | 1.0 | | | 4,449 | | | 3.0 | | | 2,356 | | | 2.1 | | | 7,068 | | | 6.2 | | | | | | | | | |
| Decrease in net income before taxes | $ | (1,231) | | | (0.8) | % | | $ | (3,691) | | | (2.4) | % | | $ | (1,106) | | | (0.9) | % | | $ | (3,319) | | | (2.9) | % | | | | | | | | |
| Decrease in basic and diluted earnings per share | $ | (0.03) | | | | | $ | (0.08) | | | | | $ | (0.02) | | | | | $ | (0.07) | | | | | | | | | | | |
| | | | | | | | | | | | | | | | | | | | | | | |
| | | | | | | | | | | | | | | | | | | | | | | |
| | | | | | | | | | | | | | | | | | | | | | | |
| | | | | | | | | | | | | | | | | | | | | | | |
| | | | | | | | | | | | | | | | | | | | | | | |
| | | | | | | | | | | | | | | | | | | | | | | |
Interest Rate Risk - Nelnet Bank
To manage Nelnet Bank's risk from fluctuations in market interest rates, the Company actively monitors interest rates and other interest sensitive components to minimize the impact that changes in interest rates have on the fair value of assets, net income, and cash flow. To achieve this objective, the Company manages and mitigates Nelnet Bank’s exposure to fluctuations in market interest rates through several techniques, including managing the maturity, repricing, and mix of fixed and variable rate assets and liabilities and the use of derivative instruments.
The following table presents Nelnet Bank's loan assets, asset-backed security investments, and deposits (including intercompany deposits) by rate characteristics:
| | | | | | | | | | | | | | | | | | | | | | | |
| | As of September 30, 2024 | | As of December 31, 2023 |
| | Dollars | | Percent | | Dollars | | Percent |
| Fixed-rate loan assets | $ | 553,025 | | | | | $ | 424,284 | | | |
| Fixed-rate investments | 99,903 | | | | | 34,644 | | | |
| Total fixed-rate assets | 652,928 | | | 53.0 | % | | 458,928 | | | 47.7 | % |
| Variable-rate loan assets | 6,847 | | | | | 8,588 | | | |
| Variable-rate investments | 571,102 | | | | | 495,004 | | | |
| Total variable rate assets | 577,949 | | | 47.0 | | | 503,592 | | | 52.3 | |
| Total assets | $ | 1,230,877 | | | 100.0 | % | | $ | 962,520 | | | 100.0 | % |
| | | | | | | |
| Fixed-rate deposits | $ | 325,127 | | | 28.3 | % | | $ | 280,736 | | | 33.1 | % |
| Variable-rate deposits (a) | 823,339 | | | 71.7 | | | 566,828 | | | 66.9 | |
| Total deposits | $ | 1,148,466 | | | 100.0 | % | | $ | 847,564 | | | 100.0 | % |
(a) Nelnet Bank uses derivative instruments to hedge exposure to variability in cash flows of variable rate deposits to minimize the exposure to volatility in cash flows from future changes in interest rates. The derivatives are not reflected in the above table. See note 5 of the notes to consolidated financial statements included under Part I, Item 1 of this report for a summary of Nelnet Bank's derivatives outstanding as of September 30, 2024.
Interest Rate and Market Risk - Investments
The following table presents the rates earned on the Company’s available-for-sale debt securities (investments) and debt facilities used to fund a portion of such investments. The table below excludes securities (investments) held by Nelnet Bank.
| | | | | | | | | | | | | | | | | | | | | | | | | | | | | | | | | | | |
| Average balance | | Interest income/ expense | | Average yields/ rates | | Average balance | | Interest income/ expense | | Average yields/ rates |
| Three months ended September 30, |
| 2024 | | 2023 |
| Investments: | | | | | | | | | | | |
| Asset-backed securities available-for-sale (a) (b) | $ | 818,421 | | | 11,502 | | | 5.58 | % | | $ | 887,549 | | | 11,448 | | | 5.12 | % |
| | | | | | | | | | | |
| Debt funding asset-backed securities available-for-sale: | | | | | | | | | | | |
| Participation agreement - variable rate (c) | $ | 100 | | | 2 | | | 6.16 | % | | $ | 3,603 | | | 54 | | | 5.95 | % |
| Repurchase agreements - variable rate (d) | 108,933 | | | 1,780 | | | 6.48 | | | 336,523 | | | 5,607 | | | 6.61 | |
| $ | 109,033 | | | 1,782 | | | 6.48 | | | $ | 340,126 | | | 5,661 | | | 6.60 | |
| | | | | | | | | | | |
| Nine months ended September 30, |
| 2024 | | 2023 |
| | | | | | | | | | | |
| Investments: | | | | | | | | | | | |
| Asset-backed securities available-for-sale (a) (b) | $ | 836,400 | | | 39,612 | | | 6.31 | % | | $ | 1,018,489 | | | 44,058 | | | 5.78 | % |
| | | | | | | | | | | |
| Debt funding asset-backed securities available-for-sale: | | | | | | | | | | | |
| Participation agreement - variable rate (c) | $ | 3,841 | | | 177 | | | 6.14 | % | | $ | 154,295 | | | 6,206 | | | 5.38 | % |
| Repurchase agreements - variable rate (d) | 120,977 | | | 6,039 | | | 6.65 | | | 421,266 | | | 18,654 | | | 5.92 | |
| $ | 124,818 | | | 6,216 | | | 6.63 | | | $ | 575,561 | | | 24,860 | | | 5.77 | |
(a) The Company has repurchased certain of its own asset-backed securities (bonds and notes payable) in the secondary market. For accounting purposes, these notes are eliminated in consolidation and are not included in the Company's consolidated financial statements. However, these securities remain legally outstanding at the trust level and the Company could sell these notes to third parties or redeem the notes at par as cash is generated by the trust estate. Upon a sale of these notes to third parties, the Company would obtain cash proceeds equal to the market value of the notes on the date of such sale. The table above includes these repurchased bonds.
(b) The majority of the Company’s asset-backed securities earn floating rates with expected returns of approximately SOFR + 100 to 350 basis points to maturity. As of September 30, 2024, $206.9 million (par value) of the Company’s asset-backed securities earn a weighted average fixed rate of 3.32%.
(c) Interest incurred by the Company on amounts borrowed under the participation agreement is at a variable rate of SOFR + 62.5 basis points.
(d) Interest incurred by the Company on amounts borrowed under repurchase agreements is at a variable rate of SOFR + 100 to 140 basis points.
The Company’s portfolio of asset-backed investment securities has limited liquidity, and the Company could incur a significant loss if the investments were sold prior to maturity at an amount less than the original purchase price. As of September 30, 2024, the gross unrealized loss on the Company’s available-for-sale debt securities was $23.3 million, and the aggregate fair value of available-for-sale debt securities with unrealized losses was $367.0 million. The Company currently has the intent and ability to retain these investments, and none of the unrealized losses were due to credit losses. See note 6 of the notes to consolidated financial statements included under Part I, Item 1 of this report for additional information.
ITEM 4. CONTROLS AND PROCEDURES
Disclosure Controls and Procedures
The Company’s management, with the participation of the Company's principal executive and principal financial officers, evaluated the effectiveness of the Company’s disclosure controls and procedures (as defined in Rules 13a-15(e) and 15d-15(e) under the Securities Exchange Act of 1934) as of September 30, 2024. Based on this evaluation, the Company’s principal executive and principal financial officers concluded that the Company's disclosure controls and procedures were effective as of September 30, 2024.
Changes in Internal Control over Financial Reporting
There were no changes in the Company’s internal control over financial reporting during the fiscal quarter ended September 30, 2024 that have materially affected, or are reasonably likely to materially affect, the Company’s internal control over financial reporting.
PART II. OTHER INFORMATION
ITEM 1. LEGAL PROCEEDINGS
There have been no material changes from the information referred to in the Legal Proceedings section of the Company's Annual Report on Form 10-K for the year ended December 31, 2023 under Part I, Item 3 of such Form 10-K.
ITEM 1A. RISK FACTORS
There have been no material changes from the risk factors described in the Company's Annual Report on Form 10-K for the year ended December 31, 2023 in response to Part I, Item 1A of such Form 10-K.
ITEM 2. UNREGISTERED SALES OF EQUITY SECURITIES AND USE OF PROCEEDS
Stock Repurchases
The following table summarizes the repurchases of Class A common stock during the third quarter of 2024 by the Company or any “affiliated purchaser” of the Company, as defined in Rule 10b-18(a)(3) under the Securities Exchange Act of 1934.
| | | | | | | | | | | | | | | | | | | | | | | | | | |
| Period | | Total number of shares purchased (a) | | Average price paid per share (b) | | Total number of shares purchased as part of publicly announced plans or programs (c) | | Maximum number of shares that may yet be purchased under the plans or programs (c) |
| July 1 - July 31, 2024 | | 139 | | | $ | 101.84 | | | — | | | 3,341,735 | |
| August 1 - August 31, 2024 | | — | | | — | | | — | | | 3,341,735 | |
| September 1 - September 30, 2024 | | 5,120 | | | 109.83 | | | — | | | 3,341,735 | |
| Total | | 5,259 | | | $ | 109.62 | | | — | | | |
(a) The total number of shares includes shares owned and tendered by employees to satisfy tax withholding obligations upon the vesting of restricted shares. Unless otherwise indicated, shares owned and tendered by employees to satisfy tax withholding obligations were purchased at the closing price of the Company’s shares on the date of vesting.
(b) The average price of shares repurchased excludes excise taxes.
(c) On May 9, 2022, the Company announced that its Board of Directors authorized a stock repurchase program to repurchase up to a total of five million shares of the Company's Class A common stock during the three-year period ending May 8, 2025.
Working capital and dividend restrictions/limitations
The Company's $495.0 million unsecured line of credit, which is available through September 22, 2026, imposes restrictions on the payment of dividends through covenants requiring a minimum consolidated net worth and a minimum level of unencumbered cash, cash equivalent investments, and available borrowing capacity under the line of credit. In addition, trust indentures and other financing agreements governing debt issued by the Company's lending subsidiaries generally have limitations on the amounts of funds that can be transferred to the Company by its subsidiaries through cash dividends at certain times. Further, Nelnet Bank is subject to laws and regulations that restrict the ability of Nelnet Bank to pay dividends to the Company, and authorize regulatory authorities to prohibit or limit the payment of dividends by Nelnet Bank to the Company. These provisions do not currently materially limit the Company's ability to pay dividends, and, based on the Company's current financial condition and recent results of operations, the Company does not currently anticipate that these provisions will materially limit the future payment of dividends.
ITEM 5. OTHER INFORMATION
Rule 10b5-1 Trading Plans
The following table describes contracts, instructions, or written plans for the purchase or sale of the Company's securities adopted by the Company's directors or executive officers during the third quarter of 2024, each of which is intended to satisfy the affirmative defense conditions of Rule 10b5-1(c), referred to as Rule 10b5-1 trading plans.
| | | | | | | | | | | | | | | | | | | | |
| Name and Title | | Date of Adoption of Rule 10b5-1 Trading Plan | | Scheduled Expiration Date of Rule 10b5-1 Trading Plan (a) | | Aggregate Number of Securities to Be Purchased or Sold |
William J. Munn Corporate Secretary / Chief Governance Officer / General Counsel | | 8/13/2024 | | 12/11/2024 | | Gift transfer of 100 shares of Class A common stock |
William J. Munn Corporate Secretary / Chief Governance Officer / General Counsel | | 8/15/2024 | | 8/15/2025 | | Sale of 2,500 shares of Class A common stock |
| | | | | | |
Jona M. Van Deun Director | | 8/16/2024 | | 12/14/2024 | | Sale of 440 shares of Class A common stock |
(a) A trading plan may also expire on such earlier date as all transactions under the trading plan are completed.
As previously disclosed, on August 2, 2024, William J. Munn, Corporate Secretary, Chief Governance Officer, and General Counsel, terminated a Rule 10b5-1 Trading Plan he had adopted on May 16, 2024 with respect to the gift of 100 shares of the Company's Class A common stock. Such Rule 10b5-1 Trading Plan was set to expire on September 15, 2024. As of the date of termination of such Rule 10b5-1 Trading Plan, no shares of Class A common stock had been gifted. Such Rule 10b5-1 Trading Plan was terminated due to an administrative error in the original adoption of the plan.
ITEM 6. EXHIBITS
| | | | | |
| 31.1* | |
| |
| 31.2* | |
| |
| 32** | |
| |
| 101.INS* | Inline XBRL Instance Document - the instance document does not appear in the Interactive Data File because its XBRL tags are embedded within the Inline XBRL document. |
| |
| 101.SCH* | Inline XBRL Taxonomy Extension Schema Document. |
| |
| 101.CAL* | Inline XBRL Taxonomy Extension Calculation Linkbase Document. |
| |
| 101.DEF* | Inline XBRL Taxonomy Extension Definition Linkbase Document. |
| |
| 101.LAB* | Inline XBRL Taxonomy Extension Label Linkbase Document. |
| |
| 101.PRE* | Inline XBRL Taxonomy Extension Presentation Linkbase Document. |
| |
| 104* | Cover Page Interactive Data File (formatted as Inline XBRL and contained in Exhibit 101). |
| | | | | |
| * | Filed herewith |
| ** | Furnished herewith |
| |
| |
| |
| |
| |
| |
| |
| |
SIGNATURES
Pursuant to the requirements of the Securities Exchange Act of 1934, the registrant has duly caused this report to be signed on its behalf by the undersigned thereunto duly authorized.
| | | | | | | | | | | | | | |
| | | NELNET, INC. | |
| | | | | |
| Date: | November 7, 2024 | By: | /s/ JEFFREY R. NOORDHOEK | |
| | | Name: | Jeffrey R. Noordhoek | |
| | | Title: | Chief Executive Officer Principal Executive Officer | |
| | | | | |
| | | | | | | | | | | | | | |
| Date: | November 7, 2024 | By: | /s/ JAMES D. KRUGER | |
| | Name: | James D. Kruger | |
| | | Title: | Chief Financial Officer Principal Financial Officer and Principal Accounting Officer | |