UNITED STATES SECURITIES AND EXCHANGE COMMISSION
Washington, D.C. 20549
FORM 10-K
(Mark One)
| | | | | | | | |
| ☒ | | ANNUAL REPORT PURSUANT TO SECTION 13 OR 15(d) OF THE SECURITIES EXCHANGE ACT OF 1934 |
For the fiscal year ended December 31, 2024
or | | | | | | | | |
| ☐ | | TRANSITION REPORT PURSUANT TO SECTION 13 OR 15(d) OF THE SECURITIES EXCHANGE ACT OF 1934 |
For the transition period from __________ to __________
Commission file number 001-34018
GRAN TIERRA ENERGY INC.
(Exact name of registrant as specified in its charter)
| | | | | | | | | | | | | | | | | |
| Delaware | | 98-0479924 |
| (State or other jurisdiction of incorporation or organization) | | (I.R.S. Employer Identification No.) |
| 500 Centre Street S.E. |
| Calgary, | Alberta | Canada | T2G 1A6 | |
| (Address of principal executive offices, including zip code) |
(403) 265-3221
(Registrant’s telephone number, including area code)
Securities registered pursuant to Section 12(b) of the Act: | | | | | | | | |
| Title of each class | Trading Symbol(s) | Name of each exchange on which registered |
| Common Stock, par value $0.001 per share | GTE | NYSE American |
| Toronto Stock Exchange |
| London Stock Exchange |
Securities Registered Pursuant to Section 12(g) of the Act: None
Indicate by check mark if the registrant is a well-known seasoned issuer, as defined in Rule 405 of the Securities Act.
Yes ☐ No ☒
Indicate by check mark if the registrant is not required to file reports pursuant to Section 13 or Section 15(d) of the Act.
Yes ☐ No ☒
Indicate by check mark whether the registrant (1) has filed all reports required to be filed by Section 13 or 15(d) of the Securities Exchange Act of 1934 during the preceding 12 months (or for such shorter period that the registrant was required to file such reports), and (2) has been subject to such filing requirements for the past 90 days. Yes ☒ No ☐
Indicate by check mark whether the registrant submitted electronically every Interactive Data File required to be submitted pursuant to Rule 405 of Regulation S-T (§ 232.405 of this chapter) during the preceding 12 months (or for such shorter period that the registrant was required to submit such files).
Yes ☒ No ☐
Indicate by check mark whether the registrant is a large accelerated filer, an accelerated filer, a non-accelerated filer, or a smaller reporting company or an emerging growth company. See the definitions of “large accelerated filer,” “accelerated filer”, “smaller reporting company” and “emerging growth company” in Rule 12b-2 of the Exchange Act.
| | | | | | | | | | | |
| Large accelerated filer | ☐ | Accelerated filer | ☒ |
| Non-accelerated filer | ☐ | Smaller reporting company | ☐ |
| | Emerging growth company | ☐ |
If an emerging growth company, indicate by check mark if the registrant has elected not to use the extended transition period for complying with any new or revised financial accounting standards provided pursuant to Section 13(a) of the Exchange
Act. ☐
Indicate by check mark whether the registrant has filed a report on and attestation to its management’s assessment of the
effectiveness of its internal control over financial reporting under Section 404(b) of the Sarbanes-Oxley Act (15 U.S.C. 7262(b)) by the registered public accounting firm that prepared or issued its audit report. ☒
If securities are registered pursuant to Section 12(b) of the Act, indicate by check mark whether the financial statements of the registrant included in the filing reflect the correction of an error to previously issued financial statements. ☒
Indicate by check mark whether any of those error corrections are restatements that required a recovery analysis of incentive-based compensation received by any of the registrant’s executive officers during the relevant recovery period pursuant
to §240.10D-1(b). ☐
Indicate by check mark whether the registrant is a shell company (as defined in Rule 12b-2 of the Act). Yes ☐ No ☒
The aggregate market value of the voting and non-voting common equity held by non-affiliates as of June 30, 2024, the last business day of the registrant’s most recently completed second fiscal quarter, was approximately $291.5 million.
On February 20, 2025, 35,888,773 shares of the registrant’s Common Stock with $0.001 par value were outstanding.
DOCUMENTS INCORPORATED BY REFERENCE
The information required by Part III of this report, to the extent not set forth herein, is incorporated by reference from the registrant’s definitive proxy statement relating to the 2025 annual meeting of stockholders, which definitive proxy statement will be filed with the Securities and Exchange Commission within 120 days after December 31, 2024.
Auditor Name: KPMG LLP Auditor Location: Calgary, Canada Auditor Firm ID: 85
Gran Tierra Energy Inc.
Annual Report on Form 10-K
Year Ended December 31, 2024
Table of Contents
| | | | | | | | |
| | | Page |
| PART I | | |
| Items 1 and 2. | Business and Properties | |
| Item 1A. | Risk Factors | |
| Item 1B. | Unresolved Staff Comments | |
| Item 1C. | Cybersecurity | |
| Item 3. | Legal Proceedings | |
| Item 4. | Mine Safety Disclosures | |
| | |
| PART II | | |
| Item 5. | Market for Registrant's Common Equity, Related Stockholder Matters and Issuer Purchases of Equity Securities | |
| Item 6. | [Reserved] | |
| Item 7. | Management's Discussion and Analysis of Financial Condition and Results of Operations | |
| Item 7A. | Quantitative and Qualitative Disclosures About Market Risk | |
| Item 8. | Financial Statements and Supplementary Data | |
| Item 9. | Changes in and Disagreements with Accountants on Accounting and Financial Disclosure | |
| Item 9A. | Controls and Procedures | |
| Item 9B. | Other Information | |
| Item 9C. | Disclosure Regarding Foreign Jurisdictions that Prevent Inspections | |
| | | |
| PART III | | |
| Item 10. | Directors, Executive Officers and Corporate Governance | |
| Item 11. | Executive Compensation | |
| Item 12. | Security Ownership of Certain Beneficial Owners and Management and Related Stockholder Matters | |
| Item 13. | Certain Relationships and Related Transactions, and Director Independence | |
| Item 14. | Principal Accounting Fees and Services | |
| | |
| PART IV | | |
| Item 15. | Exhibits, Financial Statement Schedules | |
| Item 16. | Form 10-K Summary | |
| | |
| SIGNATURES | |
CAUTIONARY LANGUAGE REGARDING FORWARD-LOOKING STATEMENTS
This Annual Report on Form 10-K includes forward-looking statements within the meaning of Section 27A of the Securities Act of 1933, as amended (the “Securities Act”), and Section 21E of the Securities Exchange Act of 1934, as amended (the “Exchange Act”). All statements other than statements of historical facts included in this Annual Report on Form 10-K regarding our financial position, estimated quantities and net present values of reserves, business strategy, plans and objectives of our management for future operations, covenant compliance, capital spending plans and benefits of the changes in our capital program or expenditures, our liquidity and financial condition and those statements preceded by, followed by or that otherwise include the words “believe”, “expect”, “anticipate”, “intend”, “estimate”, “project”, “target”, “goal”, “plan”, “budget”, “objective”, “should”, “outlook” or similar expressions or variations on these expressions are forward-looking statements. We can give no assurances that the assumptions upon which the forward-looking statements are based will prove to be correct or that, even if correct, intervening circumstances will not occur to cause actual results to be different than expected. Because forward-looking statements are subject to risks and uncertainties, actual results may differ materially from those expressed or implied by the forward-looking statements. There are a number of risks, uncertainties and other important factors that could cause our actual results to differ materially from the forward-looking statements, including, but not limited to, our ability to successfully integrate the assets and operations of i3 Energy Plc (“i3Energy”) and realize the anticipated benefits and operating synergies expected from the acquisition of i3 Energy; certain our operations are located in South America and unexpected problems can arise due to guerilla activity, strikes, local blockades or protests; technical difficulties and operational difficulties may arise which impact the production, transport or sale of our products; other disruptions to local operations; global health events; global and regional changes in the demand, supply, prices, differentials or other market conditions affecting oil and natural gas, including inflation and changes resulting from a global health crisis, geopolitical events, including the ongoing conflicts in Ukraine and the Gaza region, or from the imposition or lifting of crude oil production quotas or other actions that might be imposed by OPEC, and other producing countries and the resulting company or third-party actions in response to such changes; changes in commodity prices, including volatility or a prolonged decline in these prices relative to historical or future expected levels; the risk that current global economic and credit conditions may impact oil prices and oil consumption more than we currently predict which could cause further modification of our strategy and capital spending program; prices and markets for oil and natural gas are unpredictable and volatile; the effect of hedges; the accuracy of productive capacity of any particular field; geographic, political and weather conditions can impact the production, transport or sale of our products; our ability to execute our business plan, which may include acquisitions and realize expected benefits from current or future initiatives; the risk that unexpected delays and difficulties in developing currently owned properties may occur; the ability to replace reserves and production and develop and manage reserves on an economically viable basis; the accuracy of testing and production results and seismic data, pricing and cost estimates (including with respect to commodity pricing and exchange rates); the risk profile of planned exploration activities; the effects of drilling down-dip; the effects of waterflood and multi-stage fracture stimulation operations; the extent and effect of delivery disruptions, equipment performance and costs; actions by third parties; the timely receipt of regulatory or other required approvals for our operating activities; the failure of exploratory drilling to result in commercial wells; unexpected delays due to the limited availability of drilling equipment and personnel; volatility or declines in the trading price of our common stock or bonds; the risk that we do not receive the anticipated benefits of government programs, including government tax refunds; our ability to access debt or equity capital markets from time to time to raise additional capital, increase liquidity, fund acquisitions or refinance debt; our ability to comply with financial covenants in our indentures and make borrowings under any future credit agreement; and those factors set out in Part I, Item 1A “Risk Factors” in this Annual Report on Form 10-K. The information included herein is given as of the filing date of this Annual Report on Form 10-K with the Securities and Exchange Commission (“SEC”) and, except as otherwise required by the securities laws, we disclaim any obligation or undertaking to publicly release any updates or revisions to, or to withdraw, any forward-looking statement contained in this Annual Report on Form 10-K to reflect any change in our expectations with regard thereto or any change in events, conditions or circumstances on which any forward-looking statement is based.
GLOSSARY OF OIL AND GAS TERMS
In this report, the abbreviations set forth below have the following meanings:
| | | | | | | | | | | |
| bbl | barrel | Mcf | thousand cubic feet |
| Mbbl | thousand barrels | MMcf | million cubic feet |
| MMbbl | million barrels | Bcf | billion cubic feet |
| BOE | barrels of oil equivalent | BOPD | barrels of oil per day |
| MMBOE | million barrels of oil equivalent | NAR | net after royalty |
| BOEPD | barrels of oil equivalent per day | NGL | natural gas liquids |
Sales volumes represent production NAR adjusted for inventory changes and losses. Our oil and natural gas reserves are reported NAR. Our production is also reported NAR, except as otherwise specifically noted as “working interest production
before royalties”. Natural gas volumes are converted to BOE at the rate of 6 Mcf of natural gas per bbl of oil, based upon the approximate relative energy content of gas and oil. The rate is not necessarily indicative of the relationship between oil and natural gas prices. BOEs may be misleading, particularly if used in isolation. A BOE conversion ratio of 6 Mcf:1 bbl is based on an energy equivalency conversion method primarily applicable at the burner tip and does not represent a value equivalency at the wellhead.
Below are explanations of some commonly used terms in the oil and natural gas business and in this report.
Developed acres. The number of acres that are allocated or assignable to producing wells or wells capable of production.
Development well. A well drilled within the proved area of an oil or natural gas reservoir to the depth of a stratigraphic horizon known to be productive.
Dry hole. Exploratory or development well that does not produce oil or natural gas in commercial quantities.
Exploitation activities. The process of the recovery of fluids from reservoirs and drilling and development of oil and natural gas reserves.
Exploration well. An exploration well is a well drilled to find a new field or new reservoir in a field previously found to be productive of oil or natural gas in another reservoir. Generally, an exploratory well is any well that is not a development well, an extension well, a service well, or a stratigraphic test well.
Field. An area consisting of a single reservoir or multiple reservoirs all grouped on or related to the same individual geological structural feature and/or stratigraphic condition.
Gross acres or gross wells. The total acres or wells in which we own a working interest.
Net acres or net wells. The sum of the fractional working interests we own in gross acres or gross wells expressed as whole numbers and fractions of whole numbers.
Possible reserves. Possible reserves are those additional reserves that are less certain to be recovered than probable reserves. The SEC provides a complete definition of possible reserves in Rule 4-10(a)(17) of Regulation S-X.
Probable reserves. Probable reserves are those additional reserves that are less certain to be recovered than proved reserves but that, together with proved reserves, are as likely as not to be recovered. The SEC provides a complete definition of probable reserves in Rule 4-10(a)(18) of Regulation S-X.
Productive well. A well that is found to be capable of producing hydrocarbons in sufficient quantities such that proceeds from the sale of such production exceed production expenses and taxes.
Proved developed reserves. In general, reserves that can be expected to be recovered from existing wells with existing equipment and operating methods. The SEC provides a complete definition of developed oil and natural gas reserves in Rule 4-10(a)(6) of Regulation S-X.
Proved reserves. Those quantities of oil and natural gas, which, by analysis of geoscience and engineering data, can be estimated with reasonable certainty to be economically producible from a given date forward, from known reservoirs and under existing economic conditions, operating methods and government regulations prior to the time at which contracts providing the right to operate expire, unless evidence indicates that renewal is reasonably certain, regardless of whether deterministic or probabilistic methods are used for the estimation. The project to extract the hydrocarbons must have commenced or the operator must be reasonably certain that it will commence the project within a reasonable time.
(i)The area of the reservoir considered as proved includes:
(A)The area identified by drilling and limited by fluid contacts, if any, and
(B)Adjacent undrilled portions of the reservoir that can, with reasonable certainty, be judged to be continuous with it and to contain economically producible oil or natural gas on the basis of available geoscience and engineering data.
(ii)In the absence of data on fluid contacts, proved quantities in a reservoir are limited by the lowest known hydrocarbons (“LKH”) as seen in a well penetration unless geoscience, engineering, or performance data and reliable technology establishes a lower contact with reasonable certainty.
(iii)Where direct observation from well penetrations has defined a highest known oil (“HKO”) elevation and the potential exists for an associated natural gas cap, proved oil reserves may be assigned in the structurally higher portions of the reservoir only if geoscience, engineering, or performance data and reliable technology establish the higher contact with reasonable certainty.
(iv)Reserves which can be produced economically through the application of improved recovery techniques (including, but not limited to, fluid injection) are included in the proved classification when:
(A)Successful testing by a pilot project in an area of the reservoir with properties no more favorable than in the reservoir as a whole, the operation of an installed program in the reservoir or an analogous reservoir, or other evidence using reliable technology establishes the reasonable certainty of the engineering analysis on which the project or program was based; and
(B)The project has been approved for development by all necessary parties and entities, including governmental entities.
(v)Existing economic conditions include prices and costs at which economic producibility from a reservoir is to be determined. The price shall be the average price during the 12-month period prior to the ending date of the period covered by the report, determined as an unweighted arithmetic average of the first-day-of-the month price for each month within such period, unless prices are defined by contractual arrangements, excluding escalations based upon future conditions.
Proved undeveloped reserves. In general, reserves that are expected to be recovered from new wells on undrilled acreage or from existing wells where a relatively major expenditure is required for recompletion. The SEC provides a complete definition of undeveloped oil and natural gas reserves in Rule 4-10(a)(31) of Regulation S-X.
Reserves. Reserves are estimated remaining quantities of oil and natural gas and related substances anticipated to be economically producible, as of a given date, by application of development projects to known accumulations. In addition, there must exist, or there must be a reasonable expectation that there will exist, the legal right to produce or a revenue interest in the production, installed means of delivering oil and natural gas or related substances to market, and all permits and financing required to implement the project.
Undeveloped acreage. Lease acreage on which wells have not been drilled or completed to a point that would permit the production of economic quantities of oil and natural gas regardless of whether such acreage contains proved reserves.
Working interest. The operating interest that gives the owner the right to drill, produce and conduct operating activities on the property and a share of production and requires the owner to pay a share of the costs of drilling and production operations.
PART I
Items 1 and 2. Business and Properties
General
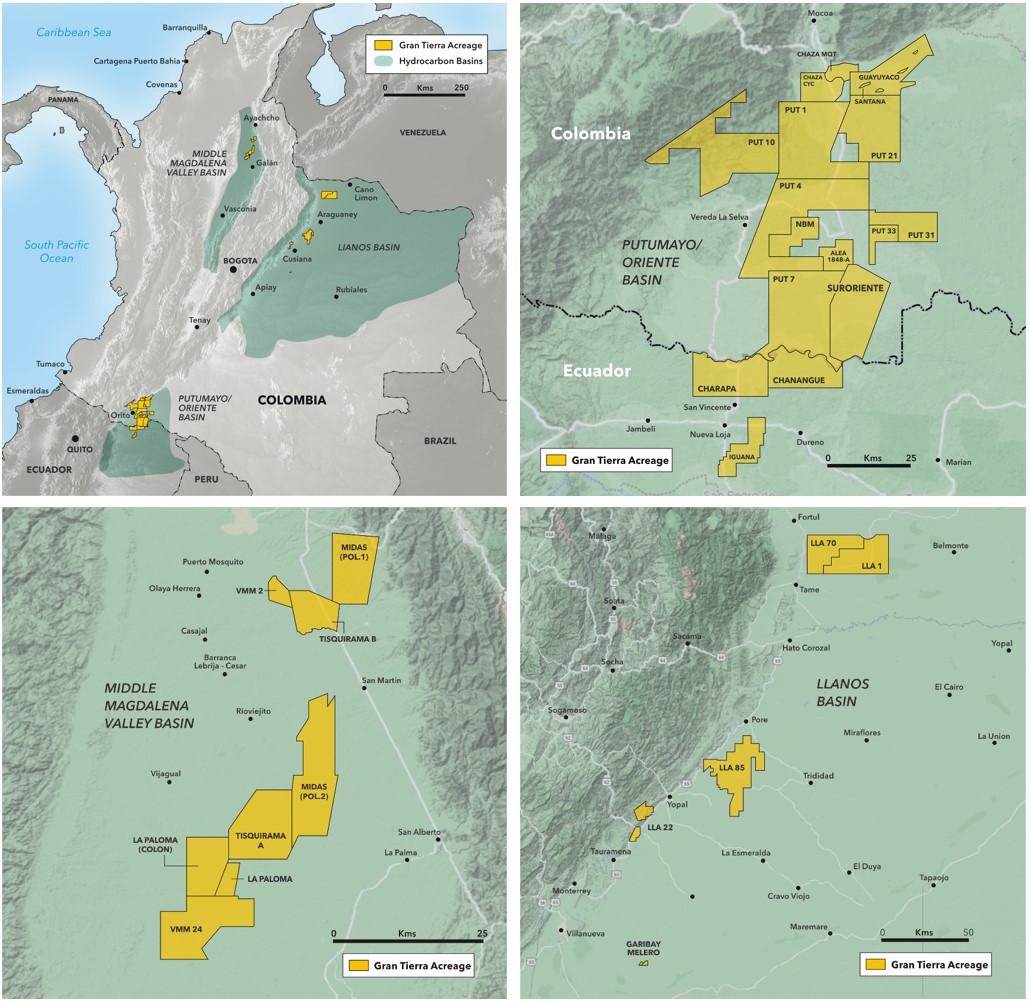
Gran Tierra Energy Inc., together with its subsidiaries (“Gran Tierra”, “the Company”, “us”, “our”, or “we”), is a company focused on oil and gas exploration and production, with assets in Colombia, Canada and Ecuador. Our Colombian properties represented 47%, our Canadian properties represented 46% and our Ecuadorian properties represented 7% of our proved reserves NAR at December 31, 2024 and for the year ended December 31, 2024, 93% (2023 - 97%, 2022 -100%) of our revenue was generated in Colombia, 3% of our revenue was generated in Canada (2023 and 2022 - nil) and 4% (2023 - 3%, 2022 - nil) of our revenue was generated in Ecuador.
We were incorporated under the laws of the State of Nevada in June 2003 and changed our state of incorporation to the State of Delaware in October 2016.
All dollar ($) amounts referred to in this Annual Report on Form 10-K are United States (U.S.) dollars, unless otherwise indicated.
On May 5, 2023, the Company completed a 1-for-10 reverse stock split of the Company’s Common Stock. As a result of the reverse stock split, every ten of the Company’s issued shares of Common Stock were automatically combined into one issued share of Common Stock, without any change to the par value per share. All share and per share numbers in this Annual Report on Form 10-K have been adjusted to reflect the reverse stock split.
2024 Operational Highlights
During the year ended December 31, 2024, we drilled 30 wells (23 development, and seven exploration), 14 in Colombia, nine in Canada (six net) and seven in Ecuador and incurred capital expenditures of $234.2 million, of which $141.6 million were incurred in Colombia, $79.4 million in Ecuador and $12.5 million in Canada with remainder comprised of administrative assets incurred by the corporate entity.
We drilled seven development and one water injector wells in Midas Block and three development and three water injector wells in Chaza Block in Colombia, seven exploration wells in Ecuador and nine gross (six net) development wells in Canada. As at December 31, 2024, of the development wells drilled during the year, seven (four net) were in-progress and the remainder were producing.
2025 Outlook
Our Colombian, Canadian and Ecuadorian development operations are expected to represent approximately 52%, 37% and 11% of our 2025 production.
The table below shows the break-down of our 2025 capital program:
| | | | | | | | | | | | | | | | | |
| Number of Wells
(Gross) | | Number of Wells
(Net) | | 2025 Capital Budget ($ million) |
| Development - Colombia | 4 - 6 | | 2 - 3 | | 105 - 120 |
| Development - Ecuador | 2 | | 2 | | 35 - 45 |
| Development - Canada | 4 - 6 | | 2 - 3 | | 35 - 45 |
| Exploration, Colombia and Ecuador | 6 - 8 | | 6 - 8 | | 65 - 70 |
| 16 - 22 | | 12 - 16 | | 240 - 280 |
Our base capital program for 2025 is $240 million to $280 million for exploration and development activities. Based on the mid-point of the 2025 guidance, the capital budget is forecasted to be approximately 75% directed to development activities and 25% directed to exploration activities. Approximately 30% of the development activities included in the 2025 capital program are expected to be directed to facilities to support future production growth and enhance recovery factors.
We expect our 2025 capital program to be fully funded by cash flows from operations. Funding this program from cash flows from operations relies in part on average Brent oil prices of $75.00 per boe, WTI oil prices of $71.00 per boe and average AECO natural gas prices of C$2.50 per mcf for 2025.
Business Strategy
We are an exploration and production company focused on hydrocarbon development in proven, under-explored conventional basins which have access to established infrastructure and competitive fiscal regimes. Our mandate is to develop high-value resource opportunities to deliver top-quartile returns. We intend to continue to high-grade our portfolio, with a continued focus on operational excellence, safety, and stakeholder returns. The senior management team has a proven track record in developing technically difficult reservoirs, enhanced oil recovery, and operating in remote locations in demanding jurisdictions. We aim to have a meaningful and sustainable impact through social investments within the communities we operate. Our “Beyond Compliance Policy” focuses on our commitments to environmental, social, and governance excellence.
Oil and Gas Properties - Colombia and Ecuador
As of December 31, 2024, excluding blocks subject to relinquishment, we had interests in 22 blocks in Colombia, three blocks in Ecuador, and are the operator of 24 of these blocks.
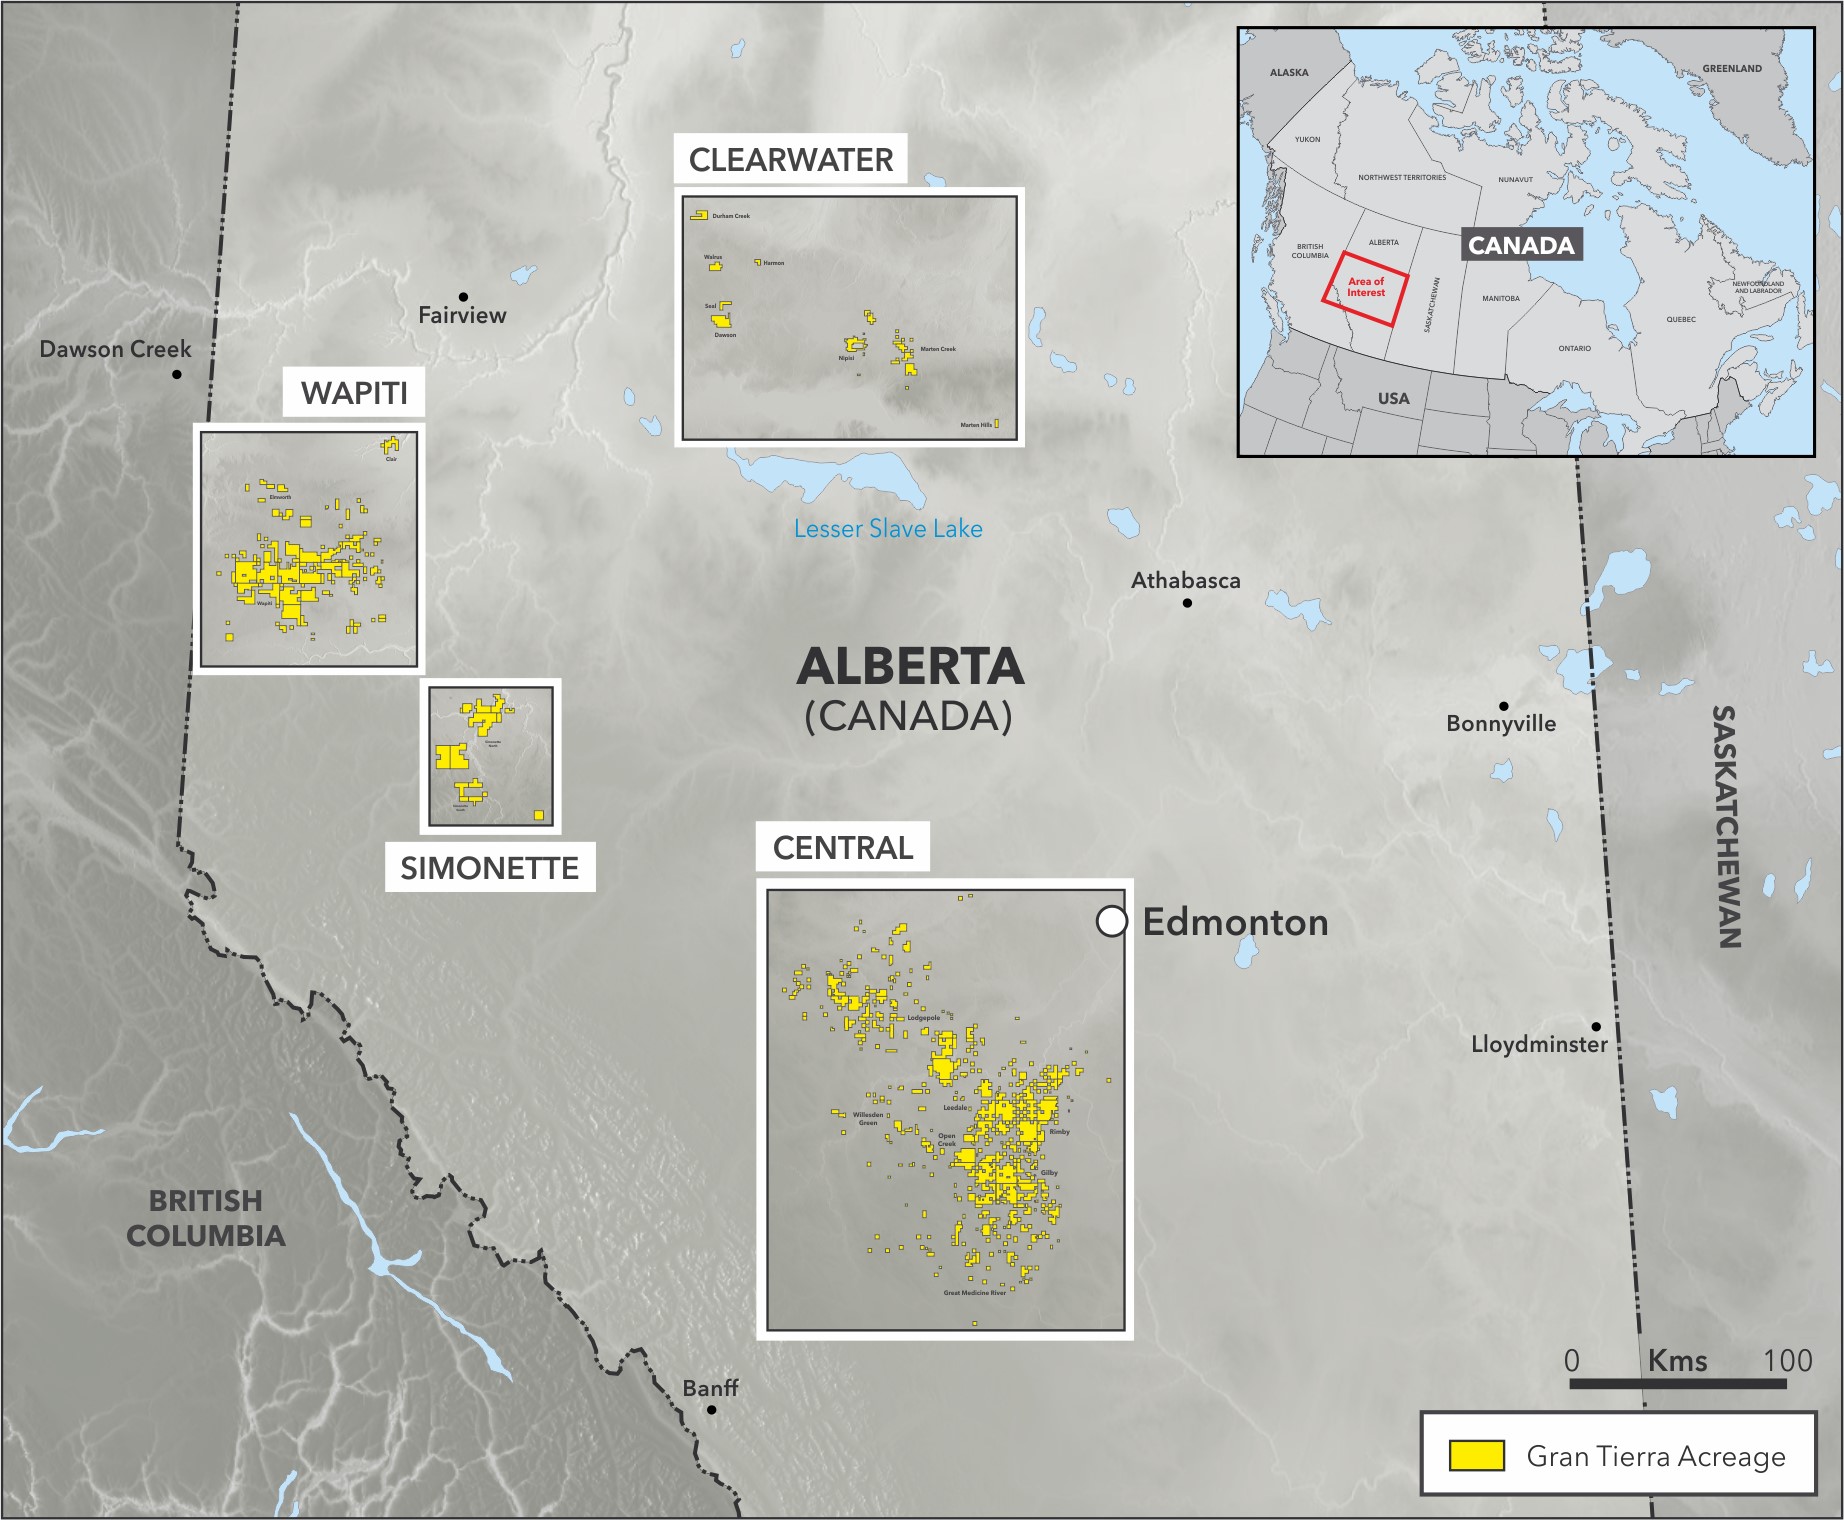
Oil and Natural Gas Properties - Canada
As of December 31, 2024, we had interests in 12 blocks in Canada and are the operator on average 63% across all areas of operations.
Exploration Blocks & Commitments
The following table provides a summary of our exploration commitments for certain blocks as of December 31, 2024:
| | | | | | | | | | | |
| Basin | Block | Current Phase | Remaining Commitments, Current Phase |
| Colombia |
| Putumayo | Alea
1848-A | N/A** | exploration area evaluation program |
| Putumayo | PUT-1 | 2* | two exploration wells |
| Putumayo | PUT-4 | 1* | one exploration well |
| Putumayo | PUT-7 | 2 | two exploration wells |
| Putumayo | PUT-10 | 1* | 73 km 2D seismic, two exploration wells |
| Putumayo | PUT-31 | 1* | 201.9 km 2D seismic, one exploration well |
| Putumayo | NBM | N/A** | two exploration wells |
| Llanos | LLA-1 | 1* | 98 km2 3D seismic, one exploration well |
| Llanos | LLA-22 | 1 & 2* | 85 km2 3D seismic, one exploration well (45% working interest) |
| Llanos | LLA-70 | 1* | 163 km2 3D seismic, one exploration well |
| Llanos | LLA-85 | 1 | one exploration well |
| MMV | VMM-24 | 1 | 50 km2 3D seismic, 100 km 2D seismic reprocessing, 100 km aerogeophysics, 100 km2 remote sensing, 80 km2 surface geochemistry, one exploration well |
| Ecuador |
| Oriente | Charapa | 1 | two exploration wells*** |
| Oriente | Chanangue | 1 | exploratory commitments fulfilled **** |
| Oriente | Iguana | 1 | two exploration wells |
* As of December 31, 2024, exploration has been suspended due to licensing restrictions, security issues or social reasons.
** As of December 31, 2024, exploration commitments in the exploration block are not subject to phasing.
*** 20km 2D seismic, 238km2 3D seismic acquired in 2024 and three exploration wells drilled in 2024 (Charapa B56, Charapa B7 and Charapa i8).
**** Four exploration wells drilled in 2024: Arawana J1, Bocachico Norte J1, Zabaleta K1, Zabaleta Oeste K1.
Royalties
Colombian royalties are regulated under Colombia Law 756 of 2002, as modified by Law 1530 of 2012. All discoveries made subsequent to the enactment of Law 756 of 2002 have the sliding scale royalty described below. Discoveries made before the enactment of Law 756 of 2002 have a royalty of 20% and in the case of such discoveries under association contracts reverted to the national government, an additional 12% applies for a total royalty of 32%.
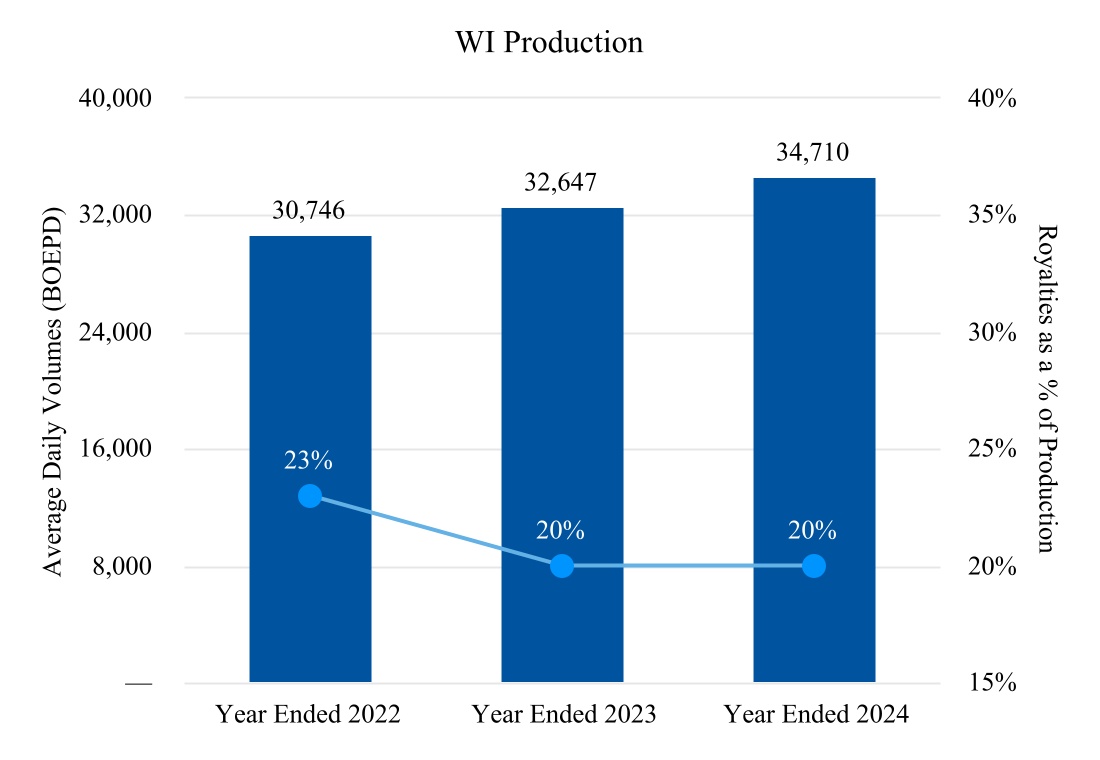
The Agencia Nacional de Hidrocarburos (National Hydrocarbons Agency) (“ANH”) contracts have royalties that are based on a sliding scale described in Law 756 of 2002. These royalties work on an individual oil field basis starting with a base royalty rate of 8% for gross production of less than 5,000 BOEPD, increasing in a linear fashion from 8% to 20% for gross production between 5,000 and 125,000 BOEPD and is fixed at 20% for gross production between 125,000 and 400,000 BOEPD. For gross production between 400,000 and 600,000 BOEPD the rate increases in a linear fashion from 20% to 25%. For gross production
in excess of 600,000 BOEPD the royalty rate is fixed at 25%. The Santana and Nancy-Burdine-Maxine Blocks have fixed rates for existing production of 32% and 20%, respectively. New discoveries and incremental production are subject to sliding scale royalties duly approved by the ANH. In addition to the sliding scale royalty, there are additional x-factor economic rights of 1% for Llanos-22, Putumayo-4, Putumayo-7, Putumayo-21 and VMM-24; 2% for Llanos-85; 3% for VMM-2, 5% for Putumayo-1; 12% for Putumayo-31; 31% for Llanos-1 and Llanos-70.
For natural gas fields, the royalty is based on an individual natural gas field basis starting with a base royalty rate of 6.4% for gross production of less than 28.5 MMcf of natural gas per day. The royalty increases in a linear fashion from 6.4% to 16% for gross production between 28.5 MMcf of natural gas per day and 712.5 MMcf of natural gas per day and is stable at 16% for gross production between 712.5 to 2,280 MMcf of natural gas per day, and then increases in a linear fashion from 16% to 20% for gross production between 2,280 to 3,420 MMcf of natural gas per day. For gross production in excess of 3,420 MMcf of natural gas per day the royalty rate is fixed at 20%.
Additional high price rights (“HPR”) are applicable to exploration and production contracts signed under the new ANH oil regulatory regime in 2004 and onwards when cumulative gross production (net of royalty) from an Exploitation Area is greater than 5 MMbbls of oil and WTI reference price exceeds the trigger price defined in the contract. The HPR is calculated using the associated production multiplied by the Q factor, which is calculated as follows:
Q factor = (WTI price - Base Price (1))/WTI Price * S(2)
(1) Base Price is determined annually by the ANH, based on a formula defined in the contract. For 2024 and 2023, the base price was set as follows:
| | | | | | | | | | | |
| Year Ended December 31, |
| 2024 | | 2023 |
| Quality (Oil API) | Base Price ($/boe) |
< 10 o | Nil | | Nil |
10o to 15o | 68.69 | | 64.54 |
15o to 22o | 48.08 | | 45.18 |
22o to 29o | 46.36 | | 43.56 |
> 29o | 44.62 | | 41.93 |
At December 31, 2024, HPR was applicable to our production from the Costayaco and Moqueta Exploitation Areas in the Chaza Block and the Acordionero Exploitation Area in the Midas Block. In January 2023, Llanos-22 reached accumulated production of 5 MMbbls which triggered its HPR.
(2) S percentage of HPR participation is 30% flat for Chaza and Midas Blocks. For Llanos-22, the percentage is variable compared to WTI price as per below:
| | | | | |
| S percentage |
| Base Price ≤ WTI < 2x Base Price | 30% |
| 2x Base Price ≤ WTI < 3x Base Price | 35% |
| 3x Base Price ≤ WTI < 4x Base Price | 40% |
| 4x Base Price ≤ WTI < 5x Base Price | 45% |
| 5x Base Price ≤ WTI | 50% |
In addition to these government royalties and rights, our original interests in the Guayuyaco and Chaza Blocks acquired on our entry into Colombia in 2006 are subject to a third party royalty. The additional interests in Guayuyaco and Chaza that we acquired on the acquisition of Solana in 2008 are not subject to this third party royalty. The overriding royalty rights start with a 2% rate on working interest production less government royalties. For new commercial fields discovered within 10 years of the agreement date and after a prescribed threshold is reached, Crosby Capital, LLC (“Crosby”) reserves the right to convert the overriding royalty rights to a net profit interest (“NPI”). This NPI ranges from 7.5% to 10% of working interest production less sliding scale government royalties, as described above, and operating and overhead costs. No adjustment is made for the HPR. On certain pre-existing fields, Crosby does not have the right to convert its overriding royalty rights to a NPI. In addition, there
are conditional overriding royalty rights that apply only to the pre-existing fields. Currently, we are subject to a 10% NPI on 50% of our working interest production from the Costayaco and Moqueta fields in the Chaza Block and 35% of our working interest production from the Juanambu field in the Guayuyaco Block and overriding royalties on our working interest production from the Guayuyaco field in the Guayuyaco Block.
The Putumayo-7 and Putumayo-1 Blocks are also subject to a third party royalty in addition to the government royalties and rights. Pursuant to the terms of the agreement by which the interests in the Putumayo-7 Block were acquired, a 10% royalty on production from the Putumayo-7 Block is payable to a third party. The terms of the royalty allow for transportation costs, marketing and handling fees, government royalties (including royalties payable to the ANH pursuant to Section 39 of the contract for the Putumayo-7 Block - the “Rights Due to High Prices”) and taxes, other than taxes measured by the income of any party, value-added tax (“VAT”) or any equivalent, to be paid in cash or kind to the Government of Colombia (or any federal, state, regional or local government agency) and ANH, and a 1% ‘X’ factor payment to be deducted from production revenue prior to the royalty being paid to a third party. Pursuant to the terms of the agreement by which the interests in the Putumayo-1 Block were acquired, a 3% royalty on production from the Putumayo-1 Block is payable to a third party. The terms of the royalty do not allow for any costs, royalties, and taxes to be deducted from production revenue.
We currently hold Participation Sharing Contracts (“PSC”) for the three Blocks (Charapa, Chanangue and Iguana) in the Oriente Basin in Ecuador. Unlike traditional PSCs, these contracts do not include cost oil or royalties. Instead, the entire production is placed into a profit-sharing pool that is split between the Company and the government based on a percentage derived from a biddable price component and a production component. The biddable price component is a sliding scale that is based on the Oriente oil price ranging from $30 per boe to $120 per boe, with the Company’s production share varying between 87.5% and 40%, respectively. The Company’s share in production would only drop below 50% if the Oriente oil prices exceed $100 per boe. The production component is a tier-based mechanic increasing from 0% to 6% based on the PSC’s daily production. For the year ended December 31, 2024, the share of production retained by the government of Ecuador was recorded as royalties in-kind.
The royalty calculation in Canada is a significant factor in the profitability of Canadian oil and natural gas production. Oil and natural gas crown royalties are determined by provincial and territorial government regulation and are generally calculated as a percentage of the value of the gross production, net of allowed deductions. The royalty rate is dependent in part on prescribed reference prices, well productivity, geographical locations, recovery methods, as well as type and quality of the hydrocarbon produced. For pre-payout oil and natural gas projects, the regulations prescribe lower royalty rates for oil and natural gas projects until allowable incentive programs have been depleted and capital costs have been recovered. The calculation for wells post payout is based on a percentage of production net of allowed deductions and varies with commodity price.
The Alberta royalty regime governs the compensation oil and natural gas producers pay to the provincial government for extracting resources, ensuring revenues for the province while promoting industry investment and competitiveness. For conventional oil and natural gas, royalties are calculated using a sliding scale that considers commodity prices, production volumes, and well characteristics such as depth and density. Higher prices and production levels result in higher royalty rates, while lower production or market prices trigger reduced rates. Conventional oil royalties can range from 0% to 40%, while natural gas royalties are similarly adjusted based on productivity, price, and natural gas composition. Newly drilled wells benefit from an initial flat 5% royalty rate for the first 12 months or until they reach a specified production cap, enabling quicker cost recovery. The Modernized Royalty Framework, introduced in 2017, applies to wells drilled on or after January 1, 2017. Under this system, producers initially pay a flat 5% royalty rate until cumulative revenues equal standardized well drilling and completion costs, known as the "C* cost allowance." Once these costs are recovered, royalties increase on a sliding scale based on commodity prices and production levels, ensuring the system adjusts to economic conditions while maintaining a stable revenue stream for the province. To further encourage resource development, Alberta’s regime includes targeted incentives, such as royalty reductions for enhanced oil recovery projects and credits for deep drilling, particularly in natural gas exploration. These measures balance the province’s economic interests with the need to attract ongoing investment and maintain competitiveness in the energy sector. All of the Company’s Canadian production is in Alberta and all wells drilled in 2024 were in Alberta.
Administrative Facilities
Our principal executive office is located in Calgary, Alberta, Canada. Our principle Calgary office leases will expire on November 30, 2028. As part of acquisition of i3 Energy Plc we assumed an office lease for our Canadian operations in Calgary, Alberta, Canada which has an expiration date of December 31, 2025. Our Office leases in Colombia and Ecuador will expire on February 28, 2026, and May 31, 2029, respectively.
Estimated Reserves
Our 2024 reserves were independently prepared by McDaniel & Associates (“McDaniel”). McDaniel was established in 1955 as an independent Canadian consulting firm and has been providing oil and natural gas reserves evaluation services to the world’s petroleum industry for the past 70 years. They have internationally recognized expertise in reserves evaluations, resource assessments, geological studies, and acquisition and disposition advisory services. McDaniel’s office is located in Calgary, Canada. The technical person primarily responsible for the preparation of our reserves estimates at McDaniel meets the requirements regarding qualifications, independence, objectivity, and confidentiality set forth in the Standards Pertaining to the Estimating and Auditing of Oil and Natural Gas Reserves Information promulgated by the Society of Petroleum Engineers.
The primary internal technical person in charge of overseeing the preparation of our reserve estimates is the Chief Operating Officer. He has a Bachelor of Geological Engineering, graduating from University of Waterloo and is responsible for our engineering activities, including reserves reporting, asset evaluation, reservoir management, and field development. He has over 20 years of experience in the oil and natural gas industry with extensive experience in reservoir management, production, and operations.
All of our reserves are evaluated by an independent reservoir engineering firm, at least annually. We have developed internal controls over estimation and evaluation of reserves. Our internal controls over reserve estimates include an independent internal review of assumptions used for reserve estimates and presentation of the results of this internal review to our reserves committee. Calculations and data are reviewed at several levels of the Company to ensure consistent and appropriate standards and procedures. Our policies are applied to all staff involved in generating and reporting reserve estimates including geological, engineering and finance personnel.
The process of estimating oil and natural gas reserves is complex and requires significant judgment, as discussed in Item 1A “Risk Factors”. The reserve estimation process requires us to use significant decisions and assumptions in the evaluation of available geological, geophysical, engineering, and economic data for each property. Therefore, the accuracy of the reserve estimates is dependent on the quality of the data, the accuracy of the assumptions based on the data, and the interpretations and judgment related to the data.
Proved reserves are reserves which, by analysis of geoscience and engineering data, can be estimated with reasonable certainty to be economically producible from a given date forward from known reservoirs under existing economic conditions, operating methods, and government regulations prior to the time at which contracts providing the right to operate expires, unless evidence indicates that renewal is reasonably certain. The term “reasonable certainty” implies a high degree of confidence that the quantities of oil or natural gas actually recovered will equal or exceed the estimate. To achieve reasonable certainty, we and the independent reserve engineers employed technologies that have been demonstrated to yield results with consistency and repeatability. Estimates of proved reserves are generated through the integration of relevant geological, engineering, and production data, utilizing technologies that have been demonstrated in the field to yield repeatable and consistent results as defined by the SEC regulations. Data used in these integrated assessments included information obtained directly from the subsurface through wellbores, such as well logs, reservoir core samples, fluid samples, static and dynamic pressure information, production test data, and surveillance and performance information. The data utilized also included subsurface information obtained through indirect measurements, such as seismic data. The tools used to interpret the data included proprietary and commercially available seismic processing software and commercially available reservoir modeling and simulation software. Reservoir parameters from analogous reservoirs were used to increase the quality of and confidence in the reserves estimates when available. The method or combination of methods used to estimate the reserves of each reservoir was based on the unique circumstances of each reservoir and the dataset available at the time of the estimate. Probable reserves are reserves that are less certain to be recovered than proved reserves but which, together with proved reserves, are as likely as not to be recovered. Estimates of probable reserves which may potentially be recoverable through additional drilling or recovery techniques are by nature more uncertain than estimates of proved reserves and accordingly are subject to substantially greater risk of not actually being realized by us. The probable reserves that have been assigned as of December 31, 2024, were based on both the greater percentage of recovery of the hydrocarbons in place than assumed for proved reserves, as well as the areas of a reservoir adjacent to proved reserves where data control or interpretations of available data are less certain. Possible reserves are reserves that are less certain to be recovered than probable reserves. Estimates of possible reserves are also inherently imprecise. Estimates of probable and possible reserves are also continually subject to revisions based on production history, results of additional exploration and development, price changes, and other factors. The possible reserves that have been assigned as of December 31, 2024, were based on both the greater percentage of recovery of the hydrocarbons in place than assumed for probable reserves as well as to areas of a reservoir adjacent to probable reserves where data control or interpretations of available data are less certain.
The following table sets forth our estimated reserves NAR located in Colombia, Ecuador and Canada as of December 31, 2024:
| | | | | | | | | | | | | | | | | | |
| Oil | Natural Gas | NGL | Total | | | | |
| Reserves Category | (Mbbl) | (MMcf) | (Mboe) | (Mbboe) | | | | |
| Proved | | | | | | | | |
| Colombia | 34,151 | | — | | — | | 34,151 | | | | | |
| Ecuador | 1,752 | | — | | — | | 1,752 | | | | | |
| Canada | 5,730 | | 93,028 | | 10,938 | | 32,173 | | | | | |
| Total proved developed reserves | 41,633 | | 93,028 | | 10,938 | | 68,076 | | | | | |
| Colombia | 29,546 | | — | | — | | 29,546 | | | | | |
| Ecuador | 7,740 | | — | | — | | 7,740 | | | | | |
| Canada | 4,178 | | 89,268 | | 10,589 | | 29,645 | | | | | |
| Total proved undeveloped reserves | 41,464 | | 89,268 | | 10,589 | | 66,931 | | | | | |
| Total proved reserves | 83,097 | | 182,296 | | 21,527 | | 135,007 | | | | | |
| | | | | | | | |
Probable (1) | | | | | | | | |
| Colombia | 8,860 | | — | | — | | 8,860 | | | | | |
| Ecuador | 455 | | — | | — | | 455 | | | | | |
| Canada | 1,512 | | 29,791 | | 3,323 | | 9,800 | | | | | |
| Total probable developed reserves | 10,827 | | 29,791 | | 3,323 | | 19,115 | | | | | |
| Colombia | 25,195 | | — | | — | | 25,195 | | | | | |
| Ecuador | 8,135 | | — | | — | | 8,135 | | | | | |
| Canada | 7,665 | | 170,053 | | 17,408 | | 53,415 | | | | | |
| Total probable undeveloped reserves | 40,995 | | 170,053 | | 17,408 | | 86,745 | | | | | |
| Total probable reserves | 51,822 | | 199,844 | | 20,731 | | 105,860 | | | | | |
| | | | | | | | |
Possible (1) | | | | | | | | |
| Colombia | 7,228 | | — | | — | | 7,228 | | | | | |
| Ecuador | 563 | | — | | — | | 563 | | | | | |
| Canada | 1,983 | | 31,880 | | 3,555 | | 10,851 | | | | | |
| Total possible developed reserves | 9,774 | | 31,880 | | 3,555 | | 18,642 | | | | | |
| Colombia | 27,382 | | — | | — | | 27,382 | | | | | |
| Ecuador | 8,517 | | — | | — | | 8,517 | | | | | |
| Canada | 2,967 | | 64,599 | | 6,350 | | 20,084 | | | | | |
| Total possible undeveloped reserves | 38,866 | | 64,599 | | 6,350 | | 55,983 | | | | | |
| Total possible reserves | 48,640 | | 96,479 | | 9,905 | | 74,625 | | | | | |
(1) Estimates of probable and possible reserves are more uncertain than proved reserves, but have not been adjusted for risk due to that uncertainty. Accordingly, estimates of probable and possible reserves are not comparable and have not been, or should not be, summed arithmetically with each other or with estimates of proved reserves.
Product Prices Used in Reserves Estimates
The product prices that were used to determine the future gross revenue for each property reflect adjustments to the benchmark prices for gravity, quality, local conditions and/or distance from market. The average realized prices for reserves in the report are based on unweighted arithmetic average price, as of the first-day-of-the-month, for the 12-month period ended December 31, 2024:
| | | | | |
| Oil ($/boe) - Colombia | $ | 68.07 | |
| |
| Oil ($/boe) - Ecuador | $ | 74.85 | |
| Oil ($/boe) - Canada | $ | 67.16 | |
| Natural Gas ($/Mcf) - Canada | $ | 0.93 | |
| Condensate ($/boe) - Canada | $ | 72.55 | |
| NGLs ($/boe) - Canada | $ | 21.94 | |
| ICE Brent - average of the first day of each month price for the 12-month period | $ | 80.42 | |
These prices should not be interpreted as a prediction of future prices. We do not represent that this data is the fair value of our oil and natural gas properties or a fair estimate of the present value of cash flows to be obtained from their development and production.
Proved Undeveloped Reserves
As at December 31, 2024, we had total proved undeveloped reserves NAR of 66.9 MMBOE (December 31, 2023 - 34.7 MMBOE), which were 44% in Colombia, 44% in Canada with the remainder in Ecuador (December 31, 2023 – 89% in Colombia with the remainder in Ecuador). Approximately 33%, 20%, and 19% for a total of 62% of proved undeveloped reserves are located in our Acordionero, Costayaco fields and Suroriente Block, respectively, in Colombia. None of our proved undeveloped reserves at December 31, 2024, have remained undeveloped for five years or more since initial disclosure as proved reserves, and we have adopted a development plan which indicates that the proved undeveloped reserves are scheduled to be drilled within five years of initial disclosure as proved reserves.
Changes in proved undeveloped reserves during the year ended December 31, 2024 are shown in the table below: | | | | | | | | | | | | | | |
| Colombia - Oil Equivalent
(MMBOE) | Ecuador - Oil Equivalent (MMBOE) | Canada - Oil Equivalent (MMBOE) | Total Company - Oil Equivalent (MMBOE) |
| Balance, December 31, 2023 | 30.7 | | 4.0 | | — | | 34.7 | |
| Acquisitions | — | | — | | 29.6 | | 29.6 | |
| Converted to proved producing | (3.9) | | (1.7) | | — | | (5.6) | |
| Technical revisions | (0.4) | | 1.2 | | — | | 0.8 | |
| Extensions and discoveries | 3.1 | | 4.3 | | — | | 7.4 | |
| Improved recovery | — | | — | | — | | — | |
| Balance, December 31, 2024 | 29.5 | | 7.8 | | 29.6 | | 66.9 | |
Changes in proved undeveloped reserves during the year ended December 31, 2024, shown in the table above primarily resulted from the following significant factors:
Acquisitions
In 2024, we acquired 29.6 MMBOE of proved undeveloped reserves in Canada (22.5 MMBOE in Central, 6.0 MMBOE in Simonette and 1.1 MMBOE in Wapiti) through the acquisition of i3 Energy with an effective date on October 31, 2024.
Converted to Proved Producing
In 2024, we converted 5.6 MMBOE, or 16% of 2023 proved undeveloped reserves to developed status (1.6 MMBOE in the Acordionero field in Colombia, 2.3 MMBOE in the Costayaco field in Colombia and 1.7 MMBOE in Ecuador). In 2024, the conversion of proved producing volumes was a result of capital expenditures of $38.3 million in Colombia and $37.7 million in Ecuador associated with drilling six wells in Midas Block, five wells in Chaza Block and four wells in Ecuador
Technical and Economic Revisions
During the year ended December 31, 2024, there were additions of 0.8 MMBOE proved undeveloped reserves, of which 1.2 MMBOE were added in Ecuador blocks associated with production type curve improvements in the Charapa Block and 0.4 MMBOE deducted in Colombia primarily due to underperformance of the wells drilled in 2024 in the Acordionero forelimb and Costayaco South areas.
Extensions and Discoveries
We added 7.4 MMBOE to proved undeveloped reserves during the year ended December 31, 2024, of which 3.1 MMBOE were in Colombia and 4.3 MMBOE in Ecuador. In Colombia, we had extensions of 1.1 MMBOE and 2.0 MMBOE in the Costayaco and Acordionero fields, respectively. In Ecuador, we had discoveries of 3.8 MMBOE in the Chanangue Block and 0.5 MMBOE in the Charapa Block.
Production, Revenue and Price History
Certain information concerning production, prices, revenues, and operating expenses for the years ended December 31, 2024, 2023, and 2022 is set forth in Item 7 “Management's Discussion and Analysis of Financial Condition and Results of Operations” and in the “Supplementary Data (Unaudited)” provided following our Financial Statements in Item 8, which information is incorporated by reference here.
The following table presents NAR oil, natural gas and NGL production, average sales prices, and operating expenses over NAR oil production from our major fields (Acordionero, Costayaco, Moqueta, Cohembi) in Colombia and total for all our properties for the three years ended December 31, 2024, 2023, and 2022, respectively:
| | | | | | | | | | | | | | | | | | | | | | | | | | | | | |
| Acordionero (1) | | Costayaco (1) | | Moqueta (1) | | Cohembi (1) | | Total for all properties (2) |
| Year Ended December 31, 2024 | | | | | | | | | |
| Oil, natural gas and NGL production NAR boe | 4,439,201 | | 2,191,332 | | 564,288 | | 824,546 | | 10,207,636 |
| Average sales price of oil per boe | $ | 67.58 | | | $ | 64.17 | | | $ | 65.97 | | | $ | 64.55 | | | $ | 60.92 | |
Operating expenses of oil per boe (3) | $ | 18.19 | | | $ | 16.47 | | | $ | 29.12 | | | $ | 34.08 | | | $ | 21.63 | |
| | | | | | | | | |
| Year Ended December 31, 2023 | | | | | | | | | |
| Oil, natural gas and NGL production NAR boe | 4,924,313 | | | 1,690,718 | | | 666,827 | | | 1,069,585 | | | 9,526,270 | |
| Average sales price of oil per boe | $ | 67.82 | | | $ | 66.41 | | | $ | 66.57 | | | $ | 65.23 | | | $ | 66.86 | |
Operating expenses of oil per boe (3) | $ | 13.68 | | | $ | 17.22 | | | $ | 24.34 | | | $ | 32.02 | | | $ | 21.14 | |
| | | | | | | | | |
| Year Ended December 31, 2022 | | | | | | | | | |
| Oil, natural gas and NGL production NAR boe | 4,491,574 | | | 1,621,073 | | | 542,796 | | | 1,105,451 | | | 8,692,689 | |
| Average sales price of oil per boe | $ | 83.65 | | | $ | 81.85 | | | $ | 80.38 | | | $ | 80.87 | | | $ | 81.84 | |
Operating expenses of oil per boe (3) | $ | 15.07 | | | $ | 18.30 | | | $ | 24.10 | | | $ | 25.10 | | | $ | 19.85 | |
(1) 100% of product sales were oil
(2) Includes natural gas production from Canada operations of 2,781,141 Mcf (463,524 boe) for the year ended December 31, 2024 and de minimis natural gas production from non-core properties from Colombia of 9,682 Mcf (1,614 boe) for the year ended December 31, 2022.
(3) Operating expenses include operating and transportation expenses
We prepared the estimate of a standardized measure of proved reserves in accordance with the Financial Accounting Standards Board (“FASB”) Accounting Standards Codification 932, “Extractive Activities – Oil and Gas.”
Drilling Activities
The following table summarizes the results of our exploration and development drilling activity for the past three years. Wells labeled as “In Progress” for a year were in progress as of December 31, 2024, 2023, or 2022. This information should not be considered indicative of future performance, nor should it be assumed that there was any correlation between the number of productive wells drilled and the oil and natural gas reserves generated thereby or the costs to Gran Tierra of productive wells compared to the costs of dry holes.
| | | | | | | | | | | | | | | | | | | | | |
| 2024 | | 2023 | 2022 |
| Gross | Net | | Gross and Net | | Gross and Net | |
| Colombia | | | | | | | |
| | | | | | | |
| Exploration | | | | | | | |
| Productive | — | | — | | | — | | | 2 | | |
| Dry | — | | — | | | — | | | 2 | | |
| | | | | | | |
| Development | | | | | | | |
| Productive | 10 | | 10.0 | | | 15 | | | 20 | | |
| | | | | | | |
| In-progress | — | | — | | | 2 | | | — | | |
| | | | | | | |
| Service | | | | | | | |
| Water injectors | 4 | | 4.0 | | | 8 | | | 8 | | |
| 14 | | 14.0 | | | 25 | | | 32 | | |
| | | | | | | |
| Ecuador | | | | | | | |
| | | | | | | |
| Exploration | | | | | | | |
| Productive | 6 | | 6.0 | | | — | | | 2 | | |
| In-progress | 1 | | 1.0 | | | — | | | — | | |
| 7 | | 7.0 | | | — | | | 2 | | |
| | | | | | | |
| Canada | | | | | | | |
| | | | | | | |
| Development | | | | | | | |
| Productive | 2 | | 1.3 | | | — | | | — | | |
| In-progress | 7 | | 4.2 | | | — | | | — | | |
| 9 | | 5.5 | | | — | | | — | | |
| Total | 30 | | 26.5 | | | 25 | | | 34 | | |
Well Statistics
The following table sets forth our productive wells as of December 31, 2024:
| | | | | | | | | | | | | | | | | | | | |
| Oil Wells | Natural Gas Wells |
| Gross | | Net | Gross | | Net |
Colombia (1) | 311 | | | 278 | | 2 | | | 1 | |
Canada (2) | 1,332 | | | 523 | | 1,697 | | | 745 | |
| Ecuador | 9 | | | 9 | | — | | | — | |
| 1,652 | | | 810 | | 1,699 | | | 746 | |
(1) Includes 93 gross and 87 net water injector wells and 99 gross and 97 net wells with multiple completions.
(2) Includes 333 gross and 123 net water injector wells.
(3) Includes one gross and net well with multiple completions
We commenced the execution of our 2025 capital program as planned, and as of February 20, 2025, we are currently drilling the first development well in the Suroriente Block in Colombia and one exploration well in the Iguana Block in Ecuador.
Developed and Undeveloped Acreage
At December 31, 2024, our acreage was located 52% in Colombia, 43% in Canada and 5% in Ecuador. The following table sets forth our developed and undeveloped oil and natural gas lease and mineral acreage as of December 31, 2024:
| | | | | | | | | | | | | | | | | | | | | | | | | | | | | | | | | | | |
| Developed | | Undeveloped (2) | | Total |
| Gross | | Net | | Gross | | Net | | Gross | | Net |
Colombia (1)(2) | 330,025 | | | 237,887 | | | 1,072,874 | | | 1,063,331 | | | 1,402,899 | | | 1,301,218 | |
Ecuador (3) | — | | | — | | | 138,239 | | | 138,239 | | | 138,239 | | | 138,239 | |
Canada(4) | 855,418 | | | 419,539 | | | 296,758 | | | 138,286 | | | 1,152,176 | | | 557,825 | |
| Total | 1,185,443 | | | 657,426 | | | 1,507,871 | | | 1,339,856 | | | 2,693,314 | | | 1,997,282 | |
(1) Excludes our interest in one Block with a total of 0.1 million net acres for which government approval of relinquishment or sale was pending at December 31, 2024
(2) As of December 31, 2024, the exploration phase for 0.5 million gross and net undeveloped acres expires within the next three years, with
an option to extend the exploration phase for 50% of the expired area
(3) During the year ended December 31, 2024, we started production in Ecuador under the evaluation permits of exploration phase, and therefore the entire acreage for Ecuador is reported as undeveloped
(4) Acres in Canada were acquired through the acquisition of i3 Energy on October 31, 2024
Marketing and Major Customers
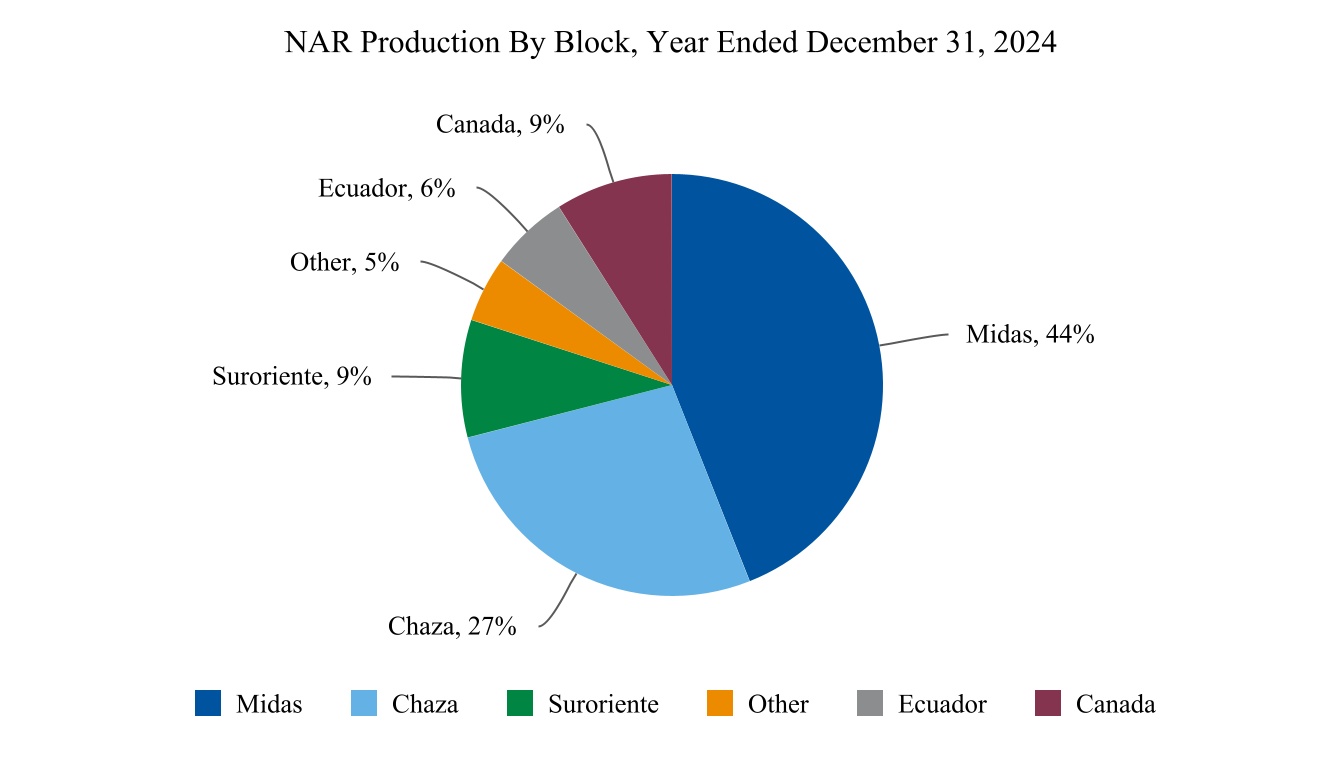
Colombia represents approximately 85% of our production with oil reserves and production located in the Middle Magdalena Valley (“MMV”) and Putumayo Basin. In MMV, our largest field is the Acordionero field, where we produce approximately 17° API oil, which represented 44% of the total Company’s production for the year ended December 31, 2024. Putumayo production is approximately 27° API for the Chaza Block and 18° API for the Suroriente Block, representing 27% and 9%, respectively, of the total Company’s production for the year ended December 31, 2024.
We have entered into numerous sales agreements for our production from MMV and the Putumayo Basin with domestic customers selling crude oil for export purposes. These agreements are subject to renegotiation terms between twelve and thirty months. The volume of crude oil contemplated in these sales agreements does not include the volume of oil corresponding to royalties taken in-kind and since October 2022 does include volumes relating to HPR royalties.
All of our Putumayo production is sold at the wellhead. In order to capture the best market value and optimize our netback, our marketing strategy is to sell a blend “Chaza Heavy” of the entire Putumayo production with an average quality of 23-25° API. Production from the Acordionero field in MMV is trucked and sold at various terminals or pipeline inlets and various distances from the Acordionero field, depending on our marketing strategy to optimize the value.
In 2024, all of our MMV and Putumayo production was sold to one domestic marketer. The sales agreement for Putumayo production expires on March 31, 2025 and for MMV production expires on March 31, 2026. The loss of any individual sales customer will not have a material adverse impact on our Company as customers can be substituted or we could market the crude directly ourselves.
In Ecuador, Bocachico produces approximately 19° API oil and Charapa produces approximately 28° API oil. All of Ecuador production was sold to one international marketer and is sold at port of shipment. For the year ended December 31, 2024, Ecuador contributed 6% of the total Company’s production.
For our Canadian operations, marketing activities are focused on maximizing the value of production from our core assets, including the Simonette, Central Alberta, Wapiti, and Clearwater regions. Our Canadian oil production is approximately 40° API. Our strategy prioritizes minimizing production curtailments, maximizing realized commodity prices, and managing credit risk exposure across our customer base. Our production, consisting of crude oil, natural gas, and NGLs, is primarily sold to marketers and aggregators. Prices realized are based on prevailing regional market indices, influenced by supply-demand fundamentals, transportation infrastructure, and competing energy sources. Our Canadian sales were 9% of the total Company’s production for the year ended December 31, 2024.
To manage commodity price risks, we employ financial hedging instruments to stabilize future cash flows, protect against price volatility, and support operational planning.
We expect to fulfill our delivery commitments primarily with production from our proved developed reserves. Longer-term delivery obligations will be satisfied through production from proved undeveloped reserves. For long-term transportation and processing agreements, we anticipate utilizing future resource developments that are not yet classified as proved reserves.
Production from our reserves is not subject to priorities, curtailments, or regulatory price limitations that could impact quantities delivered to customers.
We receive revenues for our Colombian and Ecuadorian oil sales in U.S. dollars and for our Canadian oil, natural gas and NGL sales in Canadian dollars. Oil prices for sales of our crude oil are defined by agreements with the purchasers of the oil. They are based generally on an average price for crude oil, natural gas and NGLs, referenced to ICE Brent, WTI, Mixed Sweet Blend (“MSW”) and AECO natural gas, with adjustments for differences in quality, specified fees, transportation fees, and transportation tax. Pipeline tariffs are denominated in U.S. dollars for Colombia and Ecuador and Canadian dollars for Canada, while trucking costs are in Colombian Pesos in Colombia and U.S. dollars in Ecuador. 100% of transportation in Canada is performed via pipelines.
Competition
The oil and natural gas industry is highly competitive. We face competition from both local and multinational companies. This competition impacts our ability to acquire properties, contract drilling and other oil field equipment, and secure trained personnel. Many competitors, such as Colombian and Ecuadorian national oil companies and independent oil and natural gas companies in Canada, have greater financial resources. Our larger or more integrated competitors may be able to absorb the burden of existing, and any changes to, federal, state and local laws and regulations more easily than we can, which could adversely affect our competitive position. Our ability to acquire additional properties and to discover reserves in the future will depend on our ability to evaluate and select suitable properties and consummate transactions in a highly competitive environment. There is substantial competition for land contracts, prospects, and resources in the oil and gas industry, and we compete to develop and produce those reserves cost-effectively. The oil and natural gas industry also competes with other industries focused on providing alternative forms of energy to consumers. Competitive forces can lead to cost increases or result in an oversupply of oil, natural gas or NGLs. In addition, we compete to monetize our oil production: for transportation capacity and infrastructure to deliver our products, maintain a skilled workforce, and obtain quality services and materials.
Geographic Information
We have three reportable segments based on the geographic organization: Colombia, Ecuador and Canada. Long-lived assets are Property, Plant and Equipment, which include all oil, natural gas and NGL assets, furniture and fixtures, automobiles, computer equipment, and capitalized leases. No long-lived assets are held in our country of domicile, which is the United States of America. Assets held by our corporate head office in Calgary, Alberta, Canada, were not significant as of December 31, 2024, and 2023 and were included in the “Other” category which represents the Company´s corporate activities. Because all of our exploration and development operations are in Colombia, Ecuador and Canada, we face many risks associated with these operations. See Item 1A “Risk Factors” for risks associated with our foreign operations.
Regulation
The oil and gas industry in Colombia, Ecuador and Canada is heavily regulated. Rights and obligations relating to exploration, development, and production activities are explicit for each project; economics is governed by a royalty and tax regime. Various government approvals are required for property acquisitions and transfers, including, but not limited to, meeting financial and technical qualification criteria in order to be certified as an oil and gas company in the country. Oil and gas concessions are typically granted for fixed terms with an opportunity for extension. In Alberta, the Alberta Energy Regulator (“AER") is the single regulator of oil and gas development in Alberta and oversees all aspects of the regulatory process, including related to exploration, construction and development, abandonment, reclamation, and remediation activities. The AER oversees compliance with the Oil and Gas Conservation Act, Public Lands Act, Mines and Minerals Act, Water Act and the Environmental Protection and Enhancement Act by oil and gas operators. The AER operates in conjunction with Alberta Environment and Parks to ensure the province's environmental, social and economic targets are met. Alberta Environment and Parks is also responsible for climate change-related regulations such as the Alberta Technology Innovation and Emissions Reduction program.
Colombia Administration
We operate in Colombia through Colombian branches of the following entities: Gran Tierra Energy Colombia GmbH, Gran Tierra Operations Colombia GmbH, and Gran Tierra Energy Resources Inc. These entities are currently qualified as operators
of oil and gas properties by the ANH. The entities operate under a special regime for hydrocarbon companies in Colombia that entitle them to collect proceeds from oil sales abroad in U.S. dollars and import such into Colombia for payments in local currency.
In Colombia, the ANH is the administrator of the hydrocarbons in the country, as delegated by the Ministry of Mining and Energy, and therefore is responsible for the administration of Colombian oil and natural gas contracts and managing all of the nation’s exploration and exploitation lands. Ecopetrol, the Colombian national oil company, is a public company listed in the Colombian and United States stock markets, owned in majority by the state with the main purpose of exploring and producing hydrocarbons similar to any other integrated oil company. In addition, Ecopetrol is a major purchaser and marketer of oil in Colombia and directly or through its subsidiaries operates most of the oil pipeline transportation and refining infrastructure in the country. Ecopetrol Group also owns a majority stake in the Colombian energy transmission sector. Companies can also have joint exploration and exploitation contracts with Ecopetrol.
The ANH uses various forms of contracts, which provide full risk/reward benefits for the contractor. Under the terms of these contracts, the operator retains the right to produce all reserves, production, and income from any new exploration and evaluation block, subject to existing royalty and tax regulations. Each contract contains an exploration and a production periods. The exploration period contains a number of exploration phases, and each phase has an associated work commitment. The production period usually lasts 24 years from the declaration of a commercial hydrocarbon discovery. Such contracts may be terminated at election of the ANH on the failure of the contract holder to comply with certain material terms of the contract, such as failure to perform committed exploration operations or investments in accordance with the contract. Ecopetrol uses various forms of contracts, which contain exploration and development phases. Duration of contracts can be life of field or up to a specific date and the terms of such contracts vary depending on the type of contract. Under the Ecopetrol contract, the partner retains its working interest rights to produce all reserves, production and income from any new exploration and evaluation block, subject to existing royalty and tax regulations during the duration of such contract.
When operating under the ANH contract, the contractor is the owner of the hydrocarbons extracted from the contract area during the performance of operations, except for royalty volumes which are collected by the ANH (or its designee). The contractor can market the hydrocarbons in any manner whatsoever, subject to a limitation in the case of natural emergencies where the law specifies the manner of sale. Under the Ecopetrol contract, each party owns its working interest of the hydrocarbons extracted.
The contracts in place with ANH and Ecopetrol are agreements among both parties duly protected by regulation and, therefore, cannot be unilaterally adjusted at election of the Government. Contracts include the instances for remediation, arbitration and other protection measures. In addition, investment protection treaties and Colombian regulation protect the sanctity of the existing contract.
Ecuador Administration
We operate in Ecuador through the Ecuadorian branch of Gran Tierra Energy Colombia, GmbH.
In Ecuador, the Ministry of Energy and Mines (“MEM”) is responsible for signing oil and natural gas contracts and regulating the Ecuadorian oil and gas industry through the Agency for Regulation and Control of Energy and Non-Renewable Natural Resources.
The MEM uses service and participation contracts for the exploration and/or exploitation of hydrocarbons (“Participation Contracts”). We currently hold three Participation Contracts which provide for full risk for the contractor and production sharing with the MEM and contain exploration and exploitation periods. The exploration period has an associated work commitment and lasts typically four years. The participation contracts include a provision to extend the exploration period for up to two years, on the grounds of, among others, delays caused by the Ecuadorian government in the environmental licensing procedures. In the second quarter of 2021, we received a two-year extension of the exploration period for all three Participation Contracts, under the aforementioned provision. The exploitation period usually lasts 20 years from the approval of the development plan for one of several commercial hydrocarbon discoveries. Such contracts may be terminated at the election of the MEM on the failure of the contract holder to comply with certain material terms of the contract, such as failure to perform committed exploration operations in accordance with the contract.
When operating under a participation contract, the contractor is the owner of the hydrocarbons extracted from the contract area during the performance of operations, except for the share of volumes owned by the MEM agreed under each contract.
Canada Administration
We operate in Canada through the Canadian subsidiary Gran Tierra Canada Ltd. registered in Alberta. In Canada, oil and natural gas mineral rights may be held by individuals, corporations or governments that have jurisdiction over the area in which such mineral rights are located. Generally, parties holding these mineral rights grant licenses or leases to third parties to facilitate the exploration and development of these mineral rights. The terms of these leases and licenses are generally established to require timely development. Notwithstanding the ownership of mineral rights, the government of the jurisdiction in which the mineral rights are located generally retains authority over the drilling and operation of oil and natural gas wells.
Environmental Compliance
Our activities are subject to laws and regulations governing environmental compliance quality, waste and pollution control in the countries where we maintain operations. Our activities with respect to exploration, drilling, production facilities, including the operation and construction of pipelines, plants and other facilities for transporting, processing, treating or storing oil and other products, are subject to stringent environmental regulation by regional and federal authorities in Colombia, Ecuador and Canada. Such regulations relate to mandatory environmental impact studies, the discharge of pollutants into air and water, water use and management, the management of non-hazardous and hazardous waste, including its transportation, storage and disposal permitting for the construction of facilities, recycling requirements and reclamation standards, and the protection of certain plants and animal species as well as cultural resources and areas inhabited by indigenous people, among others. Risks are inherent in oil and gas exploration, development and production operations. These risks include blowouts, fires, or spills. Significant costs and liabilities may be incurred in connection with environmental compliance issues. Licenses and permits required for our exploration and production activities may not be obtainable on reasonable terms or on a timely basis, which could result in delays and have an adverse effect on our operations. Spills and releases of petroleum products into the environment can result in remediation costs and liability for damages. The costs of remedying such conditions may be significant, and remediation obligations could adversely affect our financial condition, results of operations and prospects. Moreover, violations of environmental laws and regulations can result in the issuance of administrative, civil or criminal fines and penalties, as well as orders or injunctions prohibiting some or all of our operations in affected areas. In addition, indigenous groups or other local organizations could oppose our operations in their communities, potentially resulting in delays which could adversely affect new developments. Governmental or judicial actions may influence the interpretation and enforcement of environmental laws and regulations and may thereby increase licensing and compliance costs. We do not expect that the cost of compliance with regional and federal provisions, which have been enacted regulating the discharge of materials into the environment, or otherwise relating to the protection of the environment or natural resources, will be material to us.
We have implemented a company wide web-based reporting system which allows us to track incidents and respective corrective actions and associated costs. We have a Corporate Health, Safety, and Environmental Management Policy and Plan as well as a Corporate Environmental Management Plan (“EMP”). The EMP is based on the environmental performance standards of the World Bank International Finance Corporation and reflects best industry practices. We have an Environmental Management System which is ISO14001:2015 certified representing compliance with internationally recognized industry best practice, as well as the environmental risk management program and robust waste management procedures. Air, soil and water testing occurs regularly and environmental contingency plans have been prepared for all sites and transportation of oil. We have a regular quarterly reporting system, reporting to executive management as well as the Health Safety and Environment Committee of the Board of Directors. We have a schedule of internal and external audits and routine checking of practices and procedures and conduct emergency response exercises.
Human Capital Management
At December 31, 2024, we had 431 full-time employees (December 31, 2023 - 351): 146 located in Canada (142 staff in Calgary and four field personnel), 243 in Colombia (176 staff in Bogota and 67 field personnel), 42 in Ecuador (14 staff in Quito and 28 field personnel). None of our employees are represented by labor unions, and we consider our employee relations to be good.
Health and Safety
We have implemented safety management systems, procedures, and tools to protect our employees and contractors. As part of our Health and Safety Management System, we identify potential risks associated with the workplace and develop measures to
mitigate possible hazards. We support our employees with general safety training and implement specific programs for those working in all our operations, such as equipment and machinery safety, chemical management, and electrical safety.
Workplace Practices and Policies
Gran Tierra is an equal opportunity employer committed to equality and sourcing local employees, contractors, and suppliers. We have a program to increase gender and diversity representation, including guidelines to prevent gender discrimination in selection and recruitment by contractors, incentives to promote the recruitment of women throughout the supply chain, training to increase the competitiveness of female employees and candidates, and guarantees of fair working conditions including schedules and salaries.
We are committed to enabling employees and contractors to grow within their roles to advance by offering coaching and mentoring programs. An example of this is our Te Enseña (Learn with Gran Tierra) program. It involves independent training sessions across several departments, where participants improve internal knowledge and further develop their skill sets. We also offer employee-led virtual training sessions that promote individual growth and create a space to learn from their peers. These programs have fostered interdepartmental connections between employees and contractors providing the ability to work remotely.
Compensation
We believe that all employees deserve competitive compensation and standard short and long-term incentives that enable employees to share success of the Company.
Engagement
We believe that open, honest, and transparent communication among the team members, managers, and senior management promotes company engagement and offers a strong understanding of our business’s big picture. We regularly encourage employees to learn about the organization’s strategic objectives and understand company’s decisions and how those decisions impact them specifically. We undertake quarterly reviews to inform our team about the Company’s performance and future goals. We believe these key strategies have led to strategic alignment across the organization.
Available Information
We file or furnish annual, quarterly and current reports, proxy statements and other documents with the SEC. We make available free of charge through our website at www.grantierra.com our Annual Reports on Form 10-K, Quarterly Reports on Form 10-Q, Current Reports on Form 8-K, and all amendments to those reports as soon as reasonably practicable after such material is electronically filed or furnished with the SEC. Our Code of Business Conduct and Ethics, our Corporate Governance Guidelines, our Audit Committee Charter, our Compensation Committee Charter, our Nominating and Corporate Governance Committee Charter, our Reserve Committee Charter, and other Company policies and guidelines are also posted to the governance section of our website. Our website address is provided solely for informational purposes. Information on our website is not incorporated into this Annual Report or otherwise made part of this Annual Report. We intend to use our website as means for distributing information to the public for purposes of compliance with Regulation Fair Disclosure.
In addition, the SEC maintains a website (www.sec.gov) that contains reports, proxy and information statements, and other information regarding issuers that file electronically with the SEC, including us.
Item 1A. Risk Factors
Risks Related to our Business
Prices and markets for oil and natural gas are unpredictable and tend to fluctuate significantly, which could cause temporary suspension of production and reduce our value
We generate revenue through the production and sale of oil, natural gas and NGLs. Current and forward contract oil natural gas prices are based on world demand, supply, weather, pipeline capacity constraints, inventory storage levels, geopolitical unrest, world health events and other factors, all of which are beyond our control. Historically, the market for oil and natural gas has been volatile and is expected to remain so. Furthermore, prices which we receive for our oil and natural gas sales, while based on international oil prices, are established by contracts with purchasers and include the deductions for quality differentials and transportation. The differentials and transportation costs can change over time and have a detrimental impact on realized prices.
Future decreases in the prices of oil or natural gas, sustained low prices, periods of extended pricing volatility, and increasing borrowing costs may have a material adverse effect on our financial condition, the future results of our operations (including rendering existing projects unprofitable or requiring temporary suspension of fields), financing available to us, and quantities of reserves recoverable on an economic basis, as well as the market price for our securities.
Estimates of oil and natural gas reserves may be inaccurate and our actual revenues may be lower than estimated
We make estimates of oil and natural gas reserves, upon which we base our financial projections and capital expenditure plans. We make these reserve estimates using various assumptions, including assumptions as to oil and natural gas prices, drilling and operating expenses, capital expenditures, taxes and availability of funds. Some of these assumptions are inherently subjective, and the accuracy of our reserve estimates relies in part on the ability of our management team, engineers and other advisors to make accurate assumptions. Wells that are drilled may not achieve the results expected. Economic factors beyond our control, such as world oil and natural gas prices, interest rates, inflation, and exchange rates, will also impact the quantity and value of our reserves.
The process of estimating oil and natural gas reserves is complex and requires us to use significant decisions and assumptions in the evaluation of available geological, geophysical, engineering and economic data for each property. As a result, our reserves estimates are inherently imprecise. All categories of reserves are continually subject to revisions based on production history, results of additional exploration and development, price changes and other factors. When producing an estimate of the amount of oil or natural gas that is recoverable from a particular reservoir, probable reserves are those additional reserves that are less certain to be recovered than proved reserves but which, together with proved reserves, are as likely as not to be recovered. Possible reserves are even less certain and generally require only a 10% or greater probability of being recovered. Estimates of probable and possible reserves are by their nature much more speculative than estimates of proved reserves and are subject to greater uncertainties, and accordingly the likelihood of recovering those reserves is subject to substantially greater risk. Actual future production, oil and natural gas prices, revenues, taxes, exploration and development expenditures, operating expenses and quantities of recoverable oil and natural gas reserves may vary substantially from those we estimate. Such changes could materially reduce our revenues and result in the impairment of our oil and natural gas interests.
Unless we are able to replace our reserves and production, and develop and manage oil and natural gas reserves and production on an economically viable basis, our financial condition and results of operations will be adversely impacted
Our future success depends on our ability to find, develop and acquire additional oil and natural gas reserves that are economically recoverable. Producing oil and natural gas reservoirs generally are characterized by declining production rates that vary depending upon reservoir characteristics and other factors. Our future oil and natural gas reserves and production, and therefore our cash flows and results of operations, are highly dependent on our success in efficiently developing and exploiting our current reserves and economically finding or acquiring additional recoverable reserves. The value of our securities and our ability to raise capital will be adversely impacted if we are not able to replace our reserves that are depleted by production. We may not be able to develop, exploit, find or acquire sufficient additional reserves to replace our current and future production.
Exploration, development and production costs (including operating and transportation costs), marketing costs (including distribution costs) and regulatory compliance costs (including taxes) will substantially impact the net revenues we derive from the oil and natural gas that we produce. These costs are subject to fluctuations and variations in the areas in which we operate, and we may not be able to predict or control these costs. If these costs exceed our expectations, this may adversely affect our results of operations.
Our future reserves will depend not only on our ability to develop and effectively manage then-existing properties, but also on our ability to identify, acquire and successfully integrate additional suitable producing properties or prospects, to identify and retain responsible service providers and contractors to efficiently drill and complete our wells and to find markets for the oil and natural gas we develop and to effectively distribute our production into our markets.
Exploration for oil and natural gas, and development of new formations, is risky
Oil and natural gas exploration involves a high degree of operational and financial risk. These risks are more acute in the early stages of exploration, appraisal and development. It is difficult to predict the results and project the costs of implementing an exploratory drilling program due to the inherent uncertainties and costs of drilling in unknown formations and encountering various drilling conditions, such as unexpected formations or pressures, premature decline of reservoirs, the invasion of water into producing formations, tools lost in the hole, and changes in drilling plans and locations as a result of prior exploratory wells or additional seismic data and interpretations thereof. Future oil and natural gas exploration may involve unprofitable
efforts, not only from dry wells, but from wells that are productive but do not produce sufficient net revenues to return a profit after drilling, operating and other costs.
Oil and natural gas exploration, development and production operations are subject to the risks and hazards typically associated with such operations, including, but not limited to, fire, explosion, blowouts, cratering, sour gas releases, spills and other environmental hazards. Such risks and hazards could result in substantial damage to oil and natural gas wells, production facilities, other property or the environment, as well as personal injury to our employees, contractors or members of the public. Losses resulting from the occurrence of any of these risks may have a material adverse effect on our business, financial condition, results of operations and prospects.
Although we maintain well control and liability insurance in an amount that we consider prudent and consistent with industry practice, liabilities associated with certain risks could exceed policy limits or not be covered. In either event we could incur significant costs.
Drilling activities may encounter sour gas
A significant portion of the natural gas produced in Alberta originates as sour gas. With the inclusion of wellhead treatment facilities, our infrastructure may, from time to time, encounter concentrations of sour gas. If a well encounters a high concentration of sour gas it would have to be shut-in due to the lack of existing sour gas handling infrastructure. Sour gas leaks or other exposure to sour gas produced from our properties in Alberta may result in damage to equipment, liability to third parties, adverse effects to humans, animals or the environment, or the shutdown of operations. Special equipment and operating
procedures are deployed by the industry in Canada for the production of sour gas in accordance with applicable regulatory requirements.
Possible shortage of fresh water and surface and groundwater licenses
Drilling and completion operations require a large amount of water. The surface water resources of some of the regions in Canada where we aspire to operate may be insufficient for the full commercial-scale development of the region at a pace matching the industry's ambitions. Thus, limitations on water access may present a ceiling on the allowed pace of development. This ceiling may take the form of a physical ceiling supported by scientific investigation, or it may be a limitation we choose to accept to abate public concerns despite contradicting scientific evidence of the carrying capacity of the surface water resources. Drought and low water levels could impact the year-round availability and associated costs of fresh water for our Canadian operations such as drilling fluid, completions fluid and power or hydrogen plant cooling water. Furthermore, there can be no assurance that our Canadian governmental licenses to withdraw water will not be rescinded or that additional conditions will not be added to these licenses. Further, there can be no assurance that we will not have to pay a fee for the use of water in the future or that any such fees will be reasonable. Finally, new projects or the expansion of existing projects may be dependent on
securing licenses for additional water withdrawal, and there can be no assurance that these licenses will be granted on favorable
terms, or at all, or that such additional water will in fact be available to divert under such licenses.
Crown land tenure obligations, interpretations and freehold offset royalty obligations
Our Canadian resources are held in leases, mostly owned by Alberta. There is a risk that the Government of Alberta imposes the strictest interpretation of land tenure regulations and terminates a high percentage of leases on expiry. The leases have defined terms and conditions upon which they are granted and renewed. The Government of Alberta has the power to unilaterally change the royalty charged or the conditions of renewal. We are at risk of loss of value due to revision in royalty or lease renewal provisions. We also risk losing leases if they are not drilled and brought on to production within the terms of the relevant lease. We may fail to bring leases on to production because limited capital may be allocated to other higher return priorities or because surface access to a point where wells can be drilled to access a lease may be impaired by surface conditions, such as swamps, steep valleys, or there may be protected species access restrictions.
Furthermore, on the freehold side, as we develop our land positions in Alberta, we may be required to pay offset royalties to owners of adjacent land without wells. In addition, drilling of wells adjacent to undrilled freehold leases can trigger an obligation to drill the undrilled lands or pay a royalty on those lands equivalent to what would be expected if a well was operating on those lands, or alternatively we may allow the freehold leases to expire. As such, royalty estimates may significantly change in the future.
Unforeseen title defects
Ownership of some of our properties could be subject to prior undetected claims or interests. We plan to conduct title reviews from time to time according to industry practice prior to the purchase of most of our crude oil and natural gas producing properties or the commencement of drilling wells. However, title reviews, if conducted, do not guarantee that an unforeseen defect in the chain of title will not arise to defeat a claim by us. If any such defect were to arise, our entitlement to the production and reserves associated with such properties could be jeopardized, and could have a material adverse effect on our financial condition, results of operations and our ability to timely execute our business plan. Indigenous peoples have claimed title and rights to portions of Western Canada. We are not aware of any claims that have been made in respect of our property and assets in Western Canada; however, if a claim arose and was successful, this could have an adverse effect on our operations.
Indigenous rights and stakeholder opposition in Canada
Indigenous peoples have established and claimed Indigenous rights and title in portions of Western Canada. Claims of Indigenous peoples and protests and demonstrations pertaining to Indigenous rights and title may disrupt or delay third-party operations or new development on our Canadian properties. Requirements relating to the federal implementation of the United Nations Declaration of Rights for Indigenous Peoples, including the concept of free, prior and informed consent before adopting measures or approving projects that may affect Indigenous peoples, have the potential to adversely affect our ability to obtain permits, leases, licenses and other approvals in Canada, or to meet the terms and conditions of those approvals. We are not aware that any claims have been made by Indigenous peoples in respect of our assets in Canada; however, if a claim arose and was successful this could have an adverse effect on our operations. Additionally, opposition may occur from stakeholders, or there may be an expectation of compensation or consideration associated with a project beyond historical levels. Our ability to access land, develop and operate our business may be subject to general social opposition, negative sentiment or litigation which may result in delays or restrictions on the ability to advance through the environmental consultative process.
The process of addressing Indigenous and stakeholder claims, regardless of the outcome, can be expensive and time-consuming
and could result in delays which could have a negative effect on our business, financial condition, results of operations and prospects, which negative effect could prove to be material over time.
Restrictions on development activities to protect wildlife
Crude oil and natural gas operations in our operating areas in Canada can be adversely affected by seasonal or permanent restrictions on development activities designed to protect identified wildlife. There is a risk that our activities will be seen to adversely affect protected species, leading to an inability to access planned facility sites or, if already built, some kind of restriction on operations.
Seasonal restrictions may limit our ability to operate in protected areas and can intensify competition for drilling rigs, oilfield equipment, services, supplies and qualified personnel, which may lead to periodic shortages when drilling is allowed. These constraints and the resulting shortages or high costs could delay our operations and materially increase operating and capital costs. Permanent restrictions imposed to protect endangered species could prohibit drilling in certain areas or require the implementation of expensive mitigation measures. The designation of previously unprotected species in areas where we operate as threatened or endangered could cause us to incur increased costs arising from species protection measures or could result in limitations on our exploration and production activities that could have an adverse impact on our ability to develop and produce
our reserves.
Additionally, some of our producing areas in Canada are or will be located in areas that may become inaccessible due to environmental protection requirements. This includes, but is not limited to, protected caribou habitat on a seasonal basis.
Joint Venture partner alignment
We have operated and non operated interests in Colombia and Canada. In the areas where the Company operates as non-operating partner it may have limited control over the day-to-day management or operations of these assets. A third-party mismanagement of an asset may result in significant delays, materially increased costs or liabilities to the Company over which the Company is joint and severally liable. There is no guarantee that the third-party’s environmental standards are aligned with those of the Company. The Company continually engages with its operating partners and closely monitors the operation of its assets, thorough reviews are conducted before entering into joint venture arrangements to ensure that our operational objectives are aligned with potential joint venture partner.
Our business is subject to local legal, social, security, political and economic factors that are beyond our control, which could impair or delay our ability to expand our operations or operate profitably
All of our proved reserves and production are currently located in Colombia, Ecuador and Canada; however, we may eventually expand to other countries. Exploration and production operations are subject to legal, social, security, political and economic uncertainties, including terrorism, social unrest and activism, illegal blockades, strikes by local or national labor groups, interference with private contract rights, extreme fluctuations in currency exchange rates, high rates of inflation, exchange controls, changes in tax rates, tariff and import/export regulations and sanctions by the United States or other countries, changes in laws or policies affecting environmental issues (including land use and water use), workplace safety, foreign investment, foreign trade, investment or taxation, as well as restrictions imposed on the oil and gas industry, such as restrictions on production, price controls and export controls. When such disruptions occur, they may adversely impact our operations and threaten the economic viability of our projects or our ability to meet our production targets.
Both Colombia and Ecuador may experience future political and economic instability. Colombia has experienced social, economic and security turmoil related to security, guerilla and narcotrafficking. Political changes because of future electoral processes could result in new governments or the adoption of new policies, laws or regulations that might assume a substantially more hostile attitude toward foreign investment, including but not limited to: the imposition of additional taxes as was the case in 2022; nationalization; changes in energy or environmental policies or the personnel administering them; changes in oil and natural gas pricing policies; and royalty changes or increases. In an extreme case, such a change could result in termination of contract rights and expropriation of foreign-owned assets or renegotiation or nullification of existing concessions and contracts. Any changes in the oil and gas or investment regulations and policies or a shift in political attitudes in Colombia or Ecuador are beyond our control and may significantly hamper our ability to expand our operations in the region or operate our business at a profit. Colombia has investment protection treaties in place with the United States and Canada as well as a history of sanctity of contracts.
Oil production in Ecuador has been impacted by outages experienced by the nation’s two major pipelines (the Sistema de Oleoductos Trans Ecuadoriano (“SOTE”) and the Oleoducto de Crudos Pesados (“OCP”) pipelines) caused by physical damage from significant soil erosion in areas along the Coca river. While these pipelines have now been rerouted and are back in service, there remains some risk to our ability to transport oil to market through these systems from future, unforeseen natural events that could again generate outages in the OCP and SOTE pipelines. Such events could include, but are not limited to, earthquakes, volcanic eruptions and additional significant soil erosion.
We are vulnerable to risks associated with geographically concentrated operations
The vast majority of our production comes from four fields located in Colombia. For the year ended December 31, 2024, the Acordionero, Costayaco, Moqueta and Cohembi fields collectively generated 79% of our production and at December 31, 2024, these four fields accounted for 42% of our proved reserves. As a result of this concentration, we may be disproportionately exposed to the impact of, among other things, regional supply and demand factors including limitations on our ability to most profitably sell or market our oil and natural gas to a smaller pool of potential buyers, delays or interruptions of production from wells in these areas caused by governmental regulation, community protests, guerrilla activities, processing or transportation capacity constraints, continued authorization by the government to explore and drill in these areas, severe weather events and the availability of drilling rigs and related equipment, facilities, personnel or services. Due to the concentrated nature of our portfolio of properties, a number of our properties could experience any of the same conditions at the same time, resulting in a relatively greater impact on our results of operations than they might have on other companies that have a more diversified portfolio of properties.
We rely on local infrastructure and the availability of transportation for storage and shipment of our products. The infrastructure in Colombia and Ecuador, including storage and transportation facilities, is less developed than that in North America and may be insufficient for our needs at commercially acceptable terms in the localities in which we operate. Further, we operate in remote areas in both South America and Canada and may rely on helicopters, boats or other transportation methods. Some of these transport methods may result in increased levels of risk, including the risk of accidents involving serious injury or loss of life, and could lead to operational delays which could affect our ability to add to our reserve base or produce oil or natural gas and could have a significant impact on our reputation or cash flow. Additionally, some of this equipment is specialized and may be difficult to obtain in our areas of operations, which could hamper or delay operations, and could increase the cost of those operations.
Further, adverse weather conditions, such as flooding and severe cold weather, may interrupt or curtail our operations, cause supply disruptions, and damage our equipment and facilities. During the winter months in Canada, heavy snow, ice, or rain may
adversely affect our ability to operate. Also, during the spring thaw, which normally starts in late March and continues through June, some areas in Canada may impose transportation restrictions to prevent damage caused by the spring thaw.
Social disruptions or community disputes in Colombia and Ecuador may delay production and result in lost revenue
To enjoy the support and trust of local populations and governments in Colombia and Ecuador, we must demonstrate a commitment to providing local employment, training and business opportunities; a high level of environmental performance; open and transparent communication; and a willingness to discuss and address community issues including community development investments that are carefully selected, not unduly costly and bring lasting social and economic benefits to the community and the area. Improper management of these relationships could lead to a delay or suspension of operations, loss of license or major impact to our reputation in these communities, which could adversely affect our business. We cannot ensure that such issues or disruptions will not be experienced in the future, and we cannot predict their potential impacts, which may include delays or loss of production, standby charges, stranded equipment, or damage to our facilities. We also cannot ensure that we will not experience protests or blockades erected by criminal groups or cultivators of illegal crops, in response to the Colombian government's eradication of such crops, if such crops are grown in proximity to roads required to access our operations. In addition, we must comply with legislative requirements for prior consultation with communities and ethnic groups who are affected by our proposed projects in Colombia and Ecuador. Notwithstanding our compliance with these requirements, we may be sued by such communities through a writ for protection of tutela in the Colombian courts for enhanced consultation, potentially leading to increased costs, operational delays and other impacts. In addition, several areas in Colombia have conducted Popular Consultations and essential referendums on extractive industries. The referendums were organized by opponents of the mining or oil and natural gas industries. It remains unclear to what extent such results can impact the exercise of mineral rights conferred by the national government. In 2024, the Colombian government commenced peace process conversations with illegal groups in the country, but it is not clear if these discussions will resolve the disruptions.
Security concerns in Colombia or Ecuador may disrupt our operations
Oil pipelines have historically been primary targets of terrorist activity in Colombia. Although a Peace Agreement was ratified by the Colombian government in 2016, the result of which was the demobilization and disarmament of the Revolutionary Armed Forces of Colombia (“FARC”), there continue to be examples of violence against pipelines and other infrastructure that has been attributed to former FARC dissident groups and other illegal groups. It is not currently known whether or to what degree violence will continue and whether and to what degree that violence may impact our operations. Notwithstanding the Peace Agreement ratified and the ongoing efforts to implement such Agreements, increased eradication by the Colombian government of illicit crops, as well as the continuing attempts by the Colombian government to reduce or prevent activity of guerrilla dissidents and of farmers, such efforts may not be successful and such activity may continue to disrupt our operations in the future or cause us higher security costs and could adversely impact our financial condition, results of operations or cash flows.
Colombia and Ecuador have experienced social turmoil related to changes in economic policy, which have resulted in illegal road blockades throughout the countries, and illegal invasions to private property and impacting regions where our operating activities are located. While blockages have been historically directed at the State, the resulting impact may hinder our ability to mobilize oil, personnel and equipment, resulting in temporary shut-in of production or negatively impacting our assets.
Colombia and Ecuador also both have a history of security problems. Our efforts to ensure the security of our personnel and physical assets may not be successful and there can also be no assurance that we can maintain the safety of our field personnel or our contractors’ field personnel and our Bogota and Quito head office personnel or operations in Colombia and Ecuador or that this violence will not adversely affect our operations in the future and cause significant loss. If these security problems disrupt our operations, our financial condition and results of operations could be adversely affected.
A substantial portion of our revenue is generated outside of Canada and the United States, and if we determine to, or are required to, repatriate earnings from foreign jurisdictions, we could be subject to taxes
A substantial portion of our revenue is generated outside of Canada and the United States. The cash generated from operations abroad is generally not available to fund domestic or head office operations unless funds are repatriated. At this time, we do not intend to repatriate further funds, other than to pay head office charges, but if we did, we might have to accrue and pay withholding taxes in certain jurisdictions on the distribution of accumulated earnings. Undistributed earnings of foreign subsidiaries are considered to be permanently reinvested and a determination of the amount of unrecognized deferred tax liability on these undistributed earnings is not practicable.
Certain acquisitions could adversely affect our financial results
We may pursue strategic acquisitions, such as our recent acquisition of i3 Energy, as part of our business strategy from time to time. There is no assurance that we will be able to find suitable acquisition candidates or be able to complete acquisitions on favorable terms, if at all. We may also discover liabilities or deficiencies associated with any acquisitions that were not identified in advance, which may result in unanticipated costs. Additionally, integration efforts associated with our acquisitions may require significant capital and operating expense.
We intend to pay for future acquisitions using cash, stock, notes, debt, assumption of indebtedness or any combination of the foregoing. To the extent that we do not generate sufficient cash internally to provide the capital we require to fund our growth strategy and future operations, we will require additional debt or equity financing. This additional financing may not be available or, if available, may not be on terms acceptable to us. Further, high volatility in the capital markets and in our stock price may make it difficult for us to access the capital markets at attractive prices, if at all.
In addition, the anticipated benefits of an acquisition may not be realized fully or at all, or may take longer to realize than we expect. For example, the success of our acquisition of i3 Energy will depend, in significant part, on our ability to successfully integrate i3 Energy and realize the anticipated strategic benefits and synergies from the acquisition. The combination of independent businesses is complex, costly and time consuming, and we have devoted, and will continue to devote, significant management attention and resources to integrating the respective business practices and operations of the companies. Further, the anticipated benefits of the acquisition may not be realized fully or at all, or may take longer to realize than we expect. In connection with our acquisition of i3 Energy, we acquired assets in block 13/23c in the UK North Sea, management has not allocated any value to this block and there is significant uncertainty that any value can be realized upon disposition or relinquishment. Actual operating, technological, strategic and revenue opportunities, if achieved at all, may be less significant than we expect or may take longer to achieve than anticipated. If we are not able to achieve these objectives and realize the anticipated benefits and synergies expected from the acquisition within a reasonable time, our business, financial condition and operating results may be adversely affected.
The threat and impact of cybersecurity incidents may adversely impact our operations and could result in information theft, data corruption, operational disruption, and/or financial loss
We use digital technologies and software programs to interpret seismic data, manage drilling rigs, conduct reservoir modeling and reserves estimation, as well as to process and record financial and operating data. We depend on digital technology, including information systems and related infrastructure as well as cloud application and services, to store, transmit, process and record sensitive information (including trade secrets, employee information and financial and operating data), communicate with our employees and business partners, analyze seismic and drilling information, estimate quantities of oil and gas reserves and for many other activities related to our business. The complexities of the technologies needed to explore for and develop oil and gas in increasingly difficult physical environments, and global competition for oil and gas resources make certain information attractive to thieves. Our business processes depend on the availability, capacity, reliability and security of our information technology infrastructure and our ability to expand and continually update this infrastructure in response to our changing needs and therefore it is critical to our business that our facilities and infrastructure remain secure. While we have implemented strategies to mitigate impacts from these types of events, we cannot guarantee that measures taken to defend against cybersecurity risks and threats will be sufficient for this purpose. The ability of the information technology function to support our business in the event of a security breach or a disaster such as fire or flood and our ability to recover key systems and information from unexpected interruptions cannot be fully tested and there is a risk that, if such an event actually occurs, we may not be able to address immediately the repercussions of the breach or disaster. In that event, key information and systems may be unavailable for a number of days or weeks, leading to our inability to conduct business or perform some business processes on a timely manner. Moreover, if any of these events were to materialize, they could lead to losses of sensitive information, critical infrastructure, personnel or capabilities essential to our operations and could have a material adverse effect on our reputation, financial condition or results of operations.
Our employees have been and will continue to be targeted by parties using fraudulent “spoof” and “phishing” emails to misappropriate information or to introduce viruses or other malware through “trojan horse” programs to our computers. These emails appear to be legitimate emails but direct recipients to fake websites operated by the sender of the email or request that the recipient send a password or other confidential information through email or download malware. Despite our efforts to mitigate “spoof” and “phishing” emails through policies and education, “spoof” and “phishing” activities remain a serious risk that may result in damage our information technology infrastructure.
We may be adversely affected by global epidemics or public health crises
Global epidemics and public health crises and fear of such events may adversely impact our operations and the global economy, including the worldwide demand for oil and natural gas. The extent to which our business, results of operations and financial
condition will be affected by such events depend on future developments, many of which are outside of our control, such as the duration, severity, and sustained geographic spread of the virus, and the impact and effectiveness of governmental actions to contain and treat outbreaks, including government policies and restrictions; vaccine hesitancy, vaccine mandates, and voluntary or mandatory quarantines; and the global response surrounding such uncertainties. To the extent any global epidemic or public health crisis may adversely affect our business, operations, financial condition and operating results, it may also have the effect of heightening the other risks described herein.
Risks Related to our Financial Condition
Our business requires significant capital expenditures, and we may not have the resources necessary to fund these expenditures
Our base capital program for 2025 is $240.0 million to $280.0 million for exploration and development activities. We expect to fund our 2025 capital program through cash flows from operations. Funding this program from cash flows from operations relies in part on average Brent oil prices of $75 per barrel, WTI oil prices of $71 per barrel and gas prices of C$2.50 per mcf or greater. For the period from January 1 to February 20, 2025, the average prices of Brent oil, WTI oil and AECO natural gas were $77.24 per barrel, $73.86 per barrel and C$2.04 per mcf, respectively.
If cash flows from operations and cash on hand are not sufficient to fund our capital program, we may be required to seek external financing or to delay or reduce our exploration and development activities, which could impact production, revenues and reserves.
If we require additional capital, we may pursue sources of capital through various financing transactions or arrangements, including joint venturing of projects, debt financing, equity financing or other means. We may not be able to access capital on favorable terms or at all. If we do succeed in raising additional capital, future financings may be dilutive to our shareholders, as we could issue additional shares of Common Stock or other equity to investors. In addition, debt and other mezzanine financing may involve a pledge of assets, require covenants that would restrict our business activities, and may be senior to interests of equity holders. We may incur substantial costs in pursuing future capital financing, including investment banking fees, legal fees and other costs. We may also be required to recognize non-cash expenses in connection with certain securities we may issue, such as convertibles and warrants, which would adversely impact our financial results.
Our ability to obtain needed financing may be impaired by factors such as weak capital markets (both generally and for the oil and gas industry in particular), the location of our oil and natural gas properties, including our assets in Colombia, Ecuador and Canada, low or declining prices of oil and natural gas on the commodities markets, and the loss of key management. Further, if oil or natural gas prices on the commodities markets decrease, then our revenues will likely decrease, and such decreased revenues may increase our requirements for capital. Some of the contractual arrangements governing our exploration activity may require us to commit to certain capital expenditures, and we may lose our contract rights if we do not have the required capital to fulfill these commitments. If the amount of capital we are able to raise from financing activities, together with our cash flows from operations, is not sufficient to satisfy our capital needs, we may be required to curtail our operations.
Public and investor sentiment towards climate change, fossil fuels and other Environmental, Social and Governance (“ESG”) matters could adversely affect our cost of capital and the price of our common stock
Certain members of the investment community (including investment fund managers, sovereign wealth, pension and endowment funds, and individual investors) have promoted the divestment of fossil fuel equities and pressured lenders to cease or limit funding to companies engaged in the extraction of fossil fuel reserves, including divestment actions by several prominent New York State and New York public employee pension funds. There has also been pressure on lenders and other financial services companies to limit or curtail financing of companies in the oil and gas industry. Such environmental initiatives aimed at targeting climate changes could ultimately interfere with our access to capital and ability to finance our operations.
Some members of the investment community have increased their focus on ESG practices and disclosures by public companies, including practices and disclosures related to climate change and sustainability, diversity, equity and inclusion initiatives, and heightened governance standards, while others have criticized companies for such practices and modified their investments as a result of the same initiatives. Furthermore, concerns over climate change have resulted in, and are expected to continue to result in, the adoption of regulatory requirements for climate-related disclosures. As a result, we may continue to face increasing pressure regarding our ESG disclosures and practices, and mandatory reporting obligations could increase our compliance burden and costs. We publish a Sustainability Report, which outlines our progress and ongoing efforts to advance our ESG initiatives. Our disclosures on these matters rely on management’s expectations as of the date the statements are first made, as
well as standards for measuring progress that are still in development, and may change or fail to be realized. These expectations and standards may continue to evolve.
A failure to meet our publicly disclosed goals or evolving stakeholder expectations of ESG practices and reporting may increase the risk of litigation with respect to such goals or expectations, potentially harm our reputation and impact employee retention, customer relationships, and access to capital.
Foreign currency exchange rate volatility may affect our financial results
We sell our oil and natural gas production under agreements that are denominated mainly in U.S. dollars and Canadian dollars. Many of the operational and other expenses we incur in Colombia, including current and deferred tax assets and liabilities, are denominated in Colombian pesos. Our capital and operational expenditures in Canada and most of our administration costs in Canada are incurred in Canadian dollars. As a result, we are exposed to translation risk when local currency transactions are translated to U.S. dollars, our reporting currency. An appreciation of local currencies can increase our costs and negatively impact our results from operations. Because our Consolidated Financial Statements are presented in U.S. dollars, we must translate revenues, expenses and income, as well as assets and liabilities, into U.S. dollars at exchange rates in effect during or at the end of each reporting period. We are also exposed to transaction risk on settlement of payables and receivables denominated in foreign currency.
Legal and Regulatory Risks
We are dependent on obtaining and maintaining permits and licenses from various governmental authorities
Our oil and natural gas exploration and production operations are subject to complex and stringent laws and regulations. In order to conduct our operations in compliance with these laws and regulations, we must obtain and maintain numerous licenses, permits, approvals and certificates, including environmental and other operating permits. We may not be able to obtain, sustain or renew such licenses and permits on a timely basis or at all. We may also have licenses and permits rescinded or may not be able to renew expiring licenses and permits. Failure or delay in obtaining or maintaining regulatory approvals or permits could have a material adverse effect on our ability to develop and explore on our properties, and receipt of drilling permits with onerous conditions could increase our compliance costs. Loss of permits for existing drilling, water injection or other activities necessary for production may result in a decline of our production levels and revenues or damage to the well structure. Regulations and policies relating to these licenses and permits may change, be implemented in a way that we do not currently anticipate or take significantly greater time to obtain. There can be no assurance that future political conditions in Colombia and Ecuador will not result in changes to policies with respect to foreign development and ownership of oil, environmental protection, health and safety or labor relations, which may negatively affect our ability to undertake exploration and development activities in respect of present and future properties, as well as our ability to raise funds to further such activities.
As we are not the operator of all the joint ventures we are currently involved in, we may rely on the operator to obtain all necessary permits and licenses. If we fail to comply with these requirements, we could be prevented from drilling for oil and natural gas, and we could be subject to civil or criminal liability or fines. Revocation or suspension of our environmental and operating permits could have a material adverse effect on our business, financial condition and results of operations.
In Colombia, the ANH is delegated by the Ministry of Mining and Energy to offer and award new blocks through exploration and production (“E&P”) and technical evaluation agreement contract terms. The new administration has stated that no new bid rounds for exploration blocks will be done until it is decided differently by the government. In addition, in 2023 the government issued a new decree eliminating the obligation of ANH to offer bid rounds for new blocks to Companies. Under new Colombia regulation, we may not be able to obtain new exploration licenses which can have adverse impact on our future exploration activities, production and operations.
In connection with our acquisition of i3 Energy, we acquired an entity that owns and operates block 13/23c in the UK North Sea. Like other companies with UK North Sea assets, the frequent and adverse changes to the United Kingdom’s oil and gas fiscal regime have caused significant uncertainty that any value can be realized on disposition or relinquishment of UK assets. Management has no intentions to develop UK assets.
Environmental regulation and risks may adversely affect our business
Environmental regulation is stringent and the costs and expenses of regulatory compliance are increasing. All phases of the oil and natural gas business present environmental risks and hazards and are subject to environmental regulation pursuant to an extensive suite of international conventions and national and regional laws and regulations. Environmental laws and regulations in the countries in which we operate provide for, among other things, restrictions and prohibitions on spills, releases or
emissions of various substances used or produced in association with oil and gas operations. These regulations also require that wells and facility sites be operated, maintained, abandoned and reclaimed to the satisfaction of applicable regulatory authorities. Compliance with such legislation can require significant expenditures. Failure to comply with these laws and regulations may result in the suspension or termination of operations and subject us to administrative, civil and criminal fines and penalties. Our operations create the risk of significant environmental liabilities to the government of the jurisdictions in which we operate or third parties for any unlawful discharge of oil, gas or other pollutants into the air, soil or water or for certain other environmental impacts. There is uncertainty around the impact of environmental laws and regulations, including those presently in force and those expected to be proposed in the future. We cannot predict how future environmental laws will be interpreted, administered or enforced, but more stringent laws or regulations or more vigorous enforcement policies could in the future require material expenditures by us for the installation and operation of compliant systems; therefore it is impossible at this time to predict the nature and impact of those requirements on our company however they may have a material adverse impact on our business.
Given the nature of our business, there are inherent risks of oil spills at drilling or operations sites due to operational failure, accidents, sabotage, pipeline failure or tampering or escape of oil due to the transportation of the oil by truck. All of these may lead to significant potential environmental liabilities, such as damages, litigation costs, clean-up costs or penalties, some of which may be material and for which our insurance coverage maybe inadequate or unavailable.
We may be exposed to liabilities under anti-bribery laws and a finding that we violated these laws could have a material adverse effect on our business
We are subject to anti-bribery laws in the United States, Canada, Ecuador and Colombia and will be subject to similar laws in other jurisdictions where we may operate in the future. We may face, directly or indirectly, corrupt demands by officials, tribal or insurgent organizations, international organizations, or private entities. As a result, we face the risk of unauthorized payments or offers of payments by employees, contractors, agents, and partners of ours or our subsidiaries or affiliates, given that these parties are not always subject to our control or direction. It is our policy to prohibit these practices. However, our existing safeguards and any future improvements to those measures may prove to be less than effective or may not be followed, and our employees, contractors, agents, and partners may engage in illegal conduct for which we might be held responsible. A violation of any of these laws, even if prohibited by our policies, may result in criminal or civil sanctions or other penalties (including profit disgorgement) as well as reputational damage and could have a material adverse effect on our business and financial condition.
If the United States imposes sanctions on Colombia, Ecuador or Canada in the future, our business may be adversely affected
Colombia is among several nations whose eligibility to receive foreign aid from the United States is dependent on its progress in stemming the production and transit of illegal drugs, which is subject to an annual review by the President of the United States. Although Colombia is currently eligible for such aid, it may not remain eligible in the future. A finding by the President that Colombia has failed demonstrably to meet its obligations under international counter-narcotic agreements may result in the imposition of economic and trade sanctions on Colombia which could result in adverse economic consequences in Colombia including potentially threatening our ability to obtain necessary financing to develop our Colombian properties, and could further heighten the political and economic risks associated with our operations there. The United States may in the future impose similar eligibility restrictions on foreign aid provided to Ecuador. The president of the United States declared that Canada, among other countries, is responsible for illegal immigration and drug transit to United States and is in the process of implementing 10% tariffs on energy resources from Canada. Implementation of tariffs could have adverse impact on our profitability from Canadian operations.
Regulations related to emissions and the impact of any changes in climate could adversely impact our business, including demand for our products, our financial condition and results of operations
Governments around the world have become increasingly focused on regulating greenhouse gas (“GHG”) emissions and addressing the impacts of climate change in some manner. GHG emissions legislation is emerging and is subject to change. For example, on an international level, in December 2015, almost 200 nations, including Canada, Colombia and, by ratification in July 2017, Ecuador, agreed to an international climate change agreement in Paris, France (the “Paris Agreement”), that calls for countries to set their own GHG emission targets and be transparent about the measures each country will use to achieve its GHG emission targets. Although it is not possible at this time to predict how this legislation or any new regulations that may be adopted to address GHG emissions would impact our business, any such future laws and regulations that limit emissions of GHGs could adversely affect demand for the oil and natural gas that we produce. Current GHG emissions legislation has not resulted in material compliance costs; however, emissions, carbon and other regulations impacting climate and climate related matters are constantly evolving. It is not possible at this time to predict whether proposed legislation or regulations will be adopted, and any such future laws and regulations could result in additional compliance costs or additional operating
restrictions. If we are unable to recover a significant amount of our costs related to complying with climate change regulatory requirements imposed on us, it could have a material adverse impact on our business, financial condition and results of operations. Significant restrictions on GHG emissions could result in decreased demand for the oil and natural gas that we produce, with a resulting decrease in the value of our reserves. Increasing attention to the risks of climate change has resulted in an increased possibility of lawsuits brought by public and private entities against oil and natural gas companies in connection with their GHG emissions. Should we be targeted by any such litigation, we may incur liability, which, to the extent that societal pressures or political or other factors are involved, could be imposed without regard to the Company’s causation of or contribution to the asserted damage, or to other mitigating factors. Finally, although we strive to operate our business operations to accommodate expected climatic conditions, to the extent there are significant changes in the Earth’s climate, such as more severe or frequent weather conditions in the markets we serve or the areas where our assets reside, we could incur increased expenses, our operations could be materially impacted, and demand for our products could fall. In 2024, El-Niño-induced drought experienced across Colombia resulted in a decrease in power generated from hydroelectricity which increased power costs and resulted in higher operating expenses.
Reduction, elimination or expiration of government subsidies
The profitability of our business depends on government-imposed financial instruments such as carbon taxes and carbon tax credits. Any of these financial instruments may be changed by the relevant government and such changes may adversely affect
the profitability of some or all of our business. There is a risk that accounting for GHG releases and the rate of carbon taxation and the level it reaches will be changed from time to time, creating an economic environment of uncertainty. This risk is further complicated by the dependency of Canadian hydrocarbon energy producers on exports to the United Stated and the uncertainty as to how the United Stated will regulate GHG emissions related to domestic and Canadian production.
Carbon taxes and environmental compliance costs
The crude oil and natural gas industry is subject to environmental regulation pursuant to municipal, provincial and federal legislation in Canada. Such legislation may be changed to impose higher standards and potentially more costly obligations. Policies aimed at reducing emissions of carbon dioxide and methane could become a burden on crude oil and natural gas commodities relative to other sources of energy in the marketplace. Furthermore, there is no assurance that any such programs or regulatory amendments, if proposed and enacted, may contain emission reduction targets that we can meet. Financial penalties or charges could be incurred as a result of the failure to meet such targets. As carbon accounting rules and carbon emissions penalties evolve, distributed small-scale use of hydrocarbon-based fuels may become very costly, which may motivate the discontinued use of hydrocarbon-based fuels. This evolution, if it occurs, may severely reduce the hydrocarbon-production market to large consumers that have carbon capture and storage capability.
Risks Related to Ownership of our Common Stock
Shares of our Common Stock are listed on the NYSE American, the Toronto Stock Exchange (“TSX”) and the London Stock Exchange (“LSE”) and investors seeking to take advantage of price differences between such markets may create unexpected volatility in market prices
Shares of our Common Stock are listed on the NYSE American, the TSX and the LSE. While the shares of Common Stock are traded on such markets, the price and volume levels could fluctuate significantly on any market independently of the price or trading volume on other markets. Investors could seek to sell or purchase shares of Common Stock to take advantage of any price differences between the NYSE American, the TSX and the LSE through a practice referred to as arbitrage. Any arbitrage activity could create unexpected volatility in the price of the shares of Common Stock on any of these exchanges or the volume of shares of Common Stock available for trading on any of these markets. In addition, shareholders in any of these jurisdictions will not be able to transfer such shares of Common Stock for trading on another market without effecting necessary procedures with our transfer agent or registrar. This could result in time delays and additional cost for shareholders of the Common Stock.
The market price of our Common Stock may be volatile
The market price for shares of our Common Stock has experienced and may continue to experience volatility. For example, during 2024, the market price for shares of our Common Stock ranged from a low of $4.72 per share to a high of $10.40 per share. The market price for shares of our Common Stock may be influenced by many factors, some of which are beyond our control, including those described above and the following:
•strategic actions or announcements by us of significant contracts, acquisitions, joint marketing relationships, joint ventures or capital commitments;
•general economic and stock market conditions;
•volatility in commodity prices;
•risks related to our business and our industry, including those discussed above;
•changes in conditions or trends in our industry, markets or customers;
•geopolitical events or terrorist acts;
•trading volume of our Common Stock;
•future sales of shares of our Common Stock or other securities by us, members of our management team or our existing shareholders; and
•investor perceptions of the investment opportunity associated with our industry or securities relative to other investment alternatives.
These market and industry factors may materially reduce the market price for shares of our Common Stock, regardless of our operating performance.
Item 1B. Unresolved Staff Comments
None.
Item 1C. Cybersecurity
Governance
Board of Directors
The Board of Directors (“the Board”) has delegated the primary responsibility to oversee risks from cybersecurity threats to the Audit Committee. The Board and Audit Committee periodically review the measures implemented by the Company to identify and mitigate data protection and cybersecurity risks. The Board and Audit Committee are updated on a quarterly basis by Vice President, Corporate Services on the Company’s internal information technology (“IT”) security testing, any unauthorized attempts to access the Company’s network, any significant developments in cyber security risks and threats, and updates on the Company’s policies and procedures for protecting the Company’s data. We also have processes by which certain cybersecurity incidents are escalated within the Company and, where appropriate, reported in a timely manner to the Board and Audit Committee. All incidents are reported to the Executive Officers (including the President and Chief Executive Officer, Chief Financial Officer and the Chief Operating Officer) who assess the severity and what measures and procedures are necessary.
As part of the Company’s enterprise risk management, the Board of the Company receives, reviews and assesses reports from the Board’s committees and from management relating to enterprise-level risks. The Audit Committee reports its cybersecurity risk assessments to the full Board at each regularly scheduled Board meeting.
Management
The Executive Officers and Executive Vice President, Corporate Services are involved in all significant and appropriate cybersecurity decisions on the implementation and design of our IT architecture. Executive Vice President, Corporate Services, along with support from the Director of IT, is responsible for the assessment and management of risks from cybersecurity threats and oversees the implementation of IT processes, which includes cybersecurity, into the core business of the Company. The Director of IT has extensive cybersecurity knowledge and skills gained from over 20 years of relevant work experience. The Director of IT discusses all potential changes to the Company’s controls or detection systems with the Executive Vice President, Corporate Services prior to implementation. The Executive Vice President, Corporate Services is updated by the Director of IT on a periodic basis regarding trends in technology and cybersecurity threats or any potential changes to the Company’s cybersecurity program. The Director of IT is informed about and monitors the prevention, detection, mitigation, and remediation of cybersecurity incidents through a number of experienced direction systems and third party cybersecurity providers. The Executive Vice President, Corporate Services also attends certain meetings of the Audit Committee to report information on material risks from cybersecurity threats. None of our critical core business activities that impact production, transportation or sales of oil and gas are remotely controlled.
Risk Management and Strategy
We have implemented a cybersecurity program to assess, identify, mitigate and manage risks from cybersecurity threats that may result in material adverse effects on the confidentiality, integrity, and availability of our information systems. As part of this program, we have processes in place that include a variety of controls, systems, and technologies designed to prevent or mitigate data loss, theft, misuse, or other cybersecurity incidents affecting the data we collect, process, store, and transmit as part of our business. We conduct penetration testing and cybersecurity audits, and require all employees to undertake data
protection and cybersecurity training on an annual basis. We also use systems and processes designed to oversee and identify risks associated with our use of third-party service providers, including with respect to the occurrence of a cybersecurity incident at a third-party service provider or that otherwise implicates a third-party technology or system we use. We contract cybersecurity specialists to review and implement controls and structural mechanisms in order to enhance our cybersecurity program, and protect against and detect cybersecurity threats.
To our knowledge, we have not experienced any risks from cybersecurity threats or incidents through the date of this annual report that have materially affected or are reasonably likely to materially affect the Company, its business strategy, results of operation or financial condition. This does not guarantee that future incidents or threats will not have a material impact or that we are not currently the subject of an undetected incident or threat that may have such an impact. In particular, sophisticated nation state actors have targeted critical infrastructure, and may continue to do so in the future.
Additional information on cybersecurity risks we face is discussed in “Risk Factors” in Item 1A, which should be read in conjunction with the foregoing information.
Item 3. Legal Proceedings
We have several lawsuits and claims pending. The outcome of the lawsuits and disputes cannot be predicted with certainty. We believe the resolution of these matters would not have a material adverse effect on the Company’s consolidated financial position, results of operations, or cash flows. We record costs as they are incurred or become probable and determinable.
Item 4. Mine Safety Disclosures
Not applicable.
Information About Our Executive Officers
Set forth below is information regarding our executive officers as of February 20, 2025:
| | | | | | | | | | | | | | |
| Name | | Age | | Position |
| Gary S. Guidry | | 69 | | President and Chief Executive Officer, Director |
| Ryan Ellson | | 49 | | Chief Financial Officer and Executive Vice President, Finance |
| Sebastien Morin | | 48 | | Chief Operating Officer |
| Phillip Abraham | | 54 | | Executive Vice President, Legal and Land |
| James Evans | | 59 | | Executive Vice President, Corporate Services |
•Gary S. Guidry, President and Chief Executive Officer, Director. Mr. Guidry has been Gran Tierra’s Chief Executive Officer and President since May 7, 2015. From July 2011 to July 2014, Mr. Guidry served as President and Chief Executive Officer of Caracal Energy Inc. Mr. Guidry also served as President and CEO of Orion Oil & Gas Corp. from October 2009 to July 2011, Tanganyika Oil Corp. from May 2005 to January 2009, and Calpine Natural Gas Trust from October 2003 to February 2005. As Chief Executive Officer of these companies, Mr. Guidry was responsible for overseeing all aspects of the respective company’s business. Mr. Guidry currently sits on the board of Africa Oil Corp. (since April 2008) where he also serves as a member of the Audit Committee. Mr. Guidry was on the board of PetroTal Corp. from December 2017 until September 2022. From September 2010 to October 2011, Mr. Guidry served on the board of Zodiac Exploration Corp., from October 2009 to March 2014, he served on the board of TransGlobe Energy Corp., and from February 2007 to May 2018, he served on the board of Shamaran Petroleum Corp. Prior to these positions, Mr. Guidry served as Senior Vice President and subsequently President of Alberta Energy Company International, and President and General Manager of Canadian Occidental Petroleum’s Nigerian operations. Mr. Guidry has directed exploration and production operations in Yemen, Syria and Egypt and has worked for oil and gas companies around the world in the U.S., Colombia, Ecuador, Venezuela, Argentina and Oman. Mr. Guidry is an Alberta-registered professional engineer (P. Eng.) and holds a B.Sc. in petroleum engineering from Texas A&M University.
•Ryan Ellson, Chief Financial Officer and Executive Vice President, Finance. Mr. Ellson has been Gran Tierra’s Chief Financial Officer since May 2015. Mr. Ellson has over 24 years of experience in a broad range of international corporate finance and accounting roles. Mr. Ellson is currently a Director of Beyond Renewables (private company) and previously was a Director of Canaary Biofuels (until October 2024) and Director at PetroTal Corp. (until September 2022). From July 2014 until December 2014 Mr. Ellson was Head of Finance for Glencore E&P (Canada) Inc. and prior thereto Vice President, Finance at Caracal Energy Inc.(“Caracal”), a London Stock Exchange (“LSE”) listed company with operations
in Chad, Africa from August 2011 until July 2014. Glencore E&P (Canada) purchased Caracal in July 2014. Mr. Ellson has held management and executive positions with companies operating in Chad, Egypt, India and Canada. Mr. Ellson is a Chartered Professional Accountant and holds a Bachelor of Commerce and a Masters of Professional Accounting from the University of Saskatchewan. Mr. Ellson has completed the Leadership for Senior Executives program at Harvard Business School and the General Management Program at the Wharton School of the University of Pennsylvania.
•Sebastien Morin, Chief Operating Officer. Mr. Morin was appointed as Gran Tierra’s Chief Operations Officer on November 6, 2023. Mr. Morin has more than 20 years of experience in the oil and gas industry in various management positions. Prior to his appointment as Chief Operating Officer of the Company, Mr. Morin served as President and Chief Operating Officer at WesternZagros Resources, a privately-owned petroleum operating company with production sharing contracts in the Kurdistan region of Iraq, from October 2021 to October 2023. Prior to his role at WesternZagros, Mr. Morin was Vice President Global Drilling and Completions at Gran Tierra, leading up to that he held progressively more senior positions at Gran Tierra in Colombia and in the Corporate Office in Calgary from August 2014 to September 2021. From May 2001 to July 2014, Mr. Morin worked at Imperial Oil (Esso) and ExxonMobil, where he achieved more senior technical and managerial positions in upstream and downstream including roles in drilling and completions, reservoir development, production, customer service and distribution, mostly onshore but also with experience offshore in the Gulf of Mexico. Mr. Morin has a Bachelor of Science degree in Geological Engineering from the University of Waterloo in 2001.
•Phillip Abraham, Executive Vice President, Legal and Land. Mr. Abraham has been with Gran Tierra in a variety of roles since January 2016 and, in addition to his current role as Vice President, Legal and Business Development, is also Gran Tierra’s Corporate Secretary. He is a lawyer with over 25 years of corporate and legal experience. His legal experience includes positions at prominent law firms and is broadly based with a focus on international energy law. Mr. Abraham’s corporate experience extends to a variety of leadership positions with Cenovus Energy, Encana Corporation and Nexen Inc. His experience in oil and gas includes onshore and offshore projects located in Canada and various international jurisdictions in Latin America, Europe, Africa, Asia and the Middle East. Mr. Abraham is a member of Law Society of Alberta, holds both a B.A. and an LL.M. from the University of Calgary and a LL.B. from the University of Victoria, and was first called to the bar in British Columbia in 1997. He is credited as the author of various publications and has presented in numerous professional forums.
•James Evans, Executive Vice President, Corporate Services. Mr. Evans has been Gran Tierra’s Vice President, Corporate Services, since May 2015. Mr. Evans has over 30 years of experience including working the last 19 years in the international oil and gas industry. Most recently, Mr. Evans was the Head of Compliance & Corporate Services for Glencore E&P (Canada) Inc. from July 2014 to December 2014, and prior thereto Vice President of Compliance & Corporate Services at Caracal Energy Inc. from July 2011 to June 2014 where he oversaw the execution of corporate strategy and goals, developed and implemented a robust corporate compliance program, and managed all aspects of IT, document control, security and administration. Mr. Evans also managed the recruitment, training and retention of staff in both Calgary and Chad. He oversaw the growth of Caracal Energy from seven employees to more than 400 at the time of sale to Glencore. Prior to Caracal, Mr. Evans held senior management and executive positions at Orion Oil and Gas and Tanganyika Oil, with operating experience in Egypt, Syria and Canada. Mr. Evans holds a Bachelor of Commerce degree from the University of Calgary.
PART II
Item 5. Market for Registrant's Common Equity, Related Stockholder Matters and Issuer Purchases of Equity Securities
Shares of our Common Stock trade on the NYSE American, the TSX and on the LSE under the symbol “GTE”.
As of February 20, 2025, there were approximately 32 holders of record of shares of our Common Stock and 35,888,773 shares outstanding with $0.001 par value.
Dividend Policy
We have never declared or paid dividends on the shares of Common Stock and we intend to retain future earnings, if any, to support the development of the business and therefore do not anticipate paying cash dividends for the foreseeable future. Payment of future dividends, if any, would be at the discretion of our Board of Directors after taking into account various
factors, including current financial condition, the tax impact of repatriating cash, operating results and current and anticipated cash needs.
Issuer Purchases of Equity Securities
| | | | | | | | | | | | | | |
| (a)
Total Number of Shares Purchased | (b)
Average Price Paid per Share (1) | (c) Total Number of Shares Purchased as Part of Publicly Announced Plans or Programs | (d) Maximum Number of Shares that May Yet be Purchased Under the Plans or Programs (2) |
| October 1-31, 2024 | — | | $ | — | | — | | 3,545,872 | |
| November 1-30, 2024 | 298,450 | | $ | 6.31 | | 298,450 | | 3,247,422 | |
| December 1-31, 2024 | 189,498 | | $ | 6.76 | | 189,498 | | 3,057,924 | |
| Total | 487,948 | | $ | 6.49 | | 487,948 | | 3,057,924 | |
(1) Including commission fees paid to the broker to re-purchase the shares of Common Stock.
(2) On November 4, 2024, we implemented a share re-purchase program (the “2024 Program”) through the facilities of the TSX, the NYSE American or alternative trading programs in Canada or the United States commencing November 6, 2024 and ending on November 5, 2025. Under the 2024 Program, we are able to purchase at prevailing market prices up to 3,545,872 shares of Common Stock, representing approximately 10% of the public float of common shares as of October 31, 2024.
Performance Graph
The information in this Annual Report on Form 10-K appearing under the heading “Performance Graph” is being “furnished” pursuant to Item 201(e) of Regulation S-K under the securities Act and shall not be deemed to be “soliciting material” or “filed” with the SEC or subject to Regulation 14A or 14C, other than as provided in Item 201(e) of Regulation S-K, or to the liabilities of Section 18 of the Exchange Act and shall not be deemed incorporated by reference into any filing under the Securities Act or the Exchange Act except to the extent that we specifically incorporate it by reference into such filing.
The performance graph below shows the cumulative total shareholder return on our shares of the period starting on December 31, 2019, and ending on December 31, 2024, which was the end of our fiscal 2023 year. This is compared with the cumulative total returns over the same period of the S&P 500 Total Return Index and the S&P O&G E&P Select Index Total Return. The graph assumes that, on December 31, 2019, $100 was invested in our shares and $100 was invested in each of the other two indices, with dividends reinvested on the ex-dividend date without payment of any commissions. The performance shown in the graph represents past performance and should not considered an indication of future performance.
| | | | | | | | | | | | | | | | | | | | |
| 12/31/2019 | 12/31/2020 | 12/31/2021 | 12/31/2022 | 12/31/2023 | 12/31/2024 |
| Gran Tierra Energy Inc. (GTE) | $ | 100.0 | | $ | 28.2 | | $ | 59.0 | | $ | 76.7 | | $ | 43.7 | | $ | 56.0 | |
| S&P 500 Total Return (SPXT) | $ | 100.0 | | $ | 118.4 | | $ | 152.4 | | $ | 124.8 | | $ | 157.6 | | $ | 197.0 | |
| S&P O&G E&P Select Index Total Return (SPSIOPTR) | $ | 100.0 | | $ | 63.4 | | $ | 106.3 | | $ | 154.9 | | $ | 160.8 | | $ | 159.7 | |
Item 7. Management's Discussion and Analysis of Financial Condition and Results of Operations
This report, and in particular this Management’s Discussion and Analysis of Financial Condition and Results of Operations, contains forward-looking statements within the meaning of Section 27A of the Securities Act and Section 21E of the Exchange Act. Please see the cautionary language at the very beginning of this Annual Report on Form 10-K regarding the identification of and risks relating to forward-looking statements, as well as Part I, Item 1A. “Risk Factors” in this Annual Report on Form 10-K.
The following discussion of our financial condition and results of operations should be read in conjunction with the “Financial Statements and Supplementary Data” as set out in Part II, Item 8 of this Annual Report on Form 10-K. This Management’s Discussion and Analysis of Financial Condition and Results of Operations generally discusses items related to the fiscal year ended December 31, 2024, and year-to-year comparisons between the fiscal years ended December 31, 2024, and 2023, respectively. Discussions of items related to the fiscal year ended December 31, 2023 and year-to-year comparisons between the fiscal years ended December 31, 2023 and 2022, respectively, that are not included in this Annual Report on Form 10-K can be found in “Management’s Discussion and Analysis of Financial Condition and Results of Operations” in Part II, Item 7 of the Company’s Annual Report on Form 10-K for the fiscal year ended December 31, 2023. On May 5, 2023, the Company completed 1-for-10 reverse stock split of the Company’s Common Stock. As a result of the reverse stock split, every ten of the Company’s issued shares of Common Stock were automatically combined into one issued share of Common Stock. All share and per share data included in this Annual Report on Form 10-K have been retroactively adjusted to reflect the reverse stock split.
Overview
We are a company focused on oil and gas exploration and production, with assets in Colombia, Canada and Ecuador. Our Colombian properties represented 47%, our Canadian properties represented 46% and our Ecuadorian properties represented 7% of our proved reserves NAR at December 31, 2024, and for the year ended December 31, 2024, 93% of our revenue was
generated in Colombia (2023 - 97% and 2022 -100%), 3% of our revenue was generated in Canada (2023 and 2022 - nil) and 4% (2023 - 3%, 2022 - nil) of our revenue was generated in Ecuador. We are headquartered in Calgary, Alberta, Canada.
As of December 31, 2024, we had estimated proved reserves NAR of 135.0 MMBOE, an 82% increase from the prior year, of which 50% were proved developed reserves and 62% were oil.
Financial and Operational Highlights
Key Highlights
•On October 31, 2024, we acquired oil and natural gas reserves and production operations in Canada through the acquisition of all of the issued and outstanding common shares of i3 Energy, subsequently renamed Gran Tierra UK Limited (“Gran Tierra UK”), for $204.5 million. We consolidated operating activities for the last two months of 2024 as a result of the i3 Energy acquisition
•Net income in 2024 was $3.2 million or $0.10 per share basic and diluted compared to a net loss of $6.3 million or $(0.19) per share basic and diluted in 2023
•Income before income taxes in 2024 was $44.6 million compared to $106.2 million in 2023
•Adjusted EBITDA(2) in 2024 was $366.8 million compared to $399.4 million in 2023
•In 2024, we re-purchased 0.5 million and 1.7 million shares of Common Stock through the 2024 and 2023 share re-purchase programs, representing about 1% and 5%, respectively, of shares outstanding as of December 31, 2024
•Our 2024 average production NAR was 27,890 BOEPD, an increase from 26,099 BOEPD in 2023 as a result of two-months of production from the newly acquired Canadian operations, and positive exploration drilling results in Ecuador, partially offset by lower production in the Acordionero field
•Our 2024 oil, natural gas and NGL sales volumes NAR increased by 6% to 27,436 BOEPD compared to 25,947 BOEPD in 2023
•Oil, natural gas and natural gas liquids (“NGL”) sales for 2024 decreased by 2% to $621.8 million compared to $637.0 million in 2023, primarily as a result of a 3% decrease in Brent price, lower in sales volumes in Colombia, offset by increase in sales volumes in Ecuador, lower differentials, and the addition of natural gas and NGL into the portfolio via the Canadian acquisition in 2024
•In 2024, we generated net cash provided by operating activities of $239.3 million, an increase of 5% from $228.0 million in 2023
•Operating expenses per boe for 2024 were $20.15, 2% higher compared to 2023, primarily due to higher workovers. removal of diesel subsidies and higher natural gas and electricity costs in Colombia, partially offset by lower operating costs in Ecuador as a result of production ramp-up in 2024. Total operating expenses were $202.3 million in 2024, compared to $186.9 million in 2023, representing an 8% increase as a result of two months of Canadian production
•Quality and transportation discounts per boe increased in 2024 to $17.93 when compared to $14.90 in 2023 primarily due to higher differentials
•Transportation expenses per boe for 2024 increased by 19% to $1.84 compared to $1.54 in 2023, due to higher sales volumes transported in Ecuador, two months transportation of sales volumes in Canada through pipelines, and an increase in trucking tariffs for Acordionero volumes in 2024
•General and administrative (“G&A”) expenses before stock-based compensation per boe for 2024 decreased by 6% to $3.97 compared to $4.24 in 2023 due to lower business development, consulting and legal expenses during 2024. G&A expenses before stock-based compensation were $39.9 million in 2024 compared to $40.1 million in 2023, representing a 1% decrease
•Capital expenditures increased by $7.7 million or 3% to $234.2 million compared to 2023 due to a higher number of wells drilled in 2024 in Colombia, Ecuador and Canada.
| | | | | | | | | | | | | | | | | | | | | | | | | | | | | |
| (Thousands of U.S. Dollars, unless otherwise noted) | Year Ended December 31, |
| 2024 | | % Change | | 2023 | | % Change | | 2022 |
| SEC Compliant Reserves, NAR (MMBOE) | | | | | | | | | |
| Estimated proved oil and gas reserves | 135 | | | 82 | | | 74 | | | 12 | | | 66 | |
| | | | | | | | | |
| Estimated probable oil and gas reserves | 106 | | | 130 | | | 46 | | | 28 | | | 36 | |
| | | | | | | | | |
| Estimated possible oil and gas reserves | 75 | | | 53 | | | 49 | | | 26 | | | 39 | |
| | | | | | | | | |
| Average Consolidated Daily Volumes (BOEPD) | | | | | | | | | |
| Working interest (“WI”) production before royalties | 34,710 | | | 6 | | | 32,647 | | | 6 | | | 30,746 | |
| Royalties | (6,820) | | | 4 | | | (6,548) | | | (6) | | | (6,931) | |
| Production NAR | 27,890 | | | 7 | | | 26,099 | | | 10 | | | 23,815 | |
| (Increase) decrease in inventory | (454) | | | (199) | | | (152) | | | (28) | | | (119) | |
Sales (1) | 27,436 | | | 6 | | | 25,947 | | | 9 | | | 23,696 | |
| | | | | | | | | |
| Net Income (Loss) | $ | 3,216 | | | 151 | | | $ | (6,287) | | | (105) | | | $ | 139,029 | |
| | | | | | | | | |
| Operating Netback | | | | | | | | | |
| Oil, natural gas and NGL sales | $ | 621,849 | | | (2) | | | $ | 636,957 | | | (10) | | | $ | 711,388 | |
| Operating expenses | (202,331) | | | 8 | | | (186,864) | | | 15 | | | (162,385) | |
| Transportation expenses | (18,464) | | | 27 | | | (14,546) | | | 43 | | | (10,197) | |
Operating netback (2) | $ | 401,054 | | | (8) | | | $ | 435,547 | | | (19) | | | $ | 538,806 | |
| | | | | | | | | |
| G&A Expenses Before Stock-Based Compensation | $ | 39,912 | | | (1) | | | $ | 40,124 | | | 26 | | | $ | 31,908 | |
| G&A Stock-Based Compensation | $ | 9,707 | | | 70 | | | $ | 5,722 | | | (37) | | | $ | 9,049 | |
Adjusted EBITDA (2) | $ | 366,758 | | | (8) | | | $ | 399,355 | | | (17) | | | $ | 481,882 | |
| Net Cash Provided By Operating Activities | $ | 239,321 | | | 5 | | | $ | 227,992 | | | (47) | | | $ | 427,711 | |
Funds Flow From Operations (2) | $ | 224,941 | | | (19) | | | $ | 276,785 | | | (24) | | | $ | 366,024 | |
| Capital Expenditures | $ | 234,236 | | | 3 | | | $ | 226,584 | | | 8 | | | $ | 210,331 | |
| | | | | | | | | |
| | | | | | | | | | | | | | | | | | | | | | | | | | | | | |
| | As at December 31, |
| (Thousands of U.S. Dollars) | 2024 | | % Change | | 2023 | | % Change | | 2022 |
| Cash and cash equivalents | $ | 103,379 | | | 66 | | | $ | 62,146 | | | (51) | | | $ | 126,873 | |
| | | | | | | | | |
| | | | | | | | | |
| | | | | | | | | |
| Credit facility | $ | — | | | (100) | | | $ | 36,364 | | | 100 | | | $ | — | |
| | | | | | | | | |
| Senior Notes | $ | 786,619 | | | 47 | | | $ | 536,619 | | | (7) | | | $ | 579,909 | |
(1) Sales volumes represent production NAR adjusted for inventory changes
(2) Non-GAAP measures
Operating netback, EBITDA, adjusted EBITDA, funds flow from operations, and free cash flow are non-GAAP measures which do not have any standardized meaning prescribed under U.S. General Accepted Accounting Principles (“GAAP”). Management views these measures as financial performance measures. Investors are cautioned that these measures should not be construed as alternatives to oil sales, net income (loss) or other measures of financial performance as determined in accordance with GAAP. Our method of calculating these measures may differ from other companies and, accordingly, may not be comparable to similar measures used by other companies. Disclosure of each non-GAAP financial measure is preceded by the corresponding GAAP measure so as not to imply that more emphasis should be placed on the non-GAAP measure.
Operating netback, as presented, is defined as oil, natural gas and NGL sales less operating and transportation expenses. Management believes that operating netback is a useful supplemental measure for management and investors to analyze financial performance and provides an indication of the results generated by our principal business activities prior to the consideration of other income and expenses. A reconciliation from oil, natural gas and NGL sales to operating netback is provided in the table above.
EBITDA, as presented, is defined as net income (loss) adjusted for depletion, depreciation and accretion (“DD&A”) expenses, interest expense, and income tax expense or recovery. Adjusted EBITDA, as presented, is defined as EBITDA adjusted for non-cash lease expense,
lease payments, foreign exchange gains or losses, unrealized derivative instruments gains or losses, transaction costs, other financial instruments gains or losses, other non-cash gains or losses, and stock-based compensation expense or recovery. Management uses this supplemental measure to analyze performance and income generated by our principal business activities prior to the consideration of how non-cash items affect that income and believes that this financial measure is a useful supplemental information for investors to analyze our performance and financial results. A reconciliation from net income (loss) to EBITDA and adjusted EBITDA is as follows:
| | | | | | | | | | | | | | | | | | | | | | | | | | | | | | | | | | | |
| | Year Ended | | Three Months Ended |
| December 31, | | December 31, | | September 30, |
| (Thousands of U.S. Dollars) | 2024 | | 2023 | | 2022 | | 2024 | | 2023 | | 2024 |
| Net income (loss) | $ | 3,216 | | | $ | (6,287) | | | $ | 139,029 | | | $ | (34,210) | | | $ | 7,711 | | | $ | 1,133 | |
| Adjustments to reconcile net income (loss) to EBITDA and Adjusted EBITDA | | | | | | | | | | | |
| DD&A expenses | 230,619 | | | 215,584 | | | 180,280 | | | 63,406 | | | 52,635 | | | 55,573 | |
| Interest expense | 80,466 | | | 55,806 | | | 46,493 | | | 23,752 | | | 17,789 | | | 19,892 | |
| Income tax expense | 41,389 | | | 112,447 | | | 105,906 | | | 12,299 | | | 5,499 | | | 20,767 | |
| EBITDA (non-GAAP) | $ | 355,690 | | | $ | 377,550 | | | $ | 471,708 | | | $ | 65,247 | | | $ | 83,634 | | | $ | 97,365 | |
| | | | | | | | | | | |
| | | | | | | | | | | |
| Non-cash lease expense | 5,923 | | | 4,967 | | | 2,818 | | | 1,759 | | | 1,479 | | | 1,370 | |
| Lease payments | (5,035) | | | (3,018) | | | (1,666) | | | (1,495) | | | (1,100) | | | (1,171) | |
| Foreign exchange (gain) loss | (8,808) | | | 11,822 | | | 2,578 | | | (496) | | | 3,696 | | | (3,084) | |
| Unrealized derivative instruments loss | 3,374 | | | — | | | — | | | 3,374 | | | — | | | — | |
| Transaction costs | 5,907 | | | — | | | — | | | 4,448 | | | — | | | 1,459 | |
| | | | | | | | | | | |
| Other non-cash loss (gain) | — | | | 2,312 | | | (2,605) | | | — | | | 3,281 | | | — | |
| Stock-based compensation expense (recovery) | 9,707 | | | 5,722 | | | 9,049 | | | 3,331 | | | 1,974 | | | (3,145) | |
| Adjusted EBITDA (non-GAAP) | $ | 366,758 | | | $ | 399,355 | | | $ | 481,882 | | | $ | 76,168 | | | $ | 92,964 | | | $ | 92,794 | |
Funds flow from operations, as presented, is defined as net income (loss) adjusted for DD&A expenses, deferred tax expense or recovery, stock-based compensation expense or recovery, amortization of debt issuance costs, non-cash lease expense, lease payments, unrealized foreign exchange gains or losses, unrealized derivative instruments gains or losses, other financial instruments gains or losses, and other non-cash gains or losses. Management uses this financial measure to analyze performance and income generated by our principal business activities prior to the consideration of how non-cash items affect that income, and believes that this financial measure is also useful supplemental information for investors to analyze performance and our financial results. Free cash flow, as presented, is defined as funds flow from operations less capital expenditures. Management uses this financial measure to analyze cash flow generated by our principal business activities after capital requirements and believes that this financial measure is also useful supplemental information for investors to analyze our performance and financial results. A reconciliation from net income (loss) to funds flow from operations and free cash flow is as follows:
| | | | | | | | | | | | | | | | | | | | | | | | | | | | | | | | | | | | |
| | | Year Ended | | Three Months Ended, |
| | December 31, | | December 31, | | September 30, |
| (Thousands of U.S. Dollars) | | 2024 | | 2023 | | 2022 | | 2024 | | 2023 | | 2024 |
| Net income (loss) | | $ | 3,216 | | | $ | (6,287) | | | $ | 139,029 | | | $ | (34,210) | | | $ | 7,711 | | | $ | 1,133 | |
| Adjustments to reconcile net income (loss) to funds flow from operations | | | | | | | | | | | | |
| DD&A expenses | | 230,619 | | | 215,584 | | | 180,280 | | | 63,406 | | | 52,635 | | | 55,573 | |
| | | | | | | | | | | | |
| | | | | | | | | | | | |
| Deferred tax (recovery) expense | | (27,888) | | | 56,759 | | | 25,340 | | | 4,444 | | | 13,517 | | | 5,550 | |
| Stock-based compensation expense (recovery) | | 9,707 | | | 5,722 | | | 9,049 | | | 3,331 | | | 1,974 | | | (3,145) | |
| Amortization of debt issuance costs | | 12,918 | | | 5,831 | | | 3,528 | | | 3,743 | | | 2,437 | | | 3,109 | |
| Non-cash lease expense | | 5,923 | | | 4,967 | | | 2,818 | | | 1,759 | | | 1,479 | | | 1,370 | |
| Lease payments | | (5,035) | | | (3,018) | | | (1,666) | | | (1,495) | | | (1,100) | | | (1,171) | |
| Unrealized foreign exchange (gain) loss | | (7,893) | | | (5,085) | | | 10,251 | | | (223) | | | 2,729 | | | (2,081) | |
| Unrealized derivative instruments loss | | 3,374 | | | — | | | — | | | 3,374 | | | — | | | — | |
| | | | | | | | | | | | |
| Other non-cash loss (gain) | | — | | | 2,312 | | | (2,605) | | | — | | | 3,281 | | | — | |
| Funds flow from operations (non-GAAP) | | $ | 224,941 | | | $ | 276,785 | | | $ | 366,024 | | | $ | 44,129 | | | $ | 84,663 | | | $ | 60,338 | |
| Capital expenditures | | $ | 234,236 | | | $ | 226,584 | | | $ | 210,331 | | | $ | 70,413 | | | $ | 35,826 | | | $ | 49,779 | |
| Free cash flow (non-GAAP) | | $ | (9,295) | | | $ | 50,201 | | | $ | 155,693 | | | $ | (26,284) | | | $ | 48,837 | | | $ | 10,559 | |
Consolidated Results of Operations
| | | | | | | | | | | | | | | | | | | | | | | | | | | | | |
| | Year Ended December 31, |
| (Thousands of U.S. Dollars) | 2024 | | % Change | | 2023 | | % Change | | 2022 |
| Oil, natural gas and NGL sales | $ | 621,849 | | | (2) | | | $ | 636,957 | | | (10) | | | $ | 711,388 | |
| Operating expenses | 202,331 | | | 8 | | | 186,864 | | | 15 | | | 162,385 | |
| Transportation expenses | 18,464 | | | 27 | | | 14,546 | | | 43 | | | 10,197 | |
Operating netback (1) | 401,054 | | | (8) | | | 435,547 | | | (19) | | | 538,806 | |
| | | | | | | | | |
| DD&A expenses | 230,619 | | | 7 | | | 215,584 | | | 20 | | | 180,280 | |
| | | | | | | | | |
| | | | | | | | | |
| G&A expenses before stock-based compensation | 39,912 | | | (1) | | | 40,124 | | | 26 | | | 31,908 | |
| G&A stock-based compensation expense | 9,707 | | | 70 | | | 5,722 | | | (37) | | | 9,049 | |
| Severance expenses | 1,519 | | | 100 | | | — | | | — | | | — | |
| Transaction costs | 5,907 | | | 100 | | | — | | | — | | | — | |
| Foreign exchange (gain) loss | (8,808) | | | (175) | | | 11,822 | | | 359 | | | 2,578 | |
| Derivative instruments loss | 2,271 | | | 100 | | | — | | | (100) | | | 26,611 | |
| Other financial instruments loss (gain) | — | | | (100) | | | 15 | | | 314 | | | (7) | |
| Interest expense | 80,466 | | | 44 | | | 55,806 | | | 20 | | | 46,493 | |
| 361,593 | | | 10 | | | 329,073 | | | 11 | | | 296,912 | |
| | | | | | | | | |
| Other gain (loss) | 1,478 | | | 164 | | | (2,297) | | | (188) | | | 2,598 | |
| Interest income | 3,666 | | | 85 | | | 1,983 | | | 348 | | | 443 | |
| Income before income taxes | 44,605 | | | (58) | | | 106,160 | | | (57) | | | 244,935 | |
| | | | | | | | | |
| Current income tax expense | 69,277 | | | 24 | | | 55,688 | | | (31) | | | 80,566 | |
| Deferred income tax (recovery) expense | (27,888) | | | (149) | | | 56,759 | | | 124 | | | 25,340 | |
| Total income tax expense | 41,389 | | | (63) | | | 112,447 | | | 6 | | | 105,906 | |
| | | | | | | | | | | | | | | | | | | | | | | | | | | | | |
| Net income (loss) | $ | 3,216 | | | 151 | | | $ | (6,287) | | | (105) | | | $ | 139,029 | |
| | | | | | | | | |
| Sales Volumes (NAR) | | | | | | | | | |
| Total sales volumes, BOEPD | 27,436 | | | 6 | | | 25,947 | | | 9 | | | 23,696 | |
| | | | | | | | | |
| Brent Price per boe | $ | 79.86 | | | (3) | | | $ | 82.16 | | | (17) | | | $ | 99.04 | |
| WTI Price per boe | $ | 69.62 | | | 100 | | | $ | — | | | — | | | $ | — | |
| AECO Price per GJ | C$ | 1.56 | | | 100 | | | C$ | — | | | — | | | C$ | — | |
| | | | | | | | | |
| Consolidated Results of Operations per boe Sales Volumes (NAR) | | | | | | | | | |
| Oil, natural gas and NGL sales | $ | 61.93 | | | (8) | | | $ | 67.26 | | | (18) | | | $ | 82.25 | |
| Operating expenses | 20.15 | | 2 | | | 19.73 | | 5 | | | 18.77 |
| Transportation expenses | 1.84 | | 19 | | | 1.54 | | 31 | | | 1.18 |
Operating netback (1) | 39.94 | | (13) | | | 45.99 | | (26) | | | 62.30 |
| | | | | | | | | |
| DD&A expenses | 22.97 | | 1 | | | 22.76 | | 9 | | | 20.84 |
| | | | | | | | | |
| | | | | | | | | |
| G&A expenses before stock-based compensation | 3.97 | | (6) | | | 4.24 | | 15 | | | 3.69 |
| G&A stock-based compensation expense | 0.97 | | 62 | | | 0.60 | | (43) | | | 1.05 |
| Severance expenses | 0.15 | | 100 | | | — | | — | | | — |
| Transaction costs | 0.59 | | 100 | | | — | | — | | | — |
| Foreign exchange (gain) loss | (0.88) | | (170) | | | 1.25 | | 317 | | | 0.30 |
| Derivative instruments loss | 0.23 | | 100 | | | — | | (100) | | | 3.08 |
| Other financial instruments loss | — | | — | | | — | | — | | | — |
| Interest expense | 8.01 | | | 36 | | | 5.89 | | 9 | | | 5.38 |
| 36.01 | | 4 | | | 34.74 | | 1 | | | 34.34 |
| | | | | | | | | |
| Other gain (loss) | 0.15 | | | 163 | | | (0.24) | | | (180) | | | 0.30 | |
| Interest income | 0.37 | | | 76 | | | 0.21 | | | 320 | | | 0.05 | |
| Income before income taxes | 4.45 | | | (60) | | | 11.22 | | | (60) | | | 28.31 | |
| | | | | | | | | |
| Current income tax expense | 6.90 | | 17 | | | 5.88 | | (37) | | | 9.31 |
| Deferred income tax (recovery) expense | (2.78) | | (146) | | | 5.99 | | 104 | | | 2.93 |
| Total income tax expense | 4.12 | | (65) | | | 11.87 | | (3) | | | 12.24 |
| Net income (loss) | $ | 0.33 | | | 151 | | | $ | (0.65) | | | (104) | | | $ | 16.07 | |
(1) Operating netback is a non-GAAP measure which does not have any standardized meaning prescribed under GAAP. Refer to note 2 “Financial and Operational Highlights - Non-GAAP measures” for a definition and reconciliation of this measure.
Oil, Natural Gas and NGL Production and Sales Volumes, BOEPD
| | | | | | | | | | | | | | | | | |
| Year Ended December 31, |
| Average Daily Volumes (BOEPD) - Colombia | 2024 | | 2023 | | 2022 |
| WI production before royalties | 29,389 | | 31,590 | | 30,592 |
| Royalties | (5,545) | | (6,161) | | (6,870) |
| Production NAR | 23,844 | | 25,429 | | 23,722 |
| Decrease (increase) in inventory | 53 | | (65) | | (26) |
| Sales | 23,897 | | 25,364 | | 23,696 |
| | | | | |
| Royalties, % of working interest production before royalties | 19 | % | | 20 | % | | 22 | % |
| | | | | |
| Year Ended December 31, |
| Average Daily Volumes (BOEPD) - Ecuador | 2024 | | 2023 | | 2022 |
| WI production before royalties | 2,477 | | 1,057 | | 154 |
| Royalties | (881) | | (387) | | (61) |
| Production NAR | 1,596 | | 670 | | 93 |
| Increase in inventory | (507) | | (87) | | (93) |
| Sales | 1,089 | | 583 | | — |
| | | | | |
| Royalties, % of working interest production before royalties | 36 | % | | 37 | % | | 40 | % |
| | | | | |
| Year Ended December 31, |
| Average Daily Volumes (BOEPD) - Canada | 2024 | | 2023 | | 2022 |
| WI production before royalties | 2,844 | | — | | — |
| Royalties | (394) | | — | | — |
| Production NAR | 2,450 | | — | | — |
| Increase in inventory | — | | — | | — |
| Sales | 2,450 | | — | | — |
| | | | | |
| Royalties, % of working interest production before royalties | 14 | % | | — | % | | — | % |
| | | | | |
| Year Ended December 31, |
| Average Daily Volumes (BOEPD) - Total Company | 2024 | | 2023 | | 2022 |
| WI production before royalties | 34,710 | | 32,647 | | 30,746 |
| Royalties | (6,820) | | (6,548) | | (6,931) |
| Production NAR | 27,890 | | 26,099 | | 23,815 |
| (Increase) decrease in inventory | (454) | | (152) | | (119) |
| Sales | 27,436 | | 25,947 | | 23,696 |
| | | | | |
| Royalties, % of working interest production before royalties | 20 | % | | 20 | % | | 23 | % |
Oil, natural gas and NGL production NAR for the year ended December 31, 2024, increased by 7% to 27,890 BOEPD compared to 26,099 BOEPD in 2023. The increase in production was a result of two months of production from the Canadian operations acquired on October 31, 2024 and positive exploration well drilling results in Ecuador, partially offset by lower production in the Acordionero field caused by downtime related to workovers.
Oil production NAR for the year ended December 31, 2023, increased by 10% to 26,099 BOEPD compared to 23,815 BOEPD in 2022. The increase in production was a result of successful drilling and workover campaigns in all major fields, and increased production in Ecuador.
Royalties as a percentage of production for the year ended December 31, 2024, were comparable with royalties as a percentage of production for 2023. Royalties as a percentage of production for the year ended December 31, 2023, decreased 3% compared to 2022 commensurate with the decrease in benchmark oil prices and the price sensitive royalty regime in Colombia and Ecuador.
The Midas Block includes the Acordionero field, the Suroriente Block includes the Cohembi field, and the Chaza Block includes the Costayaco and Moqueta fields. Ecuador includes the Charapa and Chanangue Blocks. Canada includes several areas in the Western Canadian Sedimentary Basin with all production in Alberta, Canada.
Oil, Natural Gas and NGL Sales
Oil, natural gas and NGL sales for the year ended December 31, 2024, decreased by 2% to $621.8 million compared to $637.0 million in 2023, primarily as a result of a 3% decrease in Brent price and 6% decrease in sales volumes in Colombia, offset by increase in sales volumes in Ecuador, lower differentials, and two months of sales from Canadian operations of $19.0 million in 2024. Vasconia, Castilla and Oriente differentials decreased to $4.78, $8.54 and $8.75 per boe in 2024 from $5.39, $10.22 and $9.91 per boe in 2023, respectively.
On a per boe basis, average realized prices decreased by 8% to $61.93 for the year ended December 31, 2024, compared to $67.26 in 2023, primarily as a result of the decrease in benchmark oil prices and the addition of natural gas and liquids to the portfolio in 2024 through the i3 Energy acquisition.
Oil, natural gas and NGL sales for the year ended December 31, 2023, decreased by 10% to $637.0 million compared to $711.4 million in 2022, primarily as a result of a 17% decrease in Brent price and higher Vasconia and Castilla differentials partially offset by 9% higher sales volumes and lower transportation discounts in 2023. Vasconia and Castilla differentials increased to $5.39 and $10.22 per boe in 2023 from $4.99 and $9.81 per boe in 2022, respectively. During the year ended December 31, 2023, we commenced sales in Ecuador which were subject to a $9.91 per boe Oriente differential.
On a per boe basis, average realized prices decreased by 18% to $67.26 for the year ended December 31, 2023, compared to $82.25 in 2022, primarily as a result of the decrease in benchmark oil prices, offset by higher Castilla and Vasconia differentials in 2023.
The following table shows the effect of changes in realized price and sales volumes on our oil, natural gas and NGL sales for the years ended December 31, 2024, 2023, and 2022:
| | | | | | | | | | | | | | | | | |
| Year Ended December 31, |
| (Thousands of U.S. Dollars) | 2024 | | 2023 | | 2022 |
| Oil, natural gas and NGL sales for the comparative year | $ | 636,957 | | | $ | 711,388 | | | $ | 473,722 | |
| Realized sales price (decrease) increase effect | (12,147) | | | (141,997) | | | 191,664 | |
| Sales volumes (decrease) increase effect | (21,916) | | | 67,566 | | | 46,002 | |
| Oil, natural gas and NGL sales - acquisition | 18,955 | | | — | | | — | |
| Oil, natural gas and NGL sales for the current year | $ | 621,849 | | | $ | 636,957 | | | $ | 711,388 | |
Operating Expenses
Operating expenses for the year ended December 31, 2024, increased by 8% to $202.3 million compared to $186.9 million in 2023. On a per boe basis, operating expenses increased by only 2% or $0.42 to $20.15 compared to $19.73 in the prior year, primarily as a result of $0.48 higher workovers, removal of diesel subsidies and higher natural gas and electricity costs in Colombia, partially offset by lower operating costs in Ecuador as a result of production ramp-up in 2024.
Operating expenses for the year ended December 31, 2023, increased by 15% to $186.9 million compared to $162.4 million in 2022. On a per boe basis, despite significant inflationary pressures operating expenses increased by only 5% or $0.96 to $19.73 in 2023 compared to $18.77 in 2022, primarily as a result of $2.23 per boe higher lifting costs associated with road and pipeline maintenance, power generation attributed to higher compressed natural gas purchases, diesel tariffs and equipment rental associated with testing exploratory wells, offset by $1.27 per boe of lower workovers. As a result of an El-Niño-induced drought, power costs in 2023 increased across Colombia, which relies on hydroelectricity for more than two-thirds of its installed power capacity. In addition, operating costs increased as a result of the depreciation of U.S. dollar against the Colombian peso in 2023.
Transportation Expenses
We have options to sell our oil, natural gas and NGL through multiple pipelines and, in Colombia, trucking routes. Each transportation route has varying effects on realized price and transportation expenses. The following table shows the percentage of oil, natural gas and NGL volumes we sold in Canada, Colombia and Ecuador using each transportation method for each of the last three years ending December 31, 2024:
| | | | | | | | | | | | | | | | | |
| Year Ended December 31, |
| 2024 | | 2023 | | 2022 |
| Volume transported through pipelines | 13 | % | | 2 | % | | — | % |
| Volume sold at wellhead | 43 | % | | 47 | % | | 47 | % |
| Volume transported via truck to pipelines | 44 | % | | 51 | % | | 53 | % |
| 100 | % | | 100 | % | | 100 | % |
Colombian volumes transported through pipelines or via trucks receive a higher realized price but incur higher transportation expenses. Volumes sold at the wellhead have the opposite effect of lower realized price, offset by lower transportation expense. Volumes sold in Ecuador are transported via pipeline. We focus on maximizing operating netback (1) per boe when choosing a transportation method.
Transportation expenses for the year ended December 31, 2024, increased by 27% to $18.5 million or by $0.30 to $1.84 per boe compared to $14.5 million or $1.54 per boe in 2023, as a result of higher sales volumes transported in Ecuador, two months of transporting sales volumes in Canada through pipelines, and an increase in trucking tariffs for Acordionero volumes in 2024.
The following table shows the variance in our average realized price net of transportation expenses in Colombia, Ecuador and Canada for each of the three years ended December 31, 2024:
| | | | | | | | | | | | | | | | | |
| Year Ended December 31, |
| (U.S. Dollars per boe Sales Volumes NAR) | 2024 | | 2023 | | 2022 |
| Average Brent price | $ | 79.86 | | | $ | 82.16 | | | $ | 99.04 | |
| | | | | |
| Average realized price, net of transportation expenses for the comparative period | $ | 65.72 | | | $ | 81.07 | | | $ | 58.61 | |
| (Decrease) increase in benchmark prices | (2.30) | | | (16.88) | | | 28.09 | |
| (Increase) decrease in quality and transportation discounts | (3.03) | | | 1.89 | | | (5.93) | |
| (Increase) decrease in transportation expense | (0.30) | | | (0.36) | | | 0.30 | |
| Average realized price, net of transportation expenses for the year | $ | 60.09 | | | $ | 65.72 | | | $ | 81.07 | |
| | | | | |
| Average realized price, net of transportation expenses as a % of Brent | 75 | % | | 80 | % | | 82 | % |
Operating Netbacks | | | | | | | | | | | | | | | | | |
| Year Ended December 31, |
| Colombia | 2024 | | 2023 | | 2022 |
| (Thousands of U.S. Dollars) | | | | | |
| Oil, natural gas and NGL sales | $ | 575,482 | | | $ | 621,297 | | | $ | 711,388 | |
| Transportation expenses | (16,297) | | | (13,829) | | | (10,197) | |
| 559,185 | | | 607,468 | | | 701,191 | |
| Operating expenses | (179,257) | | | (179,103) | | | (162,385) | |
Operating netback (1) | $ | 379,928 | | | $ | 428,365 | | | $ | 538,806 | |
| | | | | |
| (U.S. Dollars per boe Sales Volumes NAR) | | | | | |
| Brent | $ | 79.86 | | | $ | 82.16 | | | $ | 99.04 | |
| Quality and transportation discounts | (14.06) | | | (15.05) | | | (16.79) | |
| Average realized price | 65.80 | | | 67.11 | | | 82.25 | |
| | | | | | | | | | | | | | | | | |
| Transportation expenses | (1.86) | | | (1.49) | | | (1.18) | |
| Average realized price, net of transportation expenses | 63.94 | | | 65.62 | | | 81.07 | |
| Operating expenses | (20.50) | | | (19.35) | | | (18.77) | |
Operating netback (1) | $ | 43.44 | | | $ | 46.27 | | | $ | 62.30 | |
| | | | | |
| Year Ended December 31, |
| Ecuador | 2024 | | 2023 | | 2022 |
| (Thousands of U.S. Dollars) | | | | | |
| Oil, natural gas and NGL sales | $ | 27,412 | | | $ | 15,660 | | | $ | — | |
| Transportation expenses | (1,495) | | | (717) | | | — | |
| 25,917 | | | 14,943 | | | — | |
| Operating expenses | (13,425) | | | (7,761) | | | — | |
Operating netback (1) | $ | 12,492 | | | $ | 7,182 | | | $ | — | |
| | | | | |
| (U.S. Dollars per boe Sales Volumes NAR) | | | | | |
| Brent | $ | 79.86 | | | $ | 82.16 | | | $ | — | |
| Quality and transportation discounts | (11.06) | | | (8.58) | | | — | |
| Average realized price | 68.80 | | | 73.58 | | | — | |
| Transportation expenses | (3.75) | | | (3.37) | | | — | |
| Average realized price, net of transportation expenses | 65.05 | | | 70.21 | | | — | |
| Operating expenses | (33.69) | | | (36.46) | | | — | |
Operating netback (1) | $ | 31.36 | | | $ | 33.75 | | | $ | — | |
| | | | | |
| Year Ended December 31, |
| Canada | 2024 | | 2023 | | 2022 |
| (Thousands of U.S. Dollars) | | | | | |
| Oil, natural gas and NGL sales | $ | 18,955 | | | $ | — | | | $ | — | |
| Transportation expenses | (672) | | | — | | | — | |
| 18,283 | | | — | | | — | |
| Operating expenses | (9,649) | | | — | | | — | |
Operating netback (1) | $ | 8,634 | | | $ | — | | | $ | — | |
| | | | | |
| (U.S. Dollars per boe Sales Volumes NAR) | | | | | |
| Average realized price | $ | 21.14 | | | $ | — | | | $ | — | |
| Transportation expenses | (0.75) | | | — | | | — | |
| Average realized price, net of transportation expenses | 20.39 | | | — | | | — | |
| Operating expenses | (10.76) | | | — | | | — | |
Operating netback (1) | $ | 9.63 | | | $ | — | | | $ | — | |
| | | | | |
| Year Ended December 31, |
| Total Company | 2024 | | 2023 | | 2022 |
| (Thousands of U.S. Dollars) | | | | | |
| Oil, natural gas and NGL sales | $ | 621,849 | | | $ | 636,957 | | | $ | 711,388 | |
| Transportation expenses | (18,464) | | | (14,546) | | | (10,197) | |
| 603,385 | | | 622,411 | | | 701,191 | |
| Operating expenses | (202,331) | | | (186,864) | | | (162,385) | |
| | | | | |
Operating netback (1) | $ | 401,054 | | | $ | 435,547 | | | $ | 538,806 | |
| | | | | |
| (U.S. Dollars per boe Sales Volumes NAR) | | | | | |
| | | | | | | | | | | | | | | | | |
| Brent | $ | 79.86 | | | $ | 82.16 | | | $ | 99.04 | |
| Quality and transportation discounts | (17.93) | | | (14.90) | | | (16.79) | |
| Average realized price | 61.93 | | | 67.26 | | | 82.25 | |
| Transportation expenses | (1.84) | | | (1.54) | | | (1.18) | |
| Average realized price, net of transportation expenses | 60.09 | | | 65.72 | | | 81.07 | |
| Operating expenses | (20.15) | | | (19.73) | | | (18.77) | |
| | | | | |
Operating netback (1) | $ | 39.94 | | | $ | 45.99 | | | $ | 62.30 | |
(1) Operating netback is a non-GAAP measure which does not have any standardized meaning prescribed under GAAP. Refer to note 2 “Financial and Operational Highlights - Non-GAAP measures” for a definition and reconciliation of this measure.
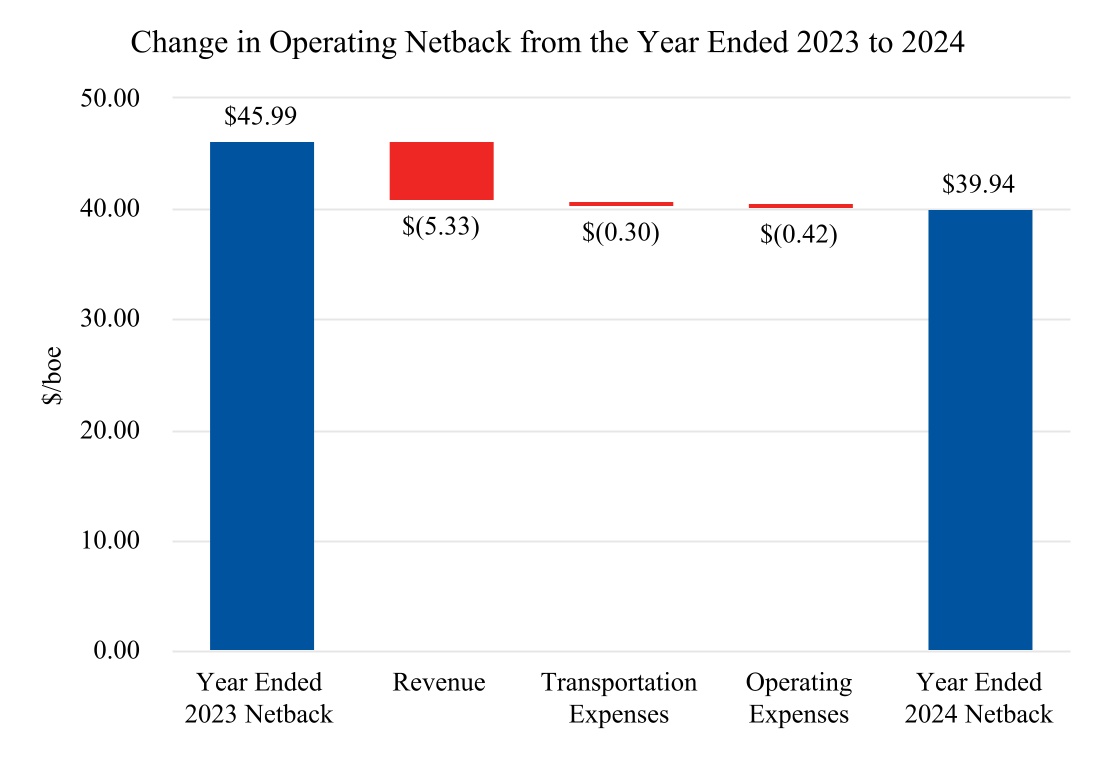 b
b
DD&A Expenses
| | | | | | | | | | | | | | | | | | | | | | | | | | | | | |
| Year Ended December 31, 2024 |
| Colombia | | Ecuador | | Canada | | Corporate | | Total |
| DD&A Expenses, Thousands of U.S. Dollars | $ | 211,239 | | | $ | 10,162 | | | $ | 8,941 | | | $ | 277 | | | $ | 230,619 | |
| DD&A Expenses, U.S. Dollars per boe | $ | 24.15 | | | $ | 25.50 | | | $ | 9.97 | | | $ | — | | | $ | 22.97 | |
| | | | | | | | | |
| | | | | | | | | |
| | | | | | | | | |
| | | | | | | | | | | | | | | | | | | | | | | | | | | | | |
| Year Ended December 31, 2023 |
| Colombia | | Ecuador | | Canada | | Corporate | | Total |
| DD&A Expenses, Thousands of U.S. Dollars | $ | 207,346 | | | $ | 8,018 | | | $ | — | | | $ | 220 | | | $ | 215,584 | |
| DD&A Expenses, U.S. Dollars per boe | $ | 22.40 | | | $ | 37.67 | | | $ | — | | | $ | — | | | $ | 22.76 | |
| | | | | | | | | |
| | | | | | | | | |
| Year Ended December 31, 2022 |
| Colombia | | Ecuador | | Canada | | Corporate | | Total |
| DD&A Expenses, Thousands of U.S. Dollars | $ | 180,039 | | | $ | — | | | $ | — | | | $ | 241 | | | $ | 180,280 | |
| DD&A Expenses, U.S. Dollars per boe | $ | 20.82 | | | $ | — | | | $ | — | | | $ | — | | | $ | 20.84 | |
| | | | | | | | | |
DD&A expenses for the year ended December 31, 2024, increased by 7% or $0.21 per boe from 2023 due to higher production in Ecuador, the addition of DD&A expense from Canadian operations acquired in the i3 Energy acquisition, and higher costs in the depletable base as a result of higher future development costs compared to 2023.
DD&A expenses for the year ended December 31, 2023, increased 20% or $1.92 per boe from 2022. On a per boe basis, the DD&A increase in 2023 was due to increased production and higher costs in the depletable base as a result of higher future development costs compared to 2022.
Asset Impairment
We follow the full cost method of accounting for our oil and gas properties. Under this method, the net book value of properties on a country-by-country basis, less related deferred income taxes, may not exceed a calculated “ceiling”. The ceiling is the estimated after-tax future net revenues from proved oil and gas properties, discounted at 10% per year. In calculating discounted future net revenues, oil and natural gas prices are determined using the unweighted arithmetic average of the first-day-of-the month Brent price for the 12-month period prior to the ending date of the period covered by the balance sheet. That average price is then held constant, except for changes which are fixed and determinable by existing contracts. Therefore, ceiling test estimates are based on historical prices discounted at 10% per year, and it should not be assumed that estimates of future net revenues represent the fair market value of our reserves.
For the years ended December 31, 2024, 2023 and 2022, we had no ceiling test impairment losses. In accordance with GAAP, we used unweighted arithmetic average of the first-day-of-the-month prices as follows; Brent Crude $80.42 per boe, Edmonton Light Crude of C$98.01 per boe, Alberta AECO spot price of C$1.46 per MMBtu Edmonton Propane C$30.46 per boe, Edmonton Butane C$48.39 per boe and Edmonton Condensate C$100.83 per boe for the December 31, 2024 ceiling test calculations (December 31, 2023, and 2022 Brent Crude - $82.51 and $97.98 per boe, respectively).
G&A Expenses
| | | | | | | | | | | | | | | | | | | | | | | | | | | | | |
| (Thousands of U.S. Dollars) | Year Ended December 31, |
| 2024 | | % change | | 2023 | | % change | | 2022 |
| G&A expenses before stock-based compensation | $ | 39,912 | | | (1) | | | $ | 40,124 | | | 26 | | | $ | 31,908 | |
| G&A stock-based compensation | 9,707 | | | 70 | | | 5,722 | | | (37) | | | 9,049 | |
| G&A expenses including stock-based compensation | $ | 49,619 | | | 8 | | | $ | 45,846 | | | 12 | | | $ | 40,957 | |
| | | | | | | | | |
| (U.S. Dollars Per boe Sales Volumes NAR) | | | | | | | | | |
| G&A expenses before stock-based compensation | $ | 3.97 | | | (6) | | | $ | 4.24 | | | 15 | | | $ | 3.69 | |
| G&A stock-based compensation | 0.97 | | | 62 | | | 0.60 | | | (43) | | | 1.05 | |
| G&A expenses including stock-based compensation | $ | 4.94 | | | 2 | | | $ | 4.84 | | | 2 | | | $ | 4.74 | |
G&A expenses before stock-based compensation for the year ended December 31, 2024 decreased 1% as a result of lower business development, legal and consulting costs compared to 2023, offset by the addition of two months of G&A from the newly acquired Canadian operations.
G&A expenses before stock-based compensation, on a per boe basis for the year ended December 31, 2024, decreased by 6% to $3.97 compared to 2023, for the same reason mentioned above and higher NAR sales during 2024.
G&A expenses before stock-based compensation for the year ended December 31, 2023, increased 26% to $40.1 million compared to 2022 due to costs attributed to business development activities, higher salaries related to increased headcount in Ecuador to support ramp-up of operations and the strengthening of the Colombian peso against the U.S. dollar.
G&A expenses before stock-based compensation, on a per boe basis, for the year ended December 31, 2023, increased by 15% to $4.24 compared to 2022, for the same reason mentioned above.
G&A expenses after stock-based compensation for the year ended December 31, 2024, increased by 8% to $49.6 million, compared to 2023 due to higher stock-based compensation attributable to the higher share price in 2024.
G&A expenses after stock-based compensation for the year ended December 31, 2023, increased by 12% to $45.8 million compared to 2022 due to higher G&A expenses before stock-based compensation, partially offset by 37% decrease in stock-based compensation expense which was a result of lower share price in 2023.
G&A expenses after stock-based compensation, on a per boe basis, for the year ended December 31, 2024, increased by 2% to $4.94 compared to 2023 due to 62% increase in stock-based compensation attributable to higher share price in 2024.
G&A expenses after stock-based compensation, on a per boe basis, for the year ended December 31, 2023, increased by 2% to $4.84 per boe compared to 2022 due to higher NAR sales in 2023.
Foreign Exchange (Gains) Losses
For the years ended December 31, 2024, 2023 and 2022, we had an $8.8 million gain, $11.8 million loss and $2.6 million loss on foreign exchange, respectively. The main sources of foreign exchange gains and losses are the revaluation of taxes receivable and payable, deferred tax assets and liabilities and accounts payable. Under GAAP, income taxes, deferred taxes and accounts payable are considered monetary assets and liabilities and require translation from local currency to the U.S. dollar functional currency at each balance sheet date.
The following table presents the change in the U.S. dollar against the Colombian peso and Canadian dollar for the last three years ended December 31, 2024:
| | | | | | | | | | | | | | | | | |
| Year Ended December 31, |
| 2024 | | 2023 | | 2022 |
| Change in the U.S. dollar against the Colombian peso | strengthened by | | weakened by | | strengthened by |
| 15 | % | | 21 | % | | 21 | % |
| Change in the U.S. dollar against the Canadian dollar | strengthened by | | weakened by | | strengthened by |
| 9 | % | | 2 | % | | 7 | % |
Financial Instruments Gains or Losses
The following table presents the nature of our financial instruments gains or losses for each of the three years ended December 31, 2024:
| | | | | | | | | | | | | | | | | |
| Year Ended December 31, |
| (Thousands of U.S. Dollars) | 2024 | | 2023 | | 2022 |
| Commodity price derivative loss | $ | 2,271 | | | $ | — | | | $ | 26,611 | |
Income Tax Expense
| | | | | | | | | | | | | | | | | |
| Year Ended December 31, |
| (Thousands of U.S. Dollars) | 2024 | | 2023 | | 2022 |
| Income before income taxes | $ | 44,605 | | $ | 106,160 | | $ | 244,935 |
| | | | | |
| Current income tax expense | $ | 69,277 | | $ | 55,688 | | $ | 80,566 |
| Deferred income tax (recovery) expense | (27,888) | | 56,759 | | 25,340 |
| Total income tax expense | $ | 41,389 | | $ | 112,447 | | $ | 105,906 |
| | | | | |
| Effective tax rate | 93 | % | | 106 | % | | 43 | % |
Current income tax expense for the year ended December 31, 2024, was $69.3 million (2023 - $55.7 million; 2022 - $80.6 million). Current income tax expense increased for the year ended December 31, 2024, compared to 2023, primarily due to the additional taxable income generated in Ecuador and Canada.
The deferred income tax expense was a recovery of $27.9 million for the year ended December 31, 2024, primarily as a result of the recognition of additional tax losses resulting from a tax planning strategy, which were partially offset by tax depreciation being higher than accounting depreciation and the use of tax losses to offset taxable income in Colombia.
The deferred income tax expense of $56.8 million and $25.3 million for the years ended December 31, 2023 and 2022, respectively, were primarily a result of tax depreciation being higher than accounting depreciation and the use of tax losses to offset taxable income in Colombia.
Our effective tax rate was 93% for the year ended December 31, 2024, compared to 106% in 2023. The decrease in the effective tax rate was primarily due to a decrease in non-deductible foreign exchange adjustments, 2022 true-up related to tax planning strategy, other permanent differences and impact of foreign taxes. These were partially offset by an increase in valuation allowance.
Our effective tax rate was 106% for the year ended December 31, 2023, compared with 43% in 2022. The increase in the effective tax rate was primarily due to an increase in non-deductible foreign exchange adjustments, impact of foreign taxes and other permanent differences. These were partially offset by a decrease in valuation allowance and non-deductible stock-based compensation.
The difference between our effective tax rate of 93% for the year ended December 31, 2024, and the 45% Colombian statutory tax rate was primarily due to an increase in impact of foreign taxes, valuation allowance, non-deductible royalties in Colombia, other permanent differences and non-deductible stock-based compensation. These were partially offset by a 2022 true-up related to tax planning strategy and non-taxable foreign exchange adjustments.
During the year ended December 31, 2024, the company strategically revised its 2022 tax return to use its tax receivable balance to offset current tax liabilities, rather than applying net operating loss carryforwards. This decision was driven by the expectation of higher future income tax rates and increased profitability. As a result, there was an increase in current tax expense of approximately $27.8 million which was offset by long-term tax receivable, ensuring no impact on cash flows. This approach preserved the Company’s net operating loss carryforward for future periods, providing greater tax benefits and flexibility in recovering tax receivables, while strengthening our equity position.
The difference between our effective tax rate of 106% for the year ended December 31, 2023, and the 45% Colombian statutory rate was primarily due to an increase in non-deductible foreign exchange adjustments, other permanent differences, the impact of foreign taxes, non-deductible royalties in Colombia and non-deductible stock-based compensation. These were partially offset by a decrease in valuation allowance.
The difference between our effective tax rate of 43% for the year ended December 31, 2022, and the 35% Colombian statutory was primarily due to $26.6 million of hedging loss, $46.5 million of financing cost mainly related to the senior notes, and $23.1 million of stock-based compensation and G&A cost, which were incurred in jurisdictions where no tax benefit is recognized. These were partially offset by $13.2 million of non-taxable foreign exchange gain.
Net Income (Loss) and Funds Flow From Operations (a Non-GAAP Measure) | | | | | | | | | | | | | | | | | | | | | | | | | | | | | | | | | | | |
| (Thousands of U.S. Dollars) | Fourth quarter 2024 compared with third quarter 2024 | | % change | | Fourth quarter 2024 compared with fourth quarter 2023 | | % change | | Year ended December 31, 2024 compared with year ended December 31, 2023 | | % change |
| Net income (loss) for the comparative period | $ | 1,133 | | | | | $ | 7,711 | | | | | $ | (6,287) | | | |
| Increase (decrease) due to: | | | | | | | | | | | |
| Sales volumes | (13,326) | | | | | (10,719) | | | | | (12,147) | | | |
| Prices | (9,712) | | | | | (15,890) | | | | | (21,916) | | | |
| Sales from acquisition | 18,955 | | | | | 18,955 | | | | | 18,955 | | | |
| Expenses: | | | | | | | | | | | |
| Cash operating expenses | (14,710) | | | | | (13,133) | | | | | (15,467) | | | |
| | | | | | | | | | | |
| Transportation | (368) | | | | | (332) | | | | | (3,918) | | | |
| Cash G&A, excluding stock-based compensation expense | 819 | | | | | 2,400 | | | | | 212 | | | |
| Severance | (1,519) | | | | | (1,519) | | | | | (1,519) | | | |
| Interest, net of amortization of debt issuance costs | (3,226) | | | | | (4,657) | | | | | (17,573) | | | |
| Realized foreign exchange gain (loss) | (730) | | | | | 1,240 | | | | | 17,822 | | | |
| Transaction costs | (2,989) | | | | | (4,448) | | | | | (5,907) | | | |
| Settlement of financial instruments | 1,103 | | | | | 1,103 | | | | | 1,103 | | | |
| Other gain (loss) | 1,478 | | | | | 1,478 | | | | | 1,478 | | | |
| Current taxes | 7,362 | | | | | (15,873) | | | | | (13,589) | | | |
| Net lease payments | 65 | | | | | (115) | | | | | (1,061) | | | |
| Interest income | 589 | | | | | 976 | | | | | 1,683 | | | |
Net change in funds flow from operations (1) from comparative period | (16,209) | | | | | (40,534) | | | | | (51,844) | | | |
| Expenses: | | | | | | | | | | | |
| Depletion, depreciation and accretion | (7,833) | | | | | (10,771) | | | | | (15,035) | | | |
| Inventory impairment | — | | | | | — | | | | | — | | | |
| Deferred tax | 1,106 | | | | | 9,073 | | | | | 84,647 | | | |
| Amortization of debt issuance costs | (634) | | | | | (1,306) | | | | | (7,087) | | | |
| Net lease payments | (65) | | | | | 115 | | | | | 1,061 | | | |
| Stock-based compensation | (6,476) | | | | | (1,357) | | | | | (3,985) | | | |
| Other non-cash loss | — | | | | | 3,281 | | | | | 2,312 | | | |
| Financial instruments loss, net of financial instruments settlements | (3,374) | | | | | (3,374) | | | | | (3,374) | | | |
| Unrealized foreign exchange (loss) gain | (1,858) | | | | | 2,952 | | | | | 2,808 | | | |
| Net change in net income | (35,343) | | | | | (41,921) | | | | | 9,503 | | | |
| Net income (loss) for the current period | $ | (34,210) | | | (3,119) | % | | $ | (34,210) | | | (544) | % | | $ | 3,216 | | | 151 | % |
(1) Funds flow from operations is a non-GAAP measure which does not have any standardized meaning prescribed under GAAP. Refer to note 2 “Financial and Operational Highlights - Non-GAAP measures” for a definition and reconciliation of this measure.
2025 Work Program and Capital Expenditures
Our Colombian, Canadian and Ecuadorian development operations are expected to represent approximately 52%, 37% and 11% of our 2025 production.
The table below shows the break-down of our 2025 capital program:
| | | | | | | | | | | | | | | | | |
| Number of Wells
(Gross) | | Number of Wells
(Net) | | 2025 Capital Budget ($ million) |
| Development - Colombia | 4 - 6 | | 2 - 3 | | 105 - 120 |
| Development - Ecuador | 2 | | 2 | | 35 - 45 |
| Development - Canada | 4 - 6 | | 2 - 3 | | 35 - 45 |
| Exploration, Colombia and Ecuador | 6 - 8 | | 6 - 8 | | 65 - 70 |
| 16 - 22 | | 12 - 16 | | 240 - 280 |
Our base capital program for 2025 is $240 million to $280 million for exploration and development activities. Based on the mid-point of the 2025 guidance, the capital budget is forecasted to be approximately 75%directed to development activities and 25% directed to exploration activities. Approximately 30% of the development activities included in the 2025 capital program are expected to be directed to facilities to support future production growth and enhance recovery factors.
We expect our 2025 capital program to be fully funded by cash flows from operations. Funding this program from cash flows from operations relies in part on average Brent oil prices of $75.00 per boe, WTI oil prices of $71.00 per boe and average AECO gas prices of C$2.50 per mcf for 2025.
Capital Program
Capital expenditures during the year ended December 31, 2024 were $234.2 million.
During the year ended December 31, 2024, we spud the following wells in Colombia, Ecuador and Canada:
| | | | | | | | | | |
| Number of Wells | | |
| Gross | Net | | |
| Colombia | | | | |
| Development | | | | |
| Productive | 10 | | 10.0 | | | |
| Dry | — | | — | | | |
| Service | 4 | | 4.0 | | | |
| 14 | | 14.0 | | | |
| | | | |
| Ecuador | | | | |
| Exploration | | | | |
| Productive | 6 | | 6.0 | | | |
| In-progress | 1 | | 1.0 | | | |
| 7 | | 7.0 | | | |
| | | | |
| Canada | | | | |
| Development | | | | |
| Productive | 2 | | 1.3 | | | |
| In-progress | 7 | | 4.2 | | | |
| 9 | | 5.5 | | | |
| Total | 30 | | 26.5 | | | |
In 2024, we drilled 10 development plus four service wells in Colombia, seven exploration wells in Ecuador, and nine development wells in Canada. Of the wells drilled in Colombia, eight were drilled in Midas Block and six in Chaza Block. In Ecuador, five wells were drilled and Charapa Block and two in Chanangue Block. In Canada, we drilled nine development
wells, four of which were in Clearwater acreage with the remaining wells drilled in our Rimbey, Lodgepole and Wapiti acreage. As at December 31, 2024, of the exploration and development wells drilled, 18 were producing and eight were in-progress.
Liquidity and Capital Resources
| | | | | | | | | | | | | | | | | | | | | | | | | | | | | |
| | As at December 31, |
| (Thousands of U.S. Dollars) | 2024 | | % Change | | 2023 | | % Change | | 2022 |
| Cash and cash equivalents | $ | 103,379 | | | 66 | | | $ | 62,146 | | | (51) | | | $ | 126,873 | |
| | | | | | | | | |
| | | | | | | | | |
| Credit facility | $ | — | | | (100) | | | $ | 36,364 | | | 100 | | | $ | — | |
| Senior Notes | $ | 786,619 | | | 47 | | | $ | 536,619 | | | (7) | | | $ | 579,909 | |
We believe that our capital resources, including cash on hand and cash generated from operations will provide us with sufficient liquidity to maintain current operations and execute the capital program for the next 12 months and beyond, given current oil and natural gas price trends and production levels. In accordance with our investment policy, available cash balances are held in our primary cash management banks or may be invested in U.S. or Canadian government-backed federal, provincial, or state securities or other money market instruments with high credit ratings and short-term liquidity. We believe that our current financial position provides us the flexibility to respond to both internal growth opportunities and those available through acquisitions. We intend to pursue growth opportunities and acquisitions from time to time, which may require significant capital, be located in basins or countries beyond our current operations, involve joint ventures, or be sizable compared to our current assets and operations.
At December 31, 2024, we had $24.8 million of 6.25% Senior Notes due 2025 (the “6.25% Senior Notes”), $24.2 million of 7.75% Senior Notes due 2027 (the “7.75% Senior Notes”), and $737.6 million of 9.50% Senior Notes due 2029 (the “9.50% Senior Notes”).
The 7.75% Senior Notes bear interest at a rate of 7.75% per year, payable semi-annually in arrears on May 23 and November 23 of each year, beginning on November 23, 2019. The 7.75% Senior Notes will mature on May 23, 2027, unless earlier redeemed or re-purchased.
The 6.25% Senior Notes bear interest at a rate of 6.25% per year, payable semi-annually in arrears on February 15 and August 15 of each year, beginning on August 15, 2018. The 6.25% Senior Notes matured and were settled on February 15, 2025.
The 9.50% Senior Notes bear interest at a rate of 9.50% per year, payable semi-annually in arrears on April 15 and October 15 of each year, beginning on April 15, 2024. The 9.50% will mature on October 15, 2029.
The principal amount of 9.50% Senior Notes is to be repaid as follows: (i) October 15, 2026, 25% of the principal amount; (ii) October 15, 2027, 5% of the principal amount; (iii) October 15, 2028, 30% of the principal amount; and (iv) October 15, 2029, the remainder of the principal amount (40%).
Under the terms of 9.50% Senior Notes agreement, we are required to maintain compliance with the following financial covenants:
i.consolidated interest coverage ratio of not less than 2.5; and
ii.consolidated net debt (total debt excluding deferred financing fees debt less cash equivalents) to consolidated adjusted earnings before interest, taxes and DD&A (“EBITDA”) of not more than 3.0.
As at December 31, 2024, we were in compliance with all applicable covenants.
On February 6, 2024 and September 18, 2024, we issued additional $100.0 million and $150.0 million of 9.50% Senior Notes due October 2029 (the “new 9.50% Senior Notes”), and received cash proceeds of $88.0 million and $139.8 million, respectively. The new 9.50% Senior Notes have the same terms and provisions as the previously issued $487.6 million 9.50% Senior Notes except for the issue price. $100.0 million of new 9.50% Senior Notes accrue interest from October 20, 2023, the date of issuance of the previously issued 9.50% Senior Notes and $150.0 million of new 9.50% Senior Notes accrue interest from April 15, 2024, the date of the last interest payment. We received a cash payment of $2.8 million and $6.1 million related to the accrued interest of the $100.0 million and $150.0 million of new 9.50% Senior Notes, respectively. As at December 31, 2023, we had a $36.4 million balance outstanding under the Company’s credit facility. On February 6, 2024, the outstanding balance under the credit facility was fully re-paid and the credit facility was terminated.
On August 19, 2024, the Company entered into a credit facility agreement (“Loan Facility”) with a market leader in the global commodities industry to fund the cash consideration payable to i3 Energy’s shareholders in connection with the i3 Energy acquisition and associated costs (Note 3). The Loan Facility has a borrowing base of £80.0 million (US$107.0 million) and bears interest based on a three-month secured overnight financing rate posted by the Federal Reserve Bank of New York plus a margin of 3.00% per annum for the first three months after the initial drawdown and 6.00% per annum thereafter. The Loan Facility is subject to a commitment fee equal to the higher of $0.5 million and 0.50% of the borrowing base converted to U.S. dollars using the agreed upon GBP to USD foreign exchange rate at the time of initial drawdown date. The Company paid $0.6 million of commitment fees and the Loan Facility was terminated on October 31, 2024.
In connection with the i3 Energy acquisition closing on October 31, 2024, the Company amended and restated the existing revolving credit facility agreement of i3 Energy Canada Ltd. (“i3 Energy Canada”) with National Bank of Canada dated March 22, 2024. As a result of the amendment and restatement, among other things, the borrowing base was revised to C$100.0 million (US$69.5 million) with available commitment of a C$50.0 million (US$34.7 million) revolving credit facility. Subject to the next borrowing base redetermination, which will occur on or before June 30, 2025, the revolving credit facility is available until October 31, 2025 with a repayment date of October 31, 2026, which may be extended by further periods of up to 364 days, subject to lender approval. The drawn down amounts under the revolving credit facility can either be in Canadian or U.S. dollars and bear interest rates equal to either the Canadian prime rate or U.S. Base Rate plus a margin ranging from 2.00% to 4.00% per annum or for CORRA loans and SOFR loans plus a margin ranging from 3.00% to 5.00% per annum. Undrawn amounts under the revolving credit facility bear standby fee ranging from 0.75% to 1.25% per annum. In each case, the margin or standby fee, as applicable is based on Net Debt to EBITDA ratio of Gran Tierra Canada Ltd.
During the year ended December 31, 2024, we implemented a share re-purchase program (the “2024 Program”) through the facilities of the TSX, the NYSE or alternative trading programs in Canada or the United States, if eligible. Under the 2024 Program, we are able to purchase up to 3,545,872 shares of Common Stock, representing 10% of the public float as of October 31, 2024, at prevailing market prices at the time of purchase. The 2024 Program will continue for one year and expire on November 5, 2025, or earlier if the 10% maximum is reached.
During the year ended December 31, 2024, the Company re-purchased 487,948 shares of Common Stock at a weighted average price of approximately $6.49 per share under the 2024 Program and 1,662,110 shares at a weighted average price of $7.31 per share under the 2023 Program implemented in 2023 with similar terms to that of 2024 Program. The 2023 Program expired on November 2, 2024. As of December 31, 2024, all shares re-purchased under the 2024 Program were held as treasury shares and all shares re-purchased under the 2023 Program were cancelled subsequent to re-purchase.
Cash and Cash Equivalents Held Outside of Canada and the United States
At December 31, 2024, 100% of our cash and cash equivalents was held in Canada and the United States.
Cash Flows
The following table presents our sources and uses of cash and cash equivalents for the periods presented:
| | | | | | | | | | | | | | | | | |
| Year Ended December 31, |
| 2024 | | 2023 | | 2022 |
| Sources of Cash and Cash Equivalents: | | | | | |
| Net income (loss) | $ | 3,216 | | | $ | (6,287) | | | $ | 139,029 | |
| Adjustments to reconcile net income (loss) to funds flow from operations | | | | | |
| DD&A expenses | 230,619 | | | 215,584 | | | 180,280 | |
| | | | | |
| Deferred tax (recovery) expense | (27,888) | | | 56,759 | | | 25,340 | |
| Stock-based compensation expense | 9,707 | | | 5,722 | | | 9,049 | |
| Amortization of debt issuance costs | 12,918 | | | 5,831 | | | 3,528 | |
| Unrealized foreign exchange (gain) loss | (7,893) | | | (5,085) | | | 10,251 | |
| Other non-cash loss (gain) | — | | | 2,312 | | | (2,605) | |
| Derivative instruments loss | 2,271 | | | — | | | 26,611 | |
| Cash settlement on derivative instruments | 1,103 | | | — | | | (26,611) | |
| Other financial instruments loss (gain) | — | | | — | | | — | |
| Non-cash lease expenses | 5,923 | | | 4,967 | | | 2,818 | |
| Lease payments | (5,035) | | | (3,018) | | | (1,666) | |
Funds flow from operations (1) | 224,941 | | | 276,785 | | | 366,024 | |
| Proceeds from issuance of Senior Notes, net of issuance costs | 221,474 | | | — | | | — | |
| Changes in non-cash operating working capital | 16,078 | | | — | | | 64,317 | |
| Proceeds from exercise of stock options | 373 | | | 8 | | | 1,300 | |
| Proceeds from debt, net of issuance costs | — | | | 48,014 | | | — | |
| Proceeds on disposition of investment, net of transaction costs | 44,382 | | | — | | | — | |
| Foreign exchange gain on cash and cash equivalents and restricted cash and cash equivalents | — | | | 5,869 | | | — | |
| 507,248 | | | 330,676 | | | 431,641 | |
| Uses of Cash and Cash Equivalents: | | | | | |
| Additions to property, plant and equipment | (234,236) | | | (226,584) | | | (210,331) | |
| Cash paid for business combinations, net of cash acquired | (162,651) | | | — | | | — | |
| Repayment of Senior Notes | — | | | (60,000) | | | — | |
| Senior Notes issuance costs | — | | | (13,351) | | | — | |
| Repayment of debt | (36,364) | | | (13,636) | | | (67,803) | |
| Lease payments | (13,300) | | | (6,527) | | | (2,228) | |
| Changes in non-cash operating working capital | — | | | (48,416) | | | — | |
| | | | | |
| Cash settlement of asset retirement obligation | (1,698) | | | (377) | | | (2,630) | |
| Re-purchase of shares of Common Stock | (15,309) | | | (17,300) | | | (27,317) | |
| Re-purchase of Senior Notes | — | | | (6,805) | | | (17,274) | |
| Foreign exchange loss on cash and cash equivalents and restricted cash and cash equivalents | (3,391) | | | — | | | (2,104) | |
| (466,949) | | | (392,996) | | | (329,687) | |
| Net increase (decrease) in cash and cash equivalents and restricted cash and cash equivalents | $ | 40,299 | | | $ | (62,320) | | | $ | 101,954 | |
(1) Funds flow from operations is a non-GAAP measure which does not have any standardized meaning prescribed under GAAP. Refer to note 2 “Financial and Operational Highlights - Non-GAAP measures” for a definition and reconciliation of this measure.
Contractual Obligations
The following is a schedule by year of purchase obligations, future minimum payments for firm agreements and leases that have initial or remaining non-cancelable terms in excess of one year as of December 31, 2024:
| | | | | | | | | | | | | | | | | | | | | | | | | | | | | |
| (Thousands of U.S. Dollars) | Total | | 2025 | | 2026-2027 | | 2028-2029 | | 2030 and beyond |
| Credit facility | $ | — | | | $ | — | | | $ | — | | | $ | — | | | $ | — | |
| 6.25% Senior Notes | 24,828 | | | 24,828 | | | — | | | — | | | — | |
| 7.75% Senior Notes | 24,201 | | | — | | | 24,201 | | | — | | | — | |
| 9.50% Senior Notes | 737,590 | | | — | | | 221,277 | | | 516,313 | | | — | |
| Total debt | 786,619 | | | 24,828 | | | 245,478 | | | 516,313 | | | — | |
Interest payments (1) | 259,860 | | | 72,136 | | | 120,865 | | | 66,859 | | | — | |
| Oil transportation services | 2,858 | | | 1,997 | | | 840 | | | 21 | | | — | |
| Facilities | 3,249 | | | 1,379 | | | 1,870 | | | — | | | — | |
| Operating leases | 14,779 | | | 5,631 | | | 6,330 | | | 2,818 | | | — | |
| Finance leases | 25,868 | | | 12,157 | | | 7,614 | | | 6,097 | | | — | |
| Software and Telecommunication | 2,229 | | | 376 | | | 1,114 | | | 739 | | | — | |
| Total | $ | 1,095,462 | | | $ | 118,504 | | | $ | 384,111 | | | $ | 592,847 | | | $ | — | |
(1) Interest payments were calculated on our 6.25% Senior Notes, 7.75% Senior Notes, and 9.50% Senior Notes under assumption that Senior Notes will be held until their maturity dates of February 2025, May 2027, and October 2029, respectively. Actual results will differ from these estimates and assumptions.
At December 31, 2024, we had provided letters of credit and other credit support totaling $244.5 million (December 31, 2023 - $220.1 million) as security relating to work commitment guarantees in Colombia and Ecuador contained in exploration contracts, the Suroriente Block, and other capital or operating requirements as well as for transmission capacity in Canada.
The above table does not reflect estimated amounts expected to be incurred in the future associated with the abandonment of our oil and gas properties and other long-term liabilities, as we cannot determine with accuracy the timing of such payments. Information regarding our asset retirement obligation can be found in Note 12 to the Consolidated Financial Statements, Asset Retirement Obligation, in Item 8 “Financial Statements and Supplementary Data.”
As is customary in the oil and gas industry, we may at times have commitments in place to reserve or earn certain acreage positions or wells. If we do not meet such commitments, the acreage positions or wells may be lost, and associated penalties may be payable.
Climate Change
We have considered the impact of the climate events on the following items presented in this Annual Report on Form 10-K for the fiscal year ended December 31, 2024:
Impairment
We have considered the impact of the evolving worldwide demand for energy and global advancement of alternative sources of energy that are not sourced from fossil fuels in the ceiling test impairment assessment on oil and gas properties. The estimated ceiling amount of our oil and gas properties was based on proved reserves, the life of which is generally less than 15 years. The ultimate period in which global energy markets can transition from carbon-based sources to alternative energy is highly uncertain. However, the majority of the cash flows associated with proved reserves per the 2024 reserve report should be realized prior to the potential elimination of carbon-based energy.
Expenditures on property, plant and equipment
From 2018 to 2024, we incurred $23.2 million on gas-to-power facilities in the Acordionero field to reduce emissions principally by the recovery and use of natural gas in the field for power generation and reduction of diesel use for power generation. In 2024, the Acordionero field represented 43% of our production. As of the end of 2024, Gran Tierra converts gas to power at seven of our facilities located in the Acordionero, Costayaco, Moqueta, Mono Arana, Los Angeles, Cohembi and Juglar fields. In total, we converted 2.8 billion standard cubic feet of natural gas into electricity instead of being flared for the
year ended December 31, 2024 and have incurred capital expenditures of $33.4 million since 2018. The extent of spending on projects directly linked to reducing the climate impact of our operations.
Established in 2017, NaturAmazonas addresses the root causes of deforestation and develops nature-based solutions for reversing the process while increasing the well-being of nearby communities. We are an industry leader in reforestation and conservation in Colombia. It has created an effective model for creating change at scale by engaging communities in protecting their environment and securing partnerships with public and private institutions, as well as stakeholders in long-term reforestation and conservation efforts. NaturAmazonas is projected to sequester approximately 8.7 million tonnes of CO2, equivalent to approximately 19 years of our 2024 Scope 1 and Scope 2 emissions1. We have planted over 1.9 million trees and conserved, preserved, or reforested more than 5,300 hectares of land through all of our environmental efforts to date.
1 2024 emissions are based on full year emissions from Colombia and Ecuador, plus post-transaction date emissions in Canada (November & December).
Current assets and current liabilities
These amounts are short-term in nature, and during the year ended December 31, 2024, management was not aware of any material impacts on these items related to climate change and climate events. We did not experience material credit losses on our accounts receivable during 2024.
Share capital
The evolving energy transition and general sentiment to the oil and gas industry may result in reduced access to capital markets.
Critical Accounting Policies and Estimates
The preparation of financial statements under GAAP requires management to make estimates, judgments, and assumptions that affect the reported amounts of assets and liabilities as well as the revenues and expenses reported and disclosure of contingent liabilities. Changes in these estimates related to judgments and assumptions will occur as a result of changes in facts and circumstances or discovery of new information, and, accordingly, actual results could differ from the amounts estimated.
On a regular basis, we evaluate our estimates, judgments, and assumptions. We also discuss our critical accounting policies and estimates with the Audit Committee of the Board of Directors.
Certain accounting estimates are considered to be critical if (a) the nature of the estimates and assumptions is material due to the level of subjectivity and judgment necessary to account for highly uncertain matters or the susceptibility of such matters to changes; and (b) the impact of the estimates and assumptions on financial condition or operating performance is material. The areas of accounting and the associated critical estimates and assumptions made are discussed below.
Full Cost Method of Accounting and the impact of estimated proved oil and gas reserves on the calculations of depletion expense and the ceiling test related to Oil and Gas Properties.
We follow the full cost method of accounting for our oil and natural gas properties in accordance with SEC Regulation S-X Rule 4-10, as described in Note 2 to the Consolidated Financial Statements, Significant Accounting Policies, in Item 8 “Financial Statements and Supplementary Data.”
Our estimates of proved oil and natural gas reserves are a major component of the depletion and full cost ceiling calculations. Additionally, our proved reserves represent the element of these calculations that require the most subjective judgments. Estimates of reserves are forecasts based on engineering data, projected future rates of production, and the amount and timing of future expenditures. The process of estimating oil and natural gas reserves requires substantial judgment, resulting in imprecise determinations, particularly for new discoveries. Different reserve engineers may make different estimates of reserve quantities based on the same data.
We believe our assumptions are reasonable based on the information available to us at the time we prepare our estimates. However, these estimates may change substantially as additional data from ongoing development activities and production performance becomes available and as economic conditions impact oil and natural gas prices and costs change.
Management is responsible for estimating the quantities of proved oil and natural gas reserves and for preparing related disclosures. Estimates and related disclosures are prepared in accordance with SEC requirements and generally accepted industry practices in the United States as prescribed by the Society of Petroleum Engineers. Reserve estimates are evaluated at least annually by independent reservoir engineering specialists.
While the quantities of proved reserves require substantial judgment, the associated prices of oil and natural gas and the applicable discount rate that are used to calculate the discounted present value of the reserves do not require judgment. The ceiling test calculation dictates that a 10% discount factor be used and future net revenues are calculated using the unweighted arithmetic average of the first-day-of-the month Brent price for the 12-month period prior to the ending date of the period covered by the balance sheet. Therefore, the future net revenues associated with the estimated proved reserves are not based on our assessment of future prices or costs but reflect adjustments for gravity, quality, local conditions, gathering and transportation fees, and distance from market. Estimates of standardized measure of our future cash flows from proved reserves for our December 31, 2024 ceiling tests were based on wellhead prices per boe as of the first day of each month within that twelve-month period.
Because the ceiling test calculation dictates the use of prices that are not representative of future prices and requires a 10% discount factor, the resulting value should not be construed as the current market value of the estimated oil and gas reserves attributable to our properties. Historical oil and gas prices for any particular 12-month period can be either higher or lower than our price forecast. Therefore, oil and gas property write-downs that result from applying the full cost ceiling limitation, and that are caused by fluctuations in price as opposed to reductions to the underlying quantities of reserves should not be viewed as absolute indicators of a reduction of the ultimate value of the related reserves.
Our Reserves Committee oversees the annual review of our oil and gas reserves and related disclosures. The Board meets with management periodically to review the reserves process, results and related disclosures and appoints and meets with the independent reservoir engineering specialists to review the scope of their work, whether they have had access to sufficient information, the nature and satisfactory resolution of any material differences of opinion, and in the case of the independent reservoir engineering specialists, their independence.
For the years ended December 31, 2024, 2023 and 2022, we had no ceiling test impairment losses. We used an average Brent Crude price of $80.42 per boe, Edmonton Light Crude of C$98.01 per boe, Alberta AECO spot price of C$1.46 per MMBtu Edmonton Propane C$30.46 per boe, Edmonton Butane C$48.39 per boe and Edmonton Condensate C$100.83 per boe for the December 31, 2024 ceiling test calculations (December 31, 2023, and 2022 Brent Crude - $82.51 and $97.98 per boe, respectively).
It is difficult to predict with reasonable certainty the amount of expected future impairment losses given the many factors impacting the asset base and the cash flows used in the prescribed GAAP ceiling test calculation. These factors include, but are not limited to, future commodity pricing, royalty rates in different pricing environments, operating costs and negotiated savings, foreign exchange rates, capital expenditures timing and negotiated savings, production and its impact on depletion and cost base, upward or downward reserve revisions as a result of ongoing exploration and development activity, and tax attributes.
Unproved Properties
Unproved properties are not depleted pending the determination of the existence of proved reserves. Costs are transferred into the amortization base on an ongoing basis as the properties are evaluated and proved reserves are established or impairment is determined. Unproved properties are evaluated quarterly to ascertain whether impairment has occurred. Unproved properties, the costs of which are individually significant, are assessed individually by considering seismic data, plans or requirements to relinquish acreage, drilling results and activity, remaining time in the commitment period, remaining capital plans and political, economic and market conditions. Where it is not practicable to individually assess the amount of impairment of properties for which costs are not individually significant, these properties are grouped for purposes of assessing impairment. During any period in which factors indicate an impairment, the cumulative costs incurred to date for such property are transferred to the full cost pool and are then subject to amortization. The transfer of costs into the amortization base involves a significant amount of judgment and may be subject to changes over time based on our drilling plans and results, seismic evaluations, the assignment of proved reserves, availability of capital and other factors. For countries where a reserve base has not yet been established, the impairment is charged to earnings.
Asset Retirement Obligations (“ARO”)
We are required to remove or remedy the effect of our activities on the environment at our present and former operating sites by dismantling and removing production facilities and remediating any damage caused. Estimating our future ARO requires us to make estimates and judgments with respect to activities that will occur many years into the future. In addition, the ultimate financial impact of environmental laws and regulations is not always clearly known and cannot be reasonably estimated as standards evolve in the countries in which we operate.
We record ARO in our consolidated financial statements by discounting the present value of the estimated retirement obligations associated with our oil and gas wells and facilities. In arriving at amounts recorded, we make numerous assumptions and judgments with respect to the existence of a legal obligation for an ARO, estimated probabilities, amounts and timing of settlements, inflation factors, credit-adjusted risk-free discount rates and changes in legal, regulatory, environmental and political environments. Because costs typically extend many years into the future, estimating future costs is difficult and requires management to make judgments that are subject to future revisions based upon numerous factors, including changing technology and the political and regulatory environment. In periods subsequent to initial measurement of the ARO, we must recognize period-to-period changes in the liability resulting from the passage of time and revisions to either the timing or the amount of the original estimate of undiscounted cash flows. Increases in the ARO liability due to passage of time impact net income as accretion expense. The related capitalized costs, including revisions thereto, are charged to expense through DD&A.
It is difficult to determine the impact of a change in any one of our assumptions. As a result, we are unable to provide a reasonable sensitivity analysis of the impact a change in our assumptions would have on our financial results.
Income Taxes
We carry on business in several countries and as a result, we are subject to income taxes in numerous jurisdictions. The determination of our income tax provision is inherently complex and we are required to interpret continually changing regulations and make certain judgments. While income tax filings are subject to audits and reassessments, we believe we have made adequate provision for all income tax obligations. However, changes in facts and circumstances as a result of income tax audits, reassessments, jurisprudence and any new legislation may result in an increase or decrease in our provision for income taxes.
To assess the realization of deferred tax assets, we consider whether it is more likely than not that some portion or all of the deferred tax assets will not be realized. The ultimate realization of deferred tax assets is dependent upon the generation of future taxable income during the periods in which those temporary differences become deductible. We consider the scheduled reversal of deferred tax liabilities, projected future taxable income and tax planning strategies in making this assessment. This determination involves numerous judgments and assumptions and includes estimating factors such as commodity prices, production and other operating conditions. If any of those factors, assumptions or judgments change, the deferred tax asset could change, and in particular decrease in a period where we determine it is more likely than not that the asset will not be realized. Alternatively, a valuation allowance may be reversed where it is determined it is more likely not that the asset will be realized.
Legal and Other Contingencies
A provision for legal and other contingencies is charged to expense when the loss is probable and the cost can be reasonably estimated. Determining when expenses should be recorded for these contingencies and the appropriate amount for accrual is a complex estimation process that includes the subjective judgment of management. In many cases, management’s judgment is based on interpretation of laws and regulations, which can be interpreted differently by regulators and/or courts of law. Management closely monitors known and potential legal and other contingencies and periodically determines when we should record losses for these items based on information available to us.
Stock-Based Compensation
Our stock-based compensation cost is measured based on the fair value of the awards that are ultimately expected to vest. Fair values are determined using pricing models such as the Black-Scholes simulation stock option-pricing model and/or observable share prices. These estimates depend on certain assumptions, including volatility, risk-free interest rate, the term of the awards, the forfeiture rate and performance factors, which, by their nature, are subject to measurement uncertainty. We use historical data to estimate the expected term used in the Black-Scholes option pricing model, option exercises and employee departure behavior. Expected volatilities used in the fair value estimate are based on the historical volatility of our shares. The risk-free rate for periods within the expected term of the stock options is based on the U.S. Treasury yield curve in effect at the time of grant.
Business Combination
Business combinations are accounted for using the acquisition method. Assets acquired and liabilities assumed in a business combination are recognized at their fair values. Any excess of the consideration paid over the fair value of the net assets acquired and liabilities assumed is recognized as a goodwill and any excess of the fair value of the net assets acquired and
liabilities assumed over the consideration paid is recognized as bargain purchase gain in the consolidated statements of operations.
Item 7A. Quantitative and Qualitative Disclosures About Market Risk
Commodity Price Risk
Our principal market risk relates to oil, natural gas and NGL prices which are volatile and unpredictable and influenced by concerns over world supply and demand imbalance and many other market factors outside of our control. Our revenues are from oil sales at Brent or WTI pricing and for gas at AECO pricing and adjusted for quality.
Foreign Currency Risk
Foreign currency risk is a factor for our company but is ameliorated to a certain degree by the nature of expenditures and revenues in the countries where we operate. Our reporting currency is U.S. dollars and 97% of our revenues are related to the U.S. dollar price of Brent with the remainder related to Canadian dollar price of WTI oil or AECO gas. In Colombia, we receive 100% of our revenues in U.S. dollars and the majority of our capital expenditures are in U.S. dollars or are based on U.S. dollar prices. The majority of income and VAT and G&A expenses in all locations are in local currency. In Canada, we receive 100% of our revenue in Canadian dollar and majority of our capital and operating expenditures are in Canadian dollars or are based on Canadian dollar prices.
Additionally, foreign exchange gains and losses result primarily from the fluctuation of the U.S. dollar to the Colombian peso due to our accounts payable, taxes receivable and payable and deferred tax assets and liabilities in Colombia are denominated in the local currency of the Colombian foreign operations which are our monetary assets. As a result, a foreign exchange gain or loss must be calculated on conversion to the U.S. dollar functional currency. A one percent strengthening in Colombian peso against the U.S. dollar results in foreign exchange loss of approximately $0.3 million U.S. dollars on accounts payable, gain of approximately $0.1 million U.S. dollars on taxes receivable and payable and loss of approximately $0.2 million U.S. dollars on deferred tax assets and liabilities.
Interest Rate Risk
Interest rate risk is the risk that future cash flows will fluctuate as a result of changes in market interest rates. We are exposed to interest rate fluctuations on our credit facility, which bears floating rates of interest. At December 31, 2024, our credit facility remained undrawn (December 31, 2023 - $36.4 million).
Our investment objectives are focused on preservation of principal and liquidity. By policy, we manage our exposure to market risks by limiting investments to high quality bank issues at overnight rates, or U.S. or Canadian government-backed federal, provincial or state securities or other money market instruments with high credit ratings and short-term liquidity. A 10% change in interest rates would not have a material effect on the value of our investment portfolio. We do not hold any of these investments for trading purposes.
Item 8. Financial Statements and Supplementary Data
Report of Independent Registered Public Accounting Firm
To the Shareholders and Board of Directors of Gran Tierra Energy Inc.:
Opinion on the Consolidated Financial Statements
We have audited the accompanying consolidated balance sheets of Gran Tierra Energy Inc. and subsidiaries (the Company) as of December 31, 2024 and 2023, the related consolidated statements of operations, shareholders’ equity, and cash flows for each of the years in the three-year period ended December 31, 2024, and the related notes (collectively, the consolidated financial statements). In our opinion, the consolidated financial statements present fairly, in all material respects, the financial position of the Company as of December 31, 2024 and 2023, and the results of its operations and its cash flows for each of the years in the three-year period ended December 31, 2024, in conformity with U.S. generally accepted accounting principles.
We also have audited, in accordance with the standards of the Public Company Accounting Oversight Board (United States) (PCAOB), the Company’s internal control over financial reporting as of December 31, 2024, based on criteria established in Internal Control – Integrated Framework (2013) issued by the Committee of Sponsoring Organizations of the Treadway
Commission, and our report dated February 24, 2025 expressed an unqualified opinion on the effectiveness of the Company’s internal control over financial reporting.
Basis for Opinion
These consolidated financial statements are the responsibility of the Company’s management. Our responsibility is to express an opinion on these consolidated financial statements based on our audits. We are a public accounting firm registered with the PCAOB and are required to be independent with respect to the Company in accordance with the U.S. federal securities laws and the applicable rules and regulations of the Securities and Exchange Commission and the PCAOB.
We conducted our audits in accordance with the standards of the PCAOB. Those standards require that we plan and perform the audit to obtain reasonable assurance about whether the consolidated financial statements are free of material misstatement, whether due to error or fraud. Our audits included performing procedures to assess the risks of material misstatement of the consolidated financial statements, whether due to error or fraud, and performing procedures that respond to those risks. Such procedures included examining, on a test basis, evidence regarding the amounts and disclosures in the consolidated financial statements. Our audits also included evaluating the accounting principles used and significant estimates made by management, as well as evaluating the overall presentation of the consolidated financial statements. We believe that our audits provide a reasonable basis for our opinion.
Critical Audit Matters
The critical audit matters communicated below are matters arising from the current period audit of the consolidated financial statements that were communicated or required to be communicated to the audit committee and that: (1) relate to accounts or disclosures that are material to the consolidated financial statements and (2) involved our especially challenging, subjective, or complex judgments. The communication of critical audit matters does not alter in any way our opinion on the consolidated financial statements, taken as a whole, and we are not, by communicating the critical audit matters below, providing separate opinions on the critical audit matters or on the accounts or disclosures to which they relate.
Fair value measurement of oil and natural gas properties acquired in a business combination
As discussed in note 3 to the consolidated financial statements, the Company acquired i3 Energy Plc (i3 Energy) in a business combination on October 31, 2024 (the acquisition-date). As a result of the business combination, the Company acquired proved oil and natural gas properties with an acquisition-date fair value of $256,040 thousand. The fair value of the proved oil and natural gas properties acquired is based on cash flows associated with the estimated acquired proved oil and natural gas reserves (acquired reserves cash flows) and the discount rate. The estimation of proved oil and natural gas reserves, which are used to estimate the acquired reserves cash flows, involves the expertise of independent reservoir engineering specialists, who take into consideration assumptions related to forecasted production, forecasted commodity prices, and forecasted operating, royalty and capital costs (reserve assumptions). The Company engaged independent reservoir engineering specialists to estimate the Company’s proved oil and natural gas reserves as of December 31, 2024 (the external reserve report). The Company also engaged an independent valuator to estimate the discount rate.
We identified the determination of the acquisition-date fair value of proved oil and natural gas properties acquired in the i3 Energy business combination as a critical audit matter. Changes in the acquired reserve cash flows and the discount rate could have had a significant impact on the determination of the acquisition-date fair value of the acquired proved oil and natural gas properties. Complex auditor judgment was required to evaluate the acquired reserves cash flows and the discount rate, which were inputs into the determination of the acquisition-date fair value. Additionally, the evaluation of this fair value required involvement of valuation professionals with specialized skills and knowledge.
The following are the primary procedures we performed to address this critical audit matter. We evaluated the design and tested the operating effectiveness of certain internal controls related to this critical audit matter. This included controls related to:
•the determination of the acquisition-date fair value, including the discount rate
•the determination of the acquired reserves cash flows
•the determination of the reserve assumptions and the resulting reserves cash flows in the external reserve report.
We evaluated the competence, capabilities and objectivity of the independent reservoir engineering specialists engaged by the Company, who estimated the proved oil and natural gas reserves as of December 31, 2024. We also evaluated the competence, capabilities and objectivity of the independent valuator engaged by the Company, who estimated the discount rate. We evaluated the methodology used by the independent reservoir engineering specialists to estimate the proved oil and natural gas reserves as of December 31, 2024 for compliance with regulatory standards. We assessed the forecasted production and forecasted operating, royalty and capital costs assumptions used in the external reserve report and the estimate of the acquired reserves cash flows by comparing them to 2024 actual results of the acquired proved oil and natural gas properties post-
acquisition. We assessed the forecasted commodity prices used in the estimate of the acquired reserves cash flows and in the external reserve report by comparing them to those published by other reserve engineering companies. We evaluated the estimated acquired reserves cash flows by comparing them to the corresponding cash flows from proved oil and natural gas reserves in the external reserve report.
We involved valuation professionals with specialized skills and knowledge, who assisted in:
•evaluating the Company’s determination of the acquisition-date discount rate by comparing the inputs of the discount rate against publicly available market data for comparable assets and assessing the discount rate
•evaluating the Company’s estimate of the acquisition-date fair value of the acquired proved oil and natural gas properties by comparing to publicly available market data and valuation metrics for comparable entities.
Assessment of the impact of estimated proved oil and natural gas reserves on the depletion expense and the ceiling test calculations related to the Colombian oil and natural gas properties
As discussed in Note 2 to the consolidated financial statements, the Company depletes its oil and natural gas properties using the unit-of-production method based upon production and estimates of proved reserve quantities. Under such method, capitalized costs are depleted over the estimated proved oil and natural gas reserves. As discussed in Note 7 to the consolidated financial statements, the Company recorded depletion and depreciation expense of $223.1 million for the year ended December 31, 2024, a portion of which related to the Colombian oil and natural gas properties. Additionally, as discussed in Note 2 to the consolidated financial statements, the Company performs a ceiling test calculation each quarter on a country-by-country basis. In performing its quarterly ceiling test, the Company limits the capitalized costs of proved oil and natural gas properties, net of accumulated depletion and deferred income taxes, to the estimated future net cash flows from proved oil and natural gas reserves discounted at 10 percent, net of related tax effects, plus the lower of cost or fair value of unproved properties included in the costs being amortized. If such capitalized costs exceed the ceiling limitation, the Company will record a ceiling test impairment to the extent of such excess. As discussed in Note 8 to the consolidated financial statements, the Company did not record a ceiling test impairment in 2024 related to the Colombian oil and natural gas properties. The estimation of proved oil and natural gas reserves, which are used in the calculations of depletion and the ceiling test, involves the expertise of independent reservoir engineering specialists, who take into consideration assumptions related to forecasted production and forecasted operating, royalty and capital costs (reserve assumptions). The Company engages independent reservoir engineering specialists to estimate the proved oil and natural gas reserves.
We identified the assessment of the impact of estimated proved oil and natural gas reserves on the depletion expense and the ceiling test calculations related to the Colombian oil and natural gas properties as a critical audit matter. Changes in the reserve assumptions could have a significant impact on the depletion expense and the ceiling test calculations. Complex auditor judgment was required in evaluating the Company’s proved oil and natural gas reserves, and the related reserve assumptions, which were an input to the depletion expense and the ceiling test calculations.
The following are the primary procedures we performed to address this critical audit matter. We evaluated the design and tested the operating effectiveness of certain internal controls related to the critical audit matter. This included controls related to:
• the depletion expense and the ceiling test calculations
• the estimation of the proved oil and natural gas reserves, including the reserve assumptions.
We recalculated the depletion expense and the ceiling test calculations and analyzed them for compliance with regulatory standards. We evaluated the competence, capabilities and objectivity of the independent reservoir engineering specialists engaged by the Company to estimate, the proved oil and natural gas reserves. We evaluated the methodology used by the independent reservoir engineering specialists to estimate the proved oil and natural gas reserves for compliance with regulatory standards. We compared the Company’s 2024 actual production and operating, royalty and capital costs to those estimates used in the prior year’s estimate of the proved oil and natural gas reserves to assess the Company’s ability to accurately forecast. We assessed the estimates of forecasted production and forecasted operating, royalty and capital costs assumptions used in the estimate of the proved oil and natural gas reserves by comparing them to historical results.
/s/ KPMG LLP
Chartered Professional Accountants
We have served as the Company’s auditor since 2018
Calgary, Canada
February 24, 2025
Gran Tierra Energy Inc.
Consolidated Statements of Operations
(Thousands of U.S. Dollars, Except Share and Per Share Amounts) | | | | | | | | | | | | | | | | | |
| | Year Ended December 31, |
| | 2024 | | 2023 | | 2022 |
OIL, NATURAL GAS AND NGL SALES (NOTE 13) | $ | 621,849 | | | $ | 636,957 | | | $ | 711,388 | |
| | | | | |
| EXPENSES | | | | | |
| Operating | 202,331 | | | 186,864 | | | 162,385 | |
| Transportation | 18,464 | | | 14,546 | | | 10,197 | |
| Depletion, depreciation and accretion (Note 7) | 230,619 | | | 215,584 | | | 180,280 | |
| | | | | |
| General and administrative (Note 16) | 49,619 | | | 45,846 | | | 40,957 | |
| Severance | 1,519 | | | — | | | — | |
| Transaction costs (Note 3) | 5,907 | | | — | | | — | |
| Foreign exchange (gain) loss | (8,808) | | | 11,822 | | | 2,578 | |
| Derivative instruments loss (Note 16) | 2,271 | | | — | | | 26,611 | |
| Other financial instruments loss (gain) (Note 16) | — | | | 15 | | | (7) | |
| Interest expense (Note 10) | 80,466 | | | 55,806 | | | 46,493 | |
| TOTAL EXPENSES | 582,388 | | | 530,483 | | | 469,494 | |
| | | | | |
| OTHER GAIN (LOSS) | 1,478 | | | (2,297) | | | 2,598 | |
| INTEREST INCOME | 3,666 | | | 1,983 | | | 443 | |
| INCOME BEFORE INCOME TAXES | 44,605 | | | 106,160 | | | 244,935 | |
| | | | | |
| INCOME TAX EXPENSE (RECOVERY) | | | | | |
| Current (Note 14) | 69,277 | | | 55,688 | | | 80,566 | |
| Deferred (Note 14) | (27,888) | | | 56,759 | | | 25,340 | |
| 41,389 | | | 112,447 | | | 105,906 | |
| NET INCOME (LOSS) | $ | 3,216 | | | $ | (6,287) | | | $ | 139,029 | |
| | | | | |
| OTHER COMPREHENSIVE LOSS | | | | | |
| Foreign currency translation adjustment | (6,736) | | | — | | | — | |
| NET AND COMPREHENSIVE (LOSS) INCOME | $ | (3,520) | | | $ | (6,287) | | | $ | 139,029 | |
| | | | | |
NET (LOSS) INCOME PER SHARE (1) | | | | | |
–BASIC | $ | 0.10 | | | $ | (0.19) | | | $ | 3.81 | |
–DILUTED | $ | 0.10 | | | $ | (0.19) | | | $ | 3.76 | |
| WEIGHTED AVERAGE SHARES OUTSTANDING - BASIC (Note 11) | 32,042,897 | | | 33,469,828 | | | 36,445,546 | |
| WEIGHTED AVERAGE SHARES OUTSTANDING - DILUTED (Note 11) | 32,042,897 | | | 33,469,828 | | | 36,928,010 | |
(1) Reflects our 1-for-10 reverse stock split that became effective May 5, 2023.
(See notes to the consolidated financial statements)
Gran Tierra Energy Inc.
Consolidated Balance Sheets
(Thousands of U.S. Dollars, Except Share and Per Share Amounts) | | | | | | | | | | | |
| | As at December 31, |
| | 2024 | | 2023 |
| ASSETS | | | |
| Current Assets | | | |
| Cash and cash equivalents | $ | 103,379 | | | $ | 62,146 | |
| | | |
| Accounts receivable (Note 6) | 35,480 | | | 12,359 | |
| Inventory | 43,116 | | | 29,039 | |
| Taxes receivable (Note 5) | 18,095 | | | 438 | |
| Other current assets (Note 16 and 17) | 11,201 | | | 8,482 | |
| Total Current Assets | 211,271 | | | 112,464 | |
| | | |
| Oil and Natural Gas Properties (using the full cost method of accounting) | | | |
| Proved | 1,260,578 | | | 1,055,070 | |
| Unproved | 119,520 | | | 54,116 | |
| Total Oil and Natural Gas Properties | 1,380,098 | | | 1,109,186 | |
| Other capital assets | 43,033 | | | 33,664 | |
| Total Property, Plant and Equipment (Note 7) | 1,423,131 | | | 1,142,850 | |
| | | |
| Other Long-Term Assets | | | |
| Taxes receivable long-term (Note 5) | 1,629 | | | 52,089 | |
| Deferred tax assets (Note 14) | 11,718 | | | 10,923 | |
| Other long-term assets (Note 16 and 17) | 7,038 | | | 7,963 | |
| Total Other Long-Term Assets | 20,385 | | | 70,975 | |
| Total Assets | $ | 1,654,787 | | | $ | 1,326,289 | |
| | | |
| LIABILITIES AND SHAREHOLDERS’ EQUITY | | | |
| Current Liabilities | | | |
| Accounts payable and accrued liabilities (Note 9, 10 and 12) | $ | 273,103 | | | $ | 187,007 | |
| Credit facility (Note 10) | — | | | 35,609 | |
| Current portion of long-term debt | 24,807 | | | — | |
| Taxes payable (Note 5) | 13,970 | | | 27,219 | |
| | | |
| Equity compensation award liability (Note 11) | 10,568 | | | 10,419 | |
| Total Current Liabilities | 322,448 | | | 260,254 | |
| | | |
| Long-Term Liabilities | | | |
| Long-term debt (Note 10) | 722,123 | | | 519,532 | |
| Deferred tax liabilities (Note 14) | 64,114 | | | 57,453 | |
| Asset retirement obligation (Note 12) | 105,936 | | | 73,029 | |
| | | |
| Equity compensation award liabilities (Note 11) | 17,456 | | | 8,750 | |
| Other long-term liabilities (Note 16) | 9,142 | | | 10,877 | |
| Total Long-Term Liabilities | 918,771 | | | 669,641 | |
| | | |
| Commitments and Contingencies (Note 15) | | | |
| | | |
Shareholders’ Equity (1) | | | |
| Common Stock (Note 11) (36,460,141 and 32,275,113 issued, 35,972,193 and 32,246,501 outstanding shares of Common Stock, par value $0.001 per share, as at December 31, 2024, and December 31, 2023, respectively) | 9,940 | | | 9,936 | |
| Additional paid in capital | 1,273,343 | | | 1,249,651 | |
| Treasury stock (Note 11) | (3,165) | | | (163) | |
| Accumulated other comprehensive loss | (6,736) | | | — | |
| Deficit | (859,814) | | | (863,030) | |
| Total Shareholders’ Equity | 413,568 | | | 396,394 | |
| Total Liabilities and Shareholders’ Equity | $ | 1,654,787 | | | $ | 1,326,289 | |
(1) Reflects our 1-for-10 reverse stock split that became effective May 5, 2023. (See notes to the consolidated financial statements)
Gran Tierra Energy Inc.
Consolidated Statements of Cash Flows
(Thousands of U.S. Dollars) | | | | | | | | | | | | | | | | | |
| | Year Ended December 31, |
| | 2024 | | 2023 | | 2022 |
| Operating Activities | | | | | |
| Net income (loss) | $ | 3,216 | | | $ | (6,287) | | | $ | 139,029 | |
| Adjustments to reconcile net income (loss) to net cash provided by operating activities: | | | | | |
| Depletion, depreciation and accretion (Note 7) | 230,619 | | | 215,584 | | | 180,280 | |
| | | | | |
| Deferred tax (recovery) expense (Note 14) | (27,888) | | | 56,759 | | | 25,340 | |
| Stock-based compensation expense (Note 11) | 9,707 | | | 5,722 | | | 9,049 | |
| Amortization of debt issuance costs (Note 10) | 12,918 | | | 5,831 | | | 3,528 | |
| Non-cash lease expenses | 5,923 | | | 4,967 | | | 2,818 | |
| Lease payments | (5,035) | | | (3,018) | | | (1,666) | |
| Unrealized foreign exchange (gain) loss | (7,893) | | | (5,085) | | | 10,251 | |
| Derivative instruments loss (Note 16) | 2,271 | | | — | | | 26,611 | |
| Cash settlement on derivatives instruments (Note 16) | 1,103 | | | — | | | (26,611) | |
| | | | | |
| Cash settlement of asset retirement obligation (Note 12) | (1,698) | | | (377) | | | (2,630) | |
| Other non-cash loss (gain) | — | | | 2,312 | | | (2,605) | |
| Net change in assets and liabilities from operating activities (Note 17) | 16,078 | | | (48,416) | | | 64,317 | |
| Net cash provided by operating activities | 239,321 | | | 227,992 | | | 427,711 | |
| | | | | |
| Investing Activities | | | | | |
Additions to property, plant and equipment1 (Note 7 and 17) | (234,236) | | | (226,584) | | | (210,331) | |
| Cash paid for business combinations, net of cash acquired (Note 3) | (162,651) | | | — | | | — | |
| Proceeds on disposition of property, plant and equipment (Note 7) | 44,382 | | | — | | | — | |
| Net cash used in investing activities | (352,505) | | | (226,584) | | | (210,331) | |
| | | | | |
| Financing Activities | | | | | |
| Proceeds from issuance of Senior Notes, net of issuance costs | 221,474 | | | — | | | — | |
| Purchase of Senior Notes (Note 10) | — | | | (6,805) | | | (17,274) | |
| Senior Notes issuance costs | — | | | (13,351) | | | — | |
| Repayment of Senior Notes (Note 10) | — | | | (60,000) | | | — | |
| Proceeds from debt, net of issuance costs (Note 10) | — | | | 48,014 | | | — | |
| Repayment of debt (Note 10) | (36,364) | | | (13,636) | | | (67,803) | |
| Lease payments | (13,300) | | | (6,527) | | | (2,228) | |
| | | | | |
| Proceeds from exercise of stock options (Note 11) | 373 | | | 8 | | | 1,300 | |
| Re-purchase of shares of Common Stock (Note 11) | (15,309) | | | (17,300) | | | (27,317) | |
| Net cash provided by (used in) financing activities | 156,874 | | | (69,597) | | | (113,322) | |
| | | | | |
| Foreign exchange (loss) gain on cash and cash equivalents and restricted cash and cash equivalents | (3,391) | | | 5,869 | | | (2,104) | |
| | | | | |
| Net increase (decrease) in cash and cash equivalents and restricted cash and cash equivalents | 40,299 | | | (62,320) | | | 101,954 | |
| | | | | |
Cash and cash equivalents and restricted cash and cash equivalents, beginning of year (Note 17) | 71,038 | | | 133,358 | | | 31,404 | |
Cash and cash equivalents and restricted cash and cash equivalents, end of year (Note 17) | $ | 111,337 | | | $ | 71,038 | | | $ | 133,358 | |
| | | | | |
| Supplemental cash flow disclosures (Note 17) | | | | | |
(See notes to the consolidated financial statements)
1Refer to Note 17 for the correction in presentation of cash flows associated with additions to property, plant and equipment in the comparative periods
Gran Tierra Energy Inc.
Consolidated Statements of Shareholders’ Equity
(Thousands of U.S. Dollars) | | | | | | | | | | | | | | | | | |
| | Year Ended December 31, |
| | 2024 | | 2023 | | 2022 |
Share Capital (1) | | | | | |
| Balance, beginning of year | $ | 9,936 | | | $ | 10,272 | | | $ | 10,270 | |
| Reverse stock split (Note 11) | — | | | (299) | | | — | |
| Cancellation of shares of Common Stock (Note 11) | (2) | | | (37) | | | — | |
| Issuance of shares of Common Stock, net of issuance costs (Note 11) | 6 | | | — | | | 2 | |
| Balance, end of year | 9,940 | | | 9,936 | | | 10,272 | |
| | | | | |
| Additional Paid in Capital | | | | | |
| Balance, beginning of year | 1,249,651 | | | 1,291,354 | | | 1,287,582 | |
| Issuance of Common shares, net of issuance costs (Note 11) | 36,649 | | | — | | | — | |
| Reverse stock split (Note 11) | — | | | 299 | | | — | |
| Cancellation of shares of Common Stock (Note 11) | (12,305) | | | (44,417) | | | — | |
| Exercise of stock options (Note 11) | 367 | | | 8 | | | 1,298 | |
| Modification of stock options (Note 11) | (4,057) | | | — | | | — | |
| Stock-based compensation (Note 11) | 3,038 | | | 2,407 | | | 2,474 | |
| Balance, end of year | 1,273,343 | | | 1,249,651 | | | 1,291,354 | |
| | | | | |
| Treasury Stock | | | | | |
| Balance, beginning of year | (163) | | | (27,317) | | | — | |
| Purchase of treasury shares (Note 11) | (15,309) | | | (17,300) | | | (27,317) | |
| Cancellation of treasury shares (Note 11) | 12,307 | | | 44,454 | | | — | |
| Balance, end of year | (3,165) | | | (163) | | | (27,317) | |
| | | | | |
| Accumulated and other comprehensive income (loss) | | | | | |
| Balance, beginning of year | — | | | — | | | — | |
| Other comprehensive loss | (6,736) | | | — | | | — | |
| Balance, end of year | (6,736) | | | — | | | — | |
| | | | | |
| Deficit | | | | | |
| Balance, beginning of year | (863,030) | | | (856,743) | | | (995,772) | |
| Net income (loss) | 3,216 | | | (6,287) | | | 139,029 | |
| | | | | |
| Balance, end of year | (859,814) | | | (863,030) | | | (856,743) | |
| | | | | |
| Total Shareholders’ Equity | $ | 413,568 | | | $ | 396,394 | | | $ | 417,566 | |
(1) Reflects our 1-for-10 reverse stock split that became effective May 5, 2023.
(See notes to the consolidated financial statements)
Gran Tierra Energy Inc.
Notes to the Consolidated Financial Statements
For the Years Ended December 31, 2024, 2023 and 2022
(Expressed in U.S. Dollars, unless otherwise indicated)
1. Description of Business
Gran Tierra Energy Inc., a Delaware corporation (the “Company” or “Gran Tierra”), is a publicly traded company focused on oil and natural gas exploration and production with assets currently in Colombia, Ecuador and Canada.
2. Significant Accounting Policies
The consolidated financial statements have been prepared in accordance with generally accepted accounting principles in the United States of America (“GAAP”).
Significant accounting policies are:
Basis of Consolidation
These consolidated financial statements include the accounts of the Company and its controlled subsidiaries. All intercompany accounts and transactions have been eliminated.
Use of Estimates
The preparation of financial statements in conformity with GAAP requires management to make estimates and assumptions that affect the reported amounts of assets and liabilities and disclosure of contingent assets and liabilities at the date of the consolidated financial statements and the reported amounts of revenues and expenses during the reporting period. Certain estimates and judgments have a material impact where the assumptions underlying these accounting estimates relate to matters that involve significant estimation uncertainty at the time the estimate or judgement is made or are subjective. These estimates and judgments include, but are not limited to:
•estimated proved and probable reserves volumes and the related cash flows are determined by the independent reservoir engineering specialists and used in several of the estimates made by management in preparing these financial statements. Estimates are required to be made in the reserve report, including forecasted production, forecasted operating and royalty costs, capital cost assumptions, and in certain cases forecasted commodity prices;
•depletion, depreciation and accretion (“DD&A”);
•timing of transfers from oil and natural gas properties not subject to depletion to the depletable base;
•impairment of proved oil and natural gas properties as determined using the full cost method of accounting for our oil and natural gas properties in accordance with SEC Regulation S-X Rule 4-10;
•asset retirement obligations; and
•fair value measurement associated with the acquired proved and unproved oil and natural gas properties in the business combination, including the discount rate determined by an independent valuator engaged by the Company.
Although management believes these estimates are reasonable, changes in facts and circumstances or discovery of new information may result in revised estimates, and actual results may differ from these estimates.
Some of the Company’s estimates and judgements have a material impact on consolidated financial statements but do not involve significant subjectivity of estimation uncertainty. These estimates and judgements include, but are not limited to:
•fair value of derivatives;
•income taxes;
•stock-based compensation;
•operating and finance leases;
•debt extinguishment and debt modification accounting; and
•assessment of the likely outcome of legal and other contingencies.
Cash and Cash Equivalents
The Company considers all highly liquid investments with an original maturity of three months or less to be cash equivalents.
Restricted Cash and Cash Equivalents
Restricted cash and cash equivalents are comprised of cash and cash equivalents pledged to secure letters of credit and to settle asset retirement obligations. Letters of credit currently secured by cash relate to work commitment guarantees contained in exploration contracts. Restrictions will lapse when work obligations are satisfied pursuant to the exploration contract or an asset retirement obligation is settled. Cash and claims to cash that are restricted as to withdrawal or use for other than current operations, or are designated for expenditure in the acquisition or construction of long-term assets are excluded from the current asset classification. The long-term portion of restricted cash and cash equivalents is included in other long-term assets on the Company’s balance sheet.
Allowance for Doubtful Accounts
At each reporting date, the Company assesses the expected lifetime credit losses on initial recognition of trade accounts receivable. Credit risk is assessed based on the number of days the receivable has been outstanding and the internal credit assessment of the customer. The expected loss rates are based on payment profiles over a period of 36 months prior to the period-end and the corresponding historical credit losses experienced within this period. Historical loss rates are adjusted to reflect current and forward-looking economic factors of the country where the Company sells oil, natural gas and NGL that affect the ability of the customers to settle the receivables. Trade receivables are written off when there is no reasonable expectation of recovery.
Prepaid Equity Forwards
The Company is exposed to equity price risk in relation to its long-term incentive plans. The Company utilizes prepaid equity forwards (“PEF”) on the equivalent number of the Company’s common shares in order to fix the future settlement cost on a portion of its cash-settled long-term incentive plans.
PEF is recorded in other current and long-term assets on the Company’s balance sheet at fair value, with changes in fair value recognized as G&A expense in the consolidated statements of operations. The Company utilizes PEF to manage equity price risk in relation to its long-term incentive plans.
Derivatives
The Company records derivative instruments on its balance sheet at fair value as either an asset or liability with changes in fair value recognized in the consolidated statements of operations as financial instruments gains or losses. While the Company utilizes derivative instruments to manage the price risk attributable to its expected oil, natural gas and NGL production and foreign exchange risk, it has elected not to designate its derivative instruments as accounting hedges under the accounting guidance.
Inventory
Inventory consists of oil in tanks and third party pipelines and supplies and is valued at the lower of cost and net realizable value. The cost of inventory is determined using the weighted average method. Oil inventories include expenditures incurred to produce, upgrade and transport the product to the storage facilities and include operating, depletion and depreciation expenses, and royalties.
Income Taxes
Income taxes are recognized using the asset and liability method, whereby deferred tax assets and liabilities are recognized for the future tax consequences attributable to differences between the consolidated financial statements carrying amounts of existing assets and liabilities and their respective tax base, and operating loss and tax credit carryforwards. Deferred tax assets and liabilities are measured using enacted tax rates expected to apply to taxable income in the years in which those temporary differences and carryforwards are expected to be recovered or settled. Valuation allowances are provided if, after considering the available evidence, it is not more likely than not that some or all of the deferred tax assets will be realized.
The tax benefit from an uncertain tax position is recognized when it is more likely than not, based on the technical merits of the position, that the position will be sustained on examination by the taxing authorities. Additionally, the amount of the tax benefit recognized is the largest amount of benefit that has a greater than 50% likelihood of being realized upon ultimate settlement. In evaluating whether a tax position has met the more-likely-than-not recognition threshold, the Company presumes that the position will be examined by the appropriate taxing authority that has full knowledge of all relevant information. The Company recognizes potential penalties and interest related to unrecognized tax benefits as a component of income tax expense.
Oil and Natural Gas Properties
The Company uses the full cost method of accounting for its investment in oil and natural gas properties as defined by the Securities and Exchange Commission (“SEC”). Under this method, the Company capitalizes all acquisition, exploration, and development costs incurred for the purpose of finding oil and natural gas reserves, including salaries, benefits, and other internal costs directly attributable to these activities. Costs associated with production and general corporate activities, are expensed as incurred. Separate cost centers are maintained for each country in which the Company incurs costs.
The Company computes depletion of oil and natural gas properties on a quarterly basis using the unit-of-production method based upon production and estimates of proved reserve quantities. Capital costs related to properties with proved oil and natural gas reserves are also included in the amortization base for the computation of depletion. The costs of unproved properties are excluded from the amortization base until the properties are evaluated. The cost of exploratory dry wells is transferred to proved properties and thus is subject to amortization immediately upon determination that a well is dry in those countries where proved reserves exist.
The Company performs a ceiling test calculation each quarter in accordance with SEC Regulation S-X Rule 4-10. In performing its quarterly ceiling test, the Company limits, on a country-by-country basis, the capitalized costs of proved oil and natural gas properties, net of accumulated depletion and deferred income taxes, to the estimated future net cash flows from proved oil and natural gas reserves discounted at 10%, net of related tax effects, plus the lower of cost or fair value of unproved properties included in the costs being amortized. If such capitalized costs exceed the ceiling, the Company will record a write-down to the extent of such excess as a non-cash charge to net income or loss. Any such write-down will reduce earnings in the period of occurrence and result in a lower DD&A rate in future periods. A write-down may not be reversed in future periods, even though higher oil and natural gas prices may subsequently increase the ceiling.
The Company calculates future net cash flows by applying the unweighted average of prices in effect on the first day of the month for the preceding 12-month period, adjusted for location and quality differentials. Such prices are utilized except where different prices are fixed and determinable from applicable contracts for the remaining term of those contracts.
Unproved properties are not depleted pending the determination of the existence of proved reserves. Costs are transferred into the depletable base on an ongoing basis as the properties are evaluated, proved reserves are established, or impairment is determined. Unproved properties are evaluated quarterly to ascertain whether impairment has occurred. This evaluation considers, among other factors, seismic data, plans or requirements to relinquish acreage, drilling results, and activity, remaining time in the commitment period, remaining capital plans, and political, economic, and market conditions. During any period in which factors indicate impairment, the cumulative costs incurred to date for such property are transferred to the full cost pool and subject to depletion. For countries where a reserve base has not yet been established, the impairment is charged to net income or loss.
In exploration areas, related seismic costs are capitalized in unproved property and evaluated as part of the total capitalized costs associated with a property. Seismic costs related to development projects are recorded in proved properties and therefore subject to depletion as incurred.
Gains and losses on the sale or other disposition of oil and natural gas properties are not recognized, unless the gain or loss would significantly alter the relationship between capitalized costs and proved oil and natural gas reserves attributable to a country.
Asset Retirement Obligation
The Company records an estimated liability for future costs associated with the abandonment of its oil and natural gas properties, including the costs of reclamation of drilling sites. The Company records the fair value of a liability for a legal obligation to retire an asset in the period in which the liability is incurred with an offsetting increase to the related oil and natural gas properties. The fair value of an asset retirement obligation is measured by reference to the expected future cash outflows required to satisfy the retirement obligation discounted at the Company’s country specific credit-adjusted risk-free
interest rate. Accretion expense is recognized over time as the discounted liabilities are accreted to their expected settlement value, while the asset retirement cost is amortized over the estimated productive life of the related assets. The accretion of the asset retirement obligation and amortization of the asset retirement cost is included in DD&A. If estimated future costs of an asset retirement obligation change, an adjustment is recorded to both the asset retirement obligation and oil and natural gas properties. Revisions to the estimated asset retirement obligation can result from changes in retirement cost estimates, revisions to estimated inflation rates, and changes in the estimated timing of abandonment.
Other Capital Assets
Other capital assets, including additions and replacements, are recorded at cost upon acquisition and include furniture, fixtures, leasehold improvement, computer equipment, automobiles and right-of-use assets for operating and finance leases. Depreciation for furniture and fixtures, computer equipment, and automobiles is provided using the straight-line method over the useful life of the asset. Leasehold improvements and right-of-use assets for operating and finance leases are depreciated on a straight-line basis over the shorter of the estimated useful life and the term of the related lease. The cost of repairs and maintenance is charged to expenses as incurred.
Leases
At the inception of a contract, the Company assesses whether a contract is, or contains, a lease. A contract is, or contains, a lease if the contract conveys the right to control the use of an identified asset for a period of time in exchange for consideration. At the inception of a contract that contains a lease component, the Company allocates the consideration in the contract to each lease and non-lease component on the basis of their relative stand-alone prices. The Company recognizes a right-of-use asset and a lease liability at the lease commencement date. The right-of-use asset is initially measured at cost and subsequently at cost less any accumulated depreciation and impairment losses and adjusted for certain remeasurements of the lease liability.
The lease liability is initially measured at the present value of the lease payments that are not paid at the commencement date, discounted using the interest rate implicit in the lease, or, if that rate cannot be readily determined, the Company’s incremental borrowing rate. Generally, the Company uses its incremental borrowing rate as the discount rate. The lease liability is subsequently increased by the interest cost on the lease liability and decreased by lease payments made. It is remeasured when there is a change in future lease payments arising from a change in an index or rate, a change in the estimate of the amount expected to be payable under a residual value guarantee, or as appropriate, changes in the assessment of whether a purchase or extension option is reasonably certain to be exercised or a termination option is reasonably certain not to be exercised.
The Company has applied judgment to determine the lease term for contracts which include renewal or termination options. The assessment of whether the Company is reasonably certain to exercise such options impacts the lease term, which significantly affects the amount of lease liabilities and right-of-use assets recognized.
Debt extinguishment and debt modification accounting
The Company accounts for debt restructuring or exchange of debt transactions as either a debt extinguishment or a debt modification. For instruments not involving conversion options, the Company recognizes an exchange of debt as an extinguishment if the present value of the cash flows under the terms of the new debt instrument is at least 10 percent different from the present value of the remaining cash flows under the terms of the original instrument. If the exchange of debt is accounted for as a debt extinguishment, the carrying value of the original debt including unamortized deferred financing fees is derecognized from our balance sheet and the new debt is recognized at its fair value less applicable deferred financing fees, with the difference between the net carrying value of the original debt and the fair value of the new debt recognized as a gain or loss in the consolidated statements of operations. If the terms of a debt instrument are changed or modified and the cash flow effect on a present value basis is less than 10 percent, the debt instrument is not considered to be substantially different, the Company accounts for this debt instrument as debt modification. If the exchange of debt is accounted for as a debt modification, the change of the carrying amount of the original debt on the balance sheet is adjusted to the net present value of the revised cash flows with the adjustments treated as a capital cost and amortized as an adjustment of interest expense on our statement of operations.
Revenue from Contracts with Customers
The Company recognizes revenue when it transfers control of the product to a customer. This generally occurs at the time the customer obtains legal title to the product and when it is physically transferred to the delivery point agreed with the customer.
Revenue is recognized based on the consideration specified in contracts with customers. Revenue represents the Company's share and is recorded net of royalty payments to governments and other mineral interest owners.
The Company evaluates its arrangements with third parties and partners to determine if the Company acts as a principal or an agent. In making this evaluation, management considers if the Company obtains control of the product delivered, which is indicated by the Company having the primary responsibility for the delivery of the product, having the ability to establish prices, or having inventory risk. If the Company acts in the capacity of an agent rather than as a principal in the transaction, then the revenue is recognized on a net basis, only reflecting the fee realized by the Company from the transaction.
Tariffs, tolls, and fees charged to other entities for the use of pipelines owned by the Company are evaluated by management to determine if these originate from contracts with customers or from incidental arrangements. When determining if the Company acted as a principal or an agent in transactions, management determines if the Company obtains control of the product. As part of this assessment, management considers the criteria for revenue recognition set out in Accounting Standard Codification 606.
Stock-based Compensation
The Company records stock-based compensation expense in its consolidated financial statements measured at fair value of the awards that are ultimately expected to vest. Fair values are determined using pricing models such as the Black-Scholes-Merton or Monte Carlo simulation stock option-pricing models and/or observable share prices. For equity-settled stock-based compensation awards, fair values are determined at the grant date, and the expense, net of estimated forfeitures, is recognized using the accelerated method over the requisite service period. An adjustment is made to compensation expense for any difference between the estimated forfeitures and the actual forfeitures. For cash-settled stock-based compensation awards (performance share units, restricted share units and stock options), the expense is recognized over the three-year vesting period based on the latest available estimate of the fair value of the awards at each reporting date, and periodic changes are recognized as compensation costs, with a corresponding change to liabilities.
The Company uses historical data to estimate the expected term used in the Black-Scholes-Merton option pricing model, option exercises, and employee departure behavior. Expected volatilities used in the fair value estimate are based on the historical volatility of the Company’s shares. The risk-free rate for periods within the expected term of the stock options is based on the U.S. Treasury yield curve in effect at the time of grant.
Stock-based compensation expense is capitalized as part of oil and natural gas properties or expensed as part of G&A or operating expenses, as appropriate.
Foreign Currency Translation
The functional currency of the Company, including its subsidiaries, (other than its Canadian subsidiary) is the U.S. dollar. The functional currency of the Canadian subsidiary is the Canadian dollar. Monetary assets and liabilities are translated into the functional currency at the exchange rate in effect at the balance sheet date, and non-monetary items are translated at historical exchange rates. Revenue and expense items are translated in a manner that produces substantially the same reporting currency amounts that would have resulted had the underlying transactions been translated on the dates they occurred.
DD&A expense on assets is translated at the historical exchange rates similar to the assets to which they relate. Gains and losses resulting from foreign currency transactions, which are transactions denominated in a currency other than the entity’s functional currency, are recognized in net income or loss.
The Company’s reporting currency is the U.S. dollar. The assets and liabilities of the Canadian subsidiary are translated to the Company’s reporting currency using the exchange rates at the end of the reporting period. Revenue and expense items are translated at the weighted average exchange rates for the reporting period and shareholders’ equity is translated at historical exchange rates. Foreign exchange gains and loss resulting from translation to reporting currency are recognized in other comprehensive income or loss.
Net Income or Loss per Share
Basic net income or loss per share is calculated by dividing net income or loss attributable to common shareholders by the weighted average number of shares of Common Stock issued and outstanding during each period. Diluted net income or loss per share is calculated by adjusting the weighted average number of shares of Common Stock outstanding for the dilutive effect, if any, of share equivalents. The Company uses the treasury stock method to determine the dilutive effect. This method assumes that all Common Stock equivalents have been exercised at the beginning of the period (or at the time of issuance, if
later), and that the funds obtained thereby were used to purchase shares of Common Stock of the Company at the volume weighted average trading price of shares of Common Stock during the period.
Segment Reporting
The Company’s operations are organized based on the geographical location of each operation. Chief Operational Decision Makers (“CODM”) allocate the Company’s resources and evaluate operation results and profitability using geographical location of each operation. Based on the review of CODM, the Company identified three reportable segments: Colombia, Ecuador and Canada (Note 4.).
Business Combinations
Business combinations are accounted for using the acquisition method. Assets acquired and liabilities assumed in a business combination are recognized at their fair values. Any excess of the consideration paid over the fair value of the net assets acquired and liabilities assumed is recognized as a goodwill and any excess of the fair value of the net assets acquired and liabilities assumed over the consideration paid is recognized as bargain purchase gain in the consolidated statements of operations.
Risks and Measurement Uncertainty
The impacts of ongoing conflicts in several parts of the world coupled with volatility in energy markets, increased interest and inflation rates and constrained supply chains have created a higher level of volatility and uncertainty. Management has, to the reasonable extent, incorporated known facts and circumstances into the estimates made; however, the increased levels of uncertainty and volatility make accounting estimates more judgmental, and the actual results could differ materially from estimates.
Recently Adopted Accounting Pronouncements
In November 2023, FASB issued ASU 2023-07, “Improvements to Reportable Segment Disclosures” for interim and annual financial reporting for all public entities, including those that have a single reportable segment. ASU 2023-07 requires to disclose by each reportable segment the significant segment expenses that are regularly provided to chief operating decision maker, amount and composition of other segment items, measure of segment’s profit or loss in assessing segment performance and how resources are allocated if used by chief operating decision maker and title and position of the chief operating decision maker. If a public entity discloses a single reportable segment, it should identify the measure or measures of a segment’s profit or loss that chief operating decision maker uses in assessing segment performance and deciding how to allocate the resources. The public entity is required to recast the prior-period segment expense information to conform to current-period presentation unless it is impracticable to do so. This ASU is effective for fiscal periods beginning after December 15, 2023 and interim periods within fiscal years beginning after December 15, 2024 and should be applied retrospectively to all periods presented in the financial statements, with early adoption permitted. The Company adopted ASU 2023-07 effective January 1, 2024. The implementation of this update impacted the segmented disclosure of the Company but did not impact the Company’s consolidated financial position, results of operations or cash flows.
Recently Issued Accounting Pronouncements
In December 2023, FASB issued ASU 2023-09, “Improvements to Income Tax Disclosures”. ASU 2023-09 enhances the income tax disclosures to enable investors to better understand entity’s exposure to potential changes in jurisdictional tax legislation and associated risks and opportunities, income tax information that effects cash flow forecasts and potential opportunities to increase future cash flows. This ASU is effective for annual reporting periods beginning after December 15, 2024 and should be applied prospectively, with retrospective application permitted. The Company adopted ASU 2023-09 effective January 1, 2025. The implementation of this update did not have a material impact on disclosures of income taxes.
In November 2024 and January 2025 FASB issued ASU 2024-03 and ASU 2025-01, “Income Statement - Reporting Comprehensive Income - Expense Disaggregation Disclosures”. The amendments in ASU 2024-03 require disclosure, in the notes to financial statements, of specified information about certain costs and expenses, such as purchases of inventory, employee compensation, depreciation, intangible asset amortization, depreciation, depletion, and amortization recognized as part of oil-and natural gas-producing activities included in each relevant expense caption on the face of statement of operations. In addition, this ASU requires the presentation of specific expense captions of comprehensive income on the face of the statements of comprehensive income. ASU 2025-01 clarifies the effective date of ASU 2024-03 to be effective for annual reporting periods beginning after December 15, 2026, and interim reporting periods within annual within annual periods
beginning after December 15, 2027. The Company is currently assessing the impact of this update will have on its financial statements disclosures.
3. Business Combination
On October 31, 2024, the Company acquired all of the issued and outstanding common shares of i3 Energy Plc (“i3 Energy”), subsequently renamed as Gran Tierra UK Limited (“Gran Tierra UK”) for $204.5 million, consisting of cash consideration of $161.8 million, cash dividend of $4.0 million, cash settlement of stock options of $2.0 million and 5,808,925 shares of the Company’s Common Stock, the fair value of which was determined to be $36.7 million based on the closing price of the Company’s shares on the acquisition date. i3 Energy was an oil and natural gas exploration and production company, incorporated in England and Wales with production assets located in the Western Canadian Sedimentary basin. This acquisition will allow the Company to diversify into the assets beyond South America. The acquisition was accounted for as a business combination using the acquisition method with Gran Tierra being the acquirer, whereby the assets acquired and liabilities assumed were recognized at their fair values as at the i3 Energy acquisition date, and the results of i3 Energy were included with those of Gran Tierra from that date. Fair value estimates were made based on significant unobservable (Level 3) inputs and based on the best information available at the time.
Determining the fair values of the assets and liabilities of i3 Energy and the consideration paid required significant judgment and certain assumptions to be made. The most significant fair value estimates related to the valuation of i3 Energy's proved and unproved oil and natural gas properties. The fair value of proved oil and natural gas properties acquired is based on cash flows associated with estimated acquired proved oil and natural gas reserves and the discount rate. Factors that impact these reserves cash flows include forecasted production, forecasted commodity prices, and forecasted operating, royalty and capital costs The following table shows the allocation of the consideration paid based on the fair values of the assets and liabilities acquired.
| | | | | |
| (Thousands of U.S. Dollars) | |
| Consideration Paid: | |
| Cash | $ | 167,822 | |
| Issuance of Common Shares, net of issuance costs | 36,654 | |
| $ | 204,476 | |
| |
Allocation of Total Consideration(1): | |
| Oil and natural gas properties | |
| Proved | $ | 256,040 | |
| Unproved | 34,188 | |
| Net working capital (including cash acquired of $5.2 million, accounts receivable of $24.2 million, accounts payable and accrued liabilities of $54.9 million and current portion of asset retirement obligation of $5.2 million an others) | (18,947) | |
| Other long-term assets | 415 | |
| Long-term deferred tax asset | 8,095 | |
| Long-term deferred tax liability | (47,939) | |
| Long-term portion of asset retirement obligation | (27,006) | |
| Other long-term liabilities | (370) | |
| $ | 204,476 | |
(1) Due to the timing of acquisition, management is continuing to review and assess information to accurately determine the acquisition date fair value of the proved oil and natural gas properties and deferred tax assets and liabilities acquired. During the measurement period, Gran Tierra will continue to obtain information to assist in finalizing the fair value of net assets acquired, which may differ materially from the above preliminary estimates.
The Company’s consolidated statement of operations for the year ended December 31, 2024, included revenue of $19.0 million and net loss of $5.1 million from Gran Tierra UK (former i3 Energy).
Pro Forma Results (unaudited)
Pro forma for the years ended December 31, 2024 and 2023 are shown below, as if the i3 Energy acquisition had occurred on January 1, 2024 and 2023. Pro forma results are not indicative of actual results or future performance:
| | | | | | | | |
| Years Ended December 31, |
| (Unaudited, thousands of U.S. Dollars) | 2024 | 2023 |
| Oil, natural gas and NGL sales | $ | 728,452 | | $ | 811,001 | |
| Net income | $ | 3,220 | | $ | 9,836 | |
| | |
| | |
The pro forma net income for the year-ended December 31, 2024, includes acquisition related transaction costs of $5.9 million incurred by the Company.
4. Segment Reporting
The Company is primarily engaged in the exploration and production of oil, natural gas and NGL. The Company reports segmented information based on internal management reporting used by CODM, which are the Company’s Chief Executive Officer, Chief Financial Officer, Chief Operating Officer, Executive Vice Presidents and Vice Presidents across various business functions. CODM allocates resources and assesses performance of each reportable segment based on segmented earnings. The Company determined three reportable segments based on the geographic organization: Colombia, Ecuador and Canada. The "Other" category represents the Company’s corporate activities.
The following tables present information on the Company’s reportable segments and other activities for the years ended December 31, 2024, 2023 and 2022:
| | | | | | | | | | | | | | | | | | | | | | | | | | | | | |
| | Year Ended December 31, 2024 |
| (Thousands of U.S. Dollars) | Colombia | | Ecuador | | Canada | | Other | | Total |
| Oil, natural gas and NGL sales | $ | 575,482 | | | $ | 27,412 | | | $ | 18,955 | | | $ | — | | | $ | 621,849 | |
| Operating expenses | 179,257 | | | 13,425 | | | 9,649 | | | — | | | 202,331 | |
| Transportation expenses | 16,297 | | | 1,495 | | | 672 | | | — | | | 18,464 | |
| Segmented earnings | $ | 379,928 | | | $ | 12,492 | | | $ | 8,634 | | | $ | — | | | $ | 401,054 | |
| | | | | | | | | |
| DD&A expenses | | | | | | | | | 230,619 | |
| General and administrative expenses | | | | | | | | | 49,619 | |
| Severance | | | | | | | | | 1,519 | |
| Transaction costs | | | | | | | | | 5,907 | |
| Foreign exchange gain | | | | | | | | | (8,808) | |
| Derivative instruments loss | | | | | | | | | 2,271 | |
| Interest expense | | | | | | | | | 80,466 | |
| Non-segmented expenses | | | | | | | | | 361,593 | |
| | | | | | | | | |
| Other gain | | | | | | | | | 1,478 | |
| Interest income | | | | | | | | | 3,666 | |
| Income before income taxes | | | | | | | | | 44,605 | |
| Income tax expense | | | | | | | | | 41,389 | |
| Net income | | | | | | | | | $ | 3,216 | |
| | | | | | | | | |
| Segment capital expenditures | 141,597 | | | 79,388 | | | 12,506 | | | 745 | | | $ | 234,236 | |
| | | | | | | | | | | | | | | | | | | | | | | | | | | | | |
| | Year Ended December 31, 2023 |
| (Thousands of U.S. Dollars) | Colombia | | Ecuador | | Canada | | Other | | Total |
| Oil, natural gas and NGL sales | $ | 621,297 | | | $ | 15,660 | | | $ | — | | | $ | — | | | $ | 636,957 | |
| Operating expenses | 179,103 | | | 7,761 | | | — | | | — | | | 186,864 | |
| Transportation expenses | 13,829 | | | 717 | | | — | | | — | | | 14,546 | |
| Segmented earnings | $ | 428,365 | | | $ | 7,182 | | | $ | — | | | $ | — | | | $ | 435,547 | |
| | | | | | | | | |
| DD&A expenses | | | | | | | | | 215,584 | |
| General and administrative expenses | | | | | | | | | 45,846 | |
| Foreign exchange loss | | | | | | | | | 11,822 | |
| Other financial instruments loss | | | | | | | | | 15 | |
| Interest expense | | | | | | | | | 55,806 | |
| Non-segmented expenses | | | | | | | | | 329,073 | |
| | | | | | | | | |
| Other loss | | | | | | | | | (2,297) | |
| Interest income | | | | | | | | | 1,983 | |
| Income before income taxes | | | | | | | | | 106,160 | |
| Income tax expense | | | | | | | | | 112,447 | |
| Net loss | | | | | | | | | $ | (6,287) | |
| | | | | | | | | |
| Segment capital expenditures | 201,282 | | | 25,277 | | | — | | | 25 | | | $ | 226,584 | |
| | | | | | | | | | | | | | | | | | | | | | | | | | | | | |
| | Year Ended December 31, 2022 |
| (Thousands of U.S. Dollars) | Colombia | | Ecuador | | Canada | | Other | | Total |
| Oil, natural gas and NGL sales | $ | 711,388 | | | $ | — | | | $ | — | | | $ | — | | | $ | 711,388 | |
| Operating expenses | 162,385 | | | — | | | — | | | — | | | 162,385 | |
| Transportation expenses | 10,197 | | | — | | | — | | | — | | | 10,197 | |
| Segmented earnings | $ | 538,806 | | | $ | — | | | $ | — | | | $ | — | | | $ | 538,806 | |
| | | | | | | | | |
| DD&A expenses | | | | | | | | | 180,280 | |
| General and administrative expenses | | | | | | | | | 40,957 | |
| Foreign exchange loss | | | | | | | | | 2,578 | |
| Derivatives instruments loss | | | | | | | | | 26,611 | |
| Other financial instruments gain | | | | | | | | | (7) | |
| Interest expense | | | | | | | | | 46,493 | |
| Non-segmented expenses | | | | | | | | | 296,912 | |
| | | | | | | | | |
| Other gain | | | | | | | | | 2,598 | |
| Interest income | | | | | | | | | 443 | |
| Income before income taxes | | | | | | | | | 244,935 | |
| Income tax expense | | | | | | | | | 105,906 | |
| Net income | | | | | | | | | $ | 139,029 | |
| | | | | | | | | |
| Segment capital expenditures | 179,051 | | | 30,981 | | | — | | | 299 | | | $ | 210,331 | |
| | | | | | | | | | | | | | | | | | | | | | | | | | | | | |
| As at December 31, 2024 |
| (Thousands of U.S. Dollars) | Colombia | | Ecuador | | Canada | | Other | | Total |
| Property, plant and equipment | $ | 1,022,808 | | | $ | 143,034 | | | $ | 247,512 | | | $ | 9,777 | | | $ | 1,423,131 | |
| All other assets | 99,100 | | | 27,942 | | | 62,541 | | | 42,073 | | | $ | 231,656 | |
| Total Assets | $ | 1,121,908 | | | $ | 170,976 | | | $ | 310,053 | | | $ | 51,850 | | | $ | 1,654,787 | |
| | | | | | | | | |
| As at December 31, 2023 |
| (Thousands of U.S. Dollars) | Colombia | | Ecuador | | Canada | | Other | | Total |
| Property, plant and equipment | $ | 1,080,231 | | | $ | 55,902 | | | $ | — | | | $ | 6,717 | | | $ | 1,142,850 | |
| All other assets | 142,066 | | | 10,147 | | | — | | | 31,226 | | | 183,439 | |
| Total Assets | $ | 1,222,297 | | | $ | 66,049 | | | $ | — | | | $ | 37,943 | | | $ | 1,326,289 | |
| | | | | | | | | |
| |
| | | | | | | | | |
| | | | | | | | | |
| | | | | | | | | |
| | | | | | | | | |
| | | | | | | | | |
5. Taxes Receivable
The table below shows the break-down of taxes receivable, which are comprised of value added tax (“VAT”) and income tax receivables and payables:
| | | | | | | | | | | |
| Year Ended December 31, |
| (Thousands of U.S. Dollars) | 2024 | | 2023 |
| Taxes Receivable | | | |
| Current | | | |
| VAT Receivable | $ | 657 | | | $ | 105 | |
| Income Tax Receivable | 17,438 | | | 333 | |
| $ | 18,095 | | | $ | 438 | |
| Long-Term | | | |
| Income Tax Receivable | $ | 1,629 | | | $ | 52,089 | |
| | | |
| Taxes Payable | | | |
| Current | | | |
| VAT Payable | $ | (7,640) | | | $ | (11,438) | |
| Taxes Payable | (6,330) | | | (15,781) | |
| $ | (13,970) | | | $ | (27,219) | |
| | | |
| Total Taxes Receivable | $ | 5,754 | | | $ | 25,308 | |
The following table shows the movement of VAT and income tax receivables and payables for the past two years:
| | | | | | | | | | | | | | | | | |
| (Thousands of U.S. Dollars) | VAT Payable (1) | | Income Tax Receivable | | Total Taxes Receivable |
| Balance, as at December 31, 2022 | $ | (11,730) | | | $ | (19,398) | | | $ | (31,128) | |
| Collected through direct government refunds | (517) | | | — | | | (517) | |
| Collected through sales contracts | (124,706) | | | — | | | (124,706) | |
Taxes paid | 126,264 | | | 49,323 | | | 175,587 | |
| Withholding taxes paid | — | | | 52,397 | | | 52,397 | |
| Current tax expense | — | | | (55,689) | | | (55,689) | |
| Foreign exchange loss (gain) | (644) | | | 10,008 | | | 9,364 | |
| Balance, as at December 31, 2023 | $ | (11,333) | | | $ | 36,641 | | | $ | 25,308 | |
| Collected through direct government refunds | (545) | | | (17,326) | | | (17,871) | |
| Collected through sales contracts | (105,730) | | | — | | | (105,730) | |
| Taxes acquired as part of business combination | 87 | | | 3,240 | | | 3,327 | |
| | | | | | | | | | | | | | | | | |
| Taxes paid | 110,562 | | | 26,776 | | | 137,338 | |
| Withholding taxes paid | — | | | 35,421 | | | 35,421 | |
| Current tax expense | — | | | (69,277) | | | (69,277) | |
| Foreign exchange loss (gain) | (24) | | | (2,738) | | | (2,762) | |
| Balance, as at December 31, 2024 | $ | (6,983) | | | $ | 12,737 | | | $ | 5,754 | |
(1) VAT is paid on certain goods and services and collected on sales in Colombia at a rate of 19%
6. Accounts Receivable
| | | | | | | | | | | |
| As at December 31, |
| (Thousands of U.S. Dollars) | 2024 | | 2023 |
| Trade | $ | 14,059 | | | $ | 5,812 | |
| Other | 21,421 | | | 6,547 | |
| Total Accounts Receivable | $ | 35,480 | | | $ | 12,359 | |
7. Property, Plant and Equipment
| | | | | | | | | | | |
| As at December 31, |
| (Thousands of U.S. Dollars) | 2024 | | 2023 |
| Oil and natural gas properties | | | |
| Proved | $ | 5,298,085 | | | $ | 4,876,185 | |
| Unproved | 119,520 | | | 54,116 | |
| | 5,417,605 | | | 4,930,301 | |
Other (1) | 97,795 | | | 73,505 | |
| 5,515,400 | | | 5,003,806 | |
| Accumulated depletion, depreciation and impairment | (4,092,269) | | | (3,860,956) | |
| $ | 1,423,131 | | | $ | 1,142,850 | |
(1) The “Other” category includes $70.1 million right-of-use assets for finance leases and operating leases, which had a net book value of $35.1 million as at December 31, 2024 (December 31, 2023 - $53.3 million, which had a net book value of $32.4 million).
During the year ended December 31, 2024, the Company entered into six new finance lease contracts related to power generating and safety equipment and seven new operating lease contracts related to office leases in Canada and Ecuador, motor vehicles and field equipment and capitalized $8.1 million and $4.9 million (including three leases of $0.4 million recorded as part of business combination, Note 3), respectively, right-of-use assets related to those contracts.
Depletion and depreciation expense on property, plant and equipment for the year ended December 31, 2024, was $223.1 million (2023 - $209.7 million; 2022 - $175.8 million). A portion of depletion and depreciation expense was recorded as oil inventory in each year.
During the year ended December 31, 2023, the Company and Ecopetrol S.A. renegotiated the terms of the contract for Company’s operatorship of the Suroriente Block, which was previously scheduled to end in mid-2024 and executed the Suroriente Continuation Agreement. The duration of the contract was extended for 20 years from September 1, 2023 (the “Effective Date”), the date on which the Company satisfied the relevant conditions precedent and regulatory approval was received. The Company continues to be the operator of the Suroriente Block. In connection with the contract extension, the Company paid cash consideration of $6.2 million and provided letters of credit with the value of $122.0 million as at December 31, 2024 (Note 15) related to committed capital investments to be made over a three-year period from the Effective Date.
2024 Dispositions
On December 17, 2024, the Company entered into agreement for the strategic disposal of 50% working interest (“WI”) in the Simonette Montney Block with an effective date of September 1, 2024 for cash consideration of C$60.2 million (US$43.1 million) which included the purchase price of C$52.0 million (US$37.2 million) and C$8.2 million (US$5.9 million) economic
adjustment related to previously drilled wells. No gain has been recognized in the statement of operations because the disposal did not significantly alter the relationship between capital costs and proved reserves of oil and natural gas assets disposed.
On December 16, 2024, the Company sold its entire WI of the Westerose Block for cash consideration of C$1.8 million (US$1.3 million). The effective date of the transaction was December 1, 2024.
Unproved Oil and Natural Gas Properties
At December 31, 2024, unproved oil and natural gas properties consisted of exploration lands held in Colombia and Ecuador and undeveloped lands in Canada. Unproved oil and natural gas properties are not being depleted pending determination of the existence of proved reserves. Gran Tierra will continue to assess the unproved properties over the next several years as proved reserves are established and whether or not future areas will be developed. The Company expects that approximately 100% of costs not subject to depletion at December 31, 2024, will be transferred to the depletable base within the next five years.
The following is a summary of Gran Tierra’s oil and natural gas properties not subject to depletion as at December 31, 2024:
| | | | | | | | | | | | | | | | | | | | | | | | | | | | | |
| Costs Incurred in |
| (Thousands of U.S. Dollars) | 2024 | | 2023 | | 2022 | | Prior to 2022 | | Total |
| Acquisition costs - Colombia | $ | — | | | $ | — | | | $ | — | | | $ | 5,161 | | | $ | 5,161 | |
| Exploration costs - Colombia | 3,249 | | | 2,743 | | | 5,904 | | | 25,769 | | | 37,665 | |
| Exploration costs - Ecuador | 34,504 | | | 5,605 | | | 1,516 | | | 1,859 | | | 43,484 | |
| Undeveloped lands - Canada | 33,210 | | | — | | | — | | | — | | | 33,210 | |
| $ | 70,963 | | | $ | 8,348 | | | $ | 7,420 | | | $ | 32,789 | | | $ | 119,520 | |
8. Asset impairment
For the years ended December 31, 2024, 2023 and 2022, the Company had no ceiling test impairment losses. In accordance with GAAP, Gran Tierra used unweighted arithmetic average of the first-day-of-the-month prices as follows; Brent Crude $80.42 per boe, Edmonton Light Crude of C$98.01 per boe, Alberta AECO spot price of C$1.46 per MMBtu Edmonton Propane C$30.46 per boe, Edmonton Butane C$48.39 per boe and Edmonton Condensate C$100.83 per boe for the December 31, 2024 ceiling test calculations (December 31, 2023, and 2022 Brent Crude - $82.51 and $97.98 per boe, respectively).
The Company has considered the impact of the evolving worldwide demand for energy and global advancement of alternative sources of energy that are not sourced from fossil fuels in the impairment assessment on oil and natural gas properties. The estimated ceiling amount of the Company’s oil and natural gas properties was based on proved oil and natural gas reserves, the life of which is generally less than 15 years. The ultimate period in which global energy markets can transition from carbon-based sources to alternative energy is highly uncertain. However, the majority of the cash flows associated with proved oil and natural gas reserves per the 2024 reserve report is expected to be realized prior to the potential elimination of carbon-based energy.
At December 31, 2024, a specific adjustment to the discount rate used in the ceiling test to account for the risk of the evolving demand for energy is not permitted as under the full cost accounting the 10% discount rate is prescribed.
9. Accounts Payable and Accrued Liabilities
| | | | | | | | | | | |
| As at December 31, |
| (Thousands of U.S. Dollars) | 2024 | | 2023 |
| Trade | $ | 177,357 | | | $ | 122,709 | |
| Tax collections on behalf of the government | 11,555 | | | 8,340 | |
| Accrued interest expense | 15,373 | | | 9,934 | |
| Short-term lease liability | 15,283 | | | 12,077 | |
| Employee compensation | 5,700 | | | 6,221 | |
| Unearned insurance premiums | 5,576 | | | — | |
| Joint Venture payable | 5,069 | | | 2,185 | |
| Royalties | 1,984 | | | 2,636 | |
| Other | 35,206 | | | 22,905 | |
| $ | 273,103 | | | $ | 187,007 | |
10. Debt and Debt Issuance Costs
The Company’s debt at December 31, 2024 and 2023, was as follows:
| | | | | | | | | | | |
| As at December 31, |
| (Thousands of U.S. Dollars) | 2024 | | 2023 |
| Current | | | |
| Credit Facility | $ | — | | | $ | 36,364 | |
| 6.25% Senior Notes | 24,828 | | | — | |
| Unamortized debt issuance costs | (21) | | | (755) | |
| $ | 24,807 | | | $ | 35,609 | |
| Long-term | | | |
| 6.25% Senior Notes | — | | | 24,828 | |
| 7.75% Senior Notes | 24,201 | | | 24,201 | |
| 9.50% Senior Notes | 737,590 | | | 487,590 | |
| Unamortized Senior Notes discount | (41,918) | | | (27,958) | |
| Unamortized debt issuance costs | (18,075) | | | (15,679) | |
Long-term lease obligation (1) | 20,325 | | | 26,550 | |
| $ | 722,123 | | | $ | 519,532 | |
| Total Debt | $ | 746,930 | | | $ | 555,141 | |
(1) The current portion of the lease obligation has been included in accounts payable and accrued liabilities on the Company’s balance sheet
and totaled $15.3 million as at December 31, 2024 (December 31, 2023 - $12.1 million).
Senior Notes
At December 31, 2024, the Company had $24.8 million of 6.25% Senior Notes due 2025 (the “6.25% Senior Notes”), $24.2 million of 7.75% Senior Notes due 2027 (the “7.75% Senior Notes”), and $737.6 million of 9.50% Senior Notes due 2029 (the “9.50% Senior Notes”).
The 6.25% Senior Notes bear interest at a rate of 6.25% per year, payable semi-annually in arrears on February 15 and August 15 of each year, beginning on August 15, 2018. The 6.25% Senior Notes matured and were settled on February 15, 2025.
The 7.75% Senior Notes bear interest at a rate of 7.75% per year, payable semi-annually in arrears on May 23 and November 23 of each year, beginning on November 23, 2019. The 7.75% Senior Notes will mature on May 23, 2027, unless earlier redeemed or re-purchased.
The Company may redeem all or a portion of the 7.75% Senior Notes plus accrued and unpaid interest applicable to the date of the redemption at the following redemption prices: 2025 and thereafter - 100%.
On February 6, 2024 and September 18, 2024, the Company issued additional $100.0 million and $150.0 million of 9.50% Senior Notes due October 2029 (the “new 9.50% Senior Notes”), and received cash proceeds of $88.0 million and $139.8 million, respectively. The new 9.50% Senior Notes have the same terms and provisions as the previously issued $487.6 million 9.50% Senior Notes except for the issue price. $100.0 million of new 9.50% Senior Notes accrue interest from October 20, 2023, the date of issuance of the previously issued 9.50% Senior Notes and $150.0 million of new 9.50% Senior Notes accrue interest from April 15, 2024, the date of the last interest payment. The Company received a cash payment of $2.8 million and $6.1 million related to the accrued interest of the $100.0 million and $150.0 million of new 9.50% Senior Notes, respectively.
The 9.50% Senior Notes bear interest at a rate of 9.50% per year, payable semi-annually in arrears on April 15 and October 15 of each year, beginning on April 15, 2024. The 9.50% Senior Notes will mature on October 15, 2029, unless earlier redeemed or re-purchased.
The principal amount of 9.50% Senior Notes is to be repaid as follows: (i) October 15, 2026, 25% of the principal amount; (ii) October 15, 2027, 5% of the principal amount; (iii) October 15, 2028, 30% of the principal amount; and (iv) October 15, 2029, the remainder of the principal amount.
At any time, prior to October 15, 2026, the Company may redeem 35% of the aggregate principal amount of 9.50% Senior Notes at a redemption price equal to 109.50% of the principal amount. Additionally, the Company may redeem all or a portion of the 9.50% Senior Notes:
(i) prior to October 15, 2026, at a redemption price equal to a 100% principal amount plus an applicable premium, which is the greater of:
•1% of the principal amount of 9.50% Senior Notes, and
•the excess of the present value of the redemption price plus all required interest payments computed using a discount rate equal to the Treasury rate at the redemption date plus 0.5% due to date, excluding accrued but unpaid interest, over the outstanding principal amount of 9.50% Senior Notes
(ii) On or after October 15, 2026, at the following redemption prices: 2026 -104.750%; 2027 -102.375%; 2028 and thereafter - 100%.
If the Company undergoes a change of control, holders may require the Company to repurchase for cash all or any portion of their 9.50% Senior Notes at a change of control repurchase price equal to 101% of the principal amount plus accrued and unpaid interest to, but excluding, the change of control repurchase date.
Under the terms of 9.50% Senior Notes agreement, the Company is required to maintain compliance with the following financial covenants:
i.consolidated interest coverage ratio of not less than 2.5; and
ii.consolidated net debt (total debt excluding deferred financing fees debt less cash equivalents) to consolidated adjusted earnings before interest, taxes and DD&A (“EBITDA”) of not more than 3.0.
As at December 31, 2024, the Company was in compliance with all applicable covenants.
Credit Facility
As at December 31, 2023, the Company had a $36.4 million balance outstanding under the Company’s credit facility. On February 6, 2024, the outstanding balance under the credit facility was fully re-paid and the credit facility was terminated.
On August 19, 2024, the Company entered into a credit facility agreement (“Loan Facility”) with a market leader in the global commodities industry to fund the cash consideration payable to i3 Energy’s shareholders in connection with the i3 Energy acquisition and associated costs (Note 3). The Loan Facility has a borrowing base of £80.0 million (US$107.0 million) and bears interest based on a three-month secured overnight financing rate posted by the Federal Reserve Bank of New York plus a margin of 3.00% per annum for the first three months after the initial drawdown and 6.00% per annum thereafter. The Loan Facility is subject to a commitment fee equal to the higher of $0.5 million and 0.50% of the borrowing base converted to U.S. dollars using the agreed upon GBP to USD foreign exchange rate at the time of initial drawdown date. The Company paid $0.6 million of commitment fees and the Loan Facility was terminated on October 31, 2024.
In connection with the i3 Energy acquisition closing on October 31, 2024, the Company amended and restated the existing revolving credit facility agreement of i3 Energy Canada Ltd. (“i3 Energy Canada”) with National Bank of Canada dated March 22, 2024. As a result of the amendment and restatement, among other things, the borrowing base was revised to C$100.0 million (US$69.5 million) with available commitment of a C$50.0 million (US$34.7 million) revolving credit facility
comprised of C$35.0 million (US$24.32 million) syndicated facility and C$15.0 million (US$10.4 million) of operating facility. Subject to the next borrowing base redetermination which will occur on or before June 30, 2025, the revolving credit facility is available until October 31, 2025 with a repayment date of October 31, 2026, which may be extended by further periods of up to 364 days, subject to lender approval. The drawn down amounts under the revolving credit facility can either be in Canadian or U.S. dollars and bear interest rates equal to either the Canadian prime rate or U.S. Base Rate plus a margin ranging from 2.00% to 4.00% per annum or for CORRA loans and SOFR loans plus a margin ranging from 3.00% to 5.00% per annum. Undrawn amounts under the revolving credit facility bear standby fee ranging from 0.75% to 1.25% per annum. In each case, the margin or standby fee, as applicable is based on Net Debt to EBITDA ratio of Gran Tierra Canada Ltd. As of December 31, 2024, the credit facility remained undrawn.
Leases
During the year ended December 31, 2024, the Company recorded seven new operating leases related to office leases in Canada and Ecuador, motor vehicles and field equipment totaling $4.9 million (including three leases of $0.4 million recorded as part of business combination, Note 3) and six new finance leases for power generation and safety equipment totaling $8.1 million. Operating leases have a lease term ranging from one to five years and weighted average discount rate of 6.69%. Finance leases have a lease term ranging from one to two years and weighted average discount rate of 9.60%.
As of December 31, 2024, the Company’s finance leases had remaining useful lives ranging from one to three years and the weighted average discount rate of 9.27% and operating leases had remaining useful lives ranging from one to five years and the weighted average discount rate of 7.54%.
Interest Expense
The following table presents the total interest expense recognized in the accompanying consolidated statements of operations:
| | | | | | | | | | | | | | | | | |
| Year Ended December 31, |
| (Thousands of U.S. Dollars) | 2024 | | 2023 | | 2022 |
| Contractual interest and other financing expenses | $ | 67,548 | | | $ | 49,975 | | | $ | 42,965 | |
| Amortization of debt issuance costs | 12,918 | | | 5,831 | | | 3,528 | |
| $ | 80,466 | | | $ | 55,806 | | | $ | 46,493 | |
The Company incurred debt issuance costs in connection with the issuance of the 9.50% Senior Notes and its credit facility. As at December 31, 2024, the balance of unamortized debt issuance costs has been presented as a direct deduction against the carrying amount of debt and is being amortized to interest expense using the effective interest method over the term of the debt.
11. Share Capital
| | | | | |
| Shares of Common Stock |
| Shares issued and outstanding, December 31, 2021 | 36,714,450 | |
| Options exercised | 175,412 | |
| Shares issued, December 31, 2022 | 36,889,862 | |
| Shares re-purchased and canceled | (2,274,746) | |
| Shares issued and outstanding, December 31, 2022 | 34,615,116 | |
| Options exercised | 1,839 | |
| Shares re-purchased and canceled | (2,341,842) | |
| Shares issued, December 31, 2023 | 32,275,113 | |
Treasury stock (1) | (28,612) | |
| Shares issued and outstanding, December 31, 2023 | 32,246,501 | |
| Options exercised | 66,825 | |
| Shares re-purchased and canceled | (1,662,110) | |
| Shares issued upon acquisition | 5,808,925 | |
| Shares issued, December 31, 2024 | 36,460,141 | |
| Treasury stock | (487,948) | |
| Shares issued and outstanding at December 31, 2024 | 35,972,193 | |
(1) 28,612 treasury stock shares held in 2023 were canceled during the year ended December 31, 2024.
The Company’s authorized share capital consists of 82 million shares of capital stock, of which 57 million was designated as Common Stock, par value $0.001 per share and 25 million as Preferred Stock, par value $0.001 per share.
On May 5, 2023, the Company completed a 1-for-10 reverse stock split of the Company’s Common Stock. As a result of the reverse stock split, every ten of the Company’s issued shares of Common Stock were automatically combined into one issued share of Common Stock, without any change to the par value per share. All share and per share numbers have been adjusted to reflect the reverse stock split. The Company’s outstanding options were also proportionately adjusted as a result of the reverse stock split to increase the exercise price and reduce the number of shares issuable upon exercise.
Share Re-purchase Program
During the year ended December 31, 2024, the Company implemented a share re-purchase program (the “2024 Program”) through the facilities of the Toronto Stock Exchange, the NYSE American or alternative trading programs in Canada or the United States, if eligible. Under the 2024 Program, the Company is able to purchase up to 3,545,872 shares of Common Stock, representing 10% of the public float as of October 31, 2024, at prevailing market prices at the time of purchase. The 2024 Program will continue for one year and expire on November 5, 2025, or earlier if the 10% maximum is reached.
During the year ended December 31, 2024, the Company re-purchased 487,948 shares of Common Stock at a weighted average price of approximately $6.49 per share under the 2024 Program and 1,662,110 shares at a weighted average price of $7.31 per share under the 2023 Program implemented in 2023 with similar terms to that of 2024 Program. The 2023 Program expired on November 2, 2024. As of December 31, 2024, all shares re-purchased under the 2024 Program were held as treasury shares and all shares re-purchased under the 2023 Program were cancelled subsequent to re-purchase.
Equity Compensation Awards
The Company has an equity compensation program for its executives, employees, and directors. Executives and employees are given equity compensation grants that vest based on a recipient’s continued employment. In the case of Performance Share Units (“PSUs”), the number of units that vest is dependent upon the achievement of specific key performance measures. Equity based awards consist of 80% of PSUs and 20% of RSUs. The Company’s stock-based compensation awards outstanding as at December 31, 2024, include PSUs, deferred share units (“DSUs”) issued to directors, restricted share units (“RSUs”) and stock options.
In accordance with the 2007 Equity Incentive Plan, as amended, the Company’s Board of Directors is authorized to issue options or other rights to acquire shares of the Company’s Common Stock. On June 27, 2012, the shareholders of Gran Tierra approved an amendment to the Company’s 2007 Equity Incentive Plan, which increased the Common Stock available for issuance thereunder from 2,330,610 shares to 3,980,610 shares. On June 2, 2021, the shareholders of Gran Tierra approved an amendment to the Company’s 2007 Equity Incentive Plan, which increased the Common Stock available for issuance thereunder from 3,980,610 shares to 5,480,610 shares. On May 4, 2022, the shareholders of Gran Tierra approved an amendment to the Company’s 2007 Equity Incentive Plan, which increased the Common Stock available for issuance thereunder from 5,480,610 shares to 5,980,610 shares.
The following table provides information about PSU, DSU, RSU and stock option activity for the year ended December 31, 2024:
| | | | | | | | | | | | | | | | | | | | | | | | | | | | | |
| PSUs | | DSUs | | RSUs | | Stock Options |
| Number of Outstanding Share Units | | Number of Outstanding Share Units | | Number of Outstanding Share Units | | Number of Outstanding Stock Options | | Weighted Average Exercise Price ($) |
| Balance, December 31, 2023 | 3,896,356 | | | 776,610 | | | — | | | 2,027,807 | | | 9.93 | |
| Granted | 3,581,853 | | | 128,064 | | | 680,199 | | | 6,281 | | | 6.96 | |
| Exercised | (1,847,322) | | | — | | | — | | | (211,249) | | | 7.00 | |
| Forfeited | (250,258) | | | — | | | (14,072) | | | (55,498) | | | 9.68 | |
| Expired | — | | | — | | | — | | | (216,844) | | | 20.67 | |
| Balance, December 31, 2024 | 5,380,629 | | | 904,674 | | | 666,127 | | | 1,550,497 | | | 8.82 | |
| Vested and exercisable, at December 31, 2024 | | | | | | | 1,193,755 | | | 8.56 | |
| Vested, or expected to vest, at December 31, 2024 through the life of the options | | | | | | | 1,539,855 | | | 8.82 | |
On May 1, 2024, the Company amended the settlement terms of all outstanding stock option awards. As of this date, all outstanding stock options are to be net settled in cash resulting in a change in classification of stock options from equity to liability. On May 1, 2024, the Company recorded a liability of $4.4 million and an additional stock-based compensation costs of $0.4 million related to the modification of the stock option plan. As at December 31, 2024, the equity compensation award liability on the Company’s balance sheet included $2.2 million of current liability and $0.2 million of long-term liability related to the Company’s outstanding stock options.
The fair value of each stock option award was estimated on the modification date using the Black-Scholes-Merton option-pricing model based on the assumptions noted in the following table:
| | | | | |
| Fair value of option modification | $0.00 - $6.11 |
| Dividend yield (per share) | Nil |
| Expected volatility | 43% to 87% |
| Risk-free interest rate | 4.6% to 5.1% |
| Expected term | 0.1 - 4.9 years |
| Expected forfeiture rate | 0% to 5% |
For the year ended December 31, 2024, stock-based compensation expense was $9.7 million (2023 - $5.7 million; 2022 - $9.0 million) and was recorded in G&A expenses.
At December 31, 2024, there was $21.9 million (December 31, 2023 - $8.6 million) of unrecognized compensation cost related to unvested PSUs, RSUs and stock options to be recognized over a weighted average period of 1.7 years. The weighted average remaining contractual term of options vested, or expected to vest, at December 31, 2024, is 1.6 years.
PSUs
PSUs entitle the holder to receive, at the option of the Company, either the underlying number of shares of the Company’s Common Stock upon vesting of such units or a cash payment equal to the value of the underlying shares. PSUs will cliff vest after three years, subject to the grantee’s continued employment. Upon vesting, the underlying number of Common Shares or the cash payment equivalent to their value may range from nil to 200% of the number of PSU’s vested, based on the Company’s performance with respect to the applicable performance targets. As at December 31, 2024, 1.1 million (December
31, 2023 - 1.8 million) of PSUs had vested and will settle in cash. The performance targets for the PSUs outstanding as at December 31, 2024, were as follows:
i.50% of the award is subject to targets relating to the total shareholder return (“TSR”) of the Company against a group of peer companies;
ii.2022 and 2023 awards: 25% of the award is subject to targets relating to net asset value (“NAV”) of the Company per share, and NAV is based on before tax net present value discounted at 10% of proved plus probable reserves;
2024 awards: 25% of the award is subject to compliance with financial covenants and $20 million free cash flow;
and
iii.25% of the award is subject to targets relating to the execution of corporate strategy.
The compensation cost of PSUs is subject to adjustment based upon the attainability of these performance targets. No settlement will occur with respect to the portion of the PSU award subject to each performance target for results below the applicable minimum threshold for that target. In excess of the target number granted, PSUs will vest and be settled if performance exceeds the targeted performance goals. The Company currently intends to settle the PSUs in cash.
DSUs
DSUs entitle the holder to receive either the underlying number of shares of the Company’s Common Stock upon vesting of such units or, at the option of the Company, a cash payment equal to the value of the underlying shares. Once a DSU is vested, it is immediately settled. During the year ended December 31, 2024, DSUs were granted to directors and will be settled at such time the grantee ceases to be a member of the Board of Directors. The Company currently intends to settle the DSUs in cash.
RSUs
RSUs entitle the holder to receive either the underlying number of shares of the Company’s Common Stock upon vesting of such units or, at the option of the Company, a cash payment equal to the value of the underlying shares. Under the 2007 Equity Incentive Plan, RSUs will vest one-third each year over a three-year period.
Stock Options
Each stock option permits the holder to purchase one share of Common Stock at the stated exercise price. The exercise price equals the market price of a share of Common Stock at the time of grant and vest over three years. The term of the stock options granted is five years or three months after the grantee’s end of service to the Company, whichever occurs first.
For the year ended December 31, 2024, 66,825 stock options were exercised, and $373 thousand cash proceeds were received (2023 - 1,839 stock options were exercised, and $8.0 thousand cash proceeds were received and 2022 - 175,412 stock options were exercised, and $1.3 million cash proceeds were received).
At December 31, 2024 and 2023, the weighted average remaining contractual term for outstanding stock options was 1.6 and 2.3 years, respectively, and for exercisable stock options was 1.2 and 1.5 years, respectively.
The fair value of each stock option award is estimated on the date of grant using the Black-Scholes Merton option-pricing model based on assumptions noted in the following table:
| | | | | | | | | | | | | | | | | |
| | Year Ended December 31, |
| | 2024 | | 2023 | | 2022 |
| Dividend yield (per share) | Nil | | Nil | | Nil |
| Volatility | 69% to 83% | | 82% to 90% | | 77% to 81% |
| Weighted average volatility | 74 | % | | 88 | % | | 77 | % |
| Risk-free interest rate | 3.5% to 4.0% | | 3.6% to 4.7% | | 1.4% to 4.0% |
| Expected term | 4 - 5 years | | 4 - 5 years | | 5 years |
The weighted average grant date fair value for options granted in the year ended December 31, 2024 was $4.29 (2023 - $5.57; 2022 - $8.83) per option. The weighted average grant date fair value for options vested in the year ended December 31, 2024
was $2.02 (2023 - $4.77; 2022 - $5.81) per option. The total fair value of stock options vested during the year ended December 31, 2024 was $0.8 million (2023 - $2.3 million; 2022 - $2.2 million).
Weighted Average Shares Outstanding
| | | | | | | | | | | | | | | | | |
| | Year Ended December 31, |
| | 2024 | | 2023 | | 2022 |
| Weighted average number of common shares outstanding | 32,042,897 | | | 33,469,828 | | | 36,445,546 | |
| Shares issuable pursuant to stock options | — | | | — | | | 1,184,732 | |
| Shares assumed to be purchased from proceeds of stock options | — | | | — | | | (702,268) | |
| Weighted average number of diluted common shares outstanding | 32,042,897 | | | 33,469,828 | | | 36,928,010 | |
For the year ended December 31, 2024, all options were excluded from the diluted earnings (loss) per share calculation as the options were anti-dilutive (2023 - 1,825,299; 2022 - 590,025)
12. Asset Retirement Obligation
Changes in the carrying amounts of the asset retirement obligation associated with the Company’s oil and natural gas properties were as follows:
| | | | | | | | | | | |
| | Year Ended December 31, |
| (Thousands of U.S. Dollars) | 2024 | | 2023 |
| Balance, beginning of year | $ | 73,508 | | | $ | 63,499 | |
| Liability incurred | 2,276 | | | 4,671 | |
| Settlements | (1,698) | | | (377) | |
| Accretion | 7,167 | | | 5,387 | |
| Currency translation | (1,082) | | | — | |
| Liability associated with assets sold | (847) | | | — | |
| Liability assumed on acquisitions | 32,186 | | | — | |
| Revisions in estimated liability | (1,194) | | | 328 | |
| Balance, end of year | $ | 110,316 | | | $ | 73,508 | |
| | | |
Current (1) | $ | 4,380 | | | $ | 479 | |
| Long-term | $ | 105,936 | | | $ | 73,029 | |
| Balance, end of year | $ | 110,316 | | | $ | 73,508 | |
| | | |
| | | |
| | | |
| | | |
(1) Current portion of asset retirement obligation is included in accounts payable and accrued liabilities on the Company’s balance sheet
Revisions in estimated liabilities relate primarily to changes in estimates of asset retirement costs and include, but are not limited to, revisions of estimated inflation rates, changes in property lives and the expected timing of settling asset retirement obligations. At December 31, 2024, the fair value of assets that were legally restricted for purposes of settling asset retirement obligations was $8.0 million (December 31, 2023 - $8.9 million). These assets were accounted for as restricted cash and cash equivalents on the Company’s balance sheet (Note 17).
13. Revenue
| | | | | | | | | | | | | | | | | | | | | | | |
| | Year Ended December 31, 2024 |
| | Crude Oil | | Natural Gas | | NGL | | Total Revenue |
| Colombia | 575,482 | | | — | | | — | | | 575,482 | |
| Ecuador | 27,412 | | | — | | | — | | | 27,412 | |
| Canada | 12,583 | | | 4,567 | | | 1,805 | | | 18,955 | |
| $ | 615,477 | | | $ | 4,567 | | | $ | 1,805 | | | $ | 621,849 | |
| | | | | | | | | | | | | | | | | | | | | | | |
| | Year Ended December 31, 2023 |
| | Crude Oil | | Natural Gas | | NGL | | Total Revenue |
| Colombia | 621,297 | | | — | | | — | | | 621,297 | |
| Ecuador | 15,660 | | | — | | | — | | | 15,660 | |
| Canada | — | | | — | | | — | | | — | |
| $ | 636,957 | | | $ | — | | | $ | — | | | $ | 636,957 | |
| | | | | | | | | | | | | | | | | | | | | | | |
| | Year Ended December 31, 2022 |
| | Crude Oil | | Natural Gas | | NGL | | Total Revenue |
| Colombia | 711,341 | | | 47 | | — | | | 711,388 | |
| Ecuador | — | | | — | | | — | | | — | |
| Canada | — | | | — | | | — | | | — | |
| $ | 711,341 | | | $ | 47 | | | $ | — | | | $ | 711,388 | |
During the year ended December 31, 2024, the Company’s production was sold primarily to one major customer, representing 91% of total Company’s sales volumes, of which 87% were sold in Colombia, 3% in Ecuador and 1% in Canada (2023 - one, representing 97% of total sales volumes in Colombia and 1% in Ecuador and 2022 - two, representing 78% and 22% of total sales volumes in Colombia).
As at December 31, 2024, accounts receivable included $13.4 million (at December 31, 2023 and 2022 - nil) of accrued sales revenue related to December production of each respective year.
14. Taxes
The income tax expense reported differs from the amount computed by applying the statutory rate to income (loss) before income taxes for the following reasons:
| | | | | | | | | | | | | | | | | |
| | Year Ended December 31, |
| (Thousands of U.S. Dollars) | 2024 | | 2023 | | 2022 |
| Income (loss) before income taxes | | | | | |
| United States | $ | (51,317) | | $ | (40,589) | | $ | (38,161) |
| Foreign | 95,922 | | 146,749 | | 283,096 |
| 44,605 | | 106,160 | | 244,935 |
Statutory rate (1) | 45 | % | | 45% | | 35% |
| Income tax expense expected | 20,072 | | 47,772 | | 85,727 |
| Impact of foreign taxes | 16,001 | | 21,139 | | 8,876 |
| Foreign currency translation | (7,090) | | 39,995 | | (4,641) |
| Stock-based compensation | 1,676 | | 2,127 | | 5,804 |
| Change in valuation allowance | 14,711 | | (10,632) | | 2,386 |
| Non-deductible third party royalty in Colombia | 3,631 | | 3,253 | | 3,422 |
| Other permanent differences | 2,205 | | 8,793 | | 4,332 |
| Strategic Tax Optimization | (9,817) | | — | | — |
| Total income tax expense | $ | 41,389 | | $ | 112,447 | | $ | 105,906 |
| | | | | |
| Effective tax rate | 93 | % | | 106% | | 43% |
| | | | | |
| Current income tax expense | | | | | |
| | | | | |
| Foreign | 69,277 | | 55,688 | | 80,566 |
| 69,277 | | 55,688 | | 80,566 |
| Deferred income tax expense (recovery) | | | | | |
| Foreign | (27,888) | | 56,759 | | 25,340 |
| Total income tax expense | $ | 41,389 | | $ | 112,447 | | $ | 105,906 |
(1) The tax rate is the statutory rate in Colombia.
In general, it is the Company’s practice and intention to reinvest the earnings of our non-U.S. subsidiaries in such subsidiaries’ operations. As of December 31, 2024, the Company has not made a provision for U.S. or additional foreign withholding taxes on the investments in foreign subsidiaries that are indefinitely reinvested. Generally, such amounts become subject to taxation upon the remittance of dividends and under certain other circumstances.
On December 31, 2022, the Colombian Government enacted a tax reform that took effect on January 1, 2023, introducing significant changes to the income tax regime for oil companies. One of the key changes was the introduction of a surcharge on the existing 35% tax rate. This surcharge is calculated by comparing the average inflation-adjusted Brent price for the taxation year to the monthly inflation-adjusted Brent prices over the previous 120 months. If the Brent price for the taxation year exceeds the 30th percentile of this historical range, a 5% surtax applies. The surtax increases to 10% when the price surpasses the 45th percentile and to 15% when it exceeds the 60th percentile. For both 2023 and 2024, the calculation of current and deferred income tax has been based on a 10% surtax, resulting in a total tax rate of 45%.
The table below presents the components of the deferred tax liabilities and assets as at December 31, 2024 and 2023:
| | | | | | | | | | | |
| | As at December 31, |
| (Thousands of U.S. Dollars) | 2024 | | 2023 |
| Tax benefit of operating loss carryforwards | $ | 68,500 | | | $ | 29,448 | |
| Book basis in excess of tax basis | (122,031) | | | (86,510) | |
| Foreign tax credits | 66,515 | | | 66,515 | |
| Other accruals | 56,557 | | | 51,022 | |
| Deferred tax assets before valuation allowance | 69,541 | | | 60,475 | |
| Valuation allowance | (121,937) | | | (107,005) | |
| Net deferred tax (liabilities) assets | $ | (52,396) | | | $ | (46,530) | |
| | | |
| Deferred tax assets | 11,718 | | | 10,923 | |
| | 11,718 | | | 10,923 | |
| | | |
| | | |
| Deferred tax liabilities | 64,114 | | | 57,453 | |
| 64,114 | | | 57,453 | |
| Net deferred tax (liabilities) assets | $ | (52,396) | | | $ | (46,530) | |
At December 31, 2024, the Company has not recognized the benefit of unused non-capital loss carryforwards of $114.4 million (2023 - $58.8 million, 2022 - $91.3 million) for federal purposes in the United States, which expire from 2037 to 2044.
At December 31, 2024, the Company has not recognized the benefit of unused non-capital loss carryforwards of $3.3 million (2023 - $16.5 million, 2022 - $40.7 million), out of a total of $101.7 million for federal purposes in Colombia. The Company’s remaining Colombian tax losses are entitled to a carryforward period of 12 years.
At December 31, 2024, the Company has not recognized the benefit of unused non-capital loss carryforwards of $14.2 million in UK.
As at December 31, 2024, Gran Tierra had $0.8 million of unrecognized tax benefits and related interest and penalties included in its deferred tax assets and current tax liabilities on the consolidated balance sheet. The Company does not anticipate any material changes with respect to unrecognized tax benefit within the next twelve months. The Company had no other significant interest or penalties related to taxes included in the consolidated statement of operations for the year ended December 31, 2024. The Company and its subsidiaries file income tax returns in the U.S. and certain other foreign jurisdictions. The Company is subject to income tax examinations for the tax years ended 2017 through 2023 in certain jurisdictions.
15. Commitments and Contingencies
Purchase Obligations, Firm Agreements and Leases
As at December 31, 2024, future minimum payments under non-cancelable agreements with remaining terms in excess of one year were as follows:
| | | | | | | | | | | | | | | | | | | | | | | | | | | | | | | | | | | | | | | | | |
| | Year ending December 31 |
| (Thousands of U.S. Dollars) | Total | | 2025 | | 2026 | | 2027 | | 2028 | | 2029 | | Thereafter |
| Oil transportation services | $ | 2,858 | | | $ | 1,997 | | | $ | 730 | | | $ | 110 | | | $ | 17 | | | $ | 4 | | | $ | — | |
| Facilities | 3,249 | | | 1,379 | | | 1,379 | | | 491 | | | — | | | — | | | — | |
Operating leases (1) | 14,779 | | | 5,631 | | | 3,108 | | | 3,222 | | | 2,758 | | | 60 | | | — | |
Finance leases (1) | 25,868 | | | 12,157 | | | 4,567 | | | 3,047 | | | 6,097 | | | — | | | — | |
| Software and Telecommunication | 2,229 | | | 376 | | | 557 | | | 557 | | | 559 | | | 180 | | | — | |
| $ | 48,983 | | | $ | 21,540 | | | $ | 10,341 | | | $ | 7,427 | | | $ | 9,431 | | | $ | 244 | | | $ | — | |
(1) Including maintenance and operating costs.
Gran Tierra has operating leases for office spaces, vehicles, and tanks and finance leases for power generation and enhanced oil recovery facilities, storage tanks, and compressors.
Indemnities
Corporate indemnities have been provided by the Company to directors and officers for various items including, but not limited to, all costs to settle suits or actions due to their association with the Company and its subsidiaries and/or affiliates, subject to certain restrictions. The Company has purchased directors’ and officers’ liability insurance to mitigate the cost of any potential future suits or actions. The maximum amount of any potential future payment cannot be reasonably estimated. The Company may provide indemnifications in the normal course of business that are often standard contractual terms to counterparties in certain transactions such as purchase and sale agreements. The terms of these indemnifications will vary based upon the contract, the nature of which prevents the Company from making a reasonable estimate of the maximum potential amounts that may be required to be paid.
Letters of Credit
At December 31, 2024, the Company had provided letters of credit and other credit support totaling $244.5 million (December 31, 2023 - $220.1 million) as security relating to work commitment guarantees in Colombia and Ecuador contained in exploration contracts, the Suroriente Block (Note 7), and other capital or operating requirements as well as for transmission capacity in Canada.
Contingencies
Gran Tierra has several lawsuits and claims pending. The outcome of the lawsuits and disputes cannot be predicted with certainty; Gran Tierra believes the resolution of these matters would not have a material adverse effect on the Company’s consolidated financial position, results of operations, or cash flows. Gran Tierra records costs as they are incurred or become probable and determinable.
16. Financial Instruments, Fair Value Measurement, Credit Risk and Foreign Exchange Risk
Financial Instruments
Financial instruments are initially recorded at fair value, defined as the price that would be received to sell an asset or paid to market participants to settle liability at the measurement date. For financial instruments carried at fair value, GAAP establishes a fair value hierarchy that prioritizes the inputs to valuation techniques used to measure fair value. This hierarchy consists of three broad levels:
•Level 1 - Inputs representing quoted market prices in active markets for identical assets and liabilities
•Level 2 - Inputs other than quoted prices included within Level 1 that are observable for the assets and liabilities, either directly or indirectly
•Level 3 - Unobservable inputs for assets and liabilities
The Company’s financial instruments recognized on the balance sheet consist of cash and cash equivalents, restricted cash and cash equivalents(1), accounts receivable, PEF, other long-term assets, accounts payable and accrued liabilities, credit facility, long-term debt and other long-term liabilities. The Company’s valuation techniques to measure the fair values of assets and liabilities are described in the subsequent disclosures.
Fair Value Measurement
The following table presents the Company’s fair value measurements of its financial instruments as of December 31, 2024 and 2023: | | | | | | | | | | | |
| As at December 31, |
| 2024 | | 2023 |
| (Thousands of U.S. Dollars) | | | |
| Level 1 | | | |
| Assets | | | |
PEF - current(1) | $ | — | | | $ | 5,630 | |
| | | |
| | | |
| Liabilities | | | |
| 6.25% Senior Notes | $ | 24,133 | | | $ | 22,994 | |
| 7.75% Senior Notes | 21,451 | | | 20,744 | |
| 9.50% Senior Notes | 688,262 | | | 429,018 | |
| $ | 733,846 | | | $ | 472,756 | |
| Level 2 | | | |
| Assets | | | |
Restricted cash and cash equivalents - long-term (2) | $ | 6,816 | | | $ | 7,750 | |
Commodity derivatives - current(2) | $ | 712 | | | $ | — | |
| $ | 7,528 | | | $ | 7,750 | |
(1) Included in the other current assets on the Company’s balance sheet
(2) The current portion of commodity derivatives was included into accounts receivable balance
The fair values of cash and cash equivalents, current restricted cash and cash equivalents, accounts receivable, accounts payable and accrued liabilities and credit facility approximate their carrying amounts due to the short-term maturity of these instruments.
Restricted cash - long-term
The fair value of long-term restricted cash and cash equivalents approximate its carrying value because interest rates are variable and reflective of market rates.
PEF
As at December 31, 2024, the Company had no outstanding PEF shares (As at December 31, 2023 - 1.0 million notional shares with a fair value of $5.6 million). During the year ended December 31, 2024, the Company settled all outstanding notional PEF shares and received net proceeds on disposition of $5.1 million, resulting in a $0.3 million loss recorded in G&A expenses. During the years ended December 31, 2023 and 2022, the Company recorded - $5.0 million loss and $1.3 million gain, respectively, on valuation of PEF shares in G&A expenses.
Senior Notes
Financial instruments recorded at amortized costs at December 31, 2024, include the Senior Notes (Note 10). The Senior Notes are publicly traded on Singapore Exchange and the fair value is determined using the Senior Notes trading prices at the end of each reporting period.
At December 31, 2024, the carrying amounts of the 6.25% Senior Notes, 7.75% Senior Notes and 9.50% Senior Notes were $24.8 million, $23.9 million and $677.9 million, respectively, which represents the aggregate principal amounts less unamortized debt issuance costs and discounts.
Derivative asset and derivative liability
The fair value of derivatives is estimated based on various factors, including quoted market prices in active markets and quotes from third parties. The Company also performs an internal valuation to ensure the reasonableness of third party quotes. In consideration of counterparty credit risk, the Company assessed the possibility of whether the counterparty to the derivative would default by failing to make any contractually required payments. Additionally, the Company considers that it has the ability to meet its potential repayment obligations associated with the derivative transactions.
The following table presents the nature of our financial instruments gains or losses for each of the three years ended December 31, 2024:
| | | | | | | | | | | | | | | | | |
| Year Ended December 31, |
| (Thousands of U.S. Dollars) | 2024 | | 2023 | | 2022 |
| Commodity price derivative loss | $ | 2,271 | | | $ | — | | | $ | 26,611 | |
Commodity Price Risk
The Company may at times utilize commodity price derivatives to manage the variability in cash flows associated with the forecasted sale of its oil production, reduce commodity price risk and provide a base level of cash flow in order to assure it can execute at least a portion of its capital spending. As at December 31, 2024, the Company had outstanding commodity price derivative positions in Canada and Colombia as follows:
| | | | | | | | | | | | | | | | | | | | | | | | | | | | | | | | | | | | | | |
| CANADA - OIL |
| Type of Instrument | Start Period | | End Period | Volume, bbl/d | | Reference | | Price (C$/bbl or $/bbl) | | Purchased Put (C$/bbl, Weighted Average) | | Sold Call (C$/bbl, Weighted Average) |
| Collar | January 01, 2025 | | January 31, 2025 | 450 | | | WTI CMA | | — | | | C$ | 100.00 | | | C$ | 110.22 | |
| Collar | February 01, 2025 | | February 28, 2025 | 250 | | | WTI CMA | | — | | | C$ | 100.00 | | | C$ | 112.25 | |
| Collar | March 01, 2025 | | March 31, 2025 | 250 | | | WTI CMA | | — | | | C$ | 100.00 | | | C$ | 110.45 | |
| Call option | January 01, 2025 | | December 31, 2025 | 250 | | | WTI CMA | | — | | | C$ | — | | | C$ | 95.00 | |
| Swap | January 01, 2025 | | January 31, 2025 | 1,050 | | | WTI CMA | | C$ | 99.03 | | | — | | | — | |
| Swap | January 01, 2025 | | March 31, 2025 | 200 | | | WTI CMA | | C$ | 101.20 | | | — | | | — | |
| Swap | February 01, 2025 | | February 28, 2025 | 900 | | | WTI CMA | | C$ | 101.12 | | | — | | | — | |
| Swap | March 01, 2025 | | March 31, 2025 | 900 | | | WTI CMA | | C$ | 99.82 | | | — | | | — | |
| Swap | April 01, 2025 | | April 30, 2025 | 1,750 | | | WTI CMA | | C$ | 102.56 | | | — | | | — | |
| Swap | May 01, 2025 | | May 31, 2025 | 1,750 | | | WTI CMA | | C$ | 98.81 | | | — | | | — | |
| Swap | June 01, 2025 | | June 30, 2025 | 1,250 | | | WTI CMA | | C$ | 98.55 | | | — | | | — | |
| Swap | July 01, 2025 | | July 31, 2025 | 1,100 | | | WTI CMA | | C$ | 99.23 | | | — | | | — | |
| Swap | August 01, 2025 | | August 31, 2025 | 500 | | | WTI CMA | | C$ | 94.67 | | | — | | | — | |
| Swap | February 01, 2025 | | February 28, 2025 | 400 | | | WTI CMA | | $ | 76.55 | | | — | | | — | |
| Swap | March 01, 2025 | | March 31, 2025 | 400 | | | WTI CMA | | $ | 75.95 | | | — | | | — | |
| Swap | April 01, 2025 | | April 30, 2025 | 250 | | | WTI CMA | | $ | 72.73 | | | — | | | — | |
| | | | | | | | | | | | | | | | | | | | | | | | | | | | | | | | | | | | | | |
| CANADA - NATURAL GAS |
| Type of Instrument | Start Period | | End Period | Volume,
GJ/day | | Reference | | Sold Swap (C$/GJ, Weighted Average) | | Purchased Put (C$/GJ, Weighted Average) | | Sold Call (C$/GJ, Weighted Average) |
| Swap | April 01, 2024 | | March 31, 2025 | 15,000 | | | Aeco 5A | | 2.52 | | | — | | | — | |
| Swap | November 01, 2024 | | March 31, 2025 | 5,000 | | | Aeco 5A | | 3.20 | | | — | | | — | |
| Swap | January 01, 2025 | | March 31, 2025 | 10,000 | | | Aeco 5A | | 2.93 | | | — | | | — | |
| Swap | April 01, 2025 | | April 30, 2025 | 2,500 | | | Aeco 5A | | 2.77 | | | — | | | — | |
| Swap | April 01, 2025 | | December 31, 2025 | 7,500 | | | Aeco 5A | | 3.12 | | | — | | | — | |
| Swap | May 01, 2025 | | June 30, 2025 | 2,500 | | | Aeco 5A | | 2.50 | | | — | | | — | |
| Swap | June 01, 2025 | | December 31, 2025 | 5,000 | | | Aeco 5A | | 3.00 | | | — | | | — | |
| Swap | October 01, 2025 | | December 31, 2025 | 10,000 | | | Aeco 5A | | 3.20 | | | — | | | — | |
| | | | | | | | | | | | | | | | | | | | | | | | | | | | | | | | | | | | | | |
| CANADA - PROPANE |
| Type of Instrument | Start Period | | End Period | Volume, boe/d | | Reference | | Sold Swap ($/gal, Weighted Average) | | Purchased Put ($/gal, Weighted Average) | | Sold Call ($/gal, Weighted Average) |
| Swap | January 01, 2025 | | March 31, 2025 | 250 | | | Conway | | 0.83 | | | — | | | — | |
| | | | | | | | | | | | | | | | | | | | | | | | | | | | | | | | | | | | | | |
| COLOMBIA - OIL |
| Type of Instrument | Start Period | | End Period | Volume, bbl/d | | Reference | | Purchased Put ($/bbl, Weighted Average) | | Sold Call ($/bbl, Weighted Average) | | Premium ($/bbl, Weighted Average) |
| Put Option | January 01, 2025 | | March 31, 2025 | 3,000 | | | Brent | | 70.00 | | | — | | | 3.23 | |
| Put Option | April 01, 2025 | | June 30, 2025 | 3,000 | | | Brent | | 70.00 | | | — | | | 3.23 | |
| Collar | January 01, 2025 | | March 31, 2025 | 1,000 | | | Brent | | 65.00 | | | 77.00 | | | — | |
| Collar | April 01, 2025 | | June 30, 2025 | 1,000 | | | Brent | | 65.00 | | | 77.00 | | | — | |
| Collar | July 01, 2025 | | September 30, 2025 | 1,000 | | | Brent | | 65.00 | | | 77.00 | | | — | |
| Collar | October 01, 2025 | | December 31, 2025 | 1,000 | | | Brent | | 65.00 | | | 77.00 | | | — | |
Subsequent to the year ended December 31, 2024, the Company entered into the following commodity price derivative positions:
| | | | | | | | | | | | | | | | | | | | | | | | | | | | | | | | | | | | | | |
| COLOMBIA - OIL |
| Type of Instrument | Start Period | | End Period | Volume, bbl/d | | Reference | | Purchased Put ($/bbl, Weighted Average) | | Sold Call ($/bbl, Weighted Average) | | Premium ($/bbl, Weighted Average) |
| Put Option | February 01, 2025 | | March 31, 2025 | 1,000 | | | Brent | | 68.50 | | | — | | | 3.34 | |
| Put Option | April 01, 2025 | | June 30, 2025 | 1,000 | | | Brent | | 68.50 | | | — | | | 3.34 | |
| Put Option | July 01, 2025 | | September 30, 2025 | 1,000 | | | Brent | | 68.50 | | | — | | | 3.34 | |
| Put Option | October 01, 2025 | | December 31, 2025 | 1,000 | | | Brent | | 68.50 | | | — | | | 3.34 | |
| Collar | February 01, 2025 | | March 31, 2025 | 3,000 | | | Brent | | 65.00 | | | 80.42 | | | — | |
| Collar | March 01, 2025 | | July 31, 2025 | 500 | | | Brent | | 65.00 | | | 80.75 | | | — | |
| Collar | March 01, 2025 | | July 31, 2025 | 500 | | | Brent | | 65.00 | | | 80.78 | | | — | |
| Collar | April 01, 2025 | | June 30, 2025 | 3,000 | | | Brent | | 65.00 | | | 80.42 | | | — | |
| Collar | July 01, 2025 | | September 30, 2025 | 3,000 | | | Brent | | 65.00 | | | 80.42 | | | — | |
| Collar | October 01, 2025 | | December 31, 2025 | 3,000 | | | Brent | | 65.00 | | | 80.42 | | | — | |
| | | | | | | | | | | | | | | | | | | | | | | | | | | | | | | | | | | | | | |
| CANADA - OIL |
| Type of Instrument | Start Period | | End Period | Volume, bbl/d | | Reference | | Price ($/bbl) | | Purchased Put ($/bbl, Weighted Average) | | Sold Call (C$/ or $/bbl, Weighted Average) |
| Collar | March 01, 2025 | | March 31, 2025 | 500 | | | WTI CMA | | — | | | 65.00 | | | 77.40 | |
| Collar | April 01, 2025 | | June 30, 2025 | 500 | | WTI CMA | | — | | | 65.00 | | | 77.40 | |
| Collar | July 01, 2025 | | September 30, 2025 | 500 | | WTI CMA | | — | | | 65.00 | | | 77.40 | |
| Collar | October 01, 2025 | | December 31, 2025 | 500 | | WTI CMA | | — | | | 65.00 | | | 77.40 | |
| Call Option | January 01, 2026 | | December 31, 2026 | 500 | | | WTI CMA | | — | | | — | | | C$ | 107.00 | |
| | | | | | | | | | | | | | | | | | | | | | | | | | | | | | | | | | | | | | |
| CANADA - NATURAL GAS |
| Type of Instrument | Start Period | | End Period | Volume,
GJ/day | | Reference | | Sold Swap (C$/GJ, Weighted Average) | | Purchased Put (C$/GJ, Weighted Average) | | Sold Call (C$/GJ, Weighted Average) |
| Put Option | April 01, 2025 | | September 30, 2025 | 6,500 | | | Aeco 7A | | — | | | 2.00 | | | — | |
Foreign Exchange Risk
The Company is exposed to foreign exchange risk in relation to its Colombian and Canadian operations predominantly in operating and transportation costs and G&A expenses. To mitigate exposure to fluctuations in foreign exchange, the Company may enter into foreign currency exchange derivatives. As at December 31, 2024, the Company had no outstanding foreign currency exchange derivative positions.
Unrealized foreign exchange gains and losses primarily result from fluctuation of the U.S. dollar to the Colombian peso and Canadian dollar due to Gran Tierra’s accounts payable, tax and deferred tax assets and liabilities which are monetary assets and liabilities mainly denominated in the local currencies. As a result, foreign exchange gains and losses must be calculated on conversion to the U.S. dollar functional currency. A one percent strengthening in Colombian peso against the U.S. dollar results in foreign exchange loss of approximately $0.3 million of U.S. dollars on accounts payable, gain of approximately $0.1 million of U.S. dollars on taxes receivable and payable and loss of approximately $0.2 million of U.S. dollars on deferred tax assets and liabilities. This effect was calculated based on the Company’s December 31, 2024 balances of accounts payable, deferred tax assets, and taxes payable. The translation of assets and liabilities of Canadian operations from Canadian dollar functional currency does not impact consolidated statements of operations foreign exchange gains and losses.
For the year ended December 31, 2024, 93% of the Company’s oil, natural gas and NGL sales were generated in Colombia, 4% of oil, natural gas and NGL sales generated in Ecuador and 3% of oil, natural gas and NGL in Canada for two months of
operations (2023 and 2022, respectively, 97% and 100% of the Company's oil sales were generated in Colombia). In Colombia and Ecuador, the Company receives 100% of its revenues in U.S. dollars and the majority of its capital expenditures are in U.S. dollars or are based on U.S. dollar prices. In Canada, 100% of oil, natural gas and NGL revenue is received in Canadian dollars and operating costs and capital expenditures are primarily based on Canadian dollar prices
Credit Risk
Credit risk arises from the potential that the Company may incur a loss if counterparty to a financial instrument fails to meet its obligation in accordance with agreed terms. The Company’s financial instruments that are exposed to concentrations of credit risk consist primarily of cash and cash equivalents, restricted cash and cash equivalents and accounts receivable. The carrying value of cash and cash equivalents, restricted cash and cash equivalents and accounts receivable reflects management’s assessment of credit risk.
At December 31, 2024, cash and cash equivalents and restricted cash and cash equivalents included balances in bank accounts, term deposits and certificates of deposit, placed with financial institutions with investment grade credit ratings.
Most of the Company’s accounts receivable relate to sales to customers in the oil and natural gas industry and are exposed to typical industry credit risks. The concentration of revenues in a single industry affects the Company’s overall exposure to credit risk because customers may be similarly affected by changes in economic and other conditions. The Company manages this credit risk by entering into sales contracts with only credit worthy entities and reviewing its exposure to individual entities on a regular basis. Additionally, the Company reduces the credit risk exposure by managing its accounts receivable which are paid on a weekly basis in Colombia and Ecuador and on a monthly basis in Canada. For the year ended December 31, 2024, the Company had one customer (2023 - one and 2022 - two) which accounted for over 91% of sales.
To reduce the concentration of exposure to any individual counterparty, the Company utilizes a group of investment-grade rated financial institutions for its derivative transactions. The Company monitors counterparty creditworthiness on an ongoing basis; however, it cannot predict sudden changes in counterparties’ creditworthiness. In addition, even if such changes are not sudden, the Company may be limited in its ability to mitigate an increase in counterparty credit risk. Should one of these counterparties not perform, the Company may not realize the benefit of some of its derivative instruments.
17. Supplemental Cash Flow Information
The following table provides a reconciliation of cash, cash equivalents and restricted cash and cash equivalents with the Company’s consolidated balance sheet that sum to the total of such amounts shown in the consolidated statements of cash flows:
| | | | | | | | | | | | | | | | | |
| As at December 31, |
| (Thousands of U.S. Dollars) | 2024 | | 2023 | | 2022 |
| Cash and cash equivalents | $ | 103,379 | | | $ | 62,146 | | | $ | 126,873 | |
Restricted cash and cash equivalents - current(1) | 1,142 | | | 1,142 | | | 1,142 | |
Restricted cash and cash equivalents - long-term (1) | 6,816 | | | 7,750 | | | 5,343 | |
| $ | 111,337 | | | $ | 71,038 | | | $ | 133,358 | |
(1) The current portion of restricted cash and cash equivalents is included in other current assets and long-term portion of restricted cash and cash equivalents is included in other long-term assets on the Company's balance sheet.
Net changes in assets and liabilities from operating activities were as follows:
| | | | | | | | | | | | | | | | | |
| | Year Ended December 31, |
| (Thousands of U.S. Dollars) | 2024 | | 2023 | | 2022 |
| Accounts receivable and other long-term assets | $ | 949 | | | $ | (1,628) | | | $ | 2,352 | |
| Derivatives | — | | | — | | | (2,749) | |
| PEF | 6,114 | | | 11,118 | | | (9,876) | |
| Prepaids and inventory | (11,987) | | | (9,557) | | | (5,940) | |
| Accounts payable and accrued and other long-term liabilities | 669 | | | (1,276) | | | (5,789) | |
| Taxes receivable and payable | 20,333 | | | (47,073) | | | 86,319 | |
| Net changes in assets and liabilities from operating activities | $ | 16,078 | | | $ | (48,416) | | | $ | 64,317 | |
Net changes in working capital from investing activities were as follows:
| | | | | | | | | | | | | | | | | |
| | Year Ended December 31, |
| (Thousands of U.S. Dollars) | 2024 | | 2023 | | 2022 |
| Additions to property, plant and equipment | $ | (248,103) | | | $ | (218,882) | | | $ | (236,604) | |
| Increase (decrease) in accounts payable and accrued liabilities | 14,623 | | | (7,628) | | | 26,273 | |
| Increase in accounts receivable | (756) | | | (74) | | | — | |
| $ | (234,236) | | | $ | (226,584) | | | $ | (210,331) | |
The Company corrected presentation of cash flows associated with additions to property, plant and equipment within net cash used in investing activities in the Consolidated Statements of Cash Flows for the years ended December 31, 2023 and 2022. For the year ended December 31, 2023, additions to property, plant and equipment as previously reported of $218.9 million (2022 - $236.6 million) were presented on an accrual basis before the related decrease in cash outflow due to impact of changes in non-cash investing working capital of $(7.7) million (2022 - $26.3 million). The cash outflow associated with additions to property, plant and equipment has been recasted in accordance with the direct method. There was no change in amount to the Company’s previously reported net cash used in investing activities.
The following table provides additional supplemental cash flow disclosures:
| | | | | | | | | | | | | | | | | |
| Year Ended December 31, |
| (Thousands of U.S. Dollars) | 2024 | | 2023 | | 2022 |
| Cash paid for income taxes | $ | 26,776 | | | $ | 49,323 | | | $ | 5,480 | |
| Cash paid for withholding taxes | $ | 35,421 | | | $ | 52,397 | | | $ | 31,572 | |
| Cash paid for interest | $ | 60,650 | | | $ | 43,755 | | | $ | 43,363 | |
| | | | | |
| Net liabilities related to property, plant and equipment, end of year | $ | 61,283 | | | $ | 47,416 | | | $ | 55,118 | |
Supplementary Data (Unaudited)
1) Oil and Natural Gas Producing Activities
In accordance with Financial Accounting Standards Board (FASB) Accounting Standards Codification Topic 932, “Extractive Activities—Oil and Gas”, and regulations of the U.S. Securities and Exchange Commission (SEC), the Company is making certain supplemental disclosures about its oil and natural gas exploration and production operations.
A. Estimated Proved Net After Royalty (“NAR”) Reserves
The following table sets forth Gran Tierra’s estimated proved NAR reserves and total net proved developed and undeveloped reserves as of December 31, 2022, 2023, and 2024, and the changes in total net proved reserves during the three-year period ended December 31, 2024.
The net proved reserves represent management’s best estimate of proved oil and natural gas reserves after royalties. Reserve estimates for each property are prepared internally each year and 100% of the reserves at December 31, 2024, have been evaluated by independent reservoir engineering specialist, McDaniel & Associates Consultants Ltd.
The reserve estimation process requires us to use significant decisions and assumptions in the evaluation of available geological, geophysical, engineering and economic data for each property, and demonstrate reasonable certainty that they are recoverable from known reservoirs under economic and operating conditions that existed at year end. The determination of oil and natural gas reserves is complex and requires significant judgment. Assumptions used to estimate reserve information may significantly increase or decrease such reserves in future periods. The estimates of reserves are subject to continuing changes and, therefore, an accurate determination of reserves may not be possible for many years because of the time needed for development, drilling, testing, and studies of reservoirs.
| | | | | | | | | | | | | | | | | | | | | | | | | | |
| Colombia | | Ecuador | | Canada |
| Crude Oil | NaturalGas | | Crude Oil | | Crude Oil | NaturalGas | NGL(1) |
| (Mbbl) | (MMcf) | | (Mbbl) | | (Mbbl) | (MMcf) | (Mbbl) |
| Proved NAR Reserves, December 31, 2021 | 66,075 | | 1,669 | | | 490 | | | — | | — | | — | |
| | | | | | | | |
| Extensions | 3,777 | | | | 2,496 | | | — | | — | | — | |
| Technical revisions | 1,713 | | (208) | | | (155) | | | — | | — | | — | |
| Production | (9,098) | | (15) | | | (31) | | | — | | — | | — | |
| Proved NAR Reserves, December 31, 2022 | 62,467 | | 1,446 | | | 2,800 | | | — | | — | | — | |
| | | | | | | | |
| Extensions and discoveries | 16,316 | | — | | | 1,492 | | | — | | — | | — | |
| Technical revisions | 175 | | (1,446) | | | 550 | | | — | | — | | — | |
| Production | (9,291) | | — | | | (213) | | | — | | — | | — | |
| Proved NAR Reserves, December 31, 2023 | 69,667 | | — | | | 4,629 | | | — | | — | | — | |
Acquisitions (1) | — | | — | | | — | | | 10,100 | | 184,832 | | 21,787 | |
| Extensions and discoveries | 3,064 | | — | | | 5,572 | | | — | | — | | — | |
| Technical revisions | (245) | | — | | | (143) | | | — | | — | | — | |
Production (1) | (8,789) | | — | | | (566) | | | (192) | | (2,536) | | (260) | |
| Proved NAR Reserves, December 31, 2024 | 63,697 | | — | | | 9,492 | | | 9,908 | | 182,296 | | 21,527 | |
| | | | | | | | |
| Proved Developed Reserves NAR, December 31, 2021 | 41,869 | | 880 | | | — | | | — | | — | | — | |
| Proved Developed Reserves NAR, December 31, 2022 | 39,645 | | 858 | | | 715 | | | — | | — | | — | |
| Proved Developed Reserves NAR, December 31, 2023 | 38,942 | | — | | | 657 | | | — | | — | | — | |
| Proved Developed Reserves NAR, December 31, 2024 | 34,151 | | — | | | 1,752 | | | 5,730 | | 93,028 | | 10,938 | |
| | | | | | | | |
| Proved Undeveloped Reserves NAR, December 31, 2021 | 24,206 | | 789 | | | 490 | | | — | | — | | — | |
| Proved Undeveloped Reserves NAR, December 31, 2022 | 22,822 | | 588 | | | 2,085 | | | — | | — | | — | |
| Proved Undeveloped Reserves NAR, December 31, 2023 | 30,725 | | — | | | 3,972 | | | — | | — | | — | |
| Proved Undeveloped Reserves NAR, December 31, 2024 | 29,546 | | — | | | 7,740 | | | 4,178 | | 89,268 | | 10,589 | |
(1) NGL includes immaterial volume of Condensate
Changes in proved reserves during the years ended December 31, 2024, 2023 and 2022 shown in the table above primarily resulted from the following significant factors:
Acquisitions. Acquisitions relate to Canadian operations acquired through the i3 Energy acquisition on October 31, 2024.
Improved Recoveries. There were no improved recoveries for the years ended December 31, 2024, 2023 and 2022 respectively.
Extensions and Discoveries. Added 8.6 MMbbl of proved reserves during the year ended December 31, 2024, of which 3.1 MMbbl were extensions in Colombia and 5.6 MMbbl were discoveries in Ecuador. In Colombia, we had 1.1 and 2.0 MMbbl of extensions in the Costayaco and Acordionero fields. In Ecuador, we had a 4.3 MMbbl discovery in the Chanangue Block and a 1.2 MMbl discovery in the Charapa block (2023 - 17.8 MMbbl due to reserve extensions in the Acordionero and Costayaco fields and the Charapa and Chanangue Blocks and a discovery in the Alea-1848 Block and 2022 - 6.3 MMbbl, due to reserve extensions in the Acordionero and Costayaco fields and the Charapa and Chanangue Blocks and a discovery in the Alea-1848 Block).
Technical and Economic Revisions. Deducted 0.4 MMbbl of proved oil reserves during the year ended December 31, 2024. In Colombia we reduced 0.2 MMbbl primarily due to the underperformance of Acordionero Forelimb and Costayaco South area drills relative to previous expectations and reduced 0.1 MMbbl in Ecuador due to production type curve decreases (2023 - 0.7 MMBOE related to positive technical revisions based on increased drilling and continued waterflood performance in the Acordionero and Costayaco fields and 2022 - 1.6 MMBOE, related to positive technical revisions based on increased drilling and continued waterflood performance in the Acordionero and Costayaco fields).
B. Capitalized Costs
Capitalized costs for Gran Tierra’s oil and natural gas producing activities consisted of the following at the end of each of the years in the two-year period ended December 31, 2024:
| | | | | | | | | | | | | | | | | | | | | | | |
| (Thousands of U.S. Dollars) | Proved Properties | | Unproved Properties | | Accumulated
Depletion,
Depreciation
and
Impairment | | Net Capitalized Costs |
| Balance, December 31, 2024 | $ | 5,298,085 | | | $ | 119,520 | | | $ | (4,037,507) | | | $ | 1,380,098 | |
| | | | | | | |
| Balance, December 31, 2023 | $ | 4,876,185 | | | $ | 54,116 | | | $ | (3,821,115) | | | $ | 1,109,186 | |
C. Costs Incurred
The following table presents costs incurred for Gran Tierra’s oil and natural gas property acquisitions and exploration and development for the respective years:
| | | | | | | | | | | | | | |
| (Thousands of U.S. Dollars) | Colombia | Ecuador | Canada | Total |
| Year Ended December 31, 2024 | | | | |
| Property acquisition costs | | | | |
| Proved | $ | — | | $ | — | | $ | 256,040 | | $ | 256,040 | |
| Unproved | $ | — | | $ | — | | $ | 34,188 | | $ | 34,188 | |
| Exploration costs | $ | 13,043 | | $ | 81,770 | | $ | — | | $ | 94,813 | |
| Development costs | $ | 118,976 | | $ | 18,175 | | $ | 7,996 | | $ | 145,147 | |
| | | | |
| Year Ended December 31, 2023 | | | | |
| Property acquisition costs | | | | |
| Proved | $ | — | | $ | — | | $ | — | | $ | — | |
| Unproved | $ | — | | $ | — | | $ | — | | $ | — | |
| Exploration costs | $ | 15,674 | | $ | 14,188 | | $ | — | | $ | 29,862 | |
| Development costs | $ | 199,240 | | $ | 4,581 | | $ | — | | $ | 203,821 | |
| | | | |
| Year Ended December 31, 2022 | | | | |
| Property acquisition costs | | | | |
| Proved | $ | — | | $ | — | | $ | — | | $ | — | |
| Unproved | $ | — | | $ | — | | $ | — | | $ | — | |
| Exploration costs | $ | 50,374 | | $ | 39,524 | | $ | — | | $ | 89,898 | |
| Development costs | $ | 160,933 | | $ | — | | $ | — | | $ | 160,933 | |
D. Results of Operations for Oil and Natural Gas Producing Activities
| | | | | | | | | | | | | | |
| (Thousands of U.S. Dollars) | Colombia | Ecuador | Canada | Total |
| December 31, 2024 | | | | |
| Oil, natural gas and NGL sales | $ | 575,482 | | $ | 27,412 | | $ | 18,955 | | $ | 621,849 | |
| Production costs | (195,554) | | (14,920) | | (10,321) | | $ | (220,795) | |
| Exploration expenses | — | | — | | — | | $ | — | |
| DD&A expenses | (211,239) | | (10,162) | | (8,941) | | $ | (230,342) | |
| Inventory impairment | — | | — | | — | | $ | — | |
| Income tax (expense) recovery | (80,036) | | (1,040) | | 70 | | $ | (81,006) | |
| Results of Operations | $ | 88,653 | | $ | 1,290 | | $ | (237) | | $ | 89,706 | |
| | | | |
| December 31, 2023 | | | | |
| Oil, natural gas and NGL sales | $ | 621,297 | | $ | 15,660 | | $ | — | | $ | 636,957 | |
| Production costs | (192,933) | | (8,477) | | — | | $ | (201,410) | |
| Exploration expenses | — | | — | | — | | $ | — | |
| DD&A expenses | (207,346) | | (8,018) | | — | | $ | (215,364) | |
| Inventory impairment | — | | — | | — | | $ | — | |
| Income tax (expense) recovery | (103,491) | | 90 | | — | | $ | (103,401) | |
| Results of Operations | $ | 117,527 | | $ | (745) | | $ | — | | $ | 116,782 | |
| | | | |
| December 31, 2022 | | | | |
| Oil, natural gas and NGL sales | $ | 711,388 | | $ | — | | $ | — | | $ | 711,388 | |
| Production costs | (172,582) | | — | | — | | $ | (172,582) | |
| Exploration expenses | — | | — | | — | | $ | — | |
| DD&A expenses | (180,039) | | — | | — | | $ | (180,039) | |
| Inventory impairment | — | | — | | — | | $ | — | |
| Income tax expense | (105,906) | | — | | — | | $ | (105,906) | |
| Results of Operations | $ | 252,861 | | $ | — | | $ | — | | $ | 252,861 | |
E. Standardized Measure of Discounted Future Net Cash Flows and Changes
The following disclosure is based on estimates of net proved reserves and the period during which they are expected to be produced. Future cash inflows are computed by applying the twelve month period unweighted arithmetic average of the price as of the first day of each month within that twelve month period, unless prices are defined by contractual arrangements, excluding escalations based on future conditions to Gran Tierra’s after royalty share of estimated annual future production from proved oil, natural gas and NGL reserves.
| | | | | | | | | | | | | | | | | |
| Colombia | | Ecuador | | Canada |
| Twelve month period unweighted arithmetic average of the wellhead price as of the first day of each month within the twelve month period | | | | | |
| 2024 | $ | 68.07 | | | $ | 74.85 | | | $ | 23.19 | |
| 2023 | $ | 69.91 | | | $ | 77.44 | | | $ | — | |
| 2022 | $ | 86.16 | | | $ | 91.53 | | | $ | — | |
| Weighted average production costs | | | | | |
| 2024 | $ | 20.04 | | | $ | 21.79 | | | $ | 10.35 | |
| 2023 | $ | 18.54 | | | $ | 20.66 | | | $ | — | |
| 2022 | $ | 16.26 | | | $ | 19.55 | | | $ | — | |
Future development and production costs to be incurred in producing and further developing the proved reserves are based on year end cost indicators. Future income taxes are computed by applying year end statutory tax rates. These rates reflect allowable deductions and tax credits, and are applied to the estimated pre-tax future net cash flows. Discounted future net cash
flows are calculated using 10% mid-year discount factors. The calculations assume the continuation of existing economic, operating and contractual conditions. However, such prescribed assumptions have not proved to be the case in the past. Other assumptions could give rise to substantially different results.
The Company believes this information does not in any way reflect the current economic value of its oil and gas producing properties or the present value of their estimated future cash flows as:
•no economic value is attributed to probable and possible reserves;
•use of a 10% prescribed discount rate; and
•prices change constantly from the twelve-month period unweighted arithmetic average of the price as of the first day of each month within that twelve-month period.
The standardized measure of discounted future net cash flows from Gran Tierra’s estimated proved oil and gas reserves is as follows:
| | | | | | | | | | | | | | | | | | | | | | | |
| (Thousands of U.S. Dollars) | Colombia | | Ecuador | | Canada | | Total |
| December 31, 2024 | | | | | | | |
| Future cash inflows | $ | 4,352,434 | | | $ | 710,523 | | | $ | 1,408,890 | | | $ | 6,471,847 | |
| Future production costs | (1,518,247) | | | (336,708) | | | (700,944) | | | (2,555,899) | |
| Future development costs | (515,541) | | | (207,441) | | | (276,201) | | | (999,183) | |
| Future asset retirement obligations | (83,754) | | | (8,700) | | | (156,810) | | | (249,264) | |
| Future income tax expense | (671,195) | | | (63,503) | | | (71,606) | | | (806,304) | |
| Future net cash flows | 1,563,697 | | | 94,171 | | | 203,329 | | | 1,861,197 | |
| 10% discount | (474,196) | | | (41,892) | | | (59,766) | | | (575,854) | |
| Standardized Measure of Discounted Future Net Cash Flows | $ | 1,089,501 | | | $ | 52,279 | | | $ | 143,563 | | | $ | 1,285,343 | |
| | | | | | | |
| December 31, 2023 | | | | | | | |
| Future cash inflows | $ | 4,893,758 | | | $ | 358,421 | | | $ | — | | | $ | 5,252,179 | |
| Future production costs | (1,552,227) | | | (158,643) | | | — | | | (1,710,870) | |
| Future development costs | (460,819) | | | (89,639) | | | — | | | (550,458) | |
| Future asset retirement obligations | (82,314) | | | (3,300) | | | — | | | (85,614) | |
| Future income tax expense | (954,973) | | | (41,852) | | | — | | | (996,825) | |
| Future net cash flows | 1,843,425 | | | 64,987 | | | — | | | 1,908,412 | |
| 10% discount | (516,451) | | | (22,924) | | | — | | | (539,375) | |
| Standardized Measure of Discounted Future Net Cash Flows | $ | 1,326,974 | | | $ | 42,063 | | | $ | — | | | $ | 1,369,037 | |
| | | | | | | |
| December 31, 2022 | | | | | | | |
| Future cash inflows | $ | 5,410,256 | | | $ | 256,220 | | | $ | — | | | $ | 5,666,476 | |
| Future production costs | (1,298,198) | | | (104,614) | | | — | | | (1,402,812) | |
| Future development costs | (334,560) | | | (63,040) | | | — | | | (397,600) | |
| Future asset retirement obligations | (50,520) | | | (2,700) | | | — | | | (53,220) | |
| Future income tax expense | (1,391,436) | | | (33,058) | | | — | | | (1,424,494) | |
| Future net cash flows | 2,335,542 | | | 52,808 | | | — | | | 2,388,350 | |
| 10% discount | (659,092) | | | (18,632) | | | — | | | (677,724) | |
| Standardized Measure of Discounted Future Net Cash Flows | $ | 1,676,450 | | | $ | 34,176 | | | $ | — | | | $ | 1,710,626 | |
Changes in the Standardized Measure of Discounted Future Net Cash Flows
The following table summarizes changes in the standardized measure of discounted future net cash flows for Gran Tierra’s proved oil and natural gas reserves:
| | | | | | | | | | | | | | | | | | | | | | | |
| (Thousands of U.S. Dollars) | Colombia | | Ecuador | | Canada | | Total |
| Present Value as of December 31, 2021 | $ | 1,221,409 | | | $ | 368 | | | $ | — | | | $ | 1,221,777 | |
| Sales and transfers of oil and natural gas produced, net of production costs | (433,676) | | | — | | | — | | | (433,676) | |
| Net changes in prices and production costs related to future production | 1,337,869 | | | 36,081 | | | — | | | 1,373,950 | |
| Extensions, discoveries and improved recovery, less related costs | 252,120 | | | 132,294 | | | — | | | 384,414 | |
| Previously estimated development costs incurred during the year | (136,856) | | | — | | | — | | | (136,856) | |
| Revisions of previous quantity estimates | 155,017 | | | (79,557) | | | — | | | 75,460 | |
| Accretion of discount | 122,141 | | | 37 | | | — | | | 122,178 | |
| Net change in income taxes | (714,433) | | | (25,446) | | | — | | | (739,879) | |
| Changes in future development costs | (127,141) | | | (29,601) | | | — | | | (156,742) | |
| Net increase | $ | 455,041 | | | $ | 33,808 | | | $ | — | | | $ | 488,849 | |
| Present Value as of December 31, 2022 | $ | 1,676,450 | | | $ | 34,176 | | | $ | — | | | $ | 1,710,626 | |
| | | | | | | |
| Sales and transfers of oil and natural gas produced, net of production costs | (718,606) | | | (21,097) | | | — | | | (739,703) | |
| Net changes in prices and production costs related to future production | (881,343) | | | (43,003) | | | — | | | (924,346) | |
| Extensions, discoveries and improved recovery, less related costs | 533,244 | | | 50,010 | | | — | | | 583,254 | |
| Previously estimated development costs incurred during the year | (116,709) | | | (39,955) | | | — | | | (156,664) | |
| Revisions of previous quantity estimates | 848,823 | | | 133,050 | | | — | | | 981,873 | |
| Accretion of discount | 167,645 | | | 3,418 | | | — | | | 171,063 | |
| Net change in income taxes | 44,585 | | | (11,710) | | | — | | | 32,875 | |
| Changes in future development costs | (227,115) | | | (62,826) | | | — | | | (289,941) | |
| Net (decrease) increase | $ | (349,476) | | | $ | 7,887 | | | $ | — | | | $ | (341,589) | |
| Present Value as of December 31, 2023 | $ | 1,326,974 | | | $ | 42,063 | | | $ | — | | | $ | 1,369,037 | |
| | | | | | | |
| Sales and transfers of oil and natural gas produced, net of production costs | (523,573) | | | (33,179) | | | — | | | (556,752) | |
| Net changes in prices and production costs related to future production | (216,670) | | | 423,053 | | | — | | | 206,383 | |
| Extensions, discoveries and improved recovery, less related costs | 100,402 | | | 157,904 | | | — | | | 258,306 | |
| Previously estimated development costs incurred during the year | (85,568) | | | (41,910) | | | — | | | (127,478) | |
| Revisions of previous quantity estimates | 428,004 | | | (342,515) | | | — | | | 85,489 | |
| Accretion of discount | 132,697 | | | 4,206 | | | — | | | 136,903 | |
| Purchases of reserves in place | — | | | — | | | 143,563 | | | 143,563 | |
| | | | | | | |
| Net change in income taxes | 73,369 | | | (22,218) | | | — | | | 51,151 | |
| Changes in future development costs | (146,134) | | | (135,125) | | | — | | | (281,259) | |
| Net (decrease) increase | (237,473) | | | 10,216 | | | 143,563 | | | (83,694) | |
| Present Value as of December 31, 2024 | $ | 1,089,501 | | | $ | 52,279 | | | $ | 143,563 | | | $ | 1,285,343 | |
Item 9. Changes in and Disagreements with Accountants on Accounting and Financial Disclosure
None.
Item 9A. Controls and Procedures
Disclosure Controls and Procedures
We have established disclosure controls and procedures (as defined in Rules 13a-15(e) and 15d-15(e) under the Securities Exchange Act of 1934, or Exchange Act). Our management, with the participation of our Chief Executive Officer and Chief Financial Officer, evaluated the effectiveness of the design and operation of our disclosure controls and procedures as of the end of the period covered by this report, as required by Rule 13a-15(b) of the Exchange Act. Based on their evaluation, our Chief Executive Officer and Chief Financial Officer have concluded that Gran Tierra’s disclosure controls and procedures were effective as of December 31, 2024, to provide reasonable assurance that the information required to be disclosed by Gran Tierra in the reports that it files or submits under the Exchange Act is recorded, processed, summarized and reported within the time periods specified in the SEC rules and forms and that such information is accumulated and communicated to management, including our Chief Executive Officer and Chief Financial Officer, as appropriate, to allow timely decisions regarding required disclosure.
Management’s Annual Report on Internal Control Over Financial Reporting
Our management is responsible for establishing and maintaining adequate internal control over financial reporting for Gran Tierra, as such term is defined in Rules 13a-15(f) and 15d-15(f) under the Exchange Act. Our management, with the participation of our Chief Executive Officer and Chief Financial Officer, conducted an evaluation of the effectiveness of our internal control over financial reporting as of December 31, 2024, based on the framework in Internal Control — Integrated Framework issued by the Committee of Sponsoring Organizations of the Treadway Commission in 2013 (the “2013 COSO Framework”). Based on this evaluation under the 2013 COSO Framework, management concluded that our internal control over financial reporting was effective as of December 31, 2024. The effectiveness of our internal control over financial reporting as of December 31, 2024, has been audited by KPMG LLP, an independent registered public accounting firm, which also audited our financial statements included in this Annual Report on Form 10-K as stated in their report which appears herein.
On October 31, 2024, the Company completed the acquisition of i3 Energy Plc (“i3 Energy”), a publicly traded oil and gas company that was listed on the TSX venture exchange. i3 Energy’s operations have been included in the consolidated financial statements of Gran Tierra since October 31, 2024. However, Gran Tierra has not had sufficient time to appropriately assess the disclosure controls and procedures and internal controls over financial reporting previously used by i3 Energy and integrate them with those of Gran Tierra. As a result, the certifying officers have limited the scope of their design of disclosure controls and procedures and internal controls over financial reporting to exclude controls, policies and procedures of i3 Energy (as permitted by applicable securities laws in U.S.). Gran Tierra has a program in place to complete its assessment of the controls, policies and procedures of the acquired operations by October 31, 2025. In 2024, the assets previously held by i3 Energy, contributed $19.0 million (representing 3% ) of total Company’s oil, natural gas and NGL sales and as at December 31, 2024, $310.1 million of total assets were associated with acquired entity.
Changes in Internal Controls over Financial Reporting
There were no changes in our internal controls over financial reporting during the fourth quarter ended December 31, 2024, that have materially affected, or are reasonably likely to materially affect our internal controls over financial reporting.
Report of Independent Registered Public Accounting Firm
To the Shareholders and Board of Directors of Gran Tierra Energy Inc.:
Opinion on Internal Control Over Financial Reporting
We have audited Gran Tierra Energy Inc. and subsidiaries’ (the Company) internal control over financial reporting as of December 31, 2024, based on criteria established in Internal Control – Integrated Framework (2013) issued by the Committee of Sponsoring Organizations of the Treadway Commission. In our opinion, the Company maintained, in all material respects, effective internal control over financial reporting as of December 31, 2024, based on criteria established in Internal Control – Integrated Framework (2013) issued by the Committee of Sponsoring Organizations of the Treadway Commission.
We also have audited, in accordance with the standards of the Public Company Accounting Oversight Board (United States) (PCAOB), the consolidated balance sheets of the Company as of December 31, 2024 and 2023, the related consolidated statements of operations, shareholders’ equity, and cash flows for each of the years in the three-year period ended December 31, 2024, and the related notes (collectively, the consolidated financial statements), and our report dated February 24, 2025 expressed an unqualified opinion on those consolidated financial statements.
The Company acquired i3 Energy Plc during 2024, and management excluded from its assessment of the effectiveness of the Company’s internal control over financial reporting as of December 31, 2024, i3 Energy Plc’s internal control over financial reporting associated with total assets of $310.1 million and total oil, natural gas and NGL sales of $19.0 million included in the consolidated financial statements of the Company as of and for the year ended December 31, 2024. Our audit of internal control over financial reporting of the Company also excluded an evaluation of the internal control over financial reporting of i3 Energy Plc.
Basis for Opinion
The Company’s management is responsible for maintaining effective internal control over financial reporting and for its assessment of the effectiveness of internal control over financial reporting, included in the accompanying Management’s Annual Report on Internal Control over Financial Reporting. Our responsibility is to express an opinion on the Company’s internal control over financial reporting based on our audit. We are a public accounting firm registered with the PCAOB and are required to be independent with respect to the Company in accordance with the U.S. federal securities laws and the applicable rules and regulations of the Securities and Exchange Commission and the PCAOB.
We conducted our audit in accordance with the standards of the PCAOB. Those standards require that we plan and perform the audit to obtain reasonable assurance about whether effective internal control over financial reporting was maintained in all material respects. Our audit of internal control over financial reporting included obtaining an understanding of internal control over financial reporting, assessing the risk that a material weakness exists, and testing and evaluating the design and operating effectiveness of internal control based on the assessed risk. Our audit also included performing such other procedures as we considered necessary in the circumstances. We believe that our audit provides a reasonable basis for our opinion.
Definition and Limitations of Internal Control Over Financial Reporting
A company’s internal control over financial reporting is a process designed to provide reasonable assurance regarding the reliability of financial reporting and the preparation of financial statements for external purposes in accordance with generally accepted accounting principles. A company’s internal control over financial reporting includes those policies and procedures that (1) pertain to the maintenance of records that, in reasonable detail, accurately and fairly reflect the transactions and dispositions of the assets of the company; (2) provide reasonable assurance that transactions are recorded as necessary to permit preparation of financial statements in accordance with generally accepted accounting principles, and that receipts and expenditures of the company are being made only in accordance with authorizations of management and directors of the company; and (3) provide reasonable assurance regarding prevention or timely detection of unauthorized acquisition, use, or disposition of the company’s assets that could have a material effect on the financial statements.
Because of its inherent limitations, internal control over financial reporting may not prevent or detect misstatements. Also, projections of any evaluation of effectiveness to future periods are subject to the risk that controls may become inadequate because of changes in conditions, or that the degree of compliance with the policies or procedures may deteriorate.
/s/ KPMG LLP
Chartered Professional Accountants
Calgary, Canada
February 24, 2025
Item 9B. Other Information
2025 Annual Meeting
The Board of Directors of Gran Tierra Energy Inc. has established May 2, 2025 as the date of the Company’s 2025 Annual Meeting of Stockholders (the “2025 Annual Meeting”) and March 6, 2025 as the record date for determining stockholders entitled to notice of, and to vote at, the 2025 Annual Meeting. The time and location of the 2025 Annual Meeting will be as set forth in the Company’s proxy materials for the 2025 Annual Meeting.
Trading Arrangements
During the three months ended December 31, 2024, no director or Section 16 officer adopted or terminated any Rule 10b5-1 trading arrangements or non-Rule 10b5-1 trading arrangements (in each case, as defined in Item 408(a) of Regulation S-K).
Item 9C. Disclosure Regarding Foreign Jurisdictions that Prevent Inspections
Not applicable
PART III
Item 10. Directors, Executive Officers and Corporate Governance
The information required regarding our directors is incorporated herein by reference from the information contained in the section entitled “Proposal 1 - Election of Directors” in our definitive Proxy Statement for the 2025 Annual Meeting of Stockholders (our “Proxy Statement”), a copy of which will be filed with the SEC within 120 days after December 31, 2024. For information with respect to our executive officers, see “Information About Our Executive Officers” at the end of Part I of this report, following Item 4 “Mine Safety Disclosures”.
The information required regarding Section 16(a) beneficial ownership reporting compliance, if applicable, is incorporated by reference from the information contained in the section entitled “Delinquent Section 16(a) Reports” in our Proxy Statement.
The information required with respect to procedures by which security holders may recommend nominees to our Board of Directors, the composition of our Audit Committee, and whether we have an “audit committee financial expert”, is incorporated by reference from the information contained in the section entitled “Proposal 1 - Election of Directors” in our Proxy Statement.
Adoption of Code of Ethics
Gran Tierra has adopted a Code of Business Conduct and Ethics (the “Code”) applicable to all of its Board members, employees and executive officers, including its President and Chief Executive Officer, Director (Principal Executive Officer), Chief Financial Officer and Executive Vice President, Finance (Principal Financial and Accounting Officer) and Chief Operating Officer (Principal Operating Officer). Gran Tierra has made the Code available on its website at www.grantierra.com.
Gran Tierra intends to satisfy the public disclosure requirements regarding (1) any amendments to the Code, or (2) any waivers under the Code given to Gran Tierra’s Principal Executive Officer, Principal Financial and Accounting Officer and Principal Operating Officer by posting such information on its website at http://www.grantierra.com/governance.html within four business days of such amendment or waiver. Information on our website is not incorporated into this Annual Report or otherwise made part of this Annual Report.
Item 11. Executive Compensation
The information required regarding the compensation of our directors and executive officers is incorporated herein by reference from the information contained in the section entitled “Executive Compensation and Related Information” in our Proxy Statement, including under the subheadings “Director Compensation,” “Compensation Committee Report,” and “Compensation Committee Interlocks and Insider Participation”.
Item 12. Security Ownership of Certain Beneficial Owners and Management and Related Stockholder Matters
Security Ownership of Certain Beneficial Owners and Management
The information required regarding security ownership of our 10% or greater stockholders and of our directors and management is incorporated herein by reference from the information contained in the section entitled “Security Ownership of Certain Beneficial Owners and Management” in our Proxy Statement.
The following table provides certain information with respect to securities authorized for issuance under Gran Tierra’s equity compensation plans in effect as of the end of December 31, 2024:
| | | | | | | | | | | | | | | | | | |
| Plan category | | (a) Number of securities to be issued upon exercise of outstanding options (1) | | (b) Weighted average exercise price of outstanding options | | (c) Number of securities remaining available for future issuance under equity compensation plans, excluding securities reflected in column (a) (2) |
| Equity compensation plans approved by security holders | | — | | | — | | | 3,189,403 | |
| Equity compensation plans not approved by security holders | | — | | | — | | | — | |
| | — | | | — | | | 3,189.403 | |
(1) This does not include shares reserved to be issued pursuant to stock options granted pursuant to the 2007 Equity Incentive Plan (“the Plan”), which is an amendment and restatement of our 2005 Equity Incentive Plan as during the year ended December 31, 2024 management's intent to cash settle is reflected in the financial statement classification of these awards as financial liabilities. This also does not include any shares reserved to be issued relating to performance stock units (“PSUs”), and deferred share units (“DSUs”), which may be settled in cash or in shares of our Common Stock at our election, and for which management's intent to cash settle is reflected in the financial statement classification of these awards as financial liabilities.
(2) In accordance with Item 201(d) of Regulation S-K, the figure in this column represents the total number of shares of our Common Stock remaining available for issuance under the Plan as of December 31, 2024, minus the awards reported in column (a), above. Note, pursuant to the terms of the Plan, the pool of shares available for grant thereunder is not actually reduced until an award is settled in shares of our Common Stock (as opposed to reducing the pool at the time of grant). At December 31, 2024, 7,835,800 shares were issued and outstanding relating to Options, PSUs and DSUs and would represent a reduction to the securities remaining available for future issuance under the Plan if such awards were to be equity settled. Consistent with accounting treatment that reflects management's intent to cash settle, these amounts are not included in the above table as a reduction in the securities remaining available for future issuance. Pursuant to the provisions of the Plan, the number of securities remaining available for issuance is reduced by the aggregate balance of (i) stock options exercised and outstanding at a fungible factor of 1.0 shares and (ii) unit based awards at a fungible factor of 1.0 shares for each share of our Common Stock issued pursuant to any equity settled awards granted under the Plan. Accordingly, the number of shares available for future awards under the Plan may be different than the amount shown in this column.
The only equity compensation plan approved by our stockholders is our 2007 Equity Incentive Plan, which is an amendment and restatement of our 2005 Equity Incentive Plan.
Item 13. Certain Relationships and Related Transactions, and Director Independence
The information required regarding related transactions is incorporated herein by reference from the information contained in the section entitled “Certain Relationships and Related Transactions” and, with respect to director independence, the section entitled “Proposal 1 - Election of Directors”, in our Proxy Statement.
Item 14. Principal Accounting Fees and Services
The information required is incorporated herein by reference from the information contained in the sections entitled “Principal Accountant Fees and Services” and “Pre-Approval Policies and Procedures” in the proposal entitled “Ratification of Selection of Independent Auditors” in our Proxy Statement.
PART IV
Item 15. Exhibits, Financial Statement Schedules
(a) The following documents are filed as part of this Annual Report on Form 10-K:
(1) Financial Statements
| | | | | |
| Page |
| Report of Independent Registered Public Accounting Firm | |
| Consolidated Statements of Operations | |
| Consolidated Balance Sheets | |
| Consolidated Statements of Cash Flow | |
| Consolidated Statements of Shareholders’ Equity | |
| Notes to the Consolidated Financial Statements | |
| Supplementary Data (Unaudited) | |
(2) Financial Statement Schedules
None.
(3) Exhibits
| | | | | | | | | | | |
| Exhibit No. | Description | | Reference |
| 2.1 | | | Incorporated by reference to Exhibit 2.2 to the Current Report on Form 8-K filed with the SEC on August 20, 2024 (SEC File No. 001-34018). |
| | | |
| 3.1 |
| | Incorporated by reference to Exhibit 3.3 to the Current Report on Form 8-K, filed with the SEC on November 4, 2016 (SEC File No. 001-34018). |
| | | |
| 3.2 | | | Incorporated by reference to Exhibit 3.1 to the Current Report on Form 8-K, filed with the SEC on May 5, 2023 (SEC File No. 001-34018). |
| | | |
| 3.3 |
| | Incorporated by reference to Exhibit 3.4 to the Current Report on Form 8-K, filed with the SEC on November 4, 2016 (SEC File No. 001-34018). |
| | | |
| 3.4 | | | Incorporated by reference to Exhibit 3.1 to the Current Report on Form 8-K, filed with the SEC on August 4, 2021 (SEC File No. 001-34018). |
| | | |
| 4.1 | | | Incorporated by reference to Exhibit 4.1 to the Current Report on Form 8-K, filed with the SEC on July 14, 2016 (SEC File No. 001-34018). |
| | | |
| 4.2 | | | Incorporated by reference to Exhibit 4.1 to the Current Report on Form 8-K filed with the SEC on February 16, 2018 (SEC File No. 001-34018). |
| | | |
| 4.3 | | | Incorporated by reference to Exhibit 10.3 to the Quarterly Report on Form 10-Q, filed with the SEC on August 8, 2019 (SEC File No. 001-34018). |
| | | |
| 4.4 | | | Incorporated by reference to Exhibit 4.2 (included as Exhibit A to Exhibit 4.1) to the Current Report on Form 8-K filed with the SEC on February 16, 2018 (SEC File No. 001-34018). |
| | | |
| | | | | | | | | | | |
| 4.5 | | | Incorporated by reference to Exhibit 4.1 to the Current Report on Form 8-K filed with the SEC on May 23, 2019 (SEC File No. 001-34018). |
| | | |
| 4.6 | | | Incorporated by reference to Exhibit 10.4 to the Quarterly Report on Form 10-Q, filed with the SEC on August 8, 2019 (SEC File No. 001-34018). |
| | | |
| 4.10 | | | Incorporated by reference to Exhibit 4.2 to the Current Report on Form 8-K filed with the SEC on May 23, 2019 (SEC File No. 001-34018). |
| | | |
| 4.11 | | | Incorporated by reference to Exhibit 4.1 to the Current Report on Form 8-K filed with the SEC on October 24, 2023 (SEC File No. 001-34018). |
| | | |
| 4.12 | | | Incorporated by reference to Exhibit 4.2 to the Current Report on Form 8-K filed with the SEC on October 24, 2023 (SEC File No. 001-34018). |
| | | |
| 4.13 | | | Incorporated by reference to Exhibit 4.11 to the Annual Report on Form 10-K, filed with the SEC on February 27, 2020 (SEC File No. 001-34018). |
| | | |
| 10.1 | | | Incorporated by reference to Appendix of the Definitive Proxy Statement filed with the SEC on March 25, 2022 (SEC File No. 001-34018). |
| | | |
| 10.2 | | | Incorporated by reference to Exhibit 10.1 to the Quarterly Report on Form 10-Q filed with the SEC on August 7, 2013 (SEC File No. 001-34018). |
| | | |
| 10.3 | | | Incorporated by reference to Exhibit 10.2 to the Quarterly Report on Form 10-Q filed with the SEC on August 7, 2013 (SEC File No. 001-34018). |
| | | |
| 10.4 | | | Incorporated by reference to Exhibit 3.5 to the Current Report on Form 8-K filed with the SEC on November 4, 2016 (SEC File No. 001-34018). |
| | | |
| 10.5 | | | Incorporated by reference to Exhibit 10.29 to the Annual Report on Form 10-K, filed with the SEC on February 29, 2016 (SEC File No. 001-34018). |
| | | |
| 10.6 | | | Incorporated by reference to Exhibit 10.30 to the Annual Report on Form 10-K, filed with the SEC on February 29, 2016 (SEC File No. 001-34018). |
| | | |
| 10.7 | | | Incorporated by reference to Exhibit 10.2 to the Quarterly Report on Form 10-Q, filed with the SEC on November 4, 2015 (SEC File No. 001-34018). |
| | | |
| 10.71 | | | Incorporated by reference to Exhibit 10.6 to the Quarterly Report on Form 10-Q, filed with the SEC on November 4, 2015 (SEC File No. 001-34018). |
| | | |
| 10.72 | | | Incorporated by reference to Exhibit 10.3 to the Quarterly Report on Form 10-Q, filed with the SEC on May 4, 2016 (SEC File No. 001-34018). |
| | | |
| 10.73 | | | Incorporated by reference to Exhibit 10.4 to the Quarterly Report on Form 10-Q, filed with the SEC on May 4, 2016 (SEC File No. 001-34018). |
| | | |
| | | | | | | | | | | |
| 10.74 | | | Incorporated by reference to Exhibit 10.5 to the Quarterly Report on Form 10-Q, filed with the SEC on May 4, 2016 (SEC File No. 001-34018). |
| | | |
| 10.75 | | | Incorporated by reference to Exhibit 10.1 to the Current Report on Form 8-K, filed with SEC on August 23, 2022 (SEC File No. 001-34018). |
| | | |
| 10.76 | | | Incorporated by reference to Exhibit 10.1 to the Quarterly Report on Form 10-Q filed with the SEC on November 1, 2023 (SEC File No. 001-34018). |
| | | |
| 10.77 | | | Incorporated by reference to Exhibit 10.55 to the Quarterly Report on Form 10-Q, filed with the SEC on August 11, 2008 (SEC File No. 001-34018). |
| | | |
| 10.78 | | | Incorporated by reference to Exhibit 10.56 to the Quarterly Report on Form 10-Q, filed with the SEC on August 11, 2008 (SEC File No. 001-34018). |
| | | |
| 10.79 | | | Incorporated by reference to Exhibit 10.3 to the Quarterly Report on Form 10-Q/A, filed with the SEC on November 19, 2008 (SEC File No. 001-34018). |
| | | |
| 10.80 | | | Incorporated by reference to Exhibit 10.1 to the Current Report on Form 8-K, filed with the SEC on January 7, 2009 (SEC File No. 001-34018). |
| | | |
| 10.81 | | | Incorporated by reference to Exhibit 10.1 to the Quarterly Report on Form 10-Q filed with the SEC on May 7, 2012 (SEC File No. 001-34018). |
| | | |
| 10.82 | | | Incorporated by reference to Exhibit 10.2 to the Quarterly Report on Form 10-Q filed with the SEC on May 7, 2012 (SEC File No. 001-34018). |
| | | |
| 10.83 | | | Incorporated by reference to Exhibit 10.9 to the Quarterly Report on Form 10-Q filed with the SEC on May 7, 2012 (SEC File No. 001-34018). |
| | | |
| 10.84 | | | Incorporated by reference to Exhibit 10.1 to the Current Report on Form 8-K filed with the SEC on August 20, 2024 (SEC File No. 001-34018). |
| | | |
| 10.85 | | | Incorporated by reference to Exhibit 10.2 to the Quarterly Report on Form 10-Q filed with the SEC on November 4, 2024 (SEC File No. 001-34018). |
| | | |
| 10.86 | | | Incorporated by reference to Exhibit 10.3 to the Quarterly Report on Form 10-Q filed with the SEC on November 4, 2024 (SEC File No. 001-34018). |
| | | |
| 19.1 | | | Filed herewith. |
| | | |
| | | | | | | | | | | |
| 21.1 | | | Filed herewith. |
| | | |
| 23.1 | | | Filed herewith. |
| | | |
| 23.2 | | | Filed herewith. |
| | | |
| 24.1 | Power of Attorney. | | See signature page. |
| | | |
| 31.1 | | | Filed herewith. |
| | | |
| 31.2 | | | Filed herewith. |
| | | |
| 32.1 | | | Furnished herewith. |
| | | |
| 99.1 | | | Filed herewith. |
| | | |
101.INS Inline XBRL Instance Document - the instance document does not appear in the Interactive Data File because its XBRL tags are embedded within the Inline XBRL document
101.SCH Inline XBRL Taxonomy Extension Schema Document
101.CAL Inline XBRL Taxonomy Extension Calculation Linkbase Document
101.DEF Inline XBRL Taxonomy Extension Definition Linkbase Document
101.LAB Inline XBRL Taxonomy Extension Label Linkbase Document
101.PRE Inline XBRL Taxonomy Extension Presentation Linkbase Document
104. Cover Page Interactive Data File - the cover page XBRL tags are embedded within the Inline XBRL document
* Management contract or compensatory plan or arrangement.
† Certain confidential information contained in this agreement has been omitted because it is both (i) not material and (ii) the type of information that the Company treats as private or confidential.
Item 16. Form 10-K Summary
None.
SIGNATURES
Pursuant to the requirements of Section 13 or 15(d) of the Securities Exchange Act of 1934, the registrant has duly caused this report to be signed on its behalf by the undersigned, thereunto duly authorized.
GRAN TIERRA ENERGY INC.
| | | | | |
| Date: February 24, 2025 | /s/ Gary S. Guidry |
| | By: Gary S. Guidry |
| | President and Chief Executive Officer, Director |
| | (Principal Executive Officer) |
| |
| Date: February 24, 2025 | /s/ Ryan Ellson |
| | By: Ryan Ellson |
| Chief Financial Officer and Executive Vice President, Finance |
| | (Principal Financial and Accounting Officer) |
POWER OF ATTORNEY
KNOW ALL PERSONS BY THESE PRESENTS, that each person whose signature appears below constitutes and appoints Gary S. Guidry and Ryan Ellson, and each of them, as his true and lawful attorneys-in-fact and agents, with full power of substitution and re-substitution, for him and in his name, place and stead, in any and all capacities, to sign any and all amendments (including post-effective amendments) to this Annual Report on Form 10-K, and to file the same, with all exhibits thereto, and other documents in connection therewith, with the Securities and Exchange Commission, granting unto said attorneys-in-fact and agents, and each of them, full power and authority to do and perform each and every act and thing requisite and necessary to be done in connection therewith, as fully to all intents and purposes as he might or could do in person, hereby ratifying and confirming all that said attorneys-in-fact and agents, or any of them, or their or his substitute or substitutes, may lawfully do or cause to be done by virtue hereof.
Pursuant to the requirements of the Securities Exchange Act of 1934, this report has been signed below by the following persons on behalf of the registrant and in the capacities and on the dates indicated:
| | | | | | | | | | | | | | |
| Name | | Title | | Date |
| | | | |
| /s/ Gary S. Guidry | | President and Chief Executive Officer, Director | | February 24, 2025 |
| Gary S. Guidry | | (Principal Executive Officer) | | |
| | | | |
| /s/ Ryan Ellson | | Chief Financial Officer and Executive Vice President, Finance | | February 24, 2025 |
| Ryan Ellson | | (Principal Financial and Accounting Officer) | | |
| | | | |
| /s/ Peter Dey | | Director | | February 24, 2025 |
| Peter Dey | | | | |
| | | | |
| /s/ Evan Hazell | | Director | | February 24, 2025 |
| Evan Hazell | | | | |
| | | | |
| /s/ Alison Redford | | Director | | February 24, 2025 |
| Alison Redford | | | | |
| | | | |
| /s/ Robert B. Hodgins | | Director | | February 24, 2025 |
| Robert B. Hodgins | | | | |
| | | | |
| /s/ Ronald Royal | | Director | | February 24, 2025 |
| Ronald Royal | | | | |
| | | | |
| /s/ Sondra Scott | | Director | | February 24, 2025 |
| Sondra Scott | | | | |
| | | | |
| /s/ David P. Smith | | Director | | February 24, 2025 |
| David P. Smith | | | | |
| | | | |
| /s/ Brooke Wade | | Director | | February 24, 2025 |
| Brooke Wade | | | | |