UNITED STATES
SECURITIES AND EXCHANGE COMMISSION
WASHINGTON, D.C. 20549
FORM 10-K
ý Annual Report Pursuant to Section 13 or 15(d) of the Securities Exchange Act of 1934
For the fiscal year ended December 31, 2017.
o Transition Report Pursuant to Section 13 or 15(d) of the Securities Exchange Act of 1934
For the Transition Period From _____________________ to __________________.
Commission file number 001-32265 (American Campus Communities, Inc.)
Commission file number 333-181102-01 (American Campus Communities Operating Partnership, L.P.)
AMERICAN CAMPUS COMMUNITIES, INC.
AMERICAN CAMPUS COMMUNITIES OPERATING PARTNERSHIP, L.P.
(Exact name of registrant as specified in its charter)
|
| | |
Maryland (American Campus Communities, Inc.) Maryland (American Campus Communities Operating Partnership, L.P.) | | 76-0753089 (American Campus Communities, Inc.) 56-2473181 (American Campus Communities Operating Partnership, L.P.) |
(State or Other Jurisdiction of Incorporation or Organization) | | (IRS Employer Identification No.) |
12700 Hill Country Blvd., Suite T-200 Austin, TX (Address of Principal Executive Offices) | | 78738 (Zip Code) |
(512) 732-1000
(Registrant’s telephone number, including area code)
Securities registered pursuant to Section 12(b) of the Act:
|
| | |
| (Title of Each Class) | | (Name of Each Exchange on Which Registered) |
| | | |
| Common Stock, $.01 par value | | New York Stock Exchange |
Securities registered pursuant to Section 12(g) of the Act: None
Indicate by check mark if the registrant is a well-known seasoned issuer, as defined in Rule 405 of the Securities Act.
|
| | | |
| American Campus Communities, Inc. | Yes x | No o | |
| American Campus Communities Operating Partnership, L.P. | Yes o | No x | |
Indicate by check mark if the registrant is not required to file reports pursuant to Section 13 or Section 15(d) of the Act.
|
| | | |
| American Campus Communities, Inc. | Yes o | No x | |
| American Campus Communities Operating Partnership, L.P. | Yes o | No x | |
Indicate by check mark whether the registrant (1) has filed all reports required to be filed by Section 13 or 15 (d) of the Securities Exchange Act of 1934 during the preceding 12 months (or for such shorter period that the registrant was required to file such reports), and (2) has been subject to such filing requirements for the past 90 days.
|
| | | |
| American Campus Communities, Inc. | Yes x | No o | |
| American Campus Communities Operating Partnership, L.P. | Yes x | No o | |
Indicate by check mark whether the registrant has submitted electronically and posted on its corporate Web site, if any, every Interactive Data File required to be submitted and posted pursuant to Rule 405 of Regulation S-T (§232.405 of this chapter) during the preceding 12 months (or for such shorter period that the registrant was required to submit and post such files).
|
| | | |
| American Campus Communities, Inc. | Yes x | No o | |
| American Campus Communities Operating Partnership, L.P. | Yes x | No o | |
Indicate by check mark if disclosure of delinquent filers pursuant to Item 405 of Regulation S-K (§229.405 of this chapter) is not contained herein, and will not be contained, to the best of registrant’s knowledge, in definitive proxy or information statements incorporated by reference in Part III of this Form 10-K or any amendment to this Form 10-K.
|
| | | |
| American Campus Communities, Inc. | o | | |
| American Campus Communities Operating Partnership, L.P. | o | | |
Indicate by check mark whether the registrant is a large accelerated filer, an accelerated filer, a non-accelerated filer, a smaller reporting company, or an emerging growth company. See the definitions of “large accelerated filer”, “accelerated filer”, “smaller reporting company”, and “emerging growth company” in Rule 12b-2 of the Exchange Act.
American Campus Communities, Inc.
|
| | |
Large accelerated filer x | Accelerated Filer o | |
Non-accelerated filer o (Do not check if a smaller reporting company) | Smaller reporting company o | |
| | Emerging growth company o | |
If an emerging growth company, indicate by check mark if the registrant has elected not to use the extended transition period for complying with any new or revised financial accounting standards provided pursuant to Section 13(a) of the Exchange Act. o
American Campus Communities Operating Partnership, L.P. |
| | |
Large accelerated filer o | Accelerated Filer o | |
Non-accelerated filer x (Do not check if a smaller reporting company) | Smaller reporting company o | |
| | Emerging growth company o | |
If an emerging growth company, indicate by check mark if the registrant has elected not to use the extended transition period for complying with any new or revised financial accounting standards provided pursuant to Section 13(a) of the Exchange Act. o
Indicate by check mark whether the registrant is a shell company (as defined in Rule 12b-2 of the Act).
|
| | | |
| American Campus Communities, Inc. | Yes o | No x | |
| American Campus Communities Operating Partnership, L.P. | Yes o | No x | |
The aggregate market value of voting and non-voting common equity held by non-affiliates of the registrant was $5,450,514,562 based on the last sale price of the common equity on June 30, 2017 which is the last business day of the Company’s most recently completed second quarter.
There were 136,494,954 shares of the Company’s common stock with a par value of $0.01 per share outstanding as of the close of business on February 23, 2018.
DOCUMENTS INCORPORATED BY REFERENCE
Part III of this report incorporates information by reference from the definitive Proxy Statement for the 2018 Annual Meeting of Stockholders.
EXPLANATORY NOTE
This report combines the annual reports on Form 10-K for the year ended December 31, 2017 of American Campus Communities, Inc. and American Campus Communities Operating Partnership, L.P. Unless stated otherwise or the context otherwise requires, references to “ACC” mean American Campus Communities, Inc. a Maryland corporation that has elected to be treated as a real estate investment trust (“REIT”) under the Internal Revenue Code, and references to “ACCOP” mean American Campus Communities Operating Partnership, L.P., a Maryland limited partnership. References to the “Company,” “we,” “us” or “our” mean collectively ACC, ACCOP and those entities/subsidiaries owned or controlled by ACC and/or ACCOP. References to the “Operating Partnership” mean collectively ACCOP and those entities/subsidiaries owned or controlled by ACCOP. The following chart illustrates the Company’s and the Operating Partnership’s corporate structure:
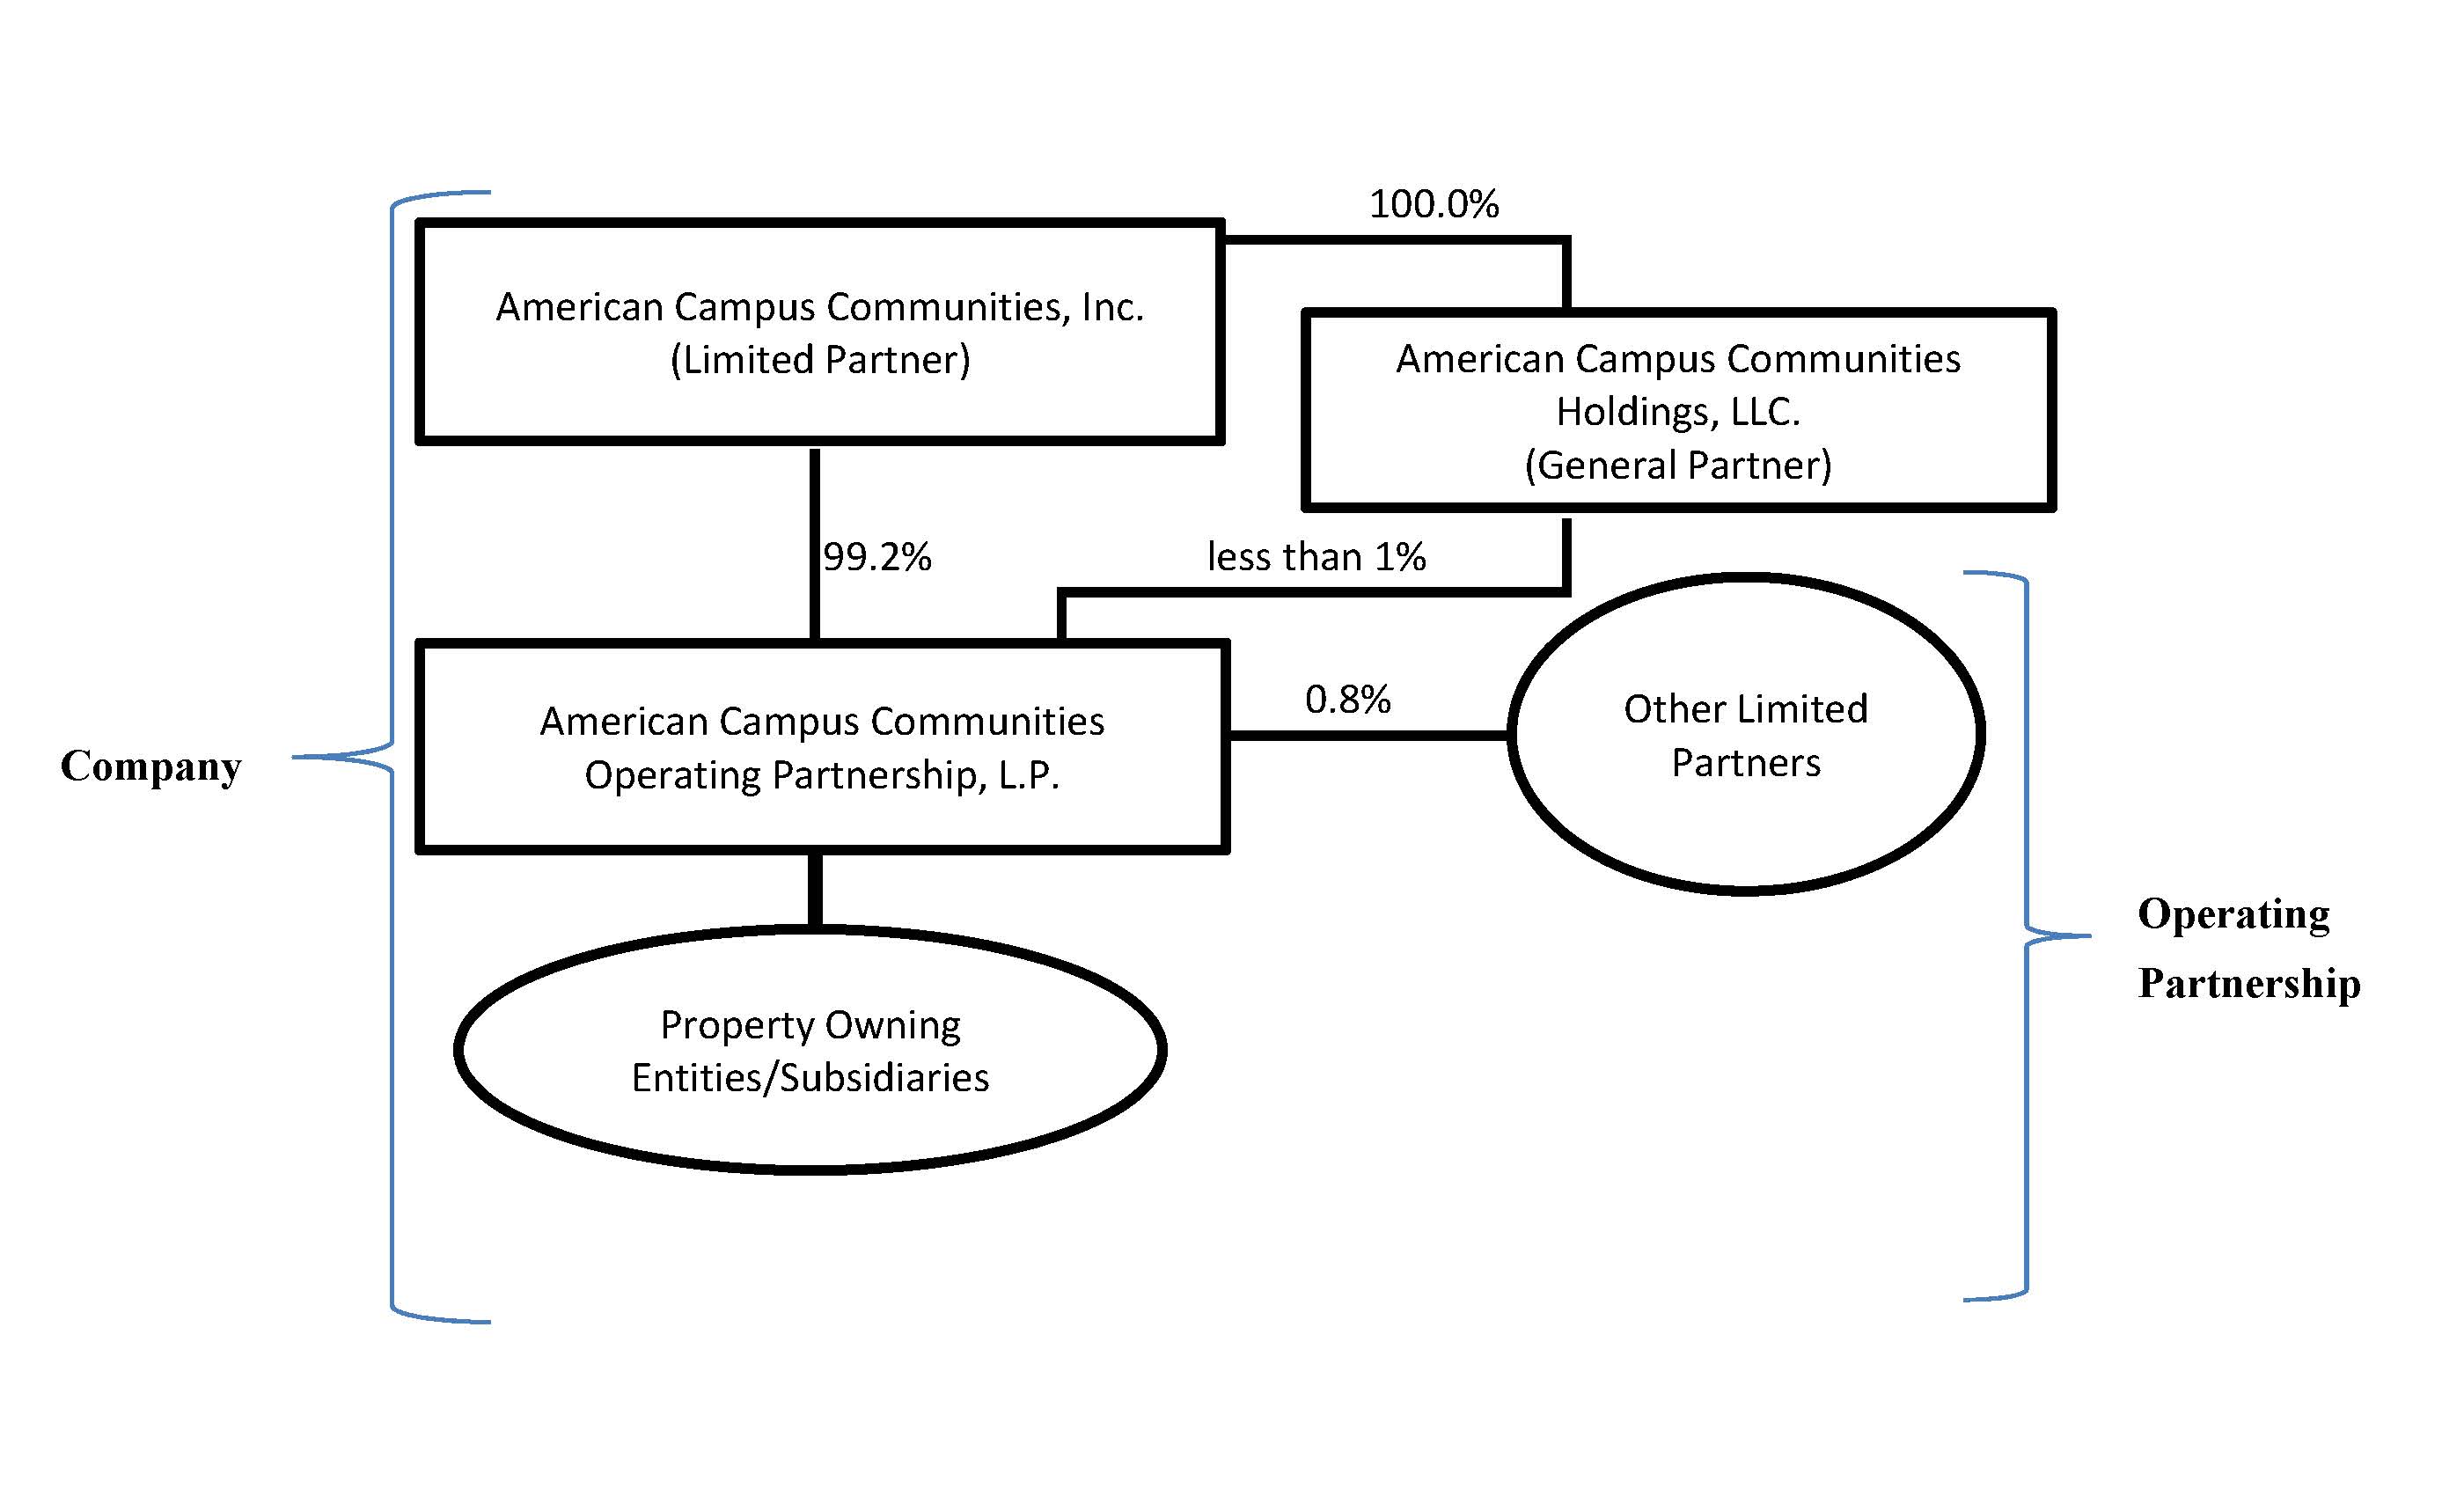
The general partner of ACCOP is American Campus Communities Holdings, LLC (“ACC Holdings”), an entity that is wholly-owned by ACC. As of December 31, 2017, ACC Holdings held an ownership interest in ACCOP of less than 1%. The limited partners of ACCOP are ACC and other limited partners consisting of current and former members of management and nonaffiliated third parties. As of December 31, 2017, ACC owned an approximate 99.2% limited partnership interest in ACCOP. As the sole member of the general partner of ACCOP, ACC has exclusive control of ACCOP’s day-to-day management. Management operates the Company and the Operating Partnership as one business. The management of ACC consists of the same members as the management of ACCOP. The Company is structured as an umbrella partnership REIT (“UPREIT”) and ACC contributes all net proceeds from its various equity offerings to the Operating Partnership. In return for those contributions, ACC receives a number of units of ACCOP (“OP Units,” see definition below) equal to the number of common shares it has issued in the equity offering. Contributions of properties to the Company can be structured as tax-deferred transactions through the issuance of OP Units in ACCOP. Based on the terms of ACCOP’s partnership agreement, OP Units can be exchanged for ACC’s common shares on a one-for-one basis. The Company maintains a one-for-one relationship between the OP Units of ACCOP issued to ACC and ACC Holdings and the common shares issued to the public. The Company believes that combining the reports on Form 10-K of the Company and the Operating Partnership into this single report provides the following benefits:
| |
| • | enhances investors’ understanding of the Company and the Operating Partnership by enabling investors to view the business as a whole in the same manner as management views and operates the business; |
| |
| • | eliminates duplicative disclosure and provides a more streamlined and readable presentation since a substantial portion of the disclosure applies to both the Company and the Operating Partnership; and |
| |
| • | creates time and cost efficiencies through the preparation of one combined report instead of two separate reports. |
ACC consolidates ACCOP for financial reporting purposes, and ACC essentially has no assets or liabilities other than its investment in ACCOP. Therefore, the assets and liabilities of the Company and the Operating Partnership are the same on their respective financial statements. However, the Company believes it is important to understand the few differences between the Company and the Operating Partnership in the context of how the entities operate as a consolidated company. All of the Company’s property ownership, development and related business operations are conducted through the Operating Partnership. ACC also issues public equity from time to time and guarantees certain debt of ACCOP. ACC does not have any indebtedness, as all debt is incurred by the Operating Partnership. The Operating Partnership holds substantially all of the assets of the Company, including the Company’s ownership interests in its joint ventures. The Operating Partnership conducts the operations of the business and is structured as a partnership with no publicly traded equity. Except for the net proceeds from ACC’s equity offerings, which are contributed to the capital of ACCOP in exchange for OP Units on a one-for-one common share per OP Unit basis, the Operating Partnership generates all remaining capital required by the Company’s business. These sources include, but are not limited to, the Operating Partnership’s working capital, net cash provided by operating activities, borrowings under its credit facility, the issuance of unsecured notes, and proceeds received from the disposition of certain properties. Noncontrolling interests, stockholders’ equity, and partners’ capital are the main areas of difference between the consolidated financial statements of the Company and those of the Operating Partnership. The noncontrolling interests in the Operating Partnership’s financial statements consist of the interests of unaffiliated partners in various consolidated joint ventures. The noncontrolling interests in the Company’s financial statements include the same noncontrolling interests at the Operating Partnership level and OP Unit holders of ACCOP. The differences between stockholders’ equity and partners’ capital result from differences in the type of equity issued at the Company and Operating Partnership levels.
To help investors understand the significant differences between the Company and the Operating Partnership, this report provides separate consolidated financial statements for the Company and the Operating Partnership. A single set of consolidated notes to such financial statements is presented that includes separate discussions for the Company and the Operating Partnership when applicable (for example, noncontrolling interests, stockholders’ equity or partners’ capital, earnings per share or unit, etc.). A combined Management’s Discussion and Analysis of Financial Condition and Results of Operations section is also included that presents discrete information related to each entity, as applicable. This report also includes separate Part II, Item 9A Controls and Procedures sections and separate Exhibits 31 and 32 certifications for each of the Company and the Operating Partnership in order to establish that the requisite certifications have been made and that the Company and the Operating Partnership are compliant with Rule 13a-15 or Rule 15d-15 of the Securities Exchange Act of 1934 and 18 U.S.C. §1350.
In order to highlight the differences between the Company and the Operating Partnership, the separate sections in this report for the Company and the Operating Partnership specifically refer to the Company and the Operating Partnership. In the sections that combine disclosure of the Company and the Operating Partnership, this report refers to actions or holdings as being actions or holdings of the Company. Although the Operating Partnership is generally the entity that directly or indirectly enters into contracts and joint ventures and holds assets and debt, reference to the Company is appropriate because the Company operates its business through the Operating Partnership. The separate discussions of the Company and the Operating Partnership in this report should be read in conjunction with each other to understand the results of the Company on a consolidated basis and how management operates the Company.
FORM 10-K
FOR THE YEAR ENDED DECEMBER 31, 2017
TABLE OF CONTENTS
|
| | |
| | | PAGE NO. |
PART I. | | |
| Item 1. | Business | |
| Item 1A. | Risk Factors | |
| Item 1B. | Unresolved Staff Comments | |
| Item 2. | Properties | |
| Item 3. | Legal Proceedings | |
| Item 4. | Mine Safety Disclosures | |
| | | |
PART II. | | |
| Item 5. | Market for Registrant’s Common Equity and Related Stockholder Matters | |
| Item 6. | Selected Financial Data | |
| Item 7. | Management’s Discussion and Analysis of Financial Condition and Results of Operations | |
| Item 7A. | Quantitative and Qualitative Disclosures About Market Risk | |
| Item 8. | Financial Statements and Supplementary Data | |
| Item 9. | Changes in and Disagreements with Accountants on Accounting and Financial Disclosure | |
| Item 9A. | Controls and Procedures | |
| | | |
| PART III. | | |
| Item 10. | Directors, Executive Officers and Corporate Governance | |
| Item 11. | Executive Compensation | |
| Item 12. | Security Ownership of Certain Beneficial Owners and Management and Related Stockholder Matters | |
| Item 13. | Certain Relationships, Related Transactions and Director Independence | |
| Item 14. | Principal Accountant Fees and Services | |
| | | |
| PART IV. | | |
| Item 15. | Exhibits and Financial Statement Schedules | |
| | | |
| SIGNATURES | | |
PART I
Item 1. Business
Overview
American Campus Communities, Inc. (“ACC”) is a real estate investment trust (“REIT”) that commenced operations effective with the completion of an initial public offering (“IPO”) on August 17, 2004. Through ACC’s controlling interest in American Campus Communities Operating Partnership, L.P. (“ACCOP”), ACC is one of the largest owners, managers and developers of high quality student housing properties in the United States in terms of beds owned and under management. ACC is a fully integrated, self-managed and self-administered equity REIT with expertise in the acquisition, design, financing, development, construction management, leasing and management of student housing properties. ACC’s common stock is publicly traded on the New York Stock Exchange (“NYSE”) under the ticker symbol “ACC.”
The general partner of ACCOP is American Campus Communities Holdings, LLC (“ACC Holdings”), an entity that is wholly-owned by ACC. As of December 31, 2017, ACC Holdings held an ownership interest in ACCOP of less than 1%. The limited partners of ACCOP are ACC and other limited partners consisting of current and former members of management and nonaffiliated third parties. As of December 31, 2017, ACC owned an approximate 99.2% limited partnership interest in ACCOP. As the sole member of the general partner of ACCOP, ACC has exclusive control of ACCOP’s day-to-day management. Management operates ACC and ACCOP as one business. The management of ACC consists of the same members as the management of ACCOP. ACC consolidates ACCOP for financial reporting purposes, and ACC does not have significant assets other than its investment in ACCOP. Therefore, the assets and liabilities of ACC and ACCOP are the same on their respective financial statements. References to the “Company,” “we,” “us” or “our” mean collectively ACC, ACCOP and those entities/subsidiaries owned or controlled by ACC and/or ACCOP. References to the “Operating Partnership” mean collectively ACCOP and those entities/subsidiaries owned or controlled by ACCOP.
As of December 31, 2017, our total owned and third-party managed portfolio included 206 properties with approximately 134,100 beds.
Business Objectives, Investment Strategies, and Operating Segments
Business Objectives
Our primary business objectives are to create long-term stockholder value by deploying capital to develop, redevelop, acquire and operate student housing communities, and to sell communities when they no longer meet our long-term investment strategy and when market conditions are favorable. We believe we can achieve these objectives by continuing to implement our investment strategies and successfully manage our operating segments, which are described in more detail below.
Investment Strategies
We seek to own high quality, well designed and well located student housing properties. We seek to acquire or develop properties in markets that have stable or increasing student populations, are in submarkets with barriers to entry and provide opportunities for economic growth as a result of their product position and/or differentiated design and close proximity to campuses, or through our superior operational capabilities. We believe that our reputation and established relationships with universities give us an advantage in sourcing acquisitions and developments and obtaining municipal approvals and community support for our development projects.
Acquisitions and Joint Venture Investments: As discussed in more detail in Note 5 in the accompanying Notes to Consolidated Financial Statements contained in Item 8, in 2017 we executed an agreement to acquire a portfolio of seven student housing properties from affiliates of Core Spaces and DRW Real Estate Investments (the “Core Transaction”). The transaction included the purchase of 100% of the ownership interests in two operating properties, the purchase of partial ownership interests in two operating properties through a joint venture arrangement, and the purchase of partial ownership interests in three in-process development properties through a joint venture arrangement. In total, the Core Transaction properties contain 3,776 beds and the initial investment made at closing was $306.0 million. Including the initial investment, the Company expects to invest a total of $590.6 million through a phased purchase of 100% of the ownership interest in all seven properties.
Additionally in 2017, the Company acquired three wholly-owned properties containing 1,240 beds for approximately $222.9 million. Refer to Note 5 in the accompanying Notes to Consolidated Financial Statements contained in Item 8 for a more detailed discussion of our recent acquisition activity.
We believe our relationships with university systems and individual educational institutions, our knowledge of the student housing market and our prominence as the first publicly-traded REIT focused exclusively on student housing in the United States will afford us a competitive advantage in acquiring additional student housing properties.
Development: In August 2017, the final stages of construction were completed on three on-campus ACE properties and seven owned off-campus properties. These properties are summarized in the following table:
|
| | | | | | | | | | | | | | |
Project | | Location | | Primary University Served | | Project Type | | Beds | | Total Project Cost | | Opened for Occupancy |
| | | | | | | | | | | | | |
| Tooker House | | Tempe, AZ | | Arizona State University | | ACE | | 1,594 | | $ | 105,500 |
| | August 2017 |
| Sky View | | Flagstaff, AZ | | Northern Arizona University | | ACE | | 626 | | 58,200 |
| | August 2017 |
| University Square | | Prairie View, TX | | Prairie View A&M University | | ACE | | 466 | | 25,900 |
| | August 2017 |
| U Centre on Turner | | Columbia, MO | | University of Missouri | | Off-campus | | 718 | | 69,600 |
| | August 2017 |
| U Pointe on Speight | | Waco, TX | | Baylor University | | Off-campus | | 700 | | 51,800 |
| | August 2017 |
| 21Hundred @ Overton Park | | Lubbock, TX | | Texas Tech University | | Off-campus | | 1,204 | | 82,700 |
| | August 2017 |
| Suites at 3rd | | Champaign, IL | | University of Illinois | | Off-campus | | 251 | | 25,200 |
| | August 2017 |
| U Club Binghamton Phase II | | Binghamton, NY | | SUNY Binghamton University | | Off-campus | | 562 | | 56,900 |
| | August 2017 |
| Callaway House Apartments | | Norman, OK | | University of Oklahoma | | Off-campus | | 915 | | 90,700 |
| | August 2017 |
| U Centre on College | | Clemson, SC | | Clemson University | | Off-campus | | 418 | | 42,700 |
| | August 2017 |
| TOTAL – 2017 DELIVERIES | | 7,454 | | $ | 609,200 |
| | |
At December 31, 2017, we were in the process of constructing seven on-campus ACE properties, and six owned off-campus properties. These properties are summarized in the tables below:
Owned Development Projects Under Construction:
|
| | | | | | | | | | | | | | | | | | |
Project | | Location | | Primary University Served | | Project Type | | Beds | | Estimated Project Cost | | Total Costs Incurred | | Scheduled Completion |
| | | | | | | | | | | | | | | |
| Gladding Residence Center | | Richmond, VA | | Virginia Commonwealth University | | ACE | | 1,524 | | $ | 95,700 |
| | $ | 74,764 |
| | August 2018 |
| Irvington House | | Indianapolis, IN | | Butler University | | ACE | | 648 | | 38,900 |
| | 22,922 |
| | August 2018 |
| Greek Leadership Village | | Tempe, AZ | | Arizona State University | | ACE | | 957 | | 69,600 |
| | 31,461 |
| | August 2018 |
| David Blackwell Hall | | Berkeley, CA | | University of California, Berkeley | | ACE | | 781 | | 98,700 |
| | 60,234 |
| | August 2018 |
| NAU Honors College | | Flagstaff, AZ | | Northern Arizona University | | ACE | | 636 | | 43,400 |
| | 24,880 |
| | August 2018 |
| U Club Townhomes | | Oxford, MS | | University of Mississippi | | Off-campus | | 528 | | 44,300 |
| | 26,181 |
| | August 2018 |
| SUBTOTAL – 2018 DELIVERIES | | 5,074 | | $ | 390,600 |
| | $ | 240,442 |
| | |
| | | | | | | | | | | | | | | |
| 191 College | | Auburn, AL | | Auburn University | | Off-campus | | 495 | | 59,300 |
| | 15,874 |
| | July 2019 |
| University of Arizona Honors College | | Tucson, AZ | | University of Arizona | | ACE | | 1,056 | | 84,700 |
| | 13,348 |
| | August 2019 |
| Columbus Avenue Student Apts. | | Boston, MA | | Northeastern University | | ACE | | 825 | | 153,400 |
| | 42,096 |
| | August 2019 |
| SUBTOTAL – 2019 DELIVERIES | | 2,376 | | $ | 297,400 |
| | $ | 71,318 |
| | |
| | | | | | | | | | | | | | | |
| TOTAL – ALL PROJECTS | | 7,450 | | $ | 688,000 |
| | $ | 311,760 |
| | |
| | | | | | | | | | | | | | | |
Presale Development Projects Under Construction:
Under the terms of a presale transaction, the Company is obligated to purchase the property as long as certain construction completion deadlines and other closing conditions are met. The Company is responsible for leasing, management, and initial operations of the project while the third-party developer retains development risk during the construction period. In accordance with accounting guidance, the Company includes presale properties in its consolidated financial statements upon execution of the presale agreement with the developer.
|
| | | | | | | | | | | | | | | | | | |
Project | | Location | | Primary University Served | | Project Type | | Beds | | Purchase Price | | Amount Funded as of December 31, 2017 | | Scheduled Completion |
| | | | | | | | | | | | | | | |
| The Edge - Stadium Centre | | Tallahassee, FL | | Florida State University | | Off-campus | | 412 | | $ | 42,600 |
| | $ | 400 |
| | August 2018 |
Core Spaces / DRW Portfolio (1) | | | | | | | | | | | | | | |
| Hub Ann Arbor | | Ann Arbor, MI | | University of Michigan | | Off-campus | | | | | | | | September 2018 |
| Hub Flagstaff | | Flagstaff, AZ | | Northern Arizona University | | Off-campus | | | | | | | | September 2018 |
| Hub West Lafayette | | West Lafayette, IN | | Purdue University | | Off-campus | | | | | | | | September 2018 |
| | | | | | | | | 1,500 | | $ | 240,000 |
| | $ | 24,208 |
| | |
| TOTAL – 2018 DELIVERIES | | 1,912 | | $ | 282,600 |
| | $ | 24,608 |
| | |
| | | | | | | | | | | | | | | |
| |
(1) | We funded an initial investment of $24.2 million through a joint venture with Core Spaces/DRW Real Estate Investments in August 2017. Including the initial investment, we expect to invest a total of $240.0 million over a two year period. See Note 5 in the accompanying Notes to Consolidated Financial Statements contained in Item 8 for further discussion. |
Our experienced development staff intends to continue to identify and acquire land parcels in close proximity to colleges and universities that offer location advantages or that allow for the development of unique products that offer a competitive advantage. We expect to continue to benefit from opportunities derived from our extensive network with colleges and universities as well as our relationship with certain developers with whom we have previously developed student housing properties.
Operating Segments
We define business segments by their distinct customer base and service provided. We have identified four reportable segments: Owned Properties, On-Campus Participating Properties, Development Services and Property Management Services. For a detailed financial analysis of our segments’ results of operations and financial position, please refer to Note 17 in the accompanying Notes to Consolidated Financial Statements contained in Item 8.
Property Operations
Unique Leasing Characteristics: Student housing properties are typically leased by the bed on an individual lease liability basis, unlike multifamily housing where leasing is by the unit. Individual lease liability limits each resident’s liability to his or her own rent without liability for a roommate’s rent. A parent or guardian is generally required to execute each lease as a guarantor unless the resident provides adequate proof of income or financial aid. The number of lease contracts that we administer is therefore approximately equivalent to the number of beds occupied and not the number of units. Leases at our off-campus properties typically require 12 monthly rent payments, whereas leases for our residence hall properties typically correspond to the university’s academic year and require 10 monthly rent payments. (Please refer to the property table contained in Item 2 – Properties for a listing of the typical rent payment terms at our properties.) As an example, in the case of our typical off-campus leases, the commencement date coincides with the commencement of the respective university’s Fall academic term and the termination date is the last day of the subsequent summer school session. As such, we must re-lease each property in its entirety each year.
Management Philosophy: Our management philosophy is based upon meeting the following objectives:
| |
| • | Satisfying the specialized needs of residents by providing the highest levels of customer service; |
| |
| • | Developing and maintaining an academically oriented environment via a premier residence life/student development program; |
| |
| • | Maintaining each project’s physical plant in top condition; |
| |
| • | Maximizing revenue through the development and implementation of a strategic annual marketing plan and leasing administration program; and |
| |
| • | Maximizing cash flow through maximizing revenue coupled with prudent control of expenses. |
LAMS: We believe we have developed the industry’s only specialized, fully integrated leasing administration and marketing software program, which we call LAMS. We utilize LAMS to maximize our revenue and improve the efficiency and effectiveness of our marketing and lease administration process. Through LAMS, each of our properties’ ongoing marketing and leasing efforts are supervised at the corporate office on a real time basis. Among other things, LAMS provides:
| |
| • | a fully integrated prospect tracking and follow-up system; |
| |
| • | a built-in marketing effectiveness program to measure the success of our marketing efforts on a real time basis; |
| |
| • | a real-time monitor of lease closings and leasing terms; |
| |
| • | an automated lease generation system; |
| |
| • | the generation of future period rent rolls to aid in budgeting and forecasting; and |
| |
| • | a customized report writer. |
Owned Properties: Off-campus properties are generally located in close proximity to the school campus, generally with pedestrian, bicycle, or university shuttle access. Off-campus housing tends to offer more relaxed rules and regulations than on-campus housing, resulting in off-campus housing being generally more appealing to upper-classmen. We believe that the support of colleges and universities can be beneficial to the success of our owned properties. We actively seek to have these institutions recommend our facilities to their students or to provide us with mailing lists so that we may directly market to students and parents. In some cases, the institutions actually promote our off-campus facilities in their recruiting and admissions literature. In cases where the educational institutions do not provide mailing lists or recommendations for off-campus housing, most provide comprehensive lists of suitable properties to their students, and we continually work to ensure that our properties are on these lists in each of the markets that we serve.
Off-campus housing is subject to competition for tenants with on-campus housing owned by colleges and universities, and vice versa. Colleges and universities can generally avoid real estate taxes and borrow funds at lower interest rates than us (and other private sector operators), thereby decreasing their operating costs. Residence halls owned and operated by the primary colleges and universities in the markets of our off-campus properties may charge lower rental rates, but typically offer fewer amenities than we offer at our properties. Additionally, most universities are only able to house a small percentage of their overall enrollment, and are therefore highly dependent upon the off-campus market to provide housing for their students. High-quality, well run off-campus student housing can be a critical component to an institution’s ability to attract and retain students. Therefore, developing and maintaining good relationships with educational institutions can result in a privately owned off-campus facility becoming, in effect, an extension of the institution’s housing program, with the institution providing highly valued references and recommendations to students and parents.
This segment also competes with national and regional owner-operators of off-campus student housing in a number of markets as well as with smaller local owner-operators. Therefore, the performance of this segment could be affected by the construction of new on-campus or off-campus residences, increases or decreases in the general levels of rents for housing in competing communities, increases or decreases in the number of students enrolled at one or more of the colleges or universities in the market of a property, and other general economic conditions.
American Campus Equity (ACE): Included in our owned properties segment and branded and marketed to colleges and universities as the ACE program, this transaction structure provides us with what we believe is a lower-risk opportunity compared to other off-campus projects, as our ACE projects have premier on-campus locations with marketing and operational assistance from the university. The subject university substantially benefits by increasing its housing capacity with modern, well-amenitized student housing with no or minimal impacts to its own credit ratios, preserving the university’s credit capacity to fund academic and research facilities.
On-Campus Participating Properties: Our On-Campus Participating Properties segment includes five on-campus properties that are operated under long-term ground/facility leases with three university systems. Under our ground/facility leases, we receive an annual distribution representing 50% of these properties’ net cash flows, as defined in the ground/facility lease agreements. We also manage these properties under long-term management agreements and are paid management fees equal to a percentage of defined gross receipts. Refer to Note 8 in the accompanying Notes to Consolidated Financial Statements contained in Item 8 herein for a more detailed description of these properties.
Our on-campus participating properties are susceptible to some of the same risks as our owned properties, including: (i) seasonality in rents; (ii) annual re-leasing that is highly dependent on marketing and university admission policies; and (iii) competition for tenants from other on-campus housing operated by educational institutions or other off-campus properties.
Third-Party Services
Our third-party services consist of development services and management services and are typically provided to university and college clients. Many of our third-party management services are provided to clients for whom we also provide development services. While management evaluates the operational performance of our third-party services based on the distinct segments identified below, at times we also evaluate these segments on a combined basis.
Development Services: Our Development Services segment consists of development and construction management services that we provide through one of our taxable REIT subsidiaries (“TRSs”) for third-party owners. These services range from short-term consulting projects to long-term full-scale development and construction projects. We typically provide these services to colleges
and universities seeking to modernize their on-campus student housing properties. They look to us to bring our student housing experience and expertise to ensure they develop marketable, functional and financially sustainable facilities. Educational institutions usually seek to build housing that will enhance their recruitment and retention of students while facilitating their academic objectives. Most of these development service contracts are awarded via a competitive request for proposal (“RFP”) process that qualifies developers based on their overall capability to provide specialized student housing design, development, construction management, financial structuring and property management services. Our development services typically include pre-development, design and financial structuring services. Our pre-development services typically include feasibility studies for third-party owners and design services. Feasibility studies include an initial feasibility analysis, review of conceptual design and assistance with master planning. Some of the documents produced in this process include the conceptual design documents, preliminary development and operating budgets, cash flow projections and a preliminary market assessment. Our design services include coordination with the architect and other members of the design team, review of construction plans and assistance with project due diligence and project budgets.
Construction management services typically consist of hiring of project professionals and a general contractor, coordinating and supervising the construction, equipping and furnishing the property, site visits, and full coordination and administration of all activities necessary for project completion in accordance with plans and specifications and with verification of adequate insurance.
Our Development Services activities benefit our primary goal of owning and operating student housing properties in a number of ways. By providing these services to others, we are able to expand and refine our unit plan and community design, the operational efficiency of our material specifications and our ability to determine market acceptance of unit and community amenities. Our development and construction management personnel enable us to establish relationships with general contractors, architects and project professionals throughout the nation. Through these services, we gain experience and expertise in residential and commercial construction methodologies under various labor conditions, including right-to-work labor markets, markets subject to prevailing wage requirements and fully unionized environments. This segment is subject to competition from other specialized student housing development companies as well as from national real estate development companies.
Property Management Services: Our Property Management Services segment, conducted by one of our TRSs, includes revenues generated from third-party management contracts in which we are typically responsible for all aspects of operations, including marketing, leasing administration, facilities maintenance, business administration, accounts payable, accounts receivable, financial reporting, capital projects and residence life student development. We provide these services pursuant to management agreements that have initial terms that range from one to five years.
There are several housing options that compete with our third-party managed properties including, but not limited to, multifamily housing, for-rent single family dwellings, other off-campus specialized student housing and the aforementioned on-campus participating properties. We also compete with other regional and national providers of third-party management services.
Americans with Disabilities Act and Federal Fair Housing Act
Many laws and governmental regulations are applicable to our properties and changes in the laws and regulations, or their interpretation by agencies and the courts, occur frequently. Our properties must comply with Title III of the Americans with Disabilities Act, or ADA, to the extent that such properties are “public accommodations” as defined by the ADA. The ADA may require removal of structural barriers to access by persons with disabilities in certain public areas of our properties where such removal is readily achievable. We believe that the existing properties are in substantial compliance with the ADA and that we will not be required to make substantial capital expenditures to address the requirements of the ADA. However, noncompliance with the ADA could result in imposition of fines or an award of damages to private litigants. The obligation to make readily achievable accommodations is an ongoing one, and we intend to continue to assess our properties and to make alterations as appropriate in this respect.
Under the federal and state fair housing laws, discrimination on the basis of certain protected classes is prohibited. Violation of these laws can result in significant damage awards to victims.
Environmental Matters
Under various laws and regulations relating to the protection of the environment, an owner of real estate may be held liable for the costs of removal or remediation of certain hazardous or toxic substances located on or in its property. These laws often impose liability without regard to whether the owner was responsible for, or even knew of, the presence of such substances. The presence of such substances may adversely affect the owner’s ability to rent or sell the property or use the property as collateral. Independent environmental consultants conducted environmental site assessments on all acquired or developed owned properties and on-campus participating properties in our existing portfolio. We are not aware of any environmental conditions that management
believes would have a material adverse effect on the Company. There is no assurance, however, that environmental site assessments or other investigations would reveal all environmental conditions or that environmental conditions not known to us may exist now or in the future which would result in liability to the Company for remediation or fines, either under existing laws and regulations or future changes to such requirements.
From time to time, the United States Environmental Protection Agency, or EPA, designates certain sites affected by hazardous substances as “Superfund” sites pursuant to CERCLA. Superfund sites can cover large areas, affecting many different parcels of land. Although CERCLA imposes joint and several liability for contamination on property owners and operators regardless of fault, the EPA may choose to pursue potentially responsible parties (“PRPs”) based on their actual contribution to the contamination. PRPs are liable for the costs of responding to the hazardous substances. Each of Villas on Apache (disposed of in April 2011), The Village on University (disposed of in December 2006) and University Village at San Bernardino (disposed of in January 2005) are located within federal Superfund sites. The EPA designated these areas as Superfund sites because groundwater underneath these areas is contaminated. We have not been named, and do not expect to be named, as a PRP with respect to these sites. However, there can be no assurance regarding potential future developments concerning such sites.
Insurance
Our primary lines of insurance coverage are property, liability and workers’ compensation. We believe that our insurance coverages are of the type and amount customarily obtained on real property assets. We intend to obtain similar coverage for properties we acquire in the future. However, there are certain types of losses, generally of a catastrophic nature, such as losses from floods or earthquakes, which may be subject to limitations in certain areas. When not otherwise contractually stipulated, we exercise our judgment in determining amounts, coverage limits and deductibles, in an effort to maintain appropriate levels of insurance on our investments. If we suffer a substantial loss, our insurance coverage may not be sufficient due to market conditions at the time or other unforeseen factors. Inflation, changes in building codes and ordinances, environmental considerations and other factors also might make it infeasible to use insurance proceeds to replace a property after it has been damaged or destroyed.
Employees
As of December 31, 2017, we had approximately 3,183 employees, consisting of:
| |
| • | approximately 1,805 on-site employees in our owned properties segment, including 696 Resident Assistants; |
| |
| • | approximately 107 on-site employees in our on-campus participating properties segment, including 46 Resident Assistants; |
| |
| • | approximately 1,086 employees in our property management services segment, including 908 on-site employees and 178 corporate office employees; |
| |
| • | approximately 58 corporate office employees in our development services segment; and |
| |
| • | approximately 127 executive, corporate administration and financial personnel. |
Our employees are not currently represented by a labor union.
Offices and Website
Our principal executive offices are located at 12700 Hill Country Boulevard, Suite T-200 Austin, TX 78738. Our telephone number at that location is (512) 732-1000.
We file our annual reports on Form 10-K, quarterly reports on Form 10-Q, current reports on Form 8-K and other reports required by Sections 13(a) and 15(d) of the Securities Exchange Act of 1934. You may read and copy any materials we file with the SEC at the SEC’s Public Reference Room at 100 F Street, NE, Washington, DC 20549. You may obtain information on the operation of the Public Reference Room by calling the SEC at 1-800-SEC-0330. The SEC maintains an internet site that contains reports, proxy and information statements and other information regarding issuers that file electronically with the SEC. The address of that site is www.sec.gov.
Our website is located at www.americancampus.com. We make available free of charge through our website our annual reports on Form 10-K, quarterly reports on Form 10-Q, current reports on Form 8-K and amendments to these reports filed or furnished pursuant to Sections 13(a) or 15(d) of the Securities Act of 1934, as amended, as soon as reasonably practicable after we electronically file such material with, or furnish it to, the SEC. Our website also contains copies of our Corporate Governance Guidelines and Code of Business Ethics as well as the charters of our Nominating and Corporate Governance, Audit, Compensation and Risk committees. The information on our website is not part of this filing.
Forward-looking Statements
This report contains forward-looking statements within the meaning of the federal securities laws. We caution investors that any forward-looking statements presented in this report, or which management may make orally or in writing from time to time, are based on management’s beliefs and assumptions made by, and information currently available to, management. When used, the words “anticipate,” “believe,” “expect,” “intend,” “may,” “might,” “plan,” “estimate,” “project,” “should,” “will,” “result” and similar expressions, do not relate solely to historical matters and are intended to identify forward-looking statements. Such statements are subject to risks, uncertainties and assumptions and may be affected by known and unknown risks, trends, uncertainties and factors that are beyond our control. Should one or more of these risks or uncertainties materialize, or should underlying assumptions prove incorrect, actual results may vary materially from those anticipated, estimated or projected. We caution you that forward-looking statements are not guarantees of future performance and will be impacted by actual events when they occur after we make such statements. We expressly disclaim any responsibility to update forward-looking statements, whether as a result of new information, future events or otherwise. Accordingly, investors should use caution in relying on past forward-looking statements, which are based on results and trends at the time they were made, to anticipate future results or trends.
Some of the risks and uncertainties that may cause our actual results, performance or achievements to differ materially from those expressed or implied by forward-looking statements include, among others, the following: general risks affecting the real estate industry; risks associated with changes in University admission or housing policies; risks associated with the availability and terms of financing and the use of debt to fund acquisitions and developments; failure to manage effectively our growth and expansion into new markets or to integrate acquisitions successfully; risks and uncertainties affecting property development and construction; risks associated with downturns in the national and local economies, volatility in capital and credit markets, increases in interest rates, and volatility in the securities markets; costs of compliance with the Americans with Disabilities Act and other similar laws; potential liability for uninsured losses and environmental contamination; risks associated with our Company’s potential failure to qualify as a REIT under the Internal Revenue Code of 1986 (the “Code”), as amended, and possible adverse changes in tax and environmental laws; and the other factors discussed in the “Risk Factors” contained in Item 1A of this report.
Item 1A. Risk Factors
The following risk factors may contain defined terms that are different from those used in other sections of this report. Unless otherwise indicated, when used in this section, the terms “we” and “us” refer to American Campus Communities, Inc. and its subsidiaries, including American Campus Communities Operating Partnership, L.P., our Operating Partnership, and the term “securities” refers to shares of common stock of American Campus Communities, Inc. and units of limited partnership interest in our Operating Partnership.
The factors described below represent our principal risks. Other factors may exist that we do not consider being significant based on information that is currently available or that we are not currently able to anticipate.
Risks Related to Our Properties, Our Business and the Real Estate Industry
Our results of operations are subject to risks inherent in the student housing industry, including a concentrated lease-up period and seasonal cash flows.
Leases at our off-campus properties typically require 12 monthly lease payments, whereas leases at our residence hall properties typically correspond to the university’s academic year and require 10 monthly rent payments. As a result, we may experience significantly reduced cash flows during the summer months at our residence hall properties. Furthermore, all of our properties must be entirely re-leased each year during a limited leasing season. We are therefore highly dependent on the effectiveness of our marketing and leasing efforts and personnel during this season, exposing us to significant leasing risk. In addition, we are subject to increased leasing risk on our properties under construction and future acquired properties based on our lack of experience leasing those properties and unfamiliarity with their leasing cycles. If we are unable to lease a substantial portion of our properties, or if the rental rates upon such leasing are significantly lower than expected rates, our cash flow from operations and our ability to make distributions to stockholders and service indebtedness could be adversely affected.
Additionally, prior to the commencement of each new lease period, generally during the first two weeks of August, we prepare the units for new incoming residents. During this period (referred to as “turn”), we incur significant expenses making our units ready for occupancy, which we recognize as incurred. We therefore experience seasonally decreased operating results and cash flows during the third quarter of each year as a result of expenses we incur during turn as well as lower revenue at our residence hall properties.
We rely on our relationships with universities, and changes in university personnel and/or policies could adversely affect our operating results.
In some cases, we rely on our relationships with colleges and universities for referrals of prospective student-tenants or for mailing lists of prospective student-tenants and their parents. Many of these colleges and universities own and operate their own competing on-campus facilities. Any failure to maintain good relationships with these colleges and universities could therefore have a material adverse effect on us. If colleges and universities refuse to make their lists of prospective student-tenants and their parents available to us or increase the costs of these lists, there could be a material adverse effect on us.
Changes in university admission policies could adversely affect us. For example, if a university reduces the number of student admissions or requires that a certain class of students, such as freshmen, live in a university-owned facility, the demand for our properties may be reduced and our occupancy rates may decline. While we may engage in marketing efforts to compensate for such change in admission policy, we may not be able to affect such marketing efforts prior to the commencement of the annual lease-up period or at all.
A decrease in enrollment at the Universities at which our properties are located could adversely affect our financial results.
University enrollment can be affected by a number of factors including, but not limited to, the current macroeconomic environment, students’ ability to afford tuition and/or the availability of student loans, competition for international students, the impact of visa requirements for international students, higher demand for distance education, and budget constraints that could limit a University’s ability to attract and retain students. If a University’s enrollment were to significantly decline as a result of these or other factors, our ability to achieve our leasing targets and thus our properties’ financial performance could be adversely affected.
We face significant competition from university-owned student housing and from other private student housing communities located within close proximity to universities.
On-campus student housing traditionally has certain inherent advantages over off-campus student housing because of, among other factors, closer physical proximity to the university campus and integration of on-campus facilities into the academic community. Colleges and universities can generally avoid real estate taxes, while we and other private sector owners are subject to full real estate tax rates. Also, colleges and universities may be able to borrow funds at lower interest rates than those available to us and other private sector owners. As a result, universities may be able to offer more convenient and/or less expensive student housing than we can, which may adversely affect our occupancy and rental rates.
We also compete with other national and regional owner-operators of off-campus student housing in a number of markets as well as with smaller local owner-operators. There are a number of purpose-built student housing properties that compete directly with us located near or in the same general vicinity of many of our student housing communities. Such competing student housing communities may be newer than our student housing communities, located closer to campus, charge less rent, possess more attractive amenities, or offer more services, shorter lease terms or more flexible leases. The construction of competing properties or decreases in the general levels of rents for housing at competing properties could adversely affect our rental income.
We have recently seen a number of large new entrants in the student housing business and there may be additional new entrants with substantial financial and marketing resources. The entry of these companies has increased and may continue to increase competition for students and for the acquisition, development and management of other student housing properties.
We may be unable to successfully complete and operate our properties or our third-party developed properties.
We intend to continue to develop and construct student housing. These activities include a number of risks, which may include the following:
| |
| • | we may be unable to obtain financing on favorable terms or at all; |
| |
| • | we may not complete development projects on schedule, within budgeted amounts or in conformity with building plans and specifications; |
| |
| • | we may encounter delays or refusals in obtaining all necessary zoning, land use, building, occupancy and other required governmental permits and authorizations; |
| |
| • | occupancy and rental rates at newly developed or renovated properties may fluctuate depending on a number of factors, including market and economic conditions, and may reduce or eliminate our return on investment; |
| |
| • | we may become liable for injuries and accidents occurring during the construction process and for environmental liabilities, including off-site disposal of construction materials; |
| |
| • | we may decide to abandon our development efforts if we determine that continuing the project would not be in our best interests; and |
| |
| • | we may encounter strikes, weather, government regulations and other conditions beyond our control. |
Our newly developed properties will be subject to risks associated with managing new properties, including lease-up and integration risks. In addition, new development activities, regardless of whether or not they are ultimately successful, typically will require a substantial portion of the time and attention of our development and management personnel. Newly developed properties may not perform as expected.
We anticipate that we will, from time to time, elect not to proceed with ongoing development projects. If we elect not to proceed with a development project, the development costs associated therewith will ordinarily be charged against income for the then-current period. Any such charge could have a material adverse effect on our results of operations in the period in which the charge is taken.
We may in the future develop properties nationally, internationally or in geographic regions other than those in which we currently operate. We do not possess the same level of familiarity with development and related regulations in these new markets, which could adversely affect our ability to develop such properties successfully or at all or to achieve expected performance. Future development opportunities may not be available to us on terms that meet our investment criteria or we may be unsuccessful in capitalizing on such opportunities.
We typically provide guarantees of timely completion of projects that we develop for third parties. In certain cases, our contingent liability under these guarantees may exceed our development fee from the project. Although we seek to mitigate this risk by, among other things, obtaining similar guarantees from the project contractor, we could sustain significant losses if development
of a project were to be delayed or stopped and we were unable to cover our guarantee exposure with the guarantee received from the project contractor.
We may be unable to successfully acquire properties on favorable terms.
Our future growth will be in part dependent upon our ability to successfully acquire new properties on favorable terms. With respect to recently acquired properties, and as we acquire additional properties, we will continue to be subject to risks associated with managing new properties, including lease-up and integration risks. Acquired properties may not perform as expected and may have characteristics or deficiencies unknown to us at the time of acquisition. Future acquisition opportunities may not be available to us on terms that meet our investment criteria or we may be unsuccessful in capitalizing on such opportunities.
Our ability to acquire properties on favorable terms and successfully operate them involves the following significant risks:
| |
| • | our potential inability to acquire a desired property may be caused by competition from other real estate investors; |
| |
| • | competition from other potential acquirers may significantly increase the purchase price and decrease expected yields; |
| |
| • | we may be unable to finance an acquisition on favorable terms or at all; |
| |
| • | we may have to incur significant unexpected capital expenditures to improve or renovate acquired properties; |
| |
| • | we may be unable to quickly and efficiently integrate new acquisitions, particularly acquisitions of portfolios of properties, into our existing operations; |
| |
| • | market conditions may result in higher than expected costs and vacancy rates and lower than expected rental rates; and |
| |
| • | we may acquire properties subject to liabilities but without any recourse, or with only limited recourse, to the sellers, or with liabilities that are unknown to us, such as liabilities for clean-up of undisclosed environmental contamination, claims by tenants, vendors or other persons dealing with the former owners of our properties and claims for indemnification by members, directors, officers and others indemnified by the former owners of our properties. |
Our failure to acquire or finance property acquisitions on favorable terms, or operate acquired properties to meet our financial expectations, could adversely affect us.
Difficulties of selling real estate could limit our flexibility.
We intend to evaluate the potential disposition of assets that may no longer meet our investment objectives. When we decide to sell an asset, we may encounter difficulty in finding buyers in a timely manner as real estate investments generally cannot be disposed of quickly, especially when market conditions are poor. This may limit our ability to vary our portfolio promptly in response to changes in economic or other conditions. In some cases, we may also determine that we will not recover the carrying value of the property upon disposition and might recognize an impairment charge. In addition, in order to maintain our status as a REIT, the Internal Revenue Code imposes restrictions on our ability to sell properties held fewer than two years, which may cause us to incur losses thereby reducing our cash flows and adversely impacting distributions to equity holders.
Our ownership of properties through ground leases may expose us to the loss of such properties upon the exercise by the lessors of purchase options or the breach or termination of the ground leases.
We have acquired an interest in certain of our properties by acquiring a leasehold interest in the property on which the building is located (or under development), and we may acquire additional properties in the future through the purchase of interests in ground leases. We could lose our interests in a property if the ground lease is terminated, if a purchase option is exercised by the lessor or if we breach the ground lease, which could adversely affect our financial condition or results of operations.
We face risks associated with land holdings.
We hold land for future development and may in the future acquire additional land holdings. The risks inherent in owning or purchasing and developing land increase as demand for student housing, or rental rates, decrease. As a result, we hold certain land and may in the future acquire additional land in our development pipeline at a cost we may not be able to recover fully or on which we cannot build and develop into a profitable student housing project. Also, real estate markets are highly uncertain and, as a result, the value of undeveloped land has fluctuated significantly and may continue to fluctuate as a result of changing market conditions. In addition, carrying costs can be significant and can result in losses or reduced margins in a poorly performing project. If there are subsequent changes in the fair value of our land holdings that we determine is less than the carrying basis of our land holdings reflected in our financial statements plus estimated costs to sell, we may be required to take future impairment charges, which would reduce our net income.
We may not be able to recover pre-development costs for third-party university developments.
University systems and educational institutions typically award us development services contracts on the basis of a competitive award process, but such contracts are typically executed following the formal approval of the transaction by the institution’s governing body. In the intervening period, we may incur significant pre-development and other costs in the expectation that the development services contract will be executed. If an institution’s governing body does not ultimately approve our selection and the terms of the pending development contract, we may not be able to recoup these costs from the institution and the resulting losses could be substantial.
Our awarded projects may not be successfully structured or financed and may delay our recognition of revenues.
The recognition and timing of revenues from our awarded development services projects will, among other things, be contingent upon successfully structuring and closing project financing as well as the timing of construction. The development projects that we have been awarded have at times been delayed beyond the originally scheduled construction commencement date. If such delays were to occur with our current awarded projects, our recognition of expected revenues and receipt of expected fees from these projects would be delayed.
We may encounter delays in completion or experience cost overruns with respect to our properties under construction.
As of December 31, 2017, we were in the process of constructing 13 owned properties. These properties are subject to the various risks relating to properties that are under construction referred to elsewhere in these risk factors, including the risks that we may encounter delays in completion and that any such project may experience cost overruns or may not be completed on time. Additionally, if we do not complete the construction of properties on schedule, we may be required to provide alternative housing to the students with whom we have signed leases, which would result in our incurring significant expenses, and may result in students attempting to terminate their leases, which may adversely affect occupancy at such properties for the applicable academic year.
Our guarantees could result in liabilities in excess of our development fees.
In third-party developments, we typically provide guarantees of the obligations of the developer, including development budgets and timely project completion. These guarantees include, among other things, the cost of providing alternate housing for students in the event we do not timely complete a development project. These guarantees typically exclude delays resulting from force majeure and also, in third-party transactions, are typically limited in amount to the amount of our development fees from the project. In certain cases, however, our contingent liability under these guarantees has exceeded our development fee from the project and we may agree to such arrangements in the future. Our obligations under alternative housing guarantees typically expire five days after construction is complete. Project cost guarantees are normally satisfied within one year after completion of the project.
Tax laws have recently changed and may continue to change at any time, and any such legislative or other actions could have a negative effect on us.
The Tax Cut and Jobs Act was signed into law on December 22, 2017. The law includes significant changes to the U.S. corporate income tax system, including a Federal corporate rate reduction from 35% to 21% for non-REIT “C” corporations, which may cause investors to perceive investments in REITs to be less attractive than investments in the stock of non-REIT “C” corporations. The law also includes limitations on the deductibility of executive compensation and interest expense, which may result in our being required to pay higher dividends to continue to qualify as a REIT at a time and in an amount that otherwise may not be in our and our stockholders’ best interests.
In addition, tax laws remain under constant review by persons involved in the legislative process, at the Internal Revenue Service and the U.S. Department of the Treasury, and by various state and local tax authorities. Changes to tax laws, regulations, or administrative interpretations, which may be applied retroactively, could adversely affect us in a number of additional ways, including making it more difficult or more costly for us to qualify as a REIT or decreasing real estate values generally.
We cannot predict the full impact of the Tax Cut and Jobs Act or whether, when, in what forms, or with what effective dates, the tax laws, regulations, and administrative interpretations applicable to us or our shareholders may be further changed. Any of these matters may significantly affect our liquidity and results of operations, as well as the value of our shares.
We are subject to numerous other laws and regulations, changes to which could increase our costs and individually or in the aggregate adversely affect our business.
In addition to tax laws, we are subject to laws and regulations affecting our operations in a number of areas. Changes in these laws and regulations, including, among others, additional healthcare reform, employment law reform such as the enactment of federal overtime exemption regulations, and financial and disclosure reform such as revisions to the Dodd-Frank Act and related SEC rulemaking, or the enactment of new laws or regulations, may increase our costs. Also, compliance with these laws, regulations and similar requirements may be onerous and expensive, and they may be inconsistent from jurisdiction to jurisdiction, which may further increase the cost of compliance and doing business.
We cannot predict whether, when, in what forms, or with what effective dates, laws, regulations, and administrative interpretations applicable to us or our stockholders may be changed. Any such change may significantly affect our liquidity and results of operations, as well as the value of our shares.
We may be adversely impacted by new accounting pronouncements.
Accounting policies are fundamental to how we record and report our financial condition and results of operations. From time to time, the Financial Accounting Standards Board (“FASB”) and the U.S. Securities and Exchange Commission, entities that create and interpret accounting standards, may issue new accounting pronouncements or change their interpretation and application of these standards that govern the preparation of our financial statements. These changes could have a material impact on our reported financial condition and results of operations, and could also affect the comparability of our financial results to previous periods. In some cases, we could be required to apply a new or revised standard retroactively, resulting in restating prior period financial statements. The adoption of new accounting pronouncements could also affect the calculation of our debt covenants, and we cannot be assured that we will be able to work with our lenders to amend our debt covenants in response to such.
A cybersecurity incident and other technology disruptions could negatively impact our business, our relationships and our reputation.
We use computers in substantially all aspects of our business operations. We also use mobile devices, social networking and other online activities to connect with our employees, suppliers and our residents. Such uses give rise to cybersecurity risks, including security breach, espionage, system disruption, theft and inadvertent release of information. Our business involves the storage and transmission of numerous classes of sensitive and/or confidential information and intellectual property, including residents’ and suppliers’ personal information, private information about employees, and financial and strategic information about us. Further, as we pursue our strategy to grow through development and acquisitions and to pursue new initiatives to improve our operations, we are also expanding our information technologies, resulting in a larger technological presence and corresponding exposure to cybersecurity risk. As our reliance on technology has increased, so have the risks posed to our systems, both internal and those we have outsourced to third party service providers. In addition, information security risks have generally increased in recent years due to the rise in new technologies and the increased sophistication and activities of perpetrators of cyber attacks. The theft, destruction, loss, misappropriation or release of sensitive and/or confidential information or intellectual property, or interference with our information technology systems or the technology systems of third-parties on which we rely, could result in business disruption, negative publicity, brand damage, violation of privacy laws, loss of residents, potential liability and competitive disadvantage, any of which could result in a material adverse effect on financial condition or results of operations.
A degradation of a university’s reputation due to negative publicity or other events may adversely impact our communities.
It is important that the universities from which our communities draw residents maintain good reputations and are able to attract the desired number of incoming students. Any degradation in a university’s reputation could inhibit its ability to attract students and reduce the demand for our communities.
Federal and state laws require universities to publish and distribute reports of on-campus crime statistics, which may result in negative publicity and media coverage associated with crimes occurring in the vicinity of, or on the premises of, our on-campus communities. Reports of crime or other negative publicity regarding the safety of the students residing on, or near, our communities may have an adverse effect on both our on-campus and off-campus communities.
Joint venture investments could be adversely affected by our lack of sole decision-making authority, our reliance on co-venturers’ financial condition and disputes between our co-venturers and us.
We have co-invested, and may continue in the future to co-invest, with third parties through partnerships, joint ventures or other entities, acquiring non-controlling interests in or sharing responsibility for managing the affairs of a property, partnership, joint
venture or other entity. In connection with joint venture investments, we do not have sole decision-making control regarding the property, partnership, joint venture or other entity. Investments in partnerships, joint ventures or other entities may, under certain circumstances, involve risks not present were a third-party not involved, including the possibility that our partners or co-venturers might become bankrupt or fail to fund their share of required capital contributions. Our partners or co-venturers also may have economic or other business interests or goals that are inconsistent with our business interests or goals, and may be in a position to take actions contrary to our preferences, policies or objectives. Such investments also will have the potential risk of impasses on decisions, such as a sale, because neither we nor our partners or co-venturers would have full control over the partnership or joint venture. Disputes between us and our partners or co-venturers may result in litigation or arbitration that would increase our expenses and prevent our officers and/or directors from focusing their time and effort exclusively on our business. Consequently, actions by or disputes with our partners or co-venturers might result in subjecting properties owned by the partnership, joint venture or other entity to additional risk. In addition, we may in certain circumstances be liable for the actions of our partners or co-venturers.
Litigation risks could affect our business.
As a publicly traded owner of properties, we have become and in the future may become involved in legal proceedings, including consumer, employment, tort or commercial litigation, that if decided adversely to or settled by us, and not adequately covered by insurance, could result in liability that is material to our financial condition or results of operations.
Our performance and value are subject to risks associated with real estate assets and with the real estate industry.
Our ability to satisfy our financial obligations and make expected distributions to our security holders depends on our ability to generate cash revenues in excess of expenses and capital expenditure requirements. Events and conditions generally applicable to owners and operators of real property that are beyond our control may decrease cash available for distribution and the value of our properties. These events include:
| |
| • | general economic conditions; |
| |
| • | rising level of interest rates; |
| |
| • | local oversupply, increased competition or reduction in demand for student housing; |
| |
| • | inability to collect rent from tenants; |
| |
| • | vacancies or our inability to rent beds on favorable terms; |
| |
| • | inability to finance property development and acquisitions on favorable terms; |
| |
| • | increased operating costs, including insurance premiums, utilities, and real estate taxes; |
| |
| • | costs of complying with changes in governmental regulations; |
| |
| • | the relative illiquidity of real estate investments; |
| |
| • | decreases in student enrollment at particular colleges and universities; |
| |
| • | changes in university policies related to admissions and housing; and |
| |
| • | changing student demographics. |
In addition, periods of economic slowdown or recession, rising interest rates or declining demand for real estate, or the public perception that any of these events may occur, could result in a general decline in rents or an increased incidence of defaults under existing leases, which would adversely affect us.
Potential losses may not be covered by insurance.
We carry fire, earthquake, terrorism, business interruption, vandalism, malicious mischief, boiler and machinery, commercial general liability and workers’ compensation insurance covering all of the properties in our portfolio under various policies. We believe the policy specifications and insured limits are appropriate and adequate given the relative risk of loss, the cost of the coverage and industry practice. There are, however, certain types of losses, such as property damage from generally unsecured losses such as riots, wars, punitive damage awards or acts of God that may be either uninsurable or not economically insurable. Some of our properties are insured subject to limitations involving large deductibles and policy limits that may not be sufficient to cover losses. In addition, we may discontinue earthquake, terrorism or other insurance on some or all of our properties in the future if the cost of premiums from any of these policies exceeds, in our judgment, the value of the coverage discounted for the risk of loss.
If we experience a loss that is uninsured or that exceeds policy limits, we could lose the capital invested in the damaged properties as well as the anticipated future cash flows from those properties. In addition, if the damaged properties are subject to recourse indebtedness, we would continue to be liable for the indebtedness, even if these properties were irreparably damaged and require substantial expenditures to rebuild or repair. In the event of a significant loss at one or more of our properties, the remaining
insurance under our policies, if any, could be insufficient to adequately insure our other properties. In such event, securing additional insurance, if possible, could be significantly more expensive than our current policies.
Unionization or work stoppages could have an adverse effect on us.
We are at times required to use unionized construction workers or to pay the prevailing wage in a jurisdiction to such workers. Due to the highly labor intensive and price competitive nature of the construction business, the cost of unionization and/or prevailing wage requirements for new developments could be substantial. Unionization and prevailing wage requirements could adversely affect a new development’s profitability. Union activity or a union workforce could increase the risk of a strike, which would adversely affect our ability to meet our construction timetables.
We could incur significant costs related to government regulation and private litigation over environmental matters.
Under various environmental laws, including the Comprehensive Environmental Response, Compensation and Liability Act (“CERCLA”), a current or previous owner or operator of real property may be liable for contamination resulting from the release or threatened release of hazardous or toxic substances or petroleum at that property, and an entity that arranges for the disposal or treatment of a hazardous or toxic substance or petroleum at another property may be held jointly and severally liable for the cost to investigate and clean up such property or other affected property. Such parties are known as potentially responsible parties (“PRPs”). Such environmental laws often impose liability without regard to whether the owner or operator knew of, or was responsible for, the presence of the contaminants, and the costs of any required investigation or cleanup of these substances can be substantial. PRPs are liable to the government as well as to other PRPs who may have claims for contribution. The liability is generally not limited under such laws and could exceed the property’s value and the aggregate assets of the liable party. The presence of contamination or the failure to remediate contamination at our properties may expose us to third-party liability for personal injury or property damage, or adversely affect our ability to sell, lease or develop the real property or to borrow using the real property as collateral.
Environmental laws also impose ongoing compliance requirements on owners and operators of real property. Environmental laws potentially affecting us address a wide variety of matters, including, but not limited to, asbestos-containing building materials (“ACBM”), storage tanks, storm water and wastewater discharges, lead-based paint, wetlands, and hazardous wastes. Failure to comply with these laws could result in fines and penalties or expose us to third-party liability. Some of our properties may have conditions that are subject to these requirements and we could be liable for such fines or penalties or liable to third parties.
Existing conditions at some of our properties may expose us to liability related to environmental matters.
Some of the properties in our portfolio may contain asbestos-containing building materials, or ACBMs. Environmental laws require that ACBMs be properly managed and maintained, and may impose fines and penalties on building owners or operators for failure to comply with these requirements. Also, some of the properties in our portfolio contain, or may have contained, or are adjacent to or near other properties that have contained or currently contain storage tanks for the storage of petroleum products or other hazardous or toxic substances. These operations create a potential for the release of petroleum products or other hazardous or toxic substances. Third parties may be permitted by law to seek recovery from owners or operators for personal injury associated with exposure to contaminants, including, but not limited to, petroleum products, hazardous or toxic substances, and asbestos fibers. Also, some of the properties may contain regulated wetlands that can delay or impede development or require costs to be incurred to mitigate the impact of any disturbance. Absent appropriate permits, we can be held responsible for restoring wetlands and be required to pay fines and penalties.
Insurance carriers have reacted to awards or settlements related to lawsuits against owners and managers of residential properties alleging personal injury and property damage caused by the presence of mold in residential real estate by excluding mold related programs designed to minimize the existence of mold in any of our properties as well as guidelines for promptly addressing and resolving reports of mold to minimize any impact mold might have on residents or the property.
Environmental liability at any of our properties, including those related to the existence of mold, may have a material adverse effect on our financial condition, results of operations, cash flow, the trading price of our stock or our ability to satisfy our debt service obligations and pay dividends or distributions to our security holders.
We may incur significant costs complying with the Americans with Disabilities Act and similar laws.
Under the Americans with Disabilities Act of 1990, or the ADA, all public accommodations must meet federal requirements related to access and use by disabled persons. Additional federal, state and local laws also may require modifications to our properties, or restrict our ability to renovate our properties. For example, the Fair Housing Amendments Act of 1988, or FHAA, requires
apartment properties first occupied after March 13, 1990 to be accessible to the handicapped. We have not conducted an audit or investigation of all of our properties to determine our compliance with present requirements. Noncompliance with the ADA or FHAA could result in the imposition of fines or an award or damages to the government or private litigants and also could result in an order to correct any non-complying feature. Also, discrimination on the basis of certain protected classes can result in significant awards to victims. We cannot predict the ultimate amount of the cost of compliance with the ADA, FHAA or other legislation. If we incur substantial costs to comply with the ADA, FHAA or any other legislation, we could be materially and adversely affected.
We may incur significant costs complying with other regulations.
The properties in our portfolio are subject to various federal, state and local regulatory requirements, such as state and local fire and life safety requirements. If we fail to comply with these various requirements, we might incur governmental fines or private damage awards. Furthermore, existing requirements could change and require us to make significant unanticipated expenditures that would materially and adversely affect us.
The impact of climate change may adversely affect our financial condition or results of operations.
To the extent that climate change does occur, we may experience extreme weather and changes in precipitation and temperature, all of which may result in physical damage or a decrease in demand for properties located in these areas or affected by these conditions. Should the impact of climate change be material in nature, including destruction of our properties, or occur for lengthy periods of time, our financial condition or results of operations may be adversely affected. In addition, changes in federal and state legislation and regulation on climate change could result in increased capital expenditures to improve the energy efficiency of our existing properties and could also require us to spend more on our new development properties without a corresponding increase in revenue.
Risks Associated with Our Indebtedness and Financing
We depend heavily on the availability of debt and equity capital to fund our business.
In order to maintain our qualification as a REIT, we are required under the Internal Revenue Code to distribute annually at least 90% of our REIT taxable income, determined without regard to the deduction for dividends paid and excluding any net capital gain. To the extent that we satisfy this distribution requirement but distribute less than 100% of our net taxable income, including any net capital gains, we will be subject to federal corporate income tax on our undistributed taxable income. In addition, we will be subject to a 4% nondeductible excise tax if the actual amount that we pay out to our stockholders in a calendar year is less than a minimum amount specified under federal tax laws. Because of these distribution requirements, REITs are largely unable to fund capital expenditures, such as acquisitions, renovations, development and property upgrades from operating cash flow. Consequently, we will be largely dependent on the public equity and debt capital markets and private lenders to provide capital to fund our growth and other capital expenditures. We may not be able to obtain this financing on favorable terms or at all. Our access to equity and debt capital depends, in part, on:
| |
| • | general market conditions; |
| |
| • | our current debt levels and the number of properties subject to encumbrances; |
| |
| • | our current performance and the market’s perception of our growth potential; |
| |
| • | our cash flow and cash distributions; and |
| |
| • | the market price per share of our common stock. |
If we cannot obtain capital from third-party sources, we may not be able to acquire properties when strategic opportunities exist, satisfy our debt service obligations or make cash distributions to our stockholders, including those necessary to maintain our qualification as a REIT.
Disruptions in the financial markets could adversely affect our ability to obtain debt financing or to issue equity and impact our acquisitions and dispositions.
Dislocations and liquidity disruptions in capital and credit markets could impact liquidity in the debt markets, resulting in financing terms that are less attractive to us and/or the unavailability of certain types of debt financing. Should the capital and credit markets experience volatility and the availability of funds become limited, or be available only on unattractive terms, we will incur increased costs associated with issuing debt instruments. In addition, it is possible that our ability to access the capital and credit markets may be limited or precluded by these or other factors at a time when we would like, or need, to do so, which would adversely impact our ability to refinance maturing debt and/or react to changing economic and business conditions. Uncertainty in the capital
and credit markets could negatively impact our ability to make acquisitions and make it more difficult or not possible for us to sell properties or may adversely affect the price we receive for properties that we do sell, as prospective buyers may experience increased costs of debt financing or difficulties in obtaining debt financing. Potential disruptions in the financial markets could also have other unknown adverse effects on us or the economy generally and may cause the price of our securities to fluctuate significantly and/or to decline.
Our debt level reduces cash available for distribution and could have other important adverse consequences.
As of December 31, 2017, our total consolidated indebtedness was approximately $3.0 billion (excluding unamortized mortgage debt premiums and discounts and original issue discounts). Our debt service obligations expose us to the risk of default and reduce or eliminate cash resources that are available to operate our business or pay distributions that are necessary to maintain our qualification as a REIT. There is no limit on the amount of indebtedness that we may incur except as provided by the covenants in our corporate-level debt. We may incur additional indebtedness to fund future property development, acquisitions and other working capital needs, which may include the payment of distributions to our security holders. The amount available to us and our ability to borrow from time to time under our corporate-level debt is subject to certain conditions and the satisfaction of specified financial and other covenants. If the income generated by our properties and other assets fails to cover our debt service, we would be forced to reduce or eliminate distributions to our stockholders and may experience losses.
In addition, the indenture governing our outstanding senior unsecured notes contains financial and operating covenants that among other things, restrict our ability to take specific actions, even if we believe them to be in our best interest, including restrictions on our ability to consummate a merger, consolidation or sale of all or substantially all of our assets and incur secured and unsecured indebtedness.
Our level of debt and the operating limitations imposed on us by our debt agreements could have significant adverse consequences, including the following:
| |
| • | we may default on our scheduled principal payments or other obligations as a result of insufficient cash flow or otherwise; |
| |
| • | with respect to debt secured by our properties, the lenders or mortgagees may foreclose on such properties and receive an assignment of rents and leases, and foreclosures could create taxable income without accompanying cash proceeds, a circumstance that could hinder our ability to meet the REIT distribution requirements imposed by the Internal Revenue Code; and |
| |
| • | compliance with the provisions of our debt agreements, including the financial and other covenants, such as the maintenance of specified financial ratios, could limit our flexibility and a default in these requirements, if uncured, could result in a requirement that we repay indebtedness, which could severely affect our liquidity and increase our financing costs. |
We may be unable to renew, repay or refinance our outstanding debt.
We are subject to the risk that our indebtedness will not be able to be renewed, repaid or refinanced when due or that the terms of any renewal or refinancing will not be as favorable as the existing terms of such indebtedness. If we were unable to refinance our indebtedness on acceptable terms, or at all, we might be forced to dispose of one or more of our properties on disadvantageous terms, which might result in losses to us. In addition, if a property is mortgaged to secure payment of indebtedness and income from such property is insufficient to pay that indebtedness, the property could be foreclosed upon by the mortgagee resulting in a loss of income and a decline in our total asset value. If any of the foregoing occurs, such losses could have a material adverse effect on us and our ability to make distributions to our equity holders and pay amounts due on our debt.
We may be adversely affected by changes in LIBOR reporting practices or the method in which LIBOR is determined.
As of December 31, 2017, we had outstanding approximately $926.9 million of fixed and variable debt that was indexed to the London Interbank Offered Rate (“LIBOR”). On July 27, 2017, the Financial Conduct Authority (the “FCA”) announced its intention to phase out LIBOR rates by the end of 2021. It is not possible to predict the further effect of the rules of the FCA, any changes in the methods by which LIBOR is determined, or any other reforms to LIBOR that may be enacted in the United Kingdom, the European Union or elsewhere. Any such developments may cause LIBOR to perform differently than in the past, or cease to exist. In addition, any other legal or regulatory changes made by the FCA, ICE Benchmark Administration Limited, the European Money Markets Institute (formerly Euribor-EBF), the European Commission or any other successor governance or oversight body, or future changes adopted by such body, in the method by which LIBOR is determined or the transition from LIBOR to a successor benchmark may result in, among other things, a sudden or prolonged increase or decrease in LIBOR, a delay in the publication of LIBOR, and changes in the rules or methodologies in LIBOR, which may discourage market participants from continuing to administer or to participate in LIBOR’s determination, and, in certain situations, could result in LIBOR no longer being determined
and published. If a published U.S. dollar LIBOR rate is unavailable after 2021, the interest rates on our debt which is indexed to LIBOR will be determined using various alternative methods, any of which may result in interest obligations which are more than or do not otherwise correlate over time with the payments that would have been made on such debt if U.S. dollar LIBOR was available in its current form. Further, the same costs and risks that may lead to the discontinuation or unavailability of U.S. dollar LIBOR may make one or more of the alternative methods impossible or impracticable to determine. Any of these proposals or consequences could have a material adverse effect on our financing costs.
Rising interest rates could both increase our borrowing costs, thereby adversely affecting our cash flows and the amounts available for distributions to our stockholders, and decrease our share price, if investors seek higher yields through other investments.
We have an unsecured revolving credit facility and a term loan that bear interest at a variable rate on all amounts borrowed and we may incur additional variable rate debt in the future. Increases in interest rates on variable rate debt would increase our interest expense and the cost of refinancing existing debt and incurring new debt, unless we make arrangements that hedge the risk of rising interest rates, which would adversely affect net income and cash available for payment of our debt obligations and distributions to equity holders.
An environment of rising interest rates could also lead holders of our securities to seek higher yields through other investments, which could adversely affect the market price of our stock. One of the factors which may influence the price of our stock in public markets is the annual distribution rate we pay as compared with the yields on alternative investments.
Failure to maintain our current credit ratings could adversely affect our cost of funds, liquidity and access to capital markets.
Moody’s and Standard & Poor’s, the major debt rating agencies, have evaluated our debt and have given us ratings of Baa2 and BBB, respectively. These ratings are based on a number of factors, which include their assessment of our financial strength, liquidity, capital structure, asset quality and sustainability of cash flow and earnings. Due to changes in market conditions, we may not be able to maintain our current credit ratings, which will adversely affect the cost of funds under our credit facilities, and could also adversely affect our liquidity and access to capital markets.
We may incur losses on interest rate swap and hedging arrangements.
We may periodically enter into agreements to reduce the risks associated with increases in interest rates. Although these agreements may partially protect against rising interest rates, they also may reduce the benefits to us if interest rates decline. If an arrangement is not indexed to the same rate as the indebtedness that is hedged, we may be exposed to losses to the extent which the rate governing the indebtedness and the rate governing the hedging arrangement change independently of each other. Finally, nonperformance by the other party to the arrangement may subject us to increased credit risks.
Potential reforms to Fannie Mae and Freddie Mac could adversely affect our performance.
There is significant uncertainty surrounding the futures of Fannie Mae and Freddie Mac. Through their lender originator networks, Fannie Mae and Freddie Mac are significant lenders both to us and to buyers of our properties. Fannie Mae and Freddie Mac have a mandate to support multifamily housing through their financing activities and any changes to their mandates, further reductions in their size or the scale of their activities, or loss of their key personnel could have a significant adverse impact on us and may, among other things, lead to lower values for our assets and higher interest rates on our borrowings. Fannie Mae’s and Freddie Mac’s regulator has set overall volume limits on most of Fannie Mae’s and Freddie Mac’s lending activities. The regulator in the future could require Fannie Mae and Freddie Mac to focus more of their lending activities on small borrowers or properties the regulator deems affordable, which may or may not include our assets, which could also adversely impact us. In addition, the members of the current Presidential administration and House and Senate banking committees have announced the reform of Fannie Mae and Freddie Mac is a priority, and there is uncertainty regarding the impact of these actions on us and buyers of our properties.
Risks Related to Our Organization and Structure
Our stock price will fluctuate.
The market price and volume of our common stock will fluctuate due not only to general stock market conditions but also to the risk factors discussed above and below and the following:
| |
| • | operating results that vary from the expectations of securities analysts and investors; |
| |
| • | investor interest in our property portfolio; |
| |
| • | the reputation and performance of REITs; |
| |
| • | the attractiveness of REITs as compared to other investment vehicles; |
| |
| • | our financial condition and the results of our operations; |
| |
| • | the perception of our growth and earnings potential; |
| |
| • | dividend payment rates and the form of the payment; |
| |
| • | increases in market rates, which may lead purchasers of our common stock to demand a higher yield; and |
| |
| • | changes in financial markets and national economic and general market conditions. |
To qualify as a REIT, we may be forced to limit the activities of a TRS.
To qualify as a REIT, no more than 25% of the value of our total assets may consist of the securities of one or more taxable REIT subsidiaries, or TRSs. This percentage limitation will be lowered to 20% for taxable years beginning after December 31, 2017. Certain of our activities, such as our third-party development, management and leasing services, must be conducted through a TRS for us to qualify as a REIT. In addition, certain non-customary services must be provided by a TRS or an independent contractor. If the revenues from such activities create a risk that the value of our TRS entities, based on revenues or otherwise, approaches the 25% threshold (20% after December 31, 2017), we will be forced to curtail such activities or take other steps to remain under the 25% threshold. Since the threshold is based on value, it is possible that the IRS could successfully contend that the value of our TRS entities exceeds the threshold even if the TRS accounts for less than 25% (20% after December 31, 2017) of our consolidated revenues, income or cash flow. Four of our five on-campus participating properties and our third-party services are held by a TRS. Consequently, income earned from four of our five on-campus participating properties and our third-party services will be subject to regular federal income taxation and state and local income taxation where applicable, thus reducing the amount of cash available for distribution to our security holders. Our TRS entities’ income tax returns are subject to examination by federal, state and local tax jurisdictions, and the methodology used in determining taxable income or loss for those subsidiaries is therefore subject to challenge in any such examination.
A TRS is not permitted to directly or indirectly operate or manage a “hotel, motel or other establishment more than one-half of the dwelling units in which are used on a transient basis.” We believe that our method of operating our TRS entities will not be considered to constitute such an activity. Future Treasury Regulations or other guidance interpreting the applicable provisions might adopt a different approach, or the IRS might disagree with our conclusion. In such event we might be forced to change our method of operating our TRS entities, which could adversely affect us, or one of our TRS entities could fail to qualify as a taxable REIT subsidiary, which would likely cause us to fail to qualify as a REIT.
Failure to qualify as a REIT would have significant adverse consequences to us and the value of our securities.
We intend to operate in a manner that will allow us to qualify as a REIT for federal income tax purposes under the Internal Revenue Code. If we lose our REIT status, we will face serious tax consequences that would substantially reduce or eliminate the funds available for investment and for distribution to security holders for each of the years involved, because:
| |
| • | we would not be allowed a deduction for dividends to security holders in computing our taxable income and such amounts would be subject to federal income tax at regular corporate rates; |
| |
| • | we also could be subject to the federal alternative minimum tax and possibly increased state and local taxes; and |
| |
| • | unless we are entitled to relief under applicable statutory provisions, we could not elect to be taxed as a REIT for four taxable years following the year during which we were disqualified. |
In addition, if we fail to qualify as a REIT, we will not be required to pay dividends to stockholders, and all dividends to stockholders will be subject to tax as ordinary income to the extent of our current and accumulated earnings and profits. As a result of all these factors, our failure to qualify as a REIT also could impair our ability to expand our business and raise capital, and would adversely affect the value of our common stock.
Qualification as a REIT involves the application of highly technical and complex Internal Revenue Code provisions for which there are only limited judicial and administrative interpretations. The complexity of these provisions and of the applicable Treasury Regulations that have been promulgated under the Internal Revenue Code is greater in the case of a REIT that, like us, holds its assets through a partnership or a limited liability company. The determination of various factual matters and circumstances not entirely within our control may affect our ability to qualify as a REIT. In order to qualify as a REIT, we must satisfy a number of requirements, including requirements regarding the composition of our assets and two “gross income tests”: (a) at least 75% of our gross income in any year must be derived from qualified sources, such as rents from real property, mortgage interest, dividends from other REITs and gains from sale of such assets, and (b) at least 95% of our gross income must be derived from sources meeting the 75% income test above, and other passive investment sources, such as other interest and dividends and gains from
sale of securities. Also, we must pay dividends to stockholders aggregating annually at least 90% of our REIT taxable income, excluding any net capital gains. In addition, legislation, new regulations, administrative interpretations or court decisions may adversely affect our investors, our ability to qualify as a REIT for federal income tax purposes or the desirability of an investment in a REIT relative to other investments.
Even if we qualify as a REIT for federal income tax purposes, we may be subject to some federal, state and local taxes on our income or property and, in certain cases, a 100% penalty tax, in the event we sell property as a dealer or if a TRS enters into agreements with us or our tenants on a basis that is determined to be other than an arm’s length basis.
Our charter contains restrictions on the ownership and transfer of our stock.
Our charter provides that, subject to certain exceptions, no person or entity may beneficially own, or be deemed to own by virtue of the applicable constructive ownership provisions of the Internal Revenue Code, more than 9.8% (by value or by number of shares, whichever is more restrictive) of the outstanding shares of our common stock or more than 9.8% by value of all our outstanding shares, including both common and preferred stock. We refer to this restriction as the “ownership limit.” A person or entity that becomes subject to the ownership limit by virtue of a violative transfer that results in a transfer to a trust is referred to as a “purported beneficial transferee” if, had the violative transfer been effective, the person or entity would have been a record owner and beneficial owner or solely a beneficial owner of our stock, or is referred to as a “purported record transferee” if, had the violative transfer been effective, the person or entity would have been solely a record owner of our stock.
The constructive ownership rules under the Internal Revenue Code are complex and may cause stock owned actually or constructively by a group of related individuals and/or entities to be owned constructively by one individual or entity. As a result, the acquisition of less than 9.8% of our stock (or the acquisition of an interest in an entity that owns, actually or constructively, our stock) by an individual or entity, could, nevertheless cause that individual or entity, or another individual or entity, to own constructively in excess of 9.8% of our outstanding stock and thereby subject the stock to the ownership limit. Our charter, however, requires exceptions to be made to this limitation if our board of directors determines that such exceptions will not jeopardize our tax status as a REIT. This ownership limit could delay, defer or prevent a change of control or other transaction that might involve a premium price for our common stock or otherwise be in the best interest of our security holders.
Certain tax and anti-takeover provisions of our charter and bylaws may inhibit a change of our control.
Certain provisions contained in our charter and bylaws and the Maryland General Corporation Law may discourage a third-party from making a tender offer or acquisition proposal to us. If this were to happen, it could delay, deter or prevent a change in control or the removal of existing management. These provisions also may delay or prevent the security holders from receiving a premium for their securities over then-prevailing market prices. These provisions include:
| |
| • | the REIT ownership limit described above; |
| |
| • | authorization of the issuance of our preferred shares with powers, preferences or rights to be determined by our board of directors; |
| |
| • | the right of our board of directors, without a stockholder vote, to increase our authorized shares and classify or reclassify unissued shares; |
| |
| • | advance-notice requirements for stockholder nomination of directors and for other proposals to be presented to stockholder meetings; and |
| |
| • | the requirement that a majority vote of the holders of common stock is needed to remove a member of our board of directors for “cause.” |
The Maryland business statutes also impose potential restrictions on a change of control of our Company.
Various Maryland laws may have the effect of discouraging offers to acquire us, even if the acquisition would be advantageous to security holders. Our bylaws exempt us from some of those laws, such as the control share acquisition provisions, but our board of directors can change our bylaws at any time to make these provisions applicable to us.
Our rights and the rights of our security holders to take action against our directors and officers are limited.
Maryland law provides that a director or officer has no liability in that capacity if he or she performs his or her duties in good faith, in a manner he or she reasonably believe to be in our best interests and with the care that an ordinary prudent person in a like position would use under similar circumstances. In addition, our charter eliminates our directors’ and officers’ liability to us and our stockholders for money damages except for liability resulting from actual receipt of an improper benefit in money, property or services or active and deliberate dishonesty established by a final judgment and which is material to the cause of action. Our
bylaws require us to indemnify directors and officers for liability resulting from actions taken by them in those capacities to the maximum extent permitted by Maryland law. As a result, we and our security holders may have more limited rights against our directors and officers than might otherwise exist under common law. In addition, we may be obligated to fund the defense costs incurred by our directors and officers.
Item 1B. Unresolved Staff Comments
There were no unresolved comments from the staff of the SEC at December 31, 2017.
Item 2. Properties
The following table presents certain summary information about our properties. Our properties generally are modern facilities, and amenities at most of our properties include a swimming pool, basketball courts and a large community center featuring a fitness center, computer center, study areas, and a recreation room with billiards and other games. Some properties also have a jacuzzi/hot tub, volleyball courts, tennis courts, in-unit washers and dryers, and food service facilities. Leases at our off-campus properties typically require 12 monthly rent payments. Leases at our residence hall properties typically correspond to the university’s academic year and require nine or ten monthly rent payments.
These properties are included in the Owned Properties and On-Campus Participating Properties segments discussed in Item 1 and Note 17 in the accompanying Notes to Consolidated Financial Statements contained in Item 8. We own fee title to all of these properties except for properties subject to ground/facility leases and our on-campus participating properties, as discussed more fully in Note 8 and Note 15 in the accompanying Notes to Consolidated Financial Statements contained in Item 8. All dollar amounts in this table and others herein, except share and per share amounts, are stated in thousands unless otherwise indicated.
|
| | | | | | | | | | | | | | | | | | | | |
| Property | | Year Built (1) | | Date Acquired/ Developed | | Primary University Served | | Typical Number of Rental Payments/ Year | | Year Ended December 31, 2017 Revenue (2) | | Average Monthly Base Rental Revenue/ Bed (3) | | # of Units | | # of Beds |
| | | | | | | | | | | | | | | | | |
| OWNED PROPERTIES | | | | | | | | | | | | | | | | |
Same Store Owned Properties: (4) | | | | | | | | | | | | | | | | |
| The Callaway House | | 1999 | | Mar-01 | | Texas A&M University | | 9 | | $ | 8,913 |
| (5) | $ | 1,512 |
| (5) | 173 | | 538 |
| The Village at Science Drive | | 2000 | | Nov-01 | | The University of Central Florida | | 12 | | 5,941 |
| | 648 |
| | 192 | | 732 |
| University Village at Boulder Creek | | 2002 | | Aug-02 | | The University of Colorado at Boulder | | 12 | | 3,731 |
| | 964 |
| | 82 | | 309 |
| University Village - Fresno | | 2004 | | Aug-04 | | California State University - Fresno | | 12 | | 2,862 |
| | 527 |
| | 105 | | 406 |
| University Village - Temple | | 2004 | | Aug-04 | | Temple University | | 12 | | 6,427 |
| | 698 |
| | 220 | | 749 |
College Club Townhomes (6) | | 2002 | | Feb-05 | | Florida A&M University | | 12 | | 2,883 |
| | 373 |
| | 136 | | 544 |
| University Club Apartments | | 1999 | | Feb-05 | | University of Florida | | 12 | | 2,343 |
| | 503 |
| | 94 | | 376 |
| City Parc at Fry Street | | 2004 | | Mar-05 | | University of North Texas | | 12 | | 3,458 |
| | 665 |
| | 136 | | 418 |
| Entrada Real | | 2000 | | Mar-05 | | University of Arizona | | 12 | | 2,639 |
| | 576 |
| | 98 | | 363 |
| University Village at Sweethome | | 2005 | | Aug-05 | | State University of New York at Buffalo | | 12 | | 6,337 |
| | 656 |
| | 269 | | 828 |
University Village - Tallahassee (7) | | 1991 | | Mar-06 | | Florida State University | | 12 | | 4,637 |
| | 509 |
| | 217 | | 716 |
| Royal Village Gainesville | | 1996 | | Mar-06 | | University of Florida | | 12 | | 3,176 |
| | 588 |
| | 118 | | 448 |
| Royal Lexington | | 1994 | | Mar-06 | | The University of Kentucky | | 12 | | 2,379 |
| | 532 |
| | 94 | | 364 |
| Raiders Pass | | 2001 | | Mar-06 | | Texas Tech University | | 12 | | 4,451 |
| | 479 |
| | 264 | | 828 |
| Aggie Station | | 2003 | | Mar-06 | | Texas A&M University | | 12 | | 3,152 |
| | 592 |
| | 156 | | 450 |
| The Outpost - San Antonio | | 2005 | | Mar-06 | | University of Texas – San Antonio | | 12 | | 5,645 |
| | 549 |
| | 276 | | 828 |
| Callaway Villas | | 2006 | | Aug-06 | | Texas A&M University | | 10/12 | | 5,426 |
| | 651 |
| | 236 | | 704 |
| The Village on Sixth Avenue | | 1999 | | Jan-07 | | Marshall University | | 12 | | 4,378 |
| | 496 |
| | 248 | | 752 |
| Newtown Crossing | | 2005 | | Feb-07 | | University of Kentucky | | 12 | | 6,879 |
| | 604 |
| | 356 | | 942 |
| Olde Towne University Square | | 2005 | | Feb-07 | | University of Toledo | | 12 | | 3,954 |
| | 603 |
| | 224 | | 550 |
| Peninsular Place | | 2005 | | Feb-07 | | Eastern Michigan University | | 12 | | 3,223 |
| | 519 |
| | 183 | | 478 |
| University Centre | | 2007 | | Aug-07 | | Rutgers University, NJIT | | 10/12 | | 7,451 |
| | 908 |
| | 234 | | 838 |
The Summit & Jacob Heights (7) | | 2004 | | Jun-08 | | Minnesota State University | | 12 | | 4,905 |
| | 423 |
| | 258 | | 930 |
| GrandMarc Seven Corners | | 2000 | | Jun-08 | | University of Minnesota | | 12 | | 4,542 |
| | 606 |
| | 186 | | 440 |
| Aztec Corner | | 2001 | | Jun-08 | | San Diego State University | | 12 | | 5,607 |
| | 740 |
| | 180 | | 606 |
| The Tower at Third | | 1973 | | Jun-08 | | University of Illinois | | 12 | | 3,050 |
| | 735 |
| | 188 | | 375 |
|
| | | | | | | | | | | | | | | | | | | | |
| Property | | Year Built (1) | | Date Acquired/ Developed | | Primary University Served | | Typical Number of Rental Payments/ Year | | Year Ended December 31, 2017 Revenue (2) | | Average Monthly Base Rental Revenue/ Bed (3) | | # of Units | | # of Beds |
Willowtree Apartments and Tower (6) | | 1970 | | Jun-08 | | University of Michigan | | 12 | | $ | 6,286 |
| | $ | 596 |
| | 473 | | 851 |
| University Pointe | | 2004 | | Jun-08 | | Texas Tech University | | 12 | | 4,412 |
| | 581 |
| | 204 | | 682 |
| University Trails | | 2003 | | Jun-08 | | Texas Tech University | | 12 | | 4,529 |
| | 576 |
| | 240 | | 684 |
| Campus Trails | | 1991 | | Jun-08 | | Mississippi State University | | 12 | | 2,344 |
| | 427 |
| | 156 | | 480 |
| University Crossings (ACE) | | 2003 | | Jun-08 | | Drexel University | | 12 | | 11,302 |
| | 826 |
| | 260 | | 1,016 |
| Vista del Sol (ACE) | | 2008 | | Aug-08 | | Arizona State University | | 12 | | 18,194 |
| | 750 |
| | 613 | | 1,866 |
| Villas at Chestnut Ridge | | 2008 | | Aug-08 | | State Univ. of New York at Buffalo | | 12 | | 5,068 |
| | 759 |
| | 196 | | 552 |
| Barrett Honors College (ACE) | | 2009 | | Aug-09 | | Arizona State University | | 10 | | 14,391 |
| | 939 |
| | 604 | | 1,721 |
| Sanctuary Lofts | | 2006 | | Jul-10 | | Texas State University | | 12 | | 4,497 |
| | 697 |
| | 201 | | 487 |
| The Edge- Charlotte | | 1999 | | Nov-10 | | UNC - Charlotte | | 12 | | 5,208 |
| | 580 |
| | 180 | | 720 |
| University Walk | | 2002 | | Nov-10 | | UNC - Charlotte | | 12 | | 3,375 |
| | 552 |
| | 120 | | 480 |
| Uptown Apartments | | 2004 | | Nov-10 | | University of North Texas | | 12 | | 4,360 |
| | 656 |
| | 180 | | 528 |
| 2nd Ave Centre | | 2008 | | Dec-10 | | University of Florida | | 12 | | 7,200 |
| | 674 |
| | 274 | | 868 |
| Villas at Babcock | | 2011 | | Aug-11 | | University of Texas – San Antonio | | 12 | | 5,281 |
| | 538 |
| | 204 | | 792 |
| Lobo Village (ACE) | | 2011 | | Aug-11 | | University of New Mexico | | 12 | | 5,990 |
| | 542 |
| | 216 | | 864 |
| Villas on Sycamore | | 2011 | | Aug-11 | | Sam Houston State University | | 12 | | 4,838 |
| | 534 |
| | 170 | | 680 |
| University Village Northwest (ACE) | | 2011 | | Aug-11 | | Prairie View A&M University | | 10 | | 938 |
| | 707 |
| | 36 | | 144 |
| 26 West | | 2008 | | Dec-11 | | University of Texas at Austin | | 12 | | 13,818 |
| | 984 |
| | 367 | | 1,026 |
| The Varsity | | 2011 | | Dec-11 | | University of Maryland | | 12 | | 11,821 |
| | 942 |
| | 258 | | 901 |
| Avalon Heights | | 2002 | | May-12 | | University of South Florida in Tampa | | 12 | | 6,083 |
| | 641 |
| | 210 | | 754 |
| University Commons | | 2003 | | Jun-12 | | Univ. of Minnesota in Minneapolis | | 12 | | 4,191 |
| | 563 |
| | 164 | | 480 |
| Casas del Rio (ACE) | | 2012 | | Aug-12 | | University of New Mexico | | 10 | | 5,208 |
| | 596 |
| | 283 | | 1,028 |
The Suites (ACE) (6) | | 2013 | | Aug-12 | | Northern Arizona University | | 10 | | 6,355 |
| | 721 |
| | 439 | | 878 |
| Hilltop Townhomes (ACE) | | 2012 | | Aug-12 | | Northern Arizona University | | 12 | | 5,121 |
| | 697 |
| | 144 | | 576 |
U Club on Frey (6) | | 2013 | | Aug-12 | | Kennesaw State University | | 12 | | 7,320 |
| | 681 |
| | 216 | | 864 |
| Campus Edge on UTA Boulevard | | 2012 | | Aug-12 | | University of Texas - Arlington | | 12 | | 4,088 |
| | 658 |
| | 128 | | 488 |
| U Club Townhomes on Marion Pugh | | 2012 | | Aug-12 | | Texas A&M University | | 12 | | 4,981 |
| | 637 |
| | 160 | | 640 |
| Villas on Rensch | | 2012 | | Aug-12 | | State Univ. of New York at Buffalo | | 12 | | 5,765 |
| | 776 |
| | 153 | | 610 |
| The Village at Overton Park | | 2012 | | Aug-12 | | Texas Tech University | | 12 | | 4,339 |
| | 621 |
| | 163 | | 612 |
| Casa de Oro (ACE) | | 2012 | | Aug-12 | | Arizona State University | | 10 | | 2,140 |
| | 693 |
| | 109 | | 365 |
| The Villas at Vista del Sol (ACE) | | 2012 | | Aug-12 | | Arizona State University | | 12 | | 3,956 |
| | 805 |
| | 104 | | 400 |
| The Block | | 2008 | | Aug-12 | | The University of Texas at Austin | | 12 | | 20,346 |
| | 959 |
| | 669 | | 1,555 |
| University Pointe at College Station (ACE) | | 2012 | | Sep-12 | | Portland State University | | 12 | | 8,869 |
| | 714 |
| | 282 | | 978 |
| 309 Green | | 2008 | | Sep-12 | | University of Illinois | | 12 | | 4,204 |
| | 815 |
| | 110 | | 416 |
| The Retreat | | 2012 | | Sep-12 | | Texas State University | | 12 | | 6,217 |
| | 625 |
| | 187 | | 780 |
| Lofts54 | | 2008 | | Sep-12 | | University of Illinois | | 12 | | 1,174 |
| | 693 |
| | 43 | | 172 |
| Campustown Rentals | | 1982 | | Sep-12 | | University of Illinois | | 12 | | 4,050 |
| | 502 |
| | 264 | | 746 |
| Chauncey Square | | 2011 | | Sep-12 | | Purdue University | | 12 | | 4,552 |
| | 881 |
| | 158 | | 386 |
Texan &Vintage West Campus (6) | | 2008 | | Sep-12 | | The University of Texas at Austin | | 12 | | 3,913 |
| | 928 |
| | 124 | | 311 |
| The Castilian | | 1967 | | Sep-12 | | The University of Texas at Austin | | 10 | | 9,412 |
| (5) | 1,449 |
| (5) | 371 | | 623 |
|
| | | | | | | | | | | | | | | | | | | | |
| Property | | Year Built (1) | | Date Acquired/ Developed | | Primary University Served | | Typical Number of Rental Payments/ Year | | Year Ended December 31, 2017 Revenue (2) | | Average Monthly Base Rental Revenue/ Bed (3) | | # of Units | | # of Beds |
| Bishops Square | | 2002 | | Sep-12 | | Texas State University | | 12 | | $ | 2,586 |
| | $ | 619 |
| | 134 | | 315 |
| Union | | 2006 | | Sep-12 | | Baylor University | | 12 | | 863 |
| | 641 |
| | 54 | | 120 |
| 922 Place | | 2009 | | Sep-12 | | Arizona State University | | 12 | | 4,524 |
| | 720 |
| | 132 | | 468 |
| Campustown | | 1997 | | Sep-12 | | Iowa State University | | 12 | | 9,089 |
| | 550 |
| | 452 | | 1,217 |
| River Mill | | 1972 | | Sep-12 | | University of Georgia | | 12 | | 3,221 |
| | 572 |
| | 243 | | 461 |
| Landmark | | 2012 | | Sep-12 | | University of Michigan | | 12 | | 10,840 |
| | 1,277 |
| | 173 | | 606 |
| Icon Plaza | | 2012 | | Sep-12 | | University of Southern California | | 12 | | 4,845 |
| | 1,404 |
| | 56 | | 253 |
| The Province - Greensboro | | 2011 | | Nov-12 | | UNC - Greensboro | | 12 | | 5,039 |
| | 597 |
| | 219 | | 696 |
| RAMZ Apts on Broad | | 2004 | | Nov-12 | | Virginia Commonwealth University | | 12 | | 2,108 |
| | 753 |
| | 88 | | 172 |
| The Lofts at Capital Garage | | 2000 | | Nov-12 | | Virginia Commonwealth University | | 12 | | 899 |
| | 475 |
| | 36 | | 144 |
| 25 Twenty | | 2011 | | Nov-12 | | Texas Tech University | | 12 | | 4,398 |
| | 686 |
| | 249 | | 562 |
| The Province - Louisville | | 2009 | | Nov-12 | | University of Louisville | | 12 | | 6,253 |
| | 600 |
| | 366 | | 858 |
| West 27th Place | | 2011 | | Nov-12 | | University of Southern California | | 12 | | 7,303 |
| | 1,099 |
| | 161 | | 475 |
| The Province - Rochester | | 2010 | | Nov-12 | | Rochester Institute of Technology | | 12 | | 7,825 |
| | 828 |
| | 336 | | 816 |
5 Twenty Four & 5 Twenty Five Angliana (6) | | 2010 | | Nov-12 | | University of Kentucky | | 12 | | 7,424 |
| | 569 |
| | 376 | | 1,060 |
| The Province - Tampa | | 2009 | | Nov-12 | | University of South Florida | | 12 | | 7,605 |
| | 654 |
| | 287 | | 947 |
| U Point Kennesaw | | 2012 | | Nov-12 | | Kennesaw State University | | 12 | | 6,554 |
| | 650 |
| | 216 | | 795 |
| The Cottages of Durham | | 2012 | | Nov-12 | | University of New Hampshire | | 12 | | 6,350 |
| | 801 |
| | 141 | | 619 |
| University Edge | | 2012 | | Dec-12 | | Kent State University | | 12 | | 5,051 |
| | 672 |
| | 201 | | 608 |
| The Lodges of East Lansing | | 2012 | | Jul-13 | | Michigan State University | | 12 | | 9,385 |
| | 726 |
| | 364 | | 1,049 |
| 7th Street Station | | 2012 | | Jul-13 | | Oregon State University | | 12 | | 2,768 |
| | 693 |
| | 82 | | 309 |
| The Callaway House Austin | | 2013 | | Aug-13 | | The University of Texas at Austin | | 10 | | 15,229 |
| (5) | 1,992 |
| (5) | 219 | | 753 |
| Manzanita (ACE) | | 2013 | | Aug-13 | | Arizona State University | | 10 | | 6,248 |
| | 878 |
| | 241 | | 816 |
| University View (ACE) | | 2013 | | Aug-13 | | Prairie View A&M University | | 10 | | 2,273 |
| | 700 |
| | 96 | | 336 |
| U Club Townhomes at Overton Park | | 2013 | | Aug-13 | | Texas Tech University | | 12 | | 3,097 |
| | 661 |
| | 112 | | 448 |
| 601 Copeland | | 2013 | | Aug-13 | | Florida State University | | 12 | | 2,935 |
| | 795 |
| | 81 | | 283 |
| The Townhomes at Newtown Crossing | | 2013 | | Aug-13 | | University of Kentucky | | 12 | | 4,526 |
| | 624 |
| | 152 | | 608 |
| Chestnut Square (ACE) | | 2013 | | Sep-13 | | Drexel University | | 12 | | 11,146 |
| | 1,009 |
| | 220 | | 861 |
| Park Point | | 2008 | | Oct-13 | | Rochester Institute of Technology | | 12 | | 10,216 |
| | 828 |
| | 300 | | 924 |
| U Centre at Fry Street | | 2012 | | Nov-13 | | University of North Texas | | 12 | | 6,068 |
| | 737 |
| | 194 | | 614 |
| Cardinal Towne | | 2010 | | Nov-13 | | University of Louisville | | 12 | | 4,867 |
| | 621 |
| | 255 | | 545 |
| Stanworth Commons Phase I (ACE) | | 2014 | | Jul-14 | | Princeton University | | 12 | | 2,883 |
| | 1,179 |
| | 127 | | 214 |
| The Plaza on University | | 2014 | | Aug-14 | | University of Central Florida | | 12 | | 13,894 |
| | 730 |
| | 364 | | 1,313 |
| U Centre at Northgate (ACE) | | 2014 | | Aug-14 | | Texas A&M University | | 12 | | 6,455 |
| | 676 |
| | 196 | | 784 |
| University Walk | | 2014 | | Aug-14 | | University of Tennessee | | 12 | | 4,214 |
| | 637 |
| | 177 | | 526 |
U Club on Woodward (6) | | 2014 | | Aug-14 | | Florida State University | | 12 | | 8,417 |
| | 720 |
| | 236 | | 944 |
| The Standard | | 2014 | | Oct-14 | | University of Georgia | | 12 | | 6,106 |
| | 799 |
| | 190 | | 610 |
| Park Point | | 2010 | | Feb-15 | | Syracuse University | | 12 | | 3,564 |
| | 1,258 |
| | 66 | | 226 |
| 1200 West Marshall | | 2013 | | Mar-15 | | Virginia Commonwealth University | | 12 | | 4,010 |
| | 781 |
| | 136 | | 406 |
| 8 1/2 Canal Street | | 2011 | | Mar-15 | | Virginia Commonwealth University | | 12 | | 4,962 |
| | 720 |
| | 160 | | 540 |
|
| | | | | | | | | | | | | | | | | | | | |
| Property | | Year Built (1) | | Date Acquired/ Developed | | Primary University Served | | Typical Number of Rental Payments/ Year | | Year Ended December 31, 2017 Revenue (2) | | Average Monthly Base Rental Revenue/ Bed (3) | | # of Units | | # of Beds |
| Vistas San Marcos | | 2013 | | Mar-15 | | Texas State University | | 12 | | $ | 5,920 |
| | $ | 724 |
| | 255 | | 600 |
| Crest at Pearl | | 2014 | | Jun-15 | | University of Texas at Austin | | 12 | | 4,658 |
| | 999 |
| | 141 | | 343 |
| U Club Binghamton | | 2005 | | Jun-15 | | SUNY Binghamton University | | 12 | | 6,069 |
| | 786 |
| | 186 | | 710 |
| Stadium Centre | | 2014 | | Jul-15 | | Florida State University | | 12 | | 8,255 |
| | 853 |
| | 367 | | 710 |
| 160 Ross | | 2015 | | Aug-15 | | Auburn University | | 12 | | 5,410 |
| | 664 |
| | 182 | | 642 |
| The Summit at University City (ACE) | | 2015 | | Sep-15 | | Drexel University | | 12 | | 15,541 |
| | 977 |
| | 351 | | 1,315 |
| 2125 Franklin | | 2015 | | Sep-15 | | University of Oregon | | 12 | | 6,383 |
| | 675 |
| | 192 | | 734 |
| Subtotal - Same Store Owned Properties | | | | $ | 662,801 |
| | $ | 725 |
| | 23,918 | | 73,871 |
| | | | | | | | | | | | | |
| New Owned Properties: | | | | | | | | | | | | |
| 2016 Acquisitions and Completed Development Projects | | | | | | | | | | | | |
| University Crossings - Charlotte | | 2014 | | Aug-16 | | University of North Carolina - Charlotte | | 12 | | $ | 4,627 |
| | $ | 646 |
| | 187 | | 546 |
| The Court - Stadium Centre | | 2016 | | Aug-16 | | Florida State University | | 12 | | 2,682 |
| | 801 |
| | 80 | | 260 |
| U Club on 28th | | 2016 | | Aug-16 | | University of Colorado | | 12 | | 4,966 |
| | 984 |
| | 100 | | 398 |
| Currie Hall (ACE) | | 2016 | | Aug-16 | | University of Southern California | | 12 | | 5,663 |
| | 1,018 |
| | 178 | | 456 |
| University Pointe (ACE) | | 2016 | | Aug-16 | | University of Louisville | | 12 | | 3,689 |
| | 579 |
| | 134 | | 531 |
| Fairview House (ACE) | | 2016 | | Aug-16 | | Butler University | | 10 | | 4,770 |
| | 825 |
| | 107 | | 633 |
| U Club Sunnyside | | 2016 | | Aug-16 | | West Virginia University | | 12 | | 4,014 |
| | 585 |
| | 134 | | 534 |
| Merwick Stanworth Phase II (ACE) | | 2016 | | Sep-16 | | Princeton University | | 12 | | 3,612 |
| | 1,049 |
| | 198 | | 379 |
| U Point | | 2016 | | Oct-16 | | Syracuse University | | 12 | | 1,651 |
| | 966 |
| | 54 | | 163 |
| | | | | | | | | | | | | | | | | |
| 2017 Acquisitions | | | | | | | | | | | | |
| The Arlie | | 2016 | | Apr-17 | | University of Texas Arlington | | 12 | | 3,483 |
| | 659 |
| | 169 | | 598 |
| TWELVE at U District | | 2014 | | Jun-17 | | University of Washington | | 12 | | 4,176 |
| | 1,648 |
| | 283 | | 384 |
| The 515 | | 2015 | | Aug-17 | | University of Oregon | | 12 | | 1,909 |
| | 795 |
| | 183 | | 513 |
| State | | 2013 | | Aug-17 | | Colorado State University | | 12 | | 2,105 |
| | 651 |
| | 220 | | 665 |
The James (8) | | 2017 | | Sep-17 | | University of Wisconsin - Madison | | 12 | | 3,054 |
| | 887 |
| | 366 | | 850 |
| Bridges @ 11th | | 2015 | | Oct-17 | | University of Washington | | 12 | | 1,081 |
| | 1,498 |
| | 184 | | 258 |
Hub U District Seattle (8) | | 2017 | | Nov-17 | | University of Washington | | 12 | | 579 |
| | 1,245 |
| | 111 | | 248 |
| | | | | | | | | | | | | | | | | |
| 2017 Completed Development Projects | | | | | | | | | | | | | | |
| Tooker House (ACE) | | 2017 | | Aug-17 | | Arizona State University | | 10 | | 6,318 |
| | 917 |
| | 429 | | 1,594 |
| Skyview (ACE) | | 2017 | | Aug-17 | | Northern Arizona University | | 12 | | 2,169 |
| | 710 |
| | 163 | | 626 |
| University Square (ACE) | | 2017 | | Aug-17 | | Prairie View A&M University | | 10 | | 1,572 |
| | 747 |
| | 143 | | 466 |
| U Centre on Turner | | 2017 | | Aug-17 | | University of Missouri | | 12 | | 2,709 |
| | 768 |
| | 182 | | 718 |
| U Pointe on Speight | | 2017 | | Aug-17 | | Baylor University | | 12 | | 1,014 |
| | 562 |
| | 180 | | 700 |
| 21Hundred @ Overton Park | | 2017 | | Aug-17 | | Texas Tech University | | 12 | | 2,133 |
| | 551 |
| | 296 | | 1,204 |
| The Suites at 3rd | | 2017 | | Aug-17 | | University of Illinois | | 12 | | 871 |
| | 736 |
| | 63 | | 251 |
| U Club Binghamton Phase II | | 2017 | | Aug-17 | | SUNY Binghamton University | | 12 | | 1,578 |
| | 825 |
| | 140 | | 562 |
| Callaway House Apartments | | 2017 | | Aug-17 | | University of Oklahoma | | 12 | | 2,059 |
| | 681 |
| | 386 | | 915 |
|
| | | | | | | | | | | | | | | | | | | | |
| Property | | Year Built (1) | | Date Acquired/ Developed | | Primary University Served | | Typical Number of Rental Payments/ Year | | Year Ended December 31, 2017 Revenue (2) | | Average Monthly Base Rental Revenue/ Bed (3) | | # of Units | | # of Beds |
| U Centre on College | | 2017 | | Aug-17 | | Clemson University | | 12 | | $ | 1,472 |
| | $ | 719 |
| | 127 | | 418 |
| | | | | | | | | | | | | | | | | |
| Projects Under Development | | | | | | | | | | | | | | |
| David Blackwell Hall (ACE) | | 2018 | | Aug-18 | | University of California, Berkeley | | 10 | | — |
| | n/a |
| | 412 | | 781 |
| Gladding Residence Center (ACE) | | 2018 | | Aug-18 | | Virginia Commonwealth University | | 10 | | — |
| | n/a |
| | 592 | | 1,524 |
| Irvington House (ACE) | | 2018 | | Aug-18 | | Butler University | | 10 | | — |
| | n/a |
| | 197 | | 648 |
| The Edge - Stadium Centre | | 2018 | | Aug-18 | | Florida State University | | 12 | | 19 |
| | n/a |
| | 111 | | 412 |
| Greek Leadership Village (ACE) | | 2018 | | Aug-18 | | Arizona State University | | 10 | | — |
| | n/a |
| | 498 | | 957 |
| NAU Honors College (ACE) | | 2018 | | Aug-18 | | Northern Arizona University | | 10 | | — |
| | n/a |
| | 318 | | 636 |
| U Club Townhomes at Oxford | | 2018 | | Aug-18 | | University of Mississippi | | 12 | | 2 |
| | n/a |
| | 132 | | 528 |
Hub Ann Arbor (9) | | 2018 | | Sep-18 | | University of Michigan | | 12 | | 5 |
| | n/a |
| | 124 | | 310 |
Hub Flagstaff (9) | | 2018 | | Sep-18 | | Northern Arizona University | | 12 | | 31 |
| | n/a |
| | 198 | | 591 |
Hub West Lafayette (9) | | 2018 | | Sep-18 | | Purdue University | | 12 | | 10 |
| | n/a |
| | 289 | | 599 |
| 191 College | | 2019 | | Jul-19 | | Auburn University | | 12 | | — |
| | n/a |
| | 127 | | 495 |
| Columbus Avenue Student Apts. (ACE) | | 2019 | | Aug-19 | | Northeastern University | | 12 | | — |
| | n/a |
| | 214 | | 825 |
| University of Arizona Honors College (ACE) | | 2019 | | Aug-19 | | University of Arizona | | 10 | | — |
| | n/a |
| | 319 | | 1,056 |
| Subtotal – New Owned Properties | | | | $ | 74,023 |
| | $ | 796 |
| | 8,328 | | 24,232 |
| | | | | | | | | | | |
| Owned Property in Receivership | | | | | | | | | | |
Blanton Common (10) | | 2005 | | Sep-10 | | Valdosta State University | | 12 | | $ | 3,459 |
| | $ | 371 |
| | 276 | | 860 |
| TOTAL – OWNED PROPERTIES | | | | $ | 740,283 |
| (11) | $ | 731 |
| | 32,522 | | 98,963 |
| | | | | | | | | | | | | |
| ON-CAMPUS PARTICIPATING PROPERTIES | | | | | | |
| | |
| | | | |
| University Village – PVAMU | | 1997 | | Aug-96 | | Prairie View A&M University | | 9 | | $ | 11,545 |
| | $ | 627 |
| | 612 | | 1,920 |
| University Village - TAMIU | | 1997 | | Aug-97 | | Texas A&M International University | | 9 | | 1,454 |
| | 648 |
| | 84 | | 250 |
| University College - PVAMU | | 2001 | | Aug-00 | | Prairie View A&M University | | 9 | | 8,925 |
| | 631 |
| | 756 | | 1,470 |
| Cullen Oaks Phase I and II | | 2003 | | Aug-01 | | The University of Houston | | 9 | | 7,827 |
| | 913 |
| | 411 | | 879 |
| College Park | | 2014 | | Aug-14 | | West Virginia University | | 12 | | 4,194 |
| | 641 |
| | 224 | | 567 |
| TOTAL - ON-CAMPUS PARTICIPATING PROPERTIES | | | | | | $ | 33,945 |
| | $ | 729 |
| | 2,087 | | 5,086 |
| GRAND TOTAL- ALL PROPERTIES | | | | | | $ | 774,228 |
| | $ | 730 |
| | 34,609 | | 104,049 |
| |
(1) | For properties with multiple phases, the year built represents the weighted average year based on the number of beds delivered each year. |
| |
(2) | Includes base rental revenue and other income, which includes, but is not limited to, utility income, damages, parking income, summer conference rent, application fees, income from retail tenants, etc. |
| |
(3) | Average monthly revenue per bed is calculated based upon our base rental revenue earned during the year ended December 31, 2017 divided by average monthly occupied beds over the lease term. |
| |
(4) | Our same store owned portfolio represents properties that were owned or operated by us for the full years ended December 31, 2016 and 2017, which are not conducting or planning to conduct substantial development, redevelopment or repositioning activities, and are not classified as held for sale as of December 31, 2017. |
| |
(5) | As rent at this property includes food services, revenue is not comparable to the other properties in this table. |
| |
(6) | Consists of two phases that are counted separately in the property portfolio numbers contained in Note 1 in the accompanying Notes to Consolidated Financial Statements contained in Item 8. |
| |
(7) | Consists of three phases that are counted separately in the property portfolio numbers contained in Note 1 in the accompanying Notes to Consolidated Financial Statements contained in Item 8. |
| |
(8) | As part of the Core Transaction, the Company purchased partial ownership in two operating properties through a joint venture arrangement. See Note 5 in the accompanying Notes to Consolidated Financial Statements contained in Item 8. |
| |
(9) | As part of the Core Transaction, the Company purchased partial ownership in three in-process development properties through a joint venture arrangement. See Note 5 in the accompanying Notes to Consolidated Financial Statements contained in Item 8. |
| |
(10) | This property is currently in receivership and is in the process of being transferred to the lender in settlement of the property’s $27.4 million mortgage loan that matured in August 2017. See Note 10 in the accompanying Notes to Consolidated Financial Statements contained in Item 8. |
| |
(11) | Does not include revenues from properties disposed of during the year ended December 31, 2017. |
Occupancy information for our property portfolio for the year ended and as of December 31, 2017 is set forth below:
|
| | | | |
| | | 2017 Average Occupancy (1) | | Occupancy as of December 31, 2017 |
| OWNED PROPERTIES | | | | |
Same-store Properties (2) | | 94.4% | | 96.7% |
| New Properties | | 89.2% | | 90.5% |
| TOTAL – OWNED PROPERTIES | | 93.9% | | 95.7% |
| | | | | |
| ON-CAMPUS PARTICIPATING PROPERTIES | | 76.0% | | 98.3% |
| |
(1) | Average occupancy is calculated based on the average number of occupied beds for the year ended December 31, 2017 divided by total beds. For properties with typical lease terms shorter than 12 months, average occupancy includes the impact of significantly low occupancy during the summer months. Average occupancy for acquired properties and properties which commenced operations during 2017 is calculated based on the period these properties were owned by us and/or operational during 2017. |
| |
(2) | Our same store owned portfolio represents properties that were owned or operated by us for the full years ended December 31, 2016 and 2017, which are not conducting or planning to conduct substantial development, redevelopment or repositioning activities, and are not classified as held for sale as of December 31, 2017. |
Item 3. Legal Proceedings
We are subject to various claims, lawsuits and legal proceedings that have not been fully resolved and that have arisen in the ordinary course of business. While it is not possible to ascertain the ultimate outcome of such matters, management believes that the aggregate amount of such liabilities, if any, in excess of amounts provided or covered by insurance, will not have a material adverse effect on our consolidated financial position or results of operations. However, the outcome of claims, lawsuits and legal proceedings brought against us are subject to significant uncertainty. Therefore, although management considers the likelihood of such an outcome to be remote, the ultimate results of these matters cannot be predicted with certainty.
Item 4. Mine Safety Disclosures
Not applicable.
PART II
Item 5. Market for the Registrant’s Common Equity and Related Stockholder Matters
Market Information
The Company’s common stock has been listed and is traded on the New York Stock Exchange (“NYSE”) under the symbol “ACC”. The following table sets forth, for the periods indicated, the high and low sale prices in dollars on the NYSE for our common stock and the distributions we declared with respect to the periods indicated.
|
| | | | | | | | | | | | |
| | | High | | Low | | Distributions
Declared |
| Quarter ended March 31, 2016 | | $ | 47.18 |
| | $ | 38.63 |
| | $ | 0.4000 |
|
| Quarter ended June 30, 2016 | | $ | 52.87 |
| | $ | 43.66 |
| | $ | 0.4200 |
|
| Quarter ended September 30, 2016 | | $ | 54.56 |
| | $ | 47.24 |
| | $ | 0.4200 |
|
| Quarter ended December 31, 2016 | | $ | 52.53 |
| | $ | 44.65 |
| | $ | 0.4200 |
|
| Quarter ended March 31, 2017 | | $ | 51.70 |
| | $ | 45.36 |
| | $ | 0.4200 |
|
| Quarter ended June 30, 2017 | | $ | 49.93 |
| | $ | 44.72 |
| | $ | 0.4400 |
|
| Quarter ended September 30, 2017 | | $ | 49.26 |
| | $ | 43.98 |
| | $ | 0.4400 |
|
| Quarter ended December 31, 2017 | | $ | 45.50 |
| | $ | 40.07 |
| | $ | 0.4400 |
|
Holders
As of February 23, 2018, there were approximately 40,200 holders of record of the Company’s common stock and 136,494,954 shares of common stock outstanding.
Distributions
We intend to continue to declare quarterly distributions on our common stock. The actual amount, timing and form of payment of distributions, however, will be at the discretion of our Board of Directors and will depend upon our financial condition in addition to the requirements of the Code, and no assurance can be given as to the amounts, timing or form of payment of future distributions.
See Part III, Item 12, for a description of securities authorized for issuance under equity compensation plans.
Item 6. Selected Financial Data
The following table sets forth selected financial and operating data on a consolidated historical basis for the Company.
The following data should be read in conjunction with the Notes to Consolidated Financial Statements in Item 8 and Management’s Discussion and Analysis of Financial Condition and Results of Operations included in Item 7.
|
| | | | | | | | | | | | | | | | | | | |
| | As of and for the Year Ended December 31, |
| | 2017 | | 2016 | | 2015 | | 2014 | | 2013 |
| Statements of Comprehensive Income Information: | | | | | | | | | |
Owned property revenue (1) | $ | 741,909 |
| | $ | 738,598 |
| | $ | 708,018 |
| | $ | 693,694 |
| | $ | 621,117 |
|
| Owned property operating expenses | 332,429 |
| | 337,296 |
| | 331,836 |
| | 329,615 |
| | 296,794 |
|
| On-campus participating property revenue | 33,945 |
| | 33,433 |
| | 31,586 |
| | 28,534 |
| | 26,348 |
|
| On-campus participating property operating expenses | 14,384 |
| | 13,447 |
| | 12,437 |
| | 11,290 |
| | 11,049 |
|
| Third-party development and management services revenues | 20,593 |
| | 14,330 |
| | 13,777 |
| | 11,687 |
| | 9,997 |
|
| Third-party development and management services expenses | 15,225 |
| | 14,533 |
| | 14,346 |
| | 12,008 |
| | 10,935 |
|
Total other operating expenses (2) | 291,871 |
| | 247,942 |
| | 237,858 |
| | 226,016 |
| | 206,931 |
|
| Income from continuing operations | 70,121 |
| | 100,623 |
| | 118,061 |
| | 61,384 |
| | 47,436 |
|
| Income from discontinued operations | — |
| | — |
| | — |
| | 2,720 |
| | 59,755 |
|
| Net income | 70,121 |
| | 100,623 |
| | 118,061 |
| | 64,104 |
| | 107,191 |
|
| Net income attributable to noncontrolling interests | (1,083 | ) | | (1,562 | ) | | (2,070 | ) | | (1,265 | ) | | (2,547 | ) |
Net income attributable to ACC, Inc. and
Subsidiaries common stockholders | 69,038 |
| | 99,061 |
| | 115,991 |
| | 62,839 |
| | 104,644 |
|
| Per Share and Distribution Data: | | | |
| | |
| | |
| | |
|
| Earnings per share: | | | |
| | |
| | |
| | |
|
| Income from continuing operations - Basic | $ | 0.50 |
| | $ | 0.76 |
| | $ | 1.03 |
| | $ | 0.56 |
| | $ | 0.43 |
|
| Income from continuing operations - Diluted | 0.50 |
| | 0.75 |
| | 1.02 |
| | 0.56 |
| | 0.42 |
|
| Net income - Basic | 0.50 |
| | 0.76 |
| | 1.03 |
| | 0.59 |
| | 0.99 |
|
| Net income - Diluted | 0.50 |
| | 0.75 |
| | 1.02 |
| | 0.58 |
| | 0.98 |
|
| Cash distributions declared per common share / unit | 1.74 |
| | 1.66 |
| | 1.58 |
| | 1.50 |
| | 1.42 |
|
| Cash distributions declared | 236,545 |
| | 218,697 |
| | 178,506 |
| | 158,487 |
| | 149,461 |
|
| Balance Sheet Data: | | | |
| | |
| | |
| | |
|
| Total assets | $ | 6,897,370 |
| | $ | 5,865,913 |
| | $ | 6,006,248 |
| | $ | 5,816,044 |
| | $ | 5,816,743 |
|
| Secured mortgage, construction and bond debt | 664,020 |
| | 688,195 |
| | 1,094,962 |
| | 1,324,783 |
| | 1,323,071 |
|
| Term loans and revolving credit facilities | 774,644 |
| | 248,365 |
| | 666,619 |
| | 838,733 |
| | 837,247 |
|
| Unsecured notes | 1,585,855 |
| | 1,188,737 |
| | 1,186,700 |
| | 790,499 |
| | 794,396 |
|
| Stockholders’ equity | 3,484,985 |
| | 3,444,985 |
| | 2,770,196 |
| | 2,609,554 |
| | 2,624,901 |
|
| Other Data: | | | | | | | | | |
| Cash flows provided by (used in): | | | | | | | | | |
| Operating activities | $ | 319,954 |
| | $ | 308,089 |
| | $ | 263,786 |
| | $ | 262,243 |
| | $ | 249,749 |
|
| Investing activities | (977,799 | ) | | (31,556 | ) | | (239,455 | ) | | (429,235 | ) | | (509,999 | ) |
| Financing activities | 676,887 |
| | (271,052 | ) | | (32,734 | ) | | 153,303 |
| | 277,547 |
|
Funds from operations (“FFO”) (3) | 317,358 |
| | 292,597 |
| | 271,381 |
| | 259,230 |
| | 236,777 |
|
Funds from operations - modified (“FFOM”) (3) | 316,434 |
| | 297,694 |
| | 269,259 |
| | 255,071 |
| | 236,643 |
|
| Property Data: | | | |
| | |
| | |
| | |
|
| Owned properties | 169 |
| | 154 |
| | 162 |
| | 169 |
| | 167 |
|
| Beds | 104,049 |
| | 95,193 |
| | 99,388 |
| | 103,661 |
| | 102,400 |
|
| Total owned properties occupancy at December 31, | 95.7 | % | | 97.2 | % | | 97.3 | % | | 97.7 | % | | 96.8 | % |
| |
(1) | Includes revenues that are reflected as resident services revenue on the accompanying Consolidated Statements of Comprehensive Income in Item 8. |
| |
(2) | Includes general and administrative expenses, depreciation and amortization expense, ground and facility lease expense, and provision for real estate impairment. See the accompanying Consolidated Statements of Comprehensive Income in Item 8. |
| |
(3) | Management considers Funds from Operations (“FFO”) and Funds from Operations - Modified (“FFOM”) to be appropriate measures of the financial performance of an equity REIT. See “Funds from Operations and Adjusted FFO” in Item 7 “Management’s Discussion and Analysis of Financial Condition and Results of Operations” for reconciliations of net income attributable to common shareholders to FFO and FFOM. |
Item 7. Management’s Discussion and Analysis of Financial Condition and Results of Operations
Our Company and Our Business
Overview
We are one of the largest owners, managers and developers of high quality student housing properties in the United States in terms of beds owned and under management. We are a fully integrated, self-managed and self-administered equity REIT with expertise in the acquisition, design, financing, development, construction management, leasing and management of student housing properties. Refer to Item 1 contained herein for additional information regarding our business objectives, investment strategies, and operating segments.
Property Portfolio
Below is a summary of our property portfolio as of December 31, 2017:
|
| | | | | | |
| Property portfolio: | | Properties | | Beds |
| Owned operating properties: | | | | |
| Off-campus properties | | 126 |
| | 70,754 |
|
On-campus ACE (1) | | 25 |
| | 18,847 |
|
| Subtotal – operating properties | | 151 |
| | 89,601 |
|
| | | | | |
| Owned properties under development: | | |
| | |
|
| Off-campus properties | | 6 |
| | 2,935 |
|
On-campus ACE | | 7 |
| | 6,427 |
|
| Subtotal – properties under development | | 13 |
| | 9,362 |
|
| | | | | |
| Total owned properties | | 164 |
| | 98,963 |
|
| | | | | |
| On-campus participating properties | | 5 |
| | 5,086 |
|
| | | | | |
| Total owned property portfolio | | 169 |
| | 104,049 |
|
| | | | | |
| Managed properties | | 37 |
| | 30,035 |
|
| Total property portfolio | | 206 |
| | 134,084 |
|
| | | | | |
| |
(1) | Includes three properties at Prairie View A&M University that we ultimately expect to be refinanced under the existing on-campus participating structure. |
We believe that the ownership and operation of student housing communities in close proximity to selected colleges and universities presents an attractive long-term investment opportunity for our investors. We intend to continue to execute our strategy of identifying existing differentiated, typically highly amenitized, student housing communities or development opportunities in close proximity to university campuses with high barriers to entry which are projected to experience substantial increases in enrollment and/or are under-serviced in terms of existing on and/or off-campus student housing.
Leasing Results
Our financial results for the 2017 calendar year are significantly impacted by the results of our annual leasing process for both the 2016/2017 academic year and the 2017/2018 academic year. As of September 30, 2016, the beginning of the 2016/2017 academic year, occupancy at our 2017 same store properties was 97.4% at a rental rate increase of 3.5% compared to the prior academic year, and occupancy at our total owned property portfolio (including 2016 acquisitions and development deliveries) was 97.1%. As of September 30, 2017, the beginning of the 2017/2018 academic year, occupancy at our 2018 same store properties was 96.6% at a rental rate increase of 2.9% compared to the prior academic year, and occupancy at our total owned property portfolio (including 2017 acquisitions and development deliveries) was 95.5%. Our 2017 same store property portfolio consists of properties owned and operating for both of the entire years ended December 31, 2016 and 2017, which are not conducting or planning to conduct substantial development, redevelopment, or repositioning activities, and are not classified as held for sale. Similarly, our 2018 same store property portfolio consists of properties owned and operating for both of the entire years ended December 31, 2017 and 2018, which are not conducting or planning to conduct substantial development, redevelopment, or repositioning activities, and are not classified as held for sale.
Third-Party Development and Management Services
We provide development and construction management services for student housing properties owned by universities, 501(c) 3 foundations and others. Our clients have included some of the nation’s most prominent systems of higher education. We develop student housing properties for these clients and we are sometimes retained to manage these properties following their opening. As of December 31, 2017, we were under contract on three third-party development projects that are currently under construction and whose fees total $13.4 million. As of December 31, 2017, fees of approximately $6.5 million remained to be earned by the Company with respect to these projects, which have scheduled completion dates in July and August 2019.
As of December 31, 2017, we also provided third-party management and leasing services for 37 properties that represented approximately 30,000 beds. Our third-party management and leasing services are typically provided pursuant to management contracts that have initial terms that range from one to five years.
While fee revenue from our third-party development, construction management and property management services allows us to develop strong and key relationships with colleges and universities, this area has over time become a smaller portion of our operations due to the continued focus on and growth of our owned property portfolio. Nevertheless, we believe these services continue to provide synergies with respect to our ability to identify, close, and successfully operate student housing properties.
Critical Accounting Policies
The preparation of financial statements in conformity with accounting principles generally accepted in the United States (“GAAP”) requires management to make estimates and assumptions in certain circumstances that affect amounts reported in our consolidated financial statements and related notes. In preparing these financial statements, management has utilized all available information, including its past history, industry standards and the current economic environment, among other factors, in forming its estimates and judgments of certain amounts included in the consolidated financial statements, giving due consideration to materiality. It is possible that the ultimate outcome anticipated by management in formulating its estimates may not be realized. Application of the critical accounting policies below involves the exercise of judgment and use of assumptions as to future uncertainties and, as a result, actual results could differ from these estimates. In addition, other companies in similar businesses may utilize different estimation policies and methodologies, which may impact the comparability of our results of operations and financial condition to those companies.
Revenue and Cost Recognition of Third-Party Development and Management Services
Development revenues are generally recognized based on a proportional performance method based on contract deliverables, while construction revenues are recognized using the percentage of completion method, as determined by construction costs incurred relative to total estimated construction costs. For projects where our fee is based on a fixed price, any cost overruns incurred during construction, as compared to the original budget, will reduce the net fee generated on those projects. Incentive fees are generally recognized when the project is complete and performance has been agreed upon by all parties, or when performance has been verified by an independent third-party.
We also evaluate the collectability of fee income and expense reimbursements generated through the provision of development and construction management services based upon the individual facts and circumstances, including the contractual right to receive such amounts in accordance with the terms of the various projects, and reserve any amounts that are deemed to be uncollectible.
Pre-development expenditures such as architectural fees, permits and deposits associated with the pursuit of third-party and owned development projects are expensed as incurred, until such time that management believes it is probable that the contract will be executed and/or construction will commence. Because we frequently incur these pre-development expenditures before a financing commitment and/or required permits and authorizations have been obtained, we bear the risk of loss of these pre-development expenditures if financing cannot ultimately be arranged on acceptable terms or we are unable to successfully obtain the required permits and authorizations. As such, management evaluates the status of third-party and owned projects that have not yet commenced construction on a periodic basis and expenses any deferred costs related to projects whose current status indicates the commencement of construction is unlikely and/or the costs may not provide future value to us in the form of revenues. Such write-offs are included in third-party development and management services expenses (in the case of third-party development projects) or general and administrative expenses (in the case of owned development projects) on the accompanying consolidated statements of comprehensive income.
Third-party management fees are generally received and recognized on a monthly basis and are computed as a percentage of property receipts, revenues or a fixed monthly amount, in accordance with the applicable management contract. Incentive management fees are recognized when the contractual criteria have been met.
As discussed in Note 2 in the accompanying Notes to the Consolidated Financial Statements contained in Item 8 herein, the adoption of Accounting Standard Update 2014-09 will change the methodology by which we recognize third-party development and management services revenue; however we do not expect such changes to have a material effect on our consolidated financial statements.
Student Housing Rental Revenue Recognition and Accounts Receivable
Student housing rental revenue is recognized on a straight-line basis over the term of the contract. Ancillary and other property related income is recognized in the period earned. In estimating the collectability of our accounts receivable, we analyze the aging of resident receivables, historical bad debts, and current economic trends. These estimates have a direct impact on our net income, as an increase in our allowance for doubtful accounts reduces our net income.
Allocation of Fair Value to Acquired Properties
The price that we pay to acquire a property is impacted by many factors, including the condition of the buildings and improvements, the occupancy of the building, favorable or unfavorable financing, and numerous other factors. Accordingly, we are required to make subjective assessments to allocate the purchase price paid to acquire investments in real estate among the assets acquired and liabilities assumed based on our estimate of the fair values of such assets and liabilities. This includes, among other items, determining the value of the buildings and improvements, land, in-place tenant leases, tax incentive arrangements, and any debt assumed from the seller. Each of these estimates requires a great deal of judgment and some of the estimates involve complex calculations. Our calculation methodology is summarized in Note 2 to our consolidated financial statements contained in Item 8. These allocation assessments have a direct impact on our results of operations because if we were to allocate more value to land there would be no depreciation with respect to such amount or if we were to allocate more value to the buildings as opposed to allocating to the value of in-place tenant leases, this amount would be recognized as an expense over a much longer period of time, since the amounts allocated to buildings are depreciated over the estimated lives of the buildings whereas amounts allocated to in-place tenant leases are amortized over the remaining terms of the leases (generally less than one year).
Impairment of Long-Lived Assets
On a periodic basis, management assesses whether there are any indicators that the value of our real estate properties may be impaired. A property’s value is considered impaired if management’s estimate of the aggregate future undiscounted cash flows to be generated by the property is less than the carrying value of the property. These estimates of cash flows consider factors such as expected future operating income, trends and prospects, as well as the effects of demand, competition and other factors. To the extent impairment has occurred, the loss will be measured as the excess of the carrying amount of the property over the fair value of the property, thereby reducing our net income. Management also performs a periodic assessment to determine which of our properties are likely to be sold prior to the end of their estimated useful lives. For those probable sales, an impairment charge is recorded for any excess of the carrying amount of the property over the estimated fair value less estimated selling costs, thereby reducing our net income.
Capital Expenditures
We distinguish between capital expenditures necessary for the ongoing operations of our properties and acquisition-related improvements incurred within one to two years of acquisition of the related property. (Acquisition-related improvements are expenditures that have been identified at the time the property is acquired, and which we intended to incur in order to position the property to be consistent with our physical standards). We capitalize non-recurring expenditures for additions and betterments to buildings and land improvements. In addition, we generally capitalize expenditures for exterior painting, roofing, and other major maintenance projects that substantially extend the useful life of the existing assets. The cost of ordinary repairs and maintenance that do not improve the value of an asset or extend its useful life are charged to expense when incurred. Planned major repair, maintenance and improvement projects are capitalized when performed. In some circumstances, lenders require us to maintain a reserve account for future repairs and capital expenditures. These amounts are classified as restricted cash on the accompanying consolidated balance sheets, as the funds are not available to us for current use.
For our properties under development, capitalized interest is generally based on the weighted average interest rate of our total debt. Upon substantial completion of the properties, cost capitalization ceases. The total capitalized development costs are then transferred to the applicable asset category and depreciation commences. These estimates used by management require judgment, and accordingly we believe cost capitalization to be a critical accounting estimate.
Results of Operations
Comparison of the Years Ended December 31, 2017 and 2016
The following table presents our results of operations for the years ended December 31, 2017 and 2016, including the amount and percentage change in these results between the two periods.
|
| | | | | | | | | | | | | | | |
| | | Year Ended December 31, | | | | |
| | | 2017 | | 2016 | | Change ($) | | Change (%) |
| Revenues: | | | | | | | | |
| Owned properties | | $ | 738,710 |
| | $ | 735,392 |
| | $ | 3,318 |
| | 0.5 | % |
| On-campus participating properties | | 33,945 |
| | 33,433 |
| | 512 |
| | 1.5 | % |
| Third-party development services | | 10,761 |
| | 4,606 |
| | 6,155 |
| | 133.6 | % |
| Third-party management services | | 9,832 |
| | 9,724 |
| | 108 |
| | 1.1 | % |
| Resident services | | 3,199 |
| | 3,206 |
| | (7 | ) | | (0.2 | )% |
| Total revenues | | 796,447 |
| | 786,361 |
| | 10,086 |
| | 1.3 | % |
| | | | | | | | | |
| Operating expenses: | | |
| | |
| | |
| | |
|
| Owned properties | | 332,429 |
| | 337,296 |
| | (4,867 | ) | | (1.4 | )% |
| On-campus participating properties | | 14,384 |
| | 13,447 |
| | 937 |
| | 7.0 | % |
| Third-party development and management services | | 15,225 |
| | 14,533 |
| | 692 |
| | 4.8 | % |
| General and administrative | | 31,386 |
| | 22,493 |
| | 8,893 |
| | 39.5 | % |
| Depreciation and amortization | | 234,955 |
| | 211,387 |
| | 23,568 |
| | 11.1 | % |
| Ground/facility leases | | 10,213 |
| | 9,167 |
| | 1,046 |
| | 11.4 | % |
| Provision for real estate impairment | | 15,317 |
| | 4,895 |
| | 10,422 |
| | 212.9 | % |
| Total operating expenses | | 653,909 |
| | 613,218 |
| | 40,691 |
| | 6.6 | % |
| | | | | | | | | |
| Operating income | | 142,538 |
| | 173,143 |
| | (30,605 | ) | | (17.7 | )% |
| | | | | | | | | |
| Nonoperating income and (expenses): | | |
| | |
| | |
| | |
|
| Interest income | | 4,945 |
| | 5,481 |
| | (536 | ) | | (9.8 | )% |
| Interest expense | | (71,122 | ) | | (78,687 | ) | | 7,565 |
| | (9.6 | )% |
| Amortization of deferred financing costs | | (4,619 | ) | | (6,520 | ) | | 1,901 |
| | (29.2 | )% |
| (Loss) gain from disposition of real estate | | (632 | ) | | 21,197 |
| | (21,829 | ) | | (103.0 | )% |
| Loss from early extinguishment of debt | | — |
| | (12,841 | ) | | 12,841 |
| | (100.0 | )% |
| Total nonoperating expenses | | (71,428 | ) | | (71,370 | ) | | (58 | ) | | 0.1 | % |
| | | | | | | | | |
| Income before income taxes | | 71,110 |
| | 101,773 |
| | (30,663 | ) | | (30.1 | )% |
| Income tax provision | | (989 | ) | | (1,150 | ) | | 161 |
| | (14.0 | )% |
| Net income | | 70,121 |
| | 100,623 |
| | (30,502 | ) | | (30.3 | )% |
| | | | | | | | | |
| Net income attributable to noncontrolling interests | | (1,083 | ) | | (1,562 | ) | | 479 |
| | (30.7 | )% |
Net income attributable to ACC, Inc. and Subsidiaries common stockholders | | $ | 69,038 |
| | $ | 99,061 |
| | $ | (30,023 | ) | | (30.3 | )% |
Same Store and New Property Operations
We define our same store property portfolio as owned properties that were owned and operating for both of the full years ended December 31, 2017 and December 31, 2016, which are not conducting or planning to conduct substantial development, redevelopment, or repositioning activities, and are not classified as held for sale as of December 31, 2017.
Same store revenues are defined as revenues generated from our same store portfolio and consist of rental revenue earned from student leases as well as other income items such as utility income, damages, parking income, summer conference rent, application and administration fees, income from retail tenants, and income earned by one of our taxable REIT subsidiaries (“TRS”) from ancillary activities such as the provision of food services.
Same store operating expenses are defined as operating expenses generated from our same store portfolio and include usual and customary expenses incurred to operate a property such as payroll, maintenance, utilities, marketing, general and administrative costs, insurance, property taxes, and bad debt. Same store operating expenses also include an allocation of payroll and other administrative costs related to corporate management and oversight.
A reconciliation of our same store, new property, and sold/held for sale property operations to our consolidated statements of comprehensive income is set forth below:
|
| | | | | | | | | | | | | | | | | | | | | | | | | | | | | | | | |
| | | Same Store Properties | | New Properties | | Sold/Held for Sale Properties (1) | | Total - All Properties |
| | | Year Ended December 31, | | Year Ended December 31, | | Year Ended December 31, | | Year Ended December 31, |
| | | 2017 | | 2016 | | 2017 | | 2016 | | 2017 (2) | | 2016 (3) | | 2017 | | 2016 |
Number of properties (4) | | 124 |
| | 124 |
| | 26 |
| | 9 |
| | 2 |
| | 24 |
| | 152 |
| (5) | 157 |
|
Number of beds (4) | | 73,871 |
| | 73,871 |
| | 14,870 |
| | 3,900 |
| | 1,517 |
| | 14,924 |
| | 90,258 |
| | 92,695 |
|
| | | | | | | | | | | | | | | | | |
Revenues (6) | | $ | 662,801 |
| | $ | 648,070 |
| | $ | 74,345 |
| | $ | 13,271 |
| | $ | 4,763 |
| | $ | 77,257 |
| | $ | 741,909 |
| | $ | 738,598 |
|
| Operating expenses | | 297,633 |
| | 291,642 |
| | 31,998 |
| | 5,652 |
| | 2,798 |
| | 40,002 |
| | 332,429 |
| | 337,296 |
|
| |
(1) | Does not include the allocation of payroll and other administrative costs related to corporate management and oversight. |
| |
(2) | Includes one property that was sold in April 2017 and one property currently in receivership that is in the process of being transferred to the lender in settlement of the property’s $27.4 million mortgage loan that matured in August 2017. |
| |
(3) | Includes properties sold in 2016 and 2017, and one property that is in the process of being transferred to the lender as discussed above. |
| |
(4) | Does not include properties under construction or undergoing redevelopment. |
| |
(5) | Difference from total operating property portfolio represents one property that was sold during the second quarter 2017. |
| |
(6) | Includes revenues which are reflected as resident services revenue on the accompanying Consolidated Statements of Comprehensive Income. |
Same Store Properties: The increase in revenue from our same store properties was primarily due to an increase in average rental rates for the 2016/2017 and 2017/2018 academic years, partially offset by a slight decrease in our weighted average occupancy from 94.8% during the year ended December 31, 2016, to 94.4% for the year ended December 31, 2017. Future revenues will be dependent on our ability to maintain our current leases in effect for the 2017/2018 academic year and our ability to obtain appropriate rental rates and desired occupancy for the 2018/2019 academic year at our various properties.
The increase in operating expenses from our same store properties was primarily due to: (i) an increase in repairs and maintenance expense of approximately $2.0 million related to cleanup and repairs for water intrusion, roofing, and landscaping at the Company’s communities located in Florida and Texas, as a result of hurricanes Harvey and Irma; (ii) an increase in property taxes and related consulting fees due to increased property tax assessments in various markets as well as increases related to 2015 development deliveries caused primarily by the stabilization of property tax assessments in the second year of operations; (iii) additional marketing expenses incurred due to our efforts to achieve our leasing targets; and (iv) other general inflationary factors. We anticipate that operating expenses for our same store property portfolio for 2018 will increase as compared to 2017 as a result of increases in property taxes, insurance and general inflation.
New Property Operations: Our new properties for the year ended December 31, 2017 are summarized in the table below:
|
| | | | | | | | |
| Property | | Location | | Primary University Served | | Beds | | Acquisition/Opening Date |
| Acquisitions: | | | | | | | | |
| University Crossings | | Charlotte, NC | | University of North Carolina | | 546 | | August 2016 |
| U Point | | Syracuse, NY | | Syracuse University | | 163 | | October 2016 |
| The Arlie | | Arlington, TX | | University of Texas at Arlington | | 598 | | April 2017 |
| TWELVE at U District | | Seattle, WA | | University of Washington | | 384 | | June 2017 |
| The 515 | | Eugene, OR | | University of Oregon | | 513 | | August 2017 |
| State | | Fort Collins, CO | | Colorado State University | | 665 | | August 2017 |
The James (1) | | Madison, WI | | University of Wisconsin - Madison | | 850 | | September 2017 |
| Bridges @ 11th | | Seattle, WA | | University of Washington | | 258 | | October 2017 |
Hub U District Seattle (1) | | Seattle, WA | | University of Washington | | 248 | | November 2017 |
| | | | | SUBTOTAL - Acquisitions | | 4,225 | | |
| Owned Developments: | | | | | | | | |
| Currie Hall | | Los Angeles, CA | | University of Southern California | | 456 | | August 2016 |
| Fairview House | | Indianapolis, IN | | Butler University | | 633 | | August 2016 |
| University Pointe | | Louisville, KY | | University of Louisville | | 531 | | August 2016 |
| U Club on 28th | | Boulder, CO | | University of Colorado | | 398 | | August 2016 |
| U Club Sunnyside | | Morgantown, WV | | West Virginia University | | 534 | | August 2016 |
| The Court at Stadium Centre | | Tallahassee, FL | | Florida State University | | 260 | | August 2016 |
| Merwick Stanworth Phase II | | Princeton, NJ | | Princeton University | | 379 | | September 2016 |
| Tooker House | | Tempe, AZ | | Arizona State University | | 1,594 | | August 2017 |
| Sky View | | Flagstaff, AZ | | Northern Arizona University | | 626 | | August 2017 |
| University Square | | Prairie View, TX | | Prairie View A&M University | | 466 | | August 2017 |
| U Centre on Turner | | Columbia, MO | | University of Missouri | | 718 | | August 2017 |
| U Pointe on Speight | | Waco, TX | | Baylor University | | 700 | | August 2017 |
| 21Hundred @ Overton Park | | Lubbock, TX | | Texas Tech University | | 1,204 | | August 2017 |
| Suites at 3rd | | Champaign, IL | | University of Illinois | | 251 | | August 2017 |
| U Club Binghamton Phase II | | Binghamton, NY | | SUNY Binghamton University | | 562 | | August 2017 |
| Callaway House Apartments | | Norman, OK | | University of Oklahoma | | 915 | | August 2017 |
| U Centre on College | | Clemson, SC | | Clemson University | | 418 | | August 2017 |
| | | | | SUBTOTAL - Owned Developments | | 10,645 | | |
| | | | | Total - New Properties | | 14,870 | | |
| |
(1) | The James and Hub U District Seattle are properties held by a joint venture formed as part of the Core Transaction. Refer to Note 5 in the accompanying Notes to the Consolidated Financial Statements contained in Item 8. |
On-Campus Participating Properties (“OCPP”) Operations
Same Store OCPP Properties: We had five on-campus participating properties containing 5,086 beds which were operating during each of the years ended December 31, 2017 and 2016. Revenues from these properties increased by $0.5 million, from $33.4 million for the year ended December 31, 2016, to $33.9 million for the year ended December 31, 2017. This increase was primarily due to an increase in average rental rates partially offset by a decrease in average occupancy from 76.6% for the year ended December 31, 2016, to 76.0% for the year ended December 31, 2017. Operating expenses at these properties increased by $1.0 million, from $13.4 million for the year ended December 31, 2016, to $14.4 million for the year ended December 31, 2017, primarily due to (i) an increase in payroll costs due to recently filled staff positions, which were previously vacant; (ii) increased maintenance costs related to the annual turn process; (iii) an increase in utilities expense; and (iv) increases in general and administrative costs. Future revenues will be dependent on our ability to maintain our current leases in effect for the 2017/2018 academic year and our ability to obtain appropriate rental rates and desired occupancy for the 2018/2019 academic year. We anticipate that operating expenses for our On-Campus Participating properties for 2018 will increase slightly as compared to 2017 as a result of general inflation.
Third-Party Development Services Revenue
Third-party development services revenue increased by approximately $6.2 million, from $4.6 million during the year ended December 31, 2016, to $10.8 million for the year ended December 31, 2017. This increase was due to: (i) the closing of bond financing and commencement of construction of a fourth phase at the University of California, Irvine in the third quarter of 2017, the closing of bond financing and the commencement of construction of the University of Illinois - Chicago project in the fourth quarter of 2017, and the commencement of construction of the University of Arizona Honors College in the fourth quarter of 2017, all of which contributed a total of $6.9 million of revenue during the year ended December 31, 2017; and (ii) the performance of advisory services related to a not-for-profit entity’s purchase of an apartment community for the benefit of Texas A&M University - Corpus Christi, for which the Company earned a $1.4 million fee in 2017. These increases were partially offset by: (i) the closing of bond financing and commencement of construction of two development projects with the Texas A&M University System at their Corpus Christi and San Antonio campuses during the year ended December 31, 2016, both of which contributed $2.3 million of revenue during the year ended December 31, 2016, versus $1.1 million in 2017; and (ii) the performance of various predevelopment activities for the University of Kansas during the year ended December 31, 2016, for which the Company earned a $0.5 million fee. During the year ended December 31, 2017, we had five projects in progress with an average contractual fee of approximately $3.4 million, as compared to the year ended December 31, 2016, in which we had four projects in progress with an average contractual fee of approximately $1.8 million.
Development services revenues are dependent on our ability to successfully be awarded such projects, the amount of the contractual fee related to the project and the timing and completion of the development and construction of the project. In addition, to the extent projects are completed under budget, we may be entitled to a portion of such savings, which are recognized as revenue when performance has been agreed upon by all parties, or when performance has been verified by an independent third-party. It is possible that projects for which we have deferred pre-development costs will not close and that we will not be reimbursed for such costs. The pre-development costs associated therewith will ordinarily be charged against income for the then-current period. We anticipate third-party development services revenue to decrease in 2018 as compared to 2017 due to a decrease in the volume and timing of third-party development projects anticipated to close and commence construction in 2018.
Third-Party Development and Management Services Expenses
Third-party development and management services expenses increased by approximately $0.7 million, from $14.5 million during the year ended December 31, 2016, to $15.2 million for the year ended December 31, 2017. This increase was due to an increase in payroll and other administrative costs related to corporate management and oversight, and general inflation. We anticipate third-party development and management services expenses will increase in 2018 as compared to 2017 for the reasons discussed above.
General and Administrative
General and administrative expenses increased by approximately $8.9 million, from $22.5 million during the year ended December 31, 2016, to $31.4 million for the year ended December 31, 2017. This increase was primarily due to the following: (i) $4.5 million in contractual executive separation and retirement charges incurred in the first and second quarter 2017 as a result of the retirement of the former Company’s Chief Financial Officer; (ii) $2.9 million of transaction costs incurred in connection with our initial investment in the Core Transaction in August 2017; (iii) increases in travel and related pursuit costs for potential acquisition transactions; (iv) additional expenses incurred in connection with enhancements to our operating systems platform, and (v) other general inflationary factors. We anticipate general and administrative expenses will decrease in 2018 as compared to 2017, as the increase in expenses incurred in connection with enhancements to our operating system platforms, payroll and benefits expense, will be more than offset by nonrecurring expenses incurred in 2017, which include the executive separation and retirement charges with regard to the retirement of the Company’s former Chief Financial Officer and transaction costs in connection with the Company’s initial investment in the Core Transaction.
Depreciation and Amortization
Depreciation and amortization increased by approximately $23.6 million, from $211.4 million during the year ended December 31, 2016, to $235.0 million for the year ended December 31, 2017. This increase was primarily due to the following: (i) a $16.3 million increase related to the completion of construction and opening of seven owned development properties in August and September of 2016 and ten owned development properties in August 2017; (ii) a $12.1 million increase due to property acquisition activity during 2016 and 2017; (iii) a $7.9 million increase in depreciation expense at our same store properties due to capital improvement projects at various properties; and (iv) a $0.4 million increase in depreciation of corporate assets. These increases were partially offset by a $13.3 million decrease in depreciation and amortization expense related to properties sold in 2016 and 2017. We anticipate depreciation and amortization expense to increase in 2018 as compared to 2017 due to the completion of
owned development projects in Fall 2017 and Fall 2018, as well as acquisitions in 2017, offset by property dispositions completed during 2017 and 2018.
Ground/Facility Leases
Ground/facility leases expense increased by approximately $1.0 million, from $9.2 million during the year ended December 31, 2016, to $10.2 million for the year ended December 31, 2017. This increase was primarily due to ACE development projects that completed construction and opened for operations in Fall 2016 and Fall 2017. We anticipate ground/facility leases expense to increase in 2018 as compared to 2017, primarily as a result of the timing of new ACE projects being placed into service.
Provision for Real Estate Impairment
During the year ended December 31, 2017, we recorded an impairment loss of approximately $15.3 million for one owned property currently in receivership that is in the process of being transferred to the lender in settlement of the property’s $27.4 million mortgage loan that matured in August 2017. During year ended December 31, 2016, we recorded an impairment loss of approximately $4.9 million related to an owned property that was classified as held for sale as of December 31, 2016 and subsequently sold in April 2017. Refer to Note 6 in the accompanying Notes to Consolidated Financial Statements contained in Item 8 for a detailed discussion of our property dispositions.
Interest Income
Interest income decreased by approximately $0.6 million, from $5.5 million during the year ended December 31, 2016, to $4.9 million for the year ended December 31, 2017. This decrease is primarily due to additional interest earned during 2016 on cash proceeds from our February 2016 equity offering. We expect interest income to remain relatively consistent with 2017 levels in 2018.
Interest Expense
Interest expense decreased by approximately $7.6 million, from $78.7 million during the year ended December 31, 2016, to $71.1 million for the year ended December 31, 2017. Interest expense decreased as a result of the following: (i) a decrease of approximately $7.9 million related to the disposition of properties with outstanding mortgage debt during 2016; (ii) a $4.3 million decrease related to the pay-off of mortgage loans during 2017 and 2016; (iii) a decrease of approximately $4.1 million due to the pay-off of $450 million of outstanding term loan debt in 2016; (iv) a $3.6 million increase in capitalized interest due to the timing and volume of construction activities on our owned development projects during the comparable twelve month periods; and (v) a decrease of $0.7 million related to lower outstanding balances on our mortgage debt due to continued scheduled principal payments. These decreases were partially offset by (i) a $4.6 million increase in interest related to closings of a new $300 million term loan in September 2017 and a new $200 million term loan in June 2017; (ii) a $3.8 million increase in interest expense related to increased borrowings on our revolving credit facility; (iii) a $3.3 million increase in interest expense related to our $400 million offering of unsecured notes in October 2017; and (iv) a $1.2 million increase in accrued default interest on one of our properties that is currently in receivership and is in the process of being transferred to the lender in settlement of the property’s $27.4 million mortgage loan that matured in August 2017.
We anticipate interest expense will increase in 2018 as compared to 2017 due to increased interest rates on a higher average outstanding balance under the Company’s revolving credit facility throughout 2018, an increase related to the closing of $500 million in term loans in 2017, additional interest incurred from the $400 million offering of unsecured notes in October 2017, and additional interest incurred from any offerings of unsecured notes anticipated during 2018. These increases will be offset by the expected pay-off of outstanding mortgage and term loan debt scheduled to mature in 2018.
Amortization of Deferred Financing Costs
Amortization of deferred financing costs decreased by approximately $1.9 million, from $6.5 million during the year ended December 31, 2016, to $4.6 million for the year ended December 31, 2017. This decrease was primarily due to the following: (i) $1.1 million of accelerated amortization related to the early pay-off of our $250 million term loan in February 2016; (ii) $0.7 million related to the pay-off of $200 million of our $350 million term loan in November 2016; and (iii) $0.3 million related to properties with mortgage debt sold in 2016. We anticipate amortization of deferred finance costs will increase in 2018 due to increases related to closings of a new $300 million term loan in September 2017 and a new $200 million term loan in June 2017, the $400 million offering of unsecured notes in October 2017, and offerings of unsecured notes anticipated during 2018.
(Loss) Gain from Disposition of Real Estate
During the year ended December 31, 2017, we sold one owned property containing 657 beds, resulting in a net loss from disposition of real estate of approximately $0.6 million. During the year ended December 31, 2016, we sold 21 owned properties containing 13,407 beds, resulting in a net gain from disposition of real estate of approximately $21.2 million. Refer to Note 6 in the accompanying Notes to Consolidated Financial Statements contained in Item 8 for additional details regarding our recent disposition transactions.
Loss from Early Extinguishment of Debt
During the year ended December 31, 2016, we incurred approximately $12.8 million of losses associated with the early pay-off of mortgage loans in connection with the sale of nine owned properties.
Noncontrolling Interests
Noncontrolling interests represent holders of common and preferred units in our Operating Partnership not held by ACC or ACC Holdings as well as certain third-party partners in joint ventures consolidated by us for financial reporting purposes. Accordingly, these external partners are allocated their share of income/loss during the respective reporting periods. Refer to Note 9 in the accompanying Notes to Consolidated Financial Statements contained in Item 8 for additional details.
Comparison of the Years Ended December 31, 2016 and 2015
The following table presents our results of operations for the years ended December 31, 2016 and 2015, including the amount and percentage change in these results between the two periods.
|
| | | | | | | | | | | | | | | |
| | | Year Ended December 31, | | | | |
| | | 2016 | | 2015 | | Change ($) | | Change (%) |
| Revenues: | | | | | | | | |
| Owned properties | | $ | 735,392 |
| | $ | 704,909 |
| | $ | 30,483 |
| | 4.3 | % |
| On-campus participating properties | | 33,433 |
| | 31,586 |
| | 1,847 |
| | 5.8 | % |
| Third-party development services | | 4,606 |
| | 4,964 |
| | (358 | ) | | (7.2 | )% |
| Third-party management services | | 9,724 |
| | 8,813 |
| | 911 |
| | 10.3 | % |
| Resident services | | 3,206 |
| | 3,109 |
| | 97 |
| | 3.1 | % |
| Total revenues | | 786,361 |
| | 753,381 |
| | 32,980 |
| | 4.4 | % |
| | | | | | | | | |
| Operating expenses: | | |
| | |
| | |
| | |
|
| Owned properties | | 337,296 |
| | 331,836 |
| | 5,460 |
| | 1.6 | % |
| On-campus participating properties | | 13,447 |
| | 12,437 |
| | 1,010 |
| | 8.1 | % |
| Third-party development and management services | | 14,533 |
| | 14,346 |
| | 187 |
| | 1.3 | % |
| General and administrative | | 22,493 |
| | 20,838 |
| | 1,655 |
| | 7.9 | % |
| Depreciation and amortization | | 211,387 |
| | 208,788 |
| | 2,599 |
| | 1.2 | % |
| Ground/facility leases | | 9,167 |
| | 8,232 |
| | 935 |
| | 11.4 | % |
| Provision for real estate impairment | | 4,895 |
| | — |
| | 4,895 |
| | 100.0 | % |
| Total operating expenses | | 613,218 |
| | 596,477 |
| | 16,741 |
| | 2.8 | % |
| | | | | | | | | |
| Operating income | | 173,143 |
| | 156,904 |
| | 16,239 |
| | 10.3 | % |
| | | | | | | | | |
| Nonoperating income and (expenses): | | |
| | |
| | |
| | |
|
| Interest income | | 5,481 |
| | 4,421 |
| | 1,060 |
| | 24.0 | % |
| Interest expense | | (78,687 | ) | | (87,789 | ) | | 9,102 |
| | (10.4 | )% |
| Amortization of deferred financing costs | | (6,520 | ) | | (5,550 | ) | | (970 | ) | | 17.5 | % |
| Gain from disposition of real estate | | 21,197 |
| | 52,699 |
| | (31,502 | ) | | (59.8 | )% |
| Loss from early extinguishment of debt | | (12,841 | ) | | (1,770 | ) | | (11,071 | ) | | 625.5 | % |
| Other nonoperating income | | — |
| | 388 |
| | (388 | ) | | (100.0 | )% |
| Total nonoperating expenses | | (71,370 | ) | | (37,601 | ) | | (33,769 | ) | | 89.8 | % |
| | | | | | | | | |
| Income before income taxes | | 101,773 |
| | 119,303 |
| | (17,530 | ) | | (14.7 | )% |
| Income tax provision | | (1,150 | ) | | (1,242 | ) | | 92 |
| | (7.4 | )% |
| Net income | | 100,623 |
| | 118,061 |
| | (17,438 | ) | | (14.8 | )% |
| | | | | | | | | |
| Net income attributable to noncontrolling interests | | (1,562 | ) | | (2,070 | ) | | 508 |
| | (24.5 | )% |
Net income attributable to ACC, Inc. and Subsidiaries common stockholders | | $ | 99,061 |
| | $ | 115,991 |
| | $ | (16,930 | ) | | (14.6 | )% |
Same Store and New Property Operations
Refer to the results of operations discussion for the years ended December 31, 2017 and 2016 for detailed definitions of same store revenues and operating expenses.
A reconciliation of our same store, new property and sold/held for sale property operations to our consolidated statements of comprehensive income is set forth below:
|
| | | | | | | | | | | | | | | | | | | | | | | | | | | | | | | | |
| | | Same Store Properties | | New Properties (1) | | Sold/Held for Sale Properties (2) | | Total - All Properties |
| | | Year Ended December 31, | | Year Ended December 31, | | Year Ended December 31, | | Year Ended December 31, |
| | | 2016 | | 2015 | | 2016 | | 2015 | | 2016(3) | | 2015(4) | | 2016 | | 2015 |
| Number of properties | | 113 |
| | 113 |
| | 21 |
| | 12 |
| | 23 |
| | 43 |
| | 157 |
| | 168 |
|
| Number of beds | | 66,993 |
| | 66,993 |
| | 11,638 |
| | 7,738 |
| | 14,064 |
| | 26,361 |
| | 92,695 |
| | 101,092 |
|
| | | | | | | | | | | | | | | | | |
Revenues (5) | | $ | 576,760 |
| | $ | 559,390 |
| | $ | 88,399 |
| | $ | 38,340 |
| | $ | 73,439 |
| | $ | 110,288 |
| | $ | 738,598 |
| | $ | 708,018 |
|
| Operating expenses | | 264,054 |
| | 257,094 |
| | 36,163 |
| | 20,775 |
| | 37,079 |
| | 53,967 |
| | 337,296 |
| | 331,836 |
|
| |
(1) | Does not include properties under construction as of December 31, 2016. Number of properties and number of beds also excludes properties undergoing redevelopment as of December 31, 2015, although the results of operations of those properties are included in new property revenues and operating expenses prior to commencement of redevelopment activities. |
| |
(2) | Does not include the allocation of payroll and other administrative costs related to corporate management and oversight. |
| |
(3) | Includes 21 owned properties that were sold during the year ended December 31, 2016, along with one property that was classified as held for sale as of December 31, 2016. One of the properties sold consists of two phases which are counted separately in the property portfolio numbers above. Refer to Note 6 in the accompanying Notes to Consolidated Financial Statements contained in Item 1 for a more detailed discussion of our recent disposition activity. |
| |
(4) | Includes the 22 owned properties, noted above, that were sold or held for sale during the year ended December 31, 2016, and 20 owned properties that were sold during the year ended December 31, 2015. |
| |
(5) | Includes revenues which are reflected as resident services revenue on the accompanying Consolidated Statements of Comprehensive Income. |
Same Store Properties: The increase in revenue from our same store properties was primarily due to an increase in average rental rates for the 2015/2016 and 2016/2017 academic years. Average occupancy for the year ended December 31, 2016, remained consistent with the year ended December 31, 2015, at 94.8%.
The increase in operating expenses from our same store properties was primarily due to: (i) an increase in general and administrative costs primarily due to an increase in the allocation of payroll and other administrative costs related to corporate management and oversight; (ii) an increase in property taxes due to higher than anticipated property tax assessments in various markets; (iii) an increase in utilities expense as a result of billing adjustments from utility companies and the implementation of a roommate utility billing program at certain properties; and (iv) additional marketing expenses incurred during the fourth quarter 2016 for marketing activities designed to drive leasing velocity for the 2017/2018 academic year.
New Property Operations: Our new properties for the year ended December 31, 2016, are summarized in the table below:
|
| | | | | | | | |
| Property | | Location | | Primary University Served | | Beds | | Acquisition/Opening Date |
| Acquisitions: | | | | | | | | |
| Park Point | | Syracuse, NY | | Syracuse University | | 226 | | February 2015 |
| 1200 West Marshall | | Richmond, VA | | Virginia Commonwealth University | | 406 | | March 2015 |
| 8 1/2 Canal Street | | Richmond, VA | | Virginia Commonwealth University | | 540 | | March 2015 |
| Vistas San Marcos | | San Marcos, TX | | Texas State University | | 600 | | March 2015 |
| Crest at Pearl | | Austin, TX | | University of Texas | | 343 | | June 2015 |
| UP at Metroplex | | Binghamton, NY | | Binghamton University - SUNY | | 710 | | June 2015 |
| Stadium Centre | | Tallahassee, FL | | Florida State University | | 710 | | July 2015 |
| University Crossings | | Charlotte, NC | | University of North Carolina | | 546 | | August 2016 |
| U Point | | Syracuse, NY | | Syracuse University | | 163 | | October 2016 |
| | | | | SUBTOTAL - Acquisitions | | 4,244 | | |
| Owned Developments: | | | | | | | | |
| 160 Ross | | Auburn, AL | | Auburn University | | 642 | | August 2015 |
| U Club on Woodward Phase II | | Tallahassee, FL | | Florida State University | | 496 | | August 2015 |
| The Summit at University City | | Philadelphia, PA | | Drexel University | | 1,315 | | September 2015 |
| 2125 Franklin | | Eugene, OR | | University of Oregon | | 734 | | September 2015 |
| Currie Hall | | Los Angeles, CA | | University of Southern California | | 456 | | August 2016 |
| Fairview House | | Indianapolis, IN | | Butler University | | 633 | | August 2016 |
| University Pointe | | Louisville, KY | | University of Louisville | | 531 | | August 2016 |
| Merwick Stanworth Phase II | | Princeton, NJ | | Princeton University | | 379 | | September 2016 |
| U Club on 28th | | Boulder, CO | | University of Colorado | | 398 | | August 2016 |
| U Club Sunnyside | | Morgantown, WV | | West Virginia University | | 534 | | August 2016 |
| The Court at Stadium Centre | | Tallahassee, FL | | Florida State University | | 260 | | August 2016 |
| | | | | SUBTOTAL - Owned Developments | | 6,378 | | |
| Under Renovation: | | | | | | | | |
| University Crossings | | Philadelphia, PA | | Drexel University | | 1,016 | | September 2015 |
| | | | | Total - New Properties | | 11,638 | | |
On-Campus Participating Properties (“OCPP”) Operations
Same Store OCPP Properties: We had five on-campus participating properties containing 5,086 beds which were operating during each of the years ended December 31, 2016 and 2015. Revenues from these properties increased by $1.8 million, from $31.6 million for the year ended December 31, 2015 to $33.4 million for the year ended December 31, 2016. This increase was primarily due to an increase in average rental rates partially offset by a decrease in average occupancy from 78.4% for the year ended December 31, 2015, to 76.6% for the year ended December 31, 2016. Operating expenses at these properties increased by $1.0 million, from $12.4 million for the year ended December 31, 2015, as compared to $13.4 million for the year ended December 31, 2016, primarily due to an increase in utilities as compared to the prior year.
Third-Party Development Services Revenue
Third-party development services revenue decreased by approximately $0.4 million, from $5.0 million during the year ended December 31, 2015, to $4.6 million for the year ended December 31, 2016. This decrease was due to: (i) the closing of bond financing and commencement of construction for the Northeastern Illinois University project in May 2015 and commencement of construction of the Oregon State University - Cascades project in November 2015, both of which contributed a total of $2.5 million of revenue during the year ended December 31, 2015, versus $1.5 million in 2016; and (ii) the completion of construction of the development projects at the University of Toledo, Princeton University and Texas A&M University Corpus Christi, which contributed $2.2 million of revenue in 2015. These decreases were partially offset by the closing of bond financing and commencement of construction of two development projects with the Texas A&M University System at their Corpus Christi and San Antonio campuses during the year ended December 31, 2016. These two projects contributed approximately $2.3 million in additional revenue in 2016. In addition, we earned a $0.5 million fee for the performance of various predevelopment activities for the University on Kansas during the year ended December 31, 2016. During the year ended December 31, 2016, we had four
projects in progress with an average contractual fee of approximately $1.8 million, as compared to the year ended December 31, 2015, in which we had five projects in progress with an average contractual fee of approximately $2.2 million.
Third-Party Management Services Revenue
Third-party management services revenue increased by approximately $0.9 million, from $8.8 million during the year ended December 31, 2015, to $9.7 million for the year ended December 31, 2016. This increase was primarily a result of revenue earned from newly awarded management contracts, and the recognition of incentive fees from an existing third-party management contract during the year ended December 31, 2016.
General and Administrative
General and administrative expenses increased by approximately $1.7 million, from $20.8 million during the year ended December 31, 2015, to $22.5 million for the year ended December 31, 2016. This increase was primarily due to additional expenses incurred in connection with enhancements to our operating system platforms, additional payroll, health care and benefits expense, public company costs and other general inflationary factors.
Depreciation and Amortization
Depreciation and amortization increased by approximately $2.6 million, from $208.8 million during the year ended December 31, 2015, to $211.4 million for the year ended December 31, 2016. This increase was primarily due to the following: (i) a $7.0 million increase related to the completion of construction and opening of four owned development properties in August and September 2015; (ii) a $3.9 million increase related to the completion of construction and opening of seven owned development properties in August and September 2016; (iii) a $3.1 million increase due to property acquisition activity in 2015 and 2016; (iv) a $1.3 million increase due to renovation activities occurring at one of our owned properties during 2015; (v) a $1.2 million increase in depreciation and amortization at our same store properties; and (vi) a $0.3 increase in depreciation of corporate assets. These increases were offset by a decrease in depreciation and amortization expense of approximately $14.1 million related to the sale of 21 properties in 2016 and 20 properties in 2015.
Ground/Facility Leases
Ground/facility leases expense increased by approximately $1.0 million, from $8.2 million during the year ended December 31, 2015, to $9.2 million for the year ended December 31, 2016. This increase was primarily due to ACE development projects that completed construction and opened for operations in Fall 2015 and Fall 2016, as well as an increase in variable lease expense at two other ACE properties as a result of improved rental income.
Provision for Real Estate Impairment
During the year ended December 31, 2016, we recorded a loss of approximately $4.9 million related to an impairment charge recognized for an owned property classified as held for sale as of December 31, 2016. Refer to Note 6 in the accompanying Notes to Consolidated Financial Statements contained in Item 8 for a detailed discussion of our property dispositions.
Interest Income
Interest income increased by approximately $1.1 million, from $4.4 million during the year ended December 31, 2015, to $5.5 million for the year ended December 31, 2016. This increase is primarily due to interest earned on cash proceeds from our February 2016 equity offering.
Interest Expense
Interest expense decreased by approximately $9.1 million, from $87.8 million during the year ended December 31, 2015, to $78.7 million for the year ended December 31, 2016. Interest expense decreased as a result of the following: (i) a decrease of $5.0 million related to the pay-off of mortgage loans during 2015 and 2016; (ii) a decrease of approximately $5.3 million due to the pay-off of $450 million of outstanding term loan debt during 2016; (iii) a decrease of approximately $5.1 million related to the disposition of properties with outstanding mortgage debt during 2015 and 2016; (iv) an increase of $2.6 million in capitalized interest due to the timing and volume of construction activities on our owned development projects during the comparable twelve month periods; (v) a decrease of $1.9 million related to interest paid on our revolving credit facility; and (vi) a decrease of $0.7 million related to lower outstanding balances on our mortgage debt due to continued scheduled principal payments. These decreases
were mostly offset by the following (i) an increase of approximately $10.0 million related to our September 2015 $400 million offering of senior unsecured notes; and (ii) approximately $1.4 million of additional interest related to loans assumed in connection with 2015 property acquisitions.
Amortization of Deferred Financing Costs
Amortization of deferred financing costs increased by approximately $0.9 million, from $5.6 million during the year ended December 31, 2015, to $6.5 million for the year ended December 31, 2016. This increase was primarily due to $1.1 million of accelerated amortization related to the early pay-off of our $250 million term loan in February 2016.
Gain from Disposition of Real Estate
During the year ended December 31, 2016, we sold 21 owned properties containing 13,407 beds, resulting in a net gain from disposition of real estate of approximately $21.2 million. During the year ended December 31, 2015, we sold 20 owned properties containing 12,297 beds, resulting in a net gain from disposition of real estate of approximately $52.7 million. Refer to Note 6 in the accompanying Notes to Consolidated Financial Statements contained in Item 8 for additional details regarding our recent disposition transactions.
Loss from Early Extinguishment of Debt
During the year ended December 31, 2016, we incurred approximately $12.8 million of losses associated with the early pay-off of mortgage loans in connection with the sale of nine owned properties. During the year ended December 31, 2015, we incurred approximately $1.8 million of losses associated with the early pay-off of mortgage loans in connection with the sale of four owned properties.
Liquidity and Capital Resources
Cash Balances and Cash Flows
As of December 31, 2017, excluding our on-campus participating properties, we had $49.9 million in cash and cash equivalents and restricted cash as compared to $32.3 million in cash and cash equivalents and restricted cash as of December 31, 2016. Restricted cash primarily consists of escrow accounts held by lenders and resident security deposits, as required by law in certain states, and funds held in escrow in connection with potential acquisition and development opportunities. The following discussion relates to changes in cash due to operating, investing and financing activities, which are presented in our consolidated statements of cash flows included in Item 8 herein.
Operating Activities: For the year ended December 31, 2017, net cash provided by operating activities was approximately $320.0 million, as compared to approximately $308.1 million for the year ended December 31, 2016, an increase of approximately $11.9 million. This increase in cash flows was due to operating cash flows provided by the completion of construction and opening of ten owned development properties in third quarter of 2017, and the completion of seven owned development projects in the third quarter of 2016, as well as property acquisitions in 2016 and 2017. The increase was partially offset by the timing of collections of our student accounts receivable as well as a decrease in operating cash flows related to properties disposed of during 2016 and 2017.
Investing Activities: Investing activities utilized approximately $977.8 million and $31.6 million for the years ended December 31, 2017 and 2016, respectively. The $946.2 million increase in cash utilized in investing activities was primarily a result of the following: (i) a $547.0 million decrease in proceeds from the disposition of owned properties, as we sold 21 properties during the year ended December 31, 2016, as compared to the sale of one property during the year ended December 31, 2017; (ii) a $263.9 million increase in cash paid for property acquisitions during the year ended December 31, 2017; (iii) a $110.7 million increase in cash used to fund the construction of our owned development properties, related to the timing of construction commencement and completion of our owned development pipeline; (iv) a $21.1 million increase in cash used to fund capital expenditures at our owned properties; and (v) an $8.0 million increase in cash paid to acquire undeveloped land parcels in 2017.
Financing Activities: Cash provided by financing activities totaled approximately $676.9 million for the year ended December 31, 2017, and cash utilized in financing activities totaled approximately $271.1 million during the year ended December 31, 2016. The $948.0 million increase in cash provided by financing activities was primarily a result of the following: (i) a $950.0 million net increase in proceeds from unsecured term loans; (ii) $399.6 million in proceeds from the offering of unsecured notes in October 2017; (iii) a $250.8 million decrease in cash used to pay off mortgage debt, including defeasance costs, during the year ended December 31, 2017; (iv) an increase of $35.7 million in proceeds from construction loans; and (v) $11.8 million in contributions from noncontrolling interests during the year ended December 31, 2017. These increases were partially offset by the following: (i) a $594.6 million decrease in net proceeds from the sale of common stock, related to our equity offering in February 2016 as compared to the issuance of common stock under our ATM Equity Program in 2017; (ii) a $75.1 million increase in distributions to noncontrolling partners due to the Company’s initial investment in joint ventures; (iii) a $17.8 million increase in distributions to common and restricted stockholders; and (iv) an $11.2 million increase in payments of debt issuance costs due to the amendment of our revolving credit agreement in January 2017 and additional term loans in June and September 2017.
Liquidity Needs, Sources and Uses of Capital
As of December 31, 2017, our short-term liquidity needs included, but were not limited to, the following: (i) the pay-off of a $300 million term loan due to mature in September 2018; (ii) anticipated distribution payments to our common and restricted stockholders totaling approximately $241.5 million based on an assumed annual cash distribution of $1.76 per share and based on the number of our shares outstanding as of December 31, 2017; (iii) anticipated distribution payments to our Operating Partnership unitholders totaling approximately $1.9 million based on an assumed annual distribution of $1.76 per common unit and a cumulative preferential per annum cash distribution rate of 5.99% on our Preferred OP Units based on the number of units outstanding as of December 31, 2017; (iv) the pay-off of approximately $133.3 million of outstanding fixed rate mortgage debt scheduled to mature during the next 12 months as well as approximately $12.4 million of scheduled debt principal payments; (v) estimated development costs over the next 12 months totaling approximately $308.2 million for our owned properties currently under construction; (vi) a $42.2 million obligation to purchase a property subject to a presale arrangement (see Note 16 in the accompanying Notes to Consolidated Financial Statements contained in Item 8); (vii) an obligation to increase our investment in two joint ventures (the “Core Joint Ventures”), resulting in a funding commitment of approximately $130.6 million (see Note 5 and Note 16 in the accompanying Notes to Consolidated Financial Statements contained in Item 8); (viii) funds for other development projects scheduled to commence construction during the next 12 months; and (ix) potential future property or land acquisitions, including mezzanine financed developments.
We expect to meet our short-term liquidity requirements by (i) borrowing under our existing revolving credit facility; (ii) accessing the unsecured bond market; (iii) exercising debt extension options to the extent they are available; (iv) issuing securities, including common stock, under our ATM Equity Program discussed more fully in Note 11 in the accompanying Notes to Consolidated Financial Statements contained in Item 8, or otherwise; (v) potentially disposing of properties and/or entering into joint venture arrangements, depending on market conditions; and (vi) utilizing current cash on hand and net cash provided by operations. Our ability to obtain additional financing will depend on a variety of factors such as market conditions, the general availability of credit, the overall availability of credit to the real estate industry, our credit ratings and credit capacity, as well as the perception of lenders regarding our long or short-term financial prospects.
In January 2017, the Company amended and expanded its senior unsecured revolving credit facility, increasing the facility size to $700 million and extending the maturity date to March 2022. The amended facility has an accordion feature that allows the Company to expand the facility by up to an additional $500 million, subject to the satisfaction of certain conditions. Borrowing rates under the credit facility float at a margin over LIBOR plus an annual facility fee with spreads reflecting current market terms which are more favorable than those contained in the prior facility. Both the margin and the facility fee are priced on a grid that is tied to the Company’s credit rating. Based on the Company’s current Baa2/BBB rating, the annual facility fee is 20 basis points and the LIBOR margin is 100 basis points, a reduction of 10 basis points from the prior facility.
In May 2017, the lender of the non-recourse mortgage loan secured by Blanton Common, an owned property located near Valdosta State University which was acquired as part of the GMH student housing transaction in 2008, sent a formal notice of default and initiated foreclosure proceedings. The property generated insufficient cash flow to cover the debt service on the $27.4 million mortgage loan that matured in August 2017. As of December 31, 2017, the underlying property was in receivership and the Company was cooperating with the lender to allow for a consensual foreclosure process upon which the property will be surrendered to the lender in satisfaction of the mortgage loan.
In June 2017, the Company entered into a $200 million term loan which will mature in June 2022. The agreement has an accordion feature that allows the Company to expand the amount by up to an additional $100 million, subject to the satisfaction of certain conditions. Borrowing rates under this agreement float at a margin over LIBOR and the margin is priced on a grid that is tied to the Company’s credit rating. Based on the Company’s current Baa2/BBB rating, the LIBOR margin is 110 basis points.
In September 2017, the Company entered into a $300 million term loan which will mature in September 2018, and can be extended for two one-year periods at our option, subject to the satisfaction of certain conditions. The agreement has an accordion feature that allows the Company to expand the amount by up to an additional $100 million, subject to the satisfaction of certain conditions. Borrowing rates under this agreement float at a margin over LIBOR and the margin is priced on a grid that is tied to the Company’s credit rating. Based on the Company’s current Baa2/BBB rating, the LIBOR margin is 110 basis points.
In October 2017, we raised $395 million in net proceeds from an unsecured $400 million bond offering. Proceeds from the offering were used to repay the outstanding balance on our revolving credit facility. We intend to use the remaining proceeds for potential repayment of other outstanding debt, to fund our development pipeline, for potential acquisitions of student housing properties and for general corporate purposes.
We may seek additional funds to undertake initiatives not contemplated by our business plan or obtain additional cushion against possible shortfalls. We also may pursue additional financing as opportunities arise. Future financings may include a range of different sizes or types of financing, including the incurrence of additional secured debt and the sale of additional debt or equity securities. These funds may not be available on favorable terms or at all. Our ability to obtain additional financing depends on several factors, including future market conditions, our success or lack of success in penetrating our markets, our future creditworthiness, and restrictions contained in agreements with our investors or lenders, including the restrictions contained in the agreements governing our unsecured credit facility and unsecured notes. These financings could increase our level of indebtedness or result in dilution to our equity holders.
Indebtedness
A summary of our consolidated indebtedness as of December 31, 2017 is as follows. Refer to Note 10 in the accompanying Notes to Consolidated Financial Statements contained in Item 8 for a detailed discussion of our indebtedness.
|
| | | | | | | | | | | | |
| | | Amount | | % of Total | | Weighted Average Rates (1) | | Weighted Average Maturities |
| Secured | | $ | 648,688 |
| | 21.4 | % | | 4.8 | % | | 5.0 Years |
| Unsecured | | 2,377,600 |
| | 78.6 | % | | 3.3 | % | | 5.0 Years |
| Total consolidated debt | | $ | 3,026,288 |
| | 100.0 | % | | 3.6 | % | | 5.0 Years |
| | | | | | | | | |
| Fixed rate debt | | | | | | | | |
| Secured | | | | | | | | |
| Project-based taxable bonds | | $ | 30,575 |
| | 1.0 | % | | 7.6 | % | | 6.8 Years |
| Mortgage | | 566,333 |
| | 18.8 | % | | 4.6 | % | | 5.3 Years |
| Unsecured | | | | | | | | |
April 2013 Notes | | 400,000 |
| | 13.2 | % | | 3.8 | % | | 5.3 Years |
| June 2014 Notes | | 400,000 |
| | 13.2 | % | | 4.1 | % | | 6.5 Years |
September 2015 Notes | | 400,000 |
| | 13.2 | % | | 3.4 | % | | 2.8 Years |
| October 2017 Notes | | 400,000 |
| | 13.2 | % | | 3.6 | % | | 9.9 Years |
| Total - fixed rate debt | | 2,196,908 |
| | 72.6 | % | | 4.0 | % | | 5.9 Years |
| | | | | | | | | |
| Variable rate debt: | | | | | | | | |
| Secured | | | | | | | | |
| Construction | | 51,780 |
| | 1.7 | % | | 4.4 | % | | 0.7 Years |
| Unsecured | | | | | | | | |
| Term loans | | 650,000 |
| | 21.5 | % | | 2.4 | % | | 2.4 Years |
| Unsecured revolving credit facility | | 127,600 |
| | 4.2 | % | | 2.7 | % | | 4.2 Years |
| Total - variable rate debt | | 829,380 |
| | 27.4 | % | | 2.6 | % | | 2.6 Years |
| Total consolidated debt | | $ | 3,026,288 |
| | 100.0 | % | | 3.6 | % | | 5.0 Years |
| | | | | | | | | |
| |
(1) | Represents stated interest rate and does not include the effect of the amortization of deferred financing costs, debt premiums and discounts, OIDs, and interest rate swap terminations. |
Distributions
We are required to distribute 90% of our REIT taxable income (excluding capital gains) on an annual basis in order to qualify as a REIT for federal income tax purposes. Distributions to common stockholders are at the discretion of the Board of Directors. We may use borrowings under our unsecured revolving credit facility to fund distributions. The Board of Directors considers a number of factors when determining distribution levels, including market factors and our Company’s performance in addition to REIT requirements.
On January 23, 2018, our Board of Directors declared a distribution of $0.44 per share, which was paid on February 16, 2018, to all common stockholders of record as of February 2, 2018. At the same time, the Operating Partnership paid an equivalent amount per unit to holders of Common Units, as well as the quarterly cumulative preferential distribution to holders of Series A Preferred Units.
Capital Expenditures
We distinguish between the following five categories of capital expenditures:
Recurring capital expenditures represent additions that are recurring in nature to maintain a property’s income, value, and competitive position within the market. Recurring capital expenditures typically include, but are not limited to, appliances, furnishings, carpeting and flooring, HVAC equipment and kitchen/bath cabinets. Maintenance and repair costs incurred throughout the year including those incurred during our annual turn process due to normal wear and tear by residents are expensed as incurred.
Acquisition-related capital expenditures represent additions identified upon acquiring a property and are considered part of the initial investment. These expenditures are intended to position the property to be consistent with our physical standards and are usually incurred within the first two and occasionally the third year after acquisition.
Renovations and strategic repositioning capital expenditures are incurred to enhance the economic value and return of the property and undergo an investment return underwrite prior to being incurred.
Non-recurring and other capital expenditures represent the addition of features or amenities that did not exist at the property but were deemed necessary to remain competitive within a specific market. This category also includes items considered extraordinary in nature.
Disposition-related capital expenditures represent capital improvements at properties disposed of during all years presented.
Additionally, we are required by certain of our lenders to contribute amounts to reserves for capital repairs and improvements at our mortgaged properties, which may exceed the amount of capital expenditures actually incurred by us during those periods.
Capital expenditures at our owned properties are set forth below:
|
| | | | | | | | | | | | | |
| | | As of and for the Year Ended December 31, | |
| | | 2017 | | 2016 | | 2015 | |
| Recurring capital expenditures | | $ | 18,516 |
| | $ | 16,062 |
| | $ | 14,101 |
| |
| Acquisition-related | | 30,435 |
| | 14,319 |
| | 4,286 |
| |
| Renovations and strategic repositioning | | 27,259 |
| | 16,568 |
| | 45,534 |
| (1) |
| Non-recurring and other | | 6,270 |
| | 8,763 |
| | 19,158 |
| |
Disposition-related (2) | | 242 |
| | 5,875 |
| | 13,753 |
| |
| Total | | $ | 82,722 |
| | $ | 61,587 |
| | $ | 96,832 |
| |
| | | | | | | | |
Average beds (3) | | 82,021 |
| | 75,318 |
| | 70,654 |
| |
| Average recurring capital expenditures per bed | | $ | 226 |
| | $ | 213 |
| | $ | 200 |
| |
| |
(1) | Includes renovation costs incurred at University Crossings and The Castilian. |
| |
(2) | Includes properties sold during 2017, 2016 and 2015. It also includes one property currently in receivership that is in the process of being transferred to the lender in settlement of the property’s $27.4 million mortgage loan that matured in August 2017. Historical capital expenditures for these properties have been reclassified for all periods presented. |
(3) Does not include beds related to the disposed properties discussed above.
Contractual Obligations
The following table summarizes our contractual obligations for the next five years and thereafter as of December 31, 2017:
|
| | | | | | | | | | | | | | | | | | | | |
| | | Total | | Less than 1 Year | | 1 - 3 Years | | 3 - 5 Years | | More than 5 Years |
Long-term debt (1) | | $ | 2,974,508 |
| (2) | $ | 445,743 |
| (2) | $ | 468,082 |
| | $ | 742,185 |
| | $ | 1,318,498 |
|
| Interest on long-term debt | | 546,548 |
| (3) | 105,296 |
| (3) | 184,301 |
| | 123,374 |
| | 133,577 |
|
Development projects (4) | | 402,943 |
| | 308,158 |
| | 94,785 |
| | — |
| | — |
|
Ground/facility lease obligations (5) | | 413,736 |
| | 7,122 |
| | 17,032 |
| | 17,546 |
| | 372,036 |
|
Operating lease obligations (6) | | 5,479 |
| | 1,446 |
| | 2,846 |
| | 826 |
| | 361 |
|
Presale development projects (7) | | 42,200 |
| | 42,200 |
| | — |
| | — |
| | — |
|
Joint venture agreements (8) | | 284,620 |
| | 130,621 |
| | 153,999 |
| | — |
| | — |
|
| | | $ | 4,670,034 |
| | $ | 1,040,586 |
| | $ | 921,045 |
| | $ | 883,931 |
| | $ | 1,824,472 |
|
| |
(1) | Amounts include aggregate principal payments only and assumes we do not exercise extension options available to us on our unsecured credit facility or our unsecured term loans (see Note 10 in the accompanying Notes to Consolidated Financial Statements contained in Item 8). |
| |
(2) | Amounts exclude $51.8 million in constructions loans associated with presale developments and joint ventures. These loans are an obligation of the third-party developer and will be paid off with proceeds from the Company’s investment in the properties, and are included in presale development projects and joint venture agreements in the table above (see Note 5 and 16 in the accompanying Notes to Consolidated Financial Statements contained in Item 8). |
| |
(3) | Amount includes $1.6 million of interest due on $51.8 million of construction loan debt outstanding as of December 31, 2017 discussed above. |
| |
(4) | Consists of anticipated cash payments, including amounts accrued as of December 31, 2017, related to nine owned development projects under construction as of December 31, 2017, which will be funded entirely by us and are scheduled to be completed between August 2018 and August 2019. We have entered into contracts with general contractors for certain phases of the construction of these projects. However, these contracts do not generally cover all of the costs that are necessary to place these properties into service, including the cost of furniture and marketing and leasing costs. The unfunded commitments presented include all such costs, not only those costs that we are obligated to fund under the construction contracts. |
| |
(5) | Includes minimum annual lease payments under ground/facility lease agreements entered into with university systems and other third parties. Refer to Note 15 in the accompanying Notes to Consolidated Financial Statements contained in Item 8 for a more detailed discussion of our ground/facility leases. |
| |
(6) | Includes operating leases related to corporate office space and equipment (see Note 15 in the accompanying Notes to Consolidated Financial Statements contained in Item 8). |
| |
(7) | Includes the contractual purchase price and the cost of elected upgrades, net of $0.4 million in earnest money funded in December 2016, for a presale development project which Company is obligated to purchase as long as certain construction completion deadlines and other closing conditions are met (see Note 5 and Note 16 in the accompanying Notes to Consolidated Financial Statements contained in Item 8). |
| |
(8) | Includes the additional investments in joint ventures that were part of the Core Transaction. See Note 5 and Note 16 in the accompanying Notes to Consolidated Financial Statements contained in Item 8. |
Funds From Operations (“FFO”)
The National Association of Real Estate Investment Trusts (“NAREIT”) currently defines FFO as net income or loss attributable to common shares computed in accordance with generally accepted accounting principles (“GAAP”), excluding gains or losses from depreciable operating property sales, impairment charges and real estate depreciation and amortization, and after adjustments for unconsolidated partnerships and joint ventures. We present FFO because we consider it an important supplemental measure of our operating performance and believe it is frequently used by securities analysts, investors and other interested parties in the evaluation of REITs, many of which present FFO when reporting their results. FFO excludes GAAP historical cost depreciation and amortization of real estate and related assets, which assumes that the value of real estate diminishes ratably over time. Historically, however, real estate values have risen or fallen with market conditions. We therefore believe that FFO provides a performance measure that, when compared year over year, reflects the impact to operations from trends in occupancy rates, rental rates, operating costs, and interest costs, among other items, providing perspective not immediately apparent from net income. We compute FFO in accordance with standards established by the Board of Governors of NAREIT in its March 1995 White Paper (and as subsequently amended), which may differ from the methodology for calculating FFO utilized by other equity REITs and, accordingly, may not be comparable to such other REITs.
We also believe it is meaningful to present a measure we refer to as FFO-Modified, or FFOM, which reflects certain adjustments related to the economic performance of our on-campus participating properties, and the elimination of property acquisition costs, contractual executive separation and retirement charges and other non-cash items, as we determine in good faith. Under our participating ground leases, we and the participating university systems each receive 50% of the properties’ net cash available for distribution after payment of operating expenses, debt service (which includes significant amounts towards repayment of principal) and capital expenditures. A substantial portion of our revenues attributable to these properties is reflective of cash that is required to be used for capital expenditures and for the amortization of applicable property indebtedness. These amounts do not increase our economic interest in these properties or otherwise benefit us since our interest in the properties terminates upon the repayment of the applicable property indebtedness. Therefore, unlike the ownership of our owned properties, the unique features of our ownership interest in our on-campus participating properties cause the value of these properties to diminish over time. For example, since the ground/facility leases under which we operate the participating properties require the reinvestment from operations of specified amounts for capital expenditures and for the repayment of debt while our interest in these properties terminates upon the repayment of the debt, such capital expenditures do not increase the value of the property to us and mortgage debt amortization only increases the equity of the ground lessor. Accordingly, we believe it is meaningful to modify FFO to exclude the operations of our on-campus participating properties and to consider their impact on our performance by including only that portion of our revenues from those properties that are reflective of our share of net cash flow and the management fees that we receive, both of which increase and decrease with the operating performance of the properties. This narrower measure of performance measures our profitability for these properties in a manner that is similar to the measure of our profitability from our third-party services business where we similarly incur no initial or ongoing capital investment in a property and derive only consequential benefits from capital expenditures and debt amortization. We believe, however, that this narrower measure of performance is inappropriate in traditional real estate ownership structures where debt amortization and capital expenditures enhance the property owner’s long-term profitability from its investment.
Our FFOM may have limitations as an analytical tool because it reflects the contractual calculation of net cash flow from our on-campus participating properties, which is unique to us and is different from that of our owned off-campus properties. Companies
that are considered to be in our industry may not have similar ownership structures; and therefore those companies may not calculate FFOM in the same manner that we do, or at all, limiting its usefulness as a comparative measure. We compensate for these limitations by relying primarily on our GAAP and FFO results and using FFOM only supplementally. Further, FFO and FFOM do not represent amounts available for management’s discretionary use because of needed capital replacement or expansion, debt service obligations or other commitments and uncertainties. FFO and FFOM should not be considered as alternatives to net income or loss computed in accordance with GAAP as an indicator of our financial performance, or to cash flow from operating activities computed in accordance with GAAP as an indicator of our liquidity, nor are these measures indicative of funds available to fund our cash needs, including our ability to pay dividends or make distributions.
The following table presents a reconciliation of our net income attributable to common shareholders to FFO and FFOM:
|
| | | | | | | | | | | | |
| | | Year Ended December 31, |
| | | 2017 | | 2016 | | 2015 |
| Net income attributable to ACC, Inc. and Subsidiaries common stockholders | | $ | 69,038 |
| | $ | 99,061 |
| | $ | 115,991 |
|
| Noncontrolling interests | | 1,076 |
| | 1,562 |
| | 2,070 |
|
| Loss (gain) from disposition of real estate | | 632 |
| | (21,197 | ) | | (52,699 | ) |
Elimination of provision for real estate impairment (1) | | 15,317 |
| | 4,895 |
| | — |
|
| Real estate related depreciation and amortization | | 231,295 |
| | 208,276 |
| | 206,019 |
|
| Funds from operations (“FFO”) attributable to common stockholders and OP unitholders | | 317,358 |
| | 292,597 |
| | 271,381 |
|
| | | | | | | |
| Elimination of operations of on-campus participating properties: | | |
| | |
| | |
|
| Net income from on-campus participating properties | | (5,133 | ) | | (5,194 | ) | | (4,236 | ) |
| Amortization of investment in on-campus participating properties | | (7,536 | ) | | (7,343 | ) | | (7,034 | ) |
| | | 304,689 |
| | 280,060 |
| | 260,111 |
|
| Modifications to reflect operational performance of on-campus participating properties: | | |
| | |
| | |
|
Our share of net cash flow (2) | | 2,841 |
| | 2,964 |
| | 3,118 |
|
| Management fees | | 1,534 |
| | 1,503 |
| | 1,424 |
|
| Contribution from on-campus participating properties | | 4,375 |
| | 4,467 |
| | 4,542 |
|
| | | | | | | |
Property acquisition costs (3) | | 2,855 |
| | 326 |
| | 2,836 |
|
Contractual executive separation and retirement charges (4) | | 4,515 |
| | — |
| | — |
|
Elimination of loss from early extinguishment of debt (5) | | — |
| | 12,841 |
| | 1,770 |
|
| Funds from operations – modified (“FFOM”) attributable to common stockholders and OP unitholders | | $ | 316,434 |
| | $ | 297,694 |
| | $ | 269,259 |
|
| | | | | | | |
| FFO per share – diluted | | $ | 2.31 |
| | $ | 2.23 |
| | $ | 2.38 |
|
| | | | | | | |
| FFOM per share – diluted | | $ | 2.31 |
| | $ | 2.27 |
| | $ | 2.36 |
|
| | | | | | | |
Weighted average common shares outstanding - diluted | | 137,099,084 |
| | 131,340,992 |
| | 114,141,997 |
|
| |
(1) | Represents an impairment charge recorded for an owned property currently in receivership that is in the process of being transferred to the lender in settlement of the property’s $27.4 million mortgage loan that matured in August 2017, and an impairment charge recorded in the fourth quarter 2016 for The Province - Dayton (a property that was classified as held for sale as of December 31, 2016). |
| |
(2) | 50% of the properties’ net cash available for distribution after payment of operating expenses, debt service (including repayment of principal) and capital expenditures which is included in ground/facility leases expense in the accompanying Consolidated Statements of Comprehensive Income. |
| |
(3) | The year ended December 31, 2017 amount represents transaction costs related to our initial investment in the Core Joint Ventures. Refer to Note 5 in the accompanying Notes to Consolidated Financial Statements contained in Item 8 for a more detailed discussion. |
| |
(4) | Represents contractual executive separation and retirement charges incurred in the first and second quarter 2017 with regard to the retirement of the Company’s former Chief Financial Officer. |
| |
(5) | Represents losses associated with the early pay-off of mortgage loans for four properties sold during the year ended December 31, 2015 and nine properties sold during the year ended December 31, 2016. Such costs are excluded from gains from disposition of real estate reported in accordance with GAAP. However, we view the losses from early extinguishment of debt associated with the sales of real estate as an incremental cost of the sale transactions because we extinguished the debt in connection with the consummation of the sale transactions and we had no intent to extinguish the |
debt absent such transactions. We believe that adjusting FFOM to exclude these losses more appropriately reflects the results of our operations exclusive of the impact of our disposition transactions.
Inflation
Our student leases do not typically provide for rent escalations. However, they typically do not have terms that extend beyond 12 months. Accordingly, although on a short term basis we would be required to bear the impact of rising costs resulting from inflation, we have the opportunity to raise rental rates at least annually to offset such rising costs. However, a weak economic environment or declining student enrollment at our principal universities may limit our ability to raise rental rates.
Item 7A. Quantitative and Qualitative Disclosures About Market Risk
We are exposed to certain market risks inherent in our operations. These risks generally arise from transactions entered into in the normal course of business. We believe our primary market risk exposure relates to interest rate risk. We do not enter into derivatives or other financial instruments for trading or speculative purposes.
The table below provides information about our assets and our liabilities sensitive to changes in interest rates as of December 31, 2017 and 2016:
|
| | | | | | | | | | | | | | | | | | | | |
| | | December 31, 2017 | | December 31, 2016 |
| | | Amount (in 000s) | | Weighted Average Maturity (in years) | | Weighted Average Interest Rate | | % of Total | | Amount (in 000s) | | Weighted Average Maturity (in years) | | Weighted Average Interest Rate | | % of Total |
| Fixed rate debt | | $ | 2,099,371 |
| | 6.1 Years | | 4.00% | | 69.4% | | $ | 1,766,590 |
| | 6.1 Years | | 4.22% | | 83.5% |
Variable rate debt (1) | | 829,380 |
| | 2.6 Years | | 2.60% | | 27.4% | | 99,300 |
| | 1.2 Years | | 2.02% | | 4.7% |
Hedged debt (2) | | 97,537 |
| | 1.4 Years | | 3.30% | | 3.2% | | 248,584 |
| | 3.4 Years | | 2.51% | | 11.8% |
| Total consolidated debt | | $ | 3,026,288 |
| | 5.0 Years | | 3.60% | | 100.0% | | $ | 2,114,474 |
| | 5.5 Years | | 3.91% | | 100.0% |
| |
(1) | The balance at December 31, 2017, includes the Company’s unsecured revolving credit facility, unsecured term loans and construction loans associated with four in-process development properties. The balance at December 31, 2016, includes the Company’s unsecured revolving credit facility. See Note 10 in the accompanying Notes to Consolidated Financial Statements contained in Item 8 for further discussion. |
| |
(2) | The balance at December 31, 2017, includes mortgage loans which are effectively fixed by the use of interest rate swaps. The balance at December 31, 2016, includes mortgage loans and a $150 million outstanding balance on one of our unsecured term loans which are effectively fixed by the use of interest rate swaps. In January 2017, the interest rate swap on this term loan expired and the term loan became classified as variable rate debt. |
For fixed rate debt, interest rate changes affect the fair market value but do not impact net income attributable to common shareholders or cash flows. Conversely, for floating rate debt, interest rate changes generally do not affect the fair market value but do impact net income attributable to common shareholders and cash flows, assuming other factors are held constant. Holding other variables constant (such as debt levels), a one percentage point variance in interest rates (100 basis points) would change the unrealized fair market value of the fixed rate debt by approximately $273.9 million. Holding all other variables constant, the net income attributable to common shareholders and cash flow impact on the next year resulting from a one percentage point variance in interest rates on $829.4 million of floating rate debt would be approximately $7.3 million.
Derivative financial instruments expose us to credit risk in the event of non-performance by the counterparties under the terms of the interest rate hedge agreements. We believe we minimize our credit risk on these transactions by dealing with major, credit worthy financial institutions. As part of our on-going control procedures, we monitor the credit ratings of counterparties and our exposure to any single entity, thus minimizing credit risk concentration. We believe the likelihood of realized losses from counterparty non-performance is remote.
The following table summarizes the notional amount, carrying value, and estimated fair value of the Company’s derivative instruments used to hedge interest rates as of December 31, 2017:
|
| | | | | | | | | | | | | | | | | | | |
| | | | | | | | | Estimated Carrying Value | |
| Hedged Debt Instrument | | Notional Amount | | Maturity Date | | Carrying and Estimated Fair Value of (Liability) Asset | | + 100 Basis Points | | - 100 Basis Points | |
| Cullen Oaks mortgage loan | | $ | 13,698 |
| | February 15, 2021 | | $ | (95 | ) | | $ | 280 |
| | $ | (485 | ) | |
| Cullen Oaks mortgage loan | | 13,839 |
| | February 15, 2021 | | (96 | ) | | 283 |
| | (490 | ) | |
| Park Point mortgage loan | | 70,000 |
| | October 5, 2018 | | 87 |
| | 557 |
| | (389 | ) | |
| Total cash flow hedges | | $ | 97,537 |
| | | | $ | (104 | ) | | $ | 1,120 |
| | $ | (1,364 | ) | |
Item 8. Financial Statements and Supplementary Data
The information required herein is included as set forth in Item 15 (a) – Financial Statements.
Item 9. Changes in and Disagreements with Accountants on Accounting and Financial Disclosure
None.
Item 9A. Controls and Procedures
American Campus Communities, Inc.
| |
| (a) | Evaluation of Disclosure Controls and Procedures |
We have adopted and maintain disclosure controls and procedures that are designed to ensure that information required to be disclosed in our Exchange Act reports is recorded, processed, summarized and reported within the time periods specified in the Securities and Exchange Commission’s rules and forms and that such information is accumulated and communicated to our management, including our Chief Executive Officer and Chief Financial Officer, as appropriate, to allow for timely decisions regarding required disclosure. In designing and evaluating the disclosure controls and procedures, management recognizes that any controls and procedures, no matter how well designed and operated, can provide only reasonable assurance of achieving the desired control objectives, and management is required to apply its judgment in evaluating the cost-benefit relationship of possible controls and procedures.
As required by SEC Rule 13a-15(b), we have carried out an evaluation, under the supervision of and with the participation of management, including our Chief Executive Officer and Chief Financial Officer, of the effectiveness of the design and operation of our disclosure controls and procedures as of the end of the period covered by this report. Based on the foregoing, our Chief Executive Officer and Chief Financial Officer concluded that our disclosure controls and procedures for the period covered by this report were effective.
There has been no change in our internal control over financial reporting during our most recent fiscal quarter that has materially affected, or is reasonably likely to materially affect, our internal control over financial reporting.
| |
| (b) | Management’s Annual Report on Internal Control over Financial Reporting |
The management of American Campus Communities, Inc. is responsible for establishing and maintaining adequate internal control over financial reporting. We have designed our internal control over financial reporting to provide reasonable assurance that our published financial statements are fairly presented, in all material respects, in conformity with generally accepted accounting principles.
Our management is required by paragraph (c) of Rule 13a-15 of the Securities Exchange Act of 1934, as amended, to assess the effectiveness of our internal control over financial reporting as of the end of each fiscal year. In making this assessment, our management used the Internal Control — Integrated Framework (2013 framework) issued by the Committee of Sponsoring Organizations of the Treadway Commission (“COSO”).
Our management conducted the required assessment of the effectiveness of our internal control over financial reporting as of December 31, 2017. Based upon this assessment, our management believes that our internal control over financial reporting is effective as of December 31, 2017. Ernst & Young LLP, an independent registered public accounting firm, has issued an attestation report regarding the effectiveness of our internal control over financial reporting, which is included herein.
American Campus Communities Operating Partnership, L.P.
| |
| (a) | Evaluation of Disclosure Controls and Procedures |
The Operating Partnership has adopted and maintains disclosure controls and procedures that are designed to ensure that information required to be disclosed by the Operating Partnership in its Exchange Act filings is recorded, processed, summarized and reported within the time periods specified in the Securities and Exchange Commission’s rules and forms and that such information is accumulated and communicated to our management, including the Chief Executive Officer and Chief Financial Officer of ACC, as appropriate, to allow for timely decisions regarding required disclosure. In designing and evaluating the disclosure controls and procedures, management recognizes that any controls and procedures, no matter how well designed and operated, can provide only reasonable assurance of achieving the desired control objectives, and management is required to apply its judgment in evaluating the cost-benefit relationship of possible controls and procedures.
As required by SEC Rule 13a-15(b), the Operating Partnership has carried out an evaluation, under the supervision of and with the participation of the Operating Partnership’s management, including the Chief Executive Officer and Chief Financial Officer of ACC, of the effectiveness of the design and operation of the Operating Partnership’s disclosure controls and procedures as of the end of the period covered by this report. Based on the foregoing, the Chief Executive Officer and Chief Financial Officer concluded that our disclosure controls and procedures for the period covered by this report were effective.
There has been no change in the Operating Partnership’s internal control over financial reporting during the most recent fiscal quarter that has materially affected, or is reasonably likely to materially affect, the Operating Partnership’s internal control over financial reporting.
| |
| (b) | Management’s Annual Report on Internal Control over Financial Reporting |
The management of American Campus Communities Operating Partnership, L.P. is responsible for establishing and maintaining adequate internal control over financial reporting. We have designed our internal control over financial reporting to provide reasonable assurance that our published financial statements are fairly presented, in all material respects, in conformity with generally accepted accounting principles.
Our management is required by paragraph (c) of Rule 13a-15 of the Securities Exchange Act of 1934, as amended, to assess the effectiveness of our internal control over financial reporting as of the end of each fiscal year. In making this assessment, our management used the Internal Control — Integrated Framework (2013 framework) issued by the Committee of Sponsoring Organizations of the Treadway Commission (“COSO”).
The Operating Partnership conducted the required assessment of the effectiveness of its internal control over financial reporting as of December 31, 2017. Based upon this assessment, our management believes that our internal control over financial reporting is effective as of December 31, 2017. Ernst & Young LLP, an independent registered public accounting firm, has issued an attestation report regarding the effectiveness of the Operating Partnership’s internal control over financial reporting, which is included herein.
PART III
Item 10. Directors, Executive Officers and Corporate Governance
Information with respect to this Item 10 is incorporated by reference from our Proxy Statement, which we intend to file on or before March 31, 2018 in connection with the Annual Meeting of Stockholders to be held May 3, 2018.
Item 11. Executive Compensation
Information with respect to this Item 11 is incorporated by reference from our Proxy Statement, which we intend to file on or before March 31, 2018 in connection with the Annual Meeting of Stockholders to be held May 3, 2018.
Item 12. Security Ownership of Certain Beneficial Owners and Management and Related Stockholder Matters
Information pertaining to security ownership of management and certain beneficial owners of the Company’s common stock with respect to this Item 12 is incorporated by reference from our Proxy Statement, which we intend to file on or before March 31, 2018 in connection with the Annual Meeting of Stockholders to be held May 3, 2018, to the extent not set forth below.
The Company maintains the American Campus Communities, Inc. 2010 Incentive Award Plan (the “2010 Plan”), as discussed in more detail in Note 12 in the accompanying Notes to Consolidated Financial Statements in Item 8.
As of December 31, 2017, the total units and shares issued under the 2010 Plan were as follows:
|
| | | | | | | | | |
| | | # of Securities to be Issued Upon Exercise of Outstanding Options, Warrants, and Rights | | | Weighted-Average Exercise Price of Outstanding Options, Warrants, and Rights | | # of Securities Remaining Available for Future Issuance Under Equity Compensation Plans |
| Equity Compensation Plans Approved by Security Holders | | 910,648 |
| (1) | | n/a | | 468,022 |
|
| Equity Compensation Plans Not Approved by Security Holders | | n/a |
| | | n/a | | n/a |
|
| |
(1) | Consists of restricted stock awards granted to executive officers and certain employees and common units of limited partnership interest in the Operating Partnership. |
Item 13. Certain Relationships, Related Transactions and Director Independence
Information with respect to this Item 13 is incorporated by reference from our Proxy Statement, which we intend to file on or before March 31, 2018 in connection with the Annual Meeting of Stockholders to be held May 3, 2018.
Item 14. Principal Accountant Fees and Services
Information with respect to this Item 14 is incorporated by reference from our Proxy Statement, which we intend to file on or before March 31, 2018 in connection with the Annual Meeting of Stockholders to be held May 3, 2018.
PART IV
Item 15. ��Exhibits and Financial Statement Schedules
(a) Financial Statements
The following consolidated financial information is included as a separate section of this Annual Report on Form 10-K:
|
| |
| | Page No. |
| Report of Independent Registered Public Accounting Firm (American Campus Communities, Inc.) | |
| Report of Independent Registered Public Accounting Firm (American Campus Communities Operating Partnership, L.P.) | |
| Report of Independent Registered Public Accounting Firm on Internal Control over Financial Reporting (American Campus Communities, Inc.) | |
Report of Independent Registered Public Accounting Firm on Internal Control over Financial Reporting (American Campus Communities Operating Partnership, L.P.) | |
| Consolidated Financial Statements of American Campus Communities, Inc. and Subsidiaries | |
| Consolidated Balance Sheets as of Balance, December 31, 2017 and 2016 | |
| Consolidated Statements of Comprehensive Income for the years ended December 31, 2017, 2016 and 2015 | |
| Consolidated Statements of Changes in Equity for the years ended December 31, 2017, 2016 and 2015 | |
| Consolidated Statements of Cash Flows for the years ended December 31, 2017, 2016 and 2015 | |
Consolidated Financial Statements of American Campus Communities Operating Partnership, L.P. and Subsidiaries | |
| Consolidated Balance Sheets as of Balance, December 31, 2017 and 2016 | |
| Consolidated Statements of Comprehensive Income for the years ended December 31, 2017, 2016 and 2015 | |
| Consolidated Statements of Changes in Capital for the years ended December 31, 2017, 2016 and 2015 | |
| Consolidated Statements of Cash Flows for the years ended December 31, 2017, 2016 and 2015 | |
Notes to Consolidated Financial Statements of American Campus Communities, Inc. and Subsidiaries and American Campus Communities Operating Partnership, L.P. and Subsidiaries | |
(b) Exhibits
|
| |
Exhibit Number | Description of Document |
|
| |
| | |
| Articles of Amendment and Restatement of American Campus Communities, Inc. Incorporated by reference to Exhibit 3.1 to the Registration Statement on Form S-11 (Registration No. 333-114813) of American Campus Communities, Inc. |
| | |
| American Campus Communities, Inc. Articles Supplementary. Incorporated by reference to Exhibit 3.1 to Current Report on Form 8-K of American Campus Communities, Inc. (File No. 001-32265) and American Campus Communities Operating Partnership LP (File No. 333-181102-01) filed on March 6, 2017. |
| | |
| Bylaws of American Campus Communities, Inc. Incorporated by reference to Exhibit 3.2 to the Registration Statement on Form S-11 (Registration No. 333-114813) of American Campus Communities, Inc. |
| | |
| Amendment to Bylaws of American Campus Communities, Inc. Incorporated by reference to Exhibit 3.1 to Current Report on Form 8-K of American Campus Communities, Inc. (File No. 001-32265) and American Campus Communities Operating Partnership LP (File No. 333-181102-01) filed on February 24, 2014. |
| | |
| Second Amendment to the Bylaws of American Campus Communities, Inc. Incorporated by reference to Exhibit 3.2 to Current Report on Form 8-K of American Campus Communities, Inc. (File No. 001-32265) and American Campus Communities Operating Partnership LP (File No. 333-181102-01) filed on March 6, 2017. |
| | |
|
| |
| Third Amendment to the Bylaws of American Campus Communities, Inc. Incorporated by reference to Exhibit 3.1 to Current Report on Form 8-K of American Campus Communities, Inc. (File No. 001-32265) and American Campus Communities Operating Partnership LP (File No. 333-181102-01) filed on April 21, 2017. |
| | |
| Form of Certificate for Common Stock of American Campus Communities, Inc. Incorporated by reference to Exhibit 4.1 to the Registration Statement on Form S-11 (Registration No. 333-114813) of American Campus Communities, Inc. |
| | |
| Indenture, dated as of April 2, 2013, among American Campus Communities Operating Partnership LP, as issuer, American Campus Communities, Inc., as guarantor, and U.S. Bank National Association, as trustee. Incorporated by reference to Exhibit 4.1 to Current Report on Form 8-K of American Campus Communities, Inc. (File No. 001-32265) and American Campus Communities Operating Partnership LP (File No. 333-181102-01) filed on April 3, 2013. |
| | |
| First Supplemental Indenture, dated as of April 2, 2013, among American Campus Communities Operating Partnership LP, as issuer, American Campus Communities, Inc., as guarantor, and U.S. Bank National Association, as trustee. Incorporated by reference to Exhibit 4.2 to Current Report on Form 8-K of American Campus Communities, Inc. (File No. 001-32265) and American Campus Communities Operating Partnership LP (File No. 333-181102-01) filed on April 3, 2013. |
| | |
| American Campus Communities Operating Partnership LP 3.750% Senior Notes due 2023. Incorporated by reference to Exhibit 4.3 to Current Report on Form 8-K of American Campus Communities, Inc. (File No. 001-32265) and American Campus Communities Operating Partnership LP (File No. 333-181102-01) filed on April 3, 2013. |
| | |
| American Campus Communities Operating Partnership LP 4.125% Senior Notes due 2024. Incorporated by reference to Exhibit 4.3 to Current Report on Form 8-K of American Campus Communities, Inc. (File No. 001-32265) and American Campus Communities Operating Partnership LP (File No. 333-181102-01) filed on June 25, 2014. |
| | |
| American Campus Communities Operating Partnership LP 3.350 % Senior Notes due 2020. Incorporated by reference to Exhibit 4.3 to Current Report on Form 8-K of American Campus Communities, Inc. (File No. 001-32265) and American Campus Communities Operating Partnership LP (File No. 333-181102-01) filed on September 22, 2015. |
| | |
| American Campus Communities Operating Partnership LP 3.635% Senior Notes due 2027. Incorporated by reference to Exhibit 4.3 to Current Report on Form 8-K of American Campus Communities, Inc. (File No. 001-32265) and American Campus Communities Operating Partnership LP (File No. 333-181102-01) filed on October 11, 2017. |
| | |
| Form of Guarantee of American Campus Communities, Inc. of Senior Debt Securities. Incorporated by reference to Exhibit 4.4 to Current Report on Form 8-K of American Campus Communities, Inc. (File No. 001-32265) and American Campus Communities Operating Partnership LP (File No. 333-181102-01) filed on April 3, 2013. |
| | |
| Form of Registration Rights and Lock-Up Agreement, dated as of March 1, 2006, between American Campus Communities, Inc. and each of the persons who are signatory thereto. Incorporated by reference to Exhibit 99.3 to Current Report on Form 8-K of American Campus Communities, Inc. (File No. 001-32265) filed on March 7, 2006. |
| | |
| Form of Registration Rights and Lock-Up Agreement, dated as of September 14, 2012, between American Campus Communities, Inc., American Campus Communities Operating Partnership, L.P. and each of the persons who are signatories thereto. Incorporated by reference to Exhibit 10.1 to Quarterly Report on Form 10-Q of American Campus Communities, Inc. (File No. 001-32265) and American Campus Communities Operating Partnership LP (File No. 333-181102-01) for the quarter ended September 30, 2012. |
| | |
| Letter Agreement Regarding Issuance of OP Units, dated September 26, 2013, between Hallmark Student Housing Lexington, LLC, on one hand, and ACC OP (Lexington) LLC and American Campus Communities Operating Partnership, L.P., on the other hand. Incorporated by reference to Exhibit 4.1 to Quarterly Report on Form 10-Q of American Campus Communities, Inc. (File No. 001-32265) and American Campus Communities Operating Partnership LP (File No. 333-181102-01) for the quarter ended September 30, 2013. |
| | |
| Form of Amended and Restated Partnership Agreement of American Campus Communities Operating Partnership LP. Incorporated by reference to Exhibit 10.1 to the Registration Statement on Form S-11 (Registration No. 333-114813) of American Campus Communities, Inc. |
| | |
|
| |
| Form of First Amendment to Amended and Restated Agreement of Limited Partnership of American Campus Communities Operating Partnership LP, dated as of March 1, 2006, between American Campus Communities Holdings LLC and those persons who have executed such amendment as limited partners. Incorporated by reference to Exhibit 99.2 to Current Report on Form 8-K of American Campus Communities, Inc. (File No. 001-32265) filed on March 7, 2006. |
| | |
| American Campus Communities, Inc. 2004 Incentive Award Plan. Incorporated by reference to Exhibit 10.2 to the Registration Statement on Form S-11 (Registration No. 333-114813) of American Campus Communities, Inc. |
| | |
| Amendment No. 1 to American Campus Communities, Inc. 2004 Incentive Award Plan. Incorporated by reference to Exhibit 99.7 to Current Report on Form 8-K of American Campus Communities, Inc. (File No. 001-32265) filed on November 5, 2007. |
| | |
| Amendment No. 2 to American Campus Communities, Inc. 2004 Incentive Award Plan. Incorporated by reference to Exhibit 99.1 to Current Report on Form 8-K of American Campus Communities, Inc. (File No. 001-32265) filed on March 11, 2008. |
| | |
| American Campus Communities, Inc. 2010 Incentive Award Plan. Incorporated by reference to Exhibit 99.1 to Current Report on Form 8-K of American Campus Communities, Inc. (File No. 001-32265) filed on May 7, 2010. |
| | |
| American Campus Communities Services, Inc. Deferred Compensation Plan, effective January 1, 2015. Incorporated by reference to Exhibit 99.1 to Current Report on Form 8-K of American Campus Communities, Inc. (File No. 001-32265) and American Campus Communities Operating Partnership LP (File No. 333-181102-01) filed on December 17, 2014. |
| | |
| Form of PIU Grant Notice (including Registration Rights). Incorporated by reference to Exhibit 10.4 to the Registration Statement on Form S-11 (Registration No. 333-114813) of American Campus Communities, Inc. |
| | |
| Form of PIU Grant Notice (including Registration Rights), dated as of August 20, 2007. Incorporated by reference to Exhibit 99.1 to Current Report on Form 8-K of American Campus Communities, Inc. (File No. 001-32265) filed on August 23, 2007. |
| | |
| Form of Indemnification Agreement between American Campus Communities, Inc. and certain of its directors and officers. Incorporated by reference to Exhibit 10.5 to the Registration Statement on Form S-11 (Registration No. 333-114813) of American Campus Communities, Inc. |
| | |
| Form of Employment Agreement between American Campus Communities, Inc. and William C. Bayless, Jr. Incorporated by reference to Exhibit 10.6 to the Registration Statement on Form S-11 (Registration No. 333-114813) of American Campus Communities, Inc. |
| | |
| Amendment No. 1 to Employment Agreement, dated as of April 28, 2005, between American Campus Communities, Inc. and William C. Bayless, Jr. Incorporated by reference to Exhibit 99.6 to Current Report on Form 8-K of American Campus Communities, Inc. (File No. 001-32265) filed on May 3, 2005. |
| | |
| Amendment No. 2 to Employment Agreement, dated as of November 1, 2007, between American Campus Communities, Inc. and William C. Bayless, Jr. Incorporated by reference to Exhibit 99.3 to Current Report on Form 8-K of American Campus Communities, Inc. (File No. 001-32265) filed on November 5, 2007. |
| | |
| Third Amendment to Employment Agreement, dated as of March 23, 2010, between William C. Bayless, Jr. and American Campus Communities, Inc. Incorporated by reference to Exhibit 99.1 to Current Report on Form 8-K of American Campus Communities, Inc. (File No. 001-32265) filed on March 24, 2010. |
| | |
| Fourth Amendment to Employment Agreement, dated as of January 10, 2017, between American Campus Communities, Inc. and William C. Bayless, Jr. Incorporated by reference to Exhibit 99.2 to Current Report on Form 8-K of American Campus Communities, Inc. (File No. 001-32265) and American Campus Communities Operating Partnership LP (File No. 333-181102-01) filed on January 10, 2017. |
| | |
| Employment Agreement, dated as of April 18, 2005, between American Campus Communities, Inc. and James C. Hopke. Incorporated by reference to Exhibit 99.1 to Current Report on Form 8-K of American Campus Communities, Inc. (File No. 001-32265) filed on May 3, 2005. |
| | |
| Amendment No. 1 to Employment Agreement, dated as of November 1, 2007, between American Campus Communities, Inc. and James C. Hopke. Incorporated by reference to Exhibit 99.6 to Current Report on Form 8-K of American Campus Communities, Inc. (File No. 001-32265) filed on November 5, 2007. |
| | |
|
| |
| Second Amendment to Employment Agreement, dated as of March 23, 2010, between James C. Hopke, Jr. and American Campus Communities, Inc. Incorporated by reference to Exhibit 99.4 to Current Report on Form 8-K of American Campus Communities, Inc. (File No. 001-32265) filed on March 24, 2010. |
| | |
| Third Amendment to Employment Agreement, dated as of December 2, 2013, between James C. Hopke, Jr. and American Campus Communities, Inc. Incorporated by reference to Exhibit 99.1 to Current Report on Form 8-K of American Campus Communities, Inc. (File No. 001-32265) and American Campus Communities Operating Partnership LP (File No. 333-181102-01) filed on December 5, 2013. |
| | |
| Fourth Amendment to Employment Agreement, dated as of May 20, 2014, between American Campus Communities, Inc. and James C. Hopke, Jr. Incorporated by reference to Exhibit 99.3 to Current Report on Form 8-K of American Campus Communities, Inc. (File No. 001-32265) and American Campus Communities Operating Partnership LP (File No. 333-181102-01) filed on May 23, 2014. |
| | |
| Fifth Amendment to Employment Agreement, dated as of January 10, 2017, between American Campus Communities, Inc. and James C. Hopke, Jr. Incorporated by reference to Exhibit 99.3 to Current Report on Form 8-K of American Campus Communities, Inc. (File No. 001-32265) and American Campus Communities Operating Partnership LP (File No. 333-181102-01) filed on January 10, 2017. |
| | |
| Employment Agreement, dated as of May 4, 2011, between William W. Talbot and American Campus Communities, Inc. Incorporated by reference to Exhibit 99.1 to Current Report on Form 8-K of American Campus Communities, Inc. (File No. 001-32265) and American Campus Communities Operating Partnership LP (File No. 333-181102-01) filed on March 21, 2013. |
| | |
| First Amendment to Employment Agreement, dated as of November 2, 2012, between William W. Talbot and American Campus Communities, Inc. Incorporated by reference to Exhibit 99.2 to Current Report on Form 8-K of American Campus Communities, Inc. (File No. 001-32265) and American Campus Communities Operating Partnership LP (File No. 333-181102-01) filed on March 21, 2013. |
| | |
| Employment Agreement, dated as of May 4, 2011, between Daniel B. Perry and American Campus Communities, Inc. Incorporated by reference to Exhibit 10.24 to Annual Report on Form 10-K of American Campus Communities, Inc. (File No. 001-32265) and American Campus Communities Operating Partnership LP (File No. (File No. 333-181102-01) for the year ended December 31, 2014. |
| | |
| First Amendment to Employment Agreement, dated as of November 2, 2012, between Daniel B. Perry and American Campus Communities, Inc. Incorporated by reference to Exhibit 10.25 to Annual Report on Form 10-K of American Campus Communities, Inc. (File No. 001-32265) and American Campus Communities Operating Partnership LP (File No. (File No. 333-181102-01) for the year ended December 31, 2014. |
| | |
| Second Amendment to Employment Agreement, dated as of January 10, 2017, between American Campus Communities, Inc. and Daniel B. Perry. Incorporated by reference to Exhibit 99.4 to Current Report on Form 8-K of American Campus Communities, Inc. (File No. 001-32265) and American Campus Communities Operating Partnership LP (File No. 333-181102-01) filed on January 10, 2017. |
| | |
| Employment Agreement, dated as of October 16, 2013, between American Campus Communities, Inc. and Jennifer Beese. |
| | |
| First Amendment to Employment Agreement, dated as of January 10, 2017, between American Campus Communities, Inc. and Jennifer Beese. |
| | |
| Separation Agreement and Mutual General Release, dated as of January 10, 2017, between American Campus Communities, Inc. and Jonathan A. Graf. Incorporated by reference to Exhibit 99.1 to Current Report on Form 8-K of American Campus Communities, Inc. (File No. 001-32265) and American Campus Communities Operating Partnership LP (File No. 333-181102-01) filed on January 10, 2017. |
| | |
| Form of Confidentiality and Noncompetition Agreement. Incorporated by reference to Exhibit 10.9 to the Registration Statement on Form S-11 (Registration No. 333-114813) of American Campus Communities, Inc. |
| | |
|
| |
| Fifth Amended and Restated Credit Agreement, dated as of January 11, 2017, among American Campus Communities Operating Partnership LP, as Borrower; American Campus Communities, Inc., as Parent Guarantor; any Additional Guarantors (as defined therein) acceding thereto pursuant to Section 7.05 thereof; the banks, financial institutions and other lenders listed on the signature pages thereof as the Initial Lenders, Initial Issuing Bank and Swing Line Bank; KeyBank National Association, as Administrative Agent; KeyBanc Capital Markets Inc., J.P. Morgan Securities LLC and Capital One National Association, as Joint Lead Arrangers; JPMorgan Chase Bank, N.A. and Capital One National Association, as Co-Syndication Agents; and Bank of America, N.A., U.S. Bank National Association and Compass Bank, as Co-Documentation Agents. Incorporated by reference to Exhibit 99.1 to Current Report on Form 8-K of American Campus Communities, Inc. (File No. 001-32265) and American Campus Communities Operating Partnership LP (File No. 333-181102-01) filed on January 11, 2017. |
| | |
| Form of Tax Matters Agreement, dated as of March 1, 2006, among American Campus Communities Operating Partnership LP, American Campus Communities, Inc., American Campus Communities Holdings LLC and each of the limited partners of American Campus Communities Operating Partnership LP who have executed a signature page thereto. Incorporated by reference to Exhibit 99.4 to Current Report on Form 8-K of American Campus Communities, Inc. (File No. 001-32265) filed on March 7, 2006. |
| | |
| Equity Distribution Agreement, dated June 25, 2015, between American Campus Communities, Inc., American Campus Communities Operating Partnership LP and American Campus Communities Holdings LLC, on one hand, and Merrill Lynch, Pierce, Fenner & Smith Incorporated, on the other hand. Incorporated by reference to Exhibit 1.1 to Current Report on Form 8-K of American Campus Communities, Inc. (File No. 001-32265) and American Campus Communities Operating Partnership LP (File No. 333-181102-01) filed on June 25, 2015. |
| | |
| Equity Distribution Agreement, dated June 25, 2015, between American Campus Communities, Inc., American Campus Communities Operating Partnership LP and American Campus Communities Holdings LLC, on one hand, and Deutsche Bank Securities Inc., on the other hand. Incorporated by reference to Exhibit 1.2 to Current Report on Form 8-K of American Campus Communities, Inc. (File No. 001-32265) and American Campus Communities Operating Partnership LP (File No. 333-181102-01) filed on June 25, 2015. |
| | |
| Equity Distribution Agreement, dated June 25, 2015, between American Campus Communities, Inc., American Campus Communities Operating Partnership LP and American Campus Communities Holdings LLC, on one hand, and J.P. Morgan Securities LLC, on the other hand. Incorporated by reference to Exhibit 1.3 to Current Report on Form 8-K of American Campus Communities, Inc. (File No. 001-32265) and American Campus Communities Operating Partnership LP (File No. 333-181102-01) filed on June 25, 2015. |
| | |
| Equity Distribution Agreement, dated June 25, 2015, between American Campus Communities, Inc., American Campus Communities Operating Partnership LP and American Campus Communities Holdings LLC, on one hand, and KeyBanc Capital Markets Inc., on the other hand. Incorporated by reference to Exhibit 1.4 to Current Report on Form 8-K of American Campus Communities, Inc. (File No. 001-32265) and American Campus Communities Operating Partnership LP (File No. 333-181102-01) filed on June 25, 2015. |
| | |
| Statement Regarding Computation of Ratios. |
| | |
| List of Subsidiaries of the Registrant. |
| | |
| Consent of Ernst & Young LLP - American Campus Communities, Inc. |
| | |
| Consent of Ernst & Young LLP - American Campus Communities Operating Partnership, L.P. |
| | |
| American Campus Communities, Inc. - Certification of Chief Executive Officer Pursuant to Section 302 of the Sarbanes-Oxley Act of 2002 |
| | |
| American Campus Communities, Inc. - Certification of Chief Financial Officer Pursuant to Section 302 of the Sarbanes-Oxley Act of 2002. |
| | |
| American Campus Communities Operating Partnership, L.P. - Certification of Chief Executive Officer Pursuant to Section 302 of the Sarbanes-Oxley Act of 2002. |
| | |
| American Campus Communities Operating Partnership, L.P. - Certification of Chief Financial Officer Pursuant to Section 302 of the Sarbanes-Oxley Act of 2002. |
| | |
| American Campus Communities, Inc. - Certification of Chief Executive Officer Pursuant to 18 U. S. C. Section 1350, as Adopted Pursuant to Section 906 of the Sarbanes-Oxley Act of 2002. |
| | |
|
| |
| American Campus Communities, Inc. - Certification of Chief Financial Officer Pursuant to 18 U.S.C. Section 1350, as Adopted Pursuant to Section 906 of the Sarbanes-Oxley Act of 2002. |
| | |
| American Campus Communities Operating Partnership, L.P. - Certification of Chief Executive Officer Pursuant to 18 U. S. C. Section 1350, as Adopted Pursuant to Section 906 of the Sarbanes-Oxley Act of 2002. |
| | |
| American Campus Communities Operating Partnership, L.P. - Certification of Chief Financial Officer Pursuant to 18 U.S.C. Section 1350, as Adopted Pursuant to Section 906 of the Sarbanes-Oxley Act of 2002. |
| | |
| 101.INS | XBRL Instance Document |
| | |
| 101.SCH | XBRL Taxonomy Extension Schema Document |
| | |
| 101.CAL | XBRL Taxonomy Extension Calculation Linkbase Document |
| | |
| 101.DEF | XBRL Taxonomy Extension Definition Linkbase Document |
| | |
| 101.LAB | XBRL Taxonomy Extension Label Linkbase Document |
| | |
| 101.PRE | XBRL Taxonomy Extension Presentation Linkbase Document |
| | |
| * | Indicates management compensation plan. |
SIGNATURES
Pursuant to the requirements of Section 13 or 15(d) of the Securities Exchange Act of 1934, the registrant has duly caused this report to be signed on its behalf by the undersigned, thereunto duly authorized.
|
| |
| AMERICAN CAMPUS COMMUNITIES, INC. |
| | |
| By: | /s/ William C. Bayless, Jr. |
| | |
| | William C. Bayless, Jr. Chief Executive Officer |
Pursuant to the requirements of Section 13 or 15(d) of the Securities Exchange Act of 1934, the registrant has duly caused this report to be signed on its behalf by the undersigned, thereunto duly authorized.
|
| |
| AMERICAN CAMPUS COMMUNITIES OPERATING PARTNERSHIP, L.P. |
By: American Campus Communities Holdings, LLC, its general partner By: American Campus Communities, Inc., its sole member |
| | |
| By: | /s/ William C. Bayless, Jr. |
| | |
| | William C. Bayless, Jr. Chief Executive Officer |
Pursuant to the requirements of the Securities Exchange Act of 1934, this report has been signed below by the following persons on behalf of the registrant and in the capacities and on the dates indicated.
|
| | | | |
| Name | | Title | | Date |
| | | | | |
| | | | | |
| /s/ William C. Bayless, Jr. | | Chief Executive Officer and Director (Principal Executive Officer) | | March 1, 2018 |
| William C. Bayless, Jr. | | | |
| | | | | |
| /s/ Daniel B. Perry | | Executive Vice President, Chief Financial Officer, Treasurer and Secretary (Principal Financial Officer) | | March 1, 2018 |
| Daniel B. Perry | | | |
| | | | | |
| /s/ Kim K. Voss | | Executive Vice President and Chief Accounting Officer (Principal Accounting Officer) | | March 1, 2018 |
| Kim K. Voss | | | |
| | | | | |
| /s/ Edward Lowenthal | | Chairman of the Board of Directors | | March 1, 2018 |
| Edward Lowenthal | | | | |
| | | | | |
| /s/ William Blakeley Chandlee III | | Director | | March 1, 2018 |
| William Blakeley Chandlee III | | | | |
| | | | | |
| /s/ G. Steven Dawson | | Director | | March 1, 2018 |
| G. Steven Dawson | | | | |
| | | | | |
| /s/ Cydney C. Donnell | | Director | | March 1, 2018 |
| Cydney Donnell | | | | |
| | | | | |
| /s/ Oliver Luck | | Director | | March 1, 2018 |
| Oliver Luck | | | | |
| | | | | |
| /s/ C. Patrick Oles, Jr. | | Director | | March 1, 2018 |
| C. Patrick Oles, Jr. | | | | |
| | | | | |
Report of Independent Registered Public Accounting Firm
To the Shareholders and the Board of Directors of American Campus Communities, Inc. and Subsidiaries
Opinion on the Financial Statements
We have audited the accompanying consolidated balance sheets of American Campus Communities, Inc. and Subsidiaries (the Company) as of December 31, 2017 and 2016, the related consolidated statements of comprehensive income, changes in equity, and cash flows for each of the three years in the period ended December 31, 2017, and the related notes (collectively referred to as the “consolidated financial statements”). In our opinion, the consolidated financial statements present fairly, in all material respects, the financial position of the Company at December 31, 2017 and 2016, and the results of its operations and its cash flows for each of the three years in the period ended December 31, 2017, in conformity with U.S. generally accepted accounting principles.
We also have audited, in accordance with the standards of the Public Company Accounting Oversight Board (United States) (PCAOB), the Company’s internal control over financial reporting as of December 31, 2017, based on criteria established in Internal Control-Integrated Framework issued by the Committee of Sponsoring Organizations of the Treadway Commission (2013 framework) and our report dated March 1, 2018 expressed an unqualified opinion thereon.
Basis for Opinion
These financial statements are the responsibility of the Company’s management. Our responsibility is to express an opinion on the Company’s financial statements based on our audits. We are a public accounting firm registered with the PCAOB and are required to be independent with respect to the Company in accordance with the U.S. federal securities laws and the applicable rules and regulations of the Securities and Exchange Commission and the PCAOB.
We conducted our audits in accordance with the standards of the PCAOB. Those standards require that we plan and perform the audit to obtain reasonable assurance about whether the financial statements are free of material misstatement, whether due to error or fraud. Our audits included performing procedures to assess the risks of material misstatement of the financial statements, whether due to error or fraud, and performing procedures that respond to those risks. Such procedures included examining, on a test basis, evidence regarding the amounts and disclosures in the financial statements. Our audits also included evaluating the accounting principles used and significant estimates made by management, as well as evaluating the overall presentation of the financial statements. We believe that our audits provide a reasonable basis for our opinion.
We have served as the Company’s auditor since 2004.
Austin, Texas
March 1, 2018
Report of Independent Registered Public Accounting Firm
To the Partners of American Campus Communities Operating Partnership, L.P. and Subsidiaries
Opinion on the Financial Statements
We have audited the accompanying consolidated balance sheets of American Campus Communities Operating Partnership, L.P. and Subsidiaries (the Company) as of December 31, 2017 and 2016, the related consolidated statements of comprehensive income, changes in capital, and cash flows for each of the three years in the period ended December 31, 2017, and the related notes (collectively referred to as the “consolidated financial statements”). In our opinion, the consolidated financial statements present fairly, in all material respects, the financial position of the Company at December 31, 2017 and 2016, and the results of its operations and its cash flows for each of the three years in the period ended December 31, 2017, in conformity with U.S. generally accepted accounting principles.
We also have audited, in accordance with the standards of the Public Company Accounting Oversight Board (United States) (PCAOB), the Company’s internal control over financial reporting as of December 31, 2017, based on criteria established in Internal Control-Integrated Framework issued by the Committee of Sponsoring Organizations of the Treadway Commission (2013 framework) and our report dated March 1, 2018 expressed an unqualified opinion thereon.
Basis for Opinion
These financial statements are the responsibility of the Company’s management. Our responsibility is to express an opinion on the Company’s financial statements based on our audits. We are a public accounting firm registered with the PCAOB and are required to be independent with respect to the Company in accordance with the U.S. federal securities laws and the applicable rules and regulations of the Securities and Exchange Commission and the PCAOB.
We conducted our audits in accordance with the standards of the PCAOB. Those standards require that we plan and perform the audit to obtain reasonable assurance about whether the financial statements are free of material misstatement, whether due to error or fraud. Our audits included performing procedures to assess the risks of material misstatement of the financial statements, whether due to error or fraud, and performing procedures that respond to those risks. Such procedures included examining, on a test basis, evidence regarding the amounts and disclosures in the financial statements. Our audits also included evaluating the accounting principles used and significant estimates made by management, as well as evaluating the overall presentation of the financial statements. We believe that our audits provide a reasonable basis for our opinion.
We have served as the Company’s auditor since 2012.
Austin, Texas
March 1, 2018
Report of Independent Registered Public Accounting Firm
To the Shareholders and the Board of Directors of American Campus Communities, Inc. and Subsidiaries
Opinion on Internal Control over Financial Reporting
We have audited American Campus Communities, Inc. and Subsidiaries’ internal control over financial reporting as of December 31, 2017, based on criteria established in Internal Control-Integrated Framework issued by the Committee of Sponsoring Organizations of the Treadway Commission (2013 framework) (the COSO criteria). In our opinion, American Campus Communities, Inc. and Subsidiaries (the Company) maintained, in all material respects, effective internal control over financial reporting as of December 31, 2017, based on the COSO criteria.
We also have audited, in accordance with the standards of the Public Company Accounting Oversight Board (United States) (PCAOB), the consolidated balance sheets of the Company as of December 31, 2017 and 2016, the related consolidated statements of comprehensive income, changes in equity, and cash flows for each of the three years in the period ended December 31, 2017, and the related notes and our report dated March 1, 2018 expressed an unqualified opinion thereon.
Basis for Opinion
The Company’s management is responsible for maintaining effective internal control over financial reporting and for its assessment of the effectiveness of internal control over financial reporting included in the accompanying Management’s Annual Report on Internal Control over Financial Reporting. Our responsibility is to express an opinion on the Company’s internal control over financial reporting based on our audit. We are a public accounting firm registered with the PCAOB and are required to be independent with respect to the Company in accordance with the U.S. federal securities laws and the applicable rules and regulations of the Securities and Exchange Commission and the PCAOB.
We conducted our audit in accordance with the standards of the PCAOB. Those standards require that we plan and perform the audit to obtain reasonable assurance about whether effective internal control over financial reporting was maintained in all material respects. Our audit included obtaining an understanding of internal control over financial reporting, assessing the risk that a material weakness exists, testing and evaluating the design and operating effectiveness of internal control based on the assessed risk, and performing such other procedures as we considered necessary in the circumstances. We believe that our audit provides a reasonable basis for our opinion.
Definition and Limitations of Internal Control Over Financial Reporting
A company’s internal control over financial reporting is a process designed to provide reasonable assurance regarding the reliability of financial reporting and the preparation of financial statements for external purposes in accordance with generally accepted accounting principles. A company’s internal control over financial reporting includes those policies and procedures that (1) pertain to the maintenance of records that, in reasonable detail, accurately and fairly reflect the transactions and dispositions of the assets of the company; (2) provide reasonable assurance that transactions are recorded as necessary to permit preparation of financial statements in accordance with generally accepted accounting principles, and that receipts and expenditures of the company are being made only in accordance with authorizations of management and directors of the company; and (3) provide reasonable assurance regarding prevention or timely detection of unauthorized acquisition, use, or disposition of the company’s assets that could have a material effect on the financial statements.
Because of its inherent limitations, internal control over financial reporting may not prevent or detect misstatements. Also, projections of any evaluation of effectiveness to future periods are subject to the risk that controls may become inadequate because of changes in conditions, or that the degree of compliance with the policies or procedures may deteriorate.
Austin, Texas
March 1, 2018
Report of Independent Registered Public Accounting Firm
To the Partners of American Campus Communities Operating Partnership, L.P. and Subsidiaries
Opinion on Internal Control over Financial Reporting
We have audited American Campus Communities Operating Partnership, L.P. and Subsidiaries’ internal control over financial reporting as of December 31, 2017, based on criteria established in Internal Control-Integrated Framework issued by the Committee of Sponsoring Organizations of the Treadway Commission (2013 framework) (the COSO criteria). In our opinion, American Campus Communities Operating Partnership, L.P. and Subsidiaries (the Company) maintained, in all material respects, effective internal control over financial reporting as of December 31, 2017, based on the COSO criteria.
We also have audited, in accordance with the standards of the Public Company Accounting Oversight Board (United States) (PCAOB), the consolidated balance sheets of the Company as of December 31, 2017 and 2016, the related consolidated statements of comprehensive income, changes in capital, and cash flows for each of the three years in the period ended December 31, 2017, and the related notes and our report dated March 1, 2018 expressed an unqualified opinion thereon.
Basis for Opinion
The Company’s management is responsible for maintaining effective internal control over financial reporting and for its assessment of the effectiveness of internal control over financial reporting included in the accompanying Management’s Annual Report on Internal Control over Financial Reporting. Our responsibility is to express an opinion on the Company’s internal control over financial reporting based on our audit. We are a public accounting firm registered with the PCAOB and are required to be independent with respect to the Company in accordance with the U.S. federal securities laws and the applicable rules and regulations of the Securities and Exchange Commission and the PCAOB.
We conducted our audit in accordance with the standards of the PCAOB. Those standards require that we plan and perform the audit to obtain reasonable assurance about whether effective internal control over financial reporting was maintained in all material respects. Our audit included obtaining an understanding of internal control over financial reporting, assessing the risk that a material weakness exists, testing and evaluating the design and operating effectiveness of internal control based on the assessed risk, and performing such other procedures as we considered necessary in the circumstances. We believe that our audit provides a reasonable basis for our opinion.
Definition and Limitations of Internal Control Over Financial Reporting
A company’s internal control over financial reporting is a process designed to provide reasonable assurance regarding the reliability of financial reporting and the preparation of financial statements for external purposes in accordance with generally accepted accounting principles. A company’s internal control over financial reporting includes those policies and procedures that (1) pertain to the maintenance of records that, in reasonable detail, accurately and fairly reflect the transactions and dispositions of the assets of the company; (2) provide reasonable assurance that transactions are recorded as necessary to permit preparation of financial statements in accordance with generally accepted accounting principles, and that receipts and expenditures of the company are being made only in accordance with authorizations of management and directors of the company; and (3) provide reasonable assurance regarding prevention or timely detection of unauthorized acquisition, use, or disposition of the company’s assets that could have a material effect on the financial statements.
Because of its inherent limitations, internal control over financial reporting may not prevent or detect misstatements. Also, projections of any evaluation of effectiveness to future periods are subject to the risk that controls may become inadequate because of changes in conditions, or that the degree of compliance with the policies or procedures may deteriorate.
Austin, Texas
March 1, 2018
AMERICAN CAMPUS COMMUNITIES, INC. AND SUBSIDIARIES
CONSOLIDATED BALANCE SHEETS
(in thousands, except share data)
|
| | | | | | | | |
| | | December 31, 2017 | | December 31, 2016 |
| Assets | | | | |
| | | | | |
| Investments in real estate: | | | | |
| Owned properties, net | | $ | 6,450,364 |
| | $ | 5,427,014 |
|
| Owned properties held for sale | | — |
| | 25,350 |
|
| On-campus participating properties, net | | 81,804 |
| | 85,797 |
|
| Investments in real estate, net | | 6,532,168 |
| | 5,538,161 |
|
| | | | | |
| Cash and cash equivalents | | 41,182 |
| | 22,140 |
|
| Restricted cash | | 23,590 |
| | 24,817 |
|
| Student contracts receivable, net | | 9,170 |
| | 8,428 |
|
| Other assets | | 291,260 |
| | 272,367 |
|
| | | | | |
| Total assets | | $ | 6,897,370 |
| | $ | 5,865,913 |
|
| | | | | |
| Liabilities and equity | | |
| | |
|
| | | | | |
| Liabilities: | | |
| | |
|
| Secured mortgage, construction and bond debt, net | | $ | 664,020 |
| | $ | 688,195 |
|
| Unsecured notes, net | | 1,585,855 |
| | 1,188,737 |
|
| Unsecured term loans, net | | 647,044 |
| | 149,065 |
|
| Unsecured revolving credit facility | | 127,600 |
| | 99,300 |
|
| Accounts payable and accrued expenses | | 53,741 |
| | 76,614 |
|
| Other liabilities | | 187,983 |
| | 158,437 |
|
| Total liabilities | | 3,266,243 |
| | 2,360,348 |
|
| | | | | |
| Commitments and contingencies (Note 16) | |
|
| |
|
|
| | | | | |
| Redeemable noncontrolling interests | | 132,169 |
| | 55,078 |
|
| | | | | |
| Equity: | | |
| | |
|
| American Campus Communities, Inc. and Subsidiaries stockholders’ equity: | | | | |
| Common stock, $0.01 par value, 800,000,000 shares authorized, 136,362,728 and 132,225,488 shares issued and outstanding at December 31, 2017 and December 31, 2016, respectively | | 1,364 |
| | 1,322 |
|
| Additional paid in capital | | 4,326,910 |
| | 4,118,842 |
|
| Common stock held in rabbi trust, 63,778 and 20,181 shares at December 31, 2017 and December 31, 2016, respectively | | (2,944 | ) | | (975 | ) |
| Accumulated earnings and dividends | | (837,644 | ) | | (670,137 | ) |
| Accumulated other comprehensive loss | | (2,701 | ) | | (4,067 | ) |
| Total American Campus Communities, Inc. and Subsidiaries stockholders’ equity | | 3,484,985 |
| | 3,444,985 |
|
| Noncontrolling interests – partially owned properties | | 13,973 |
| | 5,502 |
|
| Total equity | | 3,498,958 |
| | 3,450,487 |
|
| | | | | |
| Total liabilities and equity | | $ | 6,897,370 |
| | $ | 5,865,913 |
|
See accompanying notes to consolidated financial statements.
AMERICAN CAMPUS COMMUNITIES, INC. AND SUBSIDIARIES
CONSOLIDATED STATEMENTS OF COMPREHENSIVE INCOME
(in thousands, except share and per share data)
|
| | | | | | | | | | | | |
| | | Year Ended December 31, |
| | | 2017 | | 2016 | | 2015 |
| Revenues: | | | | | | |
| Owned properties | | $ | 738,710 |
| | $ | 735,392 |
| | $ | 704,909 |
|
| On-campus participating properties | | 33,945 |
| | 33,433 |
| | 31,586 |
|
| Third-party development services | | 10,761 |
| | 4,606 |
| | 4,964 |
|
| Third-party management services | | 9,832 |
| | 9,724 |
| | 8,813 |
|
| Resident services | | 3,199 |
| | 3,206 |
| | 3,109 |
|
| Total revenues | | 796,447 |
| | 786,361 |
| | 753,381 |
|
| | | | | | | |
| Operating expenses: | | |
| | |
| | |
|
| Owned properties | | 332,429 |
| | 337,296 |
| | 331,836 |
|
| On-campus participating properties | | 14,384 |
| | 13,447 |
| | 12,437 |
|
| Third-party development and management services | | 15,225 |
| | 14,533 |
| | 14,346 |
|
| General and administrative | | 31,386 |
| | 22,493 |
| | 20,838 |
|
| Depreciation and amortization | | 234,955 |
| | 211,387 |
| | 208,788 |
|
| Ground/facility leases | | 10,213 |
| | 9,167 |
| | 8,232 |
|
| Provision for real estate impairment | | 15,317 |
| | 4,895 |
| | — |
|
| Total operating expenses | | 653,909 |
| | 613,218 |
| | 596,477 |
|
| | | | | | | |
| Operating income | | 142,538 |
| | 173,143 |
| | 156,904 |
|
| | | | | | | |
| Nonoperating income and (expenses): | | |
| | |
| | |
|
| Interest income | | 4,945 |
| | 5,481 |
| | 4,421 |
|
| Interest expense | | (71,122 | ) | | (78,687 | ) | | (87,789 | ) |
| Amortization of deferred financing costs | | (4,619 | ) | | (6,520 | ) | | (5,550 | ) |
| (Loss) gain from disposition of real estate | | (632 | ) | | 21,197 |
| | 52,699 |
|
| Loss from early extinguishment of debt | | — |
| | (12,841 | ) | | (1,770 | ) |
Other nonoperating income | | — |
| | — |
| | 388 |
|
| Total nonoperating expenses | | (71,428 | ) | | (71,370 | ) | | (37,601 | ) |
| | | | | | | |
| Income before income taxes | | 71,110 |
| | 101,773 |
| | 119,303 |
|
| Income tax provision | | (989 | ) | | (1,150 | ) | | (1,242 | ) |
| Net income | | 70,121 |
| | 100,623 |
| | 118,061 |
|
| Net income attributable to noncontrolling interests | | (1,083 | ) | | (1,562 | ) | | (2,070 | ) |
Net income attributable to ACC, Inc. and Subsidiaries common stockholders | | $ | 69,038 |
| | $ | 99,061 |
| | $ | 115,991 |
|
| Other comprehensive income | | |
| | |
| | |
|
| Change in fair value of interest rate swaps and other | | 1,366 |
| | 1,763 |
| | 464 |
|
| Comprehensive income | | $ | 70,404 |
| | $ | 100,824 |
| | $ | 116,455 |
|
Net income per share attributable to ACC, Inc. and Subsidiaries common stockholders | | |
| | |
| | |
|
| Basic | | $ | 0.50 |
| | $ | 0.76 |
| | $ | 1.03 |
|
| Diluted | | $ | 0.50 |
| | $ | 0.75 |
| | $ | 1.02 |
|
| Weighted-average common shares outstanding: | | |
| | |
| | |
|
| Basic | | 135,141,423 |
| | 129,228,748 |
| | 111,987,361 |
|
| Diluted | | 136,002,385 |
| | 130,018,729 |
| | 114,032,222 |
|
| | | | | | | |
| Distributions declared per common share | | $ | 1.74 |
| | $ | 1.66 |
| | $ | 1.58 |
|
| | | | | | | |
See accompanying notes to consolidated financial statements.
AMERICAN CAMPUS COMMUNITIES, INC. AND SUBSIDIARIES
CONSOLIDATED STATEMENTS OF CHANGES IN EQUITY
(in thousands, except share data)
|
| | | | | | | | | | | | | | | | | | | | | | | | | | | | | | | | | | |
| | | Common Shares | | Par Value of Common Shares | | Additional Paid in Capital | | Common Shares Held in Rabbi Trust | | Common Shares Held in Rabbi Trust at Cost | | Accumulated Earnings and Dividends | | Accumulated Other Comprehensive Loss | | Noncontrolling Interests - Partially Owned Properties | | Total |
| Equity, December 31, 2014 |
| 107,175,236 |
|
| $ | 1,072 |
|
| $ | 3,102,540 |
|
| — |
| | $ | — |
| | $ | (487,986 | ) |
| $ | (6,072 | ) |
| $ | 5,729 |
|
| $ | 2,615,283 |
|
| Adjustments to reflect redeemable noncontrolling interests at fair value | | — |
| | — |
| | 4,462 |
| | — |
| | — |
| | — |
| | — |
| | — |
| | 4,462 |
|
| Amortization of restricted stock awards | | — |
| | — |
| | 7,505 |
| | — |
| | — |
| | — |
| | — |
| | — |
| | 7,505 |
|
| Vesting of restricted stock awards and restricted stock units | | 122,502 |
| | 1 |
| | (1,743 | ) | | 10,155 |
| | (403 | ) | | — |
| | — |
| | — |
| | (2,145 | ) |
| Distributions to common and restricted stockholders | | — |
| | — |
| | — |
| | — |
| | — |
| | (178,506 | ) | | — |
| | — |
| | (178,506 | ) |
| Distributions to noncontrolling interests - partially owned properties | | — |
| | — |
| | — |
| | — |
| | — |
| | — |
| | — |
| | (635 | ) | | (635 | ) |
| Increase in ownership of consolidated subsidiary | | — |
| | — |
| | 435 |
| | — |
| | — |
| | — |
| | — |
| | (1,500 | ) | | (1,065 | ) |
| Contributions by noncontrolling interests | | — |
| | — |
| | — |
| | — |
| | — |
| | — |
| | — |
| | 7,255 |
| | 7,255 |
|
| Conversion of common and preferred operating partnership units to common stock | | 119,474 |
| | 2 |
| | 3,034 |
| | — |
| | — |
| | — |
| | — |
| | — |
| | 3,036 |
|
| Redemption of common units for cash | | — |
| | — |
| | (3,061 | ) | | — |
| | — |
| | — |
| | — |
| | — |
| | (3,061 | ) |
| Net proceeds from sale of common stock | | 4,933,665 |
| | 49 |
| | 212,634 |
| | — |
| | — |
| | — |
| | — |
| | — |
| | 212,683 |
|
| Change in fair value of interest rate swaps and other | | — |
| | — |
| | — |
| | — |
| | — |
| | — |
| | (170 | ) | | — |
| | (170 | ) |
| Amortization of interest rate swap terminations | | — |
| | — |
| | — |
| | — |
| | — |
| | — |
| | 412 |
| | — |
| | 412 |
|
| Net income | | — |
| | — |
| | — |
| | — |
| | — |
| | 115,991 |
| | — |
| | 612 |
| | 116,603 |
|
| Equity, December 31, 2015 | | 112,350,877 |
| | 1,124 |
| | 3,325,806 |
| | 10,155 |
| | (403 | ) | | (550,501 | ) | | (5,830 | ) | | 11,461 |
| | 2,781,657 |
|
| Adjustments to reflect redeemable noncontrolling interests at fair value | | — |
| | — |
| | (7,937 | ) | | — |
| | — |
| | — |
| | — |
| | — |
| | (7,937 | ) |
| Amortization of restricted stock awards | | — |
| | — |
| | 9,316 |
| | — |
| | — |
| | — |
| | — |
| | — |
| | 9,316 |
|
| Vesting of restricted stock awards and restricted stock units | | 132,850 |
| | 1 |
| | (1,679 | ) | | 10,026 |
| | (572 | ) | | — |
| | — |
| | — |
| | (2,250 | ) |
| Distributions to common and restricted stockholders | | — |
| | — |
| | — |
| | — |
| | — |
| | (218,697 | ) | | — |
| | — |
| | (218,697 | ) |
| Distributions to noncontrolling interests - partially owned properties | | — |
| | — |
| | — |
| | — |
| | — |
| | — |
| | — |
| | (376 | ) | | (376 | ) |
| Increase in ownership of consolidated subsidiary | | — |
| | — |
| | — |
| | — |
| | — |
| | — |
| | — |
| | (7,311 | ) | | (7,311 | ) |
| Contributions by noncontrolling interests | | — |
| | — |
| | — |
| | — |
| | — |
| | — |
| | — |
| | 1,272 |
| | 1,272 |
|
| Conversion of common and preferred operating partnership units to common stock | | 312,761 |
| | 3 |
| | 11,289 |
| | — |
| | — |
| | — |
| | — |
| | — |
| | 11,292 |
|
| Net proceeds from sale of common stock | | 19,429,000 |
| | 194 |
| | 782,047 |
| | — |
| | — |
| | — |
| | — |
| | — |
| | 782,241 |
|
| Change in fair value of interest rate swaps and other | | — |
| | — |
| | — |
| | — |
| | — |
| | — |
| | 1,350 |
| | — |
| | 1,350 |
|
| Amortization of interest rate swap terminations | | — |
| | — |
| | — |
| | — |
| | — |
| | — |
| | 413 |
| | — |
| | 413 |
|
| Net income | | — |
| | — |
| | — |
| | — |
| | — |
| | 99,061 |
| | — |
| | 456 |
| | 99,517 |
|
| Equity, December 31, 2016 | | 132,225,488 |
| | 1,322 |
| | 4,118,842 |
| | 20,181 |
| | (975 | ) | | (670,137 | ) | | (4,067 | ) | | 5,502 |
| | 3,450,487 |
|
| Adjustments to reflect redeemable noncontrolling interests at fair value | | — |
| | — |
| | 9,172 |
| | — |
| | — |
| | — |
| | — |
| | — |
| | 9,172 |
|
| Amortization of restricted stock awards | | — |
| | — |
| | 13,094 |
| | — |
| | — |
| | — |
| | — |
| | — |
| | 13,094 |
|
| Vesting of restricted stock awards and restricted stock units | | 165,884 |
| | 2 |
| | (2,193 | ) | | 43,597 |
| | (1,969 | ) | | — |
| | — |
| | — |
| | (4,160 | ) |
| Distributions to common and restricted stockholders | | — |
| | — |
| | — |
| | — |
| | — |
| | (236,545 | ) | | — |
| | — |
| | (236,545 | ) |
| Distributions to noncontrolling interests - partially owned properties | | — |
| | — |
| | — |
| | — |
| | — |
| | — |
| | — |
| | (212 | ) | | (212 | ) |
| Contributions by noncontrolling interests | | — |
| | — |
| | — |
| | — |
| | — |
| | — |
| | — |
| | 8,254 |
| | 8,254 |
|
| Conversion of common and preferred operating partnership units to common stock | | 22,000 |
| | — |
| | 154 |
| | — |
| | — |
| | — |
| | — |
| | — |
| | 154 |
|
| Net proceeds from sale of common stock | | 3,949,356 |
| | 40 |
| | 187,841 |
| | — |
| | — |
| | — |
| | — |
| | — |
| | 187,881 |
|
| Change in fair value of interest rate swaps and other | | — |
| | — |
| | — |
| | — |
| | — |
| | — |
| | 954 |
| | — |
| | 954 |
|
| Amortization of interest rate swap terminations | | — |
| | — |
| | — |
| | — |
| | — |
| | — |
| | 412 |
| | — |
| | 412 |
|
| Net income | | — |
| | — |
| | — |
| | — |
| | — |
| | 69,038 |
| | — |
| | 429 |
| | 69,467 |
|
| Equity, December 31, 2017 | | 136,362,728 |
| | $ | 1,364 |
| | $ | 4,326,910 |
| | 63,778 |
| | $ | (2,944 | ) | | $ | (837,644 | ) | | $ | (2,701 | ) | | $ | 13,973 |
| | $ | 3,498,958 |
|
See accompanying notes to consolidated financial statements.
AMERICAN CAMPUS COMMUNITIES, INC. AND SUBSIDIARIES
CONSOLIDATED STATEMENTS OF CASH FLOWS
(in thousands)
|
| | | | | | | | | | | | |
| | | Year Ended December 31, |
| | | 2017 | | 2016 | | 2015 |
| Operating activities | | | | | | |
| Net income | | $ | 70,121 |
| | $ | 100,623 |
| | $ | 118,061 |
|
| Adjustments to reconcile net income to net cash provided by operating activities: | | | | | | |
| Loss (gain) from disposition of real estate | | 632 |
| | (21,197 | ) | | (52,699 | ) |
| Gain from insurance settlement | | — |
| | — |
| | (388 | ) |
| Loss from early extinguishment of debt | | — |
| | 12,841 |
| | 1,770 |
|
| Provision for real estate impairment | | 15,317 |
| | 4,895 |
| | — |
|
| Depreciation and amortization | | 234,955 |
| | 211,387 |
| | 208,788 |
|
| Amortization of deferred financing costs and debt premiums/discounts | | (2,871 | ) | | (5,145 | ) | | (6,280 | ) |
| Share-based compensation | | 13,854 |
| | 10,043 |
| | 8,161 |
|
| Income tax provision | | 989 |
| | 1,150 |
| | 1,242 |
|
| Amortization of interest rate swap terminations and other | | 412 |
| | 613 |
| | 412 |
|
| Changes in operating assets and liabilities: | | | | | | |
| Restricted cash | | 1,277 |
| | 2,032 |
| | 1,656 |
|
| Student contracts receivable, net | | (414 | ) | | 8,709 |
| | (9,397 | ) |
| Other assets | | 2,502 |
| | (15,905 | ) | | (23,475 | ) |
| Accounts payable and accrued expenses | | (26,718 | ) | | (83 | ) | | (1,201 | ) |
| Other liabilities | | 9,898 |
| | (1,874 | ) | | 17,136 |
|
| Net cash provided by operating activities | | 319,954 |
| | 308,089 |
| | 263,786 |
|
| | | | | | | |
| Investing activities | | |
| | |
| | |
|
| Proceeds from disposition of properties and land parcels | | 24,462 |
| | 571,424 |
| | 427,304 |
|
| Cash paid for acquisition of operating and under-development properties | | (366,655 | ) | | (102,804 | ) | | (291,352 | ) |
| Cash paid for land acquisitions | | (8,886 | ) | | (856 | ) | | (49,927 | ) |
| Capital expenditures for owned properties | | (82,722 | ) | | (61,587 | ) | | (96,832 | ) |
| Investments in owned properties under development | | (534,830 | ) | | (424,139 | ) | | (219,636 | ) |
| Capital expenditures for on-campus participating properties | | (3,533 | ) | | (2,944 | ) | | (2,943 | ) |
| Investment in direct financing lease, net | | (746 | ) | | (6,650 | ) | | — |
|
| Investment in loans receivable | | — |
| | — |
| | (5,176 | ) |
| Proceeds from loans receivable | | — |
| | — |
| | 7,483 |
|
| Change in escrow deposits for real estate investments | | (27 | ) | | 4,991 |
| | (7,033 | ) |
| Change in restricted cash related to capital reserves | | — |
| | 1,918 |
| | 2,955 |
|
| Proceeds from insurance settlement | | — |
| | — |
| | 388 |
|
| Increase in ownership of consolidated subsidiary | | — |
| | (7,254 | ) | | (1,065 | ) |
| Purchase of corporate furniture, fixtures and equipment | | (4,862 | ) | | (3,655 | ) | | (3,621 | ) |
| Net cash used in investing activities | | (977,799 | ) | | (31,556 | ) | | (239,455 | ) |
| | | | | | | |
| Financing activities | | |
| | |
| | |
|
| Proceeds from unsecured notes | | 399,648 |
| | — |
| | 399,244 |
|
| Proceeds from sale of common stock | | 190,912 |
| | 816,065 |
| | 216,666 |
|
| Offering costs | | (2,374 | ) | | (32,923 | ) | | (3,250 | ) |
| Pay-off of mortgage and construction loans | | (147,960 | ) | | (374,971 | ) | | (263,361 | ) |
| Pay-off of unsecured term loans | | — |
| | (600,000 | ) | | — |
|
| Proceeds from unsecured term loans | | 500,000 |
| | 150,000 |
| | — |
|
| Proceeds from revolving credit facility | | 1,164,700 |
| | 376,000 |
| | 720,200 |
|
| Paydowns of revolving credit facility | | (1,136,400 | ) | | (345,600 | ) | | (893,800 | ) |
| Proceeds from construction loans | | 40,170 |
| | 4,454 |
| | 258 |
|
| Scheduled principal payments on debt | | (12,842 | ) | | (15,120 | ) | | (14,450 | ) |
| Defeasance costs of early extinguishment of debt | | — |
| | (23,827 | ) | | (1,770 | ) |
| Debt issuance and assumption costs | | (12,060 | ) | | (831 | ) | | (4,330 | ) |
| Termination of interest rate swaps | | — |
| | (108 | ) | | — |
|
| Contributions by noncontrolling interests | | 11,801 |
| | — |
| | — |
|
| Taxes paid on net-share settlements | | (4,920 | ) | | (2,977 | ) | | (2,800 | ) |
| Distributions to common and restricted stockholders | | (236,545 | ) | | (218,697 | ) | | (178,506 | ) |
| Distributions to noncontrolling interests | | (77,243 | ) | | (2,517 | ) | | (2,964 | ) |
| Redemption of common units for cash | | — |
| | — |
| | (3,871 | ) |
| Net cash provided by (used in) financing activities | | 676,887 |
| | (271,052 | ) | | (32,734 | ) |
| Net change in cash and cash equivalents | | 19,042 |
| | 5,481 |
| | (8,403 | ) |
| Cash and cash equivalents at beginning of period | | 22,140 |
| | 16,659 |
| | 25,062 |
|
| Cash and cash equivalents at end of period | | $ | 41,182 |
| | $ | 22,140 |
| | $ | 16,659 |
|
|
| | | | | | | | | | | | |
| | | Year Ended December 31, |
| | | 2017 | | 2016 | | 2015 |
| Supplemental disclosure of non-cash investing and financing activities | | |
| | |
| | |
|
| Loans assumed in connection with property acquisitions | | $ | — |
| | $ | — |
| | $ | (69,423 | ) |
| Loans associated with investment in joint ventures | | $ | (104,056 | ) | | $ | — |
| | $ | — |
|
| Issuance of common units in connection with property acquisitions | | $ | — |
| | $ | — |
| | $ | (14,182 | ) |
Conversion of common and preferred operating partnership units to common stock | | $ | 154 |
| | $ | 11,292 |
| | $ | 3,036 |
|
| Non-cash contribution from noncontrolling interest | | $ | 159,247 |
| | $ | — |
| | $ | — |
|
| Non-cash consideration exchanged in purchase of land parcel | | $ | (3,071 | ) | | $ | — |
| | $ | — |
|
| Change in accrued construction in progress | | $ | 16,512 |
| | $ | 20,734 |
| | $ | 5,720 |
|
| Change in fair value of derivative instruments, net | | $ | 954 |
| | $ | 1,150 |
| | $ | (170 | ) |
| Change in fair value of redeemable noncontrolling interests | | $ | 9,172 |
| | $ | (7,937 | ) | | $ | 4,462 |
|
| | | | | | | |
| Supplemental disclosure of cash flow information | | |
| | |
| | |
|
| Cash paid for interest, net of amounts capitalized | | $ | 72,407 |
| | $ | 92,502 |
| | $ | 89,336 |
|
| Income taxes paid | | $ | 1,053 |
| | $ | 1,094 |
| | $ | 1,078 |
|
See accompanying notes to consolidated financial statements.
AMERICAN CAMPUS COMMUNITIES OPERATING PARTNERSHIP, L.P. AND SUBSIDIARIES
CONSOLIDATED BALANCE SHEETS
(in thousands, except unit data)
|
| | | | | | | | |
| | | December 31, 2017 | | December 31, 2016 |
| Assets | | | | |
| | | | | |
| Investments in real estate: | | | | |
| Owned properties, net | | $ | 6,450,364 |
| | $ | 5,427,014 |
|
| Owned properties held for sale | | — |
| | 25,350 |
|
| On-campus participating properties, net | | 81,804 |
| | 85,797 |
|
| Investments in real estate, net | | 6,532,168 |
| | 5,538,161 |
|
| | | | | |
| Cash and cash equivalents | | 41,182 |
| | 22,140 |
|
| Restricted cash | | 23,590 |
| | 24,817 |
|
| Student contracts receivable, net | | 9,170 |
| | 8,428 |
|
| Other assets | | 291,260 |
| | 272,367 |
|
| | | | | |
| Total assets | | $ | 6,897,370 |
| | $ | 5,865,913 |
|
| | | | | |
| Liabilities and capital | | |
| | |
|
| | | | | |
| Liabilities: | | |
| | |
|
| Secured mortgage, construction and bond debt, net | | $ | 664,020 |
| | $ | 688,195 |
|
| Unsecured notes, net | | 1,585,855 |
| | 1,188,737 |
|
| Unsecured term loans, net | | 647,044 |
| | 149,065 |
|
| Unsecured revolving credit facility | | 127,600 |
| | 99,300 |
|
| Accounts payable and accrued expenses | | 53,741 |
| | 76,614 |
|
| Other liabilities | | 187,983 |
| | 158,437 |
|
| Total liabilities | | 3,266,243 |
| | 2,360,348 |
|
| | | | | |
| Commitments and contingencies (Note 16) | |
|
| |
|
|
| | | | | |
| Redeemable limited partners | | 132,169 |
| | 55,078 |
|
| | | | | |
| Capital: | | |
| | |
|
| Partners’ capital: | | |
| | |
|
| General partner - 12,222 OP units outstanding at both December 31, 2017 and December 31, 2016 | | 67 |
| | 82 |
|
| Limited partner - 136,414,284 and 132,233,447 OP units outstanding at December 31, 2017 and December 31, 2016, respectively | | 3,487,619 |
| | 3,448,970 |
|
| Accumulated other comprehensive loss | | (2,701 | ) | | (4,067 | ) |
| Total partners’ capital | | 3,484,985 |
| | 3,444,985 |
|
| Noncontrolling interests – partially owned properties | | 13,973 |
| | 5,502 |
|
| Total capital | | 3,498,958 |
| | 3,450,487 |
|
| | | | | |
| Total liabilities and capital | | $ | 6,897,370 |
| | $ | 5,865,913 |
|
See accompanying notes to consolidated financial statements.
AMERICAN CAMPUS COMMUNITIES OPERATING PARTNERSHIP, L.P. AND SUBSIDIARIES
CONSOLIDATED STATEMENTS OF COMPREHENSIVE INCOME
(in thousands, except unit and per unit data)
|
| | | | | | | | | | | | |
| | | Year Ended December 31, |
| | | 2017 | | 2016 | | 2015 |
| Revenues: | | | | | | |
| Owned properties | | $ | 738,710 |
| | $ | 735,392 |
| | $ | 704,909 |
|
| On-campus participating properties | | 33,945 |
| | 33,433 |
| | 31,586 |
|
| Third-party development services | | 10,761 |
| | 4,606 |
| | 4,964 |
|
| Third-party management services | | 9,832 |
| | 9,724 |
| | 8,813 |
|
| Resident services | | 3,199 |
| | 3,206 |
| | 3,109 |
|
| Total revenues | | 796,447 |
| | 786,361 |
| | 753,381 |
|
| | | | | | | |
| Operating expenses: | | |
| | |
| | |
|
| Owned properties | | 332,429 |
| | 337,296 |
| | 331,836 |
|
| On-campus participating properties | | 14,384 |
| | 13,447 |
| | 12,437 |
|
| Third-party development and management services | | 15,225 |
| | 14,533 |
| | 14,346 |
|
| General and administrative | | 31,386 |
| | 22,493 |
| | 20,838 |
|
| Depreciation and amortization | | 234,955 |
| | 211,387 |
| | 208,788 |
|
| Ground/facility leases | | 10,213 |
| | 9,167 |
| | 8,232 |
|
| Provision for real estate impairment | | 15,317 |
| | 4,895 |
| | — |
|
| Total operating expenses | | 653,909 |
| | 613,218 |
| | 596,477 |
|
| | | | | | | |
| Operating income | | 142,538 |
| | 173,143 |
| | 156,904 |
|
| | | | | | | |
| Nonoperating income and (expenses): | | |
| | |
| | |
|
| Interest income | | 4,945 |
| | 5,481 |
| | 4,421 |
|
| Interest expense | | (71,122 | ) | | (78,687 | ) | | (87,789 | ) |
| Amortization of deferred financing costs | | (4,619 | ) | | (6,520 | ) | | (5,550 | ) |
| (Loss) gain from disposition of real estate | | (632 | ) | | 21,197 |
| | 52,699 |
|
| Loss from early extinguishment of debt | | — |
| | (12,841 | ) | | (1,770 | ) |
Other nonoperating income | | — |
| | — |
| | 388 |
|
| Total nonoperating expenses | | (71,428 | ) | | (71,370 | ) | | (37,601 | ) |
| | | | | | | |
| Income before income taxes | | 71,110 |
| | 101,773 |
| | 119,303 |
|
| Income tax provision | | (989 | ) | | (1,150 | ) | | (1,242 | ) |
| Net income | | 70,121 |
| | 100,623 |
| | 118,061 |
|
| Net income attributable to noncontrolling interests – partially owned properties | | (435 | ) | | (456 | ) | | (612 | ) |
Net income attributable to American Campus Communities Operating Partnership, L.P. | | 69,686 |
| | 100,167 |
| | 117,449 |
|
| Series A preferred units distributions | | (124 | ) | | (146 | ) | | (176 | ) |
| Net income attributable to common unitholders | | $ | 69,562 |
| | $ | 100,021 |
| | $ | 117,273 |
|
| Other comprehensive income | | |
| | |
| | |
|
Change in fair value of interest rate swaps and other | | 1,366 |
| | 1,763 |
| | 464 |
|
| Comprehensive income | | $ | 70,928 |
| | $ | 101,784 |
| | $ | 117,737 |
|
| Net income per unit attributable to common unitholders | | |
| | |
| | |
|
| Basic | | $ | 0.50 |
| | $ | 0.76 |
| | $ | 1.03 |
|
| Diluted | | $ | 0.50 |
| | $ | 0.75 |
| | $ | 1.02 |
|
| Weighted-average common units outstanding: | | |
| | |
| | |
|
| Basic | | 136,160,609 |
| | 130,460,248 |
| | 113,351,242 |
|
| Diluted | | 137,021,571 |
| | 131,250,229 |
| | 114,032,222 |
|
| | | | | | | |
| Distributions declared per Common Unit | | $ | 1.74 |
| | $ | 1.66 |
| | $ | 1.58 |
|
See accompanying notes to consolidated financial statements.
AMERICAN CAMPUS COMMUNITIES OPERATING PARTNERSHIP, L.P. AND SUBSIDIARIES
CONSOLIDATED STATEMENTS OF CHANGES IN CAPITAL
(in thousands, except unit data)
|
| | | | | | | | | | | | | | | | | | | | | | | | | | |
| | | |
| | |
| | |
| | |
| | Accumulated | | Noncontrolling | | |
|
| | | General Partner | | Limited Partner | | Other | | Interests – | | |
|
| | | Units | | Amount | | Units | | Amount | | Comprehensive Loss | | Partially Owned Properties | | Total |
| Capital as of December 31, 2014 | | 12,222 |
| | $ | 100 |
|
| 107,163,014 |
|
| $ | 2,615,526 |
|
| $ | (6,072 | ) |
| $ | 5,729 |
|
| $ | 2,615,283 |
|
| Adjustments to reflect redeemable limited partners’ interest at fair value | | — |
| | — |
| | — |
| | 4,462 |
| | — |
| | — |
| | 4,462 |
|
| Amortization of restricted stock awards | | — |
| | — |
| | — |
| | 7,505 |
| | — |
| | — |
| | 7,505 |
|
| Vesting of restricted stock awards and restricted stock units | | — |
| | — |
| | 132,657 |
| | (2,145 | ) | | — |
| | — |
| | (2,145 | ) |
| Distributions | | — |
| | (19 | ) | | — |
| | (178,487 | ) | | — |
| | — |
| | (178,506 | ) |
| Distributions to noncontrolling interests - partially owned properties | | — |
| | — |
| | — |
| | — |
| | — |
| | (635 | ) | | (635 | ) |
| Increase in ownership of consolidated subsidiary | | — |
| | — |
| | — |
| | 435 |
| | — |
| | (1,500 | ) | | (1,065 | ) |
| Contributions by noncontrolling interests | | — |
| | — |
| | — |
| | — |
| | — |
| | 7,255 |
| | 7,255 |
|
| Conversion of common and preferred operating partnership units to common stock | | — |
| | — |
| | 119,474 |
| | 3,036 |
| | — |
| | — |
| | 3,036 |
|
| Redemption of common units for cash | | — |
| | — |
| | — |
| | (3,061 | ) | | — |
| | — |
| | (3,061 | ) |
| Issuance of units in exchange for contributions of equity offering proceeds | | — |
| | — |
| | 4,933,665 |
| | 212,683 |
| | — |
| | — |
| | 212,683 |
|
| Change in fair value of interest rate swaps and other | | — |
| | — |
| | — |
| | — |
| | (170 | ) | | — |
| | (170 | ) |
| Amortization of interest rate swap terminations | | — |
| | — |
| | — |
| | — |
| | 412 |
| | — |
| | 412 |
|
| Net income | | — |
| | 12 |
| | — |
| | 115,979 |
| | — |
| | 612 |
| | 116,603 |
|
| Capital as of December 31, 2015 | | 12,222 |
| | 93 |
|
| 112,348,810 |
|
| 2,775,933 |
|
| (5,830 | ) |
| 11,461 |
|
| 2,781,657 |
|
| Adjustments to reflect redeemable limited partners’ interest at fair value | | — |
| | — |
| | — |
| | (7,937 | ) | | — |
| | — |
| | (7,937 | ) |
| Amortization of restricted stock awards | | — |
| | — |
| | — |
| | 9,316 |
| | — |
| | — |
| | 9,316 |
|
| Vesting of restricted stock awards and restricted stock units | | — |
| | — |
| | 142,876 |
| | (2,250 | ) | | — |
| | — |
| | (2,250 | ) |
| Distributions | | — |
| | (20 | ) | | — |
| | (218,677 | ) | | — |
| | — |
| | (218,697 | ) |
| Distributions to noncontrolling interests - partially owned properties | | — |
| | — |
| | — |
| | — |
| | — |
| | (376 | ) | | (376 | ) |
| Increase in ownership of consolidated subsidiary | | — |
| | — |
| | — |
| | | | — |
| | (7,311 | ) | | (7,311 | ) |
| Contributions by noncontrolling interests | | — |
| | — |
| | — |
| | — |
| | — |
| | 1,272 |
| | 1,272 |
|
| Conversion of common and preferred operating partnership units to common stock | | — |
| | — |
| | 312,761 |
| | 11,292 |
| | — |
| | — |
| | 11,292 |
|
| Issuance of units in exchange for contributions of equity offering proceeds | | — |
| | — |
| | 19,429,000 |
| | 782,241 |
| | — |
| | — |
| | 782,241 |
|
| Change in fair value of interest rate swaps and other | | — |
| | — |
| | — |
| | — |
| | 1,350 |
| | — |
| | 1,350 |
|
| Amortization of interest rate swap terminations | | — |
| | — |
| | — |
| | — |
| | 413 |
| | — |
| | 413 |
|
| Net income | | — |
| | 9 |
| | — |
| | 99,052 |
| | — |
| | 456 |
| | 99,517 |
|
| Capital as of December 31, 2016 | | 12,222 |
| | 82 |
| | 132,233,447 |
| | 3,448,970 |
| | (4,067 | ) | | 5,502 |
| | 3,450,487 |
|
| Adjustments to reflect redeemable limited partners’ interest at fair value | | — |
| | — |
| | — |
| | 9,172 |
| | — |
| | — |
| | 9,172 |
|
| Amortization of restricted stock awards | | — |
| | — |
| | — |
| | 13,094 |
| | — |
| | — |
| | 13,094 |
|
| Vesting of restricted stock awards and restricted stock units | | — |
| | — |
| | 209,481 |
| | (4,160 | ) | | — |
| | — |
| | (4,160 | ) |
| Distributions | | — |
| | (21 | ) | | — |
| | (236,524 | ) | | — |
| | — |
| | (236,545 | ) |
| Distributions to noncontrolling interests - partially owned properties | | — |
| | — |
| | — |
| | — |
| | — |
| | (212 | ) | | (212 | ) |
| Contributions by noncontrolling interests | | — |
| | — |
| | — |
| | — |
| | — |
| | 8,254 |
| | 8,254 |
|
| Conversion of common and preferred operating partnership units to common stock | | — |
| | — |
| | 22,000 |
| | 154 |
| | — |
| | — |
| | 154 |
|
| Issuance of units in exchange for contributions of equity offering proceeds | | — |
| | — |
| | 3,949,356 |
| | 187,881 |
| | — |
| | — |
| | 187,881 |
|
| Change in fair value of interest rate swaps and other | | — |
| | — |
| | — |
| | — |
| | 954 |
| | — |
| | 954 |
|
| Amortization of interest rate swap terminations | | — |
| | — |
| | — |
| | — |
| | 412 |
| | — |
| | 412 |
|
| Net income | | — |
| | 6 |
| | — |
| | 69,032 |
| | — |
| | 429 |
| | 69,467 |
|
| Capital as of December 31, 2017 | | 12,222 |
| | $ | 67 |
| | 136,414,284 |
| | $ | 3,487,619 |
| | $ | (2,701 | ) | | $ | 13,973 |
| | $ | 3,498,958 |
|
| | | | | | | | | | | | | | | |
See accompanying notes to consolidated financial statements.
AMERICAN CAMPUS COMMUNITIES OPERATING PARTNERSHIP, L.P. AND SUBSIDIARIES
CONSOLIDATED STATEMENTS OF CASH FLOWS
(in thousands)
|
| | | | | | | | | | | | |
| | | Year Ended December 31, |
| | | 2017 | | 2016 | | 2015 |
| Operating activities | | | | | | |
| Net income | | $ | 70,121 |
| | $ | 100,623 |
| | $ | 118,061 |
|
| Adjustments to reconcile net income to net cash provided by operating activities: | | | | | | |
| Loss (gain) from disposition of real estate | | 632 |
| | (21,197 | ) | | (52,699 | ) |
| Gain from insurance settlement | | — |
| | — |
| | (388 | ) |
| Loss from early extinguishment of debt | | — |
| | 12,841 |
| | 1,770 |
|
| Provision for real estate impairment | | 15,317 |
| | 4,895 |
| | — |
|
| Depreciation and amortization | | 234,955 |
| | 211,387 |
| | 208,788 |
|
| Amortization of deferred financing costs and debt premiums/discounts | | (2,871 | ) | | (5,145 | ) | | (6,280 | ) |
| Share-based compensation | | 13,854 |
| | 10,043 |
| | 8,161 |
|
| Income tax provision | | 989 |
| | 1,150 |
| | 1,242 |
|
| Amortization of interest rate swap terminations and other | | 412 |
| | 613 |
| | 412 |
|
| Changes in operating assets and liabilities: | | | | | | |
| Restricted cash | | 1,277 |
| | 2,032 |
| | 1,656 |
|
| Student contracts receivable, net | | (414 | ) | | 8,709 |
| | (9,397 | ) |
| Other assets | | 2,502 |
| | (15,905 | ) | | (23,475 | ) |
| Accounts payable and accrued expenses | | (26,718 | ) | | (83 | ) | | (1,201 | ) |
| Other liabilities | | 9,898 |
| | (1,874 | ) | | 17,136 |
|
| Net cash provided by operating activities | | 319,954 |
| | 308,089 |
| | 263,786 |
|
| | | | | | | |
| Investing activities | | |
| | |
| | |
|
| Proceeds from disposition of properties and land parcels | | 24,462 |
| | 571,424 |
| | 427,304 |
|
| Cash paid for acquisition of operating and under-development properties | | (366,655 | ) | | (102,804 | ) | | (291,352 | ) |
| Cash paid for land acquisitions | | (8,886 | ) | | (856 | ) | | (49,927 | ) |
| Capital expenditures for owned properties | | (82,722 | ) | | (61,587 | ) | | (96,832 | ) |
| Investments in owned properties under development | | (534,830 | ) | | (424,139 | ) | | (219,636 | ) |
| Capital expenditures for on-campus participating properties | | (3,533 | ) | | (2,944 | ) | | (2,943 | ) |
| Investment in direct financing lease, net | | (746 | ) | | (6,650 | ) | | — |
|
| Investment in loans receivable | | — |
| | — |
| | (5,176 | ) |
| Proceeds from loans receivable | | — |
| | — |
| | 7,483 |
|
| Change in escrow deposits for real estate investments | | (27 | ) | | 4,991 |
| | (7,033 | ) |
| Change in restricted cash related to capital reserves | | — |
| | 1,918 |
| | 2,955 |
|
| Proceeds from insurance settlement | | — |
| | — |
| | 388 |
|
| Increase in ownership of consolidated subsidiary | | — |
| | (7,254 | ) | | (1,065 | ) |
| Purchase of corporate furniture, fixtures and equipment | | (4,862 | ) | | (3,655 | ) | | (3,621 | ) |
| Net cash used in investing activities | | (977,799 | ) | | (31,556 | ) | | (239,455 | ) |
| | | | | | | |
| Financing activities | | |
| | |
| | |
|
| Proceeds from unsecured notes | | 399,648 |
| | — |
| | 399,244 |
|
| Proceeds from issuance of common units in exchange for contributions, net | | 188,538 |
| | 783,142 |
| | 213,416 |
|
| Pay-off of mortgage and construction loans | | (147,960 | ) | | (374,971 | ) | | (263,361 | ) |
| Pay-off of unsecured term loan | | — |
| | (600,000 | ) | | — |
|
| Proceeds from unsecured term loans | | 500,000 |
| | 150,000 |
| | — |
|
| Proceeds from revolving credit facility | | 1,164,700 |
| | 376,000 |
| | 720,200 |
|
| Paydowns of revolving credit facility | | (1,136,400 | ) | | (345,600 | ) | | (893,800 | ) |
| Proceeds from construction loans | | 40,170 |
| | 4,454 |
| | 258 |
|
| Scheduled principal payments on debt | | (12,842 | ) | | (15,120 | ) | | (14,450 | ) |
| Defeasance costs of early extinguishment of debt | | — |
| | (23,827 | ) | | (1,770 | ) |
| Debt issuance and assumption costs | | (12,060 | ) | | (831 | ) | | (4,330 | ) |
| Termination of interest rate swaps | | — |
| | (108 | ) | | — |
|
| Contributions by noncontrolling interests | | 11,801 |
| | — |
| | — |
|
| Taxes paid on net-share settlements | | (4,920 | ) | | (2,977 | ) | | (2,800 | ) |
| Distributions paid on unvested restricted stock awards | | (1,536 | ) | | (1,338 | ) | | (1,086 | ) |
| Distributions paid to common and preferred unitholders | | (236,905 | ) | | (219,500 | ) | | (179,749 | ) |
| Distributions paid to noncontrolling interests – partially owned properties | | (75,347 | ) | | (376 | ) | | (635 | ) |
| Redemption of common units for cash | | — |
| | — |
| | (3,871 | ) |
| Net cash provided by (used in) financing activities | | 676,887 |
| | (271,052 | ) | | (32,734 | ) |
| Net change in cash and cash equivalents | | 19,042 |
| | 5,481 |
| | (8,403 | ) |
| Cash and cash equivalents at beginning of period | | 22,140 |
| | 16,659 |
| | 25,062 |
|
| Cash and cash equivalents at end of period | | $ | 41,182 |
| | $ | 22,140 |
| | $ | 16,659 |
|
| Supplemental disclosure of non-cash investing and financing activities | | |
| | |
| | |
|
| Loans assumed in connection with property acquisitions | | $ | — |
| | $ | — |
| | $ | (69,423 | ) |
| Loans associated with investment in joint ventures | | $ | (104,056 | ) | | $ | — |
| | $ | — |
|
| Issuance of common units in connection with property acquisitions | | $ | — |
| | $ | — |
| | $ | (14,182 | ) |
| Conversion of common and preferred operating partnership units to common stock | | $ | 154 |
| | $ | 11,292 |
| | $ | 3,036 |
|
| Non-cash contribution from noncontrolling interest | | $ | 159,247 |
| | $ | — |
| | $ | — |
|
| Non-cash consideration exchanged in purchase of land parcel | | $ | (3,071 | ) | | $ | — |
| | $ | — |
|
| Change in accrued construction in progress | | $ | 16,512 |
| | $ | 20,734 |
| | $ | 5,720 |
|
| Change in fair value of derivative instruments, net | | $ | 954 |
| | $ | 1,150 |
| | $ | (170 | ) |
| Change in fair value of redeemable noncontrolling interests | | $ | 9,172 |
| | $ | (7,937 | ) | | $ | 4,462 |
|
| Supplemental disclosure of cash flow information | | |
| | |
| | |
|
| Cash paid for interest, net of amounts capitalized | | $ | 72,407 |
| | $ | 92,502 |
| | $ | 89,336 |
|
| Income taxes paid | | $ | 1,053 |
| | $ | 1,094 |
| | $ | 1,078 |
|
See accompanying notes to consolidated financial statements.
AMERICAN CAMPUS COMMUNITIES, INC. AND SUBSIDIARIES
AMERICAN CAMPUS COMMUNITIES OPERATING PARTNERSHIP, L.P. AND SUBSIDIARIES
NOTES TO CONSOLIDATED FINANCIAL STATEMENTS
1. Organization and Description of Business
American Campus Communities, Inc. (“ACC”) is a real estate investment trust (“REIT”) that commenced operations effective with the completion of an initial public offering (“IPO”) on August 17, 2004. Through ACC’s controlling interest in American Campus Communities Operating Partnership, L.P. (“ACCOP”), ACC is one of the largest owners, managers and developers of high quality student housing properties in the United States in terms of beds owned and under management. ACC is a fully integrated, self-managed and self-administered equity REIT with expertise in the acquisition, design, financing, development, construction management, leasing and management of student housing properties. ACC’s common stock is publicly traded on the New York Stock Exchange (“NYSE”) under the ticker symbol “ACC.”
The general partner of ACCOP is American Campus Communities Holdings, LLC (“ACC Holdings”), an entity that is wholly-owned by ACC. As of December 31, 2017, ACC Holdings held an ownership interest in ACCOP of less than 1%. The limited partners of ACCOP are ACC and other limited partners consisting of current and former members of management and nonaffiliated third parties. As of December 31, 2017, ACC owned an approximate 99.2% limited partnership interest in ACCOP. As the sole member of the general partner of ACCOP, ACC has exclusive control of ACCOP’s day-to-day management. Management operates ACC and ACCOP as one business. The management of ACC consists of the same members as the management of ACCOP. ACC consolidates ACCOP for financial reporting purposes, and ACC does not have significant assets other than its investment in ACCOP. Therefore, the assets and liabilities of ACC and ACCOP are the same on their respective financial statements. References to the “Company” means collectively ACC, ACCOP and those entities/subsidiaries owned or controlled by ACC and/or ACCOP. References to the “Operating Partnership” mean collectively ACCOP and those entities/subsidiaries owned or controlled by ACCOP. Unless otherwise indicated, the accompanying Notes to the Consolidated Financial Statements apply to both the Company and the Operating Partnership.
As of December 31, 2017, the Company’s property portfolio contained 169 properties with approximately 104,100 beds. The Company’s property portfolio consisted of 132 owned off-campus student housing properties that are in close proximity to colleges and universities, 32 American Campus Equity (“ACE®”) properties operated under ground/facility leases with fifteen university systems and five on-campus participating properties operated under ground/facility leases with the related university systems. Of the 169 properties, thirteen were under development as of December 31, 2017, and when completed will consist of a total of approximately 9,400 beds. Our communities contain modern housing units and are supported by a resident assistant system and other student-oriented programming, with many offering resort-style amenities.
Through one of ACC’s taxable REIT subsidiaries (“TRSs”), the Company also provides construction management and development services, primarily for student housing properties owned by colleges and universities, charitable foundations, and others. As of December 31, 2017, also through one of ACC’s TRSs, the Company provided third-party management and leasing services for 37 properties that represented approximately 30,000 beds. Third-party management and leasing services are typically provided pursuant to management contracts that have initial terms that range from one to five years. As of December 31, 2017, the Company’s total owned and third-party managed portfolio included 206 properties with approximately 134,100 beds.
2. Summary of Significant Accounting Policies
Basis of Presentation
The accompanying consolidated financial statements, presented in U.S. dollars, are prepared in accordance with U.S. generally accepted accounting principles (“GAAP”). GAAP requires the Company to make estimates and assumptions that affect the reported amounts of assets and liabilities, disclosure of contingent assets and liabilities as of the date of the financial statements, and revenue and expenses during the reporting periods. The Company’s actual results could differ from those estimates and assumptions. All material intercompany transactions among consolidated entities have been eliminated. All dollar amounts in the tables herein, except share, per share, unit and per unit amounts, are stated in thousands unless otherwise indicated.
AMERICAN CAMPUS COMMUNITIES, INC. AND SUBSIDIARIES
AMERICAN CAMPUS COMMUNITIES OPERATING PARTNERSHIP, L.P. AND SUBSIDIARIES
NOTES TO CONSOLIDATED FINANCIAL STATEMENTS
Principles of Consolidation
The Company’s consolidated financial statements include its accounts and the accounts of other subsidiaries and joint ventures (including partnerships and limited liability companies) over which it has control. Investments acquired or created are evaluated based on the accounting guidance relating to variable interest entities (“VIEs”), which requires the consolidation of VIEs in which the Company is considered to be the primary beneficiary. If the investment is determined not to be a VIE, then the investment is evaluated for consolidation using the voting interest model.
Recently Issued Accounting Pronouncements
In February 2016, the FASB issued Accounting Standards Update 2016-02 (“ASU 2016-02”), “Leases (Topic 842): Amendments to the FASB Accounting Standards Codification.” ASU 2016-02 amends the existing accounting standards for lease accounting, including requiring lessees to recognize most leases on their balance sheets and making targeted changes to lessor accounting. The new standard requires a modified retrospective transition approach for all leases existing at, or entered into after, the date of initial application, with an option to use certain transition relief. The guidance is effective for public business entities for fiscal years beginning after December 15, 2018 and interim periods within those fiscal years. Early adoption is permitted. Subsequent to the issuance of ASU 2016-02, the FASB issued an additional Accounting Standards Update clarifying aspects of the new lease accounting standard, which will be effective upon adoption of ASU 2016-02. The Company plans to adopt ASU 2016-02 as of January 1, 2019. While the Company is still evaluating the effect that the updated standard will have on its consolidated financial statements and related disclosures, it expects to recognize right-of-use assets and related lease liabilities on its consolidated balance sheets related to ground leases under which it is the lessee.
In May 2014, the FASB issued Accounting Standards Update 2014-09 (“ASU 2014-09”), “Revenue From Contracts With Customers (Topic 606)”. ASU 2014-09 provides a single comprehensive revenue recognition model for contracts with customers (excluding certain contracts, such as lease contracts) to improve comparability within industries. ASU 2014-09 requires an entity to recognize revenue to reflect the transfer of goods or services to customers at an amount the entity expects to be paid in exchange for those goods and services and provide enhanced disclosures, all to provide more comprehensive guidance for transactions such as service revenue and contract modifications. Subsequent to the issuance of ASU 2014-09, the FASB has issued multiple Accounting Standards Updates clarifying multiple aspects of the new revenue recognition standard, which include the deferral of the effective date by one year. ASU 2014-09, as amended by subsequent Accounting Standards Updates, is effective for public entities for interim and annual periods beginning after December 15, 2017 and may be applied using either a full retrospective or modified retrospective approach upon adoption.
The Company has completed the process of evaluating the impact of the adoption of ASU 2014-09 on its historical and existing contracts. Approximately 95% of the Company’s consolidated revenues consist of rental income from leasing arrangements, which is specifically excluded from ASU 2014-09, and is being evaluated as part of the adoption of the lease accounting standard, ASU 2016-02, discussed above. The remaining 5% of consolidated revenues subject to the new standard are associated with third-party development services, third-party management services, ancillary services and non-lease component revenues.
The Company will adopt the new revenue standard effective January 1, 2018 using the modified retrospective approach, which requires us to recognize the cumulative effect of initially applying the new standard to all existing contracts not yet completed as of the effective date as an adjustment, if any, to retained earnings as of the beginning of the fiscal year of adoption. Upon adoption of the new standard there will be a change in the way the Company determines the unit of account for its third-party development projects. Under existing guidance, the Company segments revenue recognition between the development and construction phases of its contracts, recognizing each using the proportional performance method and the percentage of completion method, respectively. Upon adoption, the entire development and construction contract will represent a single performance obligation comprised of a series of distinct services to be satisfied over time, and a single transaction price will be recognized over the life of the contract using a time-based measure of progress. Any variable consideration included in the transaction price will be estimated using the expected value approach and will only be included to the extent that a significant revenue reversal is not likely to occur. Although the Company anticipates differences in the timing and pattern of revenue recognition for such third-party development and construction management contracts, the Company has concluded that the adoption of ASU 2014-09 on January 1, 2018 will not have a material impact on its consolidated financial statements.
In February 2017, the FASB issued Accounting Standards Update 2017-05 (“ASU 2017-05”), “Other Income-Gains and Losses from the Derecognition of Nonfinancial Assets (Subtopic 610-20): Clarifying the Scope of Asset Derecognition Guidance and Accounting for Partial Sales of Nonfinancial Assets.” The purpose of this ASU is to eliminate the diversity in practice in accounting for derecognition of a nonfinancial asset and in-substance nonfinancial assets (only when the asset or asset group does not meet
AMERICAN CAMPUS COMMUNITIES, INC. AND SUBSIDIARIES
AMERICAN CAMPUS COMMUNITIES OPERATING PARTNERSHIP, L.P. AND SUBSIDIARIES
NOTES TO CONSOLIDATED FINANCIAL STATEMENTS
the definition of a business or the transaction is not a sale to a customer). This ASU is required to be adopted in conjunction with the Company’s adoption of ASU 2014-09, the new revenue recognition standard, which was adopted as of January 1, 2018. The adoption of ASU 2017-05 will not have a material impact on its consolidated financial statements for property dispositions given the simplicity of the Company’s historical disposition transactions.
In addition, the Company does not expect the following accounting pronouncements to have a material effect on its consolidated financial statements:
|
| | |
| Accounting Standards Update | | Effective Date |
| | | |
| ASU 2017-09, “Compensation—Stock Compensation (Topic 718): Scope of Modification Accounting” | | January 1, 2018 |
| ASU 2016-18, “Statement of Cash Flows (Topic 230): Restricted Cash” | | January 1, 2018 |
| ASU 2016-15, “Statement of Cash Flows (Topic 230): Classification of Certain Cash Receipts and Cash Payments” | | January 1, 2018 |
| ASU 2017-12, “Derivatives and Hedging (Topic 815): Targeted Improvements to Accounting for Hedging Activities” | | January 1, 2019 |
| ASU 2016-13, “Financial Instruments-Credit Losses (Topic 326): Measurement of Credit Losses on Financial Instruments” | | January 1, 2020 |
Recently Adopted Accounting Pronouncements
On January 1, 2017, the Company early adopted Accounting Standards Update 2017-01 (“ASU 2017-01”), “Business Combinations (Topic 805): Clarifying the Definition of a Business.” The amendments in this guidance clarify the definition of a business with the objective of adding guidance to assist entities with evaluating whether transactions should be accounted for as acquisitions (or disposals) of assets or businesses. ASU 2017-01 was applied prospectively to any transactions occurring subsequent to January 1, 2017. Under the new standard, the Company expects that most property acquisitions will be accounted for as asset acquisitions, and as a result, most transaction costs will be capitalized rather than expensed. The impact on the Company’s consolidated financial statements will depend on the size and volume of future acquisition activity.
In addition, on January 1, 2017, the Company adopted the following accounting pronouncements which did not have a material effect on the Company’s consolidated financial statements:
| |
| • | ASU 2017-03, “Accounting Changes and Error Corrections (Topic 250) and Investments — Equity Method and Joint Ventures (Topic 323): Amendments to SEC Paragraphs Pursuant to Staff Announcements at the September 22, 2016 and November 17, 2016 EITF Meetings (SEC Update).” |
| |
| • | ASU 2016-05, “Derivatives and Hedging (Topic 815): Effect of Derivative Contract Novations on Existing Hedge Accounting Relationships.” |
Use of Estimates
The preparation of financial statements in conformity with GAAP requires management to make estimates and assumptions that affect the reported amounts of assets and liabilities, disclosures of contingent assets and liabilities at the date of the financial statements, and the reported amounts of revenues and expenses during the reporting period. Actual results could differ from those estimates.
Investments in Real Estate
Investments in real estate are recorded at historical cost. Major improvements that extend the life of an asset are capitalized and depreciated over the remaining useful life of the asset. The cost of ordinary repairs and maintenance are charged to expense when incurred. Depreciation and amortization are recorded on a straight-line basis over the estimated useful lives of the assets as follows:
|
| | |
| Buildings and improvements | | 7-40 years |
Leasehold interest - on-campus participating properties | | 25-34 years (shorter of useful life or respective lease term) |
| Furniture, fixtures and equipment | | 3-7 years |
AMERICAN CAMPUS COMMUNITIES, INC. AND SUBSIDIARIES
AMERICAN CAMPUS COMMUNITIES OPERATING PARTNERSHIP, L.P. AND SUBSIDIARIES
NOTES TO CONSOLIDATED FINANCIAL STATEMENTS
Project costs directly associated with the development and construction of an owned real estate project, which include interest, property taxes, and amortization of deferred financing costs, are capitalized as construction in progress. Upon completion of the project, costs are transferred into the applicable asset category and depreciation commences. Interest totaling approximately $15.9 million, $12.3 million and $9.6 million was capitalized during the years ended December 31, 2017, 2016 and 2015, respectively.
Management assesses whether there has been an impairment in the value of the Company’s investments in real estate whenever events or changes in circumstances indicate that the carrying amount of an asset may not be recoverable. Impairment is recognized when estimated expected future undiscounted cash flows are less than the carrying value of the property, or when a property meets the criteria to be classified as held for sale, at which time an impairment charge is recognized for any excess of the carrying value of the property over the expected net proceeds from the disposal. The estimation of expected future net cash flows is inherently uncertain and relies on assumptions regarding current and future economics and market conditions. If such conditions change, then an adjustment to the carrying value of the Company’s long-lived assets could occur in the future period in which the conditions change. To the extent that a property is impaired, the excess of the carrying amount of the property over its estimated fair value is charged to earnings. The Company believes that there were no impairments of the carrying values of its investments in real estate as of December 31, 2017, other than a $15.3 million impairment charge recorded during the second quarter 2017 for one property that is in the process of being transferred to the lender in settlement of the property’s $27.4 million mortgage loan that matured in August 2017 (see Note 10).
The Company evaluates each acquisition to determine if the integrated set of assets and activities acquired meet the definition of a business under ASU 2017-01. If either of the following criteria is met, the integrated set of assets and activities acquired would not qualify as a business:
| |
| • | Substantially all of the fair value of the gross assets acquired is concentrated in either a single identifiable asset or a group of similar identifiable assets; or |
| |
| • | The integrated set of assets and activities is lacking, at a minimum, an input and a substantive process that together significantly contribute to the ability to create outputs (i.e. revenue generated before and after the transaction). |
Property acquisitions deemed to qualify as a business are accounted for as business combinations, and the related acquisition costs are expensed as incurred. The Company allocates the purchase price of properties acquired in business combinations to net tangible and identified intangible assets based on their fair values. Fair value estimates are based on information obtained from a number of sources, including independent appraisals that may be obtained in connection with the acquisition or financing of the respective property, the Company’s own analysis of recently acquired and existing comparable properties in the Company’s portfolio, and other market data. Information obtained about each property as a result of due diligence, marketing and leasing activities is also considered. The value allocated to land is generally based on the actual purchase price if acquired separately, or market research/comparables if acquired as part of an existing operating property. The value allocated to building is based on the fair value determined on an “as-if vacant” basis, which is estimated using a replacement cost approach that relies upon assumptions that the Company believes are consistent with current market conditions for similar properties. The value allocated to furniture, fixtures, and equipment is based on an estimate of the fair value of the appliances and fixtures inside the units. The Company has determined these estimates are primarily based upon unobservable inputs and therefore are considered to be Level 3 inputs within the fair value hierarchy.
Acquisitions of properties that do not meet the definition of a business are accounted for as asset acquisitions. The accounting model for asset acquisitions is similar to the accounting model for business combinations except that the acquisition consideration (including transaction costs) is allocated to the individual assets acquired and liabilities assumed on a relative fair value basis. The relative fair values used to allocate the cost of an asset acquisition are determined using the same methodologies and assumptions as those utilized to determine fair value in a business combination.
Long-Lived Assets–Held for Sale
Long-lived assets to be disposed of are classified as held for sale in the period in which all of the following criteria are met:
| |
| a. | Management, having the authority to approve the action, commits to a plan to sell the asset. |
| |
| b. | The asset is available for immediate sale in its present condition subject only to terms that are usual and customary for sales of such assets. |
AMERICAN CAMPUS COMMUNITIES, INC. AND SUBSIDIARIES
AMERICAN CAMPUS COMMUNITIES OPERATING PARTNERSHIP, L.P. AND SUBSIDIARIES
NOTES TO CONSOLIDATED FINANCIAL STATEMENTS
| |
| c. | An active program to locate a buyer and other actions required to complete the plan to sell the asset have been initiated. |
| |
| d. | The sale of the asset is probable, and transfer of the asset is expected to qualify for recognition as a completed sale, within one year. |
| |
| e. | The asset is being actively marketed for sale at a price that is reasonable in relation to its current fair value. |
| |
| f. | Actions required to complete the plan indicate that it is unlikely that significant changes to the plan will be made or that the plan will be withdrawn. |
Concurrent with this classification, the asset is recorded at the lower of cost or fair value less estimated selling costs, and depreciation ceases. As discussed in more detail in Note 6, concurrent with the classification of one of the Company’s owned properties as held for sale as of December 31, 2016, the Company reduced the property’s carrying amount to its estimated fair value less estimated selling costs which resulted in an impairment charge. The Company did not have any properties classified as held for sale as of December 31, 2017.
Owned On-Campus Properties
Under its ACE program, the Company, as lessee, has entered into ground/facility lease agreements with fifteen university systems to finance, construct, and manage 32 student housing properties. Seven properties were under construction as of December 31, 2017 with five scheduled to open for occupancy in Fall 2018 and two in Fall 2019. The terms of the leases, including extension options, range from 30 to 90 years, and the lessor has title to the land and in some cases any improvements placed thereon. In these cases, the Company’s involvement in construction requires the lessor’s post construction ownership of the improvements to be treated as a sale with a subsequent leaseback by the Company. However, these sale-leaseback transactions do not qualify for sale-leaseback accounting because of the Company’s continuing involvement in the constructed assets. As a result of the Company’s continuing involvement, these leases are accounted for by the deposit method, in which the assets subject to the ground/facility leases are reflected at historical cost, less amortization, and the financing obligations are reflected at the terms of the underlying financing.
On-Campus Participating Properties
The Company has entered into ground and facility leases with three university systems and colleges to finance, construct, and manage five on-campus student housing facilities. Under the terms of the leases, the lessor has title to the land and any improvements placed thereon. With the exception of the Company’s lease with West Virginia University, each lease terminates upon final repayment of the construction related financing, the amortization period of which is contractually stipulated. The Company’s involvement in construction requires the lessor’s post construction ownership of the improvements to be treated as a sale with a subsequent leaseback by the Company. The sale-leaseback transaction has been accounted for as a financing, and as a result, any fee earned during construction is deferred and recognized over the term of the lease. The resulting financing obligation is reflected at the terms of the underlying financing, i.e., interest is accrued at the contractual rates and principal reduces in accordance with the contractual principal repayment schedules.
The entities that own the on-campus participating properties are determined to be VIEs, with the Company being the primary beneficiary. As such, the Company consolidates these properties for financial reporting purposes.
Cash and Cash Equivalents
The Company considers all highly liquid investments with a maturity of three months or less when purchased to be cash equivalents. The Company maintains cash balances in various banks. At times, the Company’s balances may exceed the amount insured by the FDIC. As the Company only uses money-centered financial institutions, the Company does not believe it is exposed to any significant credit risk related to its cash and cash equivalents.
AMERICAN CAMPUS COMMUNITIES, INC. AND SUBSIDIARIES
AMERICAN CAMPUS COMMUNITIES OPERATING PARTNERSHIP, L.P. AND SUBSIDIARIES
NOTES TO CONSOLIDATED FINANCIAL STATEMENTS
Restricted Cash
Restricted cash consists of funds held in trust and invested in low risk investments, generally consisting of government backed securities, as permitted by the indentures of trusts, which were established in connection with three bond issues for the Company’s on-campus participating properties. Additionally, restricted cash includes escrow accounts held by lenders and resident security deposits, as required by law in certain states. Restricted cash also consists of escrow deposits made in connection with potential property acquisitions and development opportunities. These escrow deposits are invested in interest-bearing accounts at federally-insured banks. Realized and unrealized gains and losses are not material for the periods presented.
Loans Receivable
Loans held for investment are intended to be held to maturity and, accordingly, are carried at cost, net of unamortized loan purchase discounts, and net of an allowance for loan losses when such loan is deemed to be impaired. Loan purchase discounts are amortized over the term of the loan. The unamortized discount on the loans receivable was $2.6 million and $2.8 million as of December 31, 2017 and 2016, respectively. The Company considers a loan impaired when, based upon current information and events, it is probable that it will be unable to collect all amounts due for both principal and interest according to the contractual terms of the loan agreement. Management’s estimate of the collectability of principal and interest payments under the Company’s loans receivable from CaPFA Capital Corp. 2000F (“CaPFA”), which mature in December 2040 and carry a balance, net of discount, of approximately $57.9 million and $58.5 million as of December 31, 2017 and 2016, respectively, are highly dependent on the future operating performance of the properties securing the loans. As future economic conditions and/or market conditions at the properties change, management will continue to evaluate the collectability of such amounts. The Company believes there were no impairments of the carrying value of its loans receivable as of December 31, 2017. Loans receivable are included in other assets on the accompanying consolidated balance sheets.
Intangible Assets
A portion of the purchase price of acquired properties is allocated to the value of in-place leases for both student and commercial tenants, which is based on the difference between (i) the property valued with existing in-place leases adjusted to market rental rates and (ii) the property valued “as-if” vacant. As lease terms for student leases are typically one year or less, rates on in-place leases generally approximate market rental rates. Factors considered in the valuation of in-place leases include an estimate of the carrying costs during the expected lease-up period considering current market conditions, nature of the tenancy, and costs to execute similar leases. Carrying costs include estimates of lost rentals at market rates during the expected lease-up period, as well as marketing and other operating expenses. The value of in-place leases is amortized over the remaining initial term of the respective leases. The purchase price of property acquisitions is not allocated to student tenant relationships, considering the terms of the leases and the expected levels of renewals.
In connection with the property acquisitions and investments in joint ventures, discussed in Note 5 herein, the Company capitalized approximately $7.4 million, $0.6 million and $3.3 million for the years December 31, 2017, 2016 and 2015, respectively, related to management’s estimate of the fair value of in-place leases assumed. The net carrying amount of in-place leases at December 31, 2017 and 2016 was approximately $4.2 million and $1.3 million, respectively, and is included in other assets on the accompanying consolidated balance sheets. Amortization expense was approximately $4.5 million, $0.9 million and $3.7 million for the years ended December 31, 2017, 2016 and 2015, respectively, and is included in depreciation and amortization expense in the accompanying consolidated statements of comprehensive income. As of December 31, 2017, the remaining weighted average student and commercial in-place lease term was 3.0 years. See Note 5 herein for an expanded discussion of the property acquisitions completed during 2017, 2016 and 2015.
For acquired properties subject to an in-place property tax incentive arrangement, a portion of the purchase price is allocated to the present value of expected future property tax savings over the projected incentive arrangement period. In connection with the property acquisitions discussed in Note 5 herein, the Company capitalized approximately $10.2 million, $3.6 million and $13.7 million for the years December 31, 2017, 2016 and 2015, respectively, related to management’s estimate of the fair value of in-place property tax incentive arrangements assumed. Unamortized in-place property tax incentive arrangements as of December 31, 2017 and 2016 were approximately $61.4 million and $55.1 million, respectively, and are included in other assets on the accompanying consolidated balance sheets. Amortization expense was approximately $3.3 million, $2.9 million and $2.8 million for the years ended December 31, 2017, 2016 and 2015, respectively, and is included in owned properties operating expense in the accompanying consolidated statements of comprehensive income. As of December 31, 2017, the remaining weighted average
AMERICAN CAMPUS COMMUNITIES, INC. AND SUBSIDIARIES
AMERICAN CAMPUS COMMUNITIES OPERATING PARTNERSHIP, L.P. AND SUBSIDIARIES
NOTES TO CONSOLIDATED FINANCIAL STATEMENTS
tax incentive arrangement period was 18.6 years. See Note 5 herein for an expanded discussion of the property acquisitions completed during 2017, 2016 and 2015.
Deferred Financing Costs
The Company defers financing costs and amortizes the costs over the terms of the related debt using the effective-interest method. Upon repayment of or in conjunction with a material change in the terms of the underlying debt agreement, any unamortized costs are charged to earnings. In those instances when debt modifications do not include material changes to the terms of the underlying debt agreement, unamortized costs of the original instrument are added to the costs of the modification and amortized over the life of the modified debt using the effective interest method. Deferred financing costs, net of amortization, for the Company’s revolving credit facility are included in other assets on the accompanying consolidated balance sheets. Net deferred financing costs for the Company’s revolving credit facility at December 31, 2017 and 2016 were approximately $4.6 million and $1.4 million, respectively.
Redeemable Noncontrolling Interests
The Company follows guidance issued by the FASB regarding the classification and measurement of redeemable securities. Under this guidance, securities that are redeemable for cash or other assets, at the option of the holder and not solely within the control of the issuer, must be classified outside of permanent equity as redeemable noncontrolling interests. The Company makes this determination based on terms in the applicable agreements, specifically in relation to redemption provisions. The Company initially records the redeemable noncontrolling interests at fair value. The carrying amount of the redeemable noncontrolling interest is subsequently adjusted to the redemption value (assuming the noncontrolling interest is redeemable at the balance sheet date), with the corresponding offset for changes in fair value recorded in additional paid in capital. Reductions in fair value are recorded only to the extent that the Company has previously recorded increases in fair value above the redeemable noncontrolling interests’ initial basis. As the changes in redemption value are based on fair value, there is no effect on the Company’s earnings per share. Redeemable noncontrolling interests on the accompanying consolidated balance sheets of ACC are referred to as redeemable limited partners on the consolidated balance sheets of the Operating Partnership. Refer to Note 9 for a more detailed discussion of redeemable noncontrolling interests for both ACC and the Operating Partnership.
Joint Ventures
The Company consolidates joint ventures when it exhibits financial or operational control, which is determined using accounting standards related to the consolidation of joint ventures and VIEs. For joint ventures that are defined as VIEs, the primary beneficiary consolidates the entity. The Company considers itself to be the primary beneficiary of a VIE when it has the power to direct the activities that most significantly impact the performance of the VIE, such as management of day-to-day operations, preparing and approving operating and capital budgets, and encumbering or selling the related properties. In instances where the Company is not the primary beneficiary, it does not consolidate the joint venture for financial reporting purposes.
For joint ventures that are not defined as VIEs, where the Company is the general partner, but does not control the joint venture as the other partners hold substantive participating rights, the Company uses the equity method of accounting. For joint ventures where the Company is a limited partner, management evaluates whether the Company holds substantive participating rights. In instances where the Company holds substantive participating rights in the joint venture, the Company consolidates the joint venture; otherwise it uses the equity method of accounting.
Presale Development Projects
As part of its development strategy, the Company enters into presale agreements to purchase various properties. Under the terms of these agreements, the Company is obligated to purchase the property as long as certain construction completion deadlines and other closing conditions are met. The Company is typically responsible for leasing, management, and initial operations of the project while the third-party developer retains development risk during the construction period. The entity that owns the property is deemed to be a VIE, and the Company is deemed to be the primary beneficiary of the VIE. As such, upon execution of the purchase and sale agreement, the Company records the assets, liabilities and noncontrolling interest of the entity owning the property at fair value.
AMERICAN CAMPUS COMMUNITIES, INC. AND SUBSIDIARIES
AMERICAN CAMPUS COMMUNITIES OPERATING PARTNERSHIP, L.P. AND SUBSIDIARIES
NOTES TO CONSOLIDATED FINANCIAL STATEMENTS
Mortgage Debt - Premiums and Discounts
Mortgage debt premiums and discounts represent fair value adjustments to account for the difference between the stated rates and market rates of mortgage debt assumed in connection with the Company’s property acquisitions. The mortgage debt premiums and discounts are included in secured mortgage, construction, and bond debt on the accompanying consolidated balance sheets and are amortized to interest expense over the term of the related mortgage loans using the effective-interest method. The amortization of mortgage debt premiums and discounts resulted in a net decrease to interest expense of approximately $7.8 million, $12.0 million and $12.0 million for the years ended December 31, 2017, 2016 and 2015, respectively. As of December 31, 2017 and 2016, net unamortized mortgage debt premiums were approximately $19.0 million and $26.8 million, respectively. The Company did not have any unamortized debt discounts as of December 31, 2017 and 2016.
Unsecured Notes - Original Issue Discount
The Company has completed four offerings of senior unsecured notes totaling $1.6 billion that are detailed in Note 10 herein. The total unamortized original issue discount was approximately $1.9 million as of both December 31, 2017 and 2016, and is included in unsecured notes on the accompanying consolidated balance sheets. Amortization of the original issue discounts of approximately $0.3 million, $0.3 million, and $0.2 million for the years ended December 31, 2017, 2016, and 2015, respectively, is included in interest expense on the accompanying consolidated statements of comprehensive income.
Rental Revenues and Related Receivables
Students are required to execute lease contracts with payment schedules that vary from single to monthly payments. Receivables are recorded when billed, revenues and related lease incentives are recognized on a straight-line basis over the term of the contracts, and balances are considered past due when payment is not received on the contractual due date. The Company generally requires each executed contract to be accompanied by a signed parental guaranty, and in certain cases a refundable security deposit. Security deposits are refundable, net of any outstanding charges, upon expiration of the underlying contract.
Allowances for receivables are established when management determines that collection of such receivables is doubtful. Management’s determination of the adequacy of the allowances is based primarily on an analysis of the aging of receivables, historical bad debts, and current economic trends. When management has determined receivables to be uncollectible, which is typically after two years, they are removed as an asset with a corresponding reduction in the allowance for doubtful accounts.
The allowance for doubtful accounts is summarized as follows:
|
| | | | | | | | | | | | | | | | |
| | | Balance, Beginning of Period | | Charged to Expense | | Write-Offs (1) | | Balance, End of Period |
| Year ended December 31, 2015 | | $ | 19,711 |
| | $ | 10,115 |
| | $ | (12,772 | ) | | $ | 17,054 |
|
| Year ended December 31, 2016 | | $ | 17,054 |
| | $ | 9,195 |
| | $ | (9,794 | ) | | $ | 16,455 |
|
| Year ended December 31, 2017 | | $ | 16,455 |
| | $ | 6,753 |
| | $ | (8,860 | ) | | $ | 14,348 |
|
| |
(1) | Write-offs include $3.1 million, $3.1 million, and $4.0 million during the years ended December 31, 2017, 2016, and 2015, respectively, related to properties disposed of in prior years. |
Tenant Reimbursements
Reimbursements from tenants, consisting of amounts due from tenants for utilities, are recognized as revenue in the period the recoverable costs are incurred. Tenant reimbursements are recognized and recorded on a gross basis, as the Company is generally the primary obligor with respect to purchasing goods and services from third-party suppliers, has discretion in selecting the supplier, and has credit risk.
AMERICAN CAMPUS COMMUNITIES, INC. AND SUBSIDIARIES
AMERICAN CAMPUS COMMUNITIES OPERATING PARTNERSHIP, L.P. AND SUBSIDIARIES
NOTES TO CONSOLIDATED FINANCIAL STATEMENTS
Third-Party Development Services Revenue
Development revenues are generally recognized based on a proportional performance method based on contract deliverables, while construction revenues are recognized using the percentage of completion method, as determined by construction costs incurred relative to total estimated construction costs. For projects where the Company’s fee is based on a fixed price, any cost overruns incurred during construction, as compared to the original budget, will reduce the net fee generated on those projects. Incentive fees are recognized when the project is complete and performance has been agreed upon by all parties, or when performance has been verified by an independent third-party. The Company also evaluates the collectability of third-party fee income and expense reimbursements generated through the provision of development and construction management services based upon the individual facts and circumstances, including the contractual right to receive such amounts in accordance with the terms of the various projects, and reserves any amounts that are deemed to be uncollectible.
Upon the adoption of ASU 2014-09 on January 1, 2019, there will be a change in the way the Company determines the unit of account for these projects. Although the adoption of ASU 2014-09 will have an impact on the timing and pattern of revenue recognition in relation to third-party development contracts, the Company has concluded it will not have a material effect on its consolidated financial statements. Refer to Recently Issued Accounting Pronouncements above for more details.
Pre-development expenditures such as architectural fees, permits and deposits associated with the pursuit of third-party and owned development projects are expensed as incurred, until such time that management believes it is probable that the contract will be executed and/or construction will commence, at which time the Company capitalizes the costs. Because the Company frequently incurs these pre-development expenditures before a financing commitment and/or required permits and authorizations have been obtained, the Company bears the risk of loss of these pre-development expenditures if financing cannot ultimately be arranged on acceptable terms or the Company is unable to successfully obtain the required permits and authorizations. As such, management evaluates the status of third-party and owned projects that have not yet commenced construction on a periodic basis and expenses any deferred costs related to projects whose current status indicates the commencement of construction is unlikely and/or the costs may not provide future value to the Company in the form of revenues. Such write-offs are included in third-party development and management services expenses (in the case of third-party development projects) or general and administrative expenses (in the case of owned development projects) on the accompanying consolidated statements of comprehensive income. As of December 31, 2017, the Company has deferred approximately $4.7 million in pre-development costs related to third-party and owned development projects that have not yet commenced construction. Such costs are included in other assets on the accompanying consolidated balance sheets.
Third-Party Management Services Revenue
Management fees are recognized when earned in accordance with each management contract. Incentive management fees are recognized when the incentive criteria have been met. The Company evaluates the collectability of revenue earned from third-party management contracts and reserves any amounts deemed to be uncollectible based on the individual facts and circumstances of the projects and associated contracts. Similar to its third-party development services revenue, the Company has concluded that the adoption of ASU 2014-09 will not have a material impact on its consolidated financial statements.
Advertising Costs
Advertising costs are expensed during the period incurred, or as the advertising takes place, depending on the nature and term of the specific advertising arrangements. Advertising expense approximated $12.7 million, $12.8 million and $11.8 million for the years ended December 31, 2017, 2016 and 2015, respectively.
AMERICAN CAMPUS COMMUNITIES, INC. AND SUBSIDIARIES
AMERICAN CAMPUS COMMUNITIES OPERATING PARTNERSHIP, L.P. AND SUBSIDIARIES
NOTES TO CONSOLIDATED FINANCIAL STATEMENTS
Derivative Instruments and Hedging Activities
The Company records all derivative financial instruments on the balance sheet at fair value. Changes in fair value are recognized either in earnings or as other comprehensive income, depending on whether the derivative has been designated as a fair value or cash flow hedge and whether it qualifies as part of a hedging relationship, the nature of the exposure being hedged, and how effective the derivative is at offsetting movements in underlying exposure. The Company discontinues hedge accounting when: (i) it determines that the derivative is no longer effective in offsetting changes in the fair value or cash flows of a hedged item; (ii) the derivative expires or is sold, terminated, or exercised; (iii) it is no longer probable that the forecasted transaction will occur; or (iv) management determines that designating the derivative as a hedging instrument is no longer appropriate. In all situations in which hedge accounting is discontinued and the derivative remains outstanding, the Company will carry the derivative at its fair value on the balance sheet, recognizing changes in the fair value in current-period earnings. The Company uses interest rate swaps to effectively convert a portion of its floating rate debt to fixed rate, thus reducing the impact of rising interest rates on interest payments. These instruments are designated as cash flow hedges and the interest differential to be paid or received is accrued as interest expense. The Company’s counter-parties are major financial institutions. See Note 13 for an expanded discussion on derivative instruments and hedging activities.
Common Stock Issuances and Costs
Specific incremental costs directly attributable to the Company’s equity offerings are deferred and charged against the gross proceeds of the offering. As such, underwriting commissions and other common stock issuance costs are reflected as a reduction of additional paid in capital. See Note 11 for an expanded discussion on common stock issuances and costs.
Share-Based Compensation
Compensation expense associated with share-based awards is recognized in the consolidated statements of comprehensive income based on the grant-date fair values net of the estimated forfeitures. Compensation expense is recognized over the period during which the employee is required to provide service in exchange for the award, which is generally the vesting period. The estimated forfeitures included in compensation expense are based on historical experience and are adjusted to reflect actual forfeitures at the end of the vesting period. See Note 12 for an expanded discussion of the Company’s share-based compensation awards.
Income Taxes
The Company has elected to be taxed as a REIT under the Internal Revenue Code of 1986, as amended (the “Code”). To qualify as a REIT, the Company must meet a number of organizational and operational requirements, including a requirement that it currently distribute at least 90% of its adjusted taxable income to its stockholders. As a REIT, the Company will generally not be subject to corporate level federal income tax on taxable income it currently distributes to its stockholders. If the Company fails to qualify as a REIT in any taxable year, it will be subject to federal income taxes at regular corporate rates (including any applicable alternative minimum tax) and may not be able to qualify as a REIT for the subsequent four taxable years. Even if the Company qualifies for taxation as a REIT, the Company may be subject to certain state and local income and excise taxes on its income and property, and to federal income and excise taxes on its undistributed income.
The Company owns two TRSs, one of which manages the Company’s non-REIT activities and each of which is subject to federal, state and local income taxes.
3. Earnings Per Share
Earnings Per Share – Company
Basic earnings per share is computed using net income attributable to common shareholders and the weighted average number of shares of the Company’s common stock outstanding during the period. Diluted earnings per share reflects common shares issuable from the assumed conversion of American Campus Communities Operating Partnership Units (“OP Units”) and common share awards granted. Only those items having a dilutive impact on basic earnings per share are included in diluted earnings per share.
The following potentially dilutive securities were outstanding for the years ended December 31, 2017, 2016 and 2015, but were not included in the computation of diluted earnings per share because the effects of their inclusion would be anti-dilutive.
AMERICAN CAMPUS COMMUNITIES, INC. AND SUBSIDIARIES
AMERICAN CAMPUS COMMUNITIES OPERATING PARTNERSHIP, L.P. AND SUBSIDIARIES
NOTES TO CONSOLIDATED FINANCIAL STATEMENTS
|
| | | | | | | | | |
| | | Year Ended December 31, |
| | | 2017 | | 2016 | | 2015 |
| Common OP Units (Note 9) | | 1,019,186 |
| | 1,231,500 |
| | — |
|
| Preferred OP Units (Note 9) | | 77,513 |
| | 90,763 |
| | 109,775 |
|
| Total potentially dilutive securities | | 1,096,699 |
| | 1,322,263 |
| | 109,775 |
|
The following is a summary of the elements used in calculating basic and diluted earnings per share: |
| | | | | | | | | | | | |
| | | Year Ended December 31, |
| | | 2017 | | 2016 | | 2015 |
| Numerator - basic earnings per share: | | | | | | |
| Net income | | $ | 70,121 |
| | $ | 100,623 |
| | $ | 118,061 |
|
| Net income attributable to noncontrolling interests | | (1,083 | ) | | (1,562 | ) | | (2,070 | ) |
| Net income attributable to common stockholders | | 69,038 |
| | 99,061 |
| | 115,991 |
|
| Amount allocated to participating securities | | (1,536 | ) | | (1,338 | ) | | (1,086 | ) |
Net income attributable to common stockholders -
basic | | $ | 67,502 |
| | $ | 97,723 |
| | $ | 114,905 |
|
| | | | | | | |
| Numerator - diluted earnings per share: | |
|
| | | | |
| Net income attributable to common stockholders - basic | | $ | 67,502 |
| | $ | 97,723 |
| | $ | 114,905 |
|
| Net income attributable to Common OP Units | | — |
| | — |
| | 1,282 |
|
Net income attributable to common stockholders - diluted | | $ | 67,502 |
| | $ | 97,723 |
| | $ | 116,187 |
|
| | | | | | | |
| Denominator: | | | | | | |
| Basic weighted average common shares outstanding | | 135,141,423 |
| | 129,228,748 |
| | 111,987,361 |
|
| Unvested restricted stock awards (Note 12) | | 860,962 |
| | 789,981 |
| | 680,980 |
|
| Common OP Units (Note 9) | | — |
| | — |
| | 1,363,881 |
|
| Diluted weighted average common shares outstanding | | 136,002,385 |
| | 130,018,729 |
| | 114,032,222 |
|
|
| | | | | | | | | | | | |
| | | Year Ended December 31, |
| | | 2017 | | 2016 | | 2015 |
| Earnings per share: | | | | | | |
| Net income attributable to common stockholders - Basic | | $ | 0.50 |
| | $ | 0.76 |
| | $ | 1.03 |
|
| Net income attributable to common stockholders - diluted | | $ | 0.50 |
| | $ | 0.75 |
| | $ | 1.02 |
|
Earnings Per Unit – Operating Partnership
Basic earnings per OP Unit is computed using net income attributable to common unitholders and the weighted average number of common units outstanding during the period. Diluted earnings per OP Unit reflects the potential dilution that could occur if securities or other contracts to issue OP Units were exercised or converted into OP Units or resulted in the issuance of OP Units and then shared in the earnings of the Operating Partnership.
AMERICAN CAMPUS COMMUNITIES, INC. AND SUBSIDIARIES
AMERICAN CAMPUS COMMUNITIES OPERATING PARTNERSHIP, L.P. AND SUBSIDIARIES
NOTES TO CONSOLIDATED FINANCIAL STATEMENTS
The following is a summary of the elements used in calculating basic and diluted earnings per unit:
|
| | | | | | | | | | | | |
| | | Year Ended December 31, |
| | | 2017 | | 2016 | | 2015 |
| Numerator - basic and diluted earnings per unit: | | | | | | |
| Net income | | $ | 70,121 |
| | $ | 100,623 |
| | $ | 118,061 |
|
| Net income attributable to noncontrolling interests – partially owned properties | | (435 | ) | | (456 | ) | | (612 | ) |
| Series A preferred unit distributions | | (124 | ) | | (146 | ) | | (176 | ) |
| Amount allocated to participating securities | | (1,536 | ) | | (1,338 | ) | | (1,086 | ) |
| Net income attributable to common unitholders | | $ | 68,026 |
| | $ | 98,683 |
| | $ | 116,187 |
|
| | | | | | | |
| Denominator: | | | | | | |
| Basic weighted average common units outstanding | | 136,160,609 |
| | 130,460,248 |
| | 113,351,242 |
|
| Unvested restricted stock awards (Note 12) | | 860,962 |
| | 789,981 |
| | 680,980 |
|
| Diluted weighted average common units outstanding | | 137,021,571 |
| | 131,250,229 |
| | 114,032,222 |
|
|
| | | | | | | | | | | | |
| Earnings per unit: | | | | | | |
| Net income attributable to common unitholders - basic | | $ | 0.50 |
| | $ | 0.76 |
| | $ | 1.03 |
|
| Net income attributable to common unitholders - diluted | | $ | 0.50 |
| | $ | 0.75 |
| | $ | 1.02 |
|
4. Income Taxes
As mentioned in Note 2, the Company qualifies as a REIT under the Code. As a REIT, the Company is not subject to federal income tax as long as it distributes at least 90% of its taxable income to its shareholders each year. Therefore, no provision for federal income taxes for the REIT has been included in the accompanying consolidated financial statements. If the Company fails to qualify as a REIT, the Company will be subject to federal income tax (including any applicable alternative minimum tax) on its taxable income and to federal income and excise taxes on its undistributed income. In addition, ACCOP is a flow-through entity and is not subject to federal income taxes at the entity level. Historically, the Company has incurred only state and local income, franchise and margin taxes.
The Company’s TRSs are subject to federal, state, and local income taxes. As such, deferred income taxes result from temporary differences between the carrying amounts of assets and liabilities of the TRSs for financial reporting purposes and the amounts used for income tax purposes. On December 22, 2017, the Tax Cuts and Jobs Act was signed into law, making significant changes to the Internal Revenue Code including, but not limited to, reduction of the federal corporate income tax rate to 21%. The new rate will apply beginning on January 1, 2018, and is a significant decrease from the prior graduated rate structure, which included a 35% maximum. Deferred tax assets and liabilities are measured using enacted tax rates in effect in the years in which those temporary differences are expected to reverse. As of December 31, 2017, we have not completed our accounting for the tax effects of enactment of the Tax Cuts and Jobs Act, however we have made a reasonable estimate of the effects on our existing deferred income tax balances below to reflect the impact of the rate reduction. We are still analyzing certain aspects of the Tax Cuts and Jobs Act and refining our calculations, which could potentially affect the measurement of these balances or potentially give rise to new deferred tax amounts. In addition, our estimates may also be affected as we gain a more thorough understanding of the new tax law.
AMERICAN CAMPUS COMMUNITIES, INC. AND SUBSIDIARIES
AMERICAN CAMPUS COMMUNITIES OPERATING PARTNERSHIP, L.P. AND SUBSIDIARIES
NOTES TO CONSOLIDATED FINANCIAL STATEMENTS
|
| | | | | | | | |
| | | December 31, |
| | | 2017 | | 2016 |
| Deferred tax assets: | | | | |
| Fixed and intangible assets | | $ | 750 |
| | $ | 2,074 |
|
| Net operating loss carryforwards | | 8,808 |
| | 9,492 |
|
| Prepaid and deferred income | | 1,459 |
| | 2,417 |
|
| Bad debt reserves | | 574 |
| | 754 |
|
| Accrued expenses and other | | 2,769 |
| | 5,251 |
|
| Stock compensation | | 2,017 |
| | 2,866 |
|
| Total deferred tax assets | | 16,377 |
| | 22,854 |
|
| Valuation allowance for deferred tax assets | | (16,293 | ) | | (22,688 | ) |
| Deferred tax assets, net of valuation allowance | | 84 |
| | 166 |
|
| | | | | |
| Deferred tax liability: | | |
| | |
|
| Deferred financing costs | | 84 |
| | 166 |
|
| | | | | |
| Net deferred tax liabilities | | $ | — |
| | $ | — |
|
Significant components of the Company’s income tax provision are as follows:
|
| | | | | | | | | | | | |
| | | Year Ended December 31, |
| | | 2017 | | 2016 | | 2015 |
| Current: | | |
| | |
| | |
|
| Federal | | $ | — |
| | $ | — |
| | $ | — |
|
| State | | (989 | ) | | (1,150 | ) | | (1,242 | ) |
| Deferred: | | |
| | |
| | |
|
| Federal | | — |
| | — |
| | — |
|
| State | | — |
| | — |
| | — |
|
| Total provision | | $ | (989 | ) | | $ | (1,150 | ) | | $ | (1,242 | ) |
TRS earnings subject to tax consisted of losses of approximately $8.4 million, $3.8 million and $3.3 million for the years ended December 31, 2017, 2016 and 2015, respectively. The reconciliation of income tax for the TRSs computed at the U.S. statutory rate to income tax provision is as follows:
|
| | | | | | | | | | | | |
| | | Year Ended December 31, |
| | | 2017 | | 2016 | | 2015 |
Tax benefit at U.S. statutory rates on TRS income subject to tax | | $ | 1,277 |
| | $ | 2,303 |
| | $ | 2,019 |
|
| State income tax, net of federal income tax benefit | | 57 |
| | 85 |
| | 74 |
|
| Effect of permanent differences and other | | 207 |
| | (88 | ) | | (77 | ) |
| Deferred tax impact of tax reform | | (9,206 | ) | | — |
| | — |
|
| Decrease (increase) in valuation allowance | | 7,665 |
| | (2,300 | ) | | (2,016 | ) |
| TRS income tax provision | | $ | — |
| | $ | — |
| | $ | — |
|
At December 31, 2017, the TRSs had net operating loss carryforwards (“NOLs”) of approximately $38.2 million for income tax purposes that begin to expire in 2026. These NOLs may be used to offset future taxable income generated by each of the respective TRSs. Due to the various limitations to which the use of NOLs are subject, the Company has applied a valuation allowance to the NOLs given the likelihood that the NOLs will expire unused. The Company and its subsidiaries file income tax returns in the U.S. federal jurisdiction and various states’ jurisdictions as required, and as of December 31, 2017, the 2016, 2015 and 2014 calendar tax years are subject to examination by the tax authorities.
AMERICAN CAMPUS COMMUNITIES, INC. AND SUBSIDIARIES
AMERICAN CAMPUS COMMUNITIES OPERATING PARTNERSHIP, L.P. AND SUBSIDIARIES
NOTES TO CONSOLIDATED FINANCIAL STATEMENTS
The Company had no material unrecognized tax benefits for the years ended December 31, 2017, the 2016, and 2015, and as of December 31, 2017, the Company does not expect to record any material unrecognized tax benefits. Because no material unrecognized tax benefits have been recorded, no related interest or penalties have been calculated.
A schedule of per share distributions the Company paid and reported to its shareholders, which is unaudited, is set forth in the following table:
|
| | | | | | | | | | | | |
| | | Year Ended December 31, |
| Tax Treatment of Distributions: | | 2017 | | 2016 | | 2015 |
| Ordinary income | | $ | 0.8316 |
| | $ | 0.3541 |
| | $ | 0.4658 |
|
Long-term capital gain (1) | | — |
| | 0.5145 |
| | 0.5301 |
|
| Return of capital | | 0.9084 |
| | 0.7914 |
| | 0.5841 |
|
| Total per common share outstanding | | $ | 1.7400 |
| | $ | 1.6600 |
| | $ | 1.5800 |
|
(1) Unrecaptured Sec. 1250 gains of $0.5383 and $0.5281 were reported for the years ended December 31, 2016 and 2015, respectively. There was no unrecaptured Sec. 1250 gain reported for the year ended December 31, 2017.
5. Acquisitions and Joint Venture Investments
Asset Acquisitions
As described in Note 2, the Company adopted ASU 2017-01 prospectively to any property acquisition transactions that occurred subsequent to January 1, 2017. Under the new standard, the Company expects that most property acquisitions will be accounted for as asset acquisitions rather than business combinations.
Core Transaction Overview: During the third quarter of 2017, the Company executed an agreement to acquire a portfolio of seven student housing properties from affiliates of Core Spaces and DRW Real Estate Investments (the “Core Transaction”). The transaction included the purchase of 100% of the ownership interests in two operating properties, the purchase of partial ownership interests in two operating properties through a joint venture arrangement (with one property being subject to a purchase option that was exercised in October 2017, with initial funding occurring in November 2017), and the purchase of partial ownership interests in three in-process development properties through a joint venture arrangement. In total, the Core Transaction properties contain 3,776 beds and the initial investment made at closing was $306.0 million. Including the initial investment, the Company expects to invest a total of $590.6 million through a phased purchase of 100% of the ownership interest in all seven properties.
Core Transaction Property Acquisitions: In August 2017, the Company purchased 100% of the ownership interests in two properties for a total purchase price of approximately $146.1 million. Total cash consideration was approximately $144.3 million. The difference between the contracted purchase price and the cash consideration is due to other assets and liabilities that were not part of the contractual purchase price, but were acquired in the transactions, as well as transaction costs capitalized as part of the acquisitions. A list of these two properties acquired as part of the Core Transaction is as follows:
|
| | | | | | | | |
| Property | | Location | | Primary University Served | | Acquisition Date | | Beds |
| The 515 | | Eugene, OR | | University of Oregon | | August 2017 | | 513 |
| State | | Fort Collins, CO | | Colorado State University | | August 2017 | | 665 |
| | | | | | | | | 1,178 |
Core Transaction Joint Ventures: As mentioned above, during the third quarter of 2017, the Company funded initial investments in two joint ventures (the “Core Joint Ventures”). The Core Joint Venture transactions involved the joint venture partner making a non-cash contribution of properties and the Company making a cash contribution to the joint ventures in exchange for its membership interests. The Core Joint Ventures were determined to be VIEs, with the Company being the primary beneficiary. As such, the Core Joint Ventures are included in the Company’s consolidated financial statements contained herein. Additionally, the partners’ ownership interests in each of the joint ventures are accounted for as redeemable noncontrolling interests. For further discussion, refer to Note 9.
The first joint venture (the “Core JV I”) holds two properties (The James and Hub U District Seattle) that completed construction and opened for operations in the third quarter 2017. The Company’s initial investment was $135.7 million for an approximate 67% interest in the joint venture, part of which was used to pay off a $92.4 million construction loan at closing. Additionally, the Company has an option to purchase the remaining ownership interests in the joint venture in the fourth quarter of 2019 under a
AMERICAN CAMPUS COMMUNITIES, INC. AND SUBSIDIARIES
AMERICAN CAMPUS COMMUNITIES OPERATING PARTNERSHIP, L.P. AND SUBSIDIARIES
NOTES TO CONSOLIDATED FINANCIAL STATEMENTS
put/call agreement with the joint venture partner for an amount to be determined by the fair market value of the properties at the date of exercise. The value of the remaining ownership interests is anticipated to approximate $68.8 million.
The second joint venture (the “Core JV II”) holds three in-process development properties that are currently under construction and are scheduled to complete construction and open for operations in Fall 2018. The Company’s initial investment was $24.2 million for an approximate 58% interest in the joint venture. Upon the initial funding, the Company assumed sole operational control, while the partner retained certain limited decision making abilities, including responsibility for the development and delivery of the properties within an agreed-upon budget and completion timeline. The joint venture partner has also provided a payment guarantee for the construction loans that are partially financing the construction of the properties. Subsequent to the successful completion and delivery of the assets, which is expected to occur in September 2018, the Company anticipates increasing its investment in Core JV II by $130.6 million as a result of paying off the construction loans. Additionally, the Company has an option to purchase the remaining ownership interests in the joint venture in the third quarter of 2019 under a put/call agreement with the joint venture partner for an amount to be determined by the fair market value of the properties at the date of exercise. The value of the remaining ownership interests upon exercise of the option is anticipated to approximate $85.2 million.
A list of the properties contributed to the Core Joint Ventures as part of the Core Transaction are as follows:
|
| | | | | | | | |
| Property | | Location | | Primary University Served | | Actual or Targeted Completion Date | | Beds |
| Core JV I: | | | | | | | | |
| The James | | Madison, WI | | University of Wisconsin - Madison | | August 2017 | | 850 |
| Hub U District Seattle | | Seattle, WA | | University of Washington | | September 2017 | | 248 |
| | | | | | | | | 1,098 |
| Core JV II: | | | | | | | | |
| Hub Ann Arbor | | Ann Arbor, MI | | University of Michigan | | September 2018 | | 310 |
| Hub Flagstaff | | Flagstaff, AZ | | Northern Arizona University | | September 2018 | | 591 |
| Hub West Lafayette | | West Lafayette, IN | | Purdue University | | September 2018 | | 599 |
| | | | | | | | | 1,500 |
| | | | | | | | | |
| | | | | | | | | 2,598 |
Other 2017 Property Acquisitions: In addition to the two properties acquired as part of the Core Transaction discussed above, during the year ended December 31, 2017 the Company acquired three properties containing 1,240 beds for approximately $222.9 million. Total cash consideration was approximately $222.3 million. The difference between the contracted purchase price and the cash consideration is due to other assets and liabilities that were not part of the contractual purchase price, but were acquired in the transactions, as well as transaction costs capitalized as part of the acquisitions.
A list of these properties is outlined below:
|
| | | | | | | | |
| Property | | Location | | Primary University Served | | Acquisition Date | | Beds |
| The Arlie | | Arlington, TX | | University of Texas Arlington | | April 2017 | | 598 |
| TWELVE at U District | | Seattle, WA | | University of Washington | | June 2017 | | 384 |
| Bridges @ 11th | | Seattle, WA | | University of Washington | | October 2017 | | 258 |
| | | | | | | | | 1,240 |
Land Acquisitions: During the year ended December 31, 2017, the Company purchased five land parcels with a fair value of $12.0 million for total cash consideration of approximately $8.9 million. The difference between the fair value of the land and the cash consideration represents non-cash consideration. In addition, the Company made an initial investment of $9.0 million in a joint venture that holds a land parcel with fair value of $12.0 million.
AMERICAN CAMPUS COMMUNITIES, INC. AND SUBSIDIARIES
AMERICAN CAMPUS COMMUNITIES OPERATING PARTNERSHIP, L.P. AND SUBSIDIARIES
NOTES TO CONSOLIDATED FINANCIAL STATEMENTS
Business Combinations
As discussed above, properties acquired prior to January 1, 2017 were accounted for as business combinations.
2016 Acquisition Activity: During the year ended December 31, 2016, the Company acquired two properties containing 709 beds for a total purchase price of approximately $63.1 million, and secured two in-process development properties containing 1,333 beds for approximately $39.6 million.
2015 Acquisition Activity: During the year ended December 31, 2015, the Company acquired eight properties containing 4,061 beds for a total purchase price of approximately $378.3 million. As part of these transactions, the Company assumed approximately $69.4 million of mortgage debt and issued 343,895 Common OP Units, valued at $41.24 per unit.
The following table summarizes the fair values of the assets acquired and liabilities assumed from the 2016 property acquisitions discussed above:
|
| | | | |
| | | 2016 |
| Assets: | | |
| Land | | $ | 14,720 |
|
| Buildings and improvements | | 54,162 |
|
| Furniture, fixtures and equipment | | 2,736 |
|
| Construction in progress | | 27,806 |
|
| Intangible assets | | 4,442 |
|
| Other assets | | — |
|
| Total assets | | $ | 103,866 |
|
| | | |
| Liabilities: | | |
| Other liabilities | | (1,062 | ) |
| Net assets | | $ | 102,804 |
|
For the year ended December 31, 2016, the difference between the contracted purchase price of $102.7 million reflected above and the net assets acquired of $102.8 million is due to other assets and liabilities that were not part of the contractual purchase price, but were acquired in the transactions, as well as transaction costs capitalized as part of the acquisition of two in-process development properties.
The acquired properties’ results of operations have been included in the accompanying consolidated statements of comprehensive income since the respective acquisition closing dates, with the exception of properties under presale agreements, discussed below, and properties held by joint ventures, discussed above, which were consolidated prior to their acquisition dates. The following pro forma information for the years ended December 31, 2016 and 2015, presents consolidated financial information for the Company as if the 2016 and 2015 property acquisitions had occurred at the beginning of the earliest period presented. The unaudited pro forma information is provided for informational purposes only and is not indicative of results that would have occurred or which may occur in the future:
|
| | | | | | | | |
| | Year Ended December 31, |
| | | 2016 | | 2015 |
| Total revenues | | $ | 789,942 |
| | $ | 769,797 |
|
| Net income attributable to common shareholders | | $ | 99,941 |
| | $ | 123,101 |
|
During 2016, the Company entered into a presale agreement to purchase The Edge - Stadium Centre, a property under development, for approximately $42.6 million, which includes the contractual purchase price and the cost of elected upgrades. The property is scheduled to be completed in August 2018.
During 2015, the Company entered into a presale agreement to purchase The Court, a property under development for $26.5 million. The closing of the transaction occurred in May 2016 and was accounted for as an increase in ownership of a consolidated subsidiary. The property opened for operations in August 2016.
AMERICAN CAMPUS COMMUNITIES, INC. AND SUBSIDIARIES
AMERICAN CAMPUS COMMUNITIES OPERATING PARTNERSHIP, L.P. AND SUBSIDIARIES
NOTES TO CONSOLIDATED FINANCIAL STATEMENTS
6. Property Dispositions
During the year ended December 31, 2017, the Company sold The Province - Dayton, an owned property located near Wright State University in Dayton, Ohio, containing 657 beds for approximately $25.0 million, resulting in net proceeds of approximately $24.5 million. The net loss on this disposition totaled approximately $0.6 million. Concurrent with the classification of this property as held for sale in December 2016, the Company reduced the property’s carrying amount to its estimated fair value less estimated selling costs, and recorded an impairment charge of $4.9 million.
In 2016, the Company sold 21 properties for a total sales price of approximately $581.8 million, resulting in net proceeds of approximately $571.4 million. The net gain on these dispositions totaled approximately $21.2 million.
In 2015, the Company sold 20 properties and two land parcels for a total sales price of approximately $436.9 million, resulting in net proceeds of approximately $427.3 million. The net gain on these dispositions totaled approximately $52.7 million.
7. Investments in Owned Properties
Owned properties, both wholly-owned and those owned through investments in VIEs, consisted of the following:
|
| | | | | | | | | | | | | | | | | | | | | | | | | |
| | | December 31, 2017 | | December 31, 2016 | |
| | | Wholly-Owned | | VIE | | Total | | Wholly-Owned | | VIE | | Total | |
Land (1) | | $ | 586,170 |
| | $ | 60,821 |
| | $ | 646,991 |
| | $ | 563,037 |
| | $ | 5,229 |
| | $ | 568,266 |
| |
| Buildings and improvements | | 5,789,439 |
| | 307,088 |
| | 6,096,527 |
| | 4,921,473 |
| | 143,664 |
| | 5,065,137 |
| |
| Furniture, fixtures and equipment | | 330,669 |
| | 18,159 |
| | 348,828 |
| | 294,113 |
| | 9,128 |
| | 303,241 |
| |
| Construction in progress | | 293,542 |
| | 99,503 |
| | 393,045 |
| | 347,575 |
| | 1,923 |
| | 349,498 |
| |
| | | 6,999,820 |
| | 485,571 |
| | 7,485,391 |
| | 6,126,198 |
| | 159,944 |
| | 6,286,142 |
| |
| Less accumulated depreciation | | (988,044 | ) | | (46,983 | ) | | (1,035,027 | ) | | (815,053 | ) | | (44,075 | ) | | (859,128 | ) | |
Owned properties, net | | $ | 6,011,776 |
| | $ | 438,588 |
| | $ | 6,450,364 |
| | $ | 5,311,145 |
| | $ | 115,869 |
| | $ | 5,427,014 |
| (2) |
| |
(1) | The land balance above includes undeveloped land parcels with book values of approximately $38.0 million and $38.5 million as of December 31, 2017 and 2016, respectively. It also includes land totaling approximately $29.9 million and $61.2 million as of December 31, 2017 and 2016, respectively, related to properties under development. |
| |
(2) | Excludes the net book value of one property classified as held for sale in the accompanying consolidated balance sheet at December 31, 2016. |
8. On-Campus Participating Properties
The Company is a party to ground/facility lease agreements (“Leases”) with three university systems (each, a “Lessor”) for the purpose of developing, constructing, and operating student housing facilities on university campuses. Under the terms of the Leases, title to the constructed facilities is held by the applicable Lessor and such Lessor receives a de minimis base rent paid at inception and 50% of defined net cash flows on an annual basis through the term of the lease. The Leases with the Texas A&M University and University of Houston systems terminate upon the earlier to occur of the final repayment of the related debt, the amortization period of which is contractually stipulated, or the end of the lease term. The Lease with West Virginia University has an initial term of 40 years with two 10-year extensions at the Company’s option.
The Company may not sell, assign, convey or transfer its leasehold interest in the West Virginia University student housing facility. In the event the Company seeks to sell its leasehold interest in the other four facilities, the Leases provide the applicable Lessor the right of first refusal of a bona fide purchase offer and an option to purchase the lessee’s rights under the applicable Lease. Additionally, as discussed in Note 10, three of the on-campus participating properties are 100% financed with project-based taxable bonds.
In conjunction with the execution of each Lease, the Company has entered into separate agreements to manage the related facilities for a fee equal to a percentage of defined gross receipts. The terms of the management agreements are not contingent upon the continuation of the Leases.
AMERICAN CAMPUS COMMUNITIES, INC. AND SUBSIDIARIES
AMERICAN CAMPUS COMMUNITIES OPERATING PARTNERSHIP, L.P. AND SUBSIDIARIES
NOTES TO CONSOLIDATED FINANCIAL STATEMENTS
On-campus participating properties are as follows:
|
| | | | | | | | | | | | |
| | | | | | | |
| | | Lease | | Required Debt | | Historical Cost – December 31, |
| Lessor/University | | Commencement | | Repayment | | 2017 | | 2016 |
Texas A&M University System / Prairie View A&M University (1) | | 2/1/1996 | | 9/1/2023 | | $ | 44,364 |
| | $ | 45,310 |
|
Texas A&M University System / Texas A&M International | | 2/1/1996 | | 9/1/2023 | | 6,923 |
| | 7,215 |
|
Texas A&M University System / Prairie View A&M University (2) | | 10/1/1999 | | 8/31/2025 | | 27,802 |
| | 28,627 |
|
| | | 8/31/2028 | | |
University of Houston System / University of Houston (3) | | 9/27/2000 | | 8/31/2035 | | 36,062 |
| | 37,960 |
|
| West Virginia University / West Virginia University | | 7/16/2013 | | 7/16/2045 | | 44,845 |
| | 43,817 |
|
| | | | | | | 159,996 |
| | 162,929 |
|
| Less accumulated amortization | | | | | | (78,192 | ) | | (77,132 | ) |
| On-campus participating properties, net | | | | | | $ | 81,804 |
| | $ | 85,797 |
|
| |
(1) | Consists of three phases placed in service between 1996 and 1998. |
| |
(2) | Consists of two phases placed in service in 2000 and 2003. |
| |
(3) | Consists of two phases placed in service in 2001 and 2005. |
9. Noncontrolling Interests
Interests in Consolidated Real Estate Joint Ventures and Presale Arrangements
Noncontrolling interests - partially owned properties: As of December 31, 2017, the Operating Partnership consolidates three joint ventures that own and operate three owned off-campus properties. Additionally, in December 2016, the Company entered into a presale agreement to purchase The Edge at Stadium Centre. The portion of net assets attributable to the third-party partners in these arrangements is classified as “noncontrolling interests - partially owned properties” within equity and capital on the accompanying consolidated balance sheets of ACC and the Operating Partnership, respectively.
Redeemable noncontrolling interests (ACC) / redeemable limited partners (Operating Partnership): As part of the Core Transaction discussed in detail in Note 5, the Company entered into the Core Joint Ventures in the third quarter of 2017. The Company is consolidating these joint ventures and the noncontrolling interest holder in each of these consolidated joint ventures has the option to redeem its noncontrolling interest in the entities through the exercise of put options. The options will be exercisable in the third and fourth quarter of 2019, and the redemption price is based on the fair value of the properties at the time of option exercise. As the exercise of the options is outside of the Company’s control, the portion of net assets attributable to the third-party partner in each of the Core Joint Ventures is classified as “redeemable noncontrolling interests” and “redeemable limited partners” in the mezzanine section of the accompanying consolidated balance sheets of ACC and the Operating Partnership, respectively. During the year ended December 31, 2017, there were no changes in the redemption value of redeemable noncontrolling interests that resulted from a change in the fair value of the net assets held by the Core Joint Ventures. For further discussion on accounting for changes in redemption value, refer to Note 2.
The third-party partners’ share of the income or loss of the joint ventures described above is calculated based on the partners’ economic interest in the joint ventures and is included in “net income attributable to noncontrolling interests” on the consolidated statements of comprehensive income of ACC, and is reported as “net income attributable to noncontrolling interests - partially owned properties” on the consolidated statements of comprehensive income of the Operating Partnership.
Operating Partnership Ownership
Also included in redeemable noncontrolling interests (ACC) / redeemable limited partners (Operating Partnership) are OP Units for which the Operating Partnership is required, either by contract or securities law, to deliver registered common shares of ACC to the exchanging OP unit holder, or for which the Operating Partnership has the intent or history of exchanging such units for
AMERICAN CAMPUS COMMUNITIES, INC. AND SUBSIDIARIES
AMERICAN CAMPUS COMMUNITIES OPERATING PARTNERSHIP, L.P. AND SUBSIDIARIES
NOTES TO CONSOLIDATED FINANCIAL STATEMENTS
cash. The units classified as such include Series A Preferred Units (“Preferred OP Units”) as well as Common OP Units. The value of redeemable noncontrolling interests (ACC) / redeemable limited partners (Operating Partnership) related to OP Units on the accompanying consolidated balance sheets is reported at the greater of fair value, which is based on the closing market value of the Company’s common stock at period end, or historical cost at the end of each reporting period. The OP Unitholders’ share of the income or loss of the Company is included in “net income attributable to noncontrolling interests” on the consolidated statements of comprehensive income of ACC.
As of both December 31, 2017 and December 31, 2016, approximately 0.8% of the equity interests of the Operating Partnership were held by owners of Common OP Units and Preferred OP Units not held by ACC or ACC Holdings. During the year ended December 31, 2017, 22,000 Common OP Units were converted into an equal number of shares of ACC’s common stock. During the year ended December 31, 2016, 280,915 Common OP Units and 31,846 Preferred OP Units were converted into an equal number of shares of ACC’s common stock.
Below is a table summarizing the activity of redeemable noncontrolling interests (ACC) / redeemable limited partners (Operating Partnership) for the years ended December 31, 2017 and 2016, which includes both the redeemable joint venture partners and OP Units discussed above:
|
| | | |
| Balance, December 31, 2015 | $ | 59,511 |
|
| Net income | 1,106 |
|
| Distributions | (2,141 | ) |
| Conversion of redeemable limited partner units into shares of ACC common stock | (11,335 | ) |
| Adjustments to reflect redeemable limited partner units at fair value | 7,937 |
|
| Balance, December 31, 2016 | $ | 55,078 |
|
| Net income | 654 |
|
| Distributions | (77,031 | ) |
| Conversion of redeemable limited partner units into shares of ACC common stock | (154 | ) |
| Contributions from noncontrolling interests | 162,794 |
|
| Adjustments to reflect redeemable limited partner units at fair value | (9,172 | ) |
| Balance, December 31, 2017 | $ | 132,169 |
|
AMERICAN CAMPUS COMMUNITIES, INC. AND SUBSIDIARIES
AMERICAN CAMPUS COMMUNITIES OPERATING PARTNERSHIP, L.P. AND SUBSIDIARIES
NOTES TO CONSOLIDATED FINANCIAL STATEMENTS
10. Debt
A summary of the Company’s outstanding consolidated indebtedness, including unamortized debt premiums and discounts, is as follows:
|
| | | | | | | | | |
| | | December 31, | |
| | | 2017 | | 2016 | |
| Debt secured by owned properties: | | | | | |
| Mortgage loans payable: | | | | | |
| Unpaid principal balance | | $ | 496,557 |
| | $ | 559,642 |
| |
| Unamortized deferred financing costs | | (2,144 | ) | | (3,040 | ) | |
| Unamortized debt premiums | | 19,006 |
| | 26,830 |
| |
| | | 513,419 |
| | 583,432 |
| |
Construction loans payable (1) | | 51,780 |
| | — |
| |
| Unamortized deferred financing costs | | (888 | ) | | — |
| |
| | | 564,311 |
| | 583,432 |
| |
| Debt secured by on-campus participating properties: | | | | |
| |
Mortgage loans payable (2) | | 69,776 |
| | 71,662 |
| |
| Bonds payable | | 30,575 |
| | 33,870 |
| |
| Unamortized deferred financing costs | | (642 | ) | | (769 | ) | |
| | | 99,709 |
| | 104,763 |
| |
| Total secured mortgage, construction and bond debt | | 664,020 |
| | 688,195 |
| |
Unsecured notes, net of unamortized OID and deferred financing costs (3) | | 1,585,855 |
| | 1,188,737 |
| |
Unsecured term loans, net of unamortized deferred financing costs (4) | | 647,044 |
| | 149,065 |
| |
| Unsecured revolving credit facility | | 127,600 |
| | 99,300 |
| |
| Total debt, net | | $ | 3,024,519 |
| | $ | 2,125,297 |
| |
| |
(1) | Construction loans payable relates to construction loans partially financing the development of four in-process development properties. These properties are owned by entities determined to be VIEs for which the Company is the primary beneficiary. The creditors of these construction loans do not have recourse to the assets of the Company. |
| |
(2) | Mortgage loans payable related to on-campus participating properties do not have recourse to the assets of the Company. |
| |
(3) | Includes net unamortized original issue discount (“OID”) of $1.9 million at both December 31, 2017 and 2016, and net unamortized deferred financing costs of $12.2 million at December 31, 2017 and $9.3 million at December 31, 2016. |
| |
(4) | Includes net unamortized deferred financing costs of $3.0 million at December 31, 2017 and $0.9 million at December 31, 2016. |
Mortgage and Construction Loans Payable
Mortgage loans payable generally feature either monthly interest and principal payments or monthly interest-only payments with balloon payments due at maturity. For purposes of classification in the following table, variable rate mortgage loans subject to interest rate swaps are deemed to be fixed rate, due to the Company having effectively fixed the interest rate for the underlying debt instrument. Construction loans payable generally feature monthly payments of interest only during the term of the loan and outstanding borrowings become due at maturity.
AMERICAN CAMPUS COMMUNITIES, INC. AND SUBSIDIARIES
AMERICAN CAMPUS COMMUNITIES OPERATING PARTNERSHIP, L.P. AND SUBSIDIARIES
NOTES TO CONSOLIDATED FINANCIAL STATEMENTS
Mortgage and construction loans payable, excluding debt premiums and discounts, consisted of the following as of December 31, 2017:
|
| | | | | | | | | | | | | | | | | |
| | | | | December 31, 2017 |
| | | Principal Outstanding | | Weighted | | Weighted | | Number of |
| | | December 31, | | Average | | Average | | Properties |
| | | 2017 | | 2016 | | Interest Rate | | Years to Maturity | | Encumbered |
| Fixed Rate: | | | | | | | | | | |
Mortgage loans payable (1) | | 566,333 |
| | $ | 631,304 |
| | 4.64 | % | | 5.3 Years | | 20 |
|
| Variable Rate: | | |
| | |
| | |
| | | | |
|
Construction loans payable (2) | | 51,780 |
| | — |
| | 4.41 | % | — |
| 0.7 Years | | 4 |
|
| Total | | $ | 618,113 |
| | $ | 631,304 |
| | 4.62 | % | | 4.9 Years | | 24 |
|
| |
(1) | Fixed rate mortgage loans payable mature at various dates from June 2018 through July 2045 and carry interest rates ranging from 3.05% to 6.43% at December 31, 2017. |
| |
(2) | Variable rate construction loans mature upon completion of the development projects in August and September 2018 and carry interest rates based on LIBOR plus a spread, which translate into interest rates ranging from 3.93% to 4.90% at December 31, 2017. |
During the year ended December 31, 2017, the following transactions occurred:
|
| | | | | | | | |
| | | Mortgage Loans Payable (1) | | Construction Loans Payable |
| Balance, December 31, 2016 | | $ | 631,304 |
| | $ | — |
|
| Additions: | | | | |
Construction notes payable - Core Joint Ventures (2) | | — |
| | 104,056 |
|
| Draws under advancing construction notes payable | | — |
| | 40,170 |
|
| Deductions: | | |
| | |
|
Pay-off of maturing mortgage notes payable (3) | | (55,514 | ) | | — |
|
Pay-off of construction debt - Core Joint Ventures (2) | | — |
| | (92,446 | ) |
| Scheduled repayments of principal | | (9,457 | ) | | — |
|
| Balance, December 31, 2017 | | $ | 566,333 |
| | $ | 51,780 |
|
| |
(1) | Balance excludes unamortized debt premiums and discounts. |
| |
(2) | Includes construction debt associated with the Company’s initial investment in the Core Joint Ventures. Construction debt associated with Core JV I, totaling $92.4 million, was paid off with proceeds from the Company’s initial investment in the joint venture (see Note 5). |
| |
(3) | The Company paid off fixed rate mortgage debt nearing maturity secured by two owned properties. |
In May 2017, the lender of the non-recourse mortgage loan secured by Blanton Common, a property located near Valdosta State University which was inherited as part of the GMH student housing transaction in 2008, sent a formal notice of default and initiated foreclosure proceedings. The property generated insufficient cash flow to cover the debt service on the mortgage, which had a balance of $27.4 million at default and a contractual maturity date of August 2017. In May 2017, the lender began receiving the net operating cash flows of the property each month in lieu of scheduled monthly mortgage payments. In August 2017, the property transferred to receivership and a third-party manager began managing the property on behalf of the lender. As of December 31, 2017, the Company was cooperating with the lender to allow for a consensual foreclosure process upon which the property will be surrendered to the lender in satisfaction of the mortgage loan. As discussed in Note 2, in June 2017, the Company recorded an impairment charge for this property of $15.3 million.
AMERICAN CAMPUS COMMUNITIES, INC. AND SUBSIDIARIES
AMERICAN CAMPUS COMMUNITIES OPERATING PARTNERSHIP, L.P. AND SUBSIDIARIES
NOTES TO CONSOLIDATED FINANCIAL STATEMENTS
Bonds Payable
Three of the on-campus participating properties are 100% financed with outstanding project-based taxable bonds. Under the terms of these financings, one of the Company’s special purpose subsidiaries publicly issued three series of taxable bonds and loaned the proceeds to three special purpose subsidiaries that each hold a separate leasehold interest. The bonds encumbering the leasehold interests are non-recourse, subject to customary exceptions. Although a default in payment by these special purpose subsidiaries could result in a default under one or more series of bonds, indebtedness of any of these special purpose subsidiaries is not cross-defaulted or cross-collateralized with indebtedness of the Company, the Operating Partnership or other special purpose subsidiaries. Repayment of principal and interest on these bonds is insured by MBIA, Inc. Interest and principal are paid semi-annually and annually, respectively, through maturity. Covenants include, among other items, budgeted and actual debt service coverage ratios.
Bonds payable at December 31, 2017 consisted of the following: |
| | | | | | | | | | | | | | | | | | | |
| | | | | | | Principal | | Weighted | | | | Required |
Series | | Mortgaged Facilities Subject to Leases | | Original | | December 31, 2017 | | Average Rate | | Maturity Date | | Monthly Debt Service |
| 1999 | | University Village-PVAMU/TAMIU | | $ | 39,270 |
| | $ | 16,875 |
| | 7.76 | % | | September 2023 | | $ | 302 |
|
| 2001 | | University College–PVAMU | | 20,995 |
| | 11,075 |
| | 7.62 | % | | August 2025 | | 158 |
|
| 2003 | | University College–PVAMU | | 4,325 |
| | 2,625 |
| | 6.16 | % | | August 2028 | | 28 |
|
| | | Total/weighted average rate | | $ | 64,590 |
| | $ | 30,575 |
| | 7.57 | % | | | | $ | 488 |
|
Unsecured Notes
The Company has issued the following senior unsecured notes:
|
| | | | | | | | | | | | | | | | |
| Date Issued | | Amount | | % of Par Value | | Coupon | | Yield | | Original Issue Discount | | Term (Years) |
| April 2013 | | $ | 400,000 |
| | 99.659 | | 3.750% | | 3.791% | | $ | 1,364 |
| | 10 |
| June 2014 | | 400,000 |
| | 99.861 | | 4.125% | | 4.269% | (1) | 556 |
| | 10 |
| September 2015 | | 400,000 |
| | 99.811 | | 3.350% | | 3.391% | | 756 |
| | 5 |
| October 2017 | | 400,000 |
| | 99.912 | | 3.625% | | 3.635% | | 352 |
| | 10 |
| | | $ | 1,600,000 |
| | | | | | | | $ | 3,028 |
| | |
| |
(1) | The yield includes effect of the amortization of the interest rate swap terminations (see Note 13 for details). |
The notes are fully and unconditionally guaranteed by the Company. Interest on the notes is payable semi-annually. The terms of the unsecured notes include certain financial covenants that require the Operating Partnership to limit the amount of total debt and secured debt as a percentage of total asset value, as defined. In addition, the Operating Partnership must maintain a minimum ratio of unencumbered asset value to unsecured debt, as well as a minimum interest coverage level. As of December 31, 2017, the Company was in compliance with all such covenants.
Unsecured Revolving Credit Facility
In January 2017, the Company entered into the Fifth Amended and Restated Credit Agreement (the “Agreement”). Pursuant to the Agreement, the Company increased the size of its unsecured revolving credit facility from $500 million to $700 million, which may be expanded by up to an additional $500 million upon the satisfaction of certain conditions. In connection with the Agreement, the maturity date of the revolving credit facility was extended from March 2018 to March 2022.
The unsecured revolving credit facility bears interest at a variable rate, at the Company’s option, based upon a base rate of one-, two-, three- or six-month LIBOR, plus, in each case, a spread based upon the Company’s investment grade rating from either Moody’s Investor Services, Inc. or Standard & Poor’s Rating Group. Additionally, the Company is required to pay a facility fee of 0.20% per annum on the $700 million revolving credit facility. As of December 31, 2017, the revolving credit facility bore interest at a weighted average annual rate of 2.71% (1.51% + 1.00% spread + 0.20% facility fee), and availability under the revolving credit facility totaled $572.4 million.
AMERICAN CAMPUS COMMUNITIES, INC. AND SUBSIDIARIES
AMERICAN CAMPUS COMMUNITIES OPERATING PARTNERSHIP, L.P. AND SUBSIDIARIES
NOTES TO CONSOLIDATED FINANCIAL STATEMENTS
The terms of the unsecured credit facility include certain restrictions and covenants, which limit, among other items, the incurrence of additional indebtedness and liens. The facility contains customary affirmative and negative covenants and also contains financial covenants that, among other things, require the Company to maintain certain maximum leverage ratios and minimum ratios of “EBITDA” (earnings before interest, taxes, depreciation and amortization) to fixed charges. The financial covenants also include a minimum asset value requirement, a maximum secured debt ratio, and a minimum unsecured debt service coverage ratio. As of December 31, 2017, the Company was in compliance with all such covenants.
Unsecured Term Loans
The Company has a $150 million unsecured term loan (“Term Loan I Facility”) which has an accordion feature that allows the Company to expand the amount by up to an additional $50 million, subject to the satisfaction of certain conditions. The maturity date of the Term Loan I Facility is March 2021. The weighted average annual rate on the Term Loan I Facility was 2.47% (1.37% + 1.10% spread) at December 31, 2017.
In June 2017, the Company entered into an Unsecured Term Loan Credit Agreement (the “New Term Loan II Facility”) totaling $200 million. The maturity date of the New Term Loan II Facility is June 2022. The agreement has an accordion feature that allows the Company to expand the amount by up to an additional $100 million, subject to the satisfaction of certain conditions. The weighted average annual rate on the New Term Loan II Facility was 2.45% (1.35% + 1.10% spread) at December 31, 2017.
In September 2017, the Company entered into an Unsecured Term Loan Credit Agreement (“Term Loan III Facility”) totaling $300 million. The maturity date of the Term Loan III Facility is September 2018, and can be extended for two one-year periods at the Company’s option, subject to the satisfaction of certain conditions. The agreement has an accordion feature that allows the Company to expand the amount by up to an additional $100 million, subject to the satisfaction of certain conditions. The weighted average annual rate on this term loan was 2.41% (1.31% + 1.10% spread) at December 31, 2017.
The terms of the term loan facilities described above include certain restrictions and covenants consistent with those of the unsecured revolving credit facility discussed above. As of December 31, 2017, the Company was in compliance with all such covenants.
Debt Maturities
The following table summarizes the stated debt maturities and scheduled amortization payments, excluding debt premiums and discounts, for each of the five years subsequent to December 31, 2017 and thereafter:
|
| | | | | |
| | | | |
| 2018 | | $ | 497,523 |
| (1) |
| 2019 | | 13,036 |
| |
| 2020 | | 455,046 |
| |
| 2021 | | 382,147 |
| |
| 2022 | | 360,038 |
| |
| Thereafter | | 1,318,498 |
| |
| | | $ | 3,026,288 |
| |
| |
(1) | 2018 includes $51.8 million related to construction loans used to finance the development and construction of four in-process development properties held by entities determined to be VIEs. These loans are an obligation of the third-party developers and will be paid off with proceeds from the Company’s investment in the properties, which is expected to occur upon the successful completion and delivery of the properties in August and September 2018 (see Note 5 and Note 16). |
Other than with regard to the non-recourse mortgage loan secured by Blanton Common, as discussed above, payment of principal and interest were current at December 31, 2017. Certain of the mortgage notes and bonds payable are subject to prepayment penalties.
AMERICAN CAMPUS COMMUNITIES, INC. AND SUBSIDIARIES
AMERICAN CAMPUS COMMUNITIES OPERATING PARTNERSHIP, L.P. AND SUBSIDIARIES
NOTES TO CONSOLIDATED FINANCIAL STATEMENTS
11. Stockholders’ Equity / Partners’ Capital
Stockholders’ Equity – Company
In February 2016, ACC completed an equity offering, consisting of the sale of 17,940,000 shares of ACC’s common stock at a price of $41.25 per share, including 2,340,000 shares issued as a result of the exercise of the underwriters’ overallotment option in full at closing. The offering generated gross proceeds of approximately $740.0 million. The aggregate proceeds to ACC, net of the underwriting discount and expenses of the offering, were approximately $707.3 million.
In June 2015, the Company established an at-the-market share offering program (the “ATM Equity Program”) through which the Company may issue and sell, from time to time, shares of common stock having an aggregate offering price of up to $500 million. Actual sales under the program will depend on a variety of factors, including, but not limited to, market conditions, the trading price of the Company’s common stock and determinations of the appropriate sources of funding for the Company.
The following table presents activity under the Company’s ATM Equity Program:
|
| | | | | | | | |
| | | Year Ended December 31, |
| | | 2017 | | 2016 |
| Total net proceeds | | $ | 188,538 |
| | $ | 75,090 |
|
| Commissions paid to sales agents | | $ | 2,374 |
| | $ | 953 |
|
| Weighted average price per share | | $ | 48.34 |
| | $ | 51.07 |
|
| Shares of common stock sold | | 3,949,356 |
| | 1,489,000 |
|
As of December 31, 2017, the Company had approximately $233.0 million available for issuance under its ATM Equity Program.
In 2015, the Company established a Non-Qualified Deferred Compensation Plan (“Deferred Compensation Plan”) maintained for the benefit of select employees and members of the Company’s Board of Directors, in which vested share awards (see Note 12), salary and other cash amounts earned may be deposited. Deferred Compensation Plan assets are held in a rabbi trust, which is subject to the claims of the Company’s creditors in the event of bankruptcy or insolvency. The shares held in the Deferred Compensation Plan are classified within stockholders’ equity in a manner similar to the manner in which treasury stock is classified. Subsequent changes in the fair value of the shares are not recognized. During the year ended December 31, 2017, 43,597 shares of ACC’s common stock were deposited into the Deferred Compensation Plan, bringing the total ACC shares held in the Deferred Compensation Plan to 63,778 as of December 31, 2017.
Partners’ Capital – Operating Partnership
In connection with the issuance of common shares under the ATM Equity Program discussed above, ACCOP issued a number of Common OP Units to ACC equivalent to the number of common shares issued by ACC.
12. Incentive Award Plan
In May 2010, the Company’s stockholders approved the American Campus Communities, Inc. 2010 Incentive Award Plan (the “Plan”). The Plan provides for the grant of various stock-based incentive awards to selected employees and directors of the Company and the Company’s affiliates. The types of awards that may be granted under the Plan include incentive stock options, nonqualified stock options, restricted stock awards (“RSAs”), restricted stock units (“RSUs”), profits interest units (“PIUs”) and other stock-based awards. The Company has reserved a total of 1.7 million shares of the Company’s common stock for issuance pursuant to the Plan, subject to certain adjustments for changes in the Company’s capital structure, as defined in the Plan. As of December 31, 2017, 468,022 shares were available for issuance under the Plan.
Restricted Stock Units
Upon initial appointment to the Board of Directors and reelection to the Board of Directors at each Annual Meeting of Stockholders, each outside member of the Board of Directors is granted RSUs. On the Settlement Date, the Company will deliver to the recipients a number of shares of common stock or cash, as determined by the Compensation Committee of the Board of Directors, equal to the number of RSUs held by the recipients. In addition, recipients of RSUs are entitled to dividend equivalents equal to the cash
AMERICAN CAMPUS COMMUNITIES, INC. AND SUBSIDIARIES
AMERICAN CAMPUS COMMUNITIES OPERATING PARTNERSHIP, L.P. AND SUBSIDIARIES
NOTES TO CONSOLIDATED FINANCIAL STATEMENTS
distributions paid by the Company on one share of common stock for each RSU issued, payable currently or on the Settlement Date, as determined by the Compensation Committee of the Board of Directors.
Upon reelection to the Board of Directors in May 2017, all members of the Company’s Board of Directors were granted RSUs in accordance with the Plan. These RSUs were valued at $150,000 for the Chairman of the Board of Directors and at $105,000 for all other members. Additionally, effective July 1, 2017, the Board of Directors’ compensation program was revised to reflect an increase in RSUs of $10,000 for all members of the Board of Directors. The number of RSUs was determined based on the fair market value of the Company’s stock on the date of grant, as defined in the Plan. All awards vested and settled immediately on the date of grant, and the Company delivered shares of common stock and cash, as determined by the Compensation Committee of the Board of Directors.
A summary of ACC’s RSUs under the Plan for the years ended December 31, 2017 and 2016 and activity during the year then ended is presented below:
|
| | | | | | | |
| | | Number of RSUs | | Weighted-Average Grant Date Fair Value Per RSU |
| Outstanding at December 31, 2015 | | — |
| | $ | — |
|
| Granted | | 18,908 |
| | 46.81 |
|
| Settled in common shares | | (15,524 | ) | | 46.87 |
|
| Settled in cash | | (3,384 | ) | | 46.55 |
|
| Outstanding at December 31, 2016 | | — |
| | $ | — |
|
| Granted | | 18,221 |
| | 46.67 |
|
| Settled in common shares | | (16,295 | ) | | 46.65 |
|
| Settled in cash | | (1,926 | ) | | 46.76 |
|
| Outstanding at December 31, 2017 | | — |
| | $ | — |
|
The Company recognized expense of approximately $0.9 million for each of the years ended December 31, 2017, 2016 and 2015, respectively, reflecting the fair value of the RSUs issued on the date of grant and the expense is included in general and administrative expenses on the Company’s consolidated statements of comprehensive income. The weighted-average grant-date fair value for each RSU granted during the year ended December 31, 2015 was $39.65.
Restricted Stock Awards
The Company awards RSAs to its executive officers and certain employees that generally vest in equal annual installments over a five year period. Unvested awards are forfeited upon the termination of an individual’s employment with the Company under specified circumstances. Recipients of RSAs receive dividends, as declared by the Company’s Board of Directors, on unvested shares, provided that the recipient continues to be employed by the Company. A summary of the Company’s RSAs under the Plan for the years ended December 31, 2017 and 2016 is presented below:
|
| | | | | | | |
| | | Number of RSAs | | Weighted-Average Grant Date Fair Value Per RSA |
| Nonvested balance at December 31, 2015 | | 655,925 |
| | $ | 41.12 |
|
| Granted | | 332,717 |
| | 41.41 |
|
| Vested | | (127,352 | ) | | 40.19 |
|
| Forfeited | | (88,189 | ) | | 40.47 |
|
| Nonvested balance at December 31, 2016 | | 773,101 |
| | $ | 41.47 |
|
| Granted | | 344,688 |
| | 48.55 |
|
| Vested | | (193,186 | ) | | 42.29 |
|
| Forfeited | | (113,733 | ) | | 42.36 |
|
| Nonvested balance at December 31, 2017 | | 810,870 |
| | $ | 44.16 |
|
AMERICAN CAMPUS COMMUNITIES, INC. AND SUBSIDIARIES
AMERICAN CAMPUS COMMUNITIES OPERATING PARTNERSHIP, L.P. AND SUBSIDIARIES
NOTES TO CONSOLIDATED FINANCIAL STATEMENTS
The fair value of RSAs is calculated based on the closing market value of the Company’s common stock on the date of grant. The fair value of these awards is amortized to expense over the vesting periods, which amounted to approximately $13.1 million, $9.3 million and $7.5 million for the years ended December 31, 2017, 2016 and 2015, respectively. The amortization of restricted stock awards for the year ended December 31, 2017 includes $2.4 million of contractual executive separation and retirement charges incurred with regard to the retirement of the Company’s former Chief Financial Officer, representing the June 30, 2017 vesting of 46,976 RSAs, net of shares withheld for taxes, related to the retirement. The weighted-average grant date fair value for each RSA granted and forfeited during the year ended December 31, 2015 was $44.23 and $38.78, respectively.
The total fair value of RSAs vested during the year ended December 31, 2017, was approximately $14.6 million. Additionally, as of December 31, 2017, the Company had approximately $26.9 million of total unrecognized compensation cost related to these RSAs, which is expected to be recognized over a remaining weighted-average period of 3.1 years.
Per the provisions of the Plan, an employee becomes retirement eligible when (i) the sum of an employee’s full years of service (a minimum of 120 contiguous full months) and the employee’s age on the date of termination (a minimum of 50 years of age) equals or exceeds 70 years (hereinafter referred to as the “Rule of 70”); (ii) the employee gives at least six months prior written notice to the Company of his or her intention to retire; and (iii) the employee enters into a noncompetition agreement and a general release of all claims in a form that is reasonably satisfactory to the Company. As of December 31, 2017, 12 employees have met the Rule of 70, including the Company’s Chief Executive Officer and President. A total of 259,125 unvested RSAs are held by such employees. Once the other two conditions of retirement eligibility are met, the shares held by these employees will be subject to accelerated vesting.
13. Derivative Instruments and Hedging Activities
The Company is exposed to certain risks arising from both its business operations and economic conditions. The Company principally manages its exposures to a wide variety of business and operational risks through management of its core business activities. The Company manages economic risks, including interest rate, liquidity, and credit risk primarily by managing the amount, sources, and duration of its debt funding and the use of derivative financial instruments. Specifically, the Company enters into derivative financial instruments to manage exposures that arise from business activities that result in the receipt or payment of future known and uncertain cash amounts, the value of which are determined by interest rates. The Company’s derivative financial instruments are used to manage differences in the amount, timing, and duration of the Company’s known or expected cash receipts and its known or expected cash payments principally related to the Company’s investments and borrowings.
Cash Flow Hedges of Interest Rate Risk
The Company’s objectives in using interest rate derivatives are to add stability to interest expense and to manage its exposure to interest rate movements. To accomplish this objective, the Company primarily uses interest rate swaps and forward starting swaps as part of its interest rate risk management strategy. Interest rate swaps designated as cash flow hedges involve the receipt of variable-rate amounts from a counterparty in exchange for the Company making fixed-rate payments over the life of the agreements without exchange of the underlying notional amount. Forward starting swaps are used to protect the Company against adverse fluctuations in interest rates by reducing its exposure to variability in cash flows relating to interest payments on a forecasted issuance of debt. The effective portion of changes in the fair value of derivatives designated and that qualify as cash flow hedges is recorded in other comprehensive income (outside of earnings) and subsequently reclassified into earnings in the period that the hedged forecasted transaction affects earnings, and the ineffective portion of changes in the fair value of the derivative is recognized directly in earnings. Ineffectiveness resulting from the derivative instruments summarized below was immaterial for the years ended December 31, 2017, 2016 and 2015.
The following table summarizes the Company’s outstanding interest rate swap contracts as of December 31, 2017:
|
| | | | | | | | | | | | | | | | |
| Hedged Debt Instrument | | Effective Date | | Maturity Date | | Pay Fixed Rate | | Receive Floating Rate Index | | Current Notional Amount | | Fair Value |
| Cullen Oaks mortgage loan | | Feb 18, 2014 | | Feb 15, 2021 | | 2.2750% | | LIBOR - 1 month | | $ | 13,698 |
| | $ | (95 | ) |
| Cullen Oaks mortgage loan | | Feb 18, 2014 | | Feb 15, 2021 | | 2.2750% | | LIBOR - 1 month | | 13,839 |
| | (96 | ) |
| Park Point mortgage loan | | Nov 1, 2013 | | Oct 5, 2018 | | 1.5450% | | LIBOR - 1 month | | 70,000 |
| | 87 |
|
| | | | | | | | | Total | | $ | 97,537 |
| | $ | (104 | ) |
AMERICAN CAMPUS COMMUNITIES, INC. AND SUBSIDIARIES
AMERICAN CAMPUS COMMUNITIES OPERATING PARTNERSHIP, L.P. AND SUBSIDIARIES
NOTES TO CONSOLIDATED FINANCIAL STATEMENTS
In January 2017, the remaining interest rate swaps on the Term Loan I Facility expired and the remaining immaterial balance in accumulated other comprehensive income was reclassified into earnings.
The table below presents the fair value of the Company’s derivative financial instruments as well as their classification on the consolidated balance sheets as of December 31, 2017 and 2016:
|
| | | | | | | | | | | | | | | | | | | | |
| | | Asset Derivatives | | Liability Derivatives |
| | | | | Fair Value as of | | | | Fair Value as of |
| Description | | Balance Sheet Location | | December 31, 2017 | | December 31, 2016 | | Balance Sheet Location | | December 31, 2017 | | December 31, 2016 |
| | | | | | | | | | | | | |
| Interest rate swap contracts | | Other assets | | $ | 87 |
| | $ | — |
| | Other liabilities | | $ | 191 |
| | $ | 1,099 |
|
Total derivatives designated
as hedging instruments | | | | $ | 87 |
| | $ | — |
| | | | $ | 191 |
| | $ | 1,099 |
|
14. Fair Value Disclosures
Financial Instruments Carried at Fair Value
The following table presents information about the Company’s financial instruments measured at fair value on a recurring basis as of December 31, 2017 and 2016, and indicates the fair value hierarchy of the valuation techniques utilized by the Company to determine such fair value. In general, fair values determined by Level 1 inputs utilize quoted prices (unadjusted) in active markets for identical assets or liabilities the Company has the ability to access. Fair values determined by Level 2 inputs utilize inputs other than quoted prices included in Level 1 that are observable for the asset or liability, either directly or indirectly. Level 2 inputs include quoted prices for similar assets and liabilities in active markets and inputs other than quoted prices observable for the asset or liability, such as interest rates and yield curves observable at commonly quoted intervals. Level 3 inputs are unobservable inputs for the asset or liability, and include situations where there is little, if any, market activity for the asset or liability.
In instances in which the inputs used to measure fair value may fall into different levels of the fair value hierarchy, the level in the fair value hierarchy within which the fair value measurement in its entirety has been determined is based on the lowest level input significant to the fair value measurement in its entirety. The Company’s assessment of the significance of a particular input to the fair value measurement in its entirety requires judgment, and considers factors specific to the asset or liability.
Disclosures concerning financial instruments measured at fair value are as follows:
|
| | | | | | | | | | | | | | | | | | | | | | | | | | | | | | | | |
| | | Fair Value Measurements as of |
| | | December 31, 2017 | | December 31, 2016 |
| | | Quoted Prices in Active Markets for Identical Assets and Liabilities (Level 1) | | Significant Other Observable Inputs (Level 2) | | Significant Unobservable Inputs (Level 3) | | Total | | Quoted Prices in Active Markets for Identical Assets and Liabilities (Level 1) | | Significant Other Observable Inputs (Level 2) | | Significant Unobservable Inputs (Level 3) | | Total |
| Assets: | | | | | | | | | | | | | | | | |
Derivative financial
instruments | | $ | — |
| | $ | 87 |
| | $ | — |
| | $ | 87 |
| | $ | — |
| | $ | — |
| | $ | — |
| | $ | — |
|
| Liabilities: | | |
| | |
| | |
| | |
| | |
| | |
| | |
| | |
|
| Derivative financial instruments | | $ | — |
| | $ | 191 |
| | $ | — |
| | $ | 191 |
| | $ | — |
| | $ | 1,099 |
| | $ | — |
| | $ | 1,099 |
|
| Mezzanine: | | |
| | |
| | |
| | |
| | |
| | |
| | |
| | |
|
| Redeemable noncontrolling interests (Company)/Redeemable limited partners (Operating Partnership) | | $ | — |
| | $ | 44,503 |
| | $ | 87,666 |
| | $ | 132,169 |
| | $ | — |
| | $ | 55,078 |
| | $ | — |
| | $ | 55,078 |
|
The Company uses derivative financial instruments, specifically interest rate swaps and forward starting swaps, for nontrading purposes. The Company uses interest rate swaps to manage interest rate risk arising from previously unhedged interest payments associated with variable rate debt and forward starting swaps to reduce exposure to variability in cash flows relating to interest payments on forecasted issuances of debt. Through December 31, 2017, derivative financial instruments were designated and qualified as cash flow hedges. Derivative contracts with positive net fair values inclusive of net accrued interest receipts or payments are recorded in other assets. Derivative contracts with negative net fair values, inclusive of net accrued interest payments
AMERICAN CAMPUS COMMUNITIES, INC. AND SUBSIDIARIES
AMERICAN CAMPUS COMMUNITIES OPERATING PARTNERSHIP, L.P. AND SUBSIDIARIES
NOTES TO CONSOLIDATED FINANCIAL STATEMENTS
or receipts, are recorded in other liabilities. The valuation of these instruments is determined using widely accepted valuation techniques including discounted cash flow analysis on the expected cash flows of each derivative. This analysis reflects the contractual terms of the derivatives, including the period to maturity, and uses observable market-based inputs, including interest rate curves. The fair values of interest rate swaps are determined using the market standard methodology of netting the discounted future fixed cash receipts (or payments) and the discounted expected variable cash payments (or receipts). The variable cash payments (or receipts) are based on an expectation of future interest rates (forward curves) derived from observable market interest rate curves.
The Company incorporates credit valuation adjustments to appropriately reflect its own nonperformance risk and the respective counterparty’s nonperformance risk in the fair value measurements. In adjusting the fair value of its derivative contracts for the effect of nonperformance risk, the Company has considered the impact of netting and any applicable credit enhancements, such as collateral postings, thresholds and guarantees.
Although the Company has determined the majority of the inputs used to value its derivatives fall within Level 2 of the fair value hierarchy, the credit valuation adjustments associated with its derivatives utilize Level 3 inputs, such as estimates of current credit spreads to evaluate the likelihood of default by the Company and its counterparty. However, as of December 31, 2017 and 2016, the Company has assessed the significance of the impact of the credit valuation adjustments on the overall valuation of its derivative positions and has determined that the credit valuation adjustments are not significant to the overall valuation of the Company’s derivative financial instruments. As a result, the Company has determined each of its derivative valuations in its entirety is classified in Level 2 of the fair value hierarchy.
The OP Unit component of redeemable noncontrolling interests has a redemption feature and is marked to its redemption value. The redemption value is based on the fair value of the Company’s common stock at the redemption date, and therefore, is calculated based on the fair value of the Company’s common stock at the balance sheet date. Since the valuation is based on observable inputs such as quoted prices for similar instruments in active markets, these instruments are classified in Level 2 of the fair value hierarchy.
As discussed in Note 2 and Note 9, the redeemable noncontrolling interests related to the joint venture partners in the Core Transaction are marked to their redemption value at each balance sheet date. The redemption value is based on the fair value of the underlying properties held by the joint ventures. This analysis incorporates information obtained from a number of sources, including the Company’s analysis of comparable properties in the Company’s portfolio, estimations of net operating results of the properties, capitalization rates, discount rates, and other market data. The Company has determined these estimates are primarily based upon unobservable inputs and therefore are considered to be Level 3 inputs within the fair value hierarchy.
Financial Instruments Not Carried at Fair Value
Cash and Cash Equivalents, Restricted Cash, Student Contracts Receivable, Other Assets, Accounts Payable and Accrued Expenses and Other Liabilities: The Company estimates that the carrying amount approximates fair value, due to the short maturity of these instruments.
Loans Receivable: The fair value of loans receivable is based on a discounted cash flow analysis consisting of scheduled cash flows and discount rate estimates to approximate those that a willing buyer and seller might use. These financial instruments utilize Level 3 inputs.
Mortgage Loans Payable: The fair value of mortgage loans payable is based on the present value of the cash flows at current market interest rates through maturity. The Company has concluded the fair value of these financial instruments utilize Level 2 inputs as the majority of the inputs used to value these instruments fall within Level 2 of the fair value hierarchy.
Bonds Payable: The fair value of bonds payable is based on quoted prices in markets that are not active due to the unique characteristics of these financial instruments; as such, the Company has concluded the inputs used to measure fair value fall within Level 2 of the fair value hierarchy.
Unsecured Notes: In calculating the fair value of unsecured notes, interest rate and spread assumptions reflect current creditworthiness and market conditions available for the issuance of unsecured notes with similar terms and remaining maturities. These financial instruments utilize Level 2 inputs.
Construction Loans Payable, Unsecured Revolving Credit Facility, and Unsecured Term Loans: The fair value of these instruments approximates their carrying values due to the variable interest rate feature of these instruments.
AMERICAN CAMPUS COMMUNITIES, INC. AND SUBSIDIARIES
AMERICAN CAMPUS COMMUNITIES OPERATING PARTNERSHIP, L.P. AND SUBSIDIARIES
NOTES TO CONSOLIDATED FINANCIAL STATEMENTS
The table below contains the estimated fair value and related carrying amounts for the Company’s financial instruments as of December 31, 2017 and 2016:
|
| | | | | | | | | | | | | | | | | |
| | | December 31, 2017 | | December 31, 2016 | |
| | | Estimated Fair Value | | Carrying Amount | | Estimated Fair Value | | Carrying Amount | |
| Assets: | | | | | | | | | |
| Loans receivable | | $ | 54,140 |
| | $ | 57,948 |
| | $ | 54,396 |
| | $ | 58,539 |
| |
| Liabilities: | | | | | | | | | |
| Unsecured notes | | $ | 1,620,839 |
| | $ | 1,585,855 |
| (1) | $ | 1,211,344 |
| | $ | 1,188,737 |
| (1) |
| Mortgage loans | | $ | 571,676 |
| | $ | 582,927 |
| (2) | $ | 644,617 |
| | $ | 654,794 |
| (2) |
| Bonds payable | | $ | 32,552 |
| | $ | 30,201 |
| | $ | 37,066 |
| | $ | 33,401 |
| |
| |
(1) | Includes net unamortized OID and net unamortized deferred financing costs (see Note 10). |
| |
(2) | Includes net unamortized debt premiums and discounts and net unamortized deferred financing costs (see Note 10). |
15. Lease Commitments
As discussed in Note 2, the Company as lessee has entered into lease agreements with university systems and other third parties for the purpose of financing, constructing and operating student housing properties. Under the terms of the ground/facility leases, the lessor may receive annual minimum rent, variable rent based upon the operating performance of the property, or a combination thereof. The Company records rent under the straight-line method over the term of the lease and any difference between the straight-line rent amount and amount payable under the lease terms is recorded as prepaid or deferred rent. Straight-lined rental amounts are capitalized during the construction period and expensed upon the commencement of operations.
Owned On-Campus Properties
Under its ACE program, the Company has entered into ground/facility lease agreements with fifteen university systems to finance, construct, and manage 32 student housing properties (see Note 2 for details). As of December 31, 2017 and 2016, net prepaid ground rent totaled approximately $8.4 million and $10.5 million, respectively, and is included in other assets on the accompanying consolidated balance sheets. Under these ground/facility leases, the Company recognized rent expense of approximately $7.4 million, $6.2 million and $5.3 million for the years ended December 31, 2017, 2016 and 2015, respectively, and capitalized rent of approximately $2.0 million, $0.7 million and $0.4 million for the years ended December 31, 2017, 2016 and 2015, respectively. Rent expense is included in ground/facility leases expense in the accompanying consolidated statements of comprehensive income.
On-Campus Participating Properties
The Company is a party to ground/facility lease agreements with three university systems for the purpose of developing, constructing, and operating five student housing facilities on university campuses. Under the terms of the agreements, the lessor receives 50% of defined net cash flows on an annual basis through the term of the lease (see Note 2 and Note 8 for details). Under these leases, the Company recognized rent expense of approximately $2.8 million, $3.0 million and $2.9 million for the years ended December 31, 2017, 2016 and 2015, respectively. Rent expense is included in ground/facility leases expense in the accompanying consolidated statements of comprehensive income.
Other Leases
The Company has entered into ground lease agreements with third parties for the purpose of constructing and operating certain of its owned off-campus student housing properties. As of December 31, 2017 and 2016, net deferred ground rent totaled approximately $3.6 million and $3.2 million, respectively, and is included in other liabilities on the accompanying consolidated balance sheets. Under these ground leases, the Company recognized rent expense of approximately $2.4 million, $2.2 million and $2.2 million for the years ended December 31, 2017, 2016 and 2015, respectively. Rent expense is included in owned properties operating expenses in the accompanying consolidated statements of comprehensive income.
In addition, the Company has entered into a lease for corporate office space beginning January 2011, and expiring December 2020. Additionally, the Company entered into a lease for expansion space for its corporate office beginning December 2016 and expiring March 2024. The terms of the leases provide for a period of free rent, scheduled rental rate increases, and common area maintenance
AMERICAN CAMPUS COMMUNITIES, INC. AND SUBSIDIARIES
AMERICAN CAMPUS COMMUNITIES OPERATING PARTNERSHIP, L.P. AND SUBSIDIARIES
NOTES TO CONSOLIDATED FINANCIAL STATEMENTS
charges upon expiration of the free rent period. The Company also has various operating leases for furniture, office and technology equipment, which expire through 2023.
There were no capital lease obligations outstanding as of December 31, 2017. Future minimum commitments over the life of all leases, which exclude variable rent payments, are as follows:
|
| | | | | |
| | | Operating | |
| 2018 | | $ | 8,568 |
| |
| 2019 | | 9,719 |
| |
| 2020 | | 10,159 |
| |
| 2021 | | 9,186 |
| |
| 2022 | | 9,186 |
| |
| Thereafter | | 372,397 |
| |
| Total minimum lease payments | | $ | 419,215 |
| |
16. Commitments and Contingencies
Commitments
Construction Contracts: As of December 31, 2017, excluding four properties under construction and subject to presale arrangements which are being funded by construction loans, the Company estimates additional costs to complete nine owned development projects currently under construction or under contract to begin construction, to be approximately $376.2 million.
Joint Ventures: As discussed in Note 5, as part of the Core Transaction, the Company entered into two joint ventures during the third quarter of 2017. As part of this transaction, the Company is obligated to increase its investment in the joint ventures over a two year period, resulting in a funding commitment of approximately $284.6 million.
Presale Development Projects: In December 2016, the Company entered into a presale agreement to purchase The Edge - Stadium Centre, an in-process development, for approximately $42.6 million, which includes the purchase price and elected upgrades. The Company is obligated to purchase the property upon delivery of the asset, which is expected to occur in August 2018 (see Note 5).
The Company expects to fund the commitments mentioned above through a combination of proceeds from cash flows generated from operations, anticipated property dispositions, joint venture activity, and a combination of debt and equity transactions, which may include net proceeds from the ATM Equity Program discussed in Note 11, borrowings under the Company’s existing unsecured credit facilities, and accessing the unsecured bond market.
Development-related Guarantees: For certain of its third-party development projects, the Company commonly provides alternate housing and project cost guarantees, subject to force majeure. These guarantees are typically limited, on an aggregate basis, to the amount of the projects’ related development fees or a contractually agreed-upon maximum exposure amount. Alternate housing guarantees generally require the Company to provide substitute living quarters and transportation for students to and from the university if the project is not complete by an agreed-upon completion date. These guarantees typically expire at the later of five days after completion of the project or once the Company has moved all students from the substitute living quarters into the project.
Under project cost guarantees, the Company is responsible for the construction cost of a project in excess of an approved budget. The budget consists primarily of costs included in the general contractors’ guaranteed maximum price contract (“GMP”). In most cases, the GMP obligates the general contractor, subject to force majeure and approved change orders, to provide completion date guarantees and to cover cost overruns and liquidated damages. In addition, the GMP is in certain cases secured with payment and performance bonds. Project cost guarantees expire upon completion of certain developer obligations, which are normally satisfied within one year after completion of the project. The Company’s estimated maximum exposure amount under the above guarantees is approximately $7.8 million as of December 31, 2017. As of December 31, 2017, management did not anticipate any material deviations from schedule or budget related to third-party development projects currently in progress.
In the normal course of business, the Company enters into various development-related purchase commitments with parties that provide development-related goods and services. In the event that the Company was to terminate development services prior to the completion of projects under construction, the Company could potentially be committed to satisfy outstanding purchase orders with such parties.
AMERICAN CAMPUS COMMUNITIES, INC. AND SUBSIDIARIES
AMERICAN CAMPUS COMMUNITIES OPERATING PARTNERSHIP, L.P. AND SUBSIDIARIES
NOTES TO CONSOLIDATED FINANCIAL STATEMENTS
Conveyance to University: In August 2013, the Company entered into an agreement to convey fee interest in a parcel of land, on which one of the Company’s student housing properties resides (University Crossings), to Drexel University (the “University”). Concurrent with the land conveyance, the Company as lessee entered into a ground lease agreement with the University as lessor for an initial term of 40 years, with three 10-year extensions, at the Company’s option. The Company also agreed to convey the building and improvements to the University at an undetermined date in the future and to pay real estate transfer taxes not to exceed $2.4 million. The Company paid approximately $0.6 million in real estate transfer taxes upon the conveyance of land to the University, leaving approximately $1.8 million to be paid by the Company upon the transfer of the building and improvements.
Other Guarantees: In 2017, as part of the purchase of an undeveloped land parcel, the Company entered into an agreement to construct a commercial retail space within a future development that will be conveyed back to the seller upon construction completion. If the construction of the retail space is not completed in accordance with the agreement, the Company is required to pay liquidated damages of $2.1 million. As of December 31, 2017, management did not anticipate issues in completing construction of the retail space in accordance with the agreement.
Contingencies
Litigation: The Company is subject to various claims, lawsuits and legal proceedings, as well as other matters that have not been fully resolved and that have arisen in the ordinary course of business. While it is not possible to ascertain the ultimate outcome of such matters, management believes that the aggregate amount of such liabilities, if any, in excess of amounts provided or covered by insurance, will not have a material adverse effect on the consolidated financial position or results of operations of the Company. However, the outcome of claims, lawsuits and legal proceedings brought against the Company is subject to significant uncertainty. Therefore, although management considers the likelihood of such an outcome to be remote, the ultimate results of these matters cannot be predicted with certainty.
Letters of Intent: In the ordinary course of the Company’s business, the Company enters into letters of intent indicating a willingness to negotiate for acquisitions, dispositions or joint ventures. Such letters of intent are non-binding (except with regard to exclusivity and confidentiality), and neither party to the letter of intent is obligated to pursue negotiations unless and until a definitive contract is entered into by the parties. Even if definitive contracts are entered into, the letters of intent relating to the acquisition and disposition of real property and resulting contracts generally contemplate that such contracts will provide the acquirer with time to evaluate the property and conduct due diligence, during which periods the acquirer will have the ability to terminate the contracts without penalty or forfeiture of any material deposit or earnest money. There can be no assurance that definitive contracts will be entered into with respect to any matter covered by letters of intent or that the Company will consummate any transaction contemplated by any definitive contract. Furthermore, due diligence periods for real property are frequently extended as needed. Once the due diligence period expires, the Company is then at risk under a real property acquisition contract, but only to the extent of any non-refundable earnest money deposits associated with the contract and subject to normal closing conditions being met.
Environmental Matters: The Company is not aware of any environmental liability with respect to the properties that would have a material adverse effect on the Company’s business, assets or results of operations. However, there can be no assurance that such a material environmental liability does not exist. The existence of any such material environmental liability could have an adverse effect on the Company’s results of operations and cash flows.
17. Segments
The Company defines business segments by their distinct customer base and service provided. The Company has identified four reportable segments: Owned Properties, On-Campus Participating Properties, Development Services, and Property Management Services. Management evaluates each segment’s performance based on operating income before depreciation, amortization and minority interests.
During the year ended December 31, 2017, the Company revised the measure of profit or loss for each segment to include the allocation of costs related to corporate management and oversight and to exclude intercompany management fee revenue. This was due to a presentation change in the information used by the Company’s chief operating decision makers to assess segment and company-wide performance and allocate resources, which was driven by the reorganization of duties within the Company’s executive management team. Prior period amounts have been reclassified to conform to the current period presentation.
|
| | | | | | | | | | | | |
| | | Year Ended December 31, |
| | | 2017 | | 2016 | | 2015 |
| Owned Properties | | | | | | |
| Rental revenues and other income | | $ | 741,909 |
| | $ | 738,598 |
| | $ | 708,018 |
|
| Interest income | | 1,545 |
| | 1,170 |
| | 1,071 |
|
| Total revenues from external customers | | 743,454 |
| | 739,768 |
| | 709,089 |
|
| Operating expenses before depreciation, amortization, and ground/facility lease expense | | (332,429 | ) | | (337,296 | ) | | (331,836 | ) |
| Ground/facility leases | | (7,372 | ) | | (6,158 | ) | | (5,297 | ) |
Interest expense, net (1) | | (3,659 | ) | | (18,552 | ) | | (30,147 | ) |
| Operating income before depreciation and amortization | | $ | 399,994 |
| | $ | 377,762 |
| | $ | 341,809 |
|
| Depreciation and amortization | | $ | 223,939 |
| | $ | 200,934 |
| | $ | 198,986 |
|
| Capital expenditures | | $ | 617,552 |
| | $ | 485,726 |
| | $ | 316,468 |
|
Total segment assets at December 31, | | $ | 6,691,758 |
| | $ | 5,672,360 |
| | $ | 5,804,068 |
|
| | | | | | | |
| On-Campus Participating Properties | | | | | | |
| Rental revenues and other income | | $ | 33,945 |
| | $ | 33,433 |
| | $ | 31,586 |
|
| Interest income | | 65 |
| | 10 |
| | 2 |
|
| Total revenues from external customers | | 34,010 |
| | 33,443 |
| | 31,588 |
|
| Operating expenses before depreciation, amortization, and ground/facility lease expense | | (14,384 | ) | | (13,447 | ) | | (12,437 | ) |
| Ground/facility lease | | (2,841 | ) | | (3,009 | ) | | (2,935 | ) |
Interest expense, net (1) | | (5,264 | ) | | (5,539 | ) | | (5,833 | ) |
| Operating income before depreciation and amortization | | $ | 11,521 |
| | $ | 11,448 |
| | $ | 10,383 |
|
| Depreciation and amortization | | $ | 7,536 |
| | $ | 7,343 |
| | $ | 7,034 |
|
| Capital expenditures | | $ | 3,533 |
| | $ | 2,944 |
| | $ | 2,943 |
|
Total segment assets at December 31, | | $ | 100,031 |
| | $ | 103,256 |
| | $ | 104,641 |
|
| | | | | | | |
| Development Services | | | | | | |
| Development and construction management fees | | $ | 10,761 |
| | $ | 4,606 |
| | $ | 4,964 |
|
| Operating expenses | | (7,618 | ) | | (7,530 | ) | | (8,119 | ) |
| Operating income (loss) before depreciation and amortization | | $ | 3,143 |
| | $ | (2,924 | ) | | $ | (3,155 | ) |
Total segment assets at December 31, | | $ | 6,726 |
| | $ | 2,601 |
| | $ | 1,730 |
|
| | | | | | | |
| | | | | | | |
| Property Management Services | | | | | | |
| Property management fees from external customers | | $ | 9,832 |
| | $ | 9,724 |
| | $ | 8,813 |
|
| Operating expenses | | (7,607 | ) | | (7,003 | ) | | (6,227 | ) |
| Operating income before depreciation and amortization | | $ | 2,225 |
| | $ | 2,721 |
| | $ | 2,586 |
|
| Total segment assets at December 31, | | $ | 7,576 |
| | $ | 7,997 |
| | $ | 9,432 |
|
| | | | | | | |
| Reconciliations | | | | | | |
| Total segment revenues and other income | | $ | 798,057 |
| | $ | 787,541 |
| | $ | 754,454 |
|
| Unallocated interest income earned on investments and corporate cash | | 3,335 |
| | 4,301 |
| | 3,348 |
|
| Total consolidated revenues, including interest income | | $ | 801,392 |
| | $ | 791,842 |
| | $ | 757,802 |
|
| Segment operating income before depreciation and amortization | | $ | 416,883 |
| | $ | 389,007 |
| | $ | 351,623 |
|
| Depreciation and amortization | | (239,574 | ) | | (217,907 | ) | | (214,338 | ) |
| Net unallocated expenses relating to corporate interest and overhead | | (90,250 | ) | | (72,788 | ) | | (69,299 | ) |
| (Loss) gain from disposition of real estate | | (632 | ) | | 21,197 |
| | 52,699 |
|
| Provision for real estate impairment | | (15,317 | ) | | (4,895 | ) | | — |
|
| Other nonoperating income | | — |
| | — |
| | 388 |
|
| Loss from early extinguishment of debt | | — |
| | (12,841 | ) | | (1,770 | ) |
| Income tax provision | | (989 | ) | | (1,150 | ) | | (1,242 | ) |
| Net income | | $ | 70,121 |
| | $ | 100,623 |
| | $ | 118,061 |
|
| | | | | | | |
Total segment assets | | $ | 6,806,091 |
| | $ | 5,786,214 |
| | $ | 5,919,871 |
|
Unallocated corporate assets | | 91,279 |
| | 79,699 |
| | 86,377 |
|
Total assets at December 31, | | $ | 6,897,370 |
| | $ | 5,865,913 |
| | $ | 6,006,248 |
|
| |
(1) | Net of capitalized interest and amortization of debt premiums. |
AMERICAN CAMPUS COMMUNITIES, INC. AND SUBSIDIARIES
AMERICAN CAMPUS COMMUNITIES OPERATING PARTNERSHIP, L.P. AND SUBSIDIARIES
NOTES TO CONSOLIDATED FINANCIAL STATEMENTS
18. Quarterly Financial Information (Unaudited)
American Campus Communities, Inc.
The information presented below represents the quarterly consolidated financial results of the Company for the years ended December 31, 2017 and 2016.
|
| | | | | | | | | | | | | | | | | | | | | |
| | | 2017 | |
| | | 1st Quarter | | 2nd Quarter | | 3rd Quarter | | 4th Quarter | | Total | |
| Total revenues | | $ | 192,938 |
| | $ | 179,008 |
| | $ | 196,938 |
| | $ | 227,563 |
| | $ | 796,447 |
| |
| Operating income | | 49,219 |
| | 12,610 |
| | 17,575 |
| | 63,134 |
| | 142,538 |
| |
| | | | | | | | | | | | |
| Net income (loss) | | 34,449 |
| | (2,653 | ) | | (1,233 | ) | | 39,558 |
| | 70,121 |
| |
| Net income attributable to noncontrolling interests | | (399 | ) | | (109 | ) | | (79 | ) | | (496 | ) | | (1,083 | ) | |
| Net income (loss) attributable to ACC, Inc. and Subsidiaries common stockholders | | $ | 34,050 |
| | $ | (2,762 | ) | | $ | (1,312 | ) | | $ | 39,062 |
| | $ | 69,038 |
| |
| Net income (loss) attributable to common stockholders per share - basic | | $ | 0.25 |
| | $ | (0.02 | ) | | $ | (0.01 | ) | | $ | 0.28 |
| | $ | 0.50 |
| |
| Net income (loss) attributable to common stockholders per share - diluted | | $ | 0.25 |
| | $ | (0.02 | ) | | $ | (0.01 | ) | | $ | 0.28 |
| | $ | 0.50 |
| |
|
| | | | | | | | | | | | | | | | | | | | | |
| | | 2016 | |
| | | 1st Quarter | | 2nd Quarter | | 3rd Quarter | | 4th Quarter | | Total | |
| Total revenues | | $ | 199,995 |
| | $ | 185,983 |
| | $ | 196,411 |
| | $ | 203,972 |
| | $ | 786,361 |
| |
| Operating income | | 53,035 |
| | 39,106 |
| | 29,278 |
| | 51,724 |
| | 173,143 |
| |
| | | | | | | | | | | | |
| Net income | | 46,209 |
| | 18,765 |
| | 9,845 |
| | 25,804 |
| | 100,623 |
| |
| Net income attributable to noncontrolling interests | | (622 | ) | | (327 | ) | | (201 | ) | | (412 | ) | | (1,562 | ) | |
| Net income attributable to ACC, Inc. and Subsidiaries common stockholders | | $ | 45,587 |
| | $ | 18,438 |
| | $ | 9,644 |
| | $ | 25,392 |
| | $ | 99,061 |
| |
| Net income attributable to common stockholders per share - basic | | $ | 0.37 |
| | $ | 0.14 |
| | $ | 0.07 |
| | $ | 0.19 |
| | $ | 0.76 |
| (1) |
| Net income attributable to common stockholders per share - diluted | | $ | 0.36 |
| | $ | 0.14 |
| | $ | 0.07 |
| | $ | 0.19 |
| | $ | 0.75 |
| (1) |
| |
(1) | Net income per share is computed independently for each of the periods presented. Therefore, the sum of quarterly net income per share amounts may not equal the total computed for the year. |
AMERICAN CAMPUS COMMUNITIES, INC. AND SUBSIDIARIES
AMERICAN CAMPUS COMMUNITIES OPERATING PARTNERSHIP, L.P. AND SUBSIDIARIES
NOTES TO CONSOLIDATED FINANCIAL STATEMENTS
American Campus Communities Operating Partnership, L.P.
The information presented below represents the quarterly consolidated financial results of the Operating Partnership for the years ended December 31, 2017 and 2016.
|
| | | | | | | | | | | | | | | | | | | | | |
| | | 2017 | |
| | | 1st Quarter | | 2nd Quarter | | 3rd Quarter | | 4th Quarter | | Total | |
| Total revenues | | $ | 192,938 |
| | $ | 179,008 |
| | $ | 196,938 |
| | $ | 227,563 |
| | $ | 796,447 |
| |
| Operating income | | 49,219 |
| | 12,610 |
| | 17,575 |
| | 63,134 |
| | 142,538 |
| |
| | | | | | | | | | | | |
| Net income (loss) | | 34,449 |
| | (2,653 | ) | | (1,233 | ) | | 39,558 |
| | 70,121 |
| |
| Net income attributable to noncontrolling interests | | (105 | ) | | (97 | ) | | (57 | ) | | (176 | ) | | (435 | ) | |
| Series A preferred unit distributions | | (31 | ) | | (31 | ) | | (31 | ) | | (31 | ) | | (124 | ) | |
| Net income (loss) available to common unitholders | | $ | 34,313 |
| | $ | (2,781 | ) | | $ | (1,321 | ) | | $ | 39,351 |
| | $ | 69,562 |
| |
| Net income (loss) per unit attributable to common unitholders - basic | | $ | 0.25 |
| | $ | (0.02 | ) | | $ | (0.01 | ) | | $ | 0.28 |
| | $ | 0.50 |
| |
| Net income (loss) per unit attributable to common unitholders - diluted | | $ | 0.25 |
| | $ | (0.02 | ) | | $ | (0.01 | ) | | $ | 0.28 |
| | $ | 0.50 |
| |
|
| | | | | | | | | | | | | | | | | | | | | |
| | | 2016 | |
| | | 1st Quarter | | 2nd Quarter | | 3rd Quarter | | 4th Quarter | | Total | |
| Total revenues | | $ | 199,995 |
| | $ | 185,983 |
| | $ | 196,411 |
| | $ | 203,972 |
| | $ | 786,361 |
| |
| Operating income | | 53,035 |
| | 39,106 |
| | 29,278 |
| | 51,724 |
| | 173,143 |
| |
| | | | | | | | | | | | |
| Net income | | 46,209 |
| | 18,765 |
| | 9,845 |
| | 25,804 |
| | 100,623 |
| |
| Net income attributable to noncontrolling interests | | (104 | ) | | (104 | ) | | (77 | ) | | (171 | ) | | (456 | ) | |
| Series A preferred unit distributions | | (42 | ) | | (37 | ) | | (36 | ) | | (31 | ) | | (146 | ) | |
| Net income available to common unitholders | | $ | 46,063 |
| | $ | 18,624 |
| | $ | 9,732 |
| | $ | 25,602 |
| | $ | 100,021 |
| |
| Net income per unit attributable to common unitholders - basic | | $ | 0.37 |
| | $ | 0.14 |
| | $ | 0.07 |
| | $ | 0.19 |
| | $ | 0.76 |
| (1) |
| Net income per unit attributable to common unitholders - diluted | | $ | 0.36 |
| | $ | 0.14 |
| | $ | 0.07 |
| | $ | 0.19 |
| | $ | 0.75 |
| (1) |
| |
(1) | Net income per share is computed independently for each of the periods presented. Therefore, the sum of quarterly net income per share amounts may not equal the total computed for the year. |
19. Subsequent Events
Presale Development Projects: In January 2018, the Company entered into a presale agreement to purchase the Stadium Centre Phase IV, a 340-bed, property under development located near Florida State University. The Company is obligated to purchase the property for approximately $36.7 million as long as certain construction completion deadlines and other closing conditions are met.
Distributions: On January 23, 2018, the Company’s Board of Directors declared a distribution per share of $0.44 which was paid on February 16, 2018 to all common stockholders of record as of February 2, 2018. At the same time, the Operating Partnership paid an equivalent amount per unit to holders of Common Units, as well as the quarterly cumulative preferential distribution to holders of Series A Preferred Units (see Note 9).
AMERICAN CAMPUS COMMUNITIES, INC. AND SUBSIDIARIES
AMERICAN CAMPUS COMMUNITIES OPERATING PARTNERSHIP, L.P. AND SUBSIDIARIES
NOTES TO CONSOLIDATED FINANCIAL STATEMENTS
20. Schedule of Real Estate and Accumulated Depreciation
|
| | | | | | | | | | | | | | | | | | | | | | | | | | | | | | | | | | | | | | |
| | | | | | | Initial Cost | | | | Total Costs | | | | | | |
| | | Units | | Beds | | Land | | Buildings and Improvements and Furniture, Fixtures and Equipment | | Costs
Capitalized
Subsequent to
Acquisition / Initial Development | | Land | | Buildings and
Improvements
and Furniture,
Fixtures and
Equipment | | Total (1) | | Accumulated Depreciation | | Encumbrances (2) | | Year Built (3) |
| Owned Properties | | | | | | | | | | | | | | | | | | | | | | |
| The Callaway House | | 173 | | 538 | | $ | 5,081 |
| | $ | 20,499 |
| | $ | 7,434 |
| | $ | 5,003 |
| | $ | 28,011 |
| | $ | 33,014 |
| | $ | 11,736 |
| | $ | — |
| | 1999 |
| The Village at Science Drive | | 192 | | 732 | | 4,673 |
| | 19,021 |
| | 6,696 |
| | 4,673 |
| | 25,717 |
| | 30,390 |
| | 8,860 |
| | — |
| | 2000 |
| University Village at Boulder Creek | | 82 | | 309 | | 1,035 |
| | 16,393 |
| | 645 |
| | 1,035 |
| | 17,038 |
| | 18,073 |
| | 6,688 |
| | — |
| | 2002 |
| University Village - Fresno | | 105 | | 406 | | 929 |
| | 15,168 |
| | — |
| | 929 |
| | 15,168 |
| | 16,097 |
| | 5,332 |
| | — |
| | 2004 |
| University Village - Temple | | 220 | | 749 | | — |
| | 41,119 |
| | 940 |
| | — |
| | 42,059 |
| | 42,059 |
| | 14,360 |
| | — |
| | 2004 |
College Club Townhomes (4) | | 136 | | 544 | | 1,967 |
| | 16,049 |
| | 1,770 |
| | 1,967 |
| | 17,819 |
| | 19,786 |
| | 6,763 |
| | — |
| | 2002 |
| University Club Apartments | | 94 | | 376 | | 1,416 |
| | 11,848 |
| | 1,057 |
| | 1,416 |
| | 12,905 |
| | 14,321 |
| | 4,480 |
| | — |
| | 1999 |
| City Parc at Fry Street | | 136 | | 418 | | 1,902 |
| | 17,678 |
| | 1,196 |
| | 1,902 |
| | 18,874 |
| | 20,776 |
| | 6,305 |
| | — |
| | 2004 |
| Entrada Real | | 98 | | 363 | | 1,475 |
| | 15,859 |
| | 2,027 |
| | 1,475 |
| | 17,886 |
| | 19,361 |
| | 5,728 |
| | — |
| | 2000 |
| University Village at Sweethome | | 269 | | 828 | | 2,473 |
| | 34,448 |
| | — |
| | 2,473 |
| | 34,448 |
| | 36,921 |
| | 11,183 |
| | — |
| | 2005 |
University Village - Tallahassee (5) | | 217 | | 716 | | 4,322 |
| | 26,225 |
| | 3,796 |
| | 4,322 |
| | 30,021 |
| | 34,343 |
| | 9,435 |
| | — |
| | 1991 |
| Royal Village Gainesville | | 118 | | 448 | | 2,386 |
| | 15,153 |
| | 3,509 |
| | 2,363 |
| | 18,685 |
| | 21,048 |
| | 5,223 |
| | — |
| | 1996 |
| Royal Lexington | | 94 | | 364 | | 2,848 |
| | 12,783 |
| | 4,276 |
| | 2,848 |
| | 17,059 |
| | 19,907 |
| | 5,343 |
| | — |
| | 1994 |
| Raiders Pass | | 264 | | 828 | | 3,877 |
| | 32,445 |
| | 2,825 |
| | 3,877 |
| | 35,270 |
| | 39,147 |
| | 10,775 |
| | — |
| | 2001 |
| Aggie Station | | 156 | | 450 | | 1,634 |
| | 18,821 |
| | 2,819 |
| | 1,634 |
| | 21,640 |
| | 23,274 |
| | 6,218 |
| | — |
| | 2003 |
| The Outpost - San Antonio | | 276 | | 828 | | 3,262 |
| | 36,252 |
| | 3,596 |
| | 3,262 |
| | 39,848 |
| | 43,110 |
| | 11,716 |
| | — |
| | 2005 |
| Callaway Villas | | 236 | | 704 | | 3,903 |
| | 31,953 |
| | — |
| | 3,903 |
| | 31,953 |
| | 35,856 |
| | 9,207 |
| | — |
| | 2006 |
| The Village on Sixth Avenue | | 248 | | 752 | | 2,763 |
| | 22,480 |
| | 1,606 |
| | 2,763 |
| | 24,086 |
| | 26,849 |
| | 7,001 |
| | — |
| | 1999 |
| Newtown Crossing | | 356 | | 942 | | 7,013 |
| | 53,597 |
| | 1,657 |
| | 7,013 |
| | 55,254 |
| | 62,267 |
| | 17,456 |
| | — |
| | 2005 |
| Olde Towne University Square | | 224 | | 550 | | 2,277 |
| | 24,614 |
| | 935 |
| | 2,277 |
| | 25,549 |
| | 27,826 |
| | 8,412 |
| | — |
| | 2005 |
| Peninsular Place | | 183 | | 478 | | 2,306 |
| | 16,559 |
| | 941 |
| | 2,306 |
| | 17,500 |
| | 19,806 |
| | 6,062 |
| | — |
| | 2005 |
| University Centre | | 234 | | 838 | | — |
| | 77,378 |
| | 3,617 |
| | — |
| | 80,995 |
| | 80,995 |
| | 24,175 |
| | — |
| | 2007 |
The Summit & Jacob Heights (5) | | 258 | | 930 | | 2,318 |
| | 36,464 |
| | 1,868 |
| | 2,318 |
| | 38,332 |
| | 40,650 |
| | 10,019 |
| | — |
| | 2004 |
| GrandMarc Seven Corners | | 186 | | 440 | | 4,491 |
| | 28,807 |
| | 1,522 |
| | 4,491 |
| | 30,329 |
| | 34,820 |
| | 8,109 |
| | — |
| | 2000 |
| Aztec Corner | | 180 | | 606 | | 17,460 |
| | 32,209 |
| | 1,728 |
| | 17,460 |
| | 33,937 |
| | 51,397 |
| | 9,120 |
| | — |
| | 2001 |
| The Tower at Third | | 188 | | 375 | | 1,145 |
| | 19,128 |
| | 11,868 |
| | 1,267 |
| | 30,874 |
| | 32,141 |
| | 8,867 |
| | — |
| | 1973 |
Willowtree Apartments and Tower (4) | | 473 | | 851 | | 9,807 |
| | 21,880 |
| | 3,671 |
| | 9,807 |
| | 25,551 |
| | 35,358 |
| | 7,863 |
| | — |
| | 1970 |
| University Pointe | | 204 | | 682 | | 989 |
| | 27,576 |
| | 4,155 |
| | 989 |
| | 31,731 |
| | 32,720 |
| | 8,541 |
| | — |
| | 2004 |
| University Trails | | 240 | | 684 | | 1,183 |
| | 25,173 |
| | 3,284 |
| | 1,183 |
| | 28,457 |
| | 29,640 |
| | 8,166 |
| | — |
| | 2003 |
| Campus Trails | | 156 | | 480 | | 1,358 |
| | 11,291 |
| | 4,827 |
| | 1,358 |
| | 16,118 |
| | 17,476 |
| | 4,716 |
| | — |
| | 1991 |
| University Crossings (ACE) | | 260 | | 1,016 | | — |
| | 50,668 |
| | 38,616 |
| | — |
| | 89,284 |
| | 89,284 |
| | 22,967 |
| | — |
| | 2003 |
| Vista del Sol (ACE) | | 613 | | 1,866 | | — |
| | 135,939 |
| | 3,924 |
| | — |
| | 139,863 |
| | 139,863 |
| | 38,013 |
| | — |
| | 2008 |
| Villas at Chestnut Ridge | | 196 | | 552 | | 2,756 |
| | 33,510 |
| | 1,335 |
| | 2,756 |
| | 34,845 |
| | 37,601 |
| | 9,858 |
| | — |
| | 2008 |
| Barrett Honors College (ACE) | | 604 | | 1,721 | | — |
| | 131,302 |
| | 17,485 |
| | — |
| | 148,787 |
| | 148,787 |
| | 39,130 |
| | — |
| | 2009 |
AMERICAN CAMPUS COMMUNITIES, INC. AND SUBSIDIARIES
AMERICAN CAMPUS COMMUNITIES OPERATING PARTNERSHIP, L.P. AND SUBSIDIARIES
NOTES TO CONSOLIDATED FINANCIAL STATEMENTS
|
| | | | | | | | | | | | | | | | | | | | | | | | | | | | | | | | | | | | | | |
| | | | | | | Initial Cost | | | | Total Costs | | | | | | |
| | | Units | �� | Beds | | Land | | Buildings and Improvements and Furniture, Fixtures and Equipment | | Costs
Capitalized
Subsequent to
Acquisition / Initial Development | | Land | | Buildings and
Improvements
and Furniture,
Fixtures and
Equipment | | Total (1) | | Accumulated Depreciation | | Encumbrances (2) | | Year Built (3) |
| Sanctuary Lofts | | 201 | | 487 | | $ | 2,960 |
| | $ | 18,180 |
| | $ | 3,738 |
| | $ | 2,960 |
| | $ | 21,918 |
| | $ | 24,878 |
| | $ | 6,680 |
| | $ | — |
| | 2006 |
Blanton Common (6) | | 276 | | 860 | | 3,788 |
| | 16,759 |
| | — |
| | 3,788 |
| | 16,759 |
| | 20,547 |
| | 7,193 |
| | 27,380 |
| | 2005 |
| The Edge- Charlotte | | 180 | | 720 | | 3,076 |
| | 23,395 |
| | 8,830 |
| | 3,076 |
| | 32,225 |
| | 35,301 |
| | 7,957 |
| | — |
| | 1999 |
| University Walk | | 120 | | 480 | | 2,016 |
| | 14,599 |
| | 3,021 |
| | 2,016 |
| | 17,620 |
| | 19,636 |
| | 4,668 |
| | — |
| | 2002 |
| Uptown Apartments | | 180 | | 528 | | 3,031 |
| | 21,685 |
| | 2,151 |
| | 3,031 |
| | 23,836 |
| | 26,867 |
| | 5,429 |
| | — |
| | 2004 |
| 2nd Ave Centre | | 274 | | 868 | | 4,434 |
| | 27,236 |
| | 3,804 |
| | 4,434 |
| | 31,040 |
| | 35,474 |
| | 8,151 |
| | — |
| | 2008 |
| Villas at Babcock | | 204 | | 792 | | 4,642 |
| | 30,901 |
| | 47 |
| | 4,642 |
| | 30,948 |
| | 35,590 |
| | 9,487 |
| | — |
| | 2011 |
| Lobo Village (ACE) | | 216 | | 864 | | — |
| | 42,490 |
| | 543 |
| | — |
| | 43,033 |
| | 43,033 |
| | 8,990 |
| | — |
| | 2011 |
| Villas on Sycamore | | 170 | | 680 | | 3,000 |
| | 24,640 |
| | 263 |
| | 3,000 |
| | 24,903 |
| | 27,903 |
| | 8,064 |
| | — |
| | 2011 |
| University Village Northwest (ACE) | | 36 | | 144 | | — |
| | 4,228 |
| | 109 |
| | — |
| | 4,337 |
| | 4,337 |
| | 1,149 |
| | — |
| | 2011 |
| 26 West | | 367 | | 1,026 | | 21,396 |
| | 63,994 |
| | 6,307 |
| | 21,396 |
| | 70,301 |
| | 91,697 |
| | 13,782 |
| | — |
| | 2008 |
| The Varsity | | 258 | | 901 | | 11,605 |
| | 108,529 |
| | 2,413 |
| | 11,605 |
| | 110,942 |
| | 122,547 |
| | 18,831 |
| | — |
| | 2011 |
| Avalon Heights | | 210 | | 754 | | 4,968 |
| | 24,345 |
| | 13,726 |
| | 4,968 |
| | 38,071 |
| | 43,039 |
| | 6,584 |
| | — |
| | 2002 |
| University Commons | | 164 | | 480 | | 12,559 |
| | 19,010 |
| | 2,701 |
| | 12,559 |
| | 21,711 |
| | 34,270 |
| | 4,166 |
| | — |
| | 2003 |
| Casas del Rio (ACE) | | 283 | | 1,028 | | — |
| | 40,639 |
| | 1,198 |
| | — |
| | 41,837 |
| | 41,837 |
| | 12,691 |
| | — |
| | 2012 |
The Suites (ACE) (4) | | 439 | | 878 | | — |
| | 45,296 |
| | 502 |
| | — |
| | 45,798 |
| | 45,798 |
| | 9,467 |
| | — |
| | 2013 |
| Hilltop Townhomes (ACE) | | 144 | | 576 | | — |
| | 31,507 |
| | 419 |
| | — |
| | 31,926 |
| | 31,926 |
| | 8,042 |
| | — |
| | 2012 |
U Club on Frey (4) | | 216 | | 864 | | 8,703 |
| | 36,873 |
| | 938 |
| | 8,703 |
| | 37,811 |
| | 46,514 |
| | 7,837 |
| | — |
| | 2013 |
| Campus Edge on UTA Boulevard | | 128 | | 488 | | 2,661 |
| | 21,233 |
| | 587 |
| | 2,661 |
| | 21,820 |
| | 24,481 |
| | 5,495 |
| | — |
| | 2012 |
| U Club Townhomes on Marion Pugh | | 160 | | 640 | | 6,722 |
| | 26,546 |
| | 928 |
| | 6,722 |
| | 27,474 |
| | 34,196 |
| | 7,207 |
| | — |
| | 2012 |
| Villas on Rensch | | 153 | | 610 | | 10,231 |
| | 33,852 |
| | 759 |
| | 10,231 |
| | 34,611 |
| | 44,842 |
| | 8,025 |
| | — |
| | 2012 |
| The Village at Overton Park | | 163 | | 612 | | 5,262 |
| | 29,374 |
| | 1,009 |
| | 5,262 |
| | 30,383 |
| | 35,645 |
| | 7,663 |
| | — |
| | 2012 |
| Casa de Oro (ACE) | | 109 | | 365 | | — |
| | 12,362 |
| | 157 |
| | — |
| | 12,519 |
| | 12,519 |
| | 3,424 |
| | — |
| | 2012 |
| The Villas at Vista del Sol (ACE) | | 104 | | 400 | | — |
| | 20,421 |
| | 334 |
| | — |
| | 20,755 |
| | 20,755 |
| | 5,743 |
| | — |
| | 2012 |
| The Block | | 669 | | 1,555 | | 22,270 |
| | 141,430 |
| | 10,248 |
| | 22,350 |
| | 151,598 |
| | 173,948 |
| | 22,736 |
| | — |
| | 2008 |
| University Pointe at College Station (ACE) | | 282 | | 978 | | — |
| | 84,657 |
| | 2,089 |
| | — |
| | 86,746 |
| | 86,746 |
| | 22,279 |
| | — |
| | 2012 |
| 309 Green | | 110 | | 416 | | 5,351 |
| | 49,987 |
| | 3,695 |
| | 5,351 |
| | 53,682 |
| | 59,033 |
| | 8,518 |
| | 30,222 |
| | 2008 |
| The Retreat | | 187 | | 780 | | 5,265 |
| | 46,236 |
| | 2,364 |
| | 5,265 |
| | 48,600 |
| | 53,865 |
| | 7,979 |
| | — |
| | 2012 |
| Lofts54 | | 43 | | 172 | | 430 |
| | 14,741 |
| | 4,254 |
| | 430 |
| | 18,995 |
| | 19,425 |
| | 2,849 |
| | 10,409 |
| | 2008 |
| Campustown Rentals | | 264 | | 746 | | 2,382 |
| | 40,190 |
| | 3,902 |
| | 2,382 |
| | 44,092 |
| | 46,474 |
| | 8,356 |
| | — |
| | 1982 |
| Chauncey Square | | 158 | | 386 | | 2,522 |
| | 40,013 |
| | 1,708 |
| | 2,522 |
| | 41,721 |
| | 44,243 |
| | 6,919 |
| | — |
| | 2011 |
Texan & Vintage West Campus (4) | | 124 | | 311 | | 5,937 |
| | 11,906 |
| | 15,449 |
| | 5,937 |
| | 27,355 |
| | 33,292 |
| | 4,296 |
| | 8,381 |
| | 2008 |
| The Castilian | | 371 | | 623 | | 3,663 |
| | 59,772 |
| | 33,270 |
| | 3,663 |
| | 93,042 |
| | 96,705 |
| | 15,537 |
| | — |
| | 1967 |
| Bishops Square | | 134 | | 315 | | 1,206 |
| | 17,878 |
| | 1,649 |
| | 1,206 |
| | 19,527 |
| | 20,733 |
| | 3,645 |
| | 11,141 |
| | 2002 |
| Union | | 54 | | 120 | | 169 |
| | 6,348 |
| | 977 |
| | 169 |
| | 7,325 |
| | 7,494 |
| | 1,339 |
| | 3,471 |
| | 2006 |
| 922 Place | | 132 | | 468 | | 3,363 |
| | 34,947 |
| | 3,106 |
| | 3,363 |
| | 38,053 |
| | 41,416 |
| | 6,920 |
| | — |
| | 2009 |
| Campustown | | 452 | | 1,217 | | 1,818 |
| | 77,894 |
| | 4,490 |
| | 1,818 |
| | 82,384 |
| | 84,202 |
| | 13,027 |
| | — |
| | 1997 |
AMERICAN CAMPUS COMMUNITIES, INC. AND SUBSIDIARIES
AMERICAN CAMPUS COMMUNITIES OPERATING PARTNERSHIP, L.P. AND SUBSIDIARIES
NOTES TO CONSOLIDATED FINANCIAL STATEMENTS
|
| | | | | | | | | | | | | | | | | | | | | | | | | | | | | | | | | | | | | | |
| | | | | | | Initial Cost | | | | Total Costs | | | | | | |
| | | Units | | Beds | | Land | | Buildings and Improvements and Furniture, Fixtures and Equipment | | Costs
Capitalized
Subsequent to
Acquisition / Initial Development | | Land | | Buildings and
Improvements
and Furniture,
Fixtures and
Equipment | | Total (1) | | Accumulated Depreciation | | Encumbrances (2) | | Year Built (3) |
| River Mill | | 243 | | 461 | | $ | 1,741 |
| | $ | 22,806 |
| | $ | 3,327 |
| | $ | 1,741 |
| | $ | 26,133 |
| | $ | 27,874 |
| | $ | 4,660 |
| | $ | — |
| | 1972 |
| Landmark | | 173 | | 606 | | 3,002 |
| | 118,168 |
| | 1,175 |
| | 3,002 |
| | 119,343 |
| | 122,345 |
| | 17,702 |
| | — |
| | 2012 |
| Icon Plaza | | 56 | | 253 | | 6,292 |
| | 65,857 |
| | 3,475 |
| | 6,292 |
| | 69,332 |
| | 75,624 |
| | 10,415 |
| | — |
| | 2012 |
| The Province - Greensboro | | 219 | | 696 | | 2,226 |
| | 48,567 |
| | 1,149 |
| | 2,226 |
| | 49,716 |
| | 51,942 |
| | 8,346 |
| | 27,598 |
| | 2011 |
| RAMZ Apts on Broad | | 88 | | 172 | | 785 |
| | 12,303 |
| | 564 |
| | 785 |
| | 12,867 |
| | 13,652 |
| | 2,095 |
| | — |
| | 2004 |
| The Lofts at Capital Garage | | 36 | | 144 | | 313 |
| | 3,581 |
| | 553 |
| | 313 |
| | 4,134 |
| | 4,447 |
| | 815 |
| | — |
| | 2000 |
| 25 Twenty | | 249 | | 562 | | 2,226 |
| | 33,429 |
| | 1,111 |
| | 2,226 |
| | 34,540 |
| | 36,766 |
| | 6,555 |
| | 25,698 |
| | 2011 |
| The Province - Louisville | | 366 | | 858 | | 4,392 |
| | 63,068 |
| | 1,394 |
| | 4,392 |
| | 64,462 |
| | 68,854 |
| | 11,160 |
| | 35,938 |
| | 2009 |
| West 27th Place | | 161 | | 475 | | 13,900 |
| | 76,720 |
| | 1,316 |
| | 13,900 |
| | 78,036 |
| | 91,936 |
| | 11,530 |
| | 37,460 |
| | 2011 |
| The Province - Rochester | | 336 | | 816 | | 3,798 |
| | 70,955 |
| | 2,216 |
| | 3,798 |
| | 73,171 |
| | 76,969 |
| | 12,403 |
| | 33,719 |
| | 2010 |
5 Twenty Four & 5 Twenty Five Angliana (4) | | 376 | | 1,060 | | — |
| | 60,448 |
| | 6,941 |
| | 5,214 |
| | 62,175 |
| | 67,389 |
| | 10,879 |
| | — |
| | 2010 |
| The Province - Tampa | | 287 | | 947 | | — |
| | 52,943 |
| | 3,279 |
| | — |
| | 56,222 |
| | 56,222 |
| | 9,361 |
| | 31,826 |
| | 2009 |
| U Point Kennesaw | | 216 | | 795 | | 1,482 |
| | 61,654 |
| | 5,640 |
| | 1,482 |
| | 67,294 |
| | 68,776 |
| | 12,059 |
| | — |
| | 2012 |
| The Cottages of Durham | | 141 | | 619 | | 3,955 |
| | 41,421 |
| | 2,082 |
| | 3,955 |
| | 43,503 |
| | 47,458 |
| | 8,894 |
| | — |
| | 2012 |
| University Edge | | 201 | | 608 | | 4,500 |
| | 26,385 |
| | 1,213 |
| | 4,500 |
| | 27,598 |
| | 32,098 |
| | 4,392 |
| | — |
| | 2012 |
| The Lodges of East Lansing | | 364 | | 1,049 | | 6,472 |
| | 89,231 |
| | 1,293 |
| | 6,472 |
| | 90,524 |
| | 96,996 |
| | 14,381 |
| | 29,126 |
| | 2012 |
| 7th Street Station | | 82 | | 309 | | 9,792 |
| | 16,472 |
| | 485 |
| | 9,792 |
| | 16,957 |
| | 26,749 |
| | 2,862 |
| | — |
| | 2012 |
| The Callaway House Austin | | 219 | | 753 | | — |
| | 61,550 |
| | 769 |
| | — |
| | 62,319 |
| | 62,319 |
| | 10,973 |
| | — |
| | 2013 |
| Manzanita (ACE) | | 241 | | 816 | | — |
| | 48,781 |
| | 350 |
| | — |
| | 49,131 |
| | 49,131 |
| | 9,465 |
| | — |
| | 2013 |
| University View (ACE) | | 96 | | 336 | | — |
| | 14,683 |
| | 176 |
| | — |
| | 14,859 |
| | 14,859 |
| | 2,819 |
| | — |
| | 2013 |
| U Club Townhomes at Overton Park | | 112 | | 448 | | 7,775 |
| | 21,483 |
| | 658 |
| | 7,775 |
| | 22,141 |
| | 29,916 |
| | 4,106 |
| | — |
| | 2013 |
| 601 Copeland | | 81 | | 283 | | 1,457 |
| | 26,699 |
| | 340 |
| | 1,457 |
| | 27,039 |
| | 28,496 |
| | 4,246 |
| | — |
| | 2013 |
| The Townhomes at Newtown Crossing | | 152 | | 608 | | 7,745 |
| | 32,074 |
| | 453 |
| | 7,745 |
| | 32,527 |
| | 40,272 |
| | 5,175 |
| | — |
| | 2013 |
| Chestnut Square (ACE) | | 220 | | 861 | | — |
| | 98,369 |
| | 2,274 |
| | — |
| | 100,643 |
| | 100,643 |
| | 16,633 |
| | — |
| | 2013 |
| Park Point | | 300 | | 924 | | 7,827 |
| | 73,495 |
| | 4,848 |
| | 7,827 |
| | 78,343 |
| | 86,170 |
| | 11,962 |
| | 70,000 |
| | 2008 |
| U Centre at Fry Street | | 194 | | 614 | | 2,902 |
| | 47,700 |
| | 1,798 |
| | 2,902 |
| | 49,498 |
| | 52,400 |
| | 6,621 |
| | — |
| | 2012 |
| Cardinal Towne | | 255 | | 545 | | 6,547 |
| | 53,809 |
| | 2,730 |
| | 6,547 |
| | 56,539 |
| | 63,086 |
| | 7,359 |
| | 37,250 |
| | 2010 |
| Stanworth Commons Phase I (ACE) | | 127 | | 214 | | — |
| | 30,930 |
| | 38 |
| | — |
| | 30,968 |
| | 30,968 |
| | 3,663 |
| | — |
| | 2014 |
| The Plaza on University | | 364 | | 1,313 | | 23,987 |
| | 85,584 |
| | 3,565 |
| | 23,987 |
| | 89,149 |
| | 113,136 |
| | 11,893 |
| | — |
| | 2014 |
| U Centre at Northgate (ACE) | | 196 | | 784 | | — |
| | 35,663 |
| | 265 |
| | — |
| | 35,928 |
| | 35,928 |
| | 5,047 |
| | — |
| | 2014 |
| University Walk | | 177 | | 526 | | 4,341 |
| | 29,073 |
| | 717 |
| | 4,341 |
| | 29,790 |
| | 34,131 |
| | 3,050 |
| | — |
| | 2014 |
U Club on Woodward (4) | | 236 | | 944 | | 16,350 |
| | 46,982 |
| | 485 |
| | 16,350 |
| | 47,467 |
| | 63,817 |
| | 6,749 |
| | — |
| | 2014 |
| The Standard | | 190 | | 610 | | 4,674 |
| | 57,310 |
| | 1,406 |
| | 4,674 |
| | 58,716 |
| | 63,390 |
| | 6,217 |
| | — |
| | 2014 |
| Park Point | | 66 | | 226 | | — |
| | 25,725 |
| | 3,356 |
| | — |
| | 29,081 |
| | 29,081 |
| | 2,493 |
| | 11,049 |
| | 2010 |
| 1200 West Marshall | | 136 | | 406 | | 4,397 |
| | 33,908 |
| | 1,536 |
| | 4,397 |
| | 35,444 |
| | 39,841 |
| | 3,398 |
| | — |
| | 2013 |
| 8 1/2 Canal Street | | 160 | | 540 | | 2,797 |
| | 45,394 |
| | 1,557 |
| | 2,797 |
| | 46,951 |
| | 49,748 |
| | 4,059 |
| | — |
| | 2011 |
| Vistas San Marcos | | 255 | | 600 | | 586 |
| | 45,761 |
| | 4,760 |
| | 586 |
| | 50,521 |
| | 51,107 |
| | 5,934 |
| | — |
| | 2013 |
AMERICAN CAMPUS COMMUNITIES, INC. AND SUBSIDIARIES
AMERICAN CAMPUS COMMUNITIES OPERATING PARTNERSHIP, L.P. AND SUBSIDIARIES
NOTES TO CONSOLIDATED FINANCIAL STATEMENTS
|
| | | | | | | | | | | | | | | | | | | | | | | | | | | | | | | | | | | | | | |
| | | | | | | Initial Cost | | | | Total Costs | | | | | | |
| | | Units | | Beds | | Land | | Buildings and Improvements and Furniture, Fixtures and Equipment | | Costs
Capitalized
Subsequent to
Acquisition / Initial Development | | Land | | Buildings and
Improvements
and Furniture,
Fixtures and
Equipment | | Total (1) | | Accumulated Depreciation | | Encumbrances (2) | | Year Built (3) |
| Crest at Pearl | | 141 | | 343 | | $ | 4,395 |
| | $ | 36,268 |
| | $ | 1,597 |
| | $ | 4,491 |
| | $ | 37,769 |
| | $ | 42,260 |
| | $ | 3,235 |
| | $ | — |
| | 2014 |
| U Club Binghamton | | 186 | | 710 | | 3,584 |
| | 48,559 |
| | 2,405 |
| | 3,584 |
| | 50,964 |
| | 54,548 |
| | 3,944 |
| | — |
| | 2005 |
| Stadium Centre | | 367 | | 710 | | 7,424 |
| | 74,932 |
| | 2,698 |
| | 7,424 |
| | 77,630 |
| | 85,054 |
| | 6,502 |
| | 55,969 |
| | 2014 |
| 160 Ross | | 182 | | 642 | | 2,962 |
| | 38,478 |
| | 279 |
| | 2,962 |
| | 38,757 |
| | 41,719 |
| | 3,750 |
| | — |
| | 2015 |
| The Summit at University City (ACE) | | 351 | | 1,315 | | — |
| | 154,770 |
| | 793 |
| | — |
| | 155,563 |
| | 155,563 |
| | 11,796 |
| | — |
| | 2015 |
| 2125 Franklin | | 192 | | 734 | | 8,299 |
| | 55,716 |
| | 264 |
| | 8,299 |
| | 55,980 |
| | 64,279 |
| | 4,629 |
| | — |
| | 2015 |
| University Crossings - Charlotte | | 187 | | 546 | | 645 |
| | 36,838 |
| | 3,900 |
| | 645 |
| | 40,738 |
| | 41,383 |
| | 1,810 |
| | — |
| | 2014 |
| The Court - Stadium Centre | | 80 | | 260 | | 1,825 |
| | 25,922 |
| | 58 |
| | 1,825 |
| | 25,980 |
| | 27,805 |
| | 1,155 |
| | 9,921 |
| | 2016 |
| U Club on 28th | | 100 | | 398 | | 9,725 |
| | 45,788 |
| | 52 |
| | 9,725 |
| | 45,840 |
| | 55,565 |
| | 2,214 |
| | — |
| | 2016 |
| Currie Hall (ACE) | | 178 | | 456 | | — |
| | 49,987 |
| | 128 |
| | — |
| | 50,115 |
| | 50,115 |
| | 2,624 |
| | — |
| | 2016 |
| University Pointe (ACE) | | 134 | | 531 | | — |
| | 44,035 |
| | 86 |
| | — |
| | 44,121 |
| | 44,121 |
| | 2,168 |
| | — |
| | 2016 |
| Fairview House (ACE) | | 107 | | 633 | | — |
| | 38,144 |
| | 78 |
| | — |
| | 38,222 |
| | 38,222 |
| | 2,258 |
| | — |
| | 2016 |
| U Club Sunnyside | | 134 | | 534 | | 7,423 |
| | 41,582 |
| | 69 |
| | 7,423 |
| | 41,651 |
| | 49,074 |
| | 2,112 |
| | — |
| | 2016 |
| Merwick Stanworth Phase II (ACE) | | 198 | | 379 | | — |
| | 48,668 |
| | 52 |
| | — |
| | 48,720 |
| | 48,720 |
| | 2,145 |
| | — |
| | 2016 |
| U Point | | 54 | | 163 | | 1,425 |
| | 17,325 |
| | 2,259 |
| | 1,425 |
| | 19,584 |
| | 21,009 |
| | 747 |
| | — |
| | 2016 |
| The Arlie | | 169 | | 598 | | 1,350 |
| | 43,352 |
| | 899 |
| | 1,350 |
| | 44,251 |
| | 45,601 |
| | 1,297 |
| | — |
| | 2016 |
| TWELVE at U District | | 283 | | 384 | | 13,013 |
| | 98,115 |
| | 267 |
| | 13,013 |
| | 98,382 |
| | 111,395 |
| | 1,529 |
| | — |
| | 2014 |
The 515 (8) | | 183 | | 513 | | 1,611 |
| | 68,953 |
| | 74 |
| | 1,611 |
| | 69,027 |
| | 70,638 |
| | 800 |
| | — |
| | 2015 |
State (8) | | 220 | | 665 | | 3,448 |
| | 66,774 |
| | 1,244 |
| | 3,448 |
| | 68,018 |
| | 71,466 |
| | 875 |
| | — |
| | 2013 |
The James (9) | | 366 | | 850 | | 18,871 |
| | 118,096 |
| | 115 |
| | 18,871 |
| | 118,211 |
| | 137,082 |
| | 1,299 |
| | — |
| | 2017 |
| Bridges @ 11th | | 184 | | 258 | | — |
| | 58,825 |
| | 59 |
| | — |
| | 58,884 |
| | 58,884 |
| | 391 |
| | — |
| | 2015 |
Hub U District Seattle (9) | | 111 | | 248 | | 5,700 |
| | 56,355 |
| | 75 |
| | 5,700 |
| | 56,430 |
| | 62,130 |
| | 316 |
| | — |
| | 2017 |
| Tooker House (ACE) | | 429 | | 1,594 | | — |
| | 103,897 |
| | — |
| | — |
| | 103,897 |
| | 103,897 |
| | 1,656 |
| | — |
| | 2017 |
| Skyview (ACE) | | 163 | | 626 | | — |
| | 57,578 |
| | — |
| | — |
| | 57,578 |
| | 57,578 |
| | 742 |
| | — |
| | 2017 |
| University Square (ACE) | | 143 | | 466 | | — |
| | 25,635 |
| | — |
| | — |
| | 25,635 |
| | 25,635 |
| | 410 |
| | — |
| | 2017 |
| U Centre on Turner | | 182 | | 718 | | 14,000 |
| | 55,456 |
| | — |
| | 14,000 |
| | 55,456 |
| | 69,456 |
| | 822 |
| | — |
| | 2017 |
| U Pointe on Speight | | 180 | | 700 | | 4,705 |
| | 46,160 |
| | — |
| | 4,705 |
| | 46,160 |
| | 50,865 |
| | 610 |
| | — |
| | 2017 |
| 21Hundred @ Overton Park | | 296 | | 1,204 | | 16,767 |
| | 64,057 |
| | — |
| | 16,767 |
| | 64,057 |
| | 80,824 |
| | 982 |
| | — |
| | 2017 |
| The Suites at 3rd | | 63 | | 251 | | 831 |
| | 22,384 |
| | — |
| | 831 |
| | 22,384 |
| | 23,215 |
| | 330 |
| | — |
| | 2017 |
| U Club Binghamton Phase II | | 140 | | 562 | | 12,274 |
| | 43,813 |
| | — |
| | 12,274 |
| | 43,813 |
| | 56,087 |
| | 641 |
| | — |
| | 2017 |
| Callaway House Apartments | | 386 | | 915 | | 12,651 |
| | 78,220 |
| | — |
| | 12,651 |
| | 78,220 |
| | 90,871 |
| | 1,189 |
| | — |
| | 2017 |
| U Centre on College | | 127 | | 418 | | — |
| | 41,607 |
| | — |
| | — |
| | 41,607 |
| | 41,607 |
| | 574 |
| | — |
| | 2017 |
Properties Under Development (7) | | | | | | | | | | | | | | | | | | | | |
| David Blackwell Hall (ACE) | | 412 | | 781 | | — |
| | 59,912 |
| | — |
| | — |
| | 59,912 |
| | 59,912 |
| | — |
| | — |
| | 2018 |
| Gladding Residence Center (ACE) | | 592 | | 1,524 | | — |
| | 73,913 |
| | — |
| | — |
| | 73,913 |
| | 73,913 |
| | — |
| | — |
| | 2018 |
| Irvington House (ACE) | | 197 | | 648 | | — |
| | 22,919 |
| | — |
| | — |
| | 22,919 |
| | 22,919 |
| | — |
| | — |
| | 2018 |
| The Edge - Stadium Centre | | 111 | | 412 | | — |
| | 20,040 |
| | — |
| | — |
| | 20,040 |
| | 20,040 |
| | — |
| | 8,899 |
| | 2018 |
AMERICAN CAMPUS COMMUNITIES, INC. AND SUBSIDIARIES
AMERICAN CAMPUS COMMUNITIES OPERATING PARTNERSHIP, L.P. AND SUBSIDIARIES
NOTES TO CONSOLIDATED FINANCIAL STATEMENTS
|
| | | | | | | | | | | | | | | | | | | | | | | | | | | | | | | | | | | | | | |
| | | | | | | Initial Cost | | | | Total Costs | | | | | | |
| | | Units | | Beds | | Land | | Buildings and Improvements and Furniture, Fixtures and Equipment | | Costs
Capitalized
Subsequent to
Acquisition / Initial Development | | Land | | Buildings and
Improvements
and Furniture,
Fixtures and
Equipment | | Total (1) | | Accumulated Depreciation | | Encumbrances (2) | | Year Built (3) |
| Greek Leadership Village (ACE) | | 498 | | 957 | | $ | — |
| | $ | 30,889 |
| | $ | — |
| | $ | — |
| | $ | 30,889 |
| | $ | 30,889 |
| | $ | — |
| | $ | — |
| | 2018 |
| NAU Honors College (ACE) | | 318 | | 636 | | — |
| | 24,498 |
| | — |
| | — |
| | 24,498 |
| | 24,498 |
| | — |
| | — |
| | 2018 |
| U Club Townhomes at Oxford | | 132 | | 528 | | 5,115 |
| | 20,662 |
| | — |
| | 5,115 |
| | 20,662 |
| | 25,777 |
| | — |
| | — |
| | 2018 |
Hub Ann Arbor (10) | | 124 | | 310 | | 7,050 |
| | 26,498 |
| | — |
| | 7,050 |
| | 26,498 |
| | 33,548 |
| | — |
| | 13,971 |
| | 2018 |
Hub Flagstaff (10) | | 198 | | 591 | | 5,397 |
| | 30,330 |
| | — |
| | 5,397 |
| | 30,330 |
| | 35,727 |
| | — |
| | 16,997 |
| | 2018 |
Hub West Lafayette (10) | | 289 | | 599 | | 6,881 |
| | 22,661 |
| | — |
| | 6,881 |
| | 22,661 |
| | 29,542 |
| | — |
| | 11,912 |
| | 2018 |
| 191 College | | 127 | | 495 | | 5,434 |
| | 10,433 |
| | — |
| | 5,434 |
| | 10,433 |
| | 15,867 |
| | — |
| | — |
| | 2019 |
| Columbus Avenue Student Apts. (ACE) | | 214 | | 825 | | — |
| | 42,084 |
| | — |
| | — |
| | 42,084 |
| | 42,084 |
| | — |
| | — |
| | 2019 |
| University of Arizona Honors College (ACE) | | 319 | | 1,056 | | — |
| | 4,947 |
| | — |
| | — |
| | 4,947 |
| | 4,947 |
| | — |
| | — |
| | 2019 |
Undeveloped land parcels (11) | | — | | — | | 38,035 |
| | 318 |
| | — |
| | 38,035 |
| | 318 |
| | 38,353 |
| | 152 |
| | — |
| | N/A |
| Subtotal | | 32,522 | | 98,963 | | $ | 641,580 |
| | $ | 6,469,756 |
| | $ | 374,055 |
| | $ | 646,991 |
| | $ | 6,838,400 |
|
| $ | 7,485,391 |
|
| $ | 1,035,027 |
| | $ | 548,337 |
| | |
| | | | | | | | | | | | | | | | | | | | | | | |
| On-Campus Participating Properties | | | | |
| | |
| | |
| | |
| | |
| | |
| | |
| | |
| | |
| University Village – PVAMU | | 612 | | 1,920 | | $ | — |
| | $ | 36,506 |
| | $ | 7,858 |
| | $ | — |
| | $ | 44,364 |
| | $ | 44,364 |
| | $ | 32,663 |
| | $ | 14,636 |
| | 1997 |
| University Village - TAMIU | | 84 | | 250 | | — |
| | 5,844 |
| | 1,079 |
| | — |
| | 6,923 |
| | 6,923 |
| | 5,212 |
| | 2,239 |
| | 1997 |
| University College - PVAMU | | 756 | | 1,470 | | — |
| | 22,650 |
| | 5,152 |
| | — |
| | 27,802 |
| | 27,802 |
| | 17,916 |
| | 13,700 |
| | 2001 |
| Cullen Oaks Phase I and II | | 411 | | 879 | | — |
| | 33,910 |
| | 2,152 |
| | — |
| | 36,062 |
| | 36,062 |
| | 16,392 |
| | 27,537 |
| | 2003 |
| College Park | | 224 | | 567 | | — |
| | 43,634 |
| | 1,211 |
| | — |
| | 44,845 |
| | 44,845 |
| | 6,009 |
| | 42,239 |
| | 2014 |
| Subtotal | | 2,087 | | 5,086 | | $ | — |
| | $ | 142,544 |
| | $ | 17,452 |
| | $ | — |
| | $ | 159,996 |
| | $ | 159,996 |
| | $ | 78,192 |
| | $ | 100,351 |
| | |
| | |
| |
| |
|
| |
|
| |
|
| |
|
| |
|
| |
|
| |
|
| |
|
| | |
| Total | | 34,609 | | 104,049 | | $ | 641,580 |
| | $ | 6,612,300 |
| | $ | 391,507 |
| | $ | 646,991 |
| | $ | 6,998,396 |
| | $ | 7,645,387 |
| | $ | 1,113,219 |
| | $ | 648,688 |
| | |
| |
(1) | Total aggregate costs for federal income tax purposes is approximately $7.6 billion. |
| |
(2) | Total encumbrances exclude net unamortized debt premiums and deferred financing costs of approximately $19.0 million and $3.7 million, respectively, as of December 31, 2017. |
| |
(3) | For properties with multiple phases, the year built represents the weighted average year based on the number of beds delivered each year. |
| |
(4) | Consists of two phases that are counted separately in the property portfolio numbers contained in Note 1. |
| |
(5) | Consists of three phases that are counted separately in the property portfolio numbers contained in Note 1. |
| |
(6) | This property is currently in receivership and is in the process of being transferred to the lender in settlement of the property’s $27.4 million mortgage loan that matured in August 2017. |
| |
(7) | Initial costs represent construction costs incurred to date associated with the development of these properties. Year built represents the scheduled completion date. |
| |
(8) | The Company purchased 100% of the ownership interests in two properties as part of the Core Transaction (see Note 5). |
| |
(9) | As part of the Core Transaction, the Company purchased partial ownership in two operating properties through a joint venture arrangement (Core JV I). See Note 5. |
| |
(10) | As part of the Core Transaction, the Company purchased partial ownership in three in-process development properties through a joint venture arrangement (Core JV II). See Note 5. |
| |
(11) | Buildings and improvements and furniture, fixtures and equipment and accumulated depreciation amounts are related to buildings on one land parcel that will be demolished as part of development. |
AMERICAN CAMPUS COMMUNITIES, INC. AND SUBSIDIARIES
AMERICAN CAMPUS COMMUNITIES OPERATING PARTNERSHIP, L.P. AND SUBSIDIARIES
NOTES TO CONSOLIDATED FINANCIAL STATEMENTS
The changes in the Company’s investments in real estate and related accumulated depreciation for each of the years ended December 31, 2017, 2016 and 2015 are as follows:
|
| | | | | | | | | | | | | | | | | | | | | | | | |
| | | For the Year Ended December 31, |
| | | 2017 | | 2016 | | 2015 |
| | | Owned (1) | | On-Campus (2) | | Owned (1) (3) | | On-Campus (2) | | Owned (1) (4) | | On-Campus (2) |
| Investments in Real Estate: | | | | | | | | | | | | |
| Balance, beginning of year | | $ | 6,316,470 |
| | $ | 162,929 |
| | $ | 6,369,747 |
| | $ | 159,985 |
| | $ | 6,144,242 |
| | $ | 157,043 |
|
| Acquisition of land for development | | 24,049 |
| | — |
| | 6,338 |
| | — |
| | 39,583 |
| | — |
|
| Acquisition of properties | | 618,183 |
| | — |
| | 99,426 |
| | — |
| | 361,265 |
| | — |
|
| Improvements and development expenditures | | 621,793 |
| | 3,544 |
| | 522,723 |
| | 2,944 |
| | 306,659 |
| | 2,942 |
|
| Write off of fully depreciated or damaged assets | | (40,923 | ) | | (6,477 | ) | | (227 | ) | | — |
| | (1,240 | ) | | — |
|
| Provision for real estate impairment |
| (15,317 | ) | | — |
| | (4,895 | ) | | — |
| | — |
| | — |
|
Disposition of real estate (5) | | (38,864 | ) | | — |
| | (676,642 | ) | | — |
| | (480,762 | ) | | — |
|
| | |
| |
| | | | | | | | |
| Balance, end of year | | $ | 7,485,391 |
| | $ | 159,996 |
| | $ | 6,316,470 |
| | $ | 162,929 |
| | $ | 6,369,747 |
| | $ | 159,985 |
|
| | |
| |
| | | | | | | | |
| Accumulated Depreciation: | |
| |
| | | | | | | | |
| Balance, beginning of year | | $ | (864,106 | ) | | $ | (77,132 | ) | | $ | (792,122 | ) | | $ | (69,856 | ) | | $ | (704,521 | ) | | $ | (62,915 | ) |
| Depreciation for the year | | (213,660 | ) | | (7,536 | ) | | (197,105 | ) | | (7,276 | ) | | (191,661 | ) | | (6,941 | ) |
| Write off of fully depreciated or damaged assets | | 37,761 |
| | 6,476 |
| | 227 |
| | — |
| | 1,240 |
| | — |
|
| Disposition of properties |
| 4,978 |
| | — |
| | 124,894 |
| | — |
| | 102,820 |
| | — |
|
| | |
| |
| �� | | | | | | | |
| Balance, end of year | | $ | (1,035,027 | ) | | $ | (78,192 | ) | | $ | (864,106 | ) | | $ | (77,132 | ) | | $ | (792,122 | ) | | $ | (69,856 | ) |
| |
(1) | Includes owned off-campus properties and owned on-campus properties. |
| |
(2) | Includes on-campus participating properties. |
| |
(3) | The investments in real estate and accumulated depreciation balances include The Province-Dayton which is classified as an owned property held for sale in the accompanying consolidated balance sheets as of December 31, 2016. |
| |
(4) | The investments in real estate and accumulated depreciation balances include The Edge - Orlando and University Village Sacramento which were classified as owned properties held for sale as of December 31, 2015. |
| |
(5) | Includes the conveyance of land, originally purchased by the Company, to the University of Arizona. Concurrent with the land conveyance, the Company as lessee entered into a ground lease agreement with the University. |