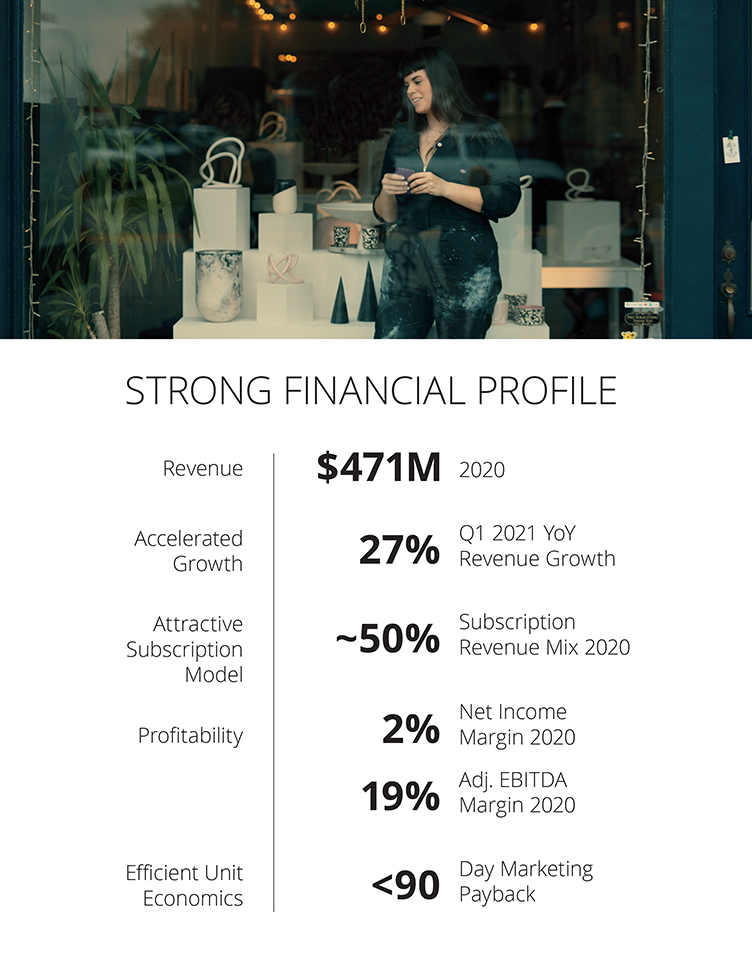
strategy and strong competitive position to acquire new customers efficiently. Over the past several years, we have generated a lifetime value in excess of customer acquisition costs within the first 90 days of establishing a customer relationship in the United States.
Attractive subscription model. The sizeable and growing subscription portion of our business gives us highly recurring revenue. At March 31, 2021, over 85% of our subscription units were on annual terms billed at the start of the term. Additionally, in 2020 and the three months ended March 31, 2021, our average revenue per subscription unit, or ARPU, was $223 and $226, respectively.
Ability to drive additional purchases and cross-sell customers. Given the trusted relationship we establish with customers at time of business formation, we are able to develop ongoing relationships which allows us to sell them additional products and services over time. During 2020 and the three months ended March 31, 2021, over 60% of our small business customers purchased one year of one of our subscription services at the time of their initial formation purchase, and over half of our small business customers purchased at least one third-party solution at time of business formation. In addition, our ongoing customer engagement drives repeat purchase behavior. For example, in 2020, 27% of our transaction customers had also transacted with us in a prior year.
Strong margins. Our technology-enabled platform with a largely variable cost structure yields efficient unit economics. In addition, our subscription services have a higher gross margin than our transaction products, and as they have become an increasing percentage of our revenue mix over the years, overall gross margin has increased. Given these dynamics, we have been able to drive consistently high Adjusted EBITDA margins. Our net income (loss) was $7.4 million, $9.9 million, $(4.9) million and $(9.8) million for 2019, 2020, and for the three months ended March 31, 2020 and 2021, respectively. Our net income (loss) margin was 1.8%, 2.1%, (4.6)% and (7.3)% for 2019, 2020, and for the three months ended March 31, 2020 and 2021, respectively. While our Adjusted EBITDA decreased from $97.2 million in 2019 to $88.0 million in 2020, and from $13.4 million to $3.6 million in the three months ended March 31, 2020 and 2021, respectively, as we invested further in marketing spend to expand our customer base and build on our digital brand leadership, we generated Adjusted EBITDA margins of 23.8%, 18.7%, 12.6% and 2.7%, respectively.
High cash flow generation. As a result of our operating efficiencies, we have been able to generate significant cash flow. In addition to our profitability, we generally receive customer payments for our transaction and subscription services prior to rendering services, driving favorable working capital dynamics. Coupled with our cash generation, we are not highly capital intensive. For the year ended December 31, 2020 and for the three months ended March 31, 2020 and 2021, our capital expenditures for the purchase of property and equipment, including capitalization of internal-use software, averaged approximately 3.4%, 1.9% and 2.0% of total revenue, respectively. As a result of these dynamics, we generated net cash from operating activities of $52.7 million, $93.0 million, $21.9 million and $31.4 million in 2019, 2020 and the three months ended March 31, 2020 and 2021, respectively, and free cash flow of $34.3 million, $82.5 million, $19.9 million and $28.5 million in 2019, 2020 and the three months ended March 31, 2020 and 2021, respectively.
Key Business Metrics
In addition to the measures presented in our consolidated financial statements, we regularly monitor the following financial and operating metrics to evaluate the growth of our business, measure the effectiveness of our marketing efforts, identify trends, formulate financial forecasts and make strategic decisions.
Number of business formations
We define the number of business formations in a given period as the number of global LLC, incorporation, not-for-profit and other formation orders placed on our platform in such period. We consider the number of business formations to be an important metric considering that it is typically the first product or service small business customers purchase on our platform, creating the foundation for additional products and subsequent subscription and partner revenue as they adopt additional products and services throughout their business lifecycles.
74