Pension Termination. Pension termination costs were $6.6 million in the year ended December 31, 2019, as a result of the Company successfully terminating its pension plans during the period. See Note 13 for additional information on the termination of the pension plans.
Income Tax Expense. Our effective combined federal and state tax rate for 2019 was 21.5% compared to 21.3% for 2018. The effective tax rate for the year ended December 31, 2019 is slightly higher than 2018 primarily due to a decrease in the release of reserves for uncertain tax positions of $0.5 million; $0.8 million in the year ended December 31, 2019 versus $1.3 million in the year ended December 31, 2018. The Company also made a voluntary pension funding payment in the year ended December 31, 2018 of $7.0 million which was deducted in the Company’s tax returns for the year ended December 31, 2017 reducing taxable income for that period. The increased pension funding deduction resulted in a tax benefit of $0.7 million, also decreasing the tax rate for the year ended December 31, 2018. The increase in effective tax rate was partially offset by decreases in the rate related to state rate changes driven by legislative changes in tax laws in one of the states in which we operate, and a benefit related to the increase in officer life insurance as a result of market performance.
Deferred income taxes reflect the net tax effects of temporary differences between the carrying amounts of assets and liabilities for financial reporting purposes and the amounts used for income tax purposes. The largest item affecting the deferred taxes is the difference between book and tax amortization of goodwill and other intangible amortization.
Net Income. Net income for the year ended December 31, 2019 was $49.2 million compared to net income of $43.9 million for 2018, an increase of $5.3 million. This increase was driven by the factors described above.
Year Ended December 31, 2018 Compared to Year Ended December 31, 2017
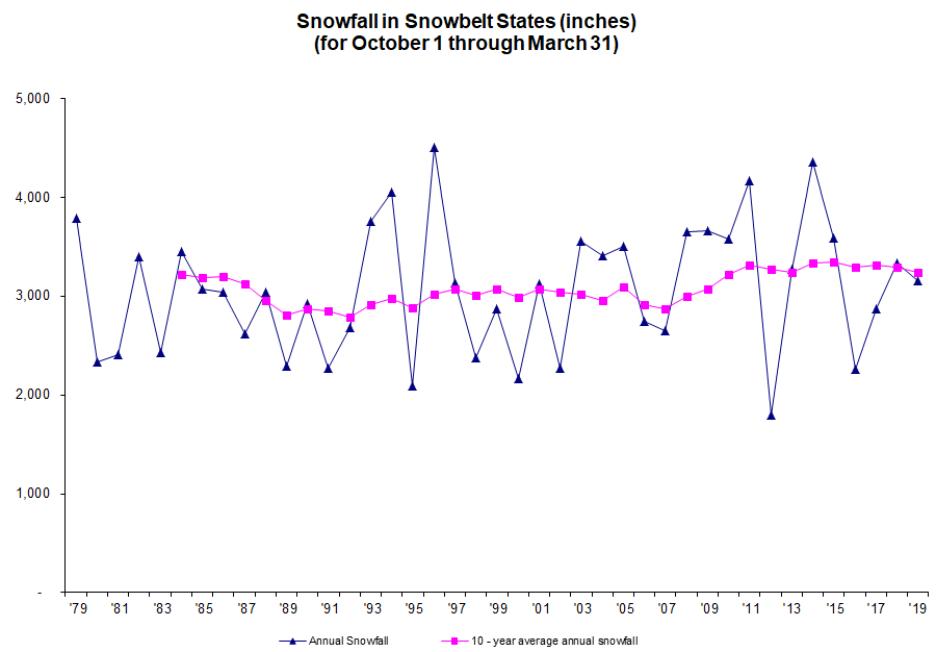
Net Sales. Net sales were $524.1 million for the year ended December 31, 2018 compared to $474.9 million in 2017, an increase of $49.2 million, or 10.4%. Net sales increased for the year ended December 31, 2018 primarily due to snowfall levels near historical averages in the snow season ended March 31, 2018, an increase compared to below average snowfall levels during the prior snow season. Additionally, the increase in sales was due to increased volume at our Work Truck Solutions segment and higher pricing across both segments. This increase was partially offset by chassis supply availability issues in both segments. See below for a discussion of net sales for each of our segments.
Net sales at our Work Truck Attachment segment were $275.2 million for the year ended December 31, 2018 compared to $238.9 million in the year ended December 31, 2017, an increase of $36.3 million primarily due to higher levels of snowfall in the snow season ended March 31, 2018 compared to the snow season ended March 31, 2017. Snowfall during the snow season ended March 31, 2018 were near historical averages, an increase compared to the snow season ended March 31, 2017, which saw below average snowfall levels.
Net sales at our Work Truck Solutions segment were $248.8 million for the year ended December 31, 2018 compared to $236.0 million in the year ended December 31, 2017, an increase of $12.8 million due primarily to increased demand from generally favorable macro-economic conditions and the inclusion of incremental sales from additional facilities of $5.3 million in the year ended December 31, 2018 versus 2017. Strong sales for work truck upfits were slightly offset by sales decreases in our municipal products, due to ongoing chassis supply availability issues.
Cost of Sales. Cost of sales was $369.2 million for the year ended December 31, 2018 compared to $331.8 million in 2017, an increase of $37.4 million, or 11.3%. Cost of sales as a percentage of net sales increased from 69.9% for the year ended December 31, 2017 to 70.4% for the year ended December 31, 2018. The increase in cost of sales in the year ended December 31, 2018 when compared to the year ended December 31, 2017 was primarily due to higher cost of sales as a percentage of sales for Work Truck Solutions products, growth in lower margin product lines, and inflation.
Gross Profit. Gross profit was $154.9 million for the year ended December 31, 2018 compared to $143.1 million in 2017, an increase of $11.8 million, or 8.2%, due to the increase in net sales described above under “—Net Sales.” As a percentage of net sales, gross profit decreased from 30.1% for the year ended December 31,