UNITED STATES
SECURITIES AND EXCHANGE COMMISSION
WASHINGTON, D. C. 20549
FORM 10-K
| x | ANNUAL REPORT PURSUANT TO SECTION 13 OR 15(d) OF THE SECURITIES EXCHANGE ACT OF 1934 |
For the Fiscal Year Ended: December 31, 2012
OR
| ¨ | TRANSITION REPORT PURSUANT TO SECTION 13 OR 15(d) OF THE SECURITIES EXCHANGE ACT OF 1934 |
Commission File Number: 001-35450
DEMANDWARE, INC.
(Exact name of registrant as specified in its charter)
| | |
| Delaware | | 20-0982939 |
(State or other jurisdiction of incorporation or organization) | | (I.R.S. Employer Identification No.) |
| |
| 5 Wall Street, Burlington, MA | | 01803 |
| (Address of principal executive offices) | | (Zip Code) |
Registrant’s telephone number, including area code: (888) 553-9216
Securities Registered pursuant to Section 12(b) of the Act:
| | |
Title of each class | | Name of each exchange on which registered |
| Common Stock, $0.01 par value per share | | The New York Stock Exchange (NYSE) |
Securities registered pursuant to Section 12(g) of the Act: None
Indicate by check mark if the Registrant is a well-known seasoned issuer, as defined in Rule 405 of the Securities Act: Yes ¨ No x
Indicate by check mark if the Registrant is not required to file reports pursuant to Section 13 or Section 15(d) of the Act: Yes ¨ No x
Indicate by check mark whether the Registrant (1) has filed all reports required to be filed by Section 13 or 15(d) of the Securities Exchange Act of 1934 during the preceding 12 months (or for such shorter period that the Registrant was required to file such reports), and (2) has been subject to such filing requirements for the past 90 days. Yes x No ¨
Indicate by check mark whether the registrant has submitted electronically and posted on its corporate Web site, if any, every Interactive Data File required to be submitted and posted pursuant to Rule 405 of Regulation S-T (§ 229.405 of this chapter) during the preceding 12 months (or for such shorter period that the registrant was required to submit and post such files). Yes x No ¨
Indicate by check mark if disclosure of delinquent filers pursuant to Item 405 of Regulation S-K is not contained herein, and will not be contained, to the best of Registrant’s knowledge, in definitive proxy or information statements incorporated by reference in Part III of this Form 10-K, or any amendment to this Form 10-K. x
Indicate by check mark whether the registrant is a large accelerated filer, an accelerated filer, a non-accelerated filer or a smaller reporting company. See the definitions of “large accelerated filer,” “accelerated filer” and “smaller reporting company” in Rule 12b-2 of the Exchange Act.
| | | | | | |
| Large accelerated filer | | ¨ | | Accelerated filer | | ¨ |
| | | |
| Non-accelerated filer | | x (Do not check if a smaller reporting company) | | Smaller reporting company | | ¨ |
Indicate by check mark whether the registrant is a shell company (as defined in Rule 12b-2 of the Exchange Act). Yes ¨ No x
As of June 30, 2012, the aggregate market value of the Registrant’s voting common stock held by non-affiliates of the Registrant was approximately $216 million (based on the last reported sale price of the Registrant’s common stock at the close of business on June 29, 2012).
The number of shares outstanding of the Registrant’s Common Stock as of March 5, 2013 was 30,050,142 shares.
Documents Incorporated by Reference
Portions of the Registrant’s definitive proxy statement for its annual meeting of stockholders, which the Registrant intends to file pursuant to Regulation 14A with the Securities and Exchange Commission not later than 120 days after the Registrant’s fiscal year end of December 31, 2012, are incorporated by reference into Part III of this Form 10-K.
DEMANDWARE, INC.
2012 FORM 10-K ANNUAL REPORT
TABLE OF CONTENTS
2
PART I
SPECIAL NOTE REGARDING FORWARD-LOOKING STATEMENTS
This Annual Report on Form 10-K contains forward-looking statements within the meaning of Section 27A of the Securities Act of 1933, as amended, and Section 21E of the Securities Exchange Act of 1934, as amended, or the Exchange Act. All statements other than statements relating to historical matters should be considered forward-looking statements. In addition, forward-looking statements may consist of statements including such words as “may,” “believe,” “could,” “anticipate,” “would,” “might,” “plan,” “expect,” and similar expressions or the negative of such terms or other comparable terminology. These forward-looking statements speak only as of the date of this Form 10-K and are subject to business and economic risks. These statements are not guarantees of future performance and involve certain risks, uncertainties, and assumptions that are difficult to predict, and you should not place undue reliance on our forward-looking statements. Our actual results could differ materially from those set forth in the forward-looking statements as a result of a number of important factors, including the factors set forth in Part I, Item 1A, “Risk Factors,” and elsewhere in this Form 10-K and in our other reports filed with the Securities and Exchange Commission, or SEC. We expressly disclaim any obligation to update the forward-looking statements to reflect events or circumstances that arise after the date hereof.
Overview
We are a leading provider of cloud-based digital commerce solutions for retailers and branded manufacturers. Our platform, Demandware Commerce, enables customers to establish and execute complex digital commerce strategies that include global expansion, multi-brand rollouts and omni-channel operations. We enable companies to easily design, implement and manage their own customized digital commerce sites, including websites, mobile applications and other digital storefronts. Through our highly scalable and open Demandware Commerce platform, our customers create seamless brand experiences to reach their consumers across all digital touch points globally. By simplifying access to the complex digital commerce functionality required for effective and engaging consumer experiences and by offering open commerce application program interfaces, or APIs, we provide our customers with increased control to more easily launch, manage and integrate multiple digital commerce sites across geographies and brands, initiate marketing campaigns more quickly, manage product merchandising as well as create highly customized consumer experiences, all of which can lead to increased revenue. As a result, our customers on average have grown their e-commerce, or digital commerce, revenue faster than e-commerce industry benchmarks calculated by ComScore and the U.S. Department of Commerce.
Our cloud-based infrastructure increases processing capacity of our customers’ digital commerce sites to meet surges in demand, minimize page load times and maximize uptime. Our cloud-based platform also offers the high reliability and security required by customers to implement their digital commerce strategies, and we have achieved 99.98% average site availability (excluding planned downtime) since 2005. Through our cloud platform, our customers run the latest version of our software and have access to a steady stream of new and innovative digital commerce functionality as soon as it becomes available.
By using our cloud platform, our customers avoid the need for a large upfront investment in on-premise hardware infrastructure and in customized software that is difficult and expensive to implement, upgrade and maintain. They also avoid the limitations of generic vendor-created digital commerce solutions that typically do not offer the flexibility and functionality necessary for brands and retailers to create, manage and control their own customized online brand presence. Through our cloud-based, multi-tenant delivery model, we combine the functionality, flexibility and customization capabilities of in-house solutions with the lower costs, speed of implementation and other operational benefits of outsourcing.
We have built a marketplace called Demandware LINK that leverages our open development platform to allow our customers to quickly and easily access an extensive library of integrations to third-party applications that can reduce the cost and complexity of adding capabilities, such as campaign management, order management, social commerce and ratings and reviews.
3
Our customers include multinational corporations, large retailers and branded manufacturers, such as adidas, Bestseller, Carter’s, Deckers, Guthy-Renker, House of Fraser, Jewelry Television, L’Oreal, mothercare, s. Oliver, and Tory Burch. We sell our solutions domestically and internationally through both direct and indirect channels. We have direct sales teams throughout North America and Europe and distributor relationships with full service digital commerce vendors that combine our Demandware Commerce platform with a host of complementary services and technologies, such as logistics and warehousing, to provide comprehensive end-to-end e-commerce, or digital commerce, solutions. See Note 2 to the consolidated financial statements included elsewhere in this Form 10-K for information on our operations in different geographic regions.
We have structured our contracts to align our interests with those of our customers by participating in a share of their gross revenue processed on our platform. We derive our subscription revenue from fees paid to us by our customers for their access to Demandware Commerce for a specified period of time. Our fees are based on a percentage of the total gross revenue our customers process through their digital commerce sites operating on our platform, and include a committed level of annual gross revenue from which a minimum subscription fee is derived. If a customer exceeds that baseline subscription amount, we are paid a percentage of the gross revenue processed by that customer on our platform in excess of its committed minimum subscription. Our customer contract terms average approximately three years and range up to seven years.
Since our inception, we have expanded our offerings and customer base through organic growth. The following chart shows the aggregate number of customers using Demandware Commerce and the aggregate number of their digital commerce sites operating on our platform from March 31, 2010 to December 31, 2012.
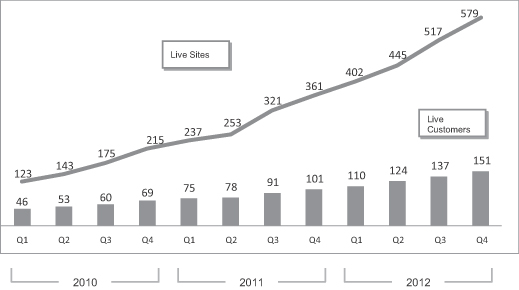
We generated revenue of $36.7 million, $56.5 million and $79.5 million in 2010, 2011 and 2012, respectively. We had net income of $0.3 million in 2010 and net losses of $1.4 million and $8.1 million in 2011 and 2012, respectively.
Industry Overview
Digital Commerce is a Key Driver of Growth for the Retail Industry
We believe our total addressable market is at the center of three large and growing sectors: retail, digital commerce and cloud computing. The double-digit growth of the e-commerce, or the digital commerce, market is being driven by several factors, including widespread broadband internet connectivity across an increasing
4
number of devices including smart phones and tablets, growing consumer familiarity and comfort with and preference for online shopping and new online shopping models such as social networks, group buying and flash sales. The recent proliferation of the smartphone and broad market acceptance of the tablet has helped accelerate the growth of digital commerce as the mobile channel has become a more conventional mode of shopping.
The increase in the number of manufacturers seeking to market their brands directly to consumers through their own digital commerce sites has also been a major contributor to this growth. In addition, traditional retailers are facing increasing competition from online marketplaces and as a result are focusing on the strategic direction of the digital channel as a more strategic growth vehicle.
Increasing Complexity of Digital Commerce
While the digital commerce market is expanding, it is also becoming more complex, particularly for global multi-channel retailers and branded consumer product manufacturers trying to reach consumers with consistent storefronts across multiple channels, geographies and digital touch points. Several trends are driving this increased complexity:
| | • | | Rapid Pace of Innovation. Technology to facilitate digital commerce is rapidly evolving. For example, new internet-enabled devices are continually developed, updated and made available to consumers at low cost. As the switching costs for consumers adopting the newest technologies remain low and new shopping models evolve, the pressure for companies to keep up with the pace of innovation increases. Companies must invest in and implement new innovative technologies quickly and cost-effectively to be able to reach consumers through new devices or channels, or risk losing them. |
| | • | | Need to Maintain Scale and Global Presence. Companies that are unable to maintain the quality and functionality of their digital commerce sites as they grow risk losing both existing and prospective consumers. Significant infrastructure can be required to provide a reliable online presence that can be quickly and easily scaled to meet growing worldwide consumer demands. |
| | • | | Increasing Consumer Demand for Compelling Content and Commerce. As the speed, functionality and sophistication of internet applications continue to improve, consumers increasingly expect a rich, interactive and personalized digital commerce experience, with features such as active merchandising, social commerce and dynamic product imaging. In order for businesses to remain competitive, they must be able to dynamically update and personalize their product offerings to stay current with emerging consumer trends and rising consumer expectations. |
| | • | | Proliferation of Retail Channels. Digital commerce is expanding beyond traditional web storefronts viewed on a personal computer or lap top due to the rapid proliferation of internet-enabled devices, including smart phones, tablets, endless aisle applications, and other devices, allowing consumers to access information and shop through an increasing number of digital retail channels. Consumers increasingly expect a consistent, high-quality and relevant experience across all digital retail channels. |
| | • | | Integration of Systems and Business Processes. Businesses have dramatically recast their online presence from static digital commerce sites focused mainly on presentation of basic product information or simple purchasing to dynamic, interactive hubs for consumer marketing, transactions, communications and services. Businesses require robust, scalable and global digital commerce solutions that can integrate with other enterprise solutions, such as enterprise resource planning, or ERP, customer relationship management, order management, call centers, supply chain management and business intelligence systems. |
5
Limitations of Traditional Digital Commerce Solutions
Traditionally, there have been two common solutions for the creation and management of a digital commerce business: on-premise enterprise software, which is built, customized and maintained by the merchant itself, and outsourcing, where the digital commerce platform for a retailer or branded manufacturer is outsourced to a third-party provider. While traditional on-premise enterprise software solutions offer the benefits of in-house control and differentiation through custom development, they typically have the following disadvantages:
| | • | | Higher Upfront Cost. On-premise software implementations are typically architected to be deployed with large information technology, or IT, teams and require significant upfront investments. These solutions can be ineffective for today’s retailers and branded consumer product manufacturers, who prefer to focus on their core competencies, such as managing their brands and merchandising their products, rather than maintaining IT infrastructure and digital commerce performance. |
| | • | | Difficult to Maintain, Upgrade and Scale. Maintenance of traditional on-premise solutions requires ongoing software implementations and on-premise customizations that necessitate significant IT investment before, during and after the upgrade. These internal customizations make it time-consuming and expensive to enhance functionality and also make it difficult for retailers and branded manufacturers to easily upgrade to the newest release from a software provider. It is also challenging and expensive to scale the required infrastructure, particularly to meet surges in demand. |
While outsourcing a digital commerce operation offers the benefits of minimal required resources for internal infrastructure management and ongoing support, it has the following disadvantages:
| | • | | Limited Customization and Functionality. Vendor-created outsourced solutions offer limited platform flexibility, making it difficult to change functionality or to control merchandising. This can be unacceptable for retailers and branded manufacturers, who prefer to proactively manage and control their online brand presence given the critical nature of brand as a key differentiator in today’s retail environment. |
| | • | | Lack of Integration with Business Processes. The online presence of many retailers and branded manufacturers has evolved from a simple website to a cross-channel hub for marketing, transactions, communications and services. The lack of innovation and extendibility of a fully outsourced solution, in addition to the lack of integration with business processes, can limit a retailer’s or branded manufacturer’s ability to effectively manage their brands across multiple channels. |
Opportunity for Cloud-based Digital Commerce Solutions
A cloud delivery model combines the lower costs, speed of implementation and other operational benefits of outsourcing with the functionality, flexibility and customization capabilities of on-premise enterprise software solutions. As a result, the adoption of cloud-based solutions across industries including salesforce management, ERP, human resource management, and marketing solutions, has grown significantly and outpaced the growth of traditional on-premise enterprise software product delivery.
Digital commerce is a critical component of growth strategies for a significant number of branded consumer product manufacturers and retailers worldwide. In the digital commerce market, we believe there is a significant opportunity for a company that can offer a comprehensive cloud-based solution designed to address the increasingly complex requirements of retailers and brands seeking to attract and satisfy consumers in the digital world.
Our Solution
Demandware Commerce combines enterprise-class digital commerce capabilities and functionality with a cloud-based multi-tenant delivery model. We deliver our solutions on-demand to enable our customers to more easily launch, manage and integrate multiple digital commerce sites across brands and geographies, initiate
6
marketing campaigns more quickly, manage product merchandising and create highly customized consumer experiences, all of which can lead to increased revenue. We believe that our cloud-based solutions provide the following benefits to our customers:
| | • | | Broad Marketing and Merchandising Functionality. Our platform uses a web-based interface to provide one central location for our customers to control and manage their digital commerce operation – from products to pricing to placement to content. A robust set of sophisticated, yet easy-to-use marketing and merchandising tools, including catalog management, customer profiling, pricing, promotions and digital commerce search, provides customers with enhanced functionality and increased control to help optimize the efficiency, growth and profitability of their digital commerce business. Our solutions are able to easily categorize, price, and display products, while efficiently presenting multiple cross-channel promotions, enabling merchandisers to optimize the digital shopping experience of their consumers while driving greater revenue. Our functionality also helps retailers and brands strengthen consumer loyalty by delivering tailored user experiences across all digital channels. |
| | • | | High Reliability and Security. We provide high uptime, robust security and disaster recovery through our network of state-of-the-art data centers. We have provided 99.98% average availability (excluding planned downtime) since 2005. Our flexible cloud platform allows us to quickly and seamlessly increase the processing capacity of our customers’ digital commerce sites to meet surges in demand. We also provide 24/7 monitoring of the environment in which our customers’ digital commerce sites operate, measuring for performance and availability of content delivery. Our platform is supported by a dynamic cloud-based architecture and complies with the Payment Card Industry, or PCI, Security Standards, which is generally referred to as being PCI-compliant. Our platform has been benchmarked to handle at least 1,400 dynamic page views per second. |
| | • | | Ease of Deployment and Reduced Time To Market. Using our Demandware Commerce platform, customers can easily deploy new digital commerce sites without the need to install or integrate their own hardware and software infrastructure. In addition, customers can leverage our platform to quickly and easily add new sites without the need to expand their own infrastructure. Through Demandware LINK, our customers can access an extensive library of integrations to third-party applications to expand the capabilities and functionality of their digital commerce operation. These features enable our existing customers to accelerate their time-to-market for new sites, quickly implement new functionality and explore emerging technologies. In addition, we believe that our typical six month platform implementation cycle for new customers is shorter than the period generally required for the development and deployment of comparable on-premise digital commerce software solutions. |
| | • | | Customizable Digital Commerce Sites. Demandware Commerce allows our customers to quickly and easily customize and deliver highly flexible digital storefronts, using our powerful and intuitive tools based on procedural programming languages such as JavaScript. This gives our customers the flexibility and control of a custom development environment with the convenience, scalability and security of on-demand, multi-tenant delivery. Our open development environment allows our customers’ developers to customize the front-end of their digital commerce sites while sharing our multi-tenant on-demand merchandising platform. As a result, developers and IT professionals can focus their efforts and resources on innovation rather than infrastructure. |
| | • | | Continual Innovation. Consumers increasingly expect greater functionality and relevance from their online experience. Through our cloud-based platform, we are able to provide a steady stream of new and innovative digital commerce functionality through multiple product upgrades each year, which provides our customers with access to the latest technologies for their digital commerce business. Our customization and integration changes are implemented through automatic upgrades with minimal or no effort required by our customers so they can avoid the time and expense associated with repeatedly upgrading to new versions with traditional providers. When we enhance our enterprise-class platform, our entire customer community benefits from our latest innovations by being on the same release cycle. In addition to our internal product development work, we work collaboratively with our customers on an ongoing basis to enhance and improve our solutions based on their specific functional requests. |
7
| | • | | Lower Total Cost of Ownership. With our transparent pricing model and our cloud-based platform, retailers and branded manufactures benefit from a lower total cost of ownership compared to traditional on-premise software license models. With on-premise licenses models, retailers and branded manufacturers incur costs and require investments for software licenses, annual maintenance and upgrades, hardware, hosting, redundancy and security. We provide customers with a transparent pricing model that is directly aligned with the growth of their digital commerce business. |
Our Strategy
Our mission is to extend our position as a leading provider of cloud-based solutions to become the global backbone for digital commerce between retailers and branded consumer product manufacturers and their consumers. Key elements of our strategy include:
Retaining and Expanding Business with Existing Customers. As our solutions become increasingly integral to our customers’ digital commerce success, we expect to maintain our strong retention rates by providing our customers with high levels of service and support as well as new digital commerce solutions and enhanced functionality. We have structured our contracts to align our interests with those of our customers by participating in a share of our customers’ gross revenue processed on our platform. We believe we have the following opportunities to grow our business with our customers:
| | • | | Increasing Customers’ Gross Revenue. Because we share in the gross revenue processed by customers on our platform, we also share an interest in optimizing the effectiveness, engagement and performance of our customers’ digital commerce sites. Early in the site implementation process, we assign a digital commerce strategist to engage with our customers to enable them to meet their goals. Once our customers’ sites are operating on our platform, the assigned strategist works hand-in-hand with our customers’ digital commerce teams to help grow their revenue by taking full advantage of the functionality of Demandware Commerce. |
| | • | | Increasing the Number of Customers’ Digital Commerce Sites. We intend to expand the adoption of Demandware Commerce within our existing customers’ organizations. After initial deployments, many of our customers seek to expand their digital commerce presence by launching additional distinct revenue-generating sites for different geographies, brands and channels on our Demandware Commerce platform. Our single instance code base allows our customers to launch sites for multiple brands and in multiple geographies cost-effectively and with minimal involvement from their internal IT staff. |
| | • | | Extending the Platform Across Channels. The internet is a central hub for our customers’ digital commerce strategies. We have and will continue to extend Demandware Commerce to support multiple channels to reach more consumers, including smart phones, tablets, social networks, and in-store solutions. A significant part of our strategy includes keeping up-to-date on emerging trends in how consumers shop and making sure we have the functionality on our platform to enable that type of activity. |
Growing Our Customer Base. A significant element of our strategy involves winning new customers. We believe that managing a successful digital commerce operation is more demanding and complex than ever and companies will increasingly migrate to cloud-based solutions like ours. We believe the continued growth of digital commerce as a strategic and differentiated sales channel provides us with a significant opportunity to acquire new customers by:
| | • | | Investing in Direct Sales. A significant portion of our market includes companies that are currently using on-premise or outsourced platforms for digital commerce that were not designed for advanced merchandising, marketing and customer experience innovation and that do not offer the benefits of a cloud-based solution. There are also companies that have an online presence but do not facilitate digital commerce transactions. As a result, we plan to grow our direct sales team to win more of these customers in the United States and internationally. |
| | • | | Enhancing Brand Awareness. We are investing in marketing and building brand awareness of our cloud-based solutions, particularly in Europe and with large enterprise accounts. |
8
| | • | | Significantly Growing our European Operations. We believe a substantial opportunity exists to continue to grow sales of our solutions internationally, particularly in Europe. We intend to continue to grow our European operations by further investing in direct sales, strategic alliances, services and support in the region. |
| | • | | Expanding and Strengthening Our Strategic Alliances. We have strategic relationships with companies such as eCommera, NETRADA and PFSweb that provide full-service end-to-end digital commerce solutions by combining our Demandware Commerce platform with a host of complementary services and technologies, such as logistics and warehousing. We intend to continue to grow our distribution channels through these key alliances, as well as build new alliances. |
Targeting New Markets. We believe substantial demand for our solutions exists in industry sectors, customer segments and geographic regions beyond those on which we are currently focused, including:
| | • | | Large Enterprise Accounts. We are targeting strategic large enterprise accounts processing more than $150 million in gross merchandise value through the digital channel. Traditionally these large customers have utilized on-premise software solutions or highly customized, internally developed solutions, but we believe there is a significant opportunity to expand our cloud based solution into this market segment. |
| | • | | Asia Pacific. We are currently assisting customers to launch and manage digital commerce sites for their consumers in the Asia Pacific region. Our solution enables customers to create locally branded digital commerce sites that reach consumers in the various Asia Pacific markets. We have extended our Demandware Commerce platform to optimize the content and application delivery in Asia Pacific markets. We are also building our sales and service operations in the Asia Pacific region and we plan to expand our strategic alliances in that region. |
Continuing to Innovate, Add New Functionality and Extend Our Platform. We believe we have developed a deep understanding of the digital commerce challenges faced by our customers. We continually collaborate with our customers to build extensive product functionality that addresses the rapidly changing digital commerce environment, including technology requirements, shifts in consumer preferences, changes in social networks, the introduction of new channels as well as the convergence of in-store and online shopping. We plan to use our expertise in digital commerce to develop new applications, features and functionality that will enhance our solutions and expand our addressable market. We also are currently working on solutions to extend the Demandware Commerce platform to include in-store solutions. We also plan to add incremental functionality to our solutions opportunistically through acquisitions. We intend to invest in our Demandware LINK technology program by adding new partners and expanding our relationship with current partners so that our customers have access to a growing library of integrations to third-party applications.
Products and Services
Demandware Commerce Platform
We offer a comprehensive cloud-based, digital commerce platform, a network of alliance partners that extends the value of the platform, and a business model designed for sustained customer revenue growth. We deliver our solutions on-demand to our customers who can access and can manage their digital commerce businesses over the internet using a standard web browser. We have built our solutions using a single code base and a multi-tenant, multi-user architecture that we host.
9
The following diagram illustrates the key interactive channels and various components of our Demandware Commerce platform:
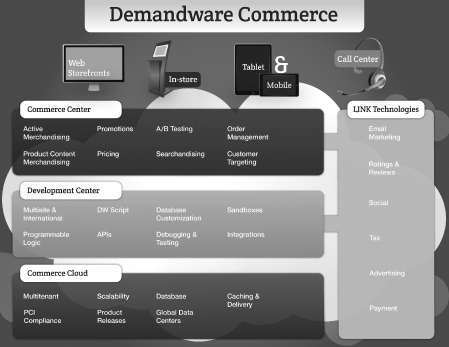
Omni-channel Consumer Experiences. Demandware Commerce provides a single platform that our customers can use to manage consumer interactions across all digital touch points worldwide, enabling a seamless and consistent brand experience on any channel. Our reference applications are based on digital commerce best practices and can be customized to individual needs, with full access to a sophisticated omni-channel marketing and merchandising engine and open development environment. By leveraging the power of the Demandware Commerce platform, customers can create omni-channel consumer experiences that include:
| | • | | Web Storefronts. With Demandware Commerce, a customer can build a new web storefront front from scratch or leverage our pre-built storefront, called Site Genesis, to gain quicker time to market. The Site Genesis storefront provides merchandisers with best practice examples of how to manage promotions, dynamic search tools, synonym dictionaries and price books. It also includes a multi-site blueprint for technical architects. The Site Genesis storefront can be used as is with out-of-the-box functionality or can be leveraged as a starting point for a digital commerce site that could then be further customized using the UX Studio application to meet a customer’s unique requirements. |
| | • | | In-store. Our customers can create in-store consumer experiences on the Demandware Commerce platform. Our customers are using Demandware Commerce to extend their in-store inventory to capture sales that may otherwise have been lost by developing endless aisle applications. Through our intuitive web interface, customers can create compelling consumer experiences such as mobile point of sale (mPOS), kiosks, and endless aisle applications. Our customers can also create more compelling, personalized in-store consumer experiences by leveraging the consumer information that is collected across other digital channels on the Demandware Commerce platform. |
| | • | | Mobile & Tablet. Customers can build compelling shopping experiences for consumers on all mobile devices including smartphones and tablets. Our Demandware Commerce platform provides a unified development environment between the mobile storefront and our customers’ other digital commerce sites for ease of customization and site management. We recently introduced Responsive Web Design into the platform which allows for dynamic formatting of consumer experiences for various devices, including desktop computer, tablets and smartphones. The Demandware Commerce platform creates |
10
| | mobile experiences in all major browsers and with popular smart phones, such as the iPhone, Android and BlackBerry and tablets including iPad, Galaxy and Chrome-based tablets. |
| | • | | Call Center. By using Demandware Commerce to facilitate consumer experiences in the call center, our customers’ call center agents can quickly access order, consumer and product information through a single web-based interface, enabling a more efficient and engaging experience for the consumer. Agents are able to easily search for products using advanced search techniques and guided navigation. In addition to providing improved customer service, agents can use this software to gain a single view into a consumer’s entire order history and recommend products using rules established by our merchandising tools. |
Demandware Commerce Center. Demandware Commerce Center is a centralized and unified application for control and management of all consumer digital commerce experiences across multiple geographies, branded sites and channels. Unlike traditional work environments that require multiple interfaces to manage processes across products, marketing, merchandising, consumers, orders and sites, Demandware Commerce Center provides one central access point. In addition, users are able to create customized dashboards to display the most commonly used activities and thus increase their efficiency and enhance their ability to manage and change consumer experiences.
Our sophisticated, yet easy-to-use marketing and merchandising capabilities enable retailers to deliver tailored user experiences across all digital channels, launch and manage multiple sites across geographies and brands, initiate marketing campaigns more quickly, manage product merchandising, improve site traffic and increase revenue. Our capabilities include the following:
| | • | | Active Merchandising, which is a metrics-driven online selling engine that controls merchandising interactions across search, personalization, analytics, promotions and catalog according to rules created by each of our customers. |
| | • | | Product Content Merchandising, which enables merchants to manage seasonal, branded and future product offerings across categories, catalogs and sites. |
| | • | | Promotions, which consists of multiple configuration options for creating and controlling product promotions, including over 50 commonly used promotions that can be combined for desired results. |
| | • | | Pricing, which consists of a flexible pricing model that allows the merchant to control pricing across multiple catalogs and sites. |
| | • | | A/B Testing, which allows merchants to perform comparison tests to determine which merchandise is more frequently selected, which advertisements are the more appealing and which promotions inspire more customers to buy. |
| | • | | Searchandising, which consists of rules that can easily be configured by the merchant to feature products in search results that deliver the best inventory turn, conversion rates and average order size. |
| | • | | Order Management, which provides users the ability to access, modify and cancel orders. |
| | • | | Customer Targeting, which provides the capability to create rules that include and exclude conditions for triggering different merchandising offers, promotions and products. |
Development Center. Demandware Commerce offers the flexibility and control of a development environment based on a procedural language with the convenience, scalability and security of cloud-based, multi-tenant delivery. With Demandware Commerce, developers and IT professionals can focus on innovation rather than infrastructure. Developers can build, customize, test, debug, deploy, integrate and extend their digital commerce sites, all on-demand. Our Development Center includes access to an extensive library of pre-built business processes and contains all the necessary tools to edit them. Business processes within the development platform are graphically illustrated as pipelines and are edited through simple drag-and-drop, making it easy for
11
web developers to quickly integrate to other applications and modify the customer experience as necessary. In Development Center, customers can leverage the Open Commerce APIs to create highly customized shopping experiences to reach consumers.
Demandware LINK. Through the Demandware LINK marketplace and Demandware LINK technology partners, merchants and developers have access to an extensive library of integrations to third-party applications. These applications include email marketing, campaign management, order management, payment management, personalization, social commerce, tax applications and ratings and reviews. We support our partners in the development of third-party integrations and undertake a rigorous approval process to evaluate quality and compatibility before the application is made available for downloading through Demandware LINK.
Commerce Cloud. Web traffic is global and not linked to brick and mortar store operational hours. Consumers expect online stores to be open and functional at all times, even when they are serving millions of other consumers during the busiest shopping season. With legacy in-house systems, retailers and brands have to plan for demand, buy resources for the peak season and create a disaster recovery back-up strategy. The Demandware Commerce Cloud is comprised of our network of state-of-the-art data centers, as well as our cloud-based architecture, which enables our customers to offer a reliable, high-performance, secure online shopping environment that is PCI-compliant. Our cloud-based platform allows us to quickly and seamlessly increase the processing capacity of the environment in which our customers’ digital commerce sites operate to meet surges in demand. Through our Commerce Cloud, we also provide high uptime, robust security and disaster recovery.
Retail Practice
We have developed a comprehensive customer success program as a key component of our engagement model, which is designed to enable our customers to achieve sustained customer revenue growth and is delivered within the context of a shared success business relationship. In this program, we assign to customers a digital commerce strategist who works hand-in-hand with our customers’ executives to maximize the value of their investment. These digital commerce strategists are focused on growing our customers’ revenue by taking full advantage of the marketing and merchandising features and functionality of Demandware Commerce and providing our customers with a deep understanding of industry practices in site design, merchandising, analytics, interactive marketing, personalization and multi-channel integration. In addition, these strategists work with our customers to implement complex digital commerce strategies including global expansion, multi-brand businesses and omni-channel operations.
We monitor customer satisfaction internally as part of formalized programs and at regular intervals during the customer lifecycle, including during the transition from sales to implementation, at the completion of an implementation project and on an on-going basis based on interactions with the account services team.
Client Services
Our customer enablement methodology includes templates and processes to help project teams focus on the key tactical and strategic areas to maximize returns on our customers’ online investments and minimize business risk. Our customer enablement methodology guides our tactical process to successfully build and deploy a digital commerce site utilizing our Demandware Commerce platform. Our services include:
| | • | | Enablement services: Our services professionals work with customers to clearly define the goals of the project. We conduct a series of in-depth enablement sessions to educate our customers on our model, technology, methodology and approach to organizational planning. The enablement services include targeted education services and consulting programs to prepare customers with the tools and training needed to successfully execute their digital commerce strategy. |
| | • | | Partner alignment services: The majority of our implementations are led by partners. We work with each of our customers to align the customer’s implementation needs with the expertise in our growing ecosystem of partners across technology, solutions and end-to-end solutions. We have programs for partner enablement and developer certification that support scaling the capacity to deliver quality implementations of our platform through our partner ecosystem. |
12
| | • | | Ongoing training services: We offer a broad range of training classes to educate the individuals—digital commerce managers, web developers, application developers and IT professionals—who are part of our customers’ implementation, maintenance and optimization teams. |
| | • | | Support services: We offer support in multiple languages and through multiple channels, including global support coverage available 24 hours a day, seven days a week. |
We also provide customer support engineers who are experts in our products, industry technologies and platforms, making them a trusted resource for timely issue assessment and resolution. Periodic system maintenance and continual feature additions are also included in product support coverage, which is included in the subscription fee.
We also leverage our Demandware Collaboration Center XChange user community across our customer, partner ecosystem and employee base to help optimize the digital commerce environment and create a virtual community to collaborate on product design, release management and best practices. In the Demandware Collaboration Center XChange user community, customers also have the opportunity to influence product roadmap.
Customers
We have a wide variety of customers across various industries and geographies. As of December 31, 2012 we had 151 customers using our Demandware Commerce platform, up from 69 and 101 as of December 31, 2010 and 2011, respectively. Some of our customers have multiple revenue generating sites, either through multiple geographies or multiple brands within a larger organization. As of December 31, 2012, there were 579 live revenue-generating sites on our platform, up from 215 and 361 as of December 31, 2010 and 2011, respectively.
Some of our significant customers for the year ended December 31, 2012 include the following, arranged alphabetically by category:
| | |
| Apparel and Footwear | | Health & Beauty |
adidas Barneys New York Bestseller Carter’s Crocs Deckers House of Fraser Lands’ End New Balance s. Oliver Tory Burch Home & Garden CPO Commerce Lifetime Brands Michaels Stores General Merchandise ASDA Procter & Gamble | | Bare Escentuals Guthy-Renker L’Oreal Other Hanover Direct Jewelry Television mothercare TDC Sporting Goods Brooks Sports Burton Snowboards Callaway Golf |
| |
| |
| |
| |
| |
Revenue from customers in apparel and footwear represented approximately 55% of our total revenue for the year ended December 31, 2012.
13
Sales and Marketing
We sell our cloud based solutions primarily through our direct sales force, which includes field sales representatives, sales engineers, sales management, digital commerce strategists and account development representatives. Our direct sales force is organized by geographic region. Our direct sales force targets primarily enterprise customers, larger retailers and branded consumer product manufacturers that seek to implement more advanced digital commerce merchandising platforms across multiple channels and geographies. Our sales cycle can vary substantially from customer to customer, but typically requires six to nine months depending on the size and complexity of the opportunity. From the time a contract is signed, it typically takes six months to implement and launch a digital commerce site for a new customer. In 2012, the majority of our implementations were done by third party LINK solutions partners including companies like Amblique, Astound Commerce, Be Excellent, Fluid, Itelios, Lyons Group, Sapient Nitro and SinnerSchrader.
We also sell through selected LINK end-to-end partners, such as eCommera, NETRADA and PFSweb, that combine our Demandware Commerce platform with a host of complementary services and technologies, such as logistics and warehousing, to provide comprehensive end-to-end digital commerce solutions.
Our marketing efforts and lead generation activities consist primarily of customer referrals, internet advertising, telemarketing, e-mail marketing, social marketing, trade shows, industry events and press releases. Our marketing programs target our prospective customers’ digital commerce executives, senior business leaders and c-suite executives. We also host frequent conferences in which customers participate, including an annual global customer conference, and we present a variety of programs with our LINK partners designed to help accelerate cross-channel digital commerce success with our integrated platform.
Technology, Operations and Development
Technology
Since inception, we have designed our solutions in a cloud-based architecture, which our customers can access through a standard web browser. Our solutions use a single code base, with all of our customers running on the current version of our platform. Our technology platform has several key design elements:
| | • | | Scalability. The on-demand platform architecture of Demandware Commerce handles sudden spikes in traffic by allocating capacity. We proactively deliver updates and feature upgrades so our customers’ sites operate at peak efficiency. Demandware Commerce allocates computing power to each digital commerce site as needed to minimize page load times. Our platform has been benchmarked to handle at least 1,400 dynamic page views per second. |
| | • | | Reliability. Our state-of-the-art data centers in North America, Europe and Asia ensure high performance and redundancy for our customer base. We support large transaction volumes and seasonal peaks in site traffic and have provided 99.98% average site availability (excluding planned down time) since 2005. |
| | • | | Security. Our platform secures millions of transactions per year and has met the PCI-DSS Level 1 Service Provider set of comprehensive requirements for enhancing payment account data security. The PCI-DSS is a multi-faceted security standard that includes requirements for security management, policies, procedures, network architecture, software design and other critical protective measures. Our platform has been PCI-DSS-compliant since June 2007 and undergoes an annual assessment conducted by a PCI Council Qualified Security Assessor. |
| | • | | Ease of Deployment. Our customers run on a shared infrastructure, creating scalability and redundancy not possible with typical single-tenant providers. In a typical single-tenant environment, every new stack must be separately purchased, provisioned, managed, scaled and backed-up. In our multi-tenant channel, we can quickly and easily create new environments for development, testing, staging, and production, thus delivering significant cost and time savings for our customers. |
14
| | • | | Flexibility. Our standards-based open framework allows our customers to develop, build, and integrate third-party technologies. Our customers can innovate their site experience using the Eclipse-based open development environment and our UX Studio application to create a unique and relevant branded experience. Using a standards-based server-side scripting language, users can quickly create new logic to business processes, new custom objects, web services calls, integrations to back-end systems and XML data processing. |
| | • | | Extendibility. Our Commerce Cloud consists of multiprocessor nodes with large amounts of memory and network capacity, as well as digital commerce databases. The processor nodes are provisioned as web, application or database servers with dynamic isolated network connectivity only to other members in the particular merchant’s environment. In this way, a logical cluster is assembled with a variable number of processor nodes for web, application and database processing. Each merchant environment is logically isolated from all other merchant environments through multiple levels of security for network, port, processor, database and storage systems. Databases can hold product, consumer and order information. Our current data model can be extended by a configuration task performed through a web user interface and does not need a database administrator to manipulate the data model directly. |
Operations
We physically host our cloud-based solutions for our customers in secure data center facilities located in North America, Europe and Asia. We contract for use of these data center facilities primarily from Equinix Operating Co. and NaviSite. We engineer and architect the actual computer, storage and network systems upon which our platform operates, which we call our grid computing points of delivery, or PODs, and deploy them to the data center facilities, which provide physical security, including manned security, 24 hours a day, 365 days a year. We currently operate 13 PODs. The data center facilities also have biometric access controls, redundant power and environmental controls. We provide system security, including firewalls and encryption technology, and we conduct regular system tests and vulnerability assessments. In the event of a failure, we have engineered our computing grid with back-up and redundancy capabilities designed to provide for business continuity.
Research and Development
Our research and development organization is focused on developing new solutions and enhancing existing solutions, conducting software and quality assurance testing and improving our core technology. We continually enhance our existing software platform and develop new applications to meet our customers’ digital commerce needs. Our research and development organization is located primarily in our Burlington, Massachusetts headquarters. We also employ a team of engineers in our Jena, Germany office.
Our development methodology, in combination with our on-demand delivery model, allows us to release new and enhanced software features multiple times a year. We patch our software on a regular basis. Based on feedback from our customers and prospects, we continually develop new merchandising functionality while enhancing and maintaining our existing solutions. We do not need to maintain multiple engineering teams to support different versions of the code because all of our customers are running on the current version of our solutions.
Competition
The market for digital commerce platform software, services and solutions is intensely competitive, subject to rapid technological change and significantly affected by new product introductions and other market activities.
15
We expect competition to persist and intensify in the future. Our primary sources of competition include:
| | • | | in-house development efforts by potential customers or their web consultants; |
| | • | | licensed application vendors, such as IBM, Oracle/ATG, eBay/Magento and hybris; |
| | • | | full-service e-commerce business process outsourcers, such as Digital River and eBay/GSI Commerce; and |
| | • | | providers of hosted on-demand subscription and SaaS services, such as MarketLive and Venda. |
We compete primarily on the basis of our robust set of merchandising capabilities and features, the reliability and scalability of our solutions, our speed of deployment, the customization of our platform, our continual innovation, our omni-channel capabilities and the extendibility of our Demandware Commerce platform.
Our current and potential competitors may have significantly greater financial, technical, marketing and other resources than we do, and there is no assurance we will be able to continue to compete effectively.
Intellectual Property and Proprietary Rights
Our intellectual property and proprietary rights are important to our business. To safeguard them, we rely on a combination of patent, copyright, trade secret, trademark and other rights in the United States and other jurisdictions, as well as confidentiality procedures and contractual provisions to protect our proprietary technology, processes and other intellectual property. We have two issued U.S. patents. We have confidentiality and license agreements with employees, contractors, customers, distributors and other third parties, which limit access to and use of our proprietary information and software. Though we rely in part upon these legal and contractual protections, we believe that factors such as the skills and ingenuity of our employees and the functionality and frequent enhancements to our solutions are larger contributors to our success in the marketplace.
Despite our efforts to preserve and protect our intellectual property and proprietary rights, unauthorized third parties may attempt to copy, reverse engineer, or otherwise obtain portions of our solutions. Competitors may attempt to develop similar products that could compete in the same market as our product. Unauthorized disclosure of our confidential information by our employees or third parties could occur. Laws of other jurisdictions may not protect our intellectual property and proprietary rights from unauthorized use or disclosure in the same manner as the United States. The risk of unauthorized use of our proprietary and intellectual property rights may increase as our company continues to expand outside of the United States.
Third-party infringement claims are also possible in our industry, especially as software functionality and features expand, evolve, and overlap with other industry segments. Third parties, including non-practicing patent holders, have from time to time claimed, and could claim in the future, that our customers’ sites infringe patents they now hold or might obtain or be issued in the future, and, in most cases, we have agreed to indemnify our customers against claims that our products infringe the intellectual property rights of third parties. See “Risk Factors–We could incur substantial costs as a result of any claim of infringement of another party’s intellectual property rights.”
Seasonality
Our subscription revenue fluctuates as a result of seasonal variations in our business, principally due to our customers’ revenue peaks during the holiday season, which correspondingly results in higher subscription revenue in the fourth quarter than in other quarters. As a result, we have historically had higher subscription revenue in our fourth quarter than other quarters in a given year. Revenue for the fourth quarter represented 34.1%, 32.9%, and 33.1% of our total revenue in 2010, 2011 and 2012, respectively.
16
Business Segment and Geographical Information
We operate in a single operating segment. For geographical financial information, see Note 2 to our consolidated financial statements, which are incorporated herein by reference.
Employees
At December 31, 2012 we had 298 employees, including 120 in sales and marketing and 65 in research and development. Except in France, none of our employees is represented by a labor union or covered by a collective bargaining agreement. We have never experienced a strike or similar work stoppage, and we believe that our relations with our employees are good.
Corporate Information
We were incorporated in Delaware in February 2004. Our principal executive office is located at 5 Wall Street, Burlington, Massachusetts 01803 and our telephone number is (888) 553-9216.
Information Available on the Internet
We maintain an internet website atwww.demandware.com. The information on our website is not incorporated by reference into this Annual Report on Form 10-K and should not be considered to be a part of this Annual Report on Form 10-K. Our website address is included in this Annual Report on Form 10-K as an inactive technical reference only. Our reports filed or furnished pursuant to Section 13(a) or 15(d) of the Exchange Act, including our Annual Reports on Form 10-K, our Quarterly Reports on Form 10-Q and our Current Reports on Form 8-K, and amendments to those reports, are accessible through our website, free of charge, as soon as reasonably practicable after these reports are filed electronically with, or otherwise furnished to, the SEC. We also make available on our website the charters of our audit committee, compensation committee and nominating and corporate governance committee, as well as our corporate governance guidelines and our code of business conduct and ethics. In addition, we intend to disclose on our website any amendments to, or waivers from, our code of business conduct and ethics that are required to be disclosed pursuant to the SEC rules.
The following risk factors could materially affect our business, consolidated financial condition and results of operations. The risks and uncertainties described below are those that we have identified as material, but are not the only risks and uncertainties we face. Our business is also subject to general risks and uncertainties that affect many other companies, including overall economic and industry conditions. Additional risks and uncertainties not currently known to us or that we currently believe are not material also may impair our business, consolidated financial condition and results of operations.
Risks Related to Our Business and Our Industry
We have had a history of losses, and we may be unable to achieve or sustain profitability.
We have experienced net losses in each year since our inception, except for the year ended December 31, 2010. We experienced net losses of $8.1 and $1.4 million in 2012 and 2011, respectively, and net income of $0.3 million in 2010. At December 31, 2012, our accumulated deficit was $76.7 million and total stockholders’ equity was $94.6 million. We expect to incur operating losses as a result of expenses associated with the continued development and expansion of our business. Our expenses include sales and marketing, research and development and other costs relating to the development, marketing and sale of our solution and consulting services that may not generate revenue until later periods, if at all. Any failure to increase revenue or manage our
17
cost structure as we implement initiatives to grow our business could prevent us from achieving or sustaining profitability. In addition, our ability to achieve profitability is subject to a number of the risks and uncertainties discussed below, many of which are beyond our control. We cannot be certain that we will be able to achieve or sustain profitability on a quarterly or annual basis.
Our limited operating history makes it difficult to evaluate our current business and future prospects.
We have been in existence since 2004, and much of our growth has occurred in recent periods. Our limited operating history may make it difficult for you to evaluate our current business and our future prospects. We have encountered and will continue to encounter risks and difficulties frequently experienced by growing companies in rapidly changing industries, including increasing and unforeseen expenses as we continue to grow our business. If we do not manage these risks successfully, our business will be harmed.
We depend on a limited number of customers for a substantial portion of our revenue. The loss of a key customer or the significant reduction of business from one of our largest customers could significantly reduce our revenue.
We have derived, and we believe that we will continue to derive, a substantial portion of our revenue from a limited number of customers. For example, for the year ended December 31, 2012, our largest ten customers by revenue accounted for an aggregate of approximately 33% of our revenue. If we were to lose one or more of our key customers, there is no assurance that we would be able to replace such customers with new customers that generate comparable revenue, which would materially adversely affect our financial condition and results of operations. Our operating results for the foreseeable future will continue to depend on our ability to sell our digital commerce solutions to a limited number of prospective customers. Any revenue growth will depend on our success in growing our customers’ online revenue processed on our platform and expanding our customer base to include additional customers.
Fluctuations in the exchange rate of foreign currencies could result in currency transactions losses.
We currently have foreign sales denominated in Euros, British pound sterling, Australian and Canadian dollars and may, in the future, have sales denominated in other foreign currencies. In addition, we incur a portion of our operating expenses in Euros, British pound sterling and, to a lesser extent, other foreign currencies. Any fluctuation in the exchange rate of these foreign currencies may negatively impact our business, financial condition and operating results. We have not previously engaged in foreign currency hedging. If we decide to hedge our foreign currency exposure, we may not be able to hedge effectively due to lack of experience, unreasonable costs or illiquid markets.
The seasonality of our business creates significant variance in our quarterly revenue.
Our customers are retailers and branded consumer product manufacturers that typically realize a significant portion of their online sales in the fourth quarter of each year, specifically during the holiday season. As a result of this seasonal variation, our subscription revenue fluctuates, with additional fees in excess of committed annual levels, called overage fees, being higher in the fourth quarter than in other quarters and with revenue generally declining in the first quarter sequentially from the fourth quarter.
We recognize revenue from customer subscriptions over the term of the subscription agreement and, therefore, a significant downturn in our business may not be immediately reflected in our operating results.
We recognize revenue from subscription agreements monthly over the terms of these agreements, which is typically three years. As a result, a significant portion of the revenue we report in each quarter is generated from customer agreements entered into during previous periods. Consequently, a decline in new or renewed subscriptions in any one quarter may not impact our financial performance in that quarter, but might negatively affect our revenue in future quarters. If a number of contracts expire and are not renewed in the same quarter, our revenue may decline significantly in that quarter and subsequent quarters. In addition, we may be unable to
18
adjust our fixed costs in response to reduced revenue. Accordingly, the effect of significant declines in sales or renewals and market acceptance of our solutions may not be reflected in our short-term results of operations.
Our business is substantially dependent upon the continued growth of the market for cloud-based software solutions.
We derive, and expect to continue to derive, substantially all of our revenue from the sale of our cloud-based digital commerce solutions. As a result, widespread acceptance and use of the on-demand business model is critical to our future growth and success. Under the perpetual or periodic license model for software procurement, users of the software would typically run the applications on their hardware. Because many companies are generally predisposed to maintaining control of their information technology, or IT, systems and infrastructure, there may be resistance to the concept of accessing software functionality as a service provided by a third party. In addition, the market for cloud-based software solutions is still evolving, and competitive dynamics may cause pricing levels to change, as the market matures and as existing and new market participants introduce new types of solutions and different approaches to enable organizations to address their digital commerce needs. As a result, we may be forced to reduce the prices we charge for our solutions and may be unable to renew existing customer agreements or enter into new customer agreements at the same prices and upon the same terms as we have historically. If the market for cloud-based software solutions fails to grow, grows more slowly than we currently anticipate or evolves and forces us to reduce the prices we charge for our solutions, demand for our solutions and our revenue, gross margin and other operating results could be materially adversely affected.
We rely on a variable pricing model and any change in that model could adversely affect our financial results.
We have adopted a variable pricing model whereby we participate in a share of our customers’ gross revenue processed on our platform. This pricing model aligns our interests with those of our customers and reflects the need for us to expand our own processing and support infrastructure as activity on our customers’ digital commerce sites increases. All of our customer contracts are based on a variable pricing model. If customers were to demand a fixed pricing model that did not provide for variability based on their level of usage of our platform, our financial results could be adversely affected.
Our lengthy sales and implementation cycles make it difficult to predict our future revenue and causes variability in our operating results.
Our sales cycle can vary substantially from customer to customer, but typically requires six to nine months depending on the size and complexity of the opportunity. From the time a new contract is signed, approximately six months are typically required to implement and launch an digital commerce site for a new customer. A number of factors influence the length and variability of our sales and implementation cycles, including, for example:
| | • | | the need to educate potential customers about the uses and benefits of our solutions; |
| | • | | the relatively long duration of the commitment customers make in their agreements with us; |
| | • | | the nature of potential customers’ purchasing and budget cycles and decisions; |
| | • | | the competitive nature of potential customers’ evaluation and purchasing processes; |
| | • | | evolving digital commerce needs and functionality demands of potential customers; |
| | • | | announcements or planned introductions of new products by us or our competitors; and |
| | • | | lengthy purchasing approval processes of potential customers. |
Lengthy sales and implementation cycles make it difficult to predict the quarter in which revenue from a new customer may first be recognized. We may incur significant sales and marketing expenses in anticipation of selling our products, and if we do not achieve the level of revenue we expected, our operating results will suffer
19
and our stock price may decline. Further, our potential customers frequently need to obtain approvals from multiple decision makers before making purchase decisions. Delays in our sales or implementation cycles could cause significant variability in our revenue and operating results for any particular period.
If we are unable to retain our existing customers, our revenue and results of operations would be adversely affected.
We sell our solutions pursuant to agreements that are approximately three years in duration. Our customers have no obligation to renew their subscriptions after their subscription period expires, and these subscriptions may not be renewed on the same or on more profitable terms. As a result, our ability to grow depends in part on subscription renewals. We may not be able to accurately predict future trends in customer renewals, and our customers’ renewal rates may decline or fluctuate because of several factors, including their satisfaction or dissatisfaction with our services, the cost of our services and the cost of services offered by our competitors or reductions in our customers’ spending levels. If our customers do not renew their subscriptions for our services or renew on less favorable terms, our revenue may grow more slowly than expected or decline, and our profitability and gross margins may be harmed.
Security and privacy breaches may hurt our business.
Any security breaches, unauthorized access, unauthorized usage, virus or similar breach or disruption could result in loss of confidential information, damage to our reputation, early termination of our contracts, litigation, regulatory investigations or other liabilities. If our, our customers’ or our partners’ security measures are breached as a result of third-party action, employee error, malfeasance or otherwise and, as a result, someone obtains unauthorized access to customer data, our reputation will be damaged, our business may suffer and we could incur significant liability.
Techniques used to obtain unauthorized access or to sabotage systems change frequently and often are not recognized until after launched against a target. As a result, we may be unable to anticipate these techniques or to implement adequate preventative measures. If an actual or perceived security breach occurs, the market perception of our security measures could be harmed and we could lose sales and customers. Any significant violations of data privacy could result in the loss of business, litigation and regulatory investigations and penalties that could damage our reputation and adversely impact our results of operations and financial condition. Moreover, if a high profile security breach occurs with respect to another software-as-a-service, or SaaS, provider, our customers and potential customers may lose trust in the security of the SaaS, or cloud-based, business model generally, which could adversely impact our ability to retain existing customers or attract new ones.
Our business and operations have experienced rapid growth and organizational change in recent periods, which has placed, and may continue to place, significant demands on our management and infrastructure. If we fail to manage our growth effectively, we may be unable to execute our business plan, maintain high levels of service or address competitive challenges adequately.
Our growth has placed, and may continue to place, a significant strain on our managerial, administrative, operational, financial and other resources. We intend to further expand our overall business, customer base, headcount and operations both domestically and internationally, with no assurance that our business or revenue will continue to grow. Creating a global organization and managing a geographically dispersed workforce will require substantial management effort, the allocation of valuable management resources and significant additional investment in our infrastructure. We will be required to continue to improve our operational, financial and management controls and our reporting procedures and we may not be able to do so effectively. As such, we may be unable to manage our expenses effectively in the future, which may negatively impact our gross margins or operating expenses in any particular quarter. If we fail to manage our anticipated growth and change in a manner that preserves the key aspects of our corporate culture, the quality of our solutions may suffer, which could negatively affect our brand and reputation and harm our ability to retain and attract customers.
20
Failure to effectively maintain and expand our direct sales teams and develop and expand our indirect sales channel will impede our growth.
We will need to continue to expand our sales and marketing infrastructure in order to grow our customer base and our business. Identifying, recruiting and training these sales and marketing personnel will require significant time, expense and attention. Our business will be seriously harmed and our financial resources will be wasted if our efforts to expand our direct and indirect sales channels do not generate a corresponding increase in revenue. In particular, if we are unable to hire, develop and retain talented sales personnel or if our new direct sales personnel are unable to achieve expected productivity levels in a reasonable period of time, we may not be able to significantly increase our revenue and grow our business.
The global economic conditions may continue to adversely affect our business and results of operations.
The U.S., Europe, and other global economies have experienced a recession that has affected all sectors of the economy, resulting in declines in economic growth and consumer confidence, increases in the level of unemployment and uncertainty about economic stability. Global credit and financial markets, including those in Europe, have also experienced extreme disruptions, including diminished liquidity and credit availability and rapid fluctuations in market valuations. Our business has been affected by these conditions, and there is no certainty that economic conditions will not deteriorate further. These uncertainties may affect our business in a number of ways, making it difficult to accurately forecast and plan our future business activities. Weak economic conditions may lead consumers and retailers to postpone spending, which may cause our customers to decrease or delay their purchases of our solutions. In addition, the inability of consumers to obtain credit could negatively affect our revenue. Financial difficulties experienced by third parties with whom we have entered relationships and upon whom we depend in order to grow our business could detract from the quality or timeliness of the products or professional services they provide to us, which could adversely affect our reputation and relationships with our customers.
If the current uncertain economic conditions continue or further deteriorate, we could be required to record charges relating to restructuring costs or the impairment of assets, and our business and results of operations could be materially adversely affected.
We are dependent upon consumers’ willingness to use the internet for commerce.
Our success depends upon the general public’s continued willingness to use the internet as a means to purchase goods, communicate, and conduct and research commercial transactions. If consumers became unwilling or less willing to use the internet for commerce for any reason, including lack of access to high-speed communications equipment, congestion of traffic on the internet, internet outages or delays, disruptions or other damage to users’ computers, increases in the cost of accessing the internet and security and privacy risks or the perception of such risks, our business could be materially adversely affected.
Even if demand for digital commerce products and services increases generally, there is no guarantee that demand for cloud-based solutions like ours will increase to a corresponding degree.
For our customers and potential customers to be willing to invest in our digital commerce solutions, the internet must continue to be accepted and widely used for commerce and communication. If digital commerce does not grow or grows more slowly than expected, then our future revenue and profits may not meet our expectations or those of analysts. The widespread adoption of our solutions depends not only on strong demand for digital commerce products and services generally, but also for products and services delivered via a cloud-based business model in particular. Many companies continue to rely primarily or exclusively on traditional means of commerce that are not internet-based and may be reluctant to change their patterns of commerce. Even if such companies do adopt digital commerce solutions, it is unclear whether they will desire digital commerce solutions like ours. As a result, we cannot assure you that our cloud-based digital commerce solutions will achieve and sustain the high level of market acceptance that is critical for the future success of our business.
21
If we fail to manage our cloud-based hosting network infrastructure capacity, our existing customers may experience service outages and our new customers may experience delays in the deployment of our digital commerce solutions.
We have experienced significant growth in the number of users, transactions and data that our hosting infrastructure supports. We seek to maintain sufficient excess capacity in our cloud-based hosting network infrastructure to meet the needs of all of our customers. We also seek to maintain excess capacity to facilitate the rapid provision of new customer deployments and the expansion of existing customer deployments. However, the provision of new hosting infrastructure requires significant lead time. If we do not accurately predict our infrastructure capacity requirements, particularly in the fourth quarter when we might experience significant increases in traffic on our customers’ digital commerce sites, our customers could experience service outages that may subject us to financial penalties and financial liabilities and result in customer losses. If our hosting infrastructure capacity fails to keep pace with increased sales, customers may experience delays as we seek to obtain additional capacity, which could harm our reputation and adversely affect our revenue growth.
If we fail to develop our brand cost-effectively, our business may suffer.
We believe that developing and maintaining awareness of our brand in a cost-effective manner is critical to achieving widespread acceptance of our existing and future solutions and is an important element in attracting new customers. Furthermore, we believe that the importance of brand recognition will increase as competition in our market increases. Successful promotion of our brand will depend largely on the effectiveness of our marketing efforts and on our ability to provide reliable and useful services at competitive prices. In the past, our efforts to build our brand have involved significant expenses. Brand promotion activities may not yield increased revenue, and even if they do, any increased revenue may not offset the expenses we incurred in building our brand. If we fail to successfully promote and maintain our brand, or incur substantial expenses in an unsuccessful attempt to promote and maintain our brand, we may fail to attract enough new customers or retain our existing customers to the extent necessary to realize a sufficient return on our brand-building efforts, and our business could suffer.
We may not be able to compete successfully against current and future competitors.
We face intense competition in the market for digital commerce applications and services, and we expect competition to intensify in the future. We have competitors with longer operating histories, larger customer bases and greater financial, technical, marketing and other resources than we do. Increased competition may result in reduced pricing for our solutions, longer sales cycles or a decrease of our market share, any of which could negatively affect our revenue and future operating results and our ability to grow our business.
A number of competitive factors could cause us to lose potential sales or to sell our solutions at lower prices or at reduced margins, including, among others:
| | • | | Potential customers may choose to develop digital commerce applications in-house, rather than paying for our solutions; |
| | • | | Some of our current and potential competitors have greater financial, marketing and technical resources than we do, allowing them to leverage a larger installed customer base and distribution network, adopt more aggressive pricing policies and offer more attractive sales terms, adapt more quickly to new technologies and changes in customer requirements, and devote greater resources to the promotion and sale of their products and services than we can; |
| | • | | Current and potential competitors have established or may establish cooperative relationships among themselves or with third parties to enhance their products and expand their markets, and consolidation in our industry is likely to intensify. Accordingly, new competitors or alliances among competitors may emerge and rapidly acquire significant market share; |
| | • | | Current and potential competitors may offer software that addresses one, or a limited number, of digital commerce functions at a lower price point or with greater depth than our solutions; and |
22
| | • | | Software vendors could bundle digital commerce solutions or offer such products at a lower price as part of a larger product sale. |
We cannot ensure that we will be able to compete successfully against current and future competitors. In addition, competition may intensify as our competitors enter into business combinations or alliances or raise additional capital and established companies in other market segments or geographic markets expand into our market segments or geographic markets. If we cannot compete successfully against our competitors, our business, results of operations and financial condition could be negatively impacted.
Mergers of or other strategic transactions by our competitors or our customers could weaken our competitive position or reduce our revenue.
If one or more of our competitors were to merge or partner with another of our competitors, the change in the competitive landscape could adversely affect our ability to compete effectively. Our competitors may also establish or strengthen cooperative relationships with our current or future strategic distributors, systems integrators, third-party consulting firms or other parties with whom we have relationships, thereby limiting our ability to promote our solutions and limiting the number of consultants available to implement our solutions. In addition, we may lose customers that merge with or are acquired by companies using a competitor’s or an internally developed solution. Disruptions in our business caused by these events could reduce our revenue.
Our growth depends in part on the success of our strategic relationships with third parties.
We anticipate that we will continue to depend on various third-party relationships in order to grow our business. In addition to growing our indirect sales channels, we intend to pursue additional relationships with other third parties, such as technology and content providers and implementation consultants. Identifying, negotiating and documenting relationships with third parties require significant time and resources as does integrating third-party content and technology. Some of the third parties that sell our solutions have the direct contractual relationships with our ultimate end-user customers, and therefore we risk the loss of such customers if the third parties fail to perform their obligations. Our agreements with distributors and providers of technology, content and consulting services are typically non-exclusive, do not prohibit them from working with our competitors or from offering competing services and may not have minimum purchase commitments. Our competitors may be effective in providing incentives to third parties to favor their products or services or to prevent or reduce subscriptions to our solutions. In addition, these distributors and providers may not perform as expected under our agreements, and we have had, and may in the future have, disagreements or disputes with such distributors and providers, which could negatively affect our brand and reputation. A global economic slowdown could also adversely affect the businesses of our distributors, and it is possible that they may not be able to devote the resources we expect to the relationship.
If we are unsuccessful in establishing or maintaining our relationships with certain of these third parties, specifically with eCommera, NETRADA and PFSweb, our ability to compete in the marketplace or to grow our revenue could be impaired and our operating results would suffer. Even if we are successful, we cannot assure you that these relationships will result in improved operating results.
We could incur substantial costs as a result of any claim of infringement of another party’s intellectual property rights.
In recent years, there has been significant litigation in the United States involving patents and other intellectual property rights. Companies providing internet-related products and services are increasingly bringing and becoming subject to suits alleging infringement of proprietary rights, particularly patent rights. These risks have been amplified by the increase in third parties, which we refer to as non-practicing entities, whose sole primary business is to assert such claims. We could incur substantial costs in prosecuting or defending any intellectual property litigation. If we sue to enforce our rights or are sued by a third party that claims that our technology infringes its rights, the litigation could be expensive and could divert our management resources.
23
In addition, in most instances, we have agreed to indemnify our customers against certain claims that our products infringe the intellectual property rights of third parties. We have received indemnification requests from many customers that have received letters from, or been sued by, non-practicing entities claiming infringement of patents owned by them. Many of those underlying claims, and the extent, if any, of our indemnification obligations, have not yet been resolved. Some of these patents are the subject of pending legal proceedings between the patent owners and one or more major companies engaged in digital commerce, and the outcome of those proceedings could affect the extent to which the patent owners seek to prosecute claims against us or our customers. Also, because the patent owners have asserted the same patents against multiple customers, an adverse resolution in the case of one customer could lead to adverse resolutions in the cases of other customers and such claims could potentially lead to greater exposure for us than for any single customer. Our business could be adversely affected by any significant disputes between us and our customers as to the applicability or scope of our indemnification obligations to them. The results of any intellectual property litigation to which we might become a party, or for which we are required to provide indemnification, may require us to do one or more of the following:
| | • | | cease selling or using products or services that incorporate the challenged intellectual property; |
| | • | | make substantial payments for legal fees, settlement payments or other costs or damages; |
| | • | | obtain a license, which may not be available on reasonable terms, to sell or use the relevant technology; or |
| | • | | redesign those products or services to avoid infringement. |
If we are required to make substantial payments or undertake any of the other actions noted above as a result of any intellectual property infringement claims against us or any obligation to indemnify our customers for such claims, such payments or costs could have a material adverse effect upon our business and financial results.
We could incur substantial costs in protecting our intellectual property from infringement, and any failure to protect our intellectual property could impair our business.
We seek to protect the source code for our proprietary software under a combination of patent, copyright and trade secrets law. However, because we make some of the source code available to some customers, third parties may be more likely to misappropriate it. Our policy is to enter into confidentiality agreements with our employees, consultants, vendors and customers and to control access to our software, documentation and other proprietary information. Despite these precautions, it may be possible for someone to copy our software or other proprietary information without authorization or to develop similar software independently.
Despite our efforts to protect our proprietary rights, unauthorized parties may attempt to copy aspects of our products or to obtain and use information that we regard as proprietary. Policing unauthorized use of our products is difficult, and while we are unable to determine the extent to which piracy of our software exists, we expect software piracy to be a persistent problem. Litigation may be necessary in the future to enforce our intellectual property rights, to protect our trade secrets, to determine the validity and scope of the proprietary rights of others or to defend against claims of infringement or invalidity. Such litigation could be costly, time-consuming and distracting to management, result in a diversion of resources, the impairment or loss of portions of our intellectual property and have a material adverse effect on our business, operating results and financial condition. Furthermore, our efforts to enforce our intellectual property rights may be met with defenses, counterclaims and countersuits attacking the validity and enforceability of our intellectual property rights. These steps may be inadequate to protect our intellectual property. We will not be able to protect our intellectual property if we are unable to enforce our rights or if we do not detect unauthorized use of our intellectual property. Despite our precautions, it may be possible for unauthorized third parties to copy our products and use information that we regard as proprietary to create products and services that compete with ours. Some license provisions protecting against unauthorized use, copying, transfer and disclosure of our licensed products may be unenforceable under the laws of certain jurisdictions and foreign countries. Further, the laws of some countries
24
do not protect proprietary rights to the same extent as the laws of the United States. To the extent we expand our international activities, our exposure to unauthorized copying and use of our products and proprietary information may increase.
There can be no assurance that our means of protecting our proprietary rights will be adequate or that our competitors will not independently develop similar technology. If we fail to meaningfully protect our intellectual property, then our business, brand, operating results and financial condition could be materially harmed.
If our software products contain serious errors or defects, then we may lose revenue and market acceptance and may incur costs to defend or settle product liability claims.
Complex software applications such as ours often contain errors or defects, particularly when first introduced or when new versions or enhancements are released. Despite internal testing and testing by our customers, our current and future products may contain serious defects, which could result in lost revenue or a delay in market acceptance.
Since our customers use our products for critical business applications, namely digital commerce, errors, defects or other performance problems could result in damage to our customers. They could seek significant compensation from us for the losses they suffer. Although our customer agreements typically contain provisions designed to limit our exposure to product liability claims, existing or future laws or unfavorable judicial decisions could negate these limitations. Even if not successful, a product liability claim brought against us would likely be time-consuming and costly and could seriously damage our reputation in the marketplace, making it harder for us to sell our products.
Government and industry regulation of the internet is evolving and could directly restrict our business or indirectly affect our business by limiting the growth of digital commerce. Unfavorable changes in government regulation or our failure to comply with regulations could harm our business and operating results.
As digital commerce evolves, federal, state and foreign agencies have adopted and could in the future adopt regulations covering issues such as user privacy, content, and taxation of products and services. Government regulations could limit the market for our products and services or impose burdensome requirements that render our business unprofitable. Our digital commerce solutions enable our customers to collect, manage and store a wide range of consumer data. The United States and various state governments have adopted or proposed limitations on the collection, distribution and use of personal information. Several foreign jurisdictions, including member states of the European Union, have adopted legislation (including directives or regulations) that increase or change the requirements governing data collection and storage in these jurisdictions. If our privacy or data security measures fail to comply with current or future laws and regulations, we may be subject to litigation, regulatory investigations or other liabilities, or our customers may terminate their relationships with us.
In addition, although many regulations might not apply to our business directly, we expect that laws regulating the solicitation, collection or processing of personal and consumer information could affect our customers’ ability to use and share data, potentially reducing demand for our services. The Telecommunications Act of 1996 prohibits certain types of information and content from being transmitted over the internet. The prohibition’s scope and the liability associated with a violation are currently unsettled. In addition, although substantial portions of the Communications Decency Act of 1996 were held to be unconstitutional, we cannot be certain that similar legislation will not be enacted and upheld in the future. It is possible that legislation could expose companies involved in digital commerce to liability, which could limit the growth of digital commerce generally. Legislation like the Telecommunications Act and the Communications Decency Act could dampen the growth in web usage and decrease its acceptance as a medium of communications and commerce. Moreover, if future laws and regulations limit our customers’ ability to use and share consumer data or our ability to store, process and share data with our customers over the internet, demand for our solutions could decrease, our costs could increase, and our results of operations and financial condition could be harmed.
25
In addition, taxation of services provided over the internet or other charges imposed by government agencies or by private organizations for accessing the internet may also be imposed. Any regulation imposing greater fees for internet use or restricting information exchange over the internet could result in a decline in the use of the internet and the viability of internet-based services, which could harm our business and operating results.
We use a limited number of data centers to deliver our services. Any disruption of service at these facilities could harm our business.
We manage our services and serve all of our customers from a limited number of third-party data center facilities. While we engineer and architect the actual computer and storage systems upon which our platform runs, which we call our grid computing points of delivery, or PODs, and deploy them to the data center facilities, we do not control the operation of these facilities.
The owners of our data facilities have no obligation to renew their agreements with us on commercially reasonable terms, or at all. If we are unable to renew these agreements on commercially reasonable terms, we may be required to transfer to new data center facilities, and we may incur significant costs and possible service interruption in connection with doing so.
Any changes in third-party service levels at our data centers or any errors, defects, disruptions or other performance problems with our services could harm our reputation and may damage our customers’ businesses. Interruptions in our services might reduce our revenue, cause us to issue credits to customers, subject us to potential liability, and cause customers to terminate their subscriptions or harm our renewal rates.
Our data centers are vulnerable to damage or interruption from human error, intentional bad acts, earthquakes, hurricanes, floods, fires, war, terrorist attacks, power losses, hardware failures, systems failures, telecommunications failures and similar events. At least one of our data facilities is located in an area known for seismic activity, increasing our susceptibility to the risk that an earthquake could significantly harm the operations of these facilities. The occurrence of a natural disaster or an act of terrorism, or vandalism or other misconduct, a decision to close the facilities without adequate notice or other unanticipated problems could result in lengthy interruptions in our services.
We may not be able to respond to rapid technological changes with new solutions, which could have a material adverse effect on our sales and profitability.
The on-demand digital commerce market is characterized by rapid technological change, frequent new product and service introductions and evolving industry standards. Our ability to attract new customers and increase revenue from existing customers will depend in large part on our ability to enhance and improve our existing solutions, introduce new solutions and sell into new industry markets. To achieve market acceptance for our solutions, we must effectively anticipate and offer solutions that meet changing customer demands in a timely manner. Customers may require features and capabilities that our current solutions do not have. If we fail to develop solutions that satisfy customer preferences in a timely and cost-effective manner, our ability to renew our contracts with existing customers and our ability to create or increase demand for our solutions will be harmed.
We may experience difficulties with software development, industry standards, design, manufacturing or marketing that could delay or prevent our development, introduction or implementation of new solutions and enhancements. The introduction of new solutions by competitors, the emergence of new industry standards or the development of entirely new technologies to replace existing offerings could render our existing or future solutions obsolete.
If we are unable to successfully develop or acquire new digital commerce capabilities and functionality, enhance our existing solutions to anticipate and meet customer preferences or sell our solutions into new markets, our revenue and results of operations would be adversely affected.
26
Our long-term success depends, in part, on our ability to expand the sales of our digital commerce solutions to customers located outside of the United States, and thus our business is susceptible to risks associated with international sales and operations.
Outside of the United States, we currently maintain offices and/or have sales personnel in Austria, China, Denmark, France, Germany, the Netherlands, and the United Kingdom, and we intend to expand our international operations. Any international expansion efforts that we may undertake may not be successful. In addition, conducting international operations in new markets subjects us to new risks that we have not generally faced in the United States. These risks include:
| | • | | localization of our solutions, including translation into foreign languages and adaptation for local practices and regulatory requirements; |
| | • | | lack of familiarity and burdens of complying with foreign laws, legal standards, regulatory requirements, tariffs, and other barriers; |
| | • | | unexpected changes in regulatory requirements, taxes, trade laws, tariffs, export quotas, custom duties or other trade restrictions; |
| | • | | difficulties in managing systems integrators and technology partners; |
| | • | | differing technology standards; |
| | • | | longer accounts receivable payment cycles and difficulties in collecting accounts receivable; |
| | • | | difficulties in managing and staffing international operations and differing employer/employee relationships; |
| | • | | fluctuations in exchange rates that may increase the volatility of our foreign based revenue; |
| | • | | potentially adverse tax consequences, including the complexities of foreign value added tax (or other tax) systems and restrictions on the repatriation of earnings; |
| | • | | uncertain political and economic climates; and |
| | • | | reduced or varied protection for intellectual property rights in some countries. |
These factors may cause our international costs of doing business to exceed our comparable domestic costs. Operating in international markets also requires significant management attention and financial resources. Any negative impact from our international business efforts could negatively impact our business, results of operations and financial condition as a whole.
We are subject to governmental export and import controls that could impair our ability to compete in international markets due to licensing requirements and subject us to liability if we are not in full compliance with applicable laws.
Our solutions are subject to export controls, including the Commerce Department’s Export Administration Regulations and various economic and trade sanctions regulations established by the Treasury Department’s Office of Foreign Assets Controls, and exports of our solutions must be made in compliance with these laws. If we fail to comply with these U.S. export control laws and import laws, including U.S. Customs regulations, we and certain of our employees could be subject to substantial civil or criminal penalties, including the possible loss of export or import privileges; fines, which may be imposed on us and responsible employees or managers; and, in extreme cases, the incarceration of responsible employees or managers. In addition, if our distributors fail to obtain appropriate import, export or re-export licenses or authorizations, we may also be adversely affected through reputational harm and penalties. Obtaining the necessary authorizations, including any required license, for a particular sale may be time-consuming, is not guaranteed and may result in the delay or loss of sales opportunities. Furthermore, the U.S. export control laws and economic sanctions laws prohibit the shipment of certain products and services to U.S. embargoed or sanctioned countries, governments and persons. Even though we take precautions to prevent our solutions from being shipped or provided to U.S. sanctions targets, our
27
solutions and services could be shipped to those targets or provided by our distributors despite such precautions. Any such shipment could have negative consequences, including government investigations, penalties and reputational harm. In addition, various countries regulate the import of certain encryption technology, including through import permitting/licensing requirements, and have enacted laws that could limit our ability to distribute our solutions or could limit our customers’ ability to implement our solutions in those countries. Changes in our solutions or changes in export and import regulations may create delays in the introduction and sale of our solutions in international markets, prevent our customers with international operations from deploying our solutions or, in some cases, prevent the export or import of our solutions to certain countries, governments or persons altogether. Any change in export or import regulations, economic sanctions or related laws, shift in the enforcement or scope of existing regulations, or change in the countries, governments, persons or technologies targeted by such regulations, could result in decreased use of our solutions, or in our decreased ability to export or sell our solutions to existing or potential customers with international operations. Any decreased use of our solutions or limitation on our ability to export or sell our solutions would likely adversely affect our business, financial condition and results of operations.
Our use of “open source” software could negatively affect our ability to sell our services and subject us to possible litigation.
A portion of the technologies licensed by us incorporate so-called “open source” software, and we may incorporate open source software in the future. Such open source software is generally licensed by its authors or other third parties under open source licenses. If we fail to comply with these licenses, we may be subject to certain conditions, including requirements that we offer our solutions that incorporate the open source software for no cost, that we make available source code for modifications or derivative works we create based upon, incorporating or using the open source software and/or that we license such modifications or derivative works under the terms of the particular open source license. If an author or other third party that distributes such open source software were to allege that we had not complied with the conditions of one or more of these licenses, we could be required to incur significant legal expenses defending against such allegations and could be subject to significant damages, enjoined from the sale of our solutions that contained the open source software and required to comply with the foregoing conditions, which could disrupt the distribution and sale of some of our solutions. In addition, there have been claims challenging the ownership of open source software against companies that incorporate open source software into their products. As a result, we could be subject to suits by parties claiming ownership of what we believe to be open source software. Litigation could be costly for us to defend, have a negative effect on our operating results and financial condition or require us to devote additional research and development resources to change our products.
We rely on third-party software, including server software and licenses from third parties to use patented intellectual property that is required for the delivery of our solutions, which may be difficult to obtain or which could cause errors or failures of our solutions.
We rely on software licensed from or hosted by third parties to offer our solutions. In addition, we may need to obtain future licenses from third parties to use intellectual property associated with the development of our solutions, which might not be available to us on acceptable terms, or at all. Any loss of the right to use any software required for the development and maintenance of our solutions could result in delays in the provision of our solutions until equivalent technology is either developed by us, or, if available, is identified, obtained and integrated, which could harm our business. Any errors or defects in third-party software could result in errors or a failure of our solutions which could harm our business.
If we fail to maintain proper and effective internal controls, our ability to produce accurate and timely financial statements could be impaired, which could harm our operating results, our ability to operate our business and investors’ views of us.
Ensuring that we have adequate internal financial and accounting controls and procedures in place so that we can produce accurate financial statements on a timely basis is a costly and time-consuming effort that needs to be re-evaluated frequently. Our internal control over financial reporting is a process designed to provide
28
reasonable assurance regarding the reliability of financial reporting and the preparation of financial statements in accordance with generally accepted accounting principles. We are in the process of reviewing and improving our internal controls and procedures for compliance with Section 404 of the Sarbanes-Oxley Act of 2002, or the Sarbanes-Oxley Act, which will require annual management assessment of the effectiveness of our internal control over financial reporting and, as part of that documentation and testing, identifying areas for further attention and improvement. We have begun recruiting additional finance and accounting personnel with certain skill sets that we will need as a public company.
Implementing any appropriate changes to our internal controls may distract our officers and employees, entail substantial costs to modify our existing processes and take significant time to complete. These changes may not, however, be effective in maintaining the adequacy of our internal controls, and any failure to maintain that adequacy, or consequent inability to produce accurate financial statements on a timely basis, could increase our operating costs and harm our business. In addition, investors’ perceptions that our internal controls are inadequate or that we are unable to produce accurate financial statements on a timely basis may harm our stock price and make it more difficult for us to effectively market and sell our service to new and existing customers.
We may expand by acquiring or investing in other companies, which may divert our management’s attention, result in additional dilution to our stockholders and consume resources that are necessary to sustain our business.
Although we have no current agreements or commitments for any acquisitions, our business strategy may include acquiring complementary services, technologies or businesses. We also may enter into relationships with other businesses to expand our service offerings or our ability to provide service in foreign jurisdictions, which could involve preferred or exclusive licenses, additional channels of distribution, discount pricing or investments in other companies. Negotiating these transactions can be time-consuming, difficult and expensive, and our ability to close these transactions may often be subject to conditions or approvals that are beyond our control. Consequently, these transactions, even if undertaken and announced, may not close.
An acquisition, investment or new business relationship may result in unforeseen operating difficulties and expenditures. In particular, we may encounter difficulties assimilating or integrating the businesses, technologies, products, personnel or operations of the acquired companies, particularly if the key personnel of the acquired company choose not to work for us, the company’s software is not easily adapted to work with ours or we have difficulty retaining the customers of any acquired business due to changes in management or otherwise. Acquisitions may also disrupt our business, divert our resources and require significant management attention that would otherwise be available for development of our business. Moreover, the anticipated benefits of any acquisition, investment or business relationship may not be realized or we may be exposed to unknown liabilities. For one or more of those transactions, we may:
| | • | | issue additional equity securities that would dilute our stockholders; |
| | • | | use cash that we may need in the future to operate our business; |
| | • | | incur debt on terms unfavorable to us or that we are unable to repay; |
| | • | | incur large charges or substantial liabilities; |
| | • | | encounter difficulties retaining key employees of the acquired company or integrating diverse software codes or business cultures; and |
| | • | | become subject to adverse tax consequences, substantial depreciation or deferred compensation charges. |
Any of these risks could harm our business and operating results.
The loss of key personnel or an inability to attract and retain highly skilled personnel may impair our ability to grow our business.
We are highly dependent upon the continued service and performance of our senior management team and key technical and sales personnel, such as our president and chief executive officer, our chief financial officer,
29
our chief operating officer and our chief technology officer. These key employees may terminate employment with us at any time with no advance notice. The replacement of these officers likely would involve significant time and costs, and the loss of these officers may significantly delay or prevent the achievement of our business objectives.
We face intense competition for qualified individuals from numerous technology, software and manufacturing companies. For example, our competitors may be able to attract and retain a more qualified engineering team by offering more competitive compensation packages. If we are unable to attract new engineers and retain our current engineers, we may not be able to develop and maintain our services at the same levels as our competitors and we may, therefore, lose potential customers and sales penetration in certain markets. Our failure to attract and retain suitably qualified individuals could have an adverse effect on our ability to implement our business plan and, as a result, our ability to compete would decrease, our operating results would suffer and our revenue would decrease. In addition, if any of our key employees joins a competitor or decides to otherwise compete with us, we may experience a material disruption of our operations and development plans, which may cause us to lose customers or increase operating expenses as the attention of our remaining senior managers is diverted to recruit replacements for the departed key employees.
Because we recognize costs of services as they are incurred and we recognize related services revenue for subscriptions and services sold in a single arrangement ratably, our gross margins may not be indicative of trends in our services business, which increases the difficulty of evaluating our future financial results.
When we sell subscriptions and services in a single arrangement, which is sometimes referred to as a multiple-element arrangement, we recognize the services revenue ratably over the longer of the related subscription term or the estimated expected life of the customer relationship. During 2012 and prior, the Company’s estimated expected life of a customer relationships ranged from three to six years. At December 31, 2012, the Company increased the estimated expected life to just over six years after considering additional renewal history during the year. This will result in services revenue being recognized over a longer period in future years. The Company will continue to evaluate the length of the estimated expected life of our customer relationships as we gain more experience with customer renewals. Future changes in the estimated expected life of our customer relationship periods could result in the recognition of services revenue over a longer or shorter period of time than previously planned, making it difficult to forecast future results. Costs associated with providing these services are recognized as incurred, resulting in variability in our gross margins when costs and revenue are recorded in different periods.
During 2010 and prior years, when we sold services in a separate arrangement after a customer’s initial use of our digital commerce solution, we recognized revenue from those services as one unit of accounting together with the related subscription revenue ratably over the remaining term of the subscription agreement. Costs associated with providing these services were recognized as incurred, resulting in variability in our gross margins as costs and revenue were recorded in different periods. Under new revenue recognition guidance that we adopted on January 1, 2011, we recognize revenue from services sold, or materially modified, together with the costs associated with providing the services, as the services are provided. This will result in our future services revenue being recognized over differing periods, which may make our operating results more difficult to understand and less indicative of trends in our services business.
Our investment portfolio may become impaired by deterioration of the capital markets.
Our cash equivalent and short-term investment portfolio as of December 31, 2012 consisted of corporate bonds and commercial paper, money market mutual funds, municipal securities, certificates of deposit, U.S. agency securities and U.S. Treasury securities. We follow an established investment policy and set of guidelines to monitor and help mitigate our exposure to interest rate and credit risk. The policy sets forth credit quality standards and limits our exposure to any one issuer, as well as our maximum exposure to various asset classes. Should financial market conditions worsen in the future, investments in some financial instruments may pose
30
risks arising from market liquidity and credit concerns. In addition, any deterioration of the capital markets could cause our other income and expense to vary from expectations. As of December 31, 2012, we had no material impairment charges associated with our short-term investment portfolio, and although we believe our current investment portfolio has little risk of material impairment, we cannot predict future market conditions or market liquidity, or credit availability, and can provide no assurance that our investment portfolio will remain materially unimpaired.
Changes in financial accounting standards or practices may cause adverse, unexpected financial reporting fluctuations and affect our reported results of operations.
A change in accounting standards or practices can have a significant effect on our reported results and may even affect our reporting of transactions completed before the change is effective. New accounting pronouncements and varying interpretations of accounting pronouncements have occurred and may occur in the future. Changes to existing rules or the questioning of current practices may adversely affect our reported financial results or the way we conduct our business.
Risks Related to Tax Matters
We are a multinational organization faced with increasingly complex tax issues in many jurisdictions, and we could be obligated to pay additional taxes in various jurisdictions.
As a multinational organization, we may be subject to taxation in several jurisdictions around the world with increasingly complex tax laws, the application of which can be uncertain. The amount of taxes we pay in these jurisdictions could increase substantially as a result of changes in the applicable tax laws, including increased tax rates or revised interpretations of existing tax laws and precedents, which could have a material adverse effect on our liquidity and results of operations. In addition, the authorities in these jurisdictions could review our tax returns and impose additional tax, interest and penalties, and the authorities could claim that various withholding requirements apply to us or our subsidiaries or assert that benefits of tax treaties are not available to us or our subsidiaries, any of which could have a material impact on us and the results of our operations.
Taxing authorities could reallocate our taxable income among our subsidiaries, which could increase our consolidated tax liability.
We conduct global operations through subsidiaries in various tax jurisdictions pursuant to transfer pricing arrangements among our affiliated entities. If two or more affiliated companies are located in different countries, the tax laws or regulations of each country generally will require that transfer prices be the same as those between unrelated companies dealing at arms’ length and that contemporaneous documentation is maintained to support the transfer prices. While we believe that we operate in compliance with applicable transfer pricing laws and intend to continue to do so, our transfer pricing procedures are not binding on applicable tax authorities. If tax authorities in any of these countries were to successfully challenge our transfer prices as not reflecting arms’ length transactions, they could require us to adjust our transfer prices and thereby reallocate our income to reflect these revised transfer prices, which could result in a higher tax liability to us. In addition, if the country from which the income is reallocated does not agree with the reallocation, both countries could tax the same income, resulting in double taxation. If tax authorities were to allocate income to a higher tax jurisdiction, subject our income to double taxation or assess interest and penalties, it would increase our consolidated tax liability, which could adversely affect our financial condition, results of operations and cash flows.
Our ability to use net operating loss carryforwards to reduce future tax payments may be limited if we experience a change in ownership, or if taxable income does not reach sufficient levels.
Under Section 382 of the Internal Revenue Code of 1986, as amended, if a corporation undergoes an “ownership change” (generally defined as a greater than 50% change (by value) in its equity ownership over a three year period), the corporation’s ability to use its pre-change net operating loss carryforwards and other pre-change tax attributes (such as research tax credits) to offset its post-change income may be limited. We may
31
experience ownership changes in the future and subsequent shifts in our stock ownership. As a result, we may be limited in the portion of net operating loss carryforwards that we can use in the future to offset taxable income for U.S. Federal income tax purposes.
Risks Related To Our Common Stock
An active trading market for our common stock may not be sustained, and the trading price of our common stock may be volatile.
Our shares of common stock began trading on the New York Stock Exchange on March 15, 2012. Given the limited trading history of our common stock, there is a risk that an active trading market for our common stock will not be sustained, which could put downward pressure on the market price of our common stock and thereby affect the ability of our stockholders to sell their shares. In addition, the trading price of our common stock has at times been volatile and could continue to be subject to significant fluctuations in response to various factors, some of which are beyond our control. For example, after opening at $16.00 per share upon the commencement of our initial public offering, our common stock has experienced an intra-day trading high of $34.27 per share and an intra-day trading low of $21.35 per share. In addition, the stock market in general, and the market for technology companies in particular, has experienced extreme price and volume fluctuations that have often been unrelated or disproportionate to the operating performance of the companies operating in such markets. The market price of our common stock may be similarly volatile, and investors in our common stock may experience a decrease in the value of their shares, including as a result of factors unrelated to our operating performance and prospects. The price of our common stock could be subject to wide fluctuations in response to a number of factors, including:
| | • | | our operating performance and the performance of other similar companies; |
| | • | | the overall performance of the equity markets; |
| | • | | developments with respect to intellectual property rights; |
| | • | | publication of unfavorable research reports about us or our industry or withdrawal of research coverage by securities analysts; |
| | • | | speculation in the press or investment community; |
| | • | | the size of our public float; |
| | • | | natural disasters or terrorist acts; |
| | • | | announcements by us or our competitors of significant contracts, new technologies, acquisitions, commercial relationships, joint ventures or capital commitments; and |
| | • | | global economic, legal and regulatory factors unrelated to our performance. |
If securities or industry analysts do not publish, or cease publishing, research or reports about us, our business or our market, or if they publish negative evaluations of our stock, the price of our stock and trading volume could decline.
The trading market for our common stock depends in part on the research and reports that securities or industry analysts publish about us or our business. If one or more of the analysts who covers us downgrades our stock or publishes incorrect or unfavorable research about our business, our stock price would likely decline. In addition, if one or more of these analysts ceases coverage of our company or fails to publish reports on us regularly, demand for our stock could decrease, which could cause our stock price or trading volume to decline.
32
We incur significant costs and demands upon management as a result of complying with the laws and regulations affecting public companies, which could adversely affect our operating results.
As a newly public company, we incur significant legal, accounting and other expenses that we did not incur as a private company, including costs associated with public company reporting and corporate governance requirements. These requirements include compliance with Section 404 and other provisions of the Sarbanes-Oxley Act, as well as rules implemented by the SEC and the New York Stock Exchange. Our management team is adapting to the requirements of being a public company. If these requirements divert our management’s attention from other business concerns, they could have a material adverse effect on our business, prospects, financial condition and operating results. In addition, complying with these rules and regulations has substantially increased our legal and financial compliance expenses, has made some activities more time-consuming and costly, and may in the future require us to reduce costs in other areas of our business or increase the prices of our solution, which could negatively impact our business.
Our principal stockholders have a controlling influence over our business affairs and may make business decisions with which our stockholders disagree and which may adversely affect the value of our stockholders’ investment.
As of December 31, 2012, our executive officers, directors and their affiliates beneficially owned or controlled, directly or indirectly, 17,943,146 shares of common stock in the aggregate (including shares of common stock subject to options exercisable within 60 days of December 31, 2012), or approximately 60% of our outstanding shares. As a result, if some of these persons or entities act together, they will have the ability to control matters submitted to our stockholders for approval, including the election and removal of directors, amendments to our certificate of incorporation and bylaws and the approval of any business combination. These actions may be taken even if they are opposed by other stockholders. This concentration of ownership may also have the effect of delaying or preventing a change of control of our company or discouraging others from making tender offers for our shares, which could prevent our stockholders from receiving a premium for their shares.
The issuance of additional stock in connection with acquisitions, our stock incentive plans, warrants or otherwise will dilute all other stockholdings.
Our certificate of incorporation authorizes us to issue up to 240,000,000 shares of common stock and up to 10,000,000 shares of preferred stock with such rights and preferences as may be determined by our board of directors. Subject to compliance with applicable rules and regulations, we may issue all of these shares that are not already outstanding without any action or approval by our stockholders. We intend to continue to evaluate strategic acquisitions in the future. We may pay for such acquisitions, partly or in full, through the issuance of additional equity. Any issuance of shares in connection with our acquisitions, the exercise of stock options or warrants, the vesting of restricted stock units or otherwise would dilute the percentage ownership held by existing investors.
We do not expect to declare any dividends in the foreseeable future.
We do not anticipate declaring any cash dividends to holders of our common stock in the foreseeable future. In addition, our existing credit facilities prohibit us from paying cash dividends, and any future financing agreements may prohibit us from paying any type of dividends. Consequently, investors may need to sell all or part of their holdings of our common stock after price appreciation, which may never occur, as the only way to realize any future gains on their investment. Investors seeking cash dividends should not purchase our common stock.
Anti-takeover provisions in our charter documents and Delaware law may delay or prevent an acquisition of our company.
Our certificate of incorporation, bylaws and Delaware law contain provisions that may have the effect of delaying or preventing a change in control of us or changes in our management. Our certificate of incorporation
33
and bylaws include provisions that:
| | • | | establishing a classified board of directors with staggered three-year terms so that not all members of our board are elected at one time; |
| | • | | providing that directors may be removed by stockholders only for cause; |
| | • | | limiting the ability of our stockholders to call and bring business before special meetings and to take action by written consent in lieu of a meeting; |
| | • | | requiring advance notice of stockholder proposals for business to be conducted at meetings of our stockholders and for nominations of candidates for election to our board of directors; |
| | • | | authorizing blank check preferred stock, which could be issued with voting, liquidation, dividend and other rights superior to our common stock; and |
| | • | | limiting the liability of, and providing indemnification to, our directors and officers. |
As a Delaware corporation, we are also subject to provisions of Delaware law, including Section 203 of the Delaware General Corporation Law, which prevents some stockholders holding more than 15% of our outstanding common stock from engaging in certain business combinations without approval of the holders of substantially all of our outstanding common stock. Any provision of our amended and restated certificate of incorporation or amended and restated by-laws or Delaware law that has the effect of delaying or deterring a change in control could limit the opportunity for our stockholders to receive a premium for their shares of our common stock, and could also affect the price that some investors are willing to pay for our common stock.
The existence of the foregoing provisions and anti-takeover measures could limit the price that investors might be willing to pay in the future for shares of our common stock. They could also deter potential acquirers of our company, thereby reducing the likelihood that you could receive a premium for your common stock in an acquisition.
To the extent that our pre-tax income or loss is relatively small, our ability to conclude that a control deficiency is not a material weakness or that an accounting error does not require a restatement could be adversely affected.
Under the Sarbanes-Oxley Act of 2002, our management is required to assess the impact of control deficiencies based upon both quantitative and qualitative factors, and depending upon that analysis we classify such identified deficiencies as either a control deficiency, significant deficiency or a material weakness. One element of our analysis of the significance of any control deficiency is its actual or potential financial impact. This assessment will vary depending on our level of pre-tax income or loss. For example, a smaller pre-tax income or loss will increase the likelihood of a quantitative assessment of a control deficiency as a significant deficiency or material weakness. To the extent that our pre-tax income or loss is relatively small, if management or our independent registered public accountants identify an error in our interim or annual financial statements, it is more likely that such an error may be determined to be a material weakness or be considered a material error that could, depending upon the complete quantitative and qualitative analysis, result in our having to restate previously issued financial statements.
Risks Related to Reduced Reporting Requirements
We are an “emerging growth company” and may elect to comply with reduced public company reporting requirements applicable to emerging growth companies, which could make our common stock less attractive to investors.
We are an emerging growth company, as defined in the Jumpstart Our Business Startups Act of 2012, or the JOBS Act, and, for as long as we continue to be an emerging growth company, we may choose to take advantage of exemptions from various reporting requirements applicable to other public companies but not to emerging growth companies, including, but not limited to, not being required to comply with the auditor attestation requirements of Section 404 of the Sarbanes Oxley Act, reduced disclosure obligations regarding executive
34
compensation in our periodic reports and proxy statements, and exemptions from the requirements of holding a nonbinding advisory vote on executive compensation and stockholder approval of any golden parachute payments not previously approved. We will continue to be an emerging growth company until the earliest of (1) the last day of the fiscal year during which we had total annual gross revenues of $1 billion or more (as indexed for inflation in the manner set forth in the JOBS Act), (2) the last day of the fiscal year following the fifth anniversary of the date of our IPO, (3) the date on which we issued more than $1 billion in non-convertible debt in the previous three-year period, or (4) the date on which we became a large accelerated filer as defined in Rule 12b-2 of the Securities Exchange Act of 1934. We cannot predict if investors will find our common stock less attractive if we choose to rely on these exemptions. If some investors find our common stock less attractive as a result of any choices to reduce future disclosure, there may be a less active trading market for our common stock and our stock price may be more volatile.
Under the JOBS Act, emerging growth companies can delay adopting new or revised accounting standards until such time as those standards apply to private companies. However, we have irrevocably elected not to avail ourselves of this exemption from new or revised accounting standards and, therefore, we will be subject to the same new or revised accounting standards as other public companies that are not emerging growth companies.
| ITEM 1B. | UNRESOLVED STAFF COMMENTS |
Not applicable.
Our principal offices are located in Burlington, Massachusetts where we occupy approximately 69,000 square feet of office space under two operating leases, one of which covers approximately 32,000 square feet of office space and expires in July 2017, and the other of which covers approximately 37,000 square feet of office space and expires in October 2019, subject to an early termination option that may be exercised by the sub-landlord, in which case the Company would be required to vacate the premises no later than November 2015. We also have offices in Jena and Munich, Germany, London, England, Utrecht, Netherlands, Paris, France and Shanghai, China to support our international operations. We believe that our facilities are adequate for our current needs and that suitable additional or substitute space will be available as needed to accommodate planned expansion of our operations.
From time to time, we are subject to various legal proceedings that arise in the normal course of our business activities. In addition, from time to time, third parties may assert intellectual property infringement claims against us in the form of letters and other forms of communication. As of the date of this Annual Report on Form 10-K, we are not a party to any litigation the outcome of which, if determined adversely to us, would individually or in the aggregate be reasonably expected to have a material adverse effect on our results of operations, prospects, cash flows, financial position or brand.
| ITEM 4. | MINE SAFETY DISCLOSURES |
Not applicable.
35
PART II
| ITEM 5. | MARKET FOR THE REGISTRANT’S COMMON EQUITY, RELATED STOCKHOLDER MATTERS, AND ISSUER PURCHASES OF EQUITY SECURITIES |
Market for Our Common Stock and Related Stockholder Matters
Our common stock has traded on the New York Stock Exchange under the symbol “DWRE” since March 15, 2012. Prior to that time, there was no public market for our common stock. The following table sets forth for the periods indicated the high and low closing sale prices for our common stock as reported on the New York Stock Exchange.
| | | | | | | | |
| | | Fiscal 2012 | |
| | | High | | | Low | |
First Quarter (from March 15, 2012) | | $ | 31.45 | | | $ | 23.59 | |
Second Quarter | | | 31.11 | | | | 23.69 | |
Third Quarter | | | 32.04 | | | | 22.52 | |
Fourth Quarter | | | 33.93 | | | | 24.64 | |
Holders of Record
As of January 31, 2013 there were 63 stockholders of record of our common stock. Because many of our shares of common stock are held of record by brokers and other institutions on behalf of stockholders, we are unable to estimate the total number of stockholders represented by such record holders.
Dividend Policy
We have never declared or paid, and do not anticipate declaring or paying, any cash dividends on our common stock. Any future determination as to the declaration and payment of dividends will be at the discretion of our board of directors and will depend on then-existing conditions, including our financial condition, operating results, contractual restrictions, capital requirements, business prospects and other factors our board of directors may deem relevant.
36
STOCK PRICE PERFORMANCE GRAPH
The following performance graph and related information shall not be deemed “soliciting material” or “filed” for purposes of Section 18 of the Securities Exchange Act of 1934, as amended, or the Exchange Act, or incorporated by reference into any filing of Demandware, Inc. under the Securities Act of 1933, as amended, or the Exchange Act, except to the extent we specifically incorporate it by reference in such filing.
The following comparative stock performance graph compares (i) the cumulative total stockholder return on our common stock from March 15, 2012 through December 31, 2012 with (ii) the cumulative total return of the Russell 2000 Index and the NASDAQ Computer Index over the same period, assuming the investment of $100 in our common stock and in both of the other indices on March 15, 2012 and the reinvestment of all dividends, if any. The stock price performance reflected on the graph below is not necessarily indicative of future price performance. See the disclosure in Part I, Item 1A. “Risk Factors.”

| | | | | | | | | | | | | | | | | | | | | | | | | | | | | | | | | | | | | | | | | | | | |
| | | 3/15/2012 | | | 3/31/2012 | | | 4/30/2012 | | | 5/31/2012 | | | 6/30/2012 | | | 7/31/2012 | | | 8/31/2012 | | | 9/30/2012 | | | 10/31/2012 | | | 11/30/2012 | | | 12/31/2012 | |
Demandware, Inc. | | $ | 100.00 | | | $ | 126.32 | | | $ | 115.52 | | | $ | 131.88 | | | $ | 100.42 | | | $ | 104.15 | | | $ | 110.22 | | | $ | 134.59 | | | $ | 125.86 | | | $ | 116.11 | | | $ | 115.81 | |
| | | | | | | | | | | |
Russell 2000 Index | | $ | 100.00 | | | $ | 99.95 | | | $ | 98.41 | | | $ | 91.90 | | | $ | 96.48 | | | $ | 95.15 | | | $ | 98.32 | | | $ | 101.55 | | | $ | 98.66 | | | $ | 98.84 | | | $ | 101.97 | |
| | | | | | | | | | | |
NASDAQ Computer Index | | $ | 100.00 | | | $ | 101.06 | | | $ | 98.19 | | | $ | 91.00 | | | $ | 93.95 | | | $ | 94.78 | | | $ | 99.68 | | | $ | 99.98 | | | $ | 93.13 | | | $ | 93.35 | | | $ | 92.98 | |
The comparisons shown in the graph are based upon historical data. We caution that the stock price performance shown in the graph above is not necessarily indicative of, nor is it intended to forecast, the potential future performance of our common stock.
37
Equity Compensation Plan Information
The information required by this item is incorporated by reference to the information disclosed under the caption “Executive Compensation and Related Information” in our Proxy Statement for the 2013 Annual Meeting of Stockholders.
Recent Sales of Unregistered Securities
None.
Use of Proceeds
In March 2012, we completed our initial public offering, or IPO, pursuant to a registration statement on Form S-1 (File No. 333-175595), which the SEC declared effective on March 14, 2012. In the IPO, we issued and sold 6,325,000 shares of common stock, including 825,000 shares of common stock sold pursuant to the underwriters’ option to purchase additional shares, at a public offering price of $16.00 per share, for aggregate gross proceeds to us of $101.2 million. The net offering proceeds to us, after deducting underwriting discounts and offering expenses, were approximately $90.8 million. No offering expenses were paid directly or indirectly to any of our directors or officers (or their associates) or persons owning ten percent or more of any class of our equity securities or to any other affiliates.
There has been no material change in the use of proceeds from our initial public offering as described in our final prospectus filed with the SEC pursuant to Rule 424(b). At December 31, 2012, all expenses incurred in connection with the offering have been paid.
Issuer Purchases of Equity Securities
None.
38
| ITEM 6. | SELECTED FINANCIAL DATA |
The consolidated statements of operations data for the years ended December 31, 2010, 2011 and 2012 and the consolidated balance sheet data at December 31, 2011 and 2012 are derived from our audited consolidated financial statements appearing elsewhere in this Form 10-K. The consolidated statements of operations data for the years ended December 31, 2008 and 2009 and the consolidated balance sheet data at December 31, 2008, 2009 and 2010 are derived from our audited consolidated financial statements that are not included in this Form 10-K.
| | | | | | | | | | | | | | | | | | | | |
| | | Year Ended December 31, | |
| | | 2012 | | | 2011 | | | 2010 | | | 2009 | | | 2008 | |
| | | (in thousands) | |
Consolidated Statements of Operations Data: | | | | | | | | | | | | | | | | | | | | |
Revenue: | | | | | | | | | | | | | | | | | | | | |
Subscription | | $ | 67,930 | | | $ | 47,219 | | | $ | 28,714 | | | $ | 16,085 | | | $ | 4,688 | |
Services | | | 11,545 | | | | 9,328 | | | | 7,976 | | | | 5,312 | | | | 2,783 | |
| | | | | | | | | | | | | | | | | | | | |
Total revenue | | | 79,475 | | | | 56,547 | | | | 36,690 | | | | 21,397 | | | | 7,471 | |
Cost of revenue: | | | | | | | | | | | | | | | | | | | | |
Subscription | | | 13,015 | | | | 9,511 | | | | 6,222 | | | | 3,964 | | | | 3,188 | |
Services | | | 11,326 | | | | 10,196 | | | | 8,282 | | | | 11,533 | | | | 12,435 | |
| | | | | | | | | | | | | | | | | | | | |
Total cost of revenue | | | 24,341 | | | | 19,707 | | | | 14,504 | | | | 15,497 | | | | 15,623 | |
| | | | | | | | | | | | | | | | | | | | |
Gross profit (loss) | | | 55,134 | | | | 36,840 | | | | 22,186 | | | | 5,900 | | | | (8,152 | ) |
Operating expenses: | | | | | | | | | | | | | | | | | | | | |
Sales and marketing | | | 33,496 | | | | 19,847 | | | | 10,883 | | | | 7,304 | | | | 8,458 | |
Research and development | | | 15,085 | | | | 11,182 | | | | 6,091 | | | | 4,950 | | | | 5,173 | |
General and administrative | | | 13,712 | | | | 6,567 | | | | 4,179 | | | | 3,729 | | | | 3,025 | |
| | | | | | | | | | | | | | | | | | | | |
Total operating expenses | | | 62,293 | | | | 37,596 | | | | 21,153 | | | | 15,983 | | | | 16,656 | |
| | | | | | | | | | | | | | | | | | | | |
(Loss) income from operations | | | (7,159 | ) | | | (756 | ) | | | 1,033 | | | | (10,083 | ) | | | (24,808 | ) |
Other expense, net | | | (544 | ) | | | (443 | ) | | | (582 | ) | | | (239 | ) | | | (223 | ) |
| | | | | | | | | | | | | | | | | | | | |
(Loss) income before provision for income taxes | | | (7,703 | ) | | | (1,199 | ) | | | 451 | | | | (10,322 | ) | | | (25,031 | ) |
Provision for income taxes | | | 421 | | | | 212 | | | | 142 | | | | 55 | | | | 27 | |
| | | | | | | | | | | | | | | | | | | | |
Net (loss) income | | $ | (8,124 | ) | | $ | (1,411 | ) | | $ | 309 | | | $ | (10,377 | ) | | $ | (25,058 | ) |
| | | | | | | | | | | | | | | | | | | | |
| | | | | | | | | | | | | | | | | | | | |
| | | As of December 31, | |
| | | 2012 | | | 2011 | | | 2010 | | | 2009 | | | 2008 | |
| | | (in thousands) | |
Consolidated Balance Sheet Data: | | | | | | | | | | | | | | | | | | | | |
Cash and cash equivalents | | $ | 58,877 | | | $ | 14,939 | | | $ | 17,148 | | | $ | 7,181 | | | $ | 1,398 | |
Working capital | | | 104,023 | | | | 8,725 | | | | 7,516 | | | | 82 | | | | (7,896 | ) |
Total assets | | | 139,328 | | | | 42,886 | | | | 37,028 | | | | 20,066 | | | | 10,401 | |
Notes payable | | | 2,353 | | | | 1,882 | | | | 1,821 | | | | 767 | | | | — | |
Total preferred stock | | | 0 | | | | 87,603 | | | | 82,329 | | | | 69,844 | | | | 50,675 | |
Total stockholders’ equity (deficit) | | | 94,590 | | | | (84,620 | ) | | | (81,114 | ) | | | (78,344 | ) | | | (64,144 | ) |
39
| ITEM 7. | MANAGEMENT’S DISCUSSION AND ANALYSIS OF FINANCIAL CONDITION AND RESULTS OF OPERATIONS |
The following discussion of our financial condition and results of operations should be read together with the financial statements and the related notes set forth in Item 8,. “Financial Statements and Supplementary Data.” The following discussion also contains forward-looking statements that involve a number of risks and uncertainties. See Part I, “Special Note Regarding Forward-Looking Statements” for a discussion of the forward-looking statements contained below and Part I, Item 1A. “Risk Factors” for a discussion of certain risks that could cause our actual results to differ materially from the results anticipated in such forward-looking statements.
Overview
We are a leading provider of cloud-based digital commerce solutions for retailers and branded manufacturers. Our digital commerce platform, Demandware Commerce, enables customers to establish and execute complex digital commerce strategies that include global expansion, multi-brand rollouts and omni-channel operations. We enable companies to easily design, implement and manage their own customized digital commerce sites, including websites, mobile applications and other digital storefronts. Through our highly scalable and open Demandware Commerce platform, our customers create seamless brand experiences to reach their consumers across all digital touch points globally.
We sell subscriptions to our on-demand software and related services through both a direct sales force and indirect channels. Our current customers consist of retailers and branded consumer product manufacturers that operate principally in the following vertical markets: apparel and footwear, general merchandise, health & beauty, home & garden, toys and sporting goods and other vertical categories.
We were incorporated in 2004, and initially focused on building our cloud-based architecture and merchandising applications to allow us to service our customers. Sales were initially constrained due in part to the reluctance of some large companies to purchase software-as-a-service, or SaaS, solutions because of concerns around security, reliability and control of their digital commerce solutions. However, the market opportunity for our solutions has increased significantly in the last several years, due both to increased acceptance of SaaS, or cloud-based, solutions across large enterprises and to greater recognition of the benefits of our solutions, which include enhanced merchandising functionality, high reliability, safety and security, ease of deployment, reduced time-to-market, flexible site customization, omni-channel distribution capabilities and availability of continual software innovation. From December 31, 2008 to December 31, 2012, the number of customers using our Demandware Commerce platform increased from 23 to 151, a 60.1% compound annual growth rate, or CAGR, and the number of sites operating on our platform increased from 50 to 579, a 84.5% CAGR.
We derive most of our revenue from subscriptions to our on-demand platform and related services. Subscription fees are generally based on a revenue share pricing model, in which our customers pay us a percentage of their total gross revenue that is processed on our platform. As part of their subscription fee, our customers commit to a minimum level of gross revenue to be processed on our platform, from which a minimum monthly, quarterly or annual, non-refundable subscription fee is derived. If a customer processes more gross revenue than their committed minimum level, then the customer is required to pay us additional fees, called overage fees, which are calculated as a percentage of the incremental revenue generated above the committed revenue. While we typically record overage fees each quarter, a significant portion is recorded in the fourth quarter. No refunds or credits are given if a customer processes less gross revenue than the contracted level. Customer contracts are generally non-cancellable for a minimum term that is approximately three years and range up to seven years.
Subscription revenue accounted for 78.3%, 83.5%, and 85.5% of our total revenue during the years ended December 31, 2010, 2011 and 2012, respectively. Subscription revenue is driven primarily by the number of customers we have, the number of digital commerce sites they operate on our platform, the contracted minimum
40
value of our subscription agreements and the gross revenue generated from our customers in excess of their committed minimum levels. To date, revenue generated by our customers’ traditional web e-commerce sites has been the primary driver of our subscription revenue. However, we believe that our omni-channel capabilities, including mobile, social and other digital channels, have been and will continue to be important factors in our new customers’ purchasing decisions and existing customer renewals.
We derive our services revenue from the implementation of our customers’ digital commerce sites, which includes the integration of complementary technologies and adaptation to back-end systems and/or business processes and the configuration and deployment of the site. We also provide training services for individuals who are part of the implementation, maintenance and optimization teams of our customers. In general, it takes approximately six months to implement a new customer site on our platform. Incremental sites for a customer, including for additional brands or geographies, can be implemented in less than one month.
Deferred revenue primarily consists of the unearned portion of billed services fees and fees for our on-demand software. As we invoice nearly all our customers on a monthly or quarterly basis, our deferred revenue balance does not serve as a reliable indicator of our future subscription revenue.
Our revenue growth has been driven by an increased number of customers, as well as an increase in our average subscription revenue per customer. We have increased the number of customers operating on our platform from 23 as of December 31, 2008 to 151 as of December 31, 2012. In addition, our average revenue per customer has continued to increase as our customers grow their online revenue processed on our platform through organic revenue growth of existing sites and the launching of new sites in new geographies or for new brands. The number of sites that our customers operate on our platform increased from 50 as of December 31, 2008 to 579 as of December 31, 2012. Our revenue from outside the United States as a percentage of total revenue was 51.3%, 49.7% and 45.4% for the years ended December 31, 2010, 2011 and 2012, respectively.
Our subscription revenue fluctuates as a result of seasonal variations in our business, principally due to our customers’ revenue peaks during the holiday season, which correspondingly result in higher overage fees in the fourth quarter than in other quarters. As a result, revenue in the first quarter generally declines sequentially from the fourth quarter. For the quarter ended March 31, 2012, subscription revenue was 16.6% lower than subscription revenue for the quarter ended December 31, 2011.
Our cost of revenue and operating expenses have increased in absolute dollars over the last year due to our need to increase bandwidth and capacity to support customer revenue growth on our platform. We expect that our cost of revenue and operating expenses will continue to increase in absolute dollars as we continue to invest in our growth and incur additional costs as a public company.
We believe the large and growing market for cloud-based digital commerce solutions will provide us with significant growth opportunities. As digital commerce transactions continue to account for a greater proportion of all retail sales, we believe that retailers and branded consumer product manufacturers will continue to enhance the performance and functionality of their digital commerce sites, increase their number of sites and expand their online presence to encompass multiple digital channels such as in-store digital solutions. Just as companies have increasingly chosen cloud-based solutions as an attractive alternative to costly and inflexible on-premise solutions for their enterprise-wide applications, we believe that retailers and branded consumer product manufacturers will increasingly adopt cloud-based solutions for their digital commerce needs.
We are focused on growing our business by pursuing the significant market opportunity for cloud-based digital commerce solutions. We plan to grow our revenue by adding new customers and helping our existing customers increase their revenue processed on our platform by taking full advantage of the functionality of Demandware Commerce, by increasing the number of sites deployed by them and by extending their online presence across multiple channels, including mobile applications, social networks, call centers and in-store applications. We also plan to expand our customer base to include industry sectors, customer segments and geographic regions beyond those which we currently serve.
41
Initial Public Offering
In March 2012, we completed our initial public offering, or IPO, in which we sold 6,325,000 shares of common stock, including 825,000 shares sold pursuant to the underwriters’ option to purchase additional shares, at an offering price of $16.00 per share. Our shares are traded on the New York Stock Exchange. We received proceeds from the IPO of $94.1 million, net of underwriting discounts and commissions, but before offering expenses of $3.3 million.
Key Metrics
We regularly review a number of metrics to evaluate growth trends, measure our performance, formulate financial projections and make strategic decisions. We discuss revenue, gross margin, and the components of operating income and margin below under “Basis of Presentation,” and we discuss other key metrics below.
Number of Customers
We believe that our ability to expand our customer base is an indicator of our market penetration and growth of our business as we continue to invest in our direct sales force, our indirect sales channels and marketing initiatives. We define our number of customers at the end of a particular quarter as the number of customers generating subscription revenue during the period, and who have a committed minimum level of gross revenue to be processed on our platform, from which a minimum monthly, quarterly or annual, non-refundable subscription fee is derived. As of December 31, 2012, we had 151 customers. For more information about our customers, see “Business—Customers.”
Number of Customer Sites
Since our customers generally operate more than one site across various geographies and brands and pay us fees based on the total gross revenue they process on our platform, we believe the total number of customer sites using our solutions in a given quarter is an indicator of the growth of our business. As of December 31, 2012, our customers were operating 579 sites on our platform.
Subscription Dollar Retention Rate
We believe that our ability to retain our customers and expand their digital commerce revenue growth on our software platform over time is an indicator of the stability of our revenue base and the long-term value of our customer relationships. We assess our performance in this area using a metric we refer to as our subscription dollar retention rate. We calculate the subscription dollar retention rate by dividing the retained average contract value of subscription revenue by the previous average contract value of subscription revenue. We define retained average contract value of subscription revenue as the average annual contract value from committed subscription fees for all contracts that renew in a given period. We define previous average contract value of subscription revenue as the average annual contract value from committed subscription fees for all contracts that expire in that same period. Since our customer contracts are typically three years, we have a limited history of quantifying our subscription dollar retention rate. However, although we have lost individual customers from time to time, our customers that have renewed their subscriptions have tended to increase their subscription commitment level to align with their increasing gross revenue volumes. As a result, our subscription dollar retention rate has been above 100% in 2010, 2011 and 2012.
Total Contract Value Backlog
As of December 31, 2012, we had contract backlog, which consists of total committed minimum subscription fees plus our deferred revenue, of approximately $208.2 million compared with backlog of approximately $141.8 million as of December 31, 2011, due largely to the increased number of new customers. Backlog does not include any anticipated overage fees. Because revenue for any period is a function of revenue recognized from deferred revenue and backlog under contracts in existence at the beginning of the period as well as contract renewals and new customer
42
contracts during the period, backlog at the beginning of any period is not necessarily indicative of future performance. Our presentation of backlog may differ from other companies in our industry.
Key Components of Our Results of Operations
Revenue
Subscription Revenue
We derive our subscription revenue from fees paid to us by our customers for their access to our cloud-based digital commerce solutions for a specified period of time. Fees are generally based on a revenue share of the total gross revenue our customers process through their sites operating on our platform, and include a committed level of gross revenue from which a minimum monthly, quarterly or annual, subscription fee is derived. Customer contracts are generally non-cancellable for a minimum period that is typically three years and range up to seven years. If customers process more than their committed gross revenue, then we bill overage fees for the difference between the resulting revenue share and their committed minimum fee at the rates applicable in their contracts for the actual volume of revenue achieved. Overage fees represented 29.4%, 33.9% and 32.7% of subscription revenue for the years ended December 31, 2010, 2011 and 2012, respectively. If customers process less than their committed gross revenue, no credits or refunds are given.
We recognize the minimum subscription fee ratably on a straight-line basis over the subscription term, provided that an enforceable contract has been signed by both parties, access to our software has been granted to the customer, the fee for the subscription is fixed or determinable and collection is reasonably assured. Revenue from overage fees is recognized in the period in which that volume is processed and earned. We also derive revenue from annual solution support fees when the services are first activated. The annual solution support fees are recorded as deferred revenue and recognized as revenue ratably on a straight-line basis over the related subscription term. Set up fees paid by customers in connection with subscription services are deferred and recognized ratably over the longer of the term of the subscription agreement or the estimated expected life of the customer relationship. As we gain more experience with customer renewals, we continue to evaluate the estimated life of our customers. At December 31, 2012, we reassessed the estimated expected life of our customers, increasing it to just over six years, as compared to three to six years in prior periods. See “Critical Accounting Policies and Estimates” for further details of this change in accounting estimate.
Services Revenue
Services revenue consists primarily of fees associated with application configuration, integration and training services. Our service arrangements are billed on a fixed fee or time and materials basis. From time to time, certain of our services projects are subcontracted to third parties. Our customers may also elect to use unrelated third parties to perform these services. Our typical service arrangement provides for payment to us within 30 to 60 days of invoice.
Cost of Revenue
Cost of Subscription Revenue
Cost of subscription revenue primarily consists of hosting costs, data communications expenses, depreciation expenses associated with computer equipment, personnel and related costs, including salaries, bonuses, payroll taxes, recruiting fees and stock compensation, software license fees and amortization expenses associated with capitalized software. In addition, we allocate a portion of overhead, such as rent, information technology, or IT, costs, depreciation and amortization and employee benefits costs, to cost of revenue based on headcount. Expenses related to the depreciation associated with computer equipment, hosting and data communications are affected by the number of customers using our on-demand software, the complexity of their sites and the volume of transactions processed. We plan to continue to significantly expand our capacity to support our growth, which will result in higher cost of subscription revenue in absolute dollars.
43
Cost of Services Revenue
Cost of services revenue primarily consists of personnel and related costs, third-party contractors and allocated overhead. Our cost of services revenue is expensed as the costs are incurred. However, the related revenue from fees we receive for our services performed before a customer is operating on our platform is deferred until the commencement of a subscription and recognized as revenue ratably over the longer of the related subscription term or the estimated expected life of the customer relationship. Therefore, the cost incurred in providing these services is not expensed in the same periods as the revenue is recognized. Our cost associated with providing services has been significantly higher as a percentage of revenue than our cost of subscription revenue.
When we perform our services, we often supplement our internal resources with third-party contractors. We also work with a variety of system integrators who sometimes lead implementation efforts. Finally, we have strategic relationships with companies who provide a full-service, comprehensive, end-to-end e-commerce solution by combining our Demandware Commerce platform with a host of complementary services and technologies, such as logistics and warehousing, and who also lead implementation efforts as part of this comprehensive service. The cost of these services will fluctuate from quarter to quarter based on the number of customers that are in the process of implementation, and also based on the extent to which the services are implemented by us or a third party. We expect gross margins from services to decline over time as we grow our customer acquisition efforts, which we expect to result in increased services costs in absolute dollars.
Operating Expenses
Sales and Marketing
Sales and marketing expenses consist primarily of personnel and related expenses for our sales and marketing staff, including salaries, benefits, bonuses, stock-based compensation and commissions; costs of marketing and promotional events, corporate communications, online marketing, product marketing and other brand-building activities; and allocated overhead. We expense sales commissions when the customer contract is signed because our obligation to pay a sales commission arises at that time.
We intend to continue to invest in sales and marketing and expect spending in these areas to increase in absolute dollars and as a percentage of revenue as we continue to expand our business both domestically and internationally. We expect sales and marketing expenses to continue to be among the most significant components of our operating expenses.
Research and Development
Research and development expenses consist primarily of personnel and related expenses for our research and development staff, including salaries, benefits, bonuses and stock-based compensation; the cost of certain third-party contractors; and allocated overhead. Research and development costs, other than software development expenses qualifying for capitalization, are expensed as incurred.
We have focused our research and development efforts on continuously improving our platform, including feature innovation as well as platform extension. We believe that our research and development activities are efficient, because we benefit from maintaining a single software code base. We expect research and development expenses to increase in absolute dollars and as a percentage of revenue as we add new functionality on the platform and expand our network infrastructure.
General and Administrative
General and administrative expenses consist primarily of personnel and related expenses for administrative, finance, IT, legal and human resource staffs, including salaries, benefits, bonuses and stock-based compensation; professional fees; insurance premiums; other corporate expenses; and allocated overhead.
44
We expect our general and administrative expenses to increase as we continue to expand our operations, hire additional personnel and incur costs as a public company. We expect to incur additional expenses related to increased outside legal counsel assistance, accounting and auditing activities, compliance with Securities and Exchange Commission, or SEC, requirements and enhancing our internal control environment through the adoption and administration of new corporate policies.
Other (Expense) Income
Interest Income
Interest income consists of interest income and realized gains and realized losses on our cash equivalents, and investments in marketable securities
Interest Expense
Interest expense consists primarily of interest expense from borrowings under our credit facility and our promissory notes; and amortization of debt issuance costs.
Other (Expense) Income
Other (expense) income, net consists of income and expense associated with fluctuations in foreign currency exchange rates and changes in fair value of preferred stock warrant liabilities. We expect other (expense) income to vary depending on the movement in foreign currency exchange rates and the related impact on our foreign exchange gain (loss). The preferred warrant liability was the result of a warrant issued in connection with our long-term debt financing. At the closing of the IPO, the warrant automatically converted into a warrant to purchase 23,092 shares of the Company’s common stock at an exercise price of $3.90 per share. The fair value of the warrant was $0.5 million, which was reclassified as a component of additional paid-in capital and as a result, we will no longer record any changes in the fair value of these liabilities in our statements of operations.
Provision for Income Taxes
The provision for income taxes is related to certain foreign income taxes. As we have incurred operating losses in all periods to date and recorded a full valuation allowance against our U.S. federal and state net deferred tax assets, we have not historically recorded a provision for federal and state income taxes.
Critical Accounting Policies and Estimates
Our financial statements and the related notes included elsewhere in this Form 10-K are prepared in accordance with generally accepted accounting principles in the United States. The preparation of these financial statements requires us to make estimates and assumptions that affect the reported amounts of assets, liabilities, revenue, cost of revenue, operating expenses, other income and expenses, provision for income taxes and related disclosures. We base our estimates on historical experience and on various other assumptions that we believe to be reasonable under the circumstances. Changes in accounting estimates are reasonably likely to occur from period to period. Accordingly, actual results could differ significantly from our estimates. We evaluate our estimates and assumptions on an ongoing basis. To the extent that there are material differences between our estimates and our actual results, our future financial statement presentation, financial condition, results of operations and cash flows will be affected.
We believe the assumptions and estimates associated with the following accounting policies have the greatest potential impact on our financial statements: revenue recognition and deferred revenue; accounting for stock based compensation; and income taxes.
45
Revenue Recognition and Deferred Revenue
Our revenue is derived from sales of subscriptions to our cloud-based digital commerce solutions and related services. We recognize revenue when: (i) persuasive evidence of an arrangement for the sale of our digital commerce solutions or services exists, (ii) our digital commerce solutions have been made available or delivered, (iii) the sales price is fixed or determinable, and (iv) collectability is reasonably assured. Evidence of an arrangement consists of a signed customer contract. We consider delivery of our digital commerce solutions to have commenced once a customer launches an initial site, or at the commencement of a subscription term, whichever is sooner, but in either case, not until our digital commerce solutions are made available to our customers for their use. Our fees are fixed based on stated revenue share rates specified in the customer contract. We assess collectability based in part on an analysis of the creditworthiness of each customer, as well as other relevant economic or financial factors. If we do not consider collection reasonably assured, we defer the revenue until the fees are actually collected.
Subscription fees are generally based on a revenue share pricing model, whereby our customers pay us a percentage of their total gross revenue that is processed on our platform. Subscription revenue primarily consists of fees derived from contractually committed minimum levels of gross revenue processed on our platform and fees derived from our customers’ gross revenue processed above minimum contracted levels. Customers do not have the contractual right to take possession of our on-demand software. Accordingly, we recognize the minimum subscription fee on a straight-line basis over the subscription term, provided that an enforceable contract has been signed by both parties, access to our software has been granted to the customer, the fee for the subscription is fixed or determinable and collection is reasonably assured. Should a customer exceed the specified contractual gross revenue volume, the customer is required to pay us additional fees, or overage fees, for the difference between the resulting revenue share and their committed minimum fee. We recognize revenue for overage fees in the period in which the revenue is processed and earned. We do not recognize revenue in excess of the amount we have a right to invoice within an annual subscription year. Set up fees are deferred and recognized ratably over the longer of the term of the subscription agreement or the estimated expected life of the customer relationship, as discussed below.
We also derive revenue from services related to the subscription to our digital commerce solutions. Services revenue consists primarily of fees associated with application configuration, integration and training. Our services are performed by us directly, or by third party service providers, distributors or customers themselves without our involvement. Services that are sold with the subscription prior to the customer’s use of our digital commerce platform are recognized ratably over the longer of the term of the subscription agreement or estimated expected life of the customer relationship. As we gain more experience with customer renewals, we continue to evaluate the estimated life of our customers. At December 31, 2012, we reassessed the estimated expected life of our customers, increasing it to just over six years. We determined this change in accounting estimate was appropriate due to the increased amount of renewal history available, which provided better insight and improved judgment in determining the estimate. Previously, our estimated expected customer life ranged from three to six years. This change in accounting estimate will affect the amortization period in future periods, and did not affect net income or related per-share amounts in any of the current periods. We have reclassified $2.1 million of short term deferred revenue to long term within the Consolidated Balance Sheet as of December 31, 2012. We will continue to evaluate the length of the amortization period and it is possible that, in the future, the estimated expected customer life may change and, if so, the period of amortization will be adjusted.
In the first quarter of 2011 we adopted, on a prospective basis, Accounting Standards Update 2009-13 “Revenue Recognition (Topic 605)—Multiple-Deliverable Revenue Arrangements — a Consensus of the Emerging Issues Task Force,” or ASU 2009-13, formerly known as EITF 08-1, “Revenue Arrangements with Multiple Deliverables,” which amended the accounting guidance for multiple-deliverable revenue arrangements to:
| | • | | provide updated guidance on whether multiple deliverables exist, how the deliverables in an arrangement should be separated, and how the consideration should be allocated; |
46
| | • | | require an entity to allocate revenue in an arrangement using estimated selling prices, or ESP of each deliverable if a vendor does not have vendor-specific objective evidence of selling price, or VSOE, or third-party evidence of selling price, or TPE; and |
| | • | | eliminate the use of the residual method and require a vendor to allocate revenue using the relative selling price method. |
Our services that are sold after a customer launches its initial digital commerce site, which are to assist customers with the configuration and integration of our solution, have standalone value because our customers who purchase these services are already operating on our platform. Beginning on January 1, 2011, services that are sold after a customer launches an initial site are billed and recognized as revenue as the services are provided. Prior to the adoption of ASU 2009-13, we did not have VSOE or TPE for the minimum subscription fees earned for the use of our cloud-based digital commerce platform and such fees were considered to be an undelivered element for which fair value had not been established in accordance with FASB ASC 605-25-25 Revenue Recognition—Multiple Element Arrangements. In addition, we were not able to establish VSOE or TPE for our services that were sold after the initial contract. As a result, we recognized these services ratably over the remaining contract period. Our digital commerce solution has standalone value because once a customer launches a site our solution is fully functional and does not require any additional development, modification or customization.
We are not able to determine VSOE or TPE for our deliverables because we have determined that there are no third-party offerings reasonably comparable to our solution. Accordingly, we determine the selling prices of subscriptions to our solution and services based on ESP. In determining ESP for subscriptions to our solution, we consider the size of customer arrangements, as measured by the volume of gross revenues processed by our customers, whether the sales were made by our direct sales team or distributors and whether the sales are to domestic or international customers. We group sales of our solution into multiple different categories based on these criteria. We then compute an average selling price for each group. This average selling price represents our ESP for that type of customer arrangement. In determining ESP for services, we analyze standalone purchases of services made subsequent to the original subscription. For these services arrangements, we then examine the actual rate per hour we charge or, for fixed fee arrangements, the implied average rate per hour based on the fixed fee divided by the estimated hours to complete the service. The ESP is the product of this average rate per hour and our estimate of the hours needed to complete the services. In evaluating and arriving at ESP for services, we also consider the reasonableness of the implied gross margins, as indicated by our internal costs to deliver such services, as well as comparisons to rates per hour for information technology consulting services in our industry generally.
The determination of ESP for our deliverables as described above requires us to make significant estimates and judgments, including the comparability of different subscription arrangements and services and estimates of the hours required to complete various types of services. In addition, we consider other factors including the following:
| | • | | Size and nature of the deliverables. In categorizing our subscriptions into meaningful groupings for determining ESP, we consider the size of the customer’s digital commerce business, the number of sites launched and the committed minimum subscription fee. For services, we consider the extent of the services provided and the estimated hours required to complete the service based on our historical experience. |
| | • | | Customer location. Our pricing is different for domestic and international customers, and therefore in determining ESP of subscriptions to our solution, we evaluate domestic arrangements separately from international arrangements. |
| | • | | Market conditions and competitive landscape for the sale.Our pricing and discounting varies based on the economic environment and competition. We consider these factors in determining the grouping of comparable services and the periods over which we compare arrangements to compute the ESP. |
| | • | | Internal costs.Our pricing for our digital commerce solution and services considers our internal costs to provide the services. |
47
After we determine the fair value of revenue allocable to each deliverable based on the relative selling price method for bundled arrangements, we recognize the revenue for each deliverable based on the type of deliverable. For subscriptions to our solution, we recognize the revenue on a straight-line basis over the term of the customer agreement, which is typically three years. For services sold after a customer launches its initial site, we generally recognize revenue using the proportional performance method over the period the services are performed.
Deferred revenue represents amounts billed to customers for which revenue has not been recognized. Deferred revenue consists of the unearned portion of services fees or the unearned portion of fees from subscriptions to our cloud-based digital commerce solutions.
Accounting for Stock-Based Compensation
We account for stock-based awards granted to employees and directors by recording compensation expense based on the awards’ estimated fair values. We expect that our expense related to stock-based compensation will increase over time.
We estimate the fair value of our stock-based awards as of the date of grant using the Black-Scholes option-pricing model. Determining the fair value of stock-based awards under this model requires judgment, including estimating the value per share of our common stock, volatility, expected term of the awards, estimated dividend yield and the risk-free interest rate. The assumptions used in calculating the fair value of stock-based awards represent our best estimates, based on management’s judgment and subjective future expectations. These estimates involve inherent uncertainties. If any of the assumptions used in the model change significantly, stock-based compensation recorded for future awards may differ materially from that recorded for awards granted previously.
Prior to our initial public offering, given the absence of an active market for our common stock, our board of directors was required to estimate the fair value of our common stock at the time of each grant of stock-based awards. From 2007 through the closing of our initial public offering, our management regularly commissioned an independent third party valuation firm to prepare contemporaneous valuation analyses near the time of each grant to assist our board of directors in this determination.
In determining the fair value of our stock-based awards, we base the majority of its estimate of expected volatility using volatility data from comparable public companies in similar industries and markets because there is currently limited public market history for the our common stock, and therefore, a lack of market-based company-specific historical and implied volatility information. The risk-free interest rate assumption was based on the U.S. Treasury zero-coupon bonds with maturities similar to those of the expected term of the award being valued. The assumed dividend yield is based on our expectation of not paying dividends in the foreseeable future. The weighted-average expected life for employee options reflects the application of the simplified method, which represents the average of the contractual term of the options and the weighted-average vesting period for all option tranches. The simplified method has been used since we do not have sufficient historical exercise data to provide a reasonable basis upon which to estimate expected term due to a limited period of the Company’s life.
Once we have determined the estimated fair value of our stock-based awards, we recognize the portion of that value that corresponds to the portion of the award that is ultimately expected to vest, taking estimated forfeitures into account. This amount is recognized as an expense over the vesting period of the award using the straight-line method. We estimate forfeitures based upon our historical experience and, at each period, review the estimated forfeiture rate and make changes as factors affecting the forfeiture rate calculations and assumptions change.
Stock-based compensation expense is expected to increase in 2013 compared to 2012 as a result of our existing unrecognized stock-based compensation and as we issue additional stock-based awards to continue to attract and retain employees.
48
Accounting for Income Taxes
We use the liability method of accounting for income taxes. Under the liability method, deferred taxes are determined based on the temporary differences between the financial statement and tax bases of assets and liabilities, using tax rates expected to be in effect during the years in which the bases differences are expected to reverse. We record a valuation allowance when it is not more likely than not that some of our net deferred tax assets will be realized. In determining the need for valuation allowances, we consider our projected future taxable income and the availability of tax planning strategies. We have recorded a full valuation allowance to reduce our net deferred tax assets to zero, because we have determined that it is not more likely than not that any of our net deferred tax assets will be realized. If in the future we determine that we will be able to realize any of our net deferred tax assets, we will make an adjustment to the allowance, which would increase our income in the period that the determination is made.
We have assessed our income tax positions and recorded tax benefits for all years subject to examination, based upon our evaluation of the facts, circumstances and information available at each period end. For those tax positions where we have determined there is greater than 50% likelihood that a tax benefit will be sustained, we have recorded the largest amount of tax benefit that has a likelihood of greater than 50% of being realized upon ultimate settlement with a taxing authority that has full knowledge of all relevant information. For those income tax positions where we have determined there is a less than 50% likelihood that a tax benefit will be sustained, no tax benefit has been recognized in our financial statements.
Results of Operations
The following table sets forth our statements of operations data for each of the periods indicated as a percentage of revenue. The period-to-period comparison of financial results is not necessarily indicative of future results.
| | | | | | | | | | | | |
| | | Year Ended December 31, | |
| | | 2012 | | | 2011 | | | 2010 | |
Consolidated Statements of Operations Data: | | | | | | | | | | | | |
Revenue: | | | | | | | | | | | | |
Subscription | | | 85.5 | % | | | 83.5 | % | | | 78.3 | % |
Services | | | 14.5 | | | | 16.5 | | | | 21.7 | |
| | | | | | | | | | | | |
Total revenue | | | 100.0 | | | | 100.0 | | | | 100.0 | |
Cost of revenue: | | | | | | | | | | | | |
Subscription | | | 16.4 | | | | 16.8 | | | | 17.0 | |
Services | | | 14.2 | | | | 18.0 | | | | 22.6 | |
| | | | | | | | | | | | |
Total cost of revenue | | | 30.6 | | | | 34.8 | | | | 39.6 | |
| | | | | | | | | | | | |
Gross profit | | | 69.4 | | | | 65.2 | | | | 60.4 | |
Operating expenses: | | | | | | | | | | | | |
Sales and marketing | | | 42.1 | | | | 35.1 | | | | 29.7 | |
Research and development | | | 19.0 | | | | 19.8 | | | | 16.6 | |
General and administrative | | | 17.3 | | | | 11.6 | | | | 11.4 | |
| | | | | | | | | | | | |
Total operating expenses | | | 78.4 | | | | 66.5 | | | | 57.7 | |
| | | | | | | | | | | | |
(Loss) income from operations | | | (9.0 | ) | | | (1.3 | ) | | | 2.7 | |
Other expense, net | | | (0.7 | ) | | | (0.8 | ) | | | (1.6 | ) |
| | | | | | | | | | | | |
(Loss) income before provision for income taxes | | | (9.7 | ) | | | (2.1 | ) | | | 1.1 | |
Provision for income taxes | | | 0.5 | | | | 0.4 | | | | 0.4 | |
| | | | | | | | | | | | |
Net (loss) income | | | (10.2 | )% | | | (2.5 | )% | | | 0.7 | % |
| | | | | | | | | | | | |
49
Comparison of Years Ended December 31, 2012, 2011 and 2010
Revenue
| | | | | | | | | | | | | | | | | | | | | | | | | | | | |
| | | Year Ended December 31, | | | Change from
2011 to 2012 | | | Change from
2010 to 2011 | |
| | | 2012 | | | 2011 | | | 2010 | | | $ | | | % | | | $ | | | % | |
| | | (dollars in thousands) | |
Subscription revenue | | $ | 67,930 | | | $ | 47,219 | | | $ | 28,714 | | | $ | 20,711 | | | | 43.9 | % | | $ | 18,505 | | | | 64.4 | % |
Percentage of total revenue | | | 85.5 | % | | | 83.5 | % | | | 78.3 | % | | | | | | | | | | | | | | | | |
Services revenue | | $ | 11,545 | | | $ | 9,328 | | | $ | 7,976 | | | $ | 2,217 | | | | 23.8 | % | | $ | 1,352 | | | | 17.0 | % |
Percentage of total revenue | | | 14.5 | % | | | 16.5 | % | | | 21.7 | % | | | | | | | | | | | | | | | | |
Subscription revenue. Subscription revenue increased by $20.7 million, or 43.9%, from 2011 to 2012. The increase was driven primarily by an increase of $17.1 million in revenue from new customers. We had 151 customers and 579 sites operating on our platform as of December 31, 2012, an increase from 101 customers and 361 sites operating on our platform as of December 31, 2011. In addition, revenue from existing customers net of revenue declines from customer terminations grew $3.7 million from 2011 to 2012. The increase in revenue from existing customers resulted from both organic site growth and the launch of additional sites in 2012. Our customers launched 218 net new sites in 2012, an increase of 49.3% from 146 net new sites in 2011. Revenue realized from overage fees increased from $16.0 million, representing 33.9% of subscription revenue for the year ended December 31, 2011, to $22.2 million, representing 32.7% of subscription revenue for the year ended December 31, 2012.
Subscription revenue increased by $18.5 million, or 64.4%, from 2010 to 2011. The increase was driven primarily by an increase of $13.3 million in revenue from new customers. We had 101 customers and 361 sites operating on our platform as of December 31, 2011, an increase from 69 customers and 215 e-commerce sites operating on our platform as of December 31, 2010. In addition, revenue from existing customers grew $5.2 million from 2010 to 2011. The increase in revenue from existing customers resulted from both organic site growth and the launch of additional sites in 2011. Our customers launched 146 net new sites in 2011, an increase of 31.5% from 111 net new sites in 2010. Revenue realized from overage fees increased from $8.4 million, representing 29.4% of subscription revenue for the year ended December 31, 2010, to $16.0 million, representing 33.9% of subscription revenue for the year ended December 31, 2011.
Services revenue. Services revenue increased $2.2 million, or 23.8%, from 2011 to 2012. The increase was driven by an increase in the number of customers for which we recognized revenue from service engagements sold with the subscription prior to the customer’s initial site launch on our digital commerce platform. We accelerated $0.8 million of deferred revenue from neckermann.de GmbH in the fourth quarter of 2012 that we would otherwise have recognized in 2013 because this customer commenced formal insolvency proceedings and, as a result of such filing, we terminated the subscription agreement with this customer. Additionally, the increase was driven by an increase of $0.5 million more in services performed after our customers launched their sites on our platform compared to the 2011 period. Moreover, fees received from sponsors of and participants attending our global customer conference increased $0.3 million during the same period of 2012 over 2011. Additionally, we recognized $0.4 million during 2012 from our LINK partner membership program. No such fee-based membership program existed in 2011.
Services revenue increased $1.4 million, or 17.0%, from 2010 to 2011. On January 1, 2011, we began recognizing revenue from service arrangements entered into by our customers after their initial site launch as the services were performed using a proportional performance model, which for the year ended December 31, 2011, increased revenue by $1.4 million over what would have been recognized under the prior guidance applied in 2010. In addition, the increase was driven by a higher number of customers for which we recognized revenue from service engagements sold with the subscription prior to the customer’s initial site launch on our digital commerce platform. We recognized services revenue from 83 customers in 2011, while in 2010 we recognized
50
services revenue from 54 customers. The increases in services revenue were partially offset by a decrease in revenue as a result of longer recognition periods in 2011 for pre-launch services recognized ratably over the longer of the term of the subscription agreement or estimated expected life of the customer relationship, which ranged from three to six years during the years ended December 31, 2012, 2011 and 2010.
Cost of Revenue
| | | | | | | | | | | | | | | | | | | | | | | | | | | | |
| | | Year Ended December 31, | | | Change from
2011 to 2012 | | | Change from
2010 to 2011 | |
| | | 2012 | | | 2011 | | | 2010 | | | $ | | | % | | | $ | | | % | |
| | | (dollars in thousands) | |
Cost of subscription revenue | | $ | 13,015 | | | $ | 9,511 | | | $ | 6,222 | | | $ | 3,504 | | | | 36.8 | % | | $ | 3,289 | | | | 52.9 | % |
Percentage of subscription revenue | | | 19.2 | % | | | 20.1 | % | | | 21.7 | % | | | | | | | | | | | | | | | | |
Gross margin | | | 80.8 | % | | | 79.9 | % | | | 78.3 | % | | | | | | | | | | | | | | | | |
Cost of services revenue | | $ | 11,326 | | | $ | 10,196 | | | $ | 8,282 | | | $ | 1,130 | | | | 11.1 | % | | $ | 1,914 | | | | 23.1 | % |
Percentage of services revenue | | | 98.1 | % | | | 109.3 | % | | | 103.8 | % | | | | | | | | | | | | | | | | |
Gross margin | | | 1.9 | % | | | (9.3 | )% | | | (3.8 | )% | | | | | | | | | | | | | | | | |
Cost of subscription revenue. Cost of subscription revenue increased $3.5 million, or 36.8%, from 2011 to 2012. The increase was primarily attributable to $1.1 million of increased depreciation, maintenance, and equipment and software support expenses associated with equipment for our data centers and $1.8 million of increased hosting and bandwidth expenses due to an expansion of our capacity to accommodate the growth during the 2012 period. In addition, we increased our headcount in our support and technical operations team by 19.2% in 2012. As a result, our personnel and related expenses, such as salaries, bonuses, payroll taxes, recruiting fees and stock compensation, increased by $0.9 million in 2012. These expense increases were partially offset by a $0.4 million decrease in a third party license arrangement, which we terminated in 2011.
Cost of subscription revenue increased $3.3 million, or 52.9%, from 2010 to 2011. The increase was primarily attributable to $1.5 million of increased depreciation and maintenance expenses associated with equipment for our data centers and $0.8 million of increased hosting and bandwidth expenses due to an expansion of our capacity to accommodate our growth during 2011. In addition, we increased our headcount in our support and technical operations team by 52.9% in 2011. As a result, our personnel and related expenses, such as salaries, bonuses, payroll taxes, recruiting fees and stock compensation, increased $0.8 million in 2011. Finally, we increased the use of third-party contractors in our support organization, which resulted in a $0.1 million increase in consulting expenses in 2011.
Cost of services revenue. Cost of services revenue increased $1.1 million, or 11.1%, from 2011 to 2012. The increase was primarily attributable to $1.8 million of increased personnel and related expenses due to increased client services headcount due to our expansion into new geographical regions and the increased number of customer implementations conducted in 2012 versus 2011, and $0.2 million of increased allocated overhead costs such as rent, information technology, or IT, costs, and depreciation and amortization expenses incurred as a result of our growth. During the year ended December 31, 2012, we experienced an approximate 26% increase in the average headcount when compared to the year ended December 31, 2011. These increased personnel related and overhead expenses are offset by a $1.0 million decrease in outside consulting expenses, resulting from a decreased use of third-party contractors to assist our direct services implementation teams. While we experienced an increase in the number of customers in the implementation phase during the year ended December 31, 2012, because more of our implementations were lead by third party integrators, the number of implementations performed directly and solely by our client service team decreased by 33% when compared to the prior period. Our increased use of third party integration partners to service our customer implementations has allowed us to enable more customers to launch sites on our platform while minimizing the additional headcount required by us to perform the implementation which has enabled us to control our internal costs.
51
Cost of services revenue increased $1.9 million, or 23.1%, from 2010 to 2011. The increase was primarily attributable to $1.2 million of increased personnel and related expenses due to the addition of employees and $0.6 million of increased outside consulting expenses resulting from an increased use of third-party contractors to implement new customer sites on our platform. The increases in headcount as well as third-party contractors resulted from an increase in the number of customer implementations conducted during 2011. In 2011, we had more customers in the implementation stage, which resulted in a 19% increase in total project hours over 2010.
Operating Expenses
Sales and Marketing
| | | | | | | | | | | | | | | | | | | | | | | | | | | | |
| | | Year Ended December 31, | | | Change from
2011 to 2012 | | | Change from
2010 to 2011 | |
| | | 2012 | | | 2011 | | | 2010 | | | $ | | | % | | | $ | | | % | |
| | | (dollars in thousands) | |
Sales and marketing | | $ | 33,496 | | | $ | 19,847 | | | $ | 10,883 | | | $ | 13,649 | | | | 68.8 | % | | $ | 8,964 | | | | 82.4 | % |
Percentage of total revenue | | | 42.1 | % | | | 35.1 | % | | | 29.7 | % | | | | | | | | | | | | | | | | |
Sales and marketing expenses increased $13.6 million, or 68.8%, from 2011 to 2012. The increase was attributable to the expansion of our sales force to address increased opportunities in new and existing markets. Total headcount within sales and marketing increased from 76 at December 31, 2011 to 120 at December 31, 2012, an increase of 57.9%. We added employees within our direct sales, business development and marketing organizations in both North America and Europe which contributed to $8.8 million of increased personnel and related expenses, of which $1.6 million related to stock compensation expense. In addition, commissions and sales bonuses increased by $1.5 million, or 32.9%, in the 2012 period as a result of an increase in new customers acquired during the 2012 period. Travel expenses also increased $0.4 million in the 2012 period as a result of the increase in headcount. Additionally, marketing program expenses increased $2.0 million in the 2012 period as we increased the size of our annual global customer conference and also increased the level of spending to enhance our global brand. Finally, we incurred $0.8 million of increased allocated overhead costs such as rent, IT costs, and depreciation and amortization expenses incurred as a result of our growth.
Sales and marketing expenses increased $9.0 million, or 82.4%, from 2010 to 2011. The increase was attributable to increases in marketing programs and the expansion of our sales force to address increased opportunities in new and existing markets. Total headcount within sales and marketing increased from 51 at December 31, 2010 to 76 at December 31, 2011, an increase of 49.0%. We added employees within our direct sales, business development and marketing organizations in both North America and Europe, which contributed to $4.4 million of increased personnel and related expenses in 2011. In addition, commissions and sales bonuses increased by $2.3 million, or 172.4%, in 2011 as a result of an increase in new customer contracts acquired during the year. We also incurred $0.8 million of increased marketing program expenses in 2011 to support our expansion of our domestic and international sales activities, including our hosting of a global customer conference in 2011; we did not host a similar conference in 2010. Finally, we incurred $1.0 million of increased travel and entertainment expenses and $0.4 million of increased allocated overhead costs, such as rent, IT costs and depreciation expenses incurred as a result of our growth.
Research and Development
| | | | | | | | | | | | | | | | | | | | | | | | | | | | |
| | | Year Ended December 31, | | | Change from
2011 to 2012 | | | Change from
2010 to 2011 | |
| | | 2012 | | | 2011 | | | 2010 | | | $ | | | % | | | $ | | | % | |
| | | (dollars in thousands) | |
Research and development | | $ | 15,085 | | | $ | 11,182 | | | $ | 6,091 | | | $ | 3,903 | | | | 34.9 | % | | $ | 5,091 | | | | 83.6 | % |
Percentage of total revenue | | | 19.0 | % | | | 19.8 | % | | | 16.6 | % | | | | | | | | | | | | | | | | |
52
Research and development expenses increased $3.9 million, or 34.9%, from 2011 to 2012. The increase was attributable to investments made to enhance and improve the functionality of our digital commerce platform. We increased our engineering headcount by 22.6%, during 2012, which contributed to increased personnel and related expenses of $3.0 million. In addition, we supplemented our internal development efforts with third-party contractors and increased the use of such resources in 2012 in order to accelerate our development efforts. As a result, we incurred increased contractor costs of $0.5 million in 2012. Finally, we incurred $0.4 million of increased allocated overhead costs, such as rent, IT costs and depreciation expenses incurred as a result of our growth.
Research and development expenses increased $5.1 million, or 83.6%, from 2010 to 2011. The increase was attributable to investments made to enhance and improve the functionality of our digital commerce platform. We increased our engineering headcount by 51.4%, during 2011, which contributed to increased personnel and related expenses of $3.1 million. In addition, we supplemented our internal development efforts with third-party contractors and increased the use of such resources in 2011 in order to accelerate our development efforts. As a result, we incurred increased contractor costs of $1.6 million in 2011. Finally, we incurred $0.3 million of increased allocated overhead costs, such as rent, IT costs and depreciation expenses incurred as a result of our growth.
General and Administrative
| | | | | | | | | | | | | | | | | | | | | | | | | | | | |
| | | Year Ended December 31, | | | Change from
2009 to 2010 | | | Change from
2010 to 2011 | |
| | | 2012 | | | 2011 | | | 2010 | | | $ | | | % | | | $ | | | % | |
| | | (dollars in thousands) | |
General and administrative | | $ | 13,712 | | | $ | 6,567 | | | $ | 4,179 | | | $ | 7,145 | | | | 108.8 | % | | $ | 2,388 | | | | 57.1 | % |
Percentage of total revenue | | | 17.3 | % | | | 11.6 | % | | | 11.4 | % | | | | | | | | | | | | | | | | |
General and administrative expenses increased $7.1 million, or 108.8%, from 2011 to 2012. The increase was driven primarily by increased employee-related costs and professional fees to support our growing business. We incurred increased personnel and related costs of $3.8 million, of which $2.2 million related to stock compensation expense, and increased professional fees of $2.0 million for accounting, audit, legal and tax services incurred as a result of our transition from a private company to a public company and to support the expansion and growth of our business. Additionally, our insurance expense increased $0.3 million over the prior period, again as a direct result of our transition from a private company to a public company. We also incurred $0.6 million of increased allocated overhead costs, such as rent, IT costs and depreciation expenses as a result of our growth as well as increased miscellaneous state taxes of $0.1 million as a result of expanding into new states in the U.S. Finally, we incurred $0.2 million of increased travel expenses as a result of our growth.
General and administrative expenses increased $2.4 million, or 57.1%, from 2010 to 2011. The increase was driven primarily by increased employee-related costs and professional fees to support our growing business. We incurred increased personnel and related costs of $1.2 million and increased professional fees of $0.9 million for accounting, audit, legal and tax services incurred as a result of our growth and our pending transition from a private company to a public company. In addition, we incurred increased expenses of allocated overhead costs of $0.2 million relating to overall increased expenses to support our continual growth. Finally, we recognized a loss of $0.1 million for disposed office furniture in 2011 that we did not incur in 2010.
Other (Expense) Income
| | | | | | | | | | | | | | | | | | | | | | | | | | | | |
| | | Year Ended December 31, | | | Change from
2011 to 2012 | | | Change from
2010 to 2011 | |
| | | 2012 | | | 2011 | | | 2010 | | | $ | | | % | | | $ | | | % | |
| | | (dollars in thousands) | |
Other (expense) income | | $ | (544 | ) | | $ | (443 | ) | | $ | (582 | ) | | $ | (101 | ) | | | (22.8 | )% | | $ | 139 | | | | 23.9 | % |
Percentage of total revenue | | | (0.7 | )% | | | (0.8 | )% | | | (1.6 | )% | | | | | | | | | | | | | | | | |
53
Other (expense) income increased $0.1 million, or 22.8%, from 2011 to 2012. During the 2012 period we incurred $0.4 million in other expense due to the increase in the fair value of our warrant. This was offset by an increase of $0.1 million in foreign exchange gains related to fluctuations in the British pound sterling and Euro in relation to the U.S. Dollar in the 2012 period compared to foreign exchange losses of $0.1 million in the 2011 period. Finally, the increase in other expense was partially offset by a $0.1 million increase in net interest income as the majority of our IPO proceeds were invested in money market funds and marketable securities.
Other (expense) income decreased $0.1 million, or 23.9%, from 2010 to 2011. The decrease was attributable to foreign exchange losses of $0.1 million related to fluctuations in the British pound sterling and Euro in relation to the U.S. Dollar in 2011 compared with foreign exchange losses of $0.5 million in the 2010 period. This decrease was partially offset by an increase in 2011 of $0.2 million in interest expense on our notes payable other expenses related to a number of individually insignificant items.
Liquidity and Capital Resources
| | | | | | | | | | | | |
| | | Year Ended December 31, | |
| | | 2012 | | | 2011 | | | 2010 | |
| | | (in thousands) | |
Net cash provided by operating activities | | $ | 3,077 | | | $ | 711 | | | $ | 4,784 | |
Net cash used in investing activities | | | (52,614 | ) | | | (3,511 | ) | | | (5,163 | ) |
Net cash provided by financing activities | | | 93,406 | | | | 657 | | | | 10,377 | |
Effect of foreign exchange rate changes on cash and equivalents | | | 69 | | | | (66 | ) | | | (31 | ) |
Net increase (decrease) in cash and equivalents | | | 43,938 | | | | (2,209 | ) | | | 9,967 | |
To date, we have financed our operations primarily through the sale of equity securities, including net cash proceeds from our IPO. In March 2012, we closed our initial public offering of 6,325,000 shares of common stock, including 825,000 shares sold pursuant to the underwriters’ option to purchase additional shares, at a public offering price of $16.00 per share. We raised approximately $94.1 million from our IPO, net of our underwriting discounts and commissions but before offering expenses of $3.3 million.
Our cash, cash equivalents and marketable securities totaled $107.1 million at December 31, 2012.
At December 31, 2012, our principal sources of liquidity were $58.9 million of cash and cash equivalents and $1.5 million of borrowings available for eligible equipment purchases under our 2008 Loan Agreement which matures March 2013. The 2008 Loan Agreement is secured by substantially all of our assets, except our intellectual property. The 2008 Loan Agreement also contains various covenants that limit, among other things, indebtedness, investments, liens, transactions and certain mergers and sales of assets. In addition, the loan contains financial covenants that impose a minimum adjusted quick ratio (as defined in the 2008 Loan Agreement) and minimum quarterly revenue targets. We were in compliance with all such covenants at December 31, 2012.
In June 2012, the Company amended the Loan Agreement and increased the available borrowings by an additional $3.0 million for equipment purchases to be made through March 31, 2013. Each advance is payable over 36 months at a fixed rate of 5.50%. Through December 31, 2012, the Company made borrowings under the Loan of $1.5 million.
The Loan Agreement expires in March 2013. We are currently evaluating an extension or amending the Loan Agreement. To the extent that we do not extend or amend our Loan Agreement, or replace it with a new facility that allows us to borrow for eligible equipment purchases, we will need to fund these equipment purchases through our existing cash and cash equivalents.
54
Based on our current level of operations and anticipated growth, we believe our future cash flows from operating activities, existing cash and cash equivalents will provide adequate funds for our ongoing operations for at least the next twelve months. Our future capital requirements will depend on many factors, including our rate of revenue, billings growth and collections, the level of our sales and marketing efforts, the timing and extent of spending to support product development efforts and expansion into new territories, the timing of general and administrative expenses as we grow our administrative infrastructure, the continuing market acceptance of our solution, and potential acquisitions of complementary businesses, services or technologies. To the extent that existing cash and cash from operations are not sufficient to fund our future activities, we may need to raise additional funds. If we make acquisitions of complementary businesses, services or technologies, we could be required to seek additional equity financing or utilize our cash resources.
Depending on certain growth opportunities, we may choose to accelerate investments in sales and marketing, research and development, which may require the use of proceeds from our initial public offering for such additional expansion and expenditures.
Net cash (used in) provided by operating activities. Cash provided by operating activities is significantly influenced by the amount of cash we invest in personnel and infrastructure to support the anticipated growth of our business, the increase in the number of customers using our on-demand software and services and the amount and timing of customer payments. Cash provided by operations has historically resulted from net (loss) income driven by sales of subscriptions to our on-demand software and services and adjusted for non-cash expense items such as depreciation and amortization of property and equipment and stock-based compensation. Our cash flows from operating activities are affected by the seasonality of our business, which results in variations in the timing of, our invoicing of, and our receipt of payments from, our customers. We have generally experienced increased invoicing in the fourth quarter of each year mainly due to billings associated with revenue realized from subscription overage fees. As a result, we have also experienced increased levels of customer payments during the first quarter of each year, related to the customer receipts from fourth quarter invoices. We expect this seasonality and resulting trends in cash flows from operating activities to continue.
Cash provided by operating activities of $3.1 million during 2012 was a result of significant increased sales due to the growth of our business although we have continued to make significant investments in headcount, including costs associated with public company reporting and corporate governance requirements, and other expenses incurred to grow our business. During 2012, $11.5 million, or 141%, of our net loss of $8.1 million consisted of non-cash items, including $7.0 million in stock-based compensation, $3.4 million of depreciation and amortization, $0.4 million of the re-measurement of our preferred stock warrant liability and $0.4 million of deferred rent expense.
Cash provided by operating activities during 2012 also included a $1.2 million increase in accrued expenses and a $1.0 million increase in accounts payable, both attributable to increased expenses associated with the growth of the company. Cash provided by operating activities was partially offset by cash used in operating activities resulting from a $2.3 million increase in accounts receivable attributable to higher billings in the fourth quarter of 2012 due to the growth in our customer base and fourth quarter revenue seasonality, a $1.0 million increase in prepaid and other current assets due to an increase in business activity associated with the growth of our business and the timing of payments to vendors, and a $0.6 million increase in deferred revenue as the number of new customers increases.
Our cash provided by operating activities during 2011 was primarily due to our net loss of $1.4 million, adjusted for $5.0 million in non-cash expenses that included $2.9 million of depreciation and amortization, $1.5 million in stock-based compensation and $0.2 million of deferred rent expense. Additionally, our accrued expenses increased $3.2 million primarily due to the use of third-party consultants assisting our client services team in implementing our new customers onto our platform, commissions owed due to new customer acquisition during the period, and other employee related costs. This source of cash was partially offset by a $5.5 million increase in accounts receivable as a result of higher billings in 2011 and a $0.1 million decrease in deferred revenue from customers who were invoiced annually prior to the beginning of the fiscal year.
55
Our cash provided by operating activities during 2010 was primarily due to our net income of $0.3 million, as our revenue growth, particularly in the fourth quarter, drove net income for the year despite growing operating expenses in 2010 by 32.3%. Cash provided by operating activities was adjusted for $2.9 million in non-cash expenses that included $1.7 million of depreciation and amortization and $1.0 million in stock-based compensation. Working capital uses of cash included a $2.2 million increase in accounts receivable at year end due to higher customer billing volume compared to the prior year mainly due to the increase in revenue from overage fees in the fourth quarter, and a $1.4 million increase in prepaid expense and other assets for prepaid support costs to maintain our increased number of PODs and for value added tax refunds back to us. These uses of cash were offset in part by a $3.6 million increase in deferred revenue, due to more customers on our platform in 2010, a $0.8 million increase in accrued expenses, and a $0.8 million increase in accounts payable due to a higher level of expenses consistent with the overall growth of our business.
Net cash used in investing activities. Our primary investing activities have consisted of capital expenditures to purchase computer equipment and furniture and fixtures in support of expanding our infrastructure and workforce. As our business grows, we expect our capital expenditures and our investment activity to continue to increase.
For the year ended December 31, 2012, cash used in investing activities consisted of $52.6 million, comprised primarily of $63.2 million for purchases of marketable securities and $3.8 million for purchases of property and equipment. These cash outflows were partially offset by the maturity of $14.8 million of marketable securities in 2012. In general, our purchases of property and equipment are primarily for data center equipment and network infrastructure to support our customer base, as well as equipment for supporting our increasing employee headcount.
For the year ended December 31, 2011, cash used in investing activities consisted of $3.5 million for purchases of property and equipment. In general, our purchases of property and equipment are primarily for data center equipment and network infrastructure to support our customer base, as well as equipment for supporting our increasing employee headcount.
For the year ended December 31, 2010, cash used in investing activities consisted primarily of $4.9 million for purchases of property and equipment, primarily for the build out of our data center equipment and network infrastructure to support our customer base, as well as furniture and equipment to build out our corporate offices in Burlington, Massachusetts.
Net cash provided by financing activities. Our primary financing activities have consisted of capital raised to fund our operations as well as proceeds from and payments on equipment debt obligations entered into to finance our property and equipment, primarily equipment used in our data centers. As our business grows, we expect to continue to finance our capital expenditures through equipment debt vehicles.
For the year ended December 31, 2012, cash provided by financing activities primarily consisted of $94.1 million of proceeds from our IPO, net of underwriting discounts and commissions but before offering expenses. In addition, cash provided by financing activities consisted of $1.3 million in proceeds from the exercise of stock options and $2.8 million in proceeds from a note payable in connection with the financing of property and equipment, partially offset by $3.1 million in payments in connection with our equipment debt obligations as well as $1.6 million in legal and audit fees associated with filing our registration statement.
For the year ended December 31, 2011, cash provided by financing activities consisted of $1.6 million in proceeds from the issuance of our common stock in connection with stock option exercises as well as $2.6 million in proceeds from a note payable in connection with the financing of property and equipment, partially offset by $1.9 million in payments in connection with our equipment debt obligations as well as $1.7 million legal and audit fees associated with filing our registration statement.
56
For the year ended December 31, 2010, cash provided by financing activities consisted of $7.4 million in proceeds from the issuance of Series D preferred stock, $1.0 million in proceeds from the issuance of our common stock in connection with stock option exercises, $2.9 million in proceeds from notes payable in connection with the financing of property and equipment, partially offset by $0.9 million in payments in connection with our equipment debt obligations.
Contractual Obligations and Commitments
Our principal commitments consist of obligations under our outstanding debt facilities, leases for our office space, computer equipment, furniture and fixtures, and contractual commitments for hosting and other support services. The following table summarizes these contractual obligations at December 31, 2012 (in thousands):
| | | | | | | | | | | | | | | | | | | | |
| | | Payment Due by Period | |
| | | Total | | | Less than 1
Year | | | 1-3
Years | | | 3-5
Years | | | More than 5
years | |
| | | (in thousands) | |
Operating lease obligations | | $ | 13,607 | | | $ | 2,424 | | | $ | 4,892 | | | $ | 4,149 | | | $ | 2,142 | |
Equipment notes payable | | | 5,374 | | | | 3,021 | | | | 2,353 | | | | — | | | | — | |
Hosting agreements | | | 2,463 | | | | 2,068 | | | | 345 | | | | 50 | | | | — | |
| | | | | | | | | | | | | | | | | | | | |
| | $ | 21,444 | | | $ | 7,513 | | | $ | 7,590 | | | $ | 4,199 | | | $ | 2,142 | |
| | | | | | | | | | | | | | | | | | | | |
At December 31, 2012, liabilities for unrecognized tax benefits of $1.1 million which are attributable to research credits and interest and penalties, are not included in the table above because, due to their nature, there is a high degree of uncertainty regarding the time of future cash outflows and other events that extinguish these liabilities.
Off-Balance Sheet Arrangements
During the periods presented, we did not have any relationships with unconsolidated entities or financial partnerships, such as entities often referred to as structured finance or special purpose entities, which would have been established for the purpose of facilitating off-balance sheet arrangements or other contractually narrow or limited purposes.
ITEM 7A. QUANTITATIVE AND QUALITATIVE DISCLOSURES ABOUT MARKET RISKS
We have operations both within the United States and internationally, and we are exposed to market risks in the ordinary course of our business. These risks primarily include interest rate, foreign exchange and inflation risks, as well as risks relating to changes in the general economic conditions in the countries where we conduct business. To reduce certain of these risks, we monitor the financial condition of our large customers and limit credit exposure by collecting fees in advance and setting credit limits as we deem appropriate. In addition, our investment strategy currently has been to invest in financial instruments that are highly liquid and readily convertible into cash and that mature within three months from the date of purchase. After receiving our proceeds from our initial public offering, we have invested $52.1 million in money market funds, certificates of deposit, and municipal securities with an average maturity of 49 days, classified as cash equivalents, and have invested $48.3 million of U.S. government debt securities, certificates of deposit, municipal securities and corporate debt securities, classified as available-for-sale securities, with maturities ranging between four and twelve months as of December 31, 2012. To date, we have not used derivative instruments to mitigate the impact of our market risk exposures. We have also not used, nor do we intend to use, derivatives for trading or speculative purposes.
Interest Rate Risk
We are exposed to market risk related to changes in interest rates. Our investments are considered cash equivalents and primarily consist of money market funds backed by United States Treasury Bills and certificates
57
of deposit. At December 31, 2012, we had cash and cash equivalents of $58.9 million. The carrying amount of our cash equivalents reasonably approximates fair value, due to the short maturities of these instruments. The primary objectives of our investment activities are the preservation of capital, the fulfillment of liquidity needs and the fiduciary control of cash and investments. We do not enter into investments for trading or speculative purposes. Our investments are exposed to market risk due to a fluctuation in interest rates, which may affect our interest income and the fair market value of our investments. Due to the short-term nature of our investment portfolio, however, we do not believe an immediate 10% increase or decrease in interest rates would have a material effect on the fair market value of our portfolio. We therefore do not expect our operating results or cash flows to be materially affected by a sudden change in market interest rates.
We do not believe our cash equivalents have significant risk of default or illiquidity. While we believe our cash equivalents do not contain excessive risk, we cannot provide absolute assurance that in the future our investments will not be subject to adverse changes in market value. In addition, we maintain significant amounts of cash and cash equivalents at one or more financial institutions that are in excess of federally insured limits. We cannot be assured that we will not experience losses on these deposits.
At December 31, 2012, we had borrowings outstanding with principal amounts of $5.4 million. Our outstanding long-term borrowings consist of fixed interest rate financial instruments. The interest rate of our fixed rate borrowings ranges between 5.3% and 7.25%. The carrying amount of these long-term borrowings approximates fair value based on borrowing rates currently available to us. A hypothetical 10% increase or decrease in interest rates relative to interest rates at December 31, 2012 would not have a material impact on the fair values of all of our outstanding borrowings.
Foreign Currency Exchange Risk
We have foreign currency risks related to our revenue and operating expenses denominated in currencies other than the U.S. Dollar. Our customer contracts are generally denominated in the currencies of the countries in which the customer is located. Our historical revenue has been denominated in U.S. Dollars, the Euro and British Pound Sterling. An immediate 10% adverse change in foreign exchange rates on foreign-denominated accounts receivable at December 31, 2012 would have a 4.1% adverse impact on our total accounts receivable balance at December 31, 2012. Our operating expenses are generally denominated in the currencies of the countries in which our operations are located, primarily the United States and, to a much lesser extent, the United Kingdom, France and Germany. More than one quarter of our employees are employed outside of the United States. Increases and decreases in our foreign denominated revenue from movements in foreign exchange rates are partially offset by the corresponding decreases or increases in our foreign-denominated operating expenses.
As our international operations grow, our risks associated with fluctuation in currency rates will become greater, and we will continue to reassess our approach to managing this risk. In addition, currency fluctuations or a weakening U.S. Dollar can increase the costs of our international expansion. At this time we do not, but we may in the future, enter into derivatives or other financial instruments in an attempt to hedge our foreign currency exchange risk. It is difficult to predict the impact hedging activities would have on our results of operations.
Inflation Risk
We do not believe that inflation has had a material effect on our business, financial condition or results of operations. Nonetheless, if our costs were to become subject to significant inflationary pressures, we may not be able to fully offset such higher costs through price increases. Our inability or failure to do so could harm our business, financial condition and results of operations.
58
| ITEM 8. | FINANCIAL STATEMENTS AND SUPPLEMENTARY DATA |
INDEX TO CONSOLIDATED FINANCIAL STATEMENTS
59
REPORT OF INDEPENDENT REGISTERED PUBLIC ACCOUNTING FIRM
To the Board of Directors and Stockholders of
Demandware, Inc.
Burlington, Massachusetts
We have audited the accompanying consolidated balance sheets of Demandware, Inc. and subsidiaries (the “Company”) as of December 31, 2012 and 2011, and the related consolidated statements of comprehensive (loss) income, stockholders’ equity (deficit), and cash flows for each of the three years in the period ended December 31, 2012. These financial statements are the responsibility of the Company’s management. Our responsibility is to express an opinion on these financial statements based on our audits.
We conducted our audits in accordance with the standards of the Public Company Accounting Oversight Board (United States). Those standards require that we plan and perform the audit to obtain reasonable assurance about whether the financial statements are free of material misstatement. The Company is not required to have, nor were we engaged to perform, an audit of its internal control over financial reporting. Our audits included consideration of internal control over financial reporting as a basis for designing audit procedures that are appropriate in the circumstances, but not for the purpose of expressing an opinion on the effectiveness of the Company’s internal control over financial reporting. Accordingly, we express no such opinion. An audit also includes examining, on a test basis, evidence supporting the amounts and disclosures in the financial statements, assessing the accounting principles used and significant estimates made by management, as well as evaluating the overall financial statement presentation. We believe that our audits provide a reasonable basis for our opinion.
In our opinion, such consolidated financial statements present fairly, in all material respects, the financial position of the Company as of December 31, 2012 and 2011, and the results of its operations and its cash flows for each of the three years in the period ended December 31, 2012, in conformity with accounting principles generally accepted in the United States of America.
/s/ Deloitte & Touche LLP
Boston, Massachusetts
March 8, 2013
60
DEMANDWARE, INC.
CONSOLIDATED BALANCE SHEETS
(in thousands, except per share data)
| | | | | | | | |
| | | December 31,
2012 | | | December 31,
2011 | |
ASSETS | | | | | | | | |
Current assets: | | | | | | | | |
Cash and cash equivalents | | $ | 58,877 | | | $ | 14,939 | |
Short-term investments | | | 48,251 | | | | — | |
Accounts receivable—net of allowance for doubtful accounts and credit memos of $630 and $117 at December 31, 2012 and 2011, respectively | | | 19,214 | | | | 16,930 | |
Prepaid expenses and other current assets | | | 3,452 | | | | 1,878 | |
| | | | | | | | |
Total current assets | | | 129,794 | | | | 33,747 | |
Property and equipment, net | | | 8,377 | | | | 6,404 | |
Other assets | | | 1,157 | | | | 2,735 | |
| | | | | | | | |
Total assets | | $ | 139,328 | | | $ | 42,886 | |
| | | | | | | | |
LIABILITIES, REDEEMABLE CONVERTIBLE PREFERRED STOCK AND STOCKHOLDERS’ EQUITY (DEFICIT) | | | | | | | | |
Current liabilities: | | | | | | | | |
Current portion of notes payable | | $ | 3,021 | | | $ | 2,098 | |
Accounts payable | | | 3,168 | | | | 1,884 | |
Accrued expenses | | | 8,348 | | | | 7,023 | |
Deferred revenue | | | 11,105 | | | | 13,960 | |
Deferred rent | | | 127 | | | | 57 | |
| | | | | | | | |
Total current liabilities | | | 25,769 | | | | 25,022 | |
| | | | | | | | |
Long-term liabilities: | | | | | | | | |
Deferred revenue | | | 15,647 | | | | 12,210 | |
Notes payable | | | 2,353 | | | | 1,882 | |
Deferred rent | | | 969 | | | | 682 | |
Preferred stock warrant liability | | | — | | | | 107 | |
| | | | | | | | |
Total liabilities | | | 44,738 | | | | 39,903 | |
| | | | | | | | |
Commitments and contingencies (Note 8) | | | | | | | | |
Redeemable convertible preferred stock, $0.01 par value per share—54,207 shares authorized at December 31, 2011 | | | | | | | | |
Series A: 0 and 9,564 shares designated at December 31, 2012 and 2011, respectively; 0 and 3,171 shares issued and outstanding at December 31, 2012 and 2011, respectively (liquidation value of $14,994 at December 31, 2011) | | | — | | | | 14,976 | |
Series B: 0 and 11,166 shares designated at December 31, 2012 and 2011, respectively; 0 and 3,722 shares issued and outstanding at December 31, 2012 and 2011, respectively (liquidation value of $18,172 at December 31, 2011) | | | — | | | | 18,158 | |
Series C: 0 and 16,234 shares designated at December 31, 2012 and 2011, respectively; 0 and 5,388 shares issued and outstanding at December 31, 2012 and 2011, respectively (liquidation value of $27,901 at December 31, 2011) | | | — | | | | 27,884 | |
Series D: 0 and 17,243 shares designated at December 31, 2012 and 2011, respectively; 0 and 5,748 shares issued and outstanding at December 31, 2012 and 2011, respectively (liquidation value of $26,667 at December 31, 2011) | | | — | | | | 26,585 | |
| | | | | | | | |
Total redeemable convertible preferred stock | | | — | | | | 87,603 | |
| | | | | | | | |
Stockholders’ equity (deficit): | | | | | | | | |
Preferred stock, $0.01 par value per share—10,000 shares authorized at December 31, 2012, none issued and outstanding | | | — | | | | — | |
Common stock, $0.01 par value per share—240,000 shares and 27,333 shares authorized at December 31, 2012 and 2011, respectively; 29,842 and 4,469 shares issued and outstanding at December 31, 2012 and 2011, respectively | | | 298 | | | | 45 | |
Additional paid-in capital | | | 170,997 | | | | — | |
Accumulated other comprehensive loss | | | (17 | ) | | | (53 | ) |
Accumulated deficit | | | (76,688 | ) | | | (84,612 | ) |
| | | | | | | | |
Total stockholders’ equity (deficit) | | | 94,590 | | | | (84,620 | ) |
| | | | | | | | |
Total liabilities, redeemable convertible preferred stock and stockholders’ equity (deficit) | | $ | 139,328 | | | $ | 42,886 | |
| | | | | | | | |
The accompanying notes are an integral part of these consolidated financial statements.
61
DEMANDWARE, INC.
CONSOLIDATED STATEMENTS OF COMPREHENSIVE (LOSS) INCOME
(in thousands, except per share data)
| | | | | | | | | | | | |
| | | Year Ended December 31, | |
| | | 2012 | | | 2011 | | | 2010 | |
Revenue: | | | | | | | | | | | | |
Subscription | | $ | 67,930 | | | $ | 47,219 | | | $ | 28,714 | |
Services | | | 11,545 | | | | 9,328 | | | | 7,976 | |
| | | | | | | | | | | | |
Total revenue | | | 79,475 | | | | 56,547 | | | | 36,690 | |
Cost of revenue: | | | | | | | | | | | | |
Subscription | | | 13,015 | | | | 9,511 | | | | 6,222 | |
Services | | | 11,326 | | | | 10,196 | | | | 8,282 | |
| | | | | | | | | | | | |
Total cost of revenue | | | 24,341 | | | | 19,707 | | | | 14,504 | |
| | | | | | | | | | | | |
Gross profit | | | 55,134 | | | | 36,840 | | | | 22,186 | |
Operating expenses: | | | | | | | | | | | | |
Sales and marketing | | | 33,496 | | | | 19,847 | | | | 10,883 | |
Research and development | | | 15,085 | | | | 11,182 | | | | 6,091 | |
General and administrative | | | 13,712 | | | | 6,567 | | | | 4,179 | |
| | | | | | | | | | | | |
Total operating expenses | | | 62,293 | | | | 37,596 | | | | 21,153 | |
| | | | | | | | | | | | |
(Loss) income from operations | | | (7,159 | ) | | | (756 | ) | | | 1,033 | |
Other (expense) income: | | | | | | | | | | | | |
Interest income | | | 162 | | | | 8 | | | | 18 | |
Interest expense | | | (355 | ) | | | (280 | ) | | | (144 | ) |
Other expense | | | (351 | ) | | | (171 | ) | | | (456 | ) |
| | | | | | | | | | | | |
Other expense, net | | | (544 | ) | | | (443 | ) | | | (582 | ) |
| | | | | | | | | | | | |
(Loss) income before provision for income taxes | | | (7,703 | ) | | | (1,199 | ) | | | 451 | |
Provision for income taxes | | | 421 | | | | 212 | | | | 142 | |
| | | | | | | | | | | | |
Net (loss) income | | | (8,124 | ) | | | (1,411 | ) | | | 309 | |
Accretion of redeemable preferred stock | | | (1,172 | ) | | | (5,274 | ) | | | (5,106 | ) |
| | | | | | | | | | | | |
Net loss attributable to common stockholders | | $ | (9,296 | ) | | $ | (6,685 | ) | | $ | (4,797 | ) |
| | | | | | | | | | | | |
Net loss per share attributable to common stockholders, basic and diluted | | $ | (0.39 | ) | | $ | (1.75 | ) | | $ | (2.44 | ) |
| | | | | | | | | | | | |
Weighted average common shares outstanding, basic and diluted | | | 24,063 | | | | 3,823 | | | | 1,967 | |
| | | | | | | | | | | | |
Net (loss) income | | $ | (8,124 | ) | | $ | (1,411 | ) | | $ | 309 | |
Other comprehensive income (loss), net of tax: | | | | | | | | | | | | |
Foreign currency translation adjustments | | | 22 | | | | (29 | ) | | | (16 | ) |
Unrealized gains on marketable securities | | | 14 | | | | 0 | | | | 0 | |
| | | | | | | | | | | | |
Comprehensive (loss) income | | $ | (8,088 | ) | | $ | (1,440 | ) | | $ | 293 | |
| | | | | | | | | | | | |
The accompanying notes are an integral part of these consolidated financial statements.
62
DEMANDWARE, INC.
CONSOLIDATED STATEMENTS OF STOCKHOLDERS’ EQUITY (DEFICIT)
(in thousands)
| | | | | | | | | | | | | | | | | | | | | | | | | | | | |
| | | Common Stock
$0.01 par value | | | Additional
Paid-In
Capital | | | Note
Receivable
From
Stockholder | | | Accumulated
Comprehensive
(Loss) Income | | | Accumulated
Deficit | | | Total
Stockholders’
Equity (Deficit) | |
| | | Shares | | | Amount | | | | | | |
BALANCE—January 1, 2010 | | | 1,897 | | | | $ 19 | | | | $ — | | | | $ (72) | | | | $ (8) | | | | $ (78,283) | | | | $ (78,344) | |
Stock-based compensation | | | | | | | | | | | 1,046 | | | | | | | | | | | | | | | | 1,046 | |
Interest accrued on note receivable | | | | | | | | | | | | | | | (2 | ) | | | | | | | | | | | (2 | ) |
Exercise of common stock options | | | 1,041 | | | | 10 | | | | 989 | | | | | | | | | | | | | | | | 999 | |
Accretion of preferred stock to redemption value | | | | | | | | | | | (2,035 | ) | | | | | | | | | | | (3,071 | ) | | | (5,106 | ) |
Net income | | | | | | | | | | | | | | | | | | | | | | | 309 | | | | 309 | |
Other comprehensive losses | | | | | | | | | | | | | | | | | | | (16 | ) | | | | | | | (16 | ) |
| | | | | | | | | | | | | | | | | | | | | | | | | | | | |
BALANCE—December 31, 2010 | | | 2,938 | | | | 29 | | | | — | | | | (74 | ) | | | (24 | ) | | | (81,045 | ) | | | (81,114 | ) |
Stock-based compensation | | | | | | | | | | | 1,489 | | | | | | | | | | | | | | | | 1,489 | |
Forgiveness of note receivable | | | | | | | | | | | | | | | 74 | | | | | | | | | | | | 74 | |
Exercise of common stock options | | | 1,531 | | | | 16 | | | | 1,629 | | | | | | | | | | | | | | | | 1,645 | |
Accretion of preferred stock to redemption value | | | | | | | | | | | (3,118 | ) | | | | | | | | | | | (2,156 | ) | | | (5,274 | ) |
Net loss | | | | | | | | | | | | | | | | | | | | | | | (1,411 | ) | | | (1,411 | ) |
Other comprehensive losses | | | | | | | | | | | | | | | | | | | (29 | ) | | | | | | | (29 | ) |
| | | | | | | | | | | | | | | | | | | | | | | | | | | | |
BALANCE—December 31, 2011 | | | 4,469 | | | | 45 | | | | — | | | | — | | | | (53 | ) | | | (84,612 | ) | | | (84,620 | ) |
Stock-based compensation | | | | | | | | | | | 7,043 | | | | | | | | | | | | | | | | 7,043 | |
Exercise of common stock options | | | 913 | | | | 9 | | | | 1,273 | | | | | | | | | | | | | | | | 1,282 | |
Accretion of preferred stock to redemption value | | | | | | | | | | | (17,220 | ) | | | | | | | | | | | 16,048 | | | | (1,172 | ) |
Vesting of restricted stock | | | 86 | | | | 1 | | | | (1 | ) | | | | | | | | | | | | | | | | |
Exercise of common stock warrant | | | 20 | | | | | | | | | | | | | | | | | | | | | | | | | |
Issuance of common stock in connection with initial public offering, net of issuance costs of $3,279 | | | 6,325 | | | | 63 | | | | 90,774 | | | | | | | | | | | | | | | | 90,837 | |
Conversion of redeemable convertible preferred stock into common stock | | | 18,029 | | | | 180 | | | | 88,595 | | | | | | | | | | | | | | | | 88,775 | |
Reclassification of a warrant to purchase shares of redeemable convertible preferred stock into a warrant to purchase common stock | | | | | | | | | | | 533 | | | | | | | | | | | | | | | | 533 | |
Net loss | | | | | | | | | | | | | | | | | | | | | | | (8,124 | ) | | | (8,124 | ) |
Other comprehensive income | | | | | | | | | | | | | | | | | | | 36 | | | | | | | | 36 | |
| | | | | | | | | | | | | | | | | | | | | | | | | | | | |
BALANCE—December 31, 2012 | | | 29,842 | | | | $ 298 | | | $ | 170,997 | | | | $ — | | | | $ (17) | | | | $ (76,688) | | | | $ 94,590 | |
| | | | | | | | | | | | | | | | | | | | | | | | | | | | |
The accompanying notes are an integral part of these consolidated financial statements.
63
DEMANDWARE, INC.
CONSOLIDATED STATEMENT OF CASH FLOWS
(in thousands)
| | | | | | | | | | | | |
| | | Year Ended December 31, | |
| | | 2012 | | | 2011 | | | 2010 | |
CASH FLOWS FROM OPERATING ACTIVITIES: | | | | | | | | | | | | |
Net (loss) income | | $ | (8,124 | ) | | $ | (1,411 | ) | | $ | 309 | |
Adjustments to reconcile net (loss) income to net cash provided by operating activities: | | | | | | | | | | | | |
Depreciation and amortization | | | 3,439 | | | | 2,884 | | | | 1,734 | |
(Gain) loss on disposal of property and equipment | | | (3 | ) | | | 80 | | | | 1 | |
Re-measurement of preferred stock warrant liability | | | 426 | | | | 49 | | | | (16 | ) |
Stock-based compensation | | | 7,043 | | | | 1,489 | | | | 1,046 | |
Deferred rent expense | | | 357 | | | | 306 | | | | 138 | |
Other non-cash reconciling items | | | 209 | | | | 105 | | | | 4 | |
Changes in operating assets and liabilities: | | | | | | | | | | | | |
Accounts receivable | | | (2,285 | ) | | | (5,355 | ) | | | (2,239 | ) |
Prepaid expenses and other current assets | | | (1,011 | ) | | | (422 | ) | | | (1,093 | ) |
Other long-term assets | | | 203 | | | | (20 | ) | | | (266 | ) |
Accounts payable | | | 1,016 | | | | (108 | ) | | | 752 | |
Accrued expenses | | | 1,224 | | | | 3,213 | | | | 837 | |
Deferred revenue | | | 583 | | | | (99 | ) | | | 3,577 | |
| | | | | | | | | | | | |
Net cash provided by operating activities | | | 3,077 | | | | 711 | | | | 4,784 | |
| | | | | | | | | | | | |
CASH FLOWS FROM INVESTING ACTIVITIES: | | | | | | | | | | | | |
Purchase of property and equipment | | | (3,846 | ) | | | (3,473 | ) | | | (4,877 | ) |
Purchase of marketable securities | | | (63,239 | ) | | | — | | | | — | |
Sale and maturity of marketable securities | | | 14,828 | | | | — | | | | — | |
Proceeds from sale of property and equipment | | | — | | | | 25 | | | | — | |
Increase in restricted cash and other assets | | | (357 | ) | | | (63 | ) | | | (286 | ) |
| | | | | | | | | | | | |
Net cash used in investing activities | | | (52,614 | ) | | | (3,511 | ) | | | (5,163 | ) |
| | | | | | | | | | | | |
CASH FLOWS FROM FINANCING ACTIVITIES: | | | | | | | | | | | | |
Proceeds from initial public offering, net of underwriting discounts and commissions | | | 94,116 | | | | — | | | | — | |
Net proceeds from the issuance of preferred stock | | | — | | | | — | | | | 7,379 | |
Proceeds from exercise of stock options | | | 1,282 | | | | 1,645 | | | | 999 | |
Deferred offering costs | | | (1,604 | ) | | | (1,674 | ) | | | — | |
Proceeds from issuance of notes payable | | | 2,757 | | | | 2,570 | | | | 2,859 | |
Payments of equipment notes | | | (2,674 | ) | | | (1,884 | ) | | | (860 | ) |
Payments of software financing agreement | | | (471 | ) | | | — | | | | — | |
| | | | | | | | | | | | |
Net cash provided by financing activities | | | 93,406 | | | | 657 | | | | 10,377 | |
| | | | | | | | | | | | |
EFFECT OF EXCHANGE RATES ON CASH AND CASH EQUIVALENTS | | | 69 | | | | (66 | ) | | | (31 | ) |
| | | | | | | | | | | | |
INCREASE (DECREASE) IN CASH AND CASH EQUIVALENTS | | | 43,938 | | | | (2,209 | ) | | | 9,967 | |
CASH AND CASH EQUIVALENTS—Beginning of year | | | 14,939 | | | | 17,148 | | | | 7,181 | |
| | | | | | | | | | | | |
CASH AND CASH EQUIVALENTS—End of year | | $ | 58,877 | | | $ | 14,939 | | | $ | 17,148 | |
| | | | | | | | | | | | |
SUPPLEMENTARY INFORMATION: | | | | | | | | | | | | |
Interest paid | | $ | 282 | | | $ | 250 | | | $ | 14 | |
| | | | | | | | | | | | |
Income taxes paid | | $ | 200 | | | $ | 203 | | | $ | 72 | |
| | | | | | | | | | | | |
NONCASH INVESTING AND FINANCING ACTIVITIES: | | | | | | | | | | | | |
Conversion of redeemable convertible preferred stock to common stock | | $ | 88,775 | | | $ | — | | | $ | — | |
Conversion of preferred stock warrant to common stock warrant | | | 533 | | | | — | | | | — | |
Deferred offering costs included in accounts payable and accrued expenses | | | — | | | | 44 | | | | — | |
Purchase of property and equipment included in accounts payable and accrued expenses | | | 350 | | | | — | | | | — | |
Software license acquired by assuming directly related liabilities | | | 1,212 | | | | — | | | | — | |
Software license technical support acquired by assuming directly related liabilities | | | 549 | | | | — | | | | — | |
| | | | | | | | | | | | |
The accompanying notes are an integral part of these consolidated financial statements.
64
DEMANDWARE, INC.
NOTES TO CONSOLIDATED FINANCIAL STATEMENTS
1. ORGANIZATION
Company Overview—Demandware, Inc. (the “Company”) provides cloud-based digital commerce solutions that enable companies to easily design, implement and manage their own customized digital commerce sites, including websites, mobile applications and other digital storefronts. The Company’s customers use its highly scalable and open Demandware Commerce platform to create seamless brand experiences to reach their consumers across all digital touch points globally.
The Company sells subscriptions to its on-demand software and related services through a direct sales force and indirect channels. The Company’s customers consist of retailers and branded consumer product manufacturers that operate principally in the following vertical markets: apparel and footwear, health and beauty, home and garden, sporting goods and general merchandise.
The Company’s headquarters are located in Burlington, Massachusetts. At December 31, 2012 the Company had six subsidiaries: Demandware Securities Corporation, Demandware GmbH, Demandware UK Limited, Demandware SARL and Demandware Hong Kong Limited, each of which is wholly owned by the Company, and Demandware E-Commerce (Shanghai) Limited, a wholly owned subsidiary of Demandware Hong Kong Limited.
Initial Public Offering—In March 2012, the Company closed its initial public offering (“IPO”) of 6,325,000 shares of common stock, including 825,000 shares sold pursuant to the underwriters’ option to purchase additional shares, at an offering price of $16.00 per share. All outstanding shares of the Company’s redeemable convertible preferred stock converted to 18,028,763 shares of common stock at the closing of the IPO. The Company’s common stock trades on the New York Stock Exchange under the symbol “DWRE”. The Company received proceeds from the IPO of $94.1 million, net of underwriting discounts and commissions, but before offering expenses of $3.3 million. Offering expenses at December 31, 2011 of $1.7 million were recorded as other non-current assets. These offering expenses, and additional expenses incurred from January 2012 through the completion of the IPO of approximately $1.6 million, have been reclassified as additional paid-in capital.
2. SUMMARY OF SIGNIFICANT ACCOUNTING POLICIES
Basis of Presentation and Consolidation—The consolidated financial statements include the accounts of the Company and its wholly owned subsidiaries. All intercompany transactions have been eliminated in consolidation.
Use of Estimates—The preparation of consolidated financial statements in conformity with accounting principles generally accepted in the United States of America (GAAP) requires management to make estimates and assumptions that affect the reported amounts of assets and liabilities and disclosure of contingent assets and liabilities at the date of the financial statements and the reported amounts of revenue, cost of revenue, and expenses during the reporting period. Actual results could differ from those estimates.
On an on-going basis, management evaluates its estimates, including those related to: (1) the realization of tax assets and estimates of tax liabilities, (2) fair values of investments in marketable securities, (3) the recognition and disclosure of contingent liabilities, (4) the collectability of accounts receivable, (5) the evaluation of revenue recognition criteria, including the determination of standalone value and customer life and (6) assumptions used in the Black-Scholes option pricing model to determine the fair value of stock options, including the fair value of the common stock. These estimates are based on historical data and experience, as well as various other factors that management believes to be reasonable under the circumstances, the results of which form the basis for making judgments about the carrying value of assets and liabilities that are not readily apparent from other sources. Prior to the Company’s initial public offering in March 2012, the Company engaged
65
third-party valuation specialists to assist with estimates related to the valuation of its common stock. Such estimates required the selection of appropriate valuation methodologies and models, and significant judgment in evaluating ranges of assumptions and financial inputs.
Foreign Currency Translation—The functional currency of the Company’s foreign subsidiaries is the local currency. All assets and liabilities denominated in a foreign currency are translated into U.S. dollars at the exchange rate on the balance sheet date. Revenue and expenses are translated at the average exchange rate during the period. Equity transactions are translated using historical exchange rates. Translation gains or losses are included as a component of accumulated other comprehensive income (loss) in stockholders’ equity (deficit). Transaction gains or losses that arise from exchange rate fluctuations on transactions denominated in a currency other than the functional currency are included in other income (expenses) in the accompanying consolidated results of operations as incurred. For the years ended December 31, 2012, 2011 and 2010, foreign currency transaction gains (losses) of $0.1 million, ($0.1) million, and ($0.5) million, respectively, are included in other expenses in the accompanying consolidated statements of operations.
Cash Equivalents and Short-Term Investments— The Company considers all highly liquid investments maturing within 90 days from the date of purchase to be the equivalent of cash for the purpose of balance sheet and statement of cash flows presentation. As of December 31, 2012, $48.1 million of the Company’s cash equivalents were invested in money market funds, and $4.0 million in marketable debt securities.
Short-term investments in marketable securities are classified as available-for-sale and mature within twelve months from the date of purchase. The Company’s investments in marketable securities are recorded at fair value, with any unrealized gains and losses, net of taxes, reported as a component of stockholders’ equity until realized or until a determination is made that an other-than-temporary decline in market value has occurred. When the Company determines that an other-than-temporary decline has occurred for debt securities that the Company does not then intend to sell, the Company recognizes the credit loss component of an other-than-temporary impairment in other income (expense) and the remaining portion in other comprehensive income. The credit loss component is identified as the amount of the present value of cash flows not expected to be received over the remaining term of the security, based on cash flow projections. In determining whether an other-than-temporary impairment exists, the Company considers: (i) the length of time and the extent to which the fair value has been less than cost; (ii) the financial condition and near-term prospects of the issuer of the securities; and (iii) the Company’s intent and ability to retain the security for a period of time sufficient to allow for any anticipated recovery in fair value. The cost of marketable securities sold is determined based on the specific identification method and any realized gains or losses on the sale of investments are reflected as a component of interest income or expense. As of December 31, 2012, all of the Company’s short-term investments were marketable debt securities.
Restricted Cash—Included in long-term other assets at December 31, 2012 is restricted cash of $0.8 million for three irrevocable standby letters of credit in relation to three of the Company’s office lease agreements. Each letter of credit names the lessor as the beneficiary, and is required to fulfill lease requirements in the event the Company should default on office lease obligations.
Fair Value of Financial Instruments—Financial instruments, including cash equivalents, restricted cash, accounts receivable, accounts payable, and accrued expenses are carried in the consolidated financial statements at amounts that approximate fair value at December 31, 2012 and 2011. Fair values are based on market prices and assumptions concerning the amount and timing of estimated future cash flows and assumed discount rates, reflecting varying degrees of perceived risk. Management believes that the Company’s debt obligations bear interest at rates which approximate prevailing market rates for instruments with similar characteristics and, accordingly, the carrying values for these instruments approximate fair value.
Accounts Receivable—Accounts receivable represent trade receivables from customers when the Company has invoiced for software subscriptions and/or services and it has not yet received payment. The Company presents accounts receivable net of an allowance for doubtful accounts and an allowance for credit memos. The allowance
66
for doubtful accounts and credit memos is the Company’s best estimate of the amount of probable credit losses and returns in the Company’s existing accounts receivable. The Company determines the allowance for doubtful accounts based on analysis of historical bad debts, customer concentrations, customer credit-worthiness, credit history and current economic trends. The allowance for credit memos is determined based on an analysis of historical credit memos issued and current economic trends, and is recorded as a reduction of revenue. The Company reviews its allowances for doubtful accounts and credit memos quarterly. Past due balances over 90 days and specified other balances are reviewed individually for collectability. All other balances are reviewed on an aggregate basis. Account balances are written off against the allowance after all means of collection have been exhausted and the potential for recovery is considered remote. Significant judgments and estimates are made and used in connection with establishing allowances for doubtful accounts and credit memos in any accounting period. Material differences in the amount and timing of the Company’s revenue for any period may result if actual results differ from these judgments and estimates. No significant differences from estimates have been experienced.
Activity within the allowance for doubtful accounts is as follows, (in thousands):
| | | | | | | | | | | | |
| | | Years Ended December 31, | |
| | | 2012 | | | 2011 | | | 2010 | |
Balance at beginning of year | | $ | — | | | $ | — | | | $ | 5 | |
Charges | | | — | | | | — | | | | — | |
Write-offs | | | — | | | | — | | | | (5 | ) |
| | | | | | | | | | | | |
Balance at end of year | | $ | — | | | $ | — | | | $ | — | |
| | | | | | | | | | | | |
Activity within the allowance for credit memos is as follows, (in thousands):
| | | | | | | | | | | | |
| | | Years Ended December 31, | |
| | | 2012 | | | 2011 | | | 2010 | |
Balance at beginning of year | | $ | 117 | | | $ | 64 | | | $ | — | |
Charges to revenue | | | 718 | | | | 147 | | | | 64 | |
Amounts written off | | | (205 | ) | | | (94 | ) | | | — | |
| | | | | | | | | | | | |
Balance at end of year | | $ | 630 | | | $ | 117 | | | $ | 64 | |
| | | | | | | | | | | | |
Concentrations of Credit Risk and Significant Customers—Financial instruments that potentially expose the Company to concentrations of credit risk include cash, cash equivalents, restricted cash, and accounts receivable. The Company maintains substantially all of its cash, cash equivalents, and restricted cash with one financial institution, which management believes has a high credit standing. To manage credit risk related to accounts receivable, the Company evaluates the allowances for potential credit losses. To date, losses resulting from uncollected receivables have not exceeded management’s expectations.
As of December 31, 2012, the Company had one customer representing 15% of accounts receivable. As of December 31, 2011, the Company had two customers representing 12% and 10% of accounts receivable. During the year ended December 31, 2012 no single customer comprised more than 10% of the Company’s revenue. During the years ended December 31, 2011, and 2010, one customer represented 16% and 21%, respectively, of total revenue.
Property and Equipment—Property and equipment are recorded at cost and depreciated using the straight-line method over the estimated useful lives of the related assets, which ranges from three to five years. Leasehold improvements are amortized over the lesser of the term of the lease or the useful life of the asset. When assets are retired or disposed of, the assets and related accumulated depreciation are eliminated from the accounts and any resulting gain or loss is included in the determination of net income or loss. Maintenance and repair expenditures are charged to expense as incurred.
67
Research and Development and Internal Use Software—Research and development expenses consist primarily of personnel and related expenses for the Company’s research and development staff, including salaries, benefits, bonuses and stock-based compensation; the cost of certain third-party contractor costs; and allocated overhead. Expenditures for research and development, other than internal use software costs, are expensed as incurred.
Software development costs associated with internal use software are capitalized when the preliminary project stage is completed, management has decided to make the project a part of its future offering, and the software will be used to perform the function intended. These capitalized costs include external direct costs of services consumed in developing or obtaining internal-use software, personnel and related expenses for employees who are directly associated with and who devote time to internal-use software projects. Capitalization of these costs cease once the project is substantially complete and the software is ready for its intended purpose. Post-configuration training and maintenance costs are expensed as incurred. Capitalized internal use software costs are amortized to cost of revenue using a straight-line method over its estimated useful life of four years, commencing when the software is ready for its intended use.
During the years ended December 31, 2012, 2011 and 2010, $0.2 million, $0.4 million and $0.2 million, respectively, of internal use software development costs were capitalized. Capitalized internal use software is included in property and equipment.
Amortization expense related to internal use software totaled $0.1 million, $0 and $0 during the years ended December 31, 2012, 2011 and 2010, respectively. The net book value of capitalized internal use software at December 31, 2012 and 2011 was $0.8 and $0.6 million, respectively.
Segment and Geographic Information—Operating segments are defined as components of an enterprise (business activity from which it earns revenue and incurs expenses) about which discrete financial information is available that is evaluated on a regular basis by the chief operating decision maker, or decision making group, in deciding how to allocate resources and assess performance. The Company’s chief operating decision maker (CODM) is the Chief Executive Officer. The CODM reviews consolidated operating results to make decisions about allocating resources and assessing performance for the entire Company. The CODM views the Company’s operations and manages its business as one operating segment.
Information about the Company’s operations in different geographic regions is presented in the tables below (in thousands):
| | | | | | | | | | | | |
| | | Year Ended December 31, | |
| | | 2012 | | | 2011 | | | 2010 | |
Revenue: | | | | | | | | | | | | |
United States | | $ | 43,365 | | | $ | 28,445 | | | $ | 17,869 | |
Germany | | | 20,221 | | | | 19,120 | | | | 13,827 | |
United Kingdom | | | 9,813 | | | | 5,582 | | | | 4,154 | |
All other international | | | 6,076 | | | | 3,400 | | | | 840 | |
| | | | | | | | | | | | |
Total revenue | | $ | 79,475 | | | $ | 56,547 | | | $ | 36,690 | |
| | | | | | | | | | | | |
Long-lived assets (at year end): | | | | | | | | | | | | |
United States | | | 7,976 | | | | 6,230 | | | | 5,884 | |
Germany | | | 303 | | | | 174 | | | | 47 | |
All other international | | | 98 | | | | 0 | | | | 0 | |
| | | | | | | | | | | | |
Total long-lived assets | | $ | 8,377 | | | $ | 6,404 | | | $ | 5,931 | |
| | | | | | | | | | | | |
Revenue Recognition—The Company generates revenue from sales of digital commerce solutions via designated sites using the Company’s proprietary technology, which are represented by subscription and support fees and related services, which include application configuration, integration and training.
68
The Company recognizes revenue when persuasive evidence of an arrangement exists, delivery to customers has occurred or services have been rendered, the fee is fixed or determinable, and collectability is reasonably assured. The Company does not recognize revenue in excess of the amounts for which it has the right to invoice in an annual subscription year.
On January 1, 2011, the Company adopted on a prospective basis, Accounting Standards Update 2009-13 “Revenue Recognition (Topic 605) — Multiple-Deliverable Revenue Arrangements — a Consensus of the Emerging Issues Task Force,” (“ASU 2009-13”) (formerly known as EITF 08-1, “Revenue Arrangements with Multiple Deliverables”), which amended the accounting guidance for multiple-deliverable revenue arrangements to:
| | • | | provide updated guidance on whether multiple deliverables exist, how the deliverables in an arrangement should be separated, and how the consideration should be allocated; |
| | • | | require an entity to allocate revenue in an arrangement using estimated selling prices (“ESP”) of each deliverable if a vendor does not have vendor-specific objective evidence of selling price (“VSOE”) or third-party evidence of selling price (“TPE”); and |
| | • | | eliminate the use of the residual method and require a vendor to allocate revenue using the relative selling price method. |
Subscription revenue primarily consists of subscription fees derived from contractually committed minimum levels of gross revenue processed by customers on the Company’s cloud-based digital commerce platform, and fees derived from customers’ gross revenue processed above the minimum contracted levels. Customers do not have the contractual right to take possession of the Company’s on-demand software. Accordingly, the Company recognizes the aggregate minimum subscription fee on a straight-line basis over the subscription term, provided that an enforceable contract has been signed by both parties, access to the Company’s software has been granted to the customer, the fee for the subscription is fixed or determinable and collection is reasonably assured. Should a customer exceed the specified minimum levels of gross revenue processed, fees for customer gross revenue processed in excess of the committed minimum level are billed for the excess volume. The Company recognizes revenue in respect of the fees it receives for its customers’ gross revenue processed in excess of the committed minimum level in the period in which such gross revenue is processed and earned. The Company also derives revenue from setup fees. The setup fees are recorded as deferred revenue and recognized revenue ratably over the longer of the subscription agreement or the estimated expected life of the customer relationship, as discussed below.
Service arrangements entered into prior to the customer’s initial use of the Company’s cloud-based digital commerce solutions include implementation services such as integration, application configuration and training. Such services can be performed by the Company, third-party service providers, distributors or customers themselves without the Company’s involvement. However, because such services are generally delivered prior to the customer being able to use the Company’s platform, the Company has concluded that such fees do not have stand-alone value, and the Company recognizes them on a straight-line basis over the longer of the life of the subscription agreement or the estimated expected life of the customer relationship. As the Company gains more experience with customer renewals, the Company continues to evaluate the estimated life of their customers. At December 31, 2012, the Company reassessed the estimated expected life of their customers, increasing it to just over six years. The Company determined this change in accounting estimate was appropriate due to the increased amount of renewal history available, which provided better insight and improved judgment in determining the estimate. Previously, the Company’s estimated expected customer life ranged from three to six years. This change in accounting estimate will affect the amortization in future periods, and did not affect net income or related per-share amounts in any of the current periods. The Company has reclassified $2.1 million of short term deferred revenue to long term within the Consolidated Balance Sheet as of December 31, 2012. The Company will continue to evaluate the length of the amortization period and it is possible that, in the future, the estimated expected customer life may change and, if so, the period of amortization will be adjusted.
69
Service arrangements entered into subsequent to the customer’s initial use of the Company’s cloud-based digital commerce solutions include assistance with additional instances of the integration, application configuration and training. Such services can be performed by the Company, third-party service providers, distributors or customers themselves without the Company’s involvement and are not necessary for the customer to access and use the Company’s cloud-based digital commerce solutions, and as a result, the Company has concluded that such fees have stand-alone value. For years ended December 31, 2010 and prior, the Company concluded for its bundled arrangements that VSOE or TPE did not exist for the minimum subscription fees earned for the use of the Company’s cloud-based digital commerce platform and such fees were considered to be an undelivered element in accordance with FASB ASC 605-25-25, Revenue Recognition—Multiple Element Arrangements. In addition, VSOE or TPE of the value of the post-launch services did not exist and, as a result, the Company recognized these services ratably over the remaining subscription contract period. Effective January 1, 2011, the Company adopted ASU 2009-13 for new multiple element arrangements. Because of the lack of VSOE and similarity with other vendors’ products and pricing, the Company uses ESP to determine the allocation of revenue for bundled arrangements. Beginning on January 1, 2011, the Company recognized revenue from these service arrangements as the services were performed using a proportional performance model, which for the year ended December 31, 2011 increased revenue by $1.4 million over what would have been recognized under the prior guidance.
For multiple-deliverable revenue arrangements, the Company first assesses whether each deliverable has value to the customer on a standalone basis. The Company has determined that the digital commerce solution has standalone value, because, once a customer launches its initial site, the solution is fully functional and does not require any additional development, modification or customization.
Based on the standalone value of the deliverables, the Company allocates revenue among the separate deliverables in an arrangement under the relative selling price method using the selling price hierarchy established in ASU 2009-13.
The Company is not able to determine VSOE or TPE for its deliverables because management has determined that there are no third-party offerings reasonably comparable to the Company’s solution. Accordingly, the selling prices of subscriptions to the solution and services are based on ESP. The determination of ESP requires the Company to make significant estimates and judgments. The Company considers numerous factors, including the size and nature of the deliverables themselves; the geography, market conditions and competitive landscape for the sale; internal costs; and pricing and discounting practices. The determination of ESP is made through consultation with and formal approval by senior management. The Company updates its estimates of ESP on an ongoing basis as events and as circumstances may require.
After the fair value of revenue allocable to each deliverable in a multiple deliverable arrangement based on the relative selling price method is determined, revenue is recognized for each deliverable based on the type of deliverable. For subscriptions to the Company’s digital commerce platform, revenue is recognized on a straight-line basis over the subscription term, which is typically three years. For services entered into subsequent to the customer’s initial implementation of the Company’s digital commerce solutions, revenue is recognized using the proportional performance method over the period the services are performed.
Reimbursable costs received for out-of-pocket expenses are recorded as revenue and cost of revenue in the consolidated statements of operations. Sales taxes collected from customers and remitted to government authorities are excluded from revenue.
Deferred revenue represents amounts billed to customers for which revenue has not been recognized. Deferred revenue consists of the unearned portion of services fees or the unearned portion of fees from subscriptions to the Company’s cloud-based digital commerce solutions.
Cost of Revenue—Cost of subscription revenue primarily consists of hosting costs, data communications expenses, depreciation expenses associated with computer equipment, personnel and related costs, including
70
salaries, bonuses, payroll taxes, recruiting fees and stock compensation, software license fees and amortization expenses associated with capitalized software. In addition, the Company allocates a portion of overhead, such as rent, IT costs, depreciation and amortization and employee benefits costs, to cost of revenue based on headcount. To date, the expenses associated with capitalized software have not been material to the Company’s cost of subscription revenue.
Cost of services revenue primarily consists of personnel and related costs, third-party contractors and allocated overhead. The Company’s cost of services revenue is expensed as the costs are incurred.
Impairment of Long-Lived Assets—The Company considers whether indicators of impairment of its long-lived assets are present. If such indicators are present, the Company determines whether the sum of the estimated undiscounted future cash flows attributable to such assets is less than their carrying amount, and if so, the Company recognizes an impairment loss based on the excess of the carrying amount of the assets over their fair value. To date, no such impairment has occurred.
Advertising—Advertising costs are charged to operations as incurred and include direct marketing, events, public relations, sales collateral materials and partner programs. Advertising expense was approximately $4.0 million, $2.0 million and $1.2 million for the years ended December 31, 2012, 2011 and 2010, respectively.
Income Taxes—Deferred tax assets and liabilities are recognized based on temporary differences between the financial reporting and income tax bases of assets and liabilities using rates anticipated to be in effect when such temporary differences reverse. A valuation allowance against deferred tax assets is recorded, based upon the available evidence, if it is more likely than not that some or all of the deferred tax assets will not be realized. The Company assesses its income tax positions and records tax benefits based upon management’s evaluation of the facts, circumstances, and information available at the reporting date. For those tax positions where it is more likely than not that a tax benefit will be sustained, the Company records the largest amount of tax benefit with a greater than 50 percent likelihood of being realized upon ultimate settlement with a taxing authority having full knowledge of all relevant information. For those income tax positions where it is not more likely than not that a tax benefit will be sustained, no tax benefit is recognized in the financial statements. The Company classifies liabilities for uncertain tax positions as non-current liabilities unless the uncertainty is expected to be resolved within one year. Potential interest and penalties associated with such uncertain tax positions are recorded as a component of income tax expense.
Stock-Based Compensation—The Company accounts for all stock options granted to employees and nonemployees using a fair value method. The Black-Scholes option pricing model is used to determine the fair value of the award, which is then recognized on a straight-line basis over the requisite services period, which is the vesting period of the award. The measurement date for employee awards is the date of the grant, and the measurement date for nonemployee awards is the date the performance or services are completed.
Preferred Stock Warrant Liability—The Company accounts for warrants to purchase redeemable convertible preferred stock as liabilities. The warrants are recorded at fair value estimated using the Black-Scholes option pricing model and revalued at each balance sheet date. The change in the fair value of the warrants is recorded as a component of other (expense) income (Note 9).
Other Comprehensive (Loss) Income—Other comprehensive (loss) income consists of net (loss) income, foreign currency translation adjustments, and unrealized gains or losses on marketable securities.
Warranties—The Company includes service level commitments to its customers warranting certain levels of uptime reliability and performance and permitting those customers to receive credits in the event that the Company fails to meet those levels. To date, the Company has not incurred any material costs as a result of such commitments.
71
Commissions—The Company recognizes commission expense related to subscriptions in the period in which the contract is signed.
Guarantees—As permitted under Delaware law, the Company indemnifies its officers and directors for liabilities incurred by reason of the fact that the officer or director is, was, or has agreed to serve as, an officer or director of the Company. The term of the indemnification period is for the officer or director’s lifetime. The maximum potential amount of future payments the Company could be required to make under these indemnification provisions is unlimited.
The Company’s agreements with customers generally require the Company to indemnify the customer against claims in which the Company’s services infringe third-party patents, copyrights, or trade secret rights (see Note 8). The term of these indemnification agreements is generally over the term of the subscription agreement. The maximum potential amount of future payments the Company could be required to make under these indemnification agreements is unlimited.
The Company leases office space under operating subleases (see Note 8). The Company has standard indemnification arrangements under these leases that require the Company to indemnify the landlord against losses, liabilities, and claims incurred in connection with the premises covered by the Company’s lease, the Company’s use of the premises, property damage or personal injury, and breach of the agreement.
Recent Accounting Pronouncements—In June 2011, FASB issued an amendment to the accounting guidance for presentation of comprehensive income. The Company adopted the guidance effective January 1, 2012, and has presented a combined statement of comprehensive income. As the new guidance relates only to how comprehensive income is disclosed and does not change the items that must be reported as comprehensive income, the adoption of this standard did not have a material impact on the Company’s financial position or results of operations.
Stock Split—On February 9, 2012, the Company’s Board of Directors approved a 1-for-3 reverse stock split of the Company’s common stock. The reverse stock split became effective on March 1, 2012. Upon the effectiveness of the reverse stock split, (i) every three shares of outstanding common stock was decreased to one share of common stock, (ii) the number of shares of common stock into which each outstanding warrant or option to purchase common stock is exercisable was proportionally decreased, (iii) the exercise price of each outstanding warrant or option to purchase common stock was proportionately increased, and (iv) the conversion ratio for each share of preferred stock outstanding was proportionately reduced. Unless otherwise indicated, all of the share numbers, share prices and exercise prices in these financial statements have been adjusted, on a retroactive basis, to reflect this 1-for-3 reverse stock split.
3. NET LOSS PER SHARE ATTRIBUTABLE TO COMMON SHAREHOLDERS
The Company calculates basic and diluted net loss per common share by dividing the net loss adjusted for the dividend on the redeemable convertible preferred stock by the weighted average number of common shares outstanding during the period. The Company has excluded all potentially dilutive shares, which include redeemable convertible preferred stock, warrant for redeemable convertible preferred stock, and outstanding common stock options, from the weighted average number of common shares outstanding as their inclusion in the computation for all periods would be anti-dilutive due to net losses. The Company’s redeemable convertible preferred stock are participating securities as defined under the authoritative guidance, but are excluded from the earnings per share calculation as they do not have an obligation to share or fund in the Company’s net losses. The Company’s unvested restricted stock awards are not considered participating securities under the authoritative guidance since any dividends earned on unvested restricted shares are required to be returned if unvested shares are forfeited.
72
The following common stock equivalents were excluded from the computation of diluted net loss per share attributable to common stockholders because they had an antidilutive impact (in thousands):
| | | | | | | | | | | | |
| | | Year Ended December 31, | |
| | | 2012 | | | 2011 | | | 2010 | |
Options to purchase common stock | | | 4,421 | | | | 4,492 | | | | 5,014 | |
Unvested restricted stock | | | 341 | | | | — | | | | — | |
Warrant | | | — | | | | 23 | | | | 23 | |
Redeemable convertible preferred stock | | | — | | | | 18,028 | | | | 18,028 | |
4. CASH EQUIVALENTS AND SHORT-TERM INVESTMENTS
A summary of the Company’s cash equivalents and short-term investments at December 31, 2012 is as follows (in thousands):
| | | | | | | | | | | | | | | | |
| | | Amortized Cost | | | Unrealized Gains | | | Unrealized Losses | | | Fair Value | |
Cash Equivalents: | | | | | | | | | | | | | | | | |
Money market funds | | $ | 48,089 | | | $ | — | | | $ | — | | | $ | 48,089 | |
Certificates of deposit | | | 1,933 | | | | — | | | | — | | | | 1,933 | |
Municipal securities | | | 2,070 | | | | — | | | | — | | | | 2,070 | |
| | | | | | | | | | | | | | | | |
| | $ | 52,092 | | | $ | — | | | $ | — | | | $ | 52,092 | |
| | | | | | | | | | | | | | | | |
Short-Term Investments: | | | | | | | | | | | | | | | | |
U.S. government agency bonds | | $ | 16,714 | | | $ | 5 | | | $ | — | | | $ | 16,719 | |
Corporate bonds and commercial paper | | | 15,397 | | | | 2 | | | | (1 | ) | | | 15,398 | |
Municipal securities | | | 7,412 | | | | 7 | | | | — | | | | 7,419 | |
Certificates of deposit | | | 8,714 | | | | 1 | | | | — | | | | 8,715 | |
| | | | | | | | | | | | | | | | |
| | $ | 48,237 | | | $ | 15 | | | $ | (1 | ) | | $ | 48,251 | |
| | | | | | | | | | | | | | | | |
At December 31, 2011, the Company held $5,357 of cash equivalents in a money market fund whose carrying amount approximates fair value. The Company did not hold any short-term investments at December 31, 2011.
The contractual maturity dates for the Company’s available-for-sale investments that are classified as short-term investments in the consolidated balance sheets are one year or less from the respective balance sheet dates.
73
5. FAIR VALUE MEASUREMENTS
The following table details the fair value measurements within the fair value hierarchy of the Company’s financial assets and liabilities at December 31, 2012 and 2011 (in thousands):
| | | | | | | | | | | | | | | | |
| | | | | | Fair Value Measurements Using | |
| | | Amounts
at Fair Value | | | Quoted Prices
in Active
Markets for
Identical Assets
(Level 1) | | | Significant Other
Observable Inputs
(Level 2) | | | Significant
Unobservable
Inputs (Level 3) | |
At December 31, 2011 | | | | | | | | | | | | | | | | |
Assets—Cash Equivalents-Money market funds | | $ | 5,357 | | | $ | 5,357 | | | $ | — | | | $ | — | |
Liabilities—Preferred stock warrant liability | | $ | 107 | | | $ | — | | | $ | — | | | $ | 107 | |
At December 31, 2012 | | | | | | | | | | | | | | | | |
Assets—Cash Equivalents: | | | | | | | | | | | | | | | | |
Money market funds | | $ | 48,089 | | | $ | 48,089 | | | $ | — | | | $ | — | |
Certificates of deposit | | $ | 1,933 | | | $ | — | | | $ | 1,933 | | | $ | — | |
Municipal securities | | $ | 2,070 | | | $ | — | | | $ | 2,070 | | | $ | — | |
| | | | |
Assets—Short-Term Investments: | | | | | | | | | | | | | | | | |
U.S. government agency bonds | | $ | 16,719 | | | $ | — | | | $ | 16,719 | | | $ | — | |
Corporate bonds and commercial paper | | $ | 15,398 | | | $ | — | | | $ | 15,398 | | | $ | — | |
Municipal securities | | $ | 7,419 | | | $ | — | | | $ | 7,419 | | | $ | — | |
Certificates of deposit | | $ | 8,715 | | | $ | — | | | $ | 8,715 | | | $ | — | |
When developing fair value estimates, we maximize the use of observable inputs and minimize the use of unobservable inputs. When available, we use quoted market prices to measure fair value. If market prices are not available, the fair value measurement is based on models that use primarily market based parameters including yield curves, volatilities, credit ratings and currency rates. In certain cases where market rate assumptions are not available, we are required to make judgments about assumptions market participants would use to estimate the fair value of a financial instrument.
The valuation technique used to measure fair value for the Company’s Level 1 and Level 2 assets and liabilities is a market approach that uses prices and other relevant information generated by market transactions involving identical or comparable assets.
The valuation technique used to measure fair value for the Company’s Level 3 assets and liabilities, which consisted of the preferred stock warrant liability, was the Black-Scholes model.
74
A rollforward of the fair value measurements of the preferred stock warrant liability categorized with Level 3 inputs as of December 31, 2012, 2011 and 2010 is as follows (in thousands):
| | | | | | | | | | | | |
| | | December 31, | |
| | | 2012 | | | 2011 | | | 2010 | |
Balance beginning of period | | $ | 107 | | | $ | 58 | | | $ | 74 | |
Change in fair value of warrant liability | | | 426 | | | | 49 | | | | (16 | ) |
Reclassification of warrant liability to equity | | | (533 | ) | | | — | | | | — | |
| | | | | | | | | | | | |
Balance end of period | | $ | — | | | $ | 107 | | | $ | 58 | |
| | | | | | | | | | | | |
6. PROPERTY AND EQUIPMENT
Property and equipment as of December 31, 2012 and 2011 consist of the following (in thousands):
| | | | | | | | |
| | | December 31, | |
| | | 2012 | | | 2011 | |
Computer equipment | | $ | 13,901 | | | $ | 10,492 | |
Purchased software, including internal use software | | | 4,135 | | | | 2,613 | |
Leasehold improvements | | | 332 | | | | 217 | |
Office furniture | | | 992 | | | | 655 | |
| | | | | | | | |
Property and equipment—at cost | | | 19,360 | | | | 13,977 | |
Less accumulated depreciation and amortization | | | (10,983 | ) | | | (7,573 | ) |
| | | | | | | | |
Property and equipment—net | | $ | 8,377 | | | $ | 6,404 | |
| | | | | | | | |
Depreciation and amortization expense for the years ended December 31, 2012, 2011 and 2010, $3.4 million, $2.9 million and $1.7 million, respectively.
7. DEBT
Line of Credit—The Company’s loan and security agreement (the “2008 Loan Agreement”) provided a secured revolving credit facility of up to $5.0 million (the “Revolving Credit Facility”). Under the terms of the agreement, borrowing availability varied based upon eligible accounts receivable. Borrowings were collateralized by substantially all of the assets of the Company and bore interest at a variable rate of 0.75% above prime rate. The Revolving Credit Facility was terminated by the Company in June 2012 at the Company’s request pursuant to the terms of the 2008 Loan Agreement.
In connection with the Company’s entry into the 2008 Loan Agreement, the Company issued a warrant to purchase 23,092 shares of its Series C Preferred Stock, which, at the closing of the IPO, automatically converted into a warrant to purchase shares of the Company’s common stock at an exercise price of $3.90 per share. The warrant was net exercised in September 2012 resulting in the issuance of 20,186 shares of common stock (see Note 9).
Equipment Notes Payable—In May 2009, the Company amended the 2008 Loan Agreement to include a $2.0 million equipment line of credit (the “Loan”). Borrowings under the Loan could be made for eligible equipment purchases through December 31, 2009. The Loan is secured by substantially all assets of the Company, except the Company’s intellectual property. The Loan also contains various covenants that limit, among other things, indebtedness, investments, liens, transactions, and certain mergers and sales of assets. In addition, the loan contains financial covenants that impose a minimum adjusted quick ratio (as defined in the 2008 Loan Agreement) and minimum quarterly revenue targets. The initial drawdown of the Loan was payable in 36 equal monthly payments of principal, plus accrued interest, at an annual rate of 7.50% through December 31, 2012. During the year ended December 31, 2009 the Company made borrowings under the Loan totaling $1.4 million.
75
In April 2010, the Company amended the Loan and increased the available borrowings by an additional $4.0 million for equipment purchases made during 2010. Each advance is payable over 36 months at a fixed annual interest rate of 7.25%. During the year ended December 31, 2010, the Company made borrowings under the Loan totaling $2.9 million.
In June 2011, the Company again amended the Loan and increased the available borrowings by an additional $4.0 million for equipment purchases made through March 31, 2012. Each advance is payable over 36 months at a fixed rate of 6.00%. During the year ended December 31, 2012 and 2011, the Company made borrowings under the Loan totaling $1.3 million and $2.6 million, respectively.
In June 2012, the Company again amended the Loan and increased the available borrowings by an additional $3.0 million for equipment purchases to be made through March 31, 2013. Each advance is payable over 36 months at a fixed rate of 5.50%. Through December 31, 2012, the Company made borrowings under the Loan of $1.5 million.
At December 31, 2012 and 2011, the outstanding balance under the Loan was $4.1 million and $4.0 million, respectively. As of December 31, 2012, the Company had $1.5 million of available borrowings under the Loan for eligible equipment purchases through March 31, 2013.
The 2008 Loan Agreement is secured by substantially all of the Company’s assets, except its intellectual property. The 2008 Loan Agreement also contains various covenants that limit, among other things, indebtedness, investments, liens, transactions and certain mergers and sales of assets. In addition, the loan contains financial covenants that impose a minimum adjusted quick ratio (as defined in the 2008 Loan Agreement) and minimum quarterly revenue targets.
As of December 31, 2012, future annual principal payments due under the Loan were as follows (in thousands):
| | | | |
Years Ending December 31, | | | |
2013 | | $ | 2,356 | |
2014 | | | 1,364 | |
2015 | | | 364 | |
| | | | |
| | | 4,084 | |
Less current portion of notes payable | | | 2,356 | |
| | | | |
Long-term notes payable | | $ | 1,728 | |
| | | | |
Software Financing—In May 2012, the Company entered into a $1.8 million agreement to finance the purchase of a perpetual software license and the related first year technical support (the “Software Finance Agreement”). The Software Finance Agreement is secured by the financed assets. The financed amount is due in 12 equal quarterly payments of principal, plus accrued interest, at an annual rate of 5.40% through April 1, 2015. As of December 31, 2012, the outstanding balance under the Software Finance Agreement was $1.3 million.
As of December 31, 2012, future annual principal payments due under the Software Finance Agreement were as follows (in thousands):
| | | | |
Years Ending December 31, | | | |
2013 | | $ | 665 | |
2014 | | | 411 | |
2015 | | | 214 | |
| | | | |
| | | 1,290 | |
Less current portion of notes payable | | | 665 | |
| | | | |
Long-term notes payable | | $ | 625 | |
| | | | |
76
8. COMMITMENTS AND CONTINGENCIES
Operating Leases— In May 2010, the Company entered into an operating lease for approximately 32,000 square feet of office space for its Burlington, Massachusetts corporate headquarters that expires in July 2017. In January 2012, the Company entered a sublease agreement for approximately 37,000 square feet of additional office space at its headquarters in Massachusetts. The sublease expires in October 2019, subject to an early termination option that may be exercised by the sub-landlord, in which case the Company would be required to vacate the premises no later than November 2015. The Company has two operating leases in Germany, each for approximately 8,000 square feet of office space, expiring in January 2016 and March 2018. Additionally, the Company has a nine-year operating lease for approximately 2,000 square feet of office space in France that expires in January 2021, but can be terminated by the Company before the start of the fourth or seventh year of the lease with six months prior written notice.
In August 2007, the Company entered into a four-year operating lease for approximately 19,000 square feet. On December 31, 2010, the Company vacated and ceased to use the facility. Accordingly, the Company expensed $0.2 million to rent expense for the eight months of rent expense that would have been incurred in 2011 as the Company did not sublease the space.
During the years ended December 31, 2012, 2011 and 2010, rent expense was $2.1 million, $1.0 million, and $0.9 million, respectively.
The Company’s obligation for payments under these leases is as follows at December 31, 2012 (in thousands):
| | | | |
Years Ending December 31 | | | |
2013 | | $ | 2,424 | |
2014 | | | 2,459 | |
2015 | | | 2,433 | |
2016 | | | 2,261 | |
2017 | | | 1,888 | |
Thereafter | | | 2,142 | |
| | | | |
Total minimum lease payments | | $ | 13,607 | |
| | | | |
Co-locationServices—The Company has agreements with third parties to provide co-location services for hosting operations, which typically have a term of 24 months. The agreements require payment of a minimum amount per month for a fixed period of time in return for which the co-location service provider provides certain guarantees of network availability. All agreements expire by December 2015.
The Company recorded co-location service expenses of $2.5 million, $1.5 million, and $0.9 million during the years ended December 31, 2012, 2011, and 2010, respectively. Future minimum payments as of December 31, 2012 under these arrangements are $2.1 million in 2013, $0.3 million in 2014 and $50,000 in 2015.
Chinese Investment—In connection with establishing operations in China, in December 2011, the Company entered into a funding agreement pursuant to which it lent $150,000 to the owners of a Chinese limited liability company (the “Chinese Entity”) in exchange for a customer-supplier relationship with the Chinese Entity and an option to purchase such entity. An additional $16,000 was funded in February 2012, and is included in the change in restricted cash and other assets line item of the Company’s Consolidated Statement of Cash Flows. As of December 31, 2012, this entity had not commenced operations.
Patent Indemnification—The Company has received indemnification requests from customers that have received letters from, or been sued by, non-practicing entities claiming infringement of patents owned by them. Many of those underlying claims have not yet been resolved, and the extent, if any, of the Company’s indemnification obligations has not been determined. Certain of these matters include speculative claims for
77
substantial or indeterminate amounts of damages. In addition, some of the patents at issue are the subject of pending legal proceedings between the patent owners and one or more leading digital commerce companies, and the outcome of those proceedings could affect the extent to which the patent owners seek to prosecute claims against the Company or its customers. The Company’s business could be materially adversely affected by any significant disputes between the Company and its customers as to intellectual property litigation to which the Company might become a party or for which the Company may be required to provide indemnification. Adverse results in these matters may include awards of substantial monetary damages, costly licensing agreements, or orders preventing the Company from offering certain features, functionalities, products, or services, and may also cause the Company to change its business practices, and require development of non-infringing products or technologies, which could result in a loss of revenues and otherwise harm the Company’s business. As of December 31, 2012, the Company has not made an accrual related to these matters.
The Company records a liability when it believes that a loss is both probable and reasonably estimable. On a quarterly basis, the Company reviews each of its legal proceedings to determine whether it is probable, reasonably possible or remote that a liability has been incurred and, if it is at least reasonably possible, whether a range of loss can be reasonably estimated. Significant judgment is required to determine both the likelihood of there being a loss and the estimated amount of such loss. Until the final resolution of such matters, there may be an exposure to loss in excess of the amount recorded, and such amounts could be material. The Company expenses legal fees in the period in which they are incurred.
In all of the Company’s outstanding legal matters for which it has not made an accrual, the Company is unable to estimate a range of reasonably possible loss due to various factors, including, among others, the early stage and uncertain outcome of the pending lawsuits to which the Company is not a party; and the significant factual issues to be resolved regarding the extent, if any, of the Company’s indemnification obligations. Given the significant uncertainties involved in these matters, the Company cannot predict the timing or extent of their impact, if any, on its business, consolidated financial position, results of operations or cash flows, which could be material, particularly in any fiscal quarter in which it may accrue a related liability.
9. CAPITALIZATION
As of December 31, 2012, the Company’s authorized stock consists of 240,000,000 shares of common stock, par value of $0.01 per share, and 10,000,000 shares of preferred stock, par value of $0.01 per share. No shares of preferred stock are issued or outstanding at December 31, 2012.
78
Redeemable Convertible Preferred Stock
The following table summarizes the number of shares of redeemable convertible preferred stock for the years ended December 31, 2012, 2011 and 2010 (in thousands):
| | | | | | | | | | | | | | | | | | | | | | | | | | | | | | | | | | | | |
| | | Redeemable Convertible Preferred Stock | |
| | | Series A | | | Series B | | | Series C | | | Series D | | | | |
| | | Shares | | | Amount | | | Shares | | | Amount | | | Shares | | | Amount | | | Shares | | | Amount | | | Total | |
Balance as of January 1, 2010 | | | 3,171 | | | $ | 13,438 | | | | 3,722 | | | $ | 16,178 | | | | 5,388 | | | $ | 24,509 | | | | 3,849 | | | $ | 15,719 | | | $ | 69,844 | |
Issuance of Series D redeemable convertible preferred stock (net of issuance costs of $21) | | | | | | | | | | | | | | | | | | | | | | | | | | | 1,899 | | | $ | 7,379 | | | $ | 7,379 | |
Accretion and dividends on preferred stock | | | | | | | 769 | | | | | | | | 990 | | | | | | | | 1,688 | | | | | | | | 1,827 | | | | 5,274 | |
| | | | | | | | | | | | | | | | | | | | | | | | | | | | | | | | | | | | |
Balance as of December 31, 2010 | | | 3,171 | | | | 14,207 | | | | 3,722 | | | | 17,168 | | | | 5,388 | | | | 26,196 | | | | 5,748 | | | | 24,758 | | | | 82,329 | |
Accretion and dividends on preferred stock | | | | | | | 769 | | | | | | | | 990 | | | | | | | | 1,688 | | | | | | | | 1,827 | | | | 5,274 | |
| | | | | | | | | | | | | | | | | | | | | | | | | | | | | | | | | | | | |
Balance as of December 31, 2011 | | | 3,171 | | | $ | 14,976 | | | | 3,722 | | | $ | 18,158 | | | | 5,388 | | | $ | 27,884 | | | | 5,748 | | | $ | 26,585 | | | $ | 87,603 | |
Accretion and dividends on preferred stock | | | | | | | 171 | | | | | | | | 220 | | | | | | | | 375 | | | | | | | | 406 | | | | 1,172 | |
Conversion of preferred stock into common stock | | | (3,171 | ) | | | (15,147 | ) | | | (3,722 | ) | | | (18,378 | ) | | | (5,388 | ) | | | (28,259 | ) | | | (5,748 | ) | | | (26,991 | ) | | | (88,775 | ) |
| | | | | | | | | | | | | | | | | | | | | | | | | | | | | | | | | | | | |
Balance as of December 31, 2012 | | | — | | | $ | — | | | | — | | | $ | — | | | | — | | | $ | — | | | | — | | | $ | — | | | $ | — | |
| | | | | | | | | | | | | | | | | | | | | | | | | | | | | | | | | | | | |
Redeemable Convertible Preferred Stock Issuance and Conversion
In 2010, the Company issued 1,898,741 shares of Series D Preferred Stock for proceeds of $7.4 million, net of issuance costs of $21,000.
On March 20, 2012, upon the closing of the IPO, all outstanding shares of redeemable convertible preferred stock were automatically converted into 18,028,763 shares of common stock.
Terms of Redeemable Convertible Preferred Stock—Prior to the conversion of the Series A Preferred Stock, Series B Preferred Stock, Series C Preferred Stock, and Series D Preferred Stock (collectively, the “Preferred Stock”) into common stock in March 2012, the rights preferences and privileges of the Preferred Stock were as follows:
Voting—Preferred Stock stockholders were entitled to vote on all matters and were entitled to the number of votes equal to the number of shares of common stock into which each share of preferred stock was then convertible. With certain exceptions, the holders of Preferred Stock would have voted together as a single class.
79
Dividends—Dividends accrued whether or not declared by the Board of Directors at an annual rate per share of $0.08 for Series A Preferred Stock, $0.08812816 per share for Series B Preferred Stock, $0.10392850 per share for Series C Preferred Stock, and $0.10392850 per share for Series D Preferred Stock. Such dividends were cumulative and payable upon the occurrence of a liquidation event or a redemption event, each as defined. The Preferred Stock was senior to all common stock with respect to dividends. Dividends were included in the carrying value in the preferred stock. The Loan prohibited payment of dividends on the Company’s capital stock without the prior consent of the lender.
Liquidation Rights—In certain events, including the liquidation, dissolution, or winding up of the Company, before any distribution of payments was to be made to common stockholders, the holders of Preferred Stock were entitled to receive, on a pari passu basis, the greater of (i) an amount equal to $1.00 per share (Series A Preferred Stock), $1.101602 per share (Series B Preferred Stock), $1.299106 (Series C Preferred Stock), and $1.299106 (Series D Preferred Stock), respectively, plus the accruing dividends and any other dividends declared but unpaid, or (ii) the amount a holder of such Preferred Stock received if such holder converted such Preferred Stock into common stock immediately prior to the liquidation event.
If there were insufficient assets legally available to make this distribution in full, then the available assets were to be distributed on a pro rata basis to the holders of Preferred Stock.
Any remaining assets legally available for distribution after satisfaction of the Preferred Stock liquidation amounts were to be distributed to the holders of common stock and the Series D Preferred Stock on a common stock equivalent basis; provided, however, that the participation rights of the Series D Preferred Stock would be capped at an amount equal to three times the original issue price.
Conversion—Each share of Preferred Stock, at the option of the holder, was convertible into a number of fully paid shares of common stock as determined by dividing the respective preferred stock issue price by the conversion price in effect at the time, subject to certain antidilutive adjustments. The initial conversion prices of the Series A Preferred Stock, Series B Preferred Stock, Series C Preferred Stock and Series D Preferred Stock was $1.00, $1.101602, $1.299106, and $1.299106, respectively, resulting in a one-for-one exchange ratio for Series A Preferred Stock, Series B Preferred Stock, Series C Preferred Stock and Series D Preferred Stock. Conversion was automatic immediately upon (i) the closing of an underwritten public offering in which the public offering price equals or exceeds $5.00 per share (adjusted to reflect subsequent stock dividends, stock splits, or recapitalization) and the aggregate proceeds raised equals or exceeds $25,000 or (ii) upon the election of the holders of at least two-thirds of the voting power of the then outstanding shares of Preferred Stock.
Redemption—At the written election of at least two-thirds of the then-outstanding shares of Preferred Stock, the Company was required to redeem all of the outstanding shares of Preferred Stock and pay in full on or after April 13, 2014, at a price equal to $1.00 per share (Series A Preferred Stock), $1.101602 per share (Series B Preferred Stock), $1.299106 per share (Series C Preferred Stock), and $1.299106 per share (Series D Preferred Stock), respectively, plus the accruing dividends and any other dividends declared but unpaid. The Company was accreting the Preferred Stock to redemption value over the period from issuance to April 13, 2014, such that the carrying amounts of the securities would equal the redemption amounts at the earliest redemption date.
10. WARRANTS
In July 2008, in connection with the Company’s entry into the 2008 Loan Agreement (see Note 6), the Company issued a warrant to purchase shares of its Series C Preferred Stock, which, at the closing of the IPO, automatically converted into a warrant to purchase 23,092 shares of the Company’s common stock at an exercise price of $3.90 per share. The warrant was exercisable at any time through its expiration in July 2018. So long as the warrant remained outstanding and exercisable for redeemable convertible preferred stock, the warrant liability was recorded at fair value at each balance sheet date with any change in fair value included as a component of other (expense) income. For the years ended December 31, 2012, 2011 and 2010, the Company recognized ($0.4) million, ($49,000), and $16,000 of (loss) income, respectively, for the change in the fair value
80
of the warrant. At the time of conversion of the warrant upon the closing of the IPO, the fair value of the warrant was $0.5 million, which was reclassified as a component of additional paid-in capital. The warrant was net exercised in September 2012 resulting in the issuance of 20,186 shares of common stock.
The following table includes the fair value of the warrant liability using the Black-Scholes option pricing model and the underlying assumptions used in the model (dollars in thousands):
| | | | | | | | |
| | | March 20, 2012
(Close of
IPO) | | | As of
December 31,
2011 | |
Fair value of preferred stock warrant liability | | $ | 533 | | | $ | 107 | |
| | | | | | | | |
Risk-free interest rate | | | 1.56 | % | | | 1.45 | % |
Expected dividend yield | | | — | | | | — | |
Expected term (in years) | | | 6.25 | | | | 6.5 | |
Expected volatility | | | 57.4 | % | | | 59.1 | % |
11. STOCK-BASED COMPENSATION PLANS
As of December 31, 2012, the Company had two stock-based compensation plans, the 2004 Stock Option and Grant Plan (the “2004 Plan”), and the 2012 Stock Incentive Plan (the “2012 Plan”). The 2012 Plan became effective upon the closing of the IPO. The 2012 Plan provides for the grant of incentive stock options to the Company’s employees and the grant of non-statutory stock options, restricted stock, restricted stock units, stock appreciation rights, performance units and performance shares to the Company’s employees, directors and consultants. Upon the effectiveness of the 2012 Plan, the Company ceased granting awards under the 2004 Plan. However, the 2004 Plan will continue to govern the terms and conditions of the outstanding awards previously granted thereunder.
Under the 2012 Plan, the Company may issue up to 5,313,673 shares of common stock pursuant to stock options and stock awards, which include (i) shares of common stock reserved for issuance under the 2004 Plan that remained available for issuance immediately prior to the closing of the IPO and (ii) shares of common stock subject to awards granted under the 2004 Plan that expire, terminate or are otherwise surrendered, cancelled, forfeited or repurchased by the Company at their original issuance price pursuant to a contractual repurchase right. As of December 31, 2012, the Company has authorized 240,000,000 shares of common stock and the following number of shares of common stock has been reserved for the exercise of stock options and the release of restricted stock (in thousands):
| | | | |
| | | As of
December 31,
2012 | |
2004 Stock Option and Grant Plan | | | 3,064 | |
2012 Stock Incentive Plan | | | 5,227 | |
| | | | |
Total | | | 8,291 | |
| | | | |
Under the 2012 Plan, stock options may be granted at an exercise price not less than the fair market value of the Company’s common stock on the date of grant. Substantially all stock options and restricted stock awards currently outstanding under both plans vest over a period of four years. No restricted stock awards were granted during the years ended December 31, 2011 and 2010.
81
The summary of stock option activity for the year ended December 31, 2012 is as follows (in thousands, except per share and term information):
| | | | | | | | | | | | | | | | |
| | | Shares | | | Weighted-
Average
Exercise
Price | | | Weighted-
Average
Remaining
Contractual
Life (in
Years) | | | Aggregate
Intrinsic
Value | |
Outstanding—January 1, 2012 | | | 4,024 | | | $ | 1.91 | | | | 7.62 | | | $ | 26,238 | |
Granted | | | 1,121 | | | | 30.78 | | | | | | | | | |
Forfeited | | | (102 | ) | | | 18.65 | | | | | | | | | |
Expired or cancelled | | | (3 | ) | | | 0.60 | | | | | | | | | |
Exercised | | | (913 | ) | | | 1.40 | | | | | | | | | |
| | | | | | | | | | | | | | | | |
Outstanding—December 31, 2012 | | | 4,127 | | | $ | 9.45 | | | | 7.57 | | | $ | 77,557 | |
| | | | | | | | | | | | | | | | |
Exercisable—December 31, 2012 | | | 2,111 | | | $ | 1.91 | | | | 6.74 | | | $ | 53,678 | |
| | | | | | | | | | | | | | | | |
Options vested and expected to vest—December 31, 2012 | | | 3,905 | | | $ | 9.04 | | | | 7.53 | | | $ | 74,788 | |
| | | | | | | | | | | | | | | | |
The summary of restricted stock activity is as follows (in thousands, except per share and term information):
| | | | | | | | | | | | | | | | |
| | | Number of
Shares | | | Weighted-
Average
Grant Date
Fair Value | | | Weighted-
Average
Remaining
Contractual
Life (in
Years) | | | Aggregate
Intrinsic
Value | |
Nonvested at December 31, 2011 | | | — | | | $ | — | | | | — | | | $ | — | |
Granted | | | 517 | | | | 30.92 | | | | | | | | | |
Vested | | | (86 | ) | | | 31.26 | | | | | | | | | |
Forfeited | | | — | | | | — | | | | | | | | | |
| | | | | | | | | | | | | | | | |
Nonvested at December 31, 2012 | | | 431 | | | $ | 30.86 | | | | 9.30 | | | $ | 11,785 | |
| | | | | | | | | | | | | | | | |
The following table summarizes information relating to stock-based awards granted and exercised (in thousands, except per share data):
| | | | | | | | | | | | |
| | | Year Ended December 31, | |
| | | 2012 | | | 2011 | | | 2010 | |
Weighted average fair value of options granted | | | 16.49 | | | | 3.30 | | | | 0.81 | |
Aggregate intrinsic value of options exercised | | | 21,402 | | | | 5,990 | | | | 1,317 | |
Cash proceeds received upon exercise of options | | | 1,282 | | | | 1,645 | | | | 999 | |
The aggregate intrinsic value represents the difference between the estimated fair value at exercise and the exercise price paid by the employee. The amount of aggregate intrinsic value will change based on the fair market value of the common stock.
82
Stock-based compensation cost is measured at the grant date, based on the calculated fair value of the award, and is recognized as an expense over the service period (generally the vesting period of the equity grant). The Company estimates forfeitures at the time of grant and revises the estimates, if necessary, in subsequent periods if actual forfeitures differ from those estimates. The following table presents stock-based compensation expense included in the Company’s consolidated statements of comprehensive loss (in thousands):
| | | | | | | | | | | | |
| | | Year Ended December 31, | |
| | | 2012 | | | 2011 | | | 2010 | |
Cost of subscription revenue | | $ | 175 | | | $ | 20 | | | $ | 16 | |
Cost of service revenue | | | 722 | | | | 93 | | | | 74 | |
Sales and marketing | | | 1,842 | | | | 252 | | | | 156 | |
Research and development | | | 1,509 | | | | 487 | | | | 205 | |
General and administration | | | 2,795 | | | | 637 | | | | 595 | |
| | | | | | | | | | | | |
| | $ | 7,043 | | | $ | 1,489 | | | $ | 1,046 | |
| | | | | | | | | | | | |
Stock-based compensation cost for the year ended December 31, 2012 includes $2.8 million related to restricted stock awards granted during the year, which are being charged to income based upon their fair values over their vesting period. During the years ended December 31, 2011 and 2010, $0.4 million and $0.1 million of the Company’s stock-based compensation cost related to a restricted stock award issued for promissory note that was repayable in full on demand. Since the measurement date for the purchase of the shares of common stock was not fixed until the note was repaid, the arrangement was subject to variable accounting and required incremental stock-based compensation to be recorded if the fair value of the underlying common stock changed. At December 31, 2010, the balance of the promissory note related to this award was $0.1 million, including accrued interest of $15,000, for the purchase of 100,000 shares of common stock. In May 2011, the promissory note was forgiven by the Company.
As of December 31, 2012, total compensation cost not yet recognized related to stock option awards was $14.1 million, which is expected to be recognized over a weighted-average period of 2.4 years, and total compensation cost not yet recognized related to restricted stock awards was $12.4 million, which is expected to be recognized over a weighted-average period of 3.2 years.
The Company uses the Black-Scholes option-pricing model to estimate the fair value of stock options awards and determine the related compensation expense. The assumptions used to compute stock-based compensation expense for awards granted are as follows:
| | | | | | | | | | | | |
| | | Year Ended December 31, | |
| | | 2012 | | | 2011 | | | 2010 | |
Risk-free interest rate | | | 1.3 | % | | | 2.1 | % | | | 2.6 | % |
Expected dividend yield | | | — | | | | — | | | | — | |
Expected term (in years) | | | 6 | | | | 6 | | | | 6 | |
Expected volatility | | | 57.0 | % | | | 59.9 | % | | | 62.3 | % |
The risk-free interest rate assumption was based on the U.S. Treasury zero-coupon bonds with maturities similar to those of the expected term of the award being valued. The assumed dividend yield was based on the Company’s expectation of not paying dividends in the foreseeable future. The weighted-average expected life for employee options reflects the application of the simplified method, which represents the average of the contractual term of the options and the weighted-average vesting period for all option tranches. The simplified method has been used since the Company does not have sufficient historical exercise data to provide a reasonable basis upon which to estimate expected term due to a limited period of the Company’s life. The expected life of options granted to nonemployees is equal to the remaining contractual term as of the measurement date. The Company bases the majority of its estimate of expected volatility using volatility data from comparable public
83
companies in similar industries and markets because there is currently limited public market history for the Company’s common stock, and therefore, a lack of market-based company-specific historical and implied volatility information.
12. INCOME TAXES
The provision for income taxes for the years ended December 31, 2012, 2011 and 2010 consists of the following (in thousands):
| | | | | | | | | | | | |
| | | December 31, | |
| | | 2012 | | | 2011 | | | 2010 | |
(Loss) income before income taxes: | | | | | | | | | | | | |
Domestic | | $ | (8,832) | | | $ | (1,627) | | | $ | 114 | |
International | | | 1,129 | | | | 428 | | | | 337 | |
| | | | | | | | | | | | |
| | $ | (7,703 | ) | | $ | (1,199 | ) | | $ | 451 | |
| | | | | | | | | | | | |
| | | | | | | | | | | | |
| | | December 31, | |
| | | 2012 | | | 2011 | | | 2010 | |
Current income tax provision: | | | | | | | | | | | | |
Federal | | $ | — | | | $ | — | | | $ | — | |
State | | | 56 | | | | 55 | | | | 39 | |
Foreign | | | 368 | | | | 157 | | | | 103 | |
| | | | | | | | | | | | |
Total current income tax provision | | | 424 | | | | 212 | | | | 142 | |
Deferred income tax provision: | | | | | | | | | | | | |
Federal | | | — | | | | — | | | | — | |
State | | | — | | | | — | | | | — | |
Foreign | | | (3 | ) | | | — | | | | — | |
| | | | | | | | | | | | |
Total deferred income tax provision | | | (3 | ) | | | — | | | | — | |
| | | | | | | | | | | | |
Total income tax provision | | $ | 421 | | | $ | 212 | | | $ | 142 | |
| | | | | | | | | | | | |
The differences in total provision for income taxes that would result from applying the 34% federal statutory rate to (loss) income before provision for income taxes and the reported provision for income taxes are as follows:
| | | | | | | | | | | | |
| | | Years Ended December 31, | |
| | | 2012 | | | 2011 | | | 2010 | |
U.S. Federal tax expense at statutory rates | | | 34 | % | | | 34 | % | | | 34 | % |
State income taxes, net of federal tax benefit | | | 1 | % | | | (14 | )% | | | 5 | % |
Foreign rate differential | | | 1 | % | | | 1 | % | | | (4 | )% |
Permanent differences | | | (7 | )% | | | (21 | )% | | | 9 | % |
Uncertain tax provisions | | | (1 | )% | | | (9 | )% | | | 14 | % |
Valuation allowance | | | (33 | )% | | | (9 | )% | | | (27 | )% |
| | | | | | | | | | | | |
| | | (5 | )% | | | (18 | )% | | | 31 | % |
| | | | | | | | | | | | |
84
Components of the net deferred tax assets as of December 31, 2012 and 2011 are as follows (in thousands):
| | | | | | | | |
| | | December 31, | |
| | | 2012 | | | 2011 | |
Operating loss carryforwards | | $ | 16,747 | | | $ | 15,089 | |
Capitalized research and development costs | | | 2,634 | | | | 3,020 | |
Accrued expenses | | | 2,897 | | | | 2,005 | |
Research and development credits | | | 890 | | | | 775 | |
Deferred revenue | | | 4,164 | | | | 4,359 | |
Stock compensation | | | 1,685 | | | | 550 | |
Depreciation | | | 301 | | | | 797 | |
| | | | | | | | |
Total deferred tax assets | | | 29,318 | | | | 26,595 | |
Valuation allowance for deferred tax assets | | | (29,315 | ) | | | (26,595 | ) |
| | | | | | | | |
Net deferred tax assets | | $ | 3 | | | $ | — | |
| | | | | | | | |
The Company has historically incurred operating losses and given the cumulative losses and limited history of profits, the Company has recorded a full valuation allowance against its deferred tax assets for all periods to date with the exception for the deferred tax asset related to Demandware E-Commerce (Shanghai) Limited.
The Company’s ability to use the operating loss carryforwards to offset future taxable income is subject to restrictions enacted in the U.S. Internal Revenue Code of 1986. These restrictions limit the future use of the operating loss carryforwards if certain ownership changes described in the Internal Revenue Code occur.
During the year ended December 31, 2010, the valuation allowance increased by $0.6 million due to the increase in deferred tax assets, primarily the net operating loss and research and development tax credit carryforwards, and the full valuation allowance against the assets. During the year ended December 31, 2011, the valuation allowance decreased by $1.0 million primarily due to the use of net operating losses to offset federal and state taxable income, which decreased the related tax asset and valuation allowance. During the year ended December 31, 2012, the valuation allowance increased by $2.7 million due to the increase in deferred tax asset associated with the net operating loss and the full valuation allowance against that asset.
At December 31, 2012, the Company had federal and state net operating loss carryforwards of approximately $67.2 million and $46.4 million, respectively. The net operating losses include federal and state excess benefits related to stock options of $23.1 million and $13.2 million, respectively, that will be charged to additional paid-in capital when utilized. At December 31, 2012, the Company also had federal and state research and development tax credit carryforwards of $0.5 million and $0.7 million, respectively. The research and development credits include federal and state excess benefits related to stock options of $0 and $0.2 million, respectively, that will be charged to additional paid-in capital when utilized. The net operating loss carryforwards and tax credits expire at various dates through 2032.
Utilization of net operating loss carryforwards and research and development credit carryforwards may be subject to annual limitations due to ownership changes that have occurred previously or that could occur in the future in accordance with Sections 382 and 383 of the Internal Revenue Code of 1986 (“IRC Sections 382 and 383”)as well as similar state provisions. During 2012 the Company had a study completed through March 31, 2011 which resulted in an ownership change that occurred during the 2004 year. The Company is currently conducting a study through December 31, 2012 and if there are additional ownership changes it could limit the amount of net operating loss carryforwards and research and development credit carryforwards that can be utilized annually to offset future taxable income and taxes, respectively.
On January 3, 2013 the American Taxpayer Relief Act of 2012 was signed into law reinstating the federal research and development credit for the 2012 and 2013 years. The effects are recognized as a component of income tax expense or benefit from continuing operations in the financial statements for the interim or annual period that includes the enactment date. The benefit related to the 2012 federal research and development credit of $0.7 million (which includes excess benefits of $0.4 million) will be recorded during 2013.
85
The following table indicates the changes to the Company’s uncertain tax positions for the years ended December 31 (in thousands):
| | | | | | | | | | | | |
| | | 2012 | | | 2011 | | | 2010 | |
Beginning balance | | $ | 805 | | | $ | 670 | | | $ | 622 | |
Increase related to current tax year | | | 256 | | | | 135 | | | | 48 | |
| | | | | | | | | | | | |
Ending balance | | $ | 1,061 | | | $ | 805 | | | $ | 670 | |
| | | | | | | | | | | | |
The liability for unrecognized tax benefits includes no accrued interest and penalties. The Company expects none of the unrecognized tax benefits will decrease within the next 12 months related to expired statutes or settlement with the taxing authorities.
The Company files federal, state, and foreign income tax returns in jurisdictions with varying statutes of limitations. With few exceptions, all tax years 2004 through 2012 remain subject to examination by federal and most state tax authorities due to the Company’s net operating loss carryforwards. In the Company’s foreign jurisdictions, all tax years remain subject to examination.
13. EMPLOYEE BENEFITS
The Company has a 401(k) defined contribution plan (the “401(k) Plan”) for employees. The 401(k) Plan includes substantially all United States full-time employees. Under the terms of the plan, participants may contribute up to the lower of 20% of their salary or the statutorily prescribed limit to the plan. At the election of its Board of Directors, the Company may make matching employee contributions, though it has not done so to date.
14. RELATED PARTY TRANSACTIONS
In September 2010, Stephan Schambach, the Company’s Chairman of the Board of Directors, entered into a consulting services agreement with the Company to provide assistance in the Company’s European expansion strategy, development of partnerships, and participation in industry conferences and key customer meetings. This agreement was terminated effective December 31, 2011. During the years ended December 31, 2011 and 2010, the Company paid Mr. Schambach $0.2 million and $0.1 million for consulting service fees, respectively.
15. SELECTED QUARTERLY INFORMATION (UNAUDITED)
| | | | | | | | | | | | | | | | |
| | | 2012 | |
| (in thousands, except per share amounts) | | 1st
Quarter | | | 2nd
Quarter | | | 3rd
Quarter | | | 4th
Quarter | |
Revenue | | $ | 16,090 | | | $ | 18,360 | | | $ | 18,706 | | | $ | 26,319 | |
Gross profit | | | 10,671 | | | | 12,265 | | | | 12,215 | | | | 19,983 | |
(Loss) income from operations | | | (1,843 | ) | | | (5,083 | ) | | | (3,566 | ) | | | 3,333 | |
(Loss) income before provision for income taxes | | | (2,117 | ) | | | (5,563 | ) | | | (3,432 | ) | | | 3,409 | |
Net (loss) income | | | (2,243 | ) | | | (5,633 | ) | | | (3,471 | ) | | | 3,223 | |
Basic net (loss) earnings per share attributable to common stockholders | | $ | (0.42 | ) | | $ | (0.19 | ) | | $ | (0.12 | ) | | $ | 0.11 | |
| | | | | | | | | | | | | | | | |
Diluted net (loss) earnings per share attributable to common stockholders | | $ | (0.42 | ) | | $ | (0.19 | ) | | $ | (0.12 | ) | | $ | 0.10 | |
| | | | | | | | | | | | | | | | |
| | | | | | | | | | | | | | | | |
| | | 2011 | |
| (in thousands, except per share amounts) | | 1st
Quarter | | | 2nd
Quarter | | | 3rd
Quarter | | | 4th
Quarter | |
Revenue | | $ | 11,604 | | | $ | 12,852 | | | $ | 13,475 | | | $ | 18,616 | |
Gross profit | | | 7,238 | | | | 8,152 | | | | 8,044 | | | | 13,406 | |
(Loss) income from operations | | | (1,041 | ) | | | (1,255 | ) | | | (1,498 | ) | | | 3,038 | |
(Loss) income before provision for income taxes | | | (688 | ) | | | (1,153 | ) | | | (1,966 | ) | | | 2,608 | |
Net (loss) income | | | (717 | ) | | | (1,179 | ) | | | (2,091 | ) | | | 2,576 | |
Basic net (loss) earnings per share attributable to common stockholders | | $ | (0.66 | ) | | $ | (0.71 | ) | | $ | (0.80 | ) | | $ | 0.28 | |
| | | | | | | | | | | | | | | | |
Diluted net (loss) earnings per share attributable to common stockholders | | $ | (0.66 | ) | | $ | (0.71 | ) | | $ | (0.80 | ) | | $ | 0.19 | |
| | | | | | | | | | | | | | | | |
86
| Item 9. | Changes in and Disagreements with Accountants on Accounting and Financial Disclosure |
None.
| Item 9A. | Controls and Procedures |
(a) Evaluation of Disclosure Controls and Procedures
The term “disclosure controls and procedures,” as defined in Rules 13a-15(e) and 15d-15(e) under the Securities Exchange Act of 1934, as amended (the “Exchange Act”), refers to controls and procedures that are designed to ensure that information required to be disclosed by a company in the reports that it files or submits under the Exchange Act is recorded, processed, summarized and reported, within the time periods specified in the SEC’s rules and forms. Disclosure controls and procedures include, without limitation, controls and procedures designed to ensure that such information is accumulated and communicated to a company’s management, including its principal executive and principal financial officers, as appropriate to allow timely decisions regarding required disclosure.
Our management, with the participation of our Chief Executive Officer and Chief Financial Officer, has evaluated the effectiveness of our disclosure controls and procedures as of December 31, 2012, the end of the period covered by this Annual Report on Form 10-K. Based upon such evaluation, our Chief Executive Officer and Chief Financial Officer have concluded that our disclosure controls and procedures were effective as of such date.
(b) Management’s Report on Internal Control over Financial Reporting
This Annual Report on Form 10-K does not include a report of management’s assessment regarding our internal control over financial reporting (as defined in Rule 13a-15(f) under the Exchange Act) or an attestation report of our independent registered accounting firm due to a transition period established by rules of the Securities and Exchange Commission for newly public companies.
(c) Changes in Internal Control over Financial Reporting
There was no change in our internal control over financial reporting that occurred during the period covered by this Annual Report on Form 10-K that has materially affected, or is reasonably likely to materially affect, our internal control over financial reporting.
| Item 9B. | Other Information |
Not applicable.
87
PART III
| Item 10. | Directors, Executive Officers and Corporate Governance |
The information required by this item is incorporated by reference to the information disclosed under the caption “Directors, Executive Officers and Corporate Governance” in our Proxy Statement for the 2013 Annual Meeting of Stockholders, which we intend to file with the SEC within 120 days of the end of the fiscal year to which this report relates.
| Item 11. | Executive Compensation |
The information required by this item is incorporated by reference to the information disclosed under the caption “Executive Compensation and Related Information” in our Proxy Statement for the 2013 Annual Meeting of Stockholders, which we intend to file with the SEC within 120 days of the end of the fiscal year to which this report relates.
| Item 12. | Security Ownership of Certain Beneficial Owners and Management and Related Stockholder Matters |
The information required by this item is incorporated by reference to the information disclosed under the caption “Security Ownership of Certain Beneficial Owners and Management” in our Proxy Statement for the 2013 Annual Meeting of Stockholders, which we intend to file with the SEC within 120 days of the end of the fiscal year to which this report relates.
| Item 13. | Certain Relationships and Related Transactions, and Director Independence |
The information required by this item is incorporated by reference to the information disclosed under the caption “Employment Contracts, Termination of Employment and Change-In-Control Agreements” in our Proxy Statement for the 2013 Annual Meeting of Stockholders, which we intend to file with the SEC within 120 days of the end of the fiscal year to which this report relates.
| Item 14. | Principal Accounting Fees and Services |
The information required by this item is incorporated by reference to the information disclosed under the caption “Principal Accounting Fees and Services” in our Proxy Statement for the 2013 Annual Meeting of Stockholders, which we intend to file with the SEC within 120 days of the end of the fiscal year to which this report relates.
88
PART IV
| Item 15. | Exhibits and Financial Statement Schedules |
Financial Statements: See the Index to Consolidated Financial Statements under Item 8 of this Annual Report on Form 10-K.
Financial Statement Schedules: All schedules are omitted as information required is inapplicable or the information is presented in the consolidated financial statements and the related notes.
Exhibits: See the Exhibit Index immediately following the signature page of this Annual Report on Form 10-K.
89
SIGNATURES
Pursuant to the requirements of Section 13 or 15(d) of the Securities Exchange Act of 1934, the Registrant has duly caused this Annual Report on Form 10-K to be signed on its behalf by the undersigned, thereunto duly authorized, on March 8, 2013.
| | |
| DEMANDWARE, INC. |
| |
| By: | | /s/ Thomas D. Ebling |
| Name: | | Thomas D. Ebling |
| Title: | | President and Chief Executive Officer (Principal Executive Officer) |
POWER OF ATTORNEY
KNOW ALL PERSONS BY THESE PRESENTS, that each person whose signature appears below constitutes and appoints Thomas D. Ebling and Scott J. Dussault, jointly and severally, his attorney-in-fact, with the power of substitution, for him in any and all capacities, to sign any amendments to this Annual Report on Form 10-K and to file the same, with exhibits thereto and other documents in connection therewith, with the Securities and Exchange Commission, hereby ratifying and confirming all that each of said attorneys-in-fact, or his substitute or substitutes, may do or cause to be done by virtue hereof.
Pursuant to the requirements of the Securities Exchange Act of 1934, this report has been signed below by the following persons on behalf of the Company and in the capacities and on the dates indicated:
| | | | |
Signature | | Title | | Date |
| | |
/s/ Thomas D. Ebling Thomas D. Ebling | | President and Chief Executive Officer (Principal Executive Officer) | | March 8, 2013 |
| | |
/s/ Scott J. Dussault Scott J. Dussault | | Executive Vice President and Chief Financial Officer (Principal Financial and Accounting Officer) | | March 8, 2013 |
| | |
/s/ Lawrence S. Bohn Lawrence S. Bohn | | Director | | March 8, 2013 |
| | |
/s/ Jill Granoff Jill Granoff | | Director | | March 8, 2013 |
| | |
/s/ Charles F. Kane Charles F. Kane | | Director | | March 8, 2013 |
| | |
/s/ Jitendra Saxena Jitendra Saxena | | Director | | March 8, 2013 |
| | |
/s/ Stephan Schambach Stephan Schambach | | Chairman of the Board | | March 8, 2013 |
| | |
/s/ Michael J. Skok Michael J. Skok | | Director | | March 8, 2013 |
90
Exhibit Index
| | | | |
| |
| | 3.1 | | | Amended and Restated Certificate of Incorporation of the Registrant, (filed as Exhibit 3.1 to the Registrant’s Current Report on Form 8-K (File No. 001-35450) on March 20, 2012 and incorporated herein by reference) |
| |
| | 3.2 | | | By-laws of the Registrant, (filed as Exhibit 3.2 to the Registrant’s Current Report on Form 8-K (File No. 001-35450) on March 20, 2012 and incorporated herein by reference) |
| |
| | 10.1* | | | 2004 Stock Option and Grant Plan, as amended (filed as Exhibit 10.1 to the Registrant’s Form S-1 (File No. 333-17595) and incorporated herein by reference) |
| |
| | 10.2* | | | Form of Non-Qualified Stock Option Agreement under the 2004 Stock Option and Grant Plan (filed as Exhibit 10.2 to the Registrant’s Form S-1 (File No. 333-17595) and incorporated herein by reference) |
| |
| | 10.3* | | | 2012 Stock Incentive Plan, effective upon the closing of this offering (filed as Exhibit 10.3 to the Registrant’s Form S-1 (File No. 333-17595) and incorporated herein by reference) |
| |
| | 10.4* | | | Forms of equity award agreements under 2012 Stock Incentive Plan |
| |
| | 10.8* | | | Letter Agreement, dated February 11, 2010, between the Registrant and Thomas D. Ebling (filed as Exhibit 10.8 to the Registrant’s Form S-1 (File No. 333-17595) and incorporated herein by reference) |
| |
| | 10.9* | | | Incentive Stock Option Agreement, dated February 11, 2010, between the Registrant and Thomas D. Ebling (filed as Exhibit 10.9 to the Registrant’s Form S-1 (File No. 333-17595) and incorporated herein by reference) |
| |
| | 10.10* | | | Letter Agreement between the Registrant and Scott J. Dussault related to Mr. Dussault’s services to the Registrant (filed as Exhibit 10.10 to the Registrant’s Form S-1 (File No. 333-17595) and incorporated herein by reference) |
| |
| | 10.11* | | | Agreements between the Registrant and Wayne R. Whitcomb relating to the Promissory Note issued by the Registrant on May 6, 2005, as amended by Amendment No. 1, dated November 30, 2009 (filed as Exhibit 10.11 to the Registrant’s Form S-1 (File No. 333-17595) and incorporated herein by reference) |
| |
| | 10.12* | | | Restricted Stock Agreement, dated May 6, 2005, between the Registrant and Wayne R. Whitcomb (filed as Exhibit 10.12 to the Registrant’s Form S-1 (File No. 333-17595) and incorporated herein by reference) |
| |
| | 10.13* | | | Letter Agreement between the Registrant and Wayne R. Whitcomb related to Mr. Whitcomb’s services to the Registrant (filed as Exhibit 10.13 to the Registrant’s Form S-1 (File No. 333-17595) and incorporated herein by reference) |
| |
| | 10.16* | | | Letter Agreements between the Registrant and Jeffrey G. Barnett related to Mr. Barnett’s services to the Registrant (filed as Exhibit 10.16 to the Registrant’s Form S-1 (File No. 333-17595) and incorporated herein by reference) |
| |
| | 10.17 | | | Form of indemnification agreement entered into by the Registrant with each of its directors and executive officers in February 2012 (filed as Exhibit 10.17 to the Registrant’s Form S-1 (File No. 333-17595) and incorporated herein by reference) |
| |
| | 10.18 | | | Loan and Security Agreement, dated July 18, 2008, between the Registrant and Silicon Valley Bank, as amended on December 23, 2008, June 26, 2009, March 2, 2010, April 28, 2010, June 23, 2011, August 12, 2011, and June 27, 2012 (filed as Exhibit 10.18 to the Registrant’s Form S-1 (File No. 333-17595) and incorporated herein by reference) |
91
| | | | |
| |
| | 10.19 | | | Lease Agreement, dated May 28, 2010, between Registrant and Burlington Office Park V Limited Partnership (filed as Exhibit 10.19 to the Registrant’s Form S-1 (File No. 333-17595) and incorporated herein by reference) |
| |
| | 10.20† | | | Master Subscription Agreement, dated June 2, 2008, between the Registrant and neckermann.de GmbH, as amended on March 26, 2009, May 21, 2010 and March 2, 2011 (filed as Exhibit 10.20 to the Registrant’s Form S-1 (File No. 333-17595) and incorporated herein by reference) |
| |
| | 10.23* | | | 2012 Executive Incentive Compensation Program (filed as Exhibit 10.23 to the Registrant’s Form S-1 (File No. 333-17595) and incorporated herein by reference) |
| |
| | 21.1 | | | Subsidiaries of the Registrant |
| |
| | 23.1 | | | Consent of Deloitte & Touche LLP, Independent Registered Public Accounting Firm |
| |
| | 31.1 | | | Certification pursuant to Section 302 of the Sarbanes-Oxley Act of 2002, Rule 13(a)-14(a)/15d-14(a), by principal executive officer |
| |
| | 31.2 | | | Certification pursuant to Section 302 of the Sarbanes-Oxley Act of 2002, Rule 13(a)-14(a)/15d-14(a), by principal financial officer |
| |
| 32.1
|
| | Certification pursuant to 18 U.S.C. Section 1350, as adopted pursuant to Section 906 of the Sarbanes-Oxley Act of 2002, by principal executive officer |
| |
| 32.2
|
| | Certification pursuant to 18 U.S.C. Section 1350, as adopted pursuant to Section 906 of the Sarbanes-Oxley Act of 2002, by principal financial officer |
| |
| 101
|
| | Materials from Registrant’s Annual Report on Form 10-K for the year ended December 31, 2012, formatted in XBRL |
| † | Indicates confidential treatment requested as to certain portions, which portions have been omitted and filed separately with the Securities and Exchange Commission pursuant to a Confidential Treatment Request. |
| * | Management Contracts or compensatory plans or arrangements required to be filed as exhibits hereto pursuant to Item 15(a) of Form 10-K. |
92