UNITED STATES
SECURITIES AND EXCHANGE COMMISSION
Washington, D.C. 20549
FORM 10-K
| x | ANNUAL REPORT PURSUANT TO SECTION 13 OR 15(d) OF THE SECURITIES EXCHANGE ACT OF 1934 |
For the fiscal year ended December 31, 2011
OR
| ¨ | TRANSITION REPORT PURSUANT TO SECTION 13 OR 15(d) OF THE SECURITIES EXCHANGE ACT OF 1934 |
For the transition period from to
Commission File Number 001-32899
EASTERN INSURANCE HOLDINGS, INC.
| | |
| Incorporated in Pennsylvania | | I.R.S. Employer Identification No. |
25 Race Avenue, Lancaster, Pennsylvania 17603-3179 (717) 396-7095 | | 20-2653793 |
Securities registered pursuant to Section 12(b) of the Act:
| | |
| Title of Each Class | | Name of Each Exchange on Which Registered |
| Common Stock, No Par Value | | NASDAQ Global Market |
Securities registered pursuant to Section 12(g) of the Act: None.
Indicate by check mark if the registrant is a well-known seasoned issuer, as defined in Rule 405 of the Securities Act: Yes ¨ No x
Indicate by check mark if the registrant is not required to file reports pursuant to Section 13 or 15(d) of the Act: Yes ¨ No x
Indicate by check mark whether the registrant: (1) has filed all reports required to be filed by Section 13 or 15(d) of the Securities Exchange Act of 1934 during the preceding 12 months (or for such shorter period that the registrant was required to file such reports), and (2) has been subject to such filing requirements for the past 90 days. Yes x No ¨
Indicate by check mark whether the registrant has submitted electronically and posted on its corporate Web site, if any, every Interactive Data File required to be submitted and posted pursuant to Rule 405 of Regulation S-T (§232.405 of this chapter) during the preceding 12 months (or for such shorter period that the registrant was required to submit and post such files). Yes x No ¨
Indicate by check mark if disclosure of delinquent filers pursuant to Item 405 of Regulation S-K (§229-405 of this chapter) is not contained herein, and will not be contained, to the best of registrant’s knowledge, in definitive proxy or information statements incorporated by reference in Part III of this Form 10-K or any amendment to this Form 10-K. ¨
Indicate by check mark whether the registrant is a large accelerated filer, an accelerated filer, a non-accelerated filer, or a smaller reporting company. See the definitions of “large accelerated filer”, “accelerated filer” and “smaller reporting company” in Rule 12b-2 of the Exchange Act. (Check one):
Large accelerated filer ¨ Accelerated filer x Non-accelerated filer ¨ Smaller reporting company ¨
Indicate by check mark whether the registrant is a shell company (as defined in Rule 12b-2 of the Act): Yes ¨ No x
The aggregate market value of the common stock held by non-affiliates of the registrant, based on the closing price of the registrant’s common stock on June 30, 2011, as reported by the NASDAQ Global Market, was $90,674,116.
Indicate the number of shares outstanding of each of the registrant’s classes of common stock, as of the latest practicable date.
| | |
| Title of Each Class | | Number of Shares Outstanding as of March 12, 2012 |
| Common Stock, No Par Value | | 7,935,446 (Outstanding Shares) |
DOCUMENTS INCORPORATED BY REFERENCE
Portions of the Proxy Statement in connection with the 2012 Annual Meeting of Stockholders—Part III.
Table of Contents
Eastern Insurance Holdings, Inc. and Subsidiaries
PART I
Item 1—Business
Our History and Overview
Eastern Insurance Holdings, Inc. (“EIHI”) is an insurance holding company offering workers’ compensation insurance and reinsurance products through its direct and indirect wholly-owned subsidiaries, Global Alliance Holdings, Ltd. (“Global Alliance”), Eastern Alliance Insurance Company (“Eastern Alliance”), Allied Eastern Indemnity Company (“Allied Eastern”), Eastern Advantage Assurance Company (“Eastern Advantage”), Employers Security Insurance Company (“Employers Security”), Employers Alliance, Inc. (“Employers Alliance”), Eastern Re Ltd., SPC (“Eastern Re”), and Eastern Services Corporation (“Eastern Services”), collectively referred to as the “Company”, “we” and/or “our”.
The following provides a brief description of EIHI’s direct and indirect wholly-owned subsidiaries:
| | • | | Global Alliance is a holding company domiciled in the Commonwealth of Pennsylvania; |
| | • | | Eastern Alliance, Allied Eastern and Eastern Advantage are stock property/casualty insurance companies domiciled in the Commonwealth of Pennsylvania and, along with Employers Security, conduct business as Eastern Alliance Insurance Group (“EAIG”). The four insurance companies provide EAIG with increased underwriting and pricing flexibility through the use of a tiered rating structure; |
| | • | | Employers Security is a stock property/casualty insurance company domiciled in the State of Indiana; |
| | • | | Employers Alliance is a Pennsylvania corporation offering claims administration and risk management services to self-insured property/casualty customers; |
| | • | | Eastern Re is a segregated portfolio cell reinsurance company domiciled in the Cayman Islands; and |
| | • | | Eastern Services is a Pennsylvania corporation that provides certain management services to EAIG. |
On December 9, 2010, EIHI completed the sale of Eastern Atlantic RE (“Atlantic RE”). Atlantic RE was a Cayman Islands reinsurance company formed for the purpose of transferring certain assets and liabilities related to EIHI’s former run-off specialty reinsurance segment. The run-off specialty reinsurance segment reported net premiums earned totaling $1,000 and $1.1 million and revenue totaling $4.2 million and $1.0 million for the years ended December 31, 2010 and 2009, respectively. Total revenue for the year ended December 31, 2010 excludes the loss on the sale of Atlantic RE of $14.0 million.
On June 21, 2010, EIHI completed the sale of Eastern Life and Health Insurance Company (“Eastern Life”), its former group benefits insurance subsidiary. Eastern Life’s net premiums earned totaled $18.3 million (prior to the sale) and $35.9 million for the years ended December 31, 2010 and 2009, respectively. Eastern Life’s revenue totaled $20.6 million (prior to the sale) and $40.7 million for the years ended December 31, 2010 and 2009, respectively.
The Company currently operates in three business segments: workers’ compensation insurance, segregated portfolio cell reinsurance, and corporate/other. Prior to the sale of Atlantic RE and Eastern Life, the Company’s operations included a run-off specialty reinsurance segment and a group benefits insurance segment. The components of the run-off specialty reinsurance segment that were not transferred to Atlantic RE have been included in the corporate/other segment for the years ended December 31, 2011, 2010 and 2009.
Overview of Business Segments
The following discussion provides information on each of our business segments:
Workers’ Compensation Insurance. The Company offers workers’ compensation insurance coverage to employers, generally with 1,000 employees or less, primarily in the Mid-Atlantic, Southeast, and Midwest regions of the continental United States. The Company’s workers’ compensation products include guaranteed cost policies, policyholder dividend policies, retrospectively-rated policies, deductible policies and alternative market programs.
Segregated Portfolio Cell Reinsurance. The Company offers alternative market workers’ compensation solutions to individual companies, groups and associations (referred to as “segregated portfolio cell dividend participants”) through the creation of segregated portfolio cells. The segregated portfolio cells are segregated pools of assets that function as insurance
1
companies within an insurance company. The pool of assets and associated liabilities of each segregated portfolio cell are solely for the benefit of the segregated portfolio cell dividend participants, and the pool of assets of one segregated portfolio cell are statutorily protected from the creditors of the others. This permits the Company to provide customers with a turn-key alternative markets solution that includes program design, fronting, claims administration, risk management, segregated portfolio cell rental, asset management and segregated portfolio management services. The Company outsources the asset management and segregated portfolio cell management services to a third party. The segregated portfolio cell structure provides dividend participants the opportunity to share in both underwriting profit and investment income derived from their respective segregated portfolio cell’s financial results.
Workers’ compensation insurance coverage is underwritten through EAIG’s alternative markets business unit and ceded 100% to the segregated portfolio cell reinsurance segment. The Company receives fee revenue, based on a percentage of direct premiums written, for fronting, claims administration, risk management and segregated portfolio cell rental services. As of December 31, 2011, the segregated portfolio cells and dividend participants provided $45.6 million of irrevocable, unconditional letters of credit to secure unfunded liabilities and collateralize reserves for unpaid losses and loss adjustment expenses (“LAE”) and unearned premiums.
The Company is a preferred shareholder in certain of the segregated portfolio cells. For those segregated portfolio cells in which the Company participates, the Company shares in the operating and investment results of those cells and recognizes its share of the segregated portfolio dividend in the consolidated statements of operations and comprehensive income (loss). The Company’s share of the segregated portfolio dividend is included in the corporate/other segment.
Corporate/OtherThe corporate/other segment primarily includes the expenses of the holding company, the third party administration activities of the Company, and the results of operations of Eastern Re, as well as certain eliminations necessary to reconcile the segment information to the consolidated statements of operations and comprehensive income (loss). The Company cancelled the remaining reinsurance contracts at Eastern Re in 1999 on a run-off basis and continues to have exposure for outstanding claims as of December 31, 2011. The corporate/other segment also includes the Company’s 10% interest in a segregated portfolio cell with an unaffiliated primary carrier that writes insurance coverage for sprinkler contractors, known as “SprinklerPro”. The Company non-renewed the contract for its 10% interest in SprinklerPro on a run-off basis effective April 1, 2009.
Products
Workers’ Compensation Insurance
The Company offers a complete line of workers’ compensation products including guaranteed cost policies, policyholder dividend policies, retrospectively-rated policies, deductible policies, and alternative market products. Direct premiums written in the workers’ compensation insurance segment totaled $155.7 million for the year ended December 31, 2011.
| | • | | Guaranteed cost policies. Guaranteed cost policies charge a fixed premium, which does not increase or decrease based upon loss experience during the policy period. For the year ended December 31, 2011, 55.2% of direct premiums written in the workers’ compensation insurance segment were derived from guaranteed cost policies. |
| | • | | Policyholder dividend policies. Policyholder dividend policies charge a fixed premium, but the customer may receive a dividend in the event of favorable loss experience during the policy period. Policyholder dividend plans are generally restricted to accounts with minimum annual premiums in excess of $20,000. For the year ended December 31, 2011, 12.3% of direct premiums written in the workers’ compensation insurance segment were derived from policyholder dividend policies. |
| | • | | Retrospectively-rated policies. Retrospectively-rated policies charge an initial premium that is subject to adjustment after the policy period expires, based upon the insured’s actual loss experience incurred during the policy period, subject to a minimum and maximum premium. These policies are typically subject to annual adjustment until all claims related to the policy year are closed. Retrospectively-rated policies are generally offered to employers with minimum annual premiums in excess of $150,000. For the year ended December 31, 2011, 3.4% of direct premiums written in the workers’ compensation insurance segment were derived from retrospectively-rated policies. |
| | • | | Deductible policies. Deductible policies generally result in a lower premium; however, the insured retains a greater share of the underwriting risk than under guaranteed cost or dividend paying policies, which reduces the risk to the Company and further encourages loss control practices by the insured. The insured is contractually obligated to pay |
2
| | its own losses up to the amount of the deductible for each occurrence, subject to an aggregate retention. For the year ended December 31, 2011, 3.8% of direct premiums written in the workers’ compensation insurance segment were derived from deductible policies. |
| | • | | Alternative market products. Alternative market products are offered to individual companies, groups, and trade associations. As described above in “Overview of Business Segments—Segregated Portfolio Cell Reinsurance” a policy is issued to an insured and 100% of the premium written, less a ceding commission, is ceded to a segregated portfolio cell at Eastern Re. For the year ended December 31, 2011, 25.3% of direct premiums written in the workers’ compensation insurance segment were derived from alternative market products. |
Segregated Portfolio Cell Reinsurance
Segregated portfolio cells, or segregated cells or rent-a-captives, are all referred to as alternative market programs or products. The Company provides a variety of products to this marketplace, including program design, fronting, claims administration, risk management, segregated portfolio cell rental, asset management and segregated portfolio management services. The Company outsources the asset management and segregated portfolio cell management services to a third party. Direct premiums written in the segregated portfolio cell reinsurance segment totaled $34.0 million for the year ended December 31, 2011. The segregated portfolio cell reinsurance segment generated fee revenue to the Company’s workers’ compensation insurance and corporate/other segments totaling $5.5 million for the year ended December 31, 2011.
Marketing and Distribution
Workers’ Compensation Insurance
The Company distributes its workers’ compensation products and services primarily in the Mid-Atlantic, Southeast and Midwest regions of the continental United States through a network of carefully chosen independent insurance agents. The following table provides direct premiums written, by state, for the year ended December 31, 2011 (dollars in thousands):
| | | | | | | | |
State | | Direct
Premiums
Written | | | Percentage | |
Pennsylvania | | $ | 109,826 | | | | 70.5 | % |
Indiana | | | 14,132 | | | | 9.1 | % |
North Carolina | | | 8,903 | | | | 5.7 | % |
Virginia | | | 6,462 | | | | 4.1 | % |
Maryland | | | 4,393 | | | | 2.8 | % |
Delaware | | | 2,763 | | | | 1.8 | % |
Other | | | 9,267 | | | | 6.0 | % |
| | | | | | | | |
Total | | $ | 155,746 | | | | 100.0 | % |
| | | | | | | | |
The Company has its greatest agency representation and largest workers’ compensation premium volume in central Pennsylvania.
The Company’s agents are compensated through a fixed base commission plan with an opportunity for profit sharing depending on the agent’s premium volume and loss experience.
The Company proactively manages its valued relationships with agents through a detailed management process. The process is driven by regular interaction with the Company’s underwriting and marketing personnel and strong relationships between senior management of the Company and the principals of each agent. The primary components of the agency management process are as follows:
| | • | | The Company carefully selects agents through a process that assesses financial results, market potential, business philosophy and reputation of the agency and its staff. Senior management of the Company approves all agent appointments following extensive meetings with the agent’s principals. Following the agreement to appoint, the Company’s Senior Vice President of Marketing and Field Operations and other key personnel conduct a formal orientation process focusing on the Company’s workers’ compensation insurance products and services, dedicated service team and the joint business objectives of the Company and the agent. |
| | • | | The Company’s senior management team conducts annual business planning meetings with the agency principals to mutually agree upon the agent’s financial goals for the following year. Senior management, marketing personnel and the underwriting staff conduct regular visits to monitor results and build relationships. |
3
| | • | | The Company has established an Agency Advisory Council to promote an active dialogue between the Company and its agents. The Agency Advisory Council is comprised of experienced insurance agency professionals. The Council meets twice a year to discuss such topics as market conditions, customer service, products, competition and areas of opportunity. In addition to the Agency Advisory Council, the Company has established a Select Business Focus Group with its agents. This group meets once a year to concentrate on issues that impact small workers’ compensation clients (under $20,000 in annual premium). |
| | • | | Agency management reports are distributed on a monthly basis, providing the agent with the data necessary to manage its relationship with the Company. |
The Company attempts to optimize the franchise value of a workers’ compensation agency appointment by limiting the number of appointments in identified marketing territories. As a result of this agency management strategy, the average direct premiums written per agency contract was $1.3 million for the year ended December 31, 2011.
The Company’s ten largest agents in its workers’ compensation insurance segment accounted for 55.9% of its direct premiums written for the year ended December 31, 2011. The Company’s largest agent, The Alliance of Central PA, Inc., accounted for 10.2% of its direct premiums written for the year ended December 31, 2011. The Alliance of Central PA, Inc. is subject to the terms and conditions of the Company’s Agency Agreement, which sets forth binding authority, premium remittance and collection and termination provisions, among other things. No other agent accounted for more than 10.0% of the Company’s direct premiums written in its workers’ compensation insurance segment for the year ended December 31, 2011.
Segregated Portfolio Cell Reinsurance
The marketing and distribution of policies that may be submitted for consideration for reinsurance are substantially the same as that of the workers’ compensation insurance segment. The Company’s independent agents market the products to potential customer groups within the Company’s geographic target markets.
Underwriting, Risk Management and Pricing
Workers’ Compensation Insurance
The Company’s workers’ compensation insurance segment is committed to an individual account underwriting strategy that is focused on selecting quality accounts. The goal of the workers’ compensation underwriting professionals is to select a diverse book of business with respect to risk classification, hazard level and geographic location. The Company expects to remain a rural underwriter focusing on territories, accounts and agencies that generate acceptable underwriting margins.
The workers’ compensation underwriting strategy is focused on accounts with strong return to work and safety programs in a low to middle hazard levels such as clerical office, light manufacturing, healthcare, auto dealers and service industries.
For the year ended December 31, 2011, the average annual workers’ compensation traditional premium per policy was $20,187.
Within the workers’ compensation underwriting operation, the Company operates a risk management unit, which delivers loss consulting services to the Company’s underwriters, agents and insureds. The objective of the risk management operation is to protect the Company from catastrophic loss, reduce claims frequency and provide value added consulting services to policyholders. These services are provided at no additional cost to the insured. Management believes the quality of the services differentiates the Company’s workers’ compensation offerings from its competitors. The risk management unit also provides risk pre-screening in support of the underwriting selection process.
Segregated Portfolio Cell Reinsurance
Underwriting and risk management services for the segregated portfolio cell reinsurance segment are substantially the same as the workers’ compensation insurance segment, although a separate alternative markets unit has been formed for the coordination of services on a group program basis. The independent agents’ knowledge of the Company’s workers’ compensation product offerings is an important component in the offering of different product proposals to customers, including the alternative market option. After successful completion of the underwriting process, if the risk is deemed to be an appropriate candidate for alternative markets, the risk is submitted for consideration of intercompany reinsurance. In
4
general, a pool of risks such as a trade group, or for similarly situated customers of an agency, are most appropriate for submission to the alternative markets unit. If a pool of risks is accepted, reinsurance agreements and dividend participant agreements are executed, external reinsurance is bound and a segregated portfolio cell is established and presented to the Cayman Islands Monetary Authority for approval.
Claims
Workers’ Compensation Insurance
Workers’ compensation claims management focuses on early intervention and aggressive disability management, utilizing the professional services of third-party medical case managers to supplement the expertise of in-house claims professionals when appropriate.
The Company believes in thorough education of its insureds and their employees regarding the workers’ compensation law and workplace safety. The Company utilizes frequent communication with all parties as a means to maintain control of claims and to minimize the influence of factors that increase costs such as attorney involvement and “doctor shopping.” The Company provides assistance and support to its insureds in the implementation of physician panels and return to work programs.
The Company utilizes strategic vendor relationships rather than in-house personnel for services such as legal representation, private investigation, vocational rehabilitation and medical case management. The Company is in the process of establishing an internal medical case management and utilization review department, as management believes this will improve the effectiveness and efficiency of its claims management process.
Medical cost management initiatives have been implemented with strategic vendors to reduce claim costs. Medical cost management services include catastrophic medical management, medical case management, preferred provider networks, physical therapy networks and a prescription drug program.
The Company attempts to aggressively achieve final resolution of and close claims from prior accident years as expeditiously as possible. The table below shows the total number of workers’ compensation claims received and open and closed claims, by accident year, as of December 31, 2011.
Traditional Business
(Exclusive of Alternative Markets)
Open Lost Time Claims (1)
| | | | | | | | | | | | | | | | | | | | |
Accident Year | | Total Claims | | | Open | | | Closed | | | % Closed | | | Open Reinsured
Claims | |
1994 | | | 1 | | | | — | | | | 1 | | | | 100.0 | % | | | — | |
1995 | | | 18 | | | | — | | | | 18 | | | | 100.0 | % | | | — | |
1996 | | | 342 | | | | — | | | | 342 | | | | 100.0 | % | | | — | |
1997 | | | 431 | | | | 1 | | | | 430 | | | | 99.8 | % | | | 1 | |
1998 | | | 567 | | | | 1 | | | | 566 | | | | 99.8 | % | | | 1 | |
1999 | | | 798 | | | | — | | | | 798 | | | | 100.0 | % | | | — | |
2000 | | | 1,503 | | | | 2 | | | | 1,501 | | | | 99.9 | % | | | 2 | |
2001 | | | 1,947 | | | | 3 | | | | 1,944 | | | | 99.8 | % | | | 2 | |
2002 | | | 1,194 | | | | 3 | | | | 1,191 | | | | 99.7 | % | | | 3 | |
2003 | | | 825 | | | | 5 | | | | 820 | | | | 99.4 | % | | | 2 | |
2004 | | | 1,137 | | | | 10 | | | | 1,127 | | | | 99.1 | % | | | 5 | |
2005 | | | 1,141 | | | | 7 | | | | 1,134 | | | | 99.4 | % | | | 1 | |
2006 | | | 1,353 | | | | 11 | | | | 1,342 | | | | 99.2 | % | | | 2 | |
2007 | | | 1,433 | | | | 22 | | | | 1,411 | | | | 98.5 | % | | | 3 | |
2008 | | | 1,508 | | | | 55 | | | | 1,453 | | | | 96.4 | % | | | 1 | |
2009 | | | 1,518 | | | | 96 | | | | 1,422 | | | | 94.7 | % | | | 1 | |
2010 | | | 1,829 | | | | 240 | | | | 1,589 | | | | 86.9 | % | | | 4 | |
2011 | | | 1,882 | | | | 877 | | | | 1,005 | | | | 53.4 | % | | | 1 | |
| | | | | | | | | | | | | | | | | | | | |
| | | 19,427 | | | | 1,333 | | | | 18,094 | | | | 93.1 | % | | | 29 | |
| | | | | | | | | | | | | | | | | | | | |
| (1) | Excludes medical only claims because such claims are opened and closed in a short period of time. |
5
The table below shows the number of open lost time claims for accident years 2010 and prior as of December 31, 2011 and 2010:
Traditional Business
(Exclusive of Alternative Markets)
Open Lost Time Claims (1)
| | | | | | | | | | | | | | | | |
Accident Year | | 12-31-11
Open | | | 12-31-10
Open | | | 2010 and Prior
Claims Closed
During 2011 | | | % of 2010 Open Claims
Closed During 2011 | |
1997 | | | 1 | | | | 1 | | | | — | | | | 0.0 | % |
1998 | | | 1 | | | | 2 | | | | 1 | | | | 50.0 | % |
1999 | | | — | | | | — | | | | — | | | | 0.0 | % |
2000 | | | 2 | | | | 2 | | | | — | | | | 0.0 | % |
2001 | | | 3 | | | | 5 | | | | 2 | | | | 40.0 | % |
2002 | | | 3 | | | | 4 | | | | 1 | | | | 25.0 | % |
2003 | | | 5 | | | | 5 | | | | — | | | | 0.0 | % |
2004 | | | 10 | | | | 12 | | | | 2 | | | | 16.7 | % |
2005 | | | 7 | | | | 14 | | | | 7 | | | | 50.0 | % |
2006 | | | 11 | | | | 18 | | | | 7 | | | | 38.9 | % |
2007 | | | 22 | | | | 47 | | | | 25 | | | | 53.2 | % |
2008 | | | 55 | | | | 88 | | | | 33 | | | | 37.5 | % |
2009 | | | 96 | | | | 206 | | | | 110 | | | | 53.4 | % |
2010 | | | 240 | | | | 754 | | | | 514 | | | | 68.2 | % |
| | | | | | | | | | | | | | | | |
| | | 456 | | | | 1,158 | | | | 702 | | | | 60.6 | % |
| | | | | | | | | | | | | | | | |
| (1) | Excludes medical only claims because such claims are opened and closed in a short period of time. |
Segregated Portfolio Cell Reinsurance
The claims administration strategy for the alternative market programs is consistent with the workers’ compensation insurance segment.
Reinsurance
The Company’s insurance subsidiaries reinsure a portion of their loss exposure and pay to the reinsurers a portion of the premiums received on all policies reinsured. Insurance policies written by the Company’s insurance subsidiaries are reinsured with other insurance companies principally to:
| | • | | reduce net liability on individual risks; |
| | • | | mitigate the effect of individual loss occurrences (including catastrophic losses); |
| | • | | stabilize underwriting results; and |
| | • | | decrease leverage and, accordingly, increase underwriting capacity. |
Reinsurance does not legally discharge the Company from primary liability for the full amount due under the reinsured policies. However, the assuming reinsurer is obligated to reimburse the Company to the extent of the coverage ceded. As of December 31, 2011, the Company’s reinsurance recoverables, by segment, were as follows (in thousands):
| | | | |
Segment | | Amount | |
Workers’ compensation insurance | | $ | 12,519 | |
Segregated portfolio cell reinsurance | | | 3,201 | |
| | | | |
Total | | $ | 15,720 | |
| | | | |
The Company determines the amount and scope of reinsurance coverage to purchase each year based on a number of factors, including the evaluation of the risks accepted, consultations with reinsurance representatives and a review of market conditions, including the availability and pricing of reinsurance.
6
The Company monitors the solvency of its reinsurers on an annual basis, at a minimum, through review of their financial statements and, if available, their A.M. Best financial strength ratings. The Company has not experienced difficulty collecting amounts due from reinsurers; however, the insolvency or inability of any reinsurer to meet its obligations could have a material adverse effect on the Company’s financial condition and results of operations.
Workers’ Compensation Insurance
The Company’s workers’ compensation traditional business is reinsured under an excess of loss arrangement under which the Company retains the first $500,000 on each loss occurrence. Loss occurrences in excess of $500,000 are covered up to a maximum of $39.5 million per claim.
The following table sets forth the amounts recoverable from reinsurers for the workers’ compensation insurance segment as of December 31, 2011 (dollars in thousands):
| | | | | | | | | | | | | | | | |
Name | | Reinsurance
Recoverable | | | A.M. Best
Rating | | | Percentage of
Shareholders’
Equity | | | Percentage of
Reinsurance
Recoverable | |
Lloyd’s of London | | $ | 5,155 | | | | A | | | | 4.1 | % | | | 32.8 | % |
General Reinsurance Corporation | | | 3,212 | | | | A++ | | | | 2.5 | % | | | 20.4 | % |
Aspen Insurance UK Limited | | | 3,072 | | | | A | | | | 2.4 | % | | | 19.5 | % |
Swiss Reinsurance America Corporation | | | 677 | | | | A+ | (2) | | | 0.5 | % | | | 4.3 | % |
Catalina London Limited. | | | 274 | | | | NR | (1) | | | 0.2 | % | | | 1.7 | % |
Alterra Bermuda Limited | | | 88 | | | | A | (3) | | | 0.1 | % | | | 0.6 | % |
Alea (Bermuda) Limited. | | | 27 | | | | NR | (1) | | | 0.0 | % | | | 0.2 | % |
St. Paul Reinsurance Company Ltd. | | | 14 | | | | NR | (1) | | | 0.0 | % | | | 0.1 | % |
| | | | | | | | | | | | | | | | |
| | $ | 12,519 | | | | | | | | 9.8 | % | | | 79.6 | % |
| | | | | | | | | | | | | | | | |
| (1) | Rating assigned to companies that are not rated by A.M. Best. |
| (2) | Effective December 21, 2011, Swiss Reinsurance America Corporation was upgraded by A.M. Best from an “A” (Excellent) to an “A+” (Superior). |
| (3) | Effective August 5, 2011, Alterra Bermuda Limited was placed on negative outlook by A.M. Best. |
Segregated Portfolio Cell Reinsurance
Intercompany Reinsurance Structure.Intercompany reinsurance agreements are the mechanisms by which premiums paid by alternative market customers are ceded to the segregated portfolio cells. Each segregated portfolio cell has the following reinsurance agreements:
| | • | | 100% Quota Share Reinsurance Agreements—Under this reinsurance agreement, all premiums received from the specific customer are ceded to the respective segregated portfolio cell, net of a ceding commission. As with any reinsurance arrangement, the ultimate liability for the payment of claims resides with the primary insurance company. The ceding commission paid by the segregated portfolio cell consists of charges customary to such arrangements including fronting fees, external reinsurance, agent’s commissions, premium taxes and assessments, claims administration and risk management services and segregated portfolio cell rental fees. In addition, the ceding commission includes the risk assumed under the aggregate excess reinsurance agreement described directly below. |
| | • | | Aggregate Excess Reinsurance Agreements—An aggregate excess reinsurance agreement exists for each respective segregated portfolio cell whereby EAIG assumes 100% of aggregate losses over an aggregate attachment point (expressed as a percentage of direct premiums written), with a maximum loss limit of $100,000. The attachment points for the aggregate excess reinsurance agreements average 89.0% of direct premiums written. For example, in the case of a segregated portfolio cell with $1.0 million in assumed premium and an 89.0% attachment point, the segregated portfolio cell pays the first $890,000 in net losses and LAE, EAIG pays the next $100,000 in net losses and LAE and the external aggregate reinsurer (as described below) pays net losses and LAE beyond the initial $990,000 covered by the segregated portfolio cell and EAIG. |
External Reinsurance.Each segregated portfolio cell purchases reinsurance coverage through the external reinsurance market. The segregated portfolio cell purchases per occurrence coverage to cover severity of claims and aggregate reinsurance coverage to cover frequency of claims on its segregated portfolio cell business.
7
Per Occurrence Reinsurance Agreements.Per occurrence reinsurance agreements cover each segregated portfolio cell for a catastrophic claim resulting from one event with respect to its segregated portfolio cell business. The specific retentions for per occurrence coverage for segregated portfolio cells range from $250,000 to $350,000, with limits ranging from $39.75 million to $39.65 million. For example, in the case of a segregated portfolio cell with a $300,000 retention that has a $3.0 million claim relating to the injury and/or death of a covered employee, the segregated portfolio cell would cover the first $300,000 of the claim with the third party reinsurer paying the remaining $2.7 million in claims.
Aggregate Reinsurance Coverage.Aggregate reinsurance agreements cover each segregated portfolio cell for losses and LAE beyond the $100,000 aggregate coverage provided by EAIG. The need for this coverage would arise in the event of a series of losses as opposed to a single, catastrophic event. Aggregate reinsurance coverage purchased through Lloyd’s of London has ultimate loss limits of $1.0 million or $2.0 million, depending on the underlying risks. This external reinsurance combined with the aggregate coverage provided by EAIG provides aggregate loss limits for each segregated portfolio cell ranging from $1.1 million to $2.1 million.
In addition to the reinsurance coverage on the segregated portfolio cell business, the dividend participants of each segregated portfolio cell provide a letter of credit to EAIG that is equal to the difference between the loss fund (amount of funds available to pay losses after deduction of ceding commission) and the aggregate attachment point of the reinsurance. This is sometimes called the GAP, or unfunded liability. As an example, if a program has $1.0 million of assumed premiums, a 40% ceding commission and a 90% aggregate attachment point, the letter of credit amount is $300,000 calculated as follows:
| | | | |
Aggregate attachment point ($1,000,000 x .90) | | $ | 900,000 | |
Loss fund ($1,000,000 – ($1,000,000 x .40)) | | $ | 600,000 | |
GAP | | $ | 300,000 | |
The difference between the premium and the ceding commission is deposited in each respective segregated portfolio cell’s Cayman Island bank account to create the loss fund.
The following table sets forth the amounts recoverable from reinsurers for the segregated portfolio cell reinsurance segment as of December 31, 2011 (dollars in thousands):
| | | | | | | | | | | | | | | | |
Name | | Reinsurance
Recoverable | | | A.M. Best
Rating | | | Percentage of
Shareholders’
Equity | | | Percentage of
Reinsurance
Recoverable | |
Lloyd’s of London | | $ | 1,943 | | | | A | | | | 1.5 | % | | | 12.4 | % |
Aspen Insurance UK Limited | | | 1,027 | | | | A | | | | 0.8 | % | | | 6.5 | % |
Catalina London Limited | | | 221 | | | | NR | (1) | | | 0.2 | % | | | 1.4 | % |
St. Paul Reinsurance Company Ltd. | | | 10 | | | | NR | (1) | | | 0.0 | % | | | 0.1 | % |
| | | | | | | | | | | | | | | | |
| | $ | 3,201 | | | | | | | | 2.5 | % | | | 20.4 | % |
| | | | | | | | | | | | | | | | |
| (1) | Rating assigned to companies that are not rated by A.M. Best. |
Loss and LAE Reserves
The Company estimates its reserves for unpaid losses and LAE as of the balance sheet date. The adequacy of the Company’s reserves is inherently uncertain and represents a significant risk to the business. The Company attempts to mitigate the uncertainty inherent in its reserves by continually reviewing loss cost trends, attempting to set premium rates that are adequate to cover anticipated future costs, and by professionally managing its claims administration function. Additionally, the Company attempts to minimize the estimation risk inherent in its reserves by employing actuarial techniques on a quarterly basis. Significant judgment is required in actuarial estimation to ascertain the relevance of historical payment and claim settlement patterns under current facts and circumstances. No assurance can be given as to whether the ultimate liability for unpaid losses and LAE will be more or less than the Company’s current estimates. While management believes that the assumptions underlying the amounts recorded for the reserves for unpaid losses and LAE as of December 31, 2011 are reasonable, the ultimate net liability may differ materially from the amount provided.
8
The following table provides a summary of the activity in the Company’s reserves for unpaid losses and LAE for the years ended December 31, 2011, 2010 and 2009 (in thousands):
| | | | | | | | | | | | |
| | | 2011 | | | 2010 | | | 2009 | |
Balance, beginning of period | | $ | 95,963 | | | $ | 89,509 | | | $ | 86,993 | |
Reinsurance recoverables on unpaid losses and LAE | | | 7,864 | | | | 8,512 | | | | 7,835 | |
| | | | | | | | | | | | |
Net balance, beginning of period | | | 88,099 | | | | 80,997 | | | | 79,158 | |
Incurred related to: | | | | | | | | | | | | |
Current year | | | 84,723 | | | | 76,794 | | | | 63,602 | |
Prior year | | | (1,001 | ) | | | 780 | | | | (4,836 | ) |
| | | | | | | | | | | | |
Total incurred | | | 83,722 | | | | 77,574 | | | | 58,766 | |
Paid related to: | | | | | | | | | | | | |
Current year | | | 31,444 | | | | 30,755 | | | | 22,369 | |
Prior year | | | 46,105 | | | | 39,717 | | | | 34,558 | |
| | | | | | | | | | | | |
Total paid | | | 77,549 | | | | 70,472 | | | | 56,927 | |
| | | | | | | | | | | | |
Net balance, end of period | | | 94,272 | | | | 88,099 | | | | 80,997 | |
Reinsurance recoverables on unpaid losses and LAE | | | 11,805 | | | | 7,864 | | | | 8,512 | |
| | | | | | | | | | | | |
Balance, end of period | | $ | 106,077 | | | $ | 95,963 | | | $ | 89,509 | |
| | | | | | | | | | | | |
Incurred losses by segment were as follows for the year ended December 31, 2011 (in thousands):
| | | | | | | | | | | | |
| | | Workers’
Compensation
Insurance
Segment | | | Segregated
Portfolio Cell
Reinsurance
Segment | | | Total | |
Incurred related to: | | | | | | | | | | | | |
Current year, gross of discount | | $ | 68,894 | | | $ | 18,770 | | | $ | 87,664 | |
Current period discount | | | (2,252 | ) | | | (689 | ) | | | (2,941 | ) |
Prior year, gross of discount | | | — | | | | (2,875 | ) | | | (2,875 | ) |
Accretion of prior period discount | | | 1,159 | | | | 715 | | | | 1,874 | |
| | | | | | | | | | | | |
Total incurred | | $ | 67,801 | | | $ | 15,921 | | | $ | 83,722 | |
| | | | | | | | | | | | |
Incurred losses by segment were as follows for the year ended December 31, 2010 (in thousands):
| | | | | | | | | | | | |
| | | Workers’
Compensation
Insurance
Segment | | | Segregated
Portfolio Cell
Reinsurance
Segment | | | Total | |
Incurred related to: | | | | | | | | | | | | |
Current year, gross of discount | | $ | 59,615 | | | $ | 19,746 | | | $ | 79,361 | |
Current period discount | | | (1,901 | ) | | | (666 | ) | | | (2,567 | ) |
Prior year, gross of discount | | | — | | | | (1,432 | ) | | | (1,432 | ) |
Accretion of prior period discount | | | 1,562 | | | | 650 | | | | 2,212 | |
| | | | | | | | | | | | |
Total incurred | | $ | 59,276 | | | $ | 18,298 | | | $ | 77,574 | |
| | | | | | | | | | | | |
Incurred losses by segment were as follows for the year ended December 31, 2009 (in thousands):
| | | | | | | | | | | | |
| | | Workers’
Compensation
Insurance
Segment | | | Segregated
Portfolio Cell
Reinsurance
Segment | | | Total | |
Incurred related to: | | | | | | | | | | | | |
Current year, gross of discount | | $ | 47,860 | | | $ | 17,732 | | | $ | 65,592 | |
Current period discount | | | (1,343 | ) | | | (647 | ) | | | (1,990 | ) |
Prior year, gross of discount | | | (3,749 | ) | | | (2,753 | ) | | | (6,502 | ) |
Accretion of prior period discount | | | 1,075 | | | | 591 | | | | 1,666 | |
| | | | | | | | | | | | |
Total incurred | | $ | 43,843 | | | $ | 14,923 | | | $ | 58,766 | |
| | | | | | | | | | | | |
9
For the years ended December 31, 2011, 2010 and 2009, the Company increased (decreased) its workers’ compensation insurance and segregated portfolio cell reinsurance reserves for unpaid losses and LAE, including the accretion of prior period discount, by the following amounts (in thousands):
| | | | | | | | | | | | |
| | | 2011 | | | 2010 | | | 2009 | |
Workers’ compensation insurance | | $ | 1,159 | | | $ | 1,562 | | | $ | (2,674 | ) |
Segregated portfolio cell reinsurance | | | (2,160 | ) | | | (782 | ) | | | (2,162 | ) |
| | | | | | | | | | | | |
Total | | $ | (1,001 | ) | | $ | 780 | | | $ | (4,836 | ) |
| | | | | | | | | | | | |
Workers’ Compensation Insurance
For the years ended December 31, 2011, 2010 and 2009, the Company increased (decreased) its workers’ compensation insurance reserves for unpaid losses and LAE by the following amounts by accident year (in thousands):
| | | | | | | | | | | | |
Accident Year | | 2011 | | | 2010 | | | 2009 | |
2010 | | $ | — | | | $ | — | | | $ | — | |
2009 | | | — | | | | — | | | | — | |
2008 | | | — | | | | — | | | | — | |
2007 | | | — | | | | — | | | | (1,170 | ) |
2006 | | | — | | | | — | | | | (1,504 | ) |
2005 | | | — | | | | — | | | | — | |
2004 | | | — | | | | — | | | | (250 | ) |
2003 | | | — | | | | — | | | | (325 | ) |
2002 | | | — | | | | — | | | | (500 | ) |
2001 and prior | | | — | | | | — | | | | — | |
| | | | | | | | | | | | |
Total before discount accretion | | | — | | | | — | | | | (3,749 | ) |
Discount accretion | | | 1,159 | | | | 1,562 | | | | 1,075 | |
| | | | | | | | | | | | |
Total | | $ | 1,159 | | | $ | 1,562 | | | $ | (2,674 | ) |
| | | | | | | | | | | | |
For the years ended December 31, 2011 and 2010, the Company did not recognize any development on prior accident year workers’ compensation insurance reserves.
For the year ended December 31, 2009, the Company recognized net favorable development on prior accident year workers’ compensation insurance reserves of $3.7 million, representing 6.7% of the Company’s estimated workers’ compensation insurance reserves as of December 31, 2008 and 5.1% of the Company’s workers’ compensation insurance net premiums earned for the year ended December 31, 2009. The favorable development arose primarily from accident years 2006 and 2007, and resulted from actual loss development being somewhat lower than the Company had expected based on its historical loss development experience, reflecting continued improvements in loss mitigation and underwriting. The improvements in loss mitigation and underwriting included greater availability and use of employers’ return to work programs. Furthermore, the Company was able to settle a large amount of Pennsylvania claims via compromise and release, which is a lump sum cash payment in exchange for a full and final claim settlement. Management attributes the large amount of compromise and release claim closures to the difficult economic conditions and the claimants’ choosing a lump sum cash settlement over the continuation of a workers’ compensation annuity payment.
10
Segregated Portfolio Cell Reinsurance
For the years ended December 31, 2011, 2010 and 2009, the Company increased (decreased) its segregated portfolio cell reinsurance reserves for unpaid losses and LAE by the following amounts, by accident year (in thousands):
| | | | | | | | | | | | |
Accident Year | | 2011 | | | 2010 | | | 2009 | |
2010 | | $ | (1,862 | ) | | $ | — | | | $ | — | |
2009 | | | (602 | ) | | | (1,372 | ) | | | — | |
2008 | | | (109 | ) | | | (418 | ) | | | (1,506 | ) |
2007 | | | (136 | ) | | | 423 | | | | (247 | ) |
2006 | | | (85 | ) | | | (12 | ) | | | (663 | ) |
2005 | | | (12 | ) | | | 103 | | | | 76 | |
2004 | | | (54 | ) | | | (124 | ) | | | (268 | ) |
2003 | | | (2 | ) | | | (51 | ) | | | 68 | |
2002 | | | (2 | ) | | | (10 | ) | | | (24 | ) |
2001 and prior | | | (11 | ) | | | 29 | | | | (189 | ) |
| | | | | | | | | | | | |
Total before discount accretion | | | (2,875 | ) | | | (1,432 | ) | | | (2,753 | ) |
Discount accretion | | | 715 | | | | 650 | | | | 591 | |
| | | | | | | | | | | | |
Total | | $ | (2,160 | ) | | $ | (782 | ) | | $ | (2,162 | ) |
| | | | | | | | | | | | |
The Company estimates and records reserves for its segregated portfolio cell reinsurance segment in the same manner as for its workers’ compensation insurance segment. Furthermore, the Company’s underwriting, claim administration and risk management services are consistent between its workers’ compensation insurance and segregated portfolio cell reinsurance segments. This is because the workers’ compensation insurance and segregated portfolio cell reinsurance segments derive their books of business from the same general business demographics and geography. Prior period reserve development in the segregated portfolio cell reinsurance segment results in an increase or decrease in the segment’s losses and LAE incurred and a corresponding decrease or increase in the segregated portfolio cell dividend expense.
For the year ended December 31, 2011, the Company recognized net favorable development on prior accident year segregated portfolio cell reinsurance reserves of $2.9 million, representing 12.6% of the Company’s estimated segregated portfolio cell reinsurance reserves as of December 31, 2010 and 10.1% of the Company’s segregated portfolio cell reinsurance net premiums earned for the year ended December 31, 2011. The favorable development arose primarily from accident years 2010 and 2009, but was generally prevalent in most prior accident years, and resulted from actual loss development being somewhat lower than the Company had expected based on its historical loss development experience, reflecting continued improvements in loss mitigation and underwriting.
For the year ended December 31, 2010, the Company recognized net favorable development on prior accident year segregated portfolio cell reinsurance reserves of $1.4 million, representing 6.5% of the Company’s estimated segregated portfolio cell reinsurance reserves as of December 31, 2009 and 5.8% of the Company’s segregated portfolio cell reinsurance net premiums earned for the year ended December 31, 2010. The favorable development arose primarily from accident years 2008 and 2009, but was generally prevalent in most prior accident years, and resulted from actual loss development being somewhat lower than the Company had expected based on its historical loss development experience, reflecting continued improvements in loss mitigation and underwriting. The unfavorable development recorded in 2010 related to accident year 2007 was driven by limited return to work options in one specific segregated portfolio cell program.
For the year ended December 31, 2009, the Company recognized net favorable development on prior accident year segregated portfolio cell reinsurance reserves of $2.8 million, representing 12.5% of the Company’s estimated segregated portfolio cell reinsurance reserves as of December 31, 2008 and 11.1% of the Company’s segregated portfolio cell reinsurance net premiums earned for the year ended December 31, 2009. The favorable development arose primarily from accident years 2006 and 2008, but was generally prevalent in most prior accident years, and resulted from actual loss development being somewhat lower than the Company had expected based on its historical loss development experience, reflecting continued improvements in loss mitigation and underwriting. The improvements in loss mitigation and underwriting included greater availability and use of employers’ return to work programs.
The analysis in the following table presents the development of the Company’s reserves for unpaid losses and LAE from December 31, 2001 to December 31, 2011 for both the workers’ compensation insurance and segregated portfolio cell reinsurance segments. The first line in the table shows the reserves for unpaid losses and LAE, net of reinsurance, as estimated at the end of each calendar year. The first section below that line shows the cumulative actual payments of losses and LAE, net of reinsurance, that relate to each year-end liability as they were paid at the end of subsequent annual periods.
11
The next section shows revised estimates of the original unpaid amounts, net of reinsurance, that are based on the subsequent payments and re-estimates of the remaining unpaid liabilities. The next line shows the favorable or unfavorable development of the original estimates, net of reinsurance. Loss reserve development in this table is cumulative, the estimated favorable or unfavorable development for a particular year represents the cumulative amount by which all previous liabilities are currently estimated to have been over- or under-estimated. The “cumulative redundancy/(deficiency)” is as of December 31, 2011, which represents the difference between the latest re-estimated liability and the amounts as originally estimated. A redundancy means the original estimate was higher than the current estimate; a deficiency means that the current estimate is higher than the original estimate (in thousands).
| | | | | | | | | | | | | | | | | | | | | | | | | | | | | | | | | | | | | | | | | | | | |
| | | As of December 31, | |
| | | 2001 | | | 2002 | | | 2003 | | | 2004 | | | 2005 | | | 2006 | | | 2007 | | | 2008 | | | 2009 | | | 2010 | | | 2011 | |
Reserves for unpaid losses and LAE, net of reinsurance | | $ | 10,352 | | | $ | 18,995 | | | $ | 35,372 | | | $ | 50,258 | | | $ | 54,610 | | | $ | 62,863 | | | $ | 63,726 | | | $ | 77,090 | | | $ | 79,442 | | | $ | 86,906 | | | $ | 94,066 | |
Cumulative amount of liability paid through: | | | | | | | | | | | | | | | | | | | | | | | | | | | | | | | | | | | | | | | | | | | | |
One year later | | | 8,399 | | | | 12,595 | | | | 16,954 | | | | 18,403 | | | | 19,386 | | | | 21,424 | | | | 25,664 | | | | 34,737 | | | | 39,297 | | | | 44,453 | | | | — | |
Two years later | | | 13,465 | | | | 20,609 | | | | 25,590 | | | | 27,612 | | | | 28,171 | | | | 32,792 | | | | 40,100 | | | | 51,284 | | | | 58,229 | | | | — | | | | — | |
Three years later | | | 16,369 | | | | 24,154 | | | | 29,299 | | | | 31,982 | | | | 33,080 | | | | 39,352 | | | | 46,854 | | | | 59,850 | | | | — | | | | — | | | | — | |
Four years later | | | 17,550 | | | | 25,433 | | | | 30,580 | | | | 33,336 | | | | 35,830 | | | | 41,593 | | | | 51,295 | | | | — | | | | — | | | | — | | | | — | |
Five years later | | | 17,932 | | | | 25,764 | | | | 31,123 | | | | 34,369 | | | | 37,038 | | | | 43,060 | | | | — | | | | — | | | | — | | | | — | | | | — | |
Six years later | | | 18,046 | | | | 25,825 | | | | 31,430 | | | | 34,596 | | | | 38,119 | | | | — | | | | — | | | | — | | | | — | | | | — | | | | — | |
Seven years later | | | 18,093 | | | | 25,868 | | | | 31,469 | | | | 35,171 | | | | — | | | | — | | | | — | | | | — | | | | — | | | | — | | | | — | |
Eight years later | | | 17,999 | | | | 25,933 | | | | 31,704 | | | | — | | | | — | | | | — | | | | — | | | | — | | | | — | | | | — | | | | — | |
Nine years later | | | 18,042 | | | | 26,061 | | | | — | | | | — | | | | — | | | | — | | | | — | | | | — | | | | — | | | | — | | | | — | |
Ten years later | | | 18,053 | | | | — | | | | — | | | | — | | | | — | | | | — | | | | — | | | | — | | | | — | | | | — | | | | — | |
| | | | | | | | | | | |
Liability estimated as of: | | | | | | | | | | | | | | | | | | | | | | | | | | | | | | | | | | | | | | | | | | | | |
One year later | | | 15,394 | | | | 26,511 | | | | 37,625 | | | | 43,208 | | | | 49,301 | | | | 52,791 | | | | 60,491 | | | | 72,216 | | | | 80,220 | | | | 85,906 | | | | — | |
Two years later | | | 18,208 | | | | 27,993 | | | | 36,038 | | | | 41,797 | | | | 42,940 | | | | 51,223 | | | | 56,054 | | | | 72,711 | | | | 78,459 | | | | — | | | | — | |
Three years later | | | 18,897 | | | | 27,848 | | | | 35,358 | | | | 39,392 | | | | 42,327 | | | | 48,507 | | | | 56,489 | | | | 71,564 | | | | — | | | | — | | | | — | |
Four years later | | | 18,892 | | | | 27,942 | | | | 34,347 | | | | 38,789 | | | | 41,266 | | | | 48,768 | | | | 56,001 | | | | — | | | | — | | | | — | | | | — | |
Five years later | | | 18,834 | | | | 27,670 | | | | 34,061 | | | | 37,582 | | | | 41,320 | | | | 48,677 | | | | — | | | | — | | | | — | | | | — | | | | — | |
Six years later | | | 18,951 | | | | 27,484 | | | | 33,199 | | | | 37,498 | | | | 41,312 | | | | — | | | | — | | | | — | | | | — | | | | — | | | | — | |
Seven years later | | | 18,784 | | | | 26,843 | | | | 33,218 | | | | 37,488 | | | | — | | | | — | | | | — | | | | — | | | | — | | | | — | | | | — | |
Eight years later | | | 18,482 | | | | 26,904 | | | | 33,260 | | | | — | | | | — | | | | — | | | | — | | | | — | | | | — | | | | — | | | | — | |
Nine years later | | | 18,527 | | | | 26,935 | | | | — | | | | — | | | | — | | | | — | | | | — | | | | — | | | | — | | | | — | | | | — | |
Ten years later | | | 18,544 | | | | — | | | | — | | | | — | | | | — | | | | — | | | | — | | | | — | | | | — | | | | — | | | | — | |
Cumulative total (deficiency) redundancy | | $ | (8,175 | ) | | $ | (7,909 | ) | | $ | 2,154 | | | $ | 12,760 | | | $ | 13,290 | | | $ | 14,095 | | | $ | 7,237 | | | $ | 4,379 | | | $ | (778 | ) | | $ | 1,000 | | | $ | 94,066 | |
| | | | | | | | | | | | | | | | | | | | | | | | | | | | | | | | | | | | | | | | | | | | |
Gross liability—end of year | | | 10,540 | | | | 20,361 | | | | 37,455 | | | | 53,108 | | | | 60,430 | | | | 67,232 | | | | 68,468 | | | | 84,925 | | | | 87,954 | | | | 94,772 | | | | 105,871 | |
Reinsurance recoverables | | | 188 | | | | 1,366 | | | | 2,083 | | | | 2,850 | | | | 5,820 | | | | 4,369 | | | | 4,742 | | | | 7,835 | | | | 8,512 | | | | 7,864 | | | | 11,805 | |
| | | | | | | | | | | | | | | | | | | | | | | | | | | | | | | | | | | | | | | | | | | | |
Net liability—end of year | | $ | 10,352 | | | $ | 18,995 | | | $ | 35,372 | | | $ | 50,258 | | | $ | 54,610 | | | $ | 62,863 | | | $ | 63,726 | | | $ | 77,090 | | | $ | 79,442 | | | $ | 86,906 | | | $ | 94,066 | |
| | | | | | | | | | | | | | | | | | | | | | | | | | | | | | | | | | | | | | | | | | | | |
Gross re-estimated liability—latest | | | 21,556 | | | | 31,736 | | | | 38,518 | | | | 44,259 | | | | 49,128 | | | | 57,119 | | | | 64,566 | | | | 82,540 | | | | 88,170 | | | | 95,309 | | | | | |
Re-estimated reinsurance recoverables—latest | | | 3,012 | | | | 4,801 | | | | 5,258 | | | | 6,771 | | | | 7,816 | | | | 8,442 | | | | 8,565 | | | | 10,976 | | | | 9,711 | | | | 9,403 | | | | | |
| | | | | | | | | | | | | | | | | | | | | | | | | | | | | | | | | | | | | | | | | | | | |
Net re-estimated liability—latest | | $ | 18,527 | | | $ | 26,904 | | | $ | 33,218 | | | $ | 37,498 | | | $ | 41,320 | | | $ | 48,768 | | | $ | 56,489 | | | $ | 72,711 | | | $ | 80,220 | | | $ | 85,906 | | | | | |
| | | | | | | | | | | | | | | | | | | | | | | | | | | | | | | | | | | | | | | | | | | | |
Gross cumulative (deficiency) redundancy | | $ | (11,016 | ) | | $ | (11,375 | ) | | $ | (1,063 | ) | | $ | 8,849 | | | $ | 11,302 | | | $ | 10,113 | | | $ | 3,902 | | | $ | 2,385 | | | $ | (216 | ) | | $ | (537 | ) | | | | |
| | | | | | | | | | | | | | | | | | | | | | | | | | | | | | | | | | | | | | | | | | | | |
| (1) | The reserves for unpaid losses and LAE as of December 31, 2010, 2009, 2008, 2007 and 2006 are reflected before the impact of purchase accounting adjustments of $330, $555, $1,068, $1,102 and $1,602, respectively. |
| (2) | The above table excludes reserves for unpaid losses and LAE of $206, $861 and $1,000 as of December 31, 2011, 2010 and 2009, respectively, related to the Company’s previous run-off specialty reinsurance segment that is now reported in the corporate/other segment. |
A.M. Best Rating
A.M. Best rates insurance companies based on factors of concern to policyholders. In evaluating a company’s financial and operating performance, A.M. Best reviews the company’s profitability, leverage and liquidity, its book of business, the adequacy and soundness of its reinsurance programs, the quality and estimated fair value of its investments, the adequacy of its reserves and surplus, its capital structure, the experience and competence of its management, and its marketing presence. A.M. Best ratings are intended to provide an independent opinion of an insurer’s ability to meet its obligations to its policyholders. Their evaluation is not directed at investors. As of December 31, 2011, Eastern Alliance Insurance Group and Eastern Re had a financial strength rating of “A” (Excellent) with a stable outlook. An “A” (Excellent) financial strength rating is the third highest out of 16 rating classifications.
The financial strength ratings assigned by A.M. Best to the Company’s insurance subsidiaries are subject to periodic review and may be upgraded or downgraded by A.M. Best as a result of changes in the views of the rating agency or positive or adverse developments in the insurance subsidiaries’ financial condition or results of operations.
12
Competition
The Company’s ability to compete successfully in its principal markets is dependent upon a number of factors, many of which are outside its control. Workers’ compensation insurance is subject to significant price competition. In addition to price, competition in the workers’ compensation insurance line of business is based on quality of the products, quality and delivery of service, financial strength, ratings, distribution systems and technical expertise.
The property and casualty insurance market is highly competitive. The Company competes with stock insurance companies, mutual insurance companies, local cooperatives and other underwriting organizations. The Company considers its principal competitors to be Old Republic Insurance Company, Travelers Insurance, Liberty Mutual Insurance Company, Erie Insurance Group, Guard Insurance Group, Penn National Insurance Company, Selective Insurance Group, Cincinnati Insurance Company, Lackawanna Insurance Group, Accident Fund Insurance Company of America, and the Highmark Casualty Insurance Company.
Investments
The Company’s investment portfolio consists of fixed income securities, convertible bonds, equity securities, and other long-term investments in various limited partnerships. The management and accounting for the Company’s investment function is outsourced to third parties. The Company has established an investment policy, approved by the Finance/Investment Committee of the Board of Directors, which has been communicated to the Company’s external investment managers. In addition, the Company has hired an independent investment consultant to oversee the Company’s investment managers and to assist the Company in setting and monitoring its investment policy. The independent investment consultant meets with the Finance/Investment Committee on at least a quarterly basis to review the Company’s investment portfolio. Management has monthly and quarterly controls in place to review the investment accounting process that is outsourced to a third party.
The Company’s investment objectives are:
| | • | | to meet insurance regulatory requirements; |
| | • | | to maintain adequate liquidity in its insurance subsidiaries; |
| | • | | to preserve capital through a well diversified, high quality investment portfolio; and |
| | • | | to maximize after tax income while generating competitive after tax total rates of return. |
The Company evaluates the performance of its investments through the use of various industry benchmarks. Benchmarks have been selected for each investment manager and/or portfolio and are reviewed on a quarterly basis by management and the Company’s Finance/Investment Committee. For the year ended December 31, 2011, the Company’s taxable equivalent total return, net of management fees, was 3.23%.
The Company’s investments in fixed income and equity securities are classified as “available for sale” and are reported at estimated fair value, with changes in fair value reported as a component of accumulated other comprehensive income (loss), net of applicable taxes. The Company’s convertible bonds are considered hybrid financial instruments and are reported at estimated fair value, with changes in fair value reported as a realized gain or loss in the consolidated statements of operations and comprehensive income (loss). The Company periodically evaluates its investments for other-than-temporary impairment. At the time an investment is determined to be other-than-temporarily impaired, the Company records a realized loss in the consolidated statements of operations and comprehensive income (loss). Any subsequent increase in the investment’s market value would be reported as an unrealized gain.
The Company’s other long-term investments include interests in various limited partnerships. The Company accounts for its limited partnership investments under the equity method. The carrying value of the Company’s limited partnership investments are based on the Company’s allocable share of the limited partnership’s net asset value. Changes in the Company’s interest in the limited partnerships recorded in the change in equity interest in limited partnerships in the consolidated statements of operations and comprehensive income (loss).
13
The following table sets forth consolidated information concerning the Company’s investments as of December 31, 2011 and 2010 (in thousands).
| | | | | | | | | | | | | | | | |
| | | As of December 31, | |
| | 2011 | | | 2010 | |
| | | Amortized
Cost or Cost | | | Estimated
Fair Market
Value | | | Amortized
Cost or Cost | | | Estimated
Fair Market
Value | |
U.S. Treasuries and government agencies | | $ | 15,524 | | | $ | 16,143 | | | $ | 22,775 | | | $ | 23,344 | |
State, Municipalities and political subdivisions | | | 39,904 | | | | 42,316 | | | | 31,282 | | | | 32,621 | |
Corporate securities | | | 44,748 | | | | 45,498 | | | | 36,462 | | | | 37,468 | |
Residential mortgage-backed securities | | | 21,499 | | | | 22,360 | | | | 25,474 | | | | 25,759 | |
Commercial mortgage-backed securities | | | 187 | | | | 206 | | | | 272 | | | | 289 | |
Collateralized mortgage obligations | | | 5,753 | | | | 5,876 | | | | 7,177 | | | | 7,220 | |
Other structured securities | | | 1,004 | | | | 1,023 | | | | 759 | | | | 773 | |
| | | | | | | | | | | | | | | | |
Total fixed income securities | | | 128,619 | | | | 133,422 | | | | 124,201 | | | | 127,474 | |
| | | | | | | | | | | | | | | | |
Equity securities | | | 16,566 | | | | 17,629 | | | | 17,002 | | | | 20,880 | |
Convertible bonds | | | 16,856 | | | | 17,574 | | | | 16,481 | | | | 18,140 | |
Other long-term investments | | | 8,100 | | | | 10,209 | | | | 9,642 | | | | 11,435 | |
| | | | | | | | | | | | | | | | |
Total investments | | $ | 170,141 | | | $ | 178,834 | | | $ | 167,326 | | | $ | 177,929 | |
| | | | | | | | | | | | | | | | |
Corporate securities include an investment in a fixed income mutual fund, held by the segregated portfolio cell reinsurance segment, with a cost and estimated fair value of $23,991 and $23,989, respectively, as of December 31, 2011. The fixed income mutual fund’s investment objective is to provide a total return that is consistent with the preservation of capital through investing in high grade U.S. Dollar fixed income securities with a maximum maturity not exceeding five years.
Other structured securities include other asset-backed securities collateralized by auto loans, equipment and manufactured homes.
As of December 31, 2011 and 2010, the estimated fair values of the Company’s other long-term investments, by investment strategy, were as follows (in thousands):
| | | | | | | | |
| | | 2011 | | | 2010 | |
Multi-strategy fund of funds | | $ | 5,578 | | | $ | 5,351 | |
Natural resources | | | 1,262 | | | | 2,515 | |
Structured finance opportunity fund | | | 2,769 | | | | 2,892 | |
Open-ended investment fund | | | 600 | | | | 629 | |
Real estate | | | — | | | | 48 | |
| | | | | | | | |
Total | | $ | 10,209 | | | $ | 11,435 | |
| | | | | | | | |
During 2011, the Company liquidated its interest in one of the natural resource funds and wrote off its interest in the real estate limited partnership. The write off of the real estate limited partnership totaled $49,000 and was a result of the limited partnership being liquidated without any benefit to the Company.
The gross unrealized losses and estimated fair value of fixed income securities, excluding those securities in the segregated portfolio cell reinsurance segment, classified as available-for-sale by category and length of time an individual security is in a continuous unrealized loss position as of December 31, 2011 were as follows (in thousands):
| | | | | | | | | | | | | | | | | | | | | | | | |
| | | Less Than 12 Months | | | 12 Months or More | | | Total | |
2011 | | Estimated
Fair
Value | | | Gross
Unrealized
Losses | | | Estimated
Fair
Value | | | Gross
Unrealized
Losses | | | Estimated
Fair
Value | | | Gross
Unrealized
Losses | |
States, municipalities, and political subdivisions | | $ | 1,604 | | | $ | (4 | ) | | $ | — | | | $ | — | | | $ | 1,604 | | | $ | (4 | ) |
Collateralized mortgage obligations | | | 375 | | | | (11 | ) | | | — | | | | — | | | | 375 | | | | (11 | ) |
| | | | | | | | | | | | | | | | | | | | | | | | |
Total fixed income securities | | | 1,979 | | | | (15 | ) | | | — | | | | — | | | | 1,979 | | | | (15 | ) |
Equity securities | | | 3,302 | | | | (374 | ) | | | — | | | | — | | | | 3,302 | | | | (374 | ) |
| | | | | | | | | | | | | | | | | | | | | | | | |
Total fixed income and equity securities | | $ | 5,281 | | | $ | (389 | ) | | $ | — | | | $ | — | | | $ | 5,281 | | | $ | (389 | ) |
| | | | | | | | | | | | | | | | | | | | | | | | |
14
| | | | | | | | | | | | | | | | | | | | | | | | |
2010 | | Less Than 12 Months | | | 12 Months or More | | | Total | |
| | Estimated
Fair
Value | | | Gross
Unrealized
Losses | | | Estimated
Fair
Value | | | Gross
Unrealized
Losses | | | Estimated
Fair
Value | | | Gross
Unrealized
Losses | |
U.S. Treasuries and government agencies | | $ | 860 | | | $ | (6 | ) | | $ | — | | | $ | — | | | $ | 860 | | | $ | (6 | ) |
States, municipalities, and political subdivisions | | | 5,914 | | | | (89 | ) | | | — | | | | — | | | | 5,914 | | | | (89 | ) |
Corporate securities | | | 2,508 | | | | (25 | ) | | | — | | | | — | | | | 2,508 | | | | (25 | ) |
Residential mortgage-backed securities | | | 10,921 | | | | (130 | ) | | | — | | | | — | | | | 10,921 | | | | (130 | ) |
Collateralized mortgage obligations | | | 1,700 | | | | (19 | ) | | | 722 | | | | (55 | ) | | | 2,422 | | | | (74 | ) |
Other structured securities | | | 446 | | | | (4 | ) | | | — | | | | — | | | | 446 | | | | (4 | ) |
| | | | | | | | | | | | | | | | | | | | | | | | |
Total fixed income securities | | $ | 22,349 | | | $ | (273 | ) | | $ | 722 | | | $ | (55 | ) | | $ | 23,071 | | | $ | (328 | ) |
| | | | | | | | | | | | | | | | | | | | | | | | |
Note: The Company has excluded the segregated portfolio cell reinsurance segment’s gross unrealized losses from the above table because changes in the estimated fair value of the segregated portfolio cell reinsurance segment’s fixed income and equity securities inures to the segregated portfolio cell dividend participant and, accordingly, is included in the segregated portfolio cell dividend payable and the related segregated portfolio dividend expense in the Company’s consolidated balance sheet and consolidated statement of operations, respectively. Management believes the exclusion of the segregated portfolio cell reinsurance segment from this disclosure provides a more transparent understanding of gross unrealized losses in the Company’s fixed income and equity security portfolios that could impact its consolidated financial position or results of operations.
As of December 31, 2011, the Company held 6 fixed income securities with gross unrealized losses totaling $15,000. Management has evaluated the unrealized losses related to those fixed income securities and determined that they are primarily due to a fluctuation in interest rates and not to credit issues of the issuer or the underlying assets in the case of asset-backed securities. The Company does not intend to sell the fixed income securities and it is not more likely than not that the Company will be required to sell the fixed income securities before recovery of their amortized cost bases, which may be maturity; therefore, management does not consider the fixed income securities to be other–than-temporarily impaired as of December 31, 2011.
As of December 31, 2011, the Company held 6 equity securities with gross unrealized losses totaling $374,000. These securities have been in an unrealized loss position for less than twelve months. The Company does not intend to sell the equity securities and it is not more likely than not that the Company will be required to sell the equity securities before recovery of their cost bases; therefore, management does not consider the equity securities to be other-than-temporarily impaired as of December 31, 2011.
For the years ended December 31, 2011, 2010 and 2009, the Company recorded other-than-temporary impairments, excluding impairments in the segregated portfolio cell reinsurance segment, totaling $0, $6,000, and $1,852,000, respectively. Other-than-temporary impairments in the segregated portfolio cell reinsurance segment totaled $78,000, $80,000 and $749,000 for the years ended December 31, 2011, 2010 and 2009, respectively.
As of December 31, 2011, the Company held asset-backed securities with an estimated fair value of $29.5 million. The types of underlying assets collateralizing these securities, the weighted average issuance date, average credit rating and the estimated fair value as of December 31, 2011 are as follows (in thousands):
| | | | | | | | | | | | |
Asset Type | | Weighted
Average Year
of Issuance | | | Weighted Average
Credit Rating | | | Estimated Fair
Value | |
Residential mortgage-backed securities (RMBS) | | | 2010 | | | | AAA | | | $ | 22,360 | |
Collateralized mortgage obligations (CMO) | | | 2007 | | | | AA+ | | | | 5,876 | |
Commercial mortgage-backed securities (CMBS) | | | 2005 | | | | AAA | | | | 206 | |
Auto loans | | | 2010 | | | | AAA | | | | 660 | |
Equipment | | | 2011 | | | | AAA | | | | 358 | |
Manufactured homes | | | 1996 | | | | AA | | | | 5 | |
| | | | | | | | | | | | |
Total | | | | | | | | | | $ | 29,465 | |
| | | | | | | | | | | | |
The Company held 41 RMBS securities as of December 31, 2011, all of which were rated AAA. These securities were all issued by government agencies.
The Company held 16 CMO securities as of December 31, 2011 all of which were rated AAA, except for two securities with a CC rating. The amortized cost and estimated fair value of the two CC-rated securities totaled $386,000 and 375,000 as of December 31, 2011, respectively.
The Company held three CMBS securities as of December 31, 2011, all of which were rated AAA.
15
The Company held two securities collateralized by auto loans as of December 31, 2011, both of which were rated AAA.
The Company held one security collateralized by equipment that was rated AAA and one security collateralized by manufactured home loans that was rated AA.
As of December 31, 2011, the Company held insurance enhanced securities, net of pre-refunded municipal bonds that are escrowed in U.S. government obligations, with an estimated fair value of $18.6 million, which represents approximately 10.4% of the Company’s total investments as of December 31, 2011. Municipal bonds made up 100% of the insurance enhanced securities.
The following table provides a breakdown of the ratings for these insurance enhanced securities, net of pre-refunded municipal bonds, with and without insurance (in thousands):
| | | | | | | | |
Ratings | | Ratings With
Insurance | | | Ratings Without
Insurance | |
AAA | | $ | 1,029 | | | $ | 1,029 | |
AA | | | 16,265 | | | | 15,426 | |
A | | | 1,114 | | | | 1,953 | |
BBB | | | 163 | | | | 163 | |
| | | | | | | | |
Total | | $ | 18,571 | | | $ | 18,571 | |
| | | | | | | | |
These securities had an average credit rating of AA+ as of December 31, 2011 (average credit rating of AA without the benefit of insurance).
The Company’s indirect exposure to third party insurers, by percentage of estimated fair value as of December 31, 2011 was as follows:
| | | | |
Insurer | | Percentage of
Estimated Fair
Value | |
Assured Guaranty Municipal Corporation | | | 40.9 | % |
National Re | | | 30.0 | % |
National Re FGIC | | | 17.4 | % |
AMBAC Financial Group, Inc. | | | 8.9 | % |
Financial Guaranty Insurance Company | | | 1.7 | % |
XLCA | | | 1.1 | % |
| | | | |
Total | | | 100.0 | % |
| | | | |
The following table shows the ratings distribution of the Company’s fixed income securities and convertible bonds, excluding fixed income securities of the segregated portfolio cell reinsurance segment, as a percentage of the estimated fair value of the fixed income and convertible bond portfolio as of December 31, 2011 (dollars in thousands).
| | | | | | | | |
| | | Total | | | Percentage of
Estimated Fair
Value | |
“AAA” | | $ | 53,663 | | | | 42.2 | % |
“AA” | | | 38,342 | | | | 30.2 | % |
“A” | | | 21,202 | | | | 16.7 | % |
“BBB” | | | 7,283 | | | | 5.7 | % |
Below Investment Grade | | | 6,517 | | | | 5.2 | % |
| | | | | | | | |
Total | | $ | 127,007 | | | | 100.0 | % |
| | | | | | | | |
Note: The Company has excluded the segregated portfolio cell reinsurance segment’s investment credit ratings from the above table because management believes the exclusion of the credit ratings of the segregated portfolio cell reinsurance segment’s fixed income securities provides a more transparent understanding of the underlying risk in the Company’s fixed income portfolio. Also, the Company has reported securities issued and/or guaranteed by the United States Government in the “AAA” classification. As of December 31, 2011, these securities were rated “AAA” by Moody’s and Fitch and “AA” by S&P.
16
The amortized cost and estimated fair value of fixed income securities and convertible bonds, excluding the fixed income mutual fund held by the segregated portfolio cell reinsurance segment which does not have a stated maturity date, as of December 31, 2011, by contractual maturity, are shown below (in thousands). Expected maturities could differ from contractual maturities because borrowers may have the right to call or prepay obligations, with or without call or prepayment penalties.
| | | | | | | | |
| | | Amortized
Cost | | | Estimated
Fair Value | |
Less than one year | | $ | 6,040 | | | $ | 6,173 | |
One through five years | | | 46,205 | | | | 47,634 | |
Five through ten years | | | 23,940 | | | | 25,624 | |
Greater than ten years | | | 16,856 | | | | 18,111 | |
Mortgage/asset-backed securities | | | 28,443 | | | | 29,465 | |
| | | | | | | | |
Total | | $ | 121,484 | | | $ | 127,007 | |
| | | | | | | | |
Company Web Sites
The Company operates two Web sites. The Company’s Corporate Web site (www.eihi.com) provides investor relations information and news. We make our annual report on Form 10-K, our quarterly reports on Form 10-Q, and our current reports on Form 8-K, and any amendments to those reports available, free of charge, on this website as soon as reasonably practical after they are filed with or furnished to the SEC. EAIG’s Web site (www.eains.com) provides information and news regarding workers’ compensation insurance products and services, in addition to secured content accessible to agents and insureds. The secured sections include a risk management library that allows EAIG’s risk management personnel to disseminate safety information quickly and effectively to agents and insureds.
Employees
As of December 31, 2011, the Company had 187 employees. The Company’s employees are not represented by a union. The Company considers its relationship with its employees to be excellent.
Regulation
General
Insurance companies are subject to supervision and regulation in the jurisdictions in which they conduct business. Insurance authorities in each jurisdiction have broad administrative powers to administer statutes and regulations with respect to all aspects of the insurance business, including:
| | • | | licensing of insurers and their agents; |
| | • | | approval of policy forms and premium rates; |
| | • | | mandating certain insurance benefits; |
| | • | | standards of solvency, including establishing statutory and risk-based capital requirements for statutory surplus; |
| | • | | classifying assets as admissible for purposes of determining statutory surplus; |
| | • | | regulating unfair trade and claim practices, including through the imposition of restrictions on marketing and sales practices, distribution arrangements and payment of inducements; |
| | • | | restrictions on the nature, quality and concentration of investments; |
| | • | | assessments by guaranty and other associations; |
| | • | | restrictions on the ability of insurance companies to pay dividends; |
| | • | | restrictions on transactions between insurance companies and their affiliates; |
| | • | | restrictions on acquisitions and dispositions of insurance companies; |
| | • | | restrictions on the size of risks insurable under a single policy; |
| | • | | requiring deposits for the benefit of policyholders; |
17
| | • | | requiring certain methods of accounting; |
| | • | | conducting periodic examinations of insurance company operations and finances; |
| | • | | reviewing claims administration practices; |
| | • | | prescribing the form and content of records of financial condition required to be filed; and |
| | • | | requiring reserves for unearned premiums, losses and other purposes. |
State insurance laws and regulations require insurance companies to file financial statements with insurance departments everywhere they do business, and the operations of insurance companies are subject to examination by those departments at any time. EIHI’s domestic insurance subsidiaries prepare statutory financial statements in accordance with accounting practices and procedures prescribed or permitted by these departments.
Examinations
Examinations of EIHI’s insurance subsidiaries are conducted by the domiciliary insurance department every three to five years. The Pennsylvania Insurance Department’s most recent examinations of Eastern Alliance and Allied Eastern for which a report was issued were as of December 31, 2006. The Indiana Insurance Department’s most recent examination of Employers Security for which a report was issued was as of December 31, 2009. These examinations did not result in any adjustments to the financial position of the insurance companies. In addition, there were no substantive qualitative matters indicated in the examination reports that had a material adverse impact on the Company’s operations. The Pennsylvania Insurance Department conducted an organizational examination of Eastern Advantage as of October 24, 2007. On February 25, 2011, the Pennsylvania Insurance Department notified the Company that a financial examination of Eastern Alliance, Allied Eastern, and Eastern Advantage would be conducted for the five-year period ending December 31, 2011.
Risk-Based Capital Requirements
Pennsylvania and Indiana impose the NAIC risk-based capital requirements that require insurance companies to calculate and report information under a risk-based formula. These risk-based capital requirements attempt to measure statutory capital and surplus needs based on the risks in an insurance company’s mix of products and investment portfolio. Under the formula, a company first determines its “authorized control level” risk-based capital. This authorized control level takes into account (i) the risk with respect to the insurer’s assets; (ii) the risk of adverse insurance experience with respect to the insurer’s liabilities and obligations; (iii) the interest rate risk with respect to the insurer’s business; and (iv) all other business and other relevant risks as are set forth in the risk-based capital instructions. As of December 31, 2011, the capital levels of EIHI’s insurance subsidiaries exceeded risk-based capital requirements.
Market Conduct Regulation
State insurance laws and regulations include numerous provisions governing trade practices and the marketplace activities of insurers, including provisions governing the form and content of disclosure to consumers, illustrations, advertising, sales practices and complaint handling. State regulatory authorities generally enforce these provisions through periodic market conduct examinations. To our knowledge, the Company is currently in compliance with these provisions.
Sarbanes-Oxley Act of 2002
The Company is subject to the Sarbanes-Oxley Act of 2002, which implemented legislative reforms intended to address corporate and accounting fraud. Among other reforms, the Sarbanes-Oxley Act requires chief executive officers and chief financial officers, or their equivalent, to certify to the accuracy of periodic reports filed with the SEC, subject to civil and criminal penalties if they knowingly or willfully violate this certification requirement. The Sarbanes-Oxley Act also increases the oversight of, and codifies, certain requirements relating to audit committees of public companies and how they interact with the company’s auditors. Audit committee members must be independent and are barred from accepting consulting, advisory or other compensatory fees from the Company. In addition, companies must disclose whether at least one member of the committee is a “financial expert,” as such term is defined by the SEC, and if not, why not. Pursuant to the Sarbanes-Oxley Act, the SEC has adopted rules requiring inclusion of an internal control report and assessment by management in the annual report to shareholders. The Sarbanes-Oxley Act requires the auditor that issues the audit report to perform an audit of the effectiveness of internal control over financial reporting that is integrated with the audit of the financial statements.
18
Insurance Guaranty Funds
Almost all states have guaranty fund laws under which insurers doing business in the state can be assessed to fund policyholder liabilities of insolvent insurance companies. Pennsylvania, Indiana and the other states in which our insurance companies do business have such laws. Under these laws, an insurer is subject to assessment depending upon its market share in the state of a given line of business. The most significant assessment fund to which the Company is subject is the Pennsylvania Workers’ Compensation Security Fund (the “Security Fund”), which assesses workers’ compensation insurers doing business in Pennsylvania for the purpose of providing funds to cover obligations to policyholders of insolvent insurance companies. The maximum assessment the Security Fund can impose is equal to 1.0% of the Company’s net workers’ compensation insurance premiums written in Pennsylvania in the year of assessment. The Company establishes reserves relating to specific insurance company insolvencies upon notification of an assessment by the respective state guaranty association. We cannot predict the amount or timing of any future assessments under these laws.
Cayman Islands Regulation
Eastern Re is organized and licensed as a Cayman Islands unrestricted Class B insurance company and is subject to regulation by the Cayman Islands Monetary Authority. Applicable laws and regulations govern the types of policies that the Company can insure or reinsure, the amount of capital that it must maintain and the way it can be invested, and the payment of dividends without approval by the Cayman Islands Monetary Authority. Eastern Re is required to maintain minimum capital of $120,000.
Holding Company Regulation
EIHI is registered as an insurance holding company under the Insurance Holding Company Act amendments to the Pennsylvania Insurance Code of 1921, as amended, and is subject to regulation and supervision by the Pennsylvania Insurance Department. EIHI is required to annually file a report of its operations with, and is subject to examination by, the Pennsylvania Insurance Department.
Each insurance company in a holding company system is required to register with the insurance supervisory agency of its state of domicile and furnish certain information. This includes information concerning the operations of companies within the holding company system that may materially affect the operations, management or financial condition of the insurers within the system. Pursuant to these laws, the respective insurance departments may examine insurance companies and their holding companies at any time, require disclosure of material transactions by insurance companies and their holding companies and require prior notice or approval of certain transactions, such as “extraordinary dividends” distributed by insurance companies.
All transactions within the holding company system affecting insurance companies and their holding companies must be fair and equitable. Notice of certain material transactions between insurance companies and any person or entity in their holding company system will be required to be given to the applicable insurance commissioner. In some states, certain transactions cannot be completed without the prior approval of the insurance commissioner.
Approval by the state insurance commissioner is required prior to any transaction affecting the control of an insurer domiciled in that state. In Pennsylvania, the acquisition of 10% or more of the outstanding capital stock of an insurer or its holding company is presumed to be a change in control. Pennsylvania law also prohibits any person from (i) making a tender offer for, or a request or invitation for tenders of, or seeking to acquire or acquiring any voting security of a Pennsylvania insurer if, after the acquisition, the person would be in control of the insurer, or (ii) effecting or attempting to effect an acquisition of control of or merger with a Pennsylvania insurer, unless the offer, request, invitation, acquisition, effectuation or attempt has received the prior approval of the Insurance Department.
Dividend Restrictions
EIHI’s ability to declare and pay dividends will depend in part on dividends received from its insurance subsidiaries. Our domestic insurance subsidiaries’ ability to pay dividends to the Company is limited by the insurance laws and regulations of Pennsylvania and Indiana. The maximum annual dividends that the domestic insurance entities may pay without prior approval from the Pennsylvania or Indiana Insurance Departments is limited to the greater of 10% of statutory surplus or 100% of statutory net income for the most recently filed annual statement. The maximum dividend that may be paid in 2012 by Eastern Alliance, Allied Eastern, Eastern Advantage, or Employers Security, without prior approval from the respective domiciliary insurance departments is $8.8 million, $910,000, $997,000, and $1.3 million, respectively.
Eastern Re must receive approval from the Cayman Islands Monetary Authority before it can pay any dividend to EIHI.
19
Note on Forward-Looking Statements
This document contains forward-looking statements, which can be identified by the use of such words as “estimate,” “project,” “believe,” “intend,” “anticipate,” “plan,” “seek,” “expect” and similar expressions. These forward-looking statements include:
| | • | | statements of goals, intentions and expectations; |
| | • | | statements regarding prospects and business strategy; and |
| | • | | estimates of future costs, benefits and results. |
These forward-looking statements are subject to significant risks, assumptions and uncertainties, including, among other things, the factors discussed under the heading “Risk Factors” that could affect the actual outcome of future events.
All of these factors are difficult to predict and many are beyond our control. These important factors include those discussed under “Risk Factors” and those listed below:
| | • | | the ability to carry out our business plans; |
| | • | | future economic conditions in the regional and national markets in which we compete that are less favorable than expected; |
| | • | | the effect of legislative, judicial, economic, demographic and regulatory events in the states in which we do business; |
| | • | | the ability to obtain licenses and enter new markets successfully and capitalize on growth opportunities either through mergers or the expansion of our agency network; |
| | • | | financial market conditions, including, but not limited to, changes in interest rates and the credit and equity markets causing a reduction of investment income or investment gains, an acceleration of the amortization of deferred policy acquisition costs, reduction in the value of our investment portfolio or a reduction in the demand for our products; |
| | • | | the impact of acts of terrorism and acts of war; |
| | • | | the effects of terrorist related insurance legislation and laws; |
| | • | | changes in general economic conditions, including inflation, unemployment, interest rates and other factors; |
| | • | | the cost, availability and collectibility of reinsurance; |
| | • | | estimates and adequacy of loss reserves and trends in losses and LAE; |
| | • | | heightened competition, including specifically the intensification of price competition, increased underwriting capacity and the entry of new competitors and the development of new products by new and existing competitors; |
| | • | | the effects of mergers, acquisitions and dispositions; |
| | • | | changes in the coverage terms selected by insurance customers, including higher deductibles and lower limits; |
| | • | | changes in the underwriting criteria that we use resulting from competitive pressures; |
| | • | | our inability to obtain regulatory approval of, or to implement, premium rate increases; |
| | • | | the potential impact on our reported earnings that could result from the adoption of future accounting standards issued by the Financial Accounting Standards Board or other standard-setting bodies; |
| | • | | our inability to carry out marketing and sales plans, including, among others, development of new products or changes to existing products and acceptance of the new or revised products in the market; |
| | • | | unanticipated changes in industry trends and ratings assigned by nationally recognized rating organizations; |
| | • | | adverse litigation or arbitration results; and |
| | • | | adverse changes in applicable laws, regulations or rules governing insurance holding companies and insurance companies, and tax or accounting matters including limitations on premium levels, increases in minimum capital and reserves, and other financial viability requirements, and changes that affect the cost of, or demand for our products. |
Because forward-looking information is subject to various risks and uncertainties, actual results may differ materially from that expressed or implied by the forward-looking information. Therefore, we caution you not to place undue reliance on this forward-looking information.
20
All subsequent written and oral forward-looking information attributable to the Company or any person acting on our behalf is expressly qualified in its entirety by the cautionary statements contained or referred to in this section. We do not undertake any obligation to publicly release any revisions that may be made to any forward-looking statements.
Because of these and other uncertainties, our actual future results may be materially different from the results indicated by these forward-looking statements. The Company has no obligation to update or revise any forward-looking statements to reflect any changed assumptions, any unanticipated events or any changes in the future.
Item 1A—Risk Factors
Our business is subject to numerous risks and uncertainties, the outcome of which may impact future results of operations and financial condition. These risks are as follows:
Risk Factors Relating to Our Business
Our results may be adversely affected if our actual losses exceed our loss reserves.
The Company maintains loss reserves to cover estimated amounts needed to pay for insured losses and for the LAE necessary to settle claims with respect to insured events that have occurred, including events that have not yet been reported to us. Estimating the reserves for unpaid losses and LAE is a difficult and complex process involving many variables and subjective judgments; reserves do not represent an exact measure of liability. Accordingly, our loss reserves may prove to be inadequate to cover our actual losses. We regularly review our reserving techniques and our overall amount of reserves. We review historical data and consider the impact of various factors such as:
| | • | | trends in claim frequency and severity; |
| | • | | information regarding each claim for losses; |
| | • | | legislative enactments, judicial decisions and legal developments regarding damages; and |
| | • | | trends in general economic conditions, including inflation and levels of employment. |
If we determine that our reserves for unpaid losses and LAE are inadequate, we will have to increase them. This adjustment would reduce income during the period in which the adjustment is made, which could have a material adverse impact on our financial condition and results of operations. For additional information, see “Item 1—Business, Loss and LAE Reserves” and “Item 7—Management’s Discussion and Analysis of Financial Condition and Results of Operations, Critical Accounting Polices and Estimates.”
If we do not accurately establish our premium rates, our results of operations may be adversely affected.
In general, the premium rates for our insurance policies are established when coverage is initiated and therefore, before all of the underlying costs are known. Like other insurance companies, we rely on estimates and assumptions in setting our premium rates. Establishing adequate rates is necessary, together with investment income, to generate sufficient revenue to offset losses, LAE and other underwriting expenses and to earn a profit. If we fail to accurately assess the risks that we assume, we may fail to charge adequate premium rates to cover our losses and expenses, which could reduce income and cause us to become unprofitable. As a result, our actual costs for providing insurance coverage to our policyholders may be significantly higher than our premiums.
In order to set premium rates accurately, we must collect and properly analyze a substantial volume of data; develop, test, and apply appropriate rating formulae; closely monitor and recognize changes in trends; project both severity and frequency of losses with reasonable accuracy; and estimate customer retention. Customer retention represents the amount of exposure a policyholder retains on any one risk or group of risks. The term may apply to an insurance policy, where the policyholder is an individual, family or business, or a reinsurance policy, where the policyholder is an insurance company. We must also implement our pricing accurately in accordance with our assumptions. For example, as we expand the geographic market in which we offer our workers’ compensation insurance products we may not price these products accurately or adequately. Our ability to undertake these efforts successfully, and as a result set premium rates accurately, is subject to a number of risks and uncertainties, including:
| | • | | inaccurate assessment of new markets in which we have little or no prior experience; |
| | • | | insufficient or unreliable data; |
| | • | | incorrect or incomplete analysis of available data; |
| | • | | uncertainties generally inherent in estimates and assumptions; |
21
| | • | | our inability to implement appropriate rating formula or other pricing methodologies; |
| | • | | costs of ongoing medical treatment; |
| | • | | our inability to accurately estimate customer retention, investment yields and the duration of our liability for losses and LAE; and |
| | • | | unanticipated court decisions, legislation or regulatory action. |
Consequently, we could set our premium rates too low, which could negatively affect our results of operations and our profitability, or we could set our premium rates too high, which could reduce our ability to obtain new or retain existing business and lead to lower net premiums earned.
If we do not effectively manage the growth of our operations we may not be able to compete or operate profitably.
Our growth strategy includes enhancing our market share in our existing markets, entering new geographic markets, introducing new insurance products and programs, further developing our agency relationships, and pursuing merger and acquisition opportunities. Our strategy is subject to various risks, including risks associated with our ability to:
| | • | | identify profitable new geographic markets to enter; |
| | • | | obtain licenses in new states in which we wish to market and sell our products; |
| | • | | successfully implement our underwriting, pricing, claims management, and product strategies over a larger operating region; |
| | • | | properly design and price new and existing products and programs and reinsurance facilities; |
| | • | | identify, train and retain qualified employees; |
| | • | | identify, recruit and integrate new independent agents; |
| | • | | formulate and execute a merger and acquisition strategy; and |
| | • | | augment our internal monitoring and control systems as we expand our business. |
We also may encounter difficulties in the implementation of our growth strategies, including unanticipated expenditures. In addition, our growth strategies may result in us entering into markets or product lines in which we have little or no prior experience. Any such difficulties could result in diversion of senior management time and adversely affect our financial results.
Our ability to manage our exposure to underwriting risks depends on the availability and cost of reinsurance coverage.
We use reinsurance arrangements to limit and manage the amount of risk we retain, to stabilize our underwriting results and to increase our underwriting capacity. Although we have not recently experienced difficulty in obtaining reinsurance at reasonable prices, the availability and cost of reinsurance is subject to current market conditions and may vary significantly over time. Any decrease in the amount of our reinsurance will increase our risk of loss. We may be unable to maintain our desired reinsurance coverage or to obtain other reinsurance coverage in adequate amounts and at favorable rates. If we are unable to renew our expiring coverage or obtain new coverage, it will be difficult for us to manage our underwriting risks and operate our business profitably.
It is also possible that the losses we experience on insured risks for which we have obtained reinsurance will exceed the coverage limits of the reinsurance. If the amount of our reinsurance coverage is insufficient, our insurance losses could increase substantially.
If our reinsurers do not pay our claims in a timely manner, we may incur losses.
We are subject to credit risk with respect to the reinsurers with whom we deal because buying reinsurance does not relieve us of our liability to policyholders. The Company had net reinsurance recoverables of $15.7 million as of December 31, 2011. For example, some of our reinsurers have been adversely impacted by the current economic environment and deterioration in the investment markets and, as a result, have been downgraded by A.M. Best, which could negatively impact the reinsurers’ results of operations or financial condition. If our reinsurers are not capable of fulfilling their financial obligations to us, including the inability to secure the necessary collateral provided under the reinsurance agreements, our insurance losses would increase, which would negatively affect our financial condition and results of operations.
22
Our investment performance may suffer as a result of adverse capital market developments, which may affect our financial results and ability to conduct business.
We invest the premiums we receive from policyholders until cash is needed to pay insured claims or other expenses. As of December 31, 2011, the Company held investments with an estimated fair value of $178.8 million. For the year ended December 31, 2011, the Company had $3.7 million of net investment income, representing 2.7% of its total revenues. Our investments are subject to a variety of investment risks, including risks relating to general economic conditions, market volatility, interest rate fluctuations, liquidity risk and credit risk. In particular, an unexpected increase in the volume or severity of claims may force us to liquidate investments, which may cause us to incur capital losses. If we do not structure the duration of our investments to match our insurance and reinsurance liabilities, we may be forced to liquidate investments prior to maturity at a significant loss to cover such payments. Investment losses could significantly decrease our asset base and statutory surplus, thereby affecting our ability to conduct business.
Our fixed income securities include investments in state and municipal bonds with an estimated fair value of $42.3 million as of December 31, 2011. Most states and many municipalities are experiencing financial difficulties and budget deficits as a result of the current economic environment and, as a result, the risks associated with our state and municipal bond portfolio have increased. Negative publicity surrounding state and municipality bond issues has resulted in reduced liquidity in the state and municipal bond market. The reduced market liquidity, as well as rising interest rates, has negatively impacted the estimated fair value of state and municipal bonds. If the liquidity in the state and municipal bond market does not improve, or worsens, the estimated fair value of the Company’s state and municipal bonds could decline further. Furthermore, the Company may experience an other-than-temporary impairment if a state or municipality in which the Company has an investment defaults on its obligations under the terms of the bond.
Our revenues may fluctuate with changes in interest rates.
Our investment portfolio contains a significant amount of fixed income securities, including bonds, mortgage-backed securities (“MBSs”), collateralized mortgage obligations (“CMOs”), and other asset-backed securities. The market values of all of our investments fluctuate depending on economic and political conditions and other factors beyond our control. The market values of our fixed income securities are particularly sensitive to changes in interest rates.
For example, if interest rates rise, fixed income securities generally will decrease in value. If interest rates decline, these securities generally will increase in value, except for MBSs, which may decline due to higher prepayments on the mortgages underlying the securities.
As of December 31, 2011, MBSs, including CMOs, constituted 15.9% of the estimated fair value of the Company’s investment portfolio. MBSs and CMOs are subject to prepayment risks that vary with, among other things, interest rates. During periods of declining interest rates, MBSs generally prepay faster as the underlying mortgages are prepaid and/or refinanced by the borrowers in order to take advantage of lower interest rates. MBSs that have an amortized cost that is greater than par (i.e., purchased at a premium) may incur a reduction in yield or a loss as a result of prepayments. In addition, during such periods, we generally will be unable to reinvest the proceeds of any prepayment at comparable yields. Conversely, during periods of rising interest rates, the frequency of prepayments generally decreases, and we may receive interest payments that are below the then prevailing interest rate for longer than expected. MBSs that have an amortized cost that is less than par (i.e., purchased at a discount) may incur a decrease in yield or a loss as a result of slower prepayments.
If we fail to comply with insurance industry regulations, or if those regulations become more burdensome, we may not be able to operate profitably.
Our insurance subsidiaries are regulated by government agencies in the states in which we conduct business, and we must comply with a number of state and federal laws and regulations. Most insurance regulations are intended to protect the interests of policyholders rather than those of shareholders and other investors.
If we fail to comply with these laws and regulations, state insurance departments can exercise a range of remedies from the imposition of fines to being placed in rehabilitation or liquidation. State insurance departments also conduct periodic examinations of the affairs of insurance companies and require the filing of annual and other reports relating to financial condition, holding company issues and other matters. These regulatory requirements may adversely affect or inhibit our ability to achieve some or all of our business objectives.
Part of our strategy includes expanded licensing and product filings for the Company. Regulatory authorities, however, have broad discretion to deny or revoke licenses for various reasons, including the violation of regulations. If we do not have
23
or obtain the requisite licenses and approvals or do not comply with applicable regulatory requirements, insurance regulatory authorities could preclude or temporarily suspend us from carrying on some or all of our activities, including our expansion objectives, or otherwise penalize us. Furthermore, changes in the level of regulation of the insurance industry or changes in laws or regulations or interpretations of such laws and regulations by regulatory authorities could adversely affect our ability to operate our business.
We are subject to various accounting and financial requirements established by the NAIC. Eastern Re is subject to the laws of the Cayman Islands and regulations promulgated by the Cayman Islands Monetary Authority. Failure to comply with these laws, regulations and requirements could result in consequences ranging from a regulatory examination to a regulatory takeover of one or more of our insurance subsidiaries. This would make our business less profitable. In addition, state regulators and the NAIC continually re-examine existing laws and regulations, with an emphasis on insurance company solvency issues and fair treatment of policyholders. Insurance laws and regulations could change or additional restrictions could be imposed that are more burdensome and make our business less profitable. Because these laws and regulations are for the protection of policyholders, any changes may not be in your best interest as a shareholder.
Compliance with applicable laws and regulations is time consuming and personnel-intensive, and changes in these laws and regulations may materially increase our direct and indirect compliance and other expenses of doing business, thus adversely affecting our financial condition and results of operations.
Workers’ compensation insurance markets in which we operate are highly competitive.
Competition in these markets is based on many factors. These factors include the perceived financial strength of the insurer, premiums charged, policy terms and conditions, services provided, reputation, financial ratings assigned by independent rating agencies and the experience of the insurer in the line of insurance to be written. The Company’s insurance subsidiaries compete with stock insurance companies, mutual companies, local cooperatives and other underwriting organizations. Our principal competitors in the workers’ compensation insurance market include Old Republic Insurance Company, Travelers Insurance, Liberty Mutual Insurance Company, Erie Insurance Group, Guard Insurance Group, Penn National Insurance Company, Selective Insurance Group, Cincinnati Insurance Company, Lackawanna Insurance Group, Accident Fund Insurance Company of America, and Highmark Casualty Insurance Company. The workers’ compensation line of insurance is subject to significant price competition. If competitors price their products aggressively, our ability to grow or renew our business may be adversely affected. We pay agents on a commission basis to produce business. Some competitors may offer higher commissions to independent agents or offer insurance at lower premium rates through the use of salaried personnel or other distribution methods that do not rely on independent agents. Increased competition could adversely affect our ability to attract and retain business and thereby reduce our profits from operations.
We could be adversely affected by the loss of our key personnel.
The success of our business is dependent, to a large extent, on the efforts of certain key personnel, in particular, Michael L. Boguski, our President and Chief Executive Officer, Kevin M. Shook, our Executive Vice President, Treasurer and Chief Financial Officer, Robert A. Gilpin, our Senior Vice President of Marketing and Field Operations, and Suzanne M. Emmet, our Senior Vice President of Claims and Corporate Compliance. We have employment agreements with each of Messrs. Boguski, Shook, Gilpin, and Ms. Emmet, which contain covenants not to compete. We do not maintain key man life insurance on any of these executives. The loss of key personnel could prevent us from fully implementing our business strategy and could significantly and negatively affect our financial condition and results of operations. As we continue to grow, we will need to recruit and retain additional qualified management personnel, and our ability to do so will depend upon a number of factors, such as our results of operations and prospects and the level of competition then prevailing in the market for qualified personnel. The current market for qualified insurance personnel is highly competitive.
Our results of operations may be adversely affected by any loss of business from key agents and by the creditworthiness of our agents.
Our products are marketed by independent agents. Other insurance companies compete with the Company for the services and allegiance of these agents. Because they are independent, these agents are not obligated to direct business to the Company and may choose to direct business to our competitors, or may direct less desirable risks to us. The Company’s ten largest agents in its workers’ compensation insurance segment accounted for 55.9% of its direct premiums written for the year ended December 31, 2011. The Company’s largest agent, The Alliance of Central PA, Inc., accounted for 10.2% of direct premiums written for the year ended December 31, 2011. No other agent accounted for more than 10.0% of direct
24
premiums written in the Company’s workers’ compensation insurance segment for the year ended December 31, 2011. If premium volume produced by any of the Company’s large agents were to decrease significantly, it would have a material adverse effect on us.
In addition, in accordance with industry practice, our customers sometimes pay the premiums for their policies to agents for payment to us. These premiums are considered paid when received by the agent and, thereafter, the customer is no longer liable to us for those amounts, whether or not we have actually received the premiums from the agent. Consequently, we assume a degree of credit risk associated with our reliance on agents in connection with the collection of insurance premiums.
If we are unable to collect receivables created as a result of our sale of Atlantic RE and Eastern Life, we could recognize a loss.
In connection with the sale of Atlantic RE, a portion of the purchase price consisted of a contingent profit commission of $3.0 million, payable upon the earlier of extinguishment of all Atlantic RE’s reinsurance obligations, commutation of those obligations, or ten years from the date of closing (December 9, 2020). The amount of the contingent profit commission is based upon the adequacy of the Company’s loss and LAE reserves as of September 30, 2010 compared to a predetermined targeted amount of loss and LAE reserves. The Company has recorded a receivable for the contingent profit commission on its consolidated balance sheet as of December 31, 2011. However, the ultimate amount of the contingent profit commission payment is dependent upon the amount of future claims incurred and the ability of the purchaser to manage the outstanding claims, both of which are outside the control of the Company. Accordingly, no assurance can be given that the Company will be collect all or any of the contingent profit commission in the future. If the Company determines at any future date that all or any portion of the contingent profit commission will not be collected, the Company will recognize a loss in the period in which such determination is made.
In connection with the sale of Eastern Life to Security Life Insurance Company of America (“Security Life”), a portion of the purchase price was payable by the delivery to Eastern Life by Security Life’s parent corporation, Security American Financial Enterprises, Inc. (“Security American”), of a three-year $1.75 million promissory note payable in full at maturity in 2013. The ability of Security American to repay the promissory note will be dependent upon its financial condition and the financial condition of Security Life when the note matures. If Security American is unable to repay the note at maturity, or if Security American’s financial condition deteriorates prior to the maturity date and it is more likely than not that they will be unable to repay the note, the Company will incur a loss.
Because the Company’s workers’ compensation insurance business is concentrated in Pennsylvania, the Company is subject to local economic risks as well as to changes in the regulatory and legal climate in Pennsylvania.
For the year ended December 31, 2011, 70.5% of the Company’s workers’ compensation premium was written in Pennsylvania. The Company’s workers’ compensation insurance business is affected by the economic health of Pennsylvania for two principal reasons. First, premium growth is dependent upon payroll growth, which, in turn, is affected by economic conditions. Second, losses and LAE can increase in weak economic conditions because it is more difficult to return injured workers to the job when employers are otherwise reducing payrolls. Finally, as a result of the Company’s high concentration of Pennsylvania business, the Company can be adversely affected by any material change in Pennsylvania law or regulation or any Pennsylvania court decision affecting workers’ compensation carriers generally.
Future changes in financial accounting standards or practices or existing tax laws may adversely affect our reported results of operations.
Financial accounting standards in the United States are constantly under review and may be changed from time to time. We would be required to apply these changes when adopted. Once implemented, these changes could materially affect our results of operations and/or the way in which such results of operations are reported. Similarly, we are subject to taxation in the United States and a number of state jurisdictions. Rates of taxation, definitions of income, exclusions from income, and other tax policies are subject to change over time. Eastern Re is domiciled in the Cayman Islands. Changes in Cayman Islands tax laws could have a material impact on our consolidated results of operations.
Proposals to federally regulate the insurance business could affect our business.
Currently, the U.S. federal government does not directly regulate the insurance business. However, federal legislation and administrative policies in several areas can significantly and adversely affect insurance companies. These areas include
25
financial services regulation, securities regulation, pension regulation, privacy, tort reform legislation and taxation. In addition, various forms of direct federal regulation of insurance have been proposed. These proposals include the State Modernization and Regulatory Transparency Act, which would maintain state-based regulation of insurance but would affect state regulation of certain aspects of the insurance business, including rates, agency and company licensing, and market conduct examinations, and the National Insurance Act of 2007, which would provide for optional federal charters for insurance companies. We cannot predict whether this or other proposals will be adopted, or what impact, if any, such proposals or, if enacted, such laws may have on our business, financial condition or results of operations.
Risk Factors Relating to Our Common Stock
Directors and management could effectively control certain situations that may be viewed as contrary to your interests.
The extent of management’s control over the Company is related to the following factors:
| | • | | Directors and management owned approximately 17.3% of the Company’s outstanding stock as of December 31, 2011. |
| | • | | The employee stock ownership plan (“ESOP”) owns 8.8%, or 699,885 shares, of the Company’s outstanding stock as of December 31, 2011. The shares held by the ESOP will be voted in the manner directed by the ESOP participants. |
| | • | | We have implemented a stock compensation plan pursuant to which shares of restricted stock and stock options have been issued to certain of our directors, officers and employees. |
As a result of these factors, the Company’s directors and management, directly or indirectly, hold a substantial equity interest in the Company. If all members of management were to act together as a group, they could have a significant influence over the outcome of the election of directors and any other shareholder vote. Therefore, management might have the power to take actions that nonaffiliated shareholders may deem to be contrary to the shareholders’ best interests.
Provisions in our articles and bylaws and statutory provisions may serve to entrench management and also may discourage takeover attempts that you may believe are in your best interests.
We are subject to provisions of Pennsylvania corporate and insurance law that hinder a change of control. Pennsylvania law requires the Pennsylvania Insurance Department’s prior approval of a change of control of an insurance holding company. Under Pennsylvania law, the acquisition of 10% or more of the outstanding capital stock of an insurer or its holding company is presumed to be a change in control. Approval by the Pennsylvania Insurance Department may be withheld even if the transaction would be in the shareholders’ best interest if, among other things, the Pennsylvania Insurance Department determines that the transaction would be detrimental to policyholders.
Our articles of incorporation and bylaws also contain provisions that may discourage a change in control. These provisions include:
| | • | | a classified Board of Directors divided into three classes serving for successive terms of three years each; |
| | • | | a provision that the Board of Directors has the authority to issue shares of authorized but unissued common stock and preferred stock and to establish the terms of any one or more series of preferred stock, including voting rights, without additional shareholder approval; |
| | • | | the prohibition of cumulative voting in the election of directors; |
| | • | | the requirement that nominations for the election of directors made by shareholders and any shareholder proposals for inclusion on the agenda at any annual meeting must be made by notice (in writing) delivered or mailed to us not less than 90 days or more than 120 days prior to the meeting; |
| | • | | the prohibition of shareholder action without a meeting and the prohibition of shareholders being able to call a special meeting; |
| | • | | the requirement that certain provisions of our articles of incorporation can only be amended by an affirmative vote of shareholders entitled to cast at least 80% of all votes that shareholders are entitled to cast, unless approved by an affirmative vote of at least 80% of the members of the Board of Directors; and |
| | • | | the requirement that certain provisions of our bylaws can only be amended by an affirmative vote of shareholders entitled to cast at least 66 2/3%, or in certain cases 80%, of all votes that shareholders are entitled to cast. |
26
These provisions may serve to entrench management and may discourage a takeover attempt that you may consider to be in your best interest or in which you would receive a substantial premium over the current market price. These provisions may make it extremely difficult for any one person or group of affiliated persons to acquire voting control of the Company, with the result that it may be extremely difficult to bring about a change in the Board of Directors or management. Some of these provisions also may perpetuate present management because of the additional time required to cause a change in the control of the board. Other provisions make it difficult for shareholders owning less than a majority of the voting stock to be able to elect even a single director.
Provisions of the Pennsylvania Business Corporation Law, which we refer to as the PBCL, that are applicable to publicly traded companies provide, among other things, that we may not engage in a business combination with an “interested shareholder” during the five-year period after the interested shareholder became such, except under certain specified circumstances. Under the PBCL, an interested shareholder is generally a holder of 20% or more of our voting stock. The PBCL also contains provisions providing for the ability of shareholders to object to the acquisition by a person, or group of persons acting in concert, of 20% or more of our outstanding voting securities and to demand that they be paid a cash payment for the fair value of their shares from the controlling person or group.
If our insurance subsidiaries are not sufficiently profitable, our ability to pay dividends will be limited by regulatory restrictions.
Our domestic insurance subsidiaries’ ability to pay dividends to the Company is limited by the insurance laws and regulations of Pennsylvania and Indiana. The maximum dividend that the domestic insurance entities may pay without prior approval from the Pennsylvania Insurance Department and the Indiana Insurance Department is limited to the greater of 10% of statutory surplus or 100% of statutory net income for the most recently filed annual statement.
Eastern Re must receive approval from the Cayman Islands Monetary Authority before it can pay any dividend. Furthermore, any dividends paid in excess of Eastern Re’s cumulative earnings and profits subsequent to June 16, 2006 would be subject to U.S. federal income tax.
Item 1B—Unresolved Staff Comments
None.
Item 2—Properties
The Company’s corporate headquarters are located at 25 Race Avenue in Lancaster, Pennsylvania. The Company leases its home office building under a 15-year, non-cancelable operating lease through February 2017. The base rent is subject to an annual increase based upon the consumer price index at the end of each preceding calendar year. In addition to the base rent, the Company is responsible for its proportionate share of expenses related to the building including, but not limited to, utilities, maintenance, real estate taxes, and insurance. The Company has a 5% interest in the limited partnership that owns the building.
The Company also has regional offices in Charlotte, North Carolina, Indianapolis, Indiana, Franklin, Tennessee, Wexford, Pennsylvania and Richmond, Virginia and leases office space in each of these locations under multi-year operating leases.
The home office building is used by the workers’ compensation insurance and corporate/other segments. The regional office space in North Carolina, Indiana, Tennessee, Western Pennyslvania and Virginia is primarily used by the workers’ compensation insurance segment to provide underwriting, marketing, claims and risk management services to insureds in the respective geographic markets.
Item 3—Legal Proceedings
The Company is, from time to time, involved in legal proceedings that arise in the ordinary course of business. We believe we have sufficient loss reserves and reinsurance to cover claims under insurance policies issued by us. Although there can be no assurance as to the ultimate disposition of these matters, we do not believe, based upon the information available at this time, that any current pending legal proceedings, individually or in the aggregate, will have a material adverse effect on our business, financial condition, or results of operations.
27
AIG Arbitration
On September 6, 2011, the Company served a written demand (the “Arbitration Demand”) initiating arbitration proceedings against various AIG Companies under 24 reinsurance treaties pursuant to which the Company reinsured AIG Companies for certain pollution liability risks related to underground storage tanks for the policy years 1990 through 1999 (the “Treaties”). The Treaties were cancelled by the Eastern Re in 1999. In the Arbitration Demand, the Company seeks an award from the arbitration panel compelling AIG Companies to permit the Company to audit the books and records of AIG Companies relevant to the Treaties, among other reasons, to enable the Company to examine the bases for certain paid losses and loss reserves ceded by AIG Companies to Eastern Re under the Treaties. The Company believes that the Treaties permit such an audit (and the Company’s prior requests have been denied by AIG Companies).
On October 3, 2011, AIG Companies responded to the Arbitration Demand by advising that they will seek an award from the arbitration panel of approximately $1.9 million plus future amounts that may become due under the Treaties before the final hearing in the arbitration. Both the Company and AIG Companies seek attorney’s fees and costs in the arbitration.
At this stage of the proceedings, both the Company and AIG Companies have appointed arbitrators. The parties are currently in the process of attempting to select an umpire.
While the Company believes it has adequately reserved the claims at issue in the arbitration, and that it is entitled to the relief it requested in the arbitration, it is reasonably possible that the final outcome of the arbitration could go against the Company.
Item 4—Mine Safety Disclosures
Not applicable.
28
PART II
Item 5—Market for Registrant’s Common Equity, Related Stockholder Matters and Issuer Purchases of Equity Securities
Our common stock trades on the NASDAQ Global Market under the symbol “EIHI”. As of March 7, 2012, there were 490 registered holders of record of our common stock.
During 2011, the Company paid four quarterly dividends of $0.07/share. Any payment of dividends in the future on the common stock is subject to determination and declaration by the Company’s Board of Directors, who will take into consideration the Company’s financial condition, results of operations and future prospects.
The table below sets forth information with respect to the amount and frequency of dividends declared on our common stock for the years ended December 31, 2011 and 2010. It is currently expected that cash dividends will continue to be paid in the future.
| | | | | | | | |
Date of Declaration by EIHI Board | | Type of and Amount of Dividend | | Record Date for Payment | | Payment Date |
February 17, 2011 | | Regular | | $0.07 cash per share | | March 17, 2011 | | March 31, 2011 |
May 12, 2011 | | Regular | | $0.07 cash per share | | June 16, 2011 | | June 30, 2011 |
August 18, 2011 | | Regular | | $0.07 cash per share | | September 16, 2011 | | September 30, 2011 |
November 10, 2011 | | Regular | | $0.07 cash per share | | December 16, 2011 | | December 30, 2011 |
| | | |
Date of Declaration by EIHI Board | | Type of and Amount of Dividend | | Record Date for Payment | | Payment Date |
February 18, 2010 | | Regular | | $0.07 cash per share | | March 17, 2010 | | March 31, 2010 |
May 13, 2010 | | Regular | | $0.07 cash per share | | June 16, 2010 | | June 30, 2010 |
August 19, 2010 | | Regular | | $0.07 cash per share | | September 16, 2010 | | September 30, 2010 |
November 11, 2010 | | Regular | | $0.07 cash per share | | December 10, 2010 | | December 24, 2010 |
Information regarding restrictions and limitations on the payment of cash dividends can be found in Item 7, “Management’s Discussion and Analysis of Financial Condition and Results of Operations” in the “Financial Condition, Liquidity and Capital Resources” section.
The table below sets forth the high and low sales prices of our common stock for each quarterly period as reported by the NASDAQ for the years ended December 31, 2011 and 2010.
| | | | | | | | | | | | | | | | |
| | | 2011 | | | 2010 | |
| | | Low | | | High | | | Low | | | High | |
1st quarter | | $ | 11.45 | | | $ | 13.40 | | | $ | 8.18 | | | $ | 10.50 | |
2nd quarter | | $ | 12.90 | | | $ | 13.82 | | | $ | 9.84 | | | $ | 11.70 | |
3rd quarter | | $ | 12.34 | | | $ | 13.50 | | | $ | 10.01 | | | $ | 11.98 | |
4th quarter | | $ | 12.91 | | | $ | 14.15 | | | $ | 10.35 | | | $ | 12.18 | |
29
Equity Compensation Plan Information
The Company adopted the Eastern Insurance Holdings, Inc. 2006 Stock Incentive Plan (the “Stock Incentive Plan”) on December 18, 2006. Under the terms of the Stock Incentive Plan, stock awards may be made in the form of incentive stock options, non-qualified stock options or restricted stock. The following table provides the total number of stock awards outstanding, including the weighted average exercise price, as of December 31, 2011:
| | | | | | | | | | | | |
Plan category | | Number of securities to be
issued upon exercise of
outstanding options,
warrants and rights | | | Weighted–average
exercise price of
outstanding options,
warrants and rights | | | Number of securities
remaining available for
future issuance under
equity compensation plans
(excluding securities
reflected in column (a)) | |
| | | (a) | | | (b) | | | (c) | |
Equity compensation plans approved by security holders | | | 754,622 | | | $ | 13.21 | | | | 389,702 | (1) |
Equity compensation plans not approved by security holders | | | — | | | | — | | | | — | |
Total | | | 754,622 | | | $ | 13.21 | | | | 389,702 | (1) |
| (1) | Beginning with calendar year 2008, the number of securities available for future issuance under the Stock Incentive Plan is automatically increased on January 1 by an amount equal to 1.0% of the total outstanding common shares on the last trading day of December of the immediately preceding calendar year. The number of securities available for future issuance can be in the form of stock options or restricted stock. |
On February 24, 2012, the Company’s Board of Directors approved the issuance of an additional 218,500 non-qualified stock option awards and an additional 128,700 restricted stock awards. The grant date fair value of the awards was $14.45.
30
Performance Graph
Set forth below is a line graph comparing the dollar change in the cumulative total shareholder return on the Company’s common stock for the year ended December 31, 2011 compared to the cumulative total return of the NASDAQ Composite Index and the cumulative total return of the SNL Insurance Underwriter Index. The chart depicts the value on December 31, 2011 of a $100 investment made on December 31, 2006.
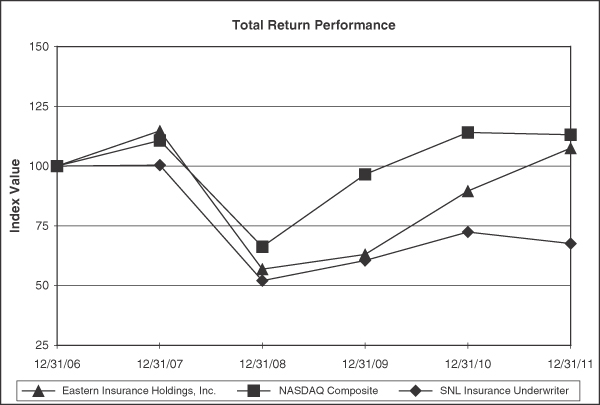
| | | | | | | | | | | | | | | | | | | | | | | | |
| | | Period Ending | |
Index | | 12/31/06 | | | 12/31/07 | | | 12/31/08 | | | 12/31/09 | | | 12/31/10 | | | 12/31/11 | |
Eastern Insurance Holdings, Inc. | | | 100.00 | | | | 114.71 | | | | 57.11 | | | | 63.20 | | | | 89.60 | | | | 107.52 | |
NASDAQ Composite | | | 100.00 | | | | 110.66 | | | | 66.42 | | | | 96.54 | | | | 114.06 | | | | 113.16 | |
SNL Insurance Underwriter Index | | | 100.00 | | | | 100.50 | | | | 52.23 | | | | 60.64 | | | | 72.51 | | | | 67.73 | |
31
Unregistered Sales of Equity Securities and Use of Proceeds
Issuer Purchases of Equity Securities
As of December 31, 2011, the Company has repurchased 3,850,568 shares of its common stock. The share repurchases will be held as treasury stock and are available for issuance in connection with the Company’s Stock Incentive Plan.
The following table presents information with respect to those purchases of our common stock made during the year ended December 31, 2011. On August 23, 2011, the Company’s Board of Directors increased the repurchase authorization of its issued and outstanding shares of common stock by 1,000,000 shares.
| | | | | | | | | | | | | | | | |
Period | | Total number of
shares purchased | | | Average price
paid per share | | | Total number of
shares purchased as
part of publicly
announced plans
or programs | | | Maximum number
(or approximate
dollar value) of
shares that may yet
be purchased under
the plans or
programs | |
January 1-31, 2011 | | | 129,110 | | | $ | 12.34 | | | | 129,110 | | | | 987,855 | |
February 1-28, 2011 | | | 31,976 | | | $ | 13.02 | | | | 31,976 | | | | 955,879 | |
March 1-31, 2011 | | | 360,832 | | | $ | 12.57 | | | | 360,832 | | | | 595,047 | |
April 1-30, 2011 | | | 72,948 | | | $ | 12.86 | | | | 72,948 | | | | 522,099 | |
May 1-31, 2011 | | | 111,984 | | | $ | 13.24 | | | | 111,984 | | | | 410,115 | |
June 1-30, 2011 | | | 26,405 | | | $ | 13.21 | | | | 26,405 | | | | 383,710 | |
July 1-31, 2011 | | | 70,063 | | | $ | 13.24 | | | | 70,063 | | | | 313,647 | |
August 1-31, 2011 | | | 123,012 | | | $ | 13.10 | | | | 123,012 | | | | 1,190,635 | |
September 1-30, 2011 | | | 79,998 | | | $ | 13.14 | | | | 79,998 | | | | 1,110,637 | |
October 1-31, 2011 | | | 11,970 | | | $ | 13.10 | | | | 11,970 | | | | 1,098,667 | |
November 1-30, 2011 | | | 12,100 | | | $ | 13.31 | | | | 12,100 | | | | 1,086,567 | |
December 1-31, 2011 | | | — | | | | — | | | | — | | | | 1,086,567 | |
| | | | | | | | | | | | | | | | |
Total | | | 1,030,398 | | | $ | 12.83 | | | | 1,030,398 | | | | | |
| | | | | | | | | | | | | | | | |
The following table presents information with respect to those purchases of our common stock made during the year ended December 31, 2010:
| | | | | | | | | | | | | | | | |
Period | | Total number of
shares purchased | | | Average price
paid per share | | | Total number of
shares purchases as
part of publicly
announced plans
or programs | | | Maximum number
(or approximate
dollar value) of
shares that may yet
be purchased under
the plans or
programs (a) | |
January 1-31, 2010 | | | — | | | $ | — | | | | — | | | | 9,570,000 | |
February 1-28, 2010 | | | — | | | $ | — | | | | — | | | | 9,570,000 | |
March 1-31, 2010 | | | — | | | $ | — | | | | — | | | | 9,570,000 | |
April 1-30, 2010 | | | — | | | $ | — | | | | — | | | | 9,570,000 | |
May 1-31, 2010 | | | 167,128 | | | $ | 10.79 | | | | 167,128 | | | | 7,770,000 | |
June 1-30, 2010 | | | 218,917 | | | $ | 10.75 | | | | 218,917 | | | | 5,420,000 | |
July 1-31, 2010 | | | 96,450 | | | $ | 10.79 | | | | 96,450 | | | | 4,380,000 | |
August 1-31, 2010 | | | — | | | $ | — | | | | — | | | | 4,380,000 | |
September 1-30, 2010 | | | — | | | $ | — | | | | — | | | | 4,380,000 | |
October 1-31, 2010 | | | — | | | $ | — | | | | — | | | | 4,380,000 | |
November 1-30, 2010 | | | — | | | $ | — | | | | — | | | | 4,380,000 | |
December 1-31, 2010 | | | 245,918 | | | $ | 11.92 | | | | 245,918 | | | | 1,450,000 | |
| | | | | | | | | | | | | | | | |
Total | | | 728,413 | | | $ | 11.16 | | | | 728,413 | | | | | |
| | | | | | | | | | | | | | | | |
32
Item 6—Selected Financial Data
The following table sets forth selected historical financial information for the Company for the years ended and as of the dates indicated. This information is derived from the Company’s consolidated financial statements. You should read the following selected financial information along with the information contained in this annual report, including Part II, Item 7 of this annual report entitled “Management’s Discussion and Analysis of Financial Condition and Results of Operations” and the consolidated financial statements and related notes and the reports of the independent registered public accounting firm included in Part II, Item 8 and elsewhere in this report. These historical results are not necessarily indicative of results to be expected from any future period (in thousands, except per share and share amounts).
| | | | | | | | | | | | | | | | | | | | |
| | | At or for the Years Ended December 31, | |
| | 2011 | | | 2010 | | | 2009 | | | 2008 (1) | | | 2007 | |
Income Statement Data: | | | | | | | | | | | | | | | | | | | | |
Direct premiums written | | $ | 155,746 | | | $ | 126,843 | | | $ | 110,108 | | | $ | 101,907 | | | $ | 91,446 | |
Reinsurance premiums assumed | | | 36,041 | | | | 30,232 | | | | 29,747 | | | | 29,765 | | | | 27,484 | |
Net premiums written | | | 142,121 | | | | 116,621 | | | | 102,336 | | | | 94,653 | | | | 81,956 | |
Net premiums earned | | $ | 132,173 | | | $ | 109,152 | | | $ | 97,916 | | | $ | 89,402 | | | $ | 79,180 | |
Investment income, net of expenses | | | 3,698 | | | | 3,365 | | | | 4,453 | | | | 5,710 | | | | 7,094 | |
Change in equity interest in limited partnerships | | | 5 | | | | 1,052 | | | | 1,066 | | | | (3,540 | ) | | | 798 | |
Net realized investment gains (losses) | | | 1,654 | | | | 3,465 | | | | (839 | ) | | | (5,311 | ) | | | 1,350 | |
Other revenue | | | 425 | | | | 582 | | | | 643 | | | | 853 | | | | 683 | |
| | | | | | | | | | | | | | | | | | | | |
Total revenue | | $ | 137,955 | | | $ | 117,616 | | | $ | 103,239 | | | $ | 87,114 | | | $ | 89,105 | |
| | | | | | | | | | | | | | | | | | | | |
Expenses: | | | | | | | | | | | | | | | | | | | | |
Losses and LAE incurred | | $ | 83,722 | | | $ | 77,574 | | | $ | 58,766 | | | $ | 49,717 | | | $ | 37,285 | |
Acquisition and other underwriting expenses | | | 13,491 | | | | 11,274 | | | | 12,252 | | | | 10,413 | | | | 7,568 | |
Other expenses | | | 25,097 | | | | 22,037 | | | | 20,507 | | | | 19,894 | | | | 16,987 | |
Amortization of intangibles | | | 1,026 | | | | 1,284 | | | | 1,732 | | | | 1,373 | | | | 1,738 | |
Policyholder dividend expense | | | 1,360 | | | | 1,046 | | | | 311 | | | | 551 | | | | 543 | |
Segregated portfolio dividend expense (2) | | | 3,469 | | | | 229 | | | | 1,238 | | | | 2,155 | | | | 4,423 | |
| | | | | | | | | | | | | | | | | | | | |
Total expenses | | $ | 128,165 | | | $ | 113,444 | | | $ | 94,806 | | | $ | 84,103 | | | $ | 68,544 | |
| | | | | | | | | | | | | | | | | | | | |
Income before income taxes | | $ | 9,790 | | | $ | 4,172 | | | $ | 8,433 | | | $ | 3,011 | | | $ | 20,561 | |
Income tax expense | | | 2,436 | | | | 1,242 | | | | 2,502 | | | | 954 | | | | 6,027 | |
| | | | | | | | | | | | | | | | | | | | |
Net income | | $ | 7,354 | | | $ | 2,930 | | | $ | 5,931 | | | $ | 2,057 | | | $ | 14,534 | |
| | | | | | | | | | | | | | | | | | | | |
Selected Balance Sheet Data (at period end): | | | | | | | | | | | | | | | | | | | | |
Total investments and cash and cash equivalents | | $ | 231,282 | | | $ | 223,784 | | | $ | 194,617 | | | $ | 180,605 | | | $ | 171,283 | |
Total assets (3) | | | 345,679 | | | | 322,664 | | | | 397,321 | | | | 382,642 | | | | 392,398 | |
Reserves for unpaid losses and LAE | | | 106,077 | | | | 95,963 | | | | 89,509 | | | | 86,962 | | | | 70,514 | |
Unearned premiums | | | 63,432 | | | | 53,485 | | | | 46,016 | | | | 41,308 | | | | 32,423 | |
Total liabilities (4) | | | 217,420 | | | | 187,953 | | | | 243,456 | | | | 244,504 | | | | 214,567 | |
Total shareholders’ equity | | | 128,259 | | | | 134,711 | | | | 153,865 | | | | 138,137 | | | | 177,831 | |
| | | | | |
U.S. GAAP Ratios: | | | | | | | | | | | | | | | | | | | | |
Loss and LAE ratio (5) | | | 63.3 | % | | | 71.1 | % | | | 60.0 | % | | | 55.6 | % | | | 47.1 | % |
Expense ratio (6) | | | 30.0 | % | | | 31.7 | % | | | 35.1 | % | | | 35.4 | % | | | 33.2 | % |
Policyholder dividend expense ratio (7) | | | 1.0 | % | | | 1.0 | % | | | 0.4 | % | | | 0.6 | % | | | 0.7 | % |
Combined ratio (8) | | | 94.3 | % | | | 103.8 | % | | | 95.5 | % | | | 91.6 | % | | | 81.0 | % |
| | | | | |
Per Share Data: | | | | | | | | | | | | | | | | | | | | |
Basic earnings per share: | | | | | | | | | | | | | | | | | | | | |
Continuing operations | | $ | 0.93 | | | $ | 0.36 | | | $ | 0.64 | | | $ | 0.27 | | | $ | 1.37 | |
Discontinued operations | | $ | 0.05 | | | $ | (1.43 | ) | | $ | 0.28 | | | $ | (2.17 | ) | | $ | 0.41 | |
| | | | | |
Diluted earnings per share: | | | | | | | | | | | | | | | | | | | | |
Continuing operations | | $ | 0.91 | | | $ | 0.36 | | | $ | 0.64 | | | $ | 0.26 | | | $ | 1.33 | |
Discontinued operations | | $ | 0.05 | | | $ | (1.43 | ) | | $ | 0.27 | | | $ | (2.17 | ) | | $ | 0.39 | |
| | | | | |
Weighted Average Shares: | | | | | | | | | | | | | | | | | | | | |
Basic—continuing operations | | | 7,860,207 | | | | 8,458,731 | | | | 8,984,644 | | | | 8,954,098 | | | | 10,264,369 | |
Basic—discontinued operations | | | 7,860,207 | | | | 8,458,731 | | | | 8,984,644 | | | | 8,954,098 | | | | 10,264,369 | |
Diluted—continuing operations | | | 7,981,930 | | | | 8,532,697 | | | | 9,051,701 | | | | 9,289,638 | | | | 10,604,349 | |
Diluted—discontinued operations | | | 7,981,930 | | | | 8,458,731 | | | | 9,051,701 | | | | 8,954,098 | | | | 10,604,349 | |
Cash dividends per share | | $ | 0.28 | | | $ | 0.28 | | | $ | 0.28 | | | $ | 0.28 | | | $ | 0.20 | |
33
| (1) | Includes Employers Security Holding Company’s results of operations for the period from October 1, 2008 to December 31, 2008. |
| (2) | The net income of the segregated portfolio cell reinsurance segment is recorded as a segregated portfolio dividend expense, which represents the dividend earned by the segregated portfolio dividend participants during the period. |
| (3) | Total assets as of December 31, 2009, 2008, 2007 and 2006 include assets reclassified to discontinued operations totaling $115,207, $116,445, $155,319 and $151,835, respectively. |
| (4) | Total liabilities as of December 31, 2009, 2008, 2007 and 2006 include liabilities reclassified to discontinued operations totaling $65,054, $77,048, $72,428 and $69,013, respectively. |
| (5) | Calculated by dividing losses and LAE incurred by net premiums earned. |
| (6) | Calculated by dividing the sum of acquisition and other underwriting expenses, other expenses and amortization of intangibles by net premiums earned. |
| (7) | Calculated by dividing the policyholder dividend expense by net premiums earned. |
| (8) | The sum of the loss and LAE ratio, expense ratio and the policyholder dividend expense ratio. |
34
Item 7—Management’s Discussion and Analysis of Financial Condition and Results of Operations
Overview
The Company reported net income from continuing operations of $7.4 million for the year ended December 31, 2011, compared to net income of $2.9 million for the year ended December 31, 2010. The improvement in the Company’s financial results primarily reflects a reduction in the combined ratio and an increase in net premiums earned, partially offset by a decline in the Company’s limited partnership interests and a decrease in net realized investment gains.
The consolidated combined ratio was 94.3% for the year ended December 31, 2011, compared to a combined ratio of 103.8% for the same period in 2010. The decrease in the combined ratio primarily reflects an increase in net premiums earned, the impact of audit premium and the release of state assessment accruals totaling $1.0 million. The Company recognized additional audit premium from customers of $3.5 million in 2011, compared to audit premium returned to customers of $2.2 million in 2010. The additional audit premium in 2011 includes an adjustment to the estimate for earned but unbilled (“EBUB”) premiums of $950,000 that increased net premiums earned, compared to an adjustment to the EBUB estimate of $750,000 that decreased net premiums earned in 2010. The increase in the EBUB estimate is primarily attributable to the increase in audit premium collected in 2011 as a result of audits of insured’s payrolls.
The decline in the Company’s limited partnership interests reflects a reduction in operating results in each of the partnerships. The decrease in net realized investment gains primarily reflects a decline in the estimated fair value of the Company’s convertible bond portfolio, which reported a loss of $1.1 million in 2011, compared to a gain of $1.2 million for the same period in 2010.
Principal Revenue and Expense Items
The Company derives its revenue primarily from net premiums earned, including assumed premiums earned, net investment income and net realized investment gains.
Direct and net premiums written.Direct premiums written is the sum of both direct premiums and assumed premiums before the effect of ceded reinsurance. Direct premiums written include all premiums billed during a specified policy period. Net premiums written is the difference between direct premiums written and premiums ceded or paid to reinsurers (ceded premiums written). In the segregated portfolio cell reinsurance segment, assumed premiums are derived from insurance contracts written by EAIG and ceded to the segregated portfolio cells.
Net premiums earned.Net premiums earned represent the earned portion of the Company’s net premiums written. Premiums are earned over the term of the related policies. At the end of each accounting period, the portion of the premiums that are not yet earned are included in unearned premiums and are realized as revenue in subsequent periods over the remaining term of the policy. The Company’s workers’ compensation policies typically have a term of twelve months. Thus, for example, for a policy that is written on July 1, 2011, one-half of the premiums would be earned in 2011 and the other half would be earned in 2012. Workers’ compensation premiums are determined based upon the payroll of the insured, the applicable premium rates and, where applicable, an experience based modification factor. An audit of the insured’s records is conducted after policy expiration to make a final determination of applicable premiums. Included with net premiums earned is an estimate for EBUB premiums. The Company can estimate EBUB premiums because it keeps track, by policy, of how much additional premium is billed in final audit invoices to estimate the probable additional amount that it has earned but not yet billed as of the balance sheet date.
Net investment income and realized gains and losses on investments. The Company invests its surplus and the funds supporting its insurance liabilities (including unearned premiums and unpaid losses and LAE) in cash, cash equivalents, fixed income securities, convertible bonds, equity securities, and limited partnership investments. Investment income includes interest earned on invested assets, including the impacts of premium amortization and discount accretion. Realized gains and losses on invested assets are reported separately from net investment income. The Company recognizes realized gains when invested assets are sold for an amount greater than their cost or amortized cost (in the case of fixed income securities) and recognizes realized losses when investment securities are written down as a result of an other than temporary impairment or sold for an amount less than their cost or amortized cost. Realized gains and losses also include the change in the estimated fair value of convertible bonds.
Other revenue. Other revenue includes fees earned for claim administration and risk management services provided to self-insured property/casualty customers. There are other revenue items that the Company recognizes on a segmental basis that are eliminated in consolidation. Such items consist primarily of fees paid by the segregated portfolio cells to other
35
entities within the consolidated group. The segregated portfolio cells recognize an expense for such items (included as part of its ceding commission) and a corresponding revenue item is recognized by the affiliate providing the service. For segment reporting purposes, such revenue items primarily include claims administration, risk management, and cell rental fees. Fronting fees are included in acquisition and other underwriting expenses as an offset to the direct costs incurred. For segment reporting purposes, such fees are recognized ratably over the period in which the service is provided, which generally corresponds to the earned portion of net premiums written for the underlying policies.
The Company’s expenses consist primarily of losses and LAE, acquisition and other underwriting expenses, other expenses, policyholder dividends, and income taxes.
Losses and LAE.Losses and LAE represent the largest expense item and include: (1) claim payments made, (2) estimates for future claim payments and changes in those estimates for prior periods, and (3) costs associated with investigating, defending and adjusting claims.
Acquisition and other underwriting expenses.In the workers’ compensation insurance segment, expenses incurred to underwrite risks are referred to as acquisition and other underwriting expenses, which consist primarily of commissions, premium taxes, assessments and fees and other underwriting expenses incurred in acquiring, writing and administering the Company’s business. In the segregated portfolio cell reinsurance segment, acquisition and other underwriting expenses consist of ceding commissions incurred under the respective reinsurance agreements. Ceding commissions received in the workers’ compensation insurance segment are netted against acquisition and other underwriting expenses.
Other expenses.Other expenses consist of general administrative expenses such as salaries, stock compensation, rent, office supplies, depreciation and all other operating expenses not otherwise classified separately.
Policyholder dividend expense. Policyholder dividends represent the amount of dividends incurred during the period that are expected to be returned to policyholders. The dividend expense is based on the loss experience of the underlying workers’ compensation insurance policy.
Income tax expense. EIHI and certain of its subsidiaries pay federal, state and local income taxes. Income tax expense includes an amount for both current and deferred income taxes. Current income tax expense includes an amount for the Company’s current year federal income tax liability and any adjustments related to differences between the prior year federal income tax estimate and the actual income tax expense reported in the federal income tax return. Deferred tax expense represents the change in the Company’s net deferred tax asset, exclusive of the tax effect related to changes in unrealized gains and losses in the Company’s investment portfolio and changes in the unrecognized amounts related to the Company’s benefit plan liabilities.
Key Financial Measures
The Company evaluates its insurance operations by monitoring certain key measures of growth and profitability. The Company measures growth by monitoring changes in direct premiums written and net premiums written. The Company measures underwriting profitability by examining loss, expense, policyholder dividend expense and combined ratios. On a segmental basis, the Company measures a segment’s operating results by examining net income, diluted earnings per share, and return on average equity.
Loss ratio.The loss ratio is the ratio (expressed as a percentage) of losses and LAE incurred to net premiums earned and measures the underwriting profitability of a company’s insurance business. The Company measures the loss ratio on an accident year and calendar year loss basis to measure underwriting profitability. An accident year loss ratio measures losses and LAE for insured events occurring in a particular policy year, regardless of when they are reported, as a percentage of net premiums earned during that year. A calendar year loss ratio measures losses and LAE for insured events occurring during a particular policy year and the change in loss reserves from prior accident years as a percentage of net premiums earned during that year.
Expense ratio. The expense ratio is the ratio (expressed as a percentage) of the sum of the acquisition and other underwriting expenses, other expenses and amortization of intangibles to net premiums earned, and measures the Company’s operational efficiency in producing, underwriting and administering its insurance business.
36
Policyholder dividend expense ratio.The policyholder dividend expense ratio is the ratio (expressed as a percentage) of policyholder dividend expense to net premiums earned and measures the impact of the Company’s policyholder dividend policies on its workers’ compensation insurance segment.
Combined ratio.The combined ratio is the sum of the loss ratio, expense ratio and policyholder dividend expense ratio and measures the Company’s overall underwriting profit. If the combined ratio is below 100%, the Company is making an underwriting profit. If the Company’s combined ratio is at or above 100%, the Company is not profitable without investment income and may not be profitable if investment income is insufficient.
Net premiums written to statutory surplus ratio.The net premiums written to statutory surplus ratio represents the ratio of net premiums written to statutory surplus. This ratio measures the Company’s insurance subsidiaries’ exposure to pricing errors in its current book of business. The higher the ratio, the greater the impact on surplus should pricing prove inadequate.
Net income, diluted earnings per share, and return on average equity.The Company uses net income and diluted earnings per share to measure its profits and return on average equity to measure its effectiveness in utilizing shareholders’ equity to generate net income. In determining return on average equity for a given year, net income is divided by the average of the beginning and ending shareholders’ equity for that year.
Critical Accounting Policies and Estimates
The preparation of financial statements in accordance with U.S. GAAP requires both the use of estimates and judgment relative to the application of appropriate accounting policies. The Company is required to make estimates and assumptions in certain circumstances that affect amounts reported in the consolidated financial statements and related footnotes. The Company evaluates these estimates and assumptions on an on-going basis based on historical developments, market conditions, industry trends and other information that is believed to be reasonable under the circumstances. There can be no assurance that actual results will conform to the estimates and assumptions and that reported results of operations will not be materially adversely affected by the need to make accounting adjustments to reflect changes in these estimates and assumptions from time to time. The Company believes the following policies are the most sensitive to estimates and judgments.
Reserves for Unpaid Losses and LAE
The Company establishes reserves for unpaid losses and LAE for its workers’ compensation insurance and segregated portfolio cell reinsurance products, which are estimates of future payments of reported and unreported claims for losses and related expenses. The adequacy of the Company’s reserves for unpaid losses and LAE are inherently uncertain because the ultimate amount that the Company may pay under many of the claims incurred as of the balance sheet date will not be known for many years. Establishing reserves is an imprecise process, requiring the use of informed estimates and judgments. The Company’s estimates and judgments may be revised as additional experience and other data becomes available and are reviewed as new or improved methodologies are developed, or as current laws change. Any such revisions could result in future changes in estimates of losses or reinsurance recoverables and would be reflected in the Company’s results of operations in the period in which the estimates are changed. Estimating the ultimate claims liability is necessarily a complex and judgmental process inasmuch as the amounts are based on management’s informed estimates and judgments using data currently available. If the Company’s ultimate losses, net of reinsurance, prove to differ substantially from the amounts recorded as of December 31, 2011, the related adjustments could have a material adverse effect on the Company’s financial condition, results of operations or liquidity.
Workers’ Compensation Insurance
On a quarterly basis, the Company prepares actuarial analyses to assess the reasonableness of the recorded reserves for unpaid losses and LAE in its workers’ compensation insurance segment. These actuarial analyses incorporate various methodologies, including paid loss development, incurred loss development and a combination of other actuarial methodologies that incorporate characteristics of paid and incurred methodologies combined with a review of the Company’s exposure base. The recorded amount in each accident year is then compared to the results of these methodologies, with consideration being given to the age of the accident year. As accident years mature, the various methodologies generally produce consistent loss estimates. For more recent accident years, the methodologies produce results that are not as consistent. Accordingly, more emphasis is placed on supplementing the methodologies in more recent accident years with trends in exposure base, medical expense inflation, general inflation, severity, and claim counts, among other things.
37
The Company’s reserves for unpaid losses and LAE in its workers’ compensation insurance segment as of December 31, 2011 and 2010 are summarized below (in thousands):
| | | | | | | | |
| | | 2011 | | | 2010 | |
Case reserves | | $ | 39,380 | | | $ | 35,758 | |
Case incurred development, IBNR and unallocated LAE reserves | | | 37,249 | | | | 32,124 | |
Amount of discount | | | (4,527 | ) | | | (3,435 | ) |
| | | | | | | | |
Net reserves before reinsurance recoverables | | | 72,102 | | | | 64,447 | |
Reinsurance recoverables on unpaid losses and LAE | | | 9,007 | | | | 4,464 | |
| | | | | | | | |
Reserves for unpaid losses and LAE | | $ | 81,109 | | | $ | 68,911 | |
| | | | | | | | |
In its workers’ compensation insurance segment, the Company records reserves for estimated losses under insurance policies and for LAE related to the investigation and settlement of policy claims. The Company’s reserves for unpaid losses and LAE represent the estimated cost of reported and unreported losses and LAE incurred and unpaid at a given point in time. In establishing its workers’ compensation insurance reserves, the Company uses loss discounting, which involves recognizing the time value of money and offsetting estimates of future payments by future expected investment income.
When a claim is reported, the Company’s claims adjusters establish a case reserve, which consists of anticipated medical costs, indemnity costs and certain defense and cost containment expenses that the Company refers to as allocated loss adjustment expenses, or ALAE. At any point in time, the amount paid on a claim, plus the case reserve for future amounts to be paid, represents the claims adjuster’s estimate at that time of the total cost of the claim, or the case incurred amount. The case reserve for each reported claim is based upon various factors, including:
| | • | | severity of the injury or damage; |
| | • | | age and occupation of the injured employee; |
| | • | | estimated length of temporary disability; |
| | • | | anticipated permanent disability; |
| | • | | expected medical procedures, costs and duration; |
| | • | | knowledge of the circumstances surrounding the claim; |
| | • | | insurance policy provisions, including coverage, related to the claim; |
| | • | | jurisdiction of the occurrence; and |
| | • | | other benefits defined by applicable statute. |
The case incurred amount can vary over time due to changes in expectations with respect to medical treatment and outcome, length and degree of disability, employment availability and wage levels and judicial determinations. As changes occur, the case incurred amount is adjusted. The initial estimate of the case incurred amount can vary significantly from the amount ultimately paid, especially in circumstances involving severe injuries with comprehensive medical treatment. Changes in case incurred amounts, or case incurred development, is an important component of the Company’s historical claim data.
In addition to case reserves, the Company establishes loss and ALAE reserves on an aggregate basis for case incurred development and IBNR claims. Case incurred development and IBNR reserves are primarily intended to provide for aggregate changes in preexisting case incurred amounts and, secondarily, to provide for the unpaid cost of IBNR claims for which an initial case reserve has not been established.
The third component of the Company’s reserves for unpaid losses and LAE is unallocated loss adjustment expense, or ULAE. The Company’s ULAE reserve is established for the costs of future unallocated loss adjustment expenses for known and unknown claims. The Company’s ULAE reserve covers primarily the estimated cost of administering claims.
In estimating case incurred development and IBNR reserves, the Company performs most of its detailed analysis on a net of reinsurance basis, and then considers expected recoveries in arriving at its recorded amounts for unpaid losses and LAE. To estimate such reserves, the Company relies primarily on the historical claim data and trends from its workers’
38
compensation insurance book of business. Using standard actuarial methods, the Company estimates reserves based on historical patterns of case development, payment patterns, mix of business, premium rates charged, case reserving adequacy, operational changes, adjustment philosophy and severity and duration trends. However, the number of variables and judgments involved in establishing reserve estimates, combined with some random variation in loss development patterns, results in uncertainty regarding projected ultimate losses.
To estimate reserves, the Company stratifies its data using variations of the following different categorizations of claims:
| | • | | All loss and LAE data developed together; |
| | • | | Lost time claims developed independently; |
| | • | | Medical only claims developed independently; |
| | • | | The indemnity portion of lost time claims developed independently; |
| | • | | The medical portion of a lost time claim and medical only claims developed together; and |
| | • | | LAE developed independently. |
The term “developed together” refers to the summation of the claims data for a particular data stratification. For example, “All loss and LAE data developed together” represents all loss and LAE data of the Company, regardless of medical, indemnity or expense components, developed together using the historical data for this particular data stratification. The term “developed independently” refers to a specific data element. For example, “The indemnity portion of lost time claims developed independently” represents the development of the indemnity portion of a claim separately using historical data for this particular type of claim. Developing claims using different data stratifications allows the Company to identify trends for a specific group of claims that would not necessarily be readily identifiable if the data were included with other types of claim information. For example, developing the medical portion of a claim separately may allow the Company to identify a medical inflation trend that may not have been evident if it had been included with indemnity claim information. The combination of the different data stratifications and standard actuarial methods, including the following, produce different actuarial indications for the Company to evaluate:
Incurred Loss Development Method. The incurred (case incurred) loss development method relies on the assumption that, at any given state of maturity, ultimate losses can be predicted by multiplying cumulative reported losses (paid losses plus case reserves) by a cumulative development factor. The validity of the results of this method depends on the stability of claim reporting and settlement rates, as well as the consistency of case reserve levels. Case reserves do not have to be adequately stated for this method to be effective; they only need to have a fairly consistent level of adequacy at all stages of maturity. “Age-to-age” loss development factors (“LDFs”) are calculated to measure the relative development of an accident year from one maturity point to the next.
Paid Loss Development Method. The paid loss development method relies on paid losses to estimate ultimate losses and is mechanically identical to the incurred loss development method described above. The paid method does not rely on case reserves or claim reporting patterns in making projections. The validity of the results from using a paid loss development approach can be affected by many conditions, such as internal claim department processing changes, legal changes or variations in a company’s mix of business from one year to the next. Also, since the percentage of losses paid for immature years is often low, development factors are more volatile. A small variation in the number of claims paid can have a leveraging effect that can lead to significant changes in estimated ultimate liability for losses and LAE. Therefore, ultimate values for immature accident years are often based on alternative estimation techniques.
Bornhuetter-Ferguson Methodology. The Bornhuetter-Ferguson expected loss projection method based on reported loss data relies on the assumption that remaining unreported losses are a function of the total expected ultimate losses rather than a function of the currently reported losses. The expected ultimate losses in this analysis are based on historical results, adjusted for known pricing changes and inflationary trends. The expected ultimate losses are multiplied by the unreported percentage to produce expected unreported losses. The unreported percentage is calculated as one minus the reciprocal of the selected cumulative incurred LDFs. Finally, the unreported losses are added to the current reported losses to produce ultimate losses. The Bornhuetter-Ferguson method is most useful as an alternative to other models for immature accident years. For these immature accident years, the amounts reported or paid may be small and unstable and therefore not predictive of future development. Therefore, future development is assumed to follow an expected pattern that is supported by more stable historical data or by emerging trends. This method is also useful when changing reporting patterns distort historical development of losses.
The Bornhuetter-Ferguson method can also be applied with paid losses.
39
In estimating ULAE reserves, the Company reviews past loss adjustment expenses in relation to paid claims and estimated future costs based on expected claims activity and duration. The sum of the Company’s net loss and ALAE reserve and ULAE reserves represents its total net reserve for unpaid losses and LAE.
In determining management’s best estimate, the Company considers the various accident year loss indications produced by the actuarial methods. Considering the results of the methods, the inherent strengths and weaknesses of each method as described above, as well as other statistical information such as ultimate loss ratios, ultimate loss to exposure ratios and average ultimate claim values, the Company determines and records its best estimate of unpaid losses and ALAE. Management believes its best estimate of recorded reserves for unpaid losses and LAE is representative of the inherent uncertainty surrounding reserving for a long-tail line of business such as workers’ compensation as well as the relative immature accident year historical experience of its workers’ compensation insurance segment, which completed its first full year of operations in 1998.
As of December 31, 2011, the Company’s best estimate of its ultimate liability for losses and LAE, net of amounts recoverable from reinsurers, for its workers’ compensation insurance segment was $72.1 million.
For each of the methods described above that are used to estimate reserves for losses and LAE, the estimated paid and incurred loss development factors are key assumptions. Loss development factors are estimated based on the Company’s historical paid and incurred loss development patterns, and an estimate of the “tail factor”, or a factor to account for development beyond the maturity of the historical data. In addition, for the Bornhuetter-Ferguson methods, a key assumption is an estimate of the expected loss ratio. The expected loss ratio is determined based on estimated historical loss ratios adjusted to reflect current underwriting and rate change activity. The assumptions used in these methods by the Company over time have reflected a consistent application of the Company’s estimating processes to emerging experience. The tail factors used in the calculation of loss development factors requires considerable judgment. Selecting representative tail factors requires substantially more judgment than the historical loss development factors. While loss development factors are based on the historical claim payment and reserving patterns of the Company over a period of time, tail factors are estimated based on loss development trends in more mature accident years and industry information, and therefore are estimated in the absence of direct historical loss development history.
Management believes that changes in tail factors are reasonably likely considering the impact that changing economic conditions and medical inflation may have on the loss and LAE estimation process. There are loss and LAE risk factors that affect workers’ compensation claims that can change over time and also cause the Company’s loss reserves to fluctuate. Some examples of these risk factors include, but are not limited to, the following:
| | • | | recovery time from the injury; |
| | • | | degree of patient responsiveness to treatment; |
| | • | | use of pharmaceutical drugs; |
| | • | | type and effectiveness of medical treatments; |
| | • | | frequency of visits to healthcare providers; |
| | • | | changes in costs of medical treatments; |
| | • | | availability of new medical treatments and equipment; |
| | • | | types of healthcare providers used; |
| | • | | availability of light duty for early return to work; |
| | • | | wage inflation in states that index benefits; and |
| | • | | changes in administrative policies of second injury funds. |
Although many factors influence the actual cost of claims and the corresponding reserves for unpaid losses and LAE estimates, we do not measure and estimate values for all of these variables individually. This is due to the fact that many of the factors that are known to impact the cost of claims cannot be measured directly. In most instances, we rely on historical experience and tail factors to estimate values for the variables that are explicitly used in the unpaid loss and LAE analysis. For the most recent accident year, we rely on selecting an expected loss ratio to estimate the reserves for unpaid losses and LAE. In addition to the examples above that represent reasonably likely changes in our tail factor, another example of
40
potential variability in our loss and LAE estimation process involves selecting an expected loss ratio for the most recent accident year. For example, if our expected loss ratio for the 2011 accident year were to increase by 5 percentage points, our reserves for unpaid losses and LAE as of December 31, 2011 would increase by $5.2 million, which would result in an after-tax reduction in our earnings of $3.4 million. Management believes that changes in the most recent year accident year loss ratio are reasonably likely due to variability in underwriting and rate changes. It is important to note that actual claims costs will vary from our estimate of ultimate claim costs, perhaps by substantial amounts, due to the inherent variability of the business written, the potentially significant claim settlement lags and the fact that not all events affecting future claim costs can be estimated.
In the event that our estimates of ultimate reserves for unpaid losses and LAE prove to be greater or less than the ultimate liability, our future earnings and financial position could be positively or negatively impacted. Future earnings would be reduced by the amount of any deficiencies in the year(s) in which the claims are paid or the reserves for unpaid losses and LAE are increased. For example, if we determined our reserves for unpaid losses and LAE, net of reinsurance, of $72.1 million as of December 31, 2011 to be 5% inadequate, this would result in an after-tax reduction in our earnings of approximately $2.3 million. This reduction could be realized in one year or multiple years, depending on when the deficiency is identified. The deficiency would also impact our financial position because our statutory surplus would be reduced by an amount equivalent to the reduction in net income. Any deficiency is typically recognized in the reserves for unpaid losses and LAE and, accordingly, it typically does not have a material effect on our liquidity because the claims have not been paid. Since the claims will typically be paid out over a multi-year period, we have generally been able to adjust our investments to match the anticipated future claim payments. Conversely, if our estimates of ultimate reserves for unpaid losses and LAE prove to be redundant, our future earnings and financial position would be improved.
The Company has utilized the following tail factors for the years ended December 31, 2011, 2010, and 2009:
| | | | | | | | | | | | |
| | | 2011 | | | 2010 | | | 2009 | |
Incurred loss development | | | 1.020 | | | | 1.020 | | | | 1.020 | |
Paid loss development | | | 1.035 | | | | 1.035 | | | | 1.035 | |
Following is a sensitivity analysis of the Company’s workers’ compensation reserves to reasonably likely changes in the tail factors used to project actual current losses to ultimate losses (dollars in thousands):
| | | | | | | | | | | | |
Change in Tail Factor Assumption | | Increase (Decrease)
in Net Reserves | | | Impact on Net
Income | | | Percentage of
Shareholders’
Equity | |
2 basis point increase | | $ | 6,066 | | | $ | (3,943 | ) | | | -3.1 | % |
1 basis point increase | | $ | 3,047 | | | $ | (1,981 | ) | | | -1.5 | % |
1 basis point decrease | | $ | (3,076 | ) | | $ | 1,999 | | | | 1.6 | % |
2 basis point decrease | | $ | (6,181 | ) | | $ | 4,018 | | | | 3.1 | % |
The estimates above rely on substantial judgment. There is inherent uncertainty in estimating reserves for unpaid losses and LAE. It is possible that the actual losses and LAE incurred may vary significantly from the Company’s estimates.
Segregated Portfolio Cell Reinsurance
The Company’s reserves for unpaid losses and LAE in its segregated portfolio cell reinsurance segment as of December 31, 2011 and 2010 are summarized below (in thousands):
| | | | | | | | |
| | | 2011 | | | 2010 | |
Case reserves | | $ | 10,229 | | | $ | 11,618 | |
Case incurred development, IBNR and unallocated LAE reserves | | | 12,931 | | | | 12,369 | |
Amount of discount | | | (1,196 | ) | | | (1,198 | ) |
| | | | | | | | |
Net reserves before reinsurance recoverables | | | 21,964 | | | | 22,789 | |
Reinsurance recoverables on unpaid losses and LAE | | | 2,798 | | | | 3,401 | |
| | | | | | | | |
Reserves for unpaid losses and LAE | | $ | 24,762 | | | $ | 26,190 | |
| | | | | | | | |
The Company estimates and records reserves for its segregated portfolio cell reinsurance segment in the same manner as for its workers’ compensation insurance segment.
41
The reporting and paid loss development patterns in the segregated portfolio cell reinsurance segment are also consistent with that of the workers’ compensation insurance segment. Accordingly, the tail factors used to project actual current losses to ultimate losses for claims covered in the Company’s segregated portfolio cell reinsurance segment require considerable judgment. The difference between total revenue for the segregated portfolio cell reinsurance segment for each period and the sum of losses and LAE, acquisition and other underwriting expenses, other expenses, and policyholder dividend expense is accrued as a segregated portfolio dividend expense. Accordingly, any change in the reserve for unpaid losses and LAE is recorded to the segregated portfolio dividend payable/receivable account and would only impact the Company’s net income or shareholders’ equity if the Company were a segregated portfolio cell dividend participant.
“Other Than Temporary” Investment Impairments
Unrealized investment gains or losses on investments carried at estimated fair value, net of applicable income taxes, are reflected directly in shareholders’ equity as a component of accumulated other comprehensive income (loss) and, accordingly, have no effect on net income. When, in the opinion of management, a decline in the fair value of an investment below its cost or amortized cost is considered to be “other-than- temporary,” such investment is written down to its fair value at the balance sheet date. The amount written down is recorded as a realized loss in the consolidated statements of operations and comprehensive income (loss). Generally, the determination of other-than-temporary impairment includes, in addition to other relevant factors, a presumption that if the market value is below cost by a significant amount for a period of time, a write-down is necessary. Notwithstanding this presumption, the determination of other-than-temporary impairment requires judgment about future prospects for an investment and is therefore a matter of inherent uncertainty. For the years ended December 31, 2011, 2010 and 2009, the Company recorded other-than-temporary impairments, excluding impairments in the segregated portfolio cell reinsurance segment, of $0, $6,000 and $1.9 million, respectively. Other-than-temporary impairments in the segregated portfolio cell reinsurance segment totaled $78,000, $80,000 and $749,000 for the years ended December 31, 2011, 2010 and 2009, respectively. The Company generally applies the following standards in determining whether the decline in fair value of an investment is other-than-temporary:
Equity securities. An equity security is considered impaired when one of the following conditions exist: 1) an equity security’s market value is less than 80% of its cost for a continuous period of 6 months, 2) an equity security’s market value is less than 50% of its cost, regardless of the amount of time the security’s market value has been below cost, and 3) an equity security’s market value has been less than cost for a continuous period of 12 months or more, regardless of the magnitude of the decline in market value. Equity securities that are in an unrealized loss position, but do not meet the above quantitative thresholds are evaluated to determine if the decline in market value is other than temporary.
For the years ended December 31, 2011, 2010 and 2009, the Company recorded other-than-temporary impairments of $0, $0, and $1.7 million, respectively, related to its equity security portfolio. The securities impaired in 2009 were a result of the securities being in an unrealized loss position for more than 12 months.
As of December 31, 2011, the Company held equity securities, excluding equity securities in the segregated portfolio cell reinsurance segment, with gross unrealized losses of $374,000, none of which were in an unrealized loss position for more than twelve months. The Company does not intend to sell the equity securities and it is not more likely than not that the Company will be required to sell the equity securities before recovery of their cost bases; therefore, management does not consider the equity securities to be other-than-temporarily impaired as of December 31, 2011. Adverse investment market conditions, or poor operating results of underlying investments, could result in impairment charges in the future.
Fixed income securities. A fixed income security is considered to be other-than-temporarily impaired when the security’s estimated fair value is less than its amortized cost basis and 1) the Company intends to sell the security, 2) it is more likely than not that the Company will be required to sell the security before recovery of the security’s amortized cost basis, or 3) the Company believes it will be unable to recover the entire amortized cost basis of the security (i.e., a credit loss has occurred). When the Company determines a credit loss has been incurred, but the Company does not intend to sell the security and it is not more likely than not that the Company will be required to sell the security before recovery of the security’s amortized cost basis, the portion of the other-than-temporary impairment that is credit related is recorded as a realized loss in the consolidated statements of operations and comprehensive income (loss), and the portion of the other-than-temporary impairment that is not credit related is included in other comprehensive income (loss). A fixed income security is reviewed for potential credit loss if any of the following situations occur:
| | • | | A review of the financial condition and prospects of the issuer indicates that the security should be evaluated; |
| | • | | Moody’s or Standard & Poor’s rate the security below investment grade; or |
| | • | | The security has a market value below 80% of amortized cost due to deterioration in credit quality. |
42
For the years ended December 31, 2011, 2010 and 2009, the Company recorded other-than-temporary impairments of $0, $6,000, and $189,000, respectively, related to its fixed income security portfolio.
As of December 31, 2011, the Company held fixed income securities, excluding fixed income securities in the segregated portfolio cell reinsurance segment, with gross unrealized losses of $15,000, none of which were in an unrealized loss position for more than twelve months. Management has evaluated the unrealized losses related to those fixed income securities and determined that they are primarily due to a fluctuation in interest rates and not to credit issues of the issuer or the underlying assets in the case of asset-backed securities. The Company does not intend to sell the fixed income securities and it is not more likely than not that the Company will be required to sell the fixed income securities before recovery of their amortized cost bases, which may be maturity; therefore, management does not consider the fixed income securities to be other–than-temporarily impaired as of December 31, 2011. Adverse investment market conditions, or poor operating results of underlying investments, could result in impairment charges in the future.
Limited partnerships.A limited partnership investment is generally written down if the Company is unable to hold or otherwise intends to sell its interest in the limited partnership at a loss, or if management has received information that suggests the Company will be unable to recover its original investment in the limited partnership. The amount written down is recorded in the change in equity interest in limited partnerships in the consolidated statement of operations and comprehensive income (loss).
During 2011, the Company wrote off its interest in the real estate limited partnership. The write off totaled $49,000 and was a result of the limited partnership being liquidated without any benefit to the Company. There were no write-offs or impairments related to the Company’s limited partnership investments in 2010 or 2009.
Goodwill
In accordance with the requirements of ASC 350, Intangibles – Goodwill and Other, goodwill is not amortized but is tested for impairment at the reporting unit level, which is at the operating segment level or one level below an operating segment. Impairment is the condition that exists when the carrying amount of goodwill exceeds its implied fair value. Goodwill is required to be tested for impairment annually and between annual tests if events or circumstances change, such as adverse changes in the business climate, that would more likely than not reduce the fair value of the reporting unit below its carrying value.
Goodwill is assigned to one or more reporting units at the date of acquisition. The Company has allocated 100% of the goodwill recorded on its consolidated balance sheet as of December 31, 2011 to its workers’ compensation insurance segment.
The Company performs its annual goodwill impairment test as of September 30. The Company adopted Accounting Standards Update No. 2011-08 (“ASU 2011-08”), Testing Goodwill for Impairment, effective September 30, 2011. Under ASU 2011-08, the Company assessed certain qualitative factors to determine if it was more likely than not that the fair value of the workers’ compensation insurance segment was less than its carrying amount. As a result of this assessment, it was determined that it was not more likely than not that fair value of the workers’ compensation insurance segment was less than its carrying amount; therefore, the performance of the two-step impairment test was not required.
The factors management considered in determining that it was not more likely than not that the fair value of the workers’ compensation insurance segment was less than its carrying amount included year over year premium growth, an increase in the renewal retention rate, and a reduction in the segment’s combined ratio. In addition, the Company continues to increase its agency base and has experienced growth in each of its regional offices. Management also considered the increase in the Company’s stock price, which closed at $13.15 on September 30, 2011, compared to $10.39 on September 30, 2010, an increase of 26.6%.
Deferred Income Taxes
The temporary differences between the tax and book bases of assets and liabilities are recorded as deferred income taxes. Management evaluates the recoverability of the net deferred tax asset based on historical trends of generating taxable income or losses, as well as expectations of future taxable income or loss. As of December 31, 2011, the Company recorded a net deferred tax asset of $1.8 million. Management expects that the net deferred tax asset is fully recoverable. If this assumption were to change, any amount of the net deferred tax asset that the Company could not expect to recover would be provided for as an allowance and would be reflected as an increase in income tax expense in the period in which it was established.
43
Reinsurance Recoverables
Amounts recoverable from Company’s reinsurers are estimated in a manner consistent with the reserves for unpaid losses and LAE associated with the reinsured policy. Amounts paid for reinsurance contracts are expensed over the contract period during which insured events are covered by the reinsurance contracts. Reinsurance balances recoverable on paid and unpaid loss and LAE are reported separately as assets, instead of being netted with the appropriate liabilities, because reinsurance does not relieve the Company of its legal liability to its policyholders. Reinsurance balances recoverable are subject to credit risk associated with the particular reinsurer. Additionally, the same uncertainties associated with estimating unpaid losses and LAE affect the estimates for the ceded portion of these liabilities. The Company continually monitors the financial condition of its reinsurers and where necessary obtains collateral. As of December 31, 2011, the Company had reinsurance recoverables of $15.7 million.
Recent Accounting Pronouncements
Testing Goodwill for Impairment
In September 2011, the Financial Accounting Standards Board (“FASB”) issued ASU 2011-08, Testing Goodwill for Impairment. ASU 2011-08 provides an entity the option to first assess qualitative factors in determining whether the existence of certain events or circumstances lead to a determination that it is more likely than not that the fair value of a reporting unit is less than its carrying amount. If an entity determines that it is not more likely than not that the fair value of a reporting unit is less than its carrying amount, the performance of the two-step impairment test is unnecessary. If, however, an entity determines that is it more likely than not that the fair value is less than the carrying amount, the first step of the impairment test (calculation of the reporting unit’s fair value) is required. ASU 2011-08 provides examples of events and circumstances that an entity should consider in evaluating whether the fair value of a reporting unit is less than its carrying amount, but other relevant events or circumstances should be considered as necessary. ASU 2011-08 is effective for annual and interim goodwill impairment tests performed for fiscal years beginning after December 15, 2011. Early adoption is permitted, including for annual and interim goodwill impairment tests performed as of a date before September 15, 2011, if an entity’s financial statements for the most recent annual or interim period have not yet been issued or, for nonpublic entities, have not yet been made available for issuance. The Company adopted the provisions of ASU 2011-08 effective September 30, 2011.
Presentation of Comprehensive Income
In June 2011, the FASB issued ASU 2011-05, Presentation of Comprehensive Income (“ASU 2011-05”). ASU 2011-05 requires entities to present net income and comprehensive income in either a single continuous statement or in two separate, but consecutive, statements of net income and other comprehensive income. The option to present items of other comprehensive income in the statement of changes in equity is eliminated. ASU 2011-05 is effective for public entities as of the beginning of a fiscal year that begins after December 15, 2011 (including interim periods) and for nonpublic entities for fiscal years ending after December 15, 2012 and interim and annual periods thereafter. Early adoption is permitted and retrospective application is required. The Company currently presents comprehensive income in the consolidated statement of operations and comprehensive income. Management does not expect the adoption of ASU 2011-05 to have a significant impact on the Company’s current presentation of comprehensive income.
Accounting for Costs Associated with Acquiring or Renewing Insurance Contracts
In October 2010, the FASB issued ASU 2010-26, “Accounting for Costs Associated with Acquiring or Renewing Insurance Contracts” (“ASU 2010-26”). ASU 2010-26 provides specific types of costs that should be capitalized in connection with the acquisition or renewal of insurance contracts. Those costs include incremental direct costs of contract acquisition incurred in connection with independent third parties and certain costs related to activities performed by the insurer for the contract, including underwriting, policy issuance and processing, medical and inspection, and sales force contract selling. Under ASU 2010-26, costs incurred by an entity related to unsuccessful acquisition or renewal efforts must be charged to expense as incurred. ASU 2010-26 is effective for fiscal years, and interim periods within those fiscal years, beginning after December 15, 2011 and is to be applied prospectively. Retrospective application to all prior periods upon the date of adoption is permitted, but not required. Early adoption is permitted but only at the beginning of an entity’s annual reporting period. The Company currently capitalizes and defers commissions and related expenses, premium taxes and certain underwriting personnel salaries. The Company will adopt ASU 2010-26 effective January 1, 2012 and apply it prospectively. Upon adoption, the Company will reduce the amount of acquisition costs capitalized related to certain underwriting personnel salaries to give effect to unsuccessful acquisition or renewal activities. If the Company had adopted ASU 2010-26 effective January 1, 2011, underwriting salaries capitalized and deferred would have been reduced by approximately $1.3 million, which would have decreased the Company’s net income by approximately $870,000.
44
YEAR ENDED DECEMBER 31, 2011 COMPARED TO YEAR ENDED DECEMBER 31, 2010
RESULTS OF OPERATIONS
The major components of consolidated revenue were as follows for the years ended December 31, 2011 and 2010 (in thousands):
| | | | | | | | |
| | | 2011 | | | 2010 | |
Net premiums written | | $ | 142,121 | | | $ | 116,621 | |
| | | | | | | | |
Net premiums earned | | $ | 132,173 | | | $ | 109,152 | |
Net investment income | | | 3,698 | | | | 3,365 | |
Change in equity interest in limited partnerships | | | 5 | | | | 1,052 | |
Net realized investment gains | | | 1,654 | | | | 3,465 | |
Other revenue | | | 425 | | | | 582 | |
| | | | | | | | |
Consolidated revenue | | $ | 137,955 | | | $ | 117,616 | |
| | | | | | | | |
The increase in consolidated revenue from 2010 to 2011 primarily reflects the growth in net premiums written, including the impact of audit premiums, partially offset by a decline in the Company’s limited partnership interests and a decrease in net realized investment gains.
The growth in net premiums written reflects new business of $32.8 million, renewal rate increases of 2.5%, and a renewal retention rate of 88.6% in 2011. Net premiums written were increased by additional audit premium from customers of $2.6 million in 2011, compared to audit premium returned to customers of $1.4 million which reduced net premiums written in 2010. Additionally, the EBUB estimate resulted in additional premium revenue of $950,000 in 2011, compared to a decrease in premium revenue of $750,000 in 2010.
As noted previously, the decline in the Company’s limited partnership interests reflects a reduction in operating results in each of the partnerships. The decrease in net realized investment gains primarily reflects a decline in the estimated fair value of the Company’s convertible bond portfolio, which reported a loss of $1.1 million in 2011, compared to a gain of $1.2 million for the same period in 2010.
The decrease in other revenue from 2010 to 2011 primarily reflects the loss of a large third party administration customer in the first quarter of 2011.
The components of consolidated net income, by segment, for the years ended December 31, 2011 and 2010 were as follows (in thousands):
| | | | | | | | |
| | | 2011 | | | 2010 | |
Workers’ compensation insurance | | $ | 10,232 | | | $ | 6,328 | |
Segregated portfolio cell reinsurance | | | — | | | | — | |
Corporate/other | | | (2,878 | ) | | | (3,398 | ) |
| | | | | | | | |
Consolidated net income | | $ | 7,354 | | | $ | 2,930 | |
| | | | | | | | |
The improvement in the Company’s financial results primarily reflect a reduction in the combined ratio, partially offset by the aforementioned decline in the limited partnership interests and a decrease in net realized investment gains.
The workers’ compensation insurance segment’s combined ratio was 89.7% in 2011, compared to 96.0% in 2010, which primarily reflects a reduction in both the loss and expense ratios. The decrease in the loss ratio primarily reflects the impact of audit premium, including the EBUB estimate. The decrease in the expense ratio primarily reflects the release of state assessment accruals of $1.0 million.
The decrease in the net loss in the corporate/other segment primarily reflects an improvement in the operating results of those segregated portfolio cells in which the Company has an equity interest. The Company reported an increase in its equity interest of $568,000 in 2011, compared to a decrease in its equity interest of $6,000 in 2010.
45
WORKERS’ COMPENSATION INSURANCE
The following table represents the operations of the workers’ compensation insurance segment for the years ended December 31, 2011 and 2010 (in thousands).
| | | | | | | | |
| | | 2011 | | | 2010 | |
Revenue: | | | | | | | | |
Direct premiums written | | $ | 155,746 | | | $ | 126,843 | |
Reinsurance premiums assumed | | | 2,047 | | | | 1,434 | |
Ceded premiums written (1) | | | (45,779 | ) | | | (37,170 | ) |
| | | | | | | | |
Net premiums written | | | 112,014 | | | | 91,107 | |
Change in unearned premiums | | | (8,346 | ) | | | (6,660 | ) |
| | | | | | | | |
Net premiums earned | | | 103,668 | | | | 84,447 | |
Net investment income | | | 3,317 | | | | 2,421 | |
Change in equity interest in limited partnerships | | | (18 | ) | | | 891 | |
Net realized investment gains | | | 1,360 | | | | 2,479 | |
| | | | | | | | |
Total revenue | | $ | 108,327 | | | $ | 90,238 | |
| | | | | | | | |
Expenses: | | | | | | | | |
Losses and LAE incurred | | $ | 67,802 | | | $ | 59,275 | |
Acquisition and other underwriting expenses | | | 7,035 | | | | 5,330 | |
Other expenses | | | 16,844 | | | | 15,416 | |
Policyholder dividend expense | | | 1,331 | | | | 1,040 | |
| | | | | | | | |
Total expenses | | $ | 93,012 | | | $ | 81,061 | |
| | | | | | | | |
Income before income taxes | | | 15,315 | | | | 9,177 | |
Income tax expense | | | 5,083 | | | | 2,849 | |
| | | | | | | | |
Net income | | $ | 10,232 | | | $ | 6,328 | |
| | | | | | | | |
| (1) | Ceded premiums written include premiums ceded to the segregated portfolio cell reinsurance segment of $33,994 and $28,798 for the years ended December 31, 2011 and 2010, respectively. |
The workers’ compensation insurance ratios were as follows for the years ended December 31, 2011 and 2010:
| | | | | | | | |
| | | 2011 | | | 2010 | |
Loss and LAE ratio | | | 65.4 | % | | | 70.2 | % |
Expense ratio | | | 23.0 | % | | | 24.6 | % |
Policyholder dividend expense ratio | | | 1.3 | % | | | 1.2 | % |
| | | | | | | | |
Combined ratio | | | 89.7 | % | | | 96.0 | % |
| | | | | | | | |
Premiums
The increase in direct premiums written reflects new business of $32.8 million, an increase in audit premium, renewal rate increases of 2.5%, and an increase in the renewal retention rate. Traditional and alternative market direct premiums written totaled $121.7 million and $34.0 million, respectively, for the year ended December 31, 2011. Audit premium, including the EBUB estimate, increased direct premiums written by $3.5 million in 2011, compared to a decrease of $2.2 million in 2010. The traditional book of business recognized audit premium from customers of $2.3 million in 2011, compared to audit premium returned to customers of $467,000 in 2010. The renewal retention rate increased from 87.0% in 2010 to 88.6% in 2011.
Net Investment Income
The increase in net investment income primarily reflects an increase in invested assets, partially offset by a decline in the average yield on the fixed income portfolio and a decline in short-term interest rates from 2010 to 2011. The average yield on the fixed income portfolio was 3.04% as of December 31, 2011, compared to 3.52% as of December 31, 2010.
Net Realized Investment Gains
Net realized investment gains for the year ended December 31, 2011 include a decrease in the estimated fair value of the Company’s convertible bond portfolio of $1.1 million, compared to an increase of $1.2 million for the same period in 2010. Net realized investment gains in 2011 also include a gain of $959,000 related to the sale of an international equity fund that the Company had impaired prior to 2011.
46
Losses and LAE
The decrease in the calendar period loss and LAE ratio from 2010 to 2011 primarily reflects the impact of audit premium and a reduction in the impact of severity-related claims. Audit premium, including the EBUB estimate, reduced the 2011 loss ratio by 2.1 percentage points, compared to increasing the 2010 loss ratio by 1.0 percentage points. The Company did not record any prior year reserve development in 2011 or 2010.
Severity-related claims for the years ended December 31, 2011 and 2010 were as follows:
| | | | | | | | | | | | | | | | |
| | | 2011 | | | 2010 | |
| | | Number of
Claims | | | Retained
Undeveloped
Losses Incurred | | | Number of
Claims | | | Retained
Undeveloped
Losses Incurred | |
Claims exceeding the Company’s $500,000 retention | | | 1 | | | $ | 500,000 | | | | 4 | | | $ | 2,000,000 | |
Claims over $200,000, but less than $500,000 | | | 9 | | | | 2,850,000 | | | | 7 | | | | 1,810,000 | |
| | | | | | | | | | | | | | | | |
Total | | | 10 | | | $ | 3,350,000 | | | | 11 | | | $ | 3,810,000 | |
| | | | | | | | | | | | | | | | |
Acquisition and Other Underwriting Expenses and Other Expenses
The acquisition and other underwriting expense ratio was 6.8% in 2011, compared to 6.3% in 2010.
The other expense ratio was 16.2% in 2011, compared to 18.3% in 2010. The decrease in the other expense ratio primarily reflects the impact of the increase in net premiums earned, including the impact of audit premium from customers.
Policyholder Dividend Expense
The increase in the policyholder dividend expense primarily reflects the loss experience of underlying policies related to policies with a 2011 policy effective date. As of December 31, 2011, approximately 12.5% of the Company’s policies were written on a participating basis, compared to approximately 12.3% as of December 31, 2010.
Tax Expense
The effective tax rate was 33.2% and 31.0% for the years ended December 31, 2011 and 2010, respectively. The primary difference between the statutory tax rate of 35.0% and the effective tax rate reflects tax exempt income on municipal bond securities.
SEGREGATED PORTFOLIO CELL REINSURANCE
The following table represents the operations of the segregated portfolio cell reinsurance segment for the years ended December 31, 2011 and 2010 (in thousands):
| | | | | | | | |
| | | 2011 | | | 2010 | |
Revenue: | | | | | | | | |
Reinsurance premiums assumed | | $ | 33,994 | | | $ | 28,798 | |
Ceded premiums written | | | (3,887 | ) | | | (3,284 | ) |
| | | | | | | | |
Net premiums written | | | 30,107 | | | | 25,514 | |
Change in unearned premiums | | | (1,602 | ) | | | (809 | ) |
| | | | | | | | |
Net premiums earned | | | 28,505 | | | | 24,705 | |
Net investment income | | | 420 | | | | 556 | |
Net realized investment gains | | | 33 | | | | 1,065 | |
| | | | | | | | |
Total revenue | | $ | 28,958 | | | $ | 26,326 | |
| | | | | | | | |
Expenses: | | | | | | | | |
Losses and LAE incurred | | $ | 15,920 | | | $ | 18,299 | |
Acquisition and other underwriting expenses | | | 8,582 | | | | 7,547 | |
Other expenses | | | 390 | | | | 251 | |
Policyholder dividend expense | | | 29 | | | | 6 | |
Segregated portfolio dividend expense (1) | | | 4,037 | | | | 223 | |
| | | | | | | | |
Total expenses | | $ | 28,958 | | | $ | 26,326 | |
| | | | | | | | |
Net income (1) | | $ | — | | | $ | — | |
| | | | | | | | |
47
| (1) | The workers’ compensation insurance and corporate/other segments provide services to the segregated portfolio cell reinsurance segment. The fees paid by the segregated portfolio cell reinsurance segment for these services are included in the revenue of the segment providing the service. The segregated portfolio cell reinsurance segment records the fees associated with these services as ceding expense, which is included in its underwriting expenses. The difference between total revenue for the segregated portfolio cell reinsurance segment for each period and the sum of losses and loss adjustment expenses, underwriting expenses, policyholder dividend expenses and other expenses is accrued as a segregated portfolio dividend expense. As a result, the segregated portfolio cell reinsurance segment has no net income for the period presented in this table. |
The segregated portfolio cell reinsurance ratios were as follows for the years ended December 31, 2011 and 2010:
| | | | | | | | |
| | | 2011 | | | 2010 | |
Loss and LAE ratio | | | 55.8 | % | | | 74.1 | % |
Expense ratio | | | 31.5 | % | | | 31.6 | % |
Policyholder dividend expense ratio | | | 0.1 | % | | | 0.0 | % |
| | | | | | | | |
Combined ratio | | | 87.4 | % | | | 105.7 | % |
| | | | | | | | |
Reinsurance Premiums Assumed
The increase in reinsurance premiums assumed reflects new business of $6.0 million, an increase in audit premium, renewal rate increases of 1.1%, and an increase in the renewal retention rate. Audit premium from customers increased direct premiums written by $280,000 in 2011, compared to a decrease of $974,000 in 2010. The renewal retention rate increased from 87.1% in 2010 to 91.3% in 2011.
Net Investment Income
The decrease in net investment income primarily reflects a reduction in short-term interest rates from 2010 to 2011.
Net Realized Investment Gains (Losses)
Net realized investment gains for the year ended December 31, 2011 include other-than-temporary impairments of $78,000, compared to impairments of $80,000 in 2010. The 2010 net realized investment gains reflect sale activity during the year. There were no significant gains on the sale of individual securities.
Losses and LAE
The decrease in the calendar period loss and LAE ratio from 2010 to 2011 reflects a decrease in the accident period loss ratio, an increase in favorable reserve development, and an improvement in audit premium. The accident period loss ratio was 65.9% in 2011, compared to 79.9% in 2010. The 2010 accident period loss ratio primarily reflects management’s estimate of the impact of the economic environment on the Company’s workers’ compensation book of business as of December 31, 2010 and the impact of severity-related claims in 2010. The Company recorded favorable reserve development of $2.9 million in 2011, compared to favorable reserve development of $1.4 million in 2010. The favorable reserve development primarily reflects the impact of claim settlements for amounts at, or less than, previously established case and IBNR reserves. Audit premium reduced the 2011 loss ratio by 0.6 percentage points, compared to increasing the 2010 loss ratio by 2.8 percentage points.
Acquisition and Other Underwriting Expenses
The expense ratios are consistent with the contractual ceding commissions for the years ended December 31, 2011 and 2010.
Segregated Portfolio Dividend Expense
The segregated portfolio dividend expense represents the amount of net income or loss in a specific period that may be payable to the segregated portfolio dividend participants.
48
CORPORATE/OTHER
The following table represents the operations of the corporate/other segment for the years ended December 31, 2011 and 2010 (in thousands):
| | | | | | | | |
| | | 2011 | | | 2010 | |
Revenue: | | | | | | | | |
Net investment income | | $ | (39 | ) | | $ | 388 | |
Change in equity interest in limited partnerships | | | 23 | | | | 161 | |
Net realized investment gains (losses) | | | 261 | | | | (79 | ) |
Other revenue | | | 425 | | | | 582 | |
| | | | | | | | |
Total revenue | | $ | 670 | | | $ | 1,052 | |
| | | | | | | | |
Expenses: | | | | | | | | |
Acquisition and other underwriting expenses | | $ | (2,126 | ) | | $ | (1,603 | ) |
Other expenses | | | 7,863 | | | | 6,370 | |
Amortization of intangibles | | | 1,026 | | | | 1,284 | |
Segregated portfolio dividend expense | | | (568 | ) | | | 6 | |
| | | | | | | | |
Total expenses | | $ | 6,195 | | | $ | 6,057 | |
| | | | | | | | |
Loss from continuing operations before income taxes | | | (5,525 | ) | | | (5,005 | ) |
Income tax benefit from continuing operations | | | (2,647 | ) | | | (1,607 | ) |
| | | | | | | | |
Net loss from continuing operations | | $ | (2,878 | ) | | $ | (3,398 | ) |
| | | | | | | | |
Revenue
The decrease in revenue primarily reflects a decrease in the Company’s equity interest in SprinklerPro, a reduction in the operating results of a limited partnership interest, and the loss of a third party administration customer in the first quarter of 2011.
Net realized investment gains for the year ended December 31, 2011 primarily reflect gains from the sale of securities in EIHI’s investment portfolio to fund the repurchase of the Company’s common stock.
Expenses
The decrease in expenses primarily reflects an increase in the Company’s equity interest in the segregated portfolio cells and a decrease in intangible asset amortization, partially offset by an increase in other expenses. The increase in other expenses primarily reflects an increase in stock compensation expense and other corporate-related expenses.
The effective tax rate was 47.9% in 2011, compared to 32.1% in 2010. The increase in the income tax benefit from 2010 to 2011 primarily reflects the reversal of the net deferred liability related to the Company’s outside basis difference in its foreign operations during 2011.
YEAR ENDED DECEMBER 31, 2010 COMPARED TO YEAR ENDED DECEMBER 31, 2009
RESULTS OF OPERATIONS
The major components of consolidated revenue were as follows for the years ended December 31, 2010 and 2009 (in thousands):
| | | | | | | | |
| | | 2010 | | | 2009 | |
Net premiums written | | $ | 116,621 | | | $ | 102,336 | |
| | | | | | | | |
Net premiums earned | | $ | 109,152 | | | $ | 97,916 | |
Net investment income | | | 3,365 | | | | 4,453 | |
Change in equity interest in limited partnerships | | | 1,052 | | | | 1,066 | |
Net realized investment gains (losses) | | | 3,465 | | | | (839 | ) |
Other revenue | | | 582 | | | | 643 | |
| | | | | | | | |
Consolidated revenue | | $ | 117,616 | | | $ | 103,239 | |
| | | | | | | | |
49
The increase in consolidated revenue primarily reflects new business of $32.7 million, an increase in realized gains related to the sale of investments, and a decline in other-than-temporary investment impairments, partially offset by a decrease in net investment income.
The components of consolidated net income, by segment, for the years ended December 31, 2010 and 2009 were as follows (in thousands):
| | | | | | | | |
| | | 2010 | | | 2009 | |
Workers’ compensation insurance | | $ | 6,328 | | | $ | 9,120 | |
Segregated portfolio cell reinsurance | | | — | | | | — | |
Corporate/other | | | (3,398 | ) | | | (3,189 | ) |
| | | | | | | | |
Consolidated net income | | $ | 2,930 | | | $ | 5,931 | |
| | | | | | | | |
The decrease in consolidated net income primarily reflects an increase in the loss ratio from 60.0% in 2009 to 71.1% in 2010, audit premiums returned to customers, and a decrease in net investment income. These items, which contributed to the decrease in the Company’s operating results, were partially offset by a decrease in other-than-temporary investment impairments and a decrease in the expense ratio from 35.5% in 2009 to 32.7% in 2010.
WORKERS’ COMPENSATION INSURANCE
The following table represents the operations of the workers’ compensation insurance segment for the years ended December 31, 2010 and 2009 (in thousands).
| | | | | | | | |
| | | 2010 | | | 2009 | |
Revenue: | | | | | | | | |
Direct premiums written | | $ | 126,843 | | | $ | 110,108 | |
Reinsurance premiums assumed | | | 1,434 | | | | 1,086 | |
Ceded premiums written (1) | | | (37,170 | ) | | | (34,241 | ) |
| | | | | | | | |
Net premiums written | | | 91,107 | | | | 76,953 | |
Change in unearned premiums | | | (6,660 | ) | | | (3,740 | ) |
| | | | | | | | |
Net premiums earned | | | 84,447 | | | | 73,213 | |
Net investment income | | | 2,421 | | | | 3,313 | |
Change in equity interest in limited partnerships | | | 891 | | | | 845 | |
Net realized investment gains (losses) | | | 2,479 | | | | (237 | ) |
| | | | | | | | |
Total revenue | | $ | 90,238 | | | $ | 77,134 | |
| | | | | | | | |
Expenses: | | | | | | | | |
Losses and LAE incurred | | $ | 59,275 | | | $ | 43,843 | |
Acquisition and other underwriting expenses | | | 5,330 | | | | 6,207 | |
Other expenses | | | 15,416 | | | | 13,754 | |
Policyholder dividend expense | | | 1,040 | | | | 432 | |
| | | | | | | | |
Total expenses | | $ | 81,061 | | | $ | 64,236 | |
| | | | | | | | |
Income before income taxes | | | 9,177 | | | | 12,898 | |
Income tax expense | | | 2,849 | | | | 3,778 | |
| | | | | | | | |
Net income | | $ | 6,328 | | | $ | 9,120 | |
| | | | | | | | |
| (1) | Ceded premiums written include premiums ceded to the segregated portfolio cell reinsurance segment of $28,798 and $28,661 for the years ended December 31, 2010 and 2009, respectively. |
The workers’ compensation insurance ratios were as follows for the years ended December 31, 2010 and 2009:
| | | | | | | | |
| | | 2010 | | | 2009 | |
Loss and LAE ratio | | | 70.2 | % | | | 59.9 | % |
Expense ratio | | | 24.6 | % | | | 27.2 | % |
Policyholder dividend expense ratio | | | 1.2 | % | | | 0.6 | % |
| | | | | | | | |
Combined ratio | | | 96.0 | % | | | 87.7 | % |
| | | | | | | | |
50
Premiums
The increase in direct premiums written primarily reflects new business of $32.7 million and an increase in the renewal retention rate, partially offset by the impact of audit premium returned and renewal rate decreases of 1.9%. Traditional and alternative market direct premiums written totaled $98.0 million and $28.8 million, respectively, for the year ended December 31, 2010. The renewal retention rate increased from 84.1% in 2009 to 87.0% in 2010. The Company returned $1.4 million in premium to customers as a result of premium audits in 2010, compared to $6,000 of additional premium from customers in 2009. In addition, the Company reduced its estimate of earned but unbilled (“EBUB”) premium in 2010 by $750,000. The decrease in audit premium and the related reduction in the EBUB estimate reflects the impact of lower payrolls in the Company’s geographic markets.
Net Investment Income
The decrease in net investment income primarily reflects a decline in the average yield on the fixed income portfolio and a decline in short-term interest rates from 2009 to 2010. The average yield on the fixed income portfolio was 3.52% as of December 31, 2010, compared to 3.61% as of December 31, 2009.
Net Realized Investment Gains (Losses)
Net realized investment gains for the year ended December 31, 2010 include an increase in the fair value of the Company’s convertible bond portfolio of $1.2 million, compared to an increase of $877,000 for the same period in 2009. The Company recognized other-than-temporary impairments of $6,000 in 2010, compared to $1.7 million in 2009.
Losses and LAE
The increase in the calendar period loss and LAE ratio reflects an increase in the accident period loss ratio and no development on prior accident period reserves. The accident period loss ratio was 70.4% and 65.6% for the years ended December 31, 2010 and 2009, respectively. The increase in the accident period loss ratio primarily reflects an increase in severity-related claims, specifically in the fourth quarter 2010, as well as the continuing impact of the current economic environment on the Company’s book of business. Favorable loss reserve development totaled $3.7 million for the year ended December 31, 2009. Severity-related claims for the year ended December 31, 2010 and 2009 were as follows:
| | | | | | | | | | | | | | | | |
| | | 2010 | | | 2009 | |
| | | Number of
Claims | | | Retained
Undeveloped
Losses Incurred | | | Number of
Claims | | | Retained
Undeveloped
Losses Incurred | |
Claims exceeding the Company’s $500,000 retention | | | 4 | | | $ | 2,000,000 | | | | 1 | | | $ | 500,000 | |
Claims over $200,000, but less than $500,000 | | | 7 | | | | 1,810,000 | | | | 3 | | | | 763,000 | |
| | | | | | | | | | | | | | | | |
Total | | | 11 | | | $ | 3,810,000 | | | | 4 | | | $ | 1,263,000 | |
| | | | | | | | | | | | | | | | |
Acquisition and Other Underwriting Expenses
Acquisition and other underwriting expenses as a percent of net premiums earned was 6.3% for the year ended December 31, 2010, compared to 8.5% for the same period in 2009. The decrease in acquisition and other underwriting expenses as a percent of net premiums earned primarily reflects the release of the 2009 and 2010 accruals related to the Pennsylvania Workers’ Compensation Security Fund assessment.
Other Expenses
Other expenses as a percent of net premiums earned was 18.3% for the year ended December 31, 2010, compared to 18.8% for the same period in 2009. The decrease primarily reflects the growth in premium revenue in the Company’s Southeast region.
Policyholder Dividend Expense
The increase in the policyholder dividend expense primarily reflects the loss experience of underlying policies related to policies with a 2010 policy effective date. As of December 31, 2010, approximately 12.3% of the Company’s policies were written on a participating basis, compared to approximately 10.0% as of December 31, 2009.
51
Tax Expense
The effective tax rate was 31.0% and 29.3% for the years ended December 31, 2010 and 2009, respectively. The primary difference between the statutory tax rate of 35.0% and the effective tax rate reflects tax exempt income on municipal bond securities.
SEGREGATED PORTFOLIO CELL REINSURANCE
The following table represents the operations of the segregated portfolio cell reinsurance segment for the years ended December 31, 2010 and 2009 (in thousands):
| | | | | | | | |
| | | 2010 | | | 2009 | |
Revenue: | | | | | | | | |
Reinsurance premiums assumed | | $ | 28,798 | | | $ | 28,661 | |
Ceded premiums written | | | (3,284 | ) | | | (3,278 | ) |
| | | | | | | | |
Net premiums written | | | 25,514 | | | | 25,383 | |
Change in unearned premiums | | | (809 | ) | | | (680 | ) |
| | | | | | | | |
Net premiums earned | | | 24,705 | | | | 24,703 | |
Net investment income | | | 556 | | | | 691 | |
Net realized investment gains (losses) | | | 1,065 | | | | (625 | ) |
| | | | | | | | |
Total revenue | | $ | 26,326 | | | $ | 24,769 | |
| | | | | | | | |
Expenses: | | | | | | | | |
Losses and LAE incurred | | $ | 18,299 | | | $ | 14,923 | |
Acquisition and other underwriting expenses | | | 7,547 | | | | 7,500 | |
Other expenses | | | 251 | | | | 244 | |
Policyholder dividend expense | | | 6 | | | | (121 | ) |
Segregated portfolio dividend expense (1) | | | 223 | | | | 2,223 | |
| | | | | | | | |
Total expenses | | $ | 26,326 | | | $ | 24,769 | |
| | | | | | | | |
Net income (1) | | $ | — | | | $ | — | |
| | | | | | | | |
| (1) | The workers’ compensation insurance and corporate/other segments provide services to the segregated portfolio cell reinsurance segment. The fees paid by the segregated portfolio cell reinsurance segment for these services are included in the revenue of the segment providing the service. The segregated portfolio cell reinsurance segment records the fees associated with these services as ceding expense, which is included in its underwriting expenses. The difference between total revenue for the segregated portfolio cell reinsurance segment for each period and the sum of losses and loss adjustment expenses, underwriting expenses, policyholder dividend expenses and other expenses is accrued as a segregated portfolio dividend expense. As a result, the segregated portfolio cell reinsurance segment has no net income for the period presented in this table. |
The segregated portfolio cell reinsurance ratios were as follows for the years ended December 31, 2010 and 2009:
| | | | | | | | |
| | | 2010 | | | 2009 | |
Loss and LAE ratio | | | 74.1 | % | | | 60.4 | % |
Expense ratio | | | 31.6 | % | | | 31.4 | % |
Policyholder dividend expense ratio | | | 0.0 | % | | | -0.5 | % |
| | | | | | | | |
Combined ratio | | | 105.7 | % | | | 91.3 | % |
| | | | | | | | |
Reinsurance Premiums Assumed
The increase in reinsurance premiums assumed primarily reflects new business of $5.2 million, partially offset by a decrease in the renewal retention rate, the impact of audit premium returned and renewal rate decreases of 0.3%. The renewal retention rate decreased from 89.1% in 2009 to 87.1% in 2010. The Company returned $974,000 in premium to customers as a result of premium audits in 2010, compared to $714,000 for the same period in 2009. The decrease in audit premium reflects the impact of lower payrolls in economically sensitive segregated portfolio cells.
Net Investment Income
The decrease in net investment income primarily reflects a reduction in short-term interest rates from 2009 to 2010.
52
Net Realized Investment Gains (Losses)
Net realized investment gains for the year ended December 31, 2010 include other-than-temporary impairments of $80,000 in 2010, compared to impairments of $749,000 in 2009. The 2010 net realized investment gains reflect sale activity during the year. There were no significant gains on the sale of individual securities.
Losses and LAE
The increase in the calendar period loss and LAE ratio reflects an increase in the accident period loss ratio and a decrease in favorable loss reserve development related to prior accident period reserves. The accident period loss ratio was 79.9% and 71.7% for the years ended December 31, 2010 and 2009, respectively. The increase in the accident period loss ratio primarily reflects management’s estimate of the impact of the current economic environment on the Company’s workers’ compensation book of business, including the impact of rising unemployment on management’s return to work controls and an increase in severity-related claims in 2010. Favorable loss reserve development totaled $1.4 million for the year ended December 31, 2010, compared to favorable loss reserve development of $2.8 million for the same period in 2009. The favorable loss reserve development relates primarily to a decrease in the prior accident period loss development factors used to estimate losses and LAE. The decrease in prior accident period loss development factors primarily reflects prior year claim settlements during 2010 for amounts at, or less than, previously established case and IBNR reserves. This decrease had the effect of lowering loss development factors as of December 31, 2010. In the aggregate, the claims were closed at amounts lower than the provision established for IBNR claims. Management believes that the realization of the benefits of its return-to-work controls enabled it to record losses and LAE that were lower than the amount reserved for claim settlements.
Acquisition and Other Underwriting Expenses
The expense ratios are consistent with the contractual ceding commissions for the years ended December 31, 2010 and 2009.
Segregated Portfolio Dividend Expense
The segregated portfolio dividend expense represents the amount of net income or loss in a specific period that may be payable to the segregated portfolio dividend participants.
CORPORATE/OTHER
The following table represents the operations of the corporate/other segment for the years ended December 31, 2010 and 2009 (in thousands):
| | | | | | | | |
| | | 2010 | | | 2009 | |
Revenue: | | | | | | | | |
Net investment income | | $ | 388 | | | $ | 449 | |
Change in equity interest in limited partnerships | | | 161 | | | | 221 | |
Net realized investment (losses) gains | | | (79 | ) | | | 23 | |
Other revenue | | | 582 | | | | 643 | |
| | | | | | | | |
Total revenue | | $ | 1,052 | | | $ | 1,336 | |
| | | | | | | | |
Expenses: | | | | | | | | |
Acquisition and other underwriting expenses | | $ | (1,603 | ) | | $ | (1,455 | ) |
Other expenses | | | 6,370 | | | | 6,509 | |
Amortization of intangibles | | | 1,284 | | | | 1,732 | |
Segregated portfolio dividend expense | | | 6 | | | | (985 | ) |
| | | | | | | | |
Total expenses | | $ | 6,057 | | | $ | 5,801 | |
| | | | | | | | |
Loss from continuing operations before income taxes | | | (5,005 | ) | | | (4,465 | ) |
Income tax benefit from continuing operations | | | (1,607 | ) | | | (1,276 | ) |
| | | | | | | | |
Net loss from continuing operations | | $ | (3,398 | ) | | $ | (3,189 | ) |
| | | | | | | | |
Revenue
The decrease in revenue primarily reflects a decrease in the Company’s equity interest in the segregated portfolio cell with an unaffiliated carrier that writes insurance coverage for sprinkler contractors, a reduction in the operating results of a limited partnership interest, and net realized investment losses in 2010.
53
Expenses
The increase in expenses primarily reflects a decrease in the Company’s equity interest in the segregated portfolio cells, partially offset by a decrease in intangible asset amortization.
Financial Position
December 31, 2011 compared to December 31, 2010.Total assets were $345.7 million as of December 31, 2011, compared to $323.3 million as of December 31, 2010. The increase in assets primarily reflects the Company’s premium growth and results of operations in 2011. The increase in premiums receivable and deferred acquisition costs is primarily attributable to the increase in written premium in 2011. The increase in cash and cash equivalents primarily reflects the Company’s positive cash flow from operations, partially offset by the use of cash to repurchase common stock. The increase in the reinsurance recoverable primarily reflects an increase in the loss reserve for a prior year claim, which is covered under the Company’s reinsurance.
Total liabilities were $217.4 million as of December 31, 2011, compared to $188.6 million as of December 31, 2010. The increase in liabilities primarily reflects the Company’s premium growth in 2011. The increase in loss reserves, unearned premiums and ceded reinsurance balances payable are primarily attributable to the increase in written premium in 2011. The increase in accounts payable and accrued expenses primarily reflects an increase in the Company’s benefit plan liabilities and commissions payable. The increase in the benefit plan liabilities reflects the impact of current interest rate environment on the discount rate used to estimate the benefit obligation. The increase in commissions payable primarily reflects the increase in premiums written.
Total shareholders’ equity was $128.3 million as of December 31, 2011, compared to $134.7 million as of December 31, 2010. The decrease in shareholders’ equity primarily reflects common stock repurchases, a decrease in the net unrealized gains in the Company’s equity security portfolio, and an increase in the Company’s benefit plan liabilities, partially offset by 2011 net income.
Liquidity and Capital Resources
Liquidity is a measure of an entity’s ability to secure sufficient cash to meet its contractual obligations and operating needs. The Company’s principal sources of funds are premiums, investment income and proceeds from sales and maturities of investments. The Company’s primary use of funds is to pay claims and operating expenses and to purchase investments. The Company’s investment portfolio is structured so that investments mature periodically over time in reasonable relation to current expectations of future claim payments. The Company’s fixed income investment portfolio as of December 31, 2011 had an effective duration of 2.76 years.
For the years ended December 31, 2011, 2010 and 2009, the Company’s cash inflows from premiums and investment activity were sufficient to support the Company’s cash outflows related to claims and operating expenses. Management expects future cash flows from operations in its workers’ compensation insurance and segregated portfolio cell reinsurance segments to be sufficient to cover claims and operating expenses. However, in the event cash flows from operations are not sufficient, the Company may have to liquidate investments to cover such costs. As of December 31, 2011, the Company’s investment portfolio included securities with gross unrealized gains totaling $5.9 million, excluding gross unrealized gains on investments in the segregated portfolio cell reinsurance segment of $493,000; therefore, based on current gross unrealized gains in the investment portfolio as of December 31, 2011, management does not believe it would have to sell securities at a loss in the event cash flows from operations proved insufficient to cover the Company’s operating needs.
The Company has a $10.0 million revolving line of credit available to provide additional liquidity if needed. The line of credit matures on May 1, 2012 and may be renewed annually for additional periods expiring on May 1 at the lender’s discretion. Outstanding balances under the line of credit bear interest at an adjustable monthly rate equal to LIBOR plus 2.0% per annum. There were no outstanding balances under the line of credit as of December 31, 2011.
The Company’s ability to manage liquidity results, in part, from the purchase of reinsurance to protect the Company against severe claims and catastrophic events. See “Item 1—Business, Reinsurance.”
Our domestic insurance subsidiaries’ ability to pay dividends to EIHI is limited by the insurance laws and regulations of Pennsylvania and Indiana. The maximum annual dividends that the domestic insurance entities may pay without prior approval from the Pennsylvania Insurance Department and the Indiana Insurance Department is limited to the greater of 10%
54
of statutory surplus or 100% of statutory net income for the most recently filed annual statement. The maximum dividend that may be paid in 2012 by Eastern Alliance, Allied Eastern, Eastern Advantage, or Employers Security, without prior approval from the respective domiciliary insurance departments is $8.8 million, $910,000, $997,000, and $1.3 million, respectively.
Eastern Re must receive approval from the Cayman Islands Monetary Authority before it can pay any dividend to the Company.
Cash Flows
The major components of cash flow from continuing operations are as follows for the years ended December 31, 2011, 2010, and 2009 (in thousands):
| | | | | | | | | | | | |
| | | December 31, | |
| | | 2011 | | | 2010 | | | 2009 | |
Cash provided by operating activities | | $ | 23,619 | | | $ | 5,005 | | | $ | 13,241 | |
Cash used in investing activities | | | (2,218 | ) | | | (27,634 | ) | | | (1,416 | ) |
Cash used in financing activities | | | (15,426 | ) | | | (12,785 | ) | | | (3,051 | ) |
Cash flows from operating activities consist primarily of cash receipts and disbursements related to premiums, investment income, claims and related adjustment expenses, operating expenses, policyholder dividends and income taxes. Cash flows from investing activities consist primarily of purchases and sales of investments and purchases of fixed assets. Cash flows from financing activities primarily consist of cash disbursements for repurchases of the Company’s common stock and shareholder dividends.
Cash Flows From Continuing Operations for the Years Ended December 31, 2011 and 2010.
The increase in cash provided by operating activities from 2010 to 2011 primarily reflects the increase in net premiums written, partially offset by an increase in claims paid and federal income taxes paid.
The decrease in cash used in investing activities from 2010 to 2011 primarily reflects the liquidation of investments at EIHI to fund the Company’s repurchase of its common stock. The decrease in cash used for the purchase of fixed income securities from 2010 to 2011 primarily reflects purchases of securities by EIHI in 2010 from the proceeds of the sale of Eastern Life.
The increase in cash flows used in financing activities primarily reflects an increase in common stock repurchases in 2011, partially offset by a decrease in shareholder dividends and debt payments. The decrease in shareholder dividends primarily reflects the reduction in outstanding common stock due to the common stock repurchases. During 2010, the Company paid its only outstanding loan in full.
Cash Flows From Continuing Operations for the Years Ended December 31, 2010 and 2009.
The decrease in cash provided by operating activities from 2009 to 2010 primarily reflects an increase in claims paid and a decrease in investment income, partially offset by an increase in net premiums written and tax refunds related to the carryback of capital losses to prior tax years.
The increase in cash used in investing activities from 2009 to 2010 primarily reflects the purchase of securities by EIHI in 2010 from the proceeds of the sale of Eastern Life.
The increase in cash flows used in financing activities primarily reflects an increase in common stock repurchases in 2010 and an increase in debt payments, partially offset by a decrease in shareholder dividends. During 2010, the Company paid its only outstanding loan in full. The decrease in shareholder dividends primarily reflects the reduction in outstanding common stock due to the common stock repurchases.
55
Contractual Commitments
The following table summarizes information about contractual obligations and commercial commitments before the impact of purchase accounting adjustments. The minimum payments under these agreements as of December 31, 2011 were as follows (in thousands):
| | | | | | | | | | | | | | | | | | | | |
| | | Payments Due By Period | |
| | | Total | | | Less than
1 year | | | 1-3 years | | | 4-5 years | | | After 5 years | |
Real estate lease obligation | | | 6,247 | | | | 1,314 | | | | 2,442 | | | | 2,354 | | | | 137 | |
Loss reserves | | | 106,077 | | | | 33,363 | | | | 51,998 | | | | 13,912 | | | | 6,804 | |
| | | | | | | | | | | | | | | | | | | | |
Total contractual obligations | | $ | 112,324 | | | $ | 34,677 | | | $ | 54,440 | | | $ | 16,266 | | | $ | 6,941 | |
| | | | | | | | | | | | | | | | | | | | |
The loss reserves payments due by period in the table above are based upon the loss and LAE reserves estimates as of December 31, 2011 and actuarial estimates of expected payout patterns by line of business. As a result, our calculation of loss reserve payments due by period is subject to the same uncertainties associated with determining the level of reserves and to the additional uncertainties arising from the difficulty of predicting when claims (including claims that have not yet been reported to us) will be paid. For a discussion of our reserving process, see “Item 1—Business, Loss and LAE Reserves.” Actual payments of loss and LAE by period will vary, perhaps materially, from the above table to the extent that current estimates of loss reserves vary from actual ultimate claims amounts and as a result of variations between expected and actual payout patterns.
Off-Balance Sheet Arrangements
As of December 31, 2011, the Company has no off-balance sheet arrangements that have or are reasonably likely to have a current or future effect on the Company’s financial condition, changes in financial condition, revenues or expenses, results of operations, liquidity, capital expenditures or capital resources.
Item 7A—Quantitative and Qualitative Disclosures About Market Risk
Market risk is the potential economic loss principally arising from adverse changes in the fair value of financial instruments. The major components of market risk affecting the Company are credit risk, interest rate risk, and equity risk.
Credit Risk.Credit risk is the potential economic loss principally arising from adverse changes in the financial condition of a specific debt issuer. The Company addresses this risk by investing primarily in fixed-income securities which are rated “A” or higher by Standard & Poor’s. The Company also independently, and through the Company’s outside investment manager, monitors the financial condition of all of the issuers of fixed-income securities in the portfolio. To limit the Company’s exposure to risk, the Company employs diversification rules that limit the credit exposure to any single issuer or business sector.
Interest Rate Risk.Interest rate risk is the risk that we will incur economic loss due to adverse changes in interest rates. The Company had fixed-income investments, excluding convertible bonds and fixed income securities in the segregated portfolio cell reinsurance segment, with an estimated fair value of $109.4 million at December 31, 2011, that are subject to interest rate risk. The Company manages the exposure to interest rate risk through an asset/liability matching and capital management process. In the management of this risk, the characteristics of duration, credit and variability of cash flows are critical elements. These risks are assessed regularly and balanced within the context of the Company’s liability and capital position.
The table below summarizes the Company’s interest rate risk. It illustrates the sensitivity of the fair value of the Company’s fixed income portfolio, excluding the Company’s convertible bond portfolio and fixed income securities in the segregated cell reinsurance segment, to selected hypothetical changes in interest rates as of December 31, 2011. The selected scenarios are not predictions of future events, but rather illustrate the effect that such events may have on the fair value of the Company’s fixed income portfolio and shareholders’ equity (dollars in thousands).
| | | | | | | | | | | | |
Hypothetical Change in Interest Rates | | Estimated Change in
Fair Value | | | Estimated
Fair Value | | | Hypothetical
Percentage Increase
(Decrease) in
Shareholders’ Equity,
Net of Tax | |
200 basis point increase | | $ | (7,507 | ) | | $ | 101,926 | | | | (3.8 | )% |
100 basis point increase | | | (3,600 | ) | | | 105,833 | | | | (1.8 | )% |
50 basis increase | | | (1,729 | ) | | | 107,704 | | | | (0.9 | )% |
No change | | | — | | | | 109,433 | | | | — | |
50 basis point decrease | | | 1,674 | | | | 111,107 | | | | 0.8 | % |
100 basis point decrease | | | 3,381 | | | | 112,814 | | | | 1.7 | % |
200 basis point decrease | | | 6,938 | | | | 116,371 | | | | 3.5 | % |
56
Equity Risk.Equity risk is the risk that the Company may incur economic loss due to adverse changes in equity prices. The Company’s exposure to changes in equity prices primarily results from its holdings of exchange traded funds and other equities. The Company’s portfolio of equity securities is carried on the balance sheet at fair value.
Impact of Inflation
Inflation rates may impact the Company’s financial condition and operating results in several ways. Fluctuations in rates of inflation influence interest rates, which in turn affect the market value of the investment portfolio and yields on new investments. Inflation also affects the portion of losses and loss reserves that relates to hospital and medical expenses and property claims and loss adjustment expenses, but not the portion of losses and loss reserves that relates to workers’ compensation indemnity payments for lost wages, which are fixed by statute. Adjustments for inflationary effects are included as part of the continual review of loss reserve estimates. Increased costs are considered in setting premium rates, and this is particularly important in the health care area where hospital and medical inflation rates have exceeded general inflation rates. Operating expenses, including payrolls, are affected to a certain degree by the inflation rate.
57
Item 8—Financial Statements and Supplementary Data

Report of Independent Registered Public Accounting Firm
To the Board of Directors and Shareholders
of Eastern Insurance Holdings, Inc.:
In our opinion, the consolidated financial statements listed in the index appearing under Item 15 a) (1) present fairly, in all material respects, the financial position of Eastern Insurance Holdings, Inc. and its subsidiaries (collectively, the “Company”) at December 31, 2011 and 2010, and the results of its operations and its cash flows for each of the three years in the period ended December 31, 2011 in conformity with accounting principles generally accepted in the United States of America. In addition, in our opinion, the financial statement schedules listed in the index appearing under Item 15 a) (2) present fairly, in all material respects, the information set forth therein when read in conjunction with the related consolidated financial statements. Also in our opinion, the Company maintained, in all material respects, effective internal control over financial reporting as of December 31, 2011, based on criteria established inInternal Control—Integrated Framework issued by the Committee of Sponsoring Organizations of the Treadway Commission (COSO). The Company’s management is responsible for these financial statements and financial statement schedules, for maintaining effective internal control over financial reporting and for its assessment of the effectiveness of internal control over financial reporting, included in “Management’s Report on Internal Control Over Financial Reporting” appearing under Item 9A. Our responsibility is to express opinions on these financial statements, on the financial statement schedules, and on the Company’s internal control over financial reporting based on our integrated audits. We conducted our audits in accordance with the standards of the Public Company Accounting Oversight Board (United States). Those standards require that we plan and perform the audits to obtain reasonable assurance about whether the financial statements are free of material misstatement and whether effective internal control over financial reporting was maintained in all material respects. Our audits of the financial statements included examining, on a test basis, evidence supporting the amounts and disclosures in the financial statements, assessing the accounting principles used and significant estimates made by management, and evaluating the overall financial statement presentation. Our audit of internal control over financial reporting included obtaining an understanding of internal control over financial reporting, assessing the risk that a material weakness exists, and testing and evaluating the design and operating effectiveness of internal control based on the assessed risk. Our audits also included performing such other procedures as we considered necessary in the circumstances. We believe that our audits provide a reasonable basis for our opinions.
As discussed in Note 2 to the consolidated financial statements, the Company changed its method of accounting for the recognition and presentation of other-than-temporary impairments of debt securities as required by accounting guidance adopted on April 1, 2009.
A company’s internal control over financial reporting is a process designed to provide reasonable assurance regarding the reliability of financial reporting and the preparation of financial statements for external purposes in accordance with generally accepted accounting principles. A company’s internal control over financial reporting includes those policies and procedures that (i) pertain to the maintenance of records that, in reasonable detail, accurately and fairly reflect the transactions and dispositions of the assets of the company; (ii) provide reasonable assurance that transactions are recorded as necessary to permit preparation of financial statements in accordance with generally accepted accounting principles, and that receipts and expenditures of the company are being made only in accordance with authorizations of management and directors of the company; and (iii) provide reasonable assurance regarding prevention or timely detection of unauthorized acquisition, use, or disposition of the company’s assets that could have a material effect on the financial statements.
Because of its inherent limitations, internal control over financial reporting may not prevent or detect misstatements. Also, projections of any evaluation of effectiveness to future periods are subject to the risk that controls may become inadequate because of changes in conditions, or that the degree of compliance with the policies or procedures may deteriorate.
/s/ PricewaterhouseCoopers, LLP
Philadelphia, PA
March 12, 2012

58
EASTERN INSURANCE HOLDINGS, INC. AND SUBSIDIARIES
CONSOLIDATED BALANCE SHEETS
(In thousands, except share and per share data)
| | | | | | | | |
| | | December 31,
2011 | | | December 31,
2010 | |
ASSETS | | | | | | | | |
| | |
Investments: | | | | | | | | |
Fixed income securities, at estimated fair value (amortized cost, $128,619; $124,201) | | $ | 133,422 | | | $ | 127,474 | |
Convertible bonds, at estimated fair value (amortized cost, $16,856; $16,481) | | | 17,574 | | | | 18,140 | |
Equity securities, at estimated fair value (cost, $16,566; $17,002) | | | 17,629 | | | | 20,880 | |
Other long-term investments, at estimated fair value (cost, $8,100; $9,642) | | | 10,209 | | | | 11,435 | |
| | | | | | | | |
Total investments | | | 178,834 | | | | 177,929 | |
Cash and cash equivalents | | | 52,448 | | | | 46,473 | |
Accrued investment income | | | 972 | | | | 1,195 | |
Premiums receivable (net of allowance, $225; $225) | | | 56,443 | | | | 46,402 | |
Reinsurance recoverable on paid and unpaid losses and loss adjustment expenses | | | 15,720 | | | | 12,285 | |
Deferred acquisition costs | | | 9,206 | | | | 7,721 | |
Deferred income taxes, net | | | 1,768 | | | | 721 | |
Federal income taxes recoverable | | | 731 | | | | 918 | |
Intangible assets | | | 5,137 | | | | 6,163 | |
Goodwill | | | 10,752 | | | | 10,752 | |
Other assets | | | 13,668 | | | | 12,723 | |
| | | | | | | | |
Total assets | | $ | 345,679 | | | $ | 323,282 | |
| | | | | | | | |
LIABILITIES | | | | | | | | |
| | |
Reserves for unpaid losses and loss adjustment expenses | | $ | 106,077 | | | $ | 95,963 | |
Unearned premium reserves | | | 63,432 | | | | 53,485 | |
Advance premium | | | 747 | | | | 482 | |
Accounts payable and accrued expenses | | | 18,892 | | | | 16,325 | |
Ceded reinsurance balances payable | | | 10,265 | | | | 7,371 | |
Segregated portfolio cell dividend payable | | | 15,774 | | | | 13,355 | |
Policyholder dividends payable | | | 2,233 | | | | 1,590 | |
| | | | | | | | |
Total liabilities | | | 217,420 | | | | 188,571 | |
| | | | | | | | |
Commitments and contingencies (Note 17) | | | | | | | | |
| | |
SHAREHOLDERS’ EQUITY | | | | | | | | |
| | |
Series A preferred stock, par value $0, auth. shares—5,000,000; no shares issued and outstanding | | | — | | | | — | |
Common capital stock, par value $0, auth. shares—20,000,000; issued—11,786,014 and 11,784,514, respectively; outstanding—7,935,446 and 8,964,344, respectively | | | — | | | | — | |
Unearned ESOP compensation | | | (3,364 | ) | | | (4,111 | ) |
Additional paid in capital | | | 116,272 | | | | 114,472 | |
Treasury stock, at cost (3,850,568 and 2,820,170 shares, respectively) | | | (54,109 | ) | | | (40,835 | ) |
Retained earnings | | | 66,910 | | | | 61,364 | |
Accumulated other comprehensive income, net | | | 2,550 | | | | 3,821 | |
| | | | | | | | |
Total shareholders’ equity | | | 128,259 | | | | 134,711 | |
| | | | | | | | |
Total liabilities and shareholders’ equity | | $ | 345,679 | | | $ | 323,282 | |
| | | | | | | | |
See accompanying notes to consolidated financial statements.
59
EASTERN INSURANCE HOLDINGS, INC. AND SUBSIDIARIES
CONSOLIDATED STATEMENTS OF OPERATIONS
AND COMPREHENSIVE INCOME (LOSS)
(In thousands, except per share data)
| | | | | | | | | | | | |
| | | For the Years Ended December 31, | |
| | | 2011 | | | 2010 | | | 2009 | |
REVENUE | | | | | | | | | | | | |
Net premiums earned | | $ | 132,173 | | | $ | 109,152 | | | $ | 97,916 | |
Net investment income | | | 3,698 | | | | 3,365 | | | | 4,453 | |
Change in equity interest in limited partnerships | | | 5 | | | | 1,052 | | | | 1,066 | |
Net realized investment gains (losses) | | | 1,654 | | | | 3,465 | | | | (839 | ) |
Other revenue | | | 425 | | | | 582 | | | | 643 | |
| | | | | | | | | | | | |
Total revenue | | | 137,955 | | | | 117,616 | | | | 103,239 | |
| | | | | | | | | | | | |
EXPENSES | | | | | | | | | | | | |
Losses and loss adjustment expenses incurred | | | 83,722 | | | | 77,574 | | | | 58,766 | |
Acquisition and other underwriting expenses | | | 13,491 | | | | 11,274 | | | | 12,252 | |
Other expenses | | | 25,097 | | | | 22,037 | | | | 20,507 | |
Amortization of intangibles | | | 1,026 | | | | 1,284 | | | | 1,732 | |
Policyholder dividend expense | | | 1,360 | | | | 1,046 | | | | 311 | |
Segregated portfolio dividend expense | | | 3,469 | | | | 229 | | | | 1,238 | |
| | | | | | | | | | | | |
Total expenses | | | 128,165 | | | | 113,444 | | | | 94,806 | |
| | | | | | | | | | | | |
Income from continuing operations before income taxes | | | 9,790 | | | | 4,172 | | | | 8,433 | |
Income tax expense from continuing operations | | | 2,436 | | | | 1,242 | | | | 2,502 | |
| | | | | | | | | | | | |
Net income from continuing operations | | $ | 7,354 | | | $ | 2,930 | | | $ | 5,931 | |
| | | | | | | | | | | | |
Discontinued operations (Note 3): | | | | | | | | | | | | |
(Loss) income from discontinued operations | | | — | | | | (11,265 | ) | | | 3,989 | |
Income tax (benefit) expense | | | (368 | ) | | | 850 | | | | 1,519 | |
| | | | | | | | | | | | |
Net income (loss) from discontinued operations | | | 368 | | | | (12,115 | ) | | | 2,470 | |
| | | | | | | | | | | | |
Net income (loss) | | $ | 7,722 | | | $ | (9,185 | ) | | $ | 8,401 | |
| | | | | | | | | | | | |
Other comprehensive (loss) income: | | | | | | | | | | | | |
Unrealized holding gains arising during period, net of tax of $638, $198, and $3,781 | | | 1,185 | | | | 367 | | | | 7,021 | |
Amortization of unrecognized benefit plan amounts, net of tax of $(357), $(179), and $127 | | | (664 | ) | | | (333 | ) | | | 235 | |
Less: Reclassification adjustment for gains (losses) included in net income (loss), net of tax of $939, $816, and $(193) | | | 1,792 | | | | 1,516 | | | | (358 | ) |
| | | | | | | | | | | | |
Other comprehensive (loss) income | | | (1,271 | ) | | | (1,482 | ) | | | 7,614 | |
| | | | | | | | | | | | |
Comprehensive income (loss) | | $ | 6,451 | | | $ | (10,667 | ) | | $ | 16,015 | |
| | | | | | | | | | | | |
EARNINGS PER SHARE (SEE NOTE 5): | | | | | | | | | | | | |
Net income (loss) | | $ | 7,722 | | | $ | (9,185 | ) | | $ | 8,401 | |
Basic earnings per share: | | | | | | | | | | | | |
Continuing operations | | $ | 0.93 | | | $ | 0.36 | | | $ | 0.64 | |
Discontinued operations | | $ | 0.05 | | | $ | (1.43 | ) | | $ | 0.28 | |
Diluted earnings per share: | | | | | | | | | | | | |
Continuing operations | | $ | 0.91 | | | $ | 0.36 | | | $ | 0.64 | |
Discontinued operations | | $ | 0.05 | | | $ | (1.43 | ) | | $ | 0.27 | |
See accompanying notes to consolidated financial statements.
60
EASTERN INSURANCE HOLDINGS, INC. AND SUBSIDIARIES
CONSOLIDATED STATEMENTS OF CHANGES IN SHAREHOLDERS’ EQUITY
For the Years Ended December 31, 2011, 2010 and 2009
(In thousands, except share data)
| | | | | | | | | | | | | | | | | | | | | | | | | | | | | | | | | | | | |
| | | Outstanding Shares | | | Common
Capital
Stock | | | Unearned
ESOP
Compensation | | | Additional
Paid-In
Capital | | | Treasury
Stock | | | Retained
Earnings | | | Accumulated
Other
Comprehensive
Income (Loss),
Net of Taxes | | | Total | |
| | Series A
Preferred
Stock | | | Common Capital
Stock | | | | | | | | |
Balance, January 1, 2009 | | | — | | | | 9,512,366 | | | $ | — | | | $ | (5,606 | ) | | $ | 111,772 | | | $ | (32,655 | ) | | $ | 66,492 | | | $ | (1,866 | ) | | $ | 138,137 | |
Cumulative effect adjustment | | | — | | | | — | | | | — | | | | — | | | | — | | | | — | | | | 685 | | | | (445 | ) | | | 240 | |
ESOP shares released | | | — | | | | — | | | | — | | | | 747 | | | | (92 | ) | | | — | | | | — | | | | — | | | | 655 | |
Equity awards | | | — | | | | 180,291 | | | | — | | | | — | | | | 1,369 | | | | — | | | | — | | | | — | | | | 1,369 | |
Repurchase of common stock | | | — | | | | (1,400 | ) | | | — | | | | — | | | | — | | | | (11 | ) | | | — | | | | — | | | | (11 | ) |
Shareholder dividend | | | — | | | | — | | | | — | | | | — | | | | — | | | | — | | | | (2,540 | ) | | | — | | | | (2,540 | ) |
Net income | | | — | | | | — | | | | — | | | | — | | | | — | | | | — | | | | 8,401 | | | | — | | | | 8,401 | |
Other comprehensive income, net of tax | | | — | | | | — | | | | — | | | | — | | | | — | | | | — | | | | — | | | | 7,614 | | | | 7,614 | |
| | | | | | | | | | | | | | | | | | | | | | | | | | | | | | | | | | | | |
Balance, December 31, 2009 | | | — | | | | 9,691,257 | | | $ | — | | | $ | (4,859 | ) | | $ | 113,049 | | | $ | (32,666 | ) | | $ | 73,038 | | | $ | 5,303 | | | $ | 153,865 | |
| | | | | | | | | | | | | | | | | | | | | | | | | | | | | | | | | | | | |
ESOP shares released | | | — | | | | — | | | | — | | | | 748 | | | | 26 | | | | — | | | | — | | | | — | | | | 774 | |
Equity awards | | | — | | | | 1,500 | | | | — | | | | — | | | | 1,374 | | | | — | | | | — | | | | — | | | | 1,374 | |
Excess tax benefit from equity awards | | | — | | | | — | | | | — | | | | — | | | | 23 | | | | — | | | | — | | | | — | | | | 23 | |
Repurchase of common stock | | | — | | | | (728,413 | ) | | | — | | | | — | | | | — | | | | (8,169 | ) | | | — | | | | — | | | | (8,169 | ) |
Shareholder dividend | | | — | | | | — | | | | — | | | | — | | | | — | | | | — | | | | (2,489 | ) | | | — | | | | (2,489 | ) |
Net loss | | | — | | | | — | | | | — | | | | — | | | | — | | | | — | | | | (9,185 | ) | | | — | | | | (9,185 | ) |
Other comprehensive loss, net of tax | | | — | | | | — | | | | — | | | | — | | | | — | | | | — | | | | — | | | | (1,482 | ) | | | (1,482 | ) |
| | | | | | | | | | | | | | | | | | | | | | | | | | | | | | | | | | | | |
Balance, December 31, 2010 | | | — | | | | 8,964,344 | | | $ | — | | | $ | (4,111 | ) | | $ | 114,472 | | | $ | (40,835 | ) | | $ | 61,364 | | | $ | 3,821 | | | $ | 134,711 | |
| | | | | | | | | | | | | | | | | | | | | | | | | | | | | | | | | | | | |
ESOP shares released | | | — | | | | — | | | | — | | | | 747 | | | | 229 | | | | — | | | | — | | | | — | | | | 976 | |
Equity awards | | | — | | | | 1,500 | | | | — | | | | — | | | | 1,547 | | | | — | | | | — | | | | — | | | | 1,547 | |
Excess tax benefit from equity awards | | | — | | | | — | | | | — | | | | — | | | | 24 | | | | — | | | | — | | | | — | | | | 24 | |
Repurchase of common stock | | | — | | | | (1,030,398 | ) | | | — | | | | — | | | | — | | | | (13,274 | ) | | | — | | | | — | | | | (13,274 | ) |
Shareholder dividend | | | — | | | | — | | | | — | | | | — | | | | — | | | | — | | | | (2,176 | ) | | | — | | | | (2,176 | ) |
Net income | | | — | | | | — | | | | — | | | | — | | | | — | | | | — | | | | 7,722 | | | | — | | | | 7,722 | |
Other comprehensive loss, net of tax | | | — | | | | — | | | | — | | | | — | | | | — | | | | — | | | | — | | | | (1,271 | ) | | | (1,271 | ) |
| | | | | | | | | | | | | | | | | | | | | | | | | | | | | | | | | | | | |
Balance, December 31, 2011 | | | — | | | | 7,935,446 | | | $ | — | | | $ | (3,364 | ) | | $ | 116,272 | | | $ | (54,109 | ) | | $ | 66,910 | | | $ | 2,550 | | | $ | 128,259 | |
| | | | | | | | | | | | | | | | | | | | | | | | | | | | | | | | | | | | |
See accompanying notes to consolidated financial statements.
61
EASTERN INSURANCE HOLDINGS, INC. AND SUBSIDIARIES
CONSOLIDATED STATEMENTS OF CASH FLOWS
For the Years Ended December 31, 2011, 2010 and 2009
(In thousands)
| | | | | | | | | | | | |
| | | 2011 | | | 2010 | | | 2009 | |
Cash flows from operating activities: | | | | | | | | | | | | |
Net income from continuing operations | | $ | 7,354 | | | $ | 2,930 | | | $ | 5,931 | |
Adjustments to reconcile net income from continuing operations to net cash provided by operating activities: | | | | | | | | | | | | |
Depreciation and amortization | | | 741 | | | | 691 | | | | 658 | |
Net amortization of bond premium/discount | | | 827 | | | | 1,108 | | | | (98 | ) |
Net realized investment (gains) losses | | | (1,767 | ) | | | (3,465 | ) | | | 839 | |
Change in equity interest in limited partnerships | | | (5 | ) | | | (1,052 | ) | | | (1,066 | ) |
Deferred tax (benefit) expense | | | (393 | ) | | | 873 | | | | 906 | |
Stock compensation expense | | | 2,524 | | | | 2,148 | | | | 2,025 | |
Intangible asset amortization | | | 1,026 | | | | 1,284 | | | | 1,732 | |
Changes in assets and liabilities: | | | | | | | | | | | | |
Accrued investment income | | | 223 | | | | (52 | ) | | | 97 | |
Premiums receivable | | | (10,041 | ) | | | (8,184 | ) | | | (3,648 | ) |
Reinsurance recoverable on paid and unpaid losses and loss adjustment expenses | | | (3,435 | ) | | | 69 | | | | (874 | ) |
Deferred acquisition costs | | | (1,485 | ) | | | (1,234 | ) | | | (1,021 | ) |
Other assets | | | (901 | ) | | | (2,936 | ) | | | 246 | |
Reserves for unpaid losses and loss adjustment expenses | | | 10,114 | | | | 6,454 | | | | 2,547 | |
Unearned and advance premium | | | 10,212 | | | | 7,294 | | | | 4,771 | |
Ceded reinsurance balances payable | | | 2,894 | | | | 1,235 | | | | (513 | ) |
Accounts payable and accrued expenses | | | 1,546 | | | | (697 | ) | | | 1,172 | |
Federal income taxes recoverable/payable | | | 555 | | | | 631 | | | | (1,231 | ) |
Policyholder dividends payable | | | 643 | | | | 433 | | | | (154 | ) |
Segregated portfolio cell dividend payable | | | 2,987 | | | | (2,525 | ) | | | 922 | |
| | | | | | | | | | | | |
Net cash provided by operating activities—continuing operations | | | 23,619 | | | | 5,005 | | | | 13,241 | |
Net cash used in operating activities—discontinued operations | | | — | | | | (50,650 | ) | | | (6,712 | ) |
| | | | | | | | | | | | |
Net cash provided by (used in) operating activities | | | 23,619 | | | | (45,645 | ) | | | 6,529 | |
| | | | | | | | | | | | |
Cash flows from investing activities: | | | | | | | | | | | | |
Purchase of fixed income securities | | | (75,655 | ) | | | (89,658 | ) | | | (58,590 | ) |
Purchase of equity securities | | | (10,643 | ) | | | (11,366 | ) | | | (6,425 | ) |
Purchase of other long-term investments | | | — | | | | (2,186 | ) | | | — | |
Proceeds from sale of fixed income securities | | | 57,131 | | | | 42,218 | | | | 36,511 | |
Proceeds from maturities/calls of fixed income securities | | | 13,837 | | | | 22,756 | | | | 20,634 | |
Proceeds from the sale of equity securities | | | 12,666 | | | | 8,293 | | | | 6,346 | |
Proceeds from sale of other long-term investments | | | 1,231 | | | | — | | | | 461 | |
Proceeds from sale of subsidiaries | | | — | | | | 2,834 | | | | — | |
Purchase of equipment, net | | | (785 | ) | | | (525 | ) | | | (353 | ) |
| | | | | | | | | | | | |
Net cash used in investing activities—continuing operations | | | (2,218 | ) | | | (27,634 | ) | | | (1,416 | ) |
Net cash provided by investing activities—discontinued operations | | | — | | | | 82,100 | | | | 12,080 | |
| | | | | | | | | | | | |
Net cash (used in) provided by investing activities | | | (2,218 | ) | | | 54,466 | | | | 10,664 | |
| | | | | | | | | | | | |
Cash flows from financing activities: | | | | | | | | | | | | |
Repurchase of common stock | | | (13,274 | ) | | | (8,169 | ) | | | (11 | ) |
Shareholder dividend | | | (2,176 | ) | | | (2,489 | ) | | | (2,540 | ) |
Repayment of long-term debt | | | — | | | | (2,150 | ) | | | (500 | ) |
Excess tax benefit related to equity awards | | | 24 | | | | 23 | | | | — | |
| | | | | | | | | | | | |
Net cash used in financing activities | | | (15,426 | ) | | | (12,785 | ) | | | (3,051 | ) |
| | | | | | | | | | | | |
Net increase (decrease) in cash and cash equivalents | | | 5,975 | | | | (3,964 | ) | | | 14,142 | |
Cash and cash equivalents, beginning of period | | | 46,473 | | | | 50,437 | | | | 46,106 | |
Reclassification to discontinued operations | | | — | | | | — | | | | (9,811 | ) |
| | | | | | | | | | | | |
Cash and cash equivalents, end of period | | $ | 52,448 | | | $ | 46,473 | | | $ | 50,437 | |
| | | | | | | | | | | | |
See accompanying notes to consolidated financial statements.
62
Eastern Insurance Holdings, Inc. and Subsidiaries
Notes to Consolidated Financial Statements
(Dollars in thousands except share and per share data)
1. Background and Nature of Operations
Eastern Insurance Holdings, Inc. (“EIHI”) is an insurance holding company offering workers’ compensation insurance and reinsurance products through its direct and indirect wholly-owned subsidiaries, Global Alliance Holdings, Ltd. (“Global Alliance”), Eastern Alliance Insurance Company (“Eastern Alliance”), Allied Eastern Indemnity Company (“Allied Eastern”), Eastern Advantage Assurance Company (“Eastern Advantage”), Employers Security Insurance Company (“Employers Security”), Employers Alliance, Inc. (“Employers Alliance”), Eastern Re Ltd., S.P.C. (“Eastern Re”), and Eastern Services Corporation (“Eastern Services”), collectively referred to as the “Company.”
On December 9, 2010, EIHI completed the sale of Eastern Atlantic RE (“Atlantic RE”). Atlantic RE was a Cayman Islands reinsurance company formed for the purpose of transferring certain assets and liabilities related to EIHI’s run-off specialty reinsurance segment as part of the sale. As a result of the sale, the results of operations for the portion of the run-off specialty reinsurance segment that was transferred to Atlantic RE have been reflected as discontinued operations in the accompanying consolidated financial statements. The portion of the run-off specialty reinsurance segment that was not sold has been reclassified to the corporate/other segment. See Note 3 for additional information related to the sale.
On June 21, 2010, EIHI completed the sale of Eastern Life and Health Insurance Company (“Eastern Life”). As a result of the sale, Eastern Life’s operations have been reflected as discontinued operations in the accompanying consolidated financial statements. See Note 3 for additional information related to the sale.
The Company currently operates in three segments: workers’ compensation insurance, segregated portfolio cell reinsurance, and corporate/other. Prior to the sale of Atlantic RE and Eastern Life, the Company’s operations included a run-off specialty reinsurance segment and a group benefits insurance segment. The components of the run-off specialty reinsurance segment that were not transferred to Atlantic RE have been included in the corporate/other segment for the years ended December 31, 2011, 2010 and 2009.
2. Significant Accounting Policies
Basis of Presentation
The accompanying consolidated financial statements have been prepared in accordance with accounting principles generally accepted in the United States of America (“GAAP”).
All inter-company transactions and related account balances have been eliminated in consolidation.
Certain amounts in the prior year consolidated financial statements have been reclassified to conform to the current year presentation. Policyholder dividends payable were reclassified from accounts payable and accrued expenses and disclosed separately on the consolidated balance sheets in 2011 and 2010. In addition, the Company increased cash and cash equivalents and accounts payable and accrued expenses by $618 as of December 31, 2010 to reflect premium deposits in transit.
Use of Estimates
The preparation of the consolidated financial statements requires management to make estimates and assumptions that affect the amount of reported assets and liabilities and disclosures of contingent assets and liabilities as of the date of the consolidated financial statements and the reported amounts of revenue and expenses during the reporting period. The most significant estimates in the consolidated financial statements include reserves for unpaid losses and loss adjustment expenses (“LAE”), earned but unbilled premium, deferred acquisition costs, return premiums under reinsurance contracts, and current and deferred income taxes. Actual results could differ from these estimates.
Cash and Cash Equivalents
The Company considers all investments with original maturity dates of three months or less to be cash equivalents for purposes of the consolidated statements of cash flows. The carrying amount of cash equivalents approximates their fair value.
63
Investments
Fixed Income Securities
The Company’s investments in fixed income securities are classified as available-for-sale and are carried at estimated fair value, with unrealized gains and losses reported in accumulated other comprehensive income (loss), net of tax. The estimated fair value of the Company’s fixed income securities are based on prices obtained from an independent pricing service. Prices obtained from the independent pricing service are determined based on quoted market prices or, in the absence of quoted market prices, dealer quotes or matrix pricing, all of which are based on observable market-based inputs when available. Management has controls in place to validate the reasonableness of fair values provided by the independent pricing service, including testing the fair value of a sample of securities on a quarterly basis by comparing fair values from different pricing sources. Adverse credit market conditions have caused some markets to become relatively illiquid, thus reducing the availability of certain data used by the independent pricing services and dealers.
Premiums or discounts are amortized using the effective interest method. Realized gains or losses are based on amortized cost and are computed using the specific identification method. The Company monitors its fixed income securities for unrealized losses that appear to be other-than-temporary. A fixed income security is considered to be other-than-temporarily impaired when the security’s fair value is less than its amortized cost basis and 1) the Company intends to sell the security, 2) it is more likely than not that the Company will be required to sell the security before recovery of the security’s amortized cost basis, or 3) the Company believes it will be unable to recover the entire amortized cost basis of the security (i.e., a credit loss has occurred). When the Company determines a credit loss has been incurred, but the Company does not intend to sell the security and it is not more likely than not that the Company will be required to sell the security before recovery of the security’s amortized cost basis, the portion of the other-than-temporary impairment that is credit related is recorded as a realized loss in the consolidated statements of operations and comprehensive income (loss), and the portion of the other-than-temporary impairment that is not credit related is included in other comprehensive income (loss). Any subsequent increase in the fixed income security’s estimated fair value would be reported as an unrealized gain.
As a result of adopting new accounting guidance related to the recognition and presentation of other-than-temporary investment impairments in 2009, the Company recorded a cumulative effect adjustment that increased retained earnings by $685 and decreased accumulated other comprehensive income (loss), net by $445, resulting in an increase to shareholders’ equity of $240. The increase in shareholders’ equity reflects the reversal of a prior period deferred tax valuation allowance, of which $240 was applied to the retained earnings cumulative effect adjustment.
Convertible Bond Securities
The Company’s investments in convertible bond securities are considered hybrid financial instruments and are carried at estimated fair value, with changes in estimated fair value reported as a realized gain or loss in the consolidated statement of operations and comprehensive income (loss).
Equity Securities
The Company’s investments in equity securities, which consist primarily of index and exchange-traded mutual funds, are classified as available-for-sale and are carried at estimated fair value, with unrealized gains and losses reported in accumulated other comprehensive income (loss), net of tax. The estimated fair value of equity securities is determined based on quoted market prices obtained from an independent pricing service.
Realized gains or losses are based on cost and are computed using the specific identification method. The Company monitors its equity securities for unrealized losses that appear to be other-than-temporary. An equity security is considered impaired when one of the following conditions exist: 1) an equity security’s market value is less than 80% of its cost for a continuous period of 6 months, 2) an equity security’s market value is less than 50% of its cost, regardless of the amount of time the security’s market value has been below cost, and 3) an equity security’s market value has been less than cost for a continuous period of 12 months or more, regardless of the magnitude of the decline in market value. Any subsequent increase in the equity security’s estimated fair value would be reported as an unrealized gain. Equity securities that are in an unrealized loss position, but do not meet the above quantitative thresholds are evaluated to determine if the decline in market value is other than temporary.
Other Long-Term Investments
Other long-term investments consist of investments in limited partnerships. Investments in limited partnerships are reported in the consolidated financial statements using the equity method. The carrying value of the Company’s limited
64
partnership investments are based on the Company’s allocable share of the limited partnerships’ net asset value. Changes in the value of the Company’s proportionate share of its limited partnership investments are included in the change in equity interest in limited partnerships in the consolidated statements of operations and comprehensive income (loss). The Company reports changes in the value of its limited partnership investments on a month lag as a result of the timing of statements being received from the limited partnership.
The Company monitors its limited partnership investments for declines in value that may be other-than-temporary. When a limited partnership interest is determined to be other-than-temporarily impaired, the Company reduces its interest in the limited partnership to its current estimated fair value at the balance sheet date. The impairment is recorded in the change in equity interest in limited partnerships in the consolidated statements of operations and comprehensive income (loss).
Premiums
Premiums, including estimates of additional premiums resulting from audits of insureds’ records, are generally recognized as written upon inception of the policy. Premiums written are primarily earned on a daily pro rata basis over the terms of the policies to which they relate. Accordingly, unearned premiums represent the portion of premiums written which is applicable to the unexpired portion of the policies in force. Workers’ compensation premiums are determined based upon the payroll of the insured, the applicable premium rates and, where applicable, an experience based modification factor. An audit of the policyholders’ records is conducted after policy expiration to make a final determination of applicable premiums. Included in net premiums earned is an estimate for earned but unbilled final audit premiums. The Company estimates earned but unbilled premiums by tracking, by policy, how much additional premium is billed in final audit invoices as a percentage of payroll exposure to estimate the probable additional amount that it has earned, but not yet billed, as of the balance sheet date. As of December 31, 2011 and 2010, the Company accrued earned but unbilled premiums of $1,551 and $601, respectively. Earned but unbilled premiums increased (decreased) net premiums earned by $950, $(750), and $(450) for the years ended December 31, 2011, 2010 and 2009, respectively.
Other Revenue
Other revenue primarily consists of service revenue related to claims adjusting and risk management services. Claims adjusting and risk management service revenue is earned over the term of the related contracts in proportion to the actual services rendered.
Losses and Loss Adjustment Expenses
A liability is established for the estimated unpaid losses and LAE under the terms of, and with respect to, its policies and agreements and includes amounts determined on the basis of claims adjusters’ evaluations and an amount based on past experience for losses incurred but not reported (“IBNR”).
The Company discounts its reserves for unpaid losses and LAE for workers’ compensation claims on a non-tabular basis, using a discount rate of 3.0%, based upon regulatory guidelines. The reserves for unpaid losses and LAE have been reduced for the effects of discounting by approximately $5,723 and $4,633 as of December 31, 2011 and 2010, respectively.
The methods used to estimate the reserves for unpaid losses and LAE are reviewed periodically and any adjustments resulting therefrom are reflected in current operations.
Management believes that its reserves for unpaid losses and LAE is adequate as of December 31, 2011. However, estimating the ultimate liability is necessarily a complex and judgmental process inasmuch as the amounts are based on management’s informed estimates and judgments using data currently available. If the Company’s ultimate losses, net of reinsurance, prove to differ substantially from the amounts recorded as of December 31, 2011, the related adjustments could have a material adverse effect on the Company’s financial condition, results of operations or liquidity.
Reinsurance
In the ordinary course of business, the Company assumes and cedes reinsurance with other insurance companies. These arrangements provide greater diversification of business and minimize the net loss potential arising from large claims. Ceded reinsurance contracts do not relieve the Company of its obligation to its insureds. Premiums and claims under the Company’s reinsurance contracts are accounted for on a basis consistent with those used in accounting for the underlying policies reinsured and the terms of the reinsurance contracts. The Company has certain reinsurance contracts that provide for return premium based on the actual loss experience of the written and reinsured business. The Company estimates the amounts to be recorded for return premium based on the terms set forth in the reinsurance agreements and the expected loss experience.
65
The reinsurance recoverable for unpaid losses and LAE includes the balances due from reinsurance companies for unpaid losses and LAE that are expected to be recovered from reinsurers, based on contracts in force.
Policy Acquisition Costs
Policy acquisition costs consist of commissions, premium taxes and underwriting salaries that vary with and are primarily related to the production of premium. Policy acquisition costs are deferred and amortized over the period in which the related premiums are earned. Deferred acquisition costs are limited to the estimated amounts recoverable after providing for losses and loss adjustment expenses that are expected to be incurred based upon historical and current experience. Anticipated investment income is considered in determining recoverability.
Amortization of policy acquisition costs totaled $7,501, $6,487, and $5,908 for the years ended December 31, 2011, 2010 and 2009, respectively.
Income Taxes
Deferred tax assets and liabilities are determined based on differences between the financial reporting and tax basis of assets and liabilities and are measured using enacted tax rates and laws that are expected to be in effect when the difference is reversed. A valuation allowance is recorded against gross deferred tax assets if it is more likely than not that all or some portion of the benefits related to the deferred tax assets will not be realized.
EIHI’s insurance subsidiaries are not generally subject to state income taxes; rather, they are subject to state premium tax in the jurisdictions in which they write business. Employers Alliance and Eastern Services are subject to state income tax in the states in which they operate.
Eastern Re is an exempt entity under the Companies Law of the Cayman Islands; however, Eastern Re’s earnings and profits are subject to federal income tax for earnings subsequent to June 16, 2006.
The Company includes income tax-related interest and penalties as a component of income tax expense. The Company did not incur any income tax-related interest or penalties during 2011, 2010 or 2009.
The statute of limitations has expired for the Company’s federal taxable years through December 31, 2007.
Policyholder Dividends
The Company issues certain workers’ compensation insurance policies with dividend payment features. These policyholders share in the operating results of their respective policies in the form of dividends. Dividends to policyholders are accrued during the period in which the related premiums are earned and are determined based on the terms of the individual policies.
Property and Equipment
Property and equipment, including expenditures for significant improvements and purchased software, is carried at cost less accumulated depreciation and amortization. Maintenance, repairs and minor improvements are expensed as incurred. When property and equipment is retired or otherwise disposed of, the cost and related accumulated depreciation are removed from the accounts and any resulting gain or loss is included in operations. Depreciation is computed under the straight-line method. The estimated useful lives of property and equipment range from 3-7 years. Accumulated depreciation and amortization expense totaled $3,484 and $2,754 as of December 31, 2011 and 2010, respectively. Depreciation and amortization expense totaled $741, $691, and $658 for the years ended December 31, 2011, 2010 and 2009, respectively.
Assessments
The Company is subject to state guaranty fund assessments in the states in which it is licensed, which provide for the payment of covered claims or to meet other insurance obligations from insurance company insolvencies. The Company’s assessments consist primarily of charges from the Workers’ Compensation Security Fund of Pennsylvania (“Security Fund”). The Security Fund serves as a guaranty fund to provide claim payments for those workers entitled to workers’ compensation benefits when the insurance company originally providing the benefits was placed into liquidation by a court. Security Fund assessments are established on an actuarial basis to provide an amount sufficient to pay the outstanding and anticipated
66
claims in a timely manner, to meet the costs of the Pennsylvania Insurance Department to administer the fund and to maintain a minimum balance in the fund of $500 million. If the Security Fund determines that the balance in the Security Fund is less than $500 million based on the actuarial study, then an assessment up to one percent of direct written premium is made to all companies licensed to write workers’ compensation in Pennsylvania. Eastern Alliance, Allied Eastern and Eastern Advantage recognize a liability and the related expense for the assessments when premiums covered under the Security Fund are written; when an assessment from the Security Fund has been imposed or it is probable that an assessment will be imposed; and the amount of the assessment is reasonably estimable. The Company did not record a liability related to the Security Fund as of December 31, 2011 or 2010 because the Company received notification that an assessment would not be imposed.
Goodwill and Intangible Assets
Goodwill is assigned to one or more reporting units at the date of acquisition. The Company has allocated 100% of the goodwill recorded on its consolidated balance sheet as of December 31, 2011 to its workers’ compensation insurance segment.
The Company performs its annual goodwill impairment test as of September 30. The Company adopted Accounting Standards Update No. 2011-08 (“ASU 2011-08”), Testing Goodwill for Impairment, effective September 30, 2011. Under ASU 2011-08, the Company assessed certain qualitative factors to determine if it was more likely than not that the fair value of the workers’ compensation insurance segment was less than its carrying amount. As a result of this assessment, it was determined that it was not more likely than not that fair value of the workers’ compensation insurance segment was less than its carrying amount; therefore, the performance of the two-step impairment test was not required.
The factors management considered in determining that it was not more likely than not that the fair value of the workers’ compensation insurance segment was less than its carrying amount included year over year premium growth, an increase in the renewal retention rate, and a reduction in the segment’s combined ratio. In addition, the Company continues to increase its agency base and has experienced growth in each of its regional offices. Management also considered the increase in the Company’s stock price, which closed at $13.15 on September 30, 2011, compared to $10.39 on September 30, 2010, an increase of 26.6%.
The Company evaluates the remaining useful life of its intangible assets with a finite life on a quarterly basis to determine whether events or circumstances warrant a revision to the remaining period of amortization. The Company evaluates its intangible assets with an indefinite life for impairment on at least an annual basis. There were no adjustments to the remaining amortization period or impairment charges related to the Company’s intangible assets during 2011, 2010, or 2009.
Treasury Stock
The Company records the repurchase of shares of its common stock using the cost method. Under the cost method, treasury stock is recorded based on the actual cost of the shares repurchased. The Company’s primary purposes for the repurchase of its common stock is capital management and to fund the issuance of common stock under the Stock Incentive Plan.
Stock-Based Compensation
The Company adopted the Eastern Insurance Holdings, Inc. 2006 Stock Incentive Plan (the “Stock Incentive Plan”) on December 18, 2006. Under the terms of the Stock Incentive Plan, stock awards may be made in the form of incentive stock options, non-qualified stock options or restricted stock. The Company records compensation expense based on the fair value of the stock award on the grant date using the straight-line attribution method.
Employee Stock Ownership Plan
The Company recognizes compensation expense related to its employee stock ownership plan (“ESOP”) equal to the product of the number of shares earned, or committed to be released, during the period, and the average price of the Company’s common stock during the period. The estimated fair value of unearned ESOP shares is calculated based on the average price of the Company’s common stock for the period. For purposes of calculating earnings per share, the Company includes the weighted average of ESOP shares committed to be released for the period.
67
Concentrations of Credit Risk
Financial instruments, which potentially expose the Company to concentrations of credit risk, consist primarily of cash and cash equivalents, investments, premiums receivable, and amounts recoverable from reinsurers.
Comprehensive Income
Comprehensive income includes all changes in shareholders’ equity during the reporting period, net of tax. The components of accumulated other comprehensive income, net of tax, as of December 31, 2011 and 2010 were as follows (in thousands):
| | | | | | | | |
| | | 2011 | | | 2010 | |
Unrealized gains on investments, net of tax of $1,922 and $2,221 | | $ | 3,817 | | | $ | 4,425 | |
Unrecognized benefit plan liabilities, net of tax of $(682) and $(325) | | | (1,267 | ) | | | (604 | ) |
| | | | | | | | |
Total | | $ | 2,550 | | | $ | 3,821 | |
| | | | | | | | |
Cash Flow Information
Purchases and sales or maturities of short-term investments are recorded net for purposes of the consolidated statements of cash flows and are included with fixed income securities.
The Company paid income taxes of $2,250, $455, and $3,175 for the years ended December 31, 2011, 2010 and 2009, respectively. Taxes paid for the year ended December 31, 2010 are net of refunds related to capital loss carrybacks to prior tax years totaling $1,795.
The Company paid interest of $0, $33, and $65 for the years ended December 31, 2011, 2010 and 2009, respectively.
Recent Accounting Pronouncements
Testing Goodwill for Impairment
In September 2011, the Financial Accounting Standards Board (“FASB”) issued ASU 2011-08, Testing Goodwill for Impairment. ASU 2011-08 provides an entity the option to first assess qualitative factors in determining whether the existence of certain events or circumstances lead to a determination that it is more likely than not that the fair value of a reporting unit is less than its carrying amount. If an entity determines that it is not more likely than not that the fair value of a reporting unit is less than its carrying amount, the performance of the two-step impairment test is unnecessary. If, however, an entity determines that is it more likely than not that the fair value is less than the carrying amount, the first step of the impairment test (calculation of the reporting unit’s fair value) is required. ASU 2011-08 provides examples of events and circumstances that an entity should consider in evaluating whether the fair value of a reporting unit is less than its carrying amount, but other relevant events or circumstances should be considered as necessary. ASU 2011-08 is effective for annual and interim goodwill impairment tests performed for fiscal years beginning after December 15, 2011. Early adoption is permitted, including for annual and interim goodwill impairment tests performed as of a date before September 15, 2011, if an entity’s financial statements for the most recent annual or interim period have not yet been issued or, for nonpublic entities, have not yet been made available for issuance. The Company adopted the provisions of ASU 2011-08 effective September 30, 2011.
Presentation of Comprehensive Income
In June 2011, the FASB issued ASU 2011-05, Presentation of Comprehensive Income (“ASU 2011-05”). ASU 2011-05 requires entities to present net income and comprehensive income in either a single continuous statement or in two separate, but consecutive, statements of net income and other comprehensive income. The option to present items of other comprehensive income in the statement of changes in equity is eliminated. ASU 2011-05 is effective for public entities as of the beginning of a fiscal year that begins after December 15, 2011 (including interim periods) and for nonpublic entities for fiscal years ending after December 15, 2012 and interim and annual periods thereafter. Early adoption is permitted and retrospective application is required. The Company currently presents comprehensive income in the consolidated statement of operations and comprehensive income. Management does not expect the adoption of ASU 2011-05 to have a significant impact on the Company’s current presentation of comprehensive income.
68
Accounting for Costs Associated with Acquiring or Renewing Insurance Contracts
In October 2010, the FASB issued ASU 2010-26, “Accounting for Costs Associated with Acquiring or Renewing Insurance Contracts” (“ASU 2010-26”). ASU 2010-26 provides specific types of costs that should be capitalized in connection with the acquisition or renewal of insurance contracts. Those costs include incremental direct costs of contract acquisition incurred in connection with independent third parties and certain costs related to activities performed by the insurer for the contract, including underwriting, policy issuance and processing, medical and inspection, and sales force contract selling. Under ASU 2010-26, costs incurred by an entity related to unsuccessful acquisition or renewal efforts must be charged to expense as incurred. ASU 2010-26 is effective for fiscal years, and interim periods within those fiscal years, beginning after December 15, 2011 and is to be applied prospectively. Retrospective application to all prior periods upon the date of adoption is permitted, but not required. Early adoption is permitted but only at the beginning of an entity’s annual reporting period. The Company currently capitalizes and defers commissions and related expenses, premium taxes and certain underwriting personnel salaries. The Company will adopt ASU 2010-26 effective January 1, 2012 and apply it prospectively. Upon adoption, the Company will reduce the amount of acquisition costs capitalized related to certain underwriting personnel salaries to give effect to unsuccessful acquisition or renewal activities. If the Company had adopted ASU 2010-26 effective January 1, 2011, underwriting salaries capitalized and deferred would have been reduced by approximately $1,340, which would have decreased the Company’s net income by approximately $870.
3. Discontinued Operations
During the year ended December 31, 2010, the Company disposed of its group benefits insurance operations and the majority of its run-off specialty reinsurance operations. As a result of the disposals, the group benefits insurance and the run-off specialty reinsurance segments have been reflected in the consolidated financial statements as discontinued operations.
Sale of Eastern Life
On June 21, 2010, EIHI completed the sale of its wholly-owned group benefits insurance subsidiary, Eastern Life, to Security Life Insurance Company of America (“Security”). The agreement effected a statutory merger of Eastern Life into Security, with Security continuing as the surviving corporation. Total transaction consideration to EIHI was $34,102, which represented Eastern Life’s GAAP shareholder’s equity as of May 31, 2010 plus $250. The consideration consisted of cash and a $1,750 promissory note from Security’s parent. The note bears interest at 4.0%, payable quarterly, and is due in full on July 1, 2013. The issuance of the $1,750 promissory note related to the sale of Eastern Life is considered a non-cash investing activity and has been excluded from the consolidated statement of cash flows for the year ended December 31, 2010.
The sale of Eastern Life resulted in the recognition of a gain totaling $564, which is included in discontinued operations. Transaction expenses related to the sale of Eastern Life totaled $873 ($567, net of tax) for the year ended December 31, 2010, and have been included in discontinued operations. Certain corporate expenses previously reported in the group benefits insurance segment were reclassified to continuing operations. The reclassification of these corporate expenses totaled $500 for each of the years ended December 31, 2010 and 2009.
For the years ended December 31, 2010 and 2009, the group benefits insurance segment reported net premiums earned of $18,262 and $35,937, respectively, and total revenue of $20,563 and $40,745, respectively. Income before income taxes in the group benefits insurance segment totaled $952 and $4,157 for the years ended December 31, 2010 and 2009, respectively.
During the third quarter of 2011, the Company filed its 2010 corporate federal income tax return. The Company’s tax liability related to Eastern Life’s operations for the period from January 1, 2010 to June 21, 2010 and the related sale of Eastern Life was less than the estimated tax liability recorded on the Company’s balance sheet as of December 31, 2010. As a result, the Company recorded a prior year tax return adjustment of $368, which was recorded as an income tax benefit in discontinued operations for the year ended December 31, 2011.
Sale of Eastern Atlantic RE
On December 9, 2010, EIHI completed the sale of Eastern Atlantic RE (“Atlantic RE”) to an investor group advised by Dowling Advisors, Inc. (“Dowling”). Atlantic RE is a Cayman Islands reinsurance company and was part of EIHI’s run-off specialty reinsurance segment. Under the terms of the sale, Dowling purchased 100% of the outstanding stock of Atlantic RE for $2,300 of cash.
69
The sale of Atlantic RE resulted in the recognition of a loss totaling $14,029, which is included in discontinued operations. The loss includes the recognition of an estimated contingent profit commission of $3,018, which is based on the adequacy of the run-off specialty reinsurance segment’s reserves for losses and LAE as of September 30, 2010, compared to a predetermined targeted reserve for losses and LAE. The recognition of the contingent profit commission is considered a non-cash investing activity and has been excluded from the consolidated statement of cash flows for the year ended December 31, 2010. Transaction expenses related to the sale of Atlantic RE totaled $510 for the year ended December 31, 2010, and have been included in discontinued operations.
The estimated contingent profit commission is included in other assets and any decrease in the estimated amount would be recorded as a loss from discontinued operations. As of December 31, 2011, management believes that the estimated contingent profit commission is realizable; however, due to the inherent uncertainty in the run-off specialty reinsurance segment’s reserves for losses and LAE, the estimated realizable amount could decrease in the future.
For the years ended December 31, 2010 and 2009, the run-off specialty reinsurance segment reported net premiums earned of $1 and $1,133, respectively, and total revenue of $4,180 and $957, respectively. Total revenue for the year ended December 31, 2010 excludes the loss on the sale of Atlantic RE of $14,029. The loss before income taxes in the run-off specialty reinsurance segment totaled $(12,924) and $(663) for the years ended December 31, 2010 and 2009, respectively.
4. Intangible Assets
The Company’s business acquisitions resulted in the identification of certain intangible assets. The renewal rights and agency relationships will be amortized over their estimated useful lives of 15 years. The state insurance licenses are considered to have an infinite life and will not be amortized.
As of December 31, 2011 and 2010, intangible assets consisted of the following (in thousands):
| | | | | | | | | | | | | | | | |
Intangible Assets with Finite Life | | December 31, 2011 | | | December 31, 2010 | |
| | Gross
Balance | | | Accumulated
Amortization | | | Gross
Balance | | | Accumulated
Amortization | |
Agency relationships (15 year amortization period) | | $ | 3,564 | | | $ | 2,095 | | | $ | 3,564 | | | $ | 1,727 | |
Renewal rights (15 year amortization period) | | | 8,238 | | | | 6,145 | | | | 8,238 | | | | 5,487 | |
| | | | | | | | | | | | | | | | |
| | $ | 11,802 | | | $ | 8,240 | | | $ | 11,802 | | | $ | 7,214 | |
| | | | | | | | | | | | | | | | |
| | | | |
Intangible Assets with Indefinite Life | | | | | | | | | | | | |
State insurance licenses | | | 1,575 | | | | — | | | | 1,575 | | | | — | |
| | | | | | | | | | | | | | | | |
Total intangible assets | | $ | 13,377 | | | $ | 8,240 | | | $ | 13,377 | | | $ | 7,214 | |
| | | | | | | | | | | | | | | | |
Amortization expense totaled $1,026, $1,284 and $1,732 for the years ended December 31, 2011, 2010 and 2009, respectively.
The estimated aggregated amortization expense for each of the next five years is as follows (in thousands):
| | | | |
2012 | | $ | 806 | |
2013 | | | 640 | |
2014 | | | 509 | |
2015 | | | 405 | |
2016 | | | 316 | |
| | | | |
Total | | $ | 2,676 | |
| | | | |
5. Earnings Per Share
Basic earnings per share are computed by dividing net income (loss) by the weighted average number of shares outstanding for the respective period. Diluted earnings per share are computed by dividing net income (loss) by the weighted average number of shares outstanding for the period, including dilutive potential common shares outstanding for the period. For the years ended December 31, 2011, 2010 and 2009, there were 887,574, 957,799 and 784,361 equity awards, respectively, that were not included in the Company’s earnings per share from continuing operations calculation because to do so would have been anti-dilutive.
70
Consolidated net income (loss), basic shares outstanding, diluted shares outstanding, basic earnings per share, diluted earnings per share and cash dividends per share for the years ended December 31, 2011, 2010 and 2009 were as follows (in thousands, except share and per share data):
| | | | | | | | | | | | |
| | | 2011 | | | 2010 | | | 2009 | |
Net income (loss) for basic and diluted earnings per share | | $ | 7,722 | | | $ | (9,185 | ) | | $ | 8,401 | |
Less: Dividends declared—common and unvested restricted share units | | | (2,176 | ) | | | (2,489 | ) | | | (2,540 | ) |
| | | | | | | | | | | | |
Undistributed earnings | | | 5,546 | | | | (11,674 | ) | | | 5,861 | |
Percent allocated to common shareholders | | | 99.3 | % | | | 98.8 | % | | | 98.3 | % |
| | | | | | | | | | | | |
| | | 5,507 | | | | (11,534 | ) | | | 5,763 | |
Add: Dividends declared—common shares | | | 2,161 | | | | 2,459 | | | | 2,497 | |
| | | | | | | | | | | | |
| | $ | 7,668 | | | $ | (9,075 | ) | | $ | 8,260 | |
| | | | | | | | | | | | |
Denominator for basic earnings per share | | | 7,860,207 | | | | 8,458,731 | | | | 8,984,644 | |
Effect of dilutive securities | | | 121,723 | | | | 73,966 | | | | 67,057 | |
| | | | | | | | | | | | |
Denominator for diluted earnings per common share | | | 7,981,930 | | | | 8,532,697 | | | | 9,051,701 | |
| | | | | | | | | | | | |
Basic earnings per share: | | | | | | | | | | | | |
Continuing operations | | $ | 0.93 | | | $ | 0.36 | | | $ | 0.64 | |
Discontinued operations | | $ | 0.05 | | | $ | (1.43 | ) | | $ | 0.28 | |
Diluted earnings per share: | | | | | | | | | | | | |
Continuing operations | | $ | 0.91 | | | $ | 0.36 | | | $ | 0.64 | |
Discontinued operations | | $ | 0.05 | | | $ | (1.43 | ) | | $ | 0.27 | |
Cash dividends per share | | $ | 0.28 | | | $ | 0.28 | | | $ | 0.28 | |
6. Exercise of Outstanding Warrants
As of January 1, 2009, contingent warrants to purchase 306,099 common shares of EIHI stock at an exercise price of $1.63 were outstanding. These warrants were awarded in 1999 as compensation to a Director of the Company who acted as the insurance broker for premium production in the Company’s run-off specialty reinsurance segment. The number of warrants ultimately earned was contingent upon achievement of predetermined direct premiums written thresholds. As of January 1, 2009, 244,879 warrants were earned. The remaining 61,220 warrants will not be earned because the specialty reinsurance segment was placed into run-off on July 1, 2008 and, therefore, there is no additional premium production. On March 10, 2009, the Director notified the Company that he was exercising the 244,879 earned warrants. Furthermore, as provided in the terms of the warrant, the Director instructed the Company to retain 64,588 shares in payment of the exercise price. Accordingly, on March 31, 2009, 180,291 shares of EIHI common stock were issued to the Director in full satisfaction of the 244,879 warrants earned. This was a non-cash transaction that had no impact on cash flows from operating or financing activities.
7. Share Repurchase
As of December 31, 2011, the Company has repurchased 3,850,568 shares of its common stock and can repurchase up to an additional 1,086,567 shares, as authorized by the Company’s Board of Directors. The share repurchases will be held as treasury stock and are available for issuance in connection with the Company’s Stock Incentive Plan.
For the years ended December 31, 2011, 2010 and 2009, the Company repurchased 1,030,398, 728,413 and 1,400 shares, respectively, at a cost of $13,274, $8,169 and $11, respectively, representing a weighted average cost of $12.88, $11.21 and $8.03 per share, respectively.
8. Stock-Based Compensation
Awards under the Stock Incentive Plan may be made in the form of incentive stock options, nonqualified stock options, restricted stock or any combination to employees and non-employee directors. The Stock Incentive Plan limits the number of shares that may be initially awarded as restricted stock to 299,000, and the number of shares for which incentive stock options may be granted to 500,000. The total number of shares initially authorized in the Stock Incentive Plan was 1,046,500 shares, with an annual increase equal to 1% of the shares outstanding at the end of each year. The Stock Incentive Plan provides that stock options and restricted stock awards may include vesting restrictions and performance criteria at the discretion of the Compensation Committee of the Board of Directors. The stock options and restricted stock awards vest over a five year period and are not subject to performance criteria. The term of options may not exceed ten years for incentive stock options, and ten years and one month for nonqualified stock options, and the option price may not be less than fair
71
market value on the date of grant. During 2011, the Company granted 3,000 stock options and 1,500 restricted stock awards to employees. During 2010, the Company granted 208,000 stock options and 1,500 restricted stock awards to employees. There were no stock options or restricted stock awards granted in 2009. During 2011, 2010, and 2009, stock options totaling 11,046, 8,522, and 12,780, respectively, were forfeited. No stock options or restricted stock awards were exercised in 2011, 2010, or 2009.
Total stock-based compensation expense recognized in the consolidated statement of operations and comprehensive income for the years ended December 31, 2011, 2010 and 2009 is shown in the following table (in thousands):
| | | | | | | | | | | | |
| | | 2011 | | | 2010 | | | 2009 | |
Stock compensation expense related to: | | | | | | | | | | | | |
Stock options | | $ | 868 | | | $ | 651 | | | $ | 575 | |
Restricted stock | | | 679 | | | | 723 | | | | 794 | |
Total related income tax benefit | | | 260 | | | | 191 | | | | 222 | |
Total unrecognized compensation expense | | $ | 820 | | | $ | 2,282 | | | $ | 2,568 | |
As of December 31, 2011, there were 481,706 and 209,462 vested stock options and restricted stock awards, respectively. As of December 31, 2010, there were 361,959 and 160,231 vested stock options and restricted stocks awards, respectively. The total unrecognized stock compensation expense related to non-vested stock options was $791 and $1,593, respectively, and the total unrecognized stock compensation expense related to non-vested restricted stock awards was $29 and $689, respectively, as of December 31, 2011 and 2010. The unrecognized stock compensation expense related to the non-vested stock options and restricted stock awards is expected to be recognized over a weighted average period of approximately 27.0 months and 48.5 months, respectively.
The fair values of stock options granted in 2011 were determined on the dates of grant using a lattice-based binomial option valuation model with the following assumptions:
| | | | |
Expected terms (years) | | | 10.00 | |
Expected stock price volatility | | | 35.00 | % |
Risk-free interest rate | | | 1.93 | % |
Expected dividend yield | | | 3.00 | % |
Weighted average fair value per option | | $ | 5.06 | |
The expected life shown above was imputed based upon the combination of vesting provisions and the termination, retirement and early exercise assumptions input to the binomial option valuation model. As trading in the Company’s stock began in June 2006, the expected stock price volatility reflects a weighting of the average historical volatility over a 10-year period for 17 comparable companies and the average 6-month implied volatility for those comparable companies with listed options. A yield curve of risk free interest rates was developed for each valuation date based on quoted prices of US Treasury STRIPs.
The assumptions used to calculate the fair value of future options granted are evaluated and revised, as necessary, to reflect market conditions and the Company’s historical experience and future expectations. The calculated fair value is recognized as compensation expense in the Company’s consolidated statements of operations and comprehensive income (loss) over the requisite service period of the entire award. Compensation expense is recognized only for those options expected to vest, with forfeitures estimated at the date of grant and evaluated and adjusted periodically to reflect the Company’s historical experience and future expectations. Any change in the forfeiture assumption is accounted for as a change in estimate, with the cumulative effect of the change on periods previously reported being reflected in the financial statements of the period in which the change is made.
The following table summarizes stock option activity for the year ended December 31, 2011:
| | | | | | | | | | | | | | | | |
| | | Shares
Subject to
Options | | | Weighted
Average
Exercise
Price per
Share | | | Weighted
Average
Remaining
Contractual
Life (years) | | | Aggregate
Intrinsic
Value (in
thousands) | |
Outstanding as of January 1, 2011 | | | 778,590 | | | $ | 13.25 | | | | 7.05 | | | $ | — | |
Granted | | | 3,000 | | | $ | 13.16 | | | | 9.56 | | | | | |
Forfeited | | | (11,046 | ) | | | 14.08 | | | | | | | | | |
Exercised | | | — | | | | | | | | | | | | | |
Cancelled | | | (15,922 | ) | | | 14.38 | | | | | | | | | |
| | | | | | | | | | | | | | | | |
Outstanding as of December 31, 2011 | | | 754,622 | | | $ | 13.21 | | | | 6.09 | | | $ | 581 | |
| | | | | | | | | | | | | | | | |
Vested and exercisable as of December 31, 2011 | | | 481,706 | | | $ | 14.00 | | | | 5.38 | | | $ | — | |
72
As of December 31, 2011, there were 389,702 shares of common stock available for issuance of future share-based awards. On February 24, 2012, the Company’s Board of Directors approved the issuance of an additional 218,500 non-qualified stock option awards and an additional 128,700 restricted stock awards. The grant date fair value of the awards was $14.45.
The following table presents additional information regarding options outstanding as of December 31, 2011:
| | | | | | | | | | | | |
| | | Number
Outstanding | | | Weighted
Average
Remaining
Contractual
Life (years) | | | Weighted
Average
Exercise
Price per
Share | |
Range of Exercise Prices | | | | | | | | | | | | |
$14.35 | | | 517,122 | | | | 5.01 | | | $ | 14.35 | |
$14.86 | | | 7,500 | | | | 5.47 | | | $ | 14.86 | |
$15.22 | | | 5,000 | | | | 5.63 | | | $ | 15.22 | |
$15.47 | | | 5,000 | | | | 5.67 | | | $ | 15.47 | |
$13.83 | | | 9,000 | | | | 6.75 | | | $ | 13.83 | |
$10.60 | | | 3,000 | | | | 8.52 | | | $ | 10.60 | |
$10.19 | | | 205,000 | | | | 8.73 | | | $ | 10.19 | |
$13.16 | | | 3,000 | | | | 9.56 | | | $ | 13.16 | |
| | | | | | | | | | | | |
Outstanding as of December 31, 2011 | | | 754,622 | | | | 6.09 | | | $ | 13.21 | |
| | | | | | | | | | | | |
The following table summarizes restricted stock activity for the year ended December 31, 2011.
| | | | | | | | |
| | | Number
of Shares | | | Grant Date
Fair Value | |
Outstanding as of January 1, 2011 | | | 253,175 | | | $ | 14.32 | |
Granted | | | 1,500 | | | $ | 13.16 | |
Forfeited | | | — | | | | | |
Exercised | | | — | | | | | |
Cancelled | | | — | | | | | |
| | | | | | | | |
Outstanding as of December 31, 2011 | | | 254,675 | | | $ | 14.31 | |
| | | | | | | | |
Vested as of December 31, 2011 | | | 209,462 | | | $ | 14.33 | |
9. Statutory Financial Information
The Company’s domestic insurance subsidiaries prepare statutory-basis financial statements in accordance with accounting practices prescribed or permitted by the insurance department in the subsidiaries’ domiciliary state. The Pennsylvania Insurance Department and the Indiana Insurance Department requires that insurance companies domiciled in their respective states prepare their statutory-basis financial statements in accordance with the National Association of Insurance Commissioners’ (“NAIC”)Accounting Practices and Proceduresmanual, subject to any deviations prescribed or permitted by domiciliary insurance commissioner (“SAP”).
Permitted statutory accounting practices encompass all accounting practices that are not prescribed; such practices differ from state to state, may differ from company to company within a state, and may change in the future. The Company’s domestic insurance subsidiaries did not have any permitted practices as of or for the year ended December 31, 2011.
The principal differences between GAAP and SAP relate to the carrying value of fixed income securities, deferred acquisition costs, deferred income taxes, dividends payable, benefit plan liabilities, the non-admissibility of certain assets for SAP purposes, and the reporting of reserves for unpaid losses and loss adjustment expenses and the related reinsurance recoverables on a gross versus net basis.
73
Financial Information
The statutory surplus and statutory net income (loss) of Eastern Alliance, Allied Eastern, Eastern Advantage and Employers Security as of December 31, 2011 and 2010 and for the years ended December 31, 2011, 2010, and 2009 was as follows (in thousands):
| | | | | | | | | | | | | | | | | | | | |
| | | Statutory Surplus as of
December 31, | | | Net Income (Loss) for the
Year Ended December 31, | |
| | 2011 | | | 2010 | | | 2011 | | | 2010 | | | 2009 | |
Eastern Alliance | | $ | 52,893 | | | $ | 47,471 | | | $ | 8,805 | | | $ | 3,843 | | | $ | 4,428 | |
Allied Eastern | | $ | 9,103 | | | $ | 8,397 | | | $ | 609 | | | $ | (195 | ) | | $ | 214 | |
Eastern Advantage | | $ | 9,664 | | | $ | 8,551 | | | $ | 997 | | | $ | 249 | | | $ | 46 | |
Employers Security | | $ | 12,361 | | | $ | 10,566 | | | $ | 1,287 | | | $ | (231 | ) | | $ | 2,826 | |
Risk-Based Capital/Minimum Capital Requirements
Risk-based capital is designed to measure the acceptable amount of capital an insurer should have based on the inherent risks of the insurer’s business. Insurers failing to meet adequate capital levels may be subject to insurance department scrutiny and ultimately rehabilitation or liquidation. Based on established standards, Eastern Alliance, Allied Eastern, Eastern Advantage, and Employers Security maintained statutory-basis surplus in excess of minimum prescribed risk-based capital requirements as of December 31, 2011.
Under Cayman Islands regulations, Eastern Re is required to maintain minimum capital of $120. Eastern Re is in compliance with the minimum capital requirements as of December 31 2011.
Dividend Restrictions
The ability of Eastern Alliance, Allied Eastern, Eastern Advantage, and Employers Security to pay dividends to EIHI is limited by the laws and regulations of Pennsylvania and Indiana. The maximum annual dividends that EIHI’s insurance subsidiaries may pay without the prior approval from the Pennsylvania Insurance Department and Indiana Insurance Department is limited to the greater of 10% of statutory surplus or 100% of statutory net income for the most recently filed annual statement. The maximum dividend that may be paid by Eastern Alliance, Allied Eastern and Eastern Advantage in 2012, without prior approval from the Pennsylvania Insurance Department, is $8,805, $910 and $997, respectively. The maximum dividend that may be paid by Employers Security in 2012, without prior approval from the Indiana Insurance Department, is $1,287.
10. Fair Value Measurements
The Company’s assets and liabilities that are measured at fair value on a recurring basis are segregated between those assets and liabilities that are valued based on quoted prices (unadjusted) in active markets for identical assets or liabilities, which the reporting entity can access at the measurement date (Level 1), direct or indirect observable inputs other than Level 1 quoted prices (Level 2), or unobservable inputs to the extent that observable inputs are not available (Level 3).
The following is a description of the Company’s categorization of the inputs used in the recurring fair value measurements of its financial assets included in its consolidated balance sheet as of December 31, 2011 and 2010:
Level 1—Represents financial assets whose fair value is determined based upon observable unadjusted quoted market prices for identical financial assets in active markets that the Company has the ability to access. An example of a Level 1 input utilized to measure fair value includes the closing price of one share of common stock on an active exchange market. The Company considers U.S. Treasuries and equity securities as Level��1 assets.
Level 2—Represents financial assets whose fair value is determined based upon: quoted market prices for similar assets in active markets; quoted market prices for identical assets in inactive markets; inputs other than quoted market prices that are observable for the asset such as interest rates or yield curves; or other inputs derived principally from or corroborated from other observable market information. An example of a Level 2 input utilized to measure fair value, specifically for the Company’s fixed income portfolio, is “matrix pricing.” “Matrix pricing” relies on observable inputs from active markets other than quoted market prices including, but not limited to, benchmark securities and yields, latest reported trades, quotes from brokers or dealers, issuer spreads, bids, offers, and other relevant reference data to determine fair value. “Matrix pricing” is used to measure the fair value of fixed income securities where obtaining individual quoted market prices is impractical. The Company considers U.S. Government agencies, municipal bonds, mortgage-backed securities, collateralized mortgage obligations, asset-backed securities, corporate bonds, and convertible bonds as Level 2 assets.
74
Level 3—Represents financial assets whose fair value is determined based upon inputs that are unobservable, including the Company’s own determinations of the assumptions that a market participant would use in pricing the asset.
The following table provides a summary of the fair value measurements of the Company’s fixed income securities, convertible bonds, and equity securities, as of December 31, 2011 and 2010, excluding the segregated portfolio cell segment (in thousands):
| | | | | | | | | | | | | | | | |
| | | | | | Fair Value Measurements at Reporting
Date Using | |
| | | 12/31/11 | | | Level 1 | | | Level 2 | | | Level 3 | |
Fixed income securities—available for sale: | | | | | | | | | | | | |
U.S. Treasuries and government agencies | | $ | 16,143 | | | $ | 9,676 | | | $ | 6,467 | | | $ | — | |
States, municipalities, and political subdivisions | | | 42,316 | | | | — | | | | 42,316 | | | | — | |
Corporate securities | | | 21,509 | | | | — | | | | 21,509 | | | | — | |
Residential mortgage-backed securities | | | 22,360 | | | | — | | | | 22,360 | | | | — | |
Commercial mortgage-backed securities | | | 206 | | | | — | | | | 206 | | | | — | |
Collateralized mortgage obligations | | | 5,876 | | | | — | | | | 5,876 | | | | — | |
Other structured securities | | | 1,023 | | | | — | | | | 1,023 | | | | — | |
Convertible bonds | | | 17,574 | | | | — | | | | 17,574 | | | | — | |
Equity securities—available for sale | | | 12,939 | | | | 12,939 | | | | — | | | | — | |
| | | | | | | | | | | | | | | | |
Total | | $ | 139,946 | | | $ | 22,615 | | | $ | 117,331 | | | $ | — | |
| | | | | | | | | | | | | | | | |
| | | | | | | | | | | | | | | | |
| | | | | | Fair Value Measurements at Reporting
Date Using | |
| | | 12/31/10 | | | Level 1 | | | Level 2 | | | Level 3 | |
Fixed income securities—available for sale: | | | | | | | | | | | | |
U.S. Treasuries and government agencies | | $ | 23,344 | | | $ | 9,272 | | | $ | 14,072 | | | $ | — | |
States, municipalities, and political subdivisions | | | 32,621 | | | | — | | | | 32,621 | | | | — | |
Corporate securities | | | 16,006 | | | | — | | | | 16,006 | | | | — | |
Residential mortgage-backed securities | | | 25,759 | | | | — | | | | 25,759 | | | | — | |
Commercial mortgage-backed securities | | | 289 | | | | — | | | | 289 | | | | — | |
Collateralized mortgage obligations | | | 7,220 | | | | — | | | | 7,220 | | | | — | |
Other structured securities | | | 773 | | | | — | | | | 773 | | | | — | |
Convertible bonds | | | 18,140 | | | | — | | | | 18,140 | | | | — | |
Equity securities—available for sale | | | 16,753 | | | | 13,228 | | | | 3,525 | | | | — | |
| | | | | | | | | | | | | | | | |
Total | | $ | 140,905 | | | $ | 22,500 | | | $ | 118,405 | | | $ | — | |
| | | | | | | | | | | | | | | | |
There were no transfers between Level 1 and Level 2 securities for the year ended December 31, 2011.
The estimated fair values of the Company’s investments in fixed income securities, convertible bonds, and equity securities are based on prices provided by an independent, nationally recognized pricing service. The prices provided by the independent pricing service are based on quoted market prices, when available, non-binding broker quotes, or matrix pricing. The independent pricing service provides a single price or quote per security and the Company does not adjust security prices. Management has controls in place to validate the reasonableness of fair values provided by the independent pricing service, including testing the fair value of a sample of securities on a quarterly basis by comparing fair values from different pricing sources. Fixed income securities include U.S. Treasuries, agencies backed by the U.S. Government, municipal bonds, mortgage-backed securities, collateralized mortgage obligations, asset-backed securities, and corporate bonds.
The Company’s fixed income securities and convertible bonds consist primarily of publicly traded securities for which there are observable inputs and/or broker quotes. Most fixed income security prices provided by the independent pricing service are based on observable inputs and, therefore, are classified as Level 2 securities. The Company does not hold any fixed income securities, for which pricing was based on significant unobservable inputs; therefore, the Company has not classified any of its fixed income securities as Level 3 securities.
The Company’s equity securities consist primarily of mutual fund instruments for which there is an active market and quoted market prices; therefore, the Company has classified its mutual fund investments as Level 1 securities. As of December 31, 2010, the Company held an investment in an international equity fund that was not traded on an active
75
exchange market and, therefore, was considered a Level 2 security. Approximately 94.1% of the fund’s underlying investments were considered Level 1 securities as of December 31, 2010, the most recent date for which the Company had audited financial statements of the fund. The Company sold its interest in the international equity fund in the second quarter of 2011.
Other long-term investments include the Company’s interest in various limited partnerships, including a low volatility multi-strategy fund of funds, a natural resource limited partnership, a structured finance opportunity fund, an open-ended investment fund and a real estate limited partnership. The Company records its investment in the limited partnerships using the equity method. The carrying value of the Company’s limited partnership investments are based on the Company’s allocable share of the limited partnerships’ net asset value. Changes in the Company’s investments are based on statements received directly from the limited partnership and/or the limited partnership’s administrator. The estimated fair values of the underlying investments in the limited partnerships may be based on Level 1, Level 2, or Level 3 inputs, or a combination thereof.
As of December 31, 2011 and 2010, the estimated fair values of the Company’s other long-term investments, by investment strategy, were as follows (in thousands):
| | | | | | | | |
| | | 2011 | | | 2010 | |
Multi-strategy fund of funds | | $ | 5,578 | | | $ | 5,351 | |
Natural resources | | | 1,262 | | | | 2,515 | |
Structured finance opportunity fund | | | 2,769 | | | | 2,892 | |
Open-ended investment fund | | | 600 | | | | 629 | |
Real estate | | | — | | | | 48 | |
| | | | | | | | |
Total | | $ | 10,209 | | | $ | 11,435 | |
| | | | | | | | |
During 2011, the Company wrote off its interest in the real estate limited partnership. The write off totaled $49 and was a result of the limited partnership being liquidated without any benefit to the Company.
Following is a summary of the investment objectives of each of the Company’s limited partnership investments, by investment strategy:
Multi-strategy fund of funds—The fund seeks to build and manage low volatility, multi-manager portfolios that have little or no correlation to the broader fixed income and equity security markets.
Natural resources—The investment objective of the fund is to achieve long-term capital appreciation primarily through investments in hard asset securities and hard asset commodities.
Structured finance opportunity fund—The fund seeks superior risk-adjusted absolute returns by acquiring and actively managing a diversified portfolio of debt securities, including bonds, loans, and other asset-backed instruments.
Open-ended investment fund—The fund seeks above-average capital growth through investment in domestic equity securities and equity related securities that are publicly traded in the United States.
Real estate partnership—The partnership was formed for the purpose of acquiring, rehabilitating, operating, leasing, and managing an apartment complex in Lancaster, Pennsylvania. The apartments are primarily marketed to low income individuals.
As of December 31, 2011, the only restrictions on the Company’s ability to redeem its interest in its limited partnership investments relate to the timing of redemption (i.e., monthly, quarterly). There are no restrictions related to the amount the Company can redeem, in the event it chooses to redeem all or a portion of its interest in its limited partnership investments. The Company has no unfunded commitments related to these investments as of December 31, 2011.
76
The activity in the Company’s limited partnership investments for the years ended December 31, 2011, 2010 and 2009 was as follows (in thousands):
| | | | | | | | | | | | |
| | | Years Ended December 31, | |
| | 2011 | | | 2010 | | | 2009 | |
Balance, beginning of period | | $ | 11,435 | | | $ | 8,197 | | | $ | 7,592 | |
Contributions | | | — | | | | 2,186 | | | | — | |
Withdrawals | | | (1,231 | ) | | | — | | | | (461 | ) |
Unrealized change in interest | | | 5 | | | | 1,052 | | | | 1,066 | |
| | | | | | | | | | | | |
Balance, end of period | | $ | 10,209 | | | $ | 11,435 | | | $ | 8,197 | |
| | | | | | | | | | | | |
During the fourth quarter of 2011, the Company liquidated its interest in one of the natural resource funds.
The change in interest in the Company’s limited partnership investments is included in the change in equity interest in limited partnerships in the consolidated statements of operations and comprehensive income (loss).
11. Investments
The following tables provide the amortized cost and estimated fair value of the Company’s fixed income and equity securities as of December 31, 2011 and 2010 (in thousands):
| | | | | | | | | | | | | | | | |
2011 | | Cost or
Amortized
Cost | | | Gross
Unrealized
Gains | | | Gross
Unrealized
Losses | | | Estimated
Fair Value | |
U.S. Treasuries and government agencies | | $ | 15,524 | | | $ | 619 | | | $ | — | | | $ | 16,143 | |
States, municipalities, and political subdivisions | | | 39,904 | | | | 2,416 | | | | (4 | ) | | | 42,316 | |
Corporate securities | | | 44,748 | | | | 752 | | | | (2 | ) | | | 45,498 | |
Residential mortgage-backed securities | | | 21,499 | | | | 861 | | | | — | | | | 22,360 | |
Commercial mortgage-backed securities | | | 187 | | | | 19 | | | | — | | | | 206 | |
Collateralized mortgage obligations | | | 5,753 | | | | 134 | | | | (11 | ) | | | 5,876 | |
Other structured securities | | | 1,004 | | | | 19 | | | | — | | | | 1,023 | |
| | | | | | | | | | | | | | | | |
Total fixed income securities | | | 128,619 | | | | 4,820 | | | | (17 | ) | | | 133,422 | |
Equity securities | | | 16,566 | | | | 1,546 | | | | (483 | ) | | | 17,629 | |
| | | | | | | | | | | | | | | | |
Total fixed income and equity securities | | $ | 145,185 | | | $ | 6,366 | | | $ | (500 | ) | | $ | 151,051 | |
| | | | | | | | | | | | | | | | |
| | | | | | | | | | | | | | | | |
2010 | | Cost or
Amortized
Cost | | | Gross
Unrealized
Gains | | | Gross
Unrealized
Losses | | | Estimated
Fair Value | |
U.S. Treasuries and government agencies | | $ | 22,775 | | | $ | 575 | | | $ | (6 | ) | | $ | 23,344 | |
States, municipalities, and political subdivisions | | | 31,282 | | | | 1,428 | | | | (89 | ) | | | 32,621 | |
Corporate securities | | | 36,462 | | | | 1,130 | | | | (124 | ) | | | 37,468 | |
Residential mortgage-backed securities | | | 25,474 | | | | 415 | | | | (130 | ) | | | 25,759 | |
Commercial mortgage-backed securities | | | 272 | | | | 17 | | | | — | | | | 289 | |
Collateralized mortgage obligations | | | 7,177 | | | | 117 | | | | (74 | ) | | | 7,220 | |
Other structured securities | | | 759 | | | | 18 | | | | (4 | ) | | | 773 | |
| | | | | | | | | | | | | | | | |
Total fixed income securities | | | 124,201 | | | | 3,700 | | | | (427 | ) | | | 127,474 | |
Equity securities | | | 17,002 | | | | 3,906 | | | | (28 | ) | | | 20,880 | |
| | | | | | | | | | | | | | | | |
Total fixed income and equity securities | | $ | 141,203 | | | $ | 7,606 | | | $ | (455 | ) | | $ | 148,354 | |
| | | | | | | | | | | | | | | | |
Corporate securities include an investment in a fixed income mutual fund, held by the segregated portfolio cell reinsurance segment, with a cost and estimated fair value of $23,991 and $23,989, respectively, as of December 31, 2011. The fixed income mutual fund’s investment objective is to provide a total return that is consistent with the preservation of capital through investing in high grade U.S. Dollar fixed income securities with a maximum maturity not exceeding five years.
Other structured securities include other asset-backed securities collateralized by home equity loans, auto loan receivables and manufactured homes.
77
Certain insurance departments in the states in which the Company is licensed to do business require a deposit to protect the Company’s policyholders should the Company become insolvent. In order to satisfy these requirements, the Company had fixed income securities with an estimated fair value of $12,023 and $11,442 on deposit with various insurance departments as of December 31, 2011 and 2010, respectively.
The amortized cost and estimated fair value of fixed income securities and convertible bonds, excluding the fixed income mutual fund held by the segregated portfolio cell reinsurance segment which does not have a stated maturity date, as of December 31, 2011, by contractual maturity, are shown below (in thousands). Expected maturities could differ from contractual maturities because borrowers may have the right to call or prepay obligations, with or without call or prepayment penalties.
| | | | | | | | |
| | | Amortized
Cost | | | Estimated
Fair Value | |
Less than one year | | $ | 6,040 | | | $ | 6,173 | |
One through five years | | | 46,205 | | | | 47,634 | |
Five through ten years | | | 23,940 | | | | 25,624 | |
Greater than ten years | | | 16,856 | | | | 18,111 | |
Mortgage/asset-backed securities | | | 28,443 | | | | 29,465 | |
| | | | | | | | |
Total | | $ | 121,484 | | | $ | 127,007 | |
| | | | | | | | |
The gross unrealized losses and estimated fair value of fixed income securities, excluding those securities in the segregated portfolio cell reinsurance segment, classified as available-for-sale by category and length of time an individual security has been in a continuous unrealized position as of December 31, 2011 and 2010 are as follows (in thousands):
| | | | | | | | | | | | | | | | | | | | | | | | |
2011 | | Less Than 12 Months | | | 12 Months or More | | | Total | |
| | Estimated
Fair
Value | | | Gross
Unrealized
Losses | | | Estimated
Fair
Value | | | Gross
Unrealized
Losses | | | Estimated
Fair
Value | | | Gross
Unrealized
Losses | |
States, municipalities, and political subdivisions | | $ | 1,604 | | | $ | (4 | ) | | $ | — | | | $ | — | | | $ | 1,604 | | | $ | (4 | ) |
Collateralized mortgage obligations | | | 375 | | | | (11 | ) | | | — | | | | — | | | | 375 | | | | (11 | ) |
| | | | | | | | | | | | | | | | | | | | | | | | |
Total fixed income securities | | | 1,979 | | | | (15 | ) | | | — | | | | — | | | | 1,979 | | | | (15 | ) |
Equity Securities | | | 3,302 | | | | (374 | ) | | | — | | | | — | | | | 3,302 | | | | (374 | ) |
| | | | | | | | | | | | | | | | | | | | | | | | |
Total fixed income and equity securities | | $ | 5,281 | | | $ | (389 | ) | | $ | — | | | $ | — | | | $ | 5,281 | | | $ | (389 | ) |
| | | | | | | | | | | | | | | | | | | | | | | | |
| | | | | | | | | | | | | | | | | | | | | | | | |
2010 | | Less Than 12 Months | | | 12 Months or More | | | Total | |
| | Estimated
Fair
Value | | | Gross
Unrealized
Losses | | | Estimated
Fair
Value | | | Gross
Unrealized
Losses | | | Estimated
Fair
Value | | | Gross
Unrealized
Losses | |
U.S. Treasuries and government agencies | | $ | 860 | | | $ | (6 | ) | | $ | — | | | $ | — | | | $ | 860 | | | $ | (6 | ) |
States, municipalities, and political subdivisions | | | 5,914 | | | | (89 | ) | | | — | | | | — | | | | 5,914 | | | | (89 | ) |
Corporate securities | | | 2,508 | | | | (25 | ) | | | — | | | | — | | | | 2,508 | | | | (25 | ) |
Residential mortgage-backed securities | | | 10,921 | | | | (130 | ) | | | — | | | | — | | | | 10,921 | | | | (130 | ) |
Collateralized mortgage obligations | | | 1,700 | | | | (19 | ) | | | 722 | | | | (55 | ) | | | 2,422 | | | | (74 | ) |
Other structured securities | | | 446 | | | | (4 | ) | | | — | | | | — | | | | 446 | | | | (4 | ) |
| | | | | | | | | | | | | | | | | | | | | | | | |
Total fixed income securities | | $ | 22,349 | | | $ | (273 | ) | | $ | 722 | | | $ | (55 | ) | | $ | 23,071 | | | $ | (328 | ) |
| | | | | | | | | | | | | | | | | | | | | | | | |
Note: The Company has excluded the segregated portfolio cell reinsurance segment’s gross unrealized losses from the above table because changes in the estimated fair value of the segregated portfolio cell reinsurance segment’s fixed income and equity securities inures to the segregated portfolio cell dividend participant and, accordingly, is included in the segregated portfolio cell dividend payable and the related segregated portfolio dividend expense in the Company’s consolidated balance sheet and consolidated statement of operations, respectively. Management believes the exclusion of the segregated portfolio cell reinsurance segment from this disclosure provides a more transparent understanding of gross unrealized losses in the Company’s fixed income and equity security portfolios that could impact its consolidated financial position or results of operations.
As of December 31, 2011, the Company held 6 fixed income securities with gross unrealized losses totaling $15. Management has evaluated the unrealized losses related to those fixed income securities and determined that they are primarily due to a fluctuation in interest rates and not to credit issues of the issuer or the underlying assets in the case of asset-backed securities. The Company does not intend to sell the fixed income securities and it is not more likely than not that the Company will be required to sell the fixed income securities before recovery of their amortized cost bases, which may be maturity; therefore, management does not consider the fixed income securities to be other–than-temporarily impaired as of December 31, 2011.
78
As of December 31, 2011, the Company held 6 equity securities with gross unrealized losses totaling $374. These securities have been in an unrealized loss position for less than twelve months. The Company does not intend to sell the equity securities and it is not more likely than not that the Company will be required to sell the equity securities before recovery of their cost bases; therefore, management does not consider the equity securities to be other-than-temporarily impaired as of December 31, 2011.
Proceeds from the sale of fixed income securities totaled $57,131, $42,218, and $36,511 for the years ended December 31, 2011, 2010 and 2009, respectively. Proceeds from the sale of equity securities totaled $12,666, $8,293, and $6,346 for the years ended December 31, 2011, 2010, and 2009, respectively. Proceeds from the sale of other long-term investments totaled $1,231, $0, and $461 for the years ended December 31, 2011, 2010, and 2009, respectively.
The gross realized gains and gross realized losses recognized by the Company as a result of the sale of investments were as follows for the years ended December 31, 2011, 2010, and 2009 (in thousands):
| | | | | | | | | | | | |
2011 | | Fixed
Income
Securities | | | Equity
Securities | | | Total | |
Gross realized gains | | $ | 1,371 | | | $ | 2,383 | | | $ | 3,754 | |
Gross realized losses | | | (430 | ) | | | (538 | ) | | | (968 | ) |
| | | | | | | | | | | | |
Net realized gains | | $ | 941 | | | $ | 1,845 | | | $ | 2,786 | |
| | | | | | | | | | | | |
| | | | | | | | | | | | |
2010 | | Fixed
Income
Securities | | | Equity
Securities | | | Total | |
Gross realized gains | | $ | 1,561 | | | $ | 1,045 | | | $ | 2,606 | |
Gross realized losses | | | (203 | ) | | | (18 | ) | | | (221 | ) |
| | | | | | | | | | | | |
Net realized gains | | $ | 1,358 | | | $ | 1,027 | | | $ | 2,385 | |
| | | | | | | | | | | | |
| | | | | | | | | | | | |
2009 | | Fixed
Income
Securities | | | Equity
Securities | | | Total | |
Gross realized gains | | $ | 1,131 | | | $ | 610 | | | $ | 1,741 | |
Gross realized losses | | | (332 | ) | | | (524 | ) | | | (856 | ) |
| | | | | | | | | | | | |
Net realized gains | | $ | 799 | | | $ | 86 | | | $ | 885 | |
| | | | | | | | | | | | |
For the years ended December 31, 2011, 2010 and 2009, the Company recorded other-than-temporary impairments, excluding the segregated portfolio cell reinsurance segment, related to its fixed income and equity securities totaling $0, $6 and $1,852, respectively. Other-than-temporary impairments in the segregated portfolio cell reinsurance segment totaled $78, $80, and $749 for the years ended December 31, 2011, 2010 and 2009, respectively.
For the years ended December 31, 2011, 2010 and 2009, the change in the estimated fair value of convertible bonds included in net realized investment gains (losses) in the consolidated statement of operations and comprehensive income totaled $(1,054), $1,166 and $877, respectively.
The change in the Company’s net unrealized gains and losses for the years ended December 31, 2011, 2010, and 2009 was as follows (in thousands):
| | | | | | | | | | | | |
2011 | | Fixed
Income
Securities | | | Equity
Securities | | | Total | |
Change in unrealized gains and losses, gross of tax | | $ | 1,343 | | | $ | (2,250 | ) | | $ | (907 | ) |
Tax effect | | | (484 | ) | | | 783 | | | | 299 | |
| | | | | | | | | | | | |
Change in net unrealized gains and losses | | $ | 859 | | | $ | (1,467 | ) | | $ | (608 | ) |
| | | | | | | | | | | | |
| | | | | | | | | | | | |
2010 | | Fixed
Income
Securities | | | Equity
Securities | | | Total | |
Change in unrealized gains and losses, gross of tax | | $ | (790 | ) | | $ | (35 | ) | | $ | (825 | ) |
Tax effect | | | (33 | ) | | | (291 | ) | | | (324 | ) |
| | | | | | | | | | | | |
Change in net unrealized gains and losses | | $ | (823 | ) | | $ | (326 | ) | | $ | (1,149 | ) |
| | | | | | | | | | | | |
79
| | | | | | | | | | | | |
2009 | | Fixed
Income
Securities | | | Equity
Securities | | | Total | |
Change in unrealized gains and losses, gross of tax | | $ | 1,685 | | | $ | 7,508 | | | $ | 9,193 | |
Tax effect | | | (132 | ) | | | (1,681 | ) | | | (1,813 | ) |
| | | | | | | | | | | | |
Change in net unrealized gains and losses | | $ | 1,553 | | | $ | 5,827 | | | $ | 7,380 | |
| | | | | | | | | | | | |
Net investment income for the years ended December 31, 2011, 2010, and 2009 was as follows (in thousands):
| | | | | | | | | | | | |
| | | 2011 | | | 2010 | | | 2009 | |
Fixed income and convertible bond securities | | $ | 4,274 | | | $ | 3,865 | | | $ | 4,634 | |
Equity securities | | | 484 | | | | 229 | | | | 304 | |
Cash and cash equivalents | | | 45 | | | | 45 | | | | 96 | |
Other | | | (345 | ) | | | 83 | | | | 89 | |
| | | | | | | | | | | | |
Gross investment income | | | 4,458 | | | | 4,222 | | | | 5,123 | |
Investment expenses | | | (760 | ) | | | (857 | ) | | | (670 | ) |
| | | | | | | | | | | | |
Net investment income | | $ | 3,698 | | | $ | 3,365 | | | $ | 4,453 | |
| | | | | | | | | | | | |
For the years ended December 31, 2011, 2010 and 2009, the Company recognized an increase of $5, $1,052, and $1,066 respectively, related to its equity interest in limited partnerships. The Company’s limited partnership investments include a multi-strategy fund of funds, natural resource funds, a structured finance opportunity fund and open-ended investment fund and a real estate partnership. The Company obtains audited financial statements of its limited partnership investments on an annual basis. The total assets, total liabilities and results of operations of the limited partnerships in which the Company invests as of and for the year ended December 31, 2010, based on the limited partnerships’ audited financial statements, were as follows (in thousands):
| | | | | | | | | | | | |
| | | Total
Assets | | | Total
Liabilities | | | Results
of Operations | |
Multi-strategy fund of funds | | $ | 452,826 | | | $ | 54,633 | | | $ | 41,821 | |
Natural resource funds | | $ | 29,609 | | | $ | 4,036 | | | $ | 1,118 | |
Structured finance opportunity fund | | $ | 294,726 | | | $ | 20,153 | | | $ | 54,793 | |
Open-ended investment fund | | $ | 118,386 | | | $ | 575 | | | $ | 11,167 | |
Real estate partnership | | $ | 3,606 | | | $ | 2,655 | | | $ | (190 | ) |
12. Reserves for Unpaid Losses and LAE
The following table provides a summary of the activity in the Company’s reserves for unpaid losses and LAE for the years ended December 31, 2011, 2010, and 2009 (in thousands):
| | | | | | | | | | | | |
| | | 2011 | | | 2010 | | | 2009 | |
Balance, beginning of period | | $ | 95,963 | | | $ | 89,509 | | | $ | 86,993 | |
Reinsurance recoverables on unpaid losses and LAE | | | 7,864 | | | | 8,512 | | | | 7,835 | |
| | | | | | | | | | | | |
Net balance, beginning of period | | | 88,099 | | | | 80,997 | | | | 79,158 | |
Incurred related to: | | | | | | | | | | | | |
Current year | | | 84,723 | | | | 76,794 | | | | 63,602 | |
Prior year | | | (1,001 | ) | | | 780 | | | | (4,836 | ) |
| | | | | | | | | | | | |
Total incurred | | | 83,722 | | | | 77,574 | | | | 58,766 | |
Paid related to: | | | | | | | | | | | | |
Current year | | | 31,444 | | | | 30,755 | | | | 22,369 | |
Prior year | | | 46,105 | | | | 39,717 | | | | 34,558 | |
| | | | | | | | | | | | |
Total paid | | | 77,549 | | | | 70,472 | | | | 56,927 | |
| | | | | | | | | | | | |
Net balance, end of period | | | 94,272 | | | | 88,099 | | | | 80,997 | |
Reinsurance recoverables on unpaid losses and LAE | | | 11,805 | | | | 7,864 | | | | 8,512 | |
| | | | | | | | | | | | |
Balance, end of period | | $ | 106,077 | | | $ | 95,963 | | | $ | 89,509 | |
| | | | | | | | | | | | |
80
Incurred losses by segment were as follows for the year ended December 31, 2011 (in thousands):
| | | | | | | | | | | | |
| | | Workers’
Compensation
Insurance
Segment | | | Segregated
Portfolio Cell
Reinsurance
Segment | | | Total | |
Incurred related to: | | | | | | | | | | | | |
Current year, gross of discount | | $ | 68,894 | | | $ | 18,770 | | | $ | 87,664 | |
Current period discount | | | (2,252 | ) | | | (689 | ) | | | (2,941 | ) |
Prior year, gross of discount | | | — | | | | (2,875 | ) | | | (2,875 | ) |
Accretion of prior period discount | | | 1,159 | | | | 715 | | | | 1,874 | |
| | | | | | | | | | | | |
Total incurred | | $ | 67,801 | | | $ | 15,921 | | | $ | 83,722 | |
| | | | | | | | | | | | |
Incurred losses by segment were as follows for the year ended December 31, 2010 (in thousands):
| | | | | | | | | | | | |
| | | Workers’
Compensation
Insurance
Segment | | | Segregated
Portfolio Cell
Reinsurance
Segment | | | Total | |
Incurred related to: | | | | | | | | | | | | |
Current year, gross of discount | | $ | 59,615 | | | $ | 19,746 | | | $ | 79,361 | |
Current period discount | | | (1,901 | ) | | | (666 | ) | | | (2,567 | ) |
Prior year, gross of discount | | | — | | | | (1,432 | ) | | | (1,432 | ) |
Accretion of prior period discount | | | 1,562 | | | | 650 | | | | 2,212 | |
| | | | | | | | | | | | |
Total incurred | | $ | 59,276 | | | $ | 18,298 | | | $ | 77,574 | |
| | | | | | | | | | | | |
Incurred losses by segment were as follows for the year ended December 31, 2009 (in thousands):
| | | | | | | | | | | | |
| | | Workers’
Compensation
Insurance
Segment | | | Segregated
Portfolio Cell
Reinsurance
Segment | | | Total | |
Incurred related to: | | | | | | | | | | | | |
Current year, gross of discount | | $ | 47,860 | | | $ | 17,732 | | | $ | 65,592 | |
Current period discount | | | (1,343 | ) | | | (647 | ) | | | (1,990 | ) |
Prior year, gross of discount | | | (3,749 | ) | | | (2,753 | ) | | | (6,502 | ) |
Accretion of prior period discount | | | 1,075 | | | | 591 | | | | 1,666 | |
| | | | | | | | | | | | |
Total incurred | | $ | 43,843 | | | $ | 14,923 | | | $ | 58,766 | |
| | | | | | | | | | | | |
For the years ended December 31, 2011, 2010 and 2009, the Company increased (decreased) its workers’ compensation insurance and segregated portfolio cell reinsurance reserves for unpaid losses and LAE, including the accretion of prior period discount, by the following amounts (in thousands):
| | | | | | | | | | | | |
| | | 2011 | | | 2010 | | | 2009 | |
Workers’ compensation insurance | | $ | 1,159 | | | $ | 1,562 | | | $ | (2,674 | ) |
Segregated portfolio cell reinsurance | | | (2,160 | ) | | | (782 | ) | | | (2,162 | ) |
| | | | | | | | | | | | |
Total | | $ | (1,001 | ) | | $ | 780 | | | $ | (4,836 | ) |
| | | | | | | | | | | | |
81
Workers’ Compensation Insurance
For the years ended December 31, 2011, 2010 and 2009, the Company increased (decreased) its workers’ compensation insurance reserves for unpaid losses and LAE by the following amounts by accident year (in thousands):
| | | | | | | | | | | | |
Accident Year | | 2011 | | | 2010 | | | 2009 | |
2009 | | $ | — | | | $ | — | | | $ | — | |
2008 | | | — | | | | — | | | | — | |
2007 | | | — | | | | — | | | | (1,170 | ) |
2006 | | | — | | | | — | | | | (1,504 | ) |
2005 | | | — | | | | — | | | | — | |
2004 | | | — | | | | — | | | | (250 | ) |
2003 | | | — | | | | — | | | | (325 | ) |
2002 | | | — | | | | — | | | | (500 | ) |
2001 and prior | | | — | | | | — | | | | — | |
| | | | | | | | | | | | |
Total before discount accretion | | | — | | | | — | | | | (3,749 | ) |
Discount accretion | | | 1,159 | | | | 1,562 | | | | 1,075 | |
| | | | | | | | | | | | |
Total | | $ | 1,159 | | | $ | 1,562 | | | $ | (2,674 | ) |
| | | | | | | | | | | | |
For the years ended December 31, 2011 and 2010, the Company did not recognize any development on prior accident period workers’ compensation insurance reserves.
For the year ended December 31, 2009, the Company recognized net favorable development on prior accident year workers’ compensation insurance reserves of $3.7 million, representing 6.7% of the Company’s estimated workers’ compensation insurance reserves as of December 31, 2008 and 5.1% of the Company’s workers’ compensation insurance net premiums earned for the year ended December 31, 2009. The favorable development arose primarily from accident years 2006 and 2007, and resulted from actual loss development being somewhat lower than the Company had expected based on its historical loss development experience, reflecting continued improvements in loss mitigation and underwriting. The improvements in loss mitigation and underwriting included greater availability and use of employers’ return to work programs. Furthermore, the Company was able to settle a large amount of Pennsylvania claims via compromise and release, which is a lump sum cash payment in exchange for a full and final claim settlement. Management attributes the large amount of compromise and release claim closures to the difficult economic conditions and the claimants’ choosing a lump sum cash settlement over the continuation of a workers’ compensation annuity payment.
Segregated Portfolio Cell Reinsurance
For the years ended December 31, 2011, 2010 and 2009, the Company (decreased) increased its segregated portfolio cell reinsurance reserves for unpaid losses and LAE by the following amounts by accident year (in thousands):
| | | | | | | | | | | | |
Accident Year | | 2011 | | | 2010 | | | 2009 | |
2010 | | $ | (1,862 | ) | | $ | — | | | $ | — | |
2009 | | | (602 | ) | | | (1,372 | ) | | | — | |
2008 | | | (109 | ) | | | (418 | ) | | | (1,506 | ) |
2007 | | | (136 | ) | | | 423 | | | | (247 | ) |
2006 | | | (85 | ) | | | (12 | ) | | | (663 | ) |
2005 | | | (12 | ) | | | 103 | | | | 76 | |
2004 | | | (54 | ) | | | (124 | ) | | | (268 | ) |
2003 | | | (2 | ) | | | (51 | ) | | | 68 | |
2002 | | | (2 | ) | | | (10 | ) | | | (24 | ) |
2001 and prior | | | (11 | ) | | | 29 | | | | (189 | ) |
| | | | | | | | | | | | |
Total before discount accretion | | | (2,875 | ) | | | (1,432 | ) | | | (2,753 | ) |
Discount accretion | | | 715 | | | | 650 | | | | 591 | |
| | | | | | | | | | | | |
Total | | $ | (2,160 | ) | | $ | (782 | ) | | $ | (2,162 | ) |
| | | | | | | | | | | | |
The Company estimates and records reserves for its segregated portfolio cell reinsurance segment in the same manner as for its workers’ compensation insurance segment. Furthermore, the Company’s underwriting, claim administration and risk management services are consistent between its workers’ compensation insurance and segregated portfolio cell reinsurance
82
segments. This is because the workers’ compensation and segregated portfolio cell reinsurance segments derive their books of business from the same general business demographics and geography. Prior period reserve development in the segregated portfolio cell reinsurance segment results in an increase or decrease in the segment’s losses and LAE incurred and a corresponding decrease or increase in the segregated portfolio cell dividend expense.
For the year ended December 31, 2011, the Company recognized net favorable development on prior accident year segregated portfolio cell reinsurance reserves of $2.9 million, representing 12.6% of the Company’s estimated segregated portfolio cell reinsurance reserves as of December 31, 2010 and 10.1% of the Company’s segregated portfolio cell reinsurance net premiums earned for the year ended December 31, 2011. The favorable development arose primarily from accident years 2010 and 2009, but was generally prevalent in most prior accident years, and resulted from actual loss development being somewhat lower than the Company had expected based on its historical loss development experience, reflecting continued improvements in loss mitigation and underwriting.
For the year ended December 31, 2010, the Company recognized net favorable development on prior accident year segregated portfolio cell reinsurance reserves of $1.4 million, representing 6.5% of the Company’s estimated segregated portfolio cell reinsurance reserves as of December 31, 2009 and 5.8% of the Company’s segregated portfolio cell reinsurance net premiums earned for the year ended December 31, 2010. The favorable development arose primarily from accident years 2008 and 2009, but was generally prevalent in most prior accident years, and resulted from actual loss development being somewhat lower than the Company had expected based on its historical loss development experience, reflecting continued improvements in loss mitigation and underwriting. The improvements in loss mitigation and underwriting include greater availability and use of employers’ return to work programs.
For the year ended December 31, 2009, the Company recognized net favorable development on prior accident year segregated portfolio cell reinsurance reserves of $2.8 million, representing 12.5% of the Company’s estimated segregated portfolio cell reinsurance reserves as of December 31, 2008 and 11.1% of the Company’s segregated portfolio cell reinsurance net premiums earned for the year ended December 31, 2009. The favorable development arose primarily from accident years 2006 and 2008, but was generally prevalent in most prior accident years, and resulted from actual loss development being somewhat lower than the Company had expected based on its historical loss development experience, reflecting continued improvements in loss mitigation and underwriting. The improvements in loss mitigation and underwriting include greater availability and use of employers’ return to work programs.
13. Reinsurance
The Company purchases reinsurance to manage its loss exposure. Although reinsurance agreements contractually obligate the Company’s reinsurers to reimburse the Company for the agreed upon portion of its gross paid losses, they do not discharge the primary liability of the Company.
The following table provides a summary of the Company’s premiums on a direct, assumed, ceded, and net basis for the years ended December 31, 2011, 2010, and 2009 (in thousands):
| | | | | | | | | | | | | | | | | | | | | | | | |
| | | 2011 | | | 2010 | | | 2009 | |
| | | Written | | | Earned | | | Written | | | Earned | | | Written | | | Earned | |
Direct premiums | | $ | 121,752 | | | $ | 113,612 | | | $ | 98,045 | | | $ | 90,414 | | | $ | 81,447 | | | $ | 77,335 | |
Assumed premiums | | | 36,041 | | | | 33,221 | | | | 30,232 | | | | 29,332 | | | | 29,747 | | | | 29,009 | |
Ceded premiums | | | (15,672 | ) | | | (14,660 | ) | | | (11,656 | ) | | | (10,594 | ) | | | (8,858 | ) | | | (8,428 | ) |
| | | | | | | | | | | | | | | | | | | | | | | | |
Net premiums | | $ | 142,121 | | | $ | 132,173 | | | $ | 116,621 | | | $ | 109,152 | | | $ | 102,336 | | | $ | 97,916 | |
| | | | | | | | | | | | | | | | | | | | | | | | |
The following table provides a summary of the Company’s losses and loss adjustment expenses incurred on a direct, assumed, ceded and net basis for the years ended December 31, 2011, 2010, and 2009 (in thousands):
| | | | | | | | | | | | |
| | | 2011 | | | 2010 | | | 2009 | |
Direct losses and LAE incurred | | $ | 73,127 | | | $ | 60,968 | | | $ | 45,148 | |
Assumed losses and LAE incurred | | | 16,031 | | | | 18,611 | | | | 16,002 | |
Ceded losses and LAE incurred | | | (5,436 | ) | | | (2,005 | ) | | | (2,384 | ) |
| | | | | | | | | | | | |
Net losses and LAE | | $ | 83,722 | | | $ | 77,574 | | | $ | 58,766 | |
| | | | | | | | | | | | |
83
14. Income Taxes
The components of the consolidated income tax provision from continuing operations for the years ended December 31, 2011, 2010, and 2009 are as follows (in thousands):
| | | | | | | | | | | | |
| | | 2011 | | | 2010 | | | 2009 | |
Current tax expense | | $ | 2,829 | | | $ | 369 | | | $ | 1,596 | |
Deferred tax (benefit) expense | | | (393 | ) | | | 873 | | | | 906 | |
| | | | | | | | | | | | |
Income tax expense | | $ | 2,436 | | | $ | 1,242 | | | $ | 2,502 | |
| | | | | | | | | | | | |
The reconciliation of taxes computed at the statutory tax rate of 35.0% for the years ended December 31, 2011, 2010, and 2009 to the consolidated income tax expense from continuing operations is as follows (in thousands):
| | | | | | | | | | | | |
| | | 2011 | | | 2010 | | | 2009 | |
Income tax expense at statutory rate | | $ | 3,427 | | | $ | 1,460 | | | $ | 2,952 | |
Tax-exempt interest | | | (318 | ) | | | (403 | ) | | | (518 | ) |
Outside basis difference in foreign operations | | | (824 | ) | | | (130 | ) | | | (122 | ) |
Other | | | 151 | | | | 315 | | | | 190 | |
| | | | | | | | | | | | |
Income tax expense | | $ | 2,436 | | | $ | 1,242 | | | $ | 2,502 | |
| | | | | | | | | | | | |
The income tax benefit of $824 recorded in 2011 is attributable to the fact that the Company has not recorded federal income taxes associated with its foreign operations due to significant deficits in the Company’s foreign earnings and profits.
The significant components of the net deferred tax asset as of December 31, 2011 and 2010 are as follows (in thousands):
| | | | | | | | |
| | | 2011 | | | 2010 | |
Deferred tax assets: | | | | | | | | |
Reserve discounting | | $ | 1,925 | | | $ | 2,244 | |
Unearned/advance premiums | | | 3,110 | | | | 2,948 | |
Other-than-temporary investment impairments | | | 56 | | | | 1,869 | |
Policyholder dividends | | | 705 | | | | 518 | |
Stock compensation expense | | | 1,160 | | | | 943 | |
Benefit plan liabilities | | | 668 | | | | 251 | |
Other | | | 281 | | | | 439 | |
| | | | | | | | |
Total deferred tax assets | | | 7,905 | | | | 9,212 | |
| | | | | | | | |
Deferred tax liabilities: | | | | | | | | |
Intangible assets | | | 1,430 | | | | 1,790 | |
Unrealized gain on investments | | | 2,542 | | | | 3,207 | |
Deferred acquisition costs | | | 1,164 | | | | 1,555 | |
Basis difference in limited partnerships | | | 246 | | | | 717 | |
Basis difference in foreign operations | | | 485 | | | | 912 | |
Other | | | 270 | | | | 310 | |
| | | | | | | | |
Total deferred tax liabilities | | | 6,137 | | | | 8,491 | |
| | | | | | | | |
Net deferred tax asset | | $ | 1,768 | | | $ | 721 | |
| | | | | | | | |
As of December 31, 2011, the net deferred tax asset of $1,768 has not been reduced by a valuation allowance because management believes that, while it is not assured, it is more likely than not that the Company will generate sufficient future taxable income to utilize these net future tax deductions. The amount of the net deferred tax asset considered realizable, however, could be materially reduced in the near term if estimates of future taxable income in the years in which the differences are expected to reverse are decreased.
As of December 31, 2011, the Company has not recognized any future tax benefit related to its foreign operations at Eastern Re. The unrecognized tax benefit, which represents the excess of the tax basis over the amount for financial reporting (i.e., outside basis difference) of Eastern Re, was $11,367 as of December 31, 2011. The outside basis difference primarily
84
arises from losses at Eastern Re recognized for financial statement purposes, which have not yet been recognized for tax purposes. Management presently believes that the Company will not be able to recognize these tax benefits in the foreseeable future and, therefore, has not recognized the future tax benefits as of December 31, 2011.
A reconciliation of the beginning and ending amount of unrecognized tax benefits for the year ended December 31, 2011 is as follows:
| | | | |
| | | 2011 | |
Balance at beginning of year | | $ | — | |
Additions based on tax positions related to the current year | | | 26 | |
| | | | |
Balance at end of year | | $ | 26 | |
| | | | |
There were no unrecognized tax benefits recorded by the Company in 2010 or 2009.
The total unrecognized federal tax benefit of $26 would impact the Company’s consolidated effective tax rate if recognized. The liability for unrecognized tax benefits is included in federal income tax recoverable on the consolidated balance sheets. The Company’s practice is to recognize interest and penalties related to income tax matters in income tax expense. The statute of limitations has expired for the Company’s federal taxable years through December 31, 2007.
EIHI and its subsidiaries join in the filing of a consolidated federal tax return in the United States. Each subsidiary pays its share of the federal tax liability as if the subsidiary filed on a separate return basis with a current period credit for net losses to the extent used in consolidation.
15. Employee Benefit Plans
ESOP
The Company sponsors an ESOP. Eligible employees generally include those employees who have reached the age of 21 and have completed one year of service. ESOP shares are allocated to participants based on the ratio of their individual compensation during the plan year to the total compensation of eligible employees during the plan year.
The Company issued 747,500 shares of its common stock to the ESOP on June 16, 2006, and the ESOP signed a promissory note in the amount of $7,475 for the purchase of the shares, which is due in ten equal installments, with interest accruing annually at 4%. Shares purchased are held in a suspense account for allocation among participating employees as the loan is repaid.
Suspense shares, allocated shares, shares committed to be released, average price per share and stock compensation expense as of and for the years ended December 31, 2011 and 2010 were as follows (in thousands, except share and per share data):
| | | | | | | | |
| | | As of and for the Years
Ended December 31, | |
| | | 2011 | | | 2010 | |
Suspense shares | | | 411,125 | | | | 485,875 | |
Allocated shares | | | 336,375 | | | | 261,625 | |
Shares committed to be released | | | 74,750 | | | | 74,750 | |
Average price per share | | $ | 13.07 | | | $ | 10.36 | |
Stock compensation expense | | $ | 977 | | | $ | 774 | |
Suspense shares represent shares held by the ESOP that have not been allocated to participant accounts. Allocated shares have been earned and allocated to participant accounts, while shares committed to be released have been earned, but have not yet been allocated to participant accounts.
As of December 31, 2011 and 2010, the estimated fair value of unearned ESOP shares were $4,396 and $4,259, respectively.
For the years ended December 31, 2011, 2010, and 2009 the Company made a cash contribution of $979, $958, and $937 to the ESOP, respectively. The ESOP used these contributions, along with dividends received on the unallocated shares
85
of the Company’s stock held by the ESOP, to make the semi-annual principal and interest payments to the Company related to the outstanding balance of the promissory note. Dividends used by the ESOP to fund the semi-annual principal and interest payments totaled $121, $142, and $163 in 2011, 2010, and 2009, respectively. The transactions between the Company and the ESOP are considered non-cash transactions for purposes of the consolidated statements of cash flows.
Defined Contribution Plan
The Company sponsors a contributory defined contribution plan covering eligible employees. Employees are eligible to participate in the defined contribution plan upon the attainment of 21 years of age. The Company provides a matching contribution up to 75% of the first 4% of an employee’s contributions. Employees are immediately vested in the employer matching contributions regardless of years of service. The Company’s contributions to the defined contribution plan for the years ended December 31, 2011, 2010, and 2009 totaled $289, $297, and $309, respectively.
Employees may invest the contributions to their account in a variety of mutual funds. The estimated fair values of the mutual fund investments are based on quoted net asset values; therefore, the estimated fair values are considered Level 1 fair value measurements.
Other Benefit Plans
The Company also sponsors a non-contributory defined benefit pension plan (the “pension plan”) and a defined benefit postretirement plan (the “postretirement plan”), both of which are frozen as to the earning of additional benefits.
As of December 31, 2011 and 2010, the projected benefit obligation, fair value of plan assets and funded status of the pension plan and the postretirement plan were as follows (in thousands):
| | | | | | | | | | | | | | | | |
| | | Pension Plan | | | Postretirement Plan | |
| | | 2011 | | | 2010 | | | 2011 | | | 2010 | |
Projected benefit obligation at end of year | | $ | 7,263 | | | $ | 7,093 | | | $ | 260 | | | $ | 256 | |
Fair value of plan assets at end of year | | | 5,613 | | | | 6,631 | | | | — | | | | — | |
Funded status | | | 1,650 | | | | 462 | | | | 260 | | | | 256 | |
The Company does not anticipate making a contribution in 2012.
The assumptions used in the measurement of the Company’s benefit obligation are shown in the following table:
| | | | | | | | | | | | | | | | |
| | | Pension Plan | | | Postretirement Plan | |
| | | 2011 | | | 2010 | | | 2011 | | | 2010 | |
Weighted average discount rate | | | 4.39 | % | | | 5.50 | % | | | 3.72 | % | | | 4.70 | % |
Rate of increase in compensation levels | | | N/A | | | | N/A | | | | 3.50 | % | | | 3.50 | % |
The net periodic benefit cost incurred by the Company for the years ended December 31, 2011, 2010 and 2009 totaled $60, $17, and $68 for the pension plan and $(22), $(7), and $(5) for the postretirement plan. In July 2011, the Company purchased annuities for plan participants that were receiving benefit payments under the pension plan, which resulted in a reduction of the projected benefit obligation of $1,083 and the recognition of a settlement loss of $134.
The assumptions used in the measurement of the Company’s net periodic benefit cost for the pension plan and the postretirement plan are shown in the following table:
| | | | | | | | | | | | | | | | | | | | | | | | |
| | | Pension Plan | | | Postretirement Plan | |
| | | 2011 | | | 2010 | | | 2009 | | | 2011 | | | 2010 | | | 2009 | |
Weighted average discount rate | | | 5.62 | %* | | | 6.00 | % | | | 6.00 | % | | | 4.70 | % | | | 5.30 | % | | | 6.18 | % |
Expected long-term rate of return on plan assets | | | 5.50 | % | | | 6.00 | % | | | 6.00 | % | | | N/A | | | | N/A | | | | N/A | |
Rate of increase in compensation levels | | | N/A | | | | N/A | | | | N/A | | | | 3.50 | % | | | 3.50 | % | | | 3.50 | % |
*The weighted average discount rate used to measure net periodic benefit cost was 5.50% for the period from January 1, 2011 to June 30, 2011 and 5.62% for the period from July 1, 2011 to December 31, 2011. The change in the discount rate on July 1, 2011 was due to the purchase of the annuity and the related settlement that occurred in July 2011.
86
Benefits paid totaled $106, $117, and $39 for the pension plan and $1, $2, and $1 for the postretirement plan for the years ended December 31, 2011, 2010, and 2009, respectively. The estimated future benefits to be paid over the next ten years related to the pension plan are as follows (in thousands):
| | | | |
| | | Pension
Plan | |
2012 | | $ | 89 | |
2013 | | | 104 | |
2014 | | | 120 | |
2015 | | | 177 | |
2016 | | | 215 | |
2017-2021 | | | 1,539 | |
| | | | |
Total | | $ | 2,244 | |
| | | | |
The estimated future benefits to be paid over the next ten years related to the postretirement plan are expected to be minimal. The only benefits currently being paid by the Company under the postretirement plan relate to life insurance premiums for certain retirees.
The pension plan’s assets were comprised of the following at December 31, 2011 and 2010 (in thousands):
| | | | | | | | |
| | | 2011 | | | 2010 | |
Equity securities | | $ | — | | | $ | 768 | |
Fixed income securities | | | 4,617 | | | | 5,852 | |
Cash equivalents | | | 996 | | | | 11 | |
| | | | | | | | |
Total | | $ | 5,613 | | | $ | 6,631 | |
| | | | | | | | |
The pension plan’s fixed income securities consist of pooled separate accounts that are valued at the net participation value of participation units held by the pension plan. The value of the participation units is determined by the trustee based on the estimated fair values of the underlying assets of the pooled separate account; therefore, the estimated fair value of the pooled separate accounts is considered a Level 2 fair value measurement. As of December 31, 2010, the pension plan’s equity securities consisted of a small-cap index mutual fund. The mutual fund’s estimated fair value was based on a quoted net asset value; therefore, the estimated fair value was considered a Level 1 fair value measurement.
As a result of the pension plan’s frozen status, the primary investment objective of the pension plan is to achieve a rate of return commensurate with the safety of principal. During 2011, the Company liquidated its investment in the small-cap index mutual fund in order to reduce market volatility in the pension plan’s investment portfolio. The pension plan’s targeted asset allocation is 100% fixed income securities and/or cash equivalents.
16. Segment Information
The Company currently operates in three business segments. Prior to the sale of Atlantic RE and Eastern Life, the Company’s operations included a run-off specialty reinsurance segment and a group benefits insurance segment. The components of the run-off specialty reinsurance segment that were not transferred to Atlantic RE have been included in the corporate/other segment for the years ended December 31, 2011, 2010 and 2009.
Workers’ Compensation Insurance
The Company offers traditional workers’ compensation insurance coverage to employers, primarily in the Mid-Atlantic, Southeast and Midwest regions of the continental United States. The Company’s workers’ compensation products include guaranteed cost policies, policyholder dividend policies, retrospectively-rated policies and deductible policies.
Segregated Portfolio Cell Reinsurance
The Company offers alternative market workers’ compensation solutions to individual companies, groups and associations (referred to as “segregated portfolio cell dividend participants”) through the creation of segregated portfolio cells. The segregated portfolio cells are segregated pools of assets that function as insurance companies within an insurance
87
company. The pool of assets and associated liabilities of each segregated portfolio cell are solely for the benefit of the segregated portfolio cell dividend participants, and the pool of assets of one segregated portfolio cell are statutorily protected from the creditors of the others. This permits the Company to provide customers with a turn-key alternative markets solution that includes program design, fronting, claims administration, risk management, segregated portfolio cell rental, asset management and segregated portfolio management services. The Company outsources the asset management and segregated portfolio cell management services to a third party. The segregated portfolio cell structure provides dividend participants the opportunity to share in both underwriting profit and investment income derived from their respective segregated portfolio cell’s financial results. The segregated portfolio cell reinsurance segment generated fee revenue to the Company’s workers’ compensation insurance and corporate/other segments totaling approximately $5,515, $4,469 and $4,054 for the years ended December 31, 2011, 2010 and 2009, respectively.
The Company is a preferred shareholder in certain of the segregated portfolio cells. For those segregated portfolio cells in which the Company participates, the Company shares in the operating and investment results of those cells and recognizes its share of the segregated portfolio dividend in the consolidated statements of operations and comprehensive income (loss). The Company’s share of the segregated portfolio dividend totaled $568, $(6) and $985 for the years ended December 31, 2011, 2010 and 2009, respectively, and is included in the corporate/other segment.
Corporate/Other
The corporate/other segment primarily includes the expenses of the holding company, the third party administration activities of the Company, and the results of operations of Eastern Re, as well as certain eliminations necessary to reconcile the segment information to the consolidated statements of operations and comprehensive income (loss). The Company cancelled the remaining reinsurance contracts at Eastern Re in 1999 on a run-off basis and continues to have exposure for outstanding claims as of December 31, 2011. The corporate/other segment also includes the Company’s 10% interest in a segregated portfolio cell with an unaffiliated primary carrier that writes insurance coverage for sprinkler contractors, known as “SprinklerPro”. The Company non-renewed the contract for its 10% interest in SprinklerPro on a run-off basis effective April 1, 2009.
The following table represents the segment results for the year ended December 31, 2011 (in thousands):
| | | | | | | | | | | | | | | | |
| | | Workers’
Compensation
Insurance | | | Segregated
Portfolio Cell
Reinsurance | | | Corporate/
Other | | | Total | |
Revenue: | | | | | | | | | | | | | | | | |
Net premiums earned | | $ | 103,668 | | | $ | 28,505 | | | $ | — | | | $ | 132,173 | |
Net investment income | | | 3,317 | | | | 420 | | | | (39 | ) | | | 3,698 | |
Change in equity interest in limited partnerships | | | (18 | ) | | | — | | | | 23 | | | | 5 | |
Net realized investment gains | | | 1,360 | | | | 33 | | | | 261 | | | | 1,654 | |
Other revenue | | | — | | | | — | | | | 425 | | | | 425 | |
| | | | | | | | | | | | | | | | |
Total revenue | | | 108,327 | | | | 28,958 | | | | 670 | | | | 137,955 | |
| | | | | | | | | | | | | | | | |
Expenses: | | | | | | | | | | | | | | | | |
Losses and LAE incurred | | | 67,802 | | | | 15,920 | | | | — | | | | 83,722 | |
Acquisition and other underwriting expenses | | | 7,035 | | | | 8,582 | | | | (2,126 | ) | | | 13,491 | |
Other expenses | | | 16,844 | | | | 390 | | | | 7,863 | | | | 25,097 | |
Amortization of intangibles | | | — | | | | — | | | | 1,026 | | | | 1,026 | |
Policyholder dividend expense | | | 1,331 | | | | 29 | | | | — | | | | 1,360 | |
Segregated portfolio dividend expense | | | — | | | | 4,037 | | | | (568 | ) | | | 3,469 | |
| | | | | | | | | | | | | | | | |
Total expenses | | | 93,012 | | | | 28,958 | | | | 6,195 | | | | 128,165 | |
| | | | | | | | | | | | | | | | |
Income (loss) from continuing operations before income taxes | | | 15,315 | | | | — | | | | (5,525 | ) | | | 9,790 | |
Income tax expense (benefit) from continuing operations | | | 5,083 | | | | — | | | | (2,647 | ) | | | 2,436 | |
| | | | | | | | | | | | | | | | |
Net income (loss) from continuing operations | | $ | 10,232 | | | $ | — | | | $ | (2,878 | ) | | $ | 7,354 | |
| | | | | | | | | | | | | | | | |
Total assets from continuing operations | | $ | 301,673 | | | $ | 59,307 | | | $ | (15,301 | ) | | $ | 345,679 | |
| | | | | | | | | | | | | | | | |
88
The following table represents the segment results for the year ended December 31, 2010 (in thousands):
| | | | | | | | | | | | | | | | |
| | | Workers’
Compensation
Insurance | | | Segregated
Portfolio Cell
Reinsurance | | | Corporate/
Other | | | Total | |
Revenue: | | | | | | | | | | | | | | | | |
Net premiums earned | | $ | 84,447 | | | $ | 24,705 | | | $ | — | | | $ | 109,152 | |
Net investment income | | | 2,421 | | | | 556 | | | | 388 | | | | 3,365 | |
Change in equity interest in limited partnerships | | | 891 | | | | — | | | | 161 | | | | 1,052 | |
Net realized investment gains (losses) | | | 2,479 | | | | 1,065 | | | | (79 | ) | | | 3,465 | |
Other revenue | | | — | | | | — | | | | 582 | | | | 582 | |
| | | | | | | | | | | | | | | | |
Total revenue | | | 90,238 | | | | 26,326 | | | | 1,052 | | | | 117,616 | |
| | | | | | | | | | | | | | | | |
Expenses: | | | | | | | | | | | | | | | | |
Losses and LAE incurred | | | 59,275 | | | | 18,299 | | | | — | | | | 77,574 | |
Acquisition and other underwriting expenses | | | 5,330 | | | | 7,547 | | | | (1,603 | ) | | | 11,274 | |
Other expenses | | | 15,416 | | | | 251 | | | | 6,370 | | | | 22,037 | |
Amortization of intangibles | | | — | | | | — | | | | 1,284 | | | | 1,284 | |
Policyholder dividend expense | | | 1,040 | | | | 6 | | | | — | | | | 1,046 | |
Segregated portfolio dividend expense | | | — | | | | 223 | | | | 6 | | | | 229 | |
| | | | | | | | | | | | | | | | |
Total expenses | | | 81,061 | | | | 26,326 | | | | 6,057 | | | | 113,444 | |
| | | | | | | | | | | | | | | | |
Income (loss) from continuing operations before income taxes | | | 9,177 | | | | — | | | | (5,005 | ) | | | 4,172 | |
Income tax expense (benefit) from continuing operations | | | 2,849 | | | | — | | | | (1,607 | ) | | | 1,242 | |
| | | | | | | | | | | | | | | | |
Net income (loss) from continuing operations | | $ | 6,328 | | | $ | — | | | $ | (3,398 | ) | | $ | 2,930 | |
| | | | | | | | | | | | | | | | |
Total assets from continuing operations | | $ | 264,267 | | | $ | 55,803 | | | $ | 2,594 | | | $ | 322,664 | |
| | | | | | | | | | | | | | | | |
The following table represents the segment results for the year ended December 31, 2009 (in thousands):
| | | | | | | | | | | | | | | | |
| | | Workers’
Compensation
Insurance | | | Segregated
Portfolio Cell
Reinsurance | | | Corporate/
Other | | | Total | |
Revenue: | | | | | | | | | | | | | | | | |
Net premiums earned | | $ | 73,213 | | | $ | 24,703 | | | $ | — | | | $ | 97,916 | |
Net investment income | | | 3,313 | | | | 691 | | | | 449 | | | | 4,453 | |
Change in equity interest in limited partnerships | | | 845 | | | | — | | | | 221 | | | | 1,066 | |
Net realized investment (losses) gains | | | (237 | ) | | | (625 | ) | | | 23 | | | | (839 | ) |
Other revenue | | | — | | | | — | | | | 643 | | | | 643 | |
| | | | | | | | | | | | | | | | |
Total revenue | | | 77,134 | | | | 24,769 | | | | 1,336 | | | | 103,239 | |
| | | | | | | | | | | | | | | | |
Expenses: | | | | | | | | | | | | | | | | |
Losses and LAE incurred | | | 43,843 | | | | 14,923 | | | | — | | | | 58,766 | |
Acquisition and other underwriting expenses | | | 6,207 | | | | 7,500 | | | | (1,455 | ) | | | 12,252 | |
Other expenses | | | 13,754 | | | | 244 | | | | 6,509 | | | | 20,507 | |
Amortization of intangibles | | | — | | | | — | | | | 1,732 | | | | 1,732 | |
Policyholder dividend expense | | | 432 | | | | (121 | ) | | | — | | | | 311 | |
Segregated portfolio dividend expense | | | — | | | | 2,223 | | | | (985 | ) | | | 1,238 | |
| | | | | | | | | | | | | | | | |
Total expenses | | | 64,236 | | | | 24,769 | | | | 5,801 | | | | 94,806 | |
| | | | | | | | | | | | | | | | |
Income (loss) from continuing operations before income taxes | | | 12,898 | | | | — | | | | (4,465 | ) | | | 8,433 | |
Income tax expense (benefit) from continuing operations | | | 3,778 | | | | — | | | | (1,276 | ) | | | 2,502 | |
| | | | | | | | | | | | | | | | |
Net income (loss) from continuing operations | | $ | 9,120 | | | $ | — | | | $ | (3,189 | ) | | $ | 5,931 | |
| | | | | | | | | | | | | | | | |
Total assets from continuing operations | | $ | 243,855 | | | $ | 57,382 | | | $ | (19,123 | ) | | $ | 282,114 | |
| | | | | | | | | | | | | | | | |
89
17. Commitments and Contingencies
AIG Arbitration
On September 6, 2011, the Company served a written demand (the “Arbitration Demand”) initiating arbitration proceedings against various AIG Companies under 24 reinsurance treaties pursuant to which the Company reinsured AIG Companies for certain pollution liability risks related to underground storage tanks for the policy years 1990 through 1999 (the “Treaties”). The Treaties were cancelled by the Eastern Re in 1999. In the Arbitration Demand, the Company seeks an award from the arbitration panel compelling AIG Companies to permit the Company to audit the books and records of AIG Companies relevant to the Treaties, among other reasons, to enable the Company to examine the bases for certain paid losses and loss reserves ceded by AIG Companies to Eastern Re under the Treaties. The Company believes that the Treaties permit such an audit (and the Company’s prior requests have been denied by AIG Companies).
On October 3, 2011, AIG Companies responded to the Arbitration Demand by advising that they will seek an award from the arbitration panel of approximately $1.9 million plus future amounts that may become due under the Treaties before the final hearing in the arbitration. Both the Company and AIG Companies seek attorney’s fees and costs in the arbitration.
At this stage of the proceedings, both the Company and AIG Companies have appointed arbitrators. The parties are currently in the process of attempting to select an umpire.
While the Company believes it has adequately reserved the claims at issue in the arbitration, and that it is entitled to the relief it requested in the arbitration, it is reasonably possible that the final outcome of the arbitration could go against the Company.
Lease Commitments
The Company’s corporate headquarters are located at 25 Race Avenue in Lancaster, Pennsylvania. The Company leases its home office building under a 15-year, non-cancelable operating lease through February 2017. The annual base rent is subject to an annual increase based upon the consumer price index at the end of each preceding calendar year. In addition to the base rent, the Company is responsible for its proportionate share of expenses related to the building including, but not limited to, utilities, maintenance, real estate taxes, and insurance. The Company has a 5% interest in the limited partnership that owns the building.
The Company maintains regional offices in North Carolina, Indiana, Tennessee and Wexford, Pennsylvania and leases office space in each of these locations under multi-year operating leases.
Minimum monthly lease commitments for the remainder of the office lease terms are as follows (in thousands):
| | | | |
2012 | | $ | 1,314 | |
2013 | | | 1,226 | |
2014 | | | 1,216 | |
2015 | | | 1,182 | |
2016 | | | 1,172 | |
2017 thereafter | | | 137 | |
| | | | |
Total | | $ | 6,247 | |
| | | | |
Rent expense totaled $1,214, $918, and $1,084 for the years ended December 31, 2011, 2010 and 2009, respectively.
18. Related Party Transactions
The Company has an agreement with Alliance Impairment Management, Inc. (“AIM”), which provides case management services to certain of the Company’s insurance subsidiaries. For the years ended December 31, 2011, 2010, and 2009, the Company paid fees to AIM totaling approximately $3,700, $3,200 and $2,600, respectively. Bruce Eckert, the Company’s Vice Chairman (Chief Executive Officer as of December 31, 2010), is an investor in AIM.
90
19. Subsequent Events
Management performed an evaluation of subsequent events and determined there were no recognized or unrecognized subsequent events that would require an adjustment and/or additional disclosure in the consolidated financial statements as of December 31, 2011.
20. Quarterly Financial Data (Unaudited, in thousands, except per share data)
| | | | | | | | | | | | | | | | |
2011 | | March 31 | | | June 30 | | | September 30 | | | December 31 | |
Total revenue from continuing operations | | $ | 32,466 | | | $ | 34,264 | | | $ | 33,356 | | | $ | 37,869 | |
Income from continuing operations | | $ | 2,721 | | | $ | 2,871 | | | $ | 945 | | | $ | 3,253 | |
Net income from continuing operations | | $ | 1,880 | | | $ | 1,990 | | | $ | 656 | | | $ | 2,828 | |
Basic earnings per share from continuing operations | | $ | 0.22 | | | $ | 0.25 | | | $ | 0.08 | | | $ | 0.38 | |
Diluted earnings per share from continuing operations | | $ | 0.22 | | | $ | 0.25 | | | $ | 0.08 | | | $ | 0.36 | |
| | | | | | | | | | | | | | | | |
2010 | | March 31 | | | June 30 | | | September 30 | | | December 31 | |
Total revenue from continuing operations | | $ | 27,604 | | | $ | 25,934 | | | $ | 31,565 | | | $ | 32,513 | |
Income from continuing operations | | $ | 1,466 | | | $ | 155 | | | $ | 1,900 | | | $ | 651 | |
Net income from continuing operations | | $ | 945 | | | $ | 279 | | | $ | 1,168 | | | $ | 538 | |
Basic earnings per share from continuing operations | | $ | 0.10 | | | $ | 0.03 | | | $ | 0.13 | | | $ | 0.08 | |
Diluted earnings per share from continuing operations | | $ | 0.10 | | | $ | 0.03 | | | $ | 0.13 | | | $ | 0.08 | |
91
Item 9—Changes in and Disagreements with Accountants on Accounting and Financial Disclosure
None
Item 9A—Controls and Procedures
| | a) | Evaluation of Disclosure Controls and Procedures. |
Our disclosure controls and procedures, as that term is defined in Rule 13a-15(e) of the Securities Exchange Act of 1934, as amended (the “Exchange Act”), are designed with the objective of providing reasonable assurance that information required to be disclosed in our reports filed or submitted under the Exchange Act, such as this report, is recorded, processed, summarized and reported within the time periods specified in the rules and forms of the Securities and Exchange Commission (the “SEC”). In designing and evaluating our disclosure controls and procedures, our management recognizes that any disclosure controls and procedures, no matter how well designed and operated, can provide only reasonable, rather than absolute, assurance of achieving the desired control objectives.
An evaluation was performed by our management, with the participation of our chief executive officer (“CEO”) and chief financial officer (“CFO”), of the effectiveness of the design and operation of our disclosure controls and procedures as of the end of the period covered by this report. Based on this evaluation, our CEO and CFO have concluded that, as of the end of such period, our disclosure controls and procedures are effective to provide reasonable assurance that information required to be disclosed in the reports that we file or submit under the Exchange Act is recorded, processed, summarized and reported, within the time periods specified in the SEC’s rules and forms and made known to our management, including our CEO and CFO, as appropriate, to allow timely decisions regarding required disclosures.
| | b) | Changes in Internal Controls. |
There have been no changes in EIHI’s internal control over financial reporting identified in connection with the evaluation described in the above paragraph that have materially affected, or are reasonably likely to materially affect, EIHI’s internal control over financial reporting.
| | (c) | Management’s Report on Internal Control Over Financial Reporting. |
Our management is responsible for establishing and maintaining adequate internal control over financial reporting, as such term is defined in Rule 13a-15(f) under the Exchange Act. Under the supervision and with the participation of our management, including the principal executive officer and principal financial officer, we have conducted an evaluation of the effectiveness of our internal control over financial reporting based on the framework in Internal Control—Integrated Framework issued by the Committee of Sponsoring Organizations of the Treadway Commission. Based on this evaluation under the framework in Internal Control-Integrated Framework, we have concluded that the internal control over financial reporting was effective as of December 31, 2011.
Because of its inherent limitations, internal control over the financial reporting may not prevent or detect misstatements. Projections of any evaluation of effectiveness to future periods are subject to the risk that controls may become inadequate because of changes in conditions, or that the degree of compliance with the policies or procedures may deteriorate.
The Report of Independent Registered Public Accounting Firm on internal control over financial reporting is included in this Annual Report on Form 10-K immediately before the consolidated financial statements.
Item 9B—Other Information
None
92
PART III
Item 10—Directors and Officers of the Registrant
Incorporated by reference from the Company’s 2012 Proxy Statement.
Item 11—Executive Compensation
Incorporated by reference from the Company’s 2012 Proxy Statement.
Item 12—Security Ownership of Certain Beneficial Owners and Management and Related Stockholder Matters
Incorporated by reference from the Company’s 2012 Proxy Statement.
Item 13—Certain Relationships and Related Transactions
Incorporated by reference from the Company’s 2012 Proxy Statement.
Item 14—Principal Accountant Fees and Services
Incorporated by reference from the Company’s 2012 Proxy Statement.
93
Part IV
Item 15—Exhibits, Financial Statement Schedules
| | a) | (1) Financial Statements. |
The following consolidated financial statements are filed as part of this report in Item 8:
Consolidated Financial Statements
Consolidated Balance Sheets as of December 31, 2011 and 2010
Consolidated Statements of Operations and Comprehensive Income (Loss) for Years Ended December 31, 2011, 2010 and 2009
Consolidated Statements of Changes in Shareholders’ Equity for Years Ended December 31, 2011, 2010 and 2009
Consolidated Statements of Cash Flows for Years Ended December 31, 2011, 2010 and 2009
Notes to Consolidated Financial Statements
(2)Financial Statement Schedules.
The following financial statement schedules for the years 2011, 2010 and 2009 are submitted herewith:
Schedule I—Summary of Investments
Schedule II—Condensed Financial Information of Parent Company
Schedule III—Supplementary Schedule Information
Schedule IV—Reinsurance
Schedule VI—Supplemental Information
The information required by Schedule V—Allowance for Uncollectible Premiums and Other Receivables has been included within the consolidated financial statements or notes thereto.
(3) Exhibits.
94
SIGNATURES
Pursuant to the requirements of Section 13 or 15(d) of the Securities Exchange Act of 1934, the registrant has duly caused this report to be signed on its behalf by the undersigned, thereunto duly authorized.
| | | | |
| | EASTERN INSURANCE HOLDINGS, INC. |
| | |
| March 12, 2012 | | By: | | /s/ KEVIN M. SHOOK |
| | | | Kevin M. Shook, Executive Vice President, Treasurer and Chief Financial Officer |
Pursuant to the requirements of the Securities Exchange Act of 1934, this report has been signed by the following persons in the capacities indicated on the date indicated:
| | | | |
Signature | | | | |
| | |
/s/ MICHAEL L. BOGUSKI Michael L. Boguski | | President and Chief Executive Officer (Principal Executive Officer) and Director | | March 12, 2012 |
| | |
/s/ KEVIN M. SHOOK Kevin M. Shook | | Executive Vice President, Treasurer and Chief Financial Officer (Principal Financial and Accounting Officer) | | March 12, 2012 |
| | |
/s/ ROBERT M. MCALAINE Robert M. McAlaine | | Chairman and Director | | March 12, 2012 |
| | |
/s/ BRUCE M. ECKERT Bruce M. Eckert | | Director | | March 12, 2012 |
| | |
/s/ PAUL R. BURKE Paul R. Burke | | Director | | March 12, 2012 |
| | |
/s/ RONALD L. KING Ronald L. King | | Director | | March 12, 2012 |
| | |
/s/ SCOTT C. PENWELL Scott C. Penwell | | Director | | March 12, 2012 |
| | |
/s/ W. LLOYD SNYDER III W. Lloyd Snyder III | | Director | | March 12, 2012 |
| | |
/s/ CHARLES H. VETTERLEIN, JR. Charles H. Vetterlein, Jr. | | Director | | March 12, 2012 |
95
EXHIBIT INDEX
| | |
Exhibit
Number | | Description |
| 2.1 | | Agreement and Plan of Merger by and among Eastern Insurance Holdings, Inc., Eastern Acquisition Corp. and Employers Security Holding Company, dated as of August 6, 2008. (Incorporated by reference from Exhibit 2.1 to the Eastern Insurance Holdings, Inc. Current Report on Form 8-K filed on August 7, 2008) |
| |
| 2.2 | | Agreement and Plan of Merger among Security American Financial Enterprises, Inc., Security Life Insurance Company of America, Eastern Insurance Holdings, Inc., and Eastern Life and Health Insurance Company dated as of May 4, 2010 (Incorporated by reference from Exhibit 2.1 to the Eastern Insurance Holdings, Inc. Form 8-k filed on May 4, 2010). |
| |
| 2.3 | | Stock Purchase Agreement by and among Eastern Atlantic Holdings Ltd., Eastern Insurance Holdings, Inc., and Eastern Re Ltd., SPC, dated as of December 9, 2010 (Incorporated by reference from Exhibit 2.1 to the Eastern Insurance Holdings, Inc. Form 8-K filed on December 9, 2010) |
| |
| 3.1 | | Articles of Incorporation of Eastern Insurance Holdings, Inc. (as filed as Exhibit 3.1 to the Eastern Insurance Holdings, Inc. Registration Statement No. 333-128913 on Form S-1) (**) |
| |
| 3.2 | | Bylaws of Eastern Insurance Holdings, Inc. (as filed as Exhibit 3.2 to the Eastern Insurance Holdings, Inc. Registration Statement No. 333-128913 on Form S-1) (**) |
| |
| 4.1 | | Form of Stock Certificate of Eastern Insurance Holdings, Inc. (as filed as Exhibit 4.1 to the Eastern Insurance Holdings, Inc. Registration Statement No. 333-128913 on Form S-1) (**) |
| |
| 10.1 | | Eastern Insurance Holdings, Inc. Management Annual Incentive Plan (Incorporated by reference from Incorporated by reference from Exhibit 10.3 to EIHI’s Current Report on Form 8-K filed on August 19, 2010) (*) |
| |
| 10.2 | | Employee Stock Ownership Plan of Eastern Insurance Holdings, Inc. (as filed as Exhibit 10.2 to the Eastern Insurance Holdings, Inc. Registration Statement No. 333-128913 on Form S-1) (*) (**) |
| |
| 10.3 | | Employment Agreement, as amended effective August 23, 2010, between Eastern Services Corporation and Bruce M. Eckert (Incorporated by reference from Exhibit 10.1 to EIHI’s Current Report on Form 8-K filed on August 19, 2010) (*) |
| |
| 10.4 | | Employment Agreement, as amended effective August 23, 2010, between Eastern Services Corporation and Michael L. Boguski (Incorporated by reference from Exhibit 10.2 to EIHI’s Current Report on Form 8-K filed on August 19, 2010) (*) |
| |
| 10.5 | | Employment Agreement, as amended effective December 17, 2008, between Eastern Services Corporation and Kevin M. Shook (filed herewith as Exhibit 10.5) (*) (**) |
| |
| 10.6 | | Employment Agreement, as amended effective December 17, 2008, between Eastern Services Corporation and Robert A. Gilpin (filed herewith as Exhibit 10.6) (*) (**) |
| |
| 10.7 | | Employment Agreement, as amended effective December 17, 2008, between Eastern Services Corporation and Suzanne M. Emmet (filed herewith as Exhibit 10.7) (*) (**) |
| |
| 10.8 | | Eastern Insurance Holdings, Inc. 2006 Stock Incentive Plan (Incorporated by reference from Exhibit 4.1 to EIHI’s Registration Statement on Form S-8 filed on April 2, 2007) (*) |
| |
| 10.9 | | Amended and Restated Loan Agreement, effective December 21, 2011, between Eastern Insurance Holdings, Inc. and Fulton Bank, N.A. (filed herewith as Exhibit 10.9) (**) |
| |
| 14.1 | | Eastern Insurance Holdings, Inc. Code of Conduct and Ethics (Incorporated by reference from Exhibit 14 to EIHI’s Current Report on Form 8-K filed on February 14, 2008) |
| |
| 21.1 | | Subsidiaries of Eastern Insurance Holdings, Inc. (filed herewith as Exhibit 21.1) (**) |
| |
| 23.1 | | Consent of PricewaterhouseCoopers LLP, dated March 12, 2012 (filed herewith as Exhibit 23.1) (**) |
| |
| 31.1 | | Certification of Chief Executive Officer in accordance with Section 302 of the Sarbanes-Oxley Act of 2002 (filed herewith) (**) |
96
| | |
Exhibit
Number | | Description |
| 31.2 | | Certification of Chief Financial Officer in accordance with Section 302 of the Sarbanes-Oxley Act of 2002 (filed herewith) (**) |
| |
| 32.1 | | Certification of Chief Executive Officer in accordance with Section 906 of the Sarbanes-Oxley Act of 2002 (filed herewith) (**) |
| |
| 32.2 | | Certification of Chief Financial Officer in accordance with Section 906 of the Sarbanes-Oxley Act of 2002 (filed herewith) (**) |
| |
| 101 | | Interactive data files pursuant to Rule 405 of Regulation S-T: (i) the Consolidated Balance Sheets as of December 31, 2011 and 2010, (ii) the Consolidated Statements of Operations and Comprehensive Income (Loss) for the years ended December 31, 2011, 2010 and 2009, (iii) the Consolidated Statements of Changes in Shareholders’ Equity for the years ended December 31, 2011, 2010 and 2009, (iv) the Consolidated Statements of Cash Flows for the years ended December 31, 2011, 2010 and 2009, and (v) the Notes to Consolidated Financial Statements, tagged as blocks of text. |
| (*) | Denotes management contract or compensatory plan or arrangement. |
97
Eastern Insurance Holdings, Inc. and Subsidiaries
Schedule I—Summary of Investments—Other than
Investments in Related Parties as of December 31, 2011
| | | | | | | | | | | | |
Column A | | Column B | | | Column C | | | Column D | |
Type of Investment | | Cost | | | Market
Value | | | Balance
Sheet | |
| | | (Dollars in thousands) | |
Fixed maturities: | | | | | | | | | | | | |
Bonds: | | | | | | | | | | | | |
United States Government and government agencies and authorities | | $ | 15,524 | | | $ | 16,143 | | | $ | 16,143 | |
States, municipalities and political subdivisions | | | 39,904 | | | | 42,316 | | | | 42,316 | |
Convertibles and bonds with warrants attached | | | 16,856 | | | | 17,574 | | | | 17,574 | |
All other corporate bonds | | | 73,191 | | | | 74,963 | | | | 74,963 | |
| | | | | | | | | | | | |
Total fixed maturities | | | 145,475 | | | | 150,996 | | | | 150,996 | |
| | | | | | | | | | | | |
Equity securities: | | | | | | | | | | | | |
Common stocks: | | | | | | | | | | | | |
Industrial, miscellaneous and all other | | | 16,566 | | | | 17,629 | | | | 17,629 | |
| | | | | | | | | | | | |
Total equity securities | | | 16,566 | | | | 17,629 | | | | 17,629 | |
| | | | | | | | | | | | |
Other long-term investments | | | 8,100 | | | | 10,209 | | | | 10,209 | |
| | | | | | | | | | | | |
Total investments | | $ | 170,141 | | | $ | 178,834 | | | $ | 178,834 | |
| | | | | | | | | | | | |
98
Eastern Insurance Holdings, Inc.
Schedule II—Condensed Financial Information of Parent Company
Condensed Balance Sheets
December 31, 2011 and 2010
(In thousands, except share data)
| | | | | | | | |
| | | 2011 | | | 2010 | |
| ASSETS | | | | | | | | |
Investment in common stock of subsidiaries (1) | | $ | 106,509 | | | $ | 95,111 | |
Cash and cash equivalents | | | 575 | | | | 1,649 | |
Fixed income securities, at estimated fair value (amortized cost, $1,415; $17,044) | | | 1,460 | | | | 17,022 | |
Equity securities, at estimated fair value (cost, $251; $251) | | | 404 | | | | 354 | |
Intangible assets | | | 5,137 | | | | 6,163 | |
Goodwill | | | 10,752 | | | | 10,752 | |
Federal income taxes recoverable | | | 176 | | | | 181 | |
Other assets | | | 5,742 | | | | 5,999 | |
Due from subsidiaries, net | | | 43 | | | | — | |
| | | | | | | | |
Total assets | | $ | 130,798 | | | $ | 137,231 | |
| | | | | | | | |
| LIABILITIES AND STOCKHOLDERS’ EQUITY | | | | | | | | |
Liabilities: | | | | | | | | |
Accounts payable and accrued expenses | | $ | 2,100 | | | $ | 1,060 | |
Deferred tax liability, net | | | 439 | | | | 1,144 | |
Due to subsidiaries, net | | | — | | | | 316 | |
| | | | | | | | |
Total liabilities | | | 2,539 | | | | 2,520 | |
| | | | | | | | |
Equity: | | | | | | | | |
Series A preferred stock, par value $0; authorized shares—5,000,000; no shares issued and outstanding | | | — | | | | — | |
Common stock, par value $0, authorized shares—20,000,000; issued—11,786,014 and 11,784,514, respectively; outstanding—7,935,446 and 8,964,344, respectively | | | — | | | | — | |
Unearned ESOP compensation | | | (3,364 | ) | | | (4,111 | ) |
Additional paid-in capital | | | 116,272 | | | | 114,472 | |
Treasury stock, at cost (3,850,568 and 2,820,170 shares, respectively) | | | (54,109 | ) | | | (40,835 | ) |
Accumulated other comprehensive income: | | | | | | | | |
Unrealized gains in investments, net of taxes | | | 3,817 | | | | 4,425 | |
Unrecognized benefit plan gains, net of taxes | | | (1,267 | ) | | | (604 | ) |
Retained Earnings | | | 66,910 | | | | 61,364 | |
| | | | | | | | |
Total stockholders’ equity | | | 128,259 | | | | 134,711 | |
| | | | | | | | |
Total liabilities and stockholders’ equity | | $ | 130,798 | | | $ | 137,231 | |
| | | | | | | | |
| (1) | Uses proportionate share of subsidiaries’ net assets method. |
See accompanying notes to consolidated financial statements.
99
Eastern Insurance Holdings, Inc.
Schedule II—Condensed Financial Information of Parent Company
Condensed Statement of Earnings
For the Years Ended December 31, 2011, 2010 and 2009
(In thousands)
| | | | | | | | | | | | |
| | | 2011 | | | 2010 | | | 2009 | |
Revenue | | | | | | | | | | | | |
Investment income, net of expenses | | $ | 506 | | | $ | 380 | | | $ | 424 | |
Net realized investment gains | | | 212 | | | | 1,008 | | | | 105 | |
| | | | | | | | | | | | |
Total revenue | | | 718 | | | | 1,388 | | | | 529 | |
| | | | | | | | | | | | |
Expenses: | | | | | | | | | | | | |
Other expenses | | | 3,858 | | | | 4,203 | | | | 3,512 | |
Amortization of intangibles | | | 1,026 | | | | 1,284 | | | | 1,732 | |
| | | | | | | | | | | | |
Total expenses | | | 4,884 | | | | 5,487 | | | | 5,244 | |
| | | | | | | | | | | | |
Loss before income tax expense | | | (4,166 | ) | | | (4,099 | ) | | | (4,715 | ) |
Income tax benefit | | | (2,352 | ) | | | (871 | ) | | | (1,276 | ) |
| | | | | | | | | | | | |
Loss before equity in income of subsidiaries | | | (1,814 | ) | | | (3,228 | ) | | | (3,439 | ) |
Equity in income (loss) of subsidiaries | | | 9,536 | | | | (5,957 | ) | | | 11,840 | |
| | | | | | | | | | | | |
Net income (loss) | | $ | 7,722 | | | $ | (9,185 | ) | | $ | 8,401 | |
| | | | | | | | | | | | |
See accompanying notes to consolidated financial statements.
100
Eastern Insurance Holdings, Inc.
Schedule II—Condensed Financial Information of Parent Company
Condensed Statements of Cash Flows
For the Years ended December 31, 2011, 2010 and 2009
(In thousands)
| | | | | | | | | | | | |
| | | 2011 | | | 2010 | | | 2009 | |
Cash flows from operating activities: | | | | | | | | | | | | |
Net income (loss) | | $ | 7,722 | | | $ | (9,185 | ) | | $ | 8,401 | |
Adjustments to reconcile net income (loss) to net cash provided by operating activities: | | | | | | | | | | | | |
Equity in undistributed (income) loss of subsidiaries | | | (9,536 | ) | | | 5,957 | | | | (11,840 | ) |
Dividends from subsidiaries (1) | | | — | | | | — | | | | 25,750 | |
Gain on sale of investments | | | (212 | ) | | | (1,008 | ) | | | — | |
Stock compensation | | | 2,524 | | | | 2,148 | | | | 2,025 | |
Intangible asset amortization | | | 1,026 | | | | 1,284 | | | | 1,732 | |
Deferred income tax provision | | | (301 | ) | | | (272 | ) | | | (338 | ) |
Other | | | (172 | ) | | | (102 | ) | | | (951 | ) |
| | | | | | | | | | | | |
Net cash provided by (used in) operating activities | | | 1,051 | | | | (1,178 | ) | | | 24,779 | |
| | | | | | | | | | | | |
Cash flows from investing activities: | | | | | | | | | | | | |
Purchase of fixed income securities | | | (1,272 | ) | | | (25,684 | ) | | | — | |
Purchase of equity securities | | | — | | | | (9 | ) | | | — | |
Proceeds from sale of fixed income securities | | | 16,242 | | | | 8,330 | | | | — | |
Proceeds from maturities/calls of fixed income securities | | | 718 | | | | 213 | | | | — | |
Merger of Eastern Holding Company. Ltd. into EIHI | | | — | | | | 136 | | | | | |
Capital contributions to subsidiaries | | | (2,387 | ) | | | (2,658 | ) | | | (23,015 | ) |
Sale of Eastern Life | | | — | | | | 32,352 | | | | — | |
| | | | | | | | | | | | |
Net cash provided by (used in) investing activities | | | 13,301 | | | | 12,680 | | | | (23,015 | ) |
| | | | | | | | | | | | |
Cash flows from financing activities: | | | | | | | | | | | | |
Repurchase of common stock | | | (13,274 | ) | | | (8,169 | ) | | | (11 | ) |
Shareholder dividends | | | (2,176 | ) | | | (2,489 | ) | | | (2,540 | ) |
Tax expense related to equity awards | | | 24 | | | | 23 | | | | — | |
| | | | | | | | | | | | |
Net cash used in financing activities | | | (15,426 | ) | | | (10,635 | ) | | | (2,551 | ) |
| | | | | | | | | | | | |
Net (decrease) increase in cash and cash equivalents | | | (1,074 | ) | | | 867 | | | | (787 | ) |
Cash and cash equivalents at beginning of period | | | 1,649 | | | | 782 | | | | 1,569 | |
| | | | | | | | | | | | |
Cash and cash equivalents at end of period | | $ | 575 | | | $ | 1,649 | | | $ | 782 | |
| | | | | | | | | | | | |
Cash received during the year for: | | | | | | | | | | | | |
Income taxes | | $ | 1,896 | | | $ | 900 | | | $ | 232 | |
| (1) | During 2009, Eastern Alliance, Allied Eastern and Eastern Life paid dividends to EIHI in the amount of $10,000, $2,000 and $13,000, respectively. During 2009, EIHI also received a dividend of $750 from one of the segregated portfolio cells for which it is a preferred shareholder. The dividends from Eastern Alliance, Allied Eastern and Eastern Life were primarily for the purpose of funding the capital contribution to Eastern Re in 2009. |
See accompanying notes to consolidated financial statements.
101
Eastern Insurance Holdings, Inc. and Subsidiaries
Schedule III—Supplementary Schedule Information
(In thousands)
| | | | | | | | | | | | | | | | | | | | |
Column A | | Column B | | | Column C | | | Column D | | | Column E | | | Column F | |
| | | Deferred
Policy
Acquisition
Costs | | | Future Policy
Benefits,
Losses, Claims,
and Loss
Expenses | | | Unearned
Premiums | | | Other Policy
Claims and
Benefits
Payable | | | Premium
Revenue | |
December 31, 2011 | | | | | | | | | | | | | | | | | | | | |
Workers’ compensation insurance | | $ | 5,428 | | | $ | 81,109 | | | $ | 49,974 | | | $ | — | | | $ | 103,668 | |
Segregated portfolio cell reinsurance | | | 3,778 | | | | 24,762 | | | | 13,458 | | | | — | | | | 28,505 | |
Corporate and other | | | — | | | | 206 | | | | — | | | | — | | | | — | |
| | | | | | | | | | | | | | | | | | | | |
Total | | $ | 9,206 | | | $ | 106,077 | | | $ | 63,432 | | | $ | — | | | $ | 132,173 | |
| | | | | | | | | | | | | | | | | | | | |
December 31, 2010 | | | | | | | | | | | | | | | | | | | | |
Workers’ compensation insurance | | $ | 4,443 | | | $ | 68,911 | | | $ | 41,629 | | | $ | — | | | $ | 84,447 | |
Segregated portfolio cell reinsurance | | | 3,278 | | | | 26,190 | | | | 11,856 | | | | — | | | | 24,705 | |
Corporate and other | | | — | | | | 862 | | | | — | | | | — | | | | — | |
| �� | | | | | | | | | | | | | | | | | | | |
Total | | $ | 7,721 | | | $ | 95,963 | | | $ | 53,485 | | | $ | — | | | $ | 109,152 | |
| | | | | | | | | | | | | | | | | | | | |
December 31, 2009 | | | | | | | | | | | | | | | | | | | | |
Workers’ compensation insurance | | $ | 3,468 | | | $ | 62,850 | | | $ | 34,969 | | | $ | — | | | $ | 73,213 | |
Segregated portfolio cell reinsurance | | | 3,019 | | | | 25,659 | | | | 11,047 | | | | — | | | | 24,703 | |
Corporate and other | | | — | | | | 1,000 | | | | — | | | | — | | | | — | |
| | | | | | | | | | | | | | | | | | | | |
Total | | $ | 6,487 | | | $ | 89,509 | | | $ | 46,016 | | | $ | — | | | $ | 97,916 | |
| | | | | | | | | | | | | | | | | | | | |
| | | | | |
| | | Column G | | | Column H | | | Column I | | | Column J | | | Column K | |
| | | Net
Investment
Income | | | Benefits,
Claims, Losses
and Settlement
Expenses | | | Amortization
of DPAC | | | Other
Operating
Expenses | | | Premiums
Written | |
December 31, 2011 | | | | | | | | | | | | | | | | | | | | |
Workers’ compensation insurance | | $ | 3,317 | | | $ | 67,802 | | | $ | 4,223 | | | $ | 20,987 | | | $ | 112,014 | |
Segregated portfolio cell reinsurance | | | 420 | | | | 15,920 | | | | 3,278 | | | | 5,723 | | | | 30,107 | |
Corporate and other | | | (39 | ) | | | — | | | | — | | | | 6,763 | | | | — | |
| | | | | | | | | | | | | | | | | | | | |
Total | | $ | 3,698 | | | $ | 83,722 | | | $ | 7,501 | | | $ | 33,473 | | | $ | 142,121 | |
| | | | | | | | | | | | | | | | | | | | |
December 31, 2010 | | | | | | | | | | | | | | | | | | | | |
Workers’ compensation insurance | | $ | 2,421 | | | $ | 59,275 | | | $ | 3,468 | | | $ | 18,318 | | | $ | 91,107 | |
Segregated portfolio cell reinsurance | | | 556 | | | | 18,299 | | | | 3,019 | | | | 4,785 | | | | 25,514 | |
Corporate and other | | | 388 | | | | — | | | | — | | | | 6,051 | | | | — | |
| | | | | | | | | | | | | | | | | | | | |
Total | | $ | 3,365 | | | $ | 77,574 | | | $ | 6,487 | | | $ | 29,154 | | | $ | 116,621 | |
| | | | | | | | | | | | | | | | | | | | |
December 31, 2009 | | | | | | | | | | | | | | | | | | | | |
Workers’ compensation insurance | | $ | 3,313 | | | $ | 43,843 | | | $ | 3,059 | | | $ | 17,334 | | | $ | 76,953 | |
Segregated portfolio cell reinsurance | | | 691 | | | | 14,923 | | | | 2,849 | | | | 4,774 | | | | 25,383 | |
Corporate and other | | | 449 | | | | — | | | | — | | | | 6,786 | | | | — | |
| | | | | | | | | | | | | | | | | | | | |
Total | | $ | 4,453 | | | $ | 58,766 | | | $ | 5,908 | | | $ | 28,894 | | | $ | 102,336 | |
| | | | | | | | | | | | | | | | | | | | |
102
Eastern Insurance Holdings, Inc. and Subsidiaries
Schedule IV—Reinsurance
For the years ended December 31, 2011, 2010 and 2009
(In thousands)
| | | | | | | | | | | | | | | | | | | | |
Column A | | Column B | | | Column C | | | Column D | | | Column E | | | Column F | |
| | | Gross
Amount | | | Ceded to
Other
Companies | | | Assumed
from Other
Companies | | | Net
Amount | | | Percentage
of Amount
Assumed to
Net | |
Premiums Earned | | | | | | | | | | | | | | | | | | | | |
For the year ended December 31, 2011 | | | | | | | | | | | | | | | | | | | | |
| | | | | |
Premiums: | | | | | | | | | | | | | | | | | | | | |
Property and liability insurance | | $ | 113,612 | | | $ | 14,660 | | | $ | 33,221 | | | $ | 132,173 | | | | 25.1 | % |
For the year ended December 31, 2010 | | | | | | | | | | | | | | | | | | | | |
| | | | | |
Premiums: | | | | | | | | | | | | | | | | | | | | |
Property and liability insurance | | $ | 90,414 | | | $ | 10,594 | | | $ | 29,332 | | | $ | 109,152 | | | | 26.9 | % |
For the year ended December 31, 2009 | | | | | | | | | | | | | | | | | | | | |
| | | | | |
Premiums: | | | | | | | | | | | | | | | | | | | | |
Property and liability insurance | | $ | 77,335 | | | $ | 8,428 | | | $ | 29,009 | | | $ | 97,916 | | | | 29.6 | % |
103
Eastern Insurance Holdings, Inc.
Schedule VI—Supplemental Information
For the year ended December 31, 2011
| | | | | | | | | | | | | | | | | | | | | | | | |
Column A | | Column B | | | Column C | | | Column D | | | Column E | | | Column F | | | Column G | |
Affiliation with Registrant | | Deferred
Policy
Acquisition
Costs | | | Reserve for
Losses and
Loss Adj.
Expenses | | | Discount if
any Deducted
in Column C | | | Unearned
Premiums | | | Net Earned
Premiums | | | Net
Investment
Income | |
| | | (Dollars in thousands) | |
Consolidated property-casualty entities: | | | | | | | | | | | | | | | | | | | | | | | | |
Year ended December 31, 2011 | | $ | 9,206 | | | $ | 106,077 | | | $ | 5,723 | | | $ | 63,432 | | | $ | 132,173 | | | $ | 3,758 | |
Year ended December 31, 2010 | | $ | 7,721 | | | $ | 95,963 | | | $ | 4,633 | | | $ | 53,485 | | | $ | 109,152 | | | $ | 2,977 | |
Year ended December 31, 2009 | | $ | 6,487 | | | $ | 89,509 | | | $ | 4,256 | | | $ | 46,016 | | | $ | 97,916 | | | $ | 4,004 | |
| | | | | | | | | | | | | | | | | | | | |
| | | Column H
Losses and LAE
Incurred | | | Column I | | | Column J | | | Column K | |
| | | Current
Period | | | Prior
Year | | | Amortization
of DPAC | | | Paid
Losses and
Adjustment
Expenses | | | Net Written
Premiums | |
| | | (Dollars in thousands) | |
Consolidated property-casualty entities: | | | | | | | | | | | | | | | | | | | | |
Year ended December 31, 2011 | | $ | 84,723 | | | $ | (1,001 | ) | | $ | 7,501 | | | $ | 77,549 | | | $ | 142,121 | |
Year ended December 31, 2010 | | $ | 76,794 | | | $ | 780 | | | $ | 6,487 | | | $ | 70,472 | | | $ | 116,621 | |
Year ended December 31, 2009 | | $ | 63,602 | | | $ | (4,836 | ) | | $ | 5,908 | | | $ | 56,927 | | | $ | 102,336 | |
104