UNITED STATES
SECURITIES AND EXCHANGE COMMISSION
Washington, DC 20549
FORM 10-K
x ANNUAL REPORT PURSUANT TO SECTION 13 OR 15(d) OF THE SECURITIES EXCHANGE ACT OF 1934
for the fiscal year ended June 30, 2007
OR
o TRANSITION REPORT PURSUANT TO SECTION 13 OR 15(d) OF THE SECURITIES EXCHANGE ACT OF 1934
for the transition period from to .
COMMISSION FILE NUMBER: 001-33461
Solera Holdings, Inc.
(Exact name of registrant as specified in its charter)
DELAWARE | | 20-4552341 |
(State or other jurisdiction of
incorporation or organization) | | (I.R.S. Employer Identification No.) |
6111 Bollinger Canyon Road, Suite 200
San Ramon, California 94583 | | (925) 866-1100 |
(Address of Principal Executive Offices,
including Zip Code) | | (Registrant’s Telephone Number,
Including Area Code) |
Securities registered pursuant to Section 12(b) of the Act:
Title of each class | | Name of exchange on which registered |
Common Stock, par value $0.01 per share | | The New York Stock Exchange |
Securities registered pursuant to Section 12(g) of the Act: None.
Indicate by check mark if the registrant is a well-known seasoned issuer, as defined in Rule 405 of the Securities Act. Yes o No x
Indicate by check mark if the registrant is not required to file reports pursuant to Section 13 or Section 15(d) of the Act. Yes o No x
Indicate by check mark whether the Registrant (1) has filed all reports required to be filed by Section 13 or 15(d) of the Securities Exchange Act of 1934 during the preceding 12 months (or for such shorter period that it was required to file such reports), and (2) has been subject to such filing requirements for the past 90 days. Yes x No o
Indicate by check mark if disclosure of delinquent filers pursuant to Item 405 of Regulation S-K is not contained herein, and will not be contained, to the best of the Registrant’s knowledge, in definitive proxy or information statements incorporated by reference in Part III of this Form 10-K or any amendment to this Form 10-K. x
Indicate by check mark whether the registrant is a large accelerated filer, an accelerated filer, or a non-accelerated filer. See definition of “accelerated filer and large accelerated filer” in Rule 12b-2 of the Exchange Act. (Check one):
Large accelerated filer o | Accelerated filer o | Non-accelerated filer x |
Indicate by check mark whether the registrant is a shell company (as defined in Rule 12b-2 of the Exchange Act). Yes o No x
The registrant consummated its initial public offering on May 16, 2007. Accordingly, as of December 31, 2006, the last day of the registrant’s most recently completed second fiscal quarter, the registrant’s common stock was not publicly traded. As of September 14, 2007, the aggregate market value of the registrant’s common stock, par value $0.01 per share, held by non-affiliates of the registrant was approximately $535.2 million (based upon the closing sale price of the common stock on that date on The New York Stock Exchange). For this purpose, all shares held by directors, executive officers and stockholders beneficially owning five percent or more of the registrant’s common stock have been treated as held by affiliates.
The number of shares of the registrant’s common stock outstanding as of as of September 14, 2007 was 64,793,563.
PART I
ITEM 1. BUSINESS
General
Our operations began in 1966, when Swiss Re Corporation founded our predecessor. Solera Holdings, LLC was founded in March 2005 by Tony Aquila, our Chief Executive Officer, and affiliates of GTCR Golder Rauner II, L.L.C., or GTCR, a private equity firm. On April 13, 2006, subsidiaries of Solera Holdings, LLC acquired our predecessor, the Claims Services Group, from Automatic Data Processing, Inc., or ADP, for approximately $1.0 billion. We refer to this acquisition in this Annual Report on Form 10-K as the Acquisition. In connection with our initial public offering in May 2007, we converted from Solera Holdings, LLC, a Delaware limited liability company, into Solera Holdings, Inc., a Delaware corporation.
The terms “we,” “us,” “our,” “our company” and “our business” collectively refer to: (1) the combined operations of the Claims Services Group for periods prior to the Acquisition, (2) the consolidated operations of Solera Holdings, LLC for the periods following the Acquisition and prior to the completion of its corporate reorganization in May 2007 and (3) the consolidated operations of Solera Holdings, Inc. as of and following the corporate reorganization in May 2007. Our fiscal year ends on June 30 of each year. Fiscal years are identified in this Annual Report on Form 10-K according to the calendar year in which they end. For example, the fiscal year ended June 30, 2007 is referred to as “fiscal 2007.” Our financial information disclosed in this Annual Report on Form 10-K under Item 1 (Business) and Item 7 (Management’s Discussion and Analysis of Financial Condition and Results of Operations) is based on the following:
Period | | | | Accounting Basis | | |
Fiscal year ended June 30, 2007, or fiscal 2007 | | Audited historical consolidated financial statements of Solera Holdings, Inc. |
Fiscal year ended June 30, 2006 (Acquisition pro forma), or fiscal 2006 (Acquisition pro forma) | | Unaudited pro forma statement of operations prepared on the basis of the requirements set forth in Article 11 of Regulation S-X promulgated under the Securities Act of 1933, as amended, giving effect to the Acquisition as if it had been completed on July 1, 2005 |
Fiscal year ended June 30, 2005 (Predecessor), or fiscal 2005 (Predecessor) | | Audited historical combined financial statements of the Claims Services Group |
Our Company
We are the leading global provider of software and services to the automobile insurance claims processing industry. Our customers include insurance companies, collision repair facilities, independent assessors and automotive recyclers. We help our customers:
· estimate the costs to repair damaged vehicles;
· determine pre-collision fair market values for vehicles damaged beyond repair;
· automate steps of the claims process;
· outsource steps of the claims process that insurance companies have historically performed internally; and
· improve their ability to monitor and manage their businesses through data reporting and analysis.
As of June 30, 2007, we served more than 55,000 customers and had operations in 49 countries with over 2,000 full-time employees. Our customers include more than 900 automobile insurance companies, 33,000 collision repair facilities, 7,000 independent assessors and 3,000 automotive recyclers. We derive revenues from many of the world’s largest automobile insurance companies, including each of the ten largest automobile insurance companies in Europe and each of the ten largest automobile insurance companies in North America.
The Automobile Insurance Claims Process
An overview of the automobile insurance claims process and its complexities provides a framework for understanding how our customers can derive value from our software and services. The automobile insurance claims process generally begins following an automobile collision and consists of the following steps:
First Notice of
Loss | | · The policyholder initiates the claim process with the insurance company. |
| · The insurance company assigns the claim to an assessor and/or a collision repair facility. |
Investigation | | · The assessor conducts interviews, examines photos and reviews police reports. |
| · The insurance company, assessor or collision repair facility estimates the cost to repair the vehicle. |
| · In the case of a heavily damaged vehicle, the assessor or collision repair facility may request a pre-accident vehicle valuation. |
Evaluation | | · The insurance company reviews the estimate and/or pre-accident valuation and confirms the results of the investigation. |
| · The insurance company may request additional information and/or require follow-up investigation. |
Decision | | · The insurance company determines whether the vehicle should be repaired or declared a total loss. |
| · Based on its evaluation, the insurance company determines who is liable for the claim and the repair or total loss amount it intends to pay. |
Settlement | | · The insurance company notifies the policyholder or the collision repair facility of the amount it intends to pay. |
| · The policyholder or collision repair facility may negotiate the final payment amount with the insurance company. |
Vehicle Repair | | · The collision repair facility repairs the vehicle if it is not a total loss. |
| · The collision repair facility purchases replacement parts from original equipment manufacturers, or OEMs, aftermarket parts makers or automotive recyclers. |
| · Further revisions to the claim payment amount may occur if additional damage or cost savings are identified. |
Payment | | · The insurance company pays the policyholder or the collision repair facility. |
2
Each of these steps consists of multiple actions requiring significant and complex interaction among several parties. For example, the investigation step generally involves insurance companies, assessors, collision repair facilities and automotive recyclers and includes conducting interviews, taking and examining photographs, obtaining and reviewing police reports and estimating repair costs. When performed manually, many of these tasks, such as the mailing of vehicle photographs or the estimating of vehicle repair costs, can be time-consuming. In addition, without an efficient means of communication that facilitates real-time access to data, claim-related negotiations can result in substantial delays and unnecessary costs.
The Automobile Insurance Claims Processing Industry
The primary participants in the automobile insurance claims processing industry are automobile insurance companies, collision repair facilities, independent assessors and automotive recyclers. We believe that our business is affected by trends associated with each of the following:
Automobile Insurance Industry
We estimate that the global automobile insurance industry processes more than 100 million claims each year, representing over $150 billion in repair costs. We believe the industry is relatively concentrated with a number of large automobile insurance companies accounting for the majority of global automobile insurance premiums. In the U.S., of the approximately 470 companies offering automobile insurance, the twenty largest providers accounted for over 70% of all automobile insurance premiums in 2006, 2005, and in 2004, the top 15 European non-life insurance companies accounted for 84% of total non-life insurance premiums.
We believe that this industry is growing due to an increasing number of vehicles on the road and an increasing percentage of vehicles that have insurance. According to industry sources, from 2003 to 2006, the worldwide number of personal and commercial vehicles grew an average of 3.5% per year, to an estimated 928 million vehicles in 2006. From 2006 to 2016, the number of worldwide personal and commercial vehicles is estimated to grow 2% to 3% per year, with forecasted annual growth of 8% in Asia-Pacific countries.
In some insurance markets, such as North America and Western Europe, automobile insurance is generally government-mandated and automated claims processing is widespread. Automobile insurance companies achieve growth in these highly competitive markets by gaining additional market share, and generally compete on price and quality of policyholder service. To remain competitive, insurance companies increasingly seek additional automated claims processing products and services to minimize costs and improve policyholder service.
In other markets, such as Eastern Europe, Latin America, China and India, automobile insurance companies are growing due primarily to an increase in the number of vehicles and emerging government regulations that require vehicles to be insured. Many automobile insurance companies in these markets process claims manually, presenting significant opportunities for them to increase their operational efficiencies.
The cost of automated claims processing software and services generally represents a relatively small portion of automobile insurance companies’ claims costs. We believe automobile insurance companies will increase their spending on automated claims processing software and services because incremental investments can result in significant cost reductions.
3
Collision Repair Industry
The collision repair industry is highly fragmented. We estimate there are approximately 100,000 collision repair facilities in our markets. The operating costs of these facilities have increased substantially over the past decade due to continued increases in vehicle diagnostic and repair technologies and changes in environmental regulations. In addition, collision repair facilities have increasingly established preferred relationships with insurance companies. These arrangements, known in the U.S. as direct repair programs, allow collision repair facilities to generate increased repair volumes through insurance company referrals. Insurance companies benefit by establishing a trusted network of collision repair facilities across which they can implement standard procedures and best practices. Insurance companies often require collision repair facilities to use specified automated claims processing software and related services to participate in their programs. We believe the combination of these factors will increase demand for our software and services that help collision repair facilities manage their workflow and increase their efficiency.
Independent Assessors
Independent assessors are often used to estimate vehicle repair costs, particularly where automobile insurance companies have chosen not to employ their own assessors or do not have a sufficient number of employee assessors and where governments mandate the use of independent assessors.
In some markets, we believe changing government regulations and improved claims technology will result in a decrease in the number of independent assessors. However, in other markets, insurance companies are reducing their employee assessor staff to contain costs, which we believe will lead to a growth in the number of independent assessors. We believe the combination of these offsetting factors will result in a modest overall increase in the number of independent assessors and, therefore, the demand for automobile insurance claims processing software and services.
Automotive Recycling Industry
The automotive recycling industry is highly fragmented with over $25 billion in estimated worldwide annual sales by over 15,000 independent salvage and recycling facilities. Participants in the automotive recycling industry are a valuable source of economical and often hard-to-find used vehicle replacement parts. In addition, this industry has become more sophisticated and technology-driven in order to keep pace with innovations in vehicle technology. Additionally, insurance companies are increasingly mandating the use of aftermarket and recycled parts to lower the costs to repair damaged vehicles. We believe these factors will result in increased demand for automobile insurance claims processing software and services, as automotive recyclers seek to manage their workflows, maximize the value of their inventories and increase efficiency.
Key Drivers of Automobile Insurance Claims Processing Demand
We believe that the principal drivers of demand for our software and services are:
Inefficiencies in the Automobile Insurance Claims Process
Claims Process Fragmentation. The automobile insurance claims process involves many parties and consists of many steps, which are often managed through paper, fax and other labor intensive processes. In a June 2004 poll conducted by a leading provider of statistical claims data to the property and casualty insurance industry, approximately 75% of U.S. insurance companies identified improving claims-handling processes as their most important goal. Key areas for improvement identified by the survey included lowering operating costs, reducing fraud and improving claims-handling efficiency. By simplifying and streamlining the claims process, insurance companies can process claims faster and reduce costs.
4
Unequal Access to Information. Collision repair facilities typically have more information about vehicles in their shops than do insurance companies who often must make their damage estimates remotely or with limited information. Through access to detailed information about vehicle damage and replacement costs, insurance companies can more accurately estimate fair settlement values and reduce overpayment on claims.
Disparate Claims Data. Claims-related data generated by automobile insurance companies often is not stored, shared with other parties or captured in a format that is easily transferable to other applications. This, combined with the inability to transfer and manipulate data easily across multiple applications, hinders comparisons of repairs and claims. Increased access to data from industry participants generates more accurate repair estimates and allows automobile insurance companies to identify top-performing collision repair facilities.
Conflicting Interests of Industry Participants. Collision repair facilities benefit from high repair costs, which increase their revenues. Conversely, insurance companies benefit from low repair costs, which reduce their expenses. This conflict can result in high settlement costs and delays. Repair cost estimates that rely on common data sources can reduce these costs and delays.
Inefficient Collision Repair Facility Workflow. Many collision repair facilities manage their complex workflows manually or without specialized software. Manual workflow management leads to increased processing time, higher costs and more errors, problems that generally intensify as a facility grows. With claims processing software and services, collision repair facilities can more effectively manage their workflows and obtain detailed part availability and pricing information.
Growth in the Automobile Insurance Claims Industry
Growth in the Number of Worldwide Vehicles. According to industry sources, from 2003 to 2006, the number of personal and commercial vehicles in use has increased an average of 3.5% per year, driven primarily by a 4% per year increase in sales of new vehicles. Additional growth of 2% to 3% per year is expected through 2016. As the number of vehicles on the road continues to expand, we believe the need for automobile insurance claims processing products and services will continue to grow to handle increased claims activity.
Adoption of Automated Claims Processing Software and Services. Many markets have only recently begun to adopt automated claims processing software and services to reduce inefficiencies. We anticipate that increased adoption of automated claims processing software and services in these markets will be a key driver of our growth.
Our Software and Services
Our software and services can be organized into five general categories: estimating and workflow software, salvage and recycling software, business intelligence and consulting services, shared services and other.
Estimating and Workflow Software
Our core offering is our estimating and workflow software. Our estimating and workflow software helps our customers manage the overall claims process, estimate the cost to repair a damaged vehicle, and calculate the pre-collision fair market value of a vehicle. Key functions of our estimating and workflow software include:
· capturing first notice of loss information;
· assigning, managing and monitoring claims and claim-related events;
5
· accessing and exchanging claims-related information;
· calculating, submitting, tracking and storing repair and total loss estimates;
· reviewing, assessing and reporting estimate variations based upon pre-set rules;
· routing shop estimates for manual review; and
· scheduling repairs.
Salvage and Recycling Software
Our salvage and recycling software helps automotive recyclers manage their inventories in order to facilitate the location, sale and exchange of vehicle parts for use in the repair of a damaged vehicle. Key functions of our salvage and recycling software include:
· managing inventory;
· connecting to collision repair facilities to facilitate the use of recycled parts in the repair of a damaged vehicle;
· locating vehicle parts by price, year, model and/or geographic area;
· determining the interchangeability of automobile parts across vehicle models;
· exchanging vehicle parts with other recyclers;
· preparing invoices and managing accounts receivable; and
· generating management reports.
Business Intelligence and Consulting Services
Our business intelligence and consulting services help our insurance company customers monitor and assess their performance through customized data, reports and analyses. Key elements of our business intelligence and consulting services include:
· analyzing claims amounts and payments;
· creating customized statistical reports on claims data and activity;
· measuring our customers’ performance against industry standards; and
· monitoring key performance indicators.
Shared Services
We have developed our shared services to help our insurance company customers outsource claims-related tasks. The key components of our shared services include:
· reviewing repair estimates prepared by collision repair facilities;
· reviewing decisions to repair or replace damaged parts;
· auditing and facilitating settlement of repair prices with collision repair facilities;
· reviewing medical and workers’ compensation bills; and
· communicating with policyholders.
6
Other
We provide additional services and products to our customers, which include selling hardware for use with our software, training, and call center technical support services. We also offer services that allow our customers to access operational and technical support in times of high demand following natural disasters and software that helps detect fraudulent activity. We also provide software and services that are not directly related to the automobile insurance claims process.
Our Databases
At the core of our software and services are our proprietary databases. Each of our databases has been adapted for use in our local markets. We have invested over $200 million in the last ten years to maintain and expand our proprietary databases. Our primary databases include our repair estimating database, our total loss database, our claims database and our parts salvage databases.
Repair Estimating Database. We have created our repair estimating database over 35 years through the development, collection, organization and management of automobile-related information. The data in this database enables our customers to estimate the cost to repair a damaged vehicle. This database:
· contains detailed cost data for each part and the required labor operations needed to complete repairs on over 3,100 vehicle types;
· covers over 95% of the vehicle models in our core markets;
· includes vehicles data dating back to 1970;
· includes over 3.3 million parts for vehicles with multiple model years, editions, option packages and country-specific variations; and
· includes over one million aftermarket parts.
We update this database with data provided to us by third parties, including OEMs and aftermarket part suppliers, along with data we develop through our proprietary analyses of local labor repair times and damage repair techniques. The quality and accuracy of the database, which are very important to each of our customers, are continuously monitored and maintained using rigorous quality control processes, which include validating up to 20 million data points every month.
Total Loss Database. Our total loss database helps our customers determine the pre-collision fair market values of vehicles that have been damaged beyond the point where repair is economically feasible, as well as the amounts they pay policyholders for total losses. Additionally, our employees use this database to provide total loss estimating service to our customers. This database has been designed to accurately reflect the local fair market value of a vehicle rather than simply delivering a market value based on national or regional averages. Each year, we collect more than 20 million vehicle purchase and sale records from over 11,000 automobile dealerships, which we have combined with local market purchase and sale data collected from over 3,500 different sources, including websites, local newspapers, magazines and private listings. We update this database by incorporating nearly two million data points per week which include the latest vehicle purchase and sale information including specific models, option packages, vehicle condition and mileage.
Claims Database. Our claims database enables our customers to evaluate their internal claims process performance, as well as measure the performance of their business partners. Our employees also use this database to provide consulting services to our customers and develop new software and services. Customers use this database to benchmark their performance against their local peer group through detailed analyses of comprehensive industry data. Compiled over the past 15 years, this database contains approximately two billion data points representing over 100 million automobile repair claims and over
7
190 billion in claims payments. We update this database by incorporating approximately 150,000 additional repair estimates every week.
Parts Salvage Databases. Our parts salvage databases contain data on approximately 130 million automobile parts through a network of approximately 3,000 automotive recyclers. These databases are used by our customers to quickly find locally available automobile parts and identify interchangeable parts across different vehicles.
Our Global Operations
We have operations in 49 countries on five continents. We have organized our operations into two regional operating segments, EMEA and Americas.
EMEA
Our EMEA operating segment accounted for 59.3% of our revenues during fiscal 2007. EMEA comprises our operations in 34 countries in Europe, the Middle East, Africa and Asia. Our EMEA segment comprises our operations and licensed independent providers in Austria, Belarus, Belgium, Bosnia, Bulgaria, China, Croatia, the Czech Republic, Denmark, Estonia, France, Germany, Greece, Hungary, India, Israel, Japan, Latvia, Lebanon, Lithuania, the Netherlands, Poland, Portugal, Romania, Russia, Serbia-Montenegro, Slovakia, Slovenia, South Africa, Spain, Switzerland, Turkey, Ukraine and the United Kingdom.
Americas
Our Americas operating segment accounted for 40.7% of our revenues during fiscal 2007. Americas comprises our operations in 15 countries in North and South America: Brazil, Canada, Chile, Colombia, Costa Rica, the Dominican Republic, Ecuador, El Salvador, Guatemala, Honduras, Mexico, Nicaragua, Panama, the U.S. and Venezuela.
Geographic Financial Information
The table below sets forth the revenues we derived from the following geographic areas during each of the previous three fiscal years.
| | Fiscal Year Ended June 30, | |
| | 2007 | | 2006
(Acquisition
pro forma) | | 2005
(Predecessor) | |
| | (in thousands) | |
United States | | $ | 146,392 | | | $ | 146,373 | | | | $ | 152,391 | | |
The Netherlands | | 56,898 | | | 52,206 | | | | 49,956 | | |
United Kingdom | | 50,814 | | | 40,371 | | | | 34,716 | | |
Germany | | 46,220 | | | 43,985 | | | | 45,986 | | |
Other | | 171,636 | | | 147,295 | | | | 129,306 | | |
| | | | | | | | | | | | | | |
8
The table below sets forth the long-lived assets we held in the following geographic areas during each of the previous three fiscal years.
| | Fiscal Year Ended June 30, | |
| | 2007 | | 2006 | | 2005
(Predecessor) | |
| | (in thousands) | |
United States | | $ | 26,214 | | | $ | 12,901 | | | | $ | 13,173 | | |
The Netherlands | | 311 | | | 487 | | | | 940 | | |
United Kingdom | | 8,149 | | | 3,949 | | | | 1,746 | | |
Germany | | 8,269 | | | 8,088 | | | | 7,906 | | |
Other | | 8,542 | | | 12,860 | | | | 9,691 | | |
| | | | | | | | | | | | | | |
Key Competitive Strengths
Leading Global Provider
We are the leading global provider of software and services to the automobile insurance claims processing industry. We have operations in 49 countries across five continents. In each of our markets, we believe we are either the largest or second-largest provider of automobile insurance claims processing software and services based on total revenues except for four countries that we have recently entered. The large number of geographic regions in which we operate provides us with a strategic advantage when expanding into new markets by enabling us to utilize our database and vehicle coverage already present in adjacent or nearby markets. As insurance companies continue to expand their businesses globally, our international leadership position should further position us as a single provider of automobile insurance claims processing software and services to our customers on a global basis.
Significant Barriers to Entry
We believe that our proprietary databases pose barriers to entry due to the significant capital investment and time that would be required to develop a similar set of integrated databases and customize them for use in local markets. Our proprietary databases have been built through 35 years of developing, collecting, organizing and managing automobile-related information and data. We have invested over $200 million in the last ten years in developing and maintaining our proprietary databases, and customizing them for use in local markets.
Long-Standing Relationships with Customers
We have long-standing relationships with many of the world’s largest automobile insurance companies. For example, our relationships with our ten largest customers in Europe and North America date back, on average, 16 and 17 years, respectively. Our software and services are typically integrated into our customers’ systems, operations and processes, often making it costly and time-consuming for our customers to switch to another provider. These long-standing relationships have also allowed us to better understand our customers’ needs and further expand these relationships over time, both with additional software and by increasing our customer support and training services. Additionally, several of our customers own minority interests in five of our local operating subsidiaries. We have found these partnerships to be effective when entering new markets as they have allowed us to collaborate more closely with our insurance company customers and rely on their local expertise to introduce, customize and market our software and services quickly and efficiently.
History of Developing New Software and Services
Since our inception, we have consistently developed and marketed new software and services in order to meet the needs of our customers. We work closely with our customers in order to determine the features
9
and functions that they may require in the future. We have developed and introduced new software and services to the market through both internal development as well as through the acquisition and licensing of products and technology owned by third parties. For example, we recently introduced an auditing tool that allows insurance companies to identify repair estimates that should be further reviewed. We believe our focus on software development and customization creates incremental revenue opportunities as we expand the number and sophistication of the software and services that we offer.
Attractive Operating Model
We believe we have an attractive operating model due to the recurring nature of our revenues, the scalability of our databases and software and the significant operating cash flow we generate.
Contract-Based Revenues. A substantial portion of our revenues is derived from customers who have been under contract with us for several years. For fiscal 2007, we generated over 95% of our revenues from subscription-based contracts (where we charge a monthly fee), transaction-based contracts (where we charge a fee per transaction), and subscription-based contracts with additional transaction-based fees (where we charge both a monthly fee and a fee per transaction), all of which generate recurring revenues from our customers.
Scalable Databases and Software. Our databases and software have been designed to accommodate significant additional transaction- and subscription-based volumes with limited incremental costs. The ability to generate additional revenues from increased subscription and transaction volumes without incurring substantial incremental costs provides us with opportunities to improve our operating margins.
Significant Operating Cash Flow Generation. We believe we are able to generate significant operating cash flows due to our operating margins and the relatively moderate working capital required to grow our business. The operating cash flow we generate may be used to repay debt, finance acquisitions, expand geographically or further invest in database and software innovation.
Business Strategy
Broaden the Scope of our Software and Services
We intend to further broaden the capabilities, features and functionality of our claims processing software, as well as the breadth of our service offerings. We believe that expanding the breadth of our offerings will allow us to retain and strengthen our relationships with our existing customers by helping them improve the efficiency of their claims process. We also intend to develop new software and services for our insurance company customers that can help them process claims in areas other than automobile insurance.
Expand Customer Base in Existing Markets
We seek to expand our customer base in existing markets by competing on the quality of our software and services, our industry expertise, and our strong industry relationships. In some markets, such as North America and Western Europe, we intend to seek new customers by competing favorably on both price and service, as well as by providing a complete suite of claims processing software and services that optimize each step of the claims process. In other markets, such as Eastern Europe, Latin America, China and India, we intend to use the combination of our local expertise with our global presence and comprehensive databases to serve new automobile insurance companies and other customers who can use our software and services to reduce claims-related costs and increase their operational efficiencies.
10
Expand into New Markets
As a result of recent growth in vehicle usage, regulatory and market developments, increasing penetration of automobile insurance, and rising adoption of automated claims processing by insurance companies, we believe that new markets represent significant opportunities for future growth. We have a history of successfully entering markets that previously had not used automated claims processing software and services. We intend to use this expertise to further expand in markets where we have recently established operations, such as China and India, and enter markets where we currently have no operations.
Improve Operational Efficiencies
We seek to operate more efficiently, reduce costs and improve our operating margins. We intend to pursue substantial operating margin improvements over the next two years. Major elements of this plan include productivity and technological enhancements and reduction of overhead. We have identified and targeted several operational initiatives that we plan to implement over the next year, including the elimination of database and infrastructure redundancies productivity and technology enhancements and reduction of overhead. If implemented, we expect that these initiatives will improve our operating margins.
Pursue Strategic Acquisitions
We plan to supplement our organic growth by acquiring businesses or technologies that allow us to expand our range of services, increase our customer base and enter new markets. When evaluating these opportunities, we will consider characteristics such as recurring revenues, strong operating and financial performance, enhanced products and services, long-standing customer relationships and strong management personnel.
Sales and Marketing
As of June 30, 2007, our sales and marketing staff included 222 full-time professionals. Our sales and marketing personnel identify and target specific sales opportunities and manage customer relationships. They also design and plan launch strategies for new software and services, and plan and facilitate customer conferences and tradeshows. Our country managers are also involved in the sales and marketing process, though they are not counted as full-time sales professionals.
Customer Support and Training
We believe that providing high quality customer support and training services is critical to our success. As of June 30, 2007, we had 395 full-time customer support and training personnel, who provide telephone support, as well as on- and off-site implementation and training. Our customer support and training staff generally consists of individuals with expertise in both our software and services and in the automobile insurance and collision repair industries.
Software and Database Development
We devote significant resources to the continued development of our software and databases. We have created sophisticated processes and tools to achieve high-quality software development and data accuracy. Our ability to maintain and grow our leading position in the automobile insurance claims processing industry is dependent upon our ability to enhance and broaden the scope of our software and services, as well as continuing to expand and improve our repair estimating, total loss, claims and parts salvage databases. We often collaborate with our customers in the development process to focus on addressing their specific needs. We then incorporate what we have learned from our customers’ workflow experiences and needs to deliver quality, workflow-oriented software and services to the marketplace
11
quickly. We believe these efforts provide a significant competitive advantage in the development of new software and services.
As of June 30, 2007, our software development staff consisted of 402 full-time professionals across six international software development centers. As of the same date, our database staff consisted of 379 full-time professionals across five international database development centers.
Competition
We compete primarily on the functionality of our software, the integrity and breadth of our data, customer service and price. The competitive dynamics of the global automobile insurance claims processing industry vary by region, and many of our competitors are present in only a limited number of markets in which we operate. In Europe, our largest competitors include DAT, GmbH and EurotaxGlass’s Group, with whom we compete in multiple countries. In North America, our largest competitors include CCC Information Services Group Inc. in the U.S. and Mitchell International Inc. in the U.S. and Canada.
Intellectual Property and Licenses
We enter into license agreements with our customers, granting each customer a license to use our software and services while ensuring the protection of our ownership and the confidentiality of the embedded information and technology contained in our software. As a general practice, employees, contractors and other parties with access to our confidential information sign agreements that prohibit the unauthorized use or disclosure of our proprietary rights, information and technology.
We own registered trademarks and service marks that we use in connection with our software and services, including their advertising and marketing. For example, our trademark Audatex is registered in over 50 countries. In the U.S. and Canada, we market our collision damage estimating and total loss valuation software under the registered trademarks Penpro, Shoplink and Autosource.
We license much of the data used in our software and services through short-term contracts with third parties, including OEMs, aftermarket parts suppliers, data aggregators, automobile dealerships and vehicle repair facilities, to whom we pay royalties.
Employees
As of June 30, 2007, we had 2,067 full-time employees, 1,033 of whom were based in our EMEA operating segment and 1,034 of whom were based in our Americas operating segment. None of our employees is subject to a collective bargaining agreement. We consider our relationships with our employees to be good.
ITEM 1A. RISK FACTORS
Investing in our common stock involves a high degree of risk. You should carefully consider the following risk factors and all other information contained in this Annual Report on Form 10-K before making a decision to invest in our common stock. If any of the following risks occur, our business, results of operations and financial condition may be materially and adversely affected. In that event, the trading price of our common stock could decline, and you could lose all or part of your investment.
We depend on a limited number of customers for a substantial portion of our revenues, and the loss of, or a significant reduction in volume from, any of these customers would harm our financial results.
We derive a substantial portion of our revenues from sales to large insurance companies. In fiscal 2007, we derived 16.2% of our revenues from our ten largest insurance company customers. The largest three of these customers accounted for 3.6%, 3.0% and 1.8%, respectively, of our revenues during this
12
period. A loss of one or more of these customers would result in a significant decrease in our revenues, including the business generated by collision repair facilities associated with those customers. We lost a customer contract in April 2006 during its renewal phase that accounted for revenues in fiscal 2006 of approximately $4.3 million and earlier this year lost our principal shared services contract, which accounted for approximately $5.8 million of revenue in fiscal 2007. Furthermore, many of our arrangements with European customers are terminable by them on short notice or at any time. In addition, disputes with customers may lead to delays in payments to us, terminations of agreements or litigation. Additional terminations or non-renewals of customer contracts or reductions in business from our large customers would harm our business, financial condition and results of operations.
Competitive pressures may require us to significantly lower our prices.
Pricing pressures have required us to significantly lower prices for some of our software and services in several of our markets. We may be required to implement further price reductions in response to the following:
· price reductions by competitors;
· the consolidation of property and casualty insurance companies;
· the introduction of competing software or services; and
· a decrease in the frequency of accidents.
If we are required to accept lower prices for our software and services, it would result in decreased revenues and harm our business, financial condition and results of operations.
Changes in or violations by us or our customers of, applicable government regulations could reduce demand for or limit our ability to provide our software and services in those jurisdictions.
Our insurance company customers are subject to extensive government regulations, mainly at the state level in the U.S. and at the country level in our non-U.S. markets. Some of these regulations relate directly to our software and services, including regulations governing the use of total loss and estimating software. If our insurance company customers fail to comply with new or existing insurance regulations, including those applicable to our software and services, they could lose their certifications to provide insurance and/or reduce their usage of our software and services, either of which would reduce our revenues. Also, we are subject to direct regulation in some markets, and our failure to comply with these regulations could significantly reduce our revenues or subject us to government sanctions. In addition, future regulations could force us to implement costly changes to our software and/or databases or have the effect of prohibiting or rendering less valuable one or more of our offerings. Moreover, some states in the U.S. have changed their regulations to permit insurance companies to use book valuations for total loss calculations, making our total loss software potentially less valuable to insurance companies in those states. Some states have adopted total loss regulations, that, among other things, require that insurers use a methodology deemed acceptable to the respective government agency. We submit our methodology to such agencies, and if they do not approve our methodology, we will not be able to perform total loss valuations in their respective states. In addition, some states are considering legislation that would require insurers to use estimates from two independent services to provide total loss calculations for a damaged vehicle and would provide authority to the state insurance commissioner to determine which services qualify as independent. If passed, this legislation may prohibit us from or limit our ability to provide our products and services in those states and/or may have the effect of making our products and services less desirable to our customers. Other states are considering legislation that would limit the data that our software can provide to our insurance company customers. In the event that demand for or our ability to provide our software
13
and services decreases in particular jurisdictions due to regulatory changes, our revenues and margins may decrease.
In addition, the Belgian Competition Department recently notified us that it has chosen to continue to investigate a complaint originally brought by a trade association representing collision repair facilities that was withdrawn by the trade association in 2005, relating to estimates generated by our software of the costs to repair damaged vehicles. Pursuant to the European Union competition laws, the Belgian Competition Department is asserting its authority to conduct this investigation as it relates to the Western European region.
Our industry is highly competitive, and our failure to compete effectively could result in a loss of customers and market share, which could harm our revenues and operating results.
The markets for our automobile insurance claims processing software and services are highly competitive. In the U.S., our principal competitors are CCC Information Services Group Inc. and Mitchell International Inc. In Europe, our principal competitors are EurotaxGlass’s Group and DAT, GmbH. If one or more of our competitors develop software or services that are superior to ours or are more effective in marketing its software or services, our market share could decrease, reducing our revenues. In addition, if one or more of our competitors retain existing or attract new customers for which we have developed new software or services, we may not realize expected revenues from these new offerings, reducing our profitability.
Some of our current or future competitors may have or develop closer customer relationships, develop stronger brands, have greater access to capital, lower cost structures and/or more attractive system design and operational capabilities than we have. In addition, consolidation within our industry could result in the formation of competitors with substantially greater financial, management or marketing resources than we have and such competitors could utilize their substantially greater resources and economies of scale to develop and market competing products, divert sales away from us by offering their products at lower prices, or hire away our key employees by offering more lucrative compensation packages. Moreover, many insurance companies have historically entered into agreements with automobile insurance claims processing service providers like us and our competitors whereby the insurance company agrees to use that provider on an exclusive or preferred basis for particular products and services and agrees to require collision repair facilities, independent assessors and other vendors to use that provider. If our competitors are more successful than we are at negotiating these exclusive or preferential arrangements, we may lose market share even in markets where we retain other competitive advantages.
In addition, our insurance company customers have varying degrees of in-house development capabilities, and one or more of them have expanded and may seek to further expand their capabilities in the areas in which we operate. Many of our customers are larger and have greater financial and other resources than we do and could commit significant resources to product development. Our software and services have been, and may in the future be, replicated by our insurance company customers in-house, which could result in our loss of those customers and their associated repair facilities, independent assessors and other vendors, resulting in decreased revenues and net income.
The time and expense associated with switching from our competitors’ software and services to ours may limit our growth.
The costs for an insurance company to switch providers of claims processing software and services can be significant and the process can sometimes take 12-18 months to complete. As a result, potential customers may decide that it is not worth the time and expense to begin using our software and services, even if we offer competitive and economic advantages. If we are unable to convince these customers to
14
switch to our software and services, our ability to increase market share will be limited, which could harm our revenues and operating results.
Our industry is subject to rapid technological changes, and if we fail to keep pace with these changes, our market share and revenues will decline.
Our industry is characterized by rapidly changing technology, evolving industry standards and frequent introductions of, and enhancements to, existing software and services, all with an underlying pressure to reduce cost. Industry changes could render our offerings less attractive or obsolete, and we may be unable to make the necessary adjustments to our offerings at a competitive cost, or at all. We also incur substantial expenses in researching, developing, designing and marketing new software and services. The development or adaptation of these new technologies may result in unanticipated expenditures and capital costs that would not be recovered in the event that our new software or services are unsuccessful. The research, development, production and marketing of new software and services are also subject to changing market requirements, as well as the satisfaction of applicable regulatory requirements and customers’ approval procedures and other factors, each of which could prevent us from successfully marketing any new software and services or responding to competing technologies. The success of new software in our industry also often depends on the ability to be first to market, and our failure to be first to market with any particular software project could limit our ability to recover the development expenses associated with that project. If we cannot develop new technologies, software and services or any of our existing software or services are rendered obsolete, our revenues and income could decline and we may lose market share to our competitors, which would impact our future operations and financial results.
We have a very limited operating history as a stand-alone company, which may make it difficult to compare our current operating results to prior periods.
Prior to the Acquisition, our predecessor operated as a business unit of ADP. Our predecessor relied on ADP during this period for many of its internal functions, including accounting, tax, payroll, technology and administrative and operational support. In connection with the Acquisition, ADP agreed to continue providing us with systems, network, programming and operational support and other administrative services for periods ranging from three to six months following the date of the Acquisition. Although we have replaced these services either through third-party contracts or internal sources, we may not be able to perform any or all of these services in a cost-effective manner. If we are unable to maintain substitute arrangements on terms that are favorable to us or effectively perform these services internally, our business, financial condition and results of operations would be adversely affected.
In addition, the historical financial information of our predecessor included in this Annual Report on Form 10-K may not reflect what our results of operations, financial position and cash flows would have been had we operated as a separate stand-alone company without the shared resources of ADP for the periods presented and are not necessarily indicative of our future results of operations, financial position and cash flows. For example, ADP allocated expenses and other centralized operating costs to our predecessor for periods prior to the Acquisition, and the allocated costs included in our predecessor’s historical financial statements could differ from amounts that we would have incurred if we had operated on a stand-alone basis.
We have a large amount of goodwill and other intangible assets as a result of the Aacquisition. Our earnings will be harmed if we suffer an impairment of our goodwill or other intangible assets.
We have a large amount of goodwill and other intangible assets and are required to perform an annual assessment for possible impairment for accounting purposes. At June 30, 2007, we had goodwill and other intangible assets of $932.2 million. If we do not achieve our planned operating results or other
15
factors impair these assets, we may be required to incur a non-cash impairment charge. Any impairment charges in the future will adversely affect our results of operations.
We have experienced net losses since the Acquisition, and future net losses may cause our stock price to decline.
We had a net loss of $80.9 million for fiscal 2007. We expect to continue to incur net losses in the future, due primarily to amortization of the remaining $363.0 million of intangible assets that we had as of June 30, 2007 and interest expense associated with our indebtedness. We cannot assure you that we will become or remain profitable, and future net losses may reduce our stock price.
We may incur significant restructuring and severance charges over the next 12 months, which would harm our operating results and cash position or increase debt.
We incurred restructuring charges (benefits) of $5.5 million in fiscal 2005 (Predecessor), $(0.5) million during the period from July 1, 2005 through April 13, 2006, $2.9 million in fiscal 2006 and $6.0 million in fiscal 2007. These charges consisted primarily of termination benefits paid or to be paid to employees. As of June 30, 2007, we had remaining liabilities associated with these restructuring charges of $5.6 million. We continue to evaluate our existing operations and capacity, and expect to incur additional restructuring charges as a result of future personnel reductions, related restructuring and productivity and technology enhancements, which may exceed the levels of our historical charges. We are currently evaluating several plans that, if all implemented, would result in restructuring and severance charges of approximately $3.0 million to $4.0 million over the next twelve months. These potential charges, consisting primarily of termination benefits, would significantly reduce our cash position or increase debt.
Our software and services rely on information generated by third parties and any interruption of our access to such information could materially harm our operating results.
We believe that our success depends significantly on our ability to provide our customers access to data from many different sources. For example, a substantial portion of the data used in our repair estimating software is derived from parts and repair data provided by, among others, original equipment manufacturers, or OEMs, aftermarket parts suppliers, data aggregators, automobile dealerships and vehicle repair facilities. We obtain much of our data about vehicle parts and components and collision repair labor and costs through license agreements with OEMs, automobile dealers, and other providers. EurotaxGlass’s Group, one of our primary competitors in Europe, provides us with valuation and paint data for use in our European markets pursuant to a similar arrangement. Many of the license agreements through which we obtain data are for terms of one year and/or may be terminated without cost to the provider on short notice. If one or more of our licenses are terminated or if we are unable to renew one or more of these licenses on favorable terms or at all, we may be unable to access alternative data sources that would provide comparable information without incurring substantial additional costs. Recently, some OEM sources have indicated to us that they intend to materially increase the licensing costs for their data. While we do not believe that our access to any individual source of data is material to our operations, prolonged industry-wide price increases or reductions in data availability could make receiving certain data more difficult and could result in significant cost increases, which would materially harm our operating results.
16
System failures, delays and other problems could harm our reputation and business, cause us to lose customers and expose us to customer liability.
Our success depends on our ability to provide accurate, consistent and reliable services and information to our customers on a timely basis. Our operations could be interrupted by any damage to or failure of:
· our computer software or hardware or our customers’ or third-party service providers’ computer software or hardware;
· our networks, our customers’ networks or our third-party service providers’ networks; and
· our connections to and outsourced service arrangements with third parties, such as Acxiom, which hosts data and applications for us and our customers.
Our systems and operations are also vulnerable to damage or interruption from:
· power loss or other telecommunications failures;
· earthquakes, fires, floods, hurricanes and other natural disasters;
· computer viruses or software defects;
· physical or electronic break-ins, sabotage, intentional acts of vandalism and similar events; and
· errors by our employees or third-party service providers.
These risks will be exacerbated by our planned migration of our systems and operations to a more centralized platform. Because many of our services play a mission-critical role for our customers, any damage to or failure of the infrastructure we rely on, including those of our customers and vendors, could disrupt our ability to deliver information to and provide services for our customers in a timely manner, which could result in the loss of current and/or potential customers. In addition, we generally indemnify our customers to a limited extent for damages they sustain related to the unavailability of, or errors in, the software and services we provide; therefore, a significant interruption of, or errors in, our software and services could expose us to significant customer liability.
Security breaches could result in lost revenues, litigation claims and/or harm to our reputation.
Our databases contain confidential data relating to our customers, policyholders and other industry participants. Security breaches, particularly those involving connectivity to the Internet, and the trend toward broad consumer and general public notification of such incidents, could significantly harm our business, financial condition or results of operations. Our databases could be vulnerable to physical system or network break-ins or other inappropriate access, which could result in claims against us and/or harm our reputation. In addition, potential competitors may obtain our data illegally and use it to provide services that are competitive to ours.
We operate in 49 countries, where we are subject to country-specific risks that could adversely impact our business and results of operations.
We generated approximately 69.0% of our revenues during fiscal 2007 outside the U.S., and we expect sales from non-U.S. markets to continue to represent a majority of our total sales. Sales and operations in individual countries are subject to changes in local government regulations and policies, including those related to tariffs and trade barriers, investments, taxation, currency exchange controls and repatriation of earnings. Our results are also subject to the difficulties of coordinating our operations across 49 different countries. Furthermore, our business strategy includes expansion of our operations into new and developing markets, which will require even greater international coordination, expose us to additional
17
local government regulations and involve markets in which we do not have experience or established operations. In addition, our operations in each country are vulnerable to changes in socio-economic conditions and monetary and fiscal policies, intellectual property protection disputes, the settlement of legal disputes through foreign legal systems, the collection of receivables through foreign legal systems, exposure to possible expropriation or other governmental actions, unsettled political conditions and possible terrorist attacks. These and other factors may harm our operations in those countries and therefore our business and results of operations.
Our operating results may vary widely from period to period, which may cause our stock price to decline.
Our contracts with insurance companies generally require time-consuming authorization procedures by the customer, which can result in additional delays between when we incur development costs and when we begin generating revenues from those software or services offerings. Our quarterly and annual revenues and operating results may fluctuate significantly in the future. In addition, we incur significant operating expenses while we are researching and designing new software and related services, and we typically do not receive corresponding payments in those same periods. As a result, the number of new software and services offerings that we are able to implement, successfully or otherwise, can cause significant variations in our cash flow from operations, and we may experience a decrease in our net income as we incur the expenses necessary to develop and design new software and services. We also may experience variations in our earnings due to other factors beyond our control, such as the introduction of new software or services by our competitors, customer acceptance of new software or services, the volume of usage of our offerings by existing customers and competitive conditions in our industry generally. We may also incur significant or unanticipated expenses when contracts expire, are terminated or are not renewed. Any of these events could harm our financial condition and results of operations and cause our stock price to decline.
Our future operating results may be subject to volatility as a result of exposure to foreign currency exchange risks.
We derive most of our revenues, and incur most of our costs, in currencies other than the U.S. dollar, principally the Euro. We currently do not hedge our exposure to foreign currency risks. In our historical financial statements, we re-measure our local currency financial results into U.S. dollars based on average exchange rates prevailing during a reporting period or the exchange rate at the end of that period. These re-measurements resulted in foreign currency translation adjustments of $10.9 million in fiscal 2005 (Predecessor), $3.8 million in fiscal 2006 and $4.8 million in fiscal 2007. Further fluctuations in exchange rates against the U.S. dollar could decrease our revenues, increase our costs and expenses and therefore harm our future operating results.
Future acquisitions and joint ventures or dispositions may require significant resources and/or result in significant unanticipated losses, costs or liabilities.
We have grown in part, and in the future may continue to grow, by making acquisitions or entering into joint ventures or similar arrangements. Acquisitions and joint ventures require significant investment and managerial attention, which may be diverted from our other operations, and could entail a number of additional risks, including:
· problems with effective integration of operations and/or management;
· loss of key customers, suppliers or employees;
· increased operating costs; and
· exposure to unanticipated liabilities.
18
Furthermore, we participate in joint ventures in some countries. Our partners in these ventures may have interests and goals that are inconsistent with or different from ours, which could result in the joint venture taking actions that negatively impact our growth in the local market and consequently harm our business or financial condition. If we are unable to find suitable partners or if suitable partners are unwilling to enter into joint ventures with us, our growth into new geographic markets may slow, which would harm our results of operations.
Additionally, we may finance future acquisitions and/or joint ventures with cash from operations, additional indebtedness and/or the issuance of additional securities, any of which may impair the operation of our business or present additional risks, such as reduced liquidity or increased interest expense. We may seek also to restructure our business in the future by disposing of certain of our assets, which may harm our future operating results, divert significant managerial attention from our operations and/or require us to accept non-cash consideration, the market value of which may fluctuate.
We may require additional capital in the future, which may not be available on favorable terms, or at all.
Our future capital requirements depend on many factors, including our ability to develop and market new software and services and to generate revenues at levels sufficient to cover ongoing expenses. If we need to raise additional capital, equity or debt financing may not be available at all or may be available only on terms that are not favorable to us. In the case of equity financings, dilution to our stockholders could result, and in any case such securities may have rights, preferences and privileges that are senior to those of the shares offered hereby. If we cannot obtain adequate capital on favorable terms or at all, we may be unable to support future growth or operating requirements and, accordingly, our business, financial condition and results of operations could be harmed.
Privacy concerns could require us to exclude data from our software and services, which may reduce the value of our offerings to our customers, damage our reputation and deter current and potential users from using our software and services.
In the European Union and other jurisdictions, there are significant restrictions on the use of personal data. Violations of these laws would harm our business. In addition, concerns about our collection, use or sharing of automobile insurance claims information or other privacy-related matters, even if unfounded, could damage our reputation and operating results.
Our business depends on our brands, and if we are not able to maintain and enhance our brands, our business and operating results could be harmed.
We believe that the brand identity that we have developed has significantly contributed to the success of our business. We also believe that maintaining and enhancing our brands, such as Audatex, ABZ, Hollander, Informex, Sidexa and IMS, are critical to the expansion of our software and services to new customers in both existing and new markets. Maintaining and enhancing our brands may require us to make substantial investments and these investments may not be successful. If we fail to promote and maintain our brands or if we incur excessive expenses in this effort, our business, operating results and financial condition will be harmed. We anticipate that, as our markets become increasingly competitive, maintaining and enhancing our brands may become increasingly difficult and expensive. Maintaining and enhancing our brands will depend largely on our ability to be a technology innovator and to continue to provide high quality software and services, which we may not do successfully. To date, we have engaged in relatively little direct brand promotion activities, and we may not successfully implement brand enhancement efforts in the future.
19
Third parties may claim that we are infringing upon their intellectual property rights, and we could be prevented from selling our software or suffer significant litigation expense even if these claims have no merit.
Our competitive position is driven in part by our intellectual property and other proprietary rights. Third parties, however, may claim that we, our software or operations or any products or technology, including claims data or other data, we obtain from other parties are infringing upon the intellectual property rights of others, and we may be unaware of intellectual property rights of others that may cover some of our assets, technology, software and services. Any litigation initiated against us regarding patents, trademarks, copyrights or other intellectual property rights, even litigation relating to claims without merit, could be costly and time-consuming and could divert our management and key personnel from operating our business. In addition, if any third party has a meritorious or successful claim that we are infringing upon its intellectual property rights, we may be forced to change our software or enter into licensing arrangement with third parties, which may be costly or impractical. These claims may also require us to stop selling our software and/or services as currently designed, which could harm our competitive position. We also may be subject to significant damages or injunctions that prevent the further development and sale of certain of our software or services and may result in a material loss in revenue.
We may be unable to protect our intellectual property and property rights, either without incurring significant costs or at all, which would harm our business.
We rely on a combination of patents, copyrights, know-how, trademarks, license agreements and contractual provisions, as well as internal procedures, to establish and protect our intellectual property rights. The steps we have taken and will take to protect our intellectual property rights may not deter infringement, duplication, misappropriation or violation of our intellectual property by third parties. In addition, any of the intellectual property we own or license from third parties may be challenged, invalidated, circumvented or rendered unenforceable. Furthermore, the laws of some of the countries in which products similar to ours may be developed may not protect our software and intellectual property to the same extent as U.S. laws or at all. We may be unable to protect our rights in trade secrets and unpatented proprietary technology in these countries. We may also be unable to prevent the unauthorized disclosure or use of our technical knowledge or trade secrets by consultants, vendors, former employees and current employees, despite the existence of nondisclosure and confidentiality agreements and other contractual restrictions. If our trade secrets become known, we may lose our competitive advantages. If we fail to protect our intellectual property, we may not receive any return on the resources expended to create the intellectual property or generate any competitive advantage based on it.
Pursuing infringers of our intellectual property could result in significant litigation costs and diversion of management resources, and any failure to pursue or successfully litigate claims against infringers could result in competitors using our technology and offering similar products and services, potentially resulting in loss of competitive advantage and decreased revenues.
Currently, we believe that one or more of our customers in our EMEA segment may be infringing our intellectual property by making and distributing unauthorized copies of our software. Enforcement of these intellectual property rights may be difficult and may require considerable resources.
We depend on a limited number of key personnel who would be difficult to replace. If we lose the services of these individuals, or are unable to attract new talent, our business will be adversely affected.
We depend upon the ability and experience of our key personnel, who have substantial experience with our operations, the rapidly changing automobile insurance claims processing industry and the markets in which we offer our software and services. The loss of the services of one or more of our senior executives or key employees, such as our Chief Executive Officer, Tony Aquila, could harm our business and
20
operations. Our success also depends on our ability to continue to attract, manage and retain other qualified management, sales and technical personnel as we grow. We may not be able to continue to attract or retain such personnel in the future.
We require a significant amount of cash to service our indebtedness, which reduces the cash available to finance our organic growth, make strategic acquisitions and enter into alliances and joint ventures.
We have a significant amount of indebtedness. As of June 30, 2007, our indebtedness, including current maturities, was $613.3 million, and we would have been able to borrow an additional $41.9 million under our amended and restated senior credit facility. During fiscal 2007, our aggregate interest expense was $69.7 million, and the cash paid for interest was $66.8 million.
Our indebtedness could:
· make us more vulnerable to unfavorable economic conditions and a reduction in our revenues;
· make it more difficult to obtain additional financing in the future for working capital, capital expenditures or other general corporate purposes;
· require us to dedicate or reserve a large portion of our cash flow from operations for making payments on our indebtedness, which would prevent us from using it for other purposes, including software development;
· make us susceptible to fluctuations in market interest rates that affect the cost of our borrowings to the extent that our variable rate debt is not covered by interest rate derivative agreements; and
· make it more difficult to pursue strategic acquisitions, joint ventures, alliances and collaborations.
Our ability to service our indebtedness will depend on our future performance, which will be affected by prevailing economic conditions and financial, business, regulatory and other factors. Some of these factors are beyond our control. If we cannot generate sufficient cash flow from operations to service our indebtedness and to meet our other obligations and commitments, we may be required to refinance our debt or to dispose of assets to obtain funds for such purpose. We cannot assure you that debt refinancings or asset dispositions could be completed on a timely basis or on satisfactory terms, if at all, or would be permitted by the terms of our debt instruments.
Our amended and restated senior credit facility limits our ability to pay dividends, incur additional debt, make acquisitions and make other investments.
Our amended and restated senior credit facility contains covenants that restrict our and our subsidiaries’ ability to make certain distributions with respect to our capital stock, prepay other debt, encumber our assets, incur additional indebtedness, make capital expenditures above specified levels, engage in business combinations or undertake various other corporate activities. These covenants may require us also to maintain certain specified financial ratios, including those relating to total leverage and interest coverage.
Our failure to comply with any of these covenants could result in the acceleration of our outstanding indebtedness. If acceleration occurs, we would not be able to repay our debt and it is unlikely that we would be able to borrow sufficient additional funds to refinance our debt. Even if new financing is made available to us, it may not be available on acceptable or reasonable terms. An acceleration of our indebtedness would impair our ability to operate as a going concern.
21
Current or future litigation could have a material adverse impact on us.
We have been and continue to be involved in legal proceedings, claims and other litigation that arise in the ordinary course of business. For example, we have been and are currently involved in disputes with collision repair facilities, acting individually and as a group in some situations that claim that we have colluded with our insurance company customers to depress the repair time estimates generated by our repair estimating software. In addition, we are currently one of the defendants in a putative class action lawsuit alleging that we have colluded with our insurance company customers to cause the estimates of vehicle fair market value generated by our total loss estimation software to be unfairly low. Furthermore, we are also subject to assertions by our customers that we have not complied with the terms of our agreements with them, which could in the future lead to arbitration or litigation. While we do not expect the outcome of any such pending or threatened litigation to have a material adverse effect on our financial position, litigation is unpredictable and excessive verdicts, both in the form of monetary damages and injunction, could occur. In the future, we could incur judgments or enter into settlements of claims that could harm our financial position and results of operations.
If we are not able to implement the requirements of Section 404 of the Sarbanes-Oxley Act in a timely manner or with adequate compliance, we may be subject to sanctions by regulatory authorities.
Section 404 of the Sarbanes-Oxley Act requires that we evaluate and determine the effectiveness of our internal control over financial reporting for our annual report for fiscal 2008. If we have a material weakness in our internal control over financial reporting, we may not detect errors on a timely basis and our financial statements may be materially misstated. We will continue to evaluate our internal controls systems to allow management to report on, and our independent auditors to attest to, our internal controls. We will continue to perform the system and process evaluation and testing (and any necessary remediation) required to comply with the management certification and auditor attestation requirements of Section 404 of the Sarbanes-Oxley Act. While we anticipate being able to fully implement the requirements relating to internal controls and all other aspects of Section 404 by the above deadline, we cannot be certain as to the timing of completion of our evaluation, testing and remediation actions or the impact of the same on our operations. If we are not able to implement the requirements of Section 404 in a timely manner or with adequate compliance, we may be subject to sanctions or investigation by regulatory authorities, such as the Securities and Exchange Commission, or SEC, or the New York Stock Exchange, or NYSE. Any such action could adversely affect our financial results or investors’ confidence in us and could cause our stock price to fall. In addition, the controls and procedures that we will implement may not comply with all of the relevant rules and regulations of the SEC and NYSE. If we fail to develop and maintain effective controls and procedures, we may be unable to provide financial information in a timely and reliable manner, subjecting us to sanctions and harm to our reputation.
Requirements associated with being a public company increase our costs significantly, as well as divert significant company resources and management attention.
Prior to our initial public offering, we were not subject to the reporting requirements of the Securities Exchange Act of 1934, as amended, or the Exchange Act, or the other rules and regulations of the SEC or any securities exchange relating to public companies. We are working with our legal, independent accounting and financial advisors to identify those areas in which changes should be made to our financial and management control systems to manage our growth and our obligations as a public company. These areas include corporate governance, corporate control, internal audit, disclosure controls and procedures and financial reporting and accounting systems. We have made, and will continue to make, changes in these and other areas. However, the expenses that are required as a result of being a public company could be material. Compliance with the various reporting and other requirements applicable to public companies also require considerable time and attention of management. We cannot predict or estimate the amount of
22
the additional costs we may incur, the timing of such costs or the degree of impact that our management’s attention to these matters will have on our business. In addition, the changes we make may not be sufficient to allow us to satisfy our obligations as a public company on a timely basis.
In addition, being a public company could make it more difficult or more costly for us to obtain certain types of insurance, including directors’ and officers’ liability insurance, and we may be forced to accept reduced policy limits and coverage or incur substantially higher costs to obtain the same or similar coverage. The impact of these events could also make it more difficult for us to attract and retain qualified persons to serve on our board of directors, our board committees or as executive officers.
Our certificate of incorporation and by-laws contain provisions that could discourage another company from acquiring us and may prevent attempts by our stockholders to replace or remove our current management.
Some provisions of our certificate of incorporation and by-laws may have the effect of delaying, discouraging or preventing a merger or acquisition that our stockholders may consider favorable, including transactions in which stockholders may receive a premium for their shares. In addition, these provisions may frustrate or prevent any attempts by our stockholders to replace or remove our current management by making it more difficult for stockholders to replace or remove our board of directors. These provisions include:
· authorization of the issuance of “blank check” preferred stock without the need for action by stockholders;
· the removal of directors only by the affirmative vote of the holders of two-thirds of the shares of our capital stock entitled to vote;
· any vacancy on the board of directors, however occurring, including a vacancy resulting from an enlargement of the board, may only be filled by vote of the directors then in office;
· inability of stockholders to call special meetings of stockholders and limited ability of stockholders to take action by written consent; and
· advance notice requirements for board nominations and proposing matters to be acted on by stockholders at stockholder meetings.
We currently do not intend to pay dividends on our common stock, and as a result, your only opportunity to achieve a return on your investment is if the price of our common stock appreciates.
We currently do not expect to declare or pay dividends on our common stock in the foreseeable future. In addition, our amended and restated senior credit facility limits our ability to declare and pay cash dividends on our common stock. As a result, your only opportunity to achieve a return on your investment in us will be if the market price of our common stock appreciates and you sell your shares at a profit. We cannot assure you that the market price for our common stock will ever exceed the price that you pay.
ITEM 1B. UNRESOLVED STAFF COMMENTS
None.
ITEM 2. PROPERTIES
Our corporate headquarters are located in San Ramon, California, where we lease approximately 107,000 square feet of space and have subleased approximately 54,000 square feet of this space.
23
Our principal leased EMEA facilities include Zurich, Switzerland and Zeist, the Netherlands. Our principal leased Americas facilities include San Diego, California, Ann Arbor, Michigan, Plymouth, Minnesota and Milwaukie, Oregon. We also lease a number of other facilities across the regions where we operate. We own real estate in Minden, Germany, Brussels, Belgium and Reading, United Kingdom.
We believe that our existing space is adequate for our current operations. We believe that suitable replacement and additional space will be available in the future on commercially reasonable terms
ITEM 3. LEGAL PROCEEDINGS
As a normal incident of the business in which we are engaged, various claims, charges and litigation are asserted or commenced against us. We believe that final judgments, if any, which may be rendered against us in current litigation, are adequately reserved for, covered by insurance or would not have a material adverse effect on our financial position. We have from time to time been the subject of allegations that our repair estimating and total loss software and services produced results that favored our insurance company customers. In addition, we are currently one of the defendants in a putative class action lawsuit alleging that we have colluded with our insurance company customers to cause the estimates of vehicle fair market value generated by our total loss estimation products to be unfairly low.
ITEM 4. SUBMISSION OF MATTERS TO A VOTE OF SECURITY HOLDERS
Prior to the completion of our initial public offering on May 16, 2007, we had 45,523,175 shares of common stock outstanding, 91.2% of which was owned by entities affiliated with GTCR, and the rest of which was owned by our directors, executive officers and certain other employees.
On May 10, 2007, holders of 44,426,880 shares of our common stock, or 97.6% of our then-outstanding common stock, executed a written consent in accordance with our then-existing certificate of incorporation in order to approve our amended and restated certificate of incorporation, our amended and restated by-laws, the Solera Holdings, Inc. 2007 Employee Stock Purchase Plan, the Solera Holdings, Inc. 2007 Long Term Equity Incentive Plan, indemnification agreements with our directors, the election of Jerrell Shelton and Stuart J. Yarbrough as directors and the selection of Deloitte & Touche LLP as independent public accountants.
24
PART II
ITEM 5. MARKET FOR COMMON STOCK, RELATED STOCKHOLDER MATTERS AND ISSUER PURCHASES OF EQUITY SECURITIES
Market Information
Our common stock has been listed on The New York Stock Exchange under the symbol “SLH” since May 11, 2007. Prior to that time, there was no public market for our common stock. The initial public offering price of our common stock was $16.00 per share, and the initial public offering closed on May 16, 2007. The closing sale price of our common stock on The New York Stock Exchange was $17.28 per share on September 14, 2007. From May 11, 2007 through June 30, 2007, the range of the high and low sale prices of our common stock was $15.41 to $19.69 per share. As of September 14, 2007, there were approximately 42 holders of record of our common stock. The transfer agent and registrar for our common stock is Computershare Trust Company N.A.
Unregistered Sales of Equity Securities
In January 2007, we sold an aggregate of 690,081 Class A Common Units to 22 of our employees at $0.30 per unit for aggregate proceeds of $207,027. In February 2007, we sold an aggregate of 50,000 Class A Common Units to two of our employees at $0.30 per unit for aggregate proceeds of $15,000. These issuances were made without registration in reliance upon Rule 701 of the Securities Act and did not involve any underwriters, underwriting discounts or commissions or any public offering. The persons and entities who received such securities represented that they acquired these securities for investment only and not with a view for sale or in connection with any distribution thereof, and appropriate legends were affixed to any share certificates issued. All recipients had adequate access through their relationship with us to information about us.
Dividends
None.
Securities Authorized for Issuance under Equity Compensation Plans
See Item 12. “Security Ownership of Certain Beneficial Owners and Management and Related Stockholder Matters” for information regarding securities authorized for issuance under our equity compensation plans.
25
Performance Graph
The following graph compares our cumulative total stockholder return since the date our common stock began trading on The New York Stock Exchange, May 11, 2007, with the Russell 2000 Index and an aggregate of peer issuers in the information services industry. The peer issuers used for this graph are The Thomson Corporation, Equifax Inc., The Dun & Bradstreet Corporation, ChoicePoint Inc., FactSet Research Systems Inc., Fair Isaac Corporation, DealerTrack Holdings, Inc. and CoStar Group, Inc. Each peer issuer was weighted according to its respective capitalization on May 11, 2007.
The graph assumes that the value of the investment in our common stock and each index was $100 on May 11, 2007.
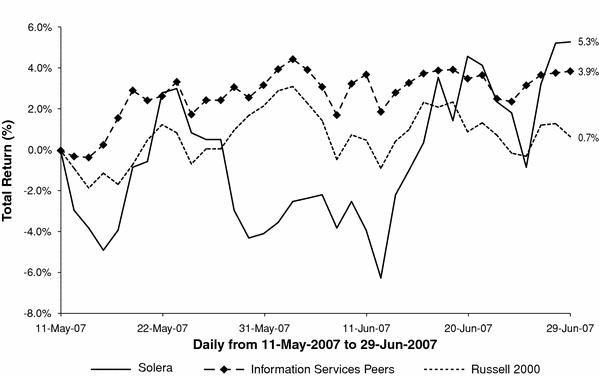
| | Cumulative Total Return | |
| | Solera
Holdings, Inc. | | Russell 2000
Index | | Information Service
Peers | |
May 11, 2007 | | | $ | 100.00 | | | | $ | 100.00 | | | | $ | 100.00 | | |
June 29, 2007 | | | 105.33 | | | | 100.68 | | | | 103.89 | | |
The information in the graph and table above is not “soliciting material,’’ is not deemed “filed” with the Securities and Exchange Commission and is not to be incorporated by reference in any of our filings under the Securities Act of 1933, as amended, or the Securities Exchange Act of 1934, as amended, whether made before or after the date of this annual report, except to the extent that we specifically incorporate such information by reference.
Issuer Purchases of Equity Securities
We did not repurchase any of our common stock during the fourth quarter of the fiscal year ended June 30, 2007.
26
ITEM 6. SELECTED FINANCIAL DATA
The following table sets forth selected historical financial information regarding our business and should be read in conjunction with Item 7. “Management’s Discussion and Analysis of Financial Condition and Results of Operations” and our consolidated financial statements and the related notes included elsewhere in this Annual Report on Form 10-K.
The selected historical consolidated financial data as of and for the fiscal years ended June 30, 2007 and 2006 are derived from the audited consolidated financial statements of Solera Holdings, Inc. that are included elsewhere in this Annual Report on Form 10-K. The historical combined balance sheet data as of June 30, 2003, 2004 and 2005 and the combined statements of operations and cash flows data for fiscal 2003, 2004 and 2005 and the period from July 1, 2005 through April 13, 2006 are derived from the audited combined financial statements of the Claims Services Group, which are not included in this Annual Report on Form 10-K.
| | Solera Holdings, Inc. | | | | Claims Services Group(1) | |
| | | | | | | | July 1, 2005 | | | | | | | |
| | Fiscal Year Ended June 30, | | | | to April 13, | | Fiscal Year Ended June 30, | |
| | 2007 | | 2006(2) | | | | 2006 | | 2005 | | 2004 | | 2003 | |
| | (in thousands, except per share data) | |
Statement of Operations Data: | | | | | | | | | | | | | | | | | |
Revenues | | $ | 471,960 | | $ | 95,084 | | | | | $ | 335,146 | | | $ | 412,355 | | $ | 361,179 | | $ | 311,334 | |
Cost of revenues: | | | | | | | | | | | | | | | | | |
Operating expenses | | 138,345 | | 29,013 | | | | | 101,995 | | | 117,361 | | 107,590 | | 88,708 | |
Systems development and programming costs | | 65,041 | | 15,080 | | | | | 52,306 | | | 62,690 | | 57,465 | | 42,517 | |
Total cost of revenues (excluding depreciation and amortization) | | 203,386 | | 44,093 | | | | | 154,301 | | | 180,051 | | 165,055 | | 131,225 | |
Selling, general and administrative expenses | | 134,545 | | 27,105 | | | | | 87,033 | | | 112,480 | | 94,757 | | 80,105 | |
Depreciation and amortization | | 104,419 | | 23,571 | | | | | 28,894 | | | 34,335 | | 28,754 | | 23,834 | |
Restructuring charges (benefit) | | 6,049 | | 2,871 | | | | | (468 | ) | | 5,512 | | 1,740 | | 1,067 | |
Impairment charges | | — | | — | | | | | — | | | — | | 4,214 | | — | |
Interest expense | | 69,681 | | 14,842 | | | | | 318 | | | 334 | | 271 | | 284 | |
Other (income) expense, net | | 31,509 | | 1,836 | | | | | (3,069 | ) | | (4,065 | ) | (1,323 | ) | (2,271 | ) |
Earnings (loss) from continuing operations before income tax provision (benefit) and minority interests | | $ | (77,629 | ) | (19,234 | ) | | | | 68,137 | | | 83,708 | | 67,711 | | 77,090 | |
Income tax provision (benefit) | | (773 | ) | (1,268 | ) | | | | 23,688 | | | 24,030 | | 22,124 | | 25,700 | |
Minority interests in net income of consolidated subsidiaries | | 4,050 | | 921 | | | | | 3,468 | | | 1,909 | | 1,229 | | 626 | |
Earnings (loss) from continuing operations | | $ | (80,906 | ) | (18,887 | ) | | | | 40,981 | | | 57,769 | | 44,358 | | 50,764 | |
Loss (income) from discontinued operations | | — | | — | | | | | — | | | 128 | | (3,816 | ) | 6,438 | |
Net income (loss) | | $ | (80,906 | ) | (18,887 | ) | | | | 40,981 | | | 57,641 | | 48,174 | | 44,326 | |
Less: Dividends and redeemable preferred unit accretion | | 14,614 | | 88,789 | | | | | — | | | — | | — | | — | |
Net income (loss) allocable to common stockholders/unitholders | | $ | (95,520 | ) | $ | (107,676 | ) | | | | $ | 40,981 | | | $ | 57,641 | | $ | 48,174 | | $ | 44,326 | |
Basic net income (loss) per common share/unit | | $ | (2.82 | ) | $ | (6.34 | ) | | | | | | | | | | | | |
Diluted net income (loss) per common share/unit(3) | | $ | (2.82 | ) | $ | (6.34 | ) | | | | | | | | | | | | |
Weighted average common shares/units outstanding(3): | | | | | | | | | | | | | | | | | |
Basic | | 33,865 | | 16,978 | | | | | | | | | | | | | |
Diluted | | 33,865 | | 16,978 | | | | | | | | | | | | | |
Other Financial Data: | | | | | | | | | | | | | | | | | |
Capital expenditures | | $ | 27,230 | | $ | 4,112 | | | | | $ | 9,671 | | | $ | 7,659 | | $ | 15,980 | | $ | 14,940 | |
Cash flows provided by (used in): | | | | | | | | | | | | | | | | | |
Operating activities | | 46,078 | | 45,356 | | | | | 51,325 | | | 106,840 | | 74,017 | | 113,000 | |
Investing activities | | (41,507 | ) | (936,471 | ) | | | | (18,464 | ) | | (62,975 | ) | (141,228 | ) | (28,598 | ) |
Financing activities | | (6,356 | ) | 977,954 | | | | | (82,787 | ) | | (33,369 | ) | 96,199 | | (69,922 | ) |
Balance Sheet Data (as of end of period): | | | | | | | | | | | | | | | | | |
Cash and cash equivalents | | $ | 89,868 | | $ | 88,826 | | | | | | | | $ | 121,313 | | $ | 107,824 | | $ | 76,886 | |
Total assets | | 1,223,953 | | 1,253,005 | | | | | | | | 608,065 | | 556,769 | | 341,889 | |
Long-term debt, net of current portion | | 599,128 | | 831,628 | | | | | | | | — | | — | | — | |
Total group/unitholders’/stockholders’ equity (deficit) | | 401,274 | | (12,403 | ) | | | | | | | 399,282 | | 376,386 | | 213,061 | |
27
(1) The Claims Services Group was owned by ADP until subsidiaries of Solera Holdings, LLC acquired it on April 13, 2006.
(2) The statement of operations data for fiscal 2006 include the results of operations for our predecessor from April 14, 2006 and the results of operations for Solera Holdings, LLC for all of fiscal 2006. Financial information presented reflects adjustment of assets and liabilities to then fair value at the date of the Acquisition, which is used as the basis for amounts included in our results of operations from April 14, 2006 until June 30, 2006. Prior to the Acquisition, Solera Holdings, LLC’s operations consisted primarily of developing our business plan, recruiting personnel, providing consulting services, raising capital and identifying and evaluating operating assets for acquisition.
(3) All unit and per unit amounts give effect to a one-for-three reverse split of our common units, which was completed on April 30, 2007.
28
ITEM 7. MANAGEMENT’S DISCUSSION & ANALYSIS OF FINANCIAL CONDITION & RESULTS OF OPERATIONS
You should read the following discussion and analysis of our financial condition and results of operations in conjunction with the information set forth under Item 6. “Selected Financial Data” and our consolidated financial statements and the notes to those statements included elsewhere in this Annual Report on Form 10-K. The statements in this discussion regarding industry outlook, our expectations regarding our future performance, liquidity and capital resources and other non-historical statements in this discussion are forward-looking statements. These forward-looking statements are subject to numerous risks and uncertainties, including, but not limited to, those described under Item 1A. “Risk Factors,” and elsewhere in this Annual Report on Form 10-K. Our actual results could differ materially from the results described in or implied by the forward-looking statements contained in the following discussion and analysis.
Overview of the Business
We are the leading global provider of software and services to the automobile insurance claims processing industry. Our customers include more than 900 automobile insurance companies, including each of the ten largest automobile insurance companies in Europe and each of the ten largest automobile insurance companies in North America. We also provide our software and services to over 33,000 collision repair facilities, 7,000 independent assessors and 3,000 automotive recyclers. Our software and services help our customers: estimate the costs to repair damaged vehicles; determine pre-collision fair market values for vehicles damaged beyond repair; automate steps of the claims process; outsource steps of the claims process that insurance companies have historically performed internally; and improve their ability to monitor and manage their businesses through data reporting and analysis. We have operations in 49 countries and derive most of our revenues from our estimating and workflow software.
Company History
Solera Holdings, LLC was initially formed in March 2005. On April 13, 2006, subsidiaries of Solera Holdings, LLC acquired the Claims Services Group, or CSG, a business unit of ADP, for approximately $1.0 billion. Prior to the Acquisition, Solera Holdings, LLC’s operations consisted primarily of developing our business plan, recruiting personnel, providing consulting services, raising capital and identifying and evaluating operating assets for acquisition. For a discussion of the accounting basis for our financial disclosures, see “Item 1—Business—General.”
We accounted for the Acquisition using the purchase method of accounting. As a result, the Acquisition has and will continue to affect our results of operations significantly. We allocated the aggregate acquisition consideration to the tangible and intangible assets acquired and liabilities assumed based on their respective fair values as of the date of the Acquisition, which resulted in an increase in the accounting bases of some of our assets. This has resulted in a significant increase in our annual depreciation and amortization expenses. In addition, due to the effects of the increased borrowings to finance the Acquisition, our interest expense has increased significantly in the periods following the acquisition. As a result, the financial information for periods beginning on or after July 1, 2006 is not comparable to the information prior to this date.
Prior to the Acquisition, our business was operated as CSG, a business unit of ADP. As a result, the combined financial information of CSG is presented on a carve-out basis and reflects the assets, liabilities, revenues and expenses that were attributed or allocated to it as a business unit of ADP. The historical financial results in the combined financial statements may not be indicative of the results that would have been achieved had we operated as a stand-alone entity. These combined financial statements include costs for facilities, functions and services used by CSG at ADP sites that it shared with other ADP business units
29
and costs for certain functions and services performed by centralized ADP organizations and directly charged to CSG based on usage. The combined statements of earnings for CSG include allocations of certain expenses of ADP, including general corporate overhead, insurance, stock compensation and pension plans, royalty fees, facilities and other expenses. These allocations were based on a variety of factors.
On May 10, 2007, in connection with our initial public offering, we converted from a limited liability company into a Delaware corporation, and all of our Class A Common Units and Class B Preferred Units were converted into shares of our common stock.
Segments
We operate our business using two reportable segments: EMEA and Americas. Our EMEA segment consists of our operations in Europe, the Middle East, Africa and Asia. Our Americas segment consists of our operations in North, Central and South America. Prior to December 1, 2006, we organized our business using three reportable segments: EMEA, Americas and the Netherlands. Since that date, we have reorganized our operations into two regional operating segments (EMEA and Americas) by incorporating our Netherlands operations into our EMEA segment. In addition, for periods prior to the Acquisition, we included our Latin American operations in our EMEA segment. We have recast the financial information in this Annual Report on Form 10-K, other than the information relating to our predecessor, to conform to our current segments.
The table below sets forth our revenues by regional operating segment and as a percentage of our total revenues for the periods indicated.
| | Fiscal Year Ended June 30, | |
| | 2007 | | 2006
(Acquisition pro forma) | | 2005
(Predecessor) | |
EMEA | | $ | 280.1 | | 59.3 | % | $ | 243.3 | | 56.6 | % | $ | 227.0 | | 55.0 | % |
Americas | | 191.9 | | 40.7 | % | 186.9 | | 43.4 | % | 185.4 | | 45.0 | % |
Total | | $ | 472.0 | | 100 | % | $ | 430.2 | | 100 | % | $ | 412.4 | | 100 | % |
Set forth below is our percentage of revenues for the periods presented from each of our principal customer categories:
| | Fiscal Year Ended June 30 | |
| | 2007 | | 2006
(Acquisition pro forma) | | 2005
(Predecessor) | |
Insurance companies | | $ | 207.6 | | 44.0 | % | $ | 192.7 | | 44.8 | % | $ | 184.9 | | 44.8 | % |
Collision repair facilities | | 162.2 | | 34.4 | | 142.6 | | 33.1 | | 130.6 | | 31.7 | |
Independent assessors | | 44.9 | | 9.5 | | 40.3 | | 9.4 | | 36.4 | | 8.8 | |
Automotive recyclers and
others | | 57.3 | | 12.1 | | 54.6 | | 12.7 | | 60.5 | | 14.7 | |
Total | | $ | 472.0 | | 100 | % | $ | 430.2 | | 100 | % | $ | 412.4 | | 100 | % |
For fiscal 2007, the United States, the Netherlands and the United Kingdom were the only countries that individually represented more than 10% of total revenues.
The accounting policies for each of our segments are the same. We evaluate the operating performance of our segments based primarily upon their respective revenues and EBITDA. For the most part, we do not evaluate our costs and expenses on a per segment basis.
30
Components of Revenues and Expenses
Revenues
We generate revenues from the sale of software and services to our customers pursuant to negotiated contracts or pricing agreements. Pricing for our software and services is set forth in these agreements and negotiated with each customer. We generally bill our customers monthly under one or more of the following bases:
· price per transaction;
· fixed monthly amount for a prescribed number of transactions;
· fixed monthly subscription rate;
· price per set of services rendered; or
· price per system delivered.
Our software and services are often sold as packages, without individual pricing for each component. Our revenues are reflected net of customer sales allowances, which we estimate based on both our examination of a subset of customer accounts and historical experience.
Elsewhere in this Annual Report on Form 10-K, solely for ease of understanding, we have grouped our software and services into five general categories: estimating and workflow software, salvage and recycling software, business intelligence and consulting services, shared services and other. See “Business—Our Software and Services.” Our core offering is our estimating and workflow software, which is used by our insurance company, collision repair facility and independent assessor customers and which we believe represents the majority of our revenues. We believe that our salvage and recycling software, business intelligence and consulting services, shared services and other offerings represent in the aggregate a smaller portion of our revenues. We currently derive an insubstantial portion of our revenues from our shared services offerings. We believe that our estimating and workflow software will continue to represent a majority of our revenue for the foreseeable future.
Cost of Revenues (excluding depreciation and amortization)
Our costs and expenses applicable to revenues represent the total of operating expenses and systems development and programming costs, which are discussed below.
Operating Expenses
Our operating expenses include compensation and benefit costs for our operations, database development and customer service personnel; other costs related to operations, database development and customer support functions; third-party data and royalty costs; and costs related to computer software and hardware used in the delivery of our software and services.
Systems Development and Programming Costs
Systems development and programming costs include compensation and benefit costs for our product development and product management personnel, other costs related to our product development and product management functions and costs related to external software consultants involved in systems development and programming activities.
31
Selling, General and Administrative Expenses
Our selling, general and administrative expenses include compensation and benefit costs for our sales, marketing, administration and corporate personnel; other costs related to our sales, marketing, administrative and corporate functions; costs related to our facilities; and professional and legal fees.
Depreciation and Amortization
Depreciation includes depreciation attributable to buildings, leasehold improvements, data processing and computer equipment, furniture and fixtures. Amortization includes amortization attributable to software purchases and software developed or obtained for internal use and our intangible assets, the majority of which were acquired in the Acquisition.
Interest Expense
Interest expense consists primarily of payments of interest on our credit facilities and amortization of related debt issuance costs.
Other (Income) Expense-Net
Other (income) expense-net consists of foreign exchange gains and losses on notes receivable and notes payable to affiliates as well as other miscellaneous income and expense.
Minority Interests in Net Income of Consolidated Subsidiaries
Several of our customers own minority interests in our local operating subsidiaries. Minority interests in net income of consolidated subsidiaries reflect such customers’ proportionate interest in the earnings of such operating subsidiaries. In April 2004, we increased our ownership interest in a Spanish entity from 25% to 75%, which resulted in such entity being consolidated with our results of operations.
Income Tax Provision (Benefit)
Prior to our corporate reorganization on May 10, 2007, we were a limited liability company and, therefore, we were not subject to entity-level federal income taxation. However, even as a limited liability company, we incurred income taxes on our operations as they were held by taxable entities in the U.S. and in foreign jurisdictions. Historical financial statements for our predecessor, which was a C corporation for federal income tax purposes, are based on corporate tax rates for the periods presented. Prior to our corporate reorganization, our income taxes were payable by our equity holders at rates applicable to them. Following our conversion to a C corporation, transactions recorded by us are subject to federal income taxation for which we do not expect a significant impact to our overall income tax liability. Income taxes have been provided for all items included in the statements of income (loss) included herein, regardless of when such items were reported for tax purposes or when the taxes were actually paid or refunded.
As part of the Acquisition, a portion of the purchase price was allocated to intangible assets and goodwill. For most jurisdictions in which we operate, the amortization charges and impairment charges will not be deductible for income tax purposes. The net deferred tax liability as shown on our balance sheet is primarily the result of the difference between book and tax basis of the acquired intangible assets.
Factors Affecting Our Operating Results
Overview. The automobile insurance claims processing industry is influenced by growth and trends in the automobile insurance industry. Demand for our software and services is generally related to automobile usage and the penetration of automobile insurance in our markets. A large portion of our
32
operating costs are fixed and we generate a large percentage of our revenues from periodic-and transaction-based fees related to software and ongoing claims processing services.
Our operating results are and will be influenced by a variety of factors, including:
· gain and loss of customers;
· pricing pressures;
· expansions into new markets, which requires us to incur costs prior to generating revenues;
· expenses to develop new software or services;
· restructuring charges related to efficiency initiatives;
· the Acquisition in April 2006, including the debt we incurred; and
· our corporate reorganization and the refinancing transactions.
Foreign currency. During the fiscal year ended June 30, 2007, we generated approximately 69% of our revenues, and incurred a majority of our costs, in currencies other than the U.S. dollar, primarily the Euro. We currently do not hedge our exposure to foreign currency risks. In our historical financial statements, we re-measure our local currency financial results in U.S. dollars based on average exchange rates prevailing during a reporting period or the exchange rate at the end of that period. These re-measurements resulted in foreign currency translation adjustments of $3.8 million in fiscal 2006 and $4.8 million in fiscal 2007 in our consolidated financial statements.
In February 2006, we entered into a foreign exchange option that gave us the right to call $200.0 million in U.S. dollars at a strike price of €1.1646 per U.S. dollar at any time up to February 8, 2011. We paid approximately $7.9 million for this option. The fair value of this option was approximately $4.0 million as of June 30, 2006 and $1.0 million as of June 30, 2007, and was recorded in other assets in our consolidated balance sheet. Decreases in fair value of approximately $3.9 million, and $3.0 million were recognized in other expense in the statement of operations during fiscal 2006 and 2007, respectively.
Non-cash charges. On July 25, 2006, November 8, 2006 and January 26, 2007, we granted the right to purchase Class A common units to certain employees. Under these and other arrangements, we issued an aggregate of 625,429 Class A common units to 20 of our employees for $0.2 million in January 2007 and an aggregate of 50,000 Class A common units to two of our employees for $15,000 in February 2007. In May 2007, we issued restricted stock units covering an aggregate of 304,730 shares to certain of our employees. We expect to incur a pre-tax, non-cash charge of approximately $7.6 million in connection with these issuances, expensed ratably over vesting periods of up to 60 months. During fiscal 2007, we have recognized approximately $2.3 million as compensation expense. In the fourth quarter of fiscal 2007, we incurred an additional pre-tax, non-cash charge of approximately $35.7 million on the early extinguishment of debt associated with the completion of our initial public offering and the refinancing of debt. This relates primarily to the write-off of unamortized debt issuance costs and a prepayment premium on our second lien credit facility and our subordinated unsecured credit facility.
Restructuring charges. We have incurred restructuring charges (or reversal) in each period presented and also expect to incur additional restructuring charges, primarily relating to severance costs, over the next several quarters as we work to improve efficiencies in our business. We are currently evaluating several plans that would eliminate redundant personnel in each of our segments, as well as reduce our need for certain facilities. If all of these plans were to be executed upon, we would expect to incur restructuring charges of approximately $3.0 million to $4.0 million over the next twelve months. These potential charges, consisting primarily of termination benefits, will significantly reduce our cash balances. The resulting benefit of these restructuring plans, if implemented, would reduce our cost of revenues and our selling, general and administrative expenses by approximately $2.5 million to $4.0 million on an annual
33
basis. We do not expect reduced revenues or an increase in other expenses as a result of any of these restructuring plans.
Results of Operations
The table below sets forth our results of operations data expressed as a percentage of revenues for the periods indicated:
| | Fiscal Year Ended June 30, | |
| | 2007 | | 2006
(Acquisition
pro forma) | | 2005
(Predecessor) | |
Revenues | | 100 | % | | 100 | % | | | 100 | % | |
Cost of revenues: | | | | | | | | | | | |
Operating expenses | | 29.3 | | | 30.2 | | | | 28.5 | | |
Systems development and programming costs | | 13.8 | | | 15.0 | | | | 15.2 | | |
Total cost of revenues (excluding depreciation and amortization) | | 43.1 | | | 45.2 | | | | 43.7 | | |
Selling, general & administrative expenses | | 28.5 | | | 25.8 | | | | 27.3 | | |
Depreciation and amortization | | 22.1 | | | 28.4 | | | | 8.3 | | |
Restructuring charges | | 1.3 | | | 0.6 | | | | 1.3 | | |
Interest expense | | 14.8 | | | 16.6 | | | | 0.1 | | |
Other (income) expense—net | | 6.7 | | | (0.3 | ) | | | (1.0 | ) | |
Earnings before provision for income taxes and minority interests | | (16.5 | ) | | (16.3 | ) | | | 20.3 | | |
Income tax provision (benefit) | | (0.2 | ) | | 0.2 | | | | 5.8 | | |
Minority interest in net income of consolidated subsidiaries | | 0.9 | | | 1.0 | | | | 0.5 | | |
Net earnings (loss) from continuing operations | | (17.2 | ) | | (17.5 | ) | | | 14.0 | | |
The table below sets forth statement of operations data, including the amount and percentage changes for the periods indicated:
| | Fiscal Year Ended June 30, | | 2007 to 2006
Change | | 2006 to 2005
Change | |
| | 2007 | | 2006
(Acquisition
pro forma) | | 2005
(Predecessor) | | $ | | % | | $ | | % | |
| | (dollars in thousands) | |
Revenues | | $ | 471,960 | | | $ | 430,230 | | | | $ | 412,355 | | | $ | 41,730 | | 9.7 | % | $ | 17,875 | | 4.3 | % |
Cost of revenues: | | | | | | | | | | | | | | | | | | | |
Operating expenses | | 138,345 | | | 129,834 | | | | 117,361 | | | 8,511 | | 6.6 | | 12,473 | | 10.6 | |
Systems development and programming costs | | 65,041 | | | 64,357 | | | | 62,690 | | | 684 | | 1.1 | | 1,667 | | 2.7 | |
Total cost of revenues (excluding depreciation and
amortization) | | 203,386 | | | 194,191 | | | | 180,051 | | | 9,195 | | 4.7 | | 14,140 | | 7.9 | |
Selling, general and administrative expenses | | 134,545 | | | 110,950 | | | | 112,480 | | | 23,595 | | 21.3 | | (1,530 | ) | (1.4 | ) |
Depreciation and amortization | | 104,419 | | | 122,560 | | | | 34,335 | | | (18,141 | ) | (14.8 | ) | 88,225 | | 257.0 | |
Restructuring charges | | 6,049 | | | 2,403 | | | | 5,512 | | | 3,646 | | 151.7 | | (3,109 | ) | (56.4 | ) |
Interest expense | | 69,681 | | | 71,388 | | | | 334 | | | (1,707 | ) | (2.4 | ) | 71,054 | | 21,273.7 | |
Other (income) expense—net | | 31,509 | | | (1,233 | ) | | | (4,065 | ) | | 32,742 | | (2,655.5 | ) | 2,832 | | (69.7 | ) |
Earnings before provision for income taxes and minority interest | | (77,629 | ) | | (70,029 | ) | | | 83,708 | | | (7,600 | ) | (10.9 | ) | (153,737 | ) | (183.7 | ) |
Income tax provision (benefit) | | (773 | ) | | 957 | | | | 24,030 | | | (1,730 | ) | (180.8 | ) | (23,073 | ) | (96.0 | ) |
Minority interest in net income of consolidated subsidiaries | | 4,050 | | | 4,389 | | | | 1,909 | | | (339 | ) | (7.7 | ) | 2,480 | | 129.9 | |
Net earnings (loss) from continuing operations | | $ | (80,906 | ) | | $ | (75,375 | ) | | | $ | 57,769 | | | $ | (5,531 | ) | (7.3 | ) | $ | (133,144 | ) | (230.5 | )% |
34
Fiscal Year Ended June 30, 2007 Compared to Fiscal Year Ended June 30, 2006 (Acquisition Pro Forma)
Revenues. Revenues increased $41.7 million due to higher revenues in both our EMEA and Americas segments. Our EMEA revenues increased $36.8 million, or 15.1%, to $280.1 million due to growth in transaction and subscription revenues in several countries from both existing as well as several new customers, and a $3.5 million increase resulting from the completion of a small acquisition in the Netherlands. Our Americas revenues increased $4.9 million, or 2.6%, to $191.8 million due to growth in transaction and subscription revenues in the U.S., Canada, Brazil and Mexico, partially offset by the loss of several significant U.S. insurance customer contracts, and a reduction in contract pricing terms given to a large U.S. insurance customer. Revenue growth for each of our customer categories was as follows:
| | Fiscal Year Ended
June 30, 2007 | |
Customer category | | | | Revenue
Growth | | Percentage
Change | |
Insurance companies | | | $ | 14.9 | | | | 7.7 | % | |
Collision repair facilities | | | 19.6 | | | | 13.7 | | |
Independent assessors | | | 4.6 | | | | 11.4 | | |
Automotive recyclers and other | | | 2.6 | | | | 4.8 | | |
Total | | | $ | 41.7 | | | | 9.7 | % | |
| | | | | | | | | | | | |
Operating expenses. Operating expenses increased $8.5 million, or 6.6%, due to higher operating expenses in both our EMEA and Americas segments. Operating expenses increased $0.9 million in our Americas segment due to a $0.7 million increase in third party license and royalty fees and a $0.4 million increase in personnel costs, offset by a $0.2 million decrease in other operating expenses. Operating expenses increased $7.6 million in our EMEA segment due to a $10.8 million increase in data center and external support and maintenance costs and a $2.0 million increase in third party license and royalty costs, offset by a $4.0 million decrease in personnel costs and a $1.2 million decrease in other operating expenses. We continually evaluate our operating costs in order to identify inefficiencies and eliminate unnecessary costs. We anticipate that, although our operating expenses will continue to increase, they will decline as a percentage of revenues over the next several years.
Systems development and programming costs. Systems development and programming costs increased $0.7 million, or 1.1%, due to a $3.6 million increase in costs in our EMEA segment, offset by a $2.9 reduction in costs in our Americas segment The increased costs in our EMEA segment were related to additional expenses associated with the development of software updates and new software releases. The lower costs in our Americas segment were due to reductions in the number of full-time systems development and programming personnel and lower external software consultant costs. Our systems development and programming costs fluctuate based upon the levels and timing of product releases. We expect our systems development and programming costs to remain relatively stable over the next several quarters.
Selling, general and administrative expenses. Selling, general and administrative expenses increased $23.6 million, or 21.3%, due to increased costs of $13.4 million in our EMEA segment and increased costs of $10.2 million in our Americas segment. The increased costs in our Americas segment were the result of an increase in professional and legal fees, facilities costs, and severance and acquisition transition costs. The increased costs in our EMEA segment were the result of an increase in personnel costs, facilities costs, advertising costs and severance and acquisition transition costs. A portion of these costs increases in our EMEA segment were the result of our expansion efforts into new markets, such as Eastern Europe, India and China. We expect these expenses to continue to increase as we incur additional costs associated with being a public company and as we continue to expand our business into new markets.
35
Depreciation and amortization. Depreciation and amortization decreased by $18.1 million primarily due to lower intangibles amortization expense resulting from the Acquisition. We amortize these intangible assets on an accelerated basis to reflect the pattern in which economic benefits of the intangible assets are consumed. Although we expect to experience significant depreciation and amortization in the future as we amortize intangible assets purchased in the Acquisition, we anticipate that the amount of total depreciation and amortization expense will continue to decline over the next several years.
Restructuring charges. Restructuring charges of $6.0 million were incurred during fiscal 2007 as a result of operational reviews conducted after the Acquisition and relate almost entirely to one-time termination benefits. We expect to incur additional restructuring charges, relating primarily to severance costs, over the next several quarters as we work to improve efficiencies in our business.
Interest expense. Interest expense decreased $1.7 million due to lower borrowings under our credit facilities, which were in part due to the refinancing transactions completed on May 16, 2007 in conjunction with our initial public offering. We expect that our annual interest expense will continue to decrease as we repay outstanding indebtedness.
Other (income) expense, net. Total other (income) expense, net increased $32.7 million due to a $35.7 million write-off of deferred financing fees associated with our prior credit facilities that were amended and restated on May 16, 2007 in conjunction with our initial public offering, offset by lower net realized and unrealized losses on our derivative instruments and other (income) and expenses.
Income tax provision. We recorded an income tax benefit of $0.8 million for fiscal 2007. Factors that impact our income tax provision include (but are not limited to) the mix of jurisdictional earnings, establishment of valuation allowances in certain jurisdictions, and varying jurisdictional income tax rates that are applied.
Fiscal Year Ended June 30, 2006 (Acquisition Pro Forma) Compared to Fiscal Year Ended June 30, 2005 (Predecessor)
Revenues. Revenue growth in fiscal 2006 (Acquisition pro forma) was due to a significant increase in revenues in our EMEA segment and a small increase in revenues in our Americas segment. Our EMEA revenues grew $16.3 million, or 7.2%, to $243.3 million due to a $16.3 million increase in revenues resulting from the inclusion of a full twelve months of operations of our Spanish subsidiary, which we began consolidating in May 2005, and a $1.8 million increase due to the acquisition of two German entities in fiscal 2006. These increases were partially offset by reduced sales in several of our European countries resulting from prior price reductions offered to several customers. Our Americas revenues increased $1.6 million, or 0.8%, to $186.9 million due to growth in Canada, Brazil and Mexico, partially offset by the loss of several significant U.S. insurance company customer contracts and a reduction in contract pricing terms given to a large U.S. insurance customer.
Operating expenses. The $12.5 million increase in operating expenses was due to an increase of approximately $7.5 million in costs of customer support, operations, and database development personnel and approximately $5.0 million as a result of the inclusion of a full twelve months of operations of our Spanish subsidiary, which we began consolidating in May 2005.
Systems development and programming costs. Systems development and programming costs increased $1.7 million due to increases of $0.6 million in systems development and programming personnel and external software consultant costs related to the development of software version updates and new product releases in certain of our markets and approximately $1.1 million related to inclusion of a full twelve months of operations of our Spanish subsidiary.
Selling, general and administrative expenses. Selling, general and administrative expenses decreased due to reduced costs of executive, administrative and sales personnel, which resulted from a workforce
36
reduction, partially offset by an increase of approximately $2.4 million due to the inclusion of a full twelve months of operations of our Spanish subsidiary.
Depreciation and amortization. Depreciation and amortization increased significantly due to the amortization of intangibles associated with the Acquisition. The depreciation and amortization corresponded to the value allocated to our assets as a result of the Acquisition.
Restructuring charges. We recorded restructuring charges, which consisted primarily of one-time termination benefits, of approximately $2.4 million during fiscal 2006 (Acquisition pro forma) as a result of restructuring initiatives related to operational reviews conducted after the Acquisition. These restructuring initiatives were designed to achieve efficiencies and reduce costs in response to changes in projected demand for certain of our services and include one-time termination benefits related to the termination of approximately 45 employees. We recorded restructuring charges, which primarily consisted of one-time termination benefits, of approximately $5.5 million during fiscal 2005 (Predecessor) as a result of similar restructuring initiatives. These one-time termination benefits related to the termination of approximately 125 employees.
Interest expense. Interest expense increased significantly as a result of borrowings under our credit facilities in connection with the Acquisition.
Other (income) expense, net. Other expense in fiscal 2006 (Acquisition pro forma) included a $3.9 million write-down in the fair value of our foreign currency exchange option offset by a $1.1 million unrealized gain related to two interest rate swaps.
Income tax provision. Income taxes were a provision of $1.0 million in fiscal 2006 (Acquisition pro forma) compared to $24.0 million in fiscal 2005 (Predecessor) as a result of amortization expense and interest expense associated with the Acquisition. Pro forma fiscal 2006 reflects a pro forma tax rate of 1.3% and fiscal 2005 (Predecessor) reflects an actual tax rate of 28.7%. The fiscal 2006 (Acquisition pro forma) tax expense is primarily due to losses of $51.4 million resulting from interest charges related to Acquisition indebtedness occurring in jurisdictions for which we have not recorded a tax benefit due to uncertainty regarding the realizability of such losses.
Liquidity and Capital Resources
Prior to the Acquisition, our predecessor’s principal sources of liquidity were capital contributions from ADP and cash generated from operations. Since the Acquisition, our principal sources of cash have included cash generated from operations and bank borrowings. Our principal uses of cash have included debt service, capital expenditures and working capital. We expect that these will remain our principal uses of cash in the future; however, we may use additional cash to pursue additional acquisitions. We expect our cash needs to service debt will decrease in future periods as a result of the application of proceeds from the refinancing transactions completed in conjunction with our initial public offering which were used to repay debt.
We believe that cash flow from operating activities and borrowings under our amended and restated senior credit facility will be sufficient to fund currently anticipated working capital, planned capital spending and debt service requirements for the foreseeable future, including at least the next twelve months. We regularly review acquisition and other strategic opportunities, which may require additional debt or equity financing. We currently do not have any pending agreements or understandings with respect to any acquisition or other strategic opportunity.
Cash and Cash Equivalents
As of June 30, 2007, we had cash and cash equivalents of $89.9 million. We fund our operations, working capital and capital expenditures with our cash on hand and short-term borrowings under our
37
credit facility. Our cash on hand and short-term borrowings vary significantly based on our cash flows as set forth below.
Cash Flows
The following summarizes our primary sources and uses of cash in the periods presented:
| | Fiscal Year Ended June 30, | |
| | 2007 | | 2006 | | 2005
(Predecessor) | |
| | (in thousands) | |
Operating activities | | $ | 46,078 | | $ | 45,356 | | | $ | 106,840 | | |
Investing activities | | $ | (41,507 | ) | $ | (936,471 | ) | | $ | (62,975 | ) | |
Financing activities | | $ | (6,356 | ) | $ | 977,954 | | | $ | (33,369 | ) | |
Operating activities. Cash provided by operating activities was $46.1 million and $45.4 million during fiscal 2007 and 2006, respectively. The increase in cash provided by operating activities during fiscal 2007 was primarily the result of an increase in the non-cash adjustments, such as depreciation and amortization and loss on debt extinguishment, to reconcile net loss to cash, partially offset by the changes in operating assets and liabilities. Cash provided by operations decreased in fiscal 2006 due primarily to the fact that our figure for fiscal 2006 incorporates the results of our predecessor only for the period from April 14, 2006 through June 30, 2006 and our figure for fiscal 2005 represents a full twelve months of our predecessor’s operations.
Investing activities. Cash used in investing activities in fiscal 2005 included acquisition of 50% interest in an affiliate in Spain for approximately $31.5 million. Cash used in investing activities in fiscal 2006 included $924.4 million net cash amount used to complete the Acquisition on April 13, 2006. In fiscal 2007, we acquired a small operating entity in the Netherlands for approximately $1.0 million. We also paid approximately $13.2 million to ADP as final working capital payment for the Acquisition.
For fiscal 2007, capital expenditures were $27.2 million, consisting of computers, computer software, leasehold improvements and furniture and fixtures. Capital expenditures were $7.7 million and $4.1 million in fiscal 2005 and 2006, respectively, and were for the purchase of computers, computer software, leasehold improvements and furniture and fixtures. Our predecessor’s capital expenditures were $9.7 million during the period from July 1, 2005 through the date of the Acquisition.
Financing activities. Cash used in financing activities was $6.4 million during fiscal 2007 and cash provided by financing activities was $978.0 million during fiscal 2006. Cash used during fiscal 2007 was the net result of our initial public offering and debt refinancing proceeds offset by payments on the original debt incurred for the Acquisition. Cash provided by financing activities during fiscal 2006 consisted primarily of issuances of debt, offset by the payment of principal on our long-term borrowings.
Financing activities in fiscal 2005 included amounts received from ADP, the parent of our predecessor. Financing activities in fiscal 2006 included proceeds raised by us to finance the Acquisition on April 13, 2006. The aggregate purchase price for the Acquisition was approximately $1.0 billion, including costs attributable to the Acquisition. The Acquisition was financed through:
· borrowings under our senior secured credit facility of approximately $714.6 million;
· borrowings under our subordinated unsecured credit facility of approximately $95.2 million; and
· the sale of equity securities to investment funds managed by GTCR and other related investors and certain members of our senior management for approximately $207.8 million.
38
We received $281.8 million in net proceeds from our initial public offering, which we completed on May 16, 2007, after deducting underwriting discounts, commissions and expenses of approximately $25.4 million, and $610.7 million in net proceeds under our amended and restated credit facility, after debt issuance costs of approximately $4.4 million. $889.2 million of the $892.5 million of combined net proceeds were used to repay (1) $538.6 million under our then existing first lien credit facility, (2) $226.2 million under our then existing second lien credit facility, and (3) $124.4 million under our then existing subordinated unsecured credit (mezzanine) facility.
Amended and Restated Senior Credit Facility
In connection with our initial public offering, we entered into an amended and restated senior credit facility. Our amended and restated senior credit facility consists of a $50.0 million revolving credit facility, a $230.0 million domestic term loan and a €280.0 million European term loan. As of June 30, 2007, we had $8.1 million, $229.4 million and $375.8 million (€279.3 million) in outstanding loans under the revolving credit facility, domestic term loan and European term loan, respectively, with interest rates of 6.375%, 7.360% and 6.164%, respectively. The amended and restated senior credit facility contains a leverage ratio, which is applicable only to the revolving loans and applies only if at least $10.0 million of revolving loans, net of outstanding letters of credit, are outstanding for at least 10 days during the prior fiscal quarter.
In addition, the amended and restated senior credit facility contains covenants restricting us from undertaking specified corporate actions, including asset dispositions, acquisitions, payment of dividends and other specified payments, changes of control, incurrence of indebtedness, creation of liens, making loans and investments and transactions with affiliates.
Contractual Obligations and Commercial Commitments
The following table reflects our contractual obligations as of June 30, 2007:
| | Payments Due by Period | |
| | Total | | Less than
1 Year | | 1-3 Years | | 3-5 Years | | More than
5 Years | |
| | (in thousands) | |
Long-term debt obligations(1) | | $ | 875,857 | | | $ | 51,899 | | | $ | 89,687 | | $ | 85,014 | | $ | 649,257 | |
Software license and other obligations | | 16,161 | | | 10,688 | | | 5,394 | | 79 | | — | |
Operating lease obligations | | 58,463 | | | 12,757 | | | 21,700 | | 15,202 | | 8,804 | |
Total | | $ | 950,481 | | | $ | 75,344 | | | $ | 116,781 | | $ | 100,295 | | $ | 658,061 | |
(1) Represents principal maturities and includes the effects of interest and interest rate swaps.
Off-Balance Sheet Arrangements
Our off-balance sheet arrangements comprise our operating leases. As of June 30, 2007, we had no outstanding letters of credit.
Inflation and Seasonality
We believe inflation has not had a material effect on our financial condition or results of operations in recent years. Our business does not experience any material level of seasonality.
Critical Accounting Policies and Estimates
The accompanying consolidated financial statements of Solera Holdings, Inc., have been prepared in accordance with generally accepted accounting principles. The preparation of these financial statements requires us to make estimates and judgments that affect the amounts reported in those financial
39
statements. On an ongoing basis, we evaluate estimates. We base our estimates on historical experiences and assumptions which we believe to be reasonable under the circumstances. Those estimates form the basis for our judgments that affect the amounts reported in the financial statements. Actual results could differ from our estimates under different assumptions or conditions. Our significant accounting policies, which may be affected by our estimates and assumptions, are more fully described in Note 2 to the consolidated financial statements of Solera Holdings, Inc. and the accompanying consolidated financial statements.
Goodwill and other intangible assets. We account for goodwill and other intangible assets in accordance with Statement of Financial Accounting Standards, or SFAS, No. 142, Goodwill and Other Intangible Assets, which states that goodwill and intangible assets with indefinite useful lives should not be amortized, but instead be tested for impairment at least annually at the reporting unit level. If an impairment exists, a write-down to fair value (normally measured by discounting estimated future cash flows) is recorded. Intangible assets with finite lives are amortized over their estimated useful lives based on expected revenues to be generated from the use of such assets and are reviewed for impairment in accordance with SFAS No. 144, Accounting for the Impairment or Disposal of Long-Lived Assets. As of June 30, 2007, we had goodwill of $569.2 million and intangible assets of $363.0 million.
Revenue recognition. We consider the guidance in Staff Accounting Bulletin Topic 13, Revenue Recognition, or SAB 104, American Institute of Certified Public Accountants, or AICPA, Statement of Position 97-2, Software Revenue Recognition, as amended, or SOP 97-2, SFAS No. 13, Accounting for Leases, Emerging Issues Task Force, or EITF, Issue No. 00-03, Application of AICPA Statement of Position 97-2 to Arrangements That Include the Right to Use Software Stored on Another Entity’s Hardware, and Emerging Issues Task Force Issue No. 00-21, Revenue Arrangements with Multiple Deliverables, or EITF 00-21, in accounting for our revenue arrangements. Revenues are recognized only after services are provided, when persuasive evidence of an arrangement exists, the fee is fixed and determinable, and when collectibility is reasonably assured. Our multiple element arrangements primarily include a combination of software licenses, hosted database and other services, installation and set-up services, hardware, maintenance services and transaction-based deliverables.
We generate a significant majority of our revenue from subscription-based contracts (where a monthly fee is charged), transaction-based contracts (where a fee per transaction is charged) and subscription-based contracts with additional transaction-based fees (where a monthly fee and a fee per transaction are charged).
Subscription-based and transaction-based contracts generally include the delivery of software, access to software through a hosted service, or hosted database, upfront fees for the implementation and set-up activities necessary for the client to use/access the software, or implementation services, and maintenance. Under a subscription arrangement, delivery of software, access to the hosted database and maintenance are considered a single element or a combined unit of accounting, and related revenues are recognized at the end of each month upon the completion of the monthly service. Revenues under transaction-based contracts are recognized based on the guidance in AICPA Technical Practice Aid 5100.76, Fair value in multiple-element arrangements that include contingent usage based fees and software revenue recognition, or TPA 5100.76. The transaction-based fee represents payment for the right to use the software, access to the hosted database and maintenance. The fee is considered fixed and determinable only at the time actual usage occurs. Revenue is recognized-based on actual usage. Implementation services are considered a separate element or unit of accounting and the related revenue recognition is described below.
Subscription-based contracts with additional fees for certain types of transactions generally include all deliverables discussed in the above paragraph and also include an additional element, which is the option to access specialized queries on the hosted database. Revenue under subscription-based contracts with additional fees for certain types of transactions is accounted for based on the guidance in TPA 5100.76.
40
Under these arrangements, the delivery of software, access to software through the hosted database, and maintenance are considered a combined unit of accounting and the related fee is recognized at the end of each month upon the completion of the monthly service. The transaction-based fee is recognized at the time of actual usage. Implementation services are considered a separate element or unit of accounting and the related revenue recognition is described below.
When we are required to perform setup and implementation activities necessary for the client to receive services and/or software, up-front fees billed during the setup/implementation phase are deferred and amortized on a straight-line basis over the estimated customer life. The upfront fees represent fair value of the implementation services based on vendor specific objective evidence. The amortization of this deferred revenue will commence upon the start of the monthly service. Setup costs that are direct and incremental to the contract are capitalized and amortized on a straight-line basis over the estimated customer life.
In a limited number of revenue arrangements described above, we also provide generic computer equipment as part of the sales arrangement. Based on guidance in EITF Issue No. 03-5, Applicability of AICPA Statement of Position 97-2, “Software Revenue Recognition”, to Non-Software Deliverables in an Arrangement Containing More-than-Incidental Software, the generic computer equipment is considered a non-software deliverable since our software is not essential to the functionality of the generic computer equipment. Based on guidance in EITF No. 01-8, Determining Whether an Arrangement Contains a Lease, EITF 00-21, Revenue Arrangements with Multiple Deliverables, and SFAS 13, Accounting for Leases, or SFAS 13, we account for the sale of generic equipment as a direct finance lease. The related revenue is recognized over the term of the contract using the effective interest rate method. We allocate revenue to SFAS 13 elements (equipment leases) and the non-SFAS 13 elements of its arrangements on a relative fair value basis using our best estimate of the fair value of the elements. Revenue from leased computer equipment represents approximately 1% of our consolidated revenue.
Revenues are reflected net of customer sales allowances, which are based on both specific identification of certain accounts and a predetermined percentage of revenue based on historical experience.
Stock-Based Compensation. Effective July 1, 2006, we adopted SFAS No. 123 (revised 2004), Share-Based Payment, or SFAS 123(R), which requires the measurement and recognition of compensation expense for all stock-based payment awards made to employees and directors, including employee stock options and share awards, based on estimated fair values recognized over the requisite service period. Prior to adoption of SFAS 123(R), pursuant to SFAS No. 123 Accounting for Stock-Based Compensation, we accounted for employee share awards under Accounting Principles Board, or APB, No. 25, Accounting for Stock Issued to Employees, or APB Opinion No. 25, and followed the Disclosure—Only Provisions of SFAS No. 123.
We made the following grants of, or granted the following rights to purchase, common units/shares or restricted common units/shares from January 1, 2006 to June 30, 2007:
Grant Date | | | | Number of
restricted
common
shares/units | | Purchase
price per
common
share/unit | | Fair value
per common
share/unit | | Was fair value
determined in a
contemporaneous
valuation | | Intrinsic
value per unit
(based on
fair value and
purchase price) | | Intrinsic
value per unit
(based on the
initial public
offering
price) | |
April 13, 2006 | | | 1,230,942 | | | | $ | 0.30 | | | | $ | 2.94 | | | | Yes | | | | $ | 2.64 | | | | $ | 15.70 | | |
July 25, 2006 | | | 1,097,846 | | | | $ | 0.30 | | | | $ | 2.94 | | | | No | | | | $ | 2.64 | | | | $15.70 | | |
November 8, 2006 | | | 34,165 | | | | $ | 0.30 | | | | $ | 12.36 | | | | Yes | | | | $ | 12.06 | | | | $ | 15.70 | | |
January 26, 2007 | | | 50,000 | | | | $ | 0.30 | | | | $ | 15.30 | | | | Yes | | | | $ | 15.00 | | | | $ | 15.70 | | |
May 11, 2007 | | | 304,730 | | | | $ | 0.01 | | | | $ | 16.00 | | | | Yes | | | | $ | 15.99 | | | | $ | 15.99 | | |
41
As of June 30, 2007, we had 1,996,760 shares outstanding from the grants made on April 13, July 25, November 8, 2006, January 26, 2007, and May 11, 2007. Based on the initial public offering price of $16.00 per share, the aggregate intrinsic value of these outstanding shares as of June 30, 2007, was $31.4 million, of which $11.7 million related to 743,388 vested shares and $19.7 million related to 1,253,372 unvested shares. At the Acquisition date, and at each subsequent date that we granted equity awards to our employees, we were required to determine the fair value of our aggregate equity, as well as the individual fair value of each of our preferred and common units. The terms of the preferred units provided that such units could be redeemed by us at any time at their redemption value, which was equal to the unreturned capital contributions made in respect of such preferred units, plus accrued and unpaid yield of 8% per annum. As a result, a significant portion of any subsequent increase in our aggregate equity value, as determined at each subsequent measurement date, was attributed to the common units as opposed to the preferred units. The fixed-return nature of the preferred units was demonstrated by the formula we used to convert our preferred units into shares of common stock in our corporate reorganization: the liquidation value of the preferred units plus accrued and unpaid yield divided by the initial public offering price.
We acquired the Claims Services Group from ADP on April 13, 2006 based on a competitive auction process. We therefore believe that the enterprise value and aggregate equity value derived from this transaction were representative of their respective fair values. The enterprise fair value was validated by using market multiple and discounted cash flow methods. We used an internal rate of return, or IRR, method to allocate our aggregate equity value between our preferred and common units. The IRR method is similar to the Probability Weighted Expected Return Method described in the AICPA Audit and Accounting Practice Aid for Valuation of Privately-Held Company Equity Securities Issued as Compensation. We determined that the IRR method was the most appropriate method to use because it enabled us to directly determine the value of our preferred units based upon an expected return method using market rates, and thus to allocate any remaining aggregate equity value to our common units. The IRR method is based upon the value we assign to various future outcomes or exit events. The per unit values are based on the probability weighted present value of expected future returns, considering each of the possible future outcomes available to us, as well as the rights of each class of our equity securities. On April 13, 2006, using the IRR method described above, we determined that the value of each preferred unit was equal to $600.40 per unit and that the value of each common unit was equal to $2.94 per unit. We assumed a 5.2 year holding period based upon a hypothetical exit event in June 2011, which we considered reasonable at the time based on typical targeted holding periods for private equity funds. Because we had just acquired the Claims Services Group and assembled a new management team, we considered an exit event that is typical for private equity funds as the most appropriate outcome for us. We assigned a 100% probability to this expected outcome. A 19.0% IRR was targeted for the preferred units based on the median IRR of various preferred spread studies we determined to be relevant. Based on the targeted return for the preferred units, we derived an implied return on our common equity of 36.0%. The aggregate equity return was derived based on EBITDA exit multiples of 8.0x. These exit multiples were deemed appropriate based on comparable company multiples and our financial projections at the time. We determined that the aggregate equity return of approximately 27.2% was consistent with expected returns of financial sponsors in similar situations.
On July 25, 2006, we determined that there was no change in the fair value of the common units from April 13, 2006, and therefore used a value of $2.94 per common unit to determine the compensation expense for the rights to purchase common units we granted on that date. We believed that there was no change in fair value between April 13, 2006 and July 25, 2006 due to the following factors: (1) the relative valuation metrics of the selected comparable publicly traded companies increased as much as 2.8% and decreased by as much as 26.8%, with an average decrease of 12.2% during this period; and we searched for and were unable to find any acquisitions of comparable businesses during the period from April 13, 2006 to July 25, 2006, causing us to determine that there was no change in the acquisition multiples of comparable businesses contained in the April 13, 2006 report; (2) our financial projections, growth and cash flow
42
forecasts on July 25, 2006 had not changed significantly from those used in the April 13, 2006 discounted cash flows method of valuation due to the limited passage of time; (3) we experienced no significant developments between April 13, 2006 and July 25, 2006, such as significant contract wins that would have impacted relative valuations; and (4) we had no discussions with external parties, including investment banks, regarding our prospects during this period.
On November 8, 2006, we determined that our aggregate equity value had increased by approximately $360 million as a result of an increase in our enterprise value of approximately $310 million and a reduction in our net debt of approximately $50 million since the prior measurement date of July 25, 2006. We used the IRR method described above to allocate this increase to our preferred and common units. We used a holding period of approximately 4.6 years, as we still considered an exit event in June 2011 to be a reasonable assumption. This assumption was unchanged from the April 13, 2006 assumption, except for the passage of time. As a result, we assigned a 100% probability to this expected outcome. We used a targeted 11.8% IRR for the preferred units based on the median of various preferred spread studies we determined to be relevant. Based on the targeted return for the preferred units, we derived an implied return on our common equity of 21.6%. The aggregate equity return was derived based on EBITDA exit multiples of 10.0x. These exit multiples were deemed appropriate based on comparable company multiples and our financial projections at that time. We determined that an aggregate equity return of approximately 18.8% was consistent with expected returns of financial sponsors in similar situations. Due to the redemption price of our preferred units being fixed, approximately $300 million of the $360 million increase was ascribed to common units and approximately $60 million was ascribed to preferred units. The approximately $300 million increase in the value of our common units consisted of approximately $214 million attributed to the use of a comparable public company EBITDA multiple that was 24.4% higher than the implied purchase price multiple paid in the Acquisition for valuation purposes; approximately $44 million attributed to an increase in our adjusted EBITDA for the last twelve months of approximately $5.0 million; and approximately $42 million attributed to a reduction in our net debt. As a result, the approximately 30% increase in our enterprise value resulted in a more than 300% increase in the value of our common equity. On November 8, 2006, using the IRR method described above, we determined that the value of each preferred unit was equal to $902.37 per unit and the value of each common unit was equal to $12.36 per unit.
On February 5, 2007, we determined that our aggregate equity value had increased by approximately $110 million as a result of an increase in our enterprise value of approximately $135 million, offset by an increase in our net debt of approximately $25 million since the prior measurement date of November 8, 2006. To derive the aggregate equity value, we used the IRR method with two holding period scenarios: (1) a scenario involving an initial public offering, or IPO, within three months, and (2) a 4.4 year holding period resulting in an exit event in June 2011 similar to our assumptions of April 13, 2006 and November 8, 2006. We applied a 70% probability to the IPO scenario and a 30% probability to the 4.4 year holding period scenario. We considered the three-month scenario to be reasonable given our progress towards making a filing with the SEC regarding an initial public offering. We applied a greater probability to the three-month holding period approach as the probability of a filing for an IPO was estimated to be high. For both exit scenarios, an IPO and a sale, an 11.8% IRR was targeted for the preferred units based on the median of various preferred spread studies we determined to be relevant. Based on the targeted return for the preferred units, we derived implied returns on the common equity of 21.3% using a 4.4 year holding period and 52.5% using three-month period. The aggregate equity returns were derived based on EBITDA exit multiples of 10.0x (4.4 year holding period) and 11x (three-month holding period). These exit multiples were deemed appropriate based on comparable company multiples and our financial projections at that time. The aggregate equity returns of approximately 19% (4.4 year holding period) and 39% (three-month holding period) are consistent with expected returns of financial sponsors in similar situations. Due to the redemption price of our preferred units being fixed, approximately $90 million of the $110 million increase was ascribed to common units and approximately $20 million was ascribed to preferred units. On
43
February 5, 2007, using the IRR method described above, we determined that the value of each preferred unit was equal to $997.36 per unit and the value of each common unit was equal to $15.30 per unit.
Foreign currency translation. The assets and liabilities of our foreign subsidiaries are translated into U.S. dollars based on exchange rates in effect at the end of each period, and revenues and expenses are translated at average exchange rates during the periods. Functional currencies of significant foreign subsidiaries include Euros, British pounds, Swiss francs, and Canadian dollars. Currency transaction gains or losses, which are included in the results of operations, totaled $3.8 million and $4.8 million in fiscal 2006 and 2007, respectively. Gains or losses from balance sheet translation are included in stockholders’ equity within accumulated other comprehensive income on the consolidated balance sheets.
Internal use software. Expenditures for software purchases and software developed or obtained for internal use are capitalized and amortized over a three- to five-year period on a straight-line basis. For software developed or obtained for internal use, we capitalize costs in accordance with the provisions of Statement of Position No. 98-1, Accounting for the Costs of Computer Software Developed or Obtained for Internal Use. Our policy provides for the capitalization of external direct costs of materials and services associated with developing or obtaining internal use computer software. In addition, we also capitalize certain payroll and payroll-related costs for employees who are directly associated with internal use computer software projects. The amount of capitalizable payroll costs with respect to these employees is limited to the time directly spent on such projects. Costs associated with preliminary project stage activities, training, maintenance, and all other post-implementation stage activities are expensed as incurred. We also expense internal costs related to minor upgrades and enhancements as it is impractical to separate these costs from normal maintenance activities.
Income taxes. We use the asset and liability method of accounting for income taxes in accordance with SFAS No. 109, Accounting for Income Taxes. Under this method, income tax expenses or benefits are recognized for the amount of taxes payable or refundable for the current year and for deferred tax liabilities and assets for the future tax consequences of events that have been recognized in our consolidated financial statements or tax returns. We also account for any income tax contingencies in accordance with SFAS No. 5, Accounting for Contingencies. The measurement of current and deferred tax assets and liabilities are based on provisions of currently enacted tax laws. The effects of future changes in tax laws or rates are not contemplated.
In addition, the calculation of our tax liabilities involves dealing with uncertainties in the application of complex tax regulations. We recognize liabilities for anticipated tax audit issues in the United States and other tax jurisdictions based on our estimate of whether, and the extent to which, additional tax payments are probable. If we ultimately determine that payment of these amounts is unnecessary, we reverse the liability and recognize a tax benefit during the period in which we determine that the liability is no longer necessary. This may occur for a variety of reasons, such as the expiration of the statute of limitations with respect to a particular tax return or the signing of a final settlement agreement with the respective tax authority. We record an additional charge in our provision for taxes in the period in which we determine that the recorded tax liability is less than we expect the ultimate assessment to be.
As part of the process of preparing consolidated financial statements, we are required to estimate our income taxes and tax contingencies in each of the jurisdictions in which we operate prior to the completion and filing for tax returns for such periods. This process involves estimating actual current tax expense together with assessing temporary differences, or reversing book-tax differences, resulting from differing treatment of items, such as deferred revenue, for tax and accounting purposes. These differences result in net deferred tax assets and liabilities. We must then assess the likelihood that the deferred tax assets will be realizable and to the extent we believe that realizability is not likely, we must establish a valuation allowance. To the extent we establish a valuation allowance in a period, we must include a tax expense or benefit within the tax provision in the statement of operations. In the event that actual results differ from
44
these estimates or we adjust these estimates in future periods, we may need to adjust our valuation allowances, which could impact our results of operations in the quarter in which such determination is made.
At June 30, 2007, our deferred tax assets of approximately $45 million are comprised of $29 million of net operating losses and the remainder pertaining to temporary differences. Approximately $12 million and $16 million of our net operating losses are generated in the United States and the Netherlands, respectively, and are attributed primarily to interest expense under our debt arrangements. We have established a full valuation allowance against our net operating losses in the Netherlands as we do not believe it is more likely than not that we will generate sufficient income after interest expenses to realize the benefits of the Netherlands net operating losses within the nine-year carryforward period under Netherlands law. While we are continuing to generate net operating losses in the US, we believe it is more likely than not that we will generate sufficient income after interest expense in the US to realize the benefits of these losses within the 20-year carryforward period under US tax law. We considered the following factors in not establishing a valuation allowance against net operating losses generated in the United States:
· a solid history of operating profits and no expiration of unused tax attributes for the U.S. group;
· a future taxable income based on adjusted EBITDA using management’s forecast; and
· potential tax planning strategy to increase U.S. taxable income.
Recent Accounting Pronouncements
On December 16, 2004, the Financial Accounting Standards Board, or the FASB, issued SFAS 123(R), which eliminates the alternative of applying the intrinsic value measurement provisions of Accounting Principles Board, or APB, No. 25, Accounting for Stock Issued to Employees, or APB Opinion No. 25, to stock-based compensation awards issued to employees. Rather, SFAS 123(R) requires enterprises to measure the cost of employee services received in exchange for an award of equity instruments generally based on the grant-date fair value of the award. That cost will be recognized over the period during which an employee is required to provide services in exchange for the award, known as the requisite service period (usually the vesting period). Effective July 1, 2006, we adopted SFAS 123(R), which requires the measurement and recognition of compensation expense for all share-based payment awards made to employees and directors, including employee stock options and share awards, based on estimated fair values recognized over the requisite service period. Prior to adoption of SFAS 123(R), pursuant to SFAS No. 123 Accounting for Stock-Based Compensation, or SFAS 123, we accounted for employee unit awards under APB Opinion No. 25 and followed the disclosure-only provisions of SFAS No. 123.
We adopted SFAS 123(R) using the prospective transition method. Under this method, SFAS 123(R) is applied to new awards and to awards modified, repurchased or cancelled after the adoption date of July 1, 2006. Compensation cost that was previously recorded under APB Opinion No. 25 for awards outstanding at the adoption date, such as unvested options, will continue to be recognized as the options vest. Accordingly, for the year ended June 30, 2007, we recorded $2.3 million in stock/unit-based compensation expense which includes compensation cost related to estimated fair values of awards granted after the date of adoption of SFAS 123(R) and compensation costs related to unvested awards at the date of adoption based on the intrinsic values as previously recorded under APB Opinion No. 25.
In June 2006, the FASB issued Interpretation No. 48, Accounting for Uncertainty in Income Taxes, an interpretation of FAS 109, Accounting for Income Taxes, or FIN 48, to create a single model to address accounting for uncertainty in tax positions. FIN 48 clarifies the accounting for income taxes by prescribing a minimum recognition threshold a tax position is required to meet before being recognized in the
45
financial statements. FIN 48 also provides guidance on derecognition, measurement, classification, interest and penalties, accounting in interim periods, disclosure, and transition. FIN 48 is effective for fiscal years beginning after December 15, 2006. We will adopt FIN 48 as of July 1, 2007, as required. The cumulative effect of adopting FIN 48 will be recorded in retained earnings and other accounts as applicable. We have not determined the effect, if any, that the adoption of FIN 48 will have on our financial position and results of operations. As a result of FIN 48, we could have greater volatility in our effective tax rate in the future.
In September 2006, the FASB issued SFAS No. 158, Employers’ Accounting for Defined Benefit Pension and Other Postretirement Plans—an amendment of FASB Statements No. 87, 88, 106 and 132(R), or SFAS No. 158. This statement requires a company to (a) recognize in its statement of financial position an asset for a plan’s overfunded status or a liability for a plan’s underfunded status, (b) measure a plan’s assets and its obligations that determine its funded status as of the end of the employer’s fiscal year, and (c) recognize changes in the funded status of a defined benefit plan in the year in which the changes occur (reported in comprehensive income). The requirement to recognize the funded status of a benefit plan and the related disclosure requirements were effective for us as of the end of fiscal 2007 and we adopted the statement at that time. The adoption of SFAS No. 158 resulted in a $0.5 million reduction in stockholders’ equity, net of income taxes. The measurement date for all plans is June 30, 2007, and as such no additional impact is expected.
In September 2006, the FASB issued SFAS No. 157, Fair Value Measurements, or SFAS 157. This statement clarifies the definition of fair value, establishes a framework for measuring fair value, and expands the disclosures on fair value measurements. SFAS 157 is effective for fiscal years beginning after November 15, 2007. We are currently evaluating the effect that the adoption of SFAS 157 will have, if any, on its consolidated results of operations and financial condition.
In September 2006, the Securities and Exchange Commission issued Staff Accounting Bulletin No. 108, or SAB 108. SAB 108 considers the effects of prior year misstatements when quantifying misstatements in current year financial statements. It is effective for fiscal years ending after November 15, 2006. We applied the guidance in SAB 108 as of July 1, 2006. The application of SAB 108 did not have a significant effect on our consolidated financial statements.
In February 2007, the FASB issued SFAS No. 159, The Fair Value Option for Financial Assets and Financial Liabilities, or SFAS 159, which permits companies to choose to measure certain financial instruments and certain other items at fair value. The standard requires that unrealized gains and losses on items for which the fair value option has been elected be reported in earnings. SFAS No. 159 is effective for us beginning in the first quarter of fiscal year 2009 although earlier adoption is permitted. We are currently evaluating the impact that SFAS 159 will have on our consolidated financial statements.
In March 2007, the FASB ratified EITF Issue No. 06-11, Accounting for Income Tax Benefits of dividends on Share-Based Payment Awards, or EITF 06-11. EITF 06 11 requires companies to recognize the income tax benefit realized from dividends or dividend equivalents that are charged to retained earnings and paid to employees for non-vested equity-classified employee share-based payment awards as an increase to additional paid-in capital. EITF 06-11 is effective for fiscal years beginning after September 15, 2007. We do not expect that EITF 06-11 will have a material impact on our results of operations or cash flows.
Forward-Looking Statements
This section and other parts of this Annual Report on Form 10-K contain forward-looking statements within the meaning of Section 27A of the Securities Act of 1933, as amended, or the Securities Act, and Section 21E of the Exchange Act. In some cases, forward-looking statements can be identified by words such as “anticipates,” “expects,” “believes,” “plans,” “predicts,” and similar terms. Such forward-looking statements are based on current expectations, estimates and projections about our industry, management’s
46
beliefs and assumptions made by management. Forward-looking statements are not guarantees of future performance and our actual results may differ significantly from the results discussed in the forward-looking statements. Factors that might cause such differences include, but are not limited to those discussed in Part I, Item 1A, “Risk Factors.” Unless otherwise required by law, we expressly disclaim any obligation to update publicly any forward-looking statements, whether as result of new information, future events or otherwise.
Available Information
Our internet website address is www.solerainc.com. Our annual reports on Form 10-K, quarterly reports on Form 10-Q, current reports on Form 8-K and amendments to those reports filed or furnished pursuant to Section 13 or 15(d) of the Exchange Act will be available free of charge through our website as soon as reasonably practicable after they are electronically filed with, or furnished to, the Securities and Exchange Commission. Our website and the information contained or incorporated therein are not intended to be incorporated into this report.
Company Overview
ITEM 7A. QUANTITATIVE AND QUALITATIVE DISCLOSURES ABOUT MARKET RISK
Foreign Currency Risk
We conduct operations in many countries around the world. Our results of operations are subject to both currency transaction risk and currency translation risk. We incur currency transaction risk when we enter into either a purchase or sale transaction using a currency other than our functional currency. With respect to currency translation risk, our financial condition and results of operations are measured and recorded in the relevant domestic currency and then translated into U.S. dollars for inclusion in our consolidated financial statements. Exchange rates between these currencies and U.S. dollars have fluctuated significantly over the last few years and may continue to do so in the future. A substantial portion of our revenues and costs are denominated in or effectively indexed to U.S. dollars, but the majority of our revenues and costs are denominated in Euros, British pounds, Swiss francs, Canadian dollars and other currencies. Historically, we have not undertaken hedging strategies to minimize the effect of currency fluctuations on our results of operations and financial condition; however, we may decide this is necessary in the future.
Interest Rate Risk
We are exposed to interest rate risks primarily through borrowings under our revolving loan arrangement and term loans. Interest on these borrowings is based upon variable interest rates. Our weighted-average borrowings outstanding under the revolving loan arrangement and term loans during fiscal 2007 was $822 million and the weighted-average interest rate in effect at June 30, 2007 was 6.614%. We terminated the interest rate collar related to our old senior credit agreement on December 18, 2006. Based on the foregoing, a hypothetical 1% increase or decrease in interest rates would have resulted in a $8.2 million change to our interest expense in fiscal 2007.
During the fourth quarter of fiscal 2006, we entered into two interest rate swaps with maturities on July 13, 2011. One swap had a notional amount of $195.0 million and required us to pay a fixed rate of 5.35%. The other swap had a notional amount of €368.4 million and required us to pay, on a quarterly basis, a fixed rate of 3.72%. These swaps had an estimated fair value of $1.1 million as of June 30, 2006, and we recognized an increase in fair value of $1.1 million during fiscal 2006. During fiscal 2007, we recognized net gains of $6.7 million in other (income) related to these swaps, which were terminated on June 25, 2007 for a total cash settlement of $7.7 million.
47
Effective on June 29, 2007, we entered into three USD-based interest rate swaps with notional amounts of $50.0 million, $81.0 million and $75.0 million with maturities on June 30, 2011 which require us to pay fixed rates of 5.445%, 5.418% and 5.445%, respectively. We also entered into three Euro-based interest rate swaps with notional amounts of €69.8 million, €50.0 million, and €60.0 million with maturities on June 30, 2011 which require us to pay fixed rates of 4.603%, 4.679%, and 4.685%, respectively. These interest rate swaps are designated and documented at the inception of the hedge as cash flow hedges and are evaluated for effectiveness quarterly. The effective portion of the gain or loss on these hedges is reported as a component of accumulated other comprehensive income/(loss) in stockholders’ equity and reclassified into earnings when the hedged transaction affects earnings. The ineffective portion on these cash flow hedges is recognized as other (income)/expense. The estimated fair value of $0.8 million on USD-based swaps, net of tax, and €0.4 million ($0.6 million) on Euro-based swaps was recorded in other liabilities in the consolidated balance sheet as of June 30, 2007. The change of $1.1 million in the fair value of swaps reflects the effective portion of loss on these hedges and is reported as a component of accumulated other comprehensive loss in stockholders’ equity.
ITEM 8. CONSOLIDATED FINANCIAL STATEMENTS AND SUPPLEMENTARY DATA
Our consolidated financial statements, together with the related notes and the report of independent registered public accounting firm, are set forth on the pages indicated in Item 15 in this Annual Report on Form 10-K.
ITEM 9. CHANGES IN AND DISAGREEMENTS WITH ACCOUNTANTS ON ACCOUNTING AND FINANCIAL DISCLOSURE
There were no changes in or disagreements with accountants on accounting and financial disclosure.
ITEM 9A. CONTROLS AND PROCEDURES
We maintain disclosure controls and procedures that are designed to ensure that information required to be disclosed in its reports pursuant to the Exchange Act, is recorded, processed, summarized and reported within the time periods specified Rule 13a-15 under the Exchange Act, and that such information is accumulated and communicated to our management, including our Chief Executive Officer and Chief Financial Officer, as appropriate, to allow timely decisions regarding required disclosure. Management is responsible for establishing and maintaining adequate internal control over financial reporting.
As required by Rule 13a-15(b) under the Exchange Act, we carried out an evaluation, under the supervision and with the participation of our management, including the Chief Executive Officer and the Chief Financial Officer, of the effectiveness of the design and operation of our disclosure controls and procedures. Based on the foregoing, our Chief Executive Officer and Chief Financial Officer determined that disclosure controls and procedures were effective at a reasonable assurance level as of the end of the period covered by this report.
There has been no change in internal controls over financial reporting during the most recent fiscal quarter that has materially affected, or is reasonably likely to materially affect, internal controls over financial reporting.
This annual report does not include a report of management’s assessment regarding internal control over financial reporting or an attestation report of our registered public accounting firm due to a transition period established by rules of the SEC for newly public companies.
ITEM 9B. OTHER INFORMATION
None.
48
PART III
ITEM 10. DIRECTORS, EXECUTIVE OFFICERS AND CORPORATE GOVERNANCE
Set forth below are the name, age, position and a description of the business experience of each of our executive officers and directors.
Name | | | | Age | | Position |
Tony Aquila | | 42 | | President, Chief Executive Officer and Director |
Jack Pearlstein | | 43 | | Chief Financial Officer, Secretary and Treasurer |
John Schwinn | | 47 | | Senior Vice President |
Michael D. Conway | | 39 | | Vice President |
Philip A. Canfield | | 39 | | Director |
Craig A. Bondy | | 34 | | Director |
Garen Staglin | | 62 | | Director |
Roxani Gillespie | | 66 | | Director |
Stuart J. Yarbrough | | 56 | | Director |
Jerrell W. Shelton | | 62 | | Director |
Tony Aquila has served as our President and Chief Executive Officer since our formation in April 2005, as a member of our board of managers between April 2005 and May 2007 and as a member of our board of directors since the completion of our corporate reorganization on May 10, 2007. From September 2001 until December 2004, Mr. Aquila held various positions, including President and Chief Operating Officer, at Mitchell International Inc., a provider of software and services to the automobile insurance, collision repair, medical claim and glass replacement industries. Mr. Aquila joined Mitchell when it acquired Ensera, Inc., an automotive claims workflow and software processing company Mr. Aquila founded in 1999. Prior to Ensera, Mr. Aquila was the Chief Executive Officer and founder of MaxMeyer America, Inc., an importer and distributor of European automotive refinishing products formed in partnership with MaxMeyer-Duco S.p.A.
Jack Pearlstein has served as our Chief Financial Officer since April 2006. From September 2001 to November 2004, Mr. Pearlstein served as the Chief Financial Officer, Treasurer and Secretary of DigitalNet Holdings, Inc., a leading provider of network, security, information and application services to U.S. defense and intelligence agencies. From September 2000 until July 2001, Mr. Pearlstein served as Chief Financial Officer of Commerce One, Inc.’s Global Services division, which he joined in September 2000 when Commerce One, Inc. acquired AppNet, Inc., a leading provider of Internet- and electronic commerce-based professional services and solutions. Mr. Pearlstein also serves as a director of Syniverse Technologies, Inc., a NYSE-listed enabler of wireless voice and data communications for telecommunications companies, which is controlled by GTCR. Mr. Pearlstein has a B.S. in Accounting from New York University and an M.B.A. in Finance from George Washington University.
John Schwinn has served as our Senior Vice President since April 2005 and leads the consulting and business analytics services groups. From September 2001 until December 2004, Mr. Schwinn served as Vice President of Corporate Development of Mitchell International Inc., which he joined in September 2001 when Mitchell International Inc. acquired Ensera, Inc., an automotive claims workflow and software processing company. From September 2000 until September 2001, Mr. Schwinn was Ensera’s Chief Operating Officer and from January 1994 until September 2000, Mr. Schwinn was Vice President of Business Development for ADP’s Claims Services Group. Mr. Schwinn has a B.S. in Economics from the Wharton School at the University of Pennsylvania, an M.S. in Economics from the London School of Economics and an M.B.A. from Harvard Business School.
Michael D. Conway has served as our Vice President since April 2005. From September 2000 to December 2004, Mr. Conway held various positions at Mitchell International Inc., including Senior
49
Director of Sales Operations and Senior Director of Business Development. From 1998 to 2000, Mr. Conway held various positions with OnHealth Network Company, a publicly-traded Internet health company, including Chief Financial Officer, Vice President of Finance, Controller and Secretary. Mr. Conway has a B.A. in Economics and Accounting from Claremont McKenna College and an M.B.A. from Claremont Graduate School’s Peter Drucker School of Management.
Philip A. Canfield has been a member of our board of directors since the completion of our corporate reorganization on May 10, 2007 and served as a member of our board of managers between April 2005 and May 2007. Mr. Canfield has been a principal at GTCR Golder Rauner, L.L.C. since 1997. Mr. Canfield has a B.S. in Finance from the Honors Business Program at the University of Texas at Austin and an M.B.A. from the University of Chicago. Mr. Canfield also serves as a board member of several private GTCR portfolio companies.
Craig A. Bondy has been a member of our board of directors since the completion of our corporate reorganization on May 10, 2007 and served as a member of our board of managers between April 2005 and May 2007. He is a principal of GTCR, which he joined in July 2000. He previously worked in the investment banking department of Credit Suisse First Boston. Mr. Bondy has a B.B.A. in Finance from the Honors Business Program at the University of Texas at Austin and an M.B.A. from the Stanford Graduate School of Business. Mr. Bondy serves on the board of directors of VeriFone Holdings, Inc. and several private GTCR portfolio companies.
Garen Staglin has been a member of our board of directors since the completion of our corporate reorganization on May 10, 2007 and served as a member of our board of managers between April 2005 and May 2007. From 2001 to 2004, Mr. Staglin served as the President and Chief Executive Officer of eONE Global LP, an emerging payments company. From 1993 to 1999, Mr. Staglin served as Chairman and Chief Executive Officer of Safelite Glass Corporation, a manufacturer of replacement autoglass and related insurance services. Mr. Staglin also serves as a director of Global Document Solutions, Inc., a digital printing, imaging and customer relationship management outsourcing company, ExlService Holdings, Inc., a provider of offshore business process outsourcing solutions, and Bottomline Technologies, Inc., a leading provider of collaborative payment and invoice automation solutions. Mr. Staglin has a B.S. in engineering from UCLA and an M.B.A. from the Stanford Graduate School of Business.
Roxani Gillespie has been a member of our board of directors since the completion of our corporate reorganization on May 10, 2007 and served as a member of our board of managers between April 2005 and May 2007. Ms. Gillespie is a partner in the law firm of Barger & Wolen LLP, where she has worked since 1997. From 1986 to 1991, Ms. Gillespie served as the Commissioner of Insurance for the State of California. Ms. Gillespie also serves on the board of directors of 21st Century Insurance Group.
Stuart J. Yarbrough has been a member of our board of directors since the completion of our initial public offering on May 16, 2007. Mr. Yarbrough is the chief executive officer of 3Point Capital Partners, LLC, a private equity firm focusing on the building products sector, where he has worked since February 2007. From 1994 through February 2007, Mr. Yarbrough was a principal at CrossHill Financial Group Inc., a company he co-founded, which provides debt financing to growth companies. Mr. Yarbrough has a B.A. in management sciences from Duke University.
Jerrell W. Shelton has been a member of our board of directors since the completion of our initial public offering on May 16, 2007. Mr. Shelton is an advisor to Medley Capital LLC, a private investment management firm. From June 2004 to May 2006, Mr. Shelton served as the chairman and chief executive officer of Wellness, Inc., a company that designs, manufacturers and installs healthcare equipment for hospitals and other clinical customers. From November 2000 to June 2004, Mr. Shelton served as a visiting executive, and then advisory director, for the Research Division of IBM Corporation, a provider of, among other things, business and information technology consulting and implementation services. Mr. Shelton has
50
a B.S. in business administration from the University of Tennessee and an M.B.A. from Harvard University.
Board Composition
Our certificate of incorporation provides that our board of directors shall consist of such number of directors as determined from time to time by resolution adopted by a majority of the total number of directors then in office. Our board of directors consists of seven members, three of whom, Ms. Gillespie and Messrs. Shelton and Yarbrough, qualify as “independent” according to the rules and regulations of the SEC and NYSE. Any additional directorships resulting from an increase in the number of directors may only be filled by the directors then in office. The term of office for each director will be until his or her successor is elected and qualified or until his or her earlier death, resignation or removal. Stockholders will elect directors each year at our annual meeting.
Board Committees
The composition, duties and responsibilities of our audit committee, compensation committee and nominating and corporate governance committee are set forth below. Committee members hold office for a term of one year. In the future, our board may establish other committees, as it deems appropriate, to assist with its responsibilities.
Audit Committee. The audit committee is responsible for (1) selecting the independent auditors, (2) approving the overall scope of the audit, (3) assisting the board in monitoring the integrity of our financial statements, the independent auditors’ qualifications and independence, the performance of the independent auditors and our internal audit function and our compliance with legal and regulatory requirements, (4) annually reviewing an independent auditors’ report describing the auditing firms’ internal quality-control procedures and any material issues raised by the most recent internal quality-control review, or peer review, of the auditing firm, (5) discussing the annual audited financial and quarterly statements with management and the independent auditor, (6) discussing earnings press releases, as well as financial information and earnings guidance provided to analysts and rating agencies from time to time, (7) discussing policies with respect to risk assessment and risk management, (8) meeting separately, periodically, with management, internal auditors and the independent auditor, (9) reviewing with the independent auditor any audit problems or difficulties and management’s response, (10) setting clear hiring policies for employees or former employees of the independent auditors, (11) handling such other matters that are specifically delegated to the audit committee by the board of directors from time to time and (12) reporting regularly to the full board of directors.
Our audit committee consists of Ms. Gillespie and Messrs. Shelton and Yarbrough. Our board of directors has determined that Ms. Gillespie and Messrs. Shelton and Yarbrough are independent directors according to the rules and regulations of the SEC and the NYSE and that Mr. Yarbrough qualifies as an “audit committee financial expert” as such term is defined in Item 407(d) of Regulation S-K.
Compensation Committee. The compensation committee is responsible for (1) reviewing key employee compensation policies, plans and programs, (2) reviewing and approving the compensation of our executive officers, (3) reviewing and approving employment contracts and other similar arrangements between us and our executive officers, (4) reviewing and consulting with our Chief Executive Officer on the selection of officers and evaluation of executive performance and other related matters, (5) administration of stock plans and other incentive compensation plans and (6) such other matters that are specifically delegated to the compensation committee by the board of directors from time to time. Our compensation committee consists of Ms. Gillespie and Messrs. Shelton and Bondy. Our board of directors has determined that Mr. Bondy is not an independent director according to the rules and regulations of the SEC and the NYSE.
51
Nominating and Corporate Governance Committee. Our nominating and corporate governance committee’s purpose is to assist our board by identifying individuals qualified to become members of our board of directors consistent with criteria set by our board and to develop our corporate governance principles. This committee’s responsibilities include: (1) evaluating the composition, size and governance of our board of directors and its committees and making recommendations regarding future planning and the appointment of directors to our committees, (2) establishing a policy for considering stockholder nominees for election to our board of directors, (3) evaluating and recommending candidates for election to our board of directors, (4) overseeing the performance and self-evaluation process of our board of directors and developing continuing education programs for our directors, (5) reviewing our corporate governance principles and providing recommendations to the board regarding possible changes and (6) reviewing and monitoring compliance with our code of ethics and our insider trading policy. Our nominating and corporate governance committee consists of Ms. Gillespie and Messrs. Canfield and Shelton. Our board of directors has determined that Mr. Canfield is not an independent director according to the rules and regulations of the SEC and the NYSE.
Compensation Committee Interlocks and Insider Participation
No member of our compensation committee is an officer or employee of us, and no member has been an officer or employee of us at any prior time. There are no interlocking relationship between any of our executive officers and compensation committee, on the one hand, and the executive officers and compensation committee of any other companies, on the other hand.
Code of Ethics
Our code of ethics applies to our principal executive, financial and accounting officers and all persons performing similar functions and is available on our internet website at www.solerainc.com. The code of ethics contains general guidelines for conducting the business of our company consistent with the highest standards of business ethics, and is intended to qualify as a “code of ethics” within the meaning of Section 406 of the Sarbanes-Oxley Act of 2002 and Item 406 of Regulation S-K. We intend to disclose amendments to, or waivers from, provisions of our code of ethics that apply to our principal executive, financial and accounting officers by posting such information on our website.
ITEM 11. EXECUTIVE COMPENSATION
Compensation Discussion and Analysis
This Compensation Discussion and Analysis focuses on the compensation arrangements we have with our “named executive officers” as required under the rules of the SEC. The SEC rules require disclosure for the Chief Executive Officer and Chief Financial Officer regardless of compensation level, and the three most highly compensated executive officers other than the Chief Executive Officer and Chief Financial Officer. During fiscal 2007, we had four executive officers, including our Chief Executive Officer and Chief Financial Officer. All of these executive officers, including the Chief Executive Officer and Chief Financial Officer, are sometimes referred to herein as the “named executive officers” or the “executive officers.”
Role of the Compensation Committee
In May 2007, our board of directors established a compensation committee consisting of Mr. Bondy, an employee of affiliates of GTCR, and Ms. Gillespie. Mr. Shelton was appointed to the compensation committee following the completion of our initial public offering. The compensation committee is responsible for (1) reviewing key employee compensation policies, plans and programs, (2) reviewing and approving the compensation of our executive officers, (3) reviewing and approving employment contracts and other similar arrangements between us and our executive officers, (4) reviewing and consulting with our Chief Executive Officer on the selection of officers and evaluation of executive performance and other
52
related matters, (5) administration of stock plans and other incentive compensation plans and (6) such other matters that are specifically delegated to the compensation committee by the board of directors from time to time. In light of our recent initial public offering, the compensation committee expects to undertake a substantial review of our existing compensation programs, objectives and philosophy and determine whether such programs, objectives, and philosophy are appropriate for our company as a public company.
Prior to our conversion into a corporation and initial public offering in May 2007, we existed as a limited liability company. In November 2006, the board of managers established a compensation committee consisting of Mr. Bondy and Ms. Gillespie. Prior to November 2006, compensation matters were handled by our entire board of managers. In general, the compensation of our named executive officers for fiscal 2006 and 2007 was established in agreements we entered into with them in connection with our formation in April 2005 and the Acquisition in 2006. Such agreements were determined by negotiations between our named executive officers and GTCR, our private equity sponsor and, until our initial public offering, our majority equity holder. Thus, much of our compensation policies and practices for fiscal 2006 and 2007 were determined by GTCR, as the majority equity holder, based on its past practice and experience with other of its portfolio companies, and negotiated with our executive officers. Going forward, executive compensation matters will be evaluated, determined and handled by our compensation committee.
The compensation committee is responsible for designing and evaluating our compensation plans for directors and executive officers, including the Chief Executive Officer, making recommendations to the board of directors and management regarding those plans, awarding incentive compensation to executive officers and administering other compensation programs as authorized by the board of directors. The compensation committee is also tasked with producing the annual report on executive officer compensation for inclusion in our annual report or proxy materials in accordance with applicable SEC rules. The compensation committee solely determines the salary and overall compensation of our Chief Executive Officer. When establishing the compensation of the other named executive officers, the compensation committee takes into consideration the recommendations of the Chief Executive Officer.
Consistent with our performance-based compensation philosophy, the compensation committee reviews and approves our compensation programs to effectively balance executive officers’ salaries with incentive compensation that is performance-based as well as to reward annual performance while maintaining a focus on longer-term objectives. We believe that it serves the needs of our stockholders and key executives to provide incentives commensurate with individual management responsibilities and past and future contributions to corporate objectives. The mix of compensation elements varies based on an executive officer’s position and responsibilities.
To maximize stockholder value, we believe that it is necessary to deliver consistent, long-term sales and earnings growth. Accordingly, the compensation committee reviews not only the individual compensation elements, but the mix of individual compensation elements that make up the aggregate compensation and attempts to structure the total compensation package between short-term and long-term compensation, and currently paid cash and equity compensation, each in a way that meets the objectives set forth above.
The compensation committee has the authority to retain the services of outside advisors, experts and compensation and benefits consultants to assist in the evaluation of the compensation of the Chief Executive Officer, the other executive officers, the board of directors and our compensation framework generally. Neither we nor our compensation committee benchmarked our executive compensation nor engaged outside consultants in fiscal 2007 to review our executive or director compensation policies and procedures or to advise us on compensation matters.
To continue to establish competitive levels of compensation, and an appropriate balance of base salary, performance-based compensation and equity compensation, the compensation committee intends
53
to retain the services of an independent, third party consultant during fiscal 2008 to benchmark and assess its compensation framework. The financial objectives of its compensation framework will be the budget approved by our board of directors for fiscal 2008.
Objectives of Our Compensation Programs
The key objectives of our executive compensation programs are (1) to attract, motivate, reward and retain the best possible executive officers with the skills necessary to successfully manage and grow our business, (2) to achieve accountability for performance by linking annual cash incentive compensation to the achievement of measurable performance objectives and (3) to align the interests of the executive officers and our stockholders through incentive and long-term compensation programs. For our named executive officers, our annual and long-term incentives are designed to support these objectives by providing a significant financial correlation between our financial results and total compensation.
The compensation committee will determine annually whether the compensation programs have met the objectives outlined above by assessing (1) the retention level or level of attrition among performing key executive officers year-over-year and (2) the relationship between our financial performance year over year and increases or decreases in executive compensation.
What Our Compensation Programs are Designed to Reward
A significant portion of the compensation paid to executive officers is designed to reward them based on our financial performance and growth, and increased stockholder value, as reflected in increases in our equity value. As discussed elsewhere in “Executive Compensation—Compensation Discussion and Analysis,” the compensation policies applicable to our named executive officers are reflective of our Company’s pay-for-performance philosophy, whereby a significant portion of compensation is contingent upon achievement of measurable operating and financial targets and enhanced equity value, as opposed to current cash compensation and perquisites not directly linked to objective financial performance. This compensation mix is consistent with our performance-based philosophy that the role of executive officers is to enhance stockholder value over the long term and allows management to participate in the upside rewards of our positive objective-driven performance.
Elements of Compensation
The elements of our compensation program are:
· Base salary;
· Annual cash incentives;
· Long-term incentives;
· Equity ownership;
· Post-termination benefits, including severance and retirement benefits; and
· Certain additional executive benefits and perquisites.
Each element of compensation was evaluated in terms of its contribution to each executive’s overall total compensation package for the year, and whether the total compensation was appropriate.
These components, individually and in the aggregate, are designed to accomplish one or more of the compensation objectives described above. For this reason, no single element dominates the compensation package of a named executive officer. Amounts of base salary and annual bonuses for fiscal 2007 were fixed by employment agreements entered into with each of the named executive officers in connection with the Acquisition, although these amounts were increased in certain cases pursuant to action by our board of
54
directors in response to our financial and operating performance. For periods following fiscal 2007, these amounts will be established pursuant to the procedures set forth below, based on amounts paid to executives from comparable companies (which companies our compensation committee has not yet determined) and based upon our financial performance.
Base Salary
We provide a base salary to our executive officers to compensate them for their full-time services during the year. Base salary is established based on our expectations of the respective executive officer’s contributions to substantially contributing to the growth in the value of our company. Therefore, the compensation committee considers the experience, skills, knowledge, past performance and responsibilities required of the executive officers in their roles. When establishing the base salaries of the executive officers for the fiscal year ended June 30, 2007, a number of factors were considered, including the years of service of the individual, individual’s duties and responsibilities, the ability to replace the individual, the base salary at the individual’s prior employment, market data on similar positions with competitive companies as information becomes available to us informally through recruitment/search consultants in connection with our recent hiring efforts, and through our directors’ experience with other affiliated portfolio companies. We seek to maintain base salaries that are competitive with the marketplace, to allow us to attract and retain executive talent.
On April 13, 2006, we entered into an amended and restated senior management agreement with each of our named executive officers, other than Mr. Pearlstein, with whom we entered into an employment agreement. The base salaries for the fiscal years ended June 30, 2006 and 2007 are set forth below.
| | Base Salary
Fiscal Year Ended June 30, | |
Name | | | | 2006 | | 2007 | |
Tony Aquila | | $ | 303,650 | | $ | 475,000 | |
Jack Pearlstein (1) | | 53,077 | | 300,000 | |
John Schwinn | | 150,493 | | 200,000 | |
Michael D. Conway | | 154,705 | | 200,000 | |
| | | | | | | | | |
(1) Mr. Pearlstein joined us in April 2006 and prior to that received $87,910 from us for consulting services provided in connection with the Acquisition.
Annual Cash Incentives
Incentive Payments based on Pre-Set Performance Objectives. Each of our named executive officers may receive an annual bonus, based upon the satisfaction of certain financial performance criteria determined by our board, up to the following percentage of base salary: Mr. Aquila, 75% for the first six months of fiscal 2007, during which his salary was $225,000, based on an annual base salary of $450,000, plus 100% for the remainder of fiscal 2007, during which his salary was $250,000, based on an annual base salary of $500,000 (for fiscal 2008, Mr. Aquila’s percentage remains at 100% of his base salary); Mr. Pearlstein, 75%; Mr. Schwinn, 40%; and Mr. Conway, 35%. These amounts were established in agreements negotiated between our executives and GTCR in connection with our formation and the Acquisition. Mr. Aquila’s bonus percentage was adjusted in connection with an amendment to his senior management agreement negotiated between him and the board of directors in January 2007, at which time the board considered our performance since the Acquisition. The relevant financial criteria established by our board of directors consisted of revenue and Adjusted EBITDA, as compared to budgeted amounts and bonus amounts are established by the board based on an overall qualitative assessment of our performance compared to such budgeted amounts. Due to, in the view of the board of directors, our performance in fiscal 2007 exceeding such criteria, the board of directors awarded our executive officers bonuses in excess of such target amounts. The target amounts and the amounts actually paid are indicated in compensation tables following this Compensation Discuss and Analysis.
55
Discretionary Incentive Bonus Awards. None of our executive officers to date has received discretionary bonuses other than annual bonuses, although the compensation committee may elect to award such bonuses in the future.
Long-Term Incentives
All of our executive officers have equity incentives in the form of equity investments that they made at our formation in 2005, in connection with the Acquisition in 2006 or both. Certain of our executive officers have also received long-term equity incentive compensation in the form of restricted stock units, and all of our executive officers are eligible to receive future grants under our 2007 Long-Term Equity Incentive Plan. In general, our equity incentive structure is intended to accomplish the following main objectives:
· encourage the judgment, initiative and efforts of employees toward our continuing success;
· increase equity ownership levels of key employees;
· assist us in attracting, retaining and motivating key employees;
· reward participants for demonstrated leadership and performance in relation to the creation of stockholder value; and
· ensure competitive levels of compensation in line with chosen peer groups; and balance and align the interests of participants and stockholders.
Equity awards that may be granted under our equity incentive plan and equity that the executives purchased vest over a period of time to encourage retention of our executive officers and focus their efforts on the creation of long-term stockholder value and corporate objectives. We believe our ability to grant equity-based awards also serves to attract new executive talent, if necessary.
2007 Long-term Equity Incentive Plan
General. In connection with the initial public offering, we established a stock-based compensation plan through the adoption of the 2007 Long-Term Equity Incentive Plan, which became effective immediately prior to the completion of the initial public offering.
Administration. The equity incentive plan is administered by the compensation committee. Our board may, however, at any time resolve to administer the equity incentive plan. Subject to the specific provisions of the equity incentive plan, the compensation committee is authorized to select persons to participate in the equity incentive plan, determine the form and substance of grants made under the equity incentive plan to each participant and otherwise make all determinations for the administration of the equity incentive plan.
Participation. Directors (including non-employee directors), officers (including non-employee officers) and employees of, and other individuals performing services for, or to whom an offer of employment has been extended by, us or our subsidiaries are eligible to participate in the equity incentive plan.
Types of Awards. The equity incentive plan provides for the issuance of stock options, restricted stock, deferred stock, dividend equivalents, other stock-based awards and performance awards. Performance awards may be based on the achievement of certain business or personal criteria or goals, as determined by the compensation committee.
Available Shares. An aggregate of 4,300,000 shares of our common stock was initially reserved for issuance under the equity incentive plan, subject to certain adjustments reflecting changes in our capitalization. If any grant under the equity incentive plan expires or terminates unexercised, becomes unexercisable or is forfeited as to any shares or is tendered or withheld as to any shares in payment of the
56
exercise price of the grant or the taxes payable with respect to the exercise, then such unpurchased, forfeited, tendered or withheld shares will thereafter be available for further grants under the equity incentive plan.
Option Grants. Options granted under the equity incentive plan may be either incentive stock options within the meaning of Section 422 of the Internal Revenue Code, or the Code, or non-qualified stock options, as the compensation committee may determine. The exercise price per share for each option will be established by the compensation committee, except that the exercise price may not be less than 100% of the fair market value of a share of common stock as of the date of grant of the option. In the case of the grant of any incentive stock option to an employee who, at the time of the grant, owns more than 10% of the total combined voting power of all of our classes of stock then outstanding, the exercise price may not be less than 110% of the fair market value of a share of common stock as of the date of grant of the option. The fair market value of a share of common stock on a given date is determined by the closing price of our stock on the NYSE (or other exchange if our common stock is no longer traded on the NYSE) as of such date (or, if such date is not a trading date, the immediately preceding trading day). In connection with the initial public offering, we granted 428,400 options to our employees. None of the options were granted to the named executive officers.
Terms of Options. The term during which each option may be exercised will be determined by the compensation committee, but if required by the Code and except as otherwise provided in the equity incentive plan, no option will be exercisable in whole or in part more than ten years from the date it is granted, and no incentive stock option granted to an employee who at the time of the grant owns more than 10% of the total combined voting power of all of our classes of stock will be exercisable more than five years from the date it is granted. All rights to purchase shares pursuant to an option will, unless sooner terminated, expire at the date designated by the compensation committee. The compensation committee will determine the date on which each option will become exercisable and may provide that an option will become exercisable in installments. The shares constituting each installment may be purchased in whole or in part at any time after such installment becomes exercisable, subject to such minimum exercise requirements as may be designated by the compensation committee. Prior to the exercise of an option and delivery of the shares represented thereby, the optionee will have no rights as a stockholder, including any dividend or voting rights, with respect to any shares covered by such outstanding option. If required by the Code, the aggregate fair market value, determined as of the grant date, of shares for which an incentive stock option is exercisable for the first time during any calendar year under all of our equity incentive plans may not exceed $100,000.
Termination of Options. Unless otherwise determined by the compensation committee, and subject to certain exemptions and conditions, if a participant ceases to be a director, officer or employee of, or to otherwise perform services for, us for any reason other than death, disability, retirement or termination for cause, all of the participant’s options that were exercisable on the date of such cessation will remain exercisable for, and will otherwise terminate at the end of, a period of 30 days after the date of such cessation. In the case of death or disability, all of the participant’s options that were exercisable on the date of such death or disability will remain so for a period of 180 days from the date of such death or disability. In the case of retirement, all of the participant’s options that were exercisable on the date of retirement will remain exercisable for, and shall otherwise terminate at the end of, a period of 90 days after the date of retirement. In the case of a termination for cause, or if a participant does not become a director, officer or employee of, or does not begin performing other services for, us for any reason, all of the participant’s options will expire and be forfeited immediately upon such cessation or non-commencement, whether or not then exercisable.
Restricted Stock and Deferred Shares. Restricted stock is a grant of shares of our common stock that may not be sold or disposed of, and that may be forfeited in the event of certain terminations of employment, prior to the end of a restricted period set by the compensation committee. A participant
57
granted restricted stock generally has all of the rights of a stockholder, unless the compensation committee determines otherwise. An award of deferred shares confers upon a participant the right to receive shares of our common stock at the end of a deferral period set by the compensation committee, subject to possible forfeiture of the award in the event of certain terminations of employment prior to the end of the deferral period. Prior to settlement, an award of deferred shares carries no voting or dividend rights or other rights associated with share ownership, although dividend equivalents may be granted in connection with restricted stock or deferred shares. In connection with our initial public offering, we granted 304,730 restricted stock units to two of our directors and certain of our employees. Of the 304,730 restricted stock units, 200,864 were granted to the named executive officers (150,648 and 50,216 restricted stock units were granted to Messrs. Aquila and Pearlstein, respectively), and 13,333 were granted to each of Messrs. Shelton and Yarbrough.
Dividend Equivalents. Dividend equivalents confer the right to receive, currently or on a deferred basis, cash, shares of our common stock, other awards or other property equal in value to dividends paid on a specific number of shares of our common stock. Dividend equivalents may be granted alone or in connection with another award and may be paid currently or on a deferred basis. If deferred, dividend equivalents may be deemed to have been reinvested in additional shares of our common stock.
The compensation committee is authorized to grant other awards that are denominated or payable in, valued by reference to or otherwise based on or related to shares of our common stock, under the equity incentive plan. These awards may include convertible or exchangeable debt securities, other rights convertible or exchangeable into shares of common stock, purchase rights for shares of common stock, awards with value and payment contingent upon our performance as a company or any other factors designated by the compensation committee. The compensation committee will determine the terms and conditions of these awards.
Performance Awards. The compensation committee may subject a participant’s right to exercise or receive a grant or settlement of an award and the timing of the grant or settlement, to performance conditions specified by the compensation committee. Performance awards may be granted under the equity incentive plan in a manner that results in their qualifying as performance-based compensation exempt from the limitation on tax deductibility under Section 162(m) of the Code for compensation in excess of $1.0 million paid to our Chief Executive Officer and our four highest compensated officers. The compensation committee will determine performance award terms, including the required levels of performance with respect to particular business criteria, the corresponding amounts payable upon achievement of those levels of performance, termination and forfeiture provisions and the form of settlement. In granting performance awards, the compensation committee may establish unfunded award “pools,” the amounts of which will be based upon the achievement of a performance goal or goals based on one or more business criteria. Business criteria may include, for example, total stockholder return, net income, pretax earnings, various measures of cash flow, earnings per share or return on investment.
Amendment of Outstanding Awards and Amendment/Termination of Plan. Our board of directors or the compensation committee generally has the power and authority to amend or terminate the equity incentive plan at any time without approval from our stockholders. The compensation committee generally has the authority to amend the terms of any outstanding award under the plan, including, without limitation, the ability to reduce the exercise price of any options or to accelerate the dates on which they become exercisable or vest, at any time without approval from our stockholders. No amendment will become effective without the prior approval of our stockholders if stockholder approval would be required by applicable law or regulations, including if required for continued compliance with the performance-based compensation exception of Section 162(m) of the Code, under provisions of Section 422 of the Code or by any listing requirement of the principal stock exchange on which our common stock is then listed. Unless previously terminated by our board of directors or the compensation committee, the equity incentive plan will terminate on the tenth anniversary of its adoption. No
58
termination of the equity incentive plan will materially and adversely affect any of the rights or obligations of any person, without his or her written consent, under any grant of options or other incentives theretofore granted under the long-term equity incentive plan.
The compensation committee has not yet made its determination as to its future expectations with respect to types and amounts future grants under the long-term equity incentive plan to executive officers. The equity grants to Messrs. Aquila and Pearlstein made in connection with the completion of our initial public offering were made in part to reward these executives for the successful completion of the offering, partially in satisfaction, with respect to Mr. Aquila’s grants, of an obligation under Mr. Aquila’s employment agreement and also to provide further incentives with respect to the long-term performance of our company and the retention of Messrs. Aquila and Pearlstein.
The restricted stock units granted to Messrs. Aquila and Pearlstein in connection with our initial public offering in May 2007 are subject to vesting. 40% vested immediately upon grant, and an additional 5% vest each fiscal quarter. The stock options granted to employees in connection with our initial public offering have an exercise price equal to the initial public offering price. The stock options and restricted stock units granted to employees in connection with the initial public offering will vest 25% at the end of fiscal 2008 and then 6.25% at the end of each fiscal quarter thereafter. Future grants of stock options, restricted stock units and other securities will be at the discretion of the compensation committee.
Equity Ownership
Senior Management and Securities Purchase Agreements
In connection with our formation in April 2005, Messrs. Aquila, Schwinn and Conway entered into senior management agreements, pursuant to which they acquired equity interests in our company. These equity interests consisted of preferred interests that accrued a yield and common interests that could participate in increases in the equity value of our company. Additionally, some of the common interests were immediately vested and others were subject to vesting over a five-year period. In connection with the Acquisition in April 2006, Mr. Pearlstein entered into a securities purchase agreement, pursuant to which he purchased preferred and common interests, some of which were subject to vesting. Messrs. Aquila, Schwinn and Conway agreed to amend and restate their senior management agreements, both to purchase additional equity in connection with the Acquisition and to alter the relative amounts of interests that were vested and subject to vesting. We expect to enter into a second amended and restated senior management agreement with each of Messrs. Aquila, Schwinn and Conway and an amended and restated securities purchase agreement with Mr. Pearlstein, among other things, to reflect our common unit split in April 2007, our conversion into a corporation, the conversion of our equity units into shares of our common stock and the completion of our initial public offering. The amount of each executive’s investment and the relative amounts of interests subject to vesting were negotiated with GTCR, the private equity sponsor of our formation and the Acquisition, in accordance with what GTCR believed to be the appropriate level of equity and long-term incentives for its investment in our company and the Acquisition.
The terms of the senior management agreements of Messrs. Conway and Schwinn provide that in connection with a public offering of shares held by GTCR, each will be entitled to sell a number of shares based on the proportion of GTCR’s shares sold in the offering and limited by the number of such executive’s shares that have vested. The terms of Mr. Aquila’s senior management agreement and Mr. Pearlstein’s securities purchase agreement provide that in connection with a public offering of shares held by GTCR, each will be entitled to sell a number of shares based on the proportion of GTCR’s shares sold in the offering, and if the number of vested shares held by such executive is less than he is entitled to sell, the vesting of additional shares will be accelerated.
59
2007 Employee Stock Purchase Plan
In connection with our initial public offering, we adopted the 2007 Employee Stock Purchase Plan. The purpose of the plan is to provide an incentive for our employees (and employees of our subsidiaries designated by our board of directors) to purchase our common stock and acquire an equity interest in us. The compensation committee administers the plan, under which we have reserved for issuance 1,500,000 shares of our common stock. We have not issued any shares of common stock in connection with this plan.
2006 Securities Purchase Plan
In November 2006, our board of managers adopted the 2006 Securities Purchase Plan. In January and February, pursuant to securities purchase agreements, 24 employees purchased common equity interests in our company that were converted into approximately 740,000 shares of our common stock. Pursuant to such agreements, the shares of stock held by these employees remains subject to vesting over a five-year period, and unvested shares remain, under certain circumstances, subject to repurchase by us or, to the extent we do not repurchase, by GTCR. No additional equity will be issued under this plan.
Post-Termination Benefits
We provide post-termination benefits to our executive officers in the form of severance payments, a 401(k) plan and change of control arrangements. We agreed to provide severance benefits to our executive officers to afford them financial protection in the event of a termination without cause, or in the case of Messrs. Aquila and Pearlstein, a resignation for good reason. We offer a 401(k) plan with matching contributions to our executive officers because we feel it is an important retirement benefit to offer to all of our plan participants. GTCR included change of control payments in the executive officers’ senior management and securities purchase agreements to reward them in the event that GTCR decided to and was able to sell our company (of which GTCR originally owned substantially all of the equity) and to retain the executive officers during a period in which GTCR or we contemplated, negotiated and was in the process of consummating a change of control of our company. The details of these post-termination benefits are described below.
Severance Payments
The severance benefits for each executive officers are set forth in an amended and restated senior management agreement, in the case of each of Messrs. Aquila, Schwinn and Conway, and an employment agreement, in the case of Mr. Pearlstein. If employment of any named executive officer is terminated by us without “cause” (as that term is defined in the applicable agreement) or is terminated by the executive for “good reason” (as that term is defined in the applicable agreement) during the employment term, then such officer will be entitled to continue to receive his base salary, a pro-rated portion of his bonus for the prior fiscal year, in the case of Messrs. Aquila and Pearlstein, and employee benefits, in each case, for the following severance period after the date of such termination: Messrs. Aquila and Pearlstein, eighteen months, subject to an extension of either six or twelve months by us; Mr. Schwinn, six months; and Mr. Conway, five months. These severance arrangements were negotiated between GTCR and the executive officers in connection with our formation and the Acquisition. The senior management agreements and Mr. Pearlstein’s employment agreement contain provisions requiring the executive to protect the confidentiality of our proprietary and confidential information. Each named executive officer has agreed not to solicit any of our employees or persons with whom we have certain business relationships for the duration of his respective severance period or, if no severance period is applicable, twenty-four months following his termination.
60
Retirement Benefits
401(k) Plan. We sponsor a tax-qualified employee savings and retirement plan, or 401(k) plan, that covers most employees who satisfy certain eligibility requirements relating to minimum age and length of service. Under the 401(k) plan, eligible employees may elect to contribute a minimum of 1% of their annual compensation, up to a maximum amount equal to approximately 35% of compensation. The 401(k) plan makes an annual matching contribution of 58% of the first 6% of the participants’ contribution. Messrs. Aquila and Schwinn have elected to participate in this plan but did not receive any payments in fiscal 2007.
Change of Control Agreements.
The amended and restated senior management agreements, in the case of Messrs. Aquila, Schwinn and Conway, and the securities purchase agreement, in the case of Mr. Pearlstein, provide that any unvested shares held by the respective executive officer will immediately vest upon the consummation of a sale of our company. Once vested, shares held by the executive officer are no longer subject to repurchase under his respective agreement. Unvested shares are subject to repurchase by us or, if we decline to purchase all of the unvested shares, GTCR in the event of a termination of the executive officer’s employment for any reason at a price of $0.30 per share. A sale of the company is defined in the agreements as a transaction or transactions pursuant to which a person or entity or group of related persons or entities acquire(s) (1) stock of our company possessing the voting power to elect a majority of our board of directors or (2) all or substantially all of our assets. The amounts of vested and unvested equity interests and the terms for vesting, repurchase and change of control were determined between GTCR and our executive officers at the time of the equity investments made in connection with our formation and the Acquisition.
Executive Benefits and Perquisites
We do not provide material perquisites that are not, in the compensation committee’s view, integrally and directly related to the executive’s duties. Nor do we otherwise maintain retirement, pension or deferred compensation programs for executives other than participation in our 401(k) plan as described above. Members of senior management participate in our other broad-based benefit programs available to our salaried employees including health, dental and life insurance programs. We have also a short-term disability policy for our executives. Except as otherwise discussed herein, other welfare and employee-benefit programs are generally the same for all eligible employees, including our executive officers, with some variation as required by local laws with respect to employees of our subsidiaries.
Accounting and Tax Considerations
In determining which elements of compensation are to be paid, and how they are weighted, we also take into account whether a particular form of compensation will be deductible under Section 162(m) of the Internal Revenue Code, as amended, or the Code. Section 162(m) generally limits the deductibility of compensation paid to our named executive officers to $1 million during any fiscal year unless such compensation is “performance-based” under Section 162(m). However, under a Section 162(m) transition rule for compensation plans of corporations which are privately held and which become publicly held in an initial public offering, compensation paid under a plan that existed prior to the initial public offering will not be subject to Section 162(m) until the earlier of (1) a material modification of the plan; (2) the issuance of all employer stock and other compensation that has been allocated under the plan; or (3) the first meeting of stockholders at which directors are to be elected that occurs after the close of the third calendar year following the year of the initial public offering, or the Transition Date. After the Transition Date, rights or awards granted under the plan, other than options and stock appreciation rights, will not qualify as “performance-based compensation” for purposes of Section 162(m) unless such rights or awards
61
are granted or vest upon pre-established objective performance goals, the material terms of which are disclosed to and approved by our stockholders.
Our compensation program is intended to maximize the deductibility of the compensation paid to our named executive officers to the extent that we determine it is in our best interests. Consequently, we may rely on the exemption from Section 162(m) afforded to us by the transition rule described above for compensation paid pursuant to our pre-existing plans. In addition, our 2007 Long-Term Equity Incentive Plan has been designed to permit our compensation committee to grant stock options and other awards which will qualify as “qualified performance-based compensation” under Section 162(m).
Many other Code provisions, SEC regulations and accounting rules affect the delivery of executive compensation and are generally taken into consideration as programs are developed. Our goal is to create and maintain plans that are efficient, effective and in full compliance with these requirements.
Compensation Tables
We are generally required to provide information regarding the compensation earned during our most recently completed fiscal year by our principal executive officer, principal financial officer and our three other most highly compensated executives. In addition, we are required to provide information regarding the compensation earned during the most recently completed fiscal year for any persons who served us in the capacity of principal executive officer or principal financial officer at any point during the fiscal year. As a result, the following tables include our current chief executive officer and chief financial officer, as well as our three other most highly compensated executive officers for the last fiscal year. As discussed above in the “Compensation Discussion and Analysis” section, we refer to these individuals as our named executive officers.
REPORT ON EXECUTIVE COMPENSATION
Compensation Committee Report
The compensation committee has reviewed and discussed the Compensation Discussion and Analysis required by Item 402(b) of Regulation S-K with management and, based on such review and discussions, the compensation committee has recommended to the board of directors that the Compensation Discussion and Analysis be included in this Annual Report on Form 10-K.
The Compensation Committee:
Jerrell W. Shelton
Roxani Gillespie
Craig Bondy
62
Summary Compensation Table
The following table shows the compensation earned by our named executive officers during the fiscal year ended June 30, 2007. The compensation consists of salary, cash bonus and, in some cases, equity awards.
Name and Principal Position | | Fiscal
Year
ended
June 30, | | Salary | | Bonus | | Stock
Awards(1) | | Option
Awards(1) | | Non-Equity
Incentive Plan
Compensation | | Change
in Pension
Value and
Nonqualified
Deferred
Compensation
Earnings | | All Other
Compensation(2) | | Total | |
Tony Aquila,
Chief Executive Officer and President | | | 2007 | | | $ | 475,000 | | | $ | — | | | $ | 1,083,988 | | | $ | — | | | | $ | 430,475 | | | | — | | | | $ | 12,209 | (2) | | $ | 2,001,672 | |
Jack Pearlstein,
Chief Financial Officer, Treasurer and Secretary | | | 2007 | | | 300,000 | | | — | | | 361,329 | | | — | | | | 231,300 | | | | — | | | | $ | 10,756 | (3) | | $ | 903,385 | |
John Schwinn,
Senior Vice President | | | 2007 | | | 200,000 | | | — | | | — | | | — | | | | 82,240 | | | | — | | | | $ | 4,120 | (4) | | $ | 286,360 | |
Michael D. Conway
Vice President | | | 2007 | | | 200,000 | | | — | | | — | | | — | | | | 71,960 | | | | — | | | | $ | 15,194 | (5) | | $ | 287,154 | |
| | | | | | | | | | | | | | | | | | | | | | | | | | | | | | | | | | | | | | |
(1) Represents the dollar amount recognized for financial statement reporting purposes with respect to the year ended June 30, 2007 in accordance with SFAS 123(R) calculated without regard to vesting or forfeiture conditions. For information regarding assumptions made in connection with this valuation, please see Note 11 to the consolidated annual financial statements below.
(2) Consists of $8,835 in medical, dental and vision insurance premiums, $1,062 in life insurance premiums and $2,312 in short-term and long-term disability premiums paid by us.
(3) Consists of $8,732 in medical, dental and vision insurance premiums, $637 in life insurance premiums and $1,387 in short-term and long-term disability premiums paid by us.
(4) Consists of $2,676 in medical, dental and vision insurance premiums, $455 in life insurance premiums and $989 in short-term and long-term disability premiums paid by us.
(5) Consists of $13,797 in medical, dental and vision insurance premiums, $440 in life insurance premiums and $957 in short-term and long-term disability premiums paid by us.
63
Grants of Plan-Based Awards
During the fiscal year ended June 30, 2007, we granted restricted stock units to certain of our named executive officers and each of our named executive officers participated in our annual cash bonus plan. The following table provides information on each of these awards on a grant-by-grant basis. In each case, the grant date of the award is the same as the approval date.
| | | | Estimated Possible Payouts
Under Non-Equity Incentive Plan | | Estimated Possible Payouts
Under Equity Incentive Plan Awards | | All Other
Stock
Awards:
Number
of Shares
of Stock | | All Other
Option
Awards:
Number
of Securities
Underlying | | Exercise
or Base Price
of Option | | Grant
Date
Fair
Value
of Stock
and
Option | |
Name | | | | Grant Date | | Threshold
($) | | Target
($)(3) | | Maximum
($) | | Threshold
(#) | | Target
(#) | | Maximum
(#) | | or Units
(#) | | Options
(#) | | Awards
($/Sh) | | Awards
($)(6) | |
Tony Aquila | | May 11, 2007 | (1) | | | | | | | | | | | | | | | 150,648 | (4) | | | | | | | | | | | | | | n/a | (5) | | 1,083,988 | |
| | April 13, 2006 | (2) | | — | | | 418,750 | | | — | | | | — | | | — | | | — | | | | — | | | | — | | | | — | | | — | |
Jack Pearlstein | | May 11, 2007 | (1) | | | | | | | | | | | | | | | 50,216 | (4) | | | | | | | | | | | | | | n/a | (5) | | 361,329 | |
| | April 13, 2006 | (2) | | — | | | 225,000 | | | — | | | | — | | | — | | | — | | | | — | | | | — | | | | — | | | — | |
John Schwinn | | April 13, 2006 | (2) | | — | | | 80,000 | | | — | | | | — | | | — | | | — | | | | — | | | | — | | | | — | | | — | |
Michael D. Conway | | April 13, 2006 | (2) | | — | | | 70,000 | | | — | | | | — | | | — | | | — | | | | — | | | | — | | | | — | | | — | |
| | | | | | | | | | | | | | | | | | | | | | | | | | | | | | | | | | | | | | | |
(1) Grants made in connection with our initial public offering under our 2007 Long-Term Equity Incentive Plan. The material terms of the plan are described in “Compensation Discussion and Analysis—Elements of Compensation—Long-Term Incentives—2007 Long-Term Equity Incentive Plan” above.
(2) Represents date that our named executive officers entered into the agreement that set forth their maximum cash bonuses for fiscal 2007.
(3) Represents estimated potential payouts of non-equity incentive plan awards for fiscal 2007. Actual amounts paid to the named executive officers are disclosed in the Summary Compensation Table above under the heading “Non-Equity Incentive Plan Compensation.” The material terms of the plan are described in “Compensation Discussion and Analysis—Elements of Compensation—Annual Cash Incentives” above.
(4) The restricted stock units are subject to vesting with 40% vesting immediately upon grant and the remainder vesting 5% at the end of each fiscal quarter. Upon vesting of each vested restricted stock unit, the individual is entitled to receive one share of common stock for each vested restricted stock unit and must pay the par value of each share of common stock received within ten days of receipt.
(5) Restricted stock units automatically entitle holder to receive a share of common stock upon vesting. No exercise or payment of exercise price is required.
(6) Represents the full grant date fair value of each individual equity award (on a grant-by-grant basis) as computed under SFAS 123(R) calculated without regard to vesting or forfeiture conditions. For information regarding assumptions made in connection with this valuation, please see
Note 11 to the consolidated annual financial statements below.
Outstanding Equity Awards at Fiscal Year-End
The table below sets forth certain information regarding the outstanding equity awards held by our named executive officers as of the close of the fiscal year ended June 30, 2007.
| | Restricted Stock Unit Awards | |
Name | | | | Number of Restricted
Stock Units
That Have Not Vested(1) | | Market Value
of Restricted Stock Units
That Have Not Vested(2) | |
Tony Aquila | | | 82,857 | | | | $ | 1,605,768 | | |
Jack Pearlstein | | | 27,619 | | | | $ | 535,256 | | |
John Schwinn | | | — | | | | — | | |
Michael D. Conway | | | — | | | | — | | |
| | | | | | | | | | | | |
(1) Approximately 7,533, in the case of Mr. Aquila, and 2,511, in the case of Mr. Pearlstein of the restricted stock units that have not vested vest at the end of each fiscal quarter.
(2) Based on the closing price of our common stock on the New York Stock Exchange at the close of the last business day of fiscal 2007.
64
Restricted Stock Units Vested
The table below sets forth the number of restricted stock units held by our named executive officers that vested during the fiscal year ended June 30, 2007. None of our named executive officers was granted or exercised any options to purchase common units or shares of common stock during fiscal 2007. Upon vesting of the restricted stock unit, the executive officer is entitled to receive one share of common stock for each vested restricted stock unit and must pay the par value of each share of common stock received within ten days of receipt.
| | Restricted Stock Unit Awards | |
Name | | | | Number of Restricted
Stock Units
That Have Vested | | Market Value
Realized on Vesting(1) | |
Tony Aquila | | | 67,791 | | | | $ | 1,110,114 | | |
Jack Pearlstein | | | 22,597 | | | | $ | 370,020 | | |
John Schwinn | | | — | | | | — | | |
Michael D. Conway | | | — | | | | — | | |
| | | | | | | | | | | | |
(1) In determining the market value of restricted Stock units that vested immediately upon grant, on May 11, the initial public offering price of $16.00 was used. In determining the market value of the restricted stock units that vested on June 30, 2007, the price of our common stock on the New York Stock Exchange as of the close of the last business day of the fiscal year was used.
65
Potential Payments upon Termination or Change in Control
The following table sets forth for each executive officer the benefits that would arise upon certain terminations of employment or a change in control under the terms of the amended and restated senior management agreements, in the case of Messrs. Aquila, Schwinn and Conway, and the employment agreement and securities purchase agreement, in the case of Mr. Pearlstein. The table assumes that the termination or change in control occurred on June 30, 2007.
Name | | | | Benefit | | Before
Change
in Control—
Termination
without Cause
or for
Good Reason | | After
Change
in Control—
Termination
without Cause
or for
Good Reason(5) | | Voluntary
Termination | | Death
or Disability | | Change
in Control | |
Tony Aquila | | Unvested common shares subject to accelerated vesting under the amended and restated senior management agreement(1) | | | $ | 216,023 | | | | $ | 13,955,054 | | | | None | | | | None | | | $ | 13,955,054 | |
| | Severance payment | | | $ | 1,072,856 | (2) | | | $ | 1,072,856 | | | | None | | | | None | | | None | |
Jack Pearlstein | | Unvested common shares subject to accelerated vesting under the securities purchase agreement(1) | | | $ | 129,614 | | | | $ | 8,373,032 | | | | None | | | | None | | | $ | 8,373,032 | |
| | Severance payment | | | $ | 623,475 | (2) | | | $ | 623,475 | | | | None | | | | None | | | None | |
John Schwinn | | Unvested common shares subject to accelerated vesting under the amended and restated senior management agreement(1) | | | $ | 29,336 | | | | $ | 1,895,131 | | | | None | | | | None | | | $ | 1,895,131 | |
| | Severance payment | | | $ | 100,000 | (3) | | | $ | 100,000 | | | | None | | | | None | | | None | |
Michael D. Conway | | Unvested common shares subject to accelerated vesting under the amended and restated senior management agreement(1) | | | $ | 20,269 | | | | $ | 1,309,352 | | | | None | | | | None | | | $ | 1,309,352 | |
| | Severance payment | | | $ | 84,000 | (4) | | | $ | 82,000 | | | | None | | | | None | | | None | |
(1) Upon a change in control, the unvested shares held by the individual immediately vest. Prior to a change in control, upon a termination of the individual’s employment for any reason, we may repurchase the unvested shares from the individual for $0.30 per share. Thus, the value of the unvested shares upon a termination prior to a change in control is equal to the number of unvested shares multiplied by $0.30. Upon a change in control, the shares immediately vest and are no longer subject to repurchase. Thus, the value of the shares upon a change in control, whether the individual is terminated or not, is the number of such shares multiplied by the price of our common stock reported on the New York Stock Exchange as of the close of the last business day of fiscal 2007. The only condition to accelerated vesting upon a change in control is that the executive officer be continuously employed up to and at the time of the change in control. A change in control is a sale of the company, which is defined in the respective agreement as a transaction or transactions pursuant to which a person or entity or group of related persons or entities acquire(s) stock of the our company possessing the voting power to elect a majority of our board of directors or all or substantially all of our assets.
(2) If Mr. Aquila or Mr. Pearlstein terminates his employment for good reason or is terminated by us without cause, then he will receive an amount equal to 150% of his base salary plus 75% of the bonus paid in respect of the prior fiscal year, regardless of whether there has been a change in control. This amount will be paid in equal installments on our regular salary payment dates for 18 months following termination. We have the option to extend this severance period from 18 to 24 or 30 months, during which extension we would continue to pay Mr. Aquila’s or Mr. Pearlstein’s, as the case may be, severance benefits at the same rate. The length of his non-solicit restriction would be extended by the same period. Additionally, Mr. Aquila and Mr. Pearlstein would continue to participate in employee benefit programs for senior executive employees other than bonus and incentive compensation plans. Severance payments are unaffected and not triggered by a change in control.
(3) If Mr. Schwinn terminates his employment for good reason or is terminated by us without cause, then he will receive an amount equal to 50% of his base salary, regardless of whether there has been a change in control. This amount will be paid in equal installments on our regular salary payment dates for six months following termination. Additionally, Mr. Schwinn would continue to participate in employee benefit programs for senior executive employees other than bonus and incentive compensation plans. Severance payments are unaffected and not triggered by a change in control.
66
(4) If Mr. Conway terminates his employment for good reason or is terminated by us without cause, then he will receive an amount equal to 42% of his base salary, regardless of whether there has been a change in control. This amount will be paid in equal installments on our regular salary payment dates for five months following termination. Additionally, Mr. Conway would continue to participate in employee benefit programs for senior executive employees other than bonus and incentive compensation plans. Severance payments are unaffected and not triggered by a change in control.
(5) Cause is generally defined as (A) the commission of a felony or a crime involving moral turpitude or any other act or omission involving dishonesty or fraud with respect to our company or any of our subsidiaries or any of our or our subsidiaries’ customers or suppliers, (B) substantial and repeated failure to perform duties, (C) gross negligence or willful misconduct with respect to our company or any of our subsidiaries, (D) conduct tending to bring our company or any of our subsidiaries into substantial public disgrace or disrepute, and (E) any breach of the confidentiality or non-solicitation provisions of his respective agreement. Good reason is generally defined as (X) a reduction in base salary, (Y) a material diminution in titles or duties, or (Z) a change in the location of our company’s principal office by more than 25 miles.
Compensation of Directors
Our non-employee and non-GTCR directors receive an annual fee of $40,000 and additional fees as follows for committee membership and chairpersonship: audit committee: member, $7,500 and chair, $15,000; compensation committee and nominating and corporate governance committee: member, $5,000 and chair, $10,000. In addition, in connection with our initial public offering, Messrs. Shelton and Yarbrough each received grants of 13,333 restricted stock units under our 2007 Long-Term Equity Incentive Plan. The restricted stock units are subject to vesting, with 25% vesting on June 30, 2008 and the remainder vesting 6.25% at the end of each fiscal quarter thereafter. The following table summarizes the compensation of our directors in fiscal 2007.
Name | | | | Fees Earned
or Paid
in Cash
($) | | Stock
Awards
($) | | Option
Awards
($) | | Non-Equity
Plan
Compensation
($) | | Change
in Pension Value
and Nonqualified
Deferred
Compensation
Earnings | | All Other
Compensation
($) | | Total
($) | |
Jerrell W. Shelton | | | $ | 8,056 | | | $5,922 | (1) | | $ | — | | | | $ | — | | | | $ | — | | | | $ | — | | | $ | 13,978 | |
Stuart J. Yarbrough | | | 7,706 | | | $5,922 | (1) | | — | | | | — | | | | — | | | | — | | | 13,628 | |
Roxanni Gillespie | | | 8,056 | | | — | | | — | | | | — | | | | — | | | | 80,001 | (2) | | 88,057 | |
Garen Staglin | | | 6,305 | | | — | | | — | | | | — | | | | — | | | | — | | | 6,305 | |
Philip A. Canfield | | | — | | | — | | | — | | | | — | | | | — | | | | — | | | — | |
Craig Bondy | | | — | | | — | | | — | | | | — | | | | — | | | | — | | | — | |
| | | | | | | | | | | | | | | | | | | | | | | | | | | | | | | | | |
(1) Represents the dollar amount recognized for financial statement purposes of the grant on May 11, 2007 of 13,333 restricted stock units. The grant date fair value of such award, as computed under SFAS 123(R) without regard to vesting or forfeiture conditions, was $15.99 per share, or $213,195. For information regarding assumptions made in connection with this valuation, please see Note 11 to the consolidated annual financial statements below. As of June 30, 2007, each of Messrs. Shelton and Yarbrough holds 13,333 restricted stock units outstanding.
(2) Ms. Gillespie provided legal and recruiting consulting services for our EMEA operations.
ITEM 12. SECURITY OWNERSHIP OF CERTAIN BENEFICIAL OWNERS AND MANAGEMENT AND RELATED STOCKHOLDER MATTERS
Unless otherwise noted, the following table sets forth, as of June 30, 2007, the beneficial ownership of our common stock by:
· each person that is a beneficial owner of 5% of more of our outstanding shares of common stock;
· each of our named executive officers;
· each of our directors; and
· all of the executive officers and directors as a group.
67
Beneficial ownership is determined under SEC rules and generally includes voting or investment power over securities. Except as disclosed in the footnotes to this table and subject to applicable community property laws, we believe that each stockholder identified in the table possesses sole voting and investment power over all shares of common stock shown as beneficially owned by the stockholder. Percentage of beneficial ownership is based on 64,803,563 shares of common stock outstanding as of August 31, 2007. Unless otherwise indicated in the footnotes below, the address for each beneficial owner is c/o Solera Holdings, Inc., 6111 Bollinger Canyon Road, Suite 200, San Ramon, California 94583.
| | Shares
Beneficially Owned | |
Name | | | | Number | | Percent | |
Stockholders owning 5% or more: | | | | | | | |
GTCR Funds(1) | | 30,721,106 | | | 47.5 | % | |
Directors and Executive Officers: | | | | | | | |
Tony Aquila(2) | | 1,620,809 | | | 2.4 | % | |
Jack Pearlstein(3) | | 996,483 | | | 1.5 | % | |
John Schwinn | | 206,704 | | | * | | |
Michael D. Conway | | 154,172 | | | * | | |
Philip A. Canfield(1) | | 30,721,106 | | | 47.5 | % | |
Craig A. Bondy(1) | | 30,721,106 | | | 47.5 | % | |
Garen Staglin(4) | | 83,286 | | | * | | |
Roxani Gillespie | | 48,684 | | | * | | |
Stuart J. Yarbrough | | — | | | — | | |
Jerrell W. Shelton | | — | | | — | | |
All directors and executive officers as a group (ten persons) | | 33,680,812 | | | 52.0 | % | |
| | | | | | | | | |
* Less than 1%
(1) Beneficial ownership information prior to the offering includes 26,016,477 shares of common stock held by GTCR Fund VIII, L.P., 4,565,770 shares of common stock held by GTCR Fund VIII/B, L.P. and 138,859 shares of common stock held by GTCR Co-Invest II, L.P. We refer to GTCR Fund VIII, L.P., GTCR Fund VIII/B, L.P. and GTCR Co-Invest II, L.P., collectively, as the GTCR Funds. The shares beneficially owned directly by each of GTCR Fund VIII, L.P. and GTCR Fund VIII/B, L.P. are beneficially owned indirectly by GTCR Partners VIII, L.P., the general partner of each; and by GTCR Golder Rauner II, L.L.C., its general partner. The shares beneficially owned directly by GTCR Co-Invest II, L.P. are beneficially owned indirectly by GTCR Golder Rauner II, L.L.C., its general partner. GTCR Golder Rauner II, L.L.C., through a six-person members committee (consisting of Mr. Canfield, David A. Donnini, Edgar D. Jannotta, Jr., Joseph P. Nolan, Bruce V. Rauner and Collin E. Roche), has voting and dispositive authority over the shares held by GTCR Fund VIII, L.P., GTCR Fund VIII/B, L.P. and GTCR Co-Invest II, L.P., and therefore beneficially owns such shares. Decisions of the members committee with respect to the voting and disposition of the shares are made by a vote of a majority of its members and, as a result, no single member of the members committee has voting or dispositive authority over the shares. Each of Messrs. Canfield and Bondy are members of our board of directors and, along with Messrs. Donnini, Jannotta, Nolan, Rauner, Roche, Vincent J. Hemmer, David S. Katz and Constantine S. Mihas, are principals of GTCR Golder Rauner II, L.L.C., and each of them disclaims beneficial ownership of the shares held by the GTCR Funds, except to the extent of his proportionate pecuniary interest in such shares. The address of each of GTCR Fund VIII, L.P., GTCR Fund VIII/B, L.P., GTCR Co-Invest II, L.P. and Messrs. Canfield and Bondy is c/o GTCR Golder Rauner II, L.L.C., 6100 Sears Tower, Chicago, Illinois 60606.
68
(2) Includes 50,000 shares of common stock held by each of Anthony Aquila 2007 Annuity Trust dated May 10, 2007 and Shelly Renee Aquila 2007 Annuity Trust dated May 10, 2007. Such shares and those held directly by Mr. Aquila are subject to transfer restrictions and certain of the shares held directly by Mr. Aquila are subject to repurchase rights under an amended and restated senior management agreement among us, the two trusts noted above and Mr. Aquila. Mr. Aquila is the trustee of Anthony Aquila 2007 Annuity Trust dated May 10, 2007. Shelly Renee Aquila is the trustee of Shelly Renee Aquila 2007 Annuity Trust dated May 10, 2007 and is the spouse of Mr. Aquila. Mr. Aquila does not exercise any voting or investment control over the shares of common stock held by Shelly Renee Aquila 2007 Annuity Trust dated May 10, 2007. Includes 7,533 restricted stock units held by Mr. Aquila that will vest within 60 days and will entitle Mr. Aquila to receive 7,533 shares of common stock.
(3) Includes 66,666 shares of common stock held by each of Ian Z. Pearlstein 2001 Trust and Ivanna V. Pearlstein 2001 Trust. The beneficiaries of Ian Z. Pearlstein 2001 Trust and Ivanna V. Pearlstein 2001 Trust are Ian Z. Pearlstein and Ivanna V. Pearlstein, respectively, who are minor children of Mr. Pearlstein. Mr. Pearlstein does not exercise any voting or investment control over the shares of common stock held by Ian Z. Pearlstein 2001 Trust or Ivanna V. Pearlstein 2001 Trust. Such shares and the shares held directly by Mr. Pearlstein are subject to transfer restrictions and certain of the shares held directly by Mr. Pearlstein are subject to repurchase rights under a securities purchase agreement among us, the two trusts noted above and Mr. Pearlstein. Includes 2,511 restricted stock units held by Mr. Pearlstein that will vest within 60 days and will entitle Mr. Pearlstein to receive 2,511 shares of common stock.
(4) Includes 4,708 shares of common stock held by each of The Brandon K. Staglin Irrevocable Trust and The Shannon K. Staglin Irrevocable Trust. Such shares and those held directly by Mr. Staglin are subject to transfer restrictions and certain of the shares held directly by Mr. Staglin are subject to repurchase rights under an amended and restated purchase agreement among us, the two trusts noted above and Mr. Staglin. The beneficiaries and trustees of The Brandon K. Staglin Irrevocable Trust and The Shannon K. Staglin Irrevocable Trust are Brandon K. Staglin and Shannon K. Staglin, children of Mr. Staglin. Mr. Staglin does not exercise any voting or investment control over the shares of common stock held by The Brandon K. Staglin Irrevocable Trust or The Shannon K. Staglin Irrevocable Trust.
Equity Compensation Plan Information
The following table sets forth certain information for each our equity compensation plans. For a description of each plan, see “Executive Compensation—Long-Term Incentives.”
| | Number of securities to be
issued upon exercise of
outstanding options,
warrants and rights | | Weighted-average exercise
price of outstanding
options, warrants and rights | | Number of securities
remaining available for
future issuance under
equity compensation plans | |
Equity compensation plans approved by stockholders: | | | | | | | | | | | | | |
2007 Long-Term Equity Incentive Plan | | | 728,330 | | | | $ | 9.31 | | | | 3,571,670 | | |
Employee Stock Purchase Plan | | | — | | | | — | | | | 1,500,000 | | |
Equity compensation plans not approved by stockholders: | | | | | | | | | | | | | |
None | | | | | | | | | | | | | |
| | | | | | | | | | | | | | |
69
ITEM 13. CERTAIN RELATIONSHIPS AND RELATED TRANSACTIONS, AND DIRECTOR INDEPENDENCE
Related Party Transactions Policy and Procedure
Our legal and finance departments are primarily responsible for developing and implementing processes and controls to obtain information from our directors, executive officers and significant stockholders regarding related party transactions and then determining, based on the facts and circumstances, whether we or a related-party has a direct or indirect material interest in our transactions. We formed our audit committee on May 10, 2007, which is now responsible for the review, approval or ratification of “related-person transactions” between us or our subsidiaries and related persons. “Related person” refers to a person or entity that is, or at any point since the beginning of the last fiscal year was, a director, officer, nominee for director, or 5% stockholder of us, or the immediate family members of such a person or entity. Our audit committee does not have a written policy regarding the approval of related party transactions but will apply its review procedures to potential related-person transactions as a part of its standard operating procedures. In the course of its review and approval or ratification of a related-party transaction, the audit committee will consider:
· the nature of the related party’s interest in the transaction;
· the material terms of the transaction, including, the amount involved and type of transaction;
· the importance of the transaction to the related party and to us;
· whether the transaction would impair the judgment of a director or executive officer to act in our best interest and the best interest of our stockholders; and
· any other matters the audit committee deems appropriate.
Any member of the audit committee who is a related person with respect to a transaction under review may not participate in the deliberations or vote on the approval or ratification of the transaction. However, such a director may be counted in determining the presence of a quorum at a meeting of the audit committee at which the transaction is considered.
Since July 1, 2005, we have not been a party to, and we have no plans to be a party to, any transaction or series of similar transactions in which the amount involved exceeded or will exceed $120,000 and in which any current director, executive officer, holder of more than 5% of our capital stock, or any member of the immediate family of any of the foregoing, had or will have a direct or indirect material interest, other than in connection with the transactions described below. All of the transactions described below were entered into prior to the formation of our audit committee, and were reviewed by our board of directors, which primarily considered the interests of our stockholders and practices with other private equity sponsor-owned companies in considering whether transactions were fair.
Indemnification and Employment Agreements
As permitted by the Delaware General Corporation Law, our certificate of incorporation includes provisions that authorize and require us to indemnify our officers and directors to the full extent permitted under Delaware law, subject to limited exceptions. We have also entered into employment agreements with our executive officers. See “Executive Compensation—Compensation Discussion and Analysis—Elements of Compensation.”
70
Our April 2005 Formation and Funding
We sold the following securities to our directors, named executive officers and principal securityholders in connection with our formation and initial funding. Class A Common Units were sold at $0.30 per unit, and Class B Preferred Units were sold at $1,000 per unit.
| | Class A
Common Units | | Class B
Preferred Units | | Aggregate
Purchase Price | |
GTCR Fund VIII, L.P. | | | 11,291,466 | | | | 846.860 | | | | $ | 4,234,300 | | |
GTCR Fund VIII/B, L.P. | | | 1,981,600 | | | | 148.620 | | | | 743,100 | | |
GTCR Co-Invest II, L.P. | | | 60,266 | | | | 4.520 | | | | 22,600 | | |
Total—principal securityholders | | | 13,333,332 | | | | 1,000.000 | | | | $ | 5,000,000 | | |
Tony Aquila | | | 1,346,673 | | | | 16.625 | | | | $ | 420,627 | | |
John Schwinn | | | 266,512 | | | | 1.771 | | | | 81,725 | | |
Michael D. Conway | | | 188,785 | | | | 2.014 | | | | 58,650 | | |
Garen Staglin | | | 72,196 | | | | 2.379 | | | | 24,037 | | |
Roxani Gillespie | | | 40,482 | | | | — | | | | 12,145 | | |
Total—directors and named executive officers | | | 1,914,648 | | | | 22.789 | | | | $ | 597,184 | | |
The units sold to our directors and named executive officers were issued pursuant to senior management agreements or securities purchase agreements, which are described in greater detail below under the caption “—Agreements Related to our 2005 Formation and Funding and the Acquisition—Senior Management Agreements and Securities Purchase Agreements.”
The Acquisition
On April 13, 2006, certain of our indirect, wholly-owned subsidiaries acquired the Claims Services Group of ADP as follows: (1) Audatex North America, Inc. acquired all of the outstanding common stock of ADP Claims Services Group, Inc., its subsidiaries and ADP Integrated Medical Solutions, Inc. from ADP, (2) Audatex North America, Inc. acquired all of the outstanding common stock of ADP Hollander, Inc. from ADP Atlantic Inc., (3) Business Services Group Holdings B.V. acquired all of the outstanding capital shares of ADP Business Services Group B.V. from ADP Nederland B.V., (4) Audatex Holdings IV B.V. acquired all of the outstanding capital shares of Audatex Holding GmbH from ADP Nederland B.V., (5) Audatex Holdings IV B.V. acquired all of the outstanding capital shares of ADP Network Services Netherlands B.V. from ADP Nederland B.V. and ADP International B.V., (6) Audatex Canada, ULC acquired the assets related primarily to our business owned by ADP Canada Co. and (7) Audatex Solutions Private Limited acquired the assets related primarily to our business owned by ADP Private Limited. The Acquisition was financed through (1) borrowings of $809.7 million, secured by assets of the businesses we acquired, including a $16.6 million revolving loan and $501.7 million and $291.4 million term loans, and (2) proceeds of $4.6 million from the issuance of Class A Common Units and $203.2 million from the issuance of Class B Preferred Units.
In connection with the Acquisition, we sold securities to our directors, named executive officers and principal securityholders in order to finance a part of the Acquisition. We also repurchased Class A Common Units from certain of our named executive officers in order to adjust the relative amounts of Class A Common Units and Class B Preferred units held by our securityholders, as well as to adjust the relative amounts of units held by our named executive officers that were vested and subject to future vesting. All Class A Common Units sold or purchased by us were sold or purchased at $0.30 per unit, and all Class B Preferred Units were sold by us at $1,000 per unit. We did not purchase any Class B Preferred Units from any investors. The following table sets forth the Class B Preferred Units sold to and the Class A Common Units either sold to or repurchased from, as applicable, each investor in connection with the Acquisition. The aggregate purchase price set forth below for each investor represents the net purchase
71
price paid by the investor, which is equal to the purchase price of Class B Preferred Units purchased, plus the purchase price of Class A Common Units purchased, if any, or minus the purchase price paid by us for Class A Common Units we repurchased from the investor, if any.
| | Class A
Common
Units Sold
(Repurchased) | | Class B
Preferred Units | | Aggregate
Purchase Price | |
GTCR Fund VIII, L.P. | | | 12,307,698 | | | | 169,067.130 | | | $ | 172,759,440 | |
GTCR Fund VIII/B, L.P. | | | 2,159,944 | | | | 29,670.497 | | | 30,318,480 | |
GTCR Co-Invest II, L.P. | | | 65,690 | | | | 902.373 | | | 922,080 | |
Total—principal securityholders | | | 14,533,332 | | | | 199,640.000 | | | $ | 204,000,000 | |
Tony Aquila | | | 176,850 | | | | 1,526.318 | | | $ | 1,579,373 | |
Jack Pearlstein | | | 954,114 | | | | 1,213.766 | | | 1,500,000 | |
John Schwinn | | | (62,494 | ) | | | 187.023 | | | 168,275 | |
Michael D. Conway | | | (37,525 | ) | | | 202.608 | | | 191,350 | |
Garen Staglin | | | 7,874 | | | | 223.600 | | | 225,963 | |
Roxani Gillespie | | | 8,202 | | | | — | | | 2,461 | |
Total—directors and named executive officers | | | 1,047,021 | | | | 3,353.315 | | | $ | 3,667,422 | |
The units sold to and/or purchased from our directors and named executive officers were issued and/or repurchased pursuant to amended and restated senior management agreements, a securities purchase agreement or amended and restated securities purchase agreements, which are described in greater detail below under the caption “—Agreements Related to our 2005 Formation and Funding and the Acquisition—Senior Management Agreements and Securities Purchase Agreements.”
Agreements Related to Our 2005 Formation and Funding and the Acquisition
Purchase Agreement. As described above, we issued Class A Common Units and Class B Preferred Units to affiliates of GTCR in our April 2005 formation and funding pursuant to a purchase agreement and issued Class A Common Units and Class B Preferred Units to affiliates of GTCR in connection with the Acquisition pursuant to an amended and restated purchase agreement. In connection with our initial public offering, affiliates of GTCR and we agreed to amend and restate the amended and restated unit purchase agreement. The second amended and restated purchase agreement imposes continuing requirements on us in favor of the affiliates of GTCR who held shares of our common stock following the completion of our initial public offering, so long as they continue to hold a certain percentage of the numbers of shares of our common stock that they held following the completion of our initial public offering. So long as affiliates of GTCR continue to hold such shares, we will be required to obtain their consent prior to (1) issuing or granting any stock-based compensation to certain members of our management team, (2) increasing the number of members on each of our compensation committee and our nominating and corporate governance committee and (3) increasing the number of shares available for issuance under our equity plans. So long as they continue to hold the requisite amount of shares noted above, the affiliates of GTCR will also be entitled to designate one member of each of our compensation committee and our nominating and corporate governance committee.
Senior Management Agreements and Securities Purchase Agreements. In connection with our April 2005 formation and funding, we entered into senior management agreements with each of Messrs. Aquila, Schwinn and Conway and securities purchase agreements with Mr. Staglin and Ms. Gillespie, pursuant to which these individuals purchased Class A Common Units and Class B Preferred Units. In connection with the Acquisition, we entered into amended and restated senior management agreements with each of Messrs. Aquila, Schwinn and Conway and, in the case of Mr. Pearlstein, an employment agreement, which set forth the terms of employment for each of our named executive officers following the Acquisition, as
72
described in greater detail under the caption “Management—Employment Agreements.” Each of our named executive officers also purchased Class A Common Units and Class B Preferred Units pursuant to these agreements, or, in the case of Mr. Pearlstein, a securities purchase agreement, and the agreements set forth certain terms and restrictions on all units held by these executives. In connection with the Acquisition, we also entered into amended and restated securities purchase agreements with Mr. Staglin and Ms. Gillespie pursuant to which these directors purchased Class A Common and Class B Preferred Units, and these agreements set forth certain terms and restrictions on all units held by these managers.
We expect to enter into second amended and restated senior management agreements with each of Messrs. Aquila, Schwinn and Conway; an amended and restated securities purchase agreement with Mr. Pearlstein; and second amended and restated securities purchase agreements with Ms. Gillespie and Mr. Staglin. We expect to enter into these agreements primarily to reflect: the reverse split of our common units, our conversion into a corporation, the conversion of all of our outstanding equity units into shares of our common stock and the completion of our initial public offering.
The following sets forth the terms of the existing agreements with respect to the shares of common stock held by our named executive officers and certain of our directors resulting from the conversion of equity units purchased in connection with our formation and funding and the Acquisition.
Of the shares of common stock acquired by our named executive officers and/or directors pursuant to the agreements described above, the table below sets for the number of shares held by each individual that are subject to vesting.
Executive Officer or Director | | | | Shares of Common Stock
Subject to Vesting | |
Tony Aquila | | | 1,309,226 | | |
Jack Pearlstein | | | 785,535 | | |
John Schwinn | | | 177,796 | | |
Michael D. Conway | | | 122,840 | | |
Garen Staglin | | | 48,684 | | |
Roxani Gillespie | | | 48,684 | | |
Of the shares subject to vesting, 20% vested in April 2006 and the remainder vest 5% at the end of each fiscal quarter ending after April 2006, so long as, in the case of an executive officer, he remains employed by us or one of our subsidiaries or, in the case of a director, he or she remains manager or director of us or one of our subsidiaries. If the employment of any executive officer or the service of any manager/director is terminated, any unvested shares will be subject to repurchase by us, or by affiliates of GTCR to the extent that we do not exercise our repurchase right, for a repurchase price equal to the lesser of the original purchase price, $0.30 per share, and the fair market of the shares as of the date of termination.
The amended and restated senior management agreements, Mr. Pearlstein’s securities purchase agreement and the amended and restated securities purchase agreements prohibit the transfer of units, other than:
· to us or affiliates of GTCR pursuant to the repurchase right described above;
· to family members, pursuant to laws of inheritance or to a guardian, in each case so long as the transferee agrees to be bound by the transfer restrictions; or
· pursuant to a sale of us, in connection with participation rights in sales by affiliates of GTCR or certain public sales executed by specified affiliates of GTCR.
The transfer restrictions survive with respect to each share of our common stock until the earliest of:
· the date on which such share is transferred in a public sale permitted by the agreement; and
· the consummation of a sale of the business.
73
Securityholders Agreement. In connection with the Acquisition, we entered into a securityholders agreement with affiliates of GTCR and certain of our named executive officers. Subject to specified conditions, the agreement requires the securityholders who are parties to it to consent to any sale of us to a non-affiliate of GTCR if the sale is approved by the holders of a majority of the units subject to the agreement. This provision generally applies to any set of transactions that results in the acquisition, by a person or group of related persons, of substantially all of our assets or of an amount of our units with sufficient voting power to elect a majority of our managers. However, a public offering of our units (or the equity units of our successor) or a sale to GTCR affiliates is not subject to this provision. This agreement was terminated in connection with our initial public offering.
Professional Services Agreement. In connection with our April 2005 initial formation and funding, we entered into a professional services agreement with GTCR, pursuant to which we engaged GTCR as a financial and management consultant. Under this agreement, GTCR agreed to consult with our board of managers and management regarding corporate strategy, budgeting of future corporate investments, acquisition and divestiture strategies and debt and equity financings. We agreed to pay GTCR an annual management fee of $250,000 and to reimburse GTCR for fees and expenses incurred by GTCR or its personnel in connection with the performance of their obligations under this agreement. We agreed also to pay GTCR a placement fee equal to 1% of the gross amount of any debt or equity financing of us or any of our subsidiaries and to indemnify GTCR and its personnel against losses arising from their performance under the agreement (except due to gross negligence or willful misconduct). During fiscal 2005 and fiscal 2006, we paid fees to GTCR under this agreement of approximately $0.5 million and $11.0 million, respectively. During fiscal 2007, we paid GTCR approximately $208,000 in management fees. This agreement was terminated in connection with our initial public offering.
Advisory Services Agreement
We entered into a letter agreement in February 2006 with Garen Staglin, one of our directors, pursuant to which Mr. Staglin received an advisory and success fee of $3.8 million upon the closing of the Acquisition.
Consulting Agreement
We entered into a consulting agreement in September 2006 with Roxani Gillespie, one of our directors, pursuant to which Ms. Gillespie was employed to resolve certain employee relations issues for us in the Netherlands. Ms. Gillespie was paid a fee of $26,000 per month for a three-month period under the terms of this agreement.
Registration Rights Agreement
We entered into a registration rights agreement pursuant to which we have agreed to register for sale under the Securities Act shares of our common stock in the circumstances described below. All persons who purchased our units in connection with our formation and funding or the Acquisition are parties to the registration rights agreement. This agreement provides some holders of our common stock with the right to require us to register common stock owned by them and other stockholders who are parties to the agreement and provides stockholders who are parties to the agreement with the right to include common stock owned by them in a registration statement under most other circumstances. The following describes such rights and circumstances.
Demand Rights. The holders of a majority of the shares of our common stock issued with respect to units purchased by affiliates of GTCR in connection with the Acquisition or our 2005 formation and funding have the right to require us to register their shares.
74
We call the right to require us to register shares a demand right and the resulting registration a demand registration. Stockholders with demand rights may make an unlimited number of such demands for registration on Form S-1 or, if available to us, on Form S-3. Holders of piggyback rights, described below, may include shares they own in a demand registration.
Piggyback Rights. A larger group of stockholders can request to participate in, or “piggyback” on, registrations of any of our securities for sale by us or by a third party. We call this right a piggyback right and the resulting registration a piggyback registration. The piggyback right applies to the following shares:
· the shares described above that have demand rights;
· shares of our common stock held by specified executive officers, as well as any other executive officer who, with the consent of an affiliate of GTCR, becomes a party to the registration rights agreement. As of June 30, 2007, all of our named executive officers, Ms. Gillespie and Mr. Staglin were parties to the registration rights agreement; and
· shares of our common stock held by any other person to whom we issue equity securities and whom we permit, with the consent of an affiliate of GTCR, to become a party to the registration rights agreement.
The piggyback right applies to any registration other than:
· our initial public offering;
· a demand registration; or
· a registration on Form S-4 or S-8.
Conditions and Limitations; Expenses. The registration rights outlined above are subject to conditions and limitations, including the right of the underwriters to limit the number of shares to be included in a registration and our right to delay or withdraw a registration statement under specified circumstances.
We are not required to make a demand registration on Form S-1 within 90 days of either a prior demand registration on Form S-1 or a prior piggyback registration, unless those stockholders with piggyback rights were unable to register all the shares they wished to in the prior piggyback registration. In addition, holders of securities with registration rights may not make any public sale of our equity securities (including sales under Rule 144) during a period that begins seven days before the effectiveness of a registration statement and that ends, in the case of our initial public offering, 180 days after the initial public offering and, in any other underwritten offering in which registration rights are exercised, 180 days after effectiveness. In either case, the managing underwriters for the relevant offering may agree to shorten this period.
The underwriters in any demand registration will be selected by the holders of a majority of the shares with demand rights that are included in the registration, and the underwriters in any piggyback registration that is underwritten will be selected by the holders of a majority of the shares that are included in the piggyback registration.
Other than underwriting discounts and commissions and brokers’ commissions, we will pay all registration expenses in connection with a registration, as well as reasonable (or otherwise limited) fees for legal counsel to the stockholders with registration rights.
75
ITEM 14. PRINCIPAL ACCOUNTING FEES AND SERVICES
Accounting Fees
The following table shows the fees paid or accrued for the audit and other services provided by Deloitte & Touche LLP, or Deloitte, for fiscal 2007 and 2006.
| | Fiscal Years Ended June 30, | |
| | 2007 | | 2006 | |
Audit fees (1) | | $ | 7,170,000 | | $ | 622,000 | |
Tax fees (2) | | 879,000 | | 27,000 | |
Total | | $ | 8,049,000 | | $ | 649,000 | |
(1) This category includes the audit of our annual financial statements, review of financial statements included in our Form 10-Q quarterly reports, services performed in connection with our initial public offering and services that are normally provided by the independent registered public accounting firm in connection with statutory and regulatory filings including consents and advice on accounting matters that arose during, or as a result of, the audit or the review of interim financial statements. This category also includes statutory audits required by non-U.S. jurisdictions, and the preparation of an annual “management letter” on internal control matters.
(2) These are fees for professional services performed by Deloitte with respect to tax compliance and tax planning and advice. Tax compliance includes preparation of original and amended tax returns, refund claims, tax payment planning and tax audit assistance.
Pre-Approval of Audit and Non-Audit Services
All audit and non-audit services provided by Deloitte to us must be pre-approved by the audit committee. The audit committee utilizes the following procedures in pre-approving all audit and non-audit services provided by Deloitte. At or before the first meeting of the audit committee each year, the audit committee is presented with a detailed listing of the individual audit and non-audit services and fees (separately describing audit-related services, tax services and other services) expected to be provided by Deloitte during the year. During the first quarter of each year, the audit committee is presented with an updated listing of approved services highlighting any new audit and non-audit services to be provided by Deloitte. The audit committee reviews these listings and approves the services outlined therein if such services are acceptable to the audit committee. To ensure prompt handling of unexpected matters, the audit committee delegates to the chairman of the audit committee the authority to amend or modify the list of audit and non-audit services and fees; provided, however, that such additional or amended services may not affect Deloitte’s independence under applicable SEC rules. The chairman reports any such action taken to the audit committee at the subsequent audit committee meeting.
76
PART IV
ITEM 15. EXHIBITS AND FINANCIAL STATEMENT SCHEDULES
(a)(1) Financial Statements.
| | Page | |
Solera Holdings, Inc.—Consolidated Financial Statements | | | | | |
Report of Independent Registered Public Accounting Firm | | | 78 | | |
Consolidated Balance Sheets as of fiscal years ended June 30, 2007 and 2006 | | | 79 | | |
Consolidated Statements of Operations for the fiscal years ended June 30, 2007 and 2006 and the period from March 24, 2005 to June 30, 2005 | | | 80 | | |
Consolidated Statements of Stockholders’/Unitholders’ Equity for the fiscal years ended June 30, 2005 and 2006 and the period from March 24, 2005 to June 30, 2005 | | | 81 | | |
Consolidated Statements of Cash Flows for the fiscal years ended June 30, 2007 and 2006 and the period from March 24, 2005 to June 30, 2005 | | | 82 | | |
Notes to Consolidated Financial Statements | | | 83 | | |
Combined Financial Statements of Claims Services Group | | | | | |
Independent Auditors’ Report | | | 108 | | |
Combined Balance Sheets as of June 30, 2004 and 2005 | | | 109 | | |
Statements of Combined Earnings for the years ended June 30, 2004 and 2005, and for the period from July 1, 2005 through April 13, 2006 | | | 110 | | |
Statements of Combined Group Equity for the years ended June 30, 2004 and 2005, and for the period from July 1, 2005 through April 13, 2006 | | | 111 | | |
Statements of Combined Cash Flows for the years ended June 30, 2004 and 2005, and for the period from July 1, 2005 through April 13, 2006 | | | 112 | | |
Notes to Combined Financial Statements | | | 113 | | |
(a)(2) Financial Statement Schedules. All schedules have been omitted because they are not required or applicable or the information is included in the consolidated financial statements or notes thereto.
(a)(3) Exhibits. The list of exhibits in the Exhibit Index to this Annual Report on Form 10-K is incorporated herein by reference.
77
REPORT OF INDEPENDENT REGISTERED PUBLIC ACCOUNTING FIRM
To the Board of Directors and Stockholders of
Solera Holdings, Inc.
We have audited the accompanying consolidated balance sheets of Solera Holdings, Inc. and subsidiaries (the “Company”) as of June 30, 2007 and 2006, and the related consolidated statements of operations, stockholders’/unitholders’ equity (deficit) and accumulated other comprehensive income (loss), and cash flows for the fiscal years ended June 30, 2007 and 2006 and for the period from March 24, 2005 (inception) through June 30, 2005. These financial statements are the responsibility of the Company’s management. Our responsibility is to express an opinion on these financial statements based on our audits.
We conducted our audits in accordance with the standards of the Public Company Accounting Oversight Board (United States). Those standards require that we plan and perform the audit to obtain reasonable assurance about whether the financial statements are free of material misstatement. The Company is not required to have, nor were we engaged to perform, an audit of its internal controls over financial reporting. Our audits included consideration of internal control over financial reporting as a basis for designing audit procedures that are appropriate in the circumstances, but not for the purpose of expressing an opinion on the effectiveness of the Company’s internal control over financial reporting. Accordingly, we express no such opinion. An audit also includes examining, on a test basis, evidence supporting the amounts and disclosures in the financial statements, assessing the accounting principles used and significant estimates made by management, as well as evaluating the overall financial statement presentation. We believe that our audits provide a reasonable basis for our opinion.
In our opinion, such consolidated financial statements present fairly, in all material respects, the financial position of the Company as of June 30, 2007 and 2006, and the results of its operations and its cash flows for the fiscal years ended June 30, 2007 and 2006 and for the period from March 24, 2005 (inception) through June 30, 2005, in conformity with accounting principles generally accepted in the United States of America.
As discussed in Note 11 to the consolidated financial statements, on June 30, 2007, the Company changed its method of accounting for defined benefit pension and other postretirement plans upon the adoption of Financial Accounting Standards Board (“FASB”) Statement No. 158, Employers’ Accounting for Defined Benefit Pension and Other Postretirement Plans—an amendment of FASB Statements No. 87, 88, 106 and 132(R). In addition, as discussed in Note 11 to the consolidated financial statements, the Company adopted FASB Statement No. 123(R), Share-Based Payment, effective July 1, 2006.
/s/ Deloitte & Touche LLP
San Jose, California
September 14, 2007
78
SOLERA HOLDINGS, INC. AND SUBSIDIARIES
CONSOLIDATED BALANCE SHEETS
AS OF JUNE 30, 2007 AND JUNE 30, 2006
(In thousands, except share/unit amounts)
| | June 30,
2007 | | June 30,
2006 | |
ASSETS | | | | | |
CURRENT ASSETS: | | | | | |
Cash and cash equivalents | | $ | 89,868 | | $ | 88,826 | |
Accounts receivable—net | | 85,543 | | 58,475 | |
Other receivable | | 9,297 | | 21,759 | |
Other current assets | | 16,901 | | 14,153 | |
Deferred income tax assets | | 3,248 | | 4,675 | |
Total current assets | | 204,857 | | 187,888 | |
PROPERTY AND EQUIPMENT—Net | | 51,485 | | 38,285 | |
OTHER ASSETS | | 11,625 | | 37,512 | |
LONG TERM DEFERRED INCOME TAX ASSETS | | 23,835 | | 6,605 | |
GOODWILL | | 569,165 | | 541,421 | |
INTANGIBLE ASSETS—Net | | 362,986 | | 441,294 | |
TOTAL | | $ | 1,223,953 | | $ | 1,253,005 | |
LIABILITIES AND STOCKHOLDERS’/UNITHOLDERS’ EQUITY (DEFICIT) | | | | | |
CURRENT LIABILITIES: | | | | | |
Accounts payable | | $ | 25,571 | | $ | 14,043 | |
Accrued expenses and other current liabilities | | 89,240 | | 107,479 | |
Income taxes payable | | 13,995 | | 23,901 | |
Deferred income tax liabilities | | 1,076 | | 3,525 | |
Current portion of long-term debt | | 14,140 | | 16,211 | |
Total current liabilities | | 144,022 | | 165,159 | |
LONG-TERM DEBT | | 599,128 | | 831,628 | |
OTHER LIABILITIES | | 25,378 | | 117 | |
LONG-TERM DEFERRED INCOME TAX LIABILITIES | | 42,922 | | 51,264 | |
Total liabilities | | 811,450 | | 1,048,168 | |
COMMITMENTS AND CONTINGENCIES (Note 14) | | | | | |
CLASS B REDEEMABLE PREFERRED UNITS—Unlimited units authorized; no units and 204,239 units issued and outstanding as of June 30, 2007 and June 30, 2006, respectively | | — | | 207,865 | |
MINORITY INTERESTS IN CONSOLIDATED SUBSIDIARIES | | 11,229 | | 9,375 | |
STOCKHOLDERS’/UNITHOLDERS’ EQUITY (DEFICIT): | | | | | |
Class A Common Units: unlimited units authorized; 31,046,962 issued and outstanding as of June 30, 2006 | | — | | 4,907 | |
Common Shares, $0.01 par value : 150,000,000 shares authorized; 64,813,563 issued and outstanding as of June 30, 2007 | | 505,939 | | — | |
Deferred unit based compensation | | — | | (1,446 | ) |
Accumulated deficit | | (111,687 | ) | (19,627 | ) |
Accumulated other comprehensive income | | 7,022 | | 3,763 | |
Total stockholders’/unitholders’ equity (deficit) | | 401,274 | | (12,403 | ) |
TOTAL | | $ | 1,223,953 | | $ | 1,253,005 | |
See notes to consolidated financial statements.
79
SOLERA HOLDINGS, INC. AND SUBSIDIARIES
CONSOLIDATED STATEMENTS OF OPERATIONS
FOR THE FISCAL YEARS ENDED JUNE 30, 2007 and 2006 AND FOR
THE PERIOD FROM MARCH 24, 2005 (INCEPTION) THROUGH JUNE 30, 2005
(In thousands, except per share and per unit amounts)
| | | | | | Period from | |
| | | | | | March 24, 2005 | |
| | | | | | (Inception) | |
| | Fiscal Year Ended | | Through | |
| | June 30, 2007 | | June 30, 2006 | | June 30, 2005 | |
Revenues | | | $ | 471,960 | | | | $ | 95,084 | | | | $ | 155 | | |
Cost of revenues: | | | | | | | | | | | | | |
Operating expenses | | | 138,345 | | | | 29,013 | | | | 228 | | |
Systems development and programming costs | | | 65,041 | | | | 15,080 | | | | — | | |
Total cost of revenues (excluding depreciation and amortization) | | | 203,386 | | | | 44,093 | | | | 228 | | |
Selling, general and administrative expenses | | | 134,545 | | | | 27,105 | | | | 673 | | |
Depreciation and amortization | | | 104,419 | | | | 23,571 | | | | 16 | | |
Restructuring charges | | | 6,049 | | | | 2,871 | | | | — | | |
Interest expense | | | 69,681 | | | | 14,842 | | | | — | | |
Other (income) expense—net | | | 31,509 | | | | 1,836 | | | | (22 | ) | |
| | | 549,589 | | | | 114,318 | | | | 895 | | |
Loss before income tax benefit and minority
interests | | | (77,629 | ) | | | (19,234 | ) | | | (740 | ) | |
Income tax benefit | | | (773 | ) | | | (1,268 | ) | | | — | | |
Minority interest in net income of consolidated subsidiaries | | | 4,050 | | | | 921 | | | | — | | |
Net loss | | | (80,906 | ) | | | (18,887 | ) | | | (740 | ) | |
Dividends and redeemable preferred unit accretion | | | 14,614 | | | | 88,789 | | | | 93 | | |
Net loss allocable to common stockholders/unitholders | | | $ | (95,520 | ) | | | $ | (107,676 | ) | | | $ | (833 | ) | |
Net loss allocable to common stockholders/unitholders per share/unit: | | | | | | | | | | | | | |
Basic and diluted | | | $ | (2.82 | ) | | | $ | (6.34 | ) | | | $ | (0.07 | ) | |
Weighted average shares/units used in the calculation of net loss per share/unit allocable to common stockholders/unitholders: | | | | | | | | | | | | | |
Basic and diluted | | | 33,865 | | | | 16,978 | | | | 12,685 | | |
Pro forma net loss data (unaudited)—Note 1 | | | | | | | | | | | | | |
Net loss allocable to common stockholders/unitholders as reported | | | $ | (95,520 | ) | | | $ | (107,676 | ) | | | | | |
Pro forma adjustment for income tax benefit | | | (956 | ) | | | (1,561 | ) | | | | | |
Pro forma net loss allocable to common stockholders/unitholders | | | $ | (94,564 | ) | | | $ | (106,115 | ) | | | | | |
Pro forma basic and diluted net loss allocable to common stockholders/unitholders per common share/unit | | | $ | (2.79 | ) | | | $ | (6.25 | ) | | | | | |
Weighted average shares/units used in pro forma basic and diluted net loss allocable to common stockholders/unitholders per common share/unit | | | 33,865 | | | | 16,978 | | | | | | |
| | | | | | | | | | | | | | | | | |
See notes to consolidated financial statements.
80
SOLERA HOLDINGS, INC. AND SUBSIDIARIES
CONSOLIDATED STATEMENTS OF STOCKHOLDERS’/UNITHOLDERS’ EQUITY (DEFICIT) AND
ACCUMULATED OTHER COMPREHENSIVE INCOME (LOSS)
FOR THE FISCAL YEARS ENDED JUNE 30, 2007 and 2006 AND FOR THE PERIOD FROM
MARCH 24, 2005 (INCEPTION) THROUGH JUNE 30, 2005
(In thousands, except share/unit amounts)
| | Common Shares | | Class A
Common Units | | Deferred | | Accumuated
Other
Compreensive | | Accumulated | | | |
| | Shares | | Amount | | Units | | Amount | | Compesation | | Income | | Deficit | | Total | |
BALANCE—March 24, 2005 (Inception) | | — | | $ | — | | — | | $ | — | | | $ | — | | | | $ | — | | | | $ | — | | | $ | — | |
Issuance of Class A Common Units, net of issuance costs of $332 | | — | | — | | 15,595,456 | | 4,347 | | | — | | | | — | | | | — | | | 4,347 | |
Dividend | | — | | — | | — | | (20 | ) | | — | | | | — | | | | — | | | (20 | ) |
Accretion of redeemable preferred units | | — | | — | | — | | (73 | ) | | — | | | | — | | | | — | | | (73 | ) |
Net loss and comprehensive net loss | | — | | — | | — | | — | | | — | | | | — | | | | (740 | ) | | (740 | ) |
BALANCE—June 30, 2005 | | — | | — | | 15,595,456 | | 4,254 | | | — | | | | — | | | | (740 | ) | | 3,514 | |
Issuance of Class A Common Units, net of issuance costs of $930 | | — | | — | | 15,451,506 | | 89,442 | | | — | | | | — | | | | — | | | 89,442 | |
Deferred unit-based compensation | | — | | — | | — | | — | | | (1,807 | ) | | | — | | | | — | | | (1,807 | ) |
Amortization of deferred unit-based compensation | | — | | — | | — | | — | | | 361 | | | | — | | | | — | | | 361 | |
Dividend | | — | | — | | — | | (3,605 | ) | | — | | | | — | | | | — | | | (3,605 | ) |
Accretion of redeemable preferred units | | — | | — | | — | | (85,184 | ) | | — | | | | — | | | | — | | | (85,184 | ) |
Components of comprehensive loss: | | | | | | | | | | | | | | | | | | | | | | | |
Net loss | | — | | — | | — | | — | | | — | | | | — | | | | (18,887 | ) | | (18,887 | ) |
Foreign currency translation adjustments | | — | | — | | — | | — | | | — | | | | 3,763 | | | | — | | | 3,763 | |
Total comprehensive loss | | — | | — | | — | | — | | | — | | | | — | | | | — | | | (15,124 | ) |
BALANCE—June 30, 2006 | | — | | — | | 31,046,962 | | 4,907 | | | (1,446 | ) | | | 3,763 | | | | (19,627 | ) | | (12,403 | ) |
Cumulative effect of adopting SFAS 123(R) | | — | | — | | — | | (1,446 | ) | | 1,446 | | | | — | | | | — | | | — | |
Adjustment to adopt SFAS 158, net of tax | | | | | | | | | | | | | | | (492 | ) | | | | | | (492 | ) |
Unit-based compensation | | — | | — | | — | | 673 | | | — | | | | — | | | | — | | | 673 | |
Stock-based compensation | | | | 1,669 | | | | | | | — | | | | — | | | | — | | | 1,669 | |
Dividend | | — | | — | | — | | (4,071 | ) | | — | | | | — | | | | (10,543 | ) | | (14,614 | ) |
Issuance of Class A Common Units | | — | | — | | 675,435 | | 203 | | | — | | | | — | | | | — | | | 203 | |
Repurchase and retirement of LLC units | | — | | — | | (89,194 | ) | (266 | ) | | — | | | | — | | | | (611 | ) | | (877 | ) |
Conversion of Class A Common Units into Common Shares | | 31,633,203 | | — | | (31,633,203 | ) | — | | | — | | | | — | | | | — | | | — | |
Conversion of Class B Redeemable Preferred Units into Common
Shares | | 13,889,971 | | 222,479 | | — | | — | | | — | | | | — | | | | — | | | 222,479 | |
Issuance of Common Stock from initial public offering, net of issuance costs of $25,410 | | 19,200,000 | | 281,790 | | — | | — | | | — | | | | — | | | | — | | | 281,790 | |
Issuance of Common Stock (May 11 grants) | | 90,389 | | 1 | | — | | — | | | — | | | | — | | | | — | | | 1 | |
Components of comprehensive loss: | | | | | | | | | | | | | | | | | | | | | | | |
Net loss | | — | | — | | — | | — | | | — | | | | — | | | | (80,906 | ) | | (80,906 | ) |
Foreign currency translation adjustments | | — | | — | | — | | — | | | — | | | | 4,816 | | | | — | | | 4,816 | |
Unrealized net loss on derivative instruments, net of tax | | | | | | | | | | | — | | | | (1,065 | ) | | | | | | (1,065 | ) |
Total comprehensive loss | | — | | | | | | — | | | — | | | | — | | | | — | | | (77,155 | ) |
BALANCE—June 30, 2007 | | 64,813,563 | | $ | 505,939 | | — | | $ | — | | | $ | — | | | | $ | 7,022 | | | | $ | (111,687 | ) | | $ | 401,274 | |
See notes to consolidated financial statements.
81
SOLERA HOLDINGS, INC. AND SUBSIDIARIES
CONSOLIDATED STATEMENTS OF CASH FLOWS
FOR THE FISCAL YEARS ENDED JUNE 30, 2007 and 2006 AND FOR THE PERIOD FROM
MARCH 24, 2005 (INCEPTION) THROUGH JUNE 30, 2005
(In thousands)
| | Year Ended | | Period from
March 24, 2005
(Inception)
Through | |
| | June 30, 2007 | | June 30, 2006 | | June 30, 2005 | |
CASH FLOWS FROM OPERATING ACTIVITIES: | | | | | | | | | | | | | |
Net loss | | | $ | (80,906 | ) | | | $ | (18,887 | ) | | | $ | (740 | ) | |
Adjustments to reconcile net loss to net cash provided by (used in) operating activities: | | | | | | | | | | | | | |
Depreciation and amortization | | | 104,419 | | | | 23,571 | | | | 16 | | |
Minority interests in net income of consolidated subsidiaries | | | 4,050 | | | | 921 | | | | — | | |
Provision for doubtful accounts | | | (193 | ) | | | 69 | | | | — | | |
Stock/unit-based compensation | | | 2,343 | | | | 361 | | | | — | | |
Deferred income taxes | | | (21,844 | ) | | | (5,847 | ) | | | — | | |
Change in fair value of financial instrument | | | (1,544 | ) | | | 2,850 | | | | — | | |
Accrued interest on mezzanine loan | | | — | | | | 2,639 | | | | — | | |
Loss on debt extinguishment | | | 28,691 | | | | — | | | | — | | |
Other | | | 558 | | | | 368 | | | | — | | |
Changes in operating assets and liabilities—net of effects from acquisition of businesses: | | | | | | | | | | | | | |
(Increase) decrease in accounts receivable | | | (18,962 | ) | | | 3,540 | | | | (112 | ) | |
(Increase) decrease in other assets | | | 8,343 | | | | (8,044 | ) | | | (124 | ) | |
Increase in accounts payable | | | 10,695 | | | | 3,487 | | | | 36 | | |
Increase in accrued expenses and other liabilities | | | 20,324 | | | | 28,922 | | | | 270 | | |
Increase (decrease) in accrued interest | | | (9,896 | ) | | | 11,406 | | | | — | | |
Net cash provided by (used in) operating activities | | | 46,078 | | | | 45,356 | | | | (654 | ) | |
CASH FLOWS FROM INVESTING ACTIVITIES: | | | | | | | | | | | | | |
Capital expenditures | | | (27,230 | ) | | | (4,112 | ) | | | (412 | ) | |
Final working capital payment adjustment for acquisition of business | | | (13,167 | ) | | | — | | | | — | | |
Purchase of foreign currency exchange option | | | — | | | | (7,912 | ) | | | — | | |
Acquisitions of business—net of cash acquired | | | (1,110 | ) | | | (924,447 | ) | | | — | | |
Net cash used in investing activities | | | (41,507 | ) | | | (936,471 | ) | | | (412 | ) | |
CASH FLOWS FROM FINANCING ACTIVITIES: | | | | | | | | | | | | | |
Proceeds from issuance of debt | | | 610,688 | | | | 821,017 | | | | — | | |
Debt issuance costs | | | (4,393 | ) | | | (31,782 | ) | | | — | | |
Principal payments on financial asset acquisitions | | | (3,740 | ) | | | — | | | | | | |
Borrowings from revolving credit facility | | | 12,814 | | | | — | | | | — | | |
Repayments under revolving credit facility | | | (16,000 | ) | | | (16,946 | ) | | | — | | |
Repayments of long-term debt | | | (887,607 | ) | | | — | | | | — | | |
Premium on prepayment of long term debt | | | (6,975 | ) | | | — | | | | — | | |
Proceeds from termination of interest rate swaps | | | 7,741 | | | | — | | | | — | | |
Proceeds from sale of Class A common units—net of offering costs | | | 203 | | | | 87,635 | | | | 4,347 | | |
Proceeds from sale of Class B redeemable preferred units—net of offering costs | | | — | | | | 118,030 | | | | 951 | | |
Repurchase of Class A common and Class B redeemable preferred units | | | (877 | ) | | | — | | | | — | | |
Proceeds from sale of Common shares, net of offering costs | | | 281,790 | | | | — | | | | — | | |
Net cash provided by (used in) financing activities | | | (6,356 | ) | | | 977,954 | | | | 5,298 | | |
EFFECT OF FOREIGN CURRENCY EXCHANGE RATE CHANGES ON CASH AND CASH EQUIVALENTS | | | 2,827 | | | | (2,245 | ) | | | — | | |
NET CHANGE IN CASH AND CASH EQUIVALENTS | | | 1,042 | | | | 84,594 | | | | 4,232 | | |
CASH AND CASH EQUIVALENTS—Beginning of period | | | 88,826 | | | | 4,232 | | | | — | | |
CASH AND CASH EQUIVALENTS—End of period | | | $ | 89,868 | | | | $ | 88,826 | | | | $ | 4,232 | | |
SUPPLEMENTAL CASH FLOW INFORMATION | | | | | | | | | | | | | |
—Dividends and redeemable preferred share accretion | | | $ | 14,614 | | | | $ | 88,789 | | | | $ | 93 | | |
—Cash paid for interest | | | $ | 66,806 | | | | $ | — | | | | $ | — | | |
SUPPLEMENTAL DISCLOSURE OF NON-CASH INVESTING AND FINANCE ACTIVITIES: | | | | | | | | | | | | | |
—Capital assets financed | | | $ | 9,618 | | | | 34 | | | | — | | |
—Conversion of Class B redeemable preferred units into common shares | | | $ | 222,479 | | | | — | | | | — | | |
See notes to consolidated financial statements.
82
SOLERA HOLDINGS, INC. AND SUBSIDIARIES
NOTES TO CONSOLIDATED FINANCIAL STATEMENTS
(In thousands, except per share/unit and share/unit amounts)
1. ORGANIZATION AND BASIS OF PRESENTATION
Description of Business Solera Holdings, Inc. and subsidiaries (the “Company” or “Solera”) is a leading global provider of software and services to the automobile insurance claims processing industry. Its software and services help its customers: estimate the costs to repair damaged vehicles; determine pre-collision fair market values for vehicles damaged beyond repair; automate steps of the claims process; outsource steps of the claims process that insurance companies have historically performed internally; and monitor and manage their businesses through data reporting and analysis. The Company has operations in 49 countries and derives most of its revenues from its estimating and workflow software.
Solera was formed in March 2005. On April 13, 2006, Solera acquired the Claims Services Group (“CSG”), a business unit of Automatic Data Processing, Inc. (“ADP”), for approximately $1.0 billion. Prior to the acquisition of CSG, Solera’s operations consisted primarily of developing its business plan, recruiting personnel, providing consulting services, raising capital and identifying and evaluating operating assets for acquisition. The statement of operations for fiscal 2006 includes Solera’s results of operations for the entire year and the results of operations for CSG from April 14, 2006.
Solera accounted for the acquisition of CSG using the purchase method of accounting. As a result, the acquisition of CSG has and will continue to affect the results of operations significantly. The Company allocated the aggregate acquisition consideration to the tangible and intangible assets acquired and liabilities assumed based on their respective fair values as of the date of the acquisition. This has resulted in a significant increase in its annual depreciation and amortization expense. In addition, due to the effects of the increased borrowings to finance the CSG acquisition, its interest expense has increased significantly in the periods following the acquisition. As a result, the financial information for periods beginning on or after July 1, 2006 is not comparable to the information prior to this date.
On May 16, 2007, the Company completed an initial public offering of shares of the Company’s common stock. In the initial public offering, the Company sold 19,200,000 shares of common stock, and the selling stockholders sold 10,987,500 shares of common stock, which include 3,937,500 shares of common stock sold by the selling stockholders pursuant to the underwriters’ over-allotment option. In connection with the initial public offering, the Company amended its corporate status and converted from a Delaware limited liability company into a Delaware corporation with 150,000,000 authorized shares of common stock, par value $0.01, and 15,000,000 authorized share of preferred stock, par value $0.01. Upon the effectiveness of the conversion, all of the Company’s outstanding preferred and common units were automatically converted into shares of common stock based on their relative rights as set forth in the Company’s limited liability company agreement. As a result, 31,633,211 common units were converted into 31,633,211 shares of common stock, and 204,016.1 preferred units were converted into 13,889,974 shares of common stock.
Unaudited Pro Forma Information The unaudited pro forma net loss data present the pro forma effects of applying a provision for income taxes to historical net income. Such provision reflects the income taxes that would have been applicable had the Company been taxed as a C corporation for the fiscal years ended June 30, 2007 and 2006.
Pro forma net income (loss) per share/unit is based on the weighted average common shares/units outstanding. Pro forma net income (loss) per share/unit is computed as if the conversion into a Delaware corporation described above occurred on July 1, 2005.
83
Principles of Consolidation and Basis of Presentation The accompanying consolidated financial statements have been prepared in accordance with United States (“U.S.”) generally accepted accounting principles and applicable regulations of the Securities and Exchange Commission. The Company’s operating results for the twelve months ended June 30, 2007 are not necessarily indicative of the results that may be expected for future quarters and the fiscal year ending June 30, 2008.
The consolidated financial statements include the accounts of the Company and its subsidiaries. All significant intercompany accounts and transactions have been eliminated in consolidation.
On April 30, 2007, the Company’s Board of Managers approved a one-for-three reverse unit split. Immediately after giving effect to the split, the Company had approximately 31,046,962 common units outstanding (with fractional units to be paid to unitholders in cash). The split did not change the number of authorized common units or modify any voting rights or other terms of the common units. All unit and per unit information in the accompanying consolidated financial statements have been retroactively restated to reflect the split.
2. SUMMARY OF SIGNIFICANT ACCOUNTING POLICIES
Cash and Cash Equivalents The Company considers all highly liquid investments with original maturities of 90 days or less at the time of purchase to be cash equivalents.
Property and Equipment Property and equipment is stated at cost and depreciated over the estimated useful lives of the assets using the straight-line method. The estimated useful lives of assets are as follows:
Buildings | | 20 to 40 years |
Building improvements | | 5 to 15 years |
Leasehold improvements | | Lesser of 10 years or useful life |
Data processing equipment | | 3 years |
Furniture and fixtures | | 4 to 7 years |
Machinery and equipment | | 3 to 6 years |
Software licenses | | 3 years |
Goodwill and Other Intangible Assets The Company accounts for goodwill and other intangible assets in accordance with Statement of Financial Accounting Standards (“SFAS”) No. 142, Goodwill and Other Intangible Assets, which states that goodwill and intangible assets with indefinite useful lives should not be amortized, but instead tested for impairment at least annually at the reporting unit level. Intangible assets with finite lives are amortized over their estimated useful lives on an accelerated basis to reflect the pattern in which the economic benefits of the intangible assets are consumed. If an impairment exists, a write-down to fair value (normally measured by discounting estimated future cash flows) is recorded. All other intangible assets are reviewed for impairment in accordance with SFAS No. 144, Accounting for the Impairment or Disposal of Long-Lived Assets (“SFAS No. 144”).
Impairment of Long-Lived Assets In accordance with SFAS No. 144, long-lived assets are reviewed for impairment whenever events or changes in circumstances indicate that the carrying amount of an asset may not be recoverable. Recoverability of assets to be held and used is measured by a comparison of the carrying amount of an asset to estimated undiscounted future cash flows expected to be generated by the asset. If the carrying amount of an asset exceeds its estimated future cash flows, an impairment charge is recognized for the amount by which the carrying amount of the asset exceeds the fair value of the asset.
Classification of Equity Securities The Company has adopted the guidance of Emerging Issues Task Force Topic (“EITF”) D-98, Classification and Measurement of Redeemable Securities, in the measurement and classification of its equity securities.
84
Use of Estimates The preparation of financial statements and related disclosures in conformity with accounting principles generally accepted in the United States of America requires management to make judgments, assumptions and estimates that affect the amounts reported in the Company’s consolidated financial statements and accompanying notes. The Company bases its estimates and judgments on historical experience and on various other assumptions that it believes are reasonable under the circumstances. However, future events are subject to change and estimates and judgments routinely require adjustment. The amounts of assets and liabilities reported in the Company’s balance sheets and the amounts of revenues and expenses reported for each of its fiscal periods are affected by estimates and assumptions which are used for, but not limited to, the accounting for sales allowances, allowance for doubtful accounts, fair value of derivatives, goodwill and intangible asset impairments, amortization of intangibles, restructurings, liabilities under defined benefit plans, stock-based compensation and income taxes. Actual results could differ from these estimates.
Revenue Recognition The Company considers the guidance in Staff Accounting Bulletin Topic 13, Revenue Recognition (“SAB 104”), AICPA Statement of Position 97-2, Software Revenue Recognition, as amended (“SOP 97-2”), SFAS No. 13, Accounting for Leases, and Emerging Issues Task Force Issue No. 00-03, Application of AICPA Statement of Position 97-2 to Arrangements That Include the Right to Use Software Stored on Another Entity’s Hardware, and Emerging Issues Task Force Issue No. 00-21, Revenue Arrangements with Multiple Deliverables (“EITF 00-21”), in accounting for its revenue arrangements. Revenues are recognized only after services are provided, when persuasive evidence of an arrangement exists, the fee is fixed and determinable, and when collectibility is reasonably assured. The Company’s multiple element arrangements primarily include a combination of software licenses, hosted database and other services, installation and set-up services, hardware, maintenance services and transaction-based deliverables.
The Company generates a significant majority of its revenue from subscription-based contracts (where a monthly fee is charged), transaction-based contracts (where a fee per transaction is charged) and subscription-based contracts with additional transaction-based fees (where a monthly fee and a fee per transaction are charged).
Subscription-based and transaction-based contracts generally include the delivery of software, access to software through a hosted service (“Hosted Database”), upfront fees for the implementation and set-up activities necessary for the client to use/access the software (“Implementation Services”) and maintenance. Under a subscription arrangement, delivery of software, access to the Hosted Database and maintenance are considered a single element or a combined unit of accounting and related revenues are recognized at the end of each month upon the completion of the monthly service. Revenues under transaction-based contracts are recognized based on the guidance in AICPA Technical Practice Aid 5100.76, Fair value in multiple-element arrangements that include contingent usage based fees and software revenue recognition. The transaction-based fee represents payment for the right to use the software, access to the Hosted Database and maintenance. The fee is considered fixed and determinable only at the time actual usage occurs. Revenue is recognized based on actual usage. Implementation Services are considered a separate element or unit of accounting and the related revenue recognition is described below.
Subscription-based contracts with additional fees for certain types of transactions generally include all deliverables discussed in the above paragraph and also include an additional element, which is the option to access specialized queries on the Hosted Database. Revenue under subscription-based contracts with additional fees for certain types of transactions is accounted for based on the guidance in AICPA Technical Practice Aid 5100.76, Fair value in multiple-element arrangements that include contingent usage based fees and software revenue recognition. Under these arrangements, the delivery of software, access to software through the Hosted Database and maintenance are considered a combined unit of accounting, and the related fee is recognized at the end of each month upon the completion of the monthly service. The transaction-based fee is recognized at the time of actual usage. Implementation Services are
85
considered a separate element or unit of accounting and the related revenue recognition is described below.
When the Company is required to perform setup and implementation activities necessary for the client to receive services/software, up-front fees billed during the setup/implementation phase are deferred and amortized on a straight-line basis over the estimated customer life. The upfront fees represent fair value of the implementation services based on vendor specific objective evidence. The amortization of this deferred revenue will commence upon the start of the monthly service. Setup costs that are direct and incremental to the contract are capitalized and amortized on a straight-line basis over the estimated customer life.
In a limited number of revenue arrangements described above, the Company also provides generic computer equipment as part of the sales arrangement. Based on guidance in EITF Issue No. 03-5, Applicability of AICPA Statement of Position 97-2, “Software Revenue Recognition”, to Non-Software Deliverables in an Arrangement Containing More-than-Incidental Software, the generic computer equipment is considered a non-software deliverable since the Company’s software is not essential to the functionality of the generic computer equipment. Based on guidance in EITF No. 01-8, Determining Whether an Arrangement Contains a Lease, EITF 00-21, Revenue Arrangements with Multiple Deliverables, and SFAS 13, Accounting for Leases (“SFAS 13”), the Company accounts for the sale of generic equipment as a direct finance lease. The related revenue is recognized over the term of the contract using the effective interest rate method. The Company allocates revenue to SFAS 13 elements (equipment leases) and the non-SFAS 13 elements of its arrangements on a relative fair value basis using the Company’s best estimate of the fair value of the elements. Revenue from leased computer equipment represents approximately 1% of the Company’s consolidated revenue.
Revenues are reflected net of customer sales allowances, which are based on both specific identification of certain accounts and a predetermined percentage of revenue based on historical experience.
Cost of revenues (excluding depreciation and amortization)—The Company’s costs and expenses applicable to revenues (“cost of revenues excluding depreciation and amortization”) represent the total of operating expenses and systems development and programming costs as presented on the consolidated statement of operations. Operating expenses include the compensation and benefits costs for operations, database development and customer service personnel, other costs related to operations, database development and customer support functions, as well as third-party data and royalty costs, and the cost of computer software and hardware used directly in the delivery of the Company’s products and services. Systems development and programming costs include compensation and benefit costs for the Company’s product development and product management personnel, other costs related to its product development and product management functions and costs related to external software consultants involved in systems development and programming activities.
Software Development Costs—Costs for the development of new software products and substantial enhancements to existing software products are expensed as incurred until technological feasibility has been established, at which time any additional costs would be capitalized in accordance with SFAS No. 86, Computer Software To Be Sold, Leased or Otherwise Marketed. The costs to develop such software have not been capitalized, as the Company believes its current software development process is essentially completed concurrent with the establishment of technological feasibility.
Foreign Currency Translation—The net assets of the Company’s foreign subsidiaries are translated into U.S. dollars based on foreign currency exchange rates in effect at the end of each period, and revenues and expenses are translated at average exchange rates during the periods. Functional currencies of significant foreign subsidiaries include Euros, British pounds, Swiss francs, and Canadian dollars. Foreign currency transaction gains or losses, which are included in the results of operations, totaled a loss of $65 for the
86
fiscal year ended June 30, 2007, a gain of $609 for the fiscal year ended June 30, 2006, and $0 for the period from March 24, 2005 (inception) to June 30, 2005. Gains or losses from balance sheet translation are included in stockholders’/unitholders’ equity within accumulated other comprehensive income on the consolidated balance sheets.
Internal Use Software—Expenditures for software purchases and software developed or obtained for internal use are capitalized and amortized over a three- to five-year period on a straight-line basis. For software developed or obtained for internal use, the Company capitalizes costs in accordance with the provisions of Statement of Position No. 98-1, Accounting for the Costs of Computer Software Developed or Obtained for Internal Use. The Company’s policy provides for the capitalization of external direct costs of materials and services associated with developing or obtaining internal use computer software. In addition, the Company also capitalizes certain payroll and payroll-related costs for employees who are directly associated with internal use computer software projects. The amount of capitalizable payroll costs with respect to these employees is limited to the time directly spent on such projects. Costs associated with preliminary project stage activities, training, maintenance and all other post-implementation stage activities are expensed as incurred. The Company also expenses internal costs related to minor upgrades and enhancements, as it is impractical to separate these costs from normal maintenance activities.
Income Taxes—The provisions for income taxes, income taxes payable and deferred income taxes are determined using the liability method. Deferred tax assets and liabilities are determined based on differences between the financial reporting and tax basis of assets and liabilities and are measured by applying enacted tax rates and laws to taxable years in which such differences are expected to reverse. A valuation allowance is provided when the Company determines that it is more likely than not that a portion of the deferred tax asset balance will not be realized.
Fair Value of Financial Instruments—Derivative financial instruments are used principally in the management of foreign currency and interest rate exposures and are recorded on the consolidated balance sheets at fair value. If the derivative is designated as a fair value hedge, the changes in the fair value of the derivative and of the hedged item attributable to the hedged risk are recognized as a charge or credit to earnings. If the derivative is designated as a cash flow hedge, the effective portions of the changes in the fair value of the derivative are initially recorded in accumulated other comprehensive income/loss and are subsequently reclassified into earnings when the hedged transactions occur and affect earnings. Ineffective portions of changes in the fair value of cash flow hedges are recognized as a charge or credit to earnings. Derivative instruments not designated as hedges are marked-to-market at the end of each accounting period with the results included in the consolidated statements of operations.
Advertising—Advertising costs are expensed when incurred and are included in selling, general and administrative expenses. Total advertising costs for the Company were $4,775, $1,573, and $6 for the fiscal years ended June 30, 2007 and June 30, 2006 and period from March 24, 2005 through June 30, 2005, respectively.
Share-/Unit-Based Compensation—Effective July 1, 2006, the Company adopted SFAS No. 123 (revised 2004), Share-Based Payment (“SFAS 123(R)”) which requires the measurement and recognition of compensation expense for all stock-based payment awards made to employees and directors, including employee stock options and share awards, based on estimated fair values recognized over the requisite service period. Prior to adoption of SFAS 123(R), pursuant to SFAS No. 123 Accounting for Stock-Based Compensation, the Company accounted for employee unit awards under Accounting Principles Board (“APB”) No. 25, Accounting for Stock Issued to Employees (“APB Opinion No. 25”) and followed the Disclosure—Only Provisions of SFAS No. 123. See Note 11.
Certain Risks and Concentrations—The Company offers a broad range of services to a diverse group of customers throughout North, Central and South America, Europe, the Middle East, Africa and Asia. The Company performs periodic credit evaluations of each customer and monitors their financial condition and
87
developing business news. Revenues for the period from March 24, 2005 (inception) through June 30, 2005 were not material. The Company did not have any customers with sales which exceeded 10% of total revenues for the fiscal years ended June 30, 2007 or June 30 2006.
Comprehensive Income (Loss)—The Company accounts for comprehensive income (loss) under the provisions of SFAS No. 130, Reporting Comprehensive Income (Loss), which establishes standards for reporting and displaying comprehensive income (loss) and its components in the financial statements. Comprehensive income (loss) as defined includes all changes in equity during a period from nonowner sources. For the fiscal years ended June 30, 2007 and June 30, 2006, comprehensive income (loss) consists of net loss, and foreign currency translation adjustments. In addition, during the fiscal year ended June 30, 2007, an unrealized loss on derivative instruments related to the effective portion of cash flow hedges was added as a new component of comprehensive income (loss) and is presented in the consolidated statement of stockholders’/unitholders’ equity (deficit) and accumulated other comprehensive income. For the period ended June 30, 2005, there was no difference between the Company’s net loss and comprehensive loss.
Recent Accounting Pronouncements—In June 2006, the FASB issued FASB Interpretation No 48, Accounting for Uncertainty in Income Taxes, an Interpretation of FASB Statement No. 109 (“FIN 48”). FIN 48 defines a criterion that an individual tax position must meet for any part of the benefit of that position to be recognized in an enterprise’s financial statements. FIN 48 also provides guidance on measurement, derecognition, classification, interest and penalties, accounting in interim periods, disclosure, and transition. FIN 48 is effective for the Company’s fiscal year beginning on July 1, 2007. The Company is currently evaluating the impact of FIN 48 on the Company’s financial statements.
In September 2006, FASB issued SFAS No. 158, Employers’ Accounting for Defined Benefit Pension and Other Postretirement Plans—an Amendment of FASB Statements No. 87, 88, 106 and 132(R) (“SFAS No. 158”). This statement requires a company to (a) recognize in its statement of financial position an asset for a plan’s overfunded status or a liability for a plan’s underfunded status, (b) measure a plan’s assets and its obligations that determine its funded status as of the end of the employer’s fiscal year, and (c) recognize changes in the funded status of a defined postretirement plan in the year in which the changes occur (reported in comprehensive income). The requirement to recognize the funded status of a benefit plan and the disclosure requirements were effective for the Company as of the end of fiscal 2007, and the Company adopted the statement as of June 30, 2007 (see Note 11).
In September 2006, the FASB issued SFAS No. 157, Fair Value Measurements (“SFAS No. 157”). This statement clarifies the definition of fair value, establishes a framework for measuring fair value, and expands the disclosures on fair value measurements. SFAS No. 157 is effective for fiscal years beginning after November 15, 2007. The Company is currently evaluating the effect that the adoption of SFAS No. 157 will have, if any, on its consolidated results of operations and financial condition.
In September 2006, the Securities and Exchange Commission issued Staff Accounting Bulletin No. 108 (“SAB 108”). SAB 108 considers the effects of prior year misstatements when quantifying misstatements in current year financial statements. It is effective for fiscal years ending after November 15, 2006. The Company applied the guidance in SAB 108 as of July 1, 2006. The application of SAB 108 did not have a significant effect on the Company’s consolidated financial statements.
In February 2007, the FASB issued SFAS No. 159, The Fair Value Option for Financial Assets and Financial Liabilities (SFAS No. 159). SFAS No. 159 permits companies to choose to measure certain financial instruments and certain other items at fair value. The standard requires that unrealized gains and losses on items for which the fair value option has been elected be reported in earnings. SFAS No. 159 is effective for the Company beginning in the first quarter of fiscal year 2009, although earlier adoption is permitted. The Company is currently evaluating the impact that SFAS No. 159 will have on its consolidated financial statements.
88
In March 2007, the FASB ratified EITF Issue No. 06-11, “Accounting for Income Tax Benefits of Dividends on Share-Based Payment Awards.” EITF 06-11 requires companies to recognize the income tax benefit realized from dividends or dividend equivalents that are charged to retained earnings and paid to employees for non-vested equity-classified employee stock-based payment awards as an increase to additional paid-in capital. EITF 06-11 is effective for fiscal years beginning after September 15, 2007. The Company does not expect that EITF 06-11 will have a material impact on its results of operations or cash flows.
Net Income (Loss) Per Common Share—The Company calculates net loss per common share in accordance with SFAS No. 128, Earnings Per Share (“SFAS No. 128”). Under SFAS No. 128, basic net loss per common share is calculated by dividing net loss by the weighted-average number of common shares outstanding during the reporting period excluding shares/units subject to repurchase.
Reconciliation of shares used in this calculation of basic net loss per share/unit is as follows (in thousands):
| | Fiscal Year
Ended
June 30, 2007 | | Fiscal Year
Ended
June 30, 2006 | | Period from
March 24, 2005
(inception)
through
June 30, 2005 | |
Weighted average number of common shares/units | | | 36,041 | | | | 18,897 | | | | 14,481 | | |
Weighted average common shares/units subject to repurchase | | | (2,176 | ) | | | (1,919 | ) | | | (1,796 | ) | |
Shares used to calculate basic net loss per share | | | 33,865 | | | | 16,978 | | | | 12,685 | | |
For the fiscal years ended June 30, 2007, 2006 and 2005, outstanding redeemable preferred units of 0, 204,239 and 1,025, respectively, and nonvested restricted common shares/units of 2,331,988 and nonvested common units of 2,010,293 and 1,934,653, respectively, have been excluded from the calculation as they are antidilutive due to the Company’s net loss.
89
3. OTHER (INCOME) EXPENSE—NET
Other (income) expense—net consists of the following:
| | Fiscal Year
Ended
June 30, 2007 | | Fiscal Year
Ended
June 30, 2006 | | Period from
March 24, 2005
(Inception)
Through
June 30, 2005 | |
Interest income | | | (2,633 | ) | | | $ | (405 | ) | | | $ | (22 | ) | |
Net realized and unrealized (gains) and losses on derivative instruments | | | (1,589 | ) | | | 2,850 | | | | — | | |
Foreign exchange (gain) loss | | | 65 | | | | (609 | ) | | | — | | |
Loss on Debt Extinguishment (Note 10) | | | 35,666 | | | | — | | | | — | | |
Other (income) expense—net | | | 31,509 | | | | $ | 1,836 | | | | $ | (22 | ) | |
4. ACQUISITION OF CLAIMS SERVICES GROUP OF ADP
On April 13, 2006, the Company acquired the Claims Services Group from ADP for approximately $1.0 billion. The Acquisition consisted of an asset purchase with respect to certain assets controlled by ADP, primarily in North America, and a purchase of a controlling interest in the outstanding shares of entities controlled by ADP, primarily in Europe. With respect to Sidexa S.A. (France), Informex S.A. (Belgium), Audatex Espana S.A. (Spain), Audatex Datos Espana S.A. (Spain), Audatex Portugal S.A. (Portugal) and Audatex Mexico S. De R.L. de C.V. (Mexico), the Company is the controlling stockholder, with ownership of 75%, 98%, 75%, 88%, 51%, and 51% of the outstanding shares, respectively. Claims Services Group’s results of operations have been included in the accompanying consolidated statements of operations from the date of the Acquisition.
The aggregate consideration was determined as:
Cash paid to ADP | | $ | 988,321 | |
Transaction costs and other | | 14,254 | |
| | $ | 1,002,575 | |
90
The Acquisition was accounted for as a purchase pursuant to SFAS No. 141, Business Combinations. Under purchase accounting, the total purchase price was allocated to the Claims Services Group’s net tangible and identifiable intangible assets based on their estimated fair values as of April 13, 2006, as set forth below. The excess of the purchase price over the net tangible and identifiable intangible assets was recorded as goodwill. The fair value of the identifiable intangible assets pertaining to customer relationships, software and database technology and trademarks was established based on a discounted cash flow approach. The purchase consideration has been allocated as follows:
Cash | | $ | 78,128 | |
Accounts receivable | | 62,010 | |
Other assets | | 54,800 | |
Property and equipment | | 38,094 | |
Intangible assets: | | | |
Software and database technology | | 239,200 | |
Customer relationships | | 173,900 | |
Trademarks | | 13,500 | |
Accounts payable and other accrued liabilities | | (97,972 | ) |
Tax-related liabilities | | (66,880 | ) |
Minority share of net assets | | (8,064 | ) |
Goodwill | | 515,859 | |
Total | | $ | 1,002,575 | |
In certain tax jurisdictions the Acquisition was structured as an asset purchase and the resulting goodwill of approximately $96,034 attributable to these jurisdictions is deductible for income tax purposes.
The unaudited pro forma information presented below reflects the combined results of the Company and the Claims Services Group as if the Acquisition and the related financing transactions had occurred at the beginning of each period presented. These results are not necessarily indicative of future operating results nor of those that would have occurred had the Acquisition been consummated on those dates:
| | Year Ended
June 30, 2006 | | Period From
March 24, 2005
Through
June 30, 2005 | |
Pro forma: | | | | | | | | | |
Revenues | | | $ | 430,230 | | | | $ | 103,035 | | |
Net loss allocable to common unit holders | | | (92,120 | ) | | | (33,111 | ) | |
Net loss allocable to common unit holders per unit: | | | | | | | | | |
Basic and diluted | | | (3.21 | ) | | | (1.21 | ) | |
Weighted average units used in the calculation of net loss per common unit allocable to common unit holders: | | | 28,668 | | | | 27,403 | | |
| | | | | | | | | | | |
91
5. RESTRUCTURING CHARGES
The Company has recorded restructuring charges, which primarily consist of one-time termination benefits, of $6,049, $2,871 and $0 for the fiscal years ended June 30, 2007 and 2006 and the period from March 24, 2005 (inception) through June 30, 2005, respectively. The 2007 restructuring initiatives were designed to achieve efficiencies and reduce costs in response to changes in projected demand for certain services. One-time termination benefits relate to the termination of approximately 125 employees during the fiscal year ended June 30, 2007. The restructuring reserves for an additional 156 employees are included in accrued expenses and other current liabilities in the consolidated balance sheets. The following table summarizes the charges for restructuring and related activities, including payments made and the ending reserve balances by business segment:
| | Restructuring Plan
from acquisition
of CSG | | FY07
Restructuring Plan | | Total | |
| | EMEA | | Americas | | EMEA | | Americas | | EMEA | | Americas | | Total | |
Balance—June 30, 2005 | | $ | — | | | $ | — | | | $ | — | | | $ | — | | | $ | — | | | $ | — | | | $ | — | |
Additions/adjustments | | 1,817 | | | 1,849 | | | — | | | — | | | 1,817 | | | 1,849 | | | 3,666 | |
Payments | | (164 | ) | | (241 | ) | | — | | | — | | | (164 | ) | | (241 | ) | | (405 | ) |
Balance—June 30, 2006 | | 1,653 | | | 1,608 | | | — | | | — | | | 1,653 | | | 1,608 | | | 3,261 | |
Additions/adjustments | | (258 | ) | | 783 | | | 4,104 | | | 1,456 | | | 3,846 | | | 2,239 | | | 6,085 | |
Payments | | (1,389 | ) | | (2,211 | ) | | — | | | (147 | ) | | (1,389 | ) | | (2,358 | ) | | (3,747 | ) |
Balance—June 30, 2007 | | $ | 6 | | | $ | 180 | | | $ | 4,104 | | | $ | 1,309 | | | $ | 4,110 | | | $ | 1,489 | | | $ | 5,599 | |
The EMEA business segment encompasses the Company’s operations in Europe, the Middle East, Africa and Asia. The Americas business unit encompasses the Company’s operations in North America, and Central and South America.
6. RECEIVABLES
Accounts receivable are net of an allowance for doubtful accounts of $724, $1,665, and $0 at June 30, 2007, 2006, and 2005, respectively. There were no customers with accounts receivable representing 10% or more of consolidated accounts receivable at June 30, 2007 or June 30, 2006. For the fiscal years ended June 30, 2007 and 2006 and the period from March 24, 2005 through June 30, 2005 the Company’s accounts receivable write-offs against the allowance for doubtful accounts were $1,615, $352, and $0, respectively. Accounts receivable recoveries (collections of previous write-offs) for the same above periods were $779, $184, and $0, respectively.
92
7. PROPERTY AND EQUIPMENT—NET
Property and equipment at cost and accumulated depreciation at June 30, 2007 and 2006 are as follows:
| | June 30, 2007 | | June 30, 2006 | |
Property and equipment: | | | | | | | | | |
Land and buildings | | | $ | 12,722 | | | | $ | 12,844 | | |
Machinery and equipment | | | 4,467 | | | | 2,013 | | |
Furniture and fixtures | | | 4,873 | | | | 3,403 | | |
Data processing equipment | | | 21,336 | | | | 13,037 | | |
Leasehold improvements | | | 13,365 | | | | 5,360 | | |
Software licenses | | | 11,473 | | | | 2,935 | | |
Capital leases | | | 1,388 | | | | 34 | | |
Property and equipment at cost | | | 69,624 | | | | 39,626 | | |
Less accumulated depreciation | | | (18,139 | ) | | | (1,341 | ) | |
Property and equipment—net | | | $ | 51,485 | | | | $ | 38,285 | | |
8. GOODWILL AND INTANGIBLE ASSETS—NET
Changes in goodwill during the year ended June 30, 2007 included the effects of the finalization of the purchase price allocation related to the acquisition of the Claims Services Group of ADP, as well as cumulative translation adjustments. Changes in goodwill for the years ended June 30, 2006 and June 30, 2007 by business segment are as follows:
| | EMEA | | Americas | | Total | |
Balance—June 30, 2005 | | $ | — | | $ | — | | $ | — | |
Additions from Acquisition | | 434,702 | | 84,958 | | 519,660 | |
Cumulative translation adjustments | | 21,448 | | 313 | | 21,761 | |
Balance—June 30, 2006 | | $ | 456,150 | | $ | 85,271 | | $ | 541,421 | |
Adjustments | | (9,274 | ) | 5,473 | | (3,801 | ) |
Cumulative translation adjustments | | 31,479 | | 66 | | 31,545 | |
Balance—June 30, 2007 | | $ | 478,355 | | $ | 90,810 | | $ | 569,165 | |
Components of intangible assets, excluding goodwill, as of June 30, 2007 and 2006, are as follows:
| | 2007 | | 2006 | |
Intangibles (excluding goodwill): | | | | | |
Internally developed software | | $ | 22,151 | | $ | 18,024 | |
Customer relationships | | 185,946 | | 179,138 | |
Trademarks | | 14,369 | | 14,396 | |
Software and database technology | | 249,347 | | 250,299 | |
| | 471,813 | | 461,857 | |
Less accumulated amortization | | (108,827 | ) | (20,563 | ) |
Intangible assets—net | | $ | 362,986 | | $ | 441,294 | |
93
Intangible assets (except goodwill) have finite lives and, as such, are subject to amortization. The weighted average remaining useful life of the intangible assets is 12.20 years (2.9 years for internally developed software, 19 years for customer relationships, 3 years for trademarks and 8 years for software and database). Internally developed software is amortized on a straight-line basis. Other intangible assets are amortized on an accelerated basis to reflect the pattern in which economic benefits of the intangible assets are consumed. Amortization of intangibles totaled $87,313, $20,563 and $0 for the fiscal years ended June 30, 2007 and 2006, and for the period from March 24, 2005 through June 30, 2005, respectively. Estimated amortization expense of the Company’s existing intangible assets for the next five fiscal years ending June 30 are as follows:
2008 | | $ | 74,827 | |
2009 | | 61,217 | |
2010 | | 50,659 | |
2011 | | 38,940 | |
2012 | | 30,684 | |
Thereafter | | 106,659 | |
Total | | $ | 362,986 | |
The above useful lives represent the Company’s best estimates. However, actual lives may differ from these estimates. In addition, the expected future amortization may vary based on fluctuations in foreign currency exchange rates.
9. FINANCIAL INSTRUMENTS AND DERIVATIVES
Financial Instruments—At June 30, 2007 and 2006, the carrying amounts of cash equivalents, receivables, accounts payable, and other liabilities approximated their fair values because of the short-term maturities of these financial instruments. The carrying amounts of long-term debt at June 30, 2007 and 2006, approximated fair value based on prevailing interest rates.
Derivatives—In the normal course of business, the Company is exposed to interest rate changes and foreign currency fluctuations. The Company strives to limit these risks through the use of derivatives such as interest rate swaps and foreign exchange options. Derivatives are not used for speculative purposes.
In February 2006, the Company entered into a foreign currency exchange option (the “FX Option”) that gives the Company the option to call USD $200,000 at a strike price of 1.1646 EUR/USD at any time up to February 8, 2011. This FX Option is not designated as a hedging instrument. In February 2006, the Company paid approximately $7,912 for the FX Option. As of June 30, 2007 and June 30, 2006, the fair value of the FX Option approximated $970 and $3,980, respectively, and was recorded in other assets in the consolidated balance sheets. The decrease in fair value of approximately $3,010 and $3,932 was recognized in other (income) expense in the consolidated statement of operations, during the fiscal years ended June 30, 2007 and 2006, respectively.
Effective April 27, 2006, the Company entered into two interest rate swaps with maturities on July 13, 2011. These swaps were not designated as hedging instruments. One swap has a notional amount of $195,000 and requires the Company to pay a fixed rate of 5.35%. The second interest rate swap has a notional amount of €368,421 and requires the Company to pay, on a quarterly basis, a fixed rate of 3.72%. The estimated fair value of $1,082 on these interest rate swaps was recorded in other assets in the consolidated balance sheets. The increase in fair value of $1,082 during the fiscal year ended June 30, 2006 was recognized as other income in the consolidated statement of operations. During the fiscal year ended June 30, 2007, the Company recognized an increase in fair value of $6,659 in other income related to these swaps, which were terminated on June 25, 2007 for a total cash settlement of $7,741.
94
Effective on June 29, 2007, the Company entered into three USD-based interest rate swaps with notional amounts of $50,000, $80,965 and $75,000 with maturities on June 30, 2011 which require the Company to pay fixed rates of 5.445%, 5.418% and 5.445%, respectively The Company also entered into three Euro-based interest rate swaps with notional amounts of € 69,821, € 50,000, and € 60,000 with maturities on June 30, 2011 which require the Company to pay fixed rates of 4.603%, 4.679%, and 4.685%, respectively. These interest rate swaps are designated and documented at the inception of the hedge as cash flow hedges and are evaluated for effectiveness quarterly. The effective portion of the gain or loss on these hedges is reported as a component of accumulated other comprehensive income/(loss) in stockholders’ equity and reclassified into earnings when the hedged transaction affects earnings. The ineffective portion on these cash flow hedges is recognized as other (income)/expense. The estimated fair value of $795 on USD-based swaps and €414 ($553) on Euro-based swaps was recorded in other liabilities in the consolidated balance sheet as of June 30, 2007. The change of $1,065 in the fair value of swaps, net of tax, reflects the effective portion of loss on these hedges and is reported as a component of accumulated other comprehensive loss in stockholders’ equity.
The estimated fair values of the Company’s derivatives were determined based on quoted market prices and may not be representative of actual values that could have been realized or that will be realized in the future.
10. LONG-TERM DEBT
Long-term debt at June 30, 2007 and 2006 consists of the following:
| | 2007 | | 2006 | |
Senior secured credit facilities: | | | | | |
First lien credit facility: | | | | | |
Domestic revolver loan, due April 2012 | | $ | — | | $ | 11,000 | |
Domestic term loan, due April 2013 | | — | | 240,000 | |
European term loan, due April 2013 | | — | | 281,127 | |
Amended and restated first lien credit facility: | | | | | |
Domestic term loan, due May 2014 | | 229,425 | | | |
European term loan, due May 2014 | | 375,770 | | | |
European revolver loan, due April 2012 | | 8,073 | | — | |
Second lien credit facility—European term loan, due October 2013 | | — | | 210,845 | |
Subordinated Unsecured Credit Facility—Mezzanine loan, due October 2014 | | — | | 104,867 | |
Total | | 613,268 | | 847,839 | |
Less current portion | | 14,140 | | 16,211 | |
Long-term portion | | $ | 599,128 | | $ | 831,628 | |
Senior Secured Credit Facilities In April 2006, the Company entered into a senior secured credit arrangement (the “Senior Secured Credit Facilities”) under a First and Second Lien Credit and Guaranty Agreement (the “First and Second Lien Credit Facility”) with a syndicate of commercial lenders. The First Lien Credit Facility includes a revolving commitment (the “Revolver Credit Facility”) which permits U.S. Dollar or Euro-based borrowings and issuances of letters of credit of up to $50,000 in the aggregate; a domestic term loan commitment (the “Domestic Term Loan”) of $240,000; and a European term loan commitment (the “European Term Loan”) of €220,000. The Second Lien Credit Facility includes a European term loan commitment (the “European Second Term Loan”) of €165,000.
On May 16, 2007, in connection with its initial public offering, the Company repaid a portion of the balances outstanding under its April 2006 First Lien facilities and all balances outstanding under its Second Lien facilities including a prepayment premium totaling $4,483.
95
The Company also entered into an Amended and Restated Senior Credit Facility Agreement with a syndicate of commercial lenders consisting of a $50,000 Revolving Credit Facility, a $230,000 Domestic Term Loan and a € 280,000 European Term Loan. As of June 30, 2007, the Company had $8,073, $229,425 and $375,770 (€ 279,300) in outstanding loans under the Revolver Credit Facility, Domestic Term Loan and European Term Loan, respectively, with interest rates of 6.375%, 7.360% and 6.164%, respectively. Borrowings under the Amended and Restated Senior Secured Credit Facility bear interest, to be reset at the Company’s option, at a rate determined by the sole lead arranger of the syndicate of commercial lenders equal to (1) the offer rate on dollars based on the British Bankers’ Association Settlement Rate for deposits or (2) the offer rate on the Euro from the Banking Federation of the European Union, or (3) in the event such rates are not available, then the offered quotation rate to first class banks in the London inter-bank market or European inter-bank market by Citibank USA Inc. for deposits, respectively, in each case, plus an applicable margin that varies based upon the Company’s consolidated leverage ratio, as defined in the agreement. Beginning on June 30, 2007, consecutive quarterly principal payments of $575 and €700 are required for the Domestic Term Loan and European Term Loan, respectively, under the Amended and Restated First Lien Credit Facility with the remaining balance due in May 2014. The Amended and Restated Senior Secured Credit Facility allows for voluntary prepayments under specified conditions and requires mandatory prepayments and commitment reductions upon the occurrence of certain events, including among others, sale of assets, receipt of insurance or condemnation proceeds, excess cash flow, and issuances of debt and equity securities.
The obligations under the Amended and Restated Senior Secured Credit Facility are secured by substantially all of the assets of the Company. The Amended and Restated Senior Secured Credit Facility contains certain covenants including, among others, requirements related to financial reporting, maintenance of operations, compliance with applicable laws and regulations, maintenance of interest rate protection and compliance with specified financial covenants, as well as restrictions related to liens, investments, additional indebtedness, dispositions of assets or subsidiary interests, dividends, distributions, issuances of equity securities, transactions with affiliates, capital expenditures, and certain other changes in the business. Financial covenants include the requirement to maintain a minimum interest coverage ratio and limit maximum total leverage, senior leverage ratios, and levels of capital expenditures.
Subordinated Unsecured Credit Facility In April 2006, the Company entered into a subordinated unsecured credit guaranty agreement (the “Subordinated Unsecured Credit Agreement”) with a syndicate of commercial lenders. The Subordinated Unsecured Credit Agreement consists of a European term loan (the “European Mezzanine Loan”) of €80,000.
Borrowings under the Subordinated Unsecured Credit Agreement bear interest, to be reset at the Company’s option, at a rate determined by the sole lead arranger of the syndicate of commercial lenders equal to (1) the offer rate on dollars based on the British Bankers Association Settlement Rate for deposits or (2) the offer rate on the Euro from the Banking Federation of the European Union, or (3) in the event such offer rates are not available, then the offered quotation rate to first class banks in the London inter-bank market or European inter-bank market by Citibank USA Inc. for deposits in each case, plus an applicable margin of 9%, which shall be capitalized, compounded, and added to the unpaid principal amount of the European Mezzanine Loan on the last day of each interest period on no less than a quarterly basis.
The Subordinated Unsecured Credit Agreement allows for voluntary prepayments under specified conditions and requires mandatory repayments upon the sale of assets or receipt of insurance or condemnation proceeds. This agreement also contains certain covenants including, among others, requirements related to financial reporting, maintenance of operations, compliance with applicable laws and regulations and compliance with specified financial covenants, as well as restrictions related to liens, investments, additional indebtedness, dispositions of assets or subsidiary interests, dividends, distributions, issuances of equity securities, transactions with affiliates, capital expenditures, and certain other changes in
96
the business. Financial covenants include the requirement to maintain a minimum interest coverage ratio and limit maximum total leverage, senior leverage ratios, and levels of capital expenditures. On May 16, 2007, balances outstanding under the Subordinated Unsecured Credit Agreements of $124,396 were paid off together with a prepayment premium of $2,486.
With the repayment of the long term debt balances under the First Lien and Second Lien Credit Facility as well as the Subordinated Unsecured Credit Agreement, the Company recognized a loss on extinguishment of debt consisting of $28,691 of remaining deferred financing costs associated with these facilities, along with the prepayment premium of $6,975, in other income and expenses in the consolidated statement of operations. In addition, in connection with the Amended and Restated Senior Credit Facility, the Company incurred approximately $4,393 in financing costs, which were deferred and included as part of other assets in the consolidated balance sheet and are amortized on a straight line method as interest expense over the term of the debt. Amortization of deferred loan costs under the April 2006 facilities and under the new May 2007 facilities for the fiscal year ended June 30, 2007 was approximately $3,895 and $80, respectively.
Future Minimum Principal Payments Future minimum principal payments as of June 30, 2007 are as follows:
| | 2007 | |
2008 | | $ | 14,140 | |
2009 | | 6,067 | |
2010 | | 6,067 | |
2011 | | 6,067 | |
2012 | | 6,067 | |
Thereafter | | 574,860 | |
Total | | $ | 613,268 | |
11. EMPLOYEE BENEFIT PLANS
Stock-Based Compensation—Effective July 1, 2006, the Company adopted SFAS No. 123 (revised 2004), Share-Based Payment (“SFAS 123(R)”) which requires the measurement and recognition of compensation expense for all stock-based payment awards made to employees and directors, including employee stock options and share awards, based on estimated fair values recognized over the requisite service period.
The Company adopted SFAS 123(R) using the prospective transition method. Under this method, SFAS 123(R) is applied to new awards and to awards modified, repurchased or cancelled after the adoption date of July 1, 2006. Compensation cost that was previously recorded under APB Opinion No. 25 for awards outstanding at the adoption date, such as unvested options, will continue to be recognized as the options vest. Accordingly, for the year ended June 30, 2007, stock/unit-based compensation expense includes compensation cost related to estimated fair values of awards granted after the date of adoption of SFAS 123(R) and compensation costs related to unvested awards at the date of adoption based on the intrinsic values as previously recorded under APB Opinion No. 25.
The fair value of stock and options awards granted after July 1, 2006 is estimated on the grant date using the Black-Scholes option valuation model. This valuation model for stock-based compensation expense requires the Company to make assumptions and judgments about the variables used in the calculation including the expected term (weighted average period of time that the shares and options granted are expected to be outstanding), the volatility of the Company’s common shares, an assumed risk free interest rate and the estimated forfeitures of unvested share awards. No compensation cost is recorded for awards that do not vest. For awards granted after July 1, 2006, and valued in accordance with
97
SFAS 123(R), the Company used the straight-line method for expense attribution. Since the Company’s common shares have not been actively traded in the past, the Company uses the simplified calculation of expected life described in the Securities and Exchange Commission Staff Accounting Bulletin No. 107 (“SAB 107”) and volatility is based on an average of the historical volatilities of the common stock of several entities with characteristics similar to those of the Company. The risk-free rate is based on the U.S. Treasury yield curve in effect at the time of grant for periods corresponding with the expected life of the option. SFAS 123(R) requires the Company to estimate forfeitures at the time of grant and revise those estimates in subsequent periods if actual forfeitures differ form those estimates. The Company used historical employee termination rates to estimate pre-vesting option forfeitures.
Summary of Plans
2007 Long-term Equity Incentive Plan
The equity incentive plan provides for the issuance of stock options, restricted stock, deferred stock, dividend equivalents, other stock-based awards and performance awards. Performance awards may be based on the achievement of certain business or personal criteria or goals, as determined by the compensation committee. An aggregate of 4,300,000 shares of the Company’s common stock was initially reserved for issuance under the equity incentive plan, subject to certain adjustments reflecting changes in the Company’s capitalization. If any grant under the equity incentive plan expires or terminates unexercised, becomes unexercisable or is forfeited as to any shares or is tendered or withheld as to any shares in payment of the exercise price of the grant or the taxes payable with respect to the exercise, then such unpurchased, forfeited, tendered or withheld shares will thereafter be available for further grants under the equity incentive plan.
2007 Employee Stock Purchase Plan
In connection with the Company’s initial public offering, the Company adopted the 2007 Employee Stock Purchase Plan. The purpose of the plan is to provide an incentive for employees (and employees of subsidiaries designated by the board of directors) to purchase common stock and acquire an equity interest in the Company. The compensation committee administers the plan, under which the Company has reserved for issuance 1,500,000 shares of common stock. The Company has not issued any shares of common stock in connection with this plan.
2006 Securities Purchase Plan
In November 2006, the board of managers adopted the 2006 Securities Purchase Plan. In January and February, pursuant to securities purchase agreements, 24 employees purchased common equity interests in the Company that were converted into approximately 740,000 shares of common stock. Pursuant to such agreements, the shares of stock held by these employees remains subject to vesting over a five-year period, and unvested shares remain, under certain circumstances, subject to repurchase by the Company or, to the extent the Company does not repurchase, by affiliates of GTCR Golder Rauner II, L.L.C. (“GTCR”), a private equity investor in the Company. No additional equity will be issued under this plan.
Restricted Stock—The Company has a restricted stock program under which shares of common stock have been issued to certain employees. These shares are restricted as to transfer and in certain circumstances must be returned to the Company at the original purchase price. The Company records stock compensation expense relating to the issuance of restricted stock over the period in which the transfer restrictions exist, which is up to five years from the date of grant. The value of the Company’s restricted stock, based on market prices, is recognized as compensation expense over the restriction period on a straight-line basis.
98
During the year ended June 30, 2006, the Company granted fully vested and nonvested restricted common units to certain employees and directors and recorded $1,807 in deferred unit-based compensation and related amortization expense of $285 related to the fully vested units and $76 related to the unvested units. The stock-based compensation expense related to restricted stock/units included in the net loss was $1,893 and $361 for years ending June 30, 2007 and 2006, respectively.
For the twelve months ended June 30, 2007, the Company granted the right to purchase restricted common stock/units as follows.
| | Number of
restricted
common
stock / units | | Purchase price
per common
stock / unit | | Fair value
per common
stock / unit | | Total
compensation
expense to be
recognized
over vesting
period | |
Granted on July 25, 2006 | | | 1,097,846 | | | | $ | 0.30 | | | | $ | 2.94 | | | | $ | 2,898 | | |
Granted on November 8, 2006 | | | 34,165 | | | | $ | 0.30 | | | | $ | 12.36 | | | | $ | 412 | | |
Granted on January 26, 2007 | | | 50,000 | | | | $ | 0.30 | | | | $ | 15.30 | | | | $ | 750 | | |
Granted on May 11, 2007 | | | 304,730 | | | | $ | 0.01 | | | | $ | 16.00 | | | | $ | 4,873 | | |
Cancellations | | | (506,582 | ) | | | $ | 0.30 | | | | $ | 2.99 | | | | $ | (1,361 | ) | |
| | | 980,159 | | | | | | | | | | | | $ | 7,572 | | |
The fair value of these rights to purchase restricted common stock/units will be recognized as an expense ratably over vesting periods of up to 60 months. Due to the significant difference between the purchase price and fair value per common share/unit, the fair value of the right to purchase these restricted shares/units and intrinsic value of the restricted shares/units were equal. During the twelve months ended June 30, 2007, the Company recorded $1,893 as an expense related to these rights, with an estimated tax benefit of $687. The remaining portion of the expense is expected to be recognized over the weighted average vesting period of 4.5 years.
Stock Options—Stock options are granted to employees at exercise prices equal to the fair market value of the Company’s common stock on the dates of grant. Stock options are issued under a graded vesting schedule, generally, vest ratably over four years and have a term of 10 years. Compensation expense for stock options is recognized over the requisite service period for each separately vesting portion of the stock option award.
On May 11, 2007, the Company granted 428,400 options to its employees to purchase common stock at a $16.00 grant price per share and a fair value of $6.63 per share. As of June 30, 2007, 4,800 of these options were canceled and none were vested. The aggregate fair value of stock options outstanding at June 30, 2007 was $2,808. The stock-based compensation expense related to stock options included in the net loss was $68 for fiscal 2007, and the estimated total remaining compensation of $2,375, net of forfeitures, is expected to be recognized over the remaining vesting period of 4 years.
Summarized information about stock options outstanding at June 30, 2007 is as follows:
| | Outstanding | | Exercisable | |
Exercise Price | | Number of Options | | Remaining Life
(in years) | | Weighted
Average Price
(in dollars) | | Number of
Options | | Weighted
Average Price
(in dollars) | |
$16.00 | | | 423,600 | | | | 9.9 | | | | $ | 16.00 | | | | 0 | | | | $ | 16.00 | | |
| | | | | | | | | | | | | | | | | | | | | | | |
The fair value for stock-based awards was estimated at the date of grant with the following assumptions: a risk-free interest rate of 4.5%; a dividend yield 0.0%; a weighted average volatility factor of 32.8%; a weighted average expected life of 6.1 years; and an exercise price of $16.00 per share.
99
Pension Plans The Company’s foreign subsidiaries sponsor various defined benefit plans and individual defined benefit arrangements covering certain eligible employees. The benefits under these pension plans are based on years of service and compensation levels. Funding is limited to statutory requirements. In September 2006, the FASB issued SFAS No. 158, “Employers’ Accounting for Defined Benefit Pension and Other Postretirement Plans—an amendment of FASB Statements No. 87, 88, 106 and 132(R)” (“SFAS No. 158”). This statement requires a company to (a) recognize in its statement of financial position an asset for a plan’s overfunded status or a liability for a plan’s underfunded status, (b)��measure a plan’s assets and its obligations that determine its funded status as of the end of the employer’s fiscal year, and (c) recognize changes in the funded status of a defined benefit plan in the year in which the changes occur (reported in comprehensive income). The requirement to recognize the funded status of a benefit plan and the related disclosure requirements were effective for the Company as of the end of fiscal 2007 and the Company adopted the statement at that time. The adoption of SFAS No. 158 resulted in a $492 reduction in stockholders’ equity, net of income taxes. The measurement date for all plans is June 30, 2007, and as such no additional impact is expected.
The change in benefit obligations and plan assets as well as the funded status of the Company’s foreign pension plans for the fiscal year ended June 30, 2007 were as follows:
| | June 30, 2007 | | June 30, 2006 | |
Change in plan assets: | | | | | | | | | |
Fair value of plan assets—beginning of year | | | $ | 27,700 | | | | $ | — | | |
Net transfer, including effect of business combination | | | 22,300 | | | | 25,800 | | |
Actual return on plan assets | | | 1,300 | | | | 200 | | |
Employer contributions | | | 4,100 | | | | 400 | | |
Participant contributions | | | 900 | | | | — | | |
Benefits and expenses paid | | | (4,700 | ) | | | (100 | ) | |
Foreign currency exchange rate changes | | | 1,400 | | | | 1,400 | | |
Fair value of plan assets—end of year | | | 53,000 | | | | $ | 27,700 | | |
Change in benefit obligation: | | | | | | | | | |
Benefit obligation—beginning of year | | | $ | 32,800 | | | | $ | — | | |
Net transfer, including effect of business combination | | | 26,300 | | | | 31,400 | | |
Service cost | | | 3,400 | | | | 200 | | |
Interest cost | | | 2,700 | | | | 400 | | |
Participant contributions | | | 900 | | | | — | | |
Actuarial (gain) loss | | | 300 | | | | (800 | ) | |
Benefits and expenses paid | | | (4,700 | ) | | | (100 | ) | |
Foreign currency exchange rate changes | | | 1,600 | | | | 1,700 | | |
Projected benefit obligation—end of year | | | $ | 63,300 | | | | $ | 32,800 | | |
Funded status—plan assets less benefit obligation | | | $ | (10,300 | ) | | | $ | (5,100 | ) | |
Unrecognized net actuarial (gain) loss due to experience different than assumed | | | — | | | | (700 | ) | |
Accrued pension liability | | | $ | (10,300 | ) | | | $ | (5,800 | ) | |
Net transfers of plan assets and benefit obligations are the result of the Company’s acquisition of CSG on April 13, 2006. During the fiscal year ended June 30, 2007, retirement plans that were included in the Company’s purchase of CSG, and were previously accounted for as defined contribution plans, were determined to be defined benefit plans under SFAS 87. During the fiscal year ended June 30, 2007, the funded status of these acquired plans was recorded as an adjustment to the purchase price allocation.
100
The impact of the adoption of SFAS No. 158, comprising actuarial gains and losses, resulted in a reduction to stockholders’ equity of $492 and consists of an increase (decrease) to the following accounts in the consolidated balance sheet:
Other liabilities (non-current) | | 559 | |
Long term deferred income tax liabilities | | (67 | ) |
Impact to stockholders’ equity | | $ | (492 | ) |
| | | | |
After the adoption of SFAS No. 158, all net accrued pension liabilities are recognized in the balance sheet as of June 30, 2007 in other liabilities (long-term).
The accumulated benefit obligation for all defined benefit pension plans was $56,300 and $29,800 at June 30, 2007 and 2006, respectively.
The projected benefit obligation, accumulated benefit obligation and fair value of plan assets for the Company’s pension plans with accumulated benefit obligations in excess of plan assets were $63,300, $56,300 and $53,000, respectively, as of June 30, 2007.
The components of net pension expense were as follows:
| | Fiscal Year
Ended
June 30, 2007 | | Fiscal Year
Ended
June 30, 2006 | |
Service cost—benefits earned during the period | | | $ | 3,400 | | | | $ | 200 | | |
Interest cost on projected benefits | | | 2,700 | | | | 400 | | |
Expected return on plan assets | | | (2,400 | ) | | | (300 | ) | |
| | | $ | 3,700 | | | | $ | 300 | | |
General assumptions used to determine the actuarial present value of benefit obligations for the fiscal year ended June 30, 2007 and 2006 were:
| | June 30, 2007 | | June 30, 2006 | |
Discount rate | | | 4.21 | % | | | 4.75 | % | |
Increase in compensation levels | | | 1.89 | | | | 1.95 | | |
General assumptions used to determine the net pension expense for the fiscal years ended June 30, 2007 and 2006 were:
| | June 30, 2007 | | June 30, 2006 | |
Discount rate | | | 4.09 | % | | | 4.60 | % | |
Expected long-term rate of return on assets | | | 4.24 | | | | 4.60 | | |
Increase in compensation levels | | | 1.99 | | | | 1.95 | | |
The discount rate is based upon published rates for high-quality fixed-income investments that produce cash flows that approximate the timing and amount of expected future benefit payments.
The weighted-average long-term expected rate of return on assets assumption is 4.24%. This percentage has been determined based on historical and expected future rates of return on plan assets considering the target asset mix and the long-term investment strategy.
Plan Assets The plan assets of the pension plans are the liability of insurance companies and benefit payments are fully insured. The insurance companies invest the plan assets in accordance with the terms of the insurance companies’ guidelines and the Company has no control over the investment decisions made
101
by the insurance companies. The insurance companies invest virtually the entire pension plan portfolio in fixed income securities.
Contributions The contribution for the year ended June 30, 2007 was $4,100. The minimum required contribution and expected contribution to the Company’s pension plans are $3,800 for the year ending June 30, 2008.
Estimated Future Benefit Payments The benefits expected to be paid for fiscal 2008 and the fiscal years ending June 30, 2009 through June 30, 2012, are $3,400, $1,000, $2,800, $1,300 and $1,400, respectively. The aggregate benefits expected to be paid in the five years ending June 30 from 2013 to 2017 are $11,400. The expected benefits to be paid are based on the same assumptions used to measure the Company’s pension plans’ benefit obligation at June 30, 2007, and include estimated future employee service.
Retirement and Savings Plan The Company has defined contribution plans that cover most of its domestic employees. This 401(k) plan provides company matching under various formulas. The costs for the domestic associates plans for the fiscal years ended June 30, 2007 and 2006, and the period from March 24, 2005 (inception) through June 30, 2005 were $1,096, $300, and $0, respectively.
The Company’s foreign subsidiaries have defined contribution plans that cover certain international employees. These retirement savings-type plans provide company matching under various formulas. The Company’s match amounted to approximately $3,000, $700, and $0 for the fiscal years ended June 30, 2007 and 2006 and the period from March 24, 2005 (inception) through June 30, 2005, respectively.
12. RELATED-PARTY TRANSACTIONS
In connection with the Unit Purchase Agreement between the Company and GTCR, the Company entered into a professional services agreement (the “Professional Services Agreement”) with GTCR as of April 1, 2005. This agreement provides for GTCR to provide certain professional services in exchange for annual management fees of $250 commencing when Solera, Inc. has consolidated EBITDA of at least $3,000. Pursuant to the Professional Services Agreement, the Company incurred management fees of approximately $208 and $53 for the fiscal years ended June 30, 2007 and June 30, 2006, respectively, and none for the period from March 24, 2005 (inception) to June 30, 2005. The Professional Services Agreement also provides for GTCR to receive a placement fee of one percent of the gross amount financed pursuant to certain issuances of equity and debt. The Company incurred placement fees of $405 for the period from March 24, 2005 (inception) through June 30, 2005. This amount has been recorded as an equity issuance cost. In connection with the raising of equity and debt financing, the Company incurred placement fees during the fiscal year ended June 30, 2006 of $10,900, of which $2,180 was recorded as an equity issuance cost and $8,720 was included in debt issuance costs.
Certain minority stockholders of the Company’s international subsidiaries are also commercial purchasers and users of the Company’s software and services. Revenue transactions with all of the individual minority stockholders in the aggregate represent less than 5% of the Company’s consolidated revenue.
In February 2006, the Company entered into an advisory services and success agreement (the “Advisory Services Agreement”) with a member of its board of managers. Pursuant to this agreement, in exchange for advisory services rendered, the Company agreed to pay the board member, upon consummation of the Acquisition, the lesser of $4,500 or a specified dollar formula calculated as a percentage of the Acquisition purchase price. Based on the final purchase price of approximately $1.0 billion, the Company paid the board member approximately $3,800 for services rendered in conjunction with the Acquisition during the fiscal year ended June 30, 2006. This amount is recorded as a cost of the Acquisition.
102
13. INCOME TAXES
The components of loss before income taxes attributable to domestic and foreign operations are as follows:
| | Fiscal Year Ended
June 30, 2007 | | Fiscal Year Ended
June 30, 2006 | |
Loss before income taxes and minority interest: | | | | | | | | | |
Domestic | | | $ | (48,759 | ) | | | $ | (16,418 | ) | |
Foreign | | | (28,870 | ) | | | (2,816 | ) | |
| | | $ | (77,629 | ) | | | $ | (19,234 | ) | |
The federal, state and foreign tax provision/(benefit) for the fiscal years ended June 30, 2007 and 2006 are summarized as follows:
| | Fiscal Year Ended
June 30, 2007 | | Fiscal Year Ended
June 30, 2006 | |
Current: | | | | | | | | | |
Federal | | | $ | (464 | ) | | | $ | — | | |
Foreign | | | 21,907 | | | | 4,573 | | |
State | | | (372 | ) | | | 6 | | |
Total current | | | 21,071 | | | | 4,579 | | |
Deferred: | | | | | | | | | |
Federal | | | (13,417 | ) | | | (4,057 | ) | |
Foreign | | | (8,295 | ) | | | (965 | ) | |
State | | | (132 | ) | | | (825 | ) | |
Total deferred | | | (21,844 | ) | | | (5,847 | ) | |
Total income tax benefit | | | $ | (773 | ) | | | $ | (1,268 | ) | |
A reconciliation between the Company’s effective tax rate on income from operations and the U.S. federal statutory rate is as follows:
| | Fiscal Year ended
June 30, 2007 | | Fiscal Year Ended
June 30, 2006 | |
| | Amount | | Percent | | Amount | | Percent | |
Income tax benefit at U.S. statutory rate | | $ | (27,170 | ) | | (35.0 | )% | | $ | (6,732 | ) | | (35.0 | )% | |
(Increase) decrease in benefit from: | | | | | | | | | | | | | |
State taxes—net of federal tax benefit | | (373 | ) | | (0.5 | ) | | (533 | ) | | (2.8 | )% | |
Foreign rate lower than U.S. federal statutory rate | | 1,257 | | | 1.6 | % | | 1,301 | | | 6.8 | % | |
Impact on deferred taxes due to reduction in foreign income tax rate | | (2,743 | ) | | (3.5 | )% | | 62 | | | 0.3 | % | |
Change in valuation allowance | | 18,486 | | | 23.8 | % | | 3,069 | | | 16.0 | % | |
LLC income not subject to entity level income tax | | 922 | | | 1.2 | % | | 1,395 | | | 7.3 | % | |
Non-deductible interest | | 5,728 | | | 7.4 | % | | — | | | — | | |
Withholding taxes | | 1,864 | | | 2.4 | % | | — | | | — | | |
Other | | 1,256 | | | 1.6 | % | | 170 | | | 0.8 | % | |
Total | | $ | (773 | ) | | (1.0 | )% | | $ | (1,268 | ) | | (6.6 | )% | |
103
The significant components of deferred income tax assets and liabilities and their balance sheet classifications as of June 30, 2006 and 2007 are as follows:
| | June 30, 2007 | | June 30, 2006 | |
Deferred tax assets: | | | | | | | | | |
Accrued expenses not currently deductible | | | $ | 3,234 | | | | $ | 7,118 | | |
Depreciation and amortization | | | 2,377 | | | | 1,147 | | |
Net operating losses | | | 28,966 | | | | 6,169 | | |
Intangibles | | | 6,170 | | | | — | | |
Other | | | 4,567 | | | | 1,563 | | |
| | | 45,314 | | | | 15,997 | | |
Less valuation allowances | | | (18,231 | ) | | | (4,717 | ) | |
Deferred tax assets—net | | | 27,083 | | | | 11,280 | | |
Deferred tax liabilities: | | | | | | | | | |
Amortization | | | 1,885 | | | | 811 | | |
Intangibles | | | 40,202 | | | | 52,534 | | |
Other | | | 1,911 | | | | 1,444 | | |
Deferred tax liabilities | | | 43,998 | | | | 54,789 | | |
Net deferred tax liabilities | | | $ | (16,915 | ) | | | $ | (43,509 | ) | |
The Company has net operating loss carry-forwards of approximately $100,667 at June 30, 2007. The net operating loss carry-forwards will expire at various times beginning in 2010, if not utilized, and of which, $604 has an indefinite utilization period.
Utilization of the Company’s net operating loss may be subject to substantial annual limitation due to the ownership change limitations provided by the Internal Revenue Code and similar state provisions. Such an annual limitation could result in the expiration of the net operating loss carry-forwards before utilization.
The Company has recorded valuation allowances for deferred tax assets attributed to net operating loss carryforwards of $4,717, and $18,231 at June 30, 2006 and 2007, respectively. Approximately $1,082 of the valuation allowance pertains to net operating losses of certain Claims Services Group entities generated prior to the Acquisition and as such, will be credited to goodwill when realized.
Income tax payments were approximately $2,035 and $22,464 for the fiscal years ended June 30, 2006 and 2007, respectively, for payments made directly by the Company.
The undistributed earnings of the Company’s foreign subsidiaries as of June 30, 2007 are considered to be indefinitely reinvested and, accordingly, no U.S. income taxes have been provided thereon. Upon distribution of those earnings in the form of dividends or otherwise, the Company would be subject to both U.S. income taxes (subject to an adjustment for foreign tax credits) and withholding taxes payable to various foreign countries.
The Company expects to be periodically examined by the Internal Revenue Service (the “IRS”) and examined by tax authorities in countries in which it conducts business, as well as states in which it has significant business operations. The tax years under examination will vary by jurisdiction. The Company regularly considers the likelihood of assessments in each of the jurisdictions resulting from examinations. The Company has established tax reserves which it believes are adequate in relation to the potential assessments. Once established, reserves are adjusted when there is more information available, when an event occurs necessitating a change to the reserves or the statute of limitations for the relevant taxing authority to examine the tax position has expired. The resolution of tax matters should not have a material
104
effect on the consolidated financial condition of the Company, the Company’s consolidated statements of operations for a particular future period or on the Company’s effective tax rate.
14. CONTRACTUAL COMMITMENTS, CONTINGENCIES, AND OFF-BALANCE-SHEET ARRANGEMENTS
The Company has obligations under various facilities and equipment leases and software license agreements. Total expense under these agreements was approximately $17,031, $2,664 and $28 for the fiscal years ended June 30, 2007 and 2006 and the period from March 24, 2005 (inception) through June 30, 2005, respectively, with minimum commitments at June 30, 2007, as follows:
2008 | | $ | 23,445 | |
2009 | | 15,787 | |
2010 | | 11,307 | |
2011 | | 8,854 | |
2012 | | 6,427 | |
Thereafter | | 8,804 | |
Total | | $ | 74,624 | |
In addition to fixed rentals, certain leases require payment of maintenance and real estate taxes and contain escalation provisions based on future adjustments in price indices.
In Ellis and Weaver v. Allstate Insurance Company, et. al., a putative class action, the plaintiff alleged that the Company’s medical bill review product and its total loss valuation product generate biased results in favor of the Company’s insurance customers. The portion of the complaint relating to medical bill review was settled in 2004 with no monetary consideration being exchanged, but the claim relating to the Company’s total loss valuation product remains outstanding. Although the Company is unable to make an estimate of the range of loss which might be possible from this proceeding, the Company nevertheless believes that any ultimate liability arising out of this proceeding will not have a material adverse effect on its consolidated financial statements. The Company is subject to other various claims and litigation in the normal course of business. The Company does not believe that the resolution of these matters will have a material impact on the consolidated financial statements.
In the normal course of business, the Company enters into contracts in which it makes representations and warranties that guarantee the performance of the Company’s products and services. Losses related to such guarantees are not significant.
105
15. SEGMENT AND GEOGRAPHIC INFORMATION
The Company manages its business operations through two strategic business units. Based upon the information reported to the chief operating decision maker, who is the Chief Executive Officer, the Company has the following reportable segments: EMEA and Americas. The EMEA business unit encompasses the Company’s operations in Europe, the Middle East, Africa and Asia. The Americas business unit encompasses the Company’s operations in North America, and Central and South America. Prior to December 1, 2006, the Company was organized into three reportable segments: EMEA, Americas and Netherlands. In connection with the initial filing of the Company’s consolidated financial statements as part of a Registration Statement on Form S-1, the Company has presented the disclosures as required by SFAS No. 131, Disclosures about Segments of an Enterprise and Related Information, for all periods presented to conform to the segment structure in place beginning as of December 1, 2006. The Company does not allocate certain costs to its reportable segments. These costs are managed at the corporate level and include costs related to financing activities of the Company. The Company evaluates the performance of its reportable segments based on operating results before income taxes:
| | EMEA | | Americas | | Corporate | | Total | |
Period From March 24, 2005 (Inception) Through June 30, 2005 | | | | | | | | | |
Revenues | | $ | — | | $ | 155 | | $ | — | | $ | 155 | |
Loss before income taxes and minority interest | | — | | (740 | ) | — | | (740 | ) |
Assets | | — | | 4,865 | | — | | 4,865 | |
Capital expenditures | | — | | 412 | | — | | 412 | |
Depreciation and amortization | | — | | 16 | | — | | 16 | |
Interest expense | | — | | — | | — | | — | |
Other (income) expense—net | | — | | 22 | | — | | 22 | |
Fiscal Year Ended June 30, 2006 | | | | | | | | | |
Revenues | | 54,933 | | 40,151 | | — | | 95,084 | |
Earnings (loss) before income taxes and minority interest | | 6,171 | | (4,067 | ) | (21,338 | ) | (19,234 | ) |
Assets | | 893,334 | | 315,340 | | 44,331 | | 1,253,005 | |
Capital expenditures | | 1,830 | | 2,282 | | — | | 4,112 | |
Depreciation and amortization | | 13,202 | | 10,369 | | — | | 23,571 | |
Interest expense | | 1 | | 9 | | 14,832 | | 14,842 | |
Other (income) expense—net | | (485 | ) | (182 | ) | 2,503 | | 1,836 | |
Fiscal Year Ended June 30, 2007 | | | | | | | | | |
Revenues | | 280,112 | | 191,848 | | — | | 471,960 | |
Earnings (loss) before income taxes and minority interest | | 39,270 | | 499 | | (117,398 | ) | (77,629 | ) |
Assets | | 883,911 | | 327,865 | | 12,177 | | 1,223,953 | |
Capital expenditures | | 7,220 | | 20,010 | | — | | 27,230 | |
Depreciation and amortization | | 58,606 | | 45,813 | | — | | 104,419 | |
Interest expense | | 47 | | 218 | | 69,416 | | 69,681 | |
Other (income) expense—net | | (3,568 | ) | (306 | ) | 35,383 | | 31,509 | |
| | | | | | | | | | | | | |
106
The Company conducts its sales, marketing and customer service activities throughout the world. Geographic revenue information is based on the location of the customer. No single country outside the United States, the Netherlands, the United Kingdom and Germany accounted for 10% or more of total external revenue or of long-lived assets.
| | Europe* | | United
States | | The
Netherlands | | United
Kingdom | | Germany | | All
Other | | Total | |
Period Ended June 30, 2005 | | | | | | | | | | | | | | | | | | | | | |
Revenues | | $ | — | | $ | 155 | | | $ | — | | | | $ | — | | | | $ | — | | | $ | — | | $ | 155 | |
Property and equipment—net | | — | | 397 | | | — | | | | — | | | | — | | | — | | 397 | |
Fiscal Year Ended June 30, 2006 | | | | | | | | | | | | | | | | | | | | | |
Revenues | | $ | 23,924 | | $ | 31,018 | | | $ | 11,301 | | | | $ | 8,760 | | | | $ | 9,438 | | | $ | 10,643 | | $ | 95,084 | |
Property and equipment—net | | 10,754 | | 12,901 | | | 487 | | | | 3,949 | | | | 8,088 | | | 2,106 | | 38,285 | |
Fiscal Year Ended June 30, 2007 | | | | | | | | | | | | | | | | | | | | | |
Revenues | | $ | 118,955 | | $ | 146,392 | | | $ | 56,898 | | | | $ | 50,814 | | | | $ | 46,220 | | | $ | 52,681 | | $ | 471,960 | |
Property and equipment—net | | 6,003 | | 26,214 | | | 311 | | | | 8,149 | | | | 8,269 | | | 2,539 | | 51,485 | |
* Excludes the Netherlands, the United Kingdom and Germany.
107
16. QUARTERLY FINANCIAL RESULTS (UNAUDITED)
Summarized quarterly results of the Company’s continuing operations for the two fiscal years ended June 30, 2007 and 2006 are as follows:
Year Ended June 30, 2007 | | | | First
Quarter | | Second
Quarter | | Third
Quarter | | Fourth
Quarter | |
Revenues | | $ | 111,482 | | $ | 116,237 | | $ | 121,701 | | $ | 122,540 | |
Allocated cost of revenues | | 70,199 | | 72,059 | | 72,832 | | 74,472 | |
Gross profit | | 41,283 | | 44,178 | | 48,869 | | 48,068 | |
Net loss | | (17,890 | ) | (11,978 | ) | (9,751 | ) | (41,287 | ) |
Dividends and redeemable preferred unit accretion | | 4,191 | | 4,276 | | 4,267 | | 1,880 | |
Net loss allocable to common stockholders/unitholders | | $ | (22,081 | ) | $ | (16,254 | ) | $ | (14,018 | ) | $ | (43,167 | ) |
Net loss allocable to common stockholders/unitholders per share/unit: | | | | | | | | | |
Basic and Diluted | | $ | (0.76 | ) | $ | (0.56 | ) | $ | (0.48 | ) | $ | (0.90 | ) |
Year Ended June 30, 2006 | | | | First
Quarter | | Second
Quarter | | Third
Quarter | | Fourth
Quarter | |
Revenues | | $ | 288 | | $ | 346 | | $ | 343 | | $ | 94,107 | |
Allocated cost of revenues | | 550 | | 449 | | 495 | | 63,021 | |
Gross profit/(loss) | | (262 | ) | (103 | ) | (152 | ) | 31,086 | |
Net loss | | (721 | ) | (799 | ) | (824 | ) | (16,543 | ) |
Dividends and redeemable preferred unit accretion | | 21 | | 21 | | 21 | | 88,725 | |
Net loss allocable to common stockholders/unitholders | | $ | (742 | ) | $ | (820 | ) | $ | (846 | ) | $ | (105,268 | ) |
Net loss allocable to common stockholders/unitholders per share/unit: | | | | | | | | | |
Basic and Diluted | | $ | (0.05 | ) | $ | (0.06 | ) | $ | (0.06 | ) | $ | (3.90 | ) |
108
INDEPENDENT AUDITORS’ REPORT
To the Board of Managers of
Solera Holdings, LLC
San Ramon, California
We have audited the accompanying combined balance sheets of Claims Services Group (entities commonly controlled by Automatic Data Processing, Inc.) (the “Company”) as of June 30, 2004 and 2005, and the related combined statements of earnings, group equity, and cash flows for the years ended June 30, 2004 and 2005 and for the period from July 1, 2005 through April 13, 2006. These financial statements are the responsibility of the Company’s management. Our responsibility is to express an opinion on these financial statements based on our audits.
We conducted our audits in accordance with auditing standards generally accepted in the United States of America. Those standards require that we plan and perform the audit to obtain reasonable assurance about whether the financial statements are free of material misstatement. An audit includes consideration of internal control over financial reporting as a basis for designing audit procedures that are appropriate in the circumstances, but not for the purpose of expressing an opinion on the effectiveness of the Company’s internal control over financial reporting. Accordingly, we express no such opinion. An audit also includes examining, on a test basis, evidence supporting the amounts and disclosures in the financial statements, assessing the accounting principles used and significant estimates made by management, as well as evaluating the overall financial statement presentation. We believe that our audits provide a reasonable basis for our opinion.
In our opinion, such combined financial statements present fairly, in all material respects, the financial position of the Claims Services Group as of June 30, 2004 and 2005, and the results of its operations and its cash flows for the years ended June 30, 2004 and 2005 and for the period from July 1, 2005 through April 13, 2006, in conformity with accounting principles generally accepted in the United States of America.
/s/ DELOITTE & TOUCHE LLP
San Jose, California
February 12, 2007
109
CLAIMS SERVICES GROUP
COMBINED BALANCE SHEETS
AS OF JUNE 30, 2004 AND 2005
(In thousands)
| | 2004 | | 2005 | |
ASSETS | | | | | |
CURRENT ASSETS: | | | | | |
Cash and cash equivalents | | $ | 107,824 | | $ | 121,313 | |
Cash in escrow | | 6,056 | | 1,853 | |
Accounts receivable—net | | 58,511 | | 69,114 | |
Other current assets | | 12,424 | | 12,229 | |
Deferred income taxes | | 8,126 | | 7,738 | |
Notes receivable from affiliated parties | | — | | 2,825 | |
Assets of discontinued operations | | 2,848 | | 199 | |
Total current assets | | 195,789 | | 215,271 | |
PROPERTY AND EQUIPMENT—Net | | 37,641 | | 33,456 | |
OTHER ASSETS | | 1,836 | | 352 | |
NOTES RECEIVABLE FROM AFFILIATED PARTIES | | 2,875 | | 14,166 | |
DEFERRED INCOME TAXES | | 547 | | 561 | |
GOODWILL | | 149,152 | | 156,009 | |
INTANGIBLE ASSETS—Net | | 168,929 | | 188,250 | |
TOTAL | | $ | 556,769 | | $ | 608,065 | |
LIABILITIES AND GROUP EQUITY | | | | | |
CURRENT LIABILITIES: | | | | | |
Accounts payable | | $ | 15,877 | | $ | 23,513 | |
Accrued expenses and other current liabilities | | 78,966 | | 83,861 | |
Income taxes payable | | 13,504 | | 21,736 | |
Deferred income taxes | | 4,438 | | 3,935 | |
Notes payable to affiliated parties | | 799 | | 14,080 | |
Liabilities of discontinued operations | | 4,841 | | 195 | |
Total current liabilities | | 118,425 | | 147,320 | |
OTHER LIABILITIES | | 1,556 | | 1,590 | |
DEFERRED INCOME TAXES | | 50,621 | | 47,138 | |
DEFERRED REVENUES | | 1,220 | | 2,839 | |
NOTES PAYABLE TO AFFILIATED PARTIES | | 4,285 | | 3,231 | |
Total liabilities | | 176,107 | | 202,118 | |
MINORITY INTERESTS IN CONSOLIDATED SUBSIDIARIES | | 4,276 | | 6,665 | |
GROUP EQUITY | | 376,386 | | 399,282 | |
TOTAL | | $ | 556,769 | | $ | 608,065 | |
See notes to combined financial statements.
110
CLAIMS SERVICES GROUP
STATEMENTS OF COMBINED EARNINGS
YEARS ENDED JUNE 30, 2004 AND 2005 AND
PERIOD FROM JULY 1, 2005 THROUGH APRIL 13, 2006
(In thousands)
| | Years Ended June 30 | | Period from
July 1, 2005
through | |
| | 2004 | | 2005 | | April 13, 2006 | |
Revenues | | $ | 361,179 | | $ | 412,355 | | | $ | 335,146 | | |
Operating expenses | | 107,590 | | 117,361 | | | 101,995 | | |
Selling, general and administrative expenses | | 94,757 | | 112,480 | | | 87,033 | | |
Systems development and programming costs | | 57,465 | | 62,690 | | | 52,306 | | |
Depreciation and amortization | | 28,754 | | 34,335 | | | 28,894 | | |
Restructuring charges (benefit) | | 1,740 | | 5,512 | | | (468 | ) | |
Impairment charges | | 4,214 | | — | | | — | | |
Interest expense | | 271 | | 334 | | | 318 | | |
Other (income) expense—net | | (1,323 | ) | (4,065 | ) | | (3,069 | ) | |
Total operating expenses | | 293,468 | | 328,647 | | | 267,009 | | |
Earnings from continuing operations before provision for income taxes, minority interests, and loss (income) from discontinued operations, net of benefit from income taxes | | 67,711 | | 83,708 | | | 68,137 | | |
Provision for income taxes | | 22,124 | | 24,030 | | | 23,688 | | |
Minority interests in net income of combined subsidiaries | | 1,229 | | 1,909 | | | 3,468 | | |
Earnings from continuing operations before loss (income) from discontinued operations, net of benefit from income taxes | | 44,358 | | 57,769 | | | 40,981 | | |
Loss (income) from discontinued operations, net of benefit from income taxes of $4,828 and $82 for the years ended June 30, 2004 and 2005, respectively | | (3,816 | ) | 128 | | | — | | |
Net earnings | | $ | 48,174 | | $ | 57,641 | | | $ | 40,981 | | |
See notes to combined financial statements
111
CLAIMS SERVICES GROUP
STATEMENTS OF COMBINED GROUP EQUITY
YEARS ENDED JUNE 30, 2004 AND 2005 AND
PERIOD FROM JULY 1, 2005 THROUGH APRIL 13, 2006
(In thousands)
| | Group
Equity | | Comprehensive
Income | |
BALANCE—July 1, 2003 | | $ | 228,307 | | | $ | — | | |
Net earnings | | 48,174 | | | 48,174 | | |
Foreign currency translation adjustments | | 2,059 | | | 2,059 | | |
Minimum pension liability adjustment, net of tax of $(6) | | 14 | | | 14 | | |
Comprehensive income | | | | | $ | 50,247 | | |
Dividends paid | | (26,277 | ) | | | | |
Advances from Parent and affiliates | | 124,109 | | | | | |
BALANCE—June 30, 2004 | | 376,386 | | | | | |
Net earnings | | 57,641 | | | $ | 57,641 | | |
Foreign currency translation adjustments | | 10,853 | | | 10,853 | | |
Minimum pension liability adjustment, net of tax of $357 | | (591 | ) | | (591 | ) | |
Comprehensive income | | | | | $ | 67,903 | | |
Dividends paid | | (21,276 | ) | | | | |
Returns to Parent and affiliates | | (23,731 | ) | | | | |
BALANCE—June 30, 2005 | | 399,282 | | | | | |
Net earnings | | 40,981 | | | $ | 40,981 | | |
Foreign currency translation adjustments | | (997 | ) | | (997 | ) | |
Comprehensive income | | | | | $ | 39,984 | | |
Dividends paid | | (91,043 | ) | | | | |
Returns to Parent and affiliates | | 15,741 | | | | | |
BALANCE—April 13, 2006 | | $ | 363,964 | | | | | |
See notes to combined financial statements.
112
CLAIMS SERVICES GROUP
STATEMENTS OF COMBINED CASH FLOWS
YEARS ENDED JUNE 30, 2004 AND 2005 AND
PERIOD FROM JULY 1, 2005 THROUGH APRIL 13, 2006
(In thousands)
| | Years Ended June 30 | | Period from
July 1, 2005
through | |
| | 2004 | | 2005 | | April 13, 2006 | |
CASH FLOWS FROM OPERATING ACTIVITIES: | | | | | | | | | |
Net earnings | | $ | 48,174 | | $ | 57,641 | | | $ | 40,981 | | |
Adjustments to reconcile net earnings to net cash flows provided by operating activities: | | | | | | | | | |
Loss from discontinued operations, net of tax | | 3,845 | | 128 | | | — | | |
Gain on disposal of discontinued operations, net of tax | | (7,661 | ) | — | | | — | | |
Depreciation and amortization | | 28,754 | | 34,335 | | | 28,894 | | |
Deferred income taxes | | (2,114 | ) | (5,989 | ) | | (1,629 | ) | |
Restricted stock compensation expense | | 268 | | 476 | | | 7,443 | | |
Minority interests in net income of consolidated subsidiaries | | 1,229 | | 1,909 | | | 3,468 | | |
Provision for doubtful accounts | | 644 | | 1,313 | | | 981 | | |
Impairment of intangible assets | | 4,214 | | — | | | — | | |
Other | | 164 | | 778 | | | 130 | | |
Net change in assets and liabilities of discontinued operations | | (1,620 | ) | (1,997 | ) | | — | | |
Changes in operating assets and liabilities, net of effects from acquisitions and divestitures of businesses: | | | | | | | | | |
Receivables | | (4,890 | ) | (4,957 | ) | | (5,157 | ) | |
Other assets | | (2,064 | ) | 540 | | | (1,250 | ) | |
Accounts payable | | (2,731 | ) | 7,335 | | | (12,811 | ) | |
Accrued expenses and other liabilities | | 5,634 | | 9,682 | | | (4,047 | ) | |
Income taxes payable | | 2,171 | | 5,646 | | | (5,680 | ) | |
Net cash flows provided by operating activities | | 74,017 | | 106,840 | | | 51,325 | | |
CASH FLOWS FROM INVESTING ACTIVITIES: | | | | | | | | | |
Capital expenditures | | (15,980 | ) | (7,659 | ) | | (9,671 | ) | |
Additions to intangibles | | (10,306 | ) | (9,451 | ) | | (6,922 | ) | |
Acquisitions of businesses, net of cash acquired | | (116,788 | ) | (36,456 | ) | | (3,403 | ) | |
Cash paid from (deposited in) escrow account for acquisitions of businesses | | (6,056 | ) | 4,203 | | | 1,853 | | |
Proceeds from the sale of businesses | | 5,369 | | — | | | — | | |
Disbursements for notes receivable from affiliated parties | | (917 | ) | (14,345 | ) | | (17,311 | ) | |
Proceeds from notes receivable from affiliated parties | | 2,994 | | 229 | | | 16,991 | | |
Other | | 456 | | 504 | | | — | | |
Net cash flows used in investing activities | | (141,228 | ) | (62,975 | ) | | (18,464 | ) | |
CASH FLOWS FROM FINANCING ACTIVITIES: | | | | | | | | | |
Additions to notes payable to affiliated parties | | 899 | | 14,686 | | | — | | |
Payments on notes payable to affiliated parties | | (29 | ) | (2,459 | ) | | — | | |
Net (returns) advances of investments to Parent and affiliates | | 121,606 | | (24,320 | ) | | 8,256 | | |
Cash dividends paid to Parent and affiliates | | (26,277 | ) | (21,276 | ) | | (91,043 | ) | |
Net cash flows (used in) provided by financing activities | | 96,199 | | (33,369 | ) | | (82,787 | ) | |
EFFECT OF EXCHANGE RATE CHANGES ON CASH AND CASH EQUIVALENTS | | 1,950 | | 2,993 | | | 6,741 | | |
NET CHANGE IN CASH AND CASH EQUIVALENTS | | 30,938 | | 13,489 | | | (43,185 | ) | |
CASH AND CASH EQUIVALENTS—Beginning of period | | 76,886 | | 107,824 | | | 121,313 | | |
CASH AND CASH EQUIVALENTS—End of period | | $ | 107,824 | | $ | 121,313 | | | $ | 78,128 | | |
SUPPLEMENTAL DISCLOSURE OF CASH FLOW INFORMATION: | | | | | | | | | |
Cash payments made for interest | | $ | 745 | | $ | 862 | | | $ | — | | |
Cash payments made for income taxes | | $ | 11,651 | | $ | 13,329 | | | $ | 13,940 | | |
See notes to combined financial statements.
113
CLAIMS SERVICES GROUP
NOTES TO COMBINED FINANCIAL STATEMENTS
YEARS ENDED JUNE 30, 2004 AND 2005 AND
PERIOD FROM JULY 1, 2005 THROUGH APRIL 13, 2006
(In thousands, except per share and share amounts)
1. ORGANIZATION AND BASIS OF PRESENTATION
Description of Business—The Claims Services Group (the “Company”) of Automatic Data Processing, Inc. (“ADP” or the “Parent”) provides software and services to the automobile insurance claims processing industry. The Company classifies its operations into the following reportable segments: Automotive Claims Services, Audatex, ADP Business Services, and Other. Automotive Claims Services provides insurance claims management and collision repair management in North America. Audatex provides insurance claims management and collision repair management in Europe, South America, South Africa and Asia. ADP Business Services provides services that help the financial industry and related businesses to streamline end-to-end processes used in property claims, risk management and distribution in the Netherlands.
Basis of Preparation—The combined financial statements have been prepared in accordance with accounting principles generally accepted in the United States of America. These financial statements present the combined financial position and results of operations of the Company, which are under common control and common management. The historical financial results in the combined financial statements presented may not be indicative of the results that would have been achieved had the Company operated as a separate, stand-alone entity. The combined financial statements include all adjustments necessary for a fair presentation of the business and all intercompany balances and transactions of the Company have been eliminated.
The accompanying combined financial statements include the accounts of the Company, which include the following entities owned directly or indirectly, by the Company:
Entity | | | | Ownership | | Location | |
ADP Claims Solutions Group, Inc. | | | 100 | % | | United States | |
Collision Repair Business Management LLP | | | 100 | % | | United States | |
ADP Hollander Inc. | | | 100 | % | | United States | |
Integrated Medical Solutions, Inc. | | | 100 | % | | United States | |
Sidexa S.A. (France) | | | 75 | % | | France | |
Audatex Developpement France SAS | | | 100 | % | | France | |
Audatex Holding GmbH (Swiss) | | | 100 | % | | Switzerland | |
Audatex Osterreich GmbH (Austria) | | | 100 | % | | Austria | |
Informex S.A. (Belgium) | | | 98 | % | | Belgium | |
Audatex Brasil Servicos Ltda. | | | 100 | % | | Brazil | |
Audatex Ceska Republica a.s. (fka Mobil Data a.s.) | | | 100 | % | | Czech Republic | |
Audatex Deutschland Datenverarbeitungs GmbH | | | 100 | % | | Germany | |
Audatex Daten Internationale Datenentwicklungs GmbH | | | 100 | % | | Germany | |
Audatex (UK) Limited | | | 100 | % | | United Kingdom | |
Audatex Magyarorszag Kft. (Hungary) | | | 100 | % | | Hungary | |
Audatex Espana S.A. | | | 75 | % | | Spain | |
Audatex Datos Espana S.A. | | | 88 | % | | Spain | |
Audatex Polska Sp. Zoo. | | | 100 | % | | Poland | |
114
Audatex Portugal S.A. | | | 51 | % | | Portugal | |
Audatex S.A. (Pty) Ltd. | | | 100 | % | | South Africa | |
Audatex Systems GmbH (Swiss) | | | 100 | % | | Switzerland | |
Audatex GmbH (Swiss) | | | 100 | % | | Switzerland | |
Audatex Schweiz GmbH | | | 100 | % | | Switzerland | |
ADP Network Services Netherlands BV | | | 100 | % | | Netherlands | |
OOO Audatex (Russia) | | | 100 | % | | Russia | |
Audatex Mexico S. De R.L. de C.V. | | | 51 | % | | Mexico | |
Audatex Slovakia s.r.o. | | | 100 | % | | Slovakia | |
Audatex Ukraine LLC | | | 100 | % | | Ukraine | |
ADP Business Services Group BV (Netherlands) | | | 100 | % | | Netherlands | |
ADP Business Services Nerland BV | | | 100 | % | | Netherlands | |
ABZ BV | | | 100 | % | | Netherlands | |
ADP Business Services International BV (D) | | | 100 | % | | Netherlands | |
EBZ BV | | | 100 | % | | Netherlands | |
ADP Claims Services (BV) | | | 100 | % | | Netherlands | |
Audatex Italia s.r.l. | | | 100 | % | | Italy | |
ArgeMu GmBH | | | 100 | % | | Germany | |
Audatex Services SRL (Romania) | | | 100 | % | | Romania | |
In addition to the above entities, the accompanying historical financial statements include the assets, liabilities and operations of a Canadian insurance claims management and collision repair management business, which are part of the Company.
The accompanying historical financial statements are presented on a carve-out basis and reflect the assets, liabilities, revenues and expenses that were directly attributable to the Company as it was operated within ADP. Each of the above subsidiaries or divisions maintains a separate general ledger and all business activities relate to the Company.
The group equity balances on the combined balance sheets are comprised of the retained earnings of the Company, foreign currency translation adjustments, dividends paid, and advances from (returns to) Parent and affiliates. The advances from (returns to) Parent and affiliates consist of the receivables and payables for transactions with ADP and its affiliates as well as transactions that are settled by the Parent on behalf of the Company. The receivables and payables within group equity on the combined balance sheets include, but are not limited to, transactions relating to insurance programs, domestic severance liability, services received from affiliated companies, services provided to affiliated companies and income taxes.
The combined financial statements include costs for facilities, functions and services used by the Company at shared ADP sites and costs for certain functions and services performed by centralized ADP organizations and directly charged to the Claims Services Business based on usage. The Company’s combined financial statements include the following transactions with ADP or its affiliates:
Corporate Overhead Expenses—The Company’s statements of combined earnings include an allocation of certain general corporate expenses of ADP, which were in support of the Claims Services Group, including departmental costs for information technologies, travel, treasury, tax, internal audit, risk management, real estate, benefits and other corporate and infrastructure costs. The Company was allocated $1,571, $1,551, and $750 of these overhead costs related to ADP’s shared functions for the years ended June 30, 2004 and 2005 and for the period from July 1, 2005 through April 13, 2006, respectively, which are primarily reported in selling, general and administrative expenses. These allocations were based on a variety of factors. The cost for information technology support is allocated based on the usage of the information technology systems by the Company in relation to ADP’s total usage. The allocation of the travel department costs is based on the estimated percentage of travel directly related to the Company.
115
The allocation of the treasury department costs is a combination of an estimated percentage of support staff time and bank service charges that are directly related to the Company’s activities. The allocation of the internal audit department costs is based on the internal audit hours incurred for the Company in relation to ADP’s total internal audit hours. The allocation of the risk management department costs is based on the estimated percentage of insurance coverage for the Claims Services Group in relation to ADP’s total insurance coverage. The allocation of the real estate department costs is based on the number of leased facilities for the Company managed by the corporate real estate department in relation to ADP’s total leased facilities. All other allocations are based on an estimated percentage of support staff time related to the Company in comparison to ADP as a whole.
Insurance Allocation—ADP retains much of the financial risk for insuring property, workers’ compensation, automobile liability, commercial general liability insurance and employee group health claims. The Company is charged with the insurance premiums and other related program costs, as well as the estimated amount of losses to be incurred in the respective policy period. Liabilities related to these insurance plans have not been allocated to the Company and therefore are included in group equity on the combined balance sheets. The Company was allocated $4,393, $4,369 and $6,276 of these insurance costs the years ended June 30, 2004 and 2005 and for the period from July 1, 2005 through April 13, 2006, respectively. The portion of the allocated costs that are reported as operating expenses are $1,455, $1,653 and $2,421 for the years ended June 30, 2004 and 2005 and for the period from July 1, 2005 through April 13, 2006, respectively. The portion of allocated costs that are reported as selling, general and administrative expenses are $1,914, $1,663 and $2,333 for years ended June 30, 2004 and 2005 and for the period from July 1, 2005 through April 13, 2006, respectively. The portion of allocated costs that are reported as systems and programming expenses are $532, $1,053 and $1,522 for the years ended June 30, 2004 and 2005, and for the period from July 1, 2005 through April 13, 2006, respectively. For the year ended June 30, 2004, $492 of allocated costs are reported within the loss (income) from discontinued operations. Property, workers’ compensation, automobile liability and commercial general liability insurance cost allocations include insurance program costs and retained losses. Employee group health costs have been allocated to the Company based on the number of Company’s employees participating in the plans in relation to the total number of ADP employees participating in these plans.
Stock Compensation and Pension Plans—Certain employees of the Company are eligible to participate in certain ADP stock compensation plans. In addition, certain employees of the Company are covered by ADP’s defined benefit and defined contribution plans (Note 12).
Royalty Fees—The statements of combined earnings include trademark royalty fees charged by ADP to the Company based on revenues for licensing fees associated with the use of the ADP trademark. The Company was charged $752, $811 and $587 for the years ended June 30, 2004 and 2005 and for the period from July 1, 2005 through April 13, 2006, respectively, for such trademark royalty fees. The portion of the allocated costs that are reported as operating expenses are $737, $811 and $587 for the years ended June 30, 2004 and 2005 and for the period from July 1, 2005 through April 13, 2006, respectively. The portion of allocated costs that are reported within the loss (income) from discontinued operations is $15 for the year ended June 30, 2004.
Facilities—The Company conducts its business in certain facilities that are being leased from various affiliated companies. The Company is charged rent based on the square footage being leased from the affiliated companies. Rental expense of facilities leased from affiliated companies were $1,347, $1,367 and $1,036 for the years ended June 30, 2004 and 2005 and for the period from July 1, 2005 through April 13, 2006, respectively, and are included within selling, general and administrative expenses. In addition, certain affiliates of ADP utilize certain leased space at Company’s facilities. The Company charges rent to ADP based on the square footage being leased by the affiliated companies. Rental income from the space leased by ADP’s affiliates was $0, $77 and $61 for the years ended June 30, 2004 and 2005 and for the period from
116
July 1, 2005 through April 13, 2006, respectively, which are included in and reduce selling, general and administrative expenses.
Services Received from Affiliated Companies—The Company conducts business with various affiliated companies that are under the control of ADP. Services purchased from affiliated companies primarily consist of services for the printing and distribution of manuals and compact discs to provide to the Company’s customers for the use of products, services for the collection and remittance of cash for certain of the Company’s product offerings and a fee per transaction charge for the access to certain car dealership information. Services from affiliated companies were $2,756, $2,810 and $1,566 for the years ended June 30, 2004 and 2005 and for the period from July 1, 2005 through April 13, 2006, respectively, and are included within operating expenses. The Company purchases services from affiliated companies at rates consistent with pricing to third parties.
Services Provided to Affiliated Companies—The Company has allocated expenses to ADP affiliates for certain general bookkeeping services provided by the Company for an ADP affiliated entity. The Company allocated $26, $27 and $20 of these overhead costs to ADP for the years ended June 30, 2004 and 2005 and for the period from July 1, 2005 through April 13, 2006, respectively. All of these allocated costs reduce selling, general and administrative expenses.
Notes Receivable from Affiliated Parties and Notes Payable to Affiliated Parties—The amounts recorded in the combined financial statements as notes receivable from affiliated parties and notes payable to affiliated parties represent amounts that are receivable from or payable to affiliated parties under contractual arrangements. Interest income and interest expense on these transactions with affiliated companies are disclosed in Note 11.
Other Services—The Company receives other services from ADP and its affiliates, including payroll processing services and the use of information technology software for recruiting employees. The Company is primarily charged at a fixed rate per employee per month for such payroll processing services and based on usage for the information technology software. Net expense incurred for such services was $437, $654 and $495 for the years ended June 30, 2004 and 2005 and for the period from July 1, 2005 through April 13, 2006, respectively, and is included in the statements of combined earnings primarily as selling, general and administrative expenses.
2. SUMMARY OF SIGNIFICANT ACCOUNTING POLICIES
Cash and Cash Equivalents—The Company’s cash and cash equivalents are primarily comprised of cash in its international bank accounts. The Company’s domestic operations participate in ADP’s centralized cash management program, where all cash in domestic bank accounts are swept to ADP on a daily basis. All highly liquid debt instruments with original maturities of ninety days or less at the time of purchase are considered cash equivalents.
Property and Equipment—Property and equipment is stated at cost and depreciated over the estimated useful lives of the assets using the straight-line method. The estimated useful lives of assets are as follows:
Buildings | | 20 to 40 years | |
Building improvements | | 5 to 15 years | |
Leasehold improvements | | Lesser of 10 years or useful life | |
Data processing equipment | | 3 years | |
Furniture and fixtures | | 4 to 7 years | |
Machinery and equipment | | 3 to 6 years | |
Goodwill and Other Intangible Assets—The Company accounts for goodwill and other intangible assets in accordance with Statement of Financial Accounting Standards (“SFAS”) No. 142, Goodwill and Other Intangible Assets, which states that goodwill and intangible assets with indefinite useful lives should not be amortized, but instead tested for impairment at least annually at the reporting unit level. If an impairment
117
exists, a write-down to fair value (normally measured by discounting estimated future cash flows) is recorded. Intangible assets with finite lives are amortized primarily on a straight-line basis over their estimated useful lives and are reviewed for impairment in accordance with SFAS No. 144, Accounting for the Impairment or Disposal of Long-Lived Assets (“SFAS No. 144”).
Impairment of Long-Lived Assets—In accordance with SFAS No. 144, long-lived assets are reviewed for impairment whenever events or changes in circumstances indicate that the carrying amount of an asset may not be recoverable. Recoverability of assets to be held and used is measured by a comparison of the carrying amount of an asset to estimated undiscounted future cash flows expected to be generated by the asset. If the carrying amount of an asset exceeds its estimated future cash flows, an impairment charge is recognized for the amount by which the carrying amount of the asset exceeds the fair value of the asset.
Use of Estimates—The preparation of financial statements and related disclosures in conformity with accounting principles generally accepted in the United States of America requires management to make judgments, assumptions and estimates that affect the amounts reported in the Company’s combined financial statements and accompanying notes. The Company bases its estimates and judgments on historical experience and on various other assumptions that it believes are reasonable under the circumstances. However, future events are subject to change and estimates and judgments routinely require adjustment. The amounts of assets and liabilities reported in the Company’s balance sheets and the amounts of revenues and expenses reported for each of its fiscal periods are affected by estimates and assumptions which are used for, but not limited to, the accounting for sales allowances, allowance for doubtful accounts, fair value of derivatives, goodwill and intangible asset impairments, amortization of intangibles, restructurings, liabilities under defined benefit plans, stock based compensation and income taxes. Actual results could differ from these estimates.
Revenue Recognition—A majority of the Company’s revenues are attributable to fees for providing services. The Company’s customers are billed on a per-transaction basis and/or on a monthly subscription basis. Revenues are recognized only after services are provided, when persuasive evidence of an arrangement exists, the fee is fixed and determinable, and when collectibility is reasonably assured.
Certain of the Company’s services are sold through a single contract with multiple elements, including database services, hardware, and maintenance. The Company accounts for revenue with multiple elements in accordance with Emerging Issues Task Force Issue No. 00-21, Revenue Arrangements with Multiple Elements (“EITF 00-21”). EITF 00-21 provides guidance on (a) how arrangement consideration should be measured, (b) whether the arrangement should be divided into separate units of accounting, and (c) how the arrangement consideration should be allocated among separate units of accounting.
Certain of the Company’s services may require the Company to perform setup and implementation activities necessary for the client to receive the Company’s services under the service contract. Up-front fees billed during the setup phase are deferred and amortized on a straight-line basis over the estimated customer life. Setup costs that are direct and incremental to the contract are capitalized and amortized on a straight-line basis over the estimated life of the customer relationship.
Revenues are reflected net of customer sales allowances, which are based on both specific identification of certain accounts and a predetermined percentage of revenue based on historical experience.
Foreign Currency Translation—The assets, revenues and expenses of the Company’s foreign subsidiaries are translated into U.S. dollars at average exchange rates during the periods. Functional currencies of significant foreign subsidiaries include: Euros, British pounds, Swiss francs and Canadian dollars. Currency transaction gains (losses), which are included in the results of operations, totaled ($363), $872 and $383 for the years ended June 30, 2004 and 2005 and for the period from July 1, 2005 through April 13, 2006, respectively. Gains or losses from balance sheet translation are included in group equity within other comprehensive income on the combined balance sheets.
118
Internal Use Software—Expenditures for software purchases and software developed or obtained for internal use are capitalized and amortized over a three- to five-year period on a straight-line basis. For software developed or obtained for internal use, the Company capitalizes costs in accordance with the provisions of Statement of Position No. 98-1, Accounting for the Costs of Computer Software Developed or Obtained for Internal Use. The Company’s policy provides for the capitalization of external direct costs of materials and services associated with developing or obtaining internal use computer software. In addition, the Company also capitalizes certain payroll and payroll-related costs for employees who are directly associated with internal use computer software projects. The amount of capitalizable payroll costs with respect to these employees is limited to the time directly spent on such projects. Costs associated with preliminary project stage activities, training, maintenance and all other post-implementation stage activities are expensed as incurred. The Company also expenses internal costs related to minor upgrades and enhancements, as it is impractical to separate these costs from normal maintenance activities.
Income Taxes—The Company’s operations are included in separate income tax returns filed with the appropriate taxing jurisdictions, except for U.S. federal and certain state and foreign jurisdictions in which the Company’s operations are included in the income tax returns of the Parent or an affiliate.
The provision for income taxes on earnings from continuing operations is computed as if the Company filed on a consolidated stand-alone or separate tax return basis, as applicable. The provision for income taxes on earnings from continuing operations does not reflect the Company’s inclusion in the tax returns of the Parent or an affiliate. Certain income taxes of the Company are paid by the Parent or an affiliate on behalf of the Company. The payment of income taxes by the Parent or affiliate on behalf of the Company is recorded within group equity on the combined balance sheets.
Deferred income taxes and related tax expense have been recorded by applying the asset and liability approach to the Company as if it was a separate taxpayer. Deferred tax liabilities and assets are recognized for the expected future tax consequences of events that have been reflected in the combined financial statements. Deferred tax liabilities and assets are determined based on the differences between the book values and the tax bases of the particular assets and liabilities, using enacted tax rates and laws in effect for the years in which the differences are expected to reverse. A valuation allowance is provided when the Company determines that it is more likely than not that a portion of the deferred tax asset balance will not be realized.
Fair Value Accounting for Stock Plans—As an operating unit of ADP, certain employees of the Company (a) have been granted stock options to purchase common shares in ADP’s stock option program, (b) have been granted restricted stock under which shares of common stock have been sold to the employees for nominal consideration, and (c) participate in ADP’s stock purchase plan under which employees have the ability to purchase shares of common stock at 85% of the lower of market value as of the date of purchase or as of the end of the stock purchase plan period.
As discussed in Note 12, ADP adopted SFAS No. 123(R), Share-Based Payment (“SFAS No. 123(R)”), effective July 1, 2005, using the modified prospective method. Accordingly, prior-period amounts have not been restated. The adoption of this standard requires the measurement of stock-based compensation expense based on the fair value of the award on the date of grant. Prior to July 1, 2005, ADP followed Accounting Principles Board Opinion No. 25, Accounting for Stock Issued to Employees (“APB No. 25”), and related interpretations. Under APB No. 25, no stock-based compensation expense was recognized related to the Company’s stock option program and employee stock purchase plan, as all options granted under the stock option program had an exercise price equal to the market value of the underlying common stock on the date of grant and, with respect to the employee stock purchase plan, the discount did not exceed 15%.
Fair Value of Financial Instruments—The Company’s financial instruments, including cash equivalents, accounts receivable, short-term notes receivable from affiliated parties, accounts payable and short-term
119
notes payable to affiliated parties are carried at cost, which approximates their fair value, due to the short-term maturities of these financial instruments. The Company’s long-term notes payable to affiliated parties approximate fair value as the notes payable contain provisions that allow the Company to repay the loan at any time without penalty. The fair value of long-term notes receivable from affiliates is estimated by using a discount rate that approximates the current rate for comparable notes.
Certain Risks and Concentrations—The Company offers a broad range of services to a diverse group of customers throughout North America, Central and South America, Europe, the Middle East, South Africa and Asia. To reduce the credit risk, the Company performs periodic credit evaluations of each customer and monitors their financial condition and developing business news. The Company had no customers with sales exceeding 10% of total sales for the years ended June 30, 2004 and 2005 and for the period from July 1, 2005 to April 13, 2006.
3. OTHER (INCOME) EXPENSE—NET
Interest Income and other—net consists of the following:
| | Years Ended
June 30 | | Period From
July 1, 2005
through | |
| | 2004 | | 2005 | | April 13, 2006 | |
Interest income | | | $ | (1,601 | ) | | $ | (2,589 | ) | | $ | (1,668 | ) | |
Interest income on notes receivable from affiliated parties | | | (133 | ) | | (348 | ) | | (998 | ) | |
Foreign exchange (gain) loss on notes receivable and notes payable from affiliated parties | | | 363 | | | (872 | ) | | (383 | ) | |
Other | | | 48 | | | (256 | ) | | (20 | ) | |
Other (income) expense—net | | | $ | (1,323 | ) | | $ | (4,065 | ) | | $ | (3,069 | ) | |
4. PURCHASE OF THE COMPANY BY SOLERA, INC.
On April 13, 2006, Solera, Inc., a subsidiary of Solera Holdings, LLC completed its purchase of the Company from ADP for approximately $1.0 billion, including transaction costs.
5. ACQUISITIONS
Assets acquired and liabilities assumed in business combinations were recorded on the Company’s combined balance sheets as of the respective acquisition dates based upon their estimated fair values at such dates. The results of operations of businesses acquired by the Company have been included in the Company’s statements of combined earnings since their respective dates of acquisition. The excess of the purchase price over the estimated fair values of the underlying assets acquired and liabilities assumed was allocated to goodwill.
The Company acquired two businesses in the period from July 1, 2005 to April 13, 2006 for approximately $3,403, net of cash acquired. These acquisitions resulted in approximately $4,095 of goodwill. Intangible assets acquired, which totaled approximately $632, consist of customer contracts and lists that are being amortized over a weighted average life of 10 years. In addition, during the period from July 1, 2005 to April 13, 2006, the Company did not make any contingent payments relating to previously consummated acquisitions. Such acquisitions for the period from July 1, 2005 to April 13, 2006 were not material to the Company’s operations, financial position or cash flows.
The Company acquired one business in the year ended June 30, 2005 for approximately $31,486, net of cash acquired. This acquisition resulted in approximately $19,127 of goodwill. Intangible assets acquired,
120
which totaled approximately $6,942, consist of customer contracts and lists that are being amortized over a weighted average life of 10 years. In addition, during the year ended June 30, 2005, the Company made $4,970 of contingent payments relating to previously consummated acquisitions. As of June 30, 2005, the Company had contingent consideration remaining for all transactions of approximately $2,239, which is payable over the next year, subject to the acquired entity’s achievement of specified revenue, earnings and/or development targets. The acquisition discussed above for the year ended June 30, 2005 was not material to the Company’s operations, financial position or cash flows.
In January 2004, the Company acquired ABZ Group B.V. (“ABZ”) for approximately $115,765, net of cash acquired. ABZ provides services that help the financial industry and related businesses to streamline end-to-end processes used in property claims, risk management and distribution. The Company formed the ADP Business Services segment to report the results of the acquired business. This acquisition resulted in approximately $82,447 of goodwill. Intangible assets acquired, which totaled approximately $59,340, consist primarily of software and customer contracts and lists that are being amortized over a weighted average life of 11 years. In connection with the acquisition of ABZ, the Company deposited cash in an escrow account for contingent payments relating to the acquisition, which has been utilized to settle the final purchase consideration in succeeding periods. The balance of the escrow account is $6,056 and $1,853 at June 30, 2004 and 2005, respectively, and is included in cash in escrow on the combined balance sheets.
In addition to the acquisition of ABZ in the year ended June 30, 2004, the Company made $1,023 of contingent payments relating to previously consummated acquisitions.
6. RESTRUCTURING CHARGES
The Company recorded restructuring charges of $1,740, $5,512 for the years ended June 30, 2004 and 2005, respectively, and a release of restructuring accruals of $(468) during the period from July 1, 2005 through April 13, 2006, which primarily consist of one-time termination benefits. These restructuring initiatives were designed to achieve efficiencies and reduce costs in response to changes in demand projections for certain services. One-time termination benefits relate to the termination of approximately 26, 125 and 18 employees for the years ended June 30, 2004 and 2005 and for the period from July 1, 2005 to April 13, 2006, respectively. The restructuring reserves are included in accrued expenses and other current liabilities on the combined balance sheets. The following table summarizes the charges for restructuring and related activity at June 30, 2004 and 2005, including payments made and the ending reserve balances:
| | Balance
at July 1
2003 | | Additions | | Payments | | Balance
at June 30
2004 | | Additions | | Payments | | Balance
at June 30
2005 | |
Automotive Claims Services | | | $ | 281 | | | | $ | — | | | | $ | (214 | ) | | | $ | 67 | | | | $ | 2,768 | | | | $ | (352 | ) | | | $ | 2,483 | | |
Audatex | | | 1,109 | | | | 1,740 | | | | (2,040 | ) | | | 809 | | | | 1,814 | | | | (1,145 | ) | | | 1,478 | | |
ADP Business Services | | | — | | | | — | | | | — | | | | — | | | | 930 | | | | — | | | | 930 | | |
Total | | | $ | 1,390 | | | | $ | 1,740 | | | | $ | (2,254 | ) | | | $ | 876 | | | | $ | 5,512 | | | | $ | (1,497 | ) | | | $ | 4,891 | | |
For the period from July 1, 2005 to April 13, 2006, payments of $4,096 were made for restructuring charges.
7. DISCONTINUED OPERATIONS
In January 2004, the Company sold a portion of the assets of its Medical Claims business for $5,369 in cash. In addition, the Company decided to shut down the remaining operations of the business rather than continue to pursue the sale of the remaining assets. In connection with the decision to shut down the remaining operations of its Medical Claims business, the Company recorded restructuring charges of
121
$3,517 during the year ended June 30, 2004. These restructuring charges primarily consisted of severance of $903, involving 259 employees, asset impairments of $2,144 and other exit costs of $470 necessary to exit certain contracts. The reserve for the restructuring charges associated with the discontinued operations is included in liabilities of discontinued operations on the combined balance sheets. During the year ended June 30, 2004, the Company reported income from discontinued operations of $3,816, including a $4,828 benefit from income taxes, in the statements of combined earnings. The income from discontinued operations included a gain on sale of certain assets of the Medical Claims business of $7,661, net of a $2,280 benefit from income taxes, as well as operating losses, including restructuring charges, of the discontinued business. The benefit from income taxes includes a benefit of $4,426 that resulted from the disposition of stock with a tax basis in excess of the book basis in assets sold. During the year ended June 30, 2004, there were no significant investing or financing cash flow activities of the discontinued operations.
During the year ended June 30, 2005, the Company recorded additional charges of $210 primarily relating to additional costs associated with certain contracts which were terminated in the year ended June 30, 2004. During the period from July 1, 2005 to April 13, 2006, the Company did not record any additional charges for discontinued operations.
Operating results of the discontinued operations of the Medical Claims business were as follows:
| | Years Ended June 30 | |
| | 2004 | | 2005 | |
Revenues | | | $ | 17,968 | | | | $ | — | | |
Loss before benefit from income taxes | | | 6,393 | | | | 210 | | |
Benefit from income taxes | | | (2,548 | ) | | | (82 | ) | |
Net loss from operations of discontinued Medical Claims business | | | 3,845 | | | | 128 | | |
Gain on disposal of Medical Claims business, net of provision for income taxes of $2,280 for the year ended June 30, 2004 | | | (7,661 | ) | | | — | | |
Net loss (income) from discontinued operations | | | $ | (3,816 | ) | | | $ | 128 | | |
The following are the major classes of assets and liabilities related to the discontinued operations as of June 30, 2004 and 2005:
| | 2004 | | 2005 | |
Current assets: | | | | | |
Accounts receivable—net | | $ | 1,951 | | $ | — | |
Deferred tax assets | | 897 | | 199 | |
Total current assets | | $ | 2,848 | | $ | 199 | |
Current liabilities: | | | | | |
Accounts payable | | $ | 808 | | $ | — | |
Accrued expenses | | 4,033 | | 195 | |
Total current liabilities | | $ | 4,841 | | $ | 195 | |
8. RECEIVABLES
Accounts receivable is net of an allowance for doubtful accounts of $3,824 and $1,489 at June 30, 2004 and 2005, respectively. The Company did not have any significant concentration of credit risk associated with its customers.
122
9. PROPERTY AND EQUIPMENT—NET
Property and equipment at cost and accumulated depreciation at June 30, 2004 and 2005 are as follows:
| | 2004 | | 2005 | | |
Property and equipment: | | | | | | |
Land and buildings | | $ | 19,174 | | $ | 19,601 | | |
Machinery and equipment | | 6,824 | | 7,193 | | |
Furniture and fixtures | | 10,316 | | 10,998 | | |
Data processing equipment | | 57,946 | | 44,854 | | |
Leasehold improvements | | 11,117 | | 11,043 | | |
Property and equipment at cost | | 105,377 | | 93,689 | | |
Less accumulated depreciation | | (67,736 | ) | (60,233 | ) | |
Property and equipment—net | | $ | 37,641 | | $ | 33,456 | | |
10. GOODWILL AND INTANGIBLE ASSETS—NET
Changes in goodwill for the years ended June 30, 2004 and 2005 are as follows:
| | Automotive
Claims
Services | | ADP
Business
Services | | Audatex | | Total | |
BALANCE—July 1, 2003 | | | $ | 2,303 | | | $ | — | | $ | 53,828 | | $ | 56,131 | |
Additions | | | — | | | 93,551 | | — | | 93,551 | |
Adjustments to previously recorded purchase price | | | — | | | — | | 1,167 | | 1,167 | |
Cumulative translation adjustments | | | — | | | (2,851 | ) | 1,154 | | (1,697 | ) |
BALANCE—June 30, 2004 | | | 2,303 | | | 90,700 | | 56,149 | | 149,152 | |
Additions | | | — | | | — | | 19,127 | | 19,127 | |
Adjustments to previously recorded purchase price | | | — | | | (11,104 | ) | (3,271 | ) | (14,375 | ) |
Cumulative translation adjustments | | | — | | | 2,714 | | (609 | ) | 2,105 | |
BALANCE—June 30, 2005 | | | $ | 2,303 | | | $ | 82,310 | | $ | 71,396 | | $ | 156,009 | |
Components of intangible assets are as follows:
| | 2004 | | 2005 | |
Intangibles: | | | | | |
Software and software licenses | | $ | 82,077 | | $ | 96,168 | |
Customer contracts and lists | | 135,567 | | 161,102 | |
Trademarks | | 14,204 | | 16,520 | |
| | 231,848 | | 273,790 | |
Less accumulated amortization | | (62,919 | ) | (85,540 | ) |
Intangible assets—net | | $ | 168,929 | | $ | 188,250 | |
During the year ended June 30, 2004, the Company decided to discontinue the use of software which was previously purchased as it was determined that the intended use of the software would no longer be feasible. This change required an impairment analysis to be performed in accordance with SFAS No. 144. Since the Company decided to dispose the software, it was determined that there was no future cash flows expected to be generated by the software. As a result, the carrying value of the intangible asset was
123
reduced to zero. The Automotive Claims Services segment recorded a pre-tax charge of $4,214, within impairment charges on the statements of combined earnings, during the year ended June 30, 2004.
All of the intangible assets (except goodwill) have finite lives and, as such, are subject to amortization on a straight-line basis. The weighted average remaining useful life of the intangible assets is 7 years (3 years for software and software licenses, 9 years for customer contracts and lists and 8 years for trademarks). Amortization of intangibles totaled $16,589, $21,840 and $19,266 for the years ended June 30, 2004 and 2005 and for the period from July 1, 2005 to April 13, 2006, respectively. Estimated future amortization expense is not presented, as the Company was acquired on April 13, 2006 (see Note 4).
11. NOTES RECEIVABLE FROM AFFILIATED PARTIES AND NOTES PAYABLE TO AFFILIATED PARTIES.
Notes receivable from affiliated parties and notes payable to affiliated parties are comprised of the following:
| | Interest | | Date of | | June 30, | |
Type of Issue | | | | Rate | | Maturity | | 2004 | | 2005 | |
Short-term notes receivable denominated in foreign currency: | | | | | | | | | | | |
Note receivable from affiliate | | | 3.25 | | | 5/21/06 | | $ | — | | $ | 2,825 | |
Long-term notes receivable denominated in foreign currency: | | | | | | | | | | | |
Note receivable from affiliate | | | 3.00 | | | 10/14/06 | | $ | — | | $ | 12,662 | |
Note receivable from affiliate | | | 6.00 | | | 6/14/07 | | — | | 1,504 | |
Note receivable from affiliate | | | 3.25 | | | 5/21/06 | | 2,875 | | — | |
Total long-term notes receivable from affiliated parties | | | | | | | | $ | 2,875 | | $ | 14,166 | |
Short-term notes payable denominated in foreign currency: | | | | | | | | | | | |
Note payable to affiliate | | | 4.00 | | | 10/10/05 | | $ | — | | $ | 3,252 | |
Note payable to affiliate | | | 12.00 | | | 12/31/05 | | — | | 1,582 | |
Note payable to affiliate | | | 2.35 | | | 4/6/06 | | — | | 8,410 | |
Note payable to affiliate | | | 2.25 | | | 3/11/06 | | 799 | | 836 | |
Total short-term notes payable to affiliated parties | | | | | | | | $ | 799 | | $ | 14,080 | |
Long-term notes payable denominated in foreign currency: | | | | | | | | | | | |
Note payable to affiliate | | | 4.00 | | | 10/10/05 | | $ | 3,179 | | $ | — | |
Note payable to affiliate | | | 12.00 | | | 12/31/05 | | 1,106 | | — | |
Note payable to affiliate | | | 1.00 | | | 4/26/07 | | — | | 3,231 | |
Total long-term notes payable to affiliated parties | | | | | | | | $ | 4,285 | | $ | 3,231 | |
| | | | | | | | | | | | | | | |
For the period from July 1, 2005 to April 13, 2006, there was one additional note receivable from affiliate of $1,548. All notes receivable and payable to/from affiliated parties were paid or otherwise settled in conjunction with the acquisition of the Company as of April 13, 2006.
Interest income on notes receivable from affiliated parties was $133, $348 and $998 for the years ended June 30, 2004 and 2005 and for the period from July 1, 2005 through April 13, 2006, respectively, and is included in other (income) expense—net.
Interest expense on notes payable to affiliated parties was $252, $334 and $301 for the years ended June 30, 2004 and 2005 and for the period from July 1, 2005 through April 13, 2006, respectively, and is included in other (income) expense—net.
124
12. EMPLOYEE BENEFIT PLANS
Stock Plans—As discussed in Note 2, effective July 1, 2005, the Company adopted SFAS No. 123(R) utilizing the modified prospective method. Accordingly, prior period amounts have not been restated. SFAS No. 123(R) requires the measurement of stock-based compensation expense based on the fair value of the award on the date of grant. Under the modified prospective method, the provisions of SFAS No. 123(R) apply to all awards granted or modified after the date of adoption. In addition, the unrecognized expense of awards not yet vested at the date of adoption, determined under the original provisions of SFAS No. 123, Accounting for Stock-Based Compensation (“SFAS No. 123”), will be recognized in net earnings in the periods after the date of adoption. Stock-based compensation primarily consists of the following:
Stock Options—As an operating unit of ADP, certain employees of the Company are eligible to participate in the ADP stock option plans, which provide for the issuance, to eligible employees, of incentive and non-qualified stock options, which may expire as much as 10 years from the date of grant, at exercise prices not less than the fair market value on the date of grant. Stock options generally vest over five years and have a term of 10 years. Compensation expense for stock options is recognized over the requisite service period for each separately vesting portion of the stock option award. Upon the sale of the Company, options granted prior to January 1, 2006 were accelerated, fully vesting on April 13, 2006. The Company recorded approximately $1,637 as stock based compensation for the incremental fair value resulting from the modification of these options. Options granted during or after January 1, 2006 were cancelled at April 13, 2006 upon sale of the Company.
Employee Stock Purchase Plan (“ESPP”)—As an operating unit of ADP, certain employees of the Company participate in ADP’s ESPP. Prior to November 2005, ADP offered an employee stock purchase plan that allowed eligible employees to purchase shares of common stock at 85% of the lower of market value as of the date of purchase or as of the end of the stock purchase plan. In November 2005, ADP revised the employee stock purchase plan, effective as of on January 1, 2006, whereby eligible employees can purchase shares of common stock at 85% of the market value at the date the purchase price for the offering is determined. Compensation expense for the employee stock purchase plan is recognized over the vesting period of 24 months on a straight-line basis. The sale of the Company on April 13, 2006 ceased the ESPP for the Company’s employees.
Restricted Stock—ADP has a restricted stock program under which shares of common stock have been sold at par value to certain key employees. These shares are restricted as to transfer and in certain circumstances must be resold to ADP at the original purchase price. The Company records stock compensation expense relating to the issuance of restricted stock over the period during which the transfer restrictions exist, which is up to five years from the date of grant. The value of ADP’s restricted stock, based on market prices, is recognized as compensation expense over the restriction period on a straight-line basis. Upon the sale of Company on April 13, 2006, the vesting for all restricted stock previously unvested was accelerated, fully vesting on April 13, 2006.
The Company utilizes treasury stock to satisfy stock option exercises, issuances under its employee stock purchase plan and restricted stock awards. Stock-based compensation expense was recognized in earnings from continuing operations as follows:
| | Fiscal Year | | July 1, 2005- | |
| | 2004 | | 2005 | | April 13, 2006 | |
Operating expenses | | $ | — | | $ | — | | | $ | 1,111 | | |
Selling, general and administrative expenses | | 268 | | 476 | | | 3,264 | | |
Systems development and programming costs | | | | | | | 3,068 | | |
Total stock-based compensation expense | | $ | 268 | | $ | 476 | | | $ | 7,443 | | |
125
The total stock-based compensation expense included in earnings from continuing operations before income taxes includes expenses related to restricted stock awards of $268, $476, and $396 within selling, general and administrative expenses for the fiscal years ended June 30, 2004 and 2005 and for the period from July 1, 2005 through April 13, 2006, respectively.
A summary of changes in the stock option plans for the fiscal years ended June 30, 2004 and 2005 and for the period from July 1, 2005 through April 13, 2006, is as follows:
| | Number of Options
(in thousands) | | Weighted-Average
Exercise Price | |
| | | | | | July 1, 2005- | | | | | | July 1, 2005- | |
| | 2004 | | 2005 | | April 13, 2006 | | 2004 | | 2005 | | April 13, 2006 | |
Options outstanding—beginning of year | | 2,642 | | 3,028 | | | 2,913 | | | | $ | 43 | | | | $ | 43 | | | | $ | 43 | | |
Options granted | | 972 | | 469 | | | 488 | | | | 41 | | | | 43 | | | | 44 | | |
Options exercised | | (183 | ) | (169 | ) | | (237 | ) | | | 32 | | | | 32 | | | | 37 | | |
Options canceled | | (403 | ) | (415 | ) | | (422 | ) | | | 46 | | | | 45 | | | | 42 | | |
Options outstanding—end of period | | 3,028 | | 2,913 | | | 2,742 | | | | $ | 43 | | | | $ | 43 | | | | $ | 44 | | |
Options outstanding as of April 13, 2006 expired in 60 days thereafter. Options not exercised within the 60 days were canceled.
During the period from July 1, 2005 through April 13, 2006, the Company issued 163,000 shares in connection with the employee stock purchase plan. The Company issued 7,000 shares of restricted stock during the period from July 1, 2005 through April 13, 2006.
The following table illustrates the effect on net earnings from continuing operations if the Company had applied the fair value recognition provisions of SFAS No. 123 to stock-based employee compensation for periods prior to adoption of SFAS No. 123(R).
| | Years Ended June 30 | |
| | 2004 | | 2005 | |
Net earnings, as reported | | $ | 48,174 | | $ | 57,641 | |
Add stock-based employee compensation expense included in reported net earnings, net of related tax effects | | 163 | | 289 | |
Deduct total stock-based employee compensation expense determined using the fair value-based method for all awards, net of related tax effects | | (6,428 | ) | (6,849 | ) |
Pro forma net earnings | | $ | 41,909 | | $ | 51,081 | |
The fair value of each stock option issued prior to January 1, 2005 was estimated on the date of grant using a Black-Scholes option-pricing model. For stock options issued on or after January 1, 2005, the fair value of each stock option was estimated on the date of grant using a binomial option-pricing model. The binomial option-pricing model considers a range of assumptions related to volatility, dividend yield, risk-free interest rate and employee exercise behavior. Expected volatilities utilized in the binomial option-pricing model are based on a combination of implied market volatilities, historical volatility of the Company’s stock price and other factors. Similarly, the dividend yield is based on historical experience and expected future changes. The risk-free rate is derived from the U.S. Treasury yield curve in effect at the time of grant. The binomial option-pricing model also incorporates exercise and forfeiture assumptions based on an analysis of historical data. The expected life of the stock option grants is derived from the output of the binomial option-pricing model and represents the period of time that options granted are expected to be outstanding.
126
The fair value for these instruments was estimated at the date of grant with the following assumptions:
| | Years Ended June 30 | | Period from
July 1, 2005
through | |
| | 2004 | | 2005 | | April 13, 2006 | |
Risk-free interest rate | | 3.9-4.5 | % | 2.1-4.2 | % | | 4.0-4.6 | % | |
Dividend yield | | 1.0-1.1 | % | 1.2-1.4 | % | | 1.4-1.7 | % | |
Volatility factor | | 29.0-29.3 | % | 26.2-29.2 | % | | 17.1-24.7 | % | |
Expected life (in years): | | | | | | | | | |
Stock options | | 6.5 | | 5.5-6.5 | | | 5.5-6.5 | | |
Stock purchase plans | | 2.0 | | 2.0 | | | 2.0 | | |
Weighted average fair value: | | | | | | | | | |
Stock options | | $ | 13.96 | | $ | 11.38 | | | $ | 10.89 | | |
Stock purchase plans | | 11.95 | | 12.66 | | | 9.76 | | |
| | | | | | | | | | | | |
Upon the modification of options at the sale of the Claims Services Group at April 13, 2006, the incremental fair value of the modification was determined by comparing the fair value of the 1,136 unvested options immediately before and after the modification. The fair value immediately before the modification was $0 since the options would have been forfeited without the acceleration. The fair value of the options immediately after the modification was based on: a risk-free interest rate of 4.67%, a dividend yield of 1.41%, a volatility factor of 17.69% and an expected life of 60 days, resulting in a weighted average fair value of options outstanding of $3.55. The net incremental fair value of the modification was $1,637.
Pension Plans—Certain employees of the Company are covered by ADP’s domestic defined benefit plans. In addition, certain employees of the Company are part of ADP’s Supplemental Officer Retirement Plan (“SORP”). The SORP is a defined benefit plan pursuant to which ADP will pay supplemental pension benefits to certain key officers upon retirement based upon the officers’ years of service and compensation. Liabilities and assets related to these plans have not been allocated to the Company and are therefore included in group equity on the combined balance sheets. Domestic pension expense allocated to the Company for the years ended June 30, 2004 and 2005 and for the period from July 1, 2005 through April 13, 2006 was $190, $390 and $500, respectively. SORP expense allocated to the Company for the years ended June 30, 2004 and 2005 and for the period from July 1, 2005 through April 13, 2006 was $42, $43 and $35, respectively. Upon the sale of the Company on April 13, 2006, all liabilities for the domestic defined benefit plan and SORP were retained by ADP.
127
The Company’s foreign subsidiaries sponsor various defined benefit plans and individual defined benefit arrangements covering certain eligible employees. All of the defined benefit plans and arrangements are closed to new members. The benefits under these pension plans are based on years of service and compensation levels. Funding is limited to statutory requirements. The Company uses a June 30 measurement date for its foreign pension plans. The change in benefit obligations and plan assets as well as the funded status of the Company’s foreign pension plans were as follows for the years ended June 30, 2004 and 2005:
| | 2004 | | 2005 | |
Change in plan assets: | | | | | |
Fair value of plan assets at beginning of year | | $ | 19,200 | | $ | 24,200 | |
Acquisitions | | 1,100 | | — | |
Actual return on plan assets | | 1,400 | | 200 | |
Employer contributions | | 1,800 | | 1,800 | |
Benefits paid | | (400 | ) | (400 | ) |
Foreign currency exchange rate changes | | 1,100 | | — | |
Fair value of plan assets at end of year | | $ | 24,200 | | $ | 25,800 | |
Change in benefit obligation: | | | | | |
Benefit obligation at beginning of year | | $ | 24,100 | | $ | 28,700 | |
Acquisitions | | 1,300 | | — | |
Service cost | | 1,000 | | 1,200 | |
Interest cost | | 1,300 | | 1,400 | |
Actuarial losses | | — | | 1,800 | |
Benefits paid | | (400 | ) | (400 | ) |
Foreign currency exchange rate changes | | 1,400 | | 100 | |
Projected benefit obligation at end of year | | $ | 28,700 | | $ | 32,800 | |
Funded status—plan assets less benefit obligation | | $ | (4,500 | ) | $ | (7,000 | ) |
Unrecognized net actuarial loss due to different experience than assumed | | 1,300 | | 4,100 | |
Accrued pension liability | | $ | (3,200 | ) | $ | (2,900 | ) |
In conjunction with the sale of the Company effective April 13, 2006 (the “Acquisition”), the Company transferred all liabilities and related assets associated with one foreign defined benefit plan to ADP, and two other foreign defined benefit pension plans were converted to defined contribution plans prior to the Acquisition date. The liabilities and related assets for the remaining three foreign defined pension plans were included in the Acquisition and were assumed by the purchaser.
The accumulated benefit obligation for all defined benefit pension plans was $26,300 and $29,900 at June 30, 2004 and 2005, respectively.
The projected benefit obligation, accumulated benefit obligation and fair value of plan assets for the Company’s pension plans with accumulated benefit obligations in excess of plan assets were $27,300, $25,100 and $22,800, respectively, as of June 30, 2004, and $30,700, $28,200 and $23,900, respectively, as of June 30, 2005.
128
The components of net pension expense were as follows:
| | Years Ended June 30, | | Period From
July 1, 2005
through | |
| | 2004 | | 2005 | | April 13, 2006 | |
Service cost—benefits earned during the period | | $ | 1,000 | | $ | 1,200 | | | $ | 1,200 | | |
Interest cost on projected benefits | | 1,300 | | 1,400 | | | 1,300 | | |
Expected return on plan assets | | (1,000 | ) | (1,200 | ) | | (800 | ) | |
| | $ | 1,300 | | $ | 1,400 | | | $ | 1,700 | | |
Assumptions used to determine the actuarial present value of benefit obligations generally were:
| | 2004 | | 2005 | |
Discount rate | | 5.06 | % | 4.46 | % |
Increase in compensation levels | | 2.54 | | 2.13 | |
Assumptions used to determine the net pension expense generally were:
| | Years Ended June 30 | | Period From
July 1, 2005
through | |
| | 2004 | | 2005 | | April 13, 2006 | |
Discount rate | | 5.04 | % | 5.06 | % | | 4.36 | % | |
Expected long-term rate of return on assets | | 4.65 | % | 4.66 | % | | 4.44 | % | |
Increase in compensation levels | | 2.53 | % | 2.54 | % | | 2.12 | % | |
The discount rate is based upon published rates for high-quality fixed-income investments that produce cash flows that approximate the timing and amount of expected future benefit payments.
The weighted average long-term expected rate of return on assets assumption is 4.44%. This percentage has been determined based on historical and expected future rates of return on plan assets considering the target asset mix and the long-term investment strategy.
Plan Assets—The plan assets of the pension plans are the liability of insurance companies and benefit payments are fully insured. The insurance companies invest the plan assets in accordance with the terms of the insurance companies’ guidelines and the Company has no control over the investment decisions made by the insurance companies. The insurance companies invest virtually the entire pension plan portfolio in fixed income securities.
Contributions—The minimum required and the expected contributions to the Company’s pension plans for the period from April 14, 2006 to June 30, 2006 and for the year ending June 30, 2007 were $400 and $1,700, respectively.
Estimated Future Benefit Payments—The benefits expected to be paid in each fiscal year for the period from April 14, 2006 to June 30, 2006 and the 5 years ending thereafter are $0, $183, $223, $389, $2,282 and $458, respectively. The aggregate benefits expected to be paid in the five years ending June 30 from 2011 to 2015 are $4,406. The expected benefits to be paid are based on the same assumptions used to measure the Company’s pension plans’ benefit obligation and include estimated future employee service.
Retirement and Savings Plan—ADP has defined contribution plans that cover most of its domestic employees. This 401(k) plan provides company matching under various formulas. The allocated costs to the Company for the domestic associates plans for the years ended June 30, 2004 and 2005 and for the period from July 1, 2005 through April 13, 2006, were $904, $1,183 and $1,098, respectively.
129
The Company’s foreign subsidiaries have defined contribution plans that cover certain international employees. These retirement savings-type plans provide company matching under various formulas. The Company’s match amounted to approximately $3,164, $4,373 and $3,977 for the years ended June 30, 2004 and 2005 and for the period from July 1, 2005 through April 13, 2006, respectively.
13. INCOME TAXES
The Company’s operations are included in separate income tax returns filed with the appropriate taxing jurisdictions, except for U.S. federal and certain state and foreign jurisdictions in which the Company’s operations are included in the income tax returns of the Parent or an affiliate.
The provision for income taxes on earnings from continuing operations is computed as if the Company filed on a consolidated stand-alone or separate tax return basis, as applicable. The provision for income taxes on earnings from continuing operations does not reflect the Company’s inclusion in the tax returns of the Parent or an affiliate. Certain income taxes of the Company are paid by the Parent or an affiliate on behalf of the Company. The payment of income taxes by the Parent or affiliate on behalf of the Company is recorded within group equity on the Combined Balance Sheets.
The provision for income taxes on loss (income) from discontinued operations includes an income tax benefit from a loss on the sale of a discontinued operation in 2004 that was utilized by the Parent. The income tax benefit was recorded within group equity on the Combined Balance Sheets.
Earnings from continuing operations before income taxes and minority interests in net income of combined subsidiaries shown below are based on the geographic location to which such earnings are attributable:
| | Years Ended June 30 | | Period From
July 1, 2005
through | |
| | 2004 | | 2005 | | April 13, 2006 | |
Earnings before income taxes: | | | | | | | | | |
United States | | $ | 20,592 | | $ | 17,044 | | | $ | 15,403 | | |
Foreign | | 47,119 | | 66,664 | | | 52,734 | | |
| | $ | 67,711 | | $ | 83,708 | | | $ | 68,137 | | |
The provision for income taxes on earnings from continuing operations consists of the following components:
| | Years Ended June 30 | | Period From
July 1, 2005
through | |
| | 2004 | | 2005 | | April 13, 2006 | |
Current: | | | | | | | | | |
Federal | | $ | 6,207 | | $ | 6,568 | | | $ | 6,418 | | |
Foreign | | 16,809 | | 22,166 | | | 18,188 | | |
State | | 1,222 | | 1,285 | | | 711 | | |
Total current | | 24,238 | | 30,019 | | | 25,317 | | |
Deferred: | | | | | | | | | |
Federal | | 667 | | (857 | ) | | (535 | ) | |
Foreign | | (2,912 | ) | (4,965 | ) | | (1,087 | ) | |
State | | 131 | | (167 | ) | | (7 | ) | |
Total deferred | | (2,114 | ) | (5,989 | ) | | (1,629 | ) | |
Total provision | | $ | 22,124 | | $ | 24,030 | | | $ | 23,688 | | |
130
A reconciliation between the Company’s effective tax rate on earnings from continuing operations and the U.S. federal statutory rate is as follows:
| | Years Ended June 30 | | Period From
July 1, 2005
through | | | |
| | 2004 | | % | | 2005 | | % | | April 13, 2006 | | % | |
Provision for taxes at U.S. statutory rate | | $ | 23,269 | | 35.0 | | $ | 28,630 | | 35.0 | | | $ | 23,848 | | | 35.0 | |
Increase (decrease) in provision from: | | | | | | | | | | | | | | | |
State taxes, net of federal tax benefit | | 880 | | 1.3 | | 727 | | 0.9 | | | 458 | | | 0.7 | |
Foreign rate lower than U.S. federal statutory rate | | (2,164 | ) | (3.2 | ) | (3,956 | ) | (4.9 | ) | | (2,824 | ) | | (4.1 | ) |
Change in valuation allowance | | | | | | | | | | | 309 | | | 0.5 | |
Impact on deferred taxes due to reduction in foreign income tax rate | | | | | | (1,509 | ) | (1.8 | ) | | (202 | ) | | (0.3 | ) |
Other | | 139 | | 0.2 | | 138 | | 0.2 | | | 2,099 | | | 3.1 | |
| | $ | 22,124 | | 33.3 | | $ | 24,030 | | 29.4 | | | $ | 23,688 | | | 34.9 | |
The significant components of deferred income tax assets and liabilities and their balance sheet classifications are as follows:
| | June 30, | | | |
| | 2004 | | 2005 | | April 13, 2006 | |
Deferred tax assets: | | | | | | | | | |
Accrued expenses not currently deductible | | $ | 7,198 | | $ | 7,646 | | | $ | 11,169 | | |
Depreciation and amortization | | 961 | | 716 | | | 1,259 | | |
Net operating losses | | 1,699 | | 1,862 | | | 1,292 | | |
Other | | 1,303 | | 842 | | | 86 | | |
| | 11,161 | | 11,066 | | | 13,806 | | |
Less valuation allowances | | (1,152 | ) | (1,613 | ) | | (1,692 | ) | |
Deferred tax assets—net | | $ | 10,009 | | $ | 9,453 | | | $ | 12,114 | | |
Deferred tax liabilities: | | | | | | | | | |
Amortization | | $ | 45,227 | | $ | 41,900 | | | $ | 262 | | |
Capitalized Software | | 6,356 | | 5,954 | | | 4,307 | | |
Statutory versus GAAP deductions | | 3,895 | | 2,809 | | | | | |
Other | | 917 | | 1,564 | | | 605 | | |
Deferred tax liabilities | | 56,395 | | 52,227 | | | 5,174 | | |
Net deferred tax assets (liabilities) | | $ | (46,386 | ) | $ | (42,774 | ) | | $ | 6,940 | | |
Income taxes have not been provided on undistributed earnings of foreign subsidiaries as the Company considers such earnings to be permanently reinvested as of June 30, 2004 and 2005.
The Company has estimated foreign net operating loss carry forwards of approximately $4,225 at April 13, 2006, of which $131 expires in 2011, $843 expires in 2014 and $3,251 has an indefinite utilization period.
The Company has recorded valuation allowances of $1,152, $1,613 and $1,692 at June 30, 2004 and June 30, 2005 and April 13, 2006, respectively, because the Company does not believe that it is more likely than not that it will be able to utilize these carryforwards to offset future taxable earnings.
Income tax payments were approximately $11,651, $13,329 and $13,940 for the years ended June 30, 2004 and 2005 and for the period from July 1, 2005 through April 13, 2006, respectively, for payments
131
made directly by the Company. The income tax payments exclude payments made by the Parent or an affiliate on behalf of the Company as these amounts are recorded within group equity on the Combined Balance Sheets. For the years ended June 30, 2004 and 2005, and the period from July 1, 2005 through April 13, 2006, income tax payments that were paid on behalf of the Company by the Parent or an affiliate were $8,484, $9,385 and $7,129 respectively, and are included within group equity on the Combined Balance Sheets.
The Company utilized losses of an affiliate in group relief in lieu of cash payments for income taxes in the amounts of $1,374, $526 and $1,008 for the years ended June 30, 2004 and 2005, and for the period from July 1, 2005 through April 13, 2006, respectively. The utilization of such losses is included within group equity on the Combined Balance Sheets.
The Company is routinely examined by the Internal Revenue Service (the “IRS”) in conjunction with the IRS audit of the Parent and examined by tax authorities in countries in which it conducts business, as well as states in which it has significant business operations. The tax years under examination vary by jurisdiction. The Company is included as part of the IRS examination for the year ended June 30, 1998 through the year ended June 30, 2002 which is expected to be substantially completed in the current fiscal year. The Company regularly considers the likelihood of assessments in each of the jurisdictions resulting from examinations. The Company has established tax reserves which it believes are adequate in relation to the potential assessments. Once established, reserves are adjusted when there is more information available, when an event occurs necessitating a change to the reserves or the statute of limitations for the relevant taxing authority to examine the tax position has expired. The resolution of tax matters should not have a material effect on the combined financial condition of the Company, the Company’s Statements of Combined Earnings for a particular future period or on the Company’s effective tax rate.
In the year ended June 30, 2005, the Company reversed a tax contingency of $4,460 due to the expiration of the statute of limitations regarding a pre-acquisition contingent tax liability that was recorded in purchase accounting at the time of the acquisition of the subsidiary to which the contingency related. The reversal resulted in a reduction of goodwill recorded in purchase accounting.
14. CONTRACTUAL COMMITMENTS, CONTINGENCIES AND OFF-BALANCE SHEET ARRANGEMENTS
The Company has obligations under various facilities and equipment leases and software license agreements. Total costs under these agreements were approximately $10,320, $16,475 and $9,225 for the years ended June 30, 2004 and 2005 and for the period from July 1, 2005 through April 13, 2006, respectively, with minimum commitments at April 13, 2006 as follows:
Period from April 14, 2006 through June 30, 2006 | | $ | 2,450 | |
Year ended June 30, 2007 | | 17,497 | |
Year ended June 30, 2008 | | 10,664 | |
Year ended June 30, 2009 | | 7,834 | |
Year ended June 30, 2010 | | 4,619 | |
Thereafter | | 8,757 | |
| | $ | 51,821 | |
In addition to fixed rentals, certain leases require payment of maintenance and real estate taxes and contain escalation provisions based on future adjustments in price indices.
The Company is subject to various claims and litigation in the normal course of business. The Company does not believe that the resolution of these matters will have a material impact on the combined financial statements.
132
In the normal course of business, the Company enters into contracts in which it makes representations and warranties that guarantee the performance of the Company’s products and services. Losses related to such guarantees are insignificant.
15. ACCUMULATED OTHER COMPREHENSIVE INCOME
Comprehensive income is a measure of income that includes both net earnings and other comprehensive income. Other comprehensive income results from items deferred within group equity on the combined balance sheets. Other comprehensive income (loss) was $2,073, $10,262 and $(997) for the years ended June 30, 2004 and 2005 and for the period from July 1, 2005 through April 13, 2006, respectively. The accumulated balances for each component of other comprehensive income are as follows:
| | Years Ended June 30 | | Period From
July 1, 2005
through | |
| | 2004 | | 2005 | | April 13, 2006 | |
Currency translation adjustments | | $ | 20,688 | | $ | 31,541 | | | $ | 30,544 | | |
Minimum pension liability adjustment, net of tax | | (156 | ) | (747 | ) | | — | | |
Accumulated other comprehensive income | | $ | 20,532 | | $ | 30,794 | | | $ | 30,544 | | |
16. SEGMENT AND GEOGRAPHIC INFORMATION
The Company manages its business operations through strategic business units and provides technology-based outsourcing solutions to the property and casualty insurance, auto collision repair and auto recycling industries. Based upon the information reported to the chief operating decision maker, the Company has the following reportable segments: Automotive Claims Services, Audatex, ADP Business Services, and Other. The Company evaluates the performance of its reportable segments based on operating results before income taxes.
| | Automotive
Claims
Services | | ADP
Business
Services | | Audatex | | Other | | Discontinued
Operations | | Reconciling
Item
Corporate
Expenses | | Total | |
Year ended June 30, 2004 | | | | | | | | | | | | | | | | | | | | | | | |
Revenues | | | $ | 176,615 | | | | $ | 23,393 | | | $ | 159,068 | | $ | 2,103 | | | $ | — | | | | $ | — | | | $ | 361,179 | |
Earnings before income taxes | | | 30,203 | | | | 4,549 | | | 38,590 | | 611 | | | — | | | | (7,471 | ) | | 66,482 | |
Assets | | | 67,417 | | | | 171,442 | | | 314,508 | | 554 | | | 2,848 | | | | — | | | 556,769 | |
Capital expenditures | | | 11,022 | | | | 128 | | | 4,736 | | 94 | | | — | | | | 15,980 | | | | |
Depreciation and amortization | | | 13,642 | | | | 3,871 | | | 11,241 | | — | | | — | | | | — | | | 28,754 | |
Interest income | | | — | | | | — | | | (1,601 | ) | — | | | — | | | | — | | | (1,601 | ) |
Interest income on notes receivable from affiliated parties | | | (133 | ) | | | (133 | ) | | | | | | | | | | | | | | | |
Interest expense | | | — | | | | — | | | 19 | | — | | | — | | | | — | | | 19 | |
Interest expense on notes payable to affiliated parties | | | — | | | | — | | | 252 | | — | | | — | | | | — | | | 252 | |
Year ended June 30, 2005 | | | | | | | | | | | | | | | | | | | | | | | |
Revenues | | | $ | 174,096 | | | | $ | 49,956 | | | $ | 186,196 | | $ | 2,107 | | | $ | — | | | | $ | — | | | $ | 412,355 | |
Earnings before income taxes | | | 32,036 | | | | 7,605 | | | 53,637 | | 471 | | | — | | | | (11,950 | ) | | 81,799 | |
Assets | | | 59,855 | | | | 181,339 | | | 366,267 | | 405 | | | 199 | | | | — | | | 608,065 | |
Capital expenditures | | | 2,982 | | | | — | | | 4,642 | | 35 | | | — | | | | — | | | 7,659 | |
Depreciation and amortization | | | 15,319 | | | | 6,403 | | | 12,608 | | 5 | | | — | | | | — | | | 34,335 | |
Interest income | | | (3 | ) | | | (99 | ) | | (2,487 | ) | — | | | — | | | | — | | | (2,589 | ) |
Interest income on notes receivable from affiliated parties | | | — | | | | (248 | ) | | (100 | ) | — | | | — | | | | — | | | (348 | ) |
Interest expense | | | — | | | | — | | | — | | — | | | — | | | | — | | | | |
Interest expense on notes payable to affiliated parties | | | — | | | | — | | | 334 | | — | | | — | | | | — | | | 334 | |
133
Period from July 1, 2005 through April 13, 2006 | | | | | | | | | | | | | | | | | | | | | | | |
Revenues | | | $ | 133,998 | | | | $ | 38,692 | | | $ | 160,823 | | $ | 1,633 | | | $ | — | | | | $ | — | | | $ | 335,146 | |
Earnings before income taxes | | | (44,925 | ) | | | 2,507 | | | 117,459 | | 358 | | | — | | | | (10,730 | ) | | 64,669 | |
Assets | | | 74,045 | | | | 126,898 | | | 179,731 | | 334 | | | — | | | | — | | | 381,008 | |
Capital expenditures | | | 3,848 | | | | 60 | | | 5,763 | | — | | | — | | | | — | | | 9,671 | |
Depreciation and amortization | | | 11,451 | | | | 5,066 | | | 12,377 | | — | | | — | | | | — | | | 28,894 | |
Interest income | | | 4 | | | | 35 | | | 1,629 | | — | | | — | | | | — | | | 1,668 | |
Interest income on notes receivable from affiliated parties | | | — | | | | 228 | | | 770 | | — | | | — | | | | — | | | 998 | |
Interest expense | | | — | | | | — | | | 17 | | — | | | — | | | | — | | | 17 | |
Interest expense on notes payable to affiliated parties | | | — | | | | — | | | 301 | | — | | | — | | | | — | | | 301 | |
| | | | | | | | | | | | | | | | | | | | | | | | | | | | | | |
Revenues and long-lived tangible assets by geographic area are as follows:
| | United
States | | Europe | | Canada | | Other | | Total | |
Year ended June 30, 2004: | | | | | | | | | | | |
Revenues | | $ | 157,685 | | $ | 174,315 | | $ | 21,033 | | $ | 8,146 | | $ | 361,179 | |
Property, plant, and equipment—net | | 17,740 | | 18,962 | | 70 | | 869 | | 37,641 | |
Year ended June 30, 2005: | | | | | | | | | | | |
Revenues | | $ | 152,391 | | $ | 221,791 | | $ | 23,812 | | $ | 14,361 | | $ | 412,355 | |
Property, plant, and equipment—net | | 13,173 | | 19,204 | | 140 | | 938 | | 33,455 | |
Period from July 1, 2005 through April 13, 2006: | | | | | | | | | | | |
Revenues | | $ | 115,355 | | $ | 183,229 | | $ | 20,275 | | $ | 16,287 | | $ | 335,146 | |
Property, plant, and equipment—net | | 12,038 | | 19,291 | | 81 | | 1,780 | | 33,190 | |
17. SUBSEQUENT EVENTS
In 1999 the European Court ruled that a German tax rule regarding the tax treatment of certain royalty fees paid to foreign entities was incompatible with European law. It was unclear whether the European Court ruling applied to non-EU and Double Tax Treaty (DTT) countries. As a result, the German law remained in effect, but German tax authorities suspended tax assessments on trade taxes where the licensor/lessor was resident in a non-EU DTT country, reserving the right to assess the tax at a later date. In response, the Company’s German subsidiaries began accruing a trade tax liability on royalties to non-EU DTT countries according to the German law. As of April 13, 2006, a $6.7 million tax liability was recorded in the Company’s financial statements. In November 2006 the Company was notified that the German tax authorities issued a clarifying ordinance, stating that in the case of lessors/licensors resident in EU or DTT countries the tax assessment would be permanently ceased. Based upon this decision, during the quarter ended December 31, 2006 Solera Holdings, LLC plans to reverse the entire $6.7 million accrual as a reduction to goodwill attributed to the purchase of the Claims Services Group.
134
SIGNATURES
Pursuant to the requirements of Section 13 or 15(d) of the Securities Exchange Act of 1934, the registrant has duly caused this report to be signed on its behalf by the undersigned, thereunto duly authorized on September 14, 2007.
| SOLERA HOLDINGS, INC. |
| /s/ Tony Aquila |
| By: | Tony Aquila |
| Its: | Chief Executive Officer |
According to the requirements of the Securities Exchange Act of 1934, this report has been signed by the following persons on behalf of the registrant and in the capacities indicated below on September 14, 2007.
| Signatures | | | Capacity | | | |
/s/ Tony Aquila | | President, Chief Executive Officer and Director | |
Tony Aquila | | (principal executive officer) | |
/s/ Jack Pearlstein | | Chief Financial Officer, Treasurer and Secretary | |
Jack Pearlstein | | (principal financial and accounting officer) | |
/s/ Philip A. Canfield | | | |
Philip A. Canfield | | Director | |
/s/ Craig A. Bondy | | | |
Craig A. Bondy | | Director | |
/s/ Garen Staglin | | | |
Garen Staglin | | Director | |
/s/ Roxani Gillespie | | | |
Roxani Gillespie | | Director | |
/s/ Stuart J. Yarbrough | | | |
Stuart J. Yarbrough | | Director | |
/s/ Jerrell Shelton | | | |
Jerrell Shelton | | Director | |
135
EXHIBIT INDEX
Exhibit
Number | | Description | |
3.1 | * | Amended and Restated Certificate of Incorporation of the Registrant (as filed as Exhibit 3.1 to Solera Holdings, Inc.’s Form S-1/A filed with the SEC on May 9, 2007) | |
3.2 | * | By-laws of the Registrant (filed as Exhibit 3.2 to Solera Holdings, Inc.’s Form S-1/A filed with the SEC on May 9, 2007) | |
4.1 | * | Specimen Common Stock Certificate (filed as Exhibit 4.1 to Solera Holdings, Inc.’s Form S-1/A filed with the SEC on May 9, 2007) | |
4.2 | * | Registration Rights Agreement, dated as of April 1, 2005, by and among Solera Holdings, LLC, GTCR Fund VIII, L.P., GTCR Fund VIII/B, L.P., GTCR Co-Invest II, L.P. and each of the other Stockholders party thereto (filed as Exhibit 4.2 to Solera Holdings, Inc.’s Form S-1 filed with the SEC on February 12, 2007) | |
10.1 | * | Transaction Agreement, dated as of February 8, 2006, by and among Solera, Inc., Automatic Data Processing, Inc., ADP Atlantic Inc., ADP Nederland B.V., ADP International B.V., ADP Canada Co. and ADP Private Limited (filed as Exhibit 10.1 to Solera Holdings, Inc.’s Form S-1 filed with the SEC on February 12, 2007) | |
10.2 | * | Amendment No. 1 to Transaction Agreement, dated as of March 28, 2006, by and among Solera, Inc., Automatic Data Processing, Inc., ADP Atlantic Inc., ADP Nederland B.V., ADP International B.V., ADP Canada Co. and ADP Private Limited (filed as Exhibit 10.2 to Solera Holdings, Inc.’s Form S-1 filed with the SEC on February 12, 2007) | |
10.3 | * | Amendment No. 2 to Transaction Agreement, dated as of April 13, 2006, by and among Solera, Inc., Automatic Data Processing, Inc., ADP Atlantic Inc., ADP Nederland B.V., ADP International B.V., ADP Canada Co. and ADP Private Limited (filed as Exhibit 10.3 to Solera Holdings, Inc.’s Form S-1 filed with the SEC on February 12, 2007) | |
10.4 | * | Professional Services Agreement, dated as of April 1, 2005, by and among Solera Holding Corp. and GTCR Golder Rauner, L.L.C. (filed as Exhibit 10.4 to Solera Holdings, Inc.’s Form S-1 filed with the SEC on February 12, 2007) | |
10.5 | *# | Solera Holdings, Inc. 2007 Long-Term Equity Incentive Plan (filed as Exhibit 10.5 to Solera Holdings, Inc.’s Form S-1/A filed with the SEC on May 9, 2007) | |
10.6 | *# | Form of Option Agreement issued under 2007 Long-Term Equity Incentive Plan (filed as Exhibit 10.6 to Solera Holdings, Inc.’s Form S-1/A filed with the SEC on April 30, 2007) | |
10.7 | *# | Solera Holdings, LLC 2006 Employee Securities Purchase Plan (filed as Exhibit 10.7 to Solera Holdings, Inc.’s Form S-1 filed with the SEC on February 12, 2007) | |
10.8 | *# | Solera Holdings, Inc. 2007 Employee Stock Purchase Plan (filed as Exhibit 10.8 to Solera Holdings, Inc.’s Form S-1/A filed with the SEC on May 9, 2007) | |
10.9 | *# | Form of Indemnification Agreement (filed as Exhibit 10.9 to Solera Holdings, Inc.’s Form S-1/A filed with the SEC on May 9, 2007) | |
10.10 | * | Unit Purchase Agreement, dated as of April 1, 2005, by and among Solera Holdings, LLC, GTCR Fund VIII, L.P., GTCR Fund VIII/B, L.P. and GTCR Co-Invest II, L.P. (filed as Exhibit 10.10 to Solera Holdings, Inc.’s Form S-1 filed with the SEC on February 12, 2007) | |
10.11 | * | Amended and Restated Unit Purchase Agreement, dated as of April 13, 2006, by and among Solera Holdings, LLC, GTCR Fund VIII, L.P., GTCR Fund VIII/B, L.P., and GTCR Co-Invest II, L.P. (filed as Exhibit 10.11 to Solera Holdings, Inc.’s Form S-1 filed with the SEC on February 12, 2007) | |
10.12 | *# | Amended and Restated Senior Management Agreement, dated as of April 13, 2006, by and among Solera Holdings, LLC, Solera, Inc. and Tony Aquila (filed as Exhibit 10.12 to Solera Holdings, Inc.’s Form S-1 filed with the SEC on February 12, 2007) | |
10.13 | *# | Employment Agreement dated as of April 13, 2006, by and among Solera, Inc., Solera Holdings, LLC and Jack Pearlstein (filed as Exhibit 10.13 to Solera Holdings, Inc.’s Form S-1 filed with the SEC on February 12, 2007) | |
136
10.14 | *# | Securities Purchase Agreement, dated as of April 13, 2006, by and between Solera Holdings, LLC and Jack Pearlstein (filed as Exhibit 10.14 to Solera Holdings, Inc.’s Form S-1 filed with the SEC on February 12, 2007) | |
10.15 | *# | Amended and Restated Senior Management Agreement, dated as of April 13, 2006, by and among Solera Holdings, LLC, Solera, Inc. and John Schwinn (filed as Exhibit 10.15 to Solera Holdings, Inc.’s Form S-1 filed with the SEC on February 12, 2007) | |
10.16 | *# | Amended and Restated Senior Management Agreement, dated as of April 13, 2006, by and among Solera Holdings, LLC, Solera, Inc. and Michael Conway (filed as Exhibit 10.16 to Solera Holdings, Inc.’s Form S-1 filed with the SEC on February 12, 2007) | |
10.17 | *# | Amended and Restated Securities Purchase Agreement, dated as of April 13, 2006, by and between Solera Holdings, LLC and Garen Staglin (filed as Exhibit 10.17 to Solera Holdings, Inc.’s Form S-1 filed with the SEC on February 12, 2007) | |
10.18 | *# | Amended and Restated Securities Purchase Agreement, dated as of April 13, 2006, by and between Solera Holdings, LLC and Roxani Gillespie (filed as Exhibit 10.18 to Solera Holdings, Inc.’s Form S-1 filed with the SEC on February 12, 2007) | |
10.19 | *# | Letter Agreement, dated as of February 8, 2006, by and between Solera, Inc. and Garen Staglin (filed as Exhibit 10.19 to Solera Holdings, Inc.’s Form S-1 filed with the SEC on February 12, 2007) | |
10.20 | *# | Consulting Agreement, dated as of September 1, 2006, by and between Solera, Inc. and Roxani Gillespie (filed as Exhibit 10.20 to Solera Holdings, Inc.’s Form S-1 filed with the SEC on February 12, 2007) | |
10.21 | * | Form of Second Amended and Restated Securities Purchase Agreement by and among the Registrant, GTCR Fund VIII, L.P., GTCR Fund VIII/B, L.P. and GTCR Co-Invest II, L.P. (filed as Exhibit 10.21 to Solera Holdings, Inc.’s Form S-1/A filed with the SEC on May 9, 2007) | |
10.22 | | First Amended and Restated First Lien Credit and Guaranty Agreement, dated as of May 16, 2007, among Audatex North America, Inc., Solera Nederland Holding B.V., Audatex Holdings IV B.V., Audatex Holdings, LLC, the other Guarantors party thereto, Goldman Sachs Credit Partners L.P., Citigroup Global Markets, Inc., Citicorp USA, Inc. and the other Lenders party thereto (filed as Exhibit 10.1 to Solera Holdings, Inc.’s Form 10-Q filed with the SEC on June 25, 2007) | |
21.1 | | List of subsidiaries of the Registrant | |
23.1 | | Consent of Deloitte & Touche LLP, independent registered public accounting firm | |
23.2 | | Consent of Deloitte & Touche LLP, independent auditors | |
31.1 | | Certification by Tony Aquila, Chief Executive Officer. | |
31.2 | | Certification of Jack Pearlstein, Chief Financial Officer. | |
32.1 | | Certification Pursuant to 18 U.S.C. Section 1350, as adopted pursuant to Section 906 of the Sarbanes-Oxley Act of 2002. | |
* Incorporated by reference.
# Management contract or compensatory plan or arrangement.
137