UNITED STATES
SECURITIES AND EXCHANGE COMMISSION
Washington, D.C. 20549
FORM 10-K
| |
☒ | ANNUAL REPORT PURSUANT TO SECTION 13 OR 15(d) OF THE SECURITIES EXCHANGE ACT OF 1934 |
For the fiscal year ended December 31, 2024
OR
| |
☐ | TRANSITION REPORT PURSUANT TO SECTION 13 OR 15(d) OF THE SECURITIES EXCHANGE ACT OF 1934 |
For the transition period from to
Commission File No.: 000-51826
MERCER INTERNATIONAL INC.
(Exact name of Registrant as specified in its charter)

| | |
Washington | | 47-0956945 |
(State or other jurisdiction | | (IRS Employer Identification No.) |
of incorporation or organization) | | |
| | |
Suite 1120, 700 West Pender Street, | | |
Vancouver, British Columbia, Canada | | V6C 1G8 |
(Address of Principal Executive Office) | | (Zip Code) |
Registrant’s telephone number including area code: (604) 684-1099
Securities registered pursuant to Section 12(b) of the Act:
| | | | |
Title of each class | | Trading Symbol(s) | | Name of each exchange on which registered |
| | | | |
| | | | |
Common Stock, par value $1.00 per share | | MERC | | NASDAQ Global Select Market |
Securities registered pursuant to Section 12(g) of the Act: None
Indicate by check mark if the Registrant is a well-known seasoned issuer, as defined in Rule 405 of the Securities Act. Yes ☒ No ☐
Indicate by check mark if the Registrant is not required to file reports pursuant to Section 13 or Section 15(d) of the Act. ☐ Yes ☒ No
Indicate by check mark whether the Registrant (1) has filed all reports required to be filed by Section 13 or 15(d) of the Securities Exchange Act of 1934 during the preceding 12 months (or for such shorter period that the Registrant was required to file such reports), and (2) has been subject to such filing requirements for the past 90 days. Yes ☒ No ☐
Indicate by check mark whether the Registrant has submitted electronically every Interactive Data File required to be submitted pursuant to Rule 405 of Regulation S-T (§ 232.405 of this chapter) during the preceding 12 months (or for such shorter period that the Registrant was required to submit such files). Yes ☒ No ☐
Indicate by check mark whether the Registrant is a large accelerated filer, an accelerated filer, a non-accelerated filer, a smaller reporting company or emerging growth company. See the definitions of “large accelerated filer,” “accelerated filer,” “smaller reporting company,” and “emerging growth company” in Rule 12b-2 of the Exchange Act.
| | | | | | |
Large accelerated filer | | ☐ | | Accelerated filer | | ☒ |
Non-accelerated filer | | ☐ | | Smaller reporting company | | ☐ |
| | | | Emerging growth company | | ☐ |
If an emerging growth company, indicate by check mark if the registrant has elected not to use the extended transition period for complying with any new or revised financial accounting standards provided pursuant to Section 13(a) of the Exchange Act. ☐
Indicate by check mark whether the registrant has filed a report on and attestation to its management’s assessment of the effectiveness of its internal control over financial reporting under Section 404(b) of the Sarbanes-Oxley Act (15 U.S.C. 7262(b)) by the registered public accounting firm that prepared or issued its audit report. ☒
If securities are registered pursuant to Section 12(b) of the Act, indicate by check mark whether the financial statements of the registrant included in the filing reflect the correction of an error to previously issued financial statements. ☐
Indicate by check mark whether any of those error corrections are restatements that required a recovery analysis of incentive-based compensation received by any of the registrant’s executive officers during the relevant recovery period pursuant to §240.10D-1(b). ☐
Indicate by check mark whether the Registrant is a shell company (as defined in Rule 12b-2 of the Act). ☐ Yes ☒ No
The aggregate market value of the Registrant’s voting and non-voting common equity held by non-affiliates of the Registrant as of June 30, 2024, the last business day of the Registrant’s most recently completed second fiscal quarter, based on the closing price of the voting stock on the NASDAQ Global Select Market on such date, was approximately $564.2 million.
As of February 18, 2025 the Registrant had 66,870,774 shares of common stock, $1.00 par value per share, outstanding.
DOCUMENTS INCORPORATED BY REFERENCE
Portions of the Registrant’s definitive Proxy Statement to be filed with the Securities and Exchange Commission in connection with its annual meeting of shareholders to be held in 2025 are incorporated by reference into Part III hereof.
TABLE OF CONTENTS
CAUTIONARY NOTE REGARDING FORWARD-LOOKING STATEMENTS
This Annual Report on Form 10-K includes “forward-looking” statements within the meaning of the Private Securities Litigation Reform Act of 1995. Forward-looking statements can be identified by the fact that they do not relate strictly to historical or current facts. They often include words such as “believes”, “expects”, “anticipates”, “estimates”, “intends”, “plans”, “seeks” or words of similar meaning, or future or conditional verbs, such as “will”, “should”, “could”, “may”, “aims”, “intends” or “projects”. A forward-looking statement is neither a prediction nor a guarantee of future events or circumstances, and those future events or circumstances may not occur. You should not place undue reliance on forward-looking statements, which speak only as of the date of this Annual Report on Form 10-K. These forward-looking statements are all based on currently available operating, financial and competitive information and the current expectations, estimates, forecasts about our business, results of operations, the industry in which we operate, economic and market outlooks and the beliefs and assumptions of our management. These forward-looking statements are subject to various risks and uncertainties, many of which are beyond our control. Our actual future results and trends may differ materially depending on a variety of factors, including, but not limited to, the risks and uncertainties discussed under Item 1. “Business”, Item 1A. “Risk Factors” and Item 7. “Management’s Discussion and Analysis of Financial Condition and Results of Operations”. Given these risks and uncertainties, you should not rely on forward-looking statements as a prediction of actual results. Any or all of the forward-looking statements contained in this Annual Report on Form 10-K and any other public statement made by us, including by our management, may turn out to be incorrect. We are including this cautionary note to make applicable and take advantage of the safe harbor provisions of the Private Securities Litigation Reform Act of 1995 for forward-looking statements. We expressly disclaim any obligation to update or revise any forward-looking statements, whether as a result of new information, future events or otherwise.
INDUSTRY, MARKET AND OTHER DATA
In this Annual Report on Form 10-K, we rely on and refer to information and statistics regarding our market share and the markets in which we compete. We have obtained some of this market share information and industry data from internal surveys, market research, publicly available information and industry publications. Such reports generally state that the information contained therein has been obtained from sources believed to be reliable, but the accuracy or completeness of such information is not guaranteed. Although we believe this information is reliable, we have not independently verified, nor can we guarantee, the accuracy or completeness of that information.
Statements in this Annual Report on Form 10-K concerning the production capacity of our mills are management estimates based primarily on historically achieved levels of production and assumptions regarding maintenance downtime. Statements concerning electrical generating capacity at our mills are also management estimates based primarily on our expected production (which largely determines the amount of electricity we can generate) and assumptions regarding maintenance downtime, in each case within manufacturers’ specifications of capacity.
INTERNET AVAILABILITY AND ADDITIONAL INFORMATION
In this Annual Report on Form 10-K, we incorporate by reference certain information contained in other documents filed with the U.S. Securities and Exchange Commission, referred to as the “SEC”, and we refer you to such information. We file annual, quarterly and current reports and other information with the SEC. The SEC maintains a website at www.sec.gov that contains these filings. You also may access, free of charge, our reports filed with the SEC through our website. Reports filed with the SEC will be available through our website as soon as reasonably practicable after they are filed. The information contained on or connected to our website, www.mercerint.com, is not incorporated by reference into this Annual Report on Form 10-K and should in no way be construed as a part of this or any other report that we filed with the SEC.
CURRENCY
The following table sets out exchange rates, based on the noon buying rates in New York City for cable transfers in foreign currencies as certified for customs purposes by the Federal Reserve Bank of New York, referred to as the “Noon Buying Rate”, for the conversion of dollars to euros and Canadian dollars in effect at the end of the following periods, the average exchange rates during these periods (based on daily Noon Buying Rates) and the range of high and low exchange rates for these periods:
| | | | | | | | | | | | | | | | | | | | |
| | Year Ended December 31, | |
| | 2024 | | | 2023 | | | 2022 | | | 2021 | | | 2020 | |
| | ($/€) | |
End of period | | | 1.0351 | | | | 1.1062 | | | | 1.0698 | | | | 1.1318 | | | | 1.2230 | |
High for period | | | 1.0351 | | | | 1.0453 | | | | 0.9616 | | | | 1.1196 | | | | 1.0682 | |
Low for period | | | 1.1184 | | | | 1.1237 | | | | 1.1487 | | | | 1.2295 | | | | 1.2280 | |
Average for period | | | 1.0820 | | | | 1.0817 | | | | 1.0534 | | | | 1.1830 | | | | 1.1410 | |
| | ($/C$) | |
End of period | | | 0.6944 | | | | 0.7575 | | | | 0.7390 | | | | 0.7827 | | | | 0.7841 | |
High for period | | | 0.6929 | | | | 0.7205 | | | | 0.7208 | | | | 0.7727 | | | | 0.6878 | |
Low for period | | | 0.7513 | | | | 0.7618 | | | | 0.8031 | | | | 0.8312 | | | | 0.7865 | |
Average for period | | | 0.7302 | | | | 0.7412 | | | | 0.7691 | | | | 0.7981 | | | | 0.7457 | |
On February 18, 2025, the most recent weekly publication of the daily Noon Buying Rate before the filing of this Annual Report on Form 10-K reported that the Noon Buying Rate as of February 14, 2025 for the conversion of dollars to euros and Canadian dollars was $1.0498 per euro and $0.7057 per Canadian dollar.
PART I
ITEM 1. BUSINESS
In this document, please note the following:
•references to “we”, “our”, “us”, the “Company” or “Mercer” mean Mercer International Inc. and its subsidiaries, unless the context clearly suggests otherwise, and references to “Mercer Inc.” mean Mercer International Inc. excluding its subsidiaries;
•references to “$” or “dollars” shall mean U.S. dollars, which is our reporting currency, unless otherwise stated; “€” refers to euros; and “C$” refers to Canadian dollars;
•references to “ADMTs” mean air-dried metric tonnes;
•references to “CLT” mean cross-laminated timber;
•references to “glulam” mean glue-laminated timber;
•references to “m3” mean cubic meters;
•references to “Mfbm” mean thousand board feet;
•references to “MMfbm” mean million board feet;
•references to “MW” mean megawatts and “MWh” mean megawatt hours;
•references to “NBHK” mean northern bleached hardwood kraft;
•references to “NBSK” mean northern bleached softwood kraft;
•references to “tonnes” mean metric tonnes; and
•our lumber metrics are converted from m3 to Mfbm using a conversion ratio of 1.6 m3 of lumber equaling one Mfbm, which is the ratio commonly used in the industry.
Due to rounding, numbers presented throughout this report may not add up precisely to totals we provide and percentages may not precisely reflect the absolute figures.
Mercer
General
We are a global forest products company and have two reportable operating segments:
•Pulp – consists of the manufacture, sale and distribution of pulp, electricity and chemicals at our pulp mills.
•Solid Wood – consists of the manufacture, sale and distribution of lumber, manufactured products (including CLT, glulam and finger joint lumber), wood pallets, electricity, biofuels and wood residuals at our sawmills and other facilities in Germany and our mass timber facilities in North America.
We have consolidated annual production capacity of approximately 2.1 million ADMTs of kraft pulp, 960 MMfbm of lumber, 210,000 m3 of CLT, 45,000 m3 of glulam, 17 million pallets, 230,000 tonnes of biofuels (wood pellets and briquettes) and 398 MW of electrical generation.
Pulp Segment
We are one of the world’s largest producers of “market” NBSK pulp, which is pulp that is sold on the open market. Our size provides us with increased presence, better industry information in our markets and close customer relationships with many large pulp consumers.
We operate four modern and highly efficient pulp mills. These include two NBSK mills in Germany and one NBSK mill and one “swing” kraft mill in Western Canada which produces both NBSK and NBHK.
We are the sole NBSK producer, and the only significant market pulp producer in Germany, which is the largest pulp import market in Europe. We supply the growing pulp demand in China both through our Canadian mills’ ready access to the Port of Vancouver and through our German mills’ existing logistics arrangements.
In addition, as a result of the significant investments previously made in cogeneration equipment, all of our mills generate and sell a significant amount of surplus “green” energy. We also produce and sell tall oil from black liquor, a by-product of our production process, which is used as both a chemical additive and as a green energy source.
In 2023, we commissioned the lignin pilot production and research and development facility at our Rosenthal mill. This facility can produce approximately 300 tonnes of lignin per year. We believe lignin has the potential to be a sustainable green alternative to displace fossil fuels and hydrocarbon-based products.
Of our consolidated annual production capacity of approximately 2.1 million ADMTs of kraft pulp, approximately 1.8 million ADMTs, or 86%, is NBSK and the balance is NBHK.
Key operating details for each of our pulp mills are as follows:
•Stendal mill – Our Stendal mill is a modern, efficient ISO 9001, 14001, 38200 and 50001 certified NBSK pulp mill that has an annual production capacity of approximately 740,000 ADMTs and 148 MW of electrical generation. The Stendal mill is located near the town of Arneburg, Germany, approximately 80 miles west of Berlin.
•Rosenthal mill – Our Rosenthal mill is a modern, efficient ISO 9001, 14001, 38200 and 50001 certified NBSK pulp mill that has an annual production capacity of approximately 360,000 ADMTs and 57 MW of electrical generation. The Rosenthal mill is located in the town of Rosenthal am Rennsteig, Germany, approximately 185 miles south of Berlin.
•Celgar mill – Our Celgar mill is a modern, efficient ISO 9001 and 14001 certified NBSK pulp mill that has an annual production capacity of approximately 520,000 ADMTs and 100 MW of electrical generation. The Celgar mill is located near the city of Castlegar, British Columbia, Canada, approximately 375 miles east of Vancouver.
•Peace River mill – Our Peace River mill is a modern, efficient ISO 9001 and 14001 certified mill that produces both NBSK and NBHK pulp and has an annual production capacity of approximately 475,000 ADMTs and 65 MW of electrical generation. The Peace River mill is located near the town of Peace River, Alberta, Canada, approximately 305 miles north of Edmonton. Peace River also holds two 20-year renewable governmental forest management agreements and three deciduous timber allocations in Alberta with an aggregate allowable annual cut of approximately 2.9 million m3 of hardwood and softwood allocations totaling 375,000 m3.
Our pulp mills are some of the newest and most modern pulp mills in Europe and North America. We believe the relative age, production capacity and electrical generation capacity of our mills provide us with certain manufacturing cost and other advantages over many of our competitors. We believe our competitors’ older mills do not have the equipment or capacity to produce or sell surplus power or chemicals in a meaningful amount. In addition, as a result of the relative age of our mills, they benefit from lower maintenance capital requirements and higher efficiency relative to many of our competitors’ mills.
The following table sets out our pulp production, sales and revenues for the periods indicated:
| | | | | | | | | | | | |
| | Year Ended December 31, | |
| | 2024(1) | | | 2023 | | | 2022 | |
Pulp production ('000 ADMTs) | | | 1,843.1 | | | | 1,965.6 | | | | 1,878.6 | |
Pulp sales ('000 ADMTs) | | | 1,899.8 | | | | 1,951.2 | | | | 1,917.7 | |
Pulp revenues (in thousands) | | $ | 1,460,460 | | | $ | 1,402,620 | | | $ | 1,686,370 | |
(1)In March 2024, we disposed of our 50% joint venture interest in the Cariboo Pulp & Paper Company (“CPP”).
Our pulp mills generate and sell surplus electricity, providing us with a stable revenue source unrelated to pulp prices. Our German pulp mills also generate tall oil from black liquor, which is sold to third parties for use in numerous applications, including biofuels. Since our energy and chemical production are by-products of our pulp production process, there are minimal incremental costs and our surplus energy and chemical sales are highly profitable. All of our mills generate and sell surplus energy to regional utilities or the regional electrical market. Our German mills sell energy at market prices. Previously, our Stendal mill also had the option to sell energy pursuant to a special tariff under Germany’s Renewable Energy Sources Act, or the “Renewable Energy Act”, which expired in December 2024. In 2024, Stendal primarily sold energy at market prices which were generally higher than the tariff rate. As a result of higher energy prices stemming from the war in Ukraine, in 2022, the European Union adopted a regulation that introduced a mandatory cap on market revenues of inframarginal electricity produced of €180 per MWh. In Germany, this was implemented through a “windfall” profits tax which took effect from December 2022 and expired in June 2023 with respect to electricity producers. See Item 1A. “Risk Factors – We sell surplus green energy in Germany and are subject to changing energy legislation in response to high prices and energy shortages”.
Our Peace River mill sells surplus energy to its regional electrical market. Our Celgar mill is party to a fixed electricity purchase agreement with the regional public utility provider for the sale of surplus power which runs until October 2030.
The following table sets out the amount of surplus energy we produced and sold and revenues from the sale of such surplus energy and chemicals in our pulp segment for the periods indicated:
| | | | | | | | | | | | | | | | | | | | | | | | |
| | Year Ended December 31, | |
| | 2024 | | | 2023 | | | 2022 | |
| | (MWh) | | | ($) | | | (MWh) | | | ($) | | | (MWh) | | | ($) | |
| |
| | | (in thousands) | | | | | | (in thousands) | | | | | | (in thousands) | |
Surplus electricity(1) | | | 797,218 | | | | 72,705 | | | | 832,587 | | | | 89,134 | | | | 751,720 | | | | 167,518 | |
Chemicals | |
| | | | 15,391 | | |
| | | | 24,376 | | |
| | | | 12,229 | |
Total | | | | | | 88,096 | | | | | | | 113,510 | | | | | | | 179,747 | |
(1)Does not include our 50% joint venture interest in CPP, which was accounted for using the equity method. In March 2024, we disposed of this interest.
We serve pulp customers in Europe, Asia and North America. We primarily work directly with customers to capitalize on our geographic diversity, coordinate sales and enhance customer relationships. We believe our ability to deliver high-quality pulp on a timely basis and our customer service makes us a preferred supplier for many customers.
Solid Wood Segment
Our solid wood segment consists of the manufacture, sale and distribution of lumber, manufactured products (including CLT, glulam and finger joint lumber), wood pallets, electricity, biofuels and wood residuals from our sawmills and other facilities located in Germany and our mass timber facilities in North America.
Since 2021, we have invested approximately $396.6 million to expand our solid wood activities and product mix, to acquire the Mercer Spokane Mass Timber facility, referred to as the “Mercer Spokane facility” in 2021, the Torgau facility in 2022 and substantially all of the assets of the Structurlam group of companies, referred to as the “Structurlam Group”, in June 2023 which included a mass timber production facility in Conway, Arkansas, referred to as the “Mercer Conway facility” and three mass timber production facilities
in British Columbia, Canada. We combined the British Columbia facilities into one facility, referred to as the “Mercer Okanagan facility” after completing the acquisition.
In addition, since 2021 we have invested approximately $134.0 million in capital expenditures in our solid wood segment to increase production, lower costs and enhance efficiency.
Our solid wood segment has an aggregate capacity of approximately 960 MMfbm of lumber, 210,000 m3 of CLT, 45,000 m3 of glulam, 17 million pallets, 230,000 tonnes of biofuels and 28 MW of electrical generation.
The following is a description of the mills and facilities comprising our solid wood segment:
•Friesau mill – Our Friesau mill is ISO 50001 and 38200 certified and has an annual production capacity of approximately 550 MMfbm of lumber and 13 MW of electrical generation. The mill is located in Friesau, Germany, approximately 185 miles south of Berlin and 10 miles west of our Rosenthal mill and is one of the Rosenthal mill’s largest fiber suppliers. The mill has a diverse product line ranging from custom rough green and dry lumber for the European market to kiln-dried, dimension lumber for the United States, Japan, United Kingdom and other export markets.
•Torgau facility – Our Torgau facility is ISO 50001 certified and is an integrated sawmill and value-add pallet production facility, with an annual production capacity of approximately 410 MMfbm of lumber, 17 million pallets and 15 MW of electrical generation. The Torgau facility can also produce up to 230,000 tonnes of biofuels, consisting of wood pellets and briquettes, used to generate electricity and thermal energy. The Torgau facility is currently one of the world’s largest producers of Euro-pallets, the standard European shipping pallet. The Torgau facility is located in Torgau, Germany, approximately 70 miles south of Berlin.
•Mercer Spokane facility – The Mercer Spokane facility is a modern, 253,000 square foot manufacturing facility, with an annual production capacity of 140,000 m3 of CLT. We believe that the facility is one of the largest CLT facilities in North America, currently representing approximately 20% of North American CLT capacity. CLT is a wood panel product, made from adhering layers of sawn lumber and is used as a more sustainable alternative to steel and concrete in building projects.
•Mercer Conway facility – The Mercer Conway facility is a modern, state-of-the-art manufacturing facility that was built in 2021 and has an annual combined capacity of approximately 75,000 m3 of CLT and glulam. The Mercer Conway facility includes over 280,000 square feet of manufacturing space, and is strategically located in the Southern United States in proximity to growing construction markets with access to a large high-quality regional wood basket.
•Mercer Okanagan facility – The Mercer Okanagan facility has an annual capacity of approximately 40,000 m3 of glulam and CLT. As glulam is commonly incorporated into mass timber construction projects, these assets complement our other mass timber facilities and enhance our ability to service the growing customer base for our mass timber business.
The European and U.S. lumber markets are very different. In the European market, lumber is generally customized in terms of dimensions and finishing. The U.S. market is driven primarily by demand from new housing starts and home renovation activities and dimensions and finishing are generally standardized. Additionally, lumber production and sales in Europe are commonly measured in m3, whereas in the U.S. they are measured in Mfbm.
The following table sets out our lumber, manufactured products, pallet and biofuels production, sales and revenues for the periods indicated:
| | | | | | | | | | | | |
| | Year Ended December 31, | |
| | 2024 | | | 2023 | | | 2022(1) | |
Lumber production (MMfbm) | | | 475.6 | | | | 462.3 | | | | 442.2 | |
Lumber sales (MMfbm) | | | 470.4 | | | | 500.5 | | | | 409.9 | |
Lumber revenues (in thousands) | | $ | 217,471 | | | $ | 217,939 | | | $ | 288,002 | |
Manufactured products production(2) (‘000 m3) | | | 34.0 | | | | 25.1 | | | | 36.3 | |
Manufactured products sales(2) (‘000 m3) | | | 30.7 | | | | 33.4 | | | | 28.8 | |
Manufactured products revenues(2) (in thousands) | | $ | 100,565 | | | $ | 58,895 | | | $ | 22,759 | |
Pallet production (‘000 units) | | | 10,243.5 | | | | 10,707.2 | | | | 2,568.4 | |
Pallet sales (‘000 units) | | | 10,089.2 | | | | 11,041.2 | | | | 2,646.3 | |
Pallet revenues (in thousands) | | $ | 104,386 | | | $ | 121,424 | | | $ | 36,063 | |
Biofuels production(3) (‘000 tonnes) | | | 160.4 | | | | 167.2 | | | | 45.7 | |
Biofuels sales(3) (‘000 tonnes) | | | 184.4 | | | | 144.8 | | | | 49.8 | |
Biofuels revenues(3) (in thousands) | | $ | 40,082 | | | $ | 40,680 | | | $ | 17,691 | |
(1)Includes results of the Torgau facility since September 30, 2022.
(2)Primarily includes CLT and glulam for the years ended December 31, 2024 and December 31, 2023. Primarily includes finger joint lumber for the year ended December 31, 2022.
(3)Includes pellets and briquettes.
The Friesau mill and Torgau facility generate electricity for minimal incremental costs, all of which is sold, providing a stable revenue source unrelated to lumber prices. Both the Friesau mill and Torgau facility can sell surplus electricity at market prices or pursuant to special tariff rates under the Renewable Energy Act. In 2024, the Friesau mill and Torgau facility primarily sold energy at their special tariff rates which were generally higher than market prices.
The following table sets out the amount of surplus energy we produced and sold and revenues from the sale of surplus energy by our Friesau mill and Torgau facility for the periods indicated.
| | | | | | | | | | | | |
| | Year Ended December 31, |
| | 2024 | | 2023 | | 2022(1) |
| | (MWh) | | ($) | | (MWh) | | ($) | | (MWh) | | ($) |
| |
| | (in thousands) | | | | (in thousands) | | | | (in thousands) |
Surplus electricity | | 126,280 | | 16,512 | | 160,161 | | 21,451 | | 109,582 | | 25,653 |
(1)Includes results of the Torgau facility since September 30, 2022.
Corporate Structure, History and Development of Business
Mercer Inc. is a corporation organized under the laws of the State of Washington whose common stock is quoted and listed for trading on the NASDAQ Global Select Market (MERC).
The following chart sets out our principal operating subsidiaries, all of which are directly or indirectly 100% owned, their jurisdictions of organization and their principal activities:
| | |
Name | Jurisdiction of Organization | Principal Activities |
Mercer Stendal GmbH | Germany | Pulp, energy and chemical production and sales |
Mercer Rosenthal GmbH | Germany | Pulp, energy and chemical production and sales |
Mercer Celgar Limited Partnership | British Columbia, Canada | Pulp, energy and chemical production and sales |
Mercer Peace River Pulp Ltd. | British Columbia, Canada | Pulp and energy production and sales |
Mercer Timber Products GmbH | Germany | Lumber and energy production and sales |
Mercer Spokane LLC | Washington, U.S.A. | CLT production and sales |
Mercer Torgau GmbH & Co. KG | Germany | Pallets, lumber, biofuels and energy production and sales |
Mercer Holz GmbH | Germany | Wood procurement and logistics |
Mercer Conway Inc. | Delaware,
U.S.A. | CLT and glulam production and sales |
We entered into the pulp business in 1994 by acquiring our Rosenthal mill and in 1999 converted it to the production of kraft pulp. We subsequently expanded our pulp operations by constructing the Stendal mill at a cost of approximately $1.1 billion in 2004 and acquired the Celgar mill in 2005 and the Peace River mill in 2018.
In 2017, we entered into the solid wood business when we acquired the Friesau mill. In 2021, we acquired the Mercer Spokane facility for approximately $51.3 million. In September 2022, we acquired all of the outstanding shares of the parent company of Mercer Torgau GmbH & Co. KG, the owner of the Torgau facility, for approximately $263.2 million, inclusive of working capital. In June 2023, we acquired the Mercer Conway facility and Mercer Okanagan facility from the Structurlam Group for approximately $82.1 million.
Corporate Strategy
Our corporate strategy is designed to, among other things, grow and expand our assets in our areas of expertise in the forest products industry in a sustainable manner. This includes organic growth through targeted capital expenditures focused on enhancing our existing assets, including to diversify our product offering and revenue sources, and acquisitions of complementary or additional assets, while maintaining the integrity of our balance sheet and liquidity. We strive to operate modern world class facilities with a high standard of environmental, social and governance performance.
The maintenance of modern, reliable and energy efficient operations is key to our ability to produce stable returns through the economic cycle. The markets for our principal products are cyclical and subject to global economic influences. Further, our manufacturing operations are capital intensive and complex. Maintaining a high standard of maintenance and strategic capital expenditure programs differentiates us from older, higher cost, lower efficiency competitors. We believe that over time this will reduce our exposure to product price volatility, unexpected downtime and changes in environmental and regulatory conditions.
We seek to have a balance sheet that allows us to advance our objectives through the full economic cycle, while at the same time, gives us the flexibility to take advantage of strategic growth opportunities as they arise. We maintain a foundation of long-term, unsecured, senior notes with expiry dates between 2028 and 2029. In addition to cash on hand, we have a series of revolving credit facilities intended to provide liquidity and flexibility in times of opportunity or economic slowdown.
In furtherance of this strategy, since 2021 we have completed a series of acquisitions that expanded and diversified our product mix in the solid wood segment, including the acquisition of the Mercer Spokane facility in 2021, the Torgau facility in 2022 and the Mercer Conway facility and the Mercer Okanagan facility in 2023. In particular, the acquisition of the Mercer Conway facility, along with its glulam production capabilities, positions us to capitalize on the growing market share of CLT and glulam in North American construction as customers seek more carbon-efficient building alternatives.
Pulp Industry
General
Pulp is used in the production of paper, tissues and paper-related products. Pulp is generally classified according to its fiber type, production process and degree of bleaching. Kraft pulp, a type of chemical pulp, is produced through a sulphate chemical process in which lignin, the component of wood which binds individual fibers, is dissolved in a chemical reaction. Chemically prepared pulp allows the wood’s fiber to retain its length and flexibility, resulting in stronger paper products. Kraft pulp can be bleached to increase its brightness. Softwood kraft pulp is noted for its strength, brightness and absorption properties and is used to produce a variety of products, including lightweight publication grades of paper, tissues and other paper-related products.
Bleached kraft pulp is comprised of either softwood kraft made from coniferous trees or hardwood kraft made from deciduous trees. Softwood species generally have long, flexible fibers which add strength to paper while fibers from species of hardwood contain shorter fibers which lend bulk and opacity.
We primarily produce and sell NBSK pulp manufactured using northern softwood, which is considered a premium grade because of its strength. It generally obtains the highest price relative to other kraft pulps. Our Peace River mill produces both NBSK and NBHK pulp.
Most paper users of market kraft pulp use a mix of softwood and hardwood grades to optimize production and product qualities. In 2024, market kraft pulp consumption was approximately 61% hardwood bleached kraft and 36% softwood bleached kraft, with the remainder comprised of unbleached pulp. Over the last several years, production of hardwood pulp, based on fast growing plantation fiber primarily from Asia and South America, has increased much more rapidly than that of softwood grades, because of longer growth cycles. Hardwood kraft generally has a cost advantage over softwood kraft as a result of lower fiber costs, higher wood yields and, for newer hardwood mills, economies of scale. As a result of this growth in supply and lower costs, kraft pulp customers have substituted some of the pulp content in their products to hardwood pulp.
However, the requirement for strength and formation characteristics in finished goods counters customers’ ability to substitute cheaper hardwood pulp for NBSK. Paper and tissue makers focus on larger paper machines with higher speeds and lower basis weights for certain papers which require the strength characteristics of softwood pulp. Additionally, where paper products are lightweight or specialty papers such as premium tissue or magazine paper, or where strength or absorbency are important, softwood kraft forms a significant proportion of the fiber used. As a result, we believe that the ability of kraft pulp users to further substitute hardwood for softwood pulp is limited by such requirements.
Kraft pulp can be made in different grades, with varying technical specifications, for different end uses. Softwood kraft pulp is an important ingredient for tissue manufacturing and tissue demand tends to increase with living standards in developing countries. Softwood kraft pulp is also valued for its reinforcing role in mechanical printing papers and is sought after by producers of paper for the publishing industry, primarily for magazines and advertising materials.
Markets
We believe that approximately 160 million ADMTs of chemical pulp are converted annually into tissues, printing and writing papers, carton boards and other specialty grades of paper and paperboard around the world. We also believe that approximately 43% of this pulp is sold on the open market as market pulp, while the remainder is produced for internal purposes by integrated paper and paperboard manufacturers.
The pulp business is highly cyclical in nature and markets are characterized by periods of supply and demand imbalance, which in turn affect prices. Pulp markets are highly competitive and are sensitive to cyclical changes in the global economy, industry capacity and foreign exchange rates, all of which can have a significant influence on selling prices and our operating results. The length and magnitude of industry cycles have varied over time but generally reflect changes in macroeconomic conditions and levels of industry
capacity. Pulp is a commodity that is generally available from other producers. As commodity products have few distinguishing qualities from producer to producer, competition is generally based upon price, which is primarily determined by supply relative to demand.
Between 2015 and 2024, overall worldwide demand for chemical market pulp grew at an average rate of approximately 2% annually, with worldwide demand for bleached softwood kraft market pulp generally flat over the same time period.
NBSK pulp demand is significantly impacted by global macroeconomic trends. Certain of such trends have had a positive effect on pulp demand while others have had a negative impact.
A major long-term macro trend has been the increase in demand from emerging markets, and in particular China. In China alone, tissue production capacity has increased by approximately 9.5 million ADMTs over the last five years. In China, imports of chemical softwood market pulp grew overall by approximately 5% per annum for the period from 2015 to 2024 and it is a key driver of pulp demand and consumption. We believe that emerging markets now account for approximately 59% of total global demand for bleached softwood kraft market pulp and China itself now accounts for approximately 33% of such global demand.
Two other macro trends positively affecting pulp demand have been the increase in usage and demand for tissue and hygiene products, particularly in China and emerging markets generally and the global reliance on online delivery of products which has increased demand for packaging and specialty products.
Two macroeconomic trends that have negatively impacted pulp demand are:
•the material decline in graphic and printing and writing paper demand in recent years, with a material portion of such decline not expected to return; and
•paper demand in the historically mature markets of North America, Europe and Japan has been declining or stagnating, which has resulted in Western Europe currently accounting for approximately 20% of global bleached softwood kraft market pulp demand compared to approximately 26% in 2015.
The trends and changes in NBSK pulp demand by end use are reflected in the following chart which compares worldwide NBSK pulp demand by end use for the periods indicated:
NBSK Pulp Demand by End Use
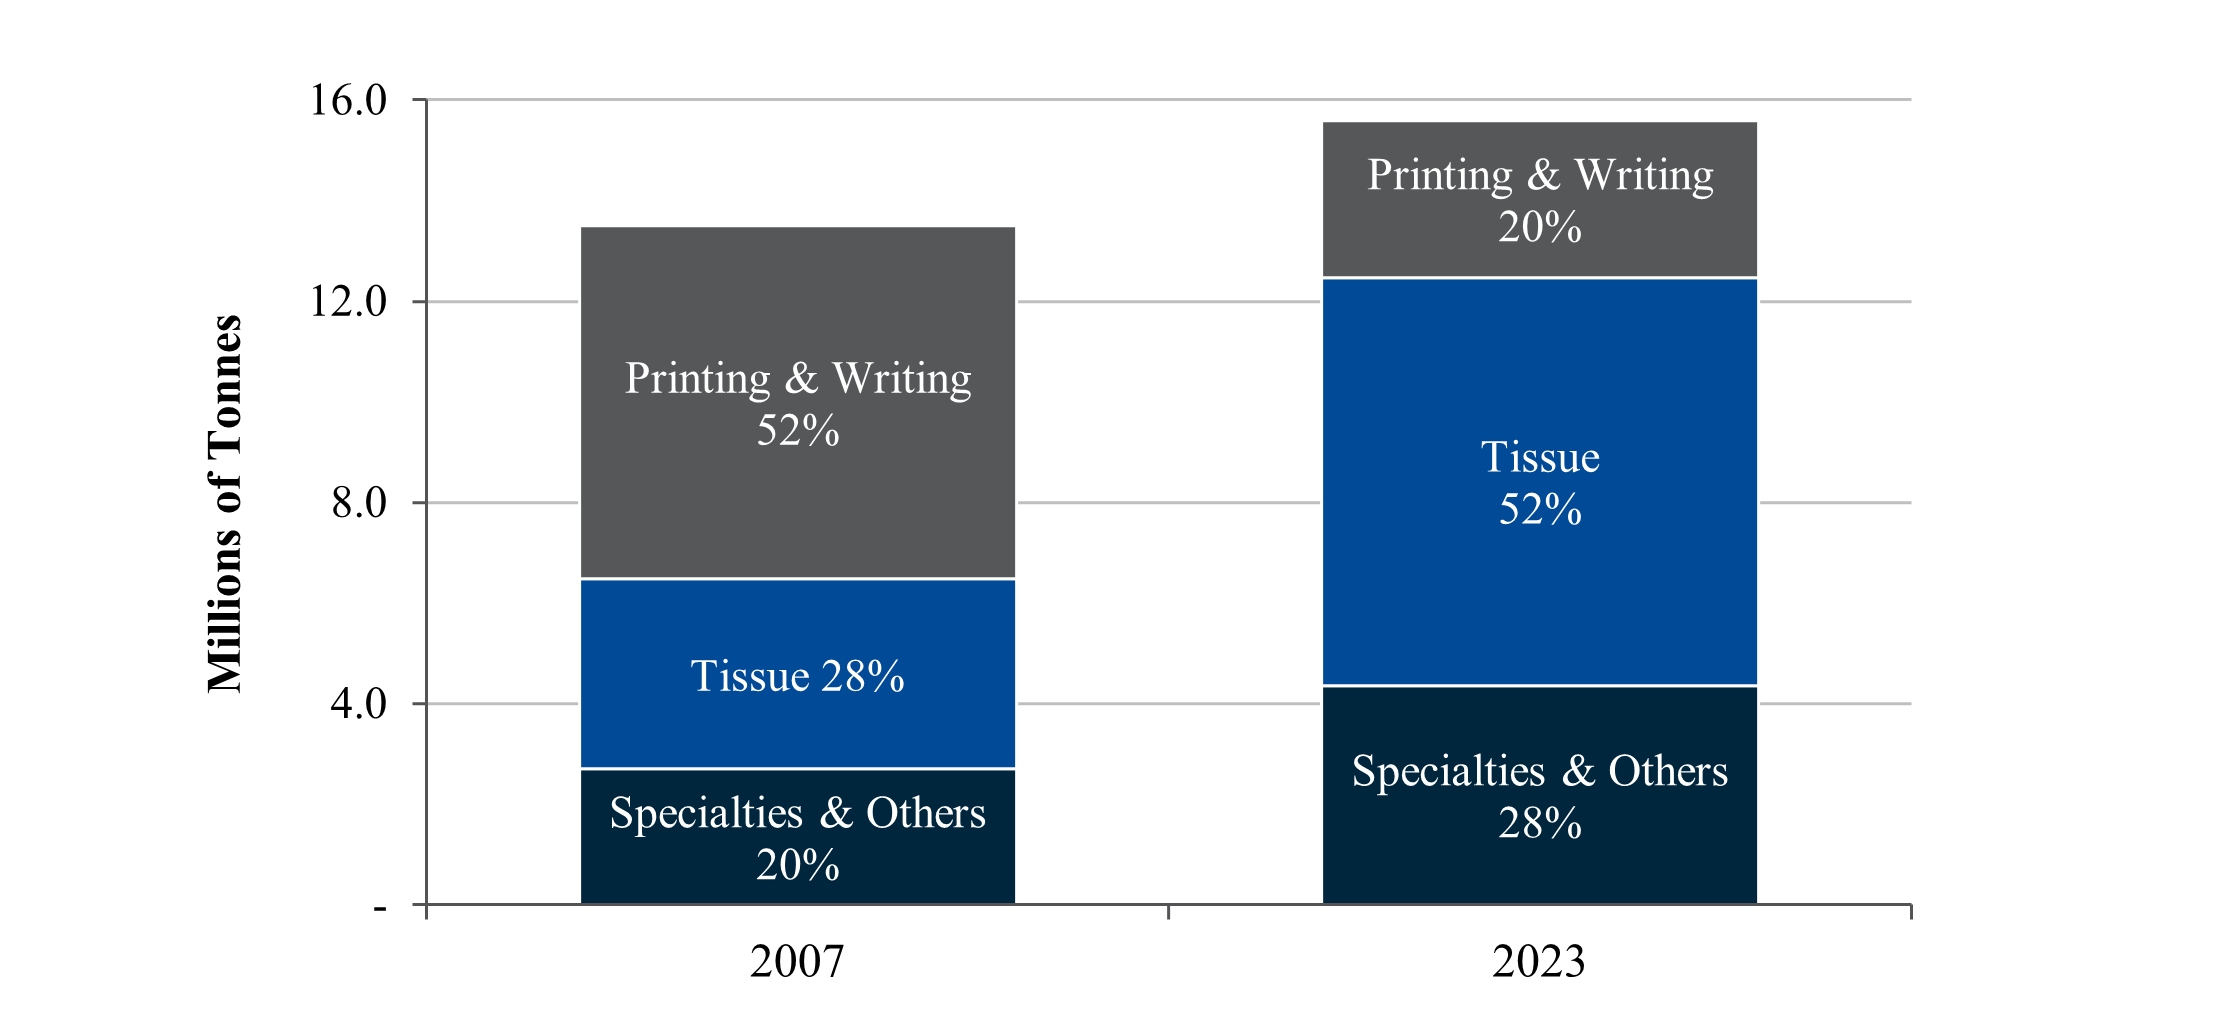
We believe 2024 NBSK demand by end use was generally consistent with the trend in the chart above.
Oversupply of our products can result from producers introducing new capacity in response to favorable pricing trends. In 2024, there was a net increase in pulp capacity of approximately 2.5 million ADMTs, primarily of hardwood kraft pulp. Currently, we are aware of approximately 0.4 million ADMTs of
announced net capacity increases primarily of softwood kraft pulp scheduled to come online in 2025.
NBSK Pulp Pricing
Kraft pulp is a globally traded commodity and prices are highly cyclical. Kraft pulp prices are generally quoted in dollars. Pricing is primarily influenced by the balance between supply and demand, as affected by global macroeconomic conditions, changes in consumption and capacity, the level of customer and producer inventories and fluctuations in exchange rates. Generally, we and other producers consider global NBSK pulp supply and demand to be evenly balanced when world inventory levels are at about 36 days’ supply.
As the majority of market NBSK pulp is produced and sold by Canadian and Northern European producers, while the price of NBSK pulp is generally quoted in dollars, pricing is often affected by fluctuations in the currency exchange rates for the dollar versus the euro and the Canadian dollar. As NBSK pulp producers generally incur costs in their local currency, while pulp is quoted in dollars, a dollar strengthening generally benefits producers’ businesses and operating margins. Conversely, a weakening of the dollar versus the local currency of producers generally adversely affects producers’ businesses and operating margins.
As a corollary to changes in exchange rates between the dollar and the euro and Canadian dollar, a stronger dollar generally increases costs to customers of NBSK pulp producers and results in downward pressure on prices. Conversely, a weakening dollar generally supports higher pulp pricing. However, there is invariably a time lag between changes in currency exchange rates and pulp prices. This lag can vary and is not predictable with any certainty.
Although China is now the largest market globally for pulp, Europe has also historically been a significant market. As NBSK pulp is a premium grade of pulp, the European market NBSK list price is at times used by the industry as a benchmark reference price. The third-party industry quoted average European list prices for NBSK pulp since 2015 have fluctuated between a low of approximately $790 per ADMT in 2016 and a high of $1,635 per ADMT in 2024.
Our pulp sales realizations in Europe and North America are based on third-party industry quoted list prices, net of customer discounts, rebates and other selling concessions. Our sales to China and Asia are generally based closer to third-party industry quoted prices, which are quoted on a net basis, inclusive of discounts, allowances, rebates and other selling concessions. As a result, our net sales realizations in China are generally similar to other markets. The following table sets out third-party industry quoted list prices (before discounts and rebates) for NBSK pulp in Europe and North America and net prices for NBSK pulp in China as of the dates indicated:
| | | | | | | | |
| | December 31, | |
| | 2024 | | | 2023 | |
| | ($/ADMT) | |
Europe (List Price) | | | 1,485 | | | | 1,300 | |
North America (List Price) | | | 1,675 | | | | 1,350 | |
China (Net Price) | | | 770 | | | | 730 | |
Seasonality
We are exposed to fluctuations in quarterly sales volumes and expenses due to seasonal factors. These factors are common in the kraft pulp industry. We generally have weaker pulp demand in China in the period relating to the lunar new year and in Europe during the summer holiday months. We typically have a seasonal build-up in raw material inventories in the early winter months as our mills build up their fiber supply for the winter when there is reduced availability.
Competition
The pulp market is highly fragmented and competitive with many producers competing globally. Producers ranging from small independent manufacturers to large integrated companies produce pulp worldwide. In recent years there has been a trend for industry consolidation and the creation of larger competitors. Pulp is generally a commodity product and our pulp competes with similar products manufactured and distributed
by many other producers. While many factors influence our competitive position, particularly in weak economic times, a primary factor is price. Other factors include quality, service, access to reasonably priced fiber and convenience of location. Some of our competitors are larger than we are in certain markets and have substantially greater financial resources. These resources may afford those competitors more purchasing power, increased financial flexibility, more capital resources for expansion and improvement and enable them to compete more effectively. Our key NBSK pulp competitors are principally located in Northern Europe and Canada and currently include Metsä Fibre, Södra Cell, Ilim, Domtar, UPM, SCA, Stora Enso and Canfor Pulp.
Solid Wood Industry
General
Our solid wood segment consists of the manufacture, sale and distribution of lumber, manufactured products (including CLT, glulam and finger joint lumber), wood pallets, electricity, biofuels and wood residuals from our sawmills and other facilities in Germany and North America.
Products and Markets
Our Friesau mill has two high-volume Linck sawlines and has the ability to produce both rough and planed products. The sawmill principally manufactures finished sawn lumber milled from spruce and pine, including European metric and specialty lumber, U.S. dimensional lumber and J-grade lumber, in various sizes and grades.
The Torgau facility is an integrated sawmill and value-add pallet production facility. The facility produces, among other products, lumber, wood pallets and biofuels. The lumber produced at the facility is used for, among other things, pallet production and also for dimensional lumber for the European, U.S. and Asian markets.
Demand for lumber is cyclical and influenced by factors that affect consumer confidence and drive demand for residential construction, such as interest rates, disposable income, unemployment rates, perceived job security and other indicators of general economic conditions. Demand is also affected by the availability of skilled construction trades and construction finishing products, transportation costs, exchange rates, government tariffs and the competitiveness of substitute products. Demand can vary from region to region within a country and seasonal factors that determine optimal building conditions can also affect demand.
The process for manufacturing lumber results in a significant percentage of each sawlog ending up as by-products or residuals such as wood chips, trim blocks, sawdust shavings and bark. Due to the close proximity of the German pulp mills to the Friesau mill and Torgau facility, we are able to achieve fiber utilization and fiber logistics synergies. By-products at the Friesau mill are typically used as fuel for our cogeneration power plant or sold to a wide variety of customers. In addition, we utilize a significant portion of the chips from the Friesau mill at our Rosenthal mill. At the Torgau facility sawmill residuals are used by our pulp mills or used to produce heating pellets and briquettes. Bark is used to generate electricity and thermal energy.
The main markets for our lumber products are in the United States and Europe. Our Friesau mill and Torgau facility lumber sales are to a diverse customer base. Customers include national and regional distributors, large construction firms, secondary manufacturers, retail yards and home centers.
Our Torgau facility also sells pallets and biofuels to a diverse customer base that is primarily located within a 185 mile range of the facility. The facility is one of the world’s largest producers of Euro-pallets, the standard European shipping pallet.
The Mercer Spokane facility, Mercer Conway facility and Mercer Okanagan facility produce CLT, a wood panel product, made from adhering layers of sawn lumber that is used as a more sustainable alternative to steel and concrete in building projects. We believe the facilities currently represent approximately 30% of North American CLT capacity. The facilities’ customers are mainly building contractors or property owners. The Mercer Conway facility and Mercer Okanagan facility are also able to produce glulam, a stress-rated,
engineered wood product comprised of wood laminations that are bonded together. It is commonly used for support structures such as columns, beams, floor-joints and trusses, offering a high degree of customization and pre-fabrication. The Mercer Spokane facility, Mercer Conway facility and Mercer Okanagan facility also produce finger joint lumber, a product which joins short pieces of wood together to form pieces of greater length.
Competition
The markets for our lumber products are highly competitive with many producers competing globally. Producers range from small independent mills to very large global producers, including integrated forest products companies. In recent years, there has been significant consolidation in the solid wood industry that has resulted in the creation of even larger global competitors. Producers compete generally on price, quality and service. With respect to lumber and certain solid wood products, these are commodities with few distinguishing features and producers primarily compete based on delivered price. Factors influencing our competitive position include, among others, the availability, quality and cost of raw materials, including fiber, energy and labor, the efficiency and productivity of our facilities and our ability to utilize or sell by-products from the lumber manufacturing process. The Friesau mill and Torgau facility lumber sales also compete in international markets subject to currency fluctuations and global business conditions. Our key competitors in the segment currently include West Fraser, Canfor, Interfor, Domtar, Weyerhaeuser, Binderholz, Stora Enso and Ilim.
The Torgau facility’s pallets compete with other European pallet producers. The German pallet market is dominated by wood pallet producers. Since most pallets are standardized, there is limited room for product differentiation, implying that logistical organization, production capacity, and the ability to meet just-in-time demand form regional competitive advantages.
Our mass timber facilities compete with other producers of CLT, glulam and alternative building materials such as concrete and steel. These building alternatives can be competitive on a cost basis, and have the added benefit of being in wide use for multiple years, as opposed to CLT and glulam which are relatively new in its North American adoption. These alternatives, however, lack the environmental attributes of CLT and glulam, in addition to its aesthetic appearance.
Generation and Sales of Green Energy and Chemicals
General
Our pulp mills are large scale bio-refineries that, in addition to pulp, also produce surplus “carbon neutral” or green energy. As part of the pulp production process, our mills generate green energy using carbon neutral biofuels such as black liquor and wood waste in a cogeneration process. Through the incineration of biofuels in the recovery and power boilers, our mills produce sufficient steam to cover all of our steam requirements and allow us to produce surplus electricity which we sell to third-party utilities or into the regional electricity market. As a result, we have benefited from green energy legislation, incentives and commercialization that have developed over the last decades in Europe and Canada along with strong electricity prices. In addition, in recent years we have applied considerable resources to increasing our capacity to produce and sell chemicals, primarily tall oil for use in numerous applications including biofuels.
Our Friesau mill and Torgau facility also generate and sell green energy produced from their biomass cogeneration power plants. Our surplus energy and chemical sales provide us with a stable revenue source unrelated to pulp or lumber prices. Since our energy and chemical production are by-products of our production processes, there are minimal incremental costs resulting in our surplus energy and chemical sales being highly profitable. We believe that this revenue source gives our mills a competitive advantage over other older mills which do not have the equipment or capacity to produce and/or sell surplus power and/or chemicals in a meaningful amount.
The following chart sets out our electricity generation and surplus electricity sales for the periods indicated:
Electricity Generation and Exports(1)
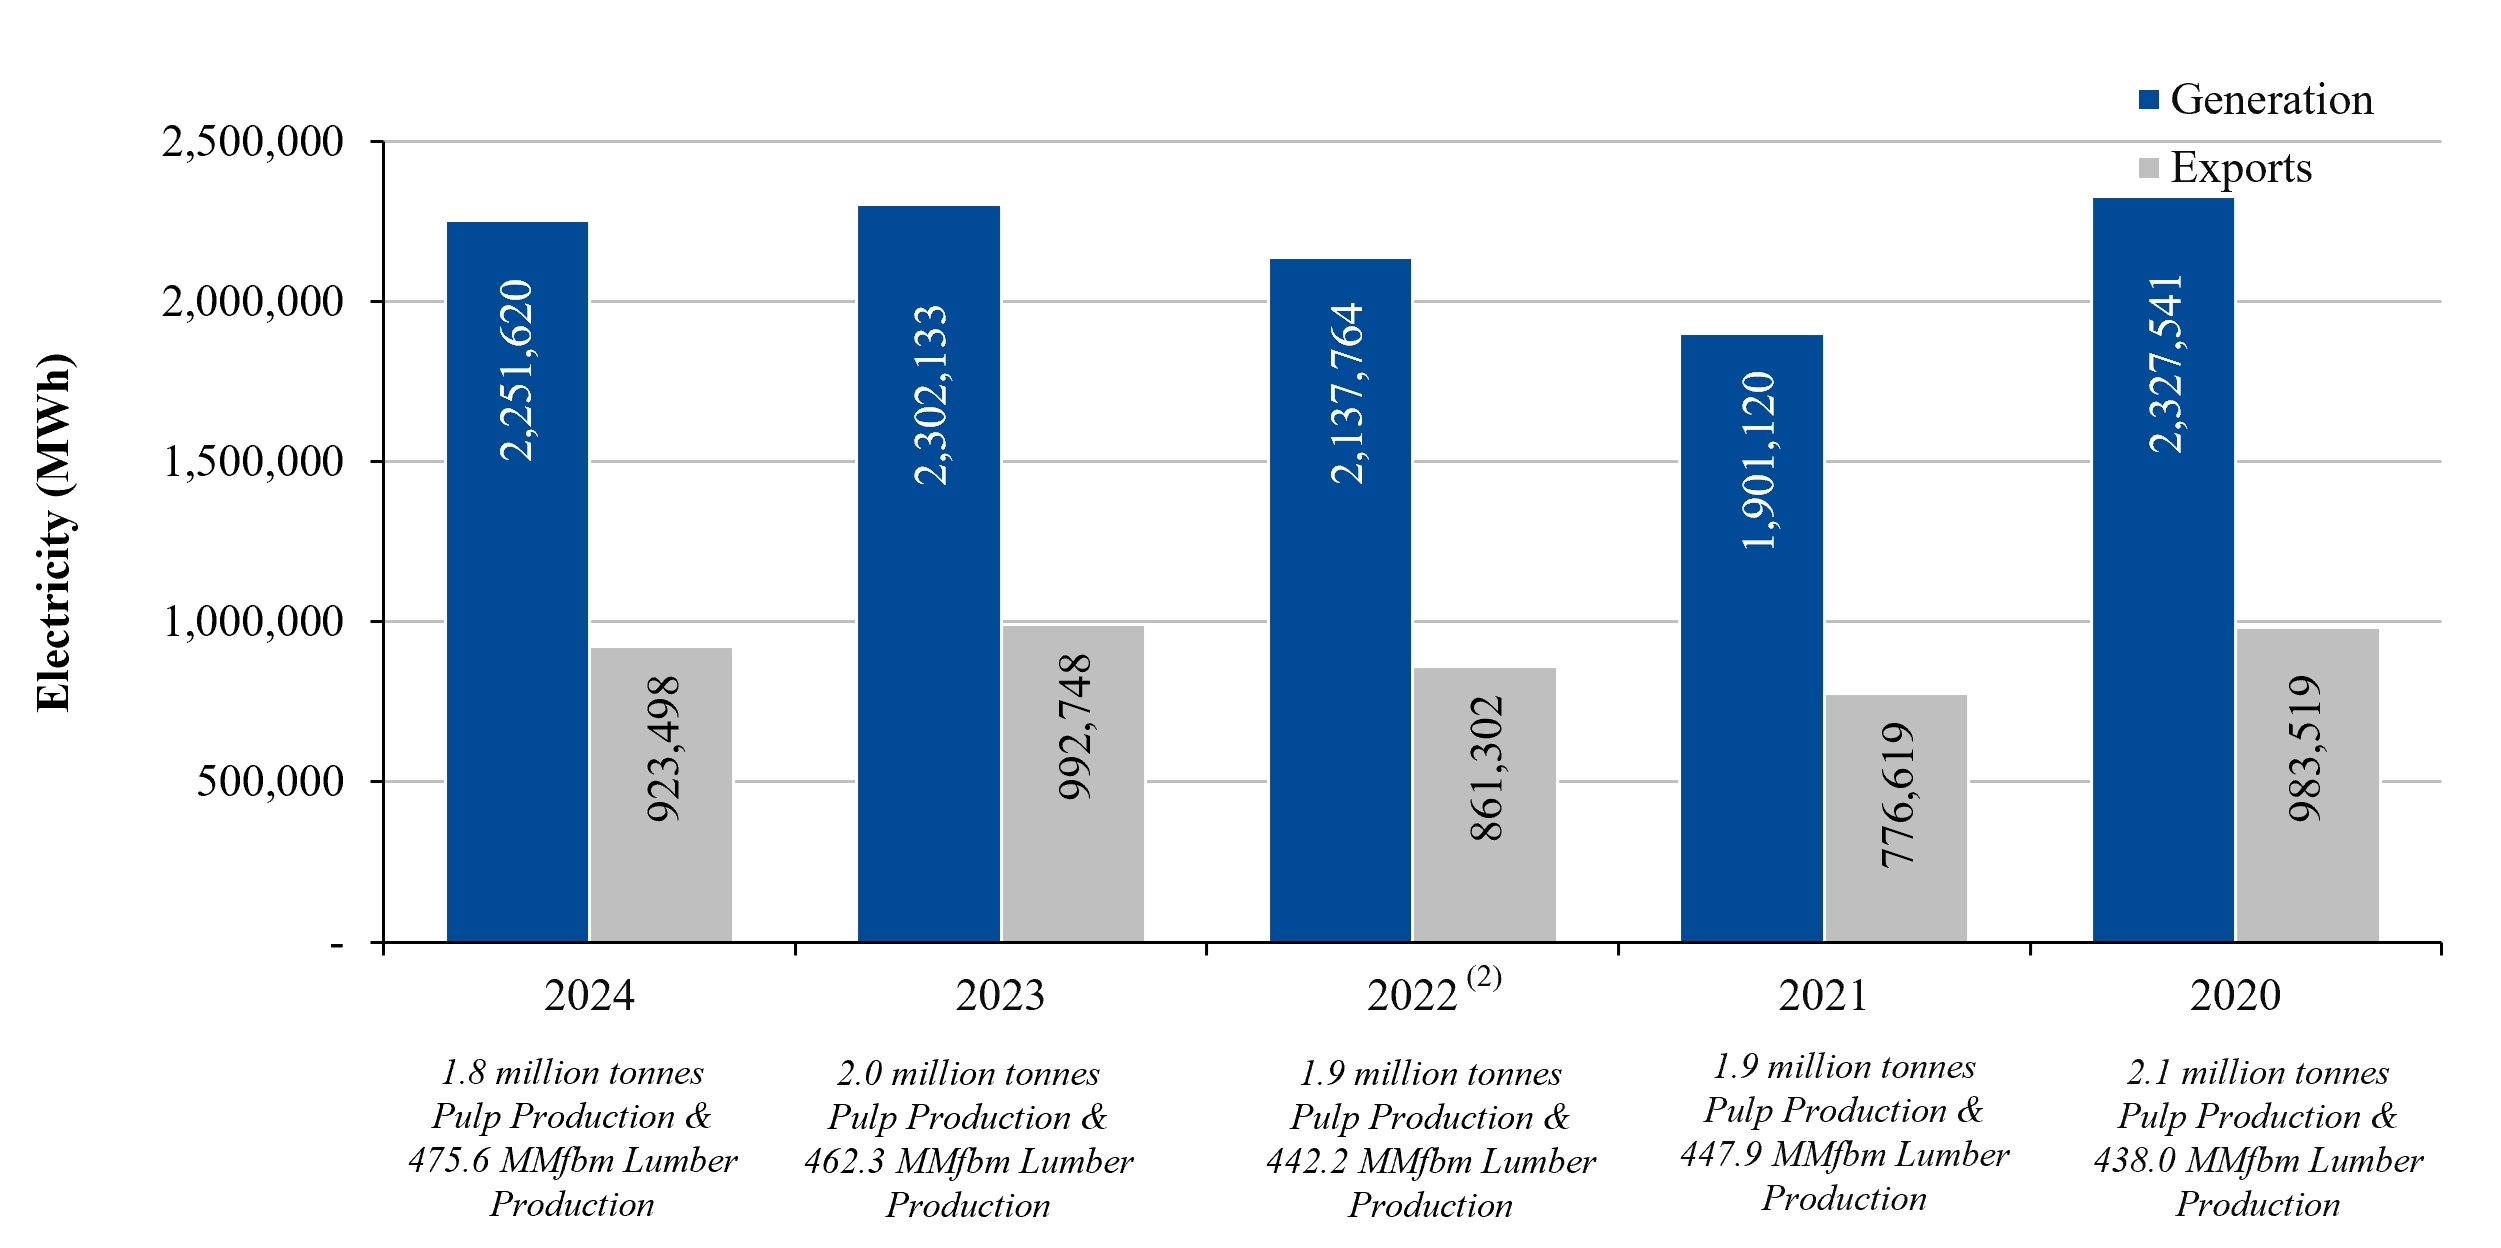
(1)Does not include our 50% joint venture interest in CPP, which was accounted for using the equity method. In March 2024, we disposed of this interest.
(2)Includes results of the Torgau facility since September 30, 2022.
The following chart sets out our consolidated revenues from electricity and chemical sales for the periods indicated:
Energy and Chemical Revenue(1)
(1)Does not include our 50% joint venture interest in CPP, which was accounted for using the equity method. In March 2024, we disposed of this interest.
(2)Includes results of the Torgau facility since September 30, 2022.
Germany
Certain of our German mills have the option to sell their surplus electricity at special tariffs under the Renewable Energy Act. The special tariffs expire in 2029 for our Friesau mill and between 2029 and 2034 for the four cogeneration power plants at our Torgau facility. The special tariff for our Stendal mill expired in December 2024.
In 2024, our Friesau mill and Torgau facility primarily sold energy at their special tariff rates which were generally higher than market prices. In 2024, our Stendal mill primarily sold energy at market prices, which were generally higher than the special tariff rate.
In 2024, energy sales at our German mills were approximately $78.1 million or 770,303 MWh.
In connection with our focus on the growing bio-energy market, we sell tall oil, a by-product of our pulp production process, which is used as both a chemical additive and as a green energy source. In 2024, we generated approximately $15.4 million from the sale of tall oil and other chemicals from our pulp segment.
Canada
Our Celgar mill is party to an electricity sales agreement with the provincial energy utility for a ten-year term that expires in October 2030. Pursuant to the agreement, the mill agreed to supply a maximum of approximately 127,000 MWh of surplus electrical energy annually to the utility.
Our Peace River mill sells its surplus electricity into the Alberta market at market prices.
In 2024, energy sales at our Canadian mills were approximately $11.1 million or 153,195 MWh.
Production Costs
Our major costs of production are fiber, labor, chemicals and energy.
Fiber
General
Fiber, comprised of wood chips and pulp logs, is our most significant operating expense for our pulp segment, representing about 55% of our pulp cash production costs in 2024. Further, fiber, in the form of sawlogs, represented about 75% of lumber cash production costs in 2024.
Given the significance of fiber to our total operating expenses and our limited ability to control its cost compared with our other operating costs, volatility in fiber costs can materially affect our margins and results of operations.
Our mills are situated in regions which generally provide a relatively stable supply of fiber. The fiber consumed by our pulp mills consists of wood chips produced by sawmills as a by-product of the sawmilling process and pulp logs. Wood chips are small pieces of wood used to make pulp and are either wood residuals from the sawmilling process or pulp logs chipped especially for this purpose. Pulp logs consist of lower quality logs not used in the production of lumber.
The Friesau mill and Torgau facility consume sawlogs and waste wood. The Mercer Spokane facility, Mercer Conway facility and Mercer Okanagan facility consume lumber. Sawlogs, waste wood and lumber are all cyclical in both price and supply.
Generally, the cost of wood chips, pulp logs and sawlogs is primarily affected by the supply and demand for lumber. Additionally, regional factors including harvesting levels, weather conditions and insect infestations can also have a material effect on the supply, demand and price for fiber.
While fiber costs and supply are subject to cyclical changes, we generally expect that we will be able to continue to obtain an adequate supply of fiber on reasonably satisfactory terms for our mills due to their locations and our long-term relationships with suppliers.
During the past few years, certain customers have endeavored to purchase pulp that is produced using fiber that meets certain recognized wood certification requirements from forest certification agencies like the Forest Stewardship Council (FSC), the Programme for the Endorsement of Forest Certification (PEFC), the Sustainable Forestry Initiative (SFI) and the Canadian Standards Association (CSA). If the fiber we purchase does not meet certain wood certifications required by customers, it may make it more difficult to, or prevent us from, selling our pulp to such customers. The chain of custody wood certification process is a voluntary process which allows a company to demonstrate that they use forest resources in accordance with strict principles and standards in the areas of sustainable forest management practices and environmental management. In an effort to procure wood only from sustainably managed sources, we employ an FSC Chain of Custody protocol and PEFC certification, which requires tracking of fiber origins and preparing risk based assessments regarding the region and operator. In the areas where we operate, we are actively engaged in the further development of certification processes. However, there is competition among private certification systems along with efforts by supporters to further these systems by having customers of forest products require products to be certified to their preferred system. Such wood certification standards continue to evolve and are not consistent from jurisdiction to jurisdiction or in how they are interpreted and applied. We currently do not expect certification requirements to have a material adverse impact on our fiber procurement and sales. However, if sufficient marketplace demand requires fiber to be sourced from standards that are inconsistent with those in our fiber supply regions, it could increase our operating costs and reduce available harvest levels.
Germany
With approximately 3.7 billion m3, Germany has the largest timber reserves in Europe. The principal species are spruce, pine, beech and oak. Many of the German forest areas have been certified according to PEFC or FSC standards.
We believe we are the largest consumer of wood chips and pulp logs in Germany and often provide the best long-term economic outlet for the sale of wood chips in Germany. We coordinate the wood procurement activities for our German mills to reduce overall personnel and administrative costs, provide greater purchasing power and coordinate buying and trading activities. This coordination and integration of fiber flows also allows us to optimize transportation costs, and the species and fiber mix for our mills. We are also party to joint wood purchasing arrangements with one of the largest wood consumers in Europe.
In 2024, our German pulp mills consumed an aggregate of approximately 5.1 million m3 of fiber. Approximately 61% was in the form of pulp logs and approximately 39% was in the form of sawmill wood chips.
In 2024, our pulp segment per unit fiber costs in Germany decreased compared to 2023 primarily due to softening demand in Germany from other wood consumers.
The core wood supply region for the Stendal mill includes most of Northeastern and Western Germany, primarily within an approximate 400 kilometer radius of the mill. We also purchase wood chips from Southwestern and Southern Germany as well as the Baltic Sea region. The fiber consumed by the Stendal mill consisted of approximately 52% spruce, 45% pine and 3% other species in 2024. The Stendal mill has sufficient chipping capacity to almost fully operate solely using pulp logs, if required. We source pulp logs from private and municipal forest owners and from state forest agencies. Our Stendal mill has historically also imported fiber from Poland and the Baltic Sea region.
Our Rosenthal mill sources wood chips from approximately 29 sawmills located primarily in the German states of Bavaria, Baden-Württemberg and Thuringia and primarily within a 300 kilometer radius of the Rosenthal mill. Within this radius, the Rosenthal mill is the largest consumer of wood chips. Given its location and size, the Rosenthal mill is often the best economic outlet for the sale of wood chips in the area. In 2024, approximately 90% of the fiber consumed by the Rosenthal mill was spruce and the remainder was pine.
Wood chips for the Rosenthal mill are normally sourced from sawmills under one-year contracts with quarterly adjustments for market pricing. Substantially all of our chip supply is sourced from suppliers with which we have long-standing relationships. Pulp logs are sourced from the state forest agencies in Thuringia, Saxony and Bavaria and from private and municipal forest owners. In addition, the Rosenthal mill buys relevant volumes via imports from the Czechia.
Our Friesau mill and Torgau facility are each dependent on the consistent supply of sawlog fiber. Our Friesau mill is located in an area where there is a significant amount of high-quality fiber within economic reach. The wood fiber requirements of the Friesau mill and Torgau facility are met primarily through open market purchases and contract purchases from state forestry agencies and private and municipal forest owners.
In Germany, over the last several years, the price and supply of wood chips has been affected from time to time by increasing demand from alternative or renewable energy producers and government initiatives for carbon neutral energy. In 2022 and early 2023, increasing energy prices as a result of energy supply shortages caused by the war in Ukraine increased the demand for wood chips and industrial logs for energy production.
Additionally, for several years leading to the first half of 2023, there was a material increase in the availability of harvestable wood as a result of beetle infestation of German forests. Generally, beetle-infested wood is harvested more rapidly so as to be useable before deterioration makes the wood unsuitable for its intended purposes.
While such beetle-infested wood increased fiber supply and led to lower prices in the short-term, such increased harvest levels can lead to challenges in maintaining a sustainable harvest level over the long-term and can lead to periods of reduced harvest levels in the future.
North America
In 2024, our Celgar and Peace River mills consumed approximately 4.2 million m3 of fiber. Approximately 55% of such fiber was in the form of sawmill wood chips and the remaining 45% came from pulp logs processed through their wood rooms or chipped by a third party. Our Canadian mills’ wood rooms are able to process about 47% of their fiber needs. The source of fiber at the mills is characterized by a mixture of species (aspen, spruce, douglas fir, hemlock, pine and cedar) and they source fiber from a number of Canadian and U.S. suppliers.
In British Columbia, a combination of high harvesting rates during a past beetle endemic, subsequent governmental initiatives to reduce harvest levels and weaker lumber prices in recent years resulted in lower sawlog availability and sawmill activity. This resulted in lower wood chip availability which increased fiber costs in British Columbia. However, in 2024, our Canadian pulp mills’ per unit fiber costs decreased compared to 2023, primarily due to the benefits from our wood room upgrades and generally stable supply.
The availability of fiber for our mills is in large part influenced by the strength of the lumber market. Lumber markets are primarily driven by U.S. housing starts, home renovation activities and, to a lesser degree, demand from China.
In 2024, our Canadian mills had access to approximately 25 different chip suppliers, most of whom are in Canada and, in the case of the Celgar mill, are also in the United States. Chips are purchased in Canada and the United States in accordance with chip purchase agreements. Generally, pricing is reviewed and adjusted periodically to reflect market conditions. The contracts for the Celgar mill are generally for one-year terms with quarterly adjustments or on three-month terms. The chip contracts for the Peace River mill are generally for three to five years with monthly adjustments indexed to the average pulp price.
To secure the volume of pulp logs required by its wood room and field chippers, the Celgar mill has entered into pulp log supply agreements. Such agreements can range from one-month to one-year terms, with a number of different suppliers, many of whom are also contract chip suppliers for the mill. All of the pulp log agreements can be terminated by the Celgar mill upon seven days’ written notice. The Celgar mill also bids on British Columbia timber sales from time to time.
Peace River holds two 20-year renewable governmental forest management agreements and three deciduous timber allocations in Alberta with an aggregate allowable annual cut of approximately 2.9 million m3 of hardwood, of which it currently harvests approximately 44%, and 375,000 m3 of softwood, which it sells or trades to sawmills surrounding the Peace River mill in exchange for wood chips. The forest management agreements were last renewed for a 20-year term expiring in 2029. While our Peace River mill can satisfy all of its hardwood fiber requirements from its forest management agreements and timber allocations, in order to optimize its fiber flow, it satisfies a small portion of its needs from third-party owned timberlands. Softwood fiber supply is from residual sawmill chips from local surrounding sawmills.
The Mercer Spokane facility, Mercer Conway facility and Mercer Okanagan facility primarily source lumber through open market purchases or short-term contracts with regional producers in the U.S. Pacific Northwest, Western Canada and the U.S. South.
Labor
Our labor costs have increased over time due to inflation in wages and health care costs.
Energy
Our energy is primarily generated from renewable carbon neutral sources, such as black liquor and wood waste. Our mills produce all of our electrical energy requirements and generate excess energy which we sell to third-party utilities and to regional electrical markets. We utilize fossil fuels, such as natural gas, primarily in our lime kilns and we use a limited amount for start-up and shut-down operations. Additionally, from time to time, mill process disruptions occur and we consume small quantities of purchased electricity and fossil fuels to maintain operations. As a result, all of our mills are subject to fluctuations in the prices for electricity and fossil fuels. Our per unit energy costs decreased in 2024.
Chemicals
Our pulp mills use certain chemicals which are generally available from several suppliers and sourcing is primarily based upon pricing and location. After a period of several years of increases in chemical costs, our per unit chemical costs decreased in 2024.
Sales, Marketing and Distribution
Our global sales and marketing group is responsible for conducting all sales and marketing of the pulp produced at our mills and currently has approximately 20 employees. This group largely handles all European and North American sales directly. Sales to Asia are made directly or through commission agents overseen by our sales group. The global sales and marketing group handles sales to approximately 250 customers. We coordinate and integrate the sales and marketing activities of our German mills to realize on a number of synergies between them. These include reduced overall administrative and personnel costs and coordinated selling, marketing and transportation activities. We also coordinate pulp sales across our mills on a global basis, thereby providing our larger customers with seamless service across all major geographies. In marketing our pulp, we seek to establish long-term relationships by providing a competitively priced, high-quality, consistent product and excellent service. In accordance with customary practice, we maintain long-standing relationships with our customers, pursuant to which we periodically reach agreements on specific volumes and prices.
Our solid wood segment sales are handled by our sales teams in Germany and Vancouver. We also sell lumber through commissioned agents in certain markets.
The following table sets out our pulp segment revenues by geographic area for the periods indicated:
| | | | | | | | |
| | Year Ended December 31, | |
| | 2024 | | | 2023 | |
| | (in thousands) | |
United States | | $ | 151,053 | | | $ | 123,818 | |
Germany | | | 334,361 | | | | 349,685 | |
China | | | 574,264 | | | | 551,945 | |
Other countries | | | 488,878 | | | | 490,682 | |
Total(1) | | $ | 1,548,556 | | | $ | 1,516,130 | |
(1)Excludes intercompany sales.
The following charts set out the geographic distribution of our pulp segment revenues as a percentage of our total pulp segment revenues for the periods indicated:
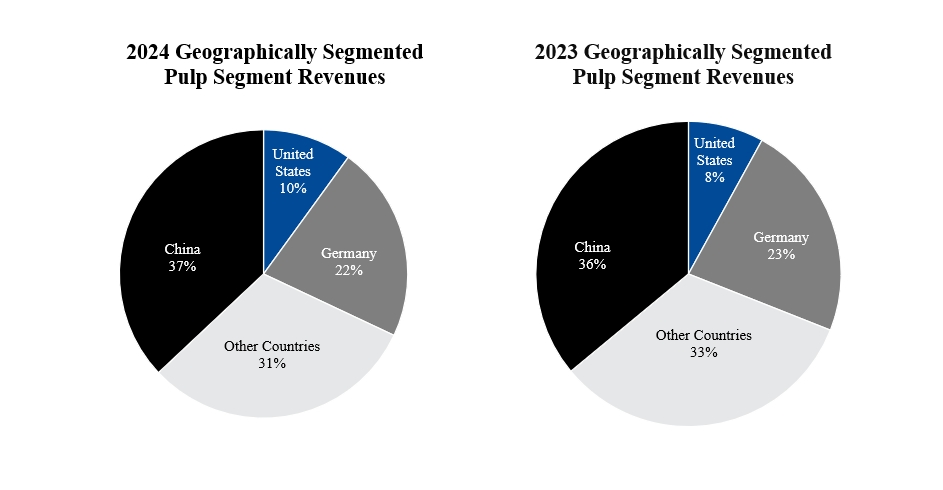
(1)Excludes intercompany sales.
The following table sets out the distribution of our pulp sales volumes by end use for the periods indicated:
| | | | | | | | |
| | Year Ended December 31, | |
| | 2024 | | | 2023 | |
| | (in thousands of ADMTs) | |
Tissue | | | 821 | | | | 778 | |
Specialty | | | 328 | | | | 333 | |
Printing & Writing | | | 708 | | | | 700 | |
Other | | | 43 | | | | 140 | |
Total | | | 1,900 | | | | 1,951 | |
The following table sets out our solid wood segment revenues by geographic area for the periods indicated:
| | | | | | | | |
| | Year Ended December 31, | |
| | 2024 | | | 2023 | |
| | (in thousands) | |
United States | | $ | 194,880 | | | $ | 169,883 | |
Germany | | | 195,867 | | | | 224,741 | |
Other countries | | | 95,244 | | | | 77,430 | |
Total(1) | | $ | 485,991 | | | $ | 472,054 | |
(1)Excludes intercompany sales.
The following charts set out the geographic distribution of our solid wood segment revenues as a percentage of our total solid wood segment revenues for the periods indicated:
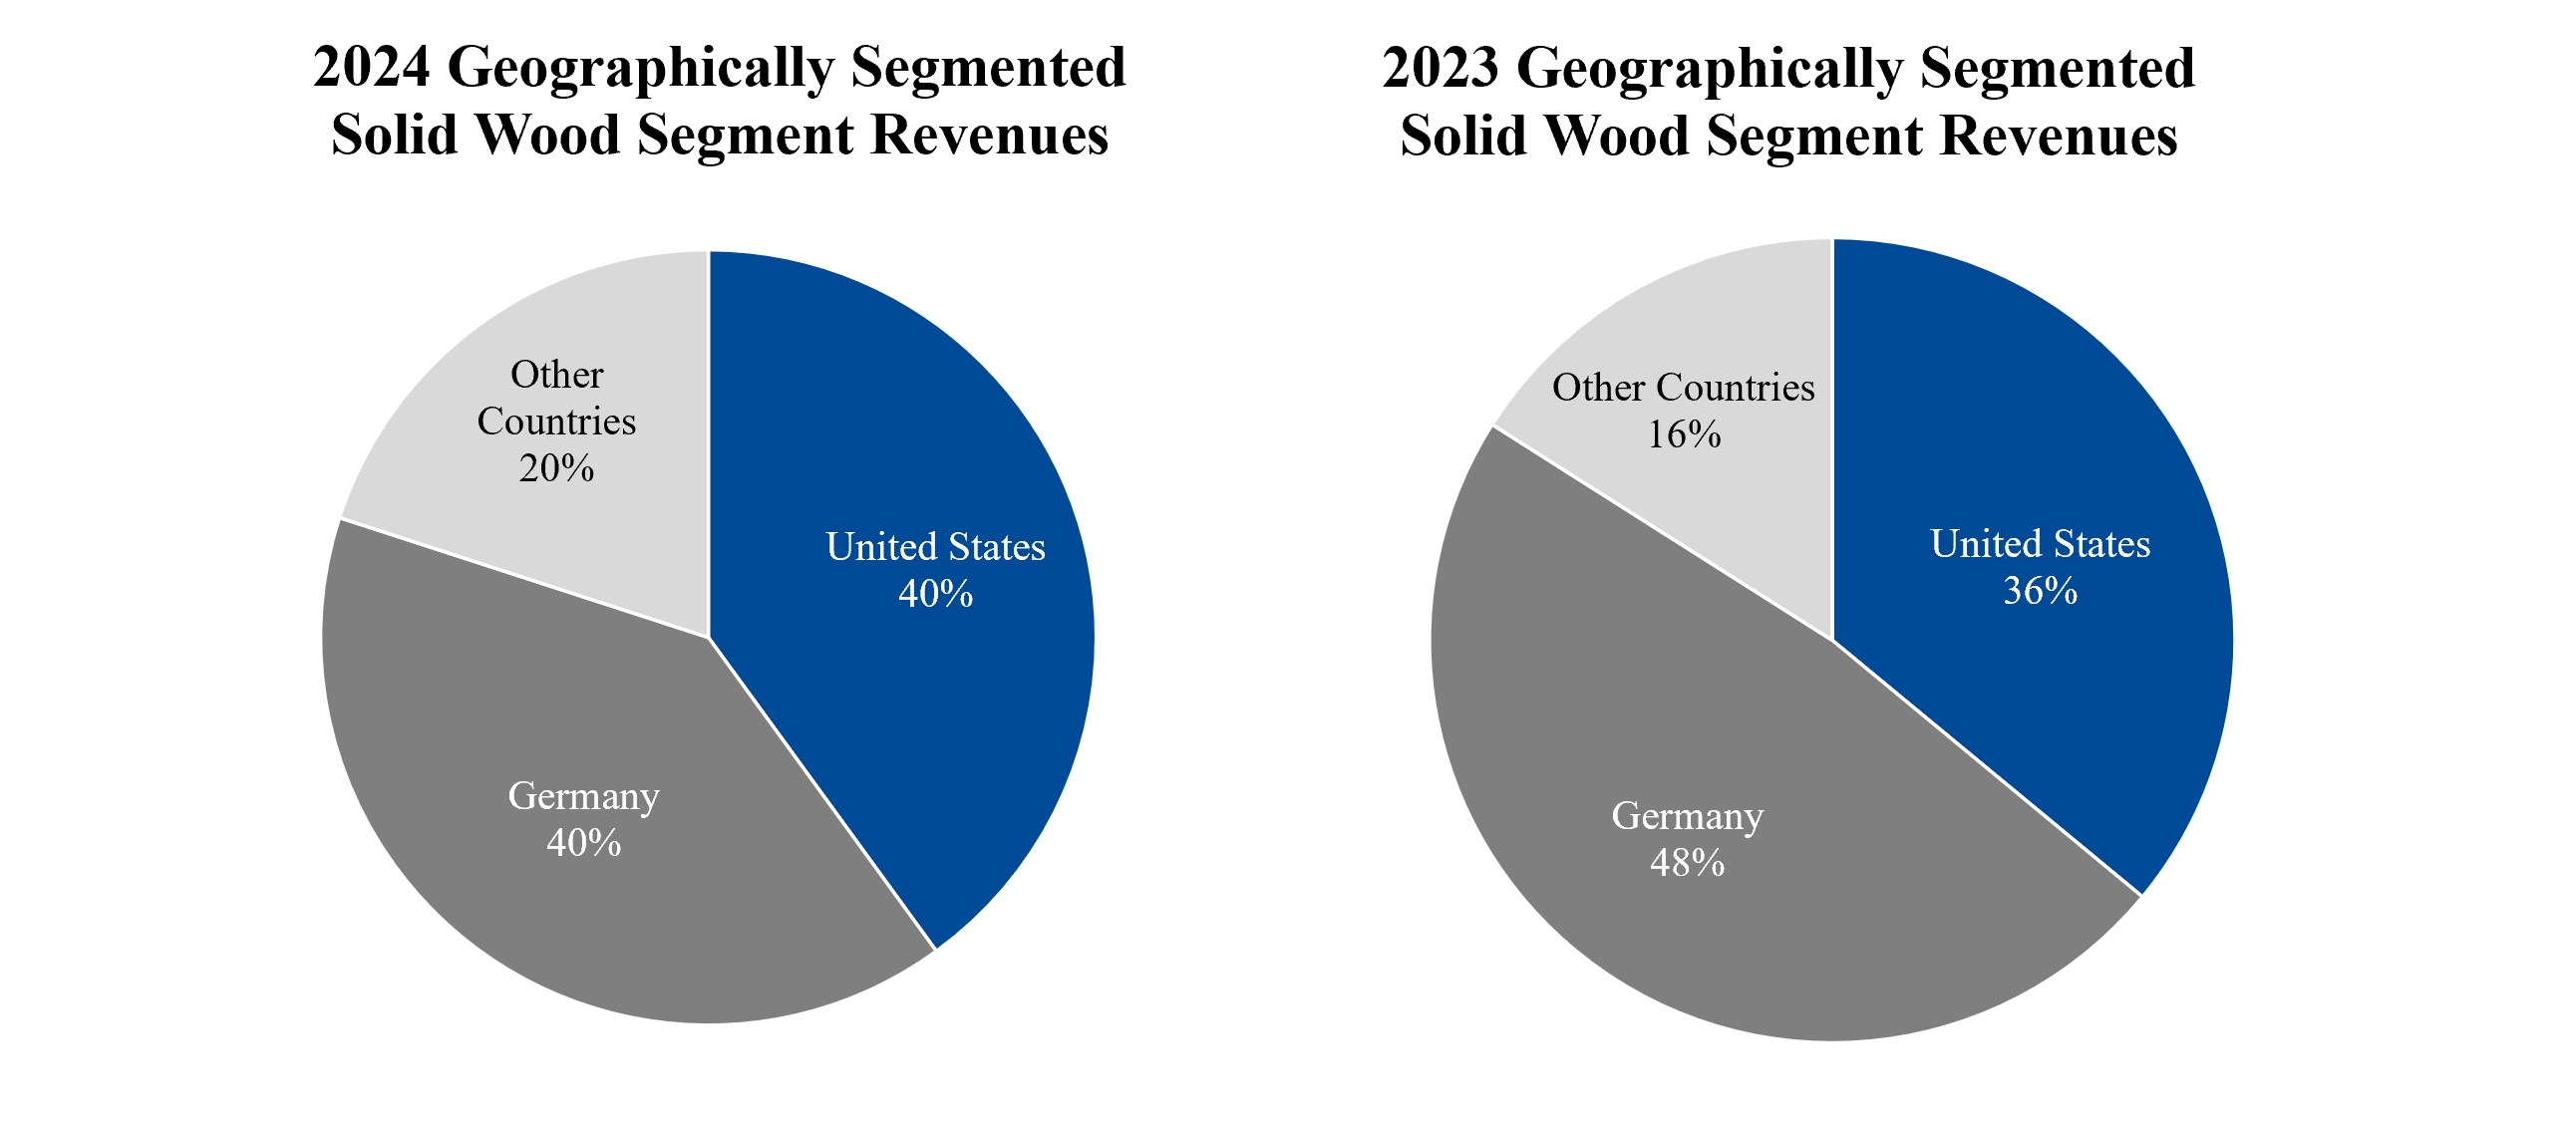
(1)Excludes intercompany sales.
Our pulp segment and solid wood segment sales are on customary industry terms. As of December 31, 2024, we had no material payment delinquencies. In 2024 and 2023, no customer accounted for 10% or more of our revenues. We do not believe our pulp segment or solid wood segment sales are dependent upon the activities of any single customer and the loss of any single customer would not have a material adverse effect on us.
Transportation
We transport our pulp and solid wood products generally by rail, ocean carrier and truck through third-party carriers. We have a small fleet of trucks in Germany that deliver some of our German mills’ pulp. In Germany, we also lease a significant number of railcars for inbound transport of fiber and outbound shipping of products.
Our German pulp mills are currently the only market kraft pulp producers in Germany, which is the largest import market for kraft pulp in Europe. We therefore have a competitive transportation cost advantage compared to Canadian and Northern European pulp producers when shipping to customers in Europe. Due to the location of our German mills, we are able to deliver pulp to many of our customers by rail and truck.
Our Canadian mills’ pulp is transported to customers by truck, rail and ocean carrier through third-party carriers. The majority of our Canadian mills’ pulp for overseas markets is initially delivered by rail to the Port of Vancouver for shipment overseas by ocean carrier. Based in Western Canada, our Canadian mills are well positioned to service Asian customers. The majority of our Canadian mills’ pulp for domestic markets is shipped by rail directly to the customer or to third-party warehouses in the United States. We also operate a logistics and reload center near Trail, British Columbia to provide us with additional warehouse space and greater transportation flexibility in terms of access to rail and trucking options.
The Friesau mill’s lumber is transported to customers by rail, ocean carrier and truck through third-party carriers.
The Torgau and mass timber facilities’ products are primarily transported by truck.
In both 2024 and 2023, outbound transportation costs comprised approximately 10% of each years' total consolidated costs and expenses.
Capital Expenditures
We have continued to make capital investments designed to increase pulp, green energy and chemical production, reduce costs and improve efficiency and environmental performance at our pulp mills. The improvements made over the years have increased the competitive position of our pulp mills. Since the acquisitions, we have also made capital investments to optimize sawmill production at the Friesau mill and Torgau facility.
The following table sets out the total capital expenditures by segment (excluding any related governmental grants) for the periods indicated:
| | | | | | | | | |
| | Year Ended December 31, | | |
| | 2024 | | | 2023 | | |
| | (in thousands) | | |
Pulp segment | | $ | 46,400 | | | $ | 90,126 | | (1) |
Solid wood segment | | | 37,732 | | | | 45,707 | | |
Total | | $ | 84,132 | | | $ | 135,833 | | |
(1)Includes expenditures to rebuild the wood chip conveying systems at the Stendal mill which were damaged by a fire in 2022. The rebuild was financed with insurance proceeds, of which $12.2 million was received in 2023.
In our pulp segment, capital investments at the Stendal mill in 2024 and 2023 primarily related to completing the rebuild of the wood chip conveying systems that were damaged by fire in 2022 and other maintenance projects.
Capital investments at the Rosenthal mill in 2024 primarily related to the purchase of a digester evaporator and maintenance projects. In 2023, capital investments at the Rosenthal mill primarily related to completion of the lignin plant and maintenance projects.
Capital investments at our Canadian pulp mills in 2024 primarily related to enhancements to soot blowers at the Peace River mill and for both mills, improvements to the wood rooms and maintenance projects. In 2023, capital investments at the Peace River and Celgar mills primarily related to wood room upgrades and maintenance projects.
In our solid wood segment, capital investments in 2024 at our Torgau facility primarily related to log yard improvements and sawing and planer machine upgrades. For the Friesau facility, capital investments in 2024 primarily related to sorter line upgrades and maintenance projects. For our mass timber facilities, capital investments in 2024 primarily related to production and sorter line upgrades. In 2023, capital investments primarily related to optimization projects, including sorter line upgrades at our Friesau mill and Mercer Spokane facility, log yard improvements at our Torgau facility and other maintenance projects.
Qualifying capital investments at industrial facilities in Germany that reduce pollutants in the effluent discharge can be used to offset wastewater fees that would otherwise be required to be paid. For more information about our environmental capital expenditures, see “– Environmental”.
In 2025, excluding amounts being financed through government grants, we currently expect our total capital expenditures to be approximately $100.0 million to $120.0 million, principally comprised of maintenance projects at our pulp mills and sawmills and optimization projects, including upgrades to the wood room at the Celgar mill, the digester evaporator at the Rosenthal mill, the sorter line at the Mercer Spokane facility and log yard improvements at both the Friesau facility and Torgau facility.
Innovation
We utilize our expertise with wood, its processing and by-products to expand our product mix. As a result, we seek to develop new products based on our expertise in wood processing and working with derivatives of the kraft pulping process. Currently these processes are focused on:
•the production and sale of CLT and glulam at our Mercer Spokane facility, Mercer Conway facility and Mercer Okanagan facility;
•the further refinement of materials contained in black liquor, the extractive chemical and lignin containing compounds that are a result of the kraft pulping process; and
•the further refinement of cellulose materials that are currently the basis of pulp.
We are working on some of these initiatives on our own, with others and in conjunction with industry associations or joint venture partners.
In an effort to further grow our chemical sales and bring additional value to our by-product stream, we invested in a pilot lignin plant at our Rosenthal mill. This plant will allow us to research the commercial opportunities of this product. Lignin has many potential uses in the manufacture of green alternative products such as adhesives and carbon black.
Environmental
Our operations are subject to a wide range of environmental laws and regulations, dealing primarily with:
•solid and hazardous waste management;
•remediation and contaminated sites; and
Compliance with these laws and regulations generally involves capital expenditures as well as additional operating costs. We cannot easily quantify the future amounts of capital expenditures we might have to make to comply with these laws and regulations or the effects on our operating costs because in some instances compliance standards have not been developed, have not become final or definitive or may be amended in the future. In addition, it is difficult to isolate the environmental component of most manufacturing capital projects.
We devote significant management and financial resources to comply with all applicable environmental laws and regulations. In particular, the operation of our plants is subject to permits, authorizations and approvals and we must comply with prescribed emission limits. Compliance with these requirements is monitored by local authorities and non-compliance may result in administrative orders, fines or closures of the non-compliant mill. Our total capital expenditures on environmental projects at our mills were approximately $3.9 million in 2024 and approximately $2.8 million in 2023. In 2025, capital expenditures for environmental projects are expected to be approximately $7.0 million.
Environmental responsibility is a priority for our operations. To ensure compliance with environmental laws and regulations, we regularly monitor emissions at our mills and periodically perform environmental audits of operational sites and procedures both with our internal personnel and outside consultants. These audits identify opportunities for improvement and allow us to take proactive measures at the mills as considered appropriate.
We believe we have obtained all required environmental permits, authorizations and approvals for our operations. We believe our operations are currently in material compliance with the requirements of all applicable environmental laws and regulations and our respective operating permits.
Under German state environmental rules relating to effluent discharges, industrial users are required to pay wastewater fees based upon the amount of pollutants they discharge in their effluent. These rules also provide that an industrial user who undertakes environmental capital expenditures and lowers certain effluent pollutants to prescribed levels may offset the amount of these expenditures against the wastewater fees that they would otherwise be required to pay. We expect capital investment programs and other environmental initiatives at our German mills will offset the wastewater fees that are payable if we demonstrate the reduced wastewater emissions and we believe they will ensure that our operations continue in substantial compliance with prescribed standards.
In Canada, in addition to existing provincial air quality regulations, an air quality management system, referred to as “AQMS”, outlines a comprehensive national approach for improving air quality in Canada. Under the AQMS, all levels of government are to work collaboratively to respond to different air quality challenges across the country. The AQMS includes four elements:
•Canadian Ambient Air Quality Standards (CAAQS), meant to drive local air quality improvements. They provide the basis for provincial territorial governments to determine the level of action needed.
•A framework for regional and local air quality management through air zones and regional airsheds.
•Base-level Industrial Emissions Requirements (BLIERs) for certain major industries.
•Improved intergovernmental collaboration to reduce emissions from the transportation sector.
In 2016, Environment Canada released the Pan-Canadian Framework on Clean Growth and Climate Change. The framework put in place a national, sector-based greenhouse gas reduction program applicable to a number of industries. In addition, various provincial governments, including British Columbia and Alberta, have introduced legislation and standards with the intention of reducing greenhouse gas emissions by, among other things, implementing greenhouse gas emissions benchmarks and reporting regulations, carbon taxes and carbon offsets.
In 2019, the Canadian federal government began phasing in a federal carbon tax pricing system which has two parts: a regulatory charge on fossil fuels like gasoline and natural gas (the “fuel charge”) and a performance-based system for industries (the output-based pricing system or “OBPS”). Under the OBPS, industrial emitters will be taxed at current rates on any emissions emitted above the performance standard or receive carbon credits if they are below the standard. As of January 1, 2025, the federal fuel charge applies to Ontario, Manitoba, Saskatchewan, Alberta, New Brunswick, Nova Scotia, Prince Edward Island and Newfoundland and Labrador, as well as the territories of Nunavut and the Yukon, while the OBPS applies to British Columbia, Manitoba and Prince Edward Island, as well as the territories of Nunavut and the Yukon.
We believe that these water and air emission measures in Germany and Canada have not had, and in 2025 will not have, a significant effect on our operations. Although these measures could have a material adverse effect on our operations in the future, we expect that we will not be disproportionately affected by these measures as compared with owners of comparable operations. We also expect that these measures will not significantly disrupt our planned operations.
Future regulations or permits may place lower limits on allowable types of emissions, including air, water, waste and hazardous materials, and may increase the financial consequences of maintaining compliance with environmental laws and regulations or conducting remediation. Our ongoing monitoring and policies have enabled us to develop and implement effective measures to maintain emissions in substantial compliance with environmental laws and regulations to date in a cost-effective manner. However, there can be no assurance that this will be the case in the future.
Climate Change
Changing weather patterns and climatic conditions due to natural and man-made causes have added to the unpredictability and frequency of natural disasters, such as hurricanes, wildfires and wind, rain, hail, snow and ice storms. Such changes and resulting conditions can adversely affect our operations, including as a result of variations in the cost and availability of raw materials, such as fiber, unplanned downtime, changes in operating rates and disruptions in transportation and logistics.
As there is uncertainty about the severity, extent and speed at which climate change is occurring, we are unable to identify and predict all of the consequences of climate change and the timing of the same on our business and operations.
The actual and perceived effects of climate change and social and governmental responses have created both
opportunities and negative consequences for our business.
The focus on climate change has generated a substantial increase in demand and in legislative requirements for carbon neutral or green energy. Pulp mills consume wood residuals, being wood chips and pulp logs, as the base raw material for their production process. Wood chips are residuals left over from lumber production and pulp logs are generally lower quality logs left over from logging that are unsuitable for the production of lumber. Sawmills consume sawlogs and produce residuals, like wood chips, which are generally sold to other industrial consumers like pulp and pellet producers.
As part of their production process, our pulp mills take wood residuals and process them through a digester where cellulose is separated from the wood to be used in pulp production and the remaining residuals, called black liquor, are used for green energy production. As a result of their use of wood residuals and because our mills generate combined heat and power in a process known as cogeneration, they are efficient producers of energy. Our Friesau mill and Torgau facility utilize residual bark and shavings from consumed logs to produce energy. This energy is carbon neutral and produced from a renewable source. Our relatively modern mills generate a substantial amount of energy that is surplus to their operational requirements.
These factors, along with governmental initiatives in respect of renewable or green energy legislation, have provided business opportunities for us to enhance our generation and sales of green energy to regional utilities.
We are constantly exploring other initiatives to enhance our generation and sales of surplus green energy and chemical by-products. Other potential opportunities that may result from climate change include:
•greater demand for sustainable energy and cellulosic biomass fuels;
•the expansion of softwood forests and increased growth rates for such forests;
•more intensive forestry practices and timber salvaging versus harvesting standing timber;
•additional governmental incentives or requirements to enhance biomass energy production; and
•additional social or investor focus or demand for biomass, green energy or sustainability initiatives.
Additionally, increased focus on climate change at the governmental level has generally led to increased demand in alternative building solutions such as CLT and glulam.
Historically, the principal driver behind reducing the effects of climate change and moving to a carbon neutral economy primarily resulted from initiatives from governmental or international bodies, including the United Nations and international treaties amongst various countries. However, over the last few years, there has been a significant push and focus on climate change and carbon reduction by private institutions including, among others, institutional investors, ratings agencies, shareholders, communities, other stakeholders and the public generally. This has resulted in, among other things, a significant amount of capital being provided for green or carbon neutral initiatives, on favorable terms, some of which are referred to as “green bonds”. The demand for renewable energy services has been further increased as a result of the war in Ukraine.
We cannot currently predict which, if any, of these potential opportunities will be realized by us or their economic effect on our business.
While not all of the specific consequences to our business from climate change are predictable, one of the most significant adverse consequences is that the focus on renewable energy has created greater demand and competition for wood residuals or fiber from renewable energy producers like the pellet industry in Germany.
In Europe, the price and supply of wood residuals has been periodically affected by an increasing demand from alternative or renewable energy producers and governmental initiatives for carbon neutral energy. In 2022 and early 2023, there was increasing demand for wood residuals and lower quality industrial logs from energy and heating pellet manufacturers as a result of energy shortages caused by the war in Ukraine.
Additionally, the growing interest and focus in British Columbia on renewable green energy has created additional competition for such fiber. Such additional demand for wood residuals may increase the competition and prices for wood residuals used by our mills over time.
In response to climate change risks, there have been governmental initiatives and legislation on the international, national, state and local levels. Such governmental action or legislation can have an important effect on the demand and prices for fiber. As governments pursue green energy initiatives, they risk creating incentives and demand for wood residuals from renewable energy producers that “cannibalizes” or adversely affects traditional users, such as lumber and pulp and paper producers. We are continually engaged in dialogue with governments to educate and try to ensure potential initiatives recognize the traditional and continuing role of our mills in the overall usage of forestry resources and the economies of local communities.
Other potential negative consequences from climate change that can affect our business include:
•a greater susceptibility of northern forests to disease, fire and insect infestation, which could negatively impact fiber availability;
•the disruption of transportation systems and power supply lines due to more severe storms;
•the loss of fresh water transportation for logs and pulp due to lower water levels;
•decreases in the quantity and quality of processed water for our mills’ operations;
•the loss of northern forests in areas in sufficient proximity to our mills to competitively acquire fiber; and
•lower harvest levels decreasing the supply of harvestable timber and, as a consequence, wood residuals.
Well-publicized events have been attributed at least in part to climate change, including a beetle infestation that has damaged significant amounts of forest lands and harvestable timber in Western Canada and Germany. Beetle infestation of forest lands has both short-term and long-term consequences for our business. In the short-term, there is often a material increase in harvest levels of infested forests as parties seek to utilize such wood before it deteriorates too much to be useable for its intended purposes. As a result, there can be a material increase in fiber availability and lower fiber prices resulting both from such increased supply and the lower quality of such infested fiber. However, infestation and increased harvest levels resulting therefrom can create over-harvesting and challenges for maintaining sustainable harvest levels over the long-term and can result in lower harvest levels in future periods.
Changes in climate conditions have also been attributed at least in part to increasingly frequent and severe wildfires in the interior of Western Canada and portions of the Western United States and Europe. We cannot currently predict whether such climate-affected conditions will continue, or the frequency or severity of the same in the future.
Human Capital
We believe the strength of our workforce is one of the significant contributors to our success as a global company. All our employees contribute to our success and help us drive strong financial performance. Attracting, developing and retaining global talent with the right skills to drive our business is central to our purpose, mission and long-term growth strategy.
As of December 31, 2024, we employ approximately 3,580 people, of which approximately 2,345 of whom work in our German operations, approximately 1,050 of whom work in our Canadian operations and approximately 160 of whom work in our U.S. operations. Our pulp segment employs approximately 1,900 people and our solid wood segment employs approximately 1,565 people. The majority of our employees in both segments are bound by collective agreements. We consider the relationships with our employees and the unions and works councils which represent them to be good. Collaborative labor management relations are fundamental to our operations. Accordingly, we recognize and work cooperatively with the unions and works councils to ensure we build and maintain superior working conditions, a supportive work environment, training and growth opportunities and fair compensation and benefits packages.
We employ a collaborative group of skilled, dedicated, resourceful and innovative individuals who support our core purpose and reflect our values every day. Investment in our people drives our excellence and accordingly, we are committed to attracting, retaining and developing quality personnel. By the nature of the industries in which we operate, many of our employees are professionals who require specialized knowledge and skills and include various categories of engineers and licensed trade persons and equipment operators. Our senior managers and directors have extensive experience in the forest products industry, and we have experienced managers at all of our mills. Our management has a proven track record of implementing new initiatives and capital projects in order to increase production and efficiency, improve safety, reduce costs and harness new revenue opportunities.
We aim to support our employees with a competitive compensation package, fulfilling career opportunities and a balanced and secure future accompanied by time away from work. All of our employees receive competitive benefits packages that provide pension, medical, dental, and vision care benefits. Employees are also able to access specialized assistance such as physiotherapy and counseling services. We offer a diversity of training activities and programs to help our people grow and be more effective in their current and future roles.
We conduct confidential engagement surveys of our workforce that are administered and analyzed by an independent third party. The aggregate survey results are reviewed by executive officers and the board of directors. We create action plans at global, operational and managerial levels. By acting on results both at an aggregate enterprise level and an operational level, we believe we have been able to enhance our culture and improve our overall engagement.
Maintaining a robust pipeline of talent is crucial to our ongoing success and is a key aspect of succession planning efforts across the organization. Our leadership and human resources teams are responsible for attracting and retaining top talent by facilitating an environment where employees feel supported and encouraged in their professional and personal development. Specifically, we promote employee development by reviewing strategic positions regularly and identifying potential internal candidates to fill those roles, evaluating job skill sets to identify competency gaps and creating developmental plans to facilitate employee professional growth. We invest in our employees through training and development programs, on the job experiences and coaching. We provide technical, managerial and leadership programs across the organization that enable colleagues to grow skills and capabilities to become more successful. We also have dedicated talent development programs that support and accelerate leadership development and strengthen our succession plans. Additionally, we understand the importance of maintaining competitive compensation, benefits and appropriate training that provides growth, opportunities and multiple career paths for our employees.
Health and Safety
Safety is a core value of our company. The industries in which we operate have their own particular set of risks including hazards from our complex industrial manufacturing facilities such as manufacturing processes, mobile equipment, heavy and complex equipment, high-pressure boilers, energy production, and the use and recovery of chemicals. Accordingly, there is no initiative that attracts a higher degree of focus for our management team than our “Road to Zero” health and safety program, which is a company-wide initiative designed to create healthy, safe and productive work environments with a goal of zero workplace incidents.
We have developed tools to analyze potential and incurred incidents and we have resources to develop prevention initiatives. In particular, we focus on modeling responses to eliminate the risk, where possible, by using the “hierarchy of controls” adopted by many of the world’s leading health and safety organizations. Our priority is the elimination of hazards, followed by safe administrative practices and appropriate personal protective equipment. We identify, monitor, educate, and take a data-driven approach to drive workplace safety improvements. Many of our programs revolve around education, hazard identification, and risk mitigation strategies. These proactive initiatives bring safety to the forefront of our work practices. Our teams of safety professionals are dedicated to finding and utilizing the right tools to prevent all workplace injuries. The Senior Safety Leadership Committee, referred to as the “SSLC”, provides governance and high-level support to the programs. The SSLC meets on a regular basis to review performance, learn from experience
and share best practices. Our team of safety professionals are dedicated to supporting line management and embedded safety committees who lead safety on a daily basis. We analyze all incidents carefully and adjust our prevention efforts accordingly.
Diversity, Equity and Inclusion
We believe that a culture of diversity and inclusion is critical in making the best decisions for our people and achieving sustainable business success. While gender is only one aspect under diversity, a number of our top management positions were and continue to be held by women. We continue to effect changes to our recruiting and training processes to make our workplaces even more reflective of the diversity that exists in our communities. We believe that making our workplace more equal and inclusive will make us a stronger, more resilient and more sustainable business over the long-term.
We have adopted an enterprise-wide diversity management program. Its goal is to respond to the particular conditions at each of our operations to develop diversity within our teams. One of the first objectives of the program has been to enhance equal opportunities for women in our business. This is a key goal, not just to improve diversity but also to address demographic changes and potential shortages of skilled workers in the future by inspiring more women to take up technical positions in our industry.
Currently, women comprise 30% of our board of directors, about 25% of our 100 senior management positions and about 20% of our total workforce. Our goal is to improve our recruitment of women so that they comprise 25% of our new hires by 2030.
In Canada, our operations work closely and partner with regional First Nations groups to foster mutually beneficial economic activities and relationships. We are party to a logging joint venture with one First Nations group and are working to expand the scope and size of the business and to include other regional groups. We are also pursuing additional joint business or venture opportunities with First Nations groups. Additionally, we have programs to provide training and job skills to regional First Nations groups.
We have an extensive apprenticeship program and outreach events for prospective employees. We believe that these programs and events, among other things, help us to reach out and attract new employees, including more female employees who perhaps in the past had not considered technical or operating employment opportunities at our mills or the forest products industry generally.
We do not employ nor do we contract with any parties that employ people who are subjected to unsafe conditions. The majority of our employees are part of a union or are represented by a works council with whom we have worked to design conditions that are safe from harassment and discrimination. In addition, as a supportive workplace, we do our best to accommodate the distinct circumstances of our employees that may require modified workplaces. We have also adopted a written Code of Business Conduct and Ethics and other corporate policies to support a corporate culture which, among other things, promotes a work environment that prohibits intimidation and harassment and encourages and promotes diversity and inclusion.
We make donations to community groups and charitable organizations in the communities in which we operate and live. We believe this commitment and engagement with local communities helps us to attract and retain employees and enhances our social license in such communities.
Commitment to Sustainability
We manage and operate our business, including the natural resources under our care or direction, with a long-term view and focus on sustainability. We believe by doing so we will be able to deliver value to our customers, employees, shareholders, communities and other stakeholders. We strive to maintain the highest environmental, social and governance standards. We believe that by caring for the health and safety of our workers, maintaining the environmental quality of our operations and being part of and actively engaged in the communities in which we operate, we enhance the value for all of our various stakeholders and our social license to operate. We work to build all of these values and goals into our corporate culture or what we refer
to as the “Mercer Way”. We believe that focusing on sustainability as a key driver in all of our operations and business will enhance our decision-making, our success and our relationships with our various stakeholders and communities in which we operate. We believe all of the foregoing elements are inter-connected and are vital to our long-term future, success and sustainability.
We focus significant attention on minimizing our environmental impact with the goal of reducing the environmental footprint of our existing operations to make them sustainable over the long-term, to ensure we have a social license to operate and to offset or reduce the impact of our operations. We endeavor to adapt to emerging trends, support new technologies and foster environmental stewardship in the areas in which we operate. We are signatory to the United Nations Global Compact that helps align our endeavors with the United Nations Sustainable Development Goals, internationally recognized Responsible Business Principles, and other key environmental standards in the areas of low carbon transition, water stewardship, waste, sustainable forestry, air emissions, circularity, responsible sourcing and biodiversity.
As part of our commitment and focus on sustainability, we have, among other things:
•increased our focus on sustainability including improved management, goal setting and tracking capabilities that will be communicated with stakeholders to ensure proper acknowledgment of our sustainability accomplishments and initiatives;
•commenced a double materiality assessment to further understand both the topics that are important for our stakeholders as well as those material to our business;
•commenced developing a Climate Transition Plan to align our business strategy and model to reduce greenhouse gas emissions (GHG) in line with a 1.5 degree pathway and net zero carbon future by 2050. As part of aligning to a 1.5 degree pathway, we raised our scope 1 GHG emissions intensity reduction target from 35% to 50%;
•updated our 2030 corporate sustainability targets, including safety, water, forest certification and mass timber-related targets to align with the growth of our business;
•incorporated further sustainability considerations into our governance process to ensure our strategic investments are aligned with our evolving sustainability goals;
•adopted a third-party technology solution to further enhance our compliance with relevant supply chain due diligence regulations and requirements;
•conducted our third climate change scenario analysis that evaluated the risks and opportunities of climate change as part of our adoption of the Task Force on Climate-related Financial Disclosure recommendations. We evaluated our business resilience to the climate change scenarios model that were developed by the Network for Greening the Financial System with extensive input from the climate community, and augmented with industry trends and climate projections. The scenarios were analyzed to identify and assess the potential impacts of climate change-related risks and opportunities on the Company;
•participated in a three-month Climate Ambition Accelerator program through our membership with the United Nations Global Compact, further aligning our business strategy with the United Nations Sustainable Development Goals and strengthening our network with the international sustainability community;
•registered as an adopter of the Taskforce on Nature-related Financial Disclosures recommendations and reaffirming our continued commitment and support towards developing our corporate biodiversity disclosures. This also includes the identification and response to nature-related impacts and dependencies and how we seek to manage biodiversity risks and opportunities;
•published our third annual sustainability report which integrates our recent acquisitions and provides a comprehensive overview of the progress on our water and biodiversity risk assessments, customer engagement, and employee engagement; and
•closely engaged with our stakeholders including governments and First Nations to strengthen our relationships in all areas of our business.
Description of Certain Indebtedness
The following summarizes certain material provisions of our senior notes and revolving credit facilities. The summaries are not complete and are qualified by reference to the applicable documents and the applicable amendments to such documents on file with the SEC, and incorporated by reference herein.
Senior Notes
In September 2023, we issued $200.0 million in aggregate principal amount of 12.875% senior notes due October 1, 2028, referred to as the “2028 Senior Notes”. In October 2024, we completed a $200.0 million add-on offering of the 2028 Senior Notes at a 103.000% premium to their principal amount, for a yield to worst of 11.624%. The proceeds and cash on hand were used to redeem $300.0 million in aggregate principal amount of 5.500% senior notes due 2026, referred to as the “2026 Senior Notes”. After giving effect to the foregoing transactions, we now have outstanding the following issues of senior notes, collectively referred to as the “Senior Notes”:
•$400.0 million in aggregate principal amount of 2028 Senior Notes; and
•$875.0 million in aggregate principal amount of 5.125% senior notes due 2029, referred to as the “2029 Senior Notes”.
The 2028 Senior Notes mature on October 1, 2028 and interest on the 2028 Senior Notes is payable semi-annually in arrears on each April 1 and October 1. Commencing April 1, 2024, interest is payable to holders of record of the 2028 Senior Notes on the immediately preceding March 15 and September 15 and is computed on the basis of a 360-day year consisting of twelve 30-day months. Commencing October 1, 2025, the 2028 Senior Notes will be redeemable at our option at a price equal to 106.438% of the principal amount redeemed and declining rateably on October 1 of each year thereafter to 100.000% on or after October 1, 2027.
The 2029 Senior Notes mature on February 1, 2029 and interest on the 2029 Senior Notes is payable semi-annually in arrears on each February 1 and August 1. Commencing August 1, 2021, interest is payable to holders of record of the 2029 Senior Notes on the immediately preceding January 15 and July 15 and is computed on the basis of a 360-day year consisting of twelve 30-day months. Commencing February 1, 2024, the 2029 Senior Notes were redeemable at our option at a price equal to 102.563% of the principal amount redeemed and declining rateably on February 1 of each year thereafter to 100.000% on or after February 1, 2026.
The indentures governing the Senior Notes contain covenants limiting, among other things, our ability and the ability of our restricted subsidiaries to: incur additional indebtedness or issue preferred stock; pay dividends or make other distributions to our shareholders; purchase or redeem capital stock or subordinated indebtedness; make investments; create liens; incur restrictions on the ability of our restricted subsidiaries to pay dividends or make other payments to us; sell assets; consolidate or merge with or into other companies or transfer all or substantially all of our assets; and engage in transactions with affiliates. As of December 31, 2024, all of our subsidiaries were restricted subsidiaries.
The Senior Notes are unsecured and are not guaranteed by any of our operating subsidiaries, most of which are located outside the United States. Our obligations under the Senior Notes rank: effectively junior in right of payment to all of our existing and future secured indebtedness, to the extent of the assets securing such indebtedness, and all indebtedness and liabilities of our subsidiaries; equal in right of payment with all of our existing and future unsecured senior indebtedness; and senior in right of payment to any of our future subordinated indebtedness.
Pan-German Revolving Credit Facility
In September 2022, certain of our German subsidiaries entered into a €300.0 million joint revolving credit facility, referred to as the “German Revolving Facility”, with a group of bank lenders. In September 2023, we increased the borrowing capacity of our German Revolving Facility by €70.1 million to €370.1 million.
The principal terms of the facility include:
•The total availability under the facility is €370.1 million.
•The facility matures in September 2027.
•The facility is unsecured and is jointly and severally guaranteed by our principal German subsidiaries.
•Interest under the facility is payable on loans of Euribor plus a variable margin ranging from 1.40% to 2.35% dependent on conditions including but not limited to a prescribed leverage ratio.
•The facility is sustainability linked, whereby the interest rate margin is subject to upward or downward adjustments of up to 0.05% per annum depending on achievement of certain specified sustainability targets.
•A commitment fee equal to 35% of the applicable margin on the unused and uncancelled amount of the German Revolving Facility is payable quarterly in arrears.
•The facility contains financial maintenance covenants which are tested on a quarterly basis which require: (i) our German subsidiaries that are party thereto to maintain a leverage ratio of “net debt” (excluding shareholder loans) to EBITDA of not greater than 3.50:1.00; and (ii) defined capital of not less than €500.0 million.
•The facility contains other customary restrictive covenants which, among other things, govern the ability of our German subsidiaries to incur liens, sell assets, incur indebtedness, make acquisitions with proceeds from the facility, enter into joint ventures or repurchase or redeem shares. The facility also contains customary events of default.
The German Revolving Facility is available to all of the borrowers, subject to maximum borrowing sub-limits for certain of the borrowers.
As of December 31, 2024, approximately €162.5 million ($168.8 million) of this facility was drawn and accruing interest at a rate of 4.470% per annum, approximately €13.6 million ($14.1 million) was supporting bank guarantees and approximately €194.0 million ($201.6 million) was available.
Canadian Revolving Credit Facility
In January 2022, certain of our Canadian subsidiaries entered into a C$160.0 million revolving credit facility with a syndicate of three North American banks, referred to as the “Canadian Revolving Facility”. In June 2024, the facility was amended to transition from the Canadian Dollar Offered Rate (CDOR) benchmark to the Adjusted Term Canadian Overnight Repo Rate Average (CORRA) benchmark for applicable Canadian dollar denominated advances under the credit facility as the CDOR benchmark was discontinued on June 28, 2024. The principal terms of the Canadian Revolving Facility include:
•The total availability under the facility is C$160.0 million.
•The facility matures in January 2027.
•The facility is available by way of: (i) Canadian dollar denominated advances, which bear interest at a designated prime rate per annum; (ii) Canadian dollar denominated advances, which bear interest at the applicable Adjusted Term CORRA plus 1.20% to 1.45% per annum; (iii) dollar denominated base rate advances at the greater of the federal funds rate plus 0.50%, an Adjusted Term Secured Overnight Financing Rate (SOFR) for a one month tenor plus 1.00% and the bank’s applicable reference rate for dollar denominated loans; and (iv) dollar denominated SOFR advances, which bear interest at Adjusted Term SOFR plus 1.20% to 1.45% per annum.
•The facility includes a C$15.0 million sub-limit for letters of credit for all borrowers, at rates of 1.20% to 1.45% per annum, plus a 0.125% annual fee where there is more than one lender under the facility, on issued letters of credit.
•The availability of the facility is subject to a borrowing base limit that is based on the borrowers’ combined eligible inventory levels and accounts and certain eligible equipment from time to time.
•The facility is secured by, among other things, a first priority charge on substantially all of the assets of the borrowers.
•The facility includes a springing financial covenant, which is measured when either excess availability under the facility is less than the greater of 10% of the line cap thereunder and C$14.0 million, in either case, for five consecutive days or less than the greater of 7.5% of the line cap and C$10.0 million, at any time, and which requires the borrowers to comply, on a combined basis, with a 1.00:1.00 fixed charge coverage ratio.
•The facility also contains restrictive covenants which, among other things, restrict the ability of the borrowers to declare and pay dividends, incur indebtedness, incur liens, make investments, including in its existing joint ventures, and make payments on subordinated debt. The facility contains customary events of default.
As of December 31, 2024, approximately C$0.5 million ($0.3 million) of this facility was drawn and accruing interest at a rate of 5.450% per annum, approximately C$0.6 million ($0.4 million) was supporting letters of credit and approximately C$146.9 million ($102.1 million) was available.
ITEM 1A. RISK FACTORS
The statements in this “Risk Factors” section describe material risks to our business and should be considered carefully. You should review carefully the risk factors listed below, as well as those factors listed in other documents we file with the SEC. In addition, these statements constitute our cautionary statements under the Private Securities Litigation Reform Act of 1995. Our disclosure and analysis in this Annual Report on Form 10-K and in our annual report to shareholders contain some forward-looking statements that set forth anticipated results based on management's current plans and assumptions. If any of the risks and uncertainties described in the cautionary factors described below actually occur or continue to occur, our business, financial condition and results of operations and the trading price of our common stock could be materially and adversely affected. Moreover, the risks below are not the only risks we face and additional risks not currently known to us or that we presently deem immaterial may emerge or become material at any time and may negatively impact our business, reputation, financial condition, results of operations or the trading price of our common stock.
Risks Related to our Business
Our business is highly cyclical in nature.
The forest products industry is highly cyclical in nature and markets are characterized by periods of supply and demand imbalance, which in turn can cause material fluctuations in prices. The markets for our principal products, being pulp and lumber, are sensitive to cyclical changes in the global economy, industry capacity and foreign exchange rates, all of which can have a significant influence on selling prices and our operating results. The length and magnitude of industry cycles have varied over time but generally reflect changes in macroeconomic conditions and levels of industry capacity. Pulp and lumber are commodities that are generally available from other producers. Because commodity products have few distinguishing qualities from producer to producer, competition is mainly based upon price, which is generally determined by supply relative to demand.
Industry capacity can fluctuate as changing industry conditions can influence producers to idle production capacity or permanently close mills. In addition, to avoid substantial cash costs in idling or closing a mill, some producers will choose to operate at a loss, sometimes even a cash loss, which can prolong weak pricing environments due to oversupply. Oversupply of our products can also result from producers introducing new capacity in response to favorable pricing trends. Certain integrated pulp and paper producers have the ability to discontinue paper production by idling their paper machines and selling their pulp production on the market, if market conditions, prices and trends warrant such actions.
Currently, we are aware of approximately 0.4 million ADMTs of announced net pulp production capacity increases, primarily of softwood kraft pulp scheduled to come online in 2025. However, we cannot predict whether additional new capacity will be announced or will come online in the future. If any new capacity, particularly for NBSK pulp, is not absorbed in the market or offset by curtailments or closures of older, high-cost pulp mills, the increase could put downward pressure on pulp prices and materially adversely affect our results of operations, margin and profitability. Additionally, while NBHK pulp is not a direct competitor to NBSK pulp, if any future increases in NBHK pulp supply are not absorbed by demand growth, such supply could put downward pressure on NBSK pulp prices as well.
Demand for each of pulp and lumber has historically been determined primarily by general global macroeconomic conditions and has been closely tied to overall business activity. Both pulp and lumber prices have been and are likely to continue to be volatile and can fluctuate widely over time. Demand for CLT, glulam and other mass timber products is primarily driven by commercial and industrial construction demand and customers’ desire to take advantage of the characteristics and environmental attributes of such products.
A pulp producer's actual sales realizations are third-party industry quoted list prices net of customer discounts, rebates and other selling concessions. Global pulp and lumber markets have historically been characterized by considerable swings in prices which have and will result in variability in our earnings. Prices for pulp and lumber are driven by many factors outside our control. We have little influence over the timing and extent of price changes. Because market conditions beyond our control determine the prices for pulp and lumber, prices may fall below our cash production costs, requiring us to either incur short-term losses on product sales or reduce or cease production at one or more of our mills. Therefore, our profitability depends on managing our cost structure, particularly raw materials which represent a significant component of our operating costs and can fluctuate based upon factors beyond our control. If the prices of our products decline, or if prices for our raw materials increase, or both, our results of operations and cash flows could be materially adversely affected.
Cyclical fluctuations in the price and supply of our raw materials, particularly fiber, could adversely affect our business.
Our main raw material is fiber in the form of wood chips, pulp logs, sawlogs and lumber. Fiber represented approximately 55% of our pulp cash production costs and approximately 75% of our lumber cash production costs in 2024. Fiber is a commodity and both prices and supply are cyclical. Fiber pricing is subject to regional market influences and our costs of fiber may increase in a region as a result of local market shifts. The costs of wood chips, pulp logs and sawlogs are primarily affected by the supply and demand for lumber. Demand for these raw materials is generally determined by the volume of pulp and paper products and solid wood products produced globally and regionally.
Governmental regulations related to the environment, forest stewardship and green or renewable energy can also affect the supply of fiber. In Europe, governmental initiatives to increase the supply of renewable energy have led to more renewable energy projects, including in Germany. Demand for wood residuals from such energy producers has generally put upward pressure on prices for wood residuals. In addition, the reduction in natural gas supply and increase in energy prices in Germany resulting from the Ukraine war has previously increased both the demand and prices for wood chips and residuals resulting in higher per unit fiber costs for our German mills in recent years.
The lumber industry is highly cyclical and the slowdown in sawmilling activities in recent years reduced the availability of both wood chips and pulp logs and put upward pressure on fiber costs. There is no assurance that sawmill activity will stabilize or not decline further or that fiber prices will not increase in the future.
Following the expiration of a softwood lumber trade agreement in 2016, the United States and Canada have renewed a long-standing trade dispute regarding lumber exports from Canada to the United States. In November 2016, a petition was filed by a coalition of U.S. lumber producers to the U.S. Department of Commerce and the U.S. International Trade Commission requesting an investigation into alleged subsidies provided to Canadian lumber producers. Since then, the U.S. Department of Commerce announced various countervailing and anti-dumping duty rates on Canadian softwood lumber and the United States and Canada have engaged in proceedings under the North American Free Trade Agreement and through the World Trade
Organization. In September 2024, the U.S. Department of Commerce published amended final results for its fifth administrative review, setting the countervailing duty at 6.74% and the anti-dumping rate at 7.66%, for combined final duty rates of 14.40% for “all other” Canadian lumber producers. In September 2024, Canada announced that it is challenging the final results of the U.S. Department of Commerce’s fifth administrative review. It is uncertain when or if the United States and Canada may settle a new agreement and what terms or restrictions it may contain. Further, additional tariffs, duties or other restrictions may be imposed. Duties or other restrictions imposed on Canadian softwood lumber exports by the United States can negatively impact Canadian sawmill production in our Canadian pulp mills’ supply area and result in reduced availability and increased costs for wood chips for our Canadian mills. While we believe this may be partially offset by increased wood chip supply from U.S. sawmills and pulp log availability, we cannot currently predict the effect on our Canadian mills’ overall fiber costs.
Availability of fiber may be further limited by adverse responses to and prevention of wildfires, weather, insect infestation, disease, ice storms, windstorms, flooding and other natural causes. In addition, the quantity, quality and price of fiber we receive could be affected by man-made causes such as those resulting from industrial disputes, material curtailments or shut down of operations by suppliers, government orders and legislation (including new taxes or tariffs). In our Western Canadian operations, fiber supply may also be impacted by unsettled land and title claims by, and government relations and actions relating to, Indigenous Nations. Any or a combination of these factors can affect fiber prices in a region.
The cyclical nature of pricing for fiber represents a potential risk to our profit margins if pulp and lumber producers are unable to pass along price increases to their customers or we cannot offset such costs through higher prices for our surplus energy.
Other than the renewable forest licenses of our Peace River mill, we do not own any timberlands or have any material long-term governmental timber concessions. We also currently have few long-term fiber contracts at our German operations. Fiber is available from a number of suppliers and prices are cyclical. Our fiber requirements have increased and may continue to do so as we expand capacity through capital projects, other efficiency measures at our mills and acquisitions. As a result, we may not be able to purchase sufficient quantities of fiber to meet our production requirements at prices acceptable to us during times of tight supply. An insufficient supply of fiber or reduction in the quality of fiber we receive would materially adversely affect our business, financial condition, results of operations and cash flows.
In addition to the supply of fiber, we are, to a lesser extent, dependent on the supply of certain chemicals and other inputs used in our production facilities. Any disruption in the supply of these chemicals or other inputs could affect our ability to meet customer demand in a timely manner and could harm our reputation. Any material increase in the cost of these chemicals or other inputs could have a material adverse effect on our business, results of operations, financial condition and cash flows.
Inflation or a sustained increase in our key production and other costs would lead to higher manufacturing costs which could reduce our margins.
Our key production input costs are fiber, chemicals and energy. Other material costs in our business include maintenance, freight and labor costs. The prices for fiber and energy can be volatile, are affected by inflation and can change rapidly. Additionally, our costs for chemicals, maintenance and freight are also subject to inflationary pressure. Also, our costs for service providers, contractors and labor may increase due to inflation and shortages of skilled labor.
Continued inflationary pressures would increase our manufacturing costs. If we are unable to pass along such operating cost increases to our customers, it could reduce our margins, contribute to earnings volatility and adversely affect our results of operations.
Our business, financial condition and results of operations could be adversely affected by disruptions in the global and European economies caused by geopolitical conflicts, including Russia's invasion of Ukraine and conflicts in the Middle East.
The global economy has been negatively impacted by increasing tension, uncertainty and tragedy resulting
from Russia's invasion of Ukraine and conflicts in the Middle East. The adverse and uncertain economic conditions resulting therefrom have and may further negatively impact global demand, cause supply chain disruptions and increase costs for transportation, energy and other raw materials. Furthermore, governments in the United States, the European Union, the United Kingdom, Canada and others have imposed financial and economic sanctions on certain industry segments and various parties in Russia. We are monitoring the conflicts including the potential impact of financial and economic sanctions on the global economy and particularly the economies of Europe. Increased trade barriers, sanctions and other restrictions on global or regional trade could adversely affect our business, financial condition and results of operations. Although we have no operations in Russia or Ukraine, the destabilizing effects of Russia's invasion of Ukraine could have other adverse effects on our business, including transportation, logistics, fiber supply and energy availability. Further escalation of geopolitical tensions related to this military conflict and/or its expansion could result in loss of property, expropriation, cyberattacks, supply disruptions, plant closures and an inability to obtain key supplies and materials, as well as adversely affect both our and our customers’ supply chains and logistics, particularly in Europe.
In many cases, both our German operations and those of European customers depend on the availability of natural gas for use in their manufacturing operations. A very significant proportion of Germany's natural gas supply historically originated from Russia. There have been significant reductions in and disruptions to the natural gas supply to Europe and in particular Germany, resulting from sanctions, counter-measures by Russia, including restricting supply, other restrictions, damage to infrastructure, logistics and other factors related to the war. The Ukraine military conflict has had a destabilizing effect and materially and adversely impacted European and global natural gas and oil markets. Such material disruptions to the natural gas supply of Germany could adversely affect its availability to industry and our ability to operate our German pulp and lumber mills in the ordinary course which could adversely affect our business, results of operations and financial condition.
Additionally, both the European Union and Germany adopted or proposed, in response to energy supply shortages and high energy prices, price caps and “windfall” taxes on energy sales resulting from the war in Ukraine. These expired in June 2023 with respect to electricity.
In addition, effects of the existing and future conflicts could heighten and increase many of the other risks described in this Item 1A.
The impacts of proposed tariffs or other trade barriers by the United States, or other nations, may adversely impact our business, financial condition and results of operations.
On February 1, 2025 the President of the United States signed executive orders directing the United States to impose a 25% tariff on all goods originating from Canada and Mexico, and an additional 10% tariff on goods imported from China. While 30-day pauses in tariffs against Canada and Mexico were announced on February 3, 2025, we do not currently know when or if such tariffs will take effect or their duration. Tariffs on Canadian goods (and any new tariffs, retaliatory tariffs or other trade protectionist measures implemented in connection therewith) and threatened imposition of tariffs against the European Union could have a material adverse impact on the sales of our products to customers in the United States. In 2024, a significant portion of pulp segment revenues from our Canadian pulp mills and approximately 10% of our overall pulp segment revenues were from the United States. The U.S. market accounted for approximately 47% of our lumber revenues and approximately 41% of our lumber sales volumes in 2024.
If implemented, the tariffs and any retaliatory measures could also impact our raw material costs and result in volatility in transportation costs and logistics disruptions and delays. For example, in 2024, our Celgar pulp mill sourced a significant portion of its fiber requirements from United States suppliers. It is also possible that tariffs between the United States and other countries, such as China and the European Union may benefit certain aspects of our business, including potential positive impacts on our Canadian dollar and Euro denominated costs, lowering our fiber costs or making our European Union solid wood products more competitive against those of United States competitors.
While we are taking steps to seek to mitigate their potential impact on our business, given that developments are ongoing with respect to these proposed tariffs and other measures, their impacts are uncertain and could
adversely affect our business, financial condition and results of operations.
We face intense competition in the forest products industry.
We compete with numerous forest products companies, some of which have greater financial resources. The trend toward consolidation in the forest products industry has led to the formation of sizable global producers that have greater flexibility in pricing and financial resources for marketing, investment, research and development, innovation, and expansion. Additionally, certain of our competitors are fully or more vertically integrated than we are and may have different priorities when operating their respective businesses. Because the markets for our products are highly competitive, actions by competitors can affect our ability to compete and the volatility of prices at which our products are sold.
The forest products industry is also capital intensive, and we require significant investment to remain competitive. Some of our competitors may be lower-cost producers in some of the businesses in which we operate. For example, the sizable low-cost hardwood grade pulp capacity in South America, which continues to grow as a result of ongoing investment and whose costs are thought to be very competitive, and the actions those mills take to gain market share, could continue to adversely affect our competitive position in similar grades. Failure to compete effectively could have a material adverse effect on our business, financial condition or results of operations.
Additionally, in our solid wood segment, demand for our CLT, glulam and other wood products may be impacted by the entry of new competitors or improved product capabilities, innovation or production capacity by existing competitors, which may adversely affect our market share for such products.
Our business is subject to risks associated with climate change and social and government responses thereto.
Our operations and those of our suppliers are subject to climate change variations which can impact the productivity of forests, the abundance of species, harvest levels and fiber supply. Further, over the last few years, changing weather patterns and climate conditions due to natural and man-made causes have added to the frequency and unpredictability of natural disasters like wildfires, insect infestation of softwood forests, floods, rain, wind, snow and ice storms. One or a combination of these factors could adversely affect our fiber supply which is our largest cash production cost. There are differing scientific studies and opinions relating to the severity, extent and speed at which climate change is or may be occurring around the world. As a result, we are currently unable to identify and predict all of the specific consequences of climate change on our business and operations.
Further, governmental initiatives and social focus in response to climate change also have an impact on operations. Their demand for carbon neutral green energy has created greater demand and competition for the wood residuals and fiber that is consumed by our pulp mills as part of their production processes. This can drive up the cost of fiber for our mills.
If our fiber costs increase and we cannot pass on these costs to our customers or offset them through higher prices for our sales of surplus energy, it will negatively affect our operating margins, results of operations and financial position. If we cannot obtain the fiber required to operate our mills, we may have to curtail and/or shut down production. This could have a material adverse effect on our operations, financial results and financial position.
Other risks to our business from climate change include:
•a greater susceptibility of northern forests to disease, fire and insect infestation, which could diminish fiber availability;
•the disruption of transportation systems and power supply lines due to more severe storms;
•the loss of fresh water transportation for logs and pulp due to lower water levels;
•decreases in the quantity and quality of processed water for our mills’ operations;
•the loss of northern forests in areas in sufficient proximity to our mills to competitively acquire fiber; and
•lower harvest levels decreasing the supply of harvestable timber and, as a consequence, wood residuals.
Any of these natural disasters could also affect woodlands or cause variations in the cost of raw materials, such as fiber or restrict or negatively impact our logistics and transportation of goods and materials. Changes in precipitation could make wildfires more frequent or more severe, and could adversely affect timber harvesting and the supply of fiber to our operations. The effects of global, regional and local weather conditions, and climate change, including the costs of complying with evolving climate change regulations and transition costs relating to a low carbon economy could also adversely impact our results of operations.
Fluctuations in prices and demand for lumber and mass timber products could adversely affect our business.
The financial performance of the Friesau mill and Torgau facility depends on the demand for and selling price of lumber, which is subject to significant fluctuations. The markets for lumber are highly volatile and are affected by economic conditions in Europe, Asia and the United States, the strength of housing markets and the home renovations activity in such regions, the growing importance of the Asian market, changes in industry production capacity, changes in inventory levels and other factors beyond our control. Interest rates also have a significant impact on residential construction and renovation activity, which in turn influence the demand for and price of lumber. Additionally, demand for mass timber products is driven, in part, by commercial and industrial construction demand. As such, periods of volatility or decreases in demand for our lumber and other wood products could adversely affect our business and results of operations.
Our solid wood segment lumber products are vulnerable to declines in demand due to competing technologies or materials.
Our lumber products may compete with alternative products. For example, plastic, wood/plastic or composite materials may be used by builders as alternatives to the lumber products produced by our solid wood segment. Changes in the prices for oil, chemicals and other products can change the competitive position of our solid wood segment lumber products relative to available alternatives and could increase substitution of those products for our solid wood segment products. If use of these alternative products grows, demand for and pricing of our solid wood segment products could be adversely affected.
We may experience material disruptions to our production.
A material disruption at one of our manufacturing facilities could prevent us from meeting customer demand, reduce our sales and/or negatively impact our results of operations. Any of our mills could cease operations unexpectedly due to a number of events, including:
•unscheduled maintenance outages;
•prolonged power failures;
•employee errors or failures;
•design error or contractor error;
•chemical spill or release or industrial fire;
•disruptions in the transportation infrastructure, including roads, bridges, railway tracks, tunnels, canals and ports;
•fires, floods, earthquakes, windstorms, pest infestations, severe weather conditions or other natural catastrophes affecting our production of goods or the supply of raw materials like fiber;
•prolonged supply disruption of major inputs;
•capital projects that require temporary cost increases or curtailment of production;
•health pandemics and related restrictions; and
•other operational problems.
Any such downtime or facility damage could prevent us from meeting customer demand for our products and/or require us to make unplanned capital expenditures. If any of our facilities were to incur significant downtime, our ability to meet our production capacity targets and satisfy customer requirements would be impaired and could have a material adverse effect on our business, financial condition, results of operations and cash flows.
Acquisitions may result in additional risks and uncertainties in our business.
In order to grow our business, we may seek to acquire additional assets or companies. For example, in September 2022, we acquired the Torgau facility for approximately $263.2 million and, in June 2023, we acquired the Mercer Conway facility and Mercer Okanagan facility for approximately $82.1 million. Our ability to pursue selective and accretive acquisitions is dependent on management's ability to identify, acquire and develop suitable acquisition targets in both new and existing markets. In pursuing acquisition and investment opportunities, we face competition from other companies having similar growth strategies, many of which may have substantially greater resources than us. Competition for these acquisitions or investment targets could result in increased acquisition or investment prices, higher risks and a diminished pool of businesses or assets available for acquisition.
Acquisitions also frequently result in the recording of goodwill and other intangible assets, which are subject to potential impairments in the future that could have a material adverse effect on our operating results. Furthermore, the costs of integrating acquired businesses (including restructuring charges associated with the acquisitions, as well as other acquisition costs, such as accounting fees, legal fees and investment banking fees) could significantly impact our operating results.
Although we perform diligence on the businesses we purchase, in light of the circumstances of each transaction, an unavoidable level of risk remains regarding the actual condition of these businesses. We may not be able to ascertain the value or understand the potential liabilities of the acquired businesses and their operations until we assume operating control of the assets and operations of these businesses.
Furthermore, acquisitions could entail a number of risks, including:
•diversion of management's attention from our ongoing business;
•difficulty integrating the operations, including financial and accounting functions, sales and marketing procedures, technology and other corporate administrative functions of the combined operations;
•increased operating costs;
•exposure to substantial unanticipated liabilities;
•difficulty in realizing projected synergies, efficiencies and cost savings;
•exposure to facilities with different health and safety standards than ours and difficulty in integrating their practices to our standards;
•difficulty maintaining relationships with present and potential customers, distributors and suppliers due to uncertainties regarding service, production quality and prices; and
•problems retaining key employees.
If we are unable to address any of these risks, our results of operations and financial condition could be materially adversely affected.
Our operations require substantial capital and we may be unable to maintain adequate capital resources to provide for such capital requirements.
Our business is capital intensive and requires that we regularly incur capital expenditures to maintain our equipment, improve efficiencies and, as a result of changes to environmental regulations that require capital expenditures, bring our operations into compliance with such regulations. We may approve projects in the future that will require significant capital expenditures. Increased capital expenditures could have a material adverse effect on our cash flow and our ability to satisfy our debt obligations. If our available cash resources and cash generated from operations are not sufficient to fund our operating needs and capital expenditures, we would have to obtain additional funds from borrowings or other available sources or reduce or delay our capital expenditures. Our indebtedness could adversely limit or impair our ability to raise additional capital. We may not be able to obtain additional funds on favorable terms or at all. If we cannot maintain or upgrade our equipment as may be required from time to time, we may become unable to manufacture products that compete effectively. An inability to make required capital expenditures in a timely fashion could have a material adverse effect on our growth, business, financial condition or results of operations.
Trends in non-print media and changes in consumer habits regarding the use of paper have and are expected to continue to adversely affect the demand for market pulp.
Trends in non-print media are expected to continue to adversely affect demand for traditional print media, including for printing, writing and graphic papers. Neither the timing nor the extent of these trends can be predicted with certainty. Our paper, magazine, book and catalog publishing customers could increase their use of, and compete with, non-print media, including multimedia technologies, electronic storage and communication platforms which could further reduce their consumption of papers and in turn their demand for market pulp. The demand for such paper products has weakened significantly over the last several years and was negatively impacted by the COVID-19 pandemic, which further altered consumer habits.
We are subject to risks related to our employees.
The majority of our employees are part of a union or are represented by a works council and we have collective agreements in place with our employees at all of our mills, other than the Peace River mill, Mercer Spokane facility, Torgau facility and Mercer Conway facility, which are non-union and not represented by a works council. Although we have not experienced any material work stoppages in the past, there can be no assurance that we will be able to negotiate acceptable collective agreements or other satisfactory arrangements with our employees upon the expiration of our collective agreements. This could result in a strike or work stoppage by the affected workers. The registration or renewal of the collective agreements or the outcome of our wage negotiations could result in higher wages or benefits paid. Many of the employment positions in our operations require technical or other operating training and/or experience. Changing demographics may make it more difficult for us to recruit skilled employees in the future. Accordingly, we could experience a significant disruption of our operations or higher ongoing labor costs, which could have a material adverse effect on our business, financial condition, results of operations and cash flows. In addition, whenever we seek to reduce the workforce at any of our mills, the affected mill's labor force could seek to hinder or delay such actions, we could incur material severance or other costs and our operations could be disrupted.
We are dependent on key personnel.
Our future success depends, to a large extent, on the efforts and abilities of our executive and senior mill operating officers. Such officers are industry professionals, many of whom have operated through multiple business cycles. The loss of one or more of our officers could make us less competitive, which could materially adversely affect our business, financial condition, results of operations and cash flows. We do not maintain key person life insurance for any of our executive or senior mill operating officers.
In addition, by nature of the industries in which we operate, many of our employees are professionals who require specialized knowledge and skills, including various categories of engineers and licensed trade persons and equipment operators. Any inability to attract, train and retain such employees could adversely affect our business and results of operations.
If our long-lived assets become impaired, we may be required to record non-cash impairment charges that could have a material impact on our results of operations.
We review the carrying value of long-lived assets for impairment when events or changes in circumstances indicate that the carrying amount of the assets may not be recoverable. Should the markets for our products deteriorate or should we decide to invest capital differently or should other cash flow assumptions change, it is possible that we will be required to record non-cash impairment charges in the future that could have a material adverse effect on our results of operations.
Our insurance coverage may not be adequate.
We have obtained insurance coverage that we believe would ordinarily be maintained by an operator of facilities similar to our mills. Our insurance is subject to various limits and exclusions. Damage or destruction to our facilities could result in claims that are excluded by, or exceed the limits of, our insurance coverage. Additionally, the weak global and financial markets have also reduced the availability and extent of credit insurance for our customers. If we cannot obtain adequate credit insurance for our customers, we may be forced to amend or curtail our planned operations which could negatively impact our sales revenues, results of operations and financial position.
We rely on third parties for transportation services.
Our business primarily relies upon third parties for the transportation of products to our customers, as well as for the delivery of our raw materials to our mills. Our products and raw materials are principally transported by truck, barge, rail and sea-going vessels, all of which are highly regulated. Increases in transportation rates can also materially adversely affect our results of operations.
Further, if our transportation providers fail to deliver our products in a timely manner, it could negatively impact our customer relationships and we may be unable to manufacture pulp or lumber in response to customer orders or sell them at full value. Also, if any of our transportation providers were to cease operations, we may be unable to replace them at a reasonable cost. The occurrence of any of the foregoing events could materially adversely affect our results of operations.
If we are unable to offer products certified to globally recognized forestry management and chain of custody standards or meet customers’ product or project specifications, it could adversely affect our ability to compete.
We market and sell pulp, lumber and other solid wood products with specific designations to certain globally recognized forest management and chain of custody standards as well as product specifications to meet customers’ requirements. Our ability to conform to new or existing guidelines for certification depends on a number of factors, many of which are beyond our control, such as: changes to the standards or the interpretation or the application of the standards; the collaboration of our suppliers in the timely sharing of product information; the adequacy of government-implemented conservation measures; and in Canada the existence of or potential territorial disputes between First Nations peoples and governments. If we are unable to offer certified products, or to meet commitments to supply certified product or meet the product specifications of our customers, it could adversely affect the marketability of our products and our ability to compete with other producers.
Our solid wood segment includes the manufacture, sale and distribution of CLT, glulam and other mass timber products that may be based on project-specific customer requirements. Some of these sales are based upon fixed-price contracts. Underestimates in the bidding process, changes in the timing of deliveries, design errors or other project delays caused by us, customers or others may adversely impact our operating results.
Failures or security breaches of our information technology systems could disrupt our operations and negatively impact our business.
We use information technologies to manage our operations and various business functions. We rely on various technologies to process, store and report on our business and to communicate electronically between
our facilities, personnel, customers and suppliers as well as for administrative functions and many of such technology systems are dependent on one another for their functionality. We also use information technologies to process financial information and results of operations for internal reporting purposes and to comply with regulatory, legal and tax requirements. We rely on third-party providers for some of these information technologies and support. Our ability to effectively manage our business and coordinate the production, distribution and sale of our products is highly dependent on our technology systems. Despite our security design and controls and other operational safeguards, and those of our third-party providers, our information technology systems may be vulnerable to a variety of interruptions, including during the process of upgrading or replacing hardware, software, databases or components thereof, natural disasters, terrorist attacks, telecommunications failures, computer viruses, cyberattacks, hackers, unauthorized access attempts and other security issues or may be breached due to employee error, malfeasance or other disruptions. Any such interruption or breach could result in operational disruptions or the misappropriation of sensitive data that could subject us to additional reporting requirements, litigation, governmental investigations or proceedings or have a negative impact on our reputation. There can be no assurance that such disruptions or misappropriations and the resulting repercussions will not negatively impact our cash flows and materially affect our results of operations or financial condition.
In addition, many of our information technology systems, such as those we use for administrative functions, including human resources, payroll, accounting and internal and external communications, as well as the information technology systems of our third-party business partners and service providers, whether cloud-based or hosted in proprietary servers, contain personal, financial or other information that is entrusted to us by our customers and personnel. Many of our information technology systems also contain proprietary and other confidential information related to our business, such as business plans and research and development initiatives. If we or a third-party were to experience a material breach of our or such third-party's information technology systems that results in the unauthorized access, theft, use, destruction or other compromises of our customers’ or personnel’s data or confidential information stored in such systems, including through cyberattacks or other external or internal methods, it could result in a violation of applicable privacy and other laws and subject us to additional reporting requirements, litigation and governmental investigations and proceedings, any of which could result in our exposure to material liability.
Evolving sustainability reporting and environmental, social and governance preferences of customers, investors and other stakeholders may impact our business.
Sustainability and environmental, social and governance reporting frameworks are numerous and evolving rapidly. Sustainability governance, performance and disclosures are reviewed and monitored by investors, customers, other stakeholders and environmental, social and governance scoring service providers using different methodologies, which may impact how they perceive, justifiably or not, us and our business. In the event we were unable to achieve our stated sustainability targets, goals and commitments or if our sustainability statements were challenged as erroneous, inaccurate or incomplete, whether justifiably or not, our reputation and customer and other relationships may be adversely affected and we may also be exposed to potential litigation and liability. In addition, evolving standards and regulations related to climate change, sustainability and environmental, social and governance reporting may also result in additional expenditures and divert management attention from our business.
Risks Related to our Debt
Our level of indebtedness could negatively impact our financial condition, results of operations and liquidity.
As of December 31, 2024, we had approximately $1,474.0 million of indebtedness outstanding. We may also incur additional indebtedness in the future. Our high debt levels may have important consequences for us, including, but not limited to the following:
•our ability to obtain additional financing for working capital, capital expenditures, general corporate and other purposes or to fund future operations may not be available on terms favorable to us or at all;
•a significant amount of our operating cash flow is dedicated to the payment of interest and principal on our indebtedness, thereby diminishing funds that would otherwise be available for our operations and for other purposes;
•increasing our vulnerability to current and future adverse economic and industry conditions;
•a substantial decrease in net operating cash flows or increase in our expenses could make it more difficult for us to meet our debt service requirements, which could force us to modify our operations;
•our leveraged capital structure may place us at a competitive disadvantage by hindering our ability to adjust rapidly to changing market conditions or by making us vulnerable to a downturn in our business or the economy in general;
•causing us to offer debt or equity securities on terms that may not be favorable to us or our shareholders;
•limiting our flexibility in planning for, or reacting to, changes and opportunities in our business and our industry; and
•our level of indebtedness increases the possibility that we may be unable to generate cash sufficient to pay the principal or interest due in respect of our indebtedness.
The indentures that govern our Senior Notes, and our credit facilities contain restrictive covenants which impose operating and other restrictions on us and our subsidiaries. These restrictions will affect, and in many respects will limit or prohibit, our ability to, among other things, incur or guarantee additional indebtedness, pay dividends or make distributions on capital stock or redeem or repurchase capital stock, make investments or acquisitions, create liens and enter into mergers, consolidations or transactions with affiliates. The terms of our indebtedness also restrict our ability to sell certain assets, apply the proceeds of such sales and reinvest in our business.
Certain of the agreements governing our indebtedness have covenants that require us to maintain prescribed financial ratios and tests. Failure to comply with such covenants could result in events of default and could have a material adverse effect on our liquidity, results of operations and financial condition.
Our ability to repay or refinance our indebtedness will depend on our future financial and operating performance. Our performance, in turn, will be subject to prevailing economic and competitive conditions, as well as financial, business, legislative, regulatory, industry and other factors, many of which are beyond our control. Our ability to meet our future debt service and other obligations may depend in significant part on the extent to which we can successfully implement our business strategy. We cannot assure you that we will be able to implement our strategy fully or that the anticipated results of our strategy will be realized. Over the next several years, we will require financing to refinance maturing debt obligations (unless extended), and such refinancing may not be available on favorable terms or at all.
Changes in credit ratings issued by nationally recognized statistical rating organizations could adversely affect our cost of financing and have an adverse effect on the market price of our securities.
Credit rating agencies rate our debt securities on factors that include our operating results, actions that we take, their view of the general outlook for our industry and their view of the general outlook for the economy. Actions taken by the rating agencies can include maintaining, upgrading or downgrading the current rating or placing the company on a watch list for possible future downgrading. Downgrading the credit rating of our debt securities or placing us on a watch list for possible future downgrading could limit our access to credit markets, increase our cost of financing and have an adverse effect on the market price of our securities, including our Senior Notes.
We are exposed to interest rate fluctuations.
Interest on borrowings under our revolving credit facilities are at “floating” rates. As a result, increases in interest rates will increase our costs of borrowing and reduce our operating results.
Risks Related to Macroeconomic Conditions
A weakening of the global economy, including capital and credit markets, could adversely affect our business and financial results and have a material adverse effect on our liquidity and capital resources.
As demand for our products has principally historically been determined by general global macroeconomic activities, demand and prices for our products have historically decreased substantially during economic slowdowns. A significant economic downturn may affect our sales and profitability. Further, our suppliers and customers may also be adversely affected by an economic downturn. Additionally, restricted credit and capital availability restrains our customers’ ability or willingness to purchase our products, resulting in lower revenues. Depending on the severity and duration, the effects and consequences of a global economic downturn could have a material adverse effect on our liquidity and capital resources, including our ability to raise capital, if needed, and otherwise negatively impact our business and financial results.
Financial uncertainties and other events in our major international markets, including inflation and other market factors, may negatively impact the global economy and consequently, our results of operations.
Political uncertainty, an increase in trade protectionism or geopolitical conflict could have a material adverse effect on global macroeconomic activities and trade and adversely affect our business, results of operations and financial condition.
The rise of economic nationalist sentiments, trade protectionism and geopolitical security has led to increasing political uncertainty and unpredictability throughout the world. Additionally, there can be no assurance that additional or new trade tensions, imposition of import and export restrictions and tariffs will not arise between various trade partners. These potential developments, market perceptions concerning these and related issues and the attendant regulatory uncertainty regarding, for example, the posture of governments with respect to international trade or national security issues, could have a material adverse effect on global trade and economic growth which, in turn, can adversely affect our business, results of operation and financial condition.
Increased trade protectionism or the perception that it may occur could materially adversely affect our business. Increasing trade protectionism may cause an increase in the cost of products exported from regions globally, the length of time required to transport products, and the risks associated with exporting products. Such increases may have an adverse impact on our business, operating schedule and financial condition. If the current global economy or outlook is undermined by downside risks and there is a prolonged economic downturn, governments may resort to new or enhanced trade barriers to protect their domestic industries against imports, thereby depressing demand.
International security issues and adverse developments in respect thereof such as the war in Ukraine and the conflicts in the Middle East could materially adversely affect global trade and economic activity and cause logistics disruptions or delays.
Protectionist developments or adverse international political tensions or developments, or the perception they may occur, may have a material adverse effect on global economic conditions, and may significantly reduce global trade. Increasing trade protectionism in the markets could increase the risks associated with exporting goods to such markets. These developments could have a material adverse effect on our business, results of operations and financial condition.
We are exposed to currency exchange rate fluctuations.
We have manufacturing operations in Germany, Canada and the United States. Most of the operating costs and expenses of our German mills are incurred in euros and those of our Canadian mills in Canadian dollars. However, the majority of our sales are in products quoted in dollars. Our results of operations and financial condition are reported in dollars. As a result, our costs generally benefit from a strengthening dollar but are adversely affected by a decrease in the value of the dollar relative to the euro and to the Canadian dollar. Such declines in the dollar relative to the euro and the Canadian dollar reduce our operating margins and the cash flow available to fund our operations and to service our debt. This could have a material adverse effect
on our business, financial condition, results of operations and cash flows.
Further, while a strengthening dollar generally lowers our costs and expenses in Germany and Canada, it increases the cost of pulp to our customers and generally puts downward pressure on pulp prices and reduces our energy, chemical, pallet, biofuel, wood residual and European lumber sales revenues as they are sold in euros and Canadian dollars.
Although we report in dollars, we hold certain assets and liabilities, including our mills, in euros and Canadian dollars. We translate foreign denominated assets and liabilities into dollars at the rate of exchange on the balance sheet date. Equity accounts are translated using historical exchange rates. Unrealized gains or losses from these translations are recognized in other comprehensive income (loss) and do not affect our net earnings, operating income (loss) or Operating EBITDA.
Certain intercompany dollar advances between Mercer Inc. and its foreign subsidiaries are held in euros and Canadian dollars. Mercer Inc. holds some cash in foreign currencies and certain foreign subsidiaries hold some cash and other balances in dollars. When such advances, cash and other balances are translated into the applicable local currency at the end of each reporting period, the gains or losses thereon are reflected in net earnings.
Globally, various central banks raised interest rates in 2022 and 2023 in response to high inflation rates, leading to a relatively high interest rate environment, which could dampen macroeconomic conditions and business activity and reduce demand for our products.
As a result of higher than acceptable rates of inflation, many central banks raised interest rates through 2022 and 2023. While various central banks initiated interest rate reductions in the second half of 2024, interest rates remain at relatively high levels. They may also fluctuate in the future.
High interest rates can, among other things, dampen macroeconomic conditions and business activity and lead to a recession. Such weakened economic activity could reduce demand and prices for our products which could reduce our margins and adversely affect our results of operations. In addition, the effects of a high interest rate environment and a weakening of global economic activity could heighten and increase many of the other risks described in this Item 1A.
Health epidemics or pandemics could adversely affect our business and financial results.
Health epidemics or pandemics have in the past and may in the future impact macroeconomic conditions, supply chains and other global economic activities. Governmental responses thereto, including operational restrictions adversely affect our business, operations and financial results. The duration and scope of a health epidemic or pandemic can be difficult to predict and depends on many factors, including the emergence of new variants and the availability, acceptance and effectiveness of preventative measures. The extent that an epidemic or pandemic may impact our business, operations and financial results will depend on numerous factors, which may be evolving and not subject to accurate prediction. Additionally, a health epidemic or pandemic may also heighten other risks disclosed in these risk factors, including, but not limited to, those related to the availability and costs of labor, raw materials and supply chain interruptions.
We may incur losses as a result of unforeseen or catastrophic events, including terrorist attacks or natural disasters.
The occurrence of unforeseen or catastrophic events, terrorist attacks or natural disasters could create economic and financial disruptions and could lead to operational difficulties (including travel limitations) that could impair our ability to manage or operate our business and adversely affect our results of operations.
Legal and Regulatory Risks
We are subject to extensive environmental regulation and we could incur substantial costs as a result of compliance with, violations of or liabilities under applicable environmental laws and regulations.
Our operations are subject to numerous environmental laws and regulations as well as permits, guidelines and policies relating to the protection of the environment. These laws, regulations, permits, guidelines and policies govern, among other things:
•discharges to land, air, water and sewers;
•waste collection, storage, transportation and disposal;
•dangerous goods and hazardous materials and the collection, storage, transportation and disposal of such substances;
•the clean-up of unlawful discharges;
•employee health and safety.
In addition, as a result of our operations, we may be subject to remediation, clean-up or other administrative orders or amendments to our operating permits and we may be involved from time to time in administrative and judicial proceedings or inquiries. Future orders, proceedings or inquiries could have a material adverse effect on our business, financial condition and results of operations. Environmental laws and land use laws and regulations are constantly changing. New regulations or the increased enforcement of existing laws could have a material adverse effect on our business and financial condition. In addition, compliance with regulatory requirements is expensive, at times requiring the replacement, enhancement or modification of equipment, facilities or operations. There can be no assurance that we will be able to maintain our profitability by offsetting any increased costs of complying with future regulatory requirements.
We are subject to liability for environmental damage at the facilities that we own or operate, including damage to neighboring landowners, residents or employees, particularly as a result of the contamination of soil, groundwater or surface water and especially drinking water. The costs of such liabilities can be substantial. Our potential liability may include damages resulting from conditions existing before we purchased or operated these facilities. We may also be subject to liability for any offsite environmental contamination caused by pollutants or hazardous substances that we or our predecessors arranged to transport, treat or dispose of at other locations. In addition, we may be held legally responsible for liabilities as a successor owner of businesses that we acquire or have acquired. Except for the Stendal mill, the Mercer Spokane facility and the Mercer Conway facility, our facilities have been operating for decades and we have not done invasive testing to determine whether or to what extent any such environmental contamination exists. As a result, these businesses may have liabilities for conditions that we discover or that become apparent, including liabilities arising from non-compliance with environmental laws by prior owners. Because of the limited availability of insurance coverage for environmental liability, any substantial liability for environmental damage could materially adversely affect our results of operations and financial condition.
We have incurred, and we expect to continue to incur, significant capital, operating and other expenditures as a result of complying with applicable environmental laws and regulations.
Further, enactment of new environmental laws or regulations, changes in existing laws or regulations or the interpretation of these laws and regulations might require significant capital expenditures. We may be unable to generate sufficient funds or access other sources of capital to fund unforeseen environmental liabilities or expenditures.
We sell surplus green energy in Germany and are subject to changing energy legislation in response to high prices and energy shortages.
In Germany, our mills sell surplus green energy at market prices or certain of our mills have the option to sell at fixed prices or tariffs pursuant to the Renewable Energy Act. The fixed price tariff expired in December 2024 for our Stendal mill, and expires in 2029 for our Friesau mill and between 2029 to 2034 for our Torgau facility's four cogeneration power plants.
In October 2022, the Council of the European Union formally adopted emergency measures to address high energy prices resulting from the war in Ukraine. The Council adopted a regulation containing temporary measures including a mandatory cap on market revenues at €180 per MWh for inframarginal electricity generators such as renewables, nuclear and lignite producers. In Germany, this was implemented through the adoption of a “windfall” profits tax in December 2022 on electricity producers which expired in June 2023. The windfall profits tax was equivalent to 90% of the revenue above a “baseline” threshold for energy producers.
We cannot predict if either Germany or the European Union will adopt new legal measures if there are further energy shortages and high prices resulting from the Ukraine conflict or otherwise in the future. The effect of the foregoing and any similar legislation may negatively impact our revenues and after tax income from surplus green energy sales during applicable periods.
Further, the availability of tariffs and other incentives for our green energy production activities is dependent, to a large extent, on political and policy developments relating to environmental concerns in the regions in which we operate. We cannot currently predict the scope of any such measures, whether they will provide similar economic incentives as under the tariffs, when, if at all, they will be implemented or their potential application and impact on the expiry of their existing tariffs for certain of our German mills.
Our international sales and operations are subject to applicable laws relating to trade, export controls, foreign corrupt practices and competition laws, the violation of which could adversely affect our operations.
As a result of our international sales and operations, we are subject to trade and economic sanctions and other restrictions imposed by the United States, Canada and other governments or organizations, including prohibitions in the United States against foreign competitors’ (including our operating subsidiaries) receipt of certain unlawful foreign governmental benefits. We are also subject to the U.S. Foreign Corrupt Practices Act of 1977, the Canadian Corruption of Foreign Public Officials Act and other anti-bribery laws that generally bar bribes or unreasonable gifts to governments or officials. Changes in trade sanction laws could restrict our business practices, including cessation of business activities in sanctioned countries or with sanctioned entities, and may result in modifications to compliance programs. Violations of these laws or regulations could result in sanctions including fines, loss of authorizations needed to conduct our international business, the imposition of tariffs or duties and other penalties, which could adversely impact our business, operating results and financial condition.
Product liability claims could adversely affect our operating results.
Our solid wood segment includes the manufacture, sale and distribution of CLT, glulam and other mass timber products, that are based on specific requirements of each customer. We believe that future orders of such products will depend on our ability to maintain the performance, quality and timely delivery standards required by customers. These products may, from time to time, be subject to product liability and warranty claims. If such products have performance or quality issues, or are installed incorrectly by customers or others, we may experience, among other things, warranty and other expenses, replacement costs or reduced or cancelled orders. In addition, product liability and warranty claims could result in costly and time-consuming litigation that could require significant time and attention of management and/or significant monetary damages that could negatively impact our operating results. No assurance can be given that coverage under insurance policies, to the extent applicable, will be adequate to cover any such claims if they arise in the future.
Risks Related to Ownership of our Shares
The price of our common stock may be volatile.
The market price of our common stock may be influenced by many factors, some of which are beyond our control, including those described above and the following:
•actual or anticipated fluctuations in our operating results or our competitors’ operating results;
•announcements by us or our competitors of new products, capacity changes, significant contracts, acquisitions or strategic investments;
•our growth rate and our competitors’ growth rates;
•the financial market and general economic conditions;
•changes in stock market analyst recommendations regarding us, our competitors or the forest products industry generally or lack of analyst coverage of our common stock;
•sales of common stock by our executive officers, directors and significant shareholders;
•changes in accounting principles; and
•changes in laws and regulations.
In addition, there has been significant volatility in the market price and trading volume of securities of companies operating in the forest products industry that often has been unrelated to the operating performance of particular companies. Some companies that have had volatile market prices for their securities have had securities litigation brought against them. If litigation of this type is brought against us, it could result in substantial costs and would divert management’s attention and resources.
A small number of our shareholders could significantly influence our business.
There are a few significant shareholders of our common stock who own a substantial percentage of the outstanding shares of our common stock. These few significant shareholders, either individually or acting together, may be able to exercise significant influence over matters requiring shareholder approval, including the election of directors and approval of significant corporate transactions, such as a merger or other sale of the company or our assets. This concentration of ownership may make it more difficult for other shareholders to effect substantial changes in the company, may have the effect of delaying, preventing or expediting, as the case may be, a change in control of the company and may adversely affect the market price of our common stock. Further, the possibility that one or more of these significant shareholders may sell all or a large portion of their common stock in a short period of time could adversely affect the trading price of our common stock. Also, the interests of these few shareholders may not be in the best interests of all shareholders.
None.
ITEM 1C. CYBERSECURITY
We maintain comprehensive programs and technologies to ensure that our information systems are effective and prepared for data privacy and cybersecurity risks, including regular oversight of our security programs for monitoring internal and external threats to ensure the confidentiality and privacy of our data. As the volume and complexity of cyberattacks continue to evolve, we continue to enhance our security capabilities by continued investment in cyber technologies, further developing our internal cybersecurity personnel and educating our workforce regarding cybersecurity, and leveraging emerging technologies.
Risk Management and Strategies
We regularly perform evaluations of our security program and continue to implement controls aligned with industry guidelines to identify threats, detect attacks and protect data. Our risk management strategy is
focused on three areas: (i) technology, being our hardware and software systems; (ii) processes, being our cybersecurity reporting, testing and other processes; and (iii) people, which refers to our internal cybersecurity personnel, external service providers and individual training and human interaction within our information technology and cybersecurity processes. We seek to align our cybersecurity program with practices recommended under ISO 27001 and by the National Institute of Standards and Technology and the Center for Internet Security Critical Security Controls.
When reviewing key third-party information technology service providers, our engagement process customarily includes, among other things, a review of such providers’ cybersecurity measures. Additionally, we use third-party data, such as Security Scorecard, to review and monitor such providers and as an indicator in respect of our cybersecurity environments.
We periodically undertake cybersecurity audits or other independent assessments, the results of which are reported to our Audit Committee. We have also implemented security monitoring programs designed to alert us of any suspicious activity, and have developed an incident response program in the event of a security breach. We have also engaged a third-party vendor to, among other things, provide continuous monitoring and respond to cybersecurity events.
We implement various training programs periodically to ensure that our employees and other personnel comply with internal processes and to enhance their cybersecurity awareness.
Additionally, we have engaged third-party providers to supplement our response capabilities for both informational and operational technology incidents, as needed.
As of the date of this filing, we have not identified any cybersecurity threats or incidents that have materially affected or are reasonably likely to materially affect our business strategy, results of operations, or financial condition. However, there can be no assurance that we, or our third-party partners or service providers, will not experience a cybersecurity threat or incident in the future that could materially adversely affect our business strategy, results of operations, or financial condition.
For further discussion of the risks related to cybersecurity, see also Item 1A. “Risk Factors – Risks Related to our Business - Failures or security breaches of our information technology systems could disrupt our operations and negatively impact our business”.
Governance
Our board of directors oversees our risk management processes and has tasked our Audit Committee with oversight of our cybersecurity and information governance, including periodically reviewing and discussing with management our risk exposures relating to data privacy and cybersecurity, and reviewing the steps we have taken to identify, assess, monitor, mitigate and manage such exposure and cybersecurity risks. At the management level, our Director of Cybersecurity is responsible for overseeing our cybersecurity processes and risk management, working together with our Chief Information Officer to implement our cybersecurity initiatives.
Our Audit Committee and management meet with the Board on a quarterly basis to provide updates on cybersecurity risks, material cyberattacks and security incidents as they occur, as well as to promote company-wide cyber risk and security awareness. Additionally, our Chief Information Officer and Director of Cybersecurity meet periodically with the Board or the Audit Committee to brief them on technology and information security matters.
Our Director of Cybersecurity is informed of cybersecurity incidents by applicable personnel, and oversees remediation efforts in accordance with our policies and processes. Our Chief Information Officer reports to our Audit Committee on significant incidents periodically. Our Chief Information Officer has over 30 years of technology leadership experience and is, among other things, a Certified Information Systems Security Professional and a Certified Secure Infrastructure Specialist. Our Director of Cybersecurity has over 20 years of experience as a cybersecurity and information technology professional. He has held various leadership positions where he developed, managed and implemented security programs and controls. He also holds,
among other information technology certifications, the Certified Information Systems Security Professional designation.
ITEM 2. PROPERTIES
We own the Stendal, Rosenthal, Celgar, Peace River pulp mills, and their underlying properties. We also own the Friesau mill and the Torgau, Mercer Spokane, Mercer Conway, Mercer Okanagan facilities and their underlying properties.
Stendal Mill. The Stendal mill is situated on a 335 acre site that is part of a larger 3,090 acre industrial park near the town of Arneburg in the state of Saxony-Anhalt, approximately 185 miles north of the Rosenthal mill and 80 miles west of Berlin. The mill is adjacent to the Elbe River and has access to harbor facilities for water transportation. The mill is a single line mill with a current annual production capacity of approximately 740,000 ADMTs of kraft pulp. The Stendal mill is self-sufficient in steam and electrical power. Some excess electrical power which is constantly being generated is sold to the regional power grid. The facilities at the mill include:
•an approximately 740,000 square feet fiber and roundwood storage area;
•debarking and chipping facilities for pulp logs;
•a fiber line, which includes 12 SuperBatch™ digesters and bleaching facilities;
•a pulp machine, which includes a dryer, a cutter and two baling lines;
•an approximately 105,000 square feet finished goods storage area;
•a chemical recovery line, which includes a recovery boiler, evaporation plant, recausticizing plant and lime kiln;
•a wastewater treatment plant; and
•a power station with two turbines capable of producing 148 MW of electrical power.
Rosenthal Mill. The Rosenthal mill is situated on a 230 acre site in the town of Rosenthal am Rennsteig in the state of Thuringia, approximately 185 miles south of Berlin. The Saale River flows through the site of the mill. In late 1999, we completed a major capital project which converted the Rosenthal mill to the production of kraft pulp. It is a single line mill with a current annual production capacity of approximately 360,000 ADMTs of kraft pulp. The mill is self-sufficient in steam and electrical power. Some excess electrical power which is constantly generated is sold to the regional power grid. The facilities at the mill include:
•an approximately 425,000 square feet fiber storage area;
•debarking and chipping facilities for pulp logs;
•an approximately 625,000 square feet roundwood yard;
•a fiber line, which includes a Kamyr continuous digester and bleaching facilities;
•a pulp machine, which includes a dryer, a cutter and a baling line;
•an approximately 60,000 square feet finished goods storage area;
•a chemical recovery line, which includes a recovery boiler, evaporation plant, recausticizing plant and lime kiln;
•a wastewater treatment plant;
•a power station with a turbine capable of producing 57 MW of electrical power.
Celgar Mill. The Celgar mill is situated on a 400 acre site near the city of Castlegar, British Columbia. The mill is located on the south bank of the Columbia River, approximately 375 miles east of the port city of Vancouver, British Columbia, and approximately 20 miles north of the Canada-U.S. border. The city of Seattle, Washington is approximately 405 miles southwest of Castlegar. The Celgar mill is a single line mill with a current annual production capacity of approximately 520,000 ADMTs of kraft pulp. The mill is self-sufficient in steam and electrical power. Some excess electrical power which is constantly generated is sold to the regional power grid. The facilities at the Celgar mill include:
•an approximately 450,000 square feet fiber storage area and an approximately 440,000 square feet log storage area;
•a wood room containing debarking and chipping facilities for pulp logs;
•a fiber line, which includes a dual vessel hydraulic digester, a two stage oxygen delignification system and a four stage bleach plant;
•two pulp machines, which each include a dryer, a cutter and a baling line;
•an approximately 28,000 square feet on-site finished goods storage area and an approximately 29,000 square feet off-site finished goods storage area;
•a chemical recovery line, which includes a recovery boiler, evaporation plant, recausticizing plant and lime kiln;
•a wastewater treatment system; and
•a power station with two turbines capable of producing approximately 100 MW of electrical power.
Peace River Mill. The Peace River mill is situated on a 791 acre site near the town of Peace River, Alberta, approximately 305 miles north of Edmonton, Alberta. The mill has an annual production capacity of approximately 475,000 ADMTs of kraft pulp. The mill is self-sufficient in steam and electrical power. Some excess electrical power which is constantly generated is sold to the regional power grid. The facilities at the Peace River mill include:
•an approximately 1,130,000 square feet fiber storage area and an approximately 2,700,000 square feet log storage area;
•an approximately 189 railcar siding/storage capacity;
•a fiber line which includes a dual vessel hydraulic digester, a single stage oxygen delignification system and a four stage bleach plant;
•a pulp machine, which includes a dryer, cutter and two baling lines;
•an approximately 56,000 square feet on-site finished goods storage area;
•a chemical recovery line, which includes a recovery boiler, evaporation plant, recausticizing plant and a lime kiln;
•a fresh water treatment plant;
•a wastewater treatment system; and
•two turbines capable of producing approximately 65 MW of electrical power.
Friesau Mill. The Friesau mill is situated on a 150 acre site in the town of Saalburg-Ebersdorf, Germany, approximately 185 miles south of Berlin and only 10 miles from the Rosenthal mill. It is a two-line sawmill
with an annual production capacity of approximately 550 MMfbm of lumber on a continuously operating basis. The mill also sells electrical power to the regional power grid. The mill is self-sufficient in thermal power. The facilities at the Friesau mill include:
•an approximately 1,000,000 square feet roundwood storage area;
•three log debarking and two sorting lines;
•34 lumber kilns capable of matching sawmill production;
•an approximately 663,800 square feet finished goods storage area; and
•a biomass fueled cogeneration power plant capable of producing 13 MW of electrical power.
Torgau Facility. The Torgau site is situated on a 270 acre site in the town of Torgau, Germany, approximately 70 miles south of Berlin and approximately 95 miles north of the Friesau and Rosenthal mills. It is an integrated production site with two sawmills with an annual lumber capacity of approximately 410 MMfbm and a pallet production capacity of 17 million pallets and two biofuel plants (wood pellets and briquettes) with a total capacity of 230,000 tonnes. The mill also sells electrical power to the regional power grid. The mill is self-sufficient in thermal power. Its facilities include:
•four logyards totaling approximately 1,000,000 square feet with log debarking and sorting lines;
•three sawlines (one Linck, one EWD and one Hew sawline with Kallfass sorting lines) and one milling line;
•EPAL pallet production with eight Coralli and one Storti line;
•two progressive kilns and nine drying kilns capable of matching pallet and sawmill production;
•pellet production with six Münch presses as well as two Salmatec presses;
•briquette production with 12 lines (Nielsen);
•two storage silos for pellets with a total capacity of 5,000 cubic tonnes; and
•four biomass fueled cogeneration power plants capable of producing 15 MW of electrical power.
Mercer Spokane Facility. The Mercer Spokane facility is situated on approximately 54 acres of land near Spokane, Washington. The Mercer Spokane facility has an annual production capacity of approximately 140,000 m3 or 13 million square feet of 5-ply CLT panels. Its facilities include:
•a Transverse High Grader sorting line;
•a Lineal High Grader Sorting Line;
Mercer Conway Facility. The Mercer Conway facility is situated on approximately 124 acres of land near Conway, Arkansas. The Mercer Conway facility has an annual production capacity of approximately 75,000 m3 of CLT and glulam. Its facilities include:
•a Transverse High Grader sorting line;
•an industry-first glulam press;
•a Lineal High Grader Sorting Line;
Mercer Okanagan Facility. The Mercer Okanagan facility is located in Okanagan Falls, British Columbia, and is situated on approximately 20 acres of land. The Mercer Okanagan facility has an annual production capacity of approximately 40,000 m3 of CLT and glulam. Its facilities include:
•large portal glulam CNC machine;
•glulam jigs, including an arch-line;
•a glulam beam planer and sander;
•two finger jointing lines; and
ITEM 3. LEGAL PROCEEDINGS
We are subject to routine litigation incidental to our business. We do not believe that the outcome of such litigation will have a material adverse effect on our business or financial condition.
ITEM 4. MINE SAFETY DISCLOSURES
Not applicable.
PART II
ITEM 5. MARKET FOR REGISTRANT’S COMMON EQUITY, RELATED STOCKHOLDER MATTERS AND ISSUER PURCHASES OF EQUITY SECURITIES
(a)Market Information. Our shares are quoted for trading on the NASDAQ Global Select Market under the symbol “MERC”.
(b)Shareholder Information. As of February 18, 2025, there were approximately 172 holders of record of our shares and a total of 66,870,774 shares were outstanding.
(c)Dividend Information. On February 20, 2025, we announced that our board of directors declared a quarterly dividend of $0.075 per share to be paid to holders of our common stock on April 2, 2025 to shareholders of record on March 26, 2025.
In 2024, our board of directors approved four quarterly dividend payments of $0.075 per share each, paid on April 4, July 3, October 3 and December 26.
The further declaration and payment of dividends is at the discretion of our board of directors and will depend upon various factors, including our earnings, financial condition, restrictions imposed by our credit facilities and the terms of any other indebtedness that may be outstanding, cash requirements, future prospects and other factors deemed relevant by our board of directors. The indentures governing our Senior Notes and our credit facilities limit our ability to pay dividends or make other distributions on capital stock. See Item 1. “Business – Description of Certain Indebtedness”.
(d)Equity Compensation Plans. The following table sets forth information as of December 31, 2024 with respect to the shares of our common stock that may be issued under our existing equity compensation plans:
| | | | | | | | | | | | | | | | | | |
| | Number of securities to be issued upon exercise of outstanding options, warrants and rights
(a) | | | Weighted-average exercise price of outstanding options, warrants and rights
(b)
($) | | | Number of securities remaining available for future issuance under equity compensation plans (excluding securities reflected in column (a))
(c) | |
Plan Category | | | | | | | | | | | | | | | |
Equity compensation plans approved by shareholders(1)(2) | | | | | — | | | | | | — | | | | | | 1,136,333 | |
Equity compensation plans not approved by shareholders | | | | | — | | | | | | — | | | | | | — | |
(1)Excludes 21,054 outstanding restricted shares and 93,760 deferred stock units, 43,363 of which had vested as of December 31, 2024 and 4,379,461 outstanding performance share units, 1,142,097 of which had vested as of December 31, 2024. The underlying shares of common stock relating to the vested performance share units will be issued in February 2025. Of the remaining 3,237,364 performance share units, 1,263,178 will vest in 2026 and 1,974,186 will vest in 2027. The actual number of shares of common stock issued in respect of the performance share units will vary from 0% to 200% of performance share units granted, based upon achievement of performance objectives established for such awards.
(2)Represents the number of shares of our common stock remaining available for issuance under the 2022 Stock Incentive Plan as of December 31, 2024.
In May 2022, our board of directors adopted an amended and restated stock incentive plan (the “2022 Stock Incentive Plan”) which provides for stock options, restricted stock units, which under the prior plan were called “restricted stock rights”, deferred stock units, restricted shares, performance shares, performance share units, and stock appreciation rights to be awarded to employees, consultants and non-employee directors. The 2022 Stock Incentive Plan replaced the Company’s 2010 stock incentive plan (the “2010 Stock Incentive Plan”). However, the 2010 Stock Incentive Plan will govern prior awards until all awards granted under the 2010 Stock Incentive Plan have been exercised, forfeited, cancelled, expired, or otherwise terminated in accordance with the
terms thereof. The Company may grant up to a maximum of 2.5 million common shares under the 2022 Stock Incentive Plan.
(e)Performance Graph. The following graph shows a five-year comparison of cumulative total shareholder return, calculated on an assumed dividend reinvested basis, for our common stock, the S&P SmallCap 600 Index, a group of peer companies, referred to as the “Peer Group”, and Standard Industrial Classification Code Index or “SIC” (SIC Code 2611 - pulp mills), referred to as the “SIC Code Index”. The graph assumes $100 was invested in each of our common stock, the S&P SmallCap 600 Index, the Peer Group and the SIC Code Index on December 31, 2019. Data points on the graph are annual.
Comparison of Cumulative Total Return
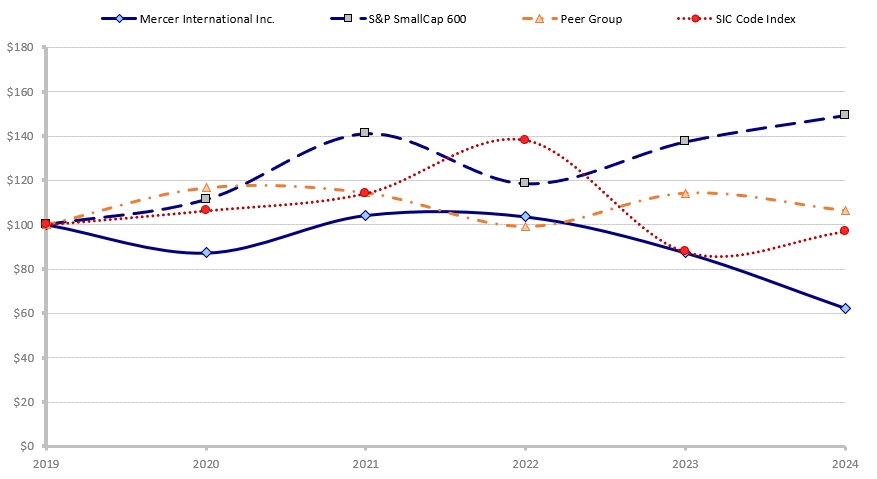
Assumes $100 Invested December 31, 2019
Assumes Dividends Reinvested
Fiscal Year Ending December 31, 2024
| | | | | | | | | | | | | | | | | | | | | | | | |
| | 2019 | | | 2020 | | | 2021 | | | 2022 | | | 2023 | | | 2024 | |
Mercer International Inc. | | $ | 100.00 | | | $ | 87.24 | | | $ | 104.19 | | | $ | 103.54 | | | $ | 87.29 | | | $ | 62.33 | |
S&P SmallCap 600 Index | | $ | 100.00 | | | $ | 111.29 | | | $ | 141.13 | | | $ | 118.41 | | | $ | 137.42 | | | $ | 149.37 | |
SIC Code Index | | $ | 100.00 | | | $ | 106.31 | | | $ | 114.10 | | | $ | 138.09 | | | $ | 87.71 | | | $ | 96.95 | |
Peer Group(1) | | $ | 100.00 | | | $ | 116.61 | | | $ | 114.36 | | | $ | 99.24 | | | $ | 114.24 | | | $ | 106.38 | |
(1)The Peer Group is determined by our Human Resources Committee and is comprised of Borregaard ASA, Canfor Pulp Products Inc., Empresas CMPC S.A., ENCE Energía y Celulosa S.A., International Paper, Klabin S.A., Metsä Board Oyj, Rayonier Advanced Materials Inc., Rottneros AB, Stora Enso Oyj, Suzano S.A., Svenska Cellulosa AB SCA, UPM-Kymmene Oyj, and West Fraser Timber Co. Ltd.
NON-GAAP FINANCIAL MEASURES
This Annual Report on Form 10-K contains “non-GAAP financial measures”, that is, financial measures that either exclude or include amounts that are not excluded or included in the most directly comparable measure calculated and presented in accordance with the generally accepted accounting principles in the United States, referred to as “GAAP”. Specifically, we make use of the non-GAAP financial measures “Operating EBITDA” and “Operating EBITDA margin”.
We define Operating EBITDA as operating income (loss) plus depreciation and amortization and long-lived asset impairment charges. Operating EBITDA margin is Operating EBITDA expressed as a percentage of revenues.
We use Operating EBITDA and Operating EBITDA margin as benchmark measurements of our own operating results and as benchmarks relative to our competitors. We consider them to be meaningful supplements to operating income (loss) as performance measures primarily because depreciation expense and long-lived asset impairment charges are not actual cash costs and depreciation expense varies widely from company to company in a manner that we consider largely independent of the underlying cost efficiency of our operating facilities. In addition, we believe Operating EBITDA is commonly used by securities analysts, investors and other interested parties to evaluate our financial performance.
Operating EBITDA does not reflect the impact of a number of items that affect our net income (loss), including financing costs, income taxes and the effect of derivative instruments. Operating EBITDA is not a measure of financial performance under GAAP and should not be considered as an alternative to net income (loss) or operating income (loss) as a measure of performance, or as an alternative to net cash from (used in) operating activities as a measure of liquidity. Operating EBITDA and Operating EBITDA margin are internal measures and therefore may not be comparable to other companies.
Operating EBITDA has significant limitations as an analytical tool, and should not be considered in isolation, or as a substitute for analysis of our results as reported under GAAP. Some of these limitations are that Operating EBITDA does not reflect: (i) our cash expenditures, or future requirements, for capital expenditures or contractual commitments; (ii) changes in, or cash requirements for, working capital needs; (iii) the significant interest expense, or the cash requirements necessary to service interest or principal payments, on our outstanding debt; (iv) the impact of realized or marked to market changes in our derivative positions, which can be substantial; and (v) the impact of impairment charges against our investments or long-lived assets. Because of these limitations, Operating EBITDA should only be considered as a supplemental performance measure and should not be considered as a measure of liquidity or cash available to us to invest in the growth of our business. Because all companies do not calculate Operating EBITDA in the same manner, Operating EBITDA as calculated by us may differ from Operating EBITDA or EBITDA as calculated by other companies. We compensate for these limitations by using Operating EBITDA as a supplemental measure of our performance and by relying primarily on our GAAP financial statements.
Operating EBITDA and Operating EBITDA margin are non-GAAP financial measures at the consolidated level and are considered different from Operating EBITDA at the segment level, referred to as “Segment Operating EBITDA”, which is our single measure of segment profit or loss presented in our financial statements under GAAP. For more information on Segment Operating EBITDA, refer to the segment information note within our consolidated financial statements.
ITEM 6. [RESERVED]
ITEM 7. MANAGEMENT’S DISCUSSION AND ANALYSIS OF FINANCIAL CONDITION AND RESULTS OF OPERATIONS
The following discussion and analysis of our financial condition and results of our operations for the years ended December 31, 2024 and 2023 is based upon and should be read in conjunction with the consolidated financial statements and related notes included elsewhere in this Annual Report. Please refer to Item 7. “Management’s Discussion and Analysis of Financial Condition and Results of Operations” in our Annual Report on Form 10-K for the year ended December 31, 2023 for a discussion of our results of operations for 2022 and financial position as of December 31, 2022. This Annual Report contains forward-looking statements that involve risks and uncertainties, including statements respecting our plans, estimates and beliefs and outlook on the markets in which we operate. Our actual results may differ materially from those indicated in forward-looking statements. See “Cautionary Note Regarding Forward-Looking Statements” and Item 1A. “Risk Factors”.
Results of Operations
General
We have two reportable operating segments:
•Pulp – consists of the manufacture, sale and distribution of pulp, electricity and chemicals at our pulp mills.
•Solid Wood – consists of the manufacture, sale and distribution of lumber, manufactured products (including CLT, glulam and finger joint lumber), wood pallets, electricity, biofuels and wood residuals at our sawmills and other facilities in Germany and our mass timber facilities in North America.
Each segment offers primarily different products and requires different manufacturing processes, technology and sales and marketing.
Markets for kraft pulp are global, cyclical and commodity based. Our financial performance depends on a number of variables that impact sales and production costs. Sales and production results for kraft pulp are influenced largely by the market price for kraft pulp, fiber costs and foreign currency exchange rates. Kraft pulp prices are highly cyclical and primarily determined by the balance between supply and demand. Pricing and demand are influenced by global macroeconomic conditions, changes in consumption and industry capacity, the level of customer and producer inventories and fluctuations in exchange rates. The third-party industry quoted average European list prices for NBSK pulp between 2015 and 2024 have fluctuated between a low of $790 per ADMT in 2016 to a high of $1,635 per ADMT in 2024. In the same period, third-party industry quoted average North American list prices for NBHK pulp have fluctuated between a low of $820 per ADMT in 2016 to a high of $1,620 per ADMT in 2022.
Our pulp sales realizations are based on third-party industry quoted list prices, net of customer discounts, rebates and other selling concessions. Our sales to China and Asia are generally based closer to third-party industry quoted prices, which are quoted on a net basis, inclusive of discounts, allowances, rebates and other selling concessions.
The market for lumber is cyclical and generally driven by macroeconomic conditions, producer inventories and fluctuations in exchange rates. As a key construction material, the pricing and demand for lumber is significantly influenced by the number of housing starts, especially in the U.S. In the U.S., third-party industry quoted monthly average western spruce/pine/fir (“WSPF”) 2 x 4 #2&Btr prices between 2015 and 2024 have fluctuated between a low of $245 per Mfbm in 2015 to a high of $1,604 per Mfbm in 2021. Similarly, the demand for CLT is primarily driven by the wood construction market and government policies focused on a low-carbon economy.
European and U.S. lumber markets differ. In the European market, lumber is generally customized in terms
of dimensions and finishing, whereas the U.S. market is driven primarily by demand from new housing starts and home renovation activities and dimensions and finishing are generally standardized and competition is primarily price driven.
Energy and chemical production and sales are key revenue sources for us. Further initiatives to increase our generation and sales of renewable energy, chemicals and other by-products will continue to be a key focus for us. Such further initiatives may require additional capital spending.
Energy and chemicals are by-products of our pulp and lumber production and the volumes generated and sold are primarily related to the rate of production. Prices for our energy and chemical sales are generally stable and unrelated to cyclical changes in pulp or lumber prices.
Our production costs are influenced by the availability and cost of raw materials, energy and labor, and our plant efficiencies and productivity. Our main raw material is fiber in the form of wood chips, pulp logs, sawlogs and lumber. Fiber costs are primarily affected by the supply of, and demand for, lumber and pulp, which are both highly cyclical. Higher fiber costs could affect producer profit margins if they are unable to pass along price increases to pulp, lumber, pallet and biofuel customers or purchasers of surplus energy.
Our financial performance is also impacted by changes in the dollar to euro and Canadian dollar exchange rates. Changes in currency rates affect our operating results because most of our operating costs at our German mills are incurred in euros and those at our Canadian mills are in Canadian dollars. These costs do not fluctuate with the dollar to euro or Canadian dollar exchange rates. Thus, an increase in the strength of the dollar versus the euro and the Canadian dollar decreases our operating costs and increases our operating margins and income from operations. Conversely, a weakening of the dollar against the euro and the Canadian dollar tends to increase our operating costs and decrease our operating margins and income from operations. Our energy, chemical, pallet, biofuel, wood residual and European lumber sales are made in local currencies and, as a result, decline in dollar terms when the dollar strengthens and increase when the dollar weakens.
As a corollary to changes in exchange rates between the dollar and the euro and Canadian dollar, a stronger dollar generally increases costs to our customers and results in downward pressure on pulp prices. Conversely, a weakening dollar generally supports higher pulp pricing. However, there is invariably a time lag between changes in currency exchange rates and prices. This lag can vary and is not predictable with any precision.
Production costs also depend on the total volume of production. High operating rates and production efficiencies permit us to lower our average per unit cost by spreading fixed costs over more units. Higher operating rates also permit us to increase our generation and sales of surplus renewable energy, chemicals and biofuels. Our production levels are also dependent on, among other things, the number of days of maintenance downtime at our mills.
Unexpected maintenance downtime can be particularly disruptive in our industry.
Selected 2024 Highlights
In 2024, we:
•refinanced our 2026 Senior Notes using cash on hand and proceeds from an add-on offering of our existing 2028 Senior Notes, thereby extending the maturity of our earliest senior notes to 2028, and decreased our long-term debt by over $100.0 million;
•exited the CPP joint venture, which allowed us to direct resources to areas aligned with our long-term focus; and
•successfully completed two large-scale mass timber building projects in the U.S.
Current Market Environment
We currently expect NBSK pulp prices to modestly increase in all our markets in the first half of 2025 as a result of stable demand and continued supply constraints. For NBHK pulp prices, we currently expect a modest increase in the first half of 2025 due to stable demand.
In our solid wood segment, we currently expect U.S. lumber prices to increase slightly in the first half of 2025 as a result of limited supply. In Europe, we currently expect lumber prices to modestly increase due to stronger demand driven by improved economic conditions in certain European countries. We currently expect mass timber prices to decrease in the first half of 2025 as the relatively high interest rate environment continues to soften demand. Pallet prices are expected to be generally stable in the first half of 2025.
Demand and pricing for our products may be further impacted by ongoing developments regarding U.S. trade policies involving Canada and the European Union. See Item 1. “Risk Factors” for further information.
Summary Financial Highlights
| | | | | | | | |
| | Year Ended December 31, | |
| | 2024 | | | 2023 | |
| | (in thousands, other than percent and per share amounts) | |
Statement of Operations Data | | | | | | |
Revenues from external customers | | | | | | |
Pulp segment | | $ | 1,548,556 | | | $ | 1,516,130 | |
Solid wood segment | | | 485,991 | | | | 472,054 | |
Corporate and other | | | 8,813 | | | | 5,660 | |
Total revenues | | $ | 2,043,360 | | | $ | 1,993,844 | |
| | | | | | |
Pulp Segment Operating EBITDA(1) | | $ | 260,914 | | | $ | 65,889 | |
Solid wood Segment Operating EBITDA(1) | | | (4,390 | ) | | | (30,343 | ) |
Corporate and other | | | (12,802 | ) | | | (18,084 | ) |
Operating EBITDA(2) | | $ | 243,722 | | | $ | 17,462 | |
Operating EBITDA margin(2) | | | 12 | % | | | 1 | % |
| | | | | | |
Net loss | | $ | (85,141 | ) | | $ | (242,056 | ) |
Net loss per common share | | | | | | |
Basic | | $ | (1.27 | ) | | $ | (3.65 | ) |
Diluted | | $ | (1.27 | ) | | $ | (3.65 | ) |
Common shares outstanding at period end | | | 66,871 | | | | 66,525 | |
(1)Segment Operating EBITDA is a measure of segment profit or loss presented in our financial statements under GAAP. Refer to the segment information note in our consolidated financial statements for more information.
(2)Operating EBITDA and Operating EBITDA margin are non-GAAP measures. See “Non-GAAP Financial Measures” for their descriptions, limitations and why we consider them to be useful measures. The following table provides a reconciliation of net loss to operating income (loss) and Operating EBITDA for the years indicated:
| | | | | | | | |
| | Year Ended December 31, | |
| | 2024 | | | 2023 | |
| | (in thousands) | |
Net loss | | $ | (85,141 | ) | | $ | (242,056 | ) |
Income tax recovery | | | (1,774 | ) | | | (27,767 | ) |
Interest expense | | | 109,150 | | | | 88,246 | |
Other income | | | (7,228 | ) | | | (7,197 | ) |
Operating income (loss) | | | 15,007 | | | | (188,774 | ) |
Add: Depreciation and amortization | | | 170,793 | | | | 172,502 | |
Add: Impairment of sandalwood business held for sale | | | — | | | | 33,734 | |
Add: Loss on disposal of investment in joint venture | | | 23,645 | | | | — | |
Add: Goodwill impairment | | | 34,277 | | | | — | |
Operating EBITDA | | $ | 243,722 | | | $ | 17,462 | |
Selected Production, Sales and Other Data
| | | | | | | | | |
| | Year Ended December 31, | | |
| | 2024 | | | 2023 | | |
Pulp Segment | | | | | | | |
Pulp production ('000 ADMTs) | | | | | | | |
NBSK | | | 1,589.1 | | | | 1,714.4 | | |
NBHK | | | 254.0 | | | | 251.2 | | |
Annual maintenance downtime ('000 ADMTs) | | | 86.9 | | | | 82.9 | | |
Annual maintenance downtime (days) | | | 57 | | | | 71 | | |
Pulp sales ('000 ADMTs) | | | | | | | |
NBSK | | | 1,647.5 | | | | 1,689.0 | | |
NBHK | | | 252.3 | | | | 262.2 | | |
Average NBSK pulp prices ($/ADMT)(1) | | | | | | | |
Europe | | | 1,519 | | | | 1,257 | | |
China | | | 774 | | | | 747 | | |
North America | | | 1,646 | | | | 1,448 | | |
Average NBHK pulp prices ($/ADMT)(1) | | | | | | | |
China | | | 645 | | | | 592 | | |
North America | | | 1,356 | | | | 1,227 | | |
Average pulp sales realizations ($/ADMT)(2) | | | | | | | |
NBSK | | | 784 | | | | 729 | | |
NBHK | | | 637 | | | | 627 | | |
Energy production ('000 MWh)(3) | | | 2,125.3 | | | | 2,142.0 | | |
Energy sales ('000 MWh)(3) | | | 797.2 | | | | 832.6 | | |
Average energy sales realizations ($/MWh)(3) | | | 91 | | | | 107 | | |
Solid Wood Segment | | | | | | | |
Lumber | | | | | | | |
Production (MMfbm) | | | 475.6 | | | | 462.3 | | |
Sales (MMfbm) | | | 470.4 | | | | 500.5 | | |
Average sales realizations ($/Mfbm) | | | 462 | | | | 435 | | |
Energy | | | | | | | |
Production and sales ('000 MWh) | | | 126.3 | | | | 160.2 | | |
Average sales realizations ($/MWh) | | | 131 | | | | 134 | | |
Manufactured products(4) | | | | | | | |
Production ('000 m3) | | | 34.0 | | | | 25.1 | | |
Sales ('000 m3) | | | 30.7 | | | | 33.4 | | |
Average sales realizations ($/m3) | | | 3,006 | | | | 1,514 | | |
Pallets | | | | | | | |
Production ('000 units) | | | 10,243.5 | | | | 10,707.2 | | |
Sales ('000 units) | | | 10,089.2 | | | | 11,041.2 | | |
Average sales realizations ($/unit) | | | 10 | | | | 11 | | |
Biofuels(5) | | | | | | | |
Production ('000 tonnes) | | | 160.4 | | | | 167.2 | | |
Sales ('000 tonnes) | | | 184.4 | | | | 144.8 | | |
Average sales realizations ($/tonne) | | | 217 | | | | 281 | | |
Average Spot Currency Exchange Rates | | | | | | | |
$ / €(6) | | | 1.0820 | | | | 1.0817 | | |
$ / C$(6) | | | 0.7302 | | | | 0.7412 | | |
(1)Source: RISI pricing report. Europe and North America are list prices. China are net prices which include discounts, allowances and rebates.
(2)Sales realizations after customer discounts, rebates and other selling concessions.
(3)Does not include our 50% joint venture interest in CPP, which is accounted for using the equity method. In 2024, we disposed of this interest.
(4)Manufactured products primarily includes CLT and glulam.
(5)Biofuels includes pellets and briquettes.
(6)Average Federal Reserve Bank of New York Noon Buying Rates over the reporting period.
Year Ended December 31, 2024 Compared to Year Ended December 31, 2023
Consolidated – Year Ended December 31, 2024 Compared to Year Ended December 31, 2023
Total revenues in 2024 modestly increased to $2,043.4 million from $1,993.8 million in 2023 as higher pulp, manufactured products and lumber sales realizations were offset by lower sales realizations from our other products and lower pulp and lumber sales volumes.
Costs and expenses in 2024 decreased by approximately 7% to $2,028.4 million from $2,182.6 million in 2023 primarily as a result of lower per unit production costs due to the easing of inflationary pressure and cost reduction initiatives, lower sales volumes and foreign exchange gains mainly on dollar denominated accounts receivables held at our operations as the dollar strengthened relative to the euro and the Canadian dollar at the end of 2024. In 2024, costs and expenses included a non-cash loss of $23.6 million recognized in connection with the dissolution of the CPP joint venture and a non-cash goodwill impairment of $34.3 million related to the Torgau facility, which was recognized as a result of ongoing weakness in lumber, pallet and biofuels markets in Europe stemming from high interest rates and other economic conditions. We have achieved some of the planned synergies from the Torgau acquisition and expect to achieve further synergies as market and economic conditions improve. In 2023, we received insurance proceeds of $46.4 million relating to the 2021 turbine downtime at the Rosenthal mill and the 2022 fire at the Stendal mill and we recognized a $33.7 million non-cash impairment in connection with the classification of our sandalwood business as held for sale.
In 2024, cost of sales depreciation and amortization was $170.5 million compared to $172.2 million in 2023.
The dollar was relatively flat against the Canadian dollar and euro in 2024 compared to 2023.
Selling, general and administrative expenses decreased by approximately 6% to $116.4 million in 2024 from $123.2 million in 2023 primarily as a result of lower employee compensation and consulting fees.
Our operating income increased to $15.0 million in 2024 from an operating loss of $188.8 million in 2023. The increase was primarily due to higher pulp, manufactured products and lumber sales realizations, lower per unit fiber and other production costs and the positive foreign exchange impact of a stronger dollar. These increases were partially offset by lower sales realizations from our other products and the $57.9 million recognized under costs and expenses related to the non-cash goodwill impairment and the non-cash loss on disposal of the CPP joint venture investment.
Interest expense in 2024 increased by approximately 24% to $109.2 million from $88.2 million in 2023 primarily as a result of the issuance of $200.0 million of additional 2028 Senior Notes in September 2023.
Other income was $7.2 million in each of 2024 and 2023. Other income in 2024 and 2023 primarily consisted of interest earned on cash.
In 2024, we had an income tax recovery of $1.8 million, or an effective tax rate of approximately 2% primarily due to the non-deductibility of the non-cash goodwill impairment recognized in 2024 and because we do not recognize a tax recovery for certain entities which we do not expect to realize a tax benefit. In 2023, we had an income tax recovery of $27.8 million, or an effective tax rate of 10%, as we do not recognize a tax recovery for certain entities for which we do not expect to realize a tax benefit.
In 2024, our net loss was $85.1 million, or $1.27 per share, compared to $242.1 million, or $3.65 per share in 2023. The net loss in 2024 included a total of $57.9 million, or $0.87 per share, related to the non-cash goodwill impairment and the non-cash loss recognized on disposal of our CPP joint venture investment.
In 2024, Operating EBITDA increased to $243.7 million from $17.5 million in 2023 primarily due to higher pulp, manufactured products and lumber sales realizations, lower per unit fiber and other production costs and the positive foreign exchange impact of a stronger dollar. These increases were partially offset by lower sales realizations from our other products. In 2023, we received insurance proceeds of $46.4 million relating to the 2021 turbine downtime at the Rosenthal mill and the 2022 fire at the Stendal mill.
Pulp Segment – Year Ended December 31, 2024 Compared to Year Ended December 31, 2023
Selected Financial Information
| | | | | | | | | | | | |
| | | | | | Year Ended December 31, | |
| | | | | | 2024 | | | 2023 | |
| | | | | | (in thousands) | |
Pulp revenues | | | | | | $ | 1,460,460 | | | $ | 1,402,620 | |
Energy and chemical revenues | | | | | | $ | 88,096 | | | $ | 113,510 | |
Segment Operating EBITDA(1) | | | | | | $ | 260,914 | | | $ | 65,889 | |
(1)Segment Operating EBITDA is a measure of segment profit or loss presented in our financial statements under GAAP. Refer to the segment information note in our consolidated financial statements for more information.
Pulp segment revenues, comprised of pulp, energy and chemical revenues, modestly increased to $1,548.6 million in 2024 from $1,516.1 million in 2023 as higher pulp revenues were partially offset by lower energy and chemical revenues.
Pulp revenues increased by approximately 4% to $1,460.5 million in 2024 from $1,402.6 million in 2023 primarily due to higher sales realizations partially offset by slightly lower sales volumes.
Energy and chemical revenues decreased by approximately 22% to $88.1 million in 2024 from $113.5 million in 2023 primarily as a result of lower sales realizations.
Total pulp production decreased by approximately 6% to 1,843,071 ADMTs in 2024 compared to 1,965,581 ADMTs in 2023 primarily as a result of the dissolution of the CPP joint venture and unplanned downtime events in 2024 partially offset by the market curtailment at the Peace River and CPP mills and the port strike related curtailment at the Celgar mill in 2023. In 2024, our pulp mills had 117 days of downtime (approximately 180,400 ADMTs) which included 57 days of planned annual maintenance, 53 days of unplanned downtime at our Peace River and Celgar mills and seven additional days due to slower than expected start-up. In 2023, our pulp mills had 132 days of downtime (approximately 152,500 ADMTs) which included 71 days of planned annual maintenance and 61 days for curtailments at the Peace River, CPP and Celgar mills.
We estimate that annual maintenance downtime in 2024 adversely impacted our Segment Operating EBITDA by approximately $78.0 million, comprised of approximately $56.1 million in direct out-of-pocket expenses and the balance in reduced production. We estimate that unplanned downtime at the Peace River and Celgar mills in 2024 adversely impacted our Segment Operating EBITDA by approximately $23.7 million in direct out-of-pocket expenses and reduced production.
In 2025, we currently have planned maintenance downtime for our pulp mills of an aggregate of 78 days, or approximately 114,800 ADMTs, which will be comprised of 21 days in the first quarter, 21 days in the second quarter, 18 days in the third quarter and 18 days in the fourth quarter.
Pulp sales volumes remained relatively flat at 1,899,754 ADMTs in 2024 compared to 1,951,206 ADMTs in 2023.
In 2024, third-party industry quoted average list prices for NBSK pulp increased in both Europe and North America from 2023. Third-party industry quoted average net prices for NBSK pulp in China also increased in 2024 compared to 2023. Average list prices for NBSK pulp in Europe and North America were approximately $1,519 per ADMT and $1,646 per ADMT, respectively, in 2024 compared to approximately $1,257 per ADMT and $1,448 per ADMT, respectively, in 2023. Average NBSK net prices in China were approximately $774 per ADMT in 2024 compared to approximately $747 per ADMT in 2023. Prices quoted for China are net of discounts, allowances and rebates whereas quoted prices for Europe and North America are before applicable discounts, allowances and rebates.
Third-party industry quoted average list prices for NBHK pulp in North America were approximately $1,356 per ADMT in 2024 compared to approximately $1,227 per ADMT in 2023. Third-party industry quoted
average net prices for NBHK pulp in China were approximately $645 per ADMT in 2024 compared to approximately $592 per ADMT in 2023.
Average NBSK pulp sales realizations increased by approximately 8% to $784 per ADMT in 2024 from $729 per ADMT in 2023 and average NBHK pulp sales realizations modestly increased to $637 per ADMT in 2024 from $627 per ADMT in 2023.
In 2024, we had a positive impact of approximately $26.8 million on Segment Operating EBITDA due to foreign exchange compared to 2023 primarily as a result of foreign exchange gains on dollar denominated accounts receivable held at our operations as the dollar strengthened relative to the euro and Canadian dollar at the end of 2024.
Costs and expenses in 2024 decreased by approximately 8% to $1,436.1 million from $1,565.4 million in 2023 primarily as a result of lower per unit fiber, energy and chemical costs due to the easing of inflationary pressure and cost reduction initiatives, lower pulp sales volumes and the positive foreign exchange impact of a stronger dollar. These decreases were partially offset by the non-cash loss on disposal of the CPP joint venture investment of $23.6 million. In 2023, we received insurance proceeds of $46.4 million relating to the 2021 turbine downtime at the Rosenthal mill and the 2022 fire at the Stendal mill.
In 2024, overall average per unit fiber costs decreased by approximately 10% from 2023 primarily due to the benefits from our wood room upgrades and generally stable supply at our Canadian mills and softening demand in Germany from other wood consumers. In 2025, we currently expect per unit fiber costs to increase in Germany due to tight supply offset by modestly lower per unit fiber costs in Canada.
Transportation costs for our pulp segment decreased by approximately 6% to $145.7 million in 2024 from $154.9 million in 2023 driven by lower freight rates and pulp sales volumes.
In 2024, Segment Operating EBITDA increased to $260.9 million from $65.9 million in 2023 primarily due to higher pulp sales realizations, lower per unit fiber and other production costs, and the positive foreign exchange impact of a stronger dollar. In 2023, we received insurance proceeds of $46.4 million relating to the 2021 turbine downtime at the Rosenthal mill and the 2022 fire at the Stendal mill.
Solid Wood Segment – Year Ended December 31, 2024 Compared to Year Ended December 31, 2023
Selected Financial Information
| | | | | | | | | | | | |
| | | | | | Year Ended December 31, | |
| | | | | | 2024 | | | 2023 | |
| | | | | | (in thousands) | |
Lumber revenues | | | | | | $ | 217,471 | | | $ | 217,939 | |
Energy revenues | | | | | | $ | 16,512 | | | $ | 21,451 | |
Manufactured products revenues(1) | | | | | | $ | 100,565 | | | $ | 58,895 | |
Pallet revenues | | | | | | $ | 104,386 | | | $ | 121,424 | |
Biofuels revenues(2) | | | | | | $ | 40,082 | | | $ | 40,680 | |
Wood residuals revenues | | | | | | $ | 6,975 | | | $ | 11,665 | |
Segment Operating EBITDA(3) | | | | | | $ | (4,390 | ) | | $ | (30,343 | ) |
(1)Manufactured products primarily includes CLT and glulam.
(2)Biofuels includes pellets and briquettes.
(3)Segment Operating EBITDA is a measure of segment profit or loss presented in our financial statements under GAAP. Refer to the segment information note in our consolidated financial statements for more information.
Solid wood segment revenues modestly increased to $486.0 million in 2024 from $472.1 million in 2023 as a result of higher manufactured products revenues partially offset by lower pallets, energy and wood residuals revenues.
Lumber revenues in 2024 were flat at $217.5 million compared to $217.9 million in 2023 as higher sales realizations were offset by lower sales volumes.
Energy and wood residuals revenues in 2024 decreased by approximately 29% to $23.5 million from $33.1 million in 2023 primarily as a result of lower wood residuals sales realizations and lower energy sales volumes. Biofuels revenues in 2024 were flat at $40.1 million compared to $40.7 million in 2023.
In 2024, our mass timber business had strong production of CLT and glulam and completed two large-scale projects. Manufactured products revenues increased by approximately 71% to $100.6 million from $58.9 million in 2023.
Pallet revenues in 2024 decreased by approximately 14% to $104.4 million from $121.4 million in 2023 due to lower sales volumes and sales realizations as weak economic conditions in Europe negatively impacted demand.
Lumber production modestly increased to 475.6 MMfbm in 2024 from 462.3 MMfbm in 2023.
Lumber sales volumes decreased by approximately 6% to 470.4 MMfbm in 2024 from 500.5 MMfbm in 2023 primarily due to timing of sales.
Average lumber sales realizations increased by approximately 6% to $462 per Mfbm in 2024 from $435 per Mfbm in 2023, driven by an increase in demand in both the U.S. and European markets. The U.S. market accounted for approximately 47% of our lumber revenues and approximately 41% of our lumber sales volumes in 2024. The majority of the balance of our lumber sales were to Europe.
Manufactured products sales realizations increased to $3,006 per m3 in 2024 from $1,514 per m3 in 2023 as a result of higher CLT and glulam sales volumes, which generate higher sales realizations relative to other manufactured products.
In 2024, due to ongoing weakness in lumber, pallet and biofuels markets in Europe stemming from high interest rates and other economic conditions, we recognized a non-cash goodwill impairment of $34.3 million related to the Torgau facility.
Fiber costs were approximately 75% of our lumber cash production costs in 2024. In 2024, per unit fiber costs for lumber decreased by approximately 4% compared to 2023 because of stable supply. In 2025, we currently expect per unit fiber costs to increase due to tight supply.
Transportation costs decreased by approximately 13% to $52.9 million in 2024 from $60.5 million in 2023 as a result of lower sales volumes and freight rates.
In 2024, Segment Operating EBITDA was negative $4.4 million compared to negative $30.3 million in 2023 primarily because of lower per unit fiber and energy costs, higher lumber sales realizations and higher mass timber sales volumes partially offset by lower sales realizations from our other products.
Sensitivities
The following sensitivity analysis provides only a limited point-in-time view of the pulp price, lumber price, fiber costs, foreign exchange rates and inflation discussed. The actual impact of the underlying price, rate and inflation changes may differ materially from that shown in the sensitivity analysis.
Our earnings are sensitive to, among other things, fluctuations in:
Pulp Price. Pulp is a global commodity that is priced in dollars, whose markets are highly competitive and cyclical in nature. As a result, our earnings are sensitive to pulp price changes. Based upon our 2024 sales volume and assuming all other factors remained constant, each $10.00 per tonne change in pulp third-party industry quoted list prices yields a change in pulp revenues of approximately $13.5 million.
Lumber Price. Lumber markets are highly competitive and cyclical in nature. As a result, our earnings are sensitive to lumber price changes. Based upon our 2024 sales volume and assuming all other factors remain
constant, each $10.00 per Mfbm change in lumber price yields a change in lumber revenues of approximately $4.7 million.
Fiber Costs. Our main raw material is fiber in the form of wood chips, pulp logs, sawlogs and lumber. Fiber is a commodity and both prices and supply are cyclical. As a result, our operating costs are sensitive to fiber cost changes. For our pulp segment, based upon our 2024 fiber costs and assuming all other factors remained constant, each 1% change in per unit fiber cost yields a change in annual operating costs of approximately $5.6 million. For our solid wood segment, based upon our 2024 fiber costs and assuming all other factors remained constant, each 1% change in per unit fiber cost yields a change in annual operating costs of approximately $2.4 million.
Foreign Exchange. Our operating costs are primarily in euros for our German mills and Canadian dollars for our Canadian mills. As a result, our operating costs will fluctuate with changes in the value of the dollar relative to the euro and Canadian dollar. Based on our 2024 operating costs and assuming all other factors remained constant, each $0.01 change in the value of the dollar relative to the euro yields a total change in annual operating costs of approximately $10.4 million. Based on our 2024 operating costs and assuming all other factors remained constant, each $0.01 change in the value of the dollar relative to the Canadian dollar yields a total change in annual operating costs of approximately $8.3 million.
Our energy, chemical, pallet, biofuel, wood residual and European lumber sales are made in local currencies and, as a result, will fluctuate with changes in the value of the dollar relative to the euro and Canadian dollar. Based on our 2024 energy, chemical, pallet, biofuel, wood residual and European lumber revenues and assuming all other factors remained constant, each $0.01 change in the value of the dollar relative to the euro yields a total change in revenues of approximately $2.9 million. Based on our 2024 energy and chemical revenues and assuming all other factors remained constant, each $0.01 change in the value of the dollar relative to the Canadian dollar yields a total change in energy and chemical revenues of approximately $0.2 million.
Inflation. Our key production input costs are for fiber, chemicals and energy. Other material costs in our business include labor and transportation. As a result, our operating costs are sensitive to inflation. For our pulp segment, based upon our 2024 cash production costs and assuming all other factors remained constant, each 1% change in per unit cash production cost yields a change in annual cash production costs of approximately $10.3 million. For our solid wood segment, based upon our 2024 cash production costs and assuming all other factors remained constant, each 1% change in per unit cash production cost yields a change in annual cash production costs of approximately $4.3 million.
Seasonal Influences. We are exposed to fluctuations in quarterly sales volumes and expenses due to seasonal factors. These factors are common in the pulp and lumber industries. We generally have weaker pulp demand in Europe during the summer holiday months and in China in the period relating to the lunar new year. We typically have a seasonal build-up in raw material inventories in the early winter months as the mills build up their fiber supply for the winter when there is reduced availability.
Liquidity and Capital Resources
Summary of Cash Flows
| | | | | | | | | | | | |
| | | | | | Year Ended December 31, | |
| | | | | | 2024 | | | 2023 | |
| | | | | | (in thousands) | |
Net cash from (used in) operating activities | | | | | | $ | 90,204 | | | $ | (69,005 | ) |
Net cash used in investing activities | | | | | | | (66,992 | ) | | | (199,867 | ) |
Net cash from (used in) financing activities | | | | | | | (152,783 | ) | | | 228,624 | |
Effect of exchange rate changes on cash and cash equivalents | | | | | | | 504 | | | | 208 | |
Net decrease in cash and cash equivalents | | | | | | $ | (129,067 | ) | | $ | (40,040 | ) |
We operate in a cyclical industry and our operating cash flows vary accordingly. Our principal operating cash
expenditures are for production costs, such as fiber, chemicals and energy costs, and other material operating costs for maintenance, freight and labor.
Working capital levels fluctuate throughout the year and are affected by maintenance downtime, changing sales patterns, seasonality and the timing of receivables and the payment of payables and expenses. Generally, finished goods inventories are increased prior to scheduled maintenance downtime to maintain sales volume while production is stopped. Our fiber inventories exhibit seasonal swings as we increase pulp log, sawlog and wood chip inventories to ensure adequate supply of fiber to our mills during the winter months. Changes in sales volume can affect the level of receivables and influence overall working capital levels. We believe our management practices with respect to working capital conform to common business practices.
Cash Flows from Operating Activities
Cash from (used in) operations includes:
•cash received from customers;
•cash paid to employees and suppliers;
•cash paid for interest on our debt; and
•cash paid or received for taxes.
In 2024, operating activities provided cash of $90.2 million compared to using cash of $69.0 million in 2023. An increase in accounts receivable used cash of $32.1 million in 2024 and a decrease in accounts receivable provided cash of $52.5 million in 2023. Adjusting for inventory impairments of $9.0 million, a decrease in inventories provided cash of $23.9 million in 2024 and adjusting for inventory impairments of $58.6 million, an increase in inventories used cash of $15.8 million in 2023. A decrease in accounts payable and accrued expenses used cash of $17.7 million in 2024 and $98.2 million in 2023.
Cash Flows from Investing Activities
Cash from (used in) investing activities includes:
•acquisitions of property, plant and equipment and businesses;
•proceeds from the sale of assets; and
•purchases and sales of short-term investments.
In 2024, investing activities used cash of $67.0 million. In 2024, we incurred $84.3 million of capital expenditures primarily related to log yard upgrades and other strategic projects at our Torgau facility, optimization projects at our Peace River mill and mass timber facilities and maintenance projects across all mills and facilities. In 2024, we received $19.9 million of proceeds from sale of property, plant and equipment primarily related to the sale of land from our sandalwood business.
In 2023, investing activities used cash of $199.9 million. In 2023, we acquired the Structurlam Mass Timber Corporation and its subsidiaries for $82.1 million and incurred capital expenditures of $136.3 million primarily related to costs to complete the rebuild of the wood chip conveying system at our Stendal mill and the Rosenthal lignin plant, upgrades to the wood rooms at our Canadian mills and maintenance and optimization projects at our German mills and Mercer Spokane facility. In 2023, we received $12.2 million of property insurance proceeds for the 2022 fire at our Stendal mill and we received $5.6 million of government grants mainly for the Peace River wood room project.
Cash Flows from Financing Activities
Cash from (used in) financing activities includes:
•issuances and payments of debt;
•borrowings and payments under revolving lines of credit; and
•payments of cash dividends and repurchases of stock.
In 2024, financing activities used cash of $152.8 million. In 2024, we redeemed the $300 million 2026 Senior Notes using cash on hand and the proceeds from the issuance of $200.0 million of additional 2028 Senior Notes at a 103.0% premium. In 2024, we repaid approximately $25.1 million under our revolving credit facilities, paid dividends of $20.1 million and incurred aggregate debt issuance costs of $4.5 million related to the issuance of the 2028 Senior Notes.
In 2023, financing activities provided cash of $228.6 million. In 2023, we received proceeds from the issuance of $200.0 million of 2028 Senior Notes and borrowed approximately $61.3 million under our revolving credit facilities. In 2023, we paid dividends of $20.0 million and incurred aggregate debt issuance costs of $4.9 million related to the issuance of senior notes and the increase in our maximum borrowing capacity under our German Revolving Facility.
Balance Sheet Data
The following table is a summary of selected financial information for the dates indicated:
| | | | | | | | |
| | As of December 31, | |
| | 2024 | | | 2023 | |
| | (in thousands) | |
Cash and cash equivalents | | $ | 184,925 | | | $ | 313,992 | |
Working capital | | $ | 653,466 | | | $ | 806,468 | |
Total assets | | $ | 2,262,932 | | | $ | 2,662,578 | |
Long-term liabilities | | $ | 1,576,619 | | | $ | 1,740,731 | |
Total shareholders' equity | | $ | 429,775 | | | $ | 635,410 | |
Sources and Uses of Funds
Our principal sources of funds are cash flows from operations and cash and cash equivalents on hand. Our principal uses of funds consist of operating expenditures, capital expenditures and interest payments on our Senior Notes.
The following table sets out our total capital expenditures and interest expense for the periods indicated:
| | | | | | | | | | | | | |
| | | | | | Year Ended December 31, | | |
| | | | | | 2024 | | | 2023 | | |
| | | | | | (in thousands) | | |
Capital expenditures | | | | | | $ | 84,318 | | | $ | 136,324 | | (1) |
Cash paid for interest expense(2) | | | | | | $ | 105,483 | | | $ | 79,620 | | |
Interest expense(3) | | | | | | $ | 109,150 | | | $ | 88,246 | | |
(1)Capital expenditures in 2023 included expenditures to rebuild the wood chip conveying systems at the Stendal mill which were damaged by a fire in 2022. The rebuild was financed with insurance proceeds, of which $12.2 million was received in 2023.
(2)Amounts differ from interest expense which includes non-cash items. See supplemental disclosure of cash flow information from our Consolidated Statements of Cash Flows included in this report.
(3)Interest on our 2028 Senior Notes is paid semi-annually in April and October of each year. Interest on our 2029 Senior Notes is paid semi-annually in February and August of each year. Prior to their redemption in October 2024, interest on our 2026 Senior Notes was paid semi-annually in January and July of each year.
As of December 31, 2024, we had cash and cash equivalents of $184.9 million and approximately $303.7 million available under our revolving credit facilities providing us with aggregate liquidity of approximately $488.6 million.
As of December 31, 2024, we had no material commitments to acquire assets or operating businesses.
In 2025, excluding amounts being financed through government grants, we currently expect capital expenditures to be approximately $100.0 million to $120.0 million.
We currently consider the majority of undistributed earnings of our foreign subsidiaries to be indefinitely reinvested and, accordingly, no U.S. income tax has been provided on such earnings. However, if we were required to repatriate funds to the United States, we believe that we currently could repatriate the majority thereof without incurring any material amount of taxes as a result of our shareholder advances and U.S. tax reform. However, it is currently not practical to estimate the income tax liability that might be incurred if such earnings were remitted to the United States. Substantially all of our undistributed earnings are held by our foreign subsidiaries outside of the United States.
Based upon the current level of operations and our current expectations for future periods in light of the current economic environment, and in particular, current and expected pulp and lumber pricing and foreign exchange rates, we believe that cash flow from operations and available cash, together with available borrowings under our revolving credit facilities, will be adequate to finance the capital requirements for our business including the payment of our quarterly dividend during the next 12 months.
In the future we may make acquisitions of businesses or assets or commitments to additional capital projects. To achieve the long-term goals of expanding our assets and earnings, including through acquisitions, capital resources will be required. Depending on the size of a transaction, the capital resources that will be required can be substantial. The necessary resources will be generated from cash flow from operations, cash on hand, borrowing against our assets or the issuance of securities.
Credit Facilities and Debt Covenants
We had the following principal amounts outstanding under our credit facilities and Senior Notes as of the dates indicated:
| | | | | | | | |
| | As of December 31, | |
| | 2024 | | | 2023 | |
| | (in thousands) | |
German Revolving Facility | | $ | 168,822 | | | $ | 161,330 | |
Rosenthal €2.6 million loan | | $ | — | | | $ | — | |
Canadian Revolving Facility | | $ | 347 | | | $ | 47,255 | |
2026 Senior Notes(1) | | $ | — | | | $ | 300,000 | |
2028 Senior Notes(2) | | $ | 400,000 | | | $ | 200,000 | |
2029 Senior Notes | | $ | 875,000 | | | $ | 875,000 | |
(1)Redeemed in October 2024.
(2)$200.0 million issued in September 2023. An add-on offering of $200.0 million was completed in October 2024.
For a description of such indebtedness, see Item 1. “Business – Description of Certain Indebtedness”.
Certain of our long-term obligations contain various financial tests and covenants customary to these types of arrangements.
Under the German Revolving Facility, the Obligors must not exceed a ratio of net debt to EBITDA of 3.50:1:00 in any 12 month period and maintain defined capital of not less than €500.0 million.
The Canadian Revolving Facility includes a covenant which requires the borrowers to comply, on a combined basis, with a 1.00:1.00 fixed charge coverage ratio as long as the excess amount under the facility is less than the greater of 10% of the line cap thereunder and C$14.0 million, in either case, for five consecutive days or less than the greater of 7.5% of the line cap and C$10.0 million, at any time.
The German Revolving Facility is provided by a syndicate of six financial institutions and the Canadian Revolving Facility is provided by three financial institutions. To date we have not experienced any reductions in credit availability with respect to these credit facilities. However, if any of these financial institutions were to default on their commitment to fund, we could be adversely affected.
The indentures governing the Senior Notes do not contain any financial maintenance covenants and there are no scheduled principal payments until maturity. Interest on our 2028 Senior Notes is payable semi-annually
in arrears on April 1 and October 1, at the rate of 12.875% and they mature in October 2028. Interest on our 2029 Senior Notes is payable semi-annually in arrears on February 1 and August 1, at the rate of 5.125% and they mature in February 2029.
As of December 31, 2024, we were in full compliance with all of the covenants of our indebtedness.
Foreign Currency
Our reporting currency is the dollar. However, we hold certain assets and liabilities in euros and Canadian dollars and the majority of our expenditures are denominated in euros or Canadian dollars. Accordingly, our consolidated financial results are subject to foreign currency exchange rate fluctuations.
We translate foreign denominated assets and liabilities into dollars at the rate of exchange on the balance sheet date. Equity accounts are translated using historical exchange rates. Unrealized gains or losses from these translations are recognized in our other comprehensive income (loss) and do not affect our net earnings.
As a result of the strengthening of the dollar versus the euro and Canadian dollar as of December 31, 2024, we recorded a non-cash decrease of $104.4 million in the carrying value of our net assets denominated in euros and Canadian dollars, consisting primarily of our property, plant and equipment. This non-cash decrease does not affect our net loss, Operating EBITDA or cash but is reflected in our other comprehensive income (loss) and as a decrease to our total equity. As a result, our accumulated other comprehensive loss increased to $230.8 million.
Based upon the exchange rate as of December 31, 2024, the dollar was approximately 6% stronger against the euro and 8% stronger against the Canadian dollar since December 31, 2023. See Item 7A. “Quantitative and Qualitative Disclosures about Market Risk”.
Credit Ratings of Senior Notes
We and our Senior Notes are rated by Standard & Poor’s Rating Services, referred to as “S&P”, Moody’s Investors Service, Inc., referred to as “Moody’s” and Fitch Ratings, referred to as “Fitch”.
S&P, Moody’s and Fitch base their assessment of the credit risk on our Senior Notes on the business and financial profile of Mercer Inc. and our restricted subsidiaries under the indentures governing the Senior Notes. As of December 31, 2024, all of our subsidiaries were restricted subsidiaries. Factors that may affect our credit rating include changes in our operating performance and liquidity. Credit rating downgrades can adversely impact, among other things, future borrowing costs and access to capital markets.
In August 2024, Moody’s downgraded its rating on our Senior Notes to B3 from B2 and confirmed its outlook is negative. In October 2024, S&P confirmed its outlook is negative and confirmed its rating on our Senior Notes is B. In October 2024, Fitch assigned its first time rating on our Senior Notes as B+ and issued a stable rating for its outlook.
Credit ratings are not recommendations to buy, sell or hold securities and may be subject to revision or withdrawal by the assigning rating organization. Each rating should be evaluated independently of any other rating.
Critical Accounting Policies
The preparation of financial statements and related disclosures in conformity with GAAP requires management to make estimates and assumptions that affect both the amount and the timing of recording of assets, liabilities, revenues and expenses in the consolidated financial statements and accompanying note disclosures. Our management routinely makes judgments and estimates about the effects of matters that are inherently uncertain. As the number of variables and assumptions affecting the probable future resolution of the uncertainties increase, these judgments become even more subjective and complex.
Our significant accounting policies are disclosed in Note 1 to our audited annual consolidated financial
statements included in Part IV of this Annual Report. While all of the significant accounting policies are important to the consolidated financial statements, some of these policies may be viewed as having a high degree of judgment. On an ongoing basis using currently available information, management reviews its estimates, including those related to accounting for, among other things, future cash flows associated with impairment testing for goodwill and long-lived assets, depreciation and amortization, pension and other post-retirement benefit obligations, deferred income taxes (valuation allowance and permanent reinvestment), the allocation of the purchase price in a business combination to the assets acquired and liabilities assumed, revenues under long-term contracts, inventory impairment, assets and liabilities classified as held for sale and the fair value of disposal groups, legal liabilities and contingencies. Actual results could differ materially from these estimates, and changes in these estimates are recorded when known.
The following accounting policies require management’s most difficult, subjective and complex judgments, and are subject to a fair degree of measurement uncertainty.
Goodwill
Goodwill is evaluated for impairment annually or whenever we identify certain triggering events or circumstances that would more likely than not reduce the fair value of a reporting unit below its carrying value. Application of the goodwill impairment test requires significant judgment, including the identification of reporting units, assignment of assets and liabilities to reporting units, assignment of goodwill to reporting units, and determination of the fair value of each reporting unit. Fair value determinations require considerable judgment and are sensitive to changes in underlying assumptions, estimates, and market factors. The fair value of a reporting unit is estimated primarily through the use of a discounted cash flow model, using market participant assumptions, and requires us to make certain assumptions and estimates regarding industry economic factors and the future profitability of the reporting unit. This analysis requires significant judgments, including estimation of future sales volumes, selling prices and costs and capital expenditures, and determination of the discount rate. The estimates used to calculate the fair value of a reporting unit may change from year to year based on operating results, market conditions, and other factors. Changes in these assumptions and estimates could materially affect the determination of fair value and goodwill impairment for each reporting unit.
In June 2024, we performed an impairment test for goodwill assigned to our Torgau facility, the reporting unit, due to ongoing weakness in lumber, pallet and biofuels markets in Europe stemming from high interest rates and other economic conditions. The impairment test showed the fair value of the reporting unit was less than its carrying value and this difference was greater than the carrying value of the goodwill. Accordingly, we recognized an impairment against all of the goodwill in 2024.
Long-Lived Assets
As of December 31, 2024, we had long-lived assets recorded in our Consolidated Balance Sheet of $1,304.5 million. These long-lived assets include property, plant and equipment, net and amortizable intangible assets, net. In 2024, we recorded depreciation and amortization of $170.8 million and no impairment charges. Depreciation and amortization and impairment charges are based on accounting estimates.
The calculation of depreciation and amortization of long-lived assets requires us to apply judgment in selecting the remaining useful lives of the assets. The remaining useful life of an asset must address both physical and economic considerations. The remaining economic life of a long-lived asset may be shorter than its physical life. The pulp industry has historically been characterized by considerable uncertainty in business conditions. Estimates of future economic conditions for our long-lived assets and therefore, their remaining useful economic life, require considerable judgment.
If our estimate of the remaining useful life changes, such a change is accounted for prospectively in our determination of depreciation and amortization. Actual depreciation and amortization charges for an individual asset may therefore be significantly accelerated if the outlook for its remaining useful life is shortened considerably.
The unit of accounting for impairment testing for long-lived assets is its “Asset Group”, which includes
property, plant and equipment, net, amortizable intangible assets, net, and liabilities directly related to those assets. We evaluate an Asset Group for impairment whenever events or changes in circumstances indicate that the carrying value may not be recoverable, such as continuing operating losses. When an indicator that the carrying value of an Asset Group may not be recoverable is triggered, we compare the carrying value of the Asset Group to its forecasted undiscounted future cash flows. If the carrying value of the Asset Group is greater than the undiscounted future cash flows an impairment charge is recorded based on the excess of the Asset Group’s carrying value over its fair value.
Impairment testing for long-lived assets requires us to apply judgment in estimating the future cash flows of the Asset Group. The significant estimates in the future cash flows include periods of operation, projections of product pricing, production levels, fiber and other production costs and maintenance spending. When performing impairment tests, we estimate the fair values of the assets using management’s best assumptions, which we believe would be consistent with the assumptions that a hypothetical marketplace participant would use. Estimates and assumptions used in these tests are evaluated and updated each period an impairment indicator is triggered.
Actual asset impairment losses could vary considerably from estimated impairment losses if actual results are not consistent with the assumptions and judgments used in estimating future cash flows.
Pension and Other Post-Retirement Benefit Obligations
We maintain defined benefit pension plans and an other post-retirement benefit plan for certain employees of our Peace River mill and our Celgar mill which are funded based on actuarial estimates and requirements and are non-contributory. We recognize the net funded status of the plans and we record net periodic benefit costs associated with these net obligations. As of December 31, 2024, we had pension and other post-retirement benefit obligations aggregating $91.6 million and accumulated pension plan assets with a fair value of $89.1 million. Our 2024 net periodic pension and other post-retirement benefit cost was $1.3 million. The amounts recorded for the net pension and other post-retirement obligations include various judgments and uncertainties.
Judgment is required for the following inputs which are used to determine our net obligations and our net periodic benefit costs each year:
•discount rate – used to determine the net present value of our pension and other post-retirement benefit obligations and to determine the interest cost component of our net periodic pension and other post-retirement benefit costs;
•return on assets – used to estimate the growth in the value of invested assets that are available to satisfy pension obligations and to determine the expected return on the plan assets component of our net periodic pension costs;
•mortality rate – used to estimate the impact of mortality on pension and other post-retirement benefit obligations;
•rate of compensation increase – used to calculate the impact future pay increases will have on pension benefit obligations; and
•health care cost trend rate – used to calculate the impact of future health care costs on other post-retirement benefit obligations.
For the discount rate, we use the rates available on high-quality corporate bonds with a duration that is expected to match the timing of expected pension and other post-retirement benefit obligations. High-quality corporate bonds are those with a rating of “AA” or better.
In determining the expected return on assets, we consider the historical long-term returns, expected asset mix and the active management premium.
For the mortality rate we use actuarially-determined mortality tables that are consistent with our historical mortality experience and future expectations for mortality of the employees who participate in our pension
and other post-retirement benefit plans.
In determining the rate of compensation increase, we review historical compensation increases and promotions, while considering current industry conditions, the terms of collective bargaining agreements with employees and the outlook for the industry.
For the health care cost trend rate, we consider historical trends for these costs, as well as recently enacted health care legislation. We also compare our health care rate to those of our industry.
Variations in assumptions described above could have a significant effect on the pension and other post-retirement benefits, net periodic benefit cost and obligation reported in our consolidated financial statements. For example, a one-percentage point change in any one of the following assumptions would have increased (decreased) our 2024 net periodic benefit cost and our accrued benefit obligation as follows:
| | | | | | | | | | | | | | | | |
| | Net periodic benefit cost | | | Accrued benefit obligation | |
| | 1%
increase | | | 1%
decrease | | | 1%
increase | | | 1%
decrease | |
| | (in thousands) | |
Assumptions | | | | | | | | | | | | |
Discount rate | | $ | (292 | ) | | $ | 351 | | | $ | (16,260 | ) | | $ | 13,026 | |
Return on assets | | $ | (869 | ) | | $ | 870 | | | $ | — | | | $ | — | |
Rate of compensation | | $ | 557 | | | $ | (206 | ) | | $ | 2,276 | | | $ | (2,694 | ) |
Health care cost trend rate | | $ | 103 | | | $ | (98 | ) | | $ | 441 | | | $ | (478 | ) |
Deferred Income Taxes
As of December 31, 2024, we had a deferred income tax liability of $74.8 million and a deferred income tax asset of $17.8 million, resulting in a net deferred income tax liability of $57.0 million. Our deferred income tax assets are net of a $81.8 million valuation allowance. Our deferred income tax assets are comprised primarily of income tax loss and interest carryforwards and deductible temporary differences, all of which will reduce taxable income in the future. We assess the realization of these deferred income tax assets at each reporting period to determine whether it is more likely than not that the deferred income tax assets will be realized. Our assessment includes a review of all available positive and negative evidence, including, but not limited to, the following:
•the history of the income tax loss carryforwards and their expiry dates;
•future reversals of temporary differences;
•our historical and projected earnings; and
•tax planning opportunities.
Significant judgment is required when evaluating the positive and negative evidence, specifically our estimates of future earnings. The weight given to negative and positive evidence is commensurate with the extent to which it can be objectively verified. Operating results during the most recent three-year period are generally given more weight than expectations of future profitability, which are inherently uncertain. A cumulative loss position during the most recent three-year period is considered significant negative evidence in assessing the realizability of deferred income tax assets that is difficult to overcome.
Once our evaluation of the evidence is complete, if we believe that it is more likely than not that some of the deferred income tax assets will not be realized, based on currently available information, a valuation allowance is recorded against the deferred income tax assets.
If market conditions improve or tax planning opportunities arise in the future, we may reduce our valuation allowance, resulting in future income tax benefits. If market conditions deteriorate in the future, we may increase our valuation allowance, resulting in future income tax expenses. Any change in tax laws may change the valuation allowances in future periods.
Revenues Under Long-Term Contracts
We have revenues from long-term contracts which are recognized over the contract term as the work progresses towards completion. The timing of revenue recognition involves a judgmental process of estimating costs and profit for the performance obligation. Cost of sales is recognized as incurred. The amount we report as revenues is determined by adding a proportionate amount of the estimated profit to the amount reported as cost of sales. We recognize revenue as costs are incurred as this provides an objective measure of progress and thereby best depicts the extent of transfer of control to the customer. Estimating cost to complete requires us to apply judgment and is largely based on negotiated or estimated purchase contract terms, historical performance trends and other economic projections. Factors that influence these estimates may include inflationary trends, internal and supplier performance, asset utilization, amongst others. Actual costs to complete could vary considerably from the estimated costs to complete and have a significant impact on the revenue we recognize.
Revenue and cost estimates for all significant long-term contract performance obligations are reviewed quarterly. Changes in estimated revenues, cost of sales and the related effect on our earnings are recognized using a cumulative catch-up adjustment which recognizes in the current period the cumulative effect of the changes on current and prior periods based on the contract’s percentage-of-completion.
Inventories
Inventories of raw materials, finished goods and work in progress are valued at the lower of cost, using the weighted-average cost method, or net realizable value and are released from inventory on the same basis. Estimating net realizable value requires us to apply judgment and is based on current and expected selling prices in the ordinary course of business, less reasonably predictable costs of completion.
Assets and Liabilities Classified as Held For Sale
Assets (and disposal groups) are classified as held for sale if their carrying amount will be recovered primarily through a sale as opposed to continued use by the Company. The classification of assets (and disposal groups) as held for sale requires us to apply judgment in determining when the held for sale criteria are met, including whether a future sale is probable. The analysis of whether the held for sale criteria are met (or no longer met) is performed at each reporting date for each disposal group that we intend or intended to sell.
When the held for sale criteria are met, assets or disposal groups are measured at the lower of its carrying amount and fair value less cost to sell. Fair value determinations require considerable judgment and are sensitive to changes in underlying assumptions, estimates, and market factors. The fair value of assets (and disposal groups) held for sale are estimated based on preliminary indicative offers from third parties or through the use of a discounted cash flow model. The estimates used to calculate the fair value of assets (and disposal groups) classified as held for sale may change from period over period based on operating results, market conditions, and other factors. Changes in these assumptions and estimates could materially affect the determination of fair value and, if applicable, impairment charges recognized.
Contingent Liabilities
We are subject to lawsuits, investigations and other claims related to environmental, product and other matters, and are required to assess the likelihood of any adverse judgments or outcomes to these matters, as well as potential ranges of probable losses. We disclose contingent liabilities when there is a reasonable possibility that an ultimate loss may occur and we record contingent liabilities when it becomes probable that we will have to make payments and the amount of loss can be reasonably estimated.
Assessing probability of loss and estimating probable losses requires analysis of multiple factors, including, but not limited to, the following:
•judgments about the potential actions of third-party claimants and courts; and
•recommendations of legal counsel.
Contingent liabilities are based on the best information available and actual losses in any future period are inherently uncertain. If estimated probable future losses or actual losses exceed our recorded liability for such claims, we would record additional charges. These exposures and proceedings can be significant and the ultimate negative outcomes could be material to our operating results or liquidity in any given quarter or year.
New Accounting Standards
See Note 1 to our consolidated financial statements included in Item 15 of this Annual Report on Form 10-K.
ITEM 7A. QUANTITATIVE AND QUALITATIVE DISCLOSURES ABOUT MARKET RISK
We are exposed to risks associated with fluctuations in:
•foreign currency exchange rates;
•prices for the products we manufacture;
For a discussion of our earnings sensitivities to pulp and lumber prices, fiber costs, foreign exchange rates and inflation, see Item 7. “Management’s Discussion and Analysis of Financial Condition and Results of Operations – Sensitivities” on page 62 hereof.
Foreign Currency Exchange Risk
We compete with producers from around the world, particularly Europe and North America, in our product lines. We sell pulp, U.S. lumber and mass timber products mainly in transactions denominated in dollars but sell certain other products including energy, chemicals, pallets, biofuels, wood residuals and European lumber in local currencies, being euros and Canadian dollars. Changes in the relative strength or weakness of the dollar versus the euro and the Canadian dollar affect our operating costs and margins. A stronger dollar lowers our operating costs but can in turn increase the cost of pulp to our customers and thereby create downward pressure on prices. On the other hand, a weaker dollar tends to increase our operating costs but tends to support higher pulp prices.
We are particularly sensitive to changes in the value of the dollar versus the euro and Canadian dollar. We expect exchange rate fluctuations to continue to impact costs and revenues, but we cannot predict the magnitude or direction of this effect for any period, and there can be no assurance of any future effects.
Furthermore, certain of our assets and liabilities are denominated in euros and Canadian dollars. A depreciation of these currencies against the dollar will decrease the fair value of such financial instrument assets and an appreciation of these currencies against the dollar will increase the fair value of such financial instrument liabilities, thereby decreasing our fair value. An appreciation of these currencies against the dollar will increase the fair value of such financial instrument assets and a depreciation of these currencies against the dollar will decrease the fair value of financial instrument liabilities, thereby increasing our fair value. As a result, our earnings can be subject to the potentially significant effect of foreign currency translation gains or losses in respect of these euros and Canadian dollar items.
The following table provides information about our exposure to foreign currency exchange rate fluctuations for the carrying amount of financial instruments sensitive to such fluctuations as of December 31, 2024 and expected cash flows from these instruments:
| | | | | | | | | | | | | | | | |
| | As of December 31, 2024 |
| | | | | | Expected maturity date |
| | Carrying Value | | Fair Value | | 2025 | | 2026 | | 2027 | | 2028 | | 2029 | | Thereafter |
| | (in thousands) |
Financial Instruments | | | | | | | | | | | | | | | | |
in euros | | | | | | | | | | | | | | | | |
Cash and cash equivalents | | 30,756 | | 30,756 | | 30,756 | | — | | — | | — | | — | | — |
Accounts receivable, net | | 95,118 | | 95,118 | | 95,118 | | — | | — | | — | | — | | — |
Accounts payable and other | | 107,874 | | 107,874 | | 107,874 | | — | | — | | — | | — | | — |
Long-term debt | | 162,501 | | 162,501 | | — | | — | | 162,501 | | — | | — | | — |
| | | | | | | | | | | | | | | | |
in Canadian dollars | | | | | | | | | | | | | | | | |
Cash and cash equivalents | | 19,477 | | 19,477 | | 19,477 | | — | | — | | — | | — | | — |
Accounts receivable, net | | 5,595 | | 5,595 | | 5,595 | | — | | — | | — | | — | | — |
Accounts payable and other | | 68,406 | | 68,406 | | 68,406 | | — | | — | | — | | — | | — |
Long-term debt | | 500 | | 500 | | — | | — | | 500 | | — | | — | | — |
Product Price Risk
Historically, economic and market shifts, fluctuations in capacity and changes in foreign currency exchange rates have created cyclical changes in prices, sales volume and margins for our principal products, being kraft pulp and lumber. In general, our products are commodities that are widely available from other producers and, because these products have few distinguishing qualities from producer to producer, competition is based primarily on price which is determined by supply relative to demand. The overall levels of demand for the products we manufacture, and consequently our sales and profitability, reflect fluctuations in end user demand.
Fiber Price Risk
Fiber in the form of wood chips, pulp logs, sawlogs and lumber represents our largest operating cost. Fiber is a market-priced commodity and, as such, is subject to fluctuations in prices based on supply and demand. Increases in the prices of fiber will tend to increase our operating costs and reduce our operating margins.
Inflation Risk
Our key production input costs are for fiber, chemicals and energy. Other material costs in our business include maintenance, freight and labor costs. As a result, our operating costs are sensitive to inflation. Increases in inflation will tend to increase our operating costs and reduce our operating margins.
Interest Rate Risk
Fluctuations in interest rates may affect the fair value of fixed interest rate financial instruments which are sensitive to such fluctuations. A decrease in interest rates may increase the fair value of such fixed interest rate financial instrument assets and an increase in interest rates may decrease the fair value of such fixed interest rate financial instrument liabilities, thereby increasing our fair value. An increase in interest rates may decrease the fair value of such fixed interest rate financial instrument assets and a decrease in interest rates may increase the fair value of such fixed interest rate financial instrument liabilities, thereby decreasing our fair value. We may seek to manage our interest rate risks through the use of interest rate derivatives.
The following table provides information about our exposure to interest rate fluctuations for the financial instruments sensitive to such fluctuations as of December 31, 2024 and expected cash flows from these instruments:
| | | | | | | | | | | | | | | | |
| | As of December 31, 2024 |
| | | | | | Expected maturity date |
| | Total | | Fair Value | | 2025 | | 2026 | | 2027 | | 2028 | | 2029 | | Thereafter |
| | (in thousands other than percentages) |
Liabilities | | | | | | | | | | | | | | | | |
Long-term debt: | | | | | | | | | | | | | | | | |
Fixed rate ($)(1) | | 400,000 | | 430,580 | | — | | — | | — | | 400,000 | | — | | — |
Interest rate | | 12.875% | | 12.875% | | | | | | | | 12.875% | | | | |
Fixed rate ($)(2) | | 875,000 | | 756,341 | | — | | — | | — | | — | | 875,000 | | — |
Interest rate | | 5.125% | | 5.125% | | | | | | | | | | 5.125% | | |
Variable rate ($)(3) | | 168,822 | | 168,822 | | — | | — | | 168,822 | | — | | — | | — |
Interest rate | | 4.470% | | 4.470% | | | | | | 4.470% | | | | | | |
Variable rate ($)(4) | | 347 | | 347 | | — | | — | | 347 | | — | | — | | — |
Interest rate | | 5.450% | | 5.450% | | | | | | 5.450% | | | | | | |
(1)2028 Senior Notes bearing interest at 12.875%, principal amount $400.0 million.
(2)2029 Senior Notes bearing interest at 5.125%, principal amount $875.0 million.
(3)The German Revolving Facility bearing interest by way of: Euribor plus a variable margin ranging from 1.40% to 2.35% dependent on conditions including but not limited to a prescribed leverage ratio. The facility is sustainability linked whereby the interest rate margin is subject to upward or downward adjustments of up to 0.05% per annum if the Company achieves, or fails to achieve, certain specified sustainability targets.
(4)The Canadian Revolving Facility bearing interest by way of: (i) Canadian dollar denominated advances, which bear interest at a designated prime rate per annum; (ii) Canadian dollar denominated advances, which bear interest at the applicable Adjusted CORRA plus 1.20% to 1.45% per annum; (iii) dollar denominated base rate advances at the greater of the federal funds rate plus 0.50%, an Adjusted Term SOFR for a one month tenor plus 1.00% and the bank’s applicable reference rate for dollar denominated loans; and (iv) dollar denominated SOFR advances, which bear interest at Adjusted Term SOFR plus 1.20% to 1.45% per annum.
Credit Risk
Our credit risk is primarily attributable to cash held in bank accounts and accounts receivable. We maintain cash balances in foreign financial institutions in excess of insured limits. We limit our credit exposure on cash held in bank accounts by periodically investing cash in excess of short-term operating requirements and debt obligations in low risk government bonds, or similar debt instruments. Our credit risk associated with our sales is managed through setting credit limits, the purchase of credit insurance and for certain customers a letter of credit is received prior to shipping the product. We review new customers’ credit history before granting credit and conduct regular reviews of existing customers’ credit. Concentrations of credit risk are with customers and agents based primarily in Germany, China and the U.S.
Risk Management and Derivatives
We seek to manage these risks through internal risk management policies as well as, from time to time, through the periodic use of derivatives. We may also from time to time use derivatives to reduce or limit our exposure to interest rate and currency risks. We may also use derivatives to reduce or limit our exposure to fluctuations in pulp and lumber prices. We may use derivatives to reduce our potential losses or to augment our potential gains, depending on our management’s perception of future economic events and developments. These types of derivatives are generally highly speculative in nature. They are also very volatile as they are highly leveraged given that margin requirements are relatively low in proportion to notional amounts.
The principal derivatives we have periodically previously used are interest rate derivatives, pulp price derivatives, energy derivatives and foreign exchange derivatives.
Many of our strategies, including the use of derivatives, and the types of derivatives selected by us, are based on historical trading patterns and correlations and our management’s expectations of future events. However, these strategies may not be effective in all market environments or against all types of risks. Unexpected market developments may affect our risk management strategies during this time, and unanticipated
developments could impact our risk management strategies in the future. If any of the variety of instruments and strategies we utilize is not effective, we may incur significant losses.
As of December 31, 2024 and December 31, 2023, we had no outstanding derivatives.
However, in the future, we may from time to time use foreign exchange derivatives to convert some of our costs (including currency swaps relating to our long-term indebtedness) from euros or Canadian dollars to dollars as our principal product is priced in dollars. We have also converted some of our costs to dollars by issuing long-term dollar-denominated debt in the form of our Senior Notes. We may also from time to time use pulp or lumber derivatives to fix price realizations and interest rate derivatives to fix the rate of interest on indebtedness.
We record unrealized gains and losses on our outstanding derivatives when they are marked to market at the end of each reporting period and realized gains or losses on them when they are settled. We determine market valuations based primarily upon valuations provided by our counterparties.
We are exposed to modest credit related risks in the event of non-performance by counterparties to derivative contracts.
ITEM 8. FINANCIAL STATEMENTS AND SUPPLEMENTARY DATA
The consolidated financial statements required with respect to this Item 8, and as listed in Item 15 of this Annual Report on Form 10-K, are included in this Annual Report on Form 10-K commencing on page 82.
ITEM 9. CHANGES IN AND DISAGREEMENTS WITH ACCOUNTANTS ON ACCOUNTING AND FINANCIAL DISCLOSURE
None.
ITEM 9A. CONTROLS AND PROCEDURES
Evaluation of Disclosure Controls and Procedures
Our management, with the participation of our principal executive officer and principal financial officer, has evaluated the effectiveness of our disclosure controls and procedures (as such term is defined in Rules 13a-15(e) and 15d-15(e) under the Exchange Act), as of the end of the period covered by this Annual Report on Form 10-K. Disclosure controls and procedures include, without limitation, controls and procedures designed to ensure that information required to be disclosed in the reports we file or submit under the Exchange Act is accumulated and communicated to management, including our principal executive officer and principal financial officer, as appropriate, to allow timely decisions regarding required disclosure. Based on such evaluation, our principal executive officer and principal financial officer have concluded that, as of the end of the period covered by this report, our disclosure controls and procedures are effective in recording, processing, summarizing and reporting, on a timely basis, information required to be disclosed by us in the reports that we file or submit under the Exchange Act.
It should be noted that any system of controls is based in part upon certain assumptions designed to obtain reasonable (and not absolute) assurance as to its effectiveness, and there can be no assurance that any design will succeed in achieving its stated goals.
Management’s Report on Internal Control Over Financial Reporting
Our management is responsible for establishing and maintaining adequate internal control over financial reporting. Mercer’s internal control over financial reporting is designed to provide reasonable assurance regarding the reliability of financial reporting and the preparation of financial statements for external purposes in accordance with GAAP.
Our internal control over financial reporting includes those policies and procedures that:
•pertain to the maintenance of records that, in reasonable detail, accurately and fairly reflect the transactions and dispositions of the assets of Mercer;
•provide reasonable assurance that transactions are recorded as necessary to permit preparation of financial statements in accordance with GAAP, and that receipts and expenditures are being made only in accordance with authorizations of management and directors; and
•provide reasonable assurance regarding prevention or timely detection of unauthorized acquisition, use or disposition of assets that could have a material effect on the financial statements.
Because of its inherent limitations, internal control over financial reporting may not prevent or detect misstatements. Also, projections of any evaluation of effectiveness to future periods are subject to the risk that controls may become inadequate because of changes in conditions, or that the degree of compliance with the policies or procedures may deteriorate.
Management assessed the effectiveness of Mercer’s internal control over financial reporting as of December 31, 2024. In making this assessment, management used the criteria set forth in Internal Control-Integrated Framework, as issued in 2013 by the Committee of Sponsoring Organizations of the Treadway Commission (COSO). Based on our assessment and those criteria, management concluded that the Company's internal control over financial reporting was effective as of December 31, 2024.
The effectiveness of our internal control over financial reporting as of December 31, 2024 has been audited by PricewaterhouseCoopers LLP, an independent registered public accounting firm, as stated in their attestation report which appears in this Annual Report on Form 10-K.
Changes in Internal Controls
There have been no changes in our internal control over financial reporting (as defined in Rules 13a-15(f) and 15d-15(f) under the Exchange Act) during the last fiscal quarter that have materially affected, or are reasonably likely to materially affect, our internal control over financial reporting.
ITEM 9B. OTHER INFORMATION
Not applicable.
ITEM 9C. DISCLOSURE REGARDING FOREIGN JURISDICTIONS THAT PREVENT INSPECTIONS
Not applicable.
PART III
ITEM 10. DIRECTORS, EXECUTIVE OFFICERS AND CORPORATE GOVERNANCE
Chairman, Chief Executive Officer and Directors
We are governed by a board of directors, referred to as the “Board”, each member of which is elected annually. The following sets forth information relating to our directors and executive officers.
William D. McCartney, age 69, has served as Chairman since 2024, and as a director since January 2003 and Lead Director since May 28, 2021. He has been the President and Chief Executive Officer of Pemcorp Management Inc., a corporate finance and management consulting firm, since its inception in 1990. From 1984 to 1990, he was a founding partner of Davidson & Company, Chartered Accountants, where he specialized in business advisory services. He has been involved with numerous capital restructuring and financing events involving several public companies and brings substantial knowledge relating to the financial accounting and auditing processes. He is a chartered professional accountant and has been a member of the Chartered Professional Accountants of Canada since 1980. He holds a Bachelor of Arts degree in Business Administration from Simon Fraser University. Mr. McCartney has extensive experience in accounting, financial and capital markets.
Juan Carlos Bueno, age 56, has served as Chief Executive Officer and President and as a director since May 2022. His previous roles included from 2018 to March 2022 serving as the Chairman of the Board and co-founder of Global Energy which produces novel green energy generation devices. Prior to that, from 2011 to 2017, Mr. Bueno was Executive Vice President and Divisional CEO, Biomaterials, for Stora Enso, a manufacturer of pulp, paper and other forest products. At Stora Enso he designed and led their new biomaterials division, growing sales and profitability. The business included six manufacturing sites and a team of approximately 2,000 employees. Mr. Bueno created a vision and strategy to expand into new sectors such as lignin and hemicellulose. He also has broad experience in investor relations, board interaction and other key CEO functions. Prior to that, Mr. Bueno served in executive positions including Vice President, Crop Protection, President Agar Cross, Commercial Manager, Global Financial Analyst and Business Consultant with EI DuPont de Nemours & Company in Brazil, UK, Argentina, Colombia and USA. EI Dupont de Nemours & Company merged with the Dow Chemical Company to create DowDuPont. Mr. Bueno holds, among other things, a BSc., Industrial Engineering degree and a graduate degree in Negotiation & International Relations. Mr. Bueno has extensive global industrial and product experience and a proven track record of achieving commercial and operational excellence over a 30-year career.
James Shepherd, age 72, has served as a director since June 2011. Mr. Shepherd was President and Chief Executive Officer of Canfor Corporation from 2004 to 2007 and Slocan Forest Products Ltd. from 1999 to 2004. He is also the former President of Crestbrook Forest Industries Ltd. and Finlay Forest Industries Limited and the former Chairman of the Forest Products Association of Canada. Mr. Shepherd has previously served as a director of Conifex Timber Inc., Canfor Corporation and Canfor Pulp Income Fund (now Canfor Pulp Products Inc.). Mr. Shepherd holds a degree in Mechanical Engineering from Queen’s University. Mr. Shepherd has held several chief executive officer leadership and other senior positions in the forest industry.
Alan Wallace, age 65, has served as a director since June 2018. Mr. Wallace is currently the Chief Executive Officer of Peloton Advisors Inc., a corporate financial advisory firm. Since 2021, Mr. Wallace has served as a director and is the chair of the board of directors of Swiss Water Decaffeinated Coffee Inc. a global provider of decaffeinated coffee. He is based in Vancouver, British Columbia. Mr. Wallace was the Vice Chairman, Investment Banking, CIBC World Markets Inc. from 1987 to 2013 where he was also the Co-Head of its Paper and Forest Products Group from 1995 to 2013. Mr. Wallace holds a Master of Business Administration from the University of Chicago and a Bachelor of Applied Science (Mech) from the University of Toronto. Mr. Wallace has significant capital markets and mergers and acquisitions experience, including relating to debt and equity financings, corporate credit facilities and financial advisory assignments. He also has extensive forest products experience relating to financings and strategic transactions in the industry.
Linda Welty, age 69, has served as a director since June 2018. Ms. Welty is currently an independent director of Huber Engineered Materials, a global manufacturer of engineered specialty ingredients, a portfolio
company of J.M. Huber Corporation and has served in that role since 2014. From 2020 to September 2022, Ms. Welty was also elected as a director of GCP Applied Technologies Inc. which is a global provider of specialty construction chemicals and building materials. She formerly served as chairman and a director of the Atlanta Chapter of the National Association of Corporate Directors, whose mission is to advance excellence in corporate governance. From 2010 to 2011 she served as a director and member of the special committee of Massey Energy Company. She served as an independent director of Vertellus Specialties, Inc. from 2007 to 2016. Ms. Welty was President and Chief Operating Officer of Flint Ink Corp., a global producer of printing inks for packaging and publication from 2003 to 2005. From 1998 to 2003, she served as President of the Specialty Group of H.B. Fuller Company, a global manufacturer of adhesives, sealants and coatings. She also served for over twenty years in global leadership roles for Hoechst AG and its former U.S. subsidiary, Celanese. Ms. Welty is a National Association of Corporate Directors (NACD) Certified Director and NACD Board Leadership Fellow and holds a Bachelor of Science in Chemical Engineering from the University of Kansas.
Rainer Rettig, age 65, has served as a director since February 2020. Mr. Rettig has served as Senior Vice-President of the Circular Economy Program at Covestro AG (formerly known as Bayer Material Science, a subgroup of Bayer AG), one of the world’s leading manufacturers of high-tech polymer materials. Mr. Rettig brings significant experience in sales, marketing and strategy development in the field of chemicals and plastics. He had several senior leadership roles in Germany, Japan, Hong Kong and China. He holds a Ph.D in polymer chemistry and polymer processing from the Technical University of Darmstadt in Germany.
Alice Laberge, age 68, has served as a director since February 2021. Ms. Laberge is currently a director of Russel Metals Inc., a metal distribution company, and has served in that role since 2007. Ms. Laberge is also a director of the Canadian Public Accountability Board. Ms. Laberge also served as a director of Potash Corporation of Saskatchewan from 2003 to 2018, and Nutrien Ltd. from 2018 to May 2024. She retired from the board of the Royal Bank of Canada in January 2021, on which she served for over 15 years. She formerly served as President and Chief Executive Officer of Fincentric Corporation, a global provider of software solutions to financial institutions, until 2005, and was previously Chief Financial Officer and Senior Vice-President, Finance for MacMillan Bloedel Ltd. Ms. Laberge is a Fellow of the Institute of Corporate Directors, and holds an MBA from the University of British Columbia and a Bachelor of Science from the University of Alberta. Ms. Laberge brings to the Board extensive senior executive experience relevant to our operations and an understanding of the forest products business. She also brings significant corporate governance and public company board experience from a wide variety of companies. Ms. Laberge also has extensive knowledge in financial and accounting matters.
Janine North, age 64, has served as a director since February 2021. Ms. North is currently a director of Conifex Timber Inc., a forest products company, and Imperial Metals Corporation, a Canadian mining company. She is also a director of the Fraser Basin Council and formerly a director of the BC Ferry Services Corp. Ms. North retired from the Northern Development Initiative Trust in 2016 after serving 11 years as the founding Chief Executive Officer. Ms. North holds a Diploma in Management Studies from the Executive MBA Program at Simon Fraser University and a Bachelor of Science from the University of Alberta. Ms. North brings with her significant public company board experience, and in particular, with companies involved in the resource sector. In particular, she has extensive knowledge and experience relevant to the Company's operations in the forest products industry, including financings and strategic transactions in the industry, as well as corporate governance and talent management.
Torbjörn Lööf, age 60, has served as a director since May 2023. Mr. Lööf is currently a director of Essity AB, a leading global hygiene and health company, listed on Nasdaq Stockholm, Husqvarna Group, a Swedish manufacturer of outdoor power products listed on the Nasdaq Stockholm, and AB Blåkläder, a family-owned company within the workwear industry. Since March 2024, Mr. Lööf has been the chairman of the board of directors of Electrolux AB, a leading global appliance company listed on Nasdaq Stockholm. He was Chief Executive Officer of Inter IKEA Holding (The Netherlands) from 2016 to 2020 and Chief Executive Officer of Inter IKEA Systems, the world-wide IKEA franchisor and owner of the IKEA concept and brand, from 2013 to 2016. From 1989 to 2013 he held a number of leading positions and roles in different areas at IKEA in Sweden and in Italy, including Managing Director, IKEA of Sweden as of 2007. His role also included different board assignments both as Chairman and member for different IKEA companies, as well as being a member of IKEA Group Management. Mr. Lööf led the acquisition and transaction of 70 companies
consisting of 26,000 employees in 30 different countries within two years. He developed and launched a new IKEA direction, Three Roads Forward, which is valid until 2025 and constitutes a major strategic shift for IKEA. In addition, he developed and implemented a new strategy which resulted in a complete restructuring for IKEA with the goal to become a global leader in furniture production with world class development and innovation capabilities. Torbjörn Lööf graduated from a Technical Industry program in Sweden and completed his financial education at MCE Management Centre Europe, Brussels.
Thomas Kevin Corrick, age 69, has served as a director since May 2023. Mr. Corrick served as Chief Executive Officer for Boise Cascade, one of the largest producers of engineered wood products and plywood in North America and a leading U.S. wholesale distributor of building products, from 2015 to 2020. Mr. Corrick began his Boise Cascade career in 1980 in finance, including roles in audit, treasury, and planning, and then moved into several leadership roles with the Wood Products manufacturing division. Under his leadership as Vice President, then Senior Vice President, the engineered wood products business grew to a market leadership position and became one of the key growth and profit engines for the company. He led the acquisition of several mills to fill product and geography gaps and nearly doubled the size of the company’s existing operations. He also focused on the supply chain, and doubled the capacity of the feeder mills supporting the business. Key accomplishments as CEO include implementing a systematic, company-wide focus on mission and values, significantly expanding leadership development and succession planning activities, with a focus on diversity and inclusion, and leading an initiative to create an owner-focused capital allocation strategy and mindset across the company. During his tenure as CEO, the company substantially improved its competitive position by expanding core capacity, selling and closing non-strategic assets, and strengthening its balance sheet by refinancing its entire debt portfolio. Mr. Corrick has served on several advisory committees and boards. He currently serves as a board member for the Treasure Valley YMCA and the St. Luke’s Health System. Previously he served as a director for the Salt Lake City branch of the Federal Reserve Bank of San Francisco and the American Wood Council (AWC), where he served as chair. He received both his bachelor's and master's degrees in business administration from Texas Christian University.
Other Executive Officers
Richard Short, age 57, has served as Chief Financial Officer and Secretary since June 2023 and was previously the Vice President, Controller since February 2014 and as Controller from November 2010 to February 2014, prior to which he served as Director, Corporate Finance since joining Mercer in 2007. Previous roles include Controller, Financial Reporting from 2006 to 2007 and Director, Corporate Finance from 2004 to 2006 with Catalyst Paper Corporation and Assistant Controller at The Alderwoods Group Inc. Mr. Short holds a Bachelor of Arts in Psychology from the University of British Columbia and has been a member of the Chartered Professional Accountants of Canada since 1993.
Adolf Koppensteiner, age 63, has been Chief Operating Officer, Pulp Products since August 2022, and previously servied as Chief Operating Officer since January 1, 2018 and has served as Managing Director, Operations and Technical of the Stendal mill since October 2013. Previously, he served as Mill Manager at the Rosenthal mill since joining Mercer in 2007. In the past, Mr. Koppensteiner was Managing Director of Kvaerner Central Europe, where he was responsible for sales and service for fifteen years. His whole career has been in the pulp and paper industry, where he has held a variety of positions building up significant experience in engineering, project work, and pulp mill start-ups, as well as the development and optimization of operating processes.
Wolfram Ridder, age 63, has served as Senior Vice President of Innovation & Government Relations since February 2023, and previously served as Vice President of Business Development from 2005. Prior to this, he served as Managing Director at Mercer’s Stendal mill from 2001 to 2005. Mr. Ridder also served as Vice President Pulp Operations, Assistant to Chief Executive Officer from 1999 to 2005 and Assistant Managing Director at the Rosenthal mill from 1995 to 1998. Prior to joining Mercer, Mr. Ridder worked as a Scientist for pulping technology development at the German Federal Research Center for Wood Science and Technology in Hamburg from 1988 to 1995. Mr. Ridder has a Master of Business Administration and a Master of Wood Science and Forest Product Technology from Hamburg University.
Cindy Alekson, age 51, has served as Vice President, Controller since April 2023. Before this, she held the position of Director, External Reporting since joining Mercer in November 2011. Her previous roles include
management positions responsible for financial reporting for public companies across several industries, including mining, high-tech and consumer products. Ms. Alekson holds a Bachelor of Science degree from the University of British Columbia and is a member of the Chartered Professional Accountants of British Columbia.
Genevieve Stannus, age 54, has served as Vice President, Treasurer since February 2021 and as Treasurer from July 2005 to February 2021, prior to which she served as Senior Financial Analyst since joining Mercer in August 2003. Prior to her role at Mercer, Ms. Stannus held Senior Treasury Analyst positions with Catalyst Paper Corporation and Pacifica Papers Inc. Ms. Stannus has over twenty years of experience in the forest products industry. She is a member of the Chartered Professional Accountants of Canada.
Dr. Carsten Merforth, age 58, has served as Chief Operating Officer, Wood Products since August 2022, prior to which he was the Managing Director of the Friesau mill since April 2017. Dr. Merforth was previously the managing director of several high-capacity sawmills for Rettenmeier Holding AG from 2000 to 2010 and from 2013 to 2014 and Pfeifer Holz GmbH from 2010 to 2012. Dr. Merforth serves as a board member of the German Sawmill Association DeSH and is the Vice President of the Main Association of the German Wood Industry HDH. He is also the spokesperson for the Raw Wood Working Group. He holds a Master of Forestry from Georg August University and a Doctorate of Forestry Economics from Albert Ludwigs University.
Wolfgang Beck, age 51, has served as Senior Vice President, Global Product Sourcing since September 1, 2022. Mr. Beck has served in different leading functions in Mercer’s German wood business since 2005, and most recently, he was Managing Director of Mercer Holz since 2016. In the past, Mr. Beck worked for a German state forest organization and in the German financial sector at the beginning of his career. He has been Managing Director of wood2M since 2016, a Joint Venture Company of Mercer and another Pulp and Paper Manufacturer. Mr. Beck is a committee chairman or member of various wood industry associations.
Guy Arguin, age 60, has served as Chief Human Resources Officer since January 2022, prior to which he was Senior Vice President, Human Resources for the Global Resources sector of SNC-Lavalin and Senior Vice President Human Resources and Human Resources Director roles with British American Tobacco across the Middle East, Northern Europe, France and Canada. Mr. Arguin started his professional career with Domtar in Montreal. Mr. Arguin has diverse Human Resources experiences across several sectors, such as Engineering and Consulting Services, Oil & Gas, Mining, Consumer Products and Pulp and Paper. Mr. Arguin holds a Master’s Degree in Industrial Relations and Human Resources from the Universite du Quebec en Outaouais and a Bachelor of Arts in Industrial Relations from McGill University. He is also a Certified Human Resources Professional and a certified Executive Coach from the Academy of Executive Coaching in the U.K.
We also have experienced mill managers at all of our mills who have operated through multiple business cycles in the pulp industry.
Code of Business Conduct and Ethics and Anti-Corruption Policy
The Board has adopted a Code of Business Conduct and Ethics that applies to our directors, employees and executive officers and an Anti-Corruption Policy. The code and the policy are available on our website at www.mercerint.com/our-company/governance/. Copies of the code and the policy may also be obtained without charge upon request to Investor Relations, Mercer International Inc., Suite 1120, 700 West Pender Street, Vancouver, British Columbia, Canada V6C 1G8 (Telephone: (604) 684-1099).
The remaining information required by this Item 10 is incorporated herein by reference to the sections entitled “Proposal 1 - Election of Directors”, “Share Ownership of Certain Beneficial Owners”, “Corporate Governance and Board Matters” and “Corporate Governance and Board Matters – Delinquent Section 16(a) Insider Reports” in our proxy statement relating to our annual meeting to be held in 2025.
ITEM 11. EXECUTIVE COMPENSATION
The information required by this Item 11 is incorporated by reference from the proxy statement relating to our annual meeting to be held in 2025.
ITEM 12. SECURITY OWNERSHIP OF CERTAIN BENEFICIAL OWNERS AND MANAGEMENT AND RELATED STOCKHOLDER MATTERS
The information required by this Item 12 is incorporated by reference from the proxy statement relating to our annual meeting to be held in 2025.
ITEM 13. CERTAIN RELATIONSHIPS AND RELATED TRANSACTIONS, AND DIRECTOR INDEPENDENCE
The information required by this Item 13 is incorporated herein by reference to the section entitled “Corporate Governance and Board Matters – Review and Approval of Related Party Transactions” of our proxy statement relating to our annual meeting to be held in 2025.
ITEM 14. PRINCIPAL ACCOUNTING FEES AND SERVICES
The information required by this Item 14 is incorporated by reference from the section entitled “Independent Registered Public Accounting Firm – Fees of Independent Registered Public Accounting Firm” of our proxy statement relating to our annual meeting to be held in 2025.
PART IV
ITEM 15. EXHIBITS AND FINANCIAL STATEMENT SCHEDULES
(a)(1) Financial Statements
(a)(2) Financial Statement Schedules
All schedules are omitted because they are not applicable or the required information is shown in the consolidated financial statements or notes thereto.
(a)(3) Exhibits
Exhibits that are not filed herewith have been previously filed with the SEC and are incorporated herein by reference.
| | |
Exhibit No. | | Description of Exhibit |
| | |
3.1 |
| Articles of Incorporation of Mercer International Inc., as amended. Incorporated by reference from Form 8-A filed March 2, 2006. |
| |
3.2 |
| Bylaws of Mercer International Inc. Incorporated by reference from Form 10-K filed February 17, 2022. |
| |
4.1 |
| Indenture dated December 20, 2017 between Mercer International Inc. and Wells Fargo Bank, National Association, as trustee, relating to the 2026 Senior Notes. Incorporated by reference from Form 8-K filed December 20, 2017. |
| |
4.2 |
| Description of Securities. Incorporated by reference from Form 10-K filed February 13, 2020. |
| |
4.3 |
| Indenture dated January 26, 2021 between Mercer International Inc. and Wells Fargo Bank, National Association, as trustee, relating to the 2029 Senior Notes. Incorporated by reference from Form 8-K filed January 26, 2021. |
| | |
4.4 | | Indenture dated September 21, 2023 between Mercer International Inc. and Computershare Trust Company, N.A., as trustee, relating to the 2028 Senior Notes. Incorporated by reference from Form 8-K filed September 21, 2023. |
| | |
10.1 |
| Revolving Credit Facility Agreement dated January 21, 2022 among Mercer Peace River Pulp Ltd., Mercer Celgar Limited Partnership and Mercer Forestry Services Ltd. et al. and Royal Bank of Canada, as Agent and the other Lenders thereto. Incorporated by reference from Form 10-K filed February 17, 2022. |
| | |
10.2 | | First Amendment to Credit Agreement dated June 10, 2024 among Mercer Peace River Pulp Ltd., Mercer Celgar Limited Partnership and Mercer Forestry Services Ltd. et al. and Royal Bank of Canada, as Agent and the other Lenders thereto. Incorporated by reference from Form 10-Q filed April 8, 2024. |
| | |
10.3 | | Revolving Facility Agreement dated September 15, 2022 among Zellstoff-Und Papierfabrik Rosenthal GmbH, Mercer Timber Products GmbH, Zellstoff Stendal GmbH, Mercer Holz GmbH, Stendal Pulp Holding GmbH, Zellstoff Stendal Transport GmbH, Mercer Timber |
| | |
| | Products Stendal GmbH, Unicredit Bank AG, Commerzbank AG, Berlin Branch, Landesbank Baden-Württemberg and Unicredit Bank AG. Incorporated by reference from Form 10-Q filed October 27, 2022. |
| |
10.4 | | Amendment and Restatement Agreement dated March 22, 2023 among Mercer Rosenthal GmbH, Mercer Timber Products GmbH, Mercer Stendal GmbH, Mercer Holz GmbH, Mercer Europe GmbH, Mercer Stendal Logistik GmbH, Mercer Timber Products Stendal GmbH, Mercer Torgau GmbH & Co. KG, Unicredit Bank AG, Commerzbank AG, Berlin Branch, Landesbank Baden-Württemberg and others relating to Revolving Facility Agreement dated September 15, 2022. Incorporated by reference from Form 10-Q filed May 4, 2023. |
| | |
10.5† |
| Form of Trustee’s Indemnity Agreement between Mercer International Inc. and its Trustees. Incorporated by reference from Form 10-K filed March 31, 2003. |
| |
10.6† |
| Mercer International Inc. 2022 Stock Incentive Plan. Incorporated by reference from Appendix A to Mercer International Inc.’s definitive proxy statement on Schedule 14A filed April 18, 2022. |
| |
10.7† | | Employment Agreement dated October 2, 2006 between Stendal Pulp Holding GmbH and Wolfram Ridder. Incorporated by reference from Form 8-K filed October 3, 2006. |
| | |
10.8† | | Chief Operating Officer and Managing Director Service Agreement, as amended, dated June 1, 2019 between Stendal Pulp Holding GmbH and Adolf Koppensteiner. Incorporated by reference from Form 10-K filed February 13, 2020. |
| | |
10.9† | | Employment Agreement between Mercer International Inc. and Juan Carlos Bueno, dated March 11, 2022. Incorporated by reference from Form 8-K filed March 16, 2022. |
| | |
10.10† | | Employment Agreement between Mercer International Inc. and Richard Short, dated April 14, 2015. Incorporated by reference from Form 10-K filed February 15, 2024. |
| | |
19.1* | | Securities Law Compliance Policy. |
| | |
21.1* | | List of Subsidiaries of Registrant. |
| | |
23.1* | | Consent of PricewaterhouseCoopers LLP. |
| | |
31.1* | | Section 302 Certificate of Chief Executive Officer. |
| | |
31.2* | | Section 302 Certificate of Chief Financial Officer. |
| | |
32.1* | | Section 906 Certificate of Chief Executive Officer. |
| | |
32.2* | | Section 906 Certificate of Chief Financial Officer. |
| | |
97.1 | | Policy relating to recovery of erroneously awarded compensation, as required by applicable listing standards adopted pursuant to 17 CFR 240.10D-1 - Mercer International Inc. Clawback Policy. Incorporated by reference from Form 10-K filed February 15, 2024. |
| | |
101* | | The following financial statements from the Company’s Annual Report on Form 10-K for the year ended December 31, 2024, formatted in inline Extensible Business Reporting Language (iXBRL): (i) Consolidated Statements of Operations; (ii) Consolidated Statements of Comprehensive Income (Loss); (iii) Consolidated Balance Sheets; (iv) Consolidated Statements of Changes in Shareholders’ Equity; (v) Consolidated Statements of Cash Flows; and (vi) Notes to the Consolidated Financial Statements. |
104* | | The cover page from the Company's Annual Report on Form 10-K for the year ended December 31, 2024, has been formatted in iXBRL. |
* Filed herewith.
† Denotes management contract or compensatory plan or arrangement.
ITEM 16. FORM 10-K SUMMARY
None.
Report of Independent Registered Public Accounting Firm
To the Board of Directors and Shareholders of Mercer International Inc.
Opinions on the Financial Statements and Internal Control over Financial Reporting
We have audited the accompanying consolidated balance sheets of Mercer International Inc. and its subsidiaries (together, the Company) as of December 31, 2024 and 2023, and the related consolidated statements of operations, of comprehensive income (loss), of changes in shareholders’ equity and of cash flows for each of the three years in the period ended December 31, 2024, including the related notes (collectively referred to as the consolidated financial statements). We also have audited the Company’s internal control over financial reporting as of December 31, 2024, based on criteria established in Internal Control ‒ Integrated Framework (2013) issued by the Committee of Sponsoring Organizations of the Treadway Commission (COSO).
In our opinion, the consolidated financial statements referred to above present fairly, in all material respects, the financial position of the Company as of December 31, 2024 and 2023, and the results of its operations and its cash flows for each of the three years in the period ended December 31, 2024 in conformity with accounting principles generally accepted in the United States of America. Also in our opinion, the Company maintained, in all material respects, effective internal control over financial reporting as of December 31, 2024, based on criteria established in Internal Control ‒ Integrated Framework (2013) issued by the COSO.
Basis for Opinions
The Company’s management is responsible for these consolidated financial statements, for maintaining effective internal control over financial reporting, and for its assessment of the effectiveness of internal control over financial reporting, included in Management’s Report on Internal Control over Financial Reporting appearing under Item 9A. Our responsibility is to express opinions on the Company’s consolidated financial statements and on the Company’s internal control over financial reporting based on our audits. We are a public accounting firm registered with the Public Company Accounting Oversight Board (United States) (PCAOB) and are required to be independent with respect to the Company in accordance with the U.S. federal securities laws and the applicable rules and regulations of the Securities and Exchange Commission and the PCAOB.
We conducted our audits in accordance with the standards of the PCAOB. Those standards require that we plan and perform the audits to obtain reasonable assurance about whether the consolidated financial statements are free of material misstatement, whether due to error or fraud, and whether effective internal control over financial reporting was maintained in all material respects.
Our audits of the consolidated financial statements included performing procedures to assess the risks of material misstatement of the consolidated financial statements, whether due to error or fraud, and performing procedures that respond to those risks. Such procedures included examining, on a test basis, evidence regarding the amounts and disclosures in the consolidated financial statements. Our audits also included evaluating the accounting principles used and significant estimates made by management, as well as evaluating the overall presentation of the consolidated financial statements. Our audit of internal control over financial reporting included obtaining an understanding of internal control over financial reporting, assessing the risk that a material weakness exists, and testing and evaluating the design and operating effectiveness of internal control based on the assessed risk. Our audits also included performing such other procedures as we considered necessary in the circumstances. We believe that our audits provide a reasonable basis for our opinions.
Definition and Limitations of Internal Control over Financial Reporting
A company’s internal control over financial reporting is a process designed to provide reasonable assurance regarding the reliability of financial reporting and the preparation of financial statements for external purposes in accordance with generally accepted accounting principles. A company’s internal control over financial reporting includes those policies and procedures that (i) pertain to the maintenance of records that, in reasonable detail, accurately and fairly reflect the transactions and dispositions of the assets of the company; (ii) provide reasonable assurance that transactions are recorded as necessary to permit preparation of financial statements in accordance with generally accepted accounting principles, and that receipts and expenditures of the company are being made only in accordance with authorizations of management and directors of the company; and (iii) provide reasonable assurance regarding prevention or timely detection of unauthorized acquisition, use, or disposition of the company’s assets that could have a material effect on the financial statements.
Because of its inherent limitations, internal control over financial reporting may not prevent or detect misstatements. Also, projections of any evaluation of effectiveness to future periods are subject to the risk that controls may become inadequate because of changes in conditions, or that the degree of compliance with the policies or procedures may deteriorate.
Critical Audit Matters
The critical audit matter communicated below is a matter arising from the current period audit of the consolidated financial statements that was communicated or required to be communicated to the audit committee and that (i) relates to accounts or disclosures that are material to the consolidated financial statements and (ii) involved our especially challenging, subjective, or complex judgments. The communication of critical audit matters does not alter in any way our opinion on the consolidated financial statements, taken as a whole, and we are not, by communicating the critical audit matter below, providing a separate opinion on the critical audit matter or on the accounts or disclosures to which it relates.
Goodwill impairment assessment for the Torgau reporting unit (Torgau)
As described in Note 11 to the consolidated financial statements, the Company fully impaired the goodwill related to Torgau during the year ended December 31, 2024. Goodwill is tested for impairment annually as of August 31, or more frequently if events or changes in circumstances indicate the existence of potential impairment loss. Management has the option to first assess qualitative factors to determine whether it is necessary to perform the quantitative goodwill impairment assessment. Management determined that there were indicators of impairment and therefore performed a quantitative goodwill impairment test for Torgau as of June 30, 2024, which involves the comparison of the fair value of the reporting unit to its carrying value. If the estimated fair value of the reporting unit is less than its carrying amount, goodwill is written down for the amount by which the carrying amount exceeds the estimated fair value. Management estimated the fair value of the reporting unit by using a discounted cash flow model. This required management to make significant estimates and assumptions related to future estimated sales volumes, selling prices and costs, capital expenditures and the discount rate. A goodwill impairment charge of $34.3 million was recognized as a result of the impairment test for Torgau.
The principal considerations for our determination that performing procedures relating to the goodwill impairment assessment for Torgau is a critical audit matter are (i) the significant judgment by management when developing the estimated fair value of Torgau; (ii) a high degree of auditor judgment, subjectivity and effort in performing procedures and evaluating management’s significant assumptions related to future estimated sales volumes, selling prices and costs, capital expenditures and the discount rate; and (iii) the audit effort involved the use of professionals with specialized skill and knowledge.
Addressing the matter involved performing procedures and evaluating audit evidence in connection with forming our overall opinion on the consolidated financial statements. These
procedures included testing the effectiveness of controls relating to management’s goodwill impairment assessment, including controls over the valuation of Torgau. These procedures also included, among others, (i) testing management’s process for developing the fair value estimate; (ii) evaluating the appropriateness of the discounted cash flow model used by management; (iii) testing the completeness and accuracy of underlying data used in the discounted cash flow model; and (iv) evaluating the reasonableness of the significant assumptions used by management related to future estimated sales volumes, selling prices and costs, capital expenditures and the discount rate. Evaluating management’s assumptions related to future estimated sales volumes, selling prices and costs and capital expenditures involved evaluating whether the assumptions used by management were reasonable considering (i) the current and past performance of Torgau; (ii) the consistency with external market and industry data; and (iii) whether the assumptions were consistent with evidence obtained in other areas of the audit, as applicable. Professionals with specialized skill and knowledge were used to assist in evaluating the reasonableness of the discount rate.
/s/PricewaterhouseCoopers LLP
Chartered Professional Accountants
|
Vancouver, Canada February 20, 2025 |
We have served as the Company’s auditor since 2007.
MERCER INTERNATIONAL INC.
CONSOLIDATED STATEMENTS OF OPERATIONS
(In thousands of U.S. dollars, except per share data)
| | | | | | | | | | | | |
| | For the Year Ended December 31, | |
| | 2024 | | | 2023 | | | 2022 | |
Revenues | | $ | 2,043,360 | | | $ | 1,993,844 | | | $ | 2,280,937 | |
Costs and expenses | | | | | | | | | |
Cost of sales, excluding depreciation and amortization | | | 1,683,456 | | | | 1,853,482 | | | | 1,638,672 | |
Cost of sales depreciation and amortization | | | 170,542 | | | | 172,223 | | | | 144,064 | |
Selling, general and administrative expenses | | | 116,433 | | | | 123,179 | | | | 105,833 | |
Impairment of sandalwood business held for sale | | | — | | | | 33,734 | | | | — | |
Loss on disposal of investment in joint venture | | | 23,645 | | | | — | | | | — | |
Goodwill impairment | | | 34,277 | | | | — | | | | — | |
Operating income (loss) | | | 15,007 | | | | (188,774 | ) | | | 392,368 | |
Other income (expenses) | | | | | | | | | |
Interest expense | | | (109,150 | ) | | | (88,246 | ) | | | (71,499 | ) |
Other income | | | 7,228 | | | | 7,197 | | | | 24,434 | |
Total other expenses, net | | | (101,922 | ) | | | (81,049 | ) | | | (47,065 | ) |
Income (loss) before income taxes | | | (86,915 | ) | | | (269,823 | ) | | | 345,303 | |
Income tax recovery (provision) | | | 1,774 | | | | 27,767 | | | | (98,264 | ) |
Net income (loss) | | $ | (85,141 | ) | | $ | (242,056 | ) | | $ | 247,039 | |
Net income (loss) per common share | | | | | | | | | |
Basic | | $ | (1.27 | ) | | $ | (3.65 | ) | | $ | 3.74 | |
Diluted | | $ | (1.27 | ) | | $ | (3.65 | ) | | $ | 3.71 | |
Dividends declared per common share | | $ | 0.300 | | | $ | 0.300 | | | $ | 0.300 | |
CONSOLIDATED STATEMENTS OF COMPREHENSIVE INCOME (LOSS)
(In thousands of U.S. dollars)
| | | | | | | | | | | | |
| | For the Year Ended December 31, | |
| | 2024 | | | 2023 | | | 2022 | |
Net income (loss) | | $ | (85,141 | ) | | $ | (242,056 | ) | | $ | 247,039 | |
Other comprehensive income (loss) | | | | | | | | | |
Gain related to defined benefit pension plans | | | 5,128 | | | | 4,063 | | | | 10,755 | |
Income tax provision | | | (653 | ) | | | (252 | ) | | | (2,356 | ) |
Gain related to defined benefit pension plans, net of tax | | | 4,475 | | | | 3,811 | | | | 8,399 | |
Foreign currency translation adjustments | | | (104,392 | ) | | | 49,480 | | | | (97,568 | ) |
Other comprehensive income (loss), net of tax | | | (99,917 | ) | | | 53,291 | | | | (89,169 | ) |
Total comprehensive income (loss) | | $ | (185,058 | ) | | $ | (188,765 | ) | | $ | 157,870 | |
See accompanying Notes to the Consolidated Financial Statements.
MERCER INTERNATIONAL INC.
CONSOLIDATED BALANCE SHEETS
(In thousands of U.S. dollars, except share and per share data)
| | | | | | | | |
| | December 31, | |
| | 2024 | | | 2023 | |
ASSETS | | | | | | |
Current assets | | | | | | |
Cash and cash equivalents | | $ | 184,925 | | | $ | 313,992 | |
Accounts receivable, net | | | 327,345 | | | | 306,166 | |
Inventories | | | 361,682 | | | | 414,161 | |
Prepaid expenses and other | | | 17,601 | | | | 23,461 | |
Assets classified as held for sale | | | 18,451 | | | | 35,125 | |
Total current assets | | | 910,004 | | | | 1,092,905 | |
Property, plant and equipment, net | | | 1,254,715 | | | | 1,409,937 | |
Investment in joint ventures | | | 3,348 | | | | 41,665 | |
Amortizable intangible assets, net | | | 49,829 | | | | 52,641 | |
Goodwill | | | — | | | | 35,381 | |
Operating lease right-of-use assets | | | 7,598 | | | | 11,725 | |
Pension asset | | | 9,378 | | | | 5,588 | |
Deferred income tax assets | | | 17,778 | | | | 661 | |
Other long-term assets | | | 10,282 | | | | 12,075 | |
Total assets | | $ | 2,262,932 | | | $ | 2,662,578 | |
LIABILITIES AND SHAREHOLDERS’ EQUITY | | | | | | |
Current liabilities | | | | | | |
Accounts payable and other | | $ | 248,661 | | | $ | 278,986 | |
Pension and other post-retirement benefit obligations | | | 732 | | | | 826 | |
Liabilities associated with assets held for sale | | | 7,145 | | | | 6,625 | |
Total current liabilities | | | 256,538 | | | | 286,437 | |
Long-term debt | | | 1,473,986 | | | | 1,609,425 | |
Pension and other post-retirement benefit obligations | | | 11,134 | | | | 12,483 | |
Operating lease liabilities | | | 4,793 | | | | 7,755 | |
Deferred income tax liabilities | | | 74,772 | | | | 97,324 | |
Other long-term liabilities | | | 11,934 | | | | 13,744 | |
Total liabilities | | | 1,833,157 | | | | 2,027,168 | |
Shareholders’ equity | | | | | | |
Common shares $1 par value; 200,000,000 authorized; 66,871,000 issued and outstanding (2023 – 66,525,000) | | | 66,850 | | | | 66,471 | |
Additional paid-in capital | | | 362,782 | | | | 359,497 | |
Retained earnings | | | 230,912 | | | | 336,113 | |
Accumulated other comprehensive loss | | | (230,769 | ) | | | (126,671 | ) |
Total shareholders’ equity | | | 429,775 | | | | 635,410 | |
Total liabilities and shareholders’ equity | | $ | 2,262,932 | | | $ | 2,662,578 | |
| | | | | | |
Commitments and contingencies (Note 23) | | | | | | |
Subsequent event (Note 16) | | | | | | |
See accompanying Notes to the Consolidated Financial Statements.
MERCER INTERNATIONAL INC.
CONSOLIDATED STATEMENTS OF CHANGES IN SHAREHOLDERS’ EQUITY
(In thousands of U.S. dollars)
| | | | | | | | | | | | | | | | | | | | | | | | |
| | Common shares | | | | | | | | | | | | | |
| | Number
(thousands
of shares) | | | Amount,
at Par
Value | | | Additional
Paid-in
Capital | | | Retained
Earnings | | | Accumulated
Other
Comprehensive
Loss | | | Total
Shareholders'
Equity | |
Balance as of December 31, 2021 | | | 66,037 | | | $ | 65,988 | | | $ | 347,902 | | | $ | 370,927 | | | $ | (90,793 | ) | | $ | 694,024 | |
Shares issued on grants of restricted shares | | | 35 | | | | 49 | | | | (49 | ) | | | — | | | | — | | | | — | |
Shares issued on grants of performance share units | | | 95 | | | | 95 | | | | (95 | ) | | | — | | | | — | | | | — | |
Stock compensation expense | | | — | | | | — | | | | 6,737 | | | | — | | | | — | | | | 6,737 | |
Net income | | | — | | | | — | | | | — | | | | 247,039 | | | | — | | | | 247,039 | |
Dividends declared | | | — | | | | — | | | | — | | | | (19,847 | ) | | | — | | | | (19,847 | ) |
Other comprehensive loss | | | — | | | | — | | | | — | | | | — | | | | (89,169 | ) | | | (89,169 | ) |
Balance as of December 31, 2022 | | | 66,167 | | | | 66,132 | | | | 354,495 | | | | 598,119 | | | | (179,962 | ) | | | 838,784 | |
Shares issued on grants of restricted shares | | | 54 | | | | 35 | | | | (35 | ) | | | — | | | | — | | | | — | |
Shares issued on grants of performance share units | | | 254 | | | | 254 | | | | (254 | ) | | | — | | | | — | | | | — | |
Shares issued on grants of restricted share units | | | 50 | | | | 50 | | | | (50 | ) | | | — | | | | — | | | | — | |
Stock compensation expense | | | — | | | | — | | | | 5,341 | | | | — | | | | — | | | | 5,341 | |
Net loss | | | — | | | | — | | | | — | | | | (242,056 | ) | | | — | | | | (242,056 | ) |
Dividends declared | | | — | | | | — | | | | — | | | | (19,950 | ) | | | — | | | | (19,950 | ) |
Other comprehensive income | | | — | | | | — | | | | — | | | | — | | | | 53,291 | | | | 53,291 | |
Balance as of December 31, 2023 | | | 66,525 | | | | 66,471 | | | | 359,497 | | | | 336,113 | | | | (126,671 | ) | | | 635,410 | |
Shares issued on grants of restricted shares | | | 21 | | | | 54 | | | | (54 | ) | | | — | | | | — | | | | — | |
Shares issued on grants of performance share units | | | 325 | | | | 325 | | | | (325 | ) | | | — | | | | — | | | | — | |
Stock compensation expense | | | — | | | | — | | | | 3,664 | | | | — | | | | — | | | | 3,664 | |
Net loss | | | — | | | | — | | | | — | | | | (85,141 | ) | | | — | | | | (85,141 | ) |
Dividends declared | | | — | | | | — | | | | — | | | | (20,060 | ) | | | — | | | | (20,060 | ) |
Disposal of investment in joint venture | | | — | | | | — | | | | — | | | | — | | | | (4,181 | ) | | | (4,181 | ) |
Other comprehensive loss | | | — | | | | — | | | | — | | | | — | | | | (99,917 | ) | | | (99,917 | ) |
Balance as of December 31, 2024 | | | 66,871 | | | $ | 66,850 | | | $ | 362,782 | | | $ | 230,912 | | | $ | (230,769 | ) | | $ | 429,775 | |
See accompanying Notes to the Consolidated Financial Statements.
MERCER INTERNATIONAL INC.
CONSOLIDATED STATEMENTS OF CASH FLOWS
(In thousands of U.S. dollars)
| | | | | | | | | | | | |
| | For the Year Ended December 31, | |
| | 2024 | | | 2023 | | | 2022 | |
Cash flows from (used in) operating activities | | | | | | | | | |
Net income (loss) | | $ | (85,141 | ) | | $ | (242,056 | ) | | $ | 247,039 | |
Adjustments to reconcile net income (loss) to cash flows from operating activities | | | | | | | | | |
Depreciation and amortization | | | 170,793 | | | | 172,502 | | | | 144,153 | |
Deferred income tax provision (recovery) | | | (35,721 | ) | | | (36,392 | ) | | | 7,003 | |
Inventory impairment | | | 9,000 | | | | 58,600 | | | | — | |
Impairment of sandalwood business held for sale | | | — | | | | 33,734 | | | | — | |
Loss on disposal of investment in joint venture | | | 23,645 | | | | — | | | | — | |
Goodwill impairment | | | 34,277 | | | | — | | | | — | |
Defined benefit pension plans and other post-retirement benefit plan expense | | | 1,272 | | | | 5,214 | | | | 1,708 | |
Stock compensation expense | | | 3,859 | | | | 5,922 | | | | 6,737 | |
Foreign exchange transaction losses (gains) | | | (8,311 | ) | | | 3,905 | | | | (16,802 | ) |
Other | | | 2,087 | | | | (5,092 | ) | | | (1,241 | ) |
Defined benefit pension plans and other post-retirement benefit plan contributions | | | (675 | ) | | | (1,152 | ) | | | (2,942 | ) |
Changes in working capital | | | | | | | | | |
Accounts receivable | | | (32,094 | ) | | | 52,507 | | | | (20,476 | ) |
Inventories | | | 23,907 | | | | (15,836 | ) | | | (63,184 | ) |
Accounts payable and accrued expenses | | | (17,680 | ) | | | (98,182 | ) | | | 66,796 | |
Other | | | 986 | | | | (2,679 | ) | | | (8,131 | ) |
Net cash from (used in) operating activities | | | 90,204 | | | | (69,005 | ) | | | 360,660 | |
Cash flows from (used in) investing activities | | | | | | | | | |
Purchase of property, plant and equipment | | | (84,318 | ) | | | (136,324 | ) | | | (178,742 | ) |
Proceeds from sale of property, plant and equipment | | | 19,874 | | | | 3,408 | | | | 1,689 | |
Acquisition, net of cash acquired | | | — | | | | (82,100 | ) | | | (256,604 | ) |
Property insurance proceeds | | | 773 | | | | 12,203 | | | | 8,616 | |
Proceeds from government grants | | | 787 | | | | 5,569 | | | | 1,067 | |
Purchase of term deposit | | | — | | | | — | | | | (75,000 | ) |
Proceeds from sale of term deposit | | | — | | | | — | | | | 75,519 | |
Other | | | (4,108 | ) | | | (2,623 | ) | | | (1,155 | ) |
Net cash from (used in) investing activities | | | (66,992 | ) | | | (199,867 | ) | | | (424,610 | ) |
Cash flows from (used in) financing activities | | | | | | | | | |
Redemption of senior notes | | | (300,000 | ) | | | — | | | | — | |
Proceeds from issuance of senior notes | | | 206,000 | | | | 200,000 | | | | — | |
Proceeds from (repayment of) revolving credit facilities, net | | | (25,061 | ) | | | 61,272 | | | | 115,330 | |
Dividend payments | | | (20,060 | ) | | | (19,950 | ) | | | (19,847 | ) |
Payment of debt issuance costs | | | (4,515 | ) | | | (4,865 | ) | | | (3,871 | ) |
Payment of finance lease obligations | | | (8,918 | ) | | | (7,785 | ) | | | (10,003 | ) |
Other | | | (229 | ) | | | (48 | ) | | | (711 | ) |
Net cash from (used in) financing activities | | | (152,783 | ) | | | 228,624 | | | | 80,898 | |
Effect of exchange rate changes on cash and cash equivalents | | | 504 | | | | 208 | | | | (8,526 | ) |
Net increase (decrease) in cash and cash equivalents | | | (129,067 | ) | | | (40,040 | ) | | | 8,422 | |
Cash and cash equivalents, beginning of year | | | 313,992 | | | | 354,032 | | | | 345,610 | |
Cash and cash equivalents, end of year | | $ | 184,925 | | | $ | 313,992 | | | $ | 354,032 | |
| | | | | | | | | |
Supplemental cash flow disclosure: | | | | | | | | | |
Cash paid for interest | | $ | 105,483 | | | $ | 79,620 | | | $ | 67,103 | |
Cash paid for income taxes | | $ | 22,494 | | | $ | 63,551 | | | $ | 86,037 | |
Supplemental schedule of non-cash investing and financing activities: | | | | | | | |
Leased production and other equipment | | $ | 11,906 | | | $ | 3,310 | | | $ | — | |
See accompanying Notes to the Consolidated Financial Statements.
MERCER INTERNATIONAL INC.
NOTES TO THE CONSOLIDATED FINANCIAL STATEMENTS
(In thousands of U.S. dollars, except share and per share data)
Note 1. The Company and Summary of Significant Accounting Policies
Background
Mercer International Inc. (“Mercer Inc.”) is a Washington corporation and its shares of common stock are quoted and listed for trading on the NASDAQ Global Select Market.
Mercer Inc. owns and operates four pulp manufacturing facilities, two in Canada and two in Germany, one sawmill and one timber processing and value-add pallet production facility in Germany. The Company also owns three mass timber production facilities, two located in the U.S. and one in Canada.
In these consolidated financial statements, unless otherwise indicated, all amounts are expressed in U.S. dollars (“$”). The symbol “€” refers to euros and the symbol “C$” refers to Canadian dollars.
Basis of Presentation
These consolidated financial statements contained herein include the accounts of Mercer Inc. and all of its subsidiaries (collectively, the “Company”). The Company’s consolidated financial statements have been prepared in accordance with accounting principles generally accepted in the U.S. (“GAAP”). All significant intercompany balances and transactions have been eliminated upon consolidation.
Mercer Inc. owns 100% of its subsidiaries. In 2024, the Company disposed of its 50% joint venture interest in Cariboo Pulp & Paper Company (“CPP”) with West Fraser Mills Ltd. (“West Fraser”) which prior to the disposal was accounted for using the equity method.
Use of Estimates
Preparation of financial statements and related disclosures in conformity with GAAP requires management to make estimates and assumptions that affect the amounts reported in the financial statements and accompanying notes. Significant management judgment is required in determining the accounting for, among other things, future cash flows associated with impairment testing for goodwill and long-lived assets, depreciation and amortization, pension and other post-retirement benefit obligations, deferred income taxes (valuation allowance and permanent reinvestment), the allocation of the purchase price in a business combination to the assets acquired and liabilities assumed, revenues under long-term contracts, inventory impairment, assets and liabilities classified as held for sale and the fair value of disposal groups, legal liabilities and contingencies. Actual results could differ materially from these estimates, and changes in these estimates are recorded when known.
Significant Accounting Policies
Cash and Cash Equivalents
Cash and cash equivalents include cash held in bank accounts and highly liquid investments with original maturities of three months or less.
Accounts Receivable
Accounts receivable are recorded at cost, net of an allowance for doubtful accounts. The Company reviews the collectability of accounts receivable at each reporting date and maintains an allowance for doubtful accounts at an amount estimated to cover the expected losses on uninsured accounts receivable. Any amounts that are determined to be uncollectible and uninsured are offset against the allowance. The allowance is based on the Company’s evaluation of numerous factors, including the payment history, financial position of the debtors and current market conditions.
MERCER INTERNATIONAL INC.
NOTES TO THE CONSOLIDATED FINANCIAL STATEMENTS
(In thousands of U.S. dollars, except share and per share data)
The Company’s credit risk associated with its sales is currently managed through the purchase of credit insurance, obtaining letters of credit and setting credit limits prior to the sale. The Company reviews new customers’ credit history before granting credit and conducts regular reviews of existing customers’ credit.
Inventories
Inventories of raw materials, finished goods and work in progress are valued at the lower of cost, using the weighted-average cost method, or net realizable value and are released from inventory on the same basis. Spare parts and other materials are valued at the lower of cost and replacement cost. Cost includes labor, materials and production overhead and is determined by using the weighted-average cost method. Raw materials inventories include pulp logs, sawlogs, wood chips and lumber. These inventories are located both at the mills and at various offsite locations. In accordance with industry practice, physical inventory counts utilize standardized techniques to estimate quantities of such inventory volumes. These techniques historically have provided reasonable estimates of such inventories.
Property, Plant and Equipment
Property, plant and equipment is stated at cost less accumulated depreciation. Depreciation of buildings and production equipment is based on the estimated useful lives of the assets and is computed using the straight-line method. The amortization periods have been provided in the Property, Plant and Equipment, Net Note.
The costs of major rebuilds, replacements and those expenditures that substantially increase the useful lives of existing property, plant and equipment are capitalized. The Company capitalizes interest on borrowings during the construction period of major capital projects as part of the related asset. The cost of repairs and maintenance as well as planned shutdown maintenance performed on manufacturing facilities, composed of labor, materials and other incremental costs, is recognized as an expense in the Consolidated Statements of Operations as incurred.
The Company provides for asset retirement obligations when there is a legislated or contractual basis for those obligations. An obligation is recorded as a liability at fair value in the period in which the Company incurs a legal obligation associated with the retirement of an asset. The associated costs are capitalized as part of the carrying value of the related asset and amortized over its remaining useful life. The liability is accreted using a credit adjusted risk-free interest rate.
Impairment of Long-Lived Assets
Long-lived assets include “Property, plant and equipment, net” and “Amortizable intangible assets, net”. The unit of accounting for impairment testing for long-lived assets is its “Asset Group”, which includes the long-lived assets and liabilities directly related to those assets. The Company evaluates an Asset Group for impairment whenever events or changes in circumstances indicate that the carrying value may not be recoverable, such as continuing operating losses. When an indicator that the carrying value of an Asset Group may not be recoverable is triggered, the Company compares the carrying value of the Asset Group to its forecasted undiscounted future cash flows. If the carrying value of the Asset Group is greater than the undiscounted future cash flows an impairment charge is recorded based on the excess of the Asset Group’s carrying value over its fair value.
Leases
The Company determines if a contract contains a lease at inception. Leases are classified as either operating or finance leases. Leases with a term of less than 12 months are not recorded in the Consolidated Balance Sheets, and are expensed over the term of the lease in the Consolidated Statements of Operations.
MERCER INTERNATIONAL INC.
NOTES TO THE CONSOLIDATED FINANCIAL STATEMENTS
(In thousands of U.S. dollars, except share and per share data)
Operating and finance lease right-of-use assets and the related liabilities are recognized at the lease commencement date based on the present value of the future lease payments over the term of the lease. Renewal and termination options are included in the lease terms when it is reasonably certain that they will be exercised. In determining the present value of lease payments, the Company uses the implicit rate when readily determinable, or the Company’s estimated incremental borrowing rate, which is based on information available at the lease commencement date.
Government Grants
The Company records grants from federal, provincial and state governments when the conditions of their receipt are complied with and there is reasonable assurance that the grants will be received. Grants related to assets are government grants whose primary condition is that the company qualifying for them should purchase, construct or otherwise acquire long-term assets. Secondary conditions may also be attached, including restricting the type or location of the assets and/or other conditions that must be met. Grants related to assets are deducted from the cost of the assets in the Consolidated Balance Sheets and amortized over the same period as the related asset in “Cost of sales depreciation and amortization” in the Consolidated Statements of Operations. Grants related to income are government grants which are either unconditional, related to reduced environmental emissions or related to the Company’s normal business operations, and are reported as a reduction of related expenses in the Consolidated Statements of Operations.
The Company is required to pay certain fees based on wastewater emissions at its German mills. Accrued fees can be reduced upon the mills’ demonstration of lower wastewater emissions. The fees are expensed as incurred and the fee reduction is recognized once the Company has reasonable assurance that the German regulators will accept the lower level of wastewater emissions. Both the fees and the fee reduction are recognized in “Cost of sales, excluding depreciation and amortization” in the Consolidated Statements of Operations. There may be a significant period of time between recognition of the wastewater expense and recognition of the wastewater fee reduction.
Amortizable Intangible Assets
Amortizable intangible assets are stated at cost less accumulated amortization. Amortization is based on the estimated useful lives of the intangible assets and is computed using the straight-line method. The amortization periods have been provided in the Amortizable Intangible Assets, Net Note.
Goodwill
Goodwill represents the excess of the purchase price over the fair value of net identifiable assets upon acquisition of a business. The carrying value of goodwill, which is not amortized, is assessed for impairment annually as of August 31 or more frequently if events or changes in circumstances arise that suggest the carrying value of goodwill may be impaired. Goodwill is allocated to reporting units that are expected to benefit from the synergies arising from business combinations.
The impairment test of goodwill is performed at the reporting unit level. A reporting unit is an operating segment or one level below an operating segment (also known as a component). The Company has the option to first assess qualitative factors to determine whether it is necessary to perform the quantitative goodwill impairment assessment. The quantitative impairment test compares the fair value of the reporting unit to its carrying value, including goodwill. If the estimated fair value of the reporting unit is less than its carrying amount, goodwill is written down for the amount by which the carrying amount exceeds the fair value.
However, the impairment charge recognized cannot exceed the carrying amount of goodwill. The fair value of a reporting unit is estimated using a discounted cash flow model, based on market participant assumptions. This requires significant estimates and assumptions related to future estimated sales volumes, selling prices and costs, capital expenditures and the discount rate. The assumptions used are consistent with internal forecasts. Unanticipated market and macroeconomic events and circumstances may occur and could affect the accuracy of management assumptions. Sensitivities of these assumptions are also performed.
MERCER INTERNATIONAL INC.
NOTES TO THE CONSOLIDATED FINANCIAL STATEMENTS
(In thousands of U.S. dollars, except share and per share data)
Pension Plans
The Company maintains defined benefit pension plans for its Peace River employees and its salaried employees at the Celgar mill which are funded and non-contributory. The cost of the benefits earned by the employees is determined using the projected unit credit benefit method prorated on years of service. The pension expense reflects the current service cost, the interest on the unfunded liability and the amortization over the estimated average remaining service life of the employees of: (i) prior service costs, and (ii) the net actuarial gain or loss that exceeds 10% of the greater of the accrued benefit obligation and the fair value of plan assets as of the beginning of the year. The Company recognizes the net funded status of the plan.
The Company also has a multiemployer pension plan and defined contribution plans for which contributions are expensed in the Consolidated Statements of Operations.
Foreign Operations and Currency Translation
The Company determines its foreign subsidiaries’ functional currency by reviewing the currency of the primary economic environment in which the foreign subsidiaries operate, which is normally the currency of the environment in which the foreign subsidiaries generate and expend cash. The Company translates assets and liabilities of its non-U.S. dollar functional currency subsidiaries into U.S. dollars using the rate in effect at the balance sheet date and revenues and expenses are translated at the average rate of exchange throughout the period. Foreign currency translation gains and losses are recognized within “Accumulated other comprehensive loss” in the Consolidated Balance Sheets.
Transactions in foreign currencies are translated to the respective functional currencies of each operation using exchange rates at the dates of the transactions. Monetary assets and liabilities denominated in foreign currencies at the reporting date are translated to the functional currency using the exchange rate at that date. Non-monetary assets and liabilities denominated in foreign currencies are translated to the functional currency using historical exchange rates. Gains and losses resulting from foreign currency transactions related to operating activities are included in “Cost of sales, excluding depreciation and amortization” while those related to non-operating activities are included in “Other income” in the Consolidated Statements of Operations.
Where intercompany loans are of a long-term investment nature, exchange rate changes are included as a foreign currency translation adjustment within “Accumulated other comprehensive loss” in the Consolidated Balance Sheets.
Revenue Recognition
The Company recognizes revenue when obligations under the terms of a contract with its customer are satisfied; generally this occurs with the transfer of control of the products sold. Transfer of control to the customer is based on the standardized shipping terms in the contract as this determines when the Company has the right to payment, the customer has legal title to the asset and the customer has the risks of ownership. Payment is due, and revenue and a receivable is recognized after control has transferred to the customer. Payment terms are defined in the contract as typically due within three months after control has transferred to the customer, and as such, the contract does not have a significant financing component.
A contract liability is created when the customer prepays for goods prior to the Company transferring control over those goods to the customer. The contract liability is reduced and revenue is recognized once control of the goods is transferred to the customer.
The Company excludes value-added taxes, sales and other taxes it collects from the customer on behalf of third parties concurrent with revenue-producing activities from revenues.
The Company may arrange shipping and handling activities as part of the sale of its products. The Company has elected to account for shipping and handling activities that occur after the customer has obtained control of the product as a fulfillment cost rather than as an additional promised service.
MERCER INTERNATIONAL INC.
NOTES TO THE CONSOLIDATED FINANCIAL STATEMENTS
(In thousands of U.S. dollars, except share and per share data)
The following is a description of the principal activities from which the Company generates its revenues. For a breakdown of revenues by product and geographic location see the Segment Information Note.
Pulp and Lumber Revenues
For European sales sent by truck or train from the mills directly to the customer, the contracted sales terms are such that control transfers once the truck or train leaves the mill. For orders sent by ocean freighter, the contract terms state that control transfers at the time the product passes the ship’s rail. For North American sales shipped by truck or train, the contracts state that control transfers once the truck or train has arrived at the customer’s specified location.
The transaction price is included in the sales contract and is net of customer discounts, rebates and other selling concessions.
The Company’s pulp sales are to tissue and paper producers and the Company’s lumber sales are to manufacturers and retailers. The Company’s sales in Europe and North America are direct to the customer. The Company’s pulp sales to overseas customers are primarily through third-party sales agents and the Company’s lumber sales to overseas customers are either direct to the customer or through third-party sales agents. The Company is the principal in all of the arrangements with third-party sales agents.
Energy Revenues
Energy sales are to utility companies in Canada and Germany. Sales of energy are recognized as the electricity is consumed by the customer and is based on contractual usage rates and meter readings that measure electricity consumption.
Pallet, Chemical, Biofuel and Wood Residual Revenues
Pallet, chemical, biofuel and wood residual revenues sold from the German mills are sold primarily into the European market. Pallet and biofuel sales are sold to the customer or to a trader. Chemical and wood residual sales are sold direct to the customer. These sales typically have shipping terms where control transfers once the product is loaded onto the truck at the mill.
Mass Timber Revenues
Mass timber includes cross-laminated timber (“CLT”) and glue-laminated timber (“glulam”), manufactured at our mass timber production facilities. A mass timber sales contract will typically represent a single distinct performance obligation due to the highly interdependent and interrelated nature of the underlying goods and services provided.
Mass timber contract revenue is recognized over the contract term as the work progresses because of the continuous transfer of control to the customer. The customer typically controls the work in process as evidenced by the Company's right to payment of the transaction price associated with work performed to date on products or services that do not have an alternative use to the Company.
The accounting for the mass timber contracts involves a judgmental process of estimating total sales, costs and profit for the performance obligation. Cost of sales is recognized as incurred. The amount reported as revenues is determined by adding a proportionate amount of the estimated profit to the amount reported as cost of sales. Recognizing revenue as costs are incurred provides an objective measure of progress and thereby best depicts the extent of transfer of control to the customer. Changes in estimated revenues, cost of sales and the related effect on operating income (loss) are recognized using a cumulative catch-up adjustment which recognizes in the current period the cumulative effect of the changes on current and prior periods based on the contract’s percentage-of-completion.
The Company has elected to omit disclosure of information about the transaction price allocated to remaining performance obligations and when revenue will be recognized for its mass timber contracts as these contracts are expected to be completed within 12 months.
MERCER INTERNATIONAL INC.
NOTES TO THE CONSOLIDATED FINANCIAL STATEMENTS
(In thousands of U.S. dollars, except share and per share data)
Shipping and Handling Costs
Amounts charged to customers for shipping and handling costs are recognized in “Revenues” in the Consolidated Statements of Operations. Shipping and handling costs incurred by the Company are included in “Cost of sales, excluding depreciation and amortization” in the Consolidated Statements of Operations at the time the related revenue is recognized.
Insurance Claims
The Company records business interruption insurance proceeds once the insurance provider acknowledges that the claim is covered and agrees in writing to the amount to be paid for the claim. The Company reports business interruption insurance proceeds in “Cost of sales, excluding depreciation and amortization” in the Consolidated Statements of Operations.
The Company records property insurance proceeds up to the amount of the related impairment when it is probable the proceeds will be received. Proceeds in excess of the impairment are recorded once the insurance provider acknowledges that the claim is covered and agrees in writing to the amount to be paid for the claim. The Company reports property insurance proceeds in the same line item in which the related impairment was recognized in the Consolidated Statements of Operations.
Stock-Based Compensation
The Company's stock incentive plan consists of stock options, restricted stock units (“RSUs”), deferred stock units (“DSUs”), restricted shares, performance shares, performance share units (“PSUs”) and stock appreciation rights. The stock-based compensation expense is recognized over an award’s requisite service period based on the award’s fair value in “Selling, general, and administrative expenses” in the Consolidated Statements of Operations. The Company issues new shares upon the exercise of stock-based compensation awards.
PSUs provide the holder the right to receive upon vesting a common share of the Company, a cash payment or a combination of common shares or cash, as determined by the Company, if certain market and/or performance goals established by the Company are met. The performance objective period is generally three years. The fair value of PSUs granted with a performance condition is based upon the targeted number of shares to be awarded and the quoted market price of the Company’s shares at that date.
The fair value of PSUs granted with a market condition is estimated using a Monte Carlo simulation model using historical volatility and a risk-free interest rate.
The Company estimates forfeitures of PSUs based on management’s expectations and recognizes compensation cost only for those awards expected to vest. Estimated forfeitures are adjusted to actual experience at each balance sheet date.
The fair value of equity settled restricted shares, RSUs, and DSUs (“Equity DSUs”) is determined based upon the number of shares or units granted and the quoted price of the Company’s common shares on the date of grant. The vesting period is generally one year.
DSUs which are settled in cash (“Cash Only DSUs”), are settled at the quoted price of the Company's common shares on the redemption date. Cash Only DSUs are accounted for as a liability and measured based on the quoted price of the Company's common shares on the balance sheet date. The change in the fair value of the outstanding Cash Only DSUs is recorded as an expense in the Consolidated Statements of Operations. The vesting period is generally one year or less.
MERCER INTERNATIONAL INC.
NOTES TO THE CONSOLIDATED FINANCIAL STATEMENTS
(In thousands of U.S. dollars, except share and per share data)
Deferred Income Taxes
Deferred income taxes are recognized using the asset and liability method, whereby deferred tax assets and liabilities are recognized for the future tax consequences attributable to differences between the financial statement carrying amounts of existing assets and liabilities and their respective tax basis, and operating loss and tax credit carryforwards. Valuation allowances are provided if, after considering both positive and negative available evidence, it is more likely than not that some or all of the net deferred tax assets will not be realized.
Deferred income taxes are determined separately for each tax-paying component of the Company. For each tax-paying component, all deferred tax liabilities and assets are offset and presented as a single net amount.
Derivative Financial Instruments
The Company occasionally enters into derivative financial instruments to manage certain market risks. These derivative instruments are not designated as hedging instruments and accordingly, are recorded at fair value in the Consolidated Balance Sheets with the changes in fair value recognized in “Other income” in the Consolidated Statements of Operations. Periodically, the Company enters into derivative contracts to supply materials for its own use and as such are exempt from mark-to-market accounting.
Fair Value Measurements
The fair value methodologies and, as a result, the fair value of the Company’s assets and liabilities measured at fair value are determined based on the fair value hierarchy provided in the Fair Value Measurements and Disclosures topic of the Financial Accounting Standards Board (“FASB”) Accounting Standards Codification, and are as follows:
Level 1 – Valuations based on quoted prices in active markets for identical assets and liabilities.
Level 2 – Valuations based on observable inputs in active markets for similar assets and liabilities, other than Level 1 prices, such as quoted commodity prices or interest or currency exchange rates.
Level 3 – Valuations based on significant unobservable inputs that are supported by little or no market activity, such as discounted cash flow methodologies based on internal cash flow forecasts.
The financial instrument’s fair value measurement level within the fair value hierarchy is based on the lowest level of any input that is significant to the fair value measurement.
Net Income (Loss) Per Common Share
Basic net income (loss) per common share is computed by dividing net income (loss) by the weighted average number of common shares outstanding in the period. Diluted net income (loss) per common share is calculated to give effect to all potentially dilutive common shares outstanding by applying the “Treasury Stock” and “If-Converted” methods. Instruments that could have a potentially dilutive effect on the Company’s weighted average shares outstanding include all or a portion of outstanding stock options, RSUs, Equity DSUs, restricted shares, performance shares, PSUs and stock appreciation rights.
The Company uses the acquisition method in accounting for a business combination that meets the definition of a business. Under this approach, identifiable assets acquired and liabilities assumed are recorded at their respective fair market values at the date of acquisition. In developing estimates of fair market values for long-lived assets, including identifiable intangible assets, the Company utilizes a variety of inputs including forecasted cash flows, discount rates, estimated replacement costs and depreciation and obsolescence factors. Valuations are performed by management or independent valuation specialists under management’s supervision, where appropriate. Acquisition costs, as well as costs to integrate acquired companies, are expensed as incurred in the Consolidated Statements of Operations.
MERCER INTERNATIONAL INC.
NOTES TO THE CONSOLIDATED FINANCIAL STATEMENTS
(In thousands of U.S. dollars, except share and per share data)
Assets and Liabilities Classified as Held for Sale
Assets (and disposal groups) are classified as held for sale if their carrying amount will be recovered primarily through a sale as opposed to continued use by the Company. Assets (and disposal groups) to be disposed that meet the held for sale criteria are reported at the lower of their carrying amount and fair value less costs to sell and are no longer depreciated.
Operating segments
An operating segment is a component of the Company for which discrete financial information is available and whose operating results are regularly reviewed by the Company’s chief operating decision maker (the “CODM”) to make decisions about resources to be allocated to the segment and assess its performance, and that engages in business activities from which it may earn revenue and incur expenses, including revenue and expenses that relate to transactions with any of the Company’s other operations. The Company makes adjustments and eliminations in preparing the financial statements and allocates revenues, expenses, and gains and losses in determining the reported segment performance measures, only if they are included in the performance measures used by the CODM.
New Accounting Pronouncements Adopted
Reference Rate Reform
In March 2020, the FASB issued Accounting Standards Update (“ASU”) 2020-04, which provides optional guidance for a limited time to ease the potential burden associated with transitioning away from reference rates that are expected to be discontinued. These amendments were effective immediately and are applied prospectively to contract modifications made and hedging relationships entered into or evaluated on or before December 31, 2022. In March 2021, the FASB deferred the expiration date to December 31, 2024. The Company has applied this guidance to account for contract modifications that are related to replacement of eligible reference rates. The application of ASU 2020-04 did not have a material impact to the consolidated financial statements and related disclosures.
Improvements to Reportable Segment Disclosures
In November 2023, the FASB issued ASU 2023-07, which requires the disclosure of significant segment expenses that are part of an entity’s segment measure of profit or loss, and regularly provided to the CODM, and adds or makes clarifications to other segment-related disclosures. ASU 2023-07 is effective for fiscal years beginning after December 15, 2023 and interim periods thereafter with early adoption permitted. The Company has applied this guidance in the Segment Information Note.
Accounting Pronouncements to be Adopted
Improvements to Income Tax Disclosures
In December 2023, the FASB issued ASU 2023-09, which requires additional disaggregation of the reconciliation between the statutory and effective tax rate for an entity and of income taxes paid. The amendments improve the transparency of income tax disclosures by requiring consistent categories and greater disaggregation of information by jurisdiction. ASU 2023-09 is effective for annual periods beginning after December 15, 2024. The Company continues to assess the impact of ASU 2023-09 to the consolidated financial statements.
MERCER INTERNATIONAL INC.
NOTES TO THE CONSOLIDATED FINANCIAL STATEMENTS
(In thousands of U.S. dollars, except share and per share data)
Disaggregation of Income Statement Expenses
In November 2024, the FASB issued ASU 2024-03, which expands disclosures about specific expense categories presented on the face of the income statement and addresses requests from investors for more detailed information about the types of expenses (including purchases of inventory, employee compensation, depreciation and amortization) in commonly presented expense captions (such as cost of sales, selling, general and administrative expenses). ASU 2024-03 is effective for fiscal years beginning after December 15, 2026 and interim periods thereafter with early adoption permitted. The Company is currently assessing the impact of ASU 2024-03 to the consolidated financial statements.
Note 2. Acquisitions
2023 Structurlam
On June 15, 2023, the Company acquired substantially all the assets of Structurlam Mass Timber Corporation, including a mass timber production facility located in Conway, Arkansas (the “Mercer Conway facility”) and mass timber production facilities in British Columbia, Canada, for cash consideration of $82,100.
The transaction is accounted for as an acquisition of a group of assets as management determined it does not qualify as an acquisition of a business under GAAP. Substantially all of the fair value of the gross assets acquired was concentrated in a group of similar identifiable assets, being the land, building and production equipment at the Mercer Conway facility.
2022 Torgau
On September 30, 2022, the Company acquired all the issued and outstanding shares of Wood Holdco GmbH, which is the parent company of Holzindustrie Torgau KG (“Torgau”) for consideration of €270.0 million ($263,196) cash.
Torgau is a business under GAAP, accordingly the Company began consolidating its results of operations, financial position and cash flows in the consolidated financial statements as of the acquisition date. The amount of Torgau’s revenues and net loss included in the Consolidated Statements of Operations for the year ended December 31, 2022 was $64,364 and $13,450, respectively. In the year ended December 31, 2022, $1,945 of acquisition related costs were recognized in “Selling, general and administrative expenses” in the Consolidated Statements of Operations.
The following unaudited pro forma information represents the Company’s results of operations as if the acquisition of Torgau had occurred on January 1, 2022. This pro forma information does not purport to be indicative of the results that would have occurred or that may be expected in the future.
| | | | | | | | |
| | For the Year Ended December 31, | |
| | 2022 | | | 2021 | |
Revenues | | $ | 2,532,271 | | | $ | 2,071,896 | |
Net income | | $ | 295,066 | | | $ | 196,017 | |
The unaudited pro forma information had no material nonrecurring adjustments directly attributable to the acquisition.
MERCER INTERNATIONAL INC.
NOTES TO THE CONSOLIDATED FINANCIAL STATEMENTS
(In thousands of U.S. dollars, except share and per share data)
Note 3. Disposal of Investment in Joint Venture
In 2024, the Company entered into an agreement with West Fraser to dissolve the CPP joint venture and effectively relinquished its contractual sharing of control over the joint venture. A non-cash loss in the Consolidated Statements of Operations of $23,645 was recognized as the estimated proceeds, comprised of inventory, were less than the net carrying amount of the disposal group. The disposal group includes the equity investment and the actuarial gains related to a defined benefit pension plan recognized in accumulated other comprehensive loss. The estimated fair value of the proceeds was determined using Level 2 inputs based on the market value of inventory.
Note 4. Assets and Liabilities Classified as Held for Sale
In 2023, the Company committed to a plan to sell the sandalwood business and classified the assets and associated liabilities of the business, referred to as the “disposal group”, as held for sale. Concurrently with this classification, the Company determined the net book value of the disposal group exceeded its estimated fair value of $28,500 as of December 31, 2023 and recognized a non-cash impairment charge of $33,734 in the Consolidated Statements of Operations.
In 2024, certain parcels of land were sold from the disposal group at amounts in line with the initial estimated fair value and therefore no gain was recognized on disposition. As the fair value exceeded the carrying value of the land parcels sold, the impairment reserve was increased to reflect the sale. Due to unexpected circumstances beyond the Company's control, the sale of the remaining disposal group was not completed within a one-year period. The Company continues to actively market the sandalwood business and expects a sale to occur within the next 12 months. Accordingly, the disposal group continues to be classified as held for sale in the Consolidated Balance Sheets.
The disposal group’s estimated fair value was determined using Level 3 inputs based on preliminary indicative offers from third parties. The following summarizes the major classes of assets and liabilities classified as held for sale as of December 31, 2024.
| | | | |
| | December 31,
2024 | |
Cash and cash equivalents | | $ | 1,379 | |
Accounts receivable, net | | | 1,248 | |
Inventories | | | 21,427 | |
Property, plant and equipment, net | | | 3,288 | |
Operating lease right-of-use-assets | | | 4,894 | |
Sandalwood tree plantations | | | 23,408 | |
Impairment reserve | | | (40,215 | ) |
Impact of changes in foreign exchange rate | | | 3,022 | |
Assets classified as held for sale | | $ | 18,451 | |
| | | |
Accounts payable and other | | $ | 2,370 | |
Operating lease liabilities | | | 4,775 | |
Liabilities associated with assets held for sale | | $ | 7,145 | |
Note 5. Business Interruption Insurance
For the year ended December 31, 2024, the Company received business interruption insurance payments of C$2.3 million ($1,688) and property insurance payments of C$1.1 million ($773) as a result of damage to the Celgar mill's lime kiln equipment.
For the year ended December 31, 2023, the Company received business interruption insurance payments of €15.2 million ($16,553) as a result of damage to the Rosenthal mill's turbine in 2021. In 2023, the Company also received business interruption insurance payments of €16.3 million ($17,665) and property insurance payments of €11.2 million ($12,203) related to a fire which occurred in the woodyard of the Stendal mill in 2022.
MERCER INTERNATIONAL INC.
NOTES TO THE CONSOLIDATED FINANCIAL STATEMENTS
(In thousands of U.S. dollars, except share and per share data)
The business interruption and property insurance proceeds were recognized in “Cost of sales, excluding depreciation and amortization” in the Consolidated Statements of Operations.
Note 6. Other Income
Other income for the years ended December 31, 2024, 2023 and 2022 was comprised of the following:
| | | | | | | | | | | | |
| | For the Year Ended December 31, | |
| | 2024 | | | 2023 | | | 2022 | |
Foreign exchange gain (loss) | | $ | (4,532 | ) | | $ | (1,821 | ) | | $ | 17,975 | |
Interest income and other | | | 11,760 | | | | 9,018 | | | | 6,459 | |
| | $ | 7,228 | | | $ | 7,197 | | | $ | 24,434 | |
Note 7. Accounts Receivable, Net
Accounts receivable, net as of December 31, 2024 and December 31, 2023, was comprised of the following:
| | | | | | | | |
| | December 31, | |
| | 2024 | | | 2023 | |
Trade, net of allowance of $1,285 (2023 — $621) | | $ | 309,501 | | | $ | 281,248 | |
Sales and income taxes receivable | | | 8,643 | | | | 13,132 | |
Other | | | 9,201 | | | | 11,786 | |
| | $ | 327,345 | | | $ | 306,166 | |
Note 8. Inventories
Inventories as of December 31, 2024 and December 31, 2023, were comprised of the following:
| | | | | | | | |
| | December 31, | |
| | 2024 | | | 2023 | |
Raw materials | | $ | 131,396 | | | $ | 127,126 | |
Finished goods | | | 101,121 | | | | 144,407 | |
Spare parts and other | | | 129,165 | | | | 142,628 | |
| | $ | 361,682 | | | $ | 414,161 | |
For the year ended December 31, 2024, the Company recorded inventory impairment charges of $9,000 as a result of low hardwood pulp prices. As of December 31, 2024, $3,500 of the write-down was recorded against raw materials inventory and $1,500 was recorded against finished goods inventory.
For the year ended December 31, 2023, the Company recorded net inventory impairment charges of $58,600 as a result of low pulp prices and high per unit fiber costs for the Canadian mills. As of December 31, 2023, $5,400 of the write-down was recorded against raw materials inventory and $1,100 was recorded against finished goods inventory.
The inventory impairment charges are recorded in "Cost of sales, excluding depreciation and amortization" in the Consolidated Statements of Operations.
MERCER INTERNATIONAL INC.
NOTES TO THE CONSOLIDATED FINANCIAL STATEMENTS
(In thousands of U.S. dollars, except share and per share data)
Note 9. Property, Plant and Equipment, Net
Property, plant and equipment, net as of December 31, 2024 and December 31, 2023, was comprised of the following:
| | | | | | | | | | |
| | Estimated Useful Lives | | December 31, | |
| | (Years) | | 2024 | | | 2023 | |
Land | | | | $ | 82,015 | | | $ | 86,693 | |
Buildings | | 10 - 50 | | | 386,559 | | | | 402,271 | |
Production and other equipment | | 5 - 25 | | | 2,355,131 | | | | 2,447,228 | |
| | | | | 2,823,705 | | | | 2,936,192 | |
Less: accumulated depreciation | | | | | (1,568,990 | ) | | | (1,526,255 | ) |
| | | | $ | 1,254,715 | | | $ | 1,409,937 | |
As of December 31, 2024, property, plant and equipment was net of $107,196 of unamortized government grants (2023 – $132,708). Amortization expense related to government grants for the year ended December 31, 2024 was $18,233 (2023 – $18,720; 2022 – $18,103). In 2024, the Company received government grants of $787 (2023 – $5,569; 2022 – $1,067) primarily to partially finance innovation and greenhouse gas reduction projects at the Canadian mills. These grants were netted against “Property, plant and equipment, net” in the Consolidated Balance Sheets.
The Company maintains industrial landfills on its premises for the disposal of waste, primarily from the mills’ pulp processing activities. The mills have obligations under their landfill permits to decommission these disposal facilities pursuant to certain regulations. As of December 31, 2024, the Company had recorded $9,931 (2023 – $11,099) of asset retirement obligations in “Other long-term liabilities” in the Consolidated Balance Sheets.
Note 10. Amortizable Intangible Assets, Net
Amortizable intangible assets, net as of December 31, 2024 and December 31, 2023, were comprised of the following:
| | | | | | | | | | | | | | | | | | | | | | | | | | |
| | Estimated | | December 31, 2024 | | | December 31, 2023 | |
| | Useful Lives
(Years) | | Gross Carrying Amount | | | Accumulated Amortization | | | Net | | | Gross Carrying Amount | | | Accumulated Amortization | | | Net | |
Energy sales agreements | | 11-12 | | $ | 26,186 | | | $ | (12,978 | ) | | $ | 13,208 | | | $ | 27,852 | | | $ | (11,347 | ) | | $ | 16,505 | |
Timber cutting rights | | 30 | | | 34,992 | | | | (7,071 | ) | | | 27,921 | | | | 38,069 | | | | (6,423 | ) | | | 31,646 | |
Order backlog | | 0.5 | | | — | | | | — | | | | — | | | | 17,279 | | | | (17,279 | ) | | | — | |
Software and other intangible assets | | 5 | | | 34,177 | | | | (25,477 | ) | | | 8,700 | | | | 30,432 | | | | (25,942 | ) | | | 4,490 | |
| | | | $ | 95,355 | | | $ | (45,526 | ) | | $ | 49,829 | | | $ | 113,632 | | | $ | (60,991 | ) | | $ | 52,641 | |
Amortization expense related to intangible assets for the year ended December 31, 2024 was $5,953 (2023 – $13,645; 2022 – $11,882).
Amortization expense for the next five years related to intangible assets as of December 31, 2024 is expected to be as follows:
| | | | | | | | | | | | | | | | | | | | | | | | |
| | | | | | 2025 | | | 2026 | | | 2027 | | | 2028 | | | 2029 | |
Amortization expense | | | | | | $ | 5,615 | | | $ | 5,178 | | | $ | 4,891 | | | $ | 3,693 | | | $ | 2,558 | |
MERCER INTERNATIONAL INC.
NOTES TO THE CONSOLIDATED FINANCIAL STATEMENTS
(In thousands of U.S. dollars, except share and per share data)
Note 11. Goodwill
| | | | | | | | |
| | December 31, | |
| | 2024 | | | 2023 | |
Beginning of year balance | | $ | 35,381 | | | $ | 30,937 | |
Purchase price allocation adjustment | | | — | | | | 2,939 | |
Goodwill impairment | | | (34,277 | ) | | | — | |
Impact of changes in foreign exchange rate | | | (1,104 | ) | | | 1,505 | |
End of year balance | | $ | — | | | $ | 35,381 | |
In 2024, the Company performed an impairment test for goodwill assigned to the Torgau facility, the reporting unit, due to ongoing weakness in lumber, pallet and biofuels markets in Europe stemming from high interest rates and other economic conditions. The fair value measurement of the reporting unit is classified as Level 3 in the fair value hierarchy as it was determined based on a discounted cash flow model which uses significant unobservable inputs, including future estimated sales volumes, selling prices and costs, capital expenditures and the discount rate. As a result of the lower revised cash flow forecast, the impairment test showed the fair value of the reporting unit was less than its carrying value and this difference was greater than the carrying value of the goodwill. Accordingly, the Company recognized an impairment against all of the goodwill in 2024.
Concurrently with the goodwill impairment test, the Company performed an impairment test on the Torgau facility asset group. The carrying value of the asset group was less than the undiscounted cash flows and no impairment was recognized.
Note 12. Accounts Payable and Other
Accounts payable and other as of December 31, 2024 and December 31, 2023, was comprised of the following:
| | | | | | | | |
| | December 31, | |
| | 2024 | | | 2023 | |
Trade payables | | $ | 53,610 | | | $ | 61,099 | |
Accrued expenses | | | 73,755 | | | | 87,413 | |
Interest payable | | | 33,312 | | | | 34,542 | |
Income tax payable | | | 30,459 | | | | 21,807 | |
Payroll-related accruals | | | 24,100 | | | | 27,512 | |
Deposits for mass timber sales contracts (a) | | | 4,345 | | | | 15,262 | |
Wastewater fee (b) | | | 6,324 | | | | 6,721 | |
Finance lease liability | | | 9,415 | | | | 7,664 | |
Operating lease liability | | | 2,874 | | | | 4,043 | |
Other | | | 10,467 | | | | 12,923 | |
| | $ | 248,661 | | | $ | 278,986 | |
(a)Revenues recognized for the year ended December 31, 2024 and 2023 from amounts recorded as deposits, advances or progress billings within "Accounts payable and other" at the beginning of each year were $15,262 and $nil, respectively.
(b)The Company is required to pay certain fees based on wastewater emissions at its German mills. Accrued fees can be reduced upon the mills’ demonstration of reduced wastewater emissions. Reduction to the wastewater fee for the year ended December 31, 2024 was $2,189 (2023 – $4,348; 2022 – $12,847).
MERCER INTERNATIONAL INC.
NOTES TO THE CONSOLIDATED FINANCIAL STATEMENTS
(In thousands of U.S. dollars, except share and per share data)
Note 13. Debt
Debt as of December 31, 2024 and December 31, 2023, was comprised of the following:
| | | | | | | | | | |
| | | | December 31, | |
| | Maturity | | 2024 | | | 2023 | |
Senior notes (a) | | | | | | | | |
5.500% senior notes | | 2026 | | $ | — | | | $ | 300,000 | |
12.875% senior notes | | 2028 | | | 400,000 | | | | 200,000 | |
5.125% senior notes | | 2029 | | | 875,000 | | | | 875,000 | |
| | | | | | | | |
Credit arrangements | | | | | | | | |
€370.1 million German joint revolving credit facility (b) | | 2027 | | | 168,822 | | | | 161,330 | |
C$160.0 million Canadian joint revolving credit facility (c) | | 2027 | | | 347 | | | | 47,255 | |
€2.6 million demand loan (d) | | | | | — | | | | — | |
| | | | | | | | |
Finance lease liability | | | | | 48,214 | | | | 48,349 | |
| | | | | 1,492,383 | | | | 1,631,934 | |
Less: unamortized senior note issuance costs | | | | | (8,982 | ) | | | (14,845 | ) |
Less: finance lease liability due within one year | | | | | (9,415 | ) | | | (7,664 | ) |
| | | | $ | 1,473,986 | | | $ | 1,609,425 | |
The maturities of the principal portion of debt as of December 31, 2024 were as follows:
| | | | | | | | |
| | Senior Notes and Credit Arrangements | | | Finance Leases | |
2025 | | $ | — | | | $ | 10,747 | |
2026 | | | — | | | | 10,499 | |
2027 | | | 169,169 | | | | 9,401 | |
2028 | | | 400,000 | | | | 8,157 | |
2029 | | | 875,000 | | | | 4,889 | |
Thereafter | | | — | | | | 7,925 | |
| | | 1,444,169 | | | | 51,618 | |
Less imputed interest | | | — | | | | (3,404 | ) |
Total payments | | $ | 1,444,169 | | | $ | 48,214 | |
Certain of the Company’s debt instruments were issued under agreements which, among other things, may limit its ability and the ability of its subsidiaries to make certain payments, including dividends. These limitations are subject to specific exceptions. As of December 31, 2024, the Company was in compliance with the terms of its debt agreements.
(a)In October 2024, the Company completed a $200,000 add-on offering of the existing 12.875% senior notes which mature on October 1, 2028 (the “2028 Senior Notes”) at a 103.000% premium to their principal amount. The net proceeds of the offerings were $202,008 after deducting the underwriter's discount and offering expenses. The net proceeds and cash on hand were used to redeem $300,000 in principal amount of senior notes which were to mature in January 2026.
In September 2023, the Company issued $200,000 in aggregate principal amount of 2028 Senior Notes. The net proceeds from this issuance was $195,668 after deducting the underwriter’s discount and offering expenses.
MERCER INTERNATIONAL INC.
NOTES TO THE CONSOLIDATED FINANCIAL STATEMENTS
(In thousands of U.S. dollars, except share and per share data)
The senior notes which mature on February 1, 2029 (the “2029 Senior Notes” and collectively with the 2028 Senior Notes, the “Senior Notes”) and the 2028 Senior Notes are general unsecured senior obligations of the Company. The Company may redeem all or a part of the Senior Notes upon not less than 10 days’ or more than 60 days’ notice at the redemption price plus accrued and unpaid interest to (but not including) the applicable redemption date.
The following table presents the redemption prices (expressed as percentages of principal amount) and the redemption periods of the Senior Notes:
| | | | | | |
2028 Senior Notes | | 2029 Senior Notes |
12 Month Period Beginning | | Percentage | | 12 Month Period Beginning | | Percentage |
October 1, 2025 | | 106.438% | | February 1, 2025 | | 101.281% |
October 1, 2026 | | 103.219% | | February 1, 2026 and thereafter | | 100.000% |
October 1, 2027 and thereafter | | 100.000% | | | | |
(b)A €370.1 million joint revolving credit facility for the German mills that matures in September 2027. Borrowings under the facility are unsecured and bear interest at Euribor plus a variable margin ranging from 1.40% to 2.35% dependent on conditions including but not limited to a prescribed leverage ratio. The facility is sustainability linked whereby the interest rate margin is subject to upward or downward adjustments of up to 0.05% per annum if the Company achieves, or fails to achieve, certain specified sustainability targets. As of December 31, 2024, approximately €162.5 million ($168,822) of this facility was drawn and accruing interest at a rate of 4.470%, approximately €13.6 million ($14,104) was supporting bank guarantees and approximately €194.0 million ($201,596) was available.
(c)A C$160.0 million joint revolving credit facility for the Celgar mill, Peace River mill and certain other Canadian subsidiaries that matures in January 2027. The facility is available by way of: (i) Canadian dollar denominated advances, which bear interest at a designated prime rate per annum; (ii) Canadian dollar denominated advances, which bear interest at the applicable Adjusted Term Canadian Overnight Repo Rate Average (“CORRA”) plus 1.20% to 1.45% per annum; (iii) dollar denominated base rate advances at the greater of the federal funds rate plus 0.50%, an Adjusted Term Secured Overnight Financing Rate (“SOFR”) for a one month tenor plus 1.00% and the bank’s applicable reference rate for dollar denominated loans; and (iv) dollar denominated SOFR advances, which bear interest at Adjusted Term SOFR plus 1.20% to 1.45% per annum. As of December 31, 2024, approximately C$0.5 million ($347) of this facility was drawn and accruing interest at a rate of 5.450%, approximately C$0.6 million ($448) was supporting letters of credit and approximately C$146.9 million ($102,061) was available.
In June 2024, the Company amended the revolving credit facility agreement to transition from the Canadian Dollar Offered Rate (“CDOR”) benchmark to the CORRA benchmark for applicable Canadian dollar denominated advances under the credit facility as the CDOR benchmark was discontinued as of June 28, 2024. The discontinuation of CDOR did not have a material impact on the Company’s consolidated financial statements.
(d)A €2.6 million demand loan for Rosenthal that does not have a maturity date. Borrowings under this facility are unsecured and bear interest at the rate of the three-month Euribor plus 2.50%. As of December 31, 2024, approximately €2.6 million ($2,651) of this facility was supporting bank guarantees and approximately $nil was available.
MERCER INTERNATIONAL INC.
NOTES TO THE CONSOLIDATED FINANCIAL STATEMENTS
(In thousands of U.S. dollars, except share and per share data)
Note 14. Pension and Other Post-Retirement Benefit Obligations
Defined Benefit Plans
Pension benefits are based on employees’ earnings and years of service. The defined benefit plans are funded by contributions from the Company based on actuarial estimates and statutory requirements. Information about the Celgar and Peace River defined benefit plans, in aggregate for the year ended December 31, 2024 was as follows:
| | | | | | | | | | | | |
| | 2024 | |
| | Pension | | | Other Post-
Retirement
Benefits | | | Total | |
Change in benefit obligation | | | | | | | | | |
Benefit obligation, December 31, 2023 | | $ | 85,988 | | | $ | 10,516 | | | $ | 96,504 | |
Service cost | | | 2,745 | | | | 125 | | | | 2,870 | |
Interest cost | | | 3,861 | | | | 461 | | | | 4,322 | |
Benefit payments | | | (3,059 | ) | | | (550 | ) | | | (3,609 | ) |
Actuarial losses (gains) | | | 27 | | | | (469 | ) | | | (442 | ) |
Foreign currency exchange rate changes | | | (7,180 | ) | | | (829 | ) | | | (8,009 | ) |
Benefit obligation, December 31, 2024 | | | 82,382 | | | | 9,254 | | | | 91,636 | |
| | | | | | | | | |
Reconciliation of fair value of plan assets | | | | | | | | | |
Fair value of plan assets, December 31, 2023 | | | 88,783 | | | | — | | | | 88,783 | |
Actual returns | | | 10,242 | | | | — | | | | 10,242 | |
Contributions | | | 675 | | | | — | | | | 675 | |
Benefit payments | | | (2,996 | ) | | | — | | | | (2,996 | ) |
Foreign currency exchange rate changes | | | (7,556 | ) | | | — | | | | (7,556 | ) |
Fair value of plan assets, December 31, 2024 | | | 89,148 | | | | — | | | | 89,148 | |
Funded status, December 31, 2024 | | $ | 6,766 | | | $ | (9,254 | ) | | $ | (2,488 | ) |
| | | | | | | | | |
Components of the net benefit cost recognized | | | | | | | | | |
Service cost | | $ | 2,745 | | | $ | 125 | | | $ | 2,870 | |
Interest cost | | | 3,861 | | | | 461 | | | | 4,322 | |
Expected return on plan assets | | | (5,160 | ) | | | — | | | | (5,160 | ) |
Amortization of unrecognized items | | | 55 | | | | (815 | ) | | | (760 | ) |
Net benefit cost | | $ | 1,501 | | | $ | (229 | ) | | $ | 1,272 | |
MERCER INTERNATIONAL INC.
NOTES TO THE CONSOLIDATED FINANCIAL STATEMENTS
(In thousands of U.S. dollars, except share and per share data)
Information about the Celgar and Peace River defined benefit plans, in aggregate for the year ended December 31, 2023 was as follows:
| | | | | | | | | | | | |
| | 2023 | |
| | Pension | | | Other Post-
Retirement
Benefits | | | Total | |
Change in benefit obligation | | | | | | | | | |
Benefit obligation, December 31, 2022 | | $ | 94,130 | | | $ | 10,012 | | | $ | 104,142 | |
Service cost | | | 2,397 | | | | 117 | | | | 2,514 | |
Interest cost | | | 4,539 | | | | 495 | | | | 5,034 | |
Benefit payments | | | (4,019 | ) | | | (542 | ) | | | (4,561 | ) |
Actuarial losses | | | 3,603 | | | | 189 | | | | 3,792 | |
Settlements | | | (16,305 | ) | | | — | | | | (16,305 | ) |
Foreign currency exchange rate changes | | | 1,643 | | | | 245 | | | | 1,888 | |
Benefit obligation, December 31, 2023 | | | 85,988 | | | | 10,516 | | | | 96,504 | |
| | | | | | | | | |
Reconciliation of fair value of plan assets | | | | | | | | | |
Fair value of plan assets, December 31, 2022 | | | 95,606 | | | | — | | | | 95,606 | |
Actual returns | | | 10,692 | | | | — | | | | 10,692 | |
Contributions | | | 1,152 | | | | — | | | | 1,152 | |
Benefit payments | | | (4,025 | ) | | | — | | | | (4,025 | ) |
Settlements | | | (16,305 | ) | | | — | | | | (16,305 | ) |
Foreign currency exchange rate changes | | | 1,663 | | | | — | | | | 1,663 | |
Fair value of plan assets, December 31, 2023 | | | 88,783 | | | | — | | | | 88,783 | |
Funded status, December 31, 2023 | | $ | 2,795 | | | $ | (10,516 | ) | | $ | (7,721 | ) |
| | | | | | | | | |
Components of the net benefit cost recognized | | | | | | | | | |
Service cost | | $ | 2,397 | | | $ | 117 | | | $ | 2,514 | |
Interest cost | | | 4,539 | | | | 495 | | | | 5,034 | |
Expected return on plan assets | | | (5,389 | ) | | | — | | | | (5,389 | ) |
Settlement loss | | | 3,502 | | | | — | | | | 3,502 | |
Amortization of unrecognized items | | | 518 | | | | (965 | ) | | | (447 | ) |
Net benefit cost | | $ | 5,567 | | | $ | (353 | ) | | $ | 5,214 | |
The components of the net benefit cost other than service cost are recognized in “Other income” in the Consolidated Statements of Operations. The amortization of unrecognized items relates to net actuarial losses (gains) and prior service costs.
The Company anticipates that it will make contributions to the defined benefit plans of approximately $86 in 2025. Estimated future benefit payments under these plans as of December 31, 2024 were as follows:
| | | | | | | | |
| | Pension | | | Other Post-Retirement
Benefits | |
2025 | | $ | 3,642 | | | $ | 500 | |
2026 | | $ | 3,906 | | | $ | 517 | |
2027 | | $ | 4,118 | | | $ | 534 | |
2028 | | $ | 4,314 | | | $ | 551 | |
2029 | | $ | 4,502 | | | $ | 564 | |
2030-2034 | | $ | 25,214 | | | $ | 2,994 | |
MERCER INTERNATIONAL INC.
NOTES TO THE CONSOLIDATED FINANCIAL STATEMENTS
(In thousands of U.S. dollars, except share and per share data)
Weighted Average Assumptions
The weighted-average assumptions used to determine the benefit obligations at the measurement dates and the net benefit costs for the years ended December 31, 2024, 2023 and 2022 were as follows for Celgar’s defined benefit plan:
| | | | | | | | | | | | |
| | For the Year Ended December 31, | |
| | 2024 | | | 2023 | | | 2022 | |
Benefit obligations | | | | | | | | | |
Discount rate | | | 4.70 | % | | | 4.60 | % | | | 5.00 | % |
Rate of compensation increase | | | 2.50 | % | | | 2.50 | % | | | 2.50 | % |
Net benefit cost for year ended | | | | | | | | | |
Discount rate | | | 4.60 | % | | | 5.00 | % | | | 3.10 | % |
Rate of compensation increase | | | 2.50 | % | | | 2.50 | % | | | 2.50 | % |
Expected rate of return on plan assets | | | 5.45 | % | | | 5.45 | % | | | 3.60 | % |
The weighted-average assumptions used to determine the benefit obligations at the measurement dates and the net benefit costs for the years ended December 31, 2024, 2023 and 2022 were as follows for Peace River’s defined benefit plan:
| | | | | | | | | | | | |
| | For the Year Ended December 31, | |
| | 2024 | | | 2023 | | | 2022 | |
Benefit obligations | | | | | | | | | |
Discount rate | | | 4.70 | % | | | 4.60 | % | | | 5.00 | % |
Rate of compensation increase | | | 2.75 | % | | | 2.75 | % | | | 2.75 | % |
Net benefit cost for year ended | | | | | | | | | |
Discount rate | | | 4.60 | % | | | 5.00 | % | | | 3.10 | % |
Rate of compensation increase | | | 2.75 | % | | | 2.75 | % | | | 2.75 | % |
Expected rate of return on plan assets | | | 6.18 | % | | | 6.18 | % | | | 5.48 | % |
The discount rate assumption is adjusted annually to reflect the rates available on high-quality debt instruments, with a duration that is expected to match the timing and amount of expected pension and other post-retirement benefit payments. High-quality debt instruments are corporate bonds with a rating of “AA” or better.
The expected rate of return on plan assets is a management estimate based on, among other factors, historical long-term returns, expected asset mix and an active management premium.
The expected rate of compensation increase is a management estimate based on, among other factors, historical compensation increases and promotions, while considering current industry conditions, the terms of collective bargaining agreements with employees and the outlook for the industry.
The assumed health care cost trend rates used to determine the other post-retirement benefit obligations as of December 31, 2024 and December 31, 2023 were as follows:
| | | | |
| | December 31, |
| | 2024 | | 2023 |
Health care cost trend rate assumed for next year | | 4.50% | | 4.75% |
Rate to which the cost trend is assumed to decline (ultimate trend rate) | | 3.50% | | 3.50% |
Year that the rate reaches the ultimate trend rate | | 2029 | | 2029 |
The expected health care cost trend rates are based on historical trends for these costs, as well as recently enacted health care legislation. The Company also compares health care cost trend rates to those of the industry.
MERCER INTERNATIONAL INC.
NOTES TO THE CONSOLIDATED FINANCIAL STATEMENTS
(In thousands of U.S. dollars, except share and per share data)
Investment Objective and Asset Allocation
The investment objective for the defined benefit pension plans is to sufficiently diversify invested plan assets to maintain a reasonable level of risk without imprudently sacrificing the return on the invested funds, and ultimately to achieve a long-term total rate of return, net of fees and expenses, at least equal to the long-term interest rate assumptions used for funding actuarial valuations. To achieve this objective, the Company’s overall investment strategy is to maintain an investment allocation mix of long-term growth investments (equities) and fixed income investments (debt securities). Investment allocation targets have been established by asset class after considering the nature of the liabilities, long-term return expectations, the risks associated with key asset classes, funded position, inflation and interest rates and related management fees and expenses. In addition, the defined benefit pension plan’s investment strategy seeks to minimize risk beyond legislated requirements by constraining the investment managers’ investment options. There are a number of specific constraints based on investment type, but they all have the general purpose of ensuring that the investments are fully diversified and that risk is appropriately managed. For example, there are constraints on the book value of assets that can be invested in any one entity or group, and all equity holdings must be listed on a public exchange. Reviews of the investment objectives, key assumptions and the independent investment managers are performed periodically.
Pension De-Risking Actions
In 2023, as part of the Company's efforts to reduce pension plan obligations, the Company transferred $16,305 of pension assets and obligations under Celgar's defined benefit plan to a third-party insurance provider by converting the buy-in annuity to a buy-out annuity. In connection with this transaction, for the year-ended December 31, 2023, the Company recognized a non-cash settlement loss of $3,502 in “Other income” in the Consolidated Statements of Operations. The settlement accelerated the recognition of previously unrecognized losses in “Accumulated other comprehensive loss” in the Consolidated Balance Sheets that would have otherwise been recognized in subsequent periods.
Concentrations of Risk in the Defined Benefit Pension Plans’ Assets
The Company has reviewed the defined benefit pension plans’ equity investments and determined that they are allocated based on the specific investment managers’ stated investment strategies with only slight over- or under-weightings within any specific category, and that those investments are within the constraints that have been set by the Company. Those constraints include a limitation on the value that can be invested in any one entity or investment category. The Company has concluded that there are no significant concentrations of risk.
The following table presents the Celgar and Peace River defined benefit pension plans’ assets fair value measurements as of December 31, 2024 under the fair value hierarchy:
| | | | | | | | | | | | | | | | |
| | Fair value measurements as of December 31, 2024 using: | |
Asset Category | | Level 1 | | | Level 2 | | | Level 3 | | | Total | |
Equity securities | | $ | — | | | $ | 57,338 | | | $ | — | | | $ | 57,338 | |
Debt securities | | | — | | | | 29,621 | | | | — | | | | 29,621 | |
Other | | | — | | | | 2,189 | | | | — | | | | 2,189 | |
Total assets | | $ | — | | | $ | 89,148 | | | $ | — | | | $ | 89,148 | |
The following table presents the Celgar and Peace River defined benefit pension plans’ assets fair value measurements as of December 31, 2023 under the fair value hierarchy:
| | | | | | | | | | | | | | | | |
| | Fair value measurements as of December 31, 2023 using: | |
Asset Category | | Level 1 | | | Level 2 | | | Level 3 | | | Total | |
Equity securities | | $ | — | | | $ | 56,532 | | | $ | — | | | $ | 56,532 | |
Debt securities | | | — | | | | 30,863 | | | | — | | | | 30,863 | |
Other | | | — | | | | 1,388 | | | | — | | | | 1,388 | |
Total assets | | $ | — | | | $ | 88,783 | | | $ | — | | | $ | 88,783 | |
MERCER INTERNATIONAL INC.
NOTES TO THE CONSOLIDATED FINANCIAL STATEMENTS
(In thousands of U.S. dollars, except share and per share data)
Defined Contribution Plans
Effective December 31, 2008, the defined benefit plans at the Celgar mill were closed to new members. In addition, the related defined benefit service accrual ceased on December 31, 2008, and members began to receive pension benefits, at a fixed contractual rate, under a defined contribution plan effective January 1, 2009. The Company’s head office employees also participate in a defined contribution plan. During the year ended December 31, 2024, the Company made contributions of $2,634 to these plans (2023 – $2,477; 2022 – $1,982).
Multiemployer Plan
The Company participates in a multiemployer plan for the hourly-paid employees at the Celgar mill. The contributions to the plan are determined based on a percentage of pensionable earnings pursuant to a collective bargaining agreement. The Company has no current or future contribution obligations in excess of the contractual contributions. During the year ended December 31, 2024, the Company made contributions of $2,128 to this plan (2023 – $2,193; 2022 – $2,175).
Plan details for the years ended December 31, 2024, 2023 and 2022 were as follows:
| | | | | | | | | | |
| | Provincially Registered Plan | | Expiration Date of Collective Bargaining | | Are the Company's Contributions Greater Than 5% of Total Contributions |
Legal name | | Number | | Agreement | | 2024 | | 2023 | | 2022 |
The Pulp and Paper Industry Pension Plan | | P085324 | | April 30, 2025 | | Yes | | Yes | | Yes |
Note 15. Income Taxes
The components of income (loss) before income taxes for the years ended December 31, 2024, 2023 and 2022 were as follows:
| | | | | | | | | | | |
| For the Year Ended December 31, | |
| 2024 | | | 2023 | | | 2022 | |
U.S. | $ | (80,257 | ) | | $ | (69,116 | ) | | $ | (75,566 | ) |
Foreign | | (6,658 | ) | | | (200,707 | ) | | | 420,869 | |
| $ | (86,915 | ) | | $ | (269,823 | ) | | $ | 345,303 | |
Income tax recovery (provision) recognized in the Consolidated Statements of Operations for the years ended December 31, 2024, 2023 and 2022 was comprised of the following:
| | | | | | | | | | | |
| For the Year Ended December 31, | |
| 2024 | | | 2023 | | | 2022 | |
U.S. Federal and State current income tax provision (recovery) | $ | 640 | | | $ | (1,564 | ) | | $ | 297 | |
Foreign current income tax provision | | 33,307 | | | | 10,189 | | | | 90,964 | |
Total current income tax provision | | 33,947 | | | | 8,625 | | | | 91,261 | |
Foreign deferred income tax provision (recovery) | | (35,721 | ) | | | (36,392 | ) | | | 7,003 | |
Total income tax provision (recovery) | $ | (1,774 | ) | | $ | (27,767 | ) | | $ | 98,264 | |
For the years ended December 31, 2024, 2023 and 2022, the foreign current income tax provisions were primarily for German entities.
The Company’s effective income tax rate can be affected by many factors, including but not limited to, changes in the mix of earnings in tax jurisdictions with differing statutory rates, changes in corporate structure, changes in the valuation of deferred tax assets and liabilities, the result of audit examinations of previously filed tax returns and changes in tax laws and rates. The asset and liability approach is used to recognize deferred tax assets and liabilities for the expected future tax consequences of temporary differences between the carrying amounts and the tax bases of assets and liabilities.
MERCER INTERNATIONAL INC.
NOTES TO THE CONSOLIDATED FINANCIAL STATEMENTS
(In thousands of U.S. dollars, except share and per share data)
The Company and/or one or more of its subsidiaries file income tax returns in the U.S., Germany, Canada and Australia. Currently, the Company does not anticipate that the expiration of the statute of limitations or the completion of audits in the next fiscal year will result in liabilities for uncertain income tax positions that are materially different than the amounts accrued or disclosed as of December 31, 2024. However, this could change as tax years are examined by taxing authorities, the timing of which are uncertain at this time. The German tax authorities have completed examinations up to and including the 2017 tax year for all but one German entity which had its examination completed up to and including the 2013 tax year. The Company is generally not subject to U.S. or Canadian income tax examinations for tax years before 2021 and 2020, respectively. The Company believes that it has adequately provided for any reasonable foreseeable outcomes related to its tax audits and that any settlement will not have a material adverse effect on its consolidated results.
The liability in the Consolidated Balance Sheets related to unrecognized tax benefits was $nil as of December 31, 2024 (2023 – $nil). The Company recognizes interest and penalties related to unrecognized tax benefits in “Income tax recovery (provision)” in the Consolidated Statements of Operations. During the years ended December 31, 2024, 2023 and 2022 the Company did not record any interest and penalties related to unrecognized tax benefits.
Differences between the U.S. Federal statutory and the Company’s effective rates for the years ended December 31, 2024, 2023 and 2022 were as follows:
| | | | | | | | | | | |
| For the Year Ended December 31, | |
| 2024 | | | 2023 | | | 2022 | |
U.S. Federal statutory rate | 21% | | | 21% | | | 21% | |
| | | | | | | | |
Income tax recovery (provision) using U.S. Federal statutory rate on income (loss) before income taxes | $ | 18,252 | | | $ | 56,663 | | | $ | (72,570 | ) |
Tax differential on foreign income (loss) | | (1,243 | ) | | | 9,049 | | | | (30,054 | ) |
Effect of foreign earnings (a) | | (5,169 | ) | | | — | | | | (5,329 | ) |
Valuation allowance | | (2,392 | ) | | | (39,810 | ) | | | 4,311 | |
Tax benefit of partnership structure | | 1,479 | | | | 3,132 | | | | 3,132 | |
Non-taxable foreign subsidies | | 2,332 | | | | 3,297 | | | | 2,704 | |
Non-deductible goodwill impairment | | (10,039 | ) | | | — | | | | — | |
True-up of prior year taxes | | (363 | ) | | | (4,553 | ) | | | 199 | |
Other | | (1,083 | ) | | | (11 | ) | | | (657 | ) |
Income tax recovery (provision) | $ | 1,774 | | | $ | 27,767 | | | $ | (98,264 | ) |
(a)Primarily due to the impact of the global intangible low-taxed income provision in the Tax Cuts and Jobs Act of 2017.
MERCER INTERNATIONAL INC.
NOTES TO THE CONSOLIDATED FINANCIAL STATEMENTS
(In thousands of U.S. dollars, except share and per share data)
Deferred income tax assets and liabilities as of December 31, 2024 and December 31, 2023 were comprised of the following:
| | | | | | | |
| December 31, | |
| 2024 | | | 2023 | |
German tax loss carryforwards | $ | 18,843 | | | $ | 12,668 | |
U.S. tax loss carryforwards and credits | | 61,318 | | | | 47,808 | |
Canadian tax loss carryforwards | | 34,758 | | | | 42,274 | |
Australian tax loss carryforwards | | 5,544 | | | | 7,178 | |
Basis difference between income tax and financial reporting with respect to operating pulp mills | | (112,852 | ) | | | (147,822 | ) |
Amortizable intangible assets | | (6,973 | ) | | | (8,972 | ) |
Other long-term assets | | 2,550 | | | | 1,045 | |
Debt | | (4,545 | ) | | | (6,604 | ) |
Accounts payable and accrued expenses | | 3,100 | | | | 4,805 | |
Deferred pension liability | | 1,023 | | | | 2,693 | |
Finance leases | | 10,799 | | | | 13,482 | |
Scientific research and experimental development investment tax credit and expenditure pool | | 6,390 | | | | 5,818 | |
Other | | 4,849 | | | | 7,653 | |
| | 24,804 | | | | (17,974 | ) |
Valuation allowance | | (81,798 | ) | | | (78,689 | ) |
Net deferred income tax liability | $ | (56,994 | ) | | $ | (96,663 | ) |
|
| | | | |
Comprised of: | | | | | |
Deferred income tax asset | $ | 17,778 | | | $ | 661 | |
Deferred income tax liability | | (74,772 | ) | | | (97,324 | ) |
Net deferred income tax liability | $ | (56,994 | ) | | $ | (96,663 | ) |
The following table details the scheduled expiration dates of the Company’s net operating loss, interest, investment tax credit and other tax attributes carryforwards as of December 31, 2024:
| | | | | |
| Amount | | | Expiration |
U.S. | | | | |
Net operating loss | $ | 26,900 | | | Indefinite |
Interest | $ | 265,000 | | | Indefinite |
Germany | | | | |
Corporate and trade tax loss | $ | 95,400 | | | Indefinite |
Interest | $ | 21,900 | | | Indefinite |
Canada | | | | |
Net operating loss | $ | 96,500 | | | 2036 – 2043 |
Scientific research and experimental development investment tax credit | $ | 4,500 | | | 2030 – 2043 |
Australia | | | | |
Net operating loss | $ | 18,500 | | | Indefinite |
At each reporting period, the Company assesses whether it is more likely than not that the deferred tax assets will be realized, based on the review of all available positive and negative evidence, including future reversals of existing taxable temporary differences, estimates of future taxable income, past operating results and prudent and feasible tax planning strategies. The carrying value of the Company’s deferred tax assets reflects its expected ability to generate sufficient future taxable income in certain tax jurisdictions to utilize these deferred income tax benefits. Significant judgment is required when evaluating this positive and negative evidence.
MERCER INTERNATIONAL INC.
NOTES TO THE CONSOLIDATED FINANCIAL STATEMENTS
(In thousands of U.S. dollars, except share and per share data)
Changes in valuation allowances related to net deferred tax assets for the years ended December 31, 2024 and 2023 were as follows:
| | | | | | | |
| December 31, | |
| 2024 | | | 2023 | |
Beginning of year balance | $ | 78,689 | | | $ | 38,879 | |
Additions (reversals) | | | | | |
U.S. | | 8,727 | | | | 20,450 | |
Canada | | (7,815 | ) | | | 19,815 | |
Australia | | 610 | | | | — | |
The impact of changes in foreign exchange rates | | 1,587 | | | | (455 | ) |
End of year balance | $ | 81,798 | | | $ | 78,689 | |
As of December 31, 2024, the Company has recognized the deferred tax assets of its German entities and has a full valuation allowance against the net deferred tax assets of its U.S. and Canadian entities.
The Company has not recognized a tax liability on the undistributed earnings of its foreign subsidiaries as of December 31, 2024 because these earnings are expected to be permanently reinvested outside the U.S. or repatriated without incurring a tax liability. As of December 31, 2024, the cumulative amount of undistributed earnings upon which U.S. income taxes have not been provided was approximately $217,970.
Global Corporate Minimum Tax Rate
In 2021, the Organisation for Economic Co-operation and Development proposed a global corporate minimum tax rate of 15% (the “Pillar Two” rules). On February 1, 2023, the FASB staff announced that the global corporate minimum tax imposed under the Pillar Two rules is an alternative minimum tax and that deferred taxes would not be recognized or adjusted for the effect of global minimum taxes that conform to Pillar Two rules. Accordingly, the incremental effects of such taxes would be accounted for as a period cost in the period when the tax law is effective.
As of December 31, 2024, Germany, Canada and Australia have enacted laws to conform with the Pillar Two rules, but the U.S. has not. The enacted Pillar Two rules have not had a material impact to the Company's effective tax rates and tax liabilities as of December 31, 2024. The Company will continue to monitor the impact of proposed and enacted legislative changes in the geographic regions in which we operate.
Note 16. Shareholders’ Equity
Dividends
The Company’s board of directors declared quarterly dividends during the years ended December 31, 2024 and 2023 as follows:
| | | | | | | | |
Date Declared | | Dividend Per
Common Share | | | Amount | |
February 15, 2024 | | $ | 0.075 | | | $ | 5,014 | |
May 9, 2024 | | | 0.075 | | | | 5,015 | |
August 8, 2024 | | | 0.075 | | | | 5,015 | |
October 31, 2024 | | | 0.075 | | | | 5,016 | |
| | $ | 0.300 | | | $ | 20,060 | |
MERCER INTERNATIONAL INC.
NOTES TO THE CONSOLIDATED FINANCIAL STATEMENTS
(In thousands of U.S. dollars, except share and per share data)
| | | | | | | | |
Date Declared | | Dividend Per
Common Share | | | Amount | |
February 16, 2023 | | $ | 0.075 | | | $ | 4,982 | |
May 4, 2023 | | | 0.075 | | | | 4,989 | |
August 3, 2023 | | | 0.075 | | | | 4,989 | |
November 2, 2023 | | | 0.075 | | | | 4,990 | |
| | $ | 0.300 | | | $ | 19,950 | |
On February 20, 2025, the Company’s board of directors declared a quarterly dividend of $0.075 per common share. Payment of the dividend will be on April 2, 2025 to all shareholders of record on March 26, 2025. Future dividends are subject to approval by the board of directors and may be adjusted as business and industry conditions warrant.
Share Capital
Preferred shares
The Company has authorized 50,000,000 preferred shares (2023 – 50,000,000) with $1 par value issuable in series, of which 2,000,000 shares have been designated as Series A. The preferred shares may be issued in one or more series. Designations and preferences for each series shall be stated in the resolutions providing for the designation and issuance of each such series adopted by the Company’s board of directors. The board of directors is authorized by the Company’s articles of incorporation to determine the voting, dividend, redemption and liquidation preferences pertaining to each such series. As of December 31, 2024, no preferred shares had been issued by the Company.
Stock-Based Compensation
The Company has a stock incentive plan which provides for stock options, RSUs, DSUs, restricted shares, performance shares, PSUs, and stock appreciation rights to be awarded to employees, consultants and non-employee directors. During the year ended December 31, 2024, there were no issued and outstanding stock options, RSUs, performance shares or stock appreciation rights. As of December 31, 2024, after factoring in all allocated shares, there remain approximately 1.1 million common shares available for grant.
As of December 31, 2024, the total compensation cost related to unvested PSUs, restricted shares, RSUs and DSUs not recognized was approximately $5,226 which will be recognized over a weighted average period of approximately two years.
In May 2023, the board of directors adopted the 2023 Non-Employee Director Compensation Plan which allows non-employee directors to elect on an annual basis to receive, in lieu of annual cash retainers, either restricted stock or DSUs. In addition, the board of directors receive annual equity compensation of restricted stock unless they elect to receive DSUs. The election for DSUs may be in the form of Equity DSUs or Cash Only DSUs and are redeemable by the director at their option following their separation from the board of directors.
PSUs
PSU activity during the year ended December 31, 2024 was as follows:
| | | | | | | | | | |
| | | | Number of PSUs | | | Weighted Average
Grant Date Fair Value Per Unit | |
Outstanding as of January 1, 2024 | | | | | 3,672,227 | | | $ | 12.80 | |
Granted | | | | | 2,330,672 | | | | 7.71 | |
Vested and issued | | | | | (324,854 | ) | | | 13.72 | |
Forfeited | | | | | (1,298,584 | ) | | | 12.11 | |
Outstanding as of December 31, 2024 | | | | | 4,379,461 | | | $ | 10.22 | |
MERCER INTERNATIONAL INC.
NOTES TO THE CONSOLIDATED FINANCIAL STATEMENTS
(In thousands of U.S. dollars, except share and per share data)
The weighted-average grant date fair value per unit of all PSUs granted in 2023 and 2022 was $11.36 and $13.61, respectively. The total fair value of PSUs vested and issued in 2024, 2023 and 2022 was $2,609, $2,943 and $1,208, respectively.
Restricted Shares and DSUs
Restricted share and DSU activity during the year ended December 31, 2024 was as follows:
| | | | | | | | | | | | | | | | |
| | Equity Based Awards | | | Liability Based Awards | |
| | Number of Restricted Shares | | | Number of Equity DSUs | | | Weighted Average
Grant Date Fair Value Per Share | | | Number of Cash Only DSUs | |
Outstanding as of January 1, 2024 | | | 54,227 | | | | 27,591 | | | $ | 8.83 | | | | 59,677 | |
Granted | | | 21,054 | | | | 50,397 | | | | 9.43 | | | | 31,581 | |
Vested | | | (54,227 | ) | | | (27,591 | ) | | | 8.83 | | | | (59,677 | ) |
Outstanding as of December 31, 2024 | | | 21,054 | | | | 50,397 | | | $ | 9.43 | | | | 31,581 | |
The weighted-average grant date fair value per share of all restricted shares and Equity DSUs granted in 2023 and 2022 was $8.83 and $15.65, respectively. The total fair value of restricted shares and Equity DSUs vested and issued in 2024, 2023 and 2022 was $787, $920 and $793, respectively.
Note 17. Net Income (Loss) Per Common Share
The reconciliation of basic and diluted net income (loss) per common share for the years ended December 31, 2024, 2023 and 2022 was as follows:
| | | | | | | | | | | | |
| | For the Year Ended December 31, | |
| | 2024 | | | 2023 | | | 2022 | |
Net income (loss) | | | | | | | | | |
Basic and diluted | | $ | (85,141 | ) | | $ | (242,056 | ) | | $ | 247,039 | |
| | | | | | | | | |
Net income (loss) per common share | | | | | | | | | |
Basic | | $ | (1.27 | ) | | $ | (3.65 | ) | | $ | 3.74 | |
Diluted | | $ | (1.27 | ) | | $ | (3.65 | ) | | $ | 3.71 | |
| | | | | | | | | |
Weighted average number of common shares outstanding: | | | | | | | | | |
Basic (a) | | | 66,821,951 | | | | 66,407,248 | | | | 66,100,040 | |
Effect of dilutive instruments: | | | | | | | | | |
PSUs | | | — | | | | — | | | | 468,931 | |
Restricted shares | | | — | | | | — | | | | 17,842 | |
RSUs | | | — | | | | — | | | | 11,886 | |
Equity DSUs | | | — | | | | — | | | | 3,687 | |
Diluted | | | 66,821,951 | | | | 66,407,248 | | | | 66,602,386 | |
(a)For the year ended December 31, 2024, the basic weighted average number of common shares outstanding excludes 21,054 restricted shares which have been issued, but have not vested as of December 31, 2024 (2023 – 54,227 restricted shares; 2022 – 34,699 restricted shares).
MERCER INTERNATIONAL INC.
NOTES TO THE CONSOLIDATED FINANCIAL STATEMENTS
(In thousands of U.S. dollars, except share and per share data)
The calculation of diluted net income (loss) per common share does not assume the exercise of any instruments that would have an anti-dilutive effect on net income (loss) per common share. Instruments excluded from the calculation of net income (loss) per common share because they were anti-dilutive for the years ended December 31, 2024, 2023 and 2022 were as follows:
| | | | | | | | | | | | |
| | For the Year Ended December 31, | |
| | 2024 | | | 2023 | | | 2022 | |
PSUs | | | 4,379,461 | | | | 3,672,227 | | | | — | |
Restricted shares | | | 21,054 | | | | 54,227 | | | | — | |
Equity DSUs | | | 50,397 | | | | 44,914 | | | | — | |
Note 18. Accumulated Other Comprehensive Loss
The change in accumulated other comprehensive loss by component (net of tax) for the years ended December 31, 2024, 2023 and 2022 was as follows:
| | | | | | | | | | | | |
| | Foreign Currency Translation Adjustments | | | Defined Benefit Pension and Other Post-Retirement Benefit Items | | | Total | |
Balance as of December 31, 2021 | | $ | (97,517 | ) | | $ | 6,724 | | | $ | (90,793 | ) |
Other comprehensive income (loss) before reclassifications | | | (97,568 | ) | | | 8,801 | | | | (88,767 | ) |
Amounts reclassified | | | — | | | | (402 | ) | | | (402 | ) |
Other comprehensive income (loss) | | | (97,568 | ) | | | 8,399 | | | | (89,169 | ) |
Balance as of December 31, 2022 | | | (195,085 | ) | | | 15,123 | | | | (179,962 | ) |
Other comprehensive income before reclassifications | | | 49,480 | | | | 756 | | | | 50,236 | |
Amounts reclassified | | | — | | | | 3,055 | | | | 3,055 | |
Other comprehensive income | | | 49,480 | | | | 3,811 | | | | 53,291 | |
Balance as of December 31, 2023 | | | (145,605 | ) | | | 18,934 | | | | (126,671 | ) |
Other comprehensive income (loss) before reclassifications | | | (104,392 | ) | | | 5,235 | | | | (99,157 | ) |
Amounts reclassified | | | — | | | | (760 | ) | | | (760 | ) |
Other comprehensive income (loss) | | | (104,392 | ) | | | 4,475 | | | | (99,917 | ) |
Disposal of investment in joint venture | | | — | | | | (4,181 | ) | | | (4,181 | ) |
Balance as of December 31, 2024 | | $ | (249,997 | ) | | $ | 19,228 | | | $ | (230,769 | ) |
Foreign currency translation adjustments recognized in other comprehensive income (loss) include intra-entity foreign currency loans that are of a long-term investment nature. For the year ended December 31, 2024, the foreign currency translation loss from these transactions was $1,355 (2023 – gain of $2,190; 2022 – gain of $1,598).
Note 19. Related Party Transactions
The Company enters into related party transactions with its joint ventures. For the year ended December 31, 2024 and prior to the disposal of the investment in the CPP joint venture in 2024, pulp purchases from the CPP mill, which were transacted at the CPP mill’s cost, were $19,707 (2023 – $97,836; 2022 – $101,095).
For the year ended December 31, 2024, services from the Company’s 50% owned logging and chipping operation were $7,356 (2023 – $11,350; 2022 – $12,545) and as of December 31, 2024 the Company had a receivable balance from the operation of $348 (December 31, 2023 – receivable of $1,912).
For the year ended December 31, 2024, services from the Company's 26% owned wood purchasing operations were $5,044 (2023 – $2,274; 2022 – $1,938) and as of December 31, 2024, the Company had a receivable balance from the operation of $50 (December 31, 2023 – receivable of $563).
MERCER INTERNATIONAL INC.
NOTES TO THE CONSOLIDATED FINANCIAL STATEMENTS
(In thousands of U.S. dollars, except share and per share data)
Note 20. Segment Information
The Company is managed based on the primary products it manufactures: pulp and solid wood, whose operating results are regularly reviewed by the Company’s CODM to assess segment performance and to make decisions about resource allocation. The Company’s CODM is the Chief Executive Officer. Accordingly, the Company's four pulp mills are aggregated into the pulp segment. The Friesau sawmill, the Torgau facility and the mass timber facilities are aggregated into the solid wood segment. The Company's sandalwood business is included in corporate and other as it does not meet the criteria to be reported as a separate reportable segment.
Revenues between segments are accounted for at prices that approximate fair value. These include revenues from the sale of residual fiber from the solid wood segment to the pulp segment for use in the pulp production process and from the sale of residual fuel from the pulp segment to the solid wood segment for use in energy production.
Change in segment measure of profit or loss
In 2024, the Company changed its segment measure from operating income (loss) to net income (loss) before interest, tax, depreciation and amortization and impairments of long-lived assets (“Segment Operating EBITDA”). The CODM uses Segment Operating EBITDA as the primary measure in assessing the operating performance of each reportable segment through periodic reviews and comparison of segment operating trends and identifying strategies to improve the allocation of resources amongst the reportable segments. Segment Operating EBITDA is different from operating income (loss) as it excludes depreciation and amortization and impairment of long-lived assets, as those items are not considered indicative of ongoing core operations. Comparative periods have been recast to conform with the current period’s presentation.
Total assets and the income or loss items following Segment Operating EBITDA, other than depreciation, amortization and impairment of long-lived assets, are not allocated to the segments, as those items are reviewed separately by management.
MERCER INTERNATIONAL INC.
NOTES TO THE CONSOLIDATED FINANCIAL STATEMENTS
(In thousands of U.S. dollars, except share and per share data)
Information about certain segment data for the years ended December 31, 2024, 2023 and 2022, was as follows:
| | | | | | | | | | | | |
Year Ended December 31, 2024 | | Pulp | | | Solid Wood | | | Total of Segments (a) | |
Revenues from external customers | | $ | 1,548,556 | | | $ | 485,991 | | | $ | 2,034,547 | |
Intersegment revenues | | | 842 | | | | 34,482 | | | | 35,324 | |
| | | 1,549,398 | | | | 520,473 | | | | 2,069,871 | |
Less segment expenses: | | | | | | | | | |
Fiber | | | 555,832 | | | | 238,992 | | | | |
Maintenance (b) | | | 148,978 | | | | 45,080 | | | | |
Freight | | | 145,706 | | | | 52,890 | | | | |
Labor (c) | | | 88,460 | | | | 54,884 | | | | |
Chemicals | | | 121,053 | | | | — | | | | |
Energy | | | 58,835 | | | | 28,488 | | | | |
Purchase of pulp from CPP (d) | | | 19,707 | | | | — | | | | |
Other (e) | | | 149,913 | | | | 104,529 | | | | |
Segment Operating EBITDA | | $ | 260,914 | | | $ | (4,390 | ) | | $ | 256,524 | |
| | | | | | | | | |
Purchase of property, plant and equipment | | $ | 46,400 | | | $ | 37,732 | | | $ | 84,132 | |
(a)The total of segments’ revenues, Segment Operating EBITDA and purchases of property, plant and equipment are reconciled to the corresponding consolidated amounts as follows:
| | | | | | | | | | | | |
Year Ended December 31, 2024 | | Pulp | | | Solid Wood | | | Total | |
Reconciliation of revenues | | | | | | | | | |
Total of segments’ revenues | | | | | | | | $ | 2,069,871 | |
Santanol chemical revenues | | | | | | | | | 8,813 | |
Elimination of intersegment revenues | | | | | | | | | (35,324 | ) |
Consolidated revenues | | | | | | | | $ | 2,043,360 | |
| | | | | | | | | |
Reconciliation to loss before income taxes | | | | | | | | | |
Total of segments’ Segment Operating EBITDA | | | | | | | | $ | 256,524 | |
Segment depreciation and amortization | | | (119,501 | ) | | | (50,430 | ) | | | (169,931 | ) |
Loss on disposal of investment in joint venture | | | (23,645 | ) | | | — | | | | (23,645 | ) |
Goodwill impairment | | | — | | | | (34,277 | ) | | | (34,277 | ) |
Interest expense | | | | | | | | | (109,150 | ) |
Other income | | | | | | | | | 7,228 | |
Corporate expenses and eliminations | | | | | | | | | (13,664 | ) |
Consolidated loss before income taxes | | | | | | | | $ | (86,915 | ) |
| | | | | | | | | |
Reconciliation of purchases of property, plant and equipment | | | | | | | | | |
Total of segments’ purchase of property, plant and equipment | | | | | | | | $ | 84,132 | |
Corporate and other | | | | | | | | | 186 | |
Consolidated purchase of property, plant and equipment | | | | | | | | $ | 84,318 | |
(b)Maintenance expense for the pulp segment includes expenditures for planned annual maintenance downtime at our pulp mills.
(c)Labor expense excludes maintenance and indirect labor costs.
(d)Purchases of pulp inventory from the CPP mill prior to the disposition in 2024.
(e)Other expenses primarily includes selling, general and administrative expenses and the net change in finished goods inventories.
MERCER INTERNATIONAL INC.
NOTES TO THE CONSOLIDATED FINANCIAL STATEMENTS
(In thousands of U.S. dollars, except share and per share data)
| | | | | | | | | | | | | | | | |
Year Ended December 31, 2024 | | Pulp | | | Solid Wood | | | Corporate
and Other | | | Consolidated | |
Revenues from external customers by major products | | | | | | | | | | | | |
Pulp | | $ | 1,460,460 | | | $ | — | | | $ | — | | | $ | 1,460,460 | |
Lumber | | | — | | | | 217,471 | | | | — | | | | 217,471 | |
Energy and chemicals | | | 88,096 | | | | 16,512 | | | | 8,813 | | | | 113,421 | |
Manufactured products (a) | | | — | | | | 100,565 | | | | — | | | | 100,565 | |
Pallets | | | — | | | | 104,386 | | | | — | | | | 104,386 | |
Biofuels (b) | | | — | | | | 40,082 | | | | — | | | | 40,082 | |
Wood residuals | | | — | | | | 6,975 | | | | — | | | | 6,975 | |
Total revenues from external customers | | $ | 1,548,556 | | | $ | 485,991 | | | $ | 8,813 | | | $ | 2,043,360 | |
| | | | | | | | | | | | |
Revenues from external customers by geography (c) | | | | | | | | | | | | |
U.S. | | $ | 151,053 | | | $ | 194,880 | | | $ | 2,497 | | | $ | 348,430 | |
Foreign countries | | | | | | | | | | | | |
Germany | | | 334,361 | | | | 195,867 | | | | 721 | | | | 530,949 | |
China | | | 574,264 | | | | 2,488 | | | | — | | | | 576,752 | |
Other countries | | | 488,878 | | | | 92,756 | | | | 5,595 | | | | 587,229 | |
| | | 1,397,503 | | | | 291,111 | | | | 6,316 | | | | 1,694,930 | |
Total revenues from external customers | | $ | 1,548,556 | | | $ | 485,991 | | | $ | 8,813 | | | $ | 2,043,360 | |
(a)Manufactured products primarily includes CLT and glulam.
(b)Biofuels includes pellets and briquettes.
(c)Sales are attributed to countries based on the ship-to location provided by the customer.
MERCER INTERNATIONAL INC.
NOTES TO THE CONSOLIDATED FINANCIAL STATEMENTS
(In thousands of U.S. dollars, except share and per share data)
| | | | | | | | | | | | |
Year Ended December 31, 2023 | | Pulp | | | Solid Wood | | | Total of Segments (a) | |
Revenues from external customers | | $ | 1,516,130 | | | $ | 472,054 | | | $ | 1,988,184 | |
Intersegment revenues | | | 1,037 | | | | 41,351 | | | | 42,388 | |
| | | 1,517,167 | | | | 513,405 | | | | 2,030,572 | |
Less segment expenses: | | | | | | | | | |
Fiber | | | 633,141 | | | | 243,369 | | | | |
Maintenance (b) | | | 128,511 | | | | 45,526 | | | | |
Freight | | | 154,918 | | | | 60,459 | | | | |
Labor (c) | | | 85,092 | | | | 48,499 | | | | |
Chemicals | | | 152,120 | | | | — | | | | |
Energy | | | 97,649 | | | | 39,358 | | | | |
Purchase of pulp from CPP | | | 97,836 | | | | — | | | | |
Other (d) | | | 102,011 | | | | 106,537 | | | | |
Segment Operating EBITDA | | $ | 65,889 | | | $ | (30,343 | ) | | $ | 35,546 | |
| | | | | | | | | |
Purchase of property, plant and equipment | | $ | 90,126 | | | $ | 45,707 | | | $ | 135,833 | |
(a)The total of segments’ revenues, Segment Operating EBITDA and purchases of property, plant and equipment are reconciled to the corresponding consolidated amounts as follows:
| | | | | | | | | | | | |
Year Ended December 31, 2023 | | Pulp | | | Solid Wood | | | Total | |
Reconciliation of revenues | | | | | | | | | |
Total of segments’ revenues | | | | | | | | $ | 2,030,572 | |
Santanol chemical revenues | | | | | | | | | 5,660 | |
Elimination of intersegment revenues | | | | | | | | | (42,388 | ) |
Consolidated revenues | | | | | | | | $ | 1,993,844 | |
| | | | | | | | | |
Reconciliation to loss before income taxes | | | | | | | | | |
Total of segments’ Segment Operating EBITDA | | | | | | | | $ | 35,546 | |
Segment depreciation and amortization | | | (114,151 | ) | | | (57,320 | ) | | | (171,471 | ) |
Impairment of sandalwood business held for sale | | | | | | | | | (33,734 | ) |
Interest expense | | | | | | | | | (88,246 | ) |
Other income | | | | | | | | | 7,197 | |
Corporate expenses and eliminations | | | | | | | | | (19,115 | ) |
Consolidated loss before income taxes | | | | | | | | $ | (269,823 | ) |
| | | | | | | | | |
Reconciliation of purchases of property, plant and equipment | | | | | | | | | |
Total of segments’ purchase of property, plant and equipment | | | | | | | | $ | 135,833 | |
Corporate and other | | | | | | | | | 491 | |
Consolidated purchase of property, plant and equipment | | | | | | | | $ | 136,324 | |
(b)Maintenance expense for the pulp segment includes expenditures for planned annual maintenance downtime at our pulp mills.
(c)Labor expense excludes maintenance and indirect labor costs.
(d)Other expenses primarily includes selling, general and administrative expenses and the net change in finished goods inventories.
MERCER INTERNATIONAL INC.
NOTES TO THE CONSOLIDATED FINANCIAL STATEMENTS
(In thousands of U.S. dollars, except share and per share data)
| | | | | | | | | | | | | | | | |
Year Ended December 31, 2023 | | Pulp | | | Solid Wood | | | Corporate
and Other | | | Consolidated | |
Revenues from external customers by major products | | | | | | | | | | | | |
Pulp | | $ | 1,402,620 | | | $ | — | | | $ | — | | | $ | 1,402,620 | |
Lumber | | | — | | | | 217,939 | | | | — | | | | 217,939 | |
Energy and chemicals | | | 113,510 | | | | 21,451 | | | | 5,660 | | | | 140,621 | |
Manufactured products (a) | | | — | | | | 58,895 | | | | — | | | | 58,895 | |
Pallets | | | — | | | | 121,424 | | | | — | | | | 121,424 | |
Biofuels (b) | | | — | | | | 40,680 | | | | — | | | | 40,680 | |
Wood residuals | | | — | | | | 11,665 | | | | — | | | | 11,665 | |
Total revenues from external customers | | $ | 1,516,130 | | | $ | 472,054 | | | $ | 5,660 | | | $ | 1,993,844 | |
| | | | | | | | | | | | |
Revenues from external customers by geography (c) | | | | | | | | | | |
U.S. | | $ | 123,818 | | | $ | 169,883 | | | $ | 1,227 | | | $ | 294,928 | |
Foreign countries | | | | | | | | | | | | |
Germany | | | 349,685 | | | | 224,741 | | | | 472 | | | | 574,898 | |
China | | | 551,945 | | | | 2,981 | | | | — | | | | 554,926 | |
Other countries | | | 490,682 | | | | 74,449 | | | | 3,961 | | | | 569,092 | |
| | | 1,392,312 | | | | 302,171 | | | | 4,433 | | | | 1,698,916 | |
Total revenues from external customers | | $ | 1,516,130 | | | $ | 472,054 | | | $ | 5,660 | | | $ | 1,993,844 | |
(a)Manufactured products primarily includes CLT and glulam.
(b)Biofuels includes pellets and briquettes.
(c)Sales are attributed to countries based on the ship-to location provided by the customer.
MERCER INTERNATIONAL INC.
NOTES TO THE CONSOLIDATED FINANCIAL STATEMENTS
(In thousands of U.S. dollars, except share and per share data)
| | | | | | | | | | | | |
Year Ended December 31, 2022 | | Pulp | | | Solid Wood | | | Total of Segments (a) | |
Revenues from external customers | | $ | 1,866,117 | | | $ | 408,458 | | | $ | 2,274,575 | |
Intersegment revenues | | | — | | | | 34,236 | | | | 34,236 | |
| | | 1,866,117 | | | | 442,694 | | | | 2,308,811 | |
Less segment expenses: | | | | | | | | | |
Fiber | | | 522,957 | | | | 184,768 | | | | |
Maintenance (b) | | | 152,499 | | | | 23,712 | | | | |
Freight | | | 176,207 | | | | 45,570 | | | | |
Labor (c) | | | 87,966 | | | | 22,378 | | | | |
Chemicals | | | 140,351 | | | | — | | | | |
Energy | | | 120,693 | | | | 17,859 | | | | |
Purchase of pulp from CPP | | | 101,095 | | | | — | | | | |
Other (d) | | | 111,627 | | | | 46,595 | | | | |
Segment Operating EBITDA | | $ | 452,722 | | | $ | 101,812 | | | $ | 554,534 | |
| | | | | | | | | |
Purchase of property, plant and equipment | | $ | 146,635 | | | $ | 31,190 | | | $ | 177,825 | |
(a)The total of segments’ revenues, Segment Operating EBITDA and purchases of property, plant and equipment are reconciled to the corresponding consolidated amounts as follows:
| | | | | | | | | | | | |
Year Ended December 31, 2022 | | Pulp | | | Solid Wood | | | Total | |
Reconciliation of revenues | | | | | | | | | |
Total of segments’ revenues | | | | | | | | $ | 2,308,811 | |
Santanol chemical revenues | | | | | | | | | 6,362 | |
Elimination of intersegment revenues | | | | | | | | | (34,236 | ) |
Consolidated revenues | | | | | | | | $ | 2,280,937 | |
| | | | | | | | | |
Reconciliation to income before income taxes | | | | | | | | | |
Total of segments’ Segment Operating EBITDA | | | | | | | | $ | 554,534 | |
Segment depreciation and amortization | | | (112,058 | ) | | | (31,170 | ) | | | (143,228 | ) |
Interest expense | | | | | | | | | (71,499 | ) |
Other income | | | | | | | | | 24,434 | |
Corporate expenses and eliminations | | | | | | | | | (18,938 | ) |
Consolidated income before income taxes | | | | | | | | $ | 345,303 | |
| | | | | | | | | |
Reconciliation of purchases of property, plant and equipment | | | | | | | | | |
Total of segments’ purchase of property, plant and equipment | | | | | | | | $ | 177,825 | |
Corporate and other | | | | | | | | | 917 | |
Consolidated purchase of property, plant and equipment | | | | | | | | $ | 178,742 | |
(b)Maintenance expense for the pulp segment includes expenditures for planned annual maintenance downtime at our pulp mills.
(c)Labor expense excludes maintenance and indirect labor costs.
(d)Other expenses primarily includes selling, general and administrative expenses and the net change in finished goods inventories.
MERCER INTERNATIONAL INC.
NOTES TO THE CONSOLIDATED FINANCIAL STATEMENTS
(In thousands of U.S. dollars, except share and per share data)
| | | | | | | | | | | | | | | | |
Year Ended December 31, 2022 | | Pulp | | | Solid Wood | | | Corporate
and Other | | | Consolidated | |
Revenues from external customers by major products | | | | | | | | | | | | |
Pulp | | $ | 1,686,370 | | | $ | — | | | $ | — | | | $ | 1,686,370 | |
Lumber | | | — | | | | 288,002 | | | | — | | | | 288,002 | |
Energy and chemicals | | | 179,747 | | | | 25,653 | | | | 6,362 | | | | 211,762 | |
Manufactured products (a) | | | — | | | | 22,759 | | | | — | | | | 22,759 | |
Pallets | | | — | | | | 36,063 | | | | — | | | | 36,063 | |
Biofuels (b) | | | — | | | | 17,691 | | | | — | | | | 17,691 | |
Wood residuals | | | — | | | | 18,290 | | | | — | | | | 18,290 | |
Total revenues from external customers | | $ | 1,866,117 | | | $ | 408,458 | | | $ | 6,362 | | | $ | 2,280,937 | |
| | | | | | | | | | | | |
Revenues from external customers by geography (c) | | | | | | | | | | |
U.S. | | $ | 236,862 | | | $ | 177,917 | | | $ | 1,329 | | | $ | 416,108 | |
Foreign countries | | | | | | | | | | | | |
Germany | | | 553,935 | | | | 142,846 | | | | 392 | | | | 697,173 | |
China | | | 495,668 | | | | 1,774 | | | | — | | | | 497,442 | |
Other countries | | | 579,652 | | | | 85,921 | | | | 4,641 | | | | 670,214 | |
| | | 1,629,255 | | | | 230,541 | | | | 5,033 | | | | 1,864,829 | |
Total revenues from external customers | | $ | 1,866,117 | | | $ | 408,458 | | | $ | 6,362 | | | $ | 2,280,937 | |
(a)Manufactured products primarily includes finger joint lumber.
(b)Biofuels includes pellets and briquettes.
(c)Sales are attributed to countries based on the ship-to location provided by the customer.
The Company’s long-lived assets by geographic area based on the location of the assets as of December 31, 2024 and December 31, 2023 were as follows:
| | | | | | | | |
| | December 31, | |
| | 2024 | | | 2023 | |
U.S. | | $ | 140,627 | | | $ | 136,790 | |
Foreign countries | | | | | | |
Germany | | | 725,229 | | | | 830,469 | |
Canada | | | 388,859 | | | | 442,678 | |
| | | 1,114,088 | | | | 1,273,147 | |
| | $ | 1,254,715 | | | $ | 1,409,937 | |
In 2024, no single customer accounted for greater than 10% of the Company’s total revenues (2023 – no customer; 2022 – no customer).
Note 21. Financial Instruments and Fair Value Measurement
Due to their short-term maturity, the carrying amounts of cash and cash equivalents, accounts receivable and accounts payable and other, approximates their fair value.
The estimated fair values of the Company’s outstanding debt under the fair value hierarchy as of December 31, 2024 and December 31, 2023 were as follows:
| | | | | | | | | | | | | | | | |
| | Fair value measurements as of | |
| | | | December 31, 2024 using: | | |
Description | | Level 1 | | | Level 2 | | | Level 3 | | | Total | |
Revolving credit facilities | | $ | — | | | $ | 169,169 | | | $ | — | | | $ | 169,169 | |
Senior notes | | | — | | | | 1,186,921 | | | | — | | | | 1,186,921 | |
| | $ | — | | | $ | 1,356,090 | | | $ | — | | | $ | 1,356,090 | |
MERCER INTERNATIONAL INC.
NOTES TO THE CONSOLIDATED FINANCIAL STATEMENTS
(In thousands of U.S. dollars, except share and per share data)
| | | | | | | | | | | | | | | | |
| | Fair value measurements as of | |
| | | | December 31, 2023 using: | | |
Description | | Level 1 | | | Level 2 | | | Level 3 | | | Total | |
Revolving credit facilities | | $ | — | | | $ | 208,585 | | | $ | — | | | $ | 208,585 | |
Senior notes | | | — | | | | 1,257,426 | | | | — | | | | 1,257,426 | |
| | $ | — | | | $ | 1,466,011 | | | $ | — | | | $ | 1,466,011 | |
The carrying value of the revolving credit facilities classified as Level 2 approximates the fair value as the variable interest rates reflect current interest rates for financial instruments with similar characteristics and maturities.
The fair value of the senior notes classified as Level 2 was determined using quoted prices in a dealer market, or using recent market transactions. The Company’s senior notes are not carried at fair value on the Consolidated Balance Sheets as of December 31, 2024 and December 31, 2023. However, fair value disclosure is required. The carrying value of the Company’s senior notes, net of note issuance costs is $1,266,018 as of December 31, 2024 (December 31, 2023 – $1,360,155).
Credit Risk
The Company’s credit risk is primarily attributable to cash held in bank accounts and accounts receivable. The Company maintains cash balances in foreign financial institutions in excess of insured limits.
The Company limits its credit exposure on cash held in bank accounts by periodically investing cash in excess of short-term operating requirements and debt obligations in low risk government bonds, or similar debt instruments. The Company’s credit risk associated with its sales is managed through setting credit limits, the purchase of credit insurance and for certain customers a letter of credit is received prior to shipping the product. The Company reviews new customers’ credit history before granting credit and conducts regular reviews of existing customers’ credit. Concentrations of credit risk on its sales are with customers and agents based primarily in Germany, China and the U.S.
The Company’s exposure to credit losses may increase if its customers’ production and other costs are adversely affected by inflation and interest rates. Although the Company has historically not experienced significant credit losses, it is possible that there could be a material adverse impact from potential adjustments of the carrying amount of trade receivables if the cash flows of the Company’s customers are adversely impacted by inflation and interest rates. As of December 31, 2024, the Company has not had significant credit losses.
As of December 31, 2024, the carrying amount of cash and cash equivalents of $184,925 and accounts receivable of $327,345 recorded in the Consolidated Balance Sheet, net of any allowances for losses, represents the Company’s maximum exposure to credit risk.
Note 22. Lease Commitments
The Company has finance leases primarily for railcars and production equipment. The railcars primarily have a remaining lease term of four to eight years with annual renewal options thereafter. The production equipment has a weighted average remaining lease term of five years. The Company has operating leases primarily for land to support the sandalwood tree plantations and for offices. The land leases have remaining terms of one to seven years with options to renew for up to 17 years. The office leases have remaining terms of three to five years with options to renew up to five years. A majority of the operating leases are subject to annual changes to the Consumer Price Index (“CPI”). Changes to the CPI are treated as variable lease payments and recognized in the period in which the obligation for those payments is incurred. A 100-basis-point increase in CPI would not have a material impact on lease costs.
MERCER INTERNATIONAL INC.
NOTES TO THE CONSOLIDATED FINANCIAL STATEMENTS
(In thousands of U.S. dollars, except share and per share data)
The components of lease expense for the years ended December 31, 2024, 2023 and 2022 was as follows:
| | | | | | | | | | | | |
| | Year Ended December 31, | |
| | 2024 | | | 2023 | | | 2022 | |
Lease cost: | | | | | | | | | |
Operating lease cost | | $ | 5,993 | | | $ | 7,439 | | | $ | 6,130 | |
Finance lease cost: | | | | | | | | | |
Amortization of right-of-use assets | | | 8,808 | | | | 7,296 | | | | 6,869 | |
Interest on lease liabilities | | | 1,560 | | | | 1,365 | | | | 1,429 | |
Total lease cost | | $ | 16,361 | | | $ | 16,100 | | | $ | 14,428 | |
Supplemental cash flow information related to leases for the years ended December 31, 2024, 2023 and 2022 was as follows:
| | | | | | | | | | | | |
| | Year Ended December 31, | |
| | 2024 | | | 2023 | | | 2022 | |
Cash paid for amounts included in the measurement of lease liabilities: | | | | | | | | | |
Operating cash flow payments for operating leases | | $ | 5,993 | | | $ | 7,439 | | | $ | 6,130 | |
Operating cash flow payments for finance leases | | $ | 1,560 | | | $ | 1,365 | | | $ | 1,429 | |
Financing cash flow payments for finance leases | | $ | 8,918 | | | $ | 7,785 | | | $ | 10,003 | |
Other information related to leases for the years ended December 31, 2024, 2023 and 2022 was as follows:
| | | | | | | | | | | | |
| | Year Ended December 31, | |
| | 2024 | | | 2023 | | | 2022 | |
Weighted average remaining lease term: | | | | | | | | | |
Operating leases | | 3 years | | | 4 years | | | 5 years | |
Finance leases | | 6 years | | | 7 years | | | 9 years | |
Weighted average discount rate: | | | | | | | | | |
Operating leases | | | 6 | % | | | 5 | % | | | 5 | % |
Finance leases | | | 3 | % | | | 3 | % | | | 3 | % |
The discount rate used to calculate the present value of the minimum lease payments is the incremental borrowing rate that the subsidiary entering into the lease would have to pay to borrow on a collateralized basis over a similar term an amount equal to the lease payments in a similar economic environment.
MERCER INTERNATIONAL INC.
NOTES TO THE CONSOLIDATED FINANCIAL STATEMENTS
(In thousands of U.S. dollars, except share and per share data)
Supplemental balance sheet information related to leases as of December 31, 2024 and December 31, 2023 was as follows:
| | | | | | | | |
| | December 31, | |
| | 2024 | | | 2023 | |
Operating Leases | | | | | | |
Operating lease right-of-use assets | | $ | 7,598 | | | $ | 11,725 | |
| | | | | | |
Operating lease right-of-use assets held for sale | | $ | 4,894 | | | $ | 4,388 | |
| | | | | | |
Other current liabilities | | $ | 2,874 | | | $ | 4,043 | |
Operating lease liabilities | | | 4,793 | | | | 7,755 | |
Total operating lease liabilities | | $ | 7,667 | | | $ | 11,798 | |
| | | | | | |
Operating lease liabilities associated with assets held for sale | | $ | 4,775 | | | $ | 4,046 | |
| | | | | | |
Finance Leases | | | | | | |
Property and equipment, gross | | $ | 88,557 | | | $ | 82,500 | |
Accumulated depreciation | | | (41,219 | ) | | | (35,046 | ) |
Property and equipment, net | | $ | 47,338 | | | $ | 47,454 | |
| | | | | | |
Other current liabilities | | $ | 9,415 | | | $ | 7,664 | |
Long-term debt | | | 38,799 | | | | 40,685 | |
Total finance lease liabilities | | $ | 48,214 | | | $ | 48,349 | |
Maturities of operating lease liabilities as of December 31, 2024 were as follows:
| | | | |
| | Operating
Leases | |
2025 | | $ | 3,712 | |
2026 | | | 2,175 | |
2027 | | | 1,294 | |
2028 | | | 511 | |
2029 | | | 391 | |
Total lease payments | | | 8,083 | |
Less: imputed interest | | | (416 | ) |
Total lease liability | | $ | 7,667 | |
Note 23. Commitments and Contingencies
(a)In the normal course of business, the Company has entered into purchase obligations primarily for fiber. As of December 31, 2024 these commitments were as follows:
| | | | |
| | Commitments | |
2025 | | $ | 54,555 | |
2026 | | | 23,213 | |
2027 | | | 17,569 | |
2028 | | | 3,329 | |
2029 | | | 3,670 | |
Thereafter | | | 79 | |
| | $ | 102,415 | |
MERCER INTERNATIONAL INC.
NOTES TO THE CONSOLIDATED FINANCIAL STATEMENTS
(In thousands of U.S. dollars, except share and per share data)
(b)The Company is involved in legal actions and claims arising in the ordinary course of business. While the outcome of any legal actions and claims cannot be predicted with certainty, it is the opinion of management that the outcome of any such claims which are pending or threatened, either individually or on a combined basis, will not have a material adverse effect on the consolidated financial condition, results of operations or liquidity of the Company.
(c)The Company is subject to regulations that require the handling and disposal of asbestos in a prescribed manner if a property undergoes a major renovation or demolition. Otherwise, the Company is not required to remove asbestos from its facilities. Generally asbestos is found on steam and condensate piping systems as well as certain cladding on buildings and in building insulation throughout older facilities. The Company’s obligation for the proper removal and disposal of asbestos products from the Company’s mills is a conditional asset retirement obligation. As a result of the longevity of the Company’s mills, due in part to the maintenance procedures and the fact that the Company does not have plans for major changes that require the removal of asbestos, the timing of the asbestos removal is indeterminate. As a result, the Company is currently unable to reasonably estimate the fair value of its asbestos removal and disposal obligation. The Company will recognize a liability in the period in which sufficient information is available to reasonably estimate its fair value.
SIGNATURES
Pursuant to the requirements of Section 13 or 15(d) of the Securities Exchange Act of 1934, the Registrant has duly caused this report to be signed on its behalf by the undersigned, thereunto duly authorized.
| | | |
| MERCER INTERNATIONAL INC. |
| | | |
Dated: February 20, 2025 | By: | | /s/ JUAN CARLOS BUENO |
| | | Juan Carlos Bueno |
| | | Chief Executive Officer and Director |
Pursuant to the requirements of the Securities Exchange Act of 1934, this report has been signed below by the following persons on behalf of the Registrant and in the capacities and on the dates indicated.
| | |
/s/ JUAN CARLOS BUENO | | Date: February 20, 2025 |
Juan Carlos Bueno | | |
Chief Executive Officer, Principal Executive Officer and Director | | |
| | |
/s/ RICHARD SHORT | | Date: February 20, 2025 |
Richard Short | | |
Executive Vice President, | | |
Chief Financial Officer, Principal Financial | | |
Officer and Principal Accounting Officer | | |
| | |
/s/ WILLIAM D. MCCARTNEY | | Date: February 20, 2025 |
William D. McCartney | | |
Chairman of the Board and Director | | |
| | |
/s/ JAMES SHEPHERD | | Date: February 20, 2025 |
James Shepherd | | |
Director | | |
| | |
/s/ ALAN WALLACE | | Date: February 20, 2025 |
Alan Wallace | | |
Director | | |
| | |
/s/ LINDA WELTY | | Date: February 20, 2025 |
Linda Welty | | |
Director | | |
| | |
/s/ RAINER RETTIG | | Date: February 20, 2025 |
Rainer Rettig | | |
Director | | |
| | |
/s/ ALICE LABERGE | | Date: February 20, 2025 |
Alice Laberge | | |
Director | | |
| | |
/s/ JANINE NORTH | | Date: February 20, 2025 |
Janine North | | |
Director | | |
| | |
/s/ TORBJÖRN LÖÖF | | Date: February 20, 2025 |
Torbjörn Lööf | | |
Director | | |
| | |
/s/ THOMAS CORRICK | | Date: February 20, 2025 |
Thomas Corrick | | |
Director | | |