UNITED STATES
SECURITIES AND EXCHANGE COMMISSION
WASHINGTON, D.C. 20549
FORM 10-K
☒ ANNUAL REPORT UNDER SECTION 13 OR 15(d) OF THE SECURITIES EXCHANGE ACT OF 1934
For the fiscal year ended October 31, 2024
☐ TRANSITION REPORT UNDER SECTION 13 OR 15(d) OF THE SECURITIES EXCHANGE ACT OF 1934
Commission file number: 001-38154
CODA OCTOPUS GROUP, INC.
(Exact name of registrant as specified in its charter)
| Delaware | | 34-2008348 |
| (State or other jurisdiction of | | (I.R.S. Employer |
| incorporation or organization) | | Identification Number) |
3300 S Hiawassee Rd, Suite 104-105, Orlando, Florida, 32835
(Address, Including Zip Code of Principal Executive Offices)
407 735 2406
(Issuer’s telephone number)
Securities registered under Section 12(b) of the Exchange Act:
COMMON STOCK, $0.001 PAR VALUE PER SHARE
Securities registered under Section 12(g) of the Exchange Act:
NONE
Indicate by check mark if the registrant is a well-known seasoned issuer, as defined in Rule 405 of the Securities Act. Yes ☐ No ☒
Indicate by check mark if the registrant is not required to file reports pursuant to Section 13 or Section 15(d) of the Act. Yes ☐ No ☒
Indicate by check mark whether the registrant (1) has filed all reports required to be filed by Section 13 or 15(d) of the Securities Exchange Act of 1934 during the preceding 12 months (or for such shorter period that the registrant was required to file such reports), and (2) has been subject to such filing requirements for the past 90 days. Yes ☒ No ☐
Indicate by check mark whether the registrant has submitted electronically every Interactive Date File required to be submitted pursuant to Rule 405 of Regulation S-T (§ 232.405 of this chapter) during the preceding 12 months (or for such shorter period that the registrant was required to submit such files). Yes ☒ No ☐
| ● | Indicate by check mark whether the registrant is a large accelerated filer, an accelerated filer, or a non-accelerated filer or a smaller reporting company. |
| | Large accelerated filer ☐ | Accelerated filer ☐ |
| | Non-accelerated filer ☒ | Smaller reporting company ☒ |
| | Emerging growth company ☐ | |
If an emerging growth company, indicate by check mark if the registrant has elected not to use the extended transition period for complying with any new or revised financial accounting standards provided pursuant to Section 13(a) of the Exchange Act. ☐
Indicate by check mark whether the registrant has filed a report on and attestation to its management’s assessment of the effectiveness of its internal control over financial reporting under Section 404(b) of the Sarbanes-Oxley Act (15 U.S.C.7262(b)) by the registered public accounting firm that prepared or issued its audit report. ☐
If securities are registered pursuant to Section 12(b) of the Act, indicate by check mark whether the financial statements of the registrant included in the filing reflect the correction of an error to previously issued financial statements. ☐
Indicate by check mark whether any of those error corrections are restatements that required a recovery analysis of incentive-based compensation received by any of the registrant’s executive offers during the relevant recovery period pursuant to §240.10D-1(b). ☐
Indicate by check mark whether the registrant is a shell company (as defined in Rule 12b-2 of the Act). Yes ☐ No ☒
| ● | State issuer’s revenues for its most recent fiscal year: $20,316,161 |
| | |
| ● | State the aggregate market value of the voting and non-voting common equity held by non-affiliates computed by reference to the price at which the common equity was last sold, or the average bid and asked price of such common equity, as of April 30, 2024 representing the last business day of the registrant’s most recently completed second fiscal quarter: approximately $41,343,000. |
| | |
| ● | State the number of shares outstanding of each of the issuer’s classes of common equity, as of the latest practicable date: 11,218,804 as of January 25, 2025. |
TABLE OF CONTENTS
FORWARD-LOOKING STATEMENTS
This annual report on Form 10-K (this “Annual Report”) contains forward-looking statements, which are subject to the safe harbor provisions created by the Private Securities Litigation Reform Act of 1995. Forward-looking statements are not statements of historical fact but rather reflect our current expectations, estimates and predictions about future results and events. These statements may use words such as “anticipate,” “believe,” “estimate,” “expect,” “intend,” “predict,” “project” and similar expressions or variations of such words are intended to identify forward-looking statements but are not the exclusive means of identifying forward-looking statements in this Annual Report. The identification of certain statements as “forward-looking” is not intended to mean that other statements not specifically identified are not forward-looking. All statements other than statements about historical facts are statements that could be deemed forward-looking statements, including, but not limited to, statements that relate to our future revenue, product development, customer demand, market share, growth rate, competitiveness, gross margins, levels of research, development and other related costs, expenditures, tax expenses, cash flows, our management’s plans and objectives for our current and future operations, the levels of customer spending or research and development activities, and related events, general economic conditions, and the sufficiency of financial resources to support future operations and capital expenditures.
When we make forward-looking statements, we are basing them on our management’s beliefs and assumptions, using information currently available to us. These forward-looking statements are subject to risks, uncertainties, and assumptions, including but not limited to, risks, uncertainties and assumptions discussed in this Annual Report. Factors that can cause or contribute to these differences include those described under the heading “Management’s Discussion and Analysis of Financial Condition and Results of Operations.”
If one or more of these or other risks or uncertainties materialize, or if our underlying assumptions prove to be incorrect, actual results may vary materially from what we projected. Any forward-looking statement you read in this Annual Report reflects our current views with respect to future events and is subject to these and other risks, uncertainties and assumptions relating to our operations, results of operations, growth strategy and liquidity. All subsequent written and oral forward-looking statements attributable to us, or individuals acting on our behalf are expressly qualified in their entirety by this paragraph. You should specifically consider the factors identified in this Annual Report, which would cause actual results to differ before making an investment decision. We are under no duty to update any of the forward-looking statements after the date of this Annual Report or to conform these statements to actual results.
PART I
ITEM 1. BUSINESS
Corporate Information
Our principal executive offices are located at 3300 S. Hiawassee Rd, Orlando, FL 32835. Our telephone number is +1 (407) 735-2406. We maintain a corporate website at www.codaoctopusgroup.com. The reference to the Company’s website address does not constitute incorporation by reference of the information on the Company’s website into this Form 10-K.
Overview
Coda Octopus Group, Inc. (“Coda” “the Company” or “we”), through its wholly owned subsidiaries, operates two distinct segments:
| | ● | the Marine Technology Business (also referred to in this Form 10-K as “Products Business”, “Products Operations” or “Products Segment”); and |
| | | |
| | ● | the Marine Engineering Business (also referred to in this Form 10-K as “Engineering Business”, “Engineering Operations”, or “Services Segment”). |
Marine Technology Business (Products Segment)
Our Marine Technology Business is a technology solution provider to the underwater market. It owns key proprietary and unique technology comprising its real time volumetric imaging sonar technology (Echoscope® technology) and diving technology (Diver Augmented Vision Display - “DAVD”), both of which are applicable to the underwater market, and which are used in the commercial offshore and defense sectors. It also sells other proprietary subsea products such as its geophysical hardware and software solutions and inertial navigation systems. All innovations, design, development and manufacturing of our products are performed within the Company. As part of our patent strategy, we endeavor to actively protect our innovations by seeking patent protection where appropriate.
Our imaging sonar series is marketed under the name Echoscope® and Echoscope PIPE® and are used primarily in the underwater construction, offshore renewables, and offshore oil and gas, complex underwater mapping, salvage operations, dredging, bridge inspection, navigation of underwater hazard, port and harbor security, mining, commercial and defense diving, marine sciences sectors and more broadly applications for real time 3D monitoring, inspection and visualization underwater. Uniquely, the Echoscope® technology is a single sensor for multiple underwater applications that can be used to image in 3D, moving objects in zero visibility water conditions. Competing technologies such as the multibeam primary function is for mapping the seabed and are not real time 3D sonars.
Our diving technology marketed under the name “CodaOctopus® DAVD” addresses the global defense and commercial diving markets. We have two variants of the DAVD: the tethered and untethered variant. The tethered variant is used with a connection to a surface vessel and the untethered variant is not connected to a surface mothership for air supply.
The DAVD solution has the potential to radically change how diving operations are performed globally because it delivers real time information simultaneously to the divers underwater and their surface-based dive supervisors. The DAVD Head- Up Display (“HUD”) is used as a data portal for the diver while underwater. Various types of information are displayed to the diver in the HUD in real time and there by obviating the need for voice instructions.
The DAVD untethered solution (“DUS”) is designed for the Defense and Military market where diving is performed without connection to a surface vessel. These divers are typically military divers performing special forces operations, mine detection and clearance or reconnaissance and surveillance. Similar to the tethered variant, the DAVD HUD is used for displaying a range of mission-related information to the diver.
DAVD’s concept of using a pair of glasses, which is capable of augmented reality display, inside the face mask, helmet or other diving suits is protected by patent. The Company has an exclusive license to exploit this utility patent.
The Marine Technology Business operates through our wholly owned subsidiaries Coda Octopus Products, Inc., (Orlando), Coda Octopus Products Ltd (UK), Coda Octopus Products A/S (Denmark) and branch office Coda Octopus Products A/S in The Netherlands)), and Coda Octopus Products (India) Private Limited (India).
Marine Engineering Business (Services Segment)
Our Marine Engineering Businesses are suppliers of embedded solutions and sub-assemblies which they design and manufacture and sell as a component of mission critical integrated defense systems. The Services Segment established its business in 1977 and has been supporting a number of significant defense programs of record for over 40 years, including Raytheon’s Close in Weapon Support (CIWS) and Northrop Grumman’s Mine Hunting Systems Program (AQS-24) Program. The Services Segment’s business model entails engineering components for integration into broader defense programs, such as the CIWS program. Typically, they supply prototypes units which are validated for integration and thereafter, subject to meeting the acceptance criteria, these lead to contracts for manufacture, repair and upgrade for the life of the program, which can span decades. We enjoy sole source status for the parts that we design and supply into these programs. This business model ensures recurring and long tail revenues. Coda Octopus Colmek, Inc. and Coda Octopus Martech Ltd, qualify as small businesses. This opens opportunities under state requirements to collaborate with Prime Defense Contractors on these programs. A significant part of the revenues generated by the Marine Engineering Business is highly concentrated and are usually derived from a small number of prime defense contractors such as Raytheon or Northrop. In any one financial year, between 20% to 30% of our consolidated revenues may be derived from these customers either alone or collectively.
The Services Segment operates through our wholly owned subsidiaries, Coda Octopus Colmek, Inc (“Colmek”), which is based in Salt Lake City, Utah and which we acquired in 2007, and Coda Octopus Martech Limited (“Martech”), which is based in Portland, United Kingdom and which we acquired in 2006.
Newly Acquired Third Business Unit into the Group’s Products Segment
On October 29, 2024 we acquired Precision Acoustics Limited (hereinafter referred to as “PAL”), a company established under the laws of England. This Company is a recognized leader in the ultrasound and acoustic measurement field. Specializing in acoustic hydrophone design and innovative acoustic materials, they provide a comprehensive range of products and solutions, with a primary focus on medical imaging and Non-Destructive Testing (NDT). NDT is used to validate the viability of structures such as aircraft, ship hulls, wellheads and other subsea structures. Their expertise extends to working closely with national and global standard-setting bodies (such as the National Physical Laboratory of the UK), contributing to the establishment of the primary measurement standards in the industry. This business was acquired to gain access to their expertise and leverage this across the group including in the area of advancing the Echoscope® technology. We believe the addition of their expertise and capabilities positions the Group to qualify to compete for larger Defense contracts.
For segment reporting purposes this newly acquired Company will be reported within our Products Segment.
Therefore, our Products Segment will now comprise PAL and our Marine Technology Business.
Cross-Group Synergies
Our Marine Technology Business and Marine Engineering Services Business both have established synergies in terms of customers, technologies and specialized engineering skills for robust, rugged, and repeated engineering solutions relating to data acquisition, data computation and display of the data. Increasingly drawing on each part of the business strengths, the Marine Technology Business and Marine Engineering Business work jointly on projects including responding jointly for responding to invitations to tender for new projects with broader scope. We believe the Services Business is important to our overall growth strategy as it brings significant engineering depth for the development of the technology solutions offered by the Marine Technology Business. This also ensures tighter control over our intellectual property rights, which are important for our market position. The addition of the expertise of PAL in the field of acoustics and NDT positions the Group to consolidate its capabilities and therefore jointly compete for larger Defense contracts.
Key Pillars for our Growth Plans
Our Echoscope® and DAVD technologies are our most promising products and solutions for the Company’s near-term growth.
We believe that our real time 3D/4D/5D/6D imaging sonars are the only acoustic imaging sonars capable of providing real time 4D imaging of moving objects in zero visibility water conditions and making real time 3D physical measurements of objects underwater. Competing acoustic imaging sonars such as the multibeam sonars are primarily seabed mapping tools which are not designed to perform complex seabed mapping or imaging of moving objects in 3D underwater. The Echoscope® technology therefore is a key sensor for underwater construction activities, inspection and monitoring in real time 3D. We also believe that our new generation of Echoscope PIPE® is the only sonar that can generate concurrently multiple real time 3D/4D/5D/6D acoustic images using different acoustic parameters in real time such as field of view, pulse length, filters, beam density and various beamforming modes. This has the potential to reduce the number of underwater sensors that are required on a project at any one time and therefore improve the efficiency of these underwater operations.
In our industry we are widely considered the leading solution provider for underwater real time 3D visualization.
We also believe that the DAVD solution is poised to radically change the way diving operations are performed by providing a fully integrated suite of sensor data which can be shared in real time by the dive supervisor on the surface vessel and the diver by displaying the required data in the DAVD HUD. Current diving is done largely by poor analog voice command missions (with the diver supervisor on the surface providing verbal instructions to the diver underwater) using a disparate suite of systems for video data, communications, and positioning, which is not available to the diver firsthand. Furthermore, by combining the DAVD with our real time 3D sonars, (Echoscope®), it allows diving to be performed in difficult water conditions (turbidity or zero visibility issues) and thus addresses the common problem of underwater operations having to be aborted due to visibility issues.
The DAVD tethered version, which has now been moved from the customer’s research and development phase into its operational phase, is now in early-stage adoption and is currently operational across nine naval commands within the US Navy. This means that the DAVD tethered version is now a standard item available for purchase and for which budget lines can be established within the various user commands within the Navy.
In the Current FY we continued our global marketing campaigns for the adoption of the DAVD tethered system outside of the US Navy. We believe we have made significant progress with these campaigns. Due to funding shortage on US Defense Programs during the Fiscal Year 2024, funds were not allocated for the DAVD tethered system. We are aware that a number of commands have requested DAVD systems, but these are awaiting budget approval. We do not believe these opportunities have gone away but until the Federal Budget is in place by the new Administration, we expect that US Defense Programs will continue to be funded through continuing resolutions under which there is limited funding available. This may result in a shift of spending priorities which may impact on the level of allocation of funding to programs like the DAVD.
We continue to see great interest in the technology from the marketplace and as we introduce the new generation of the DAVD Augmented Reality HUD, this has galvanized solid interest in the technology.
We are actively working on the DAVD untethered system under a funded joint program with the US Navy and a Foreign Navy, (the “DUS Hardening Program”) where the DAVD technology is being hardened for adoption by the special forces. We have made solid progress under this program and have received positive feedback by these customers. In the Fiscal Year 2024, we did not receive the level of funding anticipated for the DUS Hardening Program due to the reduced funding available under continuing resolutions. Until the Federal Budget is adopted by the new Administration, we anticipate reduced funding for US Defense Programs which may impact the allocation of funding to the DUS Hardening Program and affect the time scales to which we are working for completing the deliverables under this program. Despite this reduced level of funding in the FY 2024, we have achieved a critical milestone (a major pre-requisite for the success of the DUS Hardening Program and we delivered the new generation of the DAVD HUD solution. This next-generation DAVD HUD technology platform boasts a more compact design, a 200% increase in resolution, and an expanded field of view. These enhancements significantly improve compatibility with specialized dive helmets and masks, unlocking new possibilities for previously underutilized applications and markets. This accomplishment represents a major milestone in the success of the DUS Hardening Program. We continue to believe that the DUS variant represents the biggest market opportunity for the DAVD technology in the USA with the addressable market including defense, law enforcement and first responders.
The concept of utilizing a pair of transparent glasses in the HUD underwater for this purpose, is protected by patent. All component parts of the DAVD system are proprietary to the Company and include software (4G USE® DAVD Edition), Diver Processing Pack – telemetry system (DPP), topside Supervisor Console Controller and real time 3D Sonar. The Company benefits from the exclusive license from the U.S. Department of the Navy at Naval Surface Warfare Center Panama City Division to utilize the utility patent covering the concept of using the pair of transparent glasses as a data hub underwater. The DAVD tethered variant is classified as an “Authorization for Navy Use” item and also benefits from CE marking certifying that the DAVD system meets the essential health, safety and environmental requirements of the UK and European Union. The untethered variant is currently going through validation process.
Our corporate structure is as follows:
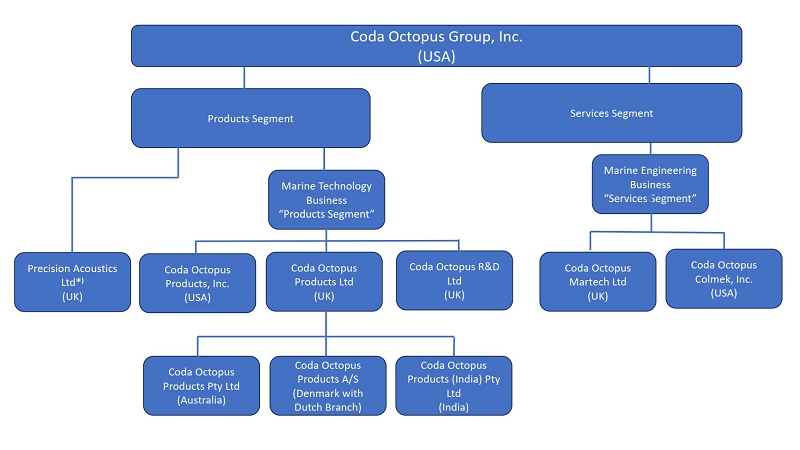
* For operational purposes, although the newly acquired PAL will, for segment reporting purposes, be reported as part of the Products Segment, this will continue to be a separate business unit from the Marine Technology Business, as it operates in a different market sector from the Marine Technology Business.
Corporate History
The Company began as Coda Technologies Limited. This company now operates under the name Coda Octopus Products Limited, a United Kingdom corporation formed in 1994 as a start-up company with its origins as a research group at Heriot-Watt University, Edinburgh, Scotland. Initially, its operations consisted primarily of developing software for subsea mapping and visualization using sidescan sonar (a technology widely used in commercial offshore geophysical survey and naval mine-hunting to detect objects on, and textures of, the surface of the seabed).
In June 2002, we acquired Octopus Marine Systems Ltd, a UK corporation, and changed our name to Coda Octopus Limited. At the time of its acquisition, Octopus Marine Systems was producing geophysical products broadly similar to those of Coda, but targeted at the less sophisticated, easy-to-use, “workhorse” market.
In December 2002, Coda Octopus Ltd acquired OmniTech AS, a Norwegian corporation, which became a wholly owned subsidiary of the Company, and which subsequently changed its name to Coda Octopus R&D A/S. At the time of acquisition, this company had been engaged for over ten years in developing a revolutionary imaging sonar technology capable of producing real time three-dimensional (“3D”) underwater images for use in subsea activities. Coda Octopus Products Limited (Edinburgh based) then developed our visualization software (Underwater Survey Explorer) to control and display the images from the real time 3D sonar device. This patented technology is now marketed by us under the brand name “Echoscope®” and Echoscope PIPE®. All activities of this now-defunct Norwegian subsidiary, Coda Octopus R&D A/S, have been transferred to Coda Octopus Products Limited (Edinburgh).
On July 13, 2004, the Company effected a reverse merger pursuant to the terms of a share exchange agreement between The Panda Project, Inc. (“Panda”), a Florida corporation, and a now defunct entity affiliated with Coda Octopus Ltd. (“Coda Parent”). Panda acquired the shares of Coda Octopus Limited, a UK corporation and a wholly-owned subsidiary of Coda Parent, in consideration for the issuance of a total of 1,432,143 shares of common stock to Coda Parent and other shareholders of Coda Octopus Limited. The shares issued represented approximately 90.9% of the issued and outstanding shares of Panda. The share exchange was accounted for as a reverse acquisition of Panda by Coda. Subsequently, Panda was reincorporated in Delaware and changed its name to Coda Octopus Group, Inc.
In June 2006, we acquired Coda Octopus Martech Limited, which is part of our Services Segment or Marine Engineering Business. This is an English corporation.
In April 2007, we acquired Coda Octopus Colmek, Inc., which is part of our Services Segment or Marine Engineering Business. This is a Utah corporation.
Both Martech and Colmek largely have the same business model, provide similar engineering services and sell to a similar customer base (Martech is UK focused and Colmek is US focused).
In December 2013 Coda Octopus Products Limited established Coda Octopus Products Pty Ltd (Australia) to grow our presence in Australia and New Zealand. These activities were interrupted by the Coronavirus Pandemic in 2020 and since then has been slow to regain momentum.
In 2017 Coda Octopus Products Limited established a subsidiary Coda Octopus Products A/S in Denmark as part of the mitigation strategy relating to the UK withdrawal from the European Union.
In November 2021 Coda Octopus Products Limited established a subsidiary Coda Octopus Products (India) Private Limited intended to gain access to this market and to recruit critical resources for software development.
On October 29, 2024, we acquired into the Group, Precision Acoustics Limited, a company established under the laws of England. This company was acquired to gain access to its expertise and expand our capabilities and offering to the market. It was also acquired to leverage its existing technologies and expertise, which are used in other market sectors, into one of our main markets, the subsea market.
Coda Octopus Group, Inc., is organized under the laws of the State of Delaware as a holding company that conducts its business through its subsidiaries, several of which are organized under the laws of foreign jurisdictions, including England, Scotland, Denmark, The Netherlands, Australia and India. This may have an adverse impact on the ability of U.S. investors to enforce a judgment obtained in U.S. courts against these entities, or to effect service of process on the officers and directors managing the foreign subsidiaries. These companies’ operations must comply with the laws of the countries under which they are incorporated, and these laws are likely to be different from the equivalent laws of the United States.
Marine Technology Business (“Products Segment”)
Our Marine Technology Business develops proprietary solutions for both the commercial and defense subsea market. The range of solutions which it offers to the market are complementary and include:
| Product | | Family | | Composition |
| Real time volumetric imaging sonar | | Echoscope®/ Echoscope PIPE® range | | Hardware and Software |
| Diving Technology | | Diver Augmented Vision Display (DAVD) range | | Hardware and Software |
Digital Audio Communications System | | Voice HUB_4 | | Hardware and Software |
| GNSS-Aided Navigation Systems (providing heading, pitch, yaw and roll data at sea) | | F280 Series® | | Hardware and Software |
Geophysical Solutions (used in conjunction with sidescan and sub-bottom data acquisition) | | DA4G®, GeoSurvey® and Survey Engine | | Hardware and software |
These products and/or solutions are sold, rented or leased into various marine sectors such as:
| | ● | Marine geophysical survey |
| | ● | Offshore Renewables (“Wind Energy”) |
| | ● | Underwater construction, inspection and monitoring |
| | ● | Diving Companies |
| | ● | Commercial and Defense Diving |
| | ● | Salvage and decommissioning |
| | ● | Oil and Gas (O&G”) |
| | ● | Robotics |
| | ● | Commercial fisheries |
| | ● | Environmental, mammal and habitat monitoring |
| | ● | Underwater Defense Applications |
| | ● | Marine vehicles and robotics |
| | ● | Port and Harbor Security, law enforcement and first responders |
| | ● | Research and education |
1. Geophysical Range of Products
The Geophysical range of products is marketed under the brands DA4G®, GeoSurvey® and Survey Engine®. We started our business in 1994 designing and developing the GeoSurvey® software and hardware package for acquisition and processing of sidescan sonar and sub-bottom profiler data. For over two decades, our GeoSurvey has been an industry leading software package in the market for data acquisition and interpretation and provides feature rich solutions and productivity enhancing tools for the most exacting survey requirements. Designed specifically for sidescan and sub-bottom data acquisition, GeoSurvey® has been purchased by numerous leading survey companies throughout the world and has been the workhorse for processing data for Oil & Gas companies for many years. The DA4G® is the hardware acquisition system and both GeoSurvey® and Survey Engine® are complementary software packages which are used for processing the data post-acquisition.
2. Inertial Positioning and Attitude Measurement Systems (“Motion Products”)
We have been selling our GNSS Aided Inertial Measurement Systems for over 15 years. Our current generation of F280 Series® was released to the market in 2021 and is used to provide data on accurate positioning, heading, pitch, roll and yaw at sea. The F280 Series® is an advancement of our F180® series and is highly complementary to our real time Echoscope® sonar series and they are packaged together to provide a more comprehensive solution. The products within the F280 Series ® range can be sold with or without our Echoscope®.
3. Real Time Volumetric Imaging Sonars (ranging from 3D/4D, 5D and 6D)
We design, develop and supply what we believe is the world’s most advanced series of real time volumetric imaging sonar (Echoscope® and Echoscope PIPE®). This is the culmination of over 25 years of research and development. Our sonar innovations are multi-tiered and extend to hardware, firmware and software, all of which co-exist and are co-dependent on each other. In other words, hardware, firmware and software operate as sub-systems to each other. We believe that the highly complex nature of this new technology will make it extremely difficult to reverse engineer our sonar products.
Prior to 2018, we were selling our third generation of Echoscope imaging sonar (3G Sonar Series). In January 2018, we launched our 4G Sonar Series which were largely form factor revisions, and removed several barriers to adoption, (size, weight, power and price). Building on 4G developments, we continued our innovation and in 2021 released our latest generation of sonar, Echoscope PIPE® to the market which advanced the capabilities of the technology and antecedent sonar products significantly.
We believe that the Echoscope PIPE® technology is superior to the other imaging sonars in the market as it generates real time 3D, 4D, 5D and 6D images of the underwater environment irrespective of low or zero visibility conditions and, unlike conventional sonars, can image a volume of data (as opposed to a slice of data). The capability of our volumetric imaging sonars covers a broad breadth of activities underwater particularly for any form of real time monitoring in 3D, underwater construction, salvaging, placements, decommissioning, obstacle avoidance, complex underwater mapping and real time 3D navigation in zero visibility conditions. Uniquely also, using a single sensor (our Echoscope PIPE®) range we can provide different data outputs to the various parts of the survey team, thus reducing the number of different sensors required on these underwater projects, and ultimately reducing the costs associated with these operations.
About the Company’s 5D and 6D Sonars Innovations
5D and 6D imaging sonars are new to the subsea market and constitute an innovation by the Company. We have several patent applications pending for these innovations.
5D Sonars (Echoscope PIPE®)
The advancement that the Company has made with its 5D Sonars is the ability to process and utilize much more of the data that is acquired and processed by our volumetric imaging sonars. Prior to this, due to limitation of processing technologies, there was an upper limit to the amount of data our antecedent sonars could acquire and process. This meant that in the previous generation of sonars (3G and 4G series) when a signal was emitted, they returned a single range and intensity value per beam. In our 5D Sonars we return multiple range and intensity values per beam (Full Time Series data). This new capability provides more information about the underwater environment.
6D Sonars (Echoscope PIPE®)
The Company’s 6D Sonars process and utilize much more of the data acquired by the sonar. 6D Sonars generate multiple real time 3D full time series images. In the previous generation of sonars (3G and 4G series), we could image and display one 3D image in real time. Our PIPE technology generates multiple 3D images simultaneously in real time using different sonar/acoustic parameters (such as different beamforming methods, frequency, range, field of view, pulse length and other acoustic filters or shading). This allows for different data sets to be provided to different parts of the survey team in real time (thus consolidating the sensors and the associated costs and effectiveness of the solution). We are not aware of any sonars that offer either 5D or 6D Capability.
Echoscope® Sonar Hardware
We believe our 5D and 6D series of sonars herald a significant leap forward in real time subsea imaging as this inventive capability allows a single sonar to provide different parts of the survey operations with multiple real time 3D data sets (as opposed to one 3D dataset) for each part of the survey teams’ requirements.
Current competing imaging technologies such as the single beam, multibeam and scanning sonars are either real time 2D imaging sonars or 3D imaging sonars which are not capable of real time 3D imaging, that is to generate a 3D image underwater of moving objects. The competing 3D technology, the multibeam, which is the current standard bearer for imaging sonars in the market is for mapping of the seabed. The Echoscope® technology can also map the seabed (and is superior to the multibeam for complex mapping and inspection of complex underwater structures) and in addition can image moving objects underwater in 3D. The Echoscope® is therefore the primary tool of choice for inspecting and monitoring in real time 3D all types of underwater operations and is the only choice in poor visibility conditions. In addition, the Echoscope® in many instances enables the user to monitor underwater operations from a surface vessel replacing the Remotely Operated Vehicles (ROVs) thus bringing considerable cost savings to our customers.
Echoscope® Software
The Echoscope® technology is used in conjunction with our internally developed software (USE, Construction Monitoring System (CMS), 4G USE® and 4G USE® DAVD Edition). The software is a critical component of the capabilities and features of our sonar series.
Our software development capability is an important part of our strategy to maintain our lead in designing, manufacturing, and selling state-of-the-art real time volumetric imaging sonars and our DAVD System. It also allows us to be responsive to our customers’ requirements for new features and capabilities around our solutions.
We have now launched our fourth-generation multi-sensor software platform which is marketed under the name “4G USE®”. We have also filed several provisional patents around our 4G USE® which is a multi-sensor platform allowing users to bring in and utilize a variety of sensor data including sonar, positioning, camera, lidar, video processing and other sources of point cloud data and seamlessly merging above and below the water data captured from the sonar and camera. It is also the platform for our DAVD software, and this module is marketed under the brand 4G USE® DAVD Edition.
Diver Augmented Vision Display (DAVD) System – Diving Technology
Funded by the Office of Naval Research (“ONR”) through its Future Naval Capabilities (FNC) program, and in close collaboration with NAVSEA 00C3 and Naval Surface Warfare Center, Panama City Division (“NSWC PCD”) we have developed a diver see-through integrated information display system (DAVD).
DAVD is a complete end-to-end diver management solution incorporating as a key element a high-resolution, fully transparent glass head-up display, HUD, integrated directly inside the diving helmet (for hard hat surface air supply diving) or full-facemask (for tethered and untethered defense, commercial and recreational diving applications) or diving suits. In October 2024, we released to the US Navy for evaluation our new generation of Augmented Reality DAVD HUD. The new generation of the DAVD HUD is much smaller and has a higher resolution and therefore offers great flexibility for use in helmets and facemasks for diving. This new generation removes some of the form factor barriers which limited the types of helmets or masks that could be used with our previous generation of the DAVD HUD. The delivery of the new generation of DAVD HUD is a key milestone under the funded DUS Hardening Program.
Problem In Context
The concept of using a pair of transparent glasses in the HUD to render real time information for underwater applications is protected by patent and Coda Octopus has an exclusive license from United States Department of the Navy at NSWC PCD to exploit this patent for all underwater diving activities.
The US Government as represented by Secretary of the Navy (Arlington, VA), describes the challenge for divers in their patent application as follows:
“By their very nature, underwater dive missions are difficult and inherently dangerous. Furthermore, the complexity of underwater missions can make it difficult or impossible for a diver to retain all pre-mission briefing information. For these reasons, it is critical for underwater divers to have access to environmental data and mission data while in the water. However, in low visibility water environments, divers can rarely see handheld displays or gauges. Accordingly, divers are generally supplied with audio-communicated information from a topside location. The topside-supplied information can include descriptions of sonar images, blueprints, maps, pictures, etc. Unfortunately, it can be very difficult and confusing for a diver to interpret a topside personnel’s audio description of the topside personnel’s visual interpretation. Combining this with unreliable audio communication can lead to mission failures or disasters.”
It further describes the objective of the Invention as:
“Accordingly, it is an object of the present invention to provide an underwater diver with real-time visual information available to topside personnel.
Another object of the present invention is to provide real-time visual information to an underwater diver for viewing in water environments irrespective of water visibility levels.
Other objects and advantages of the present invention will become more obvious hereinafter in the specification and drawings.”
How does DAVD Change this?
The DAVD system addresses all the challenges described above including removing the interpretation of the underwater scene to the topside by providing the diver with real time data and first-person interpretation. The DAVD technology benefits not only the diver and direct supervisor on the surface, but also engineers, end-clients, rescue workers and support personnel who all have a vested interest in a successful and safe diving mission. DAVD provides the location of the diver, the dive support vessel, work site assets and any hazards that are known or discovered in real-time. Real-time compass and depth are also displayed to the diver to reduce disorientation. Visibility for the diver and team is significantly enhanced with both real-time camera and 3D sonar data (providing underwater night-vision) and also high-resolution maps and models of the entire work site and surroundings. Communication is transformed from low quality audio speech to high quality digital audio and video, text messaging, visual alerts and automated navigation guidance. The safety of the diver and team is paramount. DAVD ensures the Diver and Supervisor are visually synchronized and can safely coordinate movement, tasks and instructions with full health monitoring and logging of the entire mission. Using the current method of diving, data and information sharing end when the diver leaves the surface.
The DAVD is a significant technology for both defense and commercial underwater diving applications, and we believe that we have the opportunity to standardize this technology globally. The DAVD comprises both hardware comprising the HUD, Diver Processing Pack (DPP), cables and topside Control Unit (DAVD Control Panel) along with 4G USE® DAVD Edition real time visualization software. These developments and products have been performed by the Company.
The DAVD is currently in early-stage adoption with the US Navy and enjoys the benefit of the classification Authorization for Navy Use (ANU) item. DAVD also is certified for CE markings which covers compliance with the European Union and the United Kingdom health environmental and health and safety requirements.
We are marketing the DAVD (through live demonstrations) globally to navies and the commercial diving market. We have significant interest from a number of reputable global commercial offshore service providers and are working with them for the early adoption of the technology and also a number of European friendly Navies including the UK Ministry of Defense (MOD).
Marine Technology Business Accreditations
Coda Octopus Products Limited has the requisite accreditations for its business including being Lloyds Register accredited to ISO 9001:2015 and Cyber Essentials Plus certification.
Newly Acquired Business Unit - Precision Acoustics Limited (“PAL”)
PAL, which is UK based, was acquired into the Group on October 29, 2024. This Company is a recognized leader in the ultrasound and acoustic measurement field. Specializing in acoustic hydrophone design and innovative acoustic materials, they provide a comprehensive range of products and solutions, with a primary focus on medical imaging and Non-Destructive Testing (NDT). NDT is used to validate the viability of structures such as aircraft, ship hulls, wellheads and other subsea structures. Their expertise extends to working closely with national and global standard-setting bodies (such as the National Physical Laboratory of the UK), contributing to the establishment of the primary measurement standards in the industry. For segment reporting purposes, this Company financial results will be reported as a third unit under the Products Segment.
PAL has the requisite accreditations for its business including being Lloyds Register accredited to ISO 9001:2015 and Cyber Essentials certification.
Marine Engineering Businesses (“Services Segment”)
Our Marine Engineering Businesses comprise Coda Octopus Colmek, Inc. which is based in Salt Lake City and Coda Octopus Martech Limited which is based in the United Kingdom.
They largely operate as sub-contractors to prime defense contractors, and their engineering solutions typically constitute sub-components designed for integration into larger defense programs of record where high levels of reliability and quality are essential pre-requisites for securing and maintaining these agreements with their customers. Typically, they prototype subassemblies for their customers and after going through various acceptance tests, including first article inspection approvals, they are then awarded the manufacturing contracts. Many of these manufacturing contracts have a repeat orders profile which typically follows the life cycle of the defense program that is using the subassembly component within the broader program.
These arrangements often give the Marine Engineering Business long term preferred/sole supplier status for the sub-components they supply into these programs and provide them with opportunity to participate in any requirements for technology refresh or obsolescence management for the components supplied. They generally use these long-standing relationships to win more contracts with these customers.
In order to grow, the Marine Engineering Business relies on increasing the number of new programs it attracts annually.
In addition, we are increasingly combining our engineering capabilities with our product offerings. This enables us to offer systems which are complete with installation and support to maximize the utilization of our collective expertise to advance our technologies.
Coda Octopus Martech Limited (“Martech”)
Martech, which is UK-based, operates in the specialized niche of bespoke design and manufacturing services mainly to the United Kingdom defense and subsea industries. Its services are provided on a custom subcontract basis where high quality and high integrity devices are required in small quantities. Their skill set includes both hardware and software design.
Martech enjoys pre-approvals to allow it to be short-listed for certain types of government contracts. Much of the more significant business secured by Martech is through the formal government or government contractor tendering process. Martech has the requisite accreditations for its business including being Lloyds Register accredited to ISO 9001:2015 and Cyber Essentials Plus certification.
Coda Octopus Colmek, Inc. (“Colmek”)
Colmek, which is USA-based, are suppliers of embedded solutions and sub-assemblies which they design and manufacture and sell into mission critical integrated defense systems such as the Close-In-Weapons System (CIWS). This business was established 1977 and has been supporting several significant US defense programs for over 40 years, including Raytheon’s CIWS and Northrop Grumman’s Mine Hunting Systems Program (AQS-24). Colmek’s business model entails designing sub-assemblies which are components of broader defense programs. Colmek is the sole source for the parts that they supply to these programs. This business model ensures recurring and long tail revenues since we continue to supply parts, typically for the life of the program, which can span decades. Their work scope typically extends to both hardware and software design.
Colmek has the requisite accreditations for its business including being Lloyds Register accredited to ISO 9001:2015 and NIST (National Institute of Science and Technology) 800-171 certification.
Sales and Marketing
The Marine Technology Business markets its products through its internal sales team, website, industry events such as trade shows, webinars, live demonstrations of the technology, industry relationships and a network of non-exclusive agents in foreign countries such as Japan, China, Korea and South Africa.
PAL markets its products through its internal sales team, its website and a network of non-exclusive agents in Japan, China, India and Korea.
Colmek markets its products through its internal sales team, website, industry events and agents in the US and Canada.
Martech markets its products through its internal sales team, website and industry events.
Competition
In our Marine Technology Business (Products Business), we are exposed to the following competitive challenges:
Data Acquisition Products (Geophysical Products)
A small percentage of our revenue is generated from our geophysical range of products.
The industry for data acquisition and processing systems for sidescan and sub-bottom profiler data is fragmented with several companies occupying niche areas, and we face competition from different companies with respect to our different products.
In the field of geophysical products, Triton Imaging Inc., a US-based company, now part of the ECA Group (Toulon, France), Chesapeake, a US-based company, and Oceanic Imaging Consultants, Hawaii, USA, dominate the market.
GNSS Aided Inertial Positioning and Attitude Measurement Systems (“Motion Products”)
A small percentage of our revenue is generated from our F280 Series®.
In the field of GNSS-aided inertial positioning and attitude sensing equipment, where our product addresses a small segment of the overall market, we believe that we have several principal competitors: Teledyne Technologies Inc.; Kongsberg Gruppen, iXblue, Applanix and SBG Systems. We believe that our market share in this market segment of motion sensing equipment is relatively small. We sell our MOTION range as part of our equipment suite to complement our Echoscope® real time 3D sonar range as well as supplying it individually. The development and introduction of our F280 Series® of GNSS Aided Inertial Positioning and Attitude Measurement System® constitutes our new generation of Motion Products and gives us the opportunity to increase our market share.
Real Time 3D/4D/5D and 6D Volumetric Sonar
A significant portion of our revenue is generated from our Echoscope® technology.
In the field of Real Time 3D/4D/5D imaging, we are unaware of other companies offering a similar product. In this context it is important to understand some of the intellectual property including know how and capabilities we bring to this field include:
| | - | Acoustic Projector/Transmitter design, manufacturing, and testing |
| | - | Acoustic Receiver Array design, manufacturing, and testing |
| | - | Acoustic encapsulation and sensitivity measurement |
| | - | Acoustic Projector/Transmitter beam pattern and sensitivity measurement |
| | - | Pressure housing Design and Manufacture (sonar systems) |
| | - | 3D/5D/6D Real-Time digital beamforming (on-device) |
| | - | 1D and 2D Digital Beamforming |
| | - | Broadband Beamforming |
| | - | Signal Processing |
| | - | Active High Frequency Sonar Systems |
| | - | Passive Mid Frequency Sonar Systems |
| | - | Data acquisition and recording hardware and software |
| | - | Real-time 2D and 3D sonar visualization rendering and processing software |
Any entry into this market depends upon specialized marine electronics, acoustic and software development skills. The learning curve, which has resulted in the advancement of our real time 3D sonar device, is the culmination of two decades of research and development in this field.
Companies such as Kongsberg Gruppen, R2Sonic, LLC, Tritech International Ltd., United Kingdom, BlueView Technologies Inc., USA (now a part of Teledyne Technologies Incorporated), and Norbit Group AS Norway and Kraken Robotics are examples of companies offering imaging sonar solutions (such as multibeam sonars, SAS sonars and/or 2D scanning sonars), but none of these sonar offerings are directly comparable or competitors to our real time volumetric 3D/4D/5D and 6D sonar solutions as their scanning sonar, single beam or multibeam sonars are not real time 3D imaging sonars and therefore cannot image moving targets underwater.
Specifically, we believe that they do not have the same capabilities as our Echoscope® technology in terms of real time inspection and monitoring by generating 3D, 4D, 5D and 6D images of moving objects underwater including in environments in low or zero visibility conditions. Notwithstanding it should be noted that Teledyne has acquired a significant number of substantial subsea companies (examples are Reson and BlueView). Teledyne has much greater resources, liquidity and market reach than our Company and has many operating verticals. We therefore can give no assurance that companies such as these will not enter this market. Furthermore, companies such as Kongsberg Gruppen and Teledyne can expend significantly more in any one fiscal year on R&D and Business Development, key pillars for increasing market share of underwater imaging sonars, than the Company. Notwithstanding, we believe that our recent development and introduction of 5D/6D - Echoscope PIPE® sonar capability in conjunction with our software (4G USE® a multi-sensor platform) further distinguishes our volumetric sonars and significantly extends our lead in real time 3D/4D/5D and 6D Imaging of moving objects underwater over competitors in the subsea imaging market. Furthermore, we believe that the addition of Precision Acoustic’s expertise in this area will help the Company in maintaining its lead in this area. We are not aware of any other imaging sonars in the market capable of generating real time 5D and 6D imagery underwater, which are Coda Octopus inventions. The innovations around Echoscope PIPE® are the subject of numerous patent applications. We have been awarded US 10,718,865 and US 10,816,652 which concerns a method of compressing beamformed data and method of compressing sonar data, respectively. These two patents are important method patents since we are handling significantly more data than in our previous generation of sonars.
We seek to compete on the basis of producing high quality products employing cutting edge technology that is easy to use by the operators without specialized skills in sonar technology. We intend to continue our research and development activities to continually improve our products, seek new applications for our existing products, develop new innovative products and grow the market for our products and expertise.
Diver Augmented Vision Display System (“DAVD”)
A material portion of our revenue is generated from our DAVD technology.
There are various diving systems in the market that provide a combination of different aspects of our DAVD system but no systems that directly compete in the form of embedded fully transparent glasses mounted internally within the diver helmet or mask for visual display of a range of data and augmented reality information which can be directly consumed by the diver underwater. This concept is protected by US Patent 10,877,282.
The DAVD system provides a unique diver centric system with localized and external sensors to provide increased safety, scene awareness and vital communication in the form of Digital Audio, Ultra-Low-Light Video, Text and technical instruction and access to a complete media hub for effective communication between diver and supervisor. The DAVD system provides the following capabilities:
| | ● | Fully Transparent High-Definition Head-Up Display mounted internally within supported Dive Helmets and Dive Masks, including Kirby Morgan KM37, KM37SS, KM97 and SL17 Helmets, as well as the Interspiro Divator MK II, OTS Guardian and Dräger Panorama Nova Dive |
| | ● | Fully integrated 1st person perspective digital low-light camera with advanced video processing and real-time edge enhancement for Diver and Dive Supervisor |
| | ● | Fully integrated noise-cancelling Digital Audio at source, replacing legacy communications |
| | ● | Integrated Diver Head Tracking for accurate 3D scene visualization with full support for subsea positioning systems for accurate Diver positioning |
| | ● | Telemetry Information on demand including Dive Timers, Depth and Compass Heading, Live position Lat/Long (when connected to external diving positioning system), Waypoint Range and Bearing as well as external Dive Computer data |
| | ● | Instant Digital Voice and Text Communication between Dive Supervisor and Diver, including auto and pre-defined messaging |
| | ● | Transmit unlimited on-demand media to Diver including Images, Instructional Videos, Technical Drawings and other assets to assist in live operations |
| | ● | Creation and transfer of unlimited step-by-step mission instructions with text, video and image support for common diver tasks and operations |
| | ● | Full Mixed-Reality 3D Display for Diver using live Sonar, pre-surveyed Sonar data and 3D models |
| | ● | Divers HUD Display fully adjustable between 2D Mode, and 3D Mode with 1st person and 3rd person perspective |
There are several diver related products and sensors that can be worn by the diver such as telemetry systems, navigational aids, dive computers, video and sonar systems and probes and sensors such as magnetic and thickness. Each of these systems typically have an independent display, typically on the device or wrist worn.
Video systems generally provide no direct benefit to the diver and are intended for top-side visualization. The DAVD provides video data to the diver directly.
More recent advances in technology have introduced head mounted display (HMD) as either replacement or as additional display close to the divers’ eyes. These are typically presented in the form of a monocular display mounted externally to the divers’ mask in which the diver must look at this display through a single eye. These are not intended for long term use and more for occasional glance at data for reference. Dual HMDs are also provided in certain products to replace what the diver can see through the mask with a computer display.
The drawback of such HMD is that the diver loses all sense of the natural surrounding and the real environment is placed using the computer display. Examples of monocular and dual lens HMD include Shearwater Nerd 2, Tritech DMD (Diver Mounted Display) and Blueprint Subsea Artemis HMD.
Furthermore, a significant challenge for diving is the operating environment where zero visibility conditions typically prevail. Combining our DAVD with our Echoscope® removes this barrier for diving operations.
In our Services Segment, we are exposed to the following competitive challenges:
Newly acquired business unit, PAL
PAL sells several products some of which are customized for the customer’s specific application. It is exposed to the following competitive challenges:
Needle and Membrane Hydrophones and Fibre-Optic Hydrophones Market.
For its needle and membrane hydrophone ranges, which are a highly specialized range of products, competition is limited. The principal competitors offering both needle and membrane hydrophones are Onda Corporation, Sunnyvale, CA, USA and Gampt, Merseberg, Germany. For its fibre-optic hydrophones range of products, its main competitors are Onda Corporation, Sunnyvale, CA, USA, RP Acoustics, Stuttgart, Germany and Muller Instruments, Oberursel, Germany.
Single element Transducers Market
PAL supplies single element transducers. There are many suppliers of ultrasonic transducers including Olympus, USA, Imasonic, Besancon, France; Vermon, France; Sonatest, UK; Waygate Technologies, USA as well as numerous smaller organizations in China. However, these competitors offer commercial-off-the-shelf (COTs) products whereas PAL offers custom design single element transducers based on its customers’ specifications and therefore competition is limited for this specialist customization capability).
Automated Measurement Systems Market
PAL supplies Automated Measurement Systems. Its main competitors in this area are Onda Corporation, Sunnyvale, CA, USA; Acertara Acoustic Laboratories, Longmont, CO, USA and Gampt, Merseberg, Germany. These companies offer acoustic measurement systems which are comparable with the PA UMS system. However, PAL faces less competition for its Automated Measurement Systems since its focus is on customization to their customers’ specifications.
Passive Acoustic materials Market
PAL supplies passive acoustic materials. Competition is limited as it has a license from the UK National Physical Laboratory to distribute a wide range of ultrasonic absorbers and encapsulants incorporating NPL’s intellectual property.
Measurements and Calibration Market
As a provider of measurements and calibration services in the UK, PAL’s main competitor is National Physical Laboratory (NPL), UK who is the only provider of ISO17025 accredited hydrophone calibration services, in addition to the ultrasonic power calibration service. They also provide ultrasonic and underwater acoustic field characterization services. However, there is a long-established collaboration between PAL and NPL, and both organizations act as supplier and customer of each other. Elsewhere, numerous notified bodies or national measurement institutions (TuV, Germany; SGS, France; GUM Poland; PTB, Germany) offer some specific measurement services.
Marine Engineering Businesses
Through our marine engineering operations, Coda Octopus Colmek, Inc. and Coda Octopus Martech Limited, we are involved in custom engineering for the defense industry in the United States and in the United Kingdom and are dependent on subcontract from the major prime contractors. Martech and Colmek compete with larger contractors, such as the primes, in the defense industry. Typical among these are Ultra Electronics, BAE Systems, Thales, Raytheon and Northrop Grumman, all of whom are also partners on various projects. The strongest competitors are often the prime contractors themselves as they predominantly have the option to execute the work package internally as opposed to subcontracting these.
Intellectual Property
We operate in an industry in which innovation, investment in new ideas and protection of our intellectual property rights are critical for our continued success. When we can, we protect our innovations and inventions through a variety of means, including, but not limited to, applying for patent, copyright, and trademark protection domestically and internationally, and protecting our trade secrets. We incentivize our employees to innovate through our Patent Reward Scheme. In the last 3 years we have advanced our existing sonar technology and have filed several significant patents applications pertaining to these inventions including our 5D and 6D innovations. Furthermore, we have recently been awarded a patent which concerns a method of predicting and adjusting the laying of cable using sonar imaging. This is a significant patent for the Offshore Renewables Market, which as the world makes the energy transition is set to expand globally. Our Echoscope® technology is used for real time monitoring of cable installations for many of these offshore renewable projects. This recent patent covers a method which automatically predicts the cable touchdown point and removes the need for the Echoscope® operator to manually determine and log the cable touchdown point.
Patents
Our patented inventions along with our strategy to enhance these inventions are at the heart of the Company’s strategy for growth and development. We expend a material part of our resources in building our Patent Portfolio. We also incentivize our staff to contribute to our Patent Portfolio by having in place a competitive Patent Reward Scheme.
Our patent portfolio consists of the following:
| Patent No. | | Description | | Expiration Date |
| US 7,466,628 | | Concerns a method of constructing mathematical representations of objects from reflected sonar signals | | January 1, 2027 |
| US 7,489,592 | | Concerns a method of automatically performing a patch test for a sonar system, where data from a plurality of overlapping three-dimensional (3D) sonar scans of a surface, as the platform is moved, are used to compensate for biases in mounting the sonar system on the platform | | March 5, 2027 |
| US 7,898,902 | | Concerns a method of representation of sonar images allowing 3D sonar data to be represented by a two-dimensional image | | June 13, 2028 |
| US 8,059,486 | | Concerns a method of rendering volume representation of sonar images. | | April 16, 2028 |
| Japan 5565964 | | Concerns a method for drilling/levelling by an underwater drilling/levelling construction device | | January 13, 2031 |
| Japan 5565957 | | Concerns a method of construction management for a 3D sonar device | | October 13, 2030 |
| US 8,854,920 | | Concerns a method of volumetric rendering of 3D sonar data sets | | June 22, 2033 |
| US 9,019,795 | | Concerns a method of object tracking using sonar imaging through point matching between 3D data sets | | November 30, 2033 |
| US 10,088,566 | | Concerns a method of object tracking using sonar imaging using a bounding sphere for object tracking | | November 25, 2036 |
| US 10,718,865 | | Concerns a method of compressing beamformed sonar data | | March 1, 2039 |
| US 10,816,652 | | Concerns a method of compressing sonar data | | October 28, 2038 |
| US 11,061,136 | | Concerns a method of tracking unknown possible objects with sonar | | March 28, 2039 |
| **US 11,204,108 | | Concerns a method of predicting and adjusting the laying of cable using sonar imaging. | | March 22, 2039 |
| *US 11,448,755 | | Concerns a method of correcting beamformed data through split aperture beamforming | | June 3, 2041 |
| US11,579,288 | | Concerns a method of pseudo random frequency sonar ping generation for the purposes of data and hardware cost reduction | | April 14, 2038 |
| JP7224959 | | Concerns a method of compressing sonar data | | February 28, 2038 |
| US10, 877,282 | | Head Up Display System for Underwater Face Plate (within an underwater dive helmet or dive mask) | | License for exclusive use granted to Coda Octopus. |
| US 11,846,733 | | Concerns a method of stabilizing sonar images | | October 30, 2035 |
| JP 7403226 | | Concerns a method of pseudo random frequency sonar ping generation to reduce data and hardware cost | | April 14, 2038 |
| US 11,874,407 | | Concerns technologies for dynamic, real time, four-dimensional volumetric multi-object underwater scene segmentation | | February 19, 2040 |
| US11,789,146 | | Concerns a combined method of location of sonar detection device | | August 5, 2039 |
Trademarks
We own the registered trademarks listed below and they are used in conjunction with the products that we market and sell:
Coda®, Octopus®, CodaOctopus®, CodaOctopus & Design®, Octopus & Design®, F180®, F280®, F280 Series®, Echoscope®, Echoscope 4G®, Echoscope 5D®, 5D Echoscope®, Echoscope 6D®, 6D Echoscope®, Echoscope PIPE® Ping-Pong Echoscope Sonar®, Ping-Pong Echoscope®, Ping-Pong Sonar®, Echoscope Sequencer® 4G Underwater Survey Explorer®, 4G USE®, Echoscope Sequencer®, Survey Engine®, Dimension®, DAseries®, GeoSurvey® CodaOctopus® Air, CodaOctopus® Vantage®; CodaOctopus® UIS; CodaOctopus® USE, Sentiris® , Thermite®; PA and PA Precision Acoustics.
In addition, we have registered several internet domain names including www.codaoctopus.com; www.codaoctopusgroup.com; www.colmek.com and www.martechsystems.co.uk; www.codaoctopusmartech.com; and www.acoustics.co.uk.
Research and Development (“R&D”)
Research and Development is foundational to our business strategy to ensure our growth strategy and maintain our competitiveness. The main costs that are incurred in this area are wages and salaries, researching, prototyping, and validation and testing. The acquisition of PAL into the Group on October 29, 2024, may result in an increase in R&D expenditures as we seek to take advantage of PAL’s expertise with a view to bringing more products and solutions to the market.
Our products are complex and therefore we can give no assurance that even with spending a significant part of our resources on R&D, we will be successful in our development goals or realize significant monetization of these developments. Furthermore, even following the launch of any product we may not succeed. Moreover, we may incur significant research and development expenditures without realizing viable products.
Government Regulation
We sell our products and services internationally and therefore we are subject to numerous laws concerning general business regulations in the various jurisdictions in which we operate. Governmental actions (such as trade protection measures, including export duties and quotas and custom duties and tariffs) may have a material impact on our business and directly affect our revenue. We are also subject to compliance with the U.S. Foreign Corrupt Practices Act and other applicable U.S. and foreign laws prohibiting corrupt payments to government officials and other third parties. We are subject to laws and policies of the U.S. and other jurisdictions affecting trade, foreign investment, loans, and taxes.
Furthermore, many of our products are subject to export control regimes including in the United States, United Kingdom, Denmark, and Australia. Where our products are subject to such export control requirements, they may only be exported to our customers if there is a valid export license granted by the relevant government body. Moreover, these regulations may change from time to time in these jurisdictions, including the United States, depending on the existing relationship with the country to which the goods are exported. Our international activities are significant to our revenues and profits (see Note 16 Disaggregation of revenue). We are therefore dependent on obtaining, on a timely basis, export licenses to many foreign jurisdictions including China.
In addition, as a provider for the US Government, we may be subject to numerous laws and regulations relating to the award, administration, Defense Federal Acquisition Regulations (“DFARs”) and performance of US Government contracts, including the False Claims Act. Non-compliance found by any one agency could result in fines, penalties, debarment, or suspension from receiving additional contracts with all US Government agencies. Given our dependence on US Government business, suspension or debarment could have a material adverse effect on our business and results of operations. In addition, the costs of complying with some of the regulations including DFARS may be prohibitive.
We are dependent on Government funding for a significant part of our revenue generation. To secure certain types of Defense contracts, we need as a pre-requisite to meet Defense Federal Acquisition Regulations on security (including regulations on the type of IT system which must be in place, receiving, handling and storing certain classes of materials). In many instances we do not hold these credentials, and we may therefore not qualify to compete for such contracts.
We are also required to maintain certain accreditations including ISO 900 accreditation, Cyber Essentials, Cyber Essential Plus and NIST (National Institute Science and Technology).
Employees
As of the date hereof, we employ approximately 103 employees worldwide, of which 15 hold management positions. A large majority of our employees have a background in science, technology, software and hardware engineering, with a substantial part being educated to a degree level. A number of our employees hold PhD’s in the area of their specialization. None of our employees are employed under a collective agreement and we have not experienced any organized labor difficulties in the past.
Available Information
Our internet address is www.codaoctopusgroup.com, where we make available, free of charge, our annual reports on Form 10-K, quarterly reports on Form 10-Q, current reports on Form 8-K and any amendments to those reports, as soon as reasonably practicable after we electronically file such material with, or furnish it to, the Securities Exchange Commission (“SEC”). Our SEC reports can be accessed through the investor relations section of our website. With the exception of our annual and periodic reports (Form 10-K and Form 10-Q), the information found on the Company’s website is not intended to be incorporated by reference into this or any other report we file with or furnish to the SEC and are expressly excluded from any such form or reporting.
ITEM 1A. RISK FACTORS
Not required for smaller reporting companies.
ITEM 1B. UNRESOLVED STAFF COMMENTS.
None.
ITEM 1C. CYBERSECURITY.
Risk Management
The Company has designed and implemented processes to identify, address and mitigate risks from cybersecurity threats. Our current processes, which are subject to change as best practices evolve, include:
| | (I) | maintenance of cyber security certifications (such as Cyber Essential Plus). The Cyber essential scheme is a certification scheme designed to show that an organization has a minimum level of protection in cyber security through annual assessments to maintain the certification. This certification is issued by third party service providers who review annually the Company’s security controls around its Information Technology Infrastructure (“ITI”) and business practices to determine the Company’s vulnerability to cyber security threats. We also implement all recommendations which may come out of the certification assessments process. |
| | | |
| | (II) | As part of our day-to-day management of our business, we perform ongoing monitoring of ITI for access violations to our IT systems, weaknesses, changes or other threats. |
| | | |
| | (III) | We actively monitor the bulletins that may be issued by National Cyber Security Bodies, which are a good source of information on current trends and methods relating to cyber-attacks. We review this information and adapt our business practices as may be prudent and feasible. |
| | | |
| | (IV) | We have established an internal cross-group committee (Cyber Security Management Committee (“CSMC”) designating the area of cyber security risk management as “business critical”. The CSMC, under the guidance of the Board of Directors, is responsible for the risk management strategy and governance of this critical business area. Under the CSMC, a formal monthly reporting on cyber security related matters has been implemented and this is provided to the Management of Company for ongoing review. The monthly reporting covers: (i) the outcome of random testing designed to identify threats, access violations and risks; (ii) compliance with the Company’s ITI access protocol; (iii) confirmation that in the reporting period that there were no cyber security incidents; (iv) the assessment and identification of any gaps in the Company’s cyber security risk management protocol; and (v) confirmation that we continue to be compliant with our cyber security certifications and no action or omission has caused this certification to be invalid. |
| | | |
| | (V) | We run monthly cybersecurity awareness training with our employees, and this is documented in our internal periodic reporting. |
Governance
Our Board of Directors holds oversight over the Company’s cyber security risk management strategy and protocols and has amongst its composition an expert on this subject who has been appointed as having the lead in this area. The Company’s internal CSMC works closely with the Board’s expert appointee. All ITI changes, proposed through the CSMC, are routed through approval processes, and testing before implementation.
Our business strategy, results of operations, and financial condition have not been materially affected by risks from cybersecurity threats, but we cannot provide assurance that they will not be materially affected in the future by such risks or any future material incidents.
ITEM 2. PROPERTIES
Orlando, Florida
Our corporate offices are co-located with our subsidiary Coda Octopus Products, Inc. in Orlando. We own these business premises comprising 3,000 square feet, that include office space, training center and light manufacturing facilities.
Salt Lake City, Utah, USA
Coda Octopus Colmek operates from its premises which comprises 16,000 square feet and includes manufacturing, R&D Facilities, and office space. These premises are owned by Coda Octopus Colmek.
Edinburgh, Scotland, UK
Coda Octopus Products Limited (Edinburgh based) operates from its premises comprising 21,313 square feet of internal space and includes office space, R&D Facilities, and manufacturing. These premises are owned by Coda Octopus Products Limited.
Copenhagen, Denmark
Coda Octopus Products A/S, a Danish Subsidiary was established as a mitigation strategy in relation to the UK leaving the European Union which has limited trade relations with EU member states. It leases business premises comprising 1,450 square feet for its operations. The lease is subject to 6 months’ notice of termination.
Annual rent is DKK 142,893 plus Value Added Tax (being an equivalent of $22,903) per annum) with an annual increase of 3%.
Portland, Dorset, UK
Martech uses premises owned by Coda Octopus Products Limited. These premises are located in the Marine Center in Portland, Dorset, United Kingdom, and comprise 9,890 square feet. The building comprises both office space and manufacturing and testing facilities. The rent paid to Coda Octopus Products Limited is $59,109 per annum.
Higher Bockhampton, Dorset, United Kingdom
Precision Acoustics Limited leases business premises comprising 6,501 square feet used for both office space, manufacturing and testing facilities. The lease is for a fixed period (with no provision for early termination) and expires on March 31, 2033. The annual rent for these premises is $58,350 per annum.
All non-US Dollar denominated rents are stated according to prevailing exchange rates as of the date of each respective lease agreement.
ITEM 3. LEGAL PROCEEDINGS.
From time to time, we may become involved in various lawsuits and legal proceedings which arise in the ordinary course of business. However, litigation is subject to inherent uncertainties, and an adverse result in these or other matters may arise from time to time that may harm our business. We are currently not aware of any such legal proceedings that we believe will have, individually or in the aggregate, a material adverse effect on our business, financial condition or operating results.
ITEM 4. MINE SAFETY DISCLOSURES.
Not Applicable.
PART II
ITEM 5. MARKET FOR REGISTRANT’S COMMON EQUITY, RELATED STOCKHOLDER MATTERS AND ISSUER PURCHASES OF EQUITY SECURITIES
Our common stock has been traded on the Nasdaq Capital Market under the symbol “CODA” since July 19, 2017. The following table sets forth the range of high and low bid prices of our common stock as reported and summarized on the Nasdaq, for the periods indicated. These prices are based on inter-dealer bid and asked prices, without markup, markdown, commissions, or adjustments and may not represent actual transactions.
| Year Ended October 31, 2024 | | HIGH | | | LOW | |
| First Quarter | | $ | 7.12 | | | $ | 5.21 | |
| Second Quarter | | $ | 7.04 | | | $ | 5.26 | |
| Third Quarter | | $ | 7.49 | | | $ | 5.86 | |
| Fourth Quarter | | $ | 9.03 | | | $ | 6.80 | |
| Year Ended October 31, 2023 | | HIGH | | | LOW | |
| First Quarter | | $ | 8.22 | | | $ | 5.88 | |
| Second Quarter | | $ | 8.19 | | | $ | 6.13 | |
| Third Quarter | | $ | 11.09 | | | $ | 7.75 | |
| Fourth Quarter | | $ | 8.76 | | | $ | 5.70 | |
We have not declared or paid any cash dividends on our common stock, and we currently intend to retain future earnings, if any, to finance the expansion of our business, and we do not expect to pay any cash dividends in the foreseeable future. The decision whether to pay cash dividends on our common stock will be made by our board of directors, in their discretion, and will depend on our financial condition, operating results, capital requirements and other factors that the board of directors considers significant.
As of October 31, 2024, we had no authorized share repurchase programs.
ITEM 6. SELECTED FINANCIAL DATA
Not applicable.
ITEM 7. MANAGEMENT’S DISCUSSION AND ANALYSIS OF FINANCIAL CONDITION AND RESULTS OPERATIONS
Forward-Looking Statements
The following discussion is intended to promote understanding of the results of operations and financial condition and should be read in conjunction with our consolidated financial statements and notes thereto. This discussion may contain forward-looking statements that reflect the plans, estimates and beliefs of Coda. The words “plans,” “expects,” “will,” “anticipates,” “believes,” “intends,” “projects,” “estimates” or other words of similar meaning and similar expressions, among others, generally identify “forward-looking statements,” which speak only as of the date the statements were made. Our actual results may differ materially from those anticipated in these forward-looking statements as a result of a variety of factors and we disclaim and do not undertake any obligation to update or revise any forward-looking statement, except as required by applicable law.
This section of Form 10-K discusses fiscal 2024 and 2023 items and year-to-year comparisons between 2024 and 2023. Discussions of 2022 items and year-to-year comparisons between 2023 and 2022 that are not included in this Form 10-K can be found in “Management’s Discussion and Analysis of Financial Condition and Results of Operations” in our Form 10-K, filed with the SEC on January 30, 2023, which is available free of charge on the SEC’s website at www.sec.gov and our Investor Relations website at www.codaoctopusgroup.com
General Overview
We operate two distinct business segments: the Products Segment and Services Segment. The Products Segment comprises two distinct business units: the Marine Technology Business, (which serves the subsea market), and PAL. The Services Segment comprises two engineering businesses.
Marine Technology Business
Our Marine Technology Business has operations in the USA, UK and Denmark – see organization chart set out in the Section Item 1 (Business). This business is an established technology solution provider to the underwater imaging, surveying and diving market. It has been operating as a supplier of solutions comprising both hardware and software products for over 30 years to this market and it owns key proprietary technology including its Echoscope® and DAVD technology, that are used in both the underwater defense and commercial markets. All design, development and manufacturing of our technology and solutions are performed within the Company. We sell our products and solutions globally and have a combination of direct sales and indirect sales (via our agents’ network). In Asia and Africa, we largely sell via agents while in the USA, Europe and the Middle East we sell directly. We also rent our products and solutions, particularly to tier-one offshore service providers who prefer accounting for offshore equipment as an operating expense rather than capital expense.
Our imaging sonar technology products and solutions marketed under the name of Echoscope® and Echoscope PIPE® are used in a wide range of underwater construction activities (which include real time monitoring, placements or decommissioning), offshore renewables, offshore oil and gas, forward looking obstacle avoidance, complex underwater mapping, salvage operations, dredging, bridge inspection, underwater hazard detection, port and harbor security, mining, mine counter measures, ship hull scanning, real time threat detection, robotics and 3D perception applications, fisheries, commercial and defense diving, and marine sciences sectors. Uniquely the Echoscope® technology is a single sensor for multiple underwater applications which allows the market operators to consolidate their underwater sensor requirements.
Our novel diving technology is distributed under the name “CodaOctopus® DAVD” to the global defense and commercial diving markets and is relatively new to the market. The DAVD system which embeds a pair of transparent glasses in the HUD is used as the data hub for displaying comprehensive real time data to the diver underwater including augmented reality data. DAVD technology allows both the diver and the dive supervisor to visualize in real time the same underwater scene and data. We believe that the DAVD system has the potential to radically transform how diving operations are performed globally because it provides a fully integrated singular system for topside control and a fully connected HUD system for the diver, allowing both the topside and diver to share a range of critical information including depth (pressure and temperature), compass and head tracking, real time dive timers and alerts, diver position and navigation, ultra-low light enhanced video system and enhanced digital voice communications. Limitations of current diving operations are that the diver only shares analog voice communications with the dive supervisor on the surface, instructions are relayed verbally, and there is no real time information including real time navigation, tracking and mapping of the dive area available to the diver. The topside must also manage several independent systems for video, communications, and positioning. The Company’s DAVD solution addresses these deficiencies. Another critical part of our solution is that by using the Company’s Echoscope® technology, diving can be performed in zero visibility conditions, a common problem which besets these operations and can result in significant costs to the offshore service provider.
Although we generate most of our revenues from our range of real time 3D sonars and DAVD, we have a number of other products which we supply to the marine offshore market such as our F280 Series®, DA4G, GeoSurvey and Survey Engine®. We also have added a new product for use in the diving market, a digital communication system (Voice HUB 4) which advances the current analog-based communication technology to a digital based communication technology. Our customers include offshore service providers to major oil and gas companies, renewable energy companies, underwater construction companies, law enforcement agencies, ports, mining companies, defense bodies, prime defense contractors, navies, research institutes and universities and diving companies. We also provide technology customization services, particularly in the defense market and around our DAVD solutions where this is tailored for particular markets and applications.
Newly acquired business unit within the Products Segment
We acquired PAL into the Group on October 29, 2024. PAL had no material income statement activity in the two days from the acquisition date October 29, 2024 through to October 31, 2024, the date of the Company’s fiscal year end. Therefore, the Company’s audited Consolidated Statements of Income and Comprehensive Income (“Income Statement”) reported in this Form 10-K for the year ended October 31, 2024, do not include any revenue or expenses relating to PAL. Therefore, to the extent that the Management Discussions relate to Income Statement activity, this does not include the recently acquired PAL.
Engineering Business
The Services Business has operations in the USA and UK. It is a trusted long-term Department of Defense (DoD) supplier. Its central business model consists of working with Prime Defense Contractors to design and manufacture sub-assemblies for utilization into larger Defense mission critical integrated systems (“MCIS”). An example of such MCIS is the US Close-In-Weapons Support (CIWS) Program for the Phalanx radar-guided cannon used on combat ships. These proprietary sub-assemblies, once approved within the MCIS program, afford the Services Business the status of preferred supplier. Such status permits it to supply these sub-assemblies and upgrades in the event of obsolescence or advancement of technology for the life of the MCIS program. Customers include prime Defense contractors such as Raytheon, Northrop Grumman, Thales Underwater and BAE Systems. The typical scope of services provided by this business extends to concept, design, prototype, manufacture, and post-sale support including maintenance and obsolescence management.
We have long-standing relationships with Prime Defense Contractors, and we use these credentials to secure more business. We support some significant Defense programs of record by supplying and maintaining proprietary parts (or parts for which we are preferred suppliers) through obsolescence management programs. These services provide recurring stream of revenues for our Services segment.
These business units have established synergies in terms of customers and specialized engineering skills sets (hardware, firmware, and software) encompassing capturing, computing, processing and displaying data in harsh environments.
Factors Affecting our Business.
Our business is affected by a number of factors including those set out below:
| | A. | United Kingdom’s withdrawal from the European Union (EU) – “Brexit” |
This has affected our Business in several important areas:
| |  | It has reduced demand for our products and services in EU member states. Recent Bank of England analysis (October 2024) has concluded that the UK leaving the European Union single market, has impacted demand for British products and services in all areas. |
The Company’s operations are split between the United States, United Kingdom, Denmark, and the Netherlands. A significant proportion of our consolidated revenues are generated outside of the United States by our foreign subsidiaries in the United Kingdom (“UK”) and Denmark and in the 2024 FY our foreign subsidiaries generated $12,936,755, representing 63.7% of our consolidated revenue. In addition, a significant part of our assets and liabilities is held in British Pounds, Danish Kroner and Euros by these foreign subsidiaries. Foreign Currency translations as they pertain to our assets and liabilities are translated at the prevailing exchange rate at the balance sheet date and related revenue and expenses are translated using the average exchange rates in effect during the 12-month reporting period. Significant currency fluctuations (particularly the British Pound and/or the Danish Kroner, Euros, against the US Dollar) may (positively or negatively) affect our financial results including our profit and loss account and the value of our assets and therefore we are subject to foreign currency fluctuation risks. In the 2024 FY, for the purpose of reporting revenue and expenses, the value of the British Pound and Danish Kroner when compared to the 2023 FY increased against the USD by 3.4% and 1.1%, respectively. For the purpose of reporting assets and liabilities, the British Pound and the Danish Kroner both increased by 6.0% and 2.8%, respectively against the USD when compared to the 2023 FY. We also hold cash and cash equivalents in foreign currencies such as British Pound, Euros, Danish Kroner. When the U.S. Dollar strengthens compared to these currencies, cash and cash equivalents balances when translated, may be materially less than expected and vice versa. The impact of currency fluctuations is discussed more fully below under Item 2 - “Inflation and Foreign Currency”. See also Note 2 (Summary of Accounting Policies) – “Foreign Currency Translation” to the audited consolidated financial statements.
Furthermore, we sell our goods and services globally. The exchange rate of the foreign currency used by our customer for the purchase of our goods and services against our functional currency may make the purchasing of our products unattractive from a pricing point of view. In the Current FY, revenues from Japan, a key strategic market, were significantly down due to the depreciation of the Japanese Yen against major currencies such as the USD and British Pound.
Inflation measured as the Consumer Price Index has affected the global economy since calendar year 2022, and which was caused by supply chain issues resulting from the coronavirus pandemic and which has since been further compounded by the war in Ukraine which has affected the price of commodities such as oil. Inflation has since remained volatile in the countries in which we operate and continues to be a threat to the global economy. Recently inflation has been falling in these countries but remain volatile and in the twelve months to October 31, 2024, these were:
| | | Denmark 1.6% - source: Statistics Denmark, |
| | | UK 3.2% - source: Office of National Statistics (ONS); and |
| | | USA 2.6% - source: U.S. Bureau of Labor Statistics. |
Although in the 2024 FY inflation has been falling, prices which have increased due to inflation over the last two years including our raw material costs and wages have remained at their inflationary-inspired level and have become the base price, a large part of which we have not been able to pass on to customers. Furthermore, the Bank of England has indicated that global shocks cannot be ruled out and these may cause inflation to increase. For example, developments in the Middle East could increase inflation by causing oil prices to rise.
Inflation affects our business in a number of areas including reducing demand for our goods and services, increasing our cost of operations and materials and therefore our overall financial results. See “Inflation and Foreign Currency” section of this Form 10-K.
| (i) | Relationship with the Second Largest Economy in the World: China |
We sell our products globally and increasingly to Asia. Asia is the fastest growing economies for our technology and solutions. The recent change in both the US and UK Governments’ political stance towards trade with China, directly affects the sale of our products to customers based in China. Our real time 3D sonars which are depth rated above 300 meters along with our inertial navigation and attitude measurement sensors (F280® series) are subject to export control for certain countries, including China and therefore requires an export license. Many Chinese entities have been included on the US Bureau of Industry and Security blacklist where there is a presumption of denial of grant of export licenses.
The UK Government is generally in lock step with the US Government’s position and has refused to grant export licenses for several of the Company’s applications for end users in China. The curtailment of access to this market due to refusal to issue export licenses is likely to significantly impact our revenues from Asia.
The removal of China as a trading partner (the second largest economy in the world) is likely to have a significant negative impact on our revenues and growth strategy. China has one of the largest planned and funded investment programs for offshore renewables, the market for which most of our technology is used for in China. After significant business development in China, we had started to see persistent and credible growth for our products in this market. However, with the ongoing geopolitical climate, we do not expect to see increased sales in China. We also believe that where technologies are made unavailable to China, China will endeavor to find alternative source of supply or innovate in the areas where restrictions are placed by Western governments and will be more harmful to companies.
The ongoing war in Ukraine impacts our Services Business as most defense spending is now directed toward land-based applications rather than naval based applications. This therefore reduces the opportunities for the Services Business, thus impacting revenue.
| (iii) | Global instability caused by ongoing conflicts |
In general, conflicts create global instability in many ways including disrupting the supply chain and shipping routes. Such conflicts may reduce demand for our products and also increase inflation.
| | E. | Significant Increase in the Price of Raw Materials |
While there have been improvements in lead time for supply of raw materials and components in the Supply Chain during the reporting period, we have experienced a significant increase in the costs of raw materials caused by inflation. These increases may make the costs of our products uncompetitive and affect demand and margins.
| | F. | Shortage of Key Skills/Resourcing Levels and significant increase in cost of operations due to inflation |
We are experiencing skill shortages in areas that are critical for our business operations. The inflationary conditions coupled with the shortage of skilled workers in the countries in which we operate make it difficult for us to compete for these skills. Furthermore, the competitive marketplace for labor also results in high turnover in the workforce which impacts our business in several areas.
Furthermore, as a small business, we are hindered in our ability to compete for certain specialized electronic engineering skills or technology skills, as our remuneration package is not as competitive as those offered by bigger companies which are competing for the same skills.
| | G. | Technological Advancement |
A significant part of our growth strategy is predicated on our flagship real time volumetric imaging sonar technology, the Echoscope® and our Diver Augmented Vision Display (DAVD) solution. The technology space is inherently uncertain due to the fast pace of innovations and therefore we can give no assurance that we can maintain our leading position in these areas or that innovations in other areas may not surpass our solutions that we currently supply to the subsea market. An example of new technology entering the subsea market is lidar technology. However, unlike our sonar technology, Lidar technology cannot be employed in zero visibility conditions and cannot generate a volume pulse or image moving objects required for real time inspection and monitoring underwater.
| | H. | Concentration of Business Opportunities Where the Sales Cycle is Long and Unpredictable |
The Services Business revenues are highly concentrated and are largely generated from subcontracts with a small number of Prime Defense Contractors. The sales cycle is generally protracted, which may affect our revenues. It is also dependent on the US federal government appropriating budget for Defense projects and where the federal government is unable to find consensus in the US Congress, this affects the timely award of sub-contracts from Prime Defense Contractors to our Services Business, which is reliant on these awards. Furthermore, the Marine Technology Business’ key opportunities which are critical to its growth strategy are in the Defense market and therefore this business segment is also reliant on funding from Defense Programs. Due to the protracted nature of the government procurement process and cycle for Defense spending under federal and/or state budgets, the sales cycle can be long, unpredictable and subject to variation by the different Administrations, thus affecting timing of orders, revenues and our overall growth plans.
The change in monetary policy vis-à-vis interest rates has in general affected some of our key sectors such as offshore renewables and underwater construction. The increase in interest rates has impacted on the viability of a number of underwater projects resulting in increased operational costs, which in turn has reduced the demand for our underwater solutions.
| | J. | Reduced Funding Available for Defense Programs resulting from the use of Continuing Resolutions to authorize ongoing spending under Defense Programs |
We are dependent on the timely allocation of funds to defense procurement by governments in the United States and the United Kingdom. A large part of our revenues is derived from government funding in the Defense sector. In FY 2024 many U.S. Defense Programs were funded through continuing resolution (as opposed to a fully appropriated Federal Budget). Funding programs through the continuing resolutions mechanism means that spending priorities shift caused by lower availability of funds. Both Segments have been affected by this including the Products Business DAVD Hardening Program. Consequently, our revenue from the Americas in the 2024 FY decreased by 20.0% and was $7,287,561 compared to $9,110,498 in the 2023 FY. See Note 16 (Disaggregation of Revenue) for more information on this impact on our Business. Many Defense Programs will continue to operate under continuing resolution until the new Administration approves a Federal Budget and line-item appropriations are completed, which may be several months after the new Administration takes office and therefore, we believe we will continue to be impacted until this is resolved.
Critical Accounting Policies and Estimates
The Management’s discussion and analysis of our financial condition and results of operations are based upon our consolidated financial statements. These financial statements have been prepared in conformity with GAAP in the United States which requires us to make estimates and judgments that affect the reported amounts of assets, liabilities, revenue and expenses, and related disclosure of contingent assets and liabilities. By their nature, these estimates and judgments are subject to an inherent degree of uncertainty. We evaluate our estimates based on our historical experience and various other assumptions that are believed to be reasonable under the circumstances. These estimates relate to revenue recognition, the assessment of recoverability of goodwill and intangible assets, recognition and measurement of deferred income tax assets and liabilities, the assessment of unrecognized tax benefits, and others. In addition, in connection with our acquisition of PAL, we determined the fair value of PAL’s opening balance sheet, which determination relied on numerous estimates about the current and future operations of PAL. Actual results could differ from those estimates and may have material effects on our operating results and financial position.
We believe the following accounting estimates are most critical to understanding our consolidated financial statements. See “Note 2 - Summary of Significant Accounting Policies” of the Notes to Consolidated Financial Statements for a full description of our accounting policies.
Revenue Recognition
Revenues are earned under formal contracts with our customers. In respect of our Marine Technology Business these are derived from both sales and rental of underwater technologies and in respect of our Engineering Business from the supply of engineering services. Our contracts do not include the possibility for additional contingent consideration so that our determination of the contract price does not involve having to consider potential variable additional consideration. Our product sales do not include a right of return from the customer.
Regarding our Marine Technology Business, all our products are sold on a stand-alone basis and those market prices are evidence of the value of the products. To the extent that we also provide services (e.g., installation, training, etc.), those services are either included as part of the product or are subject to written contracts based on the stand-alone value of those services. Revenue from the sales of services is recognized when those services have been provided to the customer and evidence of the provision of those services exists.
For further discussion of our revenue recognition accounting policies, refer to “Note 4 Revenue Recognition” in our Consolidated Financial Statements.
Stock-based Compensation
We recognize the expense related to the fair value of stock-based compensation awards within the consolidated statements of income and comprehensive income. The fair value of stock-based compensation is determined as of the date of the grant or the date at which the performance of the services is completed (measurement date) and is recognized over the periods in which the related services are rendered.
Income Taxes
The Company accounts for income taxes in accordance with Accounting Standards Codification Topic 740, Income Taxes (ASC 740). Under ASC 740, deferred income tax assets and liabilities are recorded for the income tax effects of differences between the bases of assets and liabilities for financial reporting purposes and their bases for income tax reporting. The Company’s differences arise principally from the use of various accelerated and modified accelerated cost recovery system lives for income tax purposes versus straight line depreciation used for book purposes and from the utilization of net operating loss carry-forwards.
Deferred tax assets and liabilities are the amounts by which the Company’s future income taxes are expected to be impacted by these differences as they reverse. Deferred tax assets are based on differences that are expected to decrease future income taxes as they reverse. Correspondingly, deferred tax liabilities are based on differences that are expected to increase future income taxes as they reverse. “Note 11 Income Taxes” to the Consolidated Financial Statements discusses the amounts of deferred tax assets and liabilities and also presents the impact of significant differences between financial reporting income and taxable income.
For income tax purposes, the Company uses the percentage of completion method of recognizing revenues on long-term contracts which is consistent with the Company’s financial reporting under U.S. GAAP.
Goodwill and Intangible Assets
Goodwill and intangible assets consist principally of the excess of cost over the fair value of net assets acquired (i.e., goodwill), customer relationships, value of technology, non-compete agreements and licenses. Goodwill was allocated to our reporting units based on the original purchase price allocation. Goodwill is not amortized and is evaluated for impairment annually or more often if circumstances indicate impairment may exist. Customer relationships, value of technology, non-compete agreements, patents and licenses are amortized on a straight-line basis over periods of 2 to 15 years. The Company amortizes its intangible assets using the straight-line method over their estimated period of benefit. We evaluate annually the recoverability of goodwill and intangible assets and carefully consider events or circumstances that warrant revised estimates of useful lives or that indicate that impairment exists.
Step 1 of the goodwill impairment test used to identify potential impairment compares the fair value of the reporting unit with its’ carrying amount, including goodwill. If the fair value, which is based on future discounted cash flows, exceeds the carrying amount, goodwill is not considered impaired. The Company has adopted Accounting Standards Codification 2017 – 04, Simplifying the Test for Goodwill Impairment, which permits the Company to impair the difference between the carrying amount in excess of the fair value of the reporting unit as the reduction in goodwill.
At the end of each financial year, we evaluate goodwill on a separate reporting unit basis to assess recoverability, and impairments, if any, are recognized in earnings. An impairment loss would be recognized in an amount equal to the excess of the carrying amount of the reporting unit compared to the fair value of the reporting unit. To date, the Company has not had any goodwill impairments.
Fiscal Year 2024 Consolidated Results of Operations
In this Form 10-K, the following meanings are ascribed to the terminologies set out immediately below:
| FY | Means Fiscal Year |
| 2024 FY | Means the Fiscal Year ended October 31, 2024 |
| 2023 FY | Means the Fiscal Year ended October 31, 2023 |
| Current FY | Means the Fiscal Year ended October 31, 2024 |
| Previous FY | Means the Fiscal Year ended October 31, 2023 |
It should be noted that our audited Consolidated Statements of Income and Comprehensive Income (“Income Statement”) for the 2024 FY do not include PAL which was acquired into the Group on October 29, 2024 (two days prior to the Company’s fiscal year end on October 31). PAL had no material Income Statement activity during that period. As such, to the extent that the Management Discussions and Analysis below relate to Income Statement activity, these do not include PAL.
In the Current FY our overall consolidated financial results were up when compared to the Previous FY. Our consolidated results of operations include the results of the Company’s foreign subsidiaries. Our foreign subsidiaries’ results are translated from their respective functional currencies into United States Dollar (USD) for reporting purposes. Currency fluctuations can therefore impact (positively or negatively) on our consolidated results including revenue, our profitability and the value of our assets and liabilities included on the consolidated balance sheet. In the Current FY our consolidated revenue was $20,316,161 compared to $19,352,088 in the Previous FY, representing an increase of 5.0%. When applying the Constant Rate (that is the foreign exchange rate applied in Previous FY when translating from the foreign subsidiaries’ functional currencies to USD for reporting purposes), our revenue would have been lower in the Current FY by 1.7% or $350,986 and therefore our consolidated revenue was positively impacted. Gross Profit Margin increased by 2.5%, reflecting changes in the mix of sales in the reporting period. Total operating expenses increased by 2.9% in the Current FY and were $10,588,974 compared to $10,291,503 in the Previous FY. Income from operations increased by 30.8% and was $3,584,131 in the Current FY compared to $2,739,552 in the Previous FY. Net income before taxes in the Current FY increased by 34.8% and was $4,611,288 compared to $3,421,228 in the Previous FY.
Although in the Current FY our revenue increased by 5.0% when compared to the Previous FY, revenue emanating from the strategic Defense sector, an important pillar for our growth strategy, was down. This was due to the reduced level of funding under US Defense Programs caused by the use of continuing resolutions to fund these programs. The use of continuing resolution means funding priorities shift to accommodate the reduced levels of funding available for these programs. The shift in priorities may therefore affect the allocation of funding for programs which we budget for internally. For this reason, in the Current FY revenue emanating from the Americas fell by 20.0% and was $7,287,561 compared to $9,110,498 in the Previous FY (See Note 16 “Disaggregation of revenue” for more information on the split of our revenue in the reporting period). We anticipate that our business will continue to be impacted until the new Administration adopts a Federal Budget and line-item appropriations are made. This could be several months from the new Administration taking office and we therefore anticipate that our Q1 2025 financial results will be impacted by this.
Segment Summary
Marine Technology Business
The Marine Technology Business forms part of the Products Segment.
In the 2024 FY, the Marine Technology Business generated $12,806,603 or 63.0% of our consolidated revenues compared to $12,119,066 or 62.6% in the 2023 FY, representing an increase of 5.7%. Gross Profit Margin was higher at 77.9% in the 2024 FY compared to 76.7% in the 2023 FY, representing an increase of 1.2 % points, reflecting the mix of sales and reduced commission costs. In 2024 FY total operating expenses increased in the Marine Technology Business by 13.2% and were $5,833,972, compared to $5,153,456 in the 2023 FY. This is due to an increase in various areas of our SG&A expenditure including wages and salaries, marketing, general office costs and exchange rate variance. Income from operations in the Marine Technology Business was $4,148,090.
Although in the 2024 FY revenue in the Marine Technology Business increased by 5.7%, this segment was impacted by reduced revenue from the Americas resulting from reduced orders under Defense Programs caused by the shift in spending priorities resulting from the use of continuing resolutions to fund these programs. As a result, the Marine Technology Business revenue from the Americas decreased by 33.4% and was $2,838,857 in the 2024 FY compared to $4,263,883 in the 2023 FY.
In the 2024 FY revenue generated from rentals increased by 84.1% and was $2,328,781 compared to $1,264,804 in the 2023 FY, which offset the reduction in outright sale of products in the 2024 FY which was $7,210,169 compared to $8,444,305 in the 2023 FY, representing a decrease of 14.6%. Commission costs decreased by 9.4% and were $719,491 in the 2024 FY as compared to $794,427 in the 2023 FY.
Services Business
In the 2024 FY, the Services Business generated $7,509,558 or 37.0% of our consolidated revenues compared to $7,233,022 or 37.4% in the 2023 FY, representing an increase of 3.8%. Gross Profit Margin was higher at 55.8% in the 2024 FY compared to 51.6% in the 2023 FY, representing an increase of 4.2% points. This increase reflects the mix of engineering services composed within our 2024 FY revenue make up (more units of manufacturing compared to design work). Total operating expenses fell in the Services Business by 1.7% and were $2,471,810 in the 2024 FY compared to $2,515,664 in the 2023 FY. This is largely related to the reduction in staff headcount caused by volatility in the workforce in general and a shortage in engineering skills in the markets in which we operate. Income from operations in the 2024 FY was $1,719,233 compared to $1,216,121 in the 2023 FY.
This segment is comprised of the UK Operations (Martech) and the US Operations (Colmek) and is reliant on funding being available under Defense Programs. During the 2024 FY, the US Operations experienced significant delays in securing orders under Defense Programs caused by the reduced funding available under continuing resolutions which result in a shift in spending priorities. This has caused reduced order intake by our US Services Operations. Until a Federal Budget is adopted by the new Administration and the line-item appropriations are in place we expect this business unit to continue to be impacted.
We continue to work on the diversification of the Services Business revenue, which is highly concentrated and reliant on Defense funding being available, by investing in our Thermite® Octal range of mission computers.
Comparison of fiscal year ended October 31, 2024, to fiscal year ended October 31, 2023
The information provided below pertains to the Company’s consolidated financial results of operations. For information on the performance of each Segment including the disaggregation of revenues and geographical split, see “Note 15 Segment Analysis” and “Note 16 Disaggregation of Revenue” of our audited Consolidated Financial Statements as of October 31, 2024, and 2023.
Revenue:
| Year Ended October 31, 2024 | | | Year Ended October 31, 2023 | | | Percentage Change |
| $ | 20,316,161 | | | $ | 19,352,088 | | | Increase of 5.0% |
Our consolidated revenues increased by 5.0% in the 2024 FY when compared to the 2023 FY. This increase is largely attributed to the increase in the revenue generated by the Marine Technology Business, which increased by 5.7%. Although revenue generated by this segment increased, its US Operations revenue decreased by 33.4% and was $2,838,857 in the 2024 FY compared to $4,263,883 in the 2023 FY. This was caused by reduced funding under Defense Programs. The Services segment was also impacted for the same reason and consequently, revenue from the Americas in the Current FY decreased by 20.0% and was $7,287,561 compared to $9,110,498 in the Previous FY. We expect weak order intake under these programs until the new Administration adopts a Federal Budget and line items are appropriated by the respective appropriation committees. In the Current FY, we were able to offset some of the impact of reduced funding under US Defense Programs, with an increase in rental income which in the Current FY was $2,328,781 compared to $1,264,804 in the Previous FY and also an increase in outright equipment sale in the strategic market of Asia which in the Current FY was $5,475,401 compared to $4,607,786 in the Previous FY.
Gross Margin:
| Year Ended October 31, 2024 | | Year Ended October 31, 2023 | | Percentage Change |
| 69.8% (Gross profit of $14,173,105) | | 67.3% (Gross profit of $13,031,055) | | Increase of 2.5% |
Our consolidated gross profit margins reported in our financial results may vary according to several factors, which include:
| | ● | The percentage of our consolidated sales that is attributable to the Marine Technology Business versus the Services Business. The Gross Profit Margin yielded by the Marine Technology Business is generally higher than that of the Services Business. |
| | | |
| | ● | The percentage of our consolidated sales that is attributable to the Services Business. The Services Business yields a lower gross profit margin on generated sales which are largely based on time and materials for our Department of Defense subcontracts. |
| | | |
| | ● | The mix of engineering projects performed by our Services Business (Design prototyping versus manufacturing). |
| | | |
| | ● | The mix of sales generated by the Marine Technology Business during the reporting period. The sales generated by the Marine Technology comprise of: |
| | ● | Outright sales versus rentals. |
| | | |
| | ● | Hardware related sales versus Software related sales (Software is generally a higher margin). |
| | | |
| | ● | Custom engineering around its technology (“services”) versus field services (where our technical support engineers are deployed to the field to provide support to our customers in their use of our technology). |
| | ● | Levels of commission on sales. Both the Marine Technology Business and our Services Business work with a global network of sales agents. Most of the sales made by the Marine Technology Business from Asia or South Africa attract commission as those are typically sales via our agents/distributors network. Although the Services Business works with sales agents this is on a lesser scale than the Marine Technology Business and typically commission costs incurred by the Services Business are immaterial. See “Note 2 Summary of Accounting Policies” (Cost of Revenue), “Note 15 Segment Analysis” and “Note 16 Disaggregation of Revenue” of our audited Consolidated Financial Statements as of October 31, 2024, for more information covering commissions as a component of Cost of Revenues, segment reporting and the disaggregation of our revenues by type and geography, respectively. |
| | | |
| | ● | Level of assets in the rental pool and Cost of Revenue associated with these rental assets – see “Note 2 Summary of Accounting Policies” (Cost of Revenue). The assets utilized for our rental offering are subject to depreciation, a portion of which is allocated to Cost of Revenue. |
In the 2024 FY gross profit margins for the Marine Technology Business were 77.9% compared to 76.7% in the 2023 FY. For the Services Business, these were 55.8% in the 2024 FY compared to 51.6% in the 2023 FY.
The Marine Technology Business incurred commission costs in the 2024 FY of $719,491 compared to $794,427 in the 2023 FY, representing a decrease of 9.4%.
Since there are more variable factors affecting Gross Profit Margins in the Marine Technology Business, a table showing a summary break-out of sales generated by the Marine Technology Business in the 2024 FY compared to the 2023 FY is set out below:
| | | 2024 FY
Products | | | 2023 FY
Products | | | Percentage Change | |
| Equipment Sales | | $ | 7,210,169 | | | $ | 8,444,305 | | | | (14.6 | )% |
| Equipment Rentals | | | 2,328,781 | | | | 1,264,804 | | | | 84.1 | % |
| Software Sales | | | 878,516 | | | | 851,976 | | | | 3.1 | % |
| Services | | | 2,389,137 | | | | 1,557,981 | | | | 53.3 | % |
| | | | | | | | | | | | | |
| Total Net Sales | | $ | 12,806,603 | | | $ | 12,119,066 | | | | 5.7 | % |
The main reason for the reduction in equipment sales in the 2024 FY is the contraction in demand from the key strategic market of Defense Programs in the U.S. During the reporting period, these programs were funded through the use of continuing resolutions resulting in reduced allocation caused by a shift of funding priorities. Services supplied by this Business unit increased due to the higher demand for engineering support on the rental projects executed in the reporting period.
For more detailed information on the composition and disaggregation of our revenues, please refer to “Note 16 Disaggregation of Revenue” of our audited Consolidated Financial Statements of October 31, 2024, and 2023.
Research and Development (R&D):
| Year Ended October 31, 2024 | | | Year Ended October 31, 2023 | | | Percentage Change |
| $ | 2,242,429 | | | $ | 2,096,467 | | | Increase of 7.0% |
Research and Development costs are, in general, an inherent ongoing cost for the Marine Technology Business operations and are expended on maintaining its products in the market, advancing these or expanding its technology portfolio.
Accordingly, we continue to invest in research and development to further our business goals including maintaining our lead in the real time volumetric imaging sonar sector (Marine Technology Business) and our new-to-market diving technology (DAVD).
In addition, the Services Business incurs research and development expenses on advancing its Thermite® Octal range of mission computer products with the strategic goals of increasing and diversifying its revenues and improving gross profit margins.
In the 2024 FY this category of expenditure increased by 7.0%. This is largely due to an increase in R&D expenditure by the Services Business which was incurred in connection with its development efforts around its Thermite® Octal range of mission computer products.
Changes in this category by Segment are set out immediately below:
| Description | | Amount | | | % change |
| Products Business (Products Segment) 2024 FY | | $ | 2,019,112 | | | Decrease 1.2% |
| Products Business (Products Segment) 2023 FY | | $ | 2,043,890 | | | |
| Engineering Business (Services Segment) 2024 FY | | $ | 223,317 | | | Increase 324.7% |
| Engineering Business (Services Segment) 2023 FY | | $ | 52,577 | | | |
Selling, General and Administrative Expenses (SG&A):
| Year Ended October 31, 2024 | | | Year Ended October 31, 2023 | | | Percentage Change |
| $ | 8,346,545 | | | $ | 8,195,036 | | | Increase of 1.8% |
In the 2024 FY SG&A expenditures increased by 1.8% when compared to the 2023 FY.
Notable factors in our SG&A expenses for the 2024 FY are:
| | SG&A expenses include transactions which are cash charges and non-cash charges. The non-cash charges comprise Depreciation, Amortization, Stock-based compensation charges, Exchange Rate Variance and Credit Losses Allowance. In 2024 FY and 2023 FY, respectively, non-cash items as a percentage of SGA expenses were 12.4% and 15.6%, respectively. |
| | SG&A expenses include stock based compensation expenses (Non-Cash Item). In the 2024 FY we recorded expense of $137,676 for stock-based compensation as compared to $645,196 in the corresponding 2023 FY, representing a decrease of 78.7% reflecting the reduced stock grants made under the plan in the Current FY. |
| | SG&A expenses include exchange rate variance (Non-Cash Item). In relation to exchange rate variance we recorded expense of $287,939 in the 2024 FY compared to $190,073 in the 2023 FY. |
| | | |
| | | SGA includes credit losses allowance (Non-Cash Item). In the 2024 FY we recorded a credit loss of $119,405. |
Further discussions on SG&A are set out immediately below.
Key Areas of SG&A Expenses across the Group for the year ended October 31, 2024, compared to the year ended October 31, 2023
| Expenditure | | October 31, 2024 | | | October 31, 2023 | | | Percentage Change |
| Wages and Salaries | | $ | 3,627,748 | | | $ | 3,499,542 | | | Increase of 3.7% |
| Legal and Professional Fees (including accounting, audit, tax and investor relations) | | $ | 1,658,648 | | | $ | 1,809,604 | | | Decrease of 8.3% |
| Rent for our various locations | | $ | 29,330 | | | $ | 50,767 | | | Decrease of 42.2% |
| Marketing (excluding associated travel) | | $ | 382,440 | | | $ | 216,403 | | | Increase of 76.7% |
| Travel associated with Marketing activities | | $ | 70,120 | | | $ | 41,149 | | | Increase of 70.4% |
In the 2024 FY compared to the 2023 FY:
Wages and Salaries increased by 3.7%. Although in the 2024 FY as a Group we had less staff on payroll, these costs have increased due to inflation combined with the fierce competition for skills leading to higher payroll costs. In the financial year 2025 we anticipate that this area of expenditure will continue to increase as we have several key vacancies which we are seeking to fill, including management positions, and we continue to increase salaries to stabilize our workforce.
Legal and Professional Fees decreased by 8.3%. The main reason for the change in this area of expenditure is the re-allocation of external accounting services to internal accounting services and also the reduction in fees associated with Investor Relations activities.
Rent expenditure decreased by 42.2% compared to FY 2023. Rent is not a material expenditure in the Group as most of our premises are owned by the Company, except for premises used in Denmark. However, with the acquisition of PAL, we anticipate this area of expenditure will increase in the future.
Marketing increased by 76.7% and Travel associated with marketing increased by 70.4%. This is in keeping with our strategy to shift our focus to business development, marketing, and brand building. Expenditures in this area are spent on industry-related trade shows and events, demonstrations particularly on the DAVD market adoption and technology awareness campaigns, marketing events and customer visits and fees relating to the US Focus Group we retained to assist us in this area.
Overhead related costs as a percentage of revenue for the year ended October 31, 2024, compared to the year ended October 31, 2023
Our overhead SG&A expenditures comprise general corporate administrative costs.
Overhead SG&A as a percentage of revenue decreased by 2.4% and was 11.2%. The main reason for this is that stock compensation expense decreased by 78.7% and in the 2024 FY was $137,676 compared to $645,196 in the 2023 FY. At the same time, in keeping with our strategy to invest in brand building and marketing, our overheads include a new fee relating to the appointment of the US Focus Group to assist in this area, which was $129,500.
Operating Income:
| Year Ended October 31, 2024 | | | Year Ended October 31, 2023 | | | Percentage Change |
| $ | 3,584,131 | | | $ | 2,739,552 | | | Increase of 30.8% |
In 2024 FY, Operating Income increased by 30.8%. This is largely due to the increase in our consolidated revenue and gross profit.
Other Income:
| Year Ended October 31, 2024 | | | Year Ended October 31, 2023 | | | Percentage Change |
| $ | 1,027,157 | | | $ | 681,676 | | | Increase of 50.7 % |
In the 2024 FY, we had “Other Income” of $1,027,157 compared to $681,676, representing an increase of 50.7% from the 2023 FY. In the 2024 FY, $938,775 of this amount represents interest income earned on our certified deposit accounts. In the 2023 FY we had interest income of $642,530 (this was lower in the 2023 FY since the certified deposit accounts were established in February 2023). These accounts are for fixed 3-month rolling periods and constitute “cash equivalents” in our current audited Consolidated Financial Statements for the period ended October 31, 2024. We anticipate that the interest earned on these certified deposit accounts will be material in the future if interest rates remain the same or continue to rise and the Company continues to maintain this level of cash in the certified deposit accounts. See “Note 6 - Composition of Certain Financial Statement Captions” (Other Income) to the audited Consolidated Financial Statements for period ended October 31, 2024, where this is discussed further.
Income before Income Tax Expense for the year ended October 31, 2024, compared to the year ended October 31, 2023
| Year Ended October 31, 2024 | | | Year Ended October 31, 2023 | | | Percentage Change |
| $ | 4,611,288 | | | $ | 3,421,228 | | | Increase of 34.8% |
In the 2024 FY, we had income before income taxes of $4,611,288 as compared to $3,421,228 in the 2023 FY, representing an increase of 34.8%. Net income before income taxes increased largely due to an increase in our consolidated revenues and a 46.1% increase in interest income in the 2024 FY (see Other Income above).
Net Income for the year ended October 31, 2024, compared to the year ended October 31, 2023
| Year Ended October 31, 2024 | | | Year Ended October 31, 2023 | | | Percentage Change |
| $ | 3,645,996 | | | $ | 3,124,149 | | | Increase of 16.7% |
In the 2024 FY we had Net Income of $3,645,996 compared to $3,124,149 in the 2023 FY, representing an increase of 16.7%. This is a reflection of the increase in our pre-tax income for the reasons discussed earlier. In the 2024 FY our tax expenses increased, and we recorded a Current Tax Expense of $713,670 compared to $248,655 in the 2023 FY and a Deferred Tax Expense of $251,622 compared to $48,424 in the 2023 FY. Our effective tax rate is subject to significant variation due to several factors including variability in our pre-tax income and taxable income and/or loss and the mix of jurisdictions to which such income or losses relate, the applicability of special tax regimes, changes in tax regulations, changes in our stock price, changes in our deferred tax assets and liabilities, their valuation, foreign currency gains (losses). The mix of jurisdictions and related income or losses also affects our tax liability for Global Intangible Low-Taxed Income. Furthermore, our tax liability is also affected by the availability of carryforwards losses and R&D tax credits in the UK subsidiaries. In the 2024 FY, the Company and its US subsidiaries had a lower percentage of taxable income (due to lower sales caused by reduced Defense funding allocation) than the Company’s foreign subsidiaries, while the Company’s UK and Danish subsidiaries had a higher percentage of taxable income in their respective tax jurisdictions. The Company’s UK subsidiaries benefit from carryforward losses (NOLs) and research and development (R&D) tax credits. These have been applied to offset a portion of the 2024 FY UK tax liability resulting in a current provision for tax liability of the UK subsidiaries of $267,759 for Current Tax Expense and a Deferred expense of $2,511. There was no provision made in 2023 FY for the UK subsidiaries as tax liabilities were fully offset through the application of offsets relating to R&D Tax Credits and NOLs. Our Danish subsidiary does not benefit from any carryforwards or other tax relief in its tax jurisdiction and therefore for the 2024 FY we have recorded a Current Tax Expense of $218,670 and a Deferred Tax Expense of $11,003.
Comprehensive Income for the year ended October 31, 2024, compared to the year ended October 31, 2023
| Year Ended October 31, 2024 | | | Year Ended October 31, 2023 | | | Percentage Change |
| $ | 4,577,714 | | | $ | 4,418,724 | | | Increase of 3.6% |
In the 2024 FY Comprehensive income was $4,577,714 compared to $4,418,724 for the 2023 FY. This category is affected by fluctuations in foreign currency exchange transactions both relating to our profit and loss expenses and our assets and liabilities on our balance sheet and are largely paper losses or gains, as may be applicable, in the reporting period. In 2024 FY we recorded a lower gain of $931,718 on foreign currency translation adjustment transactions compared to a gain of $1,294,575 in the 2023 FY. A significant part of the Company’s operations is based in the UK and Denmark, and therefore a major part of the Company’s assets and liabilities recorded in its consolidated balance sheet and profit and loss expenses are translated from the functional currencies of these subsidiaries into USD for reporting purposes, thus accounting for the changes. See Table under the section of the MD&A which concerns “Foreign Currency & Inflation”, and which shows the impact of the currency adjustments on our Income Statement and Balance Sheet in 2024 FY compared to 2023 FY.
Segment Analysis
We operate two reportable segments, “Products Business” and “Service Business” which are managed separately based upon fundamental differences in their operations. Segment operating income is total segment revenue reduced by cost of revenues and operating expenses, Research and Development (“R&D”), and Selling, General & Administrative (“SG&A”) identifiable with the reporting business segment. Overheads include general corporate administrative costs. As previously disclosed, PAL was acquired on October 29, 2024 and had no material income statement activity for the remaining two days of up to October 31, 2024. Therefore, our Income Statement does not include PAL. However, the fair value of assets acquired and liabilities assumed for PAL have been included in our audited Consolidated Balance Sheet and in respect of the Segment information provided immediately below, PAL is included in the Supplemental Disclosure information in the table below but not in the Income Statement.
The Company evaluates performance and resources based upon operating income.
Inter-company sales are not included in our consolidated financial statements. For segment reporting purposes only, we have shown in the table below our inter-company sales during the reporting period, which have been eliminated from our financial statements.
The Products Segment is comprised of the Marine Technology Business (Coda Octopus Products – with entities in UK USA and Denmark) and PAL (a recently acquired business unit within the Products Segment). The Marine Technology Business is a supplier to the underwater/subsea market and sells both hardware and software solutions which include imaging sonar technology solutions, diving and diving communications technology, geophysical products, rental equipment, customization, and field operations services. PAL is a supplier of products to the ultrasound, acoustic measurement and NDT markets.
The Services Segment is comprised of Coda Octopus Colmek, Inc. (a Utah corporation) and Coda Octopus Martech Ltd (a UK corporation). The Services Segment operates as subcontractors mainly to prime Defense contractors where they provide engineering services.
The Segment information below which covers our income statement activities does not include PAL (which had no material Income Statement activity from the date of acquisition to the Company’s current fiscal year end). The Supplemental Disclosures in the Segment information covering assets and liabilities include PAL.
The following tables summarize certain balance sheets and statement of operations information by reportable segment for the financial years ending October 31, 2024, and October 31, 2023, respectively.
| | | Products | | | Services | | | Overhead | | | Total | |
| | | | | | | | | | | | | |
| Year Ended October 31, 2024 | | | | | | | | | | | | | | | | |
| | | | | | | | | | | | | | | | | |
| Net Revenues | | $ | 12,806,603 | | | $ | 7,509,558 | | | $ | - | | | $ | 20,316,161 | |
| | | | | | | | | | | | | | | | | |
| Cost of Revenues | | | 2,824,541 | | | | 3,318,515 | | | | - | | | | 6,143,056 | |
| | | | | | | | | | | | | | | | | |
| Gross Profit | | | 9,982,062 | | | | 4,191,043 | | | | - | | | | 14,173,105 | |
| | | | | | | | | | | | | | | | | |
| Research & Development | | | 2,019,112 | | | | 223,317 | | | | - | | | | 2,242,429 | |
| Selling, General & Administrative | | | 3,814,860 | | | | 2,248,493 | | | | 2,283,192 | | | | 8,346,545 | |
| | | | | | | | | | | | | | | | | |
| Total Operating Expenses | | | 5,833,972 | | | | 2,471,810 | | | | 2,283,192 | | | | 10,588,974 | |
| | | | | | | | | | | | | | | | | |
| Income (Loss) from Operations | | | 4,148,090 | | | | 1,719,233 | | | | (2,283,192 | ) | | | 3,584,131 | |
| | | | | | | | | | | | | | | | | |
| Other Income | | | | | | | | | | | | | | | | |
| Other Income | | | 53,960 | | | | 34,422 | | | | - | | | | 88,382 | |
| Interest Income | | | 657,817 | | | | 198,239 | | | | 82,719 | | | | 938,775 | |
| | | | | | | | | | | | | | | | | |
| Total Other Income | | | 711,777 | | | | 232,661 | | | | 82,719 | | | | 1,027,157 | |
| | | | | | | | | | | | | | | | | |
| Income (Loss) before Income Taxes | | | 4,859,867 | | | | 1,951,894 | | | | (2,200,473 | ) | | | 4,611,288 | |
| | | | | | | | | | | | | | | | | |
| Income Tax Expense | | | | | | | | | | | | | | | | |
| Current Tax Expense | | | 316,955 | | | | 169,374 | | | | 227,341 | | | | 713,670 | |
| Deferred Tax Expense (Benefit) | | | (5,655 | ) | | | 19,169 | | | | 238,108 | | | | 251,622 | |
| | | | | | | | | | | | | | | | | |
| Total Income Tax Expense | | | 311,300 | | | | 188,543 | | | | 465,449 | | | | 965,292 | |
| | | | | | | | | | | | | | | | | |
| Net Income (Loss) | | $ | 4,548,567 | | | $ | 1,763,351 | | | $ | (2,665,922 | ) | | $ | 3,645,996 | |
| | | | | | | | | | | | | | | | | |
| Supplemental Disclosures | | | | | | | | | | | | | | | | |
| | | | | | | | | | | | | | | | | |
| *Total Assets | | $ | 40,922,453 | | | $ | 13,404,567 | | | $ | 3,217,524 | | | $ | 57,544,544 | |
| | | | | | | | | | | | | | | | | |
| *Total Liabilities | | $ | 3,072,876 | | | $ | 842,450 | | | $ | 500,695 | | | $ | 4,416,021 | |
| | | | | | | | | | | | | | | | | |
| Revenues from Intercompany Sales - eliminated from sales above | | $ | 3,367,839 | | | $ | 238,143 | | | $ | 1,266,000 | | | $ | 4,871,982 | |
| | | | | | | | | | | | | | | | | |
| Depreciation and Amortization | | $ | 632,882 | | | $ | 88,166 | | | $ | 49,487 | | | $ | 770,535 | |
| | | | | | | | | | | | | | | | | |
| Purchases of Long-lived Assets | | $ | 345,191 | | | $ | 23,786 | | | $ | 89,103 | | | $ | 458,079 | |
| * | The Total Assets and Total Liabilities included in the Supplemental Disclosures include PAL |
| | | Products | | | Services | | | Overhead | | | Total | |
| | | | | | | | | | | | | |
| Year Ended October 31, 2023 | | | | | | | | | | | | | | | | |
| | | | | | | | | | | | | | | | | |
| Net Revenues | | $ | 12,119,066 | | | $ | 7,233,022 | | | $ | - | | | $ | 19,352,088 | |
| | | | | | | | | | | | | | | | | |
| Cost of Revenues | | | 2,819,796 | | | | 3,501,237 | | | | - | | | | 6,321,033 | |
| | | | | | | | | | | | | | | | | |
| Gross Profit | | | 9,299,270 | | | | 3,731,785 | | | | - | | | | 13,031,055 | |
| | | | | | | | | | | | | | | | | |
| Research & Development | | | 2,043,890 | | | | 52,577 | | | | - | | | | 2,096,467 | |
| Selling, General & Administrative | | | 3,109,566 | | | | 2,463,087 | | | | 2,622,383 | | | | 8,195,036 | |
| | | | | | | | | | | | | | | | | |
| Total Operating Expenses | | | 5,153,456 | | | | 2,515,664 | | | | 2,622,383 | | | | 10,291,503 | |
| | | | | | | | | | | | | | | | | |
| Income (Loss) from Operations | | | 4,145,814 | | | | 1,216,121 | | | | (2,622,383 | ) | | | 2,739,552 | |
| | | | | | | | | | | | | | | | | |
| Other Income | | | | | | | | | | | | | | | | |
| Other Income | | | 39,146 | | | | - | | | | - | | | | 39,146 | |
| Interest Income | | | 544,892 | | | | 97,638 | | | | - | | | | 642,530 | |
| | | | | | | | | | | | | | | | | |
| Total Other Income | | | 584,038 | | | | 97,638 | | | | - | | | | 681,676 | |
| | | | | | | | | | | | | | | | | |
| Income (Loss) before Income Taxes | | | 4,729,852 | | | | 1,313,759 | | | | (2,622,383 | ) | | | 3,421,228 | |
| | | | | | | | | | | | | | | | | |
| Income Tax Expense (Benefit) | | | | | | | | | | | | | | | | |
| Current Tax Expense (Benefit) | | | 272,126 | | | | 78,876 | | | | (102,347 | ) | | | 248,655 | |
| Deferred Tax Expense (Benefit) | | | 115,954 | | | | (54,382 | ) | | | (13,148 | ) | | | 48,424 | |
| | | | | | | | | | | | | | | | | |
| Total Income Tax Expense (Benefit) | | | 388,080 | | | | 24,494 | | | | (115,495 | ) | | | 297,079 | |
| | | | | | | | | | | | | | | | | |
| Net Income (Loss) | | $ | 4,341,772 | | | $ | 1,289,265 | | | $ | (2,506,888 | ) | | $ | 3,124,149 | |
| | | | | | | | | | | | | | | | | |
| Supplemental Disclosures | | | | | | | | | | | | | | | | |
| | | | | | | | | | | | | | | | | |
| Total Assets | | $ | 36,969,673 | | | $ | 13,604,262 | | | $ | 1,267,581 | | | $ | 51,841,516 | |
| | | | | | | | | | | | | | | | | |
| Total Liabilities | | $ | 2,263,761 | | | $ | 732,582 | | | $ | 416,407 | | | $ | 3,412,750 | |
| | | | | | | | | | | | | | | | | |
| Revenues from Intercompany Sales - eliminated from sales above | | $ | 4,602,741 | | | $ | 584,622 | | | $ | 1,200,000 | | | $ | 6,387,363 | |
| | | | | | | | | | | | | | | | | |
| Depreciation and Amortization | | $ | 523,339 | | | $ | 100,689 | | | $ | 43,502 | | | $ | 667,530 | |
| | | | | | | | | | | | | | | | | |
| Purchases of Long-lived Assets | | $ | 1,996,544 | | | $ | 25,404 | | | $ | 108,392 | | | $ | 2,130,340 | |
The Company’s reportable business segments sell their goods and services in four geographic locations:
| ● | Americas |
| | |
| ● | Europe |
| | |
| ● | Australia/Asia |
| | |
| ● | Middle East/Africa |
Liquidity and Capital Resources
As of October 31, 2024, the Company had an accumulated deficit of $7,406,491, working capital of $39,084,999 and stockholders’ equity of $53,128,523. For the year then ended, the Company generated cash flow from operations of $2,451,675.
We believe that our current level of cash and cash generation will be sufficient to meet our short and medium-term liquidity needs. As of October 31, 2024, we had cash and cash equivalents on hand of $22,479,072 and both billed and unbilled receivables of $5,151,290. Our current cash balance represents approximately 33 months of Selling, General and Administrative Expenses. The Company continues to critically evaluate the level of expenses that it incurs and reduces its expenses as may be appropriate within its business priorities.
We also have access to a revolving line of credit of $4 million from HSBC NA. This line of credit is available to the Company for short-term working capital purposes. All amounts under the Revolving Line of Credit are payable at the end of each financial year. The facility was extended for another year until November 2025. To date, the Company has not borrowed any funds under this credit line.
Operating Activities
Net cash generated from operating activities for the year ended October 31, 2024, was $2,451,675. We recorded net income for the period of $3,645,996. Other items in uses and sources of funds from operations included non-cash charges related to depreciation of fixed assets, amortization of intangible assets, deferred tax asset, gain on sale of asset, allowance for credit loss and stock-based compensation, which collectively totaled $1,245,331. Changes in operating assets decreased net cash from operating activities by $2,183,361 and changes in current liabilities decreased net cash from operating activities by $256,291.
Investing Activities
Net cash used in investing activities, (net of cash acquired), for the year ended October 31, 2024, was $4,421,092.
Financing Activities
Net cash used in financing activities for the year ended October 31, 2024, was $15,633.
Foreign Currency and Inflation
The Company’s consolidated results are a combination of its US operations and foreign subsidiaries. The foreign subsidiaries maintain their accounts in the native currencies of their operations, and which are:
| US Dollars | For US Operations |
| British Pound | For United Kingdom Operations |
| Danish Kroner | For Danish Operations |
| Australian Dollars | For Australian Operations (operations are currently dormant) |
| Indian Rupees | For Indian Operations (operations are currently dormant) |
The Company’s consolidated financial results therefore include the translation of its foreign subsidiaries functional currencies into USD. See “Note 2 Summary of Accounting Policies” (Foreign Currency Translation) of our audited Consolidated Financial Statements as of October 31, 2024, for more information on the applicable rates used for our Balance Sheet transactions and Statements of Income and Comprehensive Income.
Fluctuations in currency exchange rates can directly (positively and negatively) impact on the Company’s sales, profitability and financial position when the transactions of the foreign subsidiaries are translated from their functional currencies into USD for financial reporting. In addition, the Company is also subject to currency fluctuation risk with respect to certain foreign currency denominated receivables and payables incurred in the ordinary course of its business operations (cross-border transactions such as inventory purchasing). In general, the Company’s subsidiaries perform financial transactions in their native currencies. Exceptionally, a subsidiary may perform financial transactions in foreign currencies (such as purchasing inventory from a foreign supplier, for example, in foreign currency). Furthermore, the Company holds significant cash balances in foreign currencies, such as British Pound, Euro and Danish Kroner. The Company cannot predict the extent to which currency fluctuations may affect its business and financial position, and there is a risk that such fluctuations may have an adverse impact on the Company’s sales, profits and financial position. The Company does not hedge its currency exposure risks.
Applying the Constant Rate (as the term is defined immediately below), the impact of currency fluctuations in the 2024 FY compared with the 2023 FY, is shown below.
| For Revenue and Expenses (Income Statement Transactions) for the Current FY, the Constant Rate means: | The “prevailing weighted average” exchange rate in the current 12-month period for the Current FY compared to the “prevailing weighted average” exchange rate in the 12-month period for the Previous Year. |
| For Balance Sheet Transactions Constant Rate means: | The prevailing exchange rate as of October 31, 2024, when compared to prevailing exchange rate as of October 31, 2023. |
These are the values we have used in the calculations below which show the impact of these currency fluctuations on our operations in the 2024 FY:
| | | Based British Pounds | | | Based Australian Dollar | | | Based Danish Kroner | | | TOTAL USD | |
| | | Actual | | | Constant | | | Actual | | | Constant | | | Actual | | | Constant | | | Actual | | | Constant | | | *Total | |
| | | Results | | | Rates | | | Results | | | Rates | | | Results | | | Rates | | | Results | | | Rates | | | Effect | |
| | | ($) | | | ($) | | | ($) | | | ($) | | | ($) | | | ($) | | | ($) | | | ($) | | | ($) | |
| Revenues | | | 9,391,144 | | | | 9,078,639 | | | | - | | | | - | | | | 3,545,611 | | | | 3,507,130 | | | | 12,936,755 | | | | 12,585,769 | | | | 350,986 | |
| Costs | | | 8,880,421 | | | | 8,584,911 | | | | 6,056 | | | | 6,064 | | | | 686,573 | | | | 679,121 | | | | 9,597,625 | | | | 9,297,474 | | | | 300,151 | |
| Net profit (losses) | | | 510,723 | | | | 493,728 | | | | (6,056 | ) | | | (6,064 | ) | | | 2,859,038 | | | | 2,828,009 | | | | 3,339,130 | | | | 3,288,295 | | | | 50,835 | |
| Assets | | | 29,762,265 | | | | 28,088,109 | | | | 19,986 | | | | 19,319 | | | | 841,717 | | | | 818,887 | | | | 30,635,932 | | | | 28,938,396 | | | | 1,697,536 | |
| Liabilities | | | (2,944,586 | ) | | | (2,778,950 | ) | | | (2,991 | ) | | | (2,891 | ) | | | (325,643 | ) | | | (316,811 | ) | | | (3,286,084 | ) | | | (3,111,641 | ) | | | (174,443 | ) |
| Net assets | | | 26,817,679 | | | | 25,309,159 | | | | 16,995 | | | | 16,428 | | | | 516,074 | | | | 502,076 | | | | 27,349,848 | | | | 25,826,755 | | | | 1,523,093 | |
The effect of exchange rate movements between the Previous FY and the Current FY increased net assets by $1,523,093.
The table above does not show separately the effect of exchange rate impact for Indian Rupees since this operation is dormant and the impact is not material.
*Total Effect summary column data is the difference between the Actual Results in the reporting period and the results when the Constant Rate is applied.
Off-Balance Sheet Arrangements
We do not have any off-balance sheet arrangements.
Inflation
Inflation affects our Business in several ways including:
| | | Cost of Operations (including wages, salaries, utilities) and therefore our overheads. |
| | | Bill of Material (BOM) Costs of our Products and Input Materials for Engineering Services. |
| | | Our revenue. An inflationary environment is likely to reduce demand for our goods and services. |
| | | Impacts on our ability to compete for key skills required for our Business |
High inflation affects our business in a number of areas including costs of operations, including wages and salaries which have increased in relation to the number of staff in the Current FY (which has reduced) compared to the number of staff in the Previous FY. In addition, our general costs of operations have increased along with raw material costs for our products and solutions.
Inflation is also an inherently destabilizing factor for both retaining staff and recruiting staff and therefore impacts on our business plans and the effectiveness of our assembled workforce.
Furthermore, our revenue continues to be affected in strategic markets and geographies due to inflationary pressures which have made the pricing for our solutions unattractive for those markets.
ITEM 7A. QUANTITATIVE AND QUALITATIVE DISCLOSURES ABOUT MARKET RISK
Not applicable.
ITEM 8. FINANCIAL STATEMENTS AND SUPPLEMENTARY DATA
Reference is made to the Index of Financial statements following Part III of this Report for a listing of the Company’s Consolidated Financial Statements and Notes thereto.
ITEM 9. CHANGES IN AND DISAGREEMENTS WITH ACCOUNTANTS ON ACCOUNTING AND FINANCIAL DISCLOSURE
None.
ITEM 9A. CONTROLS AND PROCEDURES
Evaluation of Disclosure Controls and Procedures
Our management, with the participation of our Chief Executive Officer and Interim Chief Financial Officer, has evaluated the effectiveness of our disclosure controls and procedures (as defined in Rules 13(a)- 15(e) under the Exchange Act), as of the end of the period covered by this Report. Based on the evaluation of our disclosure controls and procedures as of October 31, 2024, our Chief Executive Officer and Interim Chief Financial Officer have concluded that our disclosure controls and procedures were effective as of this date.
Attached as exhibits to this Form 10-K are certifications of the Company’s Chief Executive Officer and Interim Chief Financial Officer, which are required in accordance with Rules 13a-15(e) and 15d-15(e) of the Exchange Act.
This “Controls and Procedures” section includes information concerning the controls and controls evaluation referred to in the certifications and it should be read in conjunction with the certifications, for a more complete understanding of the topics presented.
Disclosure controls and procedures are controls and other procedures that are designed to ensure that information required to be disclosed by us in the reports that we file or submit under the Securities Exchange Act of 1934, as amended (the “Exchange Act”) is recorded, processed, summarized and reported, within the time periods specified in the Securities and Exchange Commission’s rules and forms. Disclosure controls and procedures include, without limitation, controls and procedures designed to ensure that information required to be disclosed by us in the reports that we file under the Exchange Act is accumulated and communicated to our management, including our principal executive and financial officers, as appropriate to allow timely decisions regarding required disclosure.
Management’s Report on Internal Control over Financial Reporting
A company’s internal control over financial reporting is a process designed by, or under the supervision of, a public company’s principal executive and principal financial officers, or persons performing similar functions, and effected by the board of directors, management and other personnel, to provide reasonable assurance regarding the reliability of financial reporting and the preparation of financial statements for external purposes in accordance with US generally accepted accounting principles (“US GAAP”) including those policies and procedures that: (i) pertain to the maintenance of records that in reasonable detail accurately and fairly reflect the transactions and dispositions of the assets of the company, (ii) provide reasonable assurance that transactions are recorded as necessary to permit preparation of financial statements in accordance with US GAAP, and that receipts and expenditures are being made only in accordance with authorizations of management and directors of the company, and (iii) provide reasonable assurance regarding prevention or timely detection of unauthorized acquisition, use or disposition of the company’s assets that could have a material effect on the financial statements.
Management is responsible for establishing and maintaining adequate internal control over financial reporting. Our management, with the participation of our Chief Executive Officer and Interim Chief Financial Officer, has assessed the effectiveness of our internal control over financial reporting as of October 31, 2024. In making this assessment, our management used the criteria established in Internal Control—Integrated Framework issued by the Committee of Sponsoring Organizations of the Treadway Commission (COSO 2013 Framework). Based on its assessment, our management believes that, as of October 31, 2024, our internal control over financial reporting was effective based on those criteria.
This annual report does not include an attestation report of the Company’s independent registered public accounting firm regarding internal control over financial reporting. Under SEC rules, the management’s report was not subject to attestation by the Company’s independent registered public accounting firm.
Changes in Internal Control over Financial Reporting
During the year ended October 31, 2024, there were no changes in the Company’s internal control over financial reporting (as defined in Rule 13a-15(f) and 15d–15(f) under the Exchange Act) that have materially affected, or are reasonably likely to materially affect, the Company’s internal control over financial reporting.
ITEM 9B. Other Information
Not Applicable
ITEM 9C. Disclosure Regarding Foreign Jurisdictions that Prevent Inspections
Not applicable.
PART III
ITEM 10. DIRECTORS, EXECUTIVE OFFICERS, AND CORPORATE GOVERNANCE
Directors and Executive Officers
The following persons are the executive officers and directors as of the date hereof:
| Name | | Age | | Position |
| Annmarie Gayle | | 61 | | Chief Executive Officer and Chairman |
| Gayle Jardine | | 54 | | Interim Chief Financial Officer |
| Blair Cunningham | | 56 | | President of Technology |
| Michael Hamilton | | 77 | | Director |
| Robert Harcourt | | 79 | | Director |
| Anthony Tata | | 65 | | Director |
| Tyler G. Runnels | | 68 | | Director |
| Gwenael Rouy-Poirier | | 50 | | Director |
| Dr. Angus McFadzean | | 60 | | Director |
Annmarie Gayle has been our Chief Executive Officer and a member of the Board of Directors since 2011 and our Chairman since March 2017. She is also our Chief Executive Officer for our flagship products business, Coda Octopus Products, Limited (UK) since 2013. Prior thereto, she spent two years assisting with the restructuring of our Company. She previously served with the Company as Senior Vice President of Legal Affairs between 2006 and 2007. Earlier in her career she worked for a leading City-London law firm specializing in Intellectual Property Rights, the United Nations in various legal positions and the European Union. Ms. Gayle has a strong background in restructuring and has spent more than 12 years in a number of countries where she has been the lead adviser to a number of transitional administrations on privatizing banks and reforming state-owned assets in the Central Eastern European countries including banking, infrastructure, mining and telecommunications assets. Ms. Gayle has also managed a number of large European Union funded projects providing transitional support and capacity. Ms. Gayle holds a Law degree gained at the University of London and a Master of Law degree in International Commercial Law from Cambridge University and has completed her professional law exams to practice law in England & Wales. Because of her wealth of experience in corporate governance, large-scale project management, restructuring, strategy, structuring and managing corporate transactions, we believe that she is highly qualified to act as our Chief Executive Officer.
Gayle Jardine joined the Company as European Director of Finance in September 1, 2015. She was appointed as the Interim CFO on February 14, 2024. From 2009 to 2015, she was the Controlling Director of Pentland Accounting Ltd providing management accounting services to a variety of businesses related to software provision and commercial property offerings. Between 2004 and 2009 she held senior finance management roles in Wireless Fiber Systems, Scottish Water Solutions and Honeywell. The majority of her earlier career from 1992-2002 was spent at Hewlett Packard (HP) / Agilent Technologies where she started as a Graduate Financial Analyst and worked her way through various roles to be Financial Operations Manager of a worldwide product line managing teams in UK, Germany and USA. From 1995-1996 she had a foreign services assignment to Santa Rosa, California with HP as a Financial Business Consultant in their Test & Measurement Business. Ms. Jardine qualified as a Chartered Management Accountant (CIMA) in 1996 and has a BA (Hons) in Business Studies from Robert Gordon University in Aberdeen.
Blair Cunningham joined the Company in July 2004 and held several roles in the Company including Chief Technology Officer between July 2004 and July 2005. He is currently our President of Technology and Divisional CEO of Coda Octopus Products, Inc. Mr. Cunningham received an HND in Computer Science in 1989 from Moray College of Further Education, Elgin, Scotland. Because of Mr. Cunningham’s expertise in technology, systems software development and project management, the Company believes that he is highly qualified to serve in his current roles.
Michael Hamilton was our Chairman of the Board between June 2010 and March 2017. He is currently serving as an independent director of our Board. He has been a member of the board of directors and a member of the audit committee of Tian Ruixiang Holdings Ltd., a Nasdaq traded public company, since 2020. Since 2014, Mr. Hamilton has provided accounting and valuation services for a varied list of clients. He was Senior Vice President of Powerlink Transmission Company from 2011 through 2014. From 1988 to 2003, he was an audit partner at PricewaterhouseCoopers. He holds a Bachelor of Science in Accounting from St. Frances College and is a certified public accountant and is accredited in business valuation. Because of Mr. Hamilton’s background in auditing, strategic corporate finance solutions, financial management and financial reporting, we believe that he is highly qualified to be a member of our Board of Directors.
G. Tyler Runnels was elected as a director at the 2018 annual meeting. Mr. Runnels has nearly 30 years of investment banking experience including debt and equity financing, private placements, mergers and acquisitions, initial public offerings, bridge financings, and financial restructurings. Since 2003 Mr. Runnels has been the Chairman and Chief Executive Officer of T.R. Winston & Company, LLC, an investment bank and member of FINRA, where he began working in 1990. Mr. Runnels was an early-stage investor in our company and T.R. Winston & Company, LLC has served as our exclusive placement agent in one of our private placements raising early rounds of capital for our company. Mr. Runnels has successfully completed and advised on numerous transactions for clients in a variety of industries, including healthcare, oil and gas, business services, manufacturing, and technology. Mr. Runnels is also responsible for working with high-net-worth clients seeking to diversify their portfolios to include real estate products through established relationships with real estate brokers, accountants, attorneys, qualified intermediaries, and financial advisors. Prior to joining T.R. Winston & Co., LLC, Mr. Runnels held the position of Senior Vice President of Corporate Finance for H.J. Meyers & Company, a regional investment bank. Mr. Runnels received a B.S. and MBA from Pepperdine University. Mr. Runnels holds FINRA Series 7, 24, 55, 63 and 79 licenses.
Robert Harcourt has been a member of Coda’s Board of Directors since June 26,2023. Mr. Harcourt is a retired Audit and Advisory Partner of KPMG with a professional career spanning over 40 years where he executed a variety of roles at the partnership level during the time with KPMG. including Assurance Partner from 1978 – 1999 and Advisory Partner from 1999- 2007. He also worked as Associate Director, Division of Registration and Inspection of the Public Company Accounting Oversight Board (PCAOB) from 2011-2016. He most recently worked for the Analysis Group and Cornerstone Research from 2018-2021. He is a Certified Public Accountant and holds a BBA in Accountancy from Pace University and has completed course work at Harvard University and Stanford University.
Brigadier General Anthony Tata (Ret) has been a member of Coda’s Board of Directors since June 26, 2023. Brigadier General Tata most recently performed the duties of Undersecretary of Defense for Policy, the number 3 position in the United States Department of Defense, where he implemented the National Defense Strategy and worked closely with allies and partners to achieve strategic defense goals globally. His military career includes commands in the 82nd and 101st Airborne Divisions and the 10th Mountain Division, as well as many overseas operations. He is a West Point graduate with a Bachelor of Science and two master’s degrees in Operational Planning and International Relations. He is also a distinguished national security fellow at Harvard University’s JFK School of Government and a successful author. His military awards include the bronze star, combat action badge, ranger tab, master parachutist badge and Department of Defense award for distinguished public service.
Gwenaël Rouy-Poirier was elected as a director in April 2024. Since January 2024, he has been an independent consultant for companies in the aerospace and defense sectors. From May to December 2023, he was Chief Financial Officer for SHL (Scandinavian Health Ltd.) Medical, a private company backed up by private equity operating as a leading solutions provider in the design, development, and manufacturing of advanced medical delivery devices such as autoinjectors and pen injectors. From April 2021 to December 2022, he was Chief Financial Officer of GKN Aerospace, one of the world’s leading multi-technology Tier 1 aerospace suppliers, serving 90% of the world’s aircraft and engine manufacturers. From 2019 to 2021, he was Chief Financial Officer of Nobel Biocare Systems, a premium dental implant leader whose portfolio also included restorative solutions, dentist hardware equipment and digital treatment technologies. Prior thereto, he worked for Honeywell mostly in the Aerospace division, as well as in the Homes & Building Technologies and Specialty Materials), l’Oréal and Arthur Andersen, among others. He earned a Bachelor (Mathematics) from Lycée Victor Duruy and a Master of Management in Corporate Finance from EDHEC Business School in France. Because of his strong financial background and ties to the defense industry, the Company believes that he is highly qualified to serve on the Board.
Dr. Angus McFadzean became a director on July 1, 2024. He is one of the co-founders of the Company’s Marine Technology Business and has been affiliated with the Company in various capacities since its inception in 1994. From 2013 until his retirement in May 2024, Dr. McFadzean was the Research and Development Director of the Company’s Marine Technology subsidiary, where, among other things, he was responsible for overseeing and managing the Marine Technology Business’ R&D Program including developments relating to the Echoscope® and DAVD. He was also responsible for the Company’s Cyber Security Management Program. Dr. McFadzean holds a master’s degree in electrical and electronic engineering as well as a Ph.D. from Heriot-Watt University in Edinburgh, Scotland. Because of his deep knowledge of the Company’s technology, the Company believes that he is highly qualified to serve on the Board.
Family Relationships
None of our Directors are related by blood, marriage, or adoption to any other Director, executive officer, or other key employees.
Board Leadership Structure
The Board of Directors is currently chaired by the Chief Executive Officer of the Company, Annmarie Gayle. The Company believes that combining the positions of Chief Executive Officer and Chairman of the Board of Directors helps to ensure that the Board of Directors and management act with a common purpose. Integrating the positions of Chief Executive Officer and Chairman can provide a clear chain of command to execute the Company’s strategic initiatives. The Company also believes that it is advantageous to have a chairman with an extensive history with, and knowledge of, the Company. Notwithstanding the combined role of Chief Executive Officer and Chairman, key strategic initiatives and decisions involving the Company are discussed and approved by the entire Board of Directors. The Company believes that the current leadership structure and processes maintain an effective oversight of management and independence of the Board of Directors as a whole without separate designation of a lead independent director. However, the Board of Directors will continue to monitor its functioning and will consider appropriate changes to ensure the effective independent function of the Board of Directors in its oversight responsibilities.
Independence of the Board of Directors and its Committees
After review of all relevant transactions or relationships between each director, or any of his or her family members, and the Company, its senior management and its Independent Registered Public Accounting Firm, the Board of Directors has determined that all the Company’s directors are independent within the meaning of the applicable NASDAQ listing standards, except Ms. Gayle, the Company’s Chairman and Chief Executive Officer. The Board of Directors met 4 times and acted by unanimous written consent 4 times during the fiscal year ended October 31, 2024. Each member of the Board of Directors attended all meetings of the Board of Directors held in the last fiscal year during the period for which he or she was a director and of the meetings of the committees on which he or she served in the last fiscal year during the period for which he or she was a committee member.
The Board of Directors has three committees: the Audit Committee, the Compensation Committee and the Nominating Committee. Below is a description of each committee of the Board of Directors. The Board of Directors has determined that each member of each committee meets the applicable rules and regulations regarding “independence” and that each member is free of any relationship that would interfere with his or her individual exercise of independent judgment with regard to the Company.
Audit Committee
The Audit Committee of the Board of Directors oversees the Company’s corporate accounting and financial reporting process. For this purpose, the Audit Committee performs several functions. The Audit Committee, among other things: evaluates the performance, and assesses the qualifications, of the Independent Registered Public Accounting Firm; determines and pre-approves the engagement of the Independent Registered Public Accounting Firm to perform all proposed audit, review and attest services; reviews and pre-approves the retention of the Independent Registered Public Accounting Firm to perform any proposed, permissible non-audit services; determines whether to retain or terminate the existing Independent Registered Public Accounting Firm or to appoint and engage a new independent registered Public Accounting Firm for the ensuing year; confers with management and the Independent Registered Public Accounting Firm regarding the effectiveness of internal control over financial reporting; establishes procedures as required under applicable law, for the receipt, retention and treatment of complaints received by the Company regarding accounting, internal accounting controls or auditing matters and the confidential and anonymous submission by employees of concerns regarding questionable accounting or auditing matters; reviews the financial statements to be included in the Company’s Annual Report on Form 10-K and the Company’s periodic quarterly filings on Form 10-Q, recommends whether or not such financial statements should be so included; and discusses with management and the Independent Registered Public Accounting Firm the results of the annual audit and review of the Company’s quarterly financial statements.
The Audit Committee is currently composed of four outside directors: Michael Hamilton (Chairman), Robert Harcourt, Anthony Tata and Gwenaël Rouy-Poirier. The Audit Committee met four times during the fiscal year ended October 31, 2024. The Audit Committee Charter is available on the Company’s website, www.codaoctopusgroup.com.
The Board of Directors periodically reviews the NASDAQ listing standards’ definition of independence for Audit Committee members and has determined that all members of the Company’s Audit Committee are independent (as independence is currently defined in Rule 5605(c)(2)(A) of the NASDAQ listing standards and Rule 10A-3(b)(1) of the Securities Exchange Act, as amended). The Board of Directors has determined that Michael Hamilton qualifies as an “audit committee financial expert,” as defined in applicable SEC rules. The Board of Directors made a qualitative assessment of Mr. Hamilton’s level of knowledge and experience based on a number of factors, including his formal education and his service in executive capacities, having financial oversight responsibilities.
Compensation Committee
The Compensation Committee of the Board of Directors reviews, modifies and approves the overall compensation strategy and policies for the Company. The Compensation Committee, among other things, reviews and approves corporate performance goals and objectives relevant to the compensation of the Company’s officers; determines and approves the compensation and other terms of employment of the Company’s Chief Executive Officer; determines and approves the compensation and other terms of employment of the other officers of the Company; and administers the Company’s stock option and purchase plans, pension and profit sharing plans and other similar programs.
The Compensation Committee is composed of four outside directors: G. Tyler Runnels (Chairman), Robert Harcourt, Michael Hamilton and Gwenaël Rouy-Poirier. All members of the Compensation Committee are independent (as independence is currently defined in Rule 5605(a)(2) of the NASDAQ listing standards). The Compensation Committee met three times during the fiscal year ended October 31, 2024. The Compensation Committee Charter is available on the Company’s website at: www.codaoctopusgroup.com.
Compensation Committee Interlocks and Insider Participation
No member of our compensation committee has at any time been an employee of ours. None of our executive officers serves as a member of the board of directors or the compensation committee of any entity that has one or more executive officers serving as a member of our board of directors or compensation committee.
Nominating Committee
The Nominating Committee of the Board of Directors is responsible for, among other things, identifying, reviewing and evaluating candidates to serve as directors of the Company; reviewing, evaluating and considering incumbent directors; recommending to the Board of Directors candidates for election to the Board of Directors; making recommendations to the Board of Directors regarding the membership of the committees of the Board of Directors, and assessing the performance of the Board of Directors.
The Nominating and Governance Committee is currently composed of four outside directors: G. Tyler Runnels (Chair), Michael Hamilton, Robert Harcourt and Gwenaël Rouy-Poirier. All members of the Nominating Committee are independent (as independence is currently defined in Rule 5605(a)(2) of the NASDAQ listing standards). The Nominating Committee met three times during the fiscal year ended October 31, 2024. The Nominating Committee Charter is available on the Company’s website at www.codaoctopusgroup.com.
The Nominating Committee has not established any specific minimum qualifications that must be met for recommendation for a position on the Board of Directors. Instead, in considering candidates for director the Nominating Committee will generally consider all relevant factors, including among others the candidate’s applicable education, expertise and demonstrated excellence in his or her field, the usefulness of the expertise to the Company, the availability of the candidate to devote sufficient time and attention to the affairs of the Company, the candidate’s reputation for personal integrity and ethics and the candidate’s ability to exercise sound business judgment. Other relevant factors, including diversity, experience, and skills, will also be considered. Candidates for director are reviewed in the context of the existing membership of the Board of Directors (including the qualities and skills of the existing directors), the operating requirements of the Company and the long-term interests of its stockholders.
The Nominating Committee considers each director’s executive experience and his or her familiarity and experience with the various operational, scientific and/or financial aspects of managing companies in our industry.
With respect to diversity, the Nominating Committee seeks a diverse group of individuals who have executive leadership experience and a complementary mix of backgrounds and skills necessary to provide meaningful oversight of the Company’s activities. The Company meets the NASDAQ standards for diversity on the board of directors. The Nominating Committee annually reviews the Board’s composition in light of the Company’s changing requirements. The Nominating Committee uses the Board of Director’s network of contacts when compiling a list of potential director candidates and may also engage outside consultants. Pursuant to its charter, the Nominating Committee will consider, but not necessarily recommend to the Board of Directors, potential director candidates recommended by stockholders. All potential director candidates are evaluated based on the factors set forth above, and the Nominating Committee has established no special procedure for the consideration of director candidates recommended by stockholders.
Employment Agreements
Annmarie Gayle
Pursuant to the terms of an employment agreement dated March 16, 2017, the Company employs Ms. Gayle as its Chief Executive Officer on a full-time basis and a member of its Board of Directors. Effective July 1, 2019, Ms. Gayle’s annual salary is $305,000. She is also entitled to an annual performance bonus of up to $100,000, upon achieving certain targets that are to be defined on an annual basis. The agreement provides for 30 days of paid vacation in addition to public holidays observed in Denmark where she is resident.
The agreement has no definitive term and may be terminated upon twelve months’ prior written notice by Ms. Gayle. In the event that the Company terminates her at any time without cause, she is entitled to a payment equal to her annual salary as well as a separation bonus of $150,000. The Company may terminate the agreement for cause, immediately and without notice. Among others, “for cause” includes gross misconduct, a serious or repeated breach of the agreement and negligence and incompetence as reasonably determined by the Company’s Board. The agreement includes a 12-month non-compete and non-solicitation provision.
Blair Cunningham
Under the terms of an employment contract dated January 1, 2013, our wholly owned subsidiary Coda Octopus Products, Inc. employs Blair Cunningham as its Chief Executive Officer and President of Technology. On January 24, 2025, Mr. Cunningham’s annual salary was increased to $270,000 from 225,000, effective February 1, 2025. Mr. Cunningham is entitled to 25 vacation days in addition to any public holiday. The Company also makes a contribution to certain benefits such as 401(k), dental and medical cover.
The agreement may be terminated only upon twelve-month prior written notice without cause. The Company may terminate the agreement for cause, immediately and without notice. Among others, “for cause” includes gross misconduct, a serious or repeated breach of the agreement and negligence and incompetence as reasonably determined by the Company’s Board. The agreement includes an 18-month non-compete and non-solicitation provision.
Gayle Jardine
Under the terms of an employment contract dated September 2015, our wholly owned subsidiary Coda Octopus Products, Limited. employs Gayle Jardine as its European Finance Director. She is being paid an annual base salary of £82,000 (equivalent of $104,875). Mrs. Jardine is entitled to 25 vacation days in addition to any public holiday.
In February 2024, Mrs. Jardine was appointed as Interim Chief Financial Officer of the Company. As an inducement for assuming the additional duties as Interim CFO, she is paid an additional short-term incentive payment of £6,000 (approximately $7,674) for each month that she acted in such a capacity.
The total compensation package paid by the Company to Mrs. Jardine is $196,963.
The company may terminate the agreement by giving nine weeks prior written notice without cause.
Code of Ethics
We have adopted a code of ethics for all our employees, including our chief executive officer, principal financial officer and principal accounting officer or controller, and/or persons performing similar functions, which is available on our website, under the link entitled “Code of Ethics”.
Claw Back Policy
We have adopted a Claw Back Policy with effect from September 7, 2023. The Claw Back policy applies to Covered Executive of the Company and provide for the recovery of (i) Erroneously Awarded Compensation from Covered Executives, and (ii) Recoverable Amounts from Covered Executives. This Policy is designed to comply with Nasdaq Rule 5608 and with Section 10D and Rule 10D-1 of the Exchange Act.
ITEM 11. EXECUTIVE COMPENSATION
The Summary Compensation Table shows certain compensation information for services rendered for the fiscal years ended October 31, 2024, and 2023, by our executive officers. The following information includes the dollar value of base salaries, bonus awards, stock options grants and certain other compensation, if any, whether paid or deferred.
| Name and Principal Position | | Year | | Salary | | | Bonus | | | Restricted Stock Awards | | | Option Awards | | | * All Other Compensation | | | Total | |
| | | | | ($) | | | ($) | | | ($) | | | ($) | | | ($) | | | ($) | |
| Annmarie Gayle | | 2024 | | | 305,000 | | | | 100,000 | | | | -0- | | | | -0- | | | | | | | | 405,000 | |
| Chief Executive Officer | | 2023 | | | 305,000 | | | | 100,000 | | | | | | | | | | | | -0- | | | | 405,000 | |
| | | | | | | | | | | | | | | | | | | | | | | | | | | |
| Gayle Jardine** | | 2024 | | | 82,600 | | | | 71,622 | | | | -0- | | | | -0- | | | | 17,426 | | | | 171,648 | |
| Interim Chief Financial Officer | | 2023 | | | 95,204 | | | | 23,801 | | | | 20,275 | | | | -0- | | | | 32,922 | | | | 172,202 | |
| | | | | | | | | | | | | | | | | | | | | | | | | | | |
| Kevin Kane*** | | 2024 | | | 67,582 | | | | -0- | | | | -0- | | | | -0- | | | | 23,918 | | | | 91,500 | |
| Divisional Chief Executive Officer | | 2023 | | | 200,000 | | | | -0- | | | | -0- | | | | -0- | | | | 21,876 | | | | 221,876 | |
| | | | | | | | | | | | | | | | | | | | | | | | | | | |
| John Price | | 2024 | | | 52,198 | | | | -0- | | | | -0- | | | | -0- | | | | 26,737 | | | | 78,935 | |
| Chief Financial Officer**** | | | | | | | | | | | | | | | | | | | | | | | | | | |
| | | | | | | | | | | | | | | | | | | | | | | | | | | |
| Blair Cunningham | | 2024 | | | 225,000 | | | | 8,000 | | | | -0- | | | | -0- | | | | 32,932 | | | | 265,932 | |
| President of Technology | | 2023 | | | 225,000 | | | | 30,000 | | | | -0- | | | | -0- | | | | 21,854 | | | | 276,854 | |
*The amounts described in the category of “All Other Compensation” comprise Health, Dental, Vision, Short Term Disability, Long Term Disability and Accidental Death and Dismemberment insurance premiums which the Company contributed to the officers’ identified plan.
** Mrs. Gayle Jardine was appointed as Interim Chief Financial Officer of the Company in February 2024.
*** Mr. Kevin Kane vacated his role in March 2024.
**** Mr. John Price was Chief Financial Officer from November 27, 2023 until February 12, 2024.
Grants of restricted stock awards as of October 31, 2024
| Name | | Grant Date | | All other restricted
awards; number of
securities underlying
restricted stock awards | | | Exercise
or base price of
restricted stock awards | | | Grant date fair value
of restricted stock awards | |
| Gayle Jardine | | 5/3/2023 | | | 2,500 | | | | 8.11 | | | | 20,275 | |
Outstanding option awards as of October 31, 2024
| | | Option Awards | |
| Name | | Number of securities underlying unexercised
options exercisable | | | Number of securities underlying unexercised
options unexercisable | | | Exercise or base price of option swards | | | Option
expiration date |
| Gayle Jardine | | | 3,334 | | | | - | | | | 4.62 | | | 3/23/2025 |
Option exercises for October 31, 2024
None
DIRECTOR COMPENSATION
The following table sets forth the compensation paid to each of our directors (who are not also officers of the Company) for the fiscal year ended October 31, 2024, in connection with their services to the company. In accordance with the SEC’s rules, the table omits columns showing items that are not applicable. Except as set forth in the table, no other persons were paid any compensation for director services.
| Name | | Fees Earned
or Paid in
Cash ($) | | | Stock Awards
($) | | | Total
($) | |
| Michael Hamilton | | $ | 50,000 | | | $ | 15,000 | | | $ | 65,000 | |
| Mr. Gwenael Rouy-Poirier | | $ | 27,083 | | | $ | 50,000 | | | $ | 77,083 | |
| Dr. Angus McFadzean | | $ | 16,700 | | | $ | 40,000 | | | $ | 56,700 | |
| G. Tyler Runnels | | $ | 50,000 | | | $ | | | | $ | 50,000 | |
| Robert Harcourt | | $ | 50,000 | | | $ | | | | $ | 50,000 | |
| Anthony Tata | | $ | 50,000 | | | $ | | | | $ | 50,000 | |
Stock Incentive Plans
The Company has two active Stock Incentive Plans - 2017 Stock Incentive Plan and 2021 Stock Incentive Plan.
2017 Stock Incentive Plan
On December 6, 2017, the Board of Directors adopted the 2017 Stock Incentive Plan (the “2017 Plan”). The purpose of the Plan is to advance the interests of the Company and its stockholders by enabling the Company and its subsidiaries to attract and retain qualified individuals through opportunities for equity participation in the Company, and to reward those individuals who contribute to the Company’s achievement of its economic objectives. The Plan, which was adopted subject to stockholders’ approval, was approved by Stockholders at its meeting held on July 24, 2018.
The maximum number of shares of Common Stock that will be available for issuance under the Plan is 913,612. The shares available for issuance under the Plan may, at the election of the Committee, be either treasury shares or shares authorized but unissued, and, if treasury shares are used, all references in the Plan to the issuance of shares will, for corporate law purposes, be deemed to mean the transfer of shares from treasury.
The Plan is administered by the Compensation Committee of the Board of Directors which has the authority to determine all provisions of Incentive Awards as the Committee may deem necessary or desirable and as consistent with the terms of the Plan, including, without limitation, the following: (i) eligible recipients; (ii) the nature and extent of the Incentive Awards to be made to each Participant; (iii) the time or times when Incentive Awards will be granted; (iv) the duration of each Incentive Award; and (v) the restrictions and other conditions to which the payment or vesting of Incentive Awards may be subject.
During the fiscal year ended October 31, 2024, pursuant to the terms of the 2017 Plan, the Company granted 21,208 restricted stock awards for an aggregate share of common stock of 21,208 to various eligible individuals. During this period 15,000 restricted stock awards were forfeited, and 2,394 units were converted into Treasury Stock and a further 72,542 vested and were issued to the holders of these by the Company. During the fiscal year ended October 31, 2024, no options were exercised, awarded or forfeited. As a result, as of October 31, 2024, there were 366,486 shares available for future issuance under the 2017 Plan.
The Company also issued 5,250 shares of common stock to an external consultant for services rendered in the reporting period.
2021 Stock Incentive Plan
On July 12, 2021, the Board of Directors adopted the 2021 Stock Incentive Plan (the “2021 Plan”), which was approved by the Company’s stockholders at its meeting held on August 2, 2021. The 2021 Plan is identical to the 2017 Plan in all material respects, except that the number of shares available for issuance thereunder is 1,000,000.
During 2024 FY the Company issued a total of 77,792 shares of common stock.
Section 16(a) Beneficial Ownership Reporting Compliance
Under the Exchange Act, our directors, our executive officers, and any persons holding more than 10% of our common stock are required to report their ownership of the common stock and any changes in that ownership to the SEC. To our knowledge, based solely on our review of the copies of such reports received or written representations from certain reporting persons that no other reports were required, except as set forth below, we believe that during our fiscal year ended October 31, 2024, no reports relating to our securities required to be filed by current reporting persons were filed late.
We will continue monitoring Section 16 compliance by each of our directors and executive officers and will assist them where possible in their filing obligations.
ITEM 12. SECURITIES OWNERSHIP OF CERTAIN BENEFICIAL OWNERS AND MANAGEMENT AND RELATED STOCKHOLDER MATTERS
The following table sets forth information as of January 25, 2025, regarding the beneficial ownership of our Common Stock, based on information provided by (i) each of our executive officers and directors; (ii) all executive officers and directors as a group; and (iii) each person who is known by us to beneficially own more than 5% of the outstanding shares of our Common Stock. The percentage ownership in this table is based on 11,218,804 shares issued and outstanding as of January 25, 2025.
Unless otherwise indicated, we believe that all persons named in the following table have sole voting and investment power with respect to all shares of Common Stock that they beneficially own.
| Name and Address of Beneficial Owner (1) | | Amount and Nature of Beneficial Ownership of Common Stock | | | Percent of Common Stock | |
| Michael Hamilton | | | 5,533 | | | | * | |
| Annmarie Gayle (2) | | | 2,367,952 | | | | 21.1 | % |
| Gayle Jardine (3) | | | 6,333 | | | | * | |
| Blair Cunningham | | | 38,211 | | | | * | |
| Robert Harcourt | | | 6,273 | | | | * | |
| Anthony Tata | | | 6,273 | | | | * | |
| G. Tyler Runnels (4) | | | 875,685 | | | | 7.8 | % |
| Gwenael Rouy-Poirier (5) | | | -0- | | | | * | |
| Angus McFadzean (6) | | | 17,411 | | | | * | |
All Directors and Executive Officers as a Group (Nine persons) (2)(3)(4)(5)(6): | | | 3,323,671 | | | | 29.6 | % |
| | | | | | | | | |
Niels Sondergaard Carit Etlars Vej 17A 8700 Horsens Denmark | | | 2,241,581 | | | | 20 | % |
J. Steven Emerson (7) 1522 Ensley Avenue Los Angeles, CA 90024 | | | 1,301,232 | | | | 11.6 | % |
Bryan Ezralow (8) 23622 Calabasas Rd. Suite 200 Calabasas, CA 91302 | | | 1,073,120 | | | | 9.6 | % |
*) Less than 1%.
| 1) | Unless otherwise indicated, the address of all individuals and entities listed below is c/o Coda Octopus Group, Inc. 3300 S Hiawassee Rd, Suite 104-105, Orlando, Florida, 32835. |
| 2) | Consists of 95,038 shares held by Ms. Gayle and 2,241,581 shares beneficially owned by Ms. Gayle’s spouse, Niels Sondergaard. Ms. Gayle disclaims any beneficial ownership in those shares. |
| 3) | Includes 3,333 shares issuable upon exercise of currently exercisable options. |
| 4) | Includes 609,331 shares held by the G. Tyler Runnels and Jasmine Niklas Runnels TTEES of The Runnels Family Trust DTD 1-11-2000 of which Mr. Runnels is a trustee; 227,700 shares held by T.R. Winston; 24,368 shares held by TRW Capital Growth Fund, Ltd.; and 14,286 shares held by Pangaea Partners. The Company has been advised that Mr. Runnels has voting and dispositive power with respect to all of these shares. |
| 5) | Does not include 7,898 shares that will vest on April 15, 2025. |
| 6) | Includes 16,666 shares of common stock issuable upon exercise of currently exercisable options. Does not include 6,107 shares of common stock that vest on May 23, 2025. |
| 7) | Includes the following: 217,081 held by J. Steven Emerson IRA R/O II; 350,000 shares held by J. Steven Emerson Roth IRA; 49,328 shares held by Brian Emerson IRA; 310,928 shares held by Emerson Partners; 217,250 shares held by 1993 Emerson Family Trust; 8,286 shares held by the Alleghany Meadows IRA; 8,286 shares held by the Jill Meadows IRA; and 144,073 shares held by the Emerson family Foundation. The Company has been advised that Mr. Emerson has voting and dispositive power with respect to all of these shares. |
| 8) | Consists of 896,079 shares held by the Bryan Ezralow 1994 Trust u/t/d 12/22/1994; and 177,041 shares held by EZ MM&B Holdings, LLC. According to filings made with the SEC, Mr. Ezralow has voting and dispositive power with respect to these shares. |
ITEM 13. CERTAIN RELATIONSHIPS AND RELATED TRANSACTIONS, AND DIRECTOR INDEPENDENCE
None that are required to be reported herein.
ITEM 14. PRINCIPAL ACCOUNTANT FEES AND SERVICES
Audit Fees. The aggregate fees billed by Frazier & Deeter, LLC, our principal accountants, for professional services rendered for the audit and audit related services of the Company’s annual financial statements for the last two fiscal years and for the reviews of the financial statements included in the Company’s Quarterly reports on Form 10-Q during the last two fiscal years 2024 and 2023 were $361,125 and $381,987 respectively.
Tax Fees. The Company did not engage its principal accountants to render any tax services to the Company during the last two fiscal years.
All Other Fees. The Company did not engage its principal accountants to render services to the Company during the last two fiscal years, other than as reported above.
Prior to the Company’s engagement of its independent auditor, such engagement is approved by the Company’s Audit Committee. The services provided under this engagement may include audit services, audit-related services, tax services and other services. Pre-approval is generally provided for up to one year and any pre-approval is detailed as to the particular service or category of services and is generally subject to a specific budget. Pursuant to the Company’s Audit Committee Charter, the independent auditors and management are required to report to the Company’s audit committee at least quarterly regarding the extent of services provided by the independent auditors in accordance with this pre-approval, and the fees for the services performed to date. The audit committee may also pre-approve particular services on a case-by-case basis. All audit-related fees, tax fees and other fees incurred by the Company for the year ended October 31, 2024, were approved by the Company’s Audit Committee.
ITEM 15. EXHIBITS, FINANCIAL STATEMENT SCHEDULES
| Exhibit Number | | Description |
| 2.1 | | Plan and Agreement of Merger dated July 12, 2004 by and between Panda and Coda Octopus (1) |
| 3.1 | | Restated Certificate of Incorporation (2) |
| 3.2 | | By-Laws (1) |
| 10.30 | | Employment Contract dated January 1, 2013 between Coda Octopus Products, Inc. and Blair Cunningham (3) |
| 10.31 | | Employment Contract dated March 16, 2017 between the Company and Annmarie Gayle (4) |
| 10.32 | | 2017 Stock Incentive Plan (5) |
| 10.33 | | Employment Agreement dated May 7, 2021 between Coda Octopus Colmek, Inc and Kevin Kane (6) |
| 10.34 | | 2021 Stock Incentive Plan (7) |
| 10.35 | | Employment Agreement dated August 30, 2023, between the Company and John Price (8) |
| 10.36 | | Share Purchase Agreement dated October 29, 2024, between LG Motion and Others and Coda Octopus R&D Limited. |
| 14 | | Code of Ethics (9) |
| 23.1 | | Consent of Frazier & Deeter, LLC (filed herewith) |
| 31.1 | | Chief Executive Office and Interim Chief Financial Officer Certification |
| 32 | | Certificate Pursuant to 18 U.S.C Section 1350 |
| | | |
| 101.INS | | Inline XBRL Instance Document |
| 101.SCH | | Inline XBRL Taxonomy Extension Schema Document |
| 101.CAL | | Inline XBRL Taxonomy Extension Calculation Linkbase Document |
| 101.DEF | | Inline XBRL Taxonomy Extension Definition Linkbase Document |
| 101.LAB | | Inline XBRL Taxonomy Extension Label Linkbase Document |
| 101.PRE | | Inline XBRL Taxonomy Extension Presentation Linkbase Document |
| 104 | | Cover Page Interactive Data File (embedded within the Inline XBRL document) |
| (1) | | Incorporated by reference to the Company’s Registration Statement on Form SB-2 (SEC File No.143144) |
| (2) | | Incorporated by reference to the Company’s Registration Statement on Form 10. |
| (3) | | Incorporated by reference to the Company’s Annual Report on Form 10-KSB for the year ended October 31, 2010 |
| (4) | | Incorporated by reference to the Company’s Registration Statement on Form 10/A filed March 29,2017 |
| (5) | | Incorporated by reference to the Company’s Annual Report on Form 10 for the year ended October 31, 2017 |
| (6) | | Incorporated by reference to the Company’s Form 10-K for the year ended October 31, 2021, filed February 14, 2022 |
| (7) | | Incorporated by reference to the Company’s Definitive Statement filed August 2, 2021 |
| (8) | | Incorporated by reference to the Company’s Current Report on Form 8-K filed September 5, 2023 |
| (9) | | Incorporated by reference to the Company’s Form 10-K for the year ended October 31, 2017, filed January 30, 2018 |
SIGNATURES
Pursuant to the requirements of Section 13 or 15(d) of the Securities Exchange Act of 1934, as amended, the Registrant has duly caused this report to be signed on its behalf by the undersigned thereunto duly authorized.
| DATE: January 29, 2025 | CODA OCTOPUS GROUP, INC. |
| | |
| | /s/ Annmarie Gayle |
| | Chief Executive Officer |
POWER OF ATTORNEY
Each person whose signature appears below constitutes and appoints Annmarie Gayle, his or her true and lawful attorney-in-fact and agent, with full power of substitution and re-substitution, severally, for him or her and in his or her name, place and stead, in any and all capacities, to sign any and all amendments to this annual report on Form 10-K, and to file the same, with all exhibits thereto and other documents in connection therewith, with the Securities and Exchange Commission, granting unto said attorneys-in-fact and agents, and each of them, full power and authority to do and perform each and every act and thing requisite and necessary to be done in and about the premises, as fully to all intents and purposes as he/she might or could do in person, hereby ratifying and confirming all that said attorneys-in-fact and agents, or any of them or their or his or her substitute or substitutes, may lawfully do or cause to be done by virtue hereof. This power of attorney may be executed in counterparts.
Pursuant to the requirements of the Securities Exchange Act of 1934, this report has been signed below by the following persons on behalf of the registrant and in the capacities and on the dates indicated.
| Signature | | Title | | Date |
| | | | | |
| /s/ Annmarie Gayle | | Chief Executive Officer and Chairman | | January 29, 2025 |
| Annmarie Gayle | | (Principal Executive Officer) | | |
| | | | | |
| /s/ Gayle Jardine | | Interim Chief Financial Officer | | January 29, 2025 |
| Gayle Jardine | | (Principal Financial and Accounting Officer) | | |
| | | | | |
| /s/ Michael Hamilton | | Director | | January 29, 2025 |
| Michael Hamilton | | | | |
| | | | | |
| /s/ Robert Harcourt | | Director | | January 29, 2025 |
| Robert Harcourt | | | | |
| | | | | |
| /s/ Anthony Tata | | Director | | January 29, 2025 |
| Anthony Tata | | | | |
| | | | | |
| /s/ G. Tyler Runnels | | Director | | January 29, 2025 |
| G. Tyler Runnels | | | | |
| | | | | |
| /s/ Gwenael Rouy-Poirier | | Director | | January 29, 2025 |
| Gwenael Rouy-Poirier | | | | |
| | | | | |
| /s/ Angus McFadzean | | Director | | January 29, 2025 |
| Dr. Angus McFadzean | | | | |
CODA OCTOPUS GROUP, INC.
INDEX TO CONSOLIDATED FINANCIAL STATEMENTS
REPORT OF INDEPENDENT REGISTERED PUBLIC ACCOUNTING FIRM
To the Board of Directors and Stockholders of
Coda Octopus Group, Inc.
Opinion on the Consolidated Financial Statements
We have audited the accompanying consolidated balance sheets of Coda Octopus Group, Inc. and subsidiaries (the “Company”) as of October 31, 2024 and 2023, and related consolidated statements of income and comprehensive income, changes in stockholders’ equity, and cash flows for the years then ended, and the related notes (collectively referred to as the consolidated financial statements). In our opinion, the consolidated financial statements present fairly, in all material respects, the financial position of the Company as of October 31, 2024 and 2023, and the results of their operations and cash flows for the years then ended in conformity with accounting principles generally accepted in the United States of America.
Basis for Opinion
These consolidated financial statements are the responsibility of the Company’s management. Our responsibility is to express an opinion on the Company’s consolidated financial statements based on our audits. We are a public accounting firm registered with the Public Company Accounting Oversight Board (United States) (“PCAOB”) and are required to be independent with respect to the Company in accordance with the U.S. federal securities laws and the applicable rules and regulations of the Securities and Exchange Commission and the PCAOB.
We conducted our audits in accordance with the standards of the PCAOB. Those standards require that we plan and perform the audit to obtain reasonable assurance about whether the consolidated financial statements are free of material misstatement, whether due to error or fraud. The Company is not required to have, nor were we engaged to perform, an audit of its internal control over financial reporting. As part of our audits we are required to obtain an understanding of internal control over financial reporting but not for the purpose of expressing an opinion on the effectiveness of the Company’s internal control over financial reporting. Accordingly, we express no such opinion.
Our audits included performing procedures to assess the risks of material misstatement of the financial statements, whether due to error or fraud, and performing procedures that respond to those risks. Such procedures included examining, on a test basis, evidence regarding the amounts and disclosures in the consolidated financial statements. Our audits also included evaluating the accounting principles used and significant estimates made by management, as well as evaluating the overall presentation of the consolidated financial statements. We believe that our audits provide a reasonable basis for our opinion.
Critical Audit Matters
The critical audit matters communicated below are matters arising from the current period audit of the consolidated financial statements that were communicated or required to be communicated to the audit committee and that: (1) relate to accounts or disclosures that are material to the consolidated financial statements and (2) involved our especially challenging, subjective, or complex judgments. The communication of critical audit matters does not alter in any way our opinion on the consolidated financial statements, taken as a whole, and we are not, by communicating the critical audit matters below, providing separate opinions on the critical audit matters or on the accounts or disclosures to which they relate.
Valuation of Intangible Asset
As described in Note 7 to the consolidated financial statements, the Company acquired Precision Acoustics Limited (“PAL”), for a net purchase price of approximately $6.5 million. As part of its purchase price allocation, the Company determined approximately $2.9 million should be allocated to an acquired technology intangible asset.
We identified the Company’s valuation of the intangible asset as a critical audit matter because of the significant estimates and assumptions management used in the estimate of the preliminary acquisition date fair value, including forecasts of future revenues and expenses and the selection of the discount rates. Auditing management’s valuation methodologies and forecasts of future revenues and expenses as well as the selection of the discount rates involved a high degree of auditor judgment and increased audit effort, including the use of our valuation specialists, as changes in these assumptions could have a significant impact on the preliminary acquisition date fair value of the intangible asset.
Our audit procedures related to the Company’s estimate of the preliminary acquisition date fair value of the intangible asset included the following, among others:
| ● | We read the purchase agreements and full closing document binder to understand and evaluate the terms of the transaction to determine that the acquisition met the requirements of a business combination. |
| | | |
| ● | We evaluated the analysis of the initial allocation of the purchase price accounting as well as the determination of the balance sheet classification of the intangible asset. |
| | | |
| ● | We obtained the Company’s valuation expert report to gain an understanding of the processes and key assumptions for estimating the fair value of intangible asset. |
| | | |
| ● | We utilized our valuation specialists to evaluate the adequacy and appropriateness of the methodologies and assumptions, including the weighted-average cost of capital and the discount rate, used by the Company’s third-party valuation expert in developing the estimated fair value of the intangible asset. |
| | | |
| ● | We assessed the reasonableness of management’s cash flow forecasts based on historical results, revenue growth assumptions and expected inflation. |
| | | |
| ● | We performed independent calculations to test the reasonableness and mathematical accuracy of the fair value concluded on by the Company. |
| | | |
| ● | We evaluated the qualifications of the Company’s valuation expert based on credentials, reputation and experience. |
| | | |
| ● | We assessed the appropriateness of the disclosures in the consolidated financial statements. |
/s/ Frazier & Deeter, LLC
We have served as the Company’s auditor since 2014.
Atlanta, Georgia
January 29, 2025
CODA OCTOPUS GROUP, INC.
Consolidated Balance Sheets
October 31, 2024 and 2023
| | | 2024 | | | 2023 | |
| ASSETS | | | | | | | | |
| CURRENT ASSETS | | | | | | | | |
| | | | | | | | | |
| Cash and Cash Equivalents | | $ | 22,479,072 | | | $ | 24,448,841 | |
| Accounts Receivable | | | 3,493,463 | | | | 2,643,461 | |
| Inventory | | | 13,975,529 | | | | 11,685,525 | |
| Unbilled Receivables | | | 1,657,827 | | | | 894,251 | |
| Prepaid Expenses | | | 537,289 | | | | 181,383 | |
| Other Current Assets | | | 838,835 | | | | 1,034,626 | |
| | | | | | | | | |
| Total Current Assets | | | 42,982,015 | | | | 40,888,087 | |
| | | | | | | | | |
| FIXED ASSETS | | | | | | | | |
| Property and Equipment, net | | | 6,822,990 | | | | 6,873,320 | |
| Right of Use Assets | | | 413,171 | | | | - | |
| | | | | | | | | |
| Total Fixed Assets | | | 7,236,161 | | | | 6,873,320 | |
| | | | | | | | | |
| OTHER ASSETS | | | | | | | | |
| Goodwill | | | 3,639,334 | | | | 3,382,108 | |
| Intangible Assets, net | | | 3,687,034 | | | | 486,615 | |
| Deferred Tax Asset | | | - | | | | 211,386 | |
| | | | | | | | | |
| Total Other Assets | | | 7,326,368 | | | | 4,080,109 | |
| | | | | | | | | |
| Total Assets | | $ | 57,544,544 | | | $ | 51,841,516 | |
CODA OCTOPUS GROUP, INC.
Consolidated Balance Sheets (Continued)
October 31, 2024 and 2023
| | | 2024 | | | 2023 | |
| LIABILITIES AND STOCKHOLDERS’ EQUITY | | | | | | | | |
| CURRENT LIABILITIES | | | | | | | | |
| | | | | | | | | |
| Accounts Payable | | $ | 1,034,488 | | | $ | 1,308,201 | |
| Current portion of operating lease liabilities | | | 32,298 | | | | - | |
| Accrued Expenses and Other Current Liabilities | | | 1,604,596 | | | | 995,630 | |
| Deferred Revenue | | | 1,225,634 | | | | 975,537 | |
| | | | | | | | | |
| Total Current Liabilities | | | 3,897,016 | | | | 3,279,368 | |
| | | | | | | | | |
| LONG TERM LIABILITIES | | | | | | | | |
| Deferred Tax Liability, net | | | 82,011 | | | | - | |
| Non-current operating lease liabilities | | | 380,873 | | | | - | |
| Deferred Revenue, less current portion | | | 56,121 | | | | 133,382 | |
| | | | | | | | | |
| Total Long Term Liabilities | | | 519,005 | | | | 133,382 | |
| | | | | | | | | |
| Total Liabilities | | | 4,416,021 | | | | 3,412,750 | |
| | | | | | | | | |
| Commitments and contingencies | | | - | | | | - | |
| | | | | | | | | |
| STOCKHOLDERS’ EQUITY | | | | | | | | |
| | | | | | | | | |
| Common Stock, $.001 par value; 150,000,000 shares authorized, 11,195,487 issued and outstanding as of October 31, 2024 and 11,117,695 shares issued and outstanding as of October 31, 2023 | | | 11,195 | | | | 11,118 | |
| Preferred Stock $.001 par value; 5,000,000 shares authorized, zero issued and outstanding as of October 31, 2024 and 2023 | | | - | | | | - | |
| Treasury Stock | | | (61,933 | ) | | | (46,300 | ) |
| Additional Paid-in Capital | | | 63,096,583 | | | | 62,958,984 | |
| Accumulated Other Comprehensive Loss | | | (2,510,831 | ) | | | (3,442,549 | ) |
| Accumulated Deficit | | | (7,406,491 | ) | | | (11,052,487 | ) |
| | | | | | | | | |
| Total Stockholders’ Equity | | | 53,128,523 | | | | 48,428,766 | |
| | | | | | | | | |
| Total Liabilities and Stockholders’ Equity | | $ | 57,544,544 | | | $ | 51,841,516 | |
CODA OCTOPUS GROUP, INC.
Consolidated Statements of Income and Comprehensive Income
| | | | | | | |
| | | Year Ended October 31, | |
| | | 2024 | | | 2023 | |
| | | | | | | |
| Net Revenues | | $ | 20,316,161 | | | $ | 19,352,088 | |
| Cost of Revenues | | | 6,143,056 | | | | 6,321,033 | |
| | | | | | | | | |
| Gross Profit | | | 14,173,105 | | | | 13,031,055 | |
| | | | | | | | | |
| OPERATING EXPENSES | | | | | | | | |
| Research & Development | | | 2,242,429 | | | | 2,096,467 | |
| Selling, General & Administrative | | | 8,346,545 | | | | 8,195,036 | |
| | | | | | | | | |
| Total Operating Expenses | | | 10,588,974 | | | | 10,291,503 | |
| | | | | | | | | |
| INCOME FROM OPERATIONS | | | 3,584,131 | | | | 2,739,552 | |
| | | | | | | | | |
| OTHER INCOME | | | | | | | | |
| Other Income | | | 88,382 | | | | 39,146 | |
| Interest Income | | | 938,775 | | | | 642,530 | |
| | | | | | | | | |
| Total Other Income | | | 1,027,157 | | | | 681,676 | |
| | | | | | | | | |
| | | | | | | | | |
| INCOME TAX EXPENSE | | | | | | | | |
| Current Tax Expense | | | 713,670 | | | | 248,655 | |
| Deferred Tax Expense | | | 251,622 | | | | 48,424 | |
| | | | | | | | | |
| Total Income Tax Expense | | | 965,292 | | | | 297,079 | |
| | | | | | | | | |
| NET INCOME | | $ | 3,645,996 | | | $ | 3,124,149 | |
| | | | | | | | | |
| NET INCOME PER SHARE: | | | | | | | | |
| Basic | | $ | 0.33 | | | $ | 0.28 | |
| Diluted | | $ | 0.32 | | | $ | 0.28 | |
| | | | | | | | | |
| WEIGHTED AVERAGE SHARES: | | | | | | | | |
| Basic | | | 11,166,956 | | | | 11,131,469 | |
| Diluted | | | 11,290,327 | | | | 11,323,568 | |
| | | | | | | | | |
| NET INCOME | | $ | 3,645,996 | | | $ | 3,124,149 | |
| | | | | | | | | |
| Foreign Currency Translation Adjustment | | | 931,718 | | | | 1,294,575 | |
| | | | | | | | | |
| Total Other Comprehensive Income | | $ | 931,718 | | | $ | 1,294,575 | |
| | | | | | | | | |
| COMPREHENSIVE INCOME | | $ | 4,577,714 | | | $ | 4,418,724 | |
CODA OCTOPUS GROUP, INC.
Consolidated Statements of Changes in Stockholders’ Equity
For the Years Ended October 31, 2024 and 2023
| | | | | | | | | Additional | | | Other | | | | | | | | | | |
| | | Common Stock | | | Paid-in | | | Comprehensive | | | Accumulated | | | Treasury | | | | |
| | | Shares | | | Amount | | | Capital | | | Income (Loss) | | | Deficit | | | Stock | | | Total | |
| | | | | | | | | | | | | | | | | | | | | | |
| Balance, October 31, 2022 | | | 10,916,853 | | | $ | 10,918 | | | $ | 62,313,988 | | | $ | (4,737,124 | ) | | $ | (14,176,636 | ) | | $ | (28,337 | ) | | $ | 43,382,809 | |
| | | | | | | | | | | | | | | | | | | | | | | | | | | | | |
| Employee stock-based compensation | | | - | | | | - | | | | 645,196 | | | | - | | | | - | | | | - | | | | 645,196 | |
| Stock issued for options exercised and stock grants | | | 200,842 | | | | 200 | | | | (200 | ) | | | - | | | | - | | | | (17,963 | ) | | | (17,963 | ) |
| Foreign currency translation adjustment | | | - | | | | - | | | | - | | | | 1,294,575 | | | | - | | | | - | | | | 1,294,575 | |
| Net Income | | | - | | | | - | | | | - | | | | - | | | | 3,124,149 | | | | - | | | | 3,124,149 | |
| Balance, October 31, 2023 | | | 11,117,695 | | | $ | 11,118 | | | $ | 62,958,984 | | | $ | (3,442,549 | ) | | $ | (11,052,487 | ) | | $ | (46,300 | ) | | $ | 48,428,766 | |
| Balance | | | 11,117,695 | | | $ | 11,118 | | | $ | 62,958,984 | | | $ | (3,442,549 | ) | | $ | (11,052,487 | ) | | $ | (46,300 | ) | | $ | 48,428,766 | |
| | | | | | | | | | | | | | | | | | | | | | | | | | | | | |
| Employee stock-based compensation | | | - | | | | - | | | | 137,676 | | | | - | | | | - | | | | - | | | | 137,676 | |
| Stock issued for options exercised and stock grants | | | 77,792 | | | | 77 | | | | (77 | ) | | | - | | | | - | | | | (15,633 | ) | | | (15,633 | ) |
| Foreign currency translation adjustment | | | - | | | | - | | | | - | | | | 931,718 | | | | - | | | | - | | | | 931,718 | |
| Net Income | | | - | | | | - | | | | - | | | | - | | | | 3,645,996 | | | | - | | | | 3,645,996 | |
| Balance, October 31, 2024 | | | 11,195,487 | | | $ | 11,195 | | | $ | 63,096,583 | | | $ | (2,510,831 | ) | | $ | (7,406,491 | ) | | $ | (61,933 | ) | | $ | 53,128,523 | |
| Balance | | | 11,195,487 | | | $ | 11,195 | | | $ | 63,096,583 | | | $ | (2,510,831 | ) | | $ | (7,406,491 | ) | | $ | (61,933 | ) | | $ | 53,128,523 | |
CODA OCTOPUS GROUP, INC.
Consolidated Statements of Cash Flows
| | | | | | | |
| | | Year Ended October 31, | |
| | | 2024 | | | 2023 | |
| CASH FLOWS FROM OPERATING ACTIVITIES | | | | | | | | |
| Net income | | $ | 3,645,996 | | | $ | 3,124,149 | |
| Adjustments to reconcile net income to net cash provided by operating activities: | | | | | | | | |
| Depreciation of property and equipment | | | 710,059 | | | | 603,467 | |
| Amortization of intangible assets | | | 60,476 | | | | 64,063 | |
| Stock-based compensation | | | 137,676 | | | | 645,196 | |
| Deferred income taxes | | | 251,622 | | | | 48,726 | |
| Gain on sale of property and equipment | | | (33,907 | ) | | | - | |
| Allowance for credit loss | | | 119,405 | | | | - | |
| (Increase) decrease in operating assets, net of assets acquired | | | | | | | | |
| Accounts receivable | | | (506,120 | ) | | | 291,873 | |
| Inventory | | | (707,897 | ) | | | (1,287,108 | ) |
| Unbilled receivables | | | (758,537 | ) | | | (281,981 | ) |
| Prepaid expenses | | | (284,041 | ) | | | 68,836 | |
| Other current assets | | | 73,234 | | | | (330,516 | ) |
| (Decrease) increase in operating liabilities, net of liabilities assumed | | | | | | | | |
| Accounts payable and other current liabilities | | | 93,685 | | | | (613,239 | ) |
| Deferred revenue | | | (349,976 | ) | | | 56,410 | |
| Net Cash Provided by Operating Activities | | | 2,451,675 | | | | 2,389,876 | |
| CASH FLOWS FROM INVESTING ACTIVITIES | | | | | | | | |
| Purchases of property and equipment | | | (502,525 | ) | | | (2,021,948 | ) |
| Purchases of other intangible assets | | | (89,103 | ) | | | (108,392 | ) |
| Acquisitions, net of acquired cash | | | (4,605,285 | ) | | | - | |
| Proceeds from the sale of property and equipment | | | 775,821 | | | | 609,565 | |
| Net Cash Used in Investing Activities | | | (4,421,092 | ) | | | (1,520,775 | ) |
| CASH FLOWS FROM FINANCING ACTIVITIES | | | | | | | | |
| Purchase of treasury stock | | | (15,633 | ) | | | (17,963 | ) |
| Net Cash Used in Financing Activities | | | (15,633 | ) | | | (17,963 | ) |
| | | | | | | | | |
| EFFECT OF CURRENCY TRANSLATION ON CHANGES IN CASH AND CASH EQUIVALENTS | | | 15,281 | | | | 670,332 | |
| | | | | | | | | |
| NET (DECREASE) INCREASE IN CASH AND CASH EQUIVALENTS | | | (1,969,769 | ) | | | 1,521,470 | |
| | | | | | | | | |
| CASH AND CASH EQUIVALENTS AT THE BEGINNING OF THE PERIOD | | | 24,448,841 | | | | 22,927,371 | |
| | | | | | | | | |
| CASH AND CASH EQUIVALENTS AT THE END OF THE PERIOD | | $ | 22,479,072 | | | $ | 24,448,841 | |
| SUPPLEMENTAL CASH FLOW INFORMATION | | | | | | | | |
| Cash paid for taxes | | $ | 363,374 | | | $ | 1,406,562 | |
| Cash paid for interest | | | - | | | | - | |
CODA OCTOPUS GROUP, INC.
Notes to the Consolidated Financial Statements
October 31, 2024 and 2023
NOTE 1 – ORGANIZATION AND DESCRIPTION OF BUSINESS
Until October 29, 2024, Coda Octopus Group, Inc. (“Coda,” “the Company,” or “we”) operated two operating business units. These are the Marine Technology Business (“Products Business,” or “Products Segment”) and the Marine Engineering Business (“Services Business,” “Engineering Business” or “Services Segment”). On October 29, 2024, the Company acquired Precision Acoustics Limited (“PAL”). For Segment Reporting purposes this newly acquired business unit will be reported within our Products Segment.
The Marine Technology Business is an established supplier of underwater technologies and solutions, to the underwater/subsea market. Its products and solutions comprise both hardware and software for which it is the innovator, developer, manufacturer and distributor. It has key proprietary 3D/4D/5D/6D imaging sonar technology marketed under the name of Echoscope® and Echoscope PIPE® and diving technology marketed under the name of CodaOctopus® DAVD (Diver Augmented Vision Display). The Echoscope® sonar series is the only sonar that can generate multiple real time 3D images of moving objects underwater in zero visibility conditions. This business also launched the DAVD system in 2021 which emanated from the requirements of the Office of Naval Research as part of its Future Naval Requirements Program. The DAVD embeds inside of the diver Head up Display (HUD) a pair of transparent glasses which is used as the data hub for displaying real time data to the diver. It allows both the diver underwater and the dive supervisor on the surface to see the same data or underwater scene. In addition, by combining the DAVD with the Echoscope®, dive operations can be performed in zero visibility conditions. These conditions are a common barrier which impinges on the ability to perform these activities and therefore the DAVD combined with the Echoscope® is a real requirement for these operations.
The Engineering Business is an established sub-contractor to prime defense contractors and generally designs, engineers, manufactures and supplies proprietary sub-assemblies for incorporation into broader mission critical defense systems. These sub-assemblies are typically supplied for the life of the program. The Marine Engineering Business’ scope of services for these defense programs typically extends to concept, design, prototype, manufacture, and post-sale support. The manufacturing contracts for these sub-assemblies can run over many years and during this time they enjoy sole supplier status for these sub-assemblies which they supply into these programs.
On October 29, 2024, we acquired PAL, a company established under the laws of England. This Company is a recognized leader in the ultrasound and acoustic measurement field. Specializing in acoustic hydrophone design and innovative acoustic materials, they provide a comprehensive range of products and solutions, with a primary focus on medical imaging and Non-Destructive Testing (NDT). NDT is used to validate the viability of structures such as aircraft, ship hulls, wellheads and other subsea structures. Their expertise extends to working closely with national and global standard-setting bodies (such as the National Physical Laboratory of the UK), contributing to the establishment of the primary measurement standards in the industry. This business was acquired to gain access to their expertise and leverage this across the group including in the area of advancing the Echoscope® technology. We believe the addition of their expertise and capabilities positions the Group to qualify to compete for larger Defense contracts. PAL had no material income statement activity in the two days from the acquisition date to the end of the Company’s fiscal end on October 31, 2024. Therefore, there are no revenues or expenses relating to PAL recorded in the Company’s Consolidated Statements of Income and Comprehensive Income.
CODA OCTOPUS GROUP, INC.
Notes to the Consolidated Financial Statements
October 31, 2024 and 2023
The consolidated financial statements include the accounts of Coda Octopus Group, Inc. and its wholly owned domestic and foreign subsidiaries (except as disclosed, PAL is not included in the Company’s Consolidated Statements of Income and Comprehensive Income for the year ended October 31, 2024 as it had no material income statement activity from the date of acquisition to the Company’s fiscal year end). All significant intercompany transactions and balances have been eliminated in the consolidated financial statements.
NOTE 2 - SUMMARY OF ACCOUNTING POLICIES
Basis of Presentation
The accompanying consolidated financial statements of the Company and its wholly owned subsidiaries have been prepared in accordance with generally accepted accounting principles (“GAAP”) in the United States (“U.S.”) and the applicable rules and regulations of the Securities and Exchange Commission (the “SEC”) and the Public Company Accounting Oversight Board (“PCAOB”).
The Company’s fiscal year ends on October 31. The Company employs a calendar month-end reporting period for its quarterly reporting.
Estimates
The preparation of consolidated financial statements in conformity with GAAP requires management to make estimates and assumptions that affect the amounts reported in the consolidated financial statements and accompanying notes. The accounting estimates and assumptions that require management’s most significant, challenging, and subjective judgment include estimates related to the percentage of completion method used to account for contracts including costs and earnings in excess of billings, billings in excess of costs and estimated earnings, the valuation of the deferred tax asset, the valuation of the assets purchased and liabilities assumed in our acquisition of PAL, and the valuation of goodwill. Actual results realized by the Company may differ from management’s estimates.
Reclassifications
Certain amounts included in the accompanying Consolidated Balance Sheets, Consolidated Statements of Income and Comprehensive Income, and Consolidated Statements of Cash Flows for the year ended October 31, 2023, have been reclassified to conform to the October 31, 2024, presentation.
Revenue Recognition
Revenue is recognized when control of the promised goods or services is transferred to a customer in an amount that reflects the consideration the Company expects to receive in exchange for those goods or services, which may include various combinations of goods and services which are generally capable of being distinct and accounted for as separate performance obligations. See “Note 4 – Revenue” for a detailed discussion on revenue and revenue recognition.
Cost of Revenue
Our Cost of Revenues includes the cost of materials and related direct costs. With respect to sales made through the Company’s sales agents distribution network, we include in our costs of revenues the commissions paid to agents for the specific sales that they make. All other sales-related expenses, including those related to unsuccessful bids, are included in selling, general and administrative costs. Sales commissions included as a component of Cost of Revenues were $740,507 and $826,719 for the years ended October 31, 2024 and 2023, respectively.
CODA OCTOPUS GROUP, INC.
Notes to the Consolidated Financial Statements
October 31, 2024 and 2023
Foreign Currency Translation
The Company’s operations are split between the United States, United Kingdom, Denmark, Netherlands, Australia and India. The foreign subsidiaries’ functional currencies are those of their respective local jurisdictions and are translated into U.S. dollars for the purpose of reporting the Company’s consolidated financial results. The translation of assets and liabilities into U.S. dollars for subsidiaries with a functional currency other than the U.S. dollar is performed using exchange rates in effect at the balance sheet date of October 31, 2024 and 2023 respectively. Stockholders’ equity, fixed assets and long-term investments are recorded at historical exchange rates. The translation of revenues and expenses into U.S. dollars for subsidiaries with a functional currency other than the U.S. dollar is performed using the average exchange rate for the respective reporting period. Gains or losses from cumulative translation adjustments, net of tax, are included as a component of accumulated other comprehensive loss in the Consolidated Balance Sheets. The Company records net foreign exchange transaction gains and losses in the Consolidated Statements of Income and Comprehensive Income.
For the years ended October 31, 2024, and 2023, the Company recorded an aggregate transaction loss of $287,939 and $190,073, respectively. The aggregate transaction losses were recorded as a component of Selling, General & Administrative (“SG&A”).
Treasury Stock
Repurchases by the Company of common stock awarded pursuant to the Company’s Stock Incentive Plan to provide our employees with funds to pay their tax obligations on such common stock are classified as treasury stock on our Consolidated Balance Sheet. We account for treasury stock under the cost method. When treasury stock is re-issued at a price higher than its cost, the difference is recorded as a component of additional paid-in-capital in our Consolidated Balance Sheet. When treasury stock is re-issued at a price lower than its cost, the difference is recorded as a reduction of retained earnings in our Consolidated Balance Sheet.
Segment Reporting
Operating segments are defined as components of an enterprise for which separate financial information is available and that is evaluated on a regular basis by the chief operating decision-maker (“CODM”) in deciding how to allocate resources to an individual segment and in assessing performance. The Company’s operations are organized into two reportable segments: Products Segment (Marine Technology Business serving the subsea market and PAL, which sells other products (acoustic hydrophones and acoustic materials to a different market); and the Services Segment (Marine Engineering Business). The Company’s organizational structure is based on many factors that the CODM uses to evaluate, view and run the business operations, which include, but are not limited to, customer base and homogeneity of products and technology. The segments are based on this organizational structure and information reviewed by the Company’s CODM to evaluate segment results. The CODM uses several metrics to evaluate the performance of the overall business, including revenue and earnings from operations, and uses these results to allocate resources to each of the segments.
Cash and Cash Equivalents
The Company considers all highly liquid investments with an original maturity of three months or less at the time of purchase to be cash equivalents. Cash and cash equivalents are maintained with various financial institutions. As of October 31, 2024, approximately $21.0 million may be in excess of federal deposit insurance limits.
CODA OCTOPUS GROUP, INC.
Notes to the Consolidated Financial Statements
October 31, 2024 and 2023
Financial Instruments
Financial instruments that potentially subject the Company to significant concentrations of credit risk consist principally of cash, accounts receivable, trade and other payables, and deferred revenue. The carrying amounts of the Company’s cash equivalents, accounts receivables, unbilled receivables, accounts payables, accrued liabilities and deferred revenue, as reflected in the consolidated financial statements approximate fair value due to the short-term maturity of these items. Fair value is defined as the price that would be received to sell an asset or paid to transfer a liability in an orderly transaction between market participants at the measurement date. The long-term deferred revenue approximates its carrying amounts as assessed by management. The Company’s financial instruments are exposed to certain financial risks, primarily concentration risk. Concentration risk is the risk of financial loss to the Company if the counterparty to a financial instrument fails to meet its contractual obligations and arises principally from the Company’s cash, cash equivalents and trade receivables. The carrying amount of the financial assets represents the maximum credit exposure. The Company limits its exposure to concentration risk on cash by placing these financial instruments with high-credit, quality financial institutions and only investing in liquid, investment grade securities. The Company’s bank deposits are held with financial institutions both in and outside the United States. At times, such amounts may be in excess of applicable government mandated insurance limits. The Company has not experienced any losses in such accounts or lack of access to its cash. The Company’s accounts receivables are subject to potential concentrations of credit risk, since a significant part of the Company’s sales are to a small number of companies and, even though these are generally established businesses, market fluctuations may affect our customers’ ability to meet their obligations to us. Furthermore, trade disputes may result in impairment or delays in receivables.
Accounts Receivable
The timing of revenue recognition may differ from the timing of invoicing to customers. The Company records a receivable when revenue is recognized prior to cash collection.
Payment terms and conditions vary by contract type, location of customer and the products or services offered, although terms generally require payment from a customer within 30-60 days (depending on the type of customer) for our Products Business and between 45-60 days from our Services Business. When the timing of revenue recognition differs from the timing of cash collection, an evaluation is performed to determine whether the contract includes a significant financing component. Accounts Receivable were $3,493,463, $2,643,461 and $2,870,600 as of October 31, 2024, 2023 and 2022, respectively.
Allowance for Credit Losses
The allowance for credit losses, which includes the allowance for accounts receivable and unbilled accounts receivable, represents the Company’s best estimate of lifetime expected credit losses inherent in those financial assets. The Company’s lifetime expected credit losses are determined using relevant information about past events (including historical experience), current conditions, and reasonable and supportable forecasts that affect collectability. The Company monitors its credit exposure through ongoing credit evaluations of its customers’ financial condition and limits the amount of credit extended when deemed necessary. In addition, the Company performs routine credit management activities such as timely account reconciliations, dispute resolution, and payment confirmations. The Company may employ collection agencies and legal counsel to pursue recovery of defaulted receivables. The Allowance for Credit Losses was $119,405 for the year ended October 31, 2024, and $0 for the years ended October 31, 2023 and 2022, respectively.
Inventory
Inventories consist primarily of raw materials and finished goods and are stated at the lower of cost or net realizable value on an aggregate basis. Cost is computed using the average of actual cost, on a first-in, first-out basis. Adjustments to reduce the carrying amount of inventory to the lower of cost or net realizable value are made, if required, for excess or obsolete goods, which includes a review of, among other factors, demand requirements and market conditions. This valuation requires us to make judgments, based on currently available information, about the likely method of disposition, such as through sales to individual customers, returns of product to vendors, or liquidations, and expected recoverable values of each disposition category. These assumptions about the future disposition of inventory are inherently uncertain and changes in our estimates and assumptions may cause us to realize material write-downs in the future. In addition, we enter into supplier commitments for certain electronic device components and certain products. These commitments are based on forecasted customer demand. If we reduce these commitments, we may incur additional costs.
CODA OCTOPUS GROUP, INC.
Notes to the Consolidated Financial Statements
October 31, 2024 and 2023
Business Combinations
The Company accounts for business combinations using the acquisition method of accounting in accordance with ASC 805, “Business Combinations.” Identifiable assets acquired and liabilities assumed are recorded at their fair values on the acquisition date. The excess of the fair value of purchase consideration over the fair values of these identifiable assets and liabilities is recorded as goodwill. Acquisition-related costs are expensed as incurred. Upon acquisition, the accounts and results of operations are consolidated as of and subsequent to the acquisition date. When determining the fair values of assets acquired and liabilities assumed, management makes significant estimates and assumptions, especially with respect to intangible assets. The Company utilizes commonly accepted valuation techniques, such as the income, market and cost approaches, as appropriate, in establishing the fair value of intangible assets. Typically, key assumptions include projections of cash flows that arise from identifiable intangible assets of acquired businesses as well as discount rates based on an analysis of the weighted average cost of capital, adjusted for specific risks associated with the assets.
Goodwill and Intangible Assets
Goodwill and intangible assets consist principally of the excess of cost over the fair value of net assets acquired (i.e., goodwill), customer relationships, value of technology, non-compete agreements and licenses. Goodwill was allocated to our reporting units based on the original purchase price allocation. Goodwill is not amortized and is evaluated for impairment annually or more often if circumstances indicate impairment may exist. Customer relationships, non-compete agreements, value of technology, patents and licenses are being amortized on a straight-line basis over periods of 2 to 15 years. The Company amortizes its intangible assets using the straight-line method over their estimated period of benefit. We annually evaluate the recoverability of goodwill and intangible assets and carefully consider events or circumstances that warrant revised estimates of useful lives or that indicate that impairment exists.
The goodwill impairment test is conducted once a year, or more frequently if necessary, and is used to identify potential impairment by comparing the fair value of the reporting unit with its carrying amount, including goodwill. If the fair value of the reporting units, which is based on future discounted cash flows, exceeds the carrying amount, goodwill is not considered impaired. If the fair value of the reporting unit is less than its carrying amount, goodwill is impaired in the amount of the difference between the higher carrying amount and the fair value of the reporting unit. The Company has adopted Accounting Standards Codification 2017 – 04, Simplifying the Test for Goodwill Impairment, which permits the Company to impair the difference between the carrying amount in excess of the fair value of the reporting unit as a reduction in goodwill.
At the end of each year, we evaluate goodwill on a separate reporting unit basis to assess recoverability, and impairments, if any, are recognized in earnings. An impairment loss would be recognized in an amount equal to the excess of the carrying amount of the reporting unit compared to the fair value of the reporting unit. To date, the Company has not had any goodwill impairments.
Finite-lived intangible assets consist of acquired patents, customer relationships, value of technology and non-compete agreements resulting from business combinations. The Company’s intangible assets are amortized on a straight-line basis over their estimated useful lives, ranging from 2 to 15 years. The Company makes judgments about the recoverability of finite-lived intangible assets whenever facts and circumstances indicate that the useful life is shorter than originally estimated or that the carrying amount of assets may not be recoverable. If such facts and circumstances exist, the Company assesses recoverability by comparing the projected undiscounted net cash flows associated with the related asset or group of assets over their remaining lives against their respective carrying amounts. Impairments, if any, are based on the excess of the carrying amount over the fair value of those assets. If the useful life is shorter than originally estimated, the Company would accelerate the rate of amortization and amortize the remaining carrying value over the new shorter useful life. The Company evaluates the carrying value of indefinite-lived intangible assets on an annual basis, and an impairment charge would be recognized to the extent that the carrying amount of such assets exceeds their estimated fair value.
CODA OCTOPUS GROUP, INC.
Notes to the Consolidated Financial Statements
October 31, 2024 and 2023
Property and Equipment
Property and equipment are stated at cost less accumulated depreciation. Expenditures for minor replacements, maintenance and repairs which do not increase the useful lives of the property and equipment are charged to operations as incurred. Major additions and improvements are capitalized.
Depreciation and amortization are computed using the straight-line method over their estimated useful lives:
SCHEDULE OF ESTIMATED USEFUL LIVES OF PROPERTY AND EQUIPMENT
| Buildings | | | 50 years | |
| Office machinery and equipment | | | 3-5 years | |
| Rental assets | | | 3-7 years | |
| Furniture, fixtures, and improvements | | | 3-5 years | |
Depreciation expense is presented as a component of SG&A expense in the Consolidated Statements of Income and Comprehensive Income. Depreciation expense related to the Marine Technology Products Business “Rental Assets” used for generating rental income is allocated 70% to Cost of Goods Sold and the remaining 30% as a component of SG&A expense. For the years ended October 31, 2024 and 2023, our depreciation costs allocated to Cost of Sales for rental assets were $271,276 and $186,361, respectively.
Leases
We review our documents to determine if an arrangement is a lease or contains a lease at inception. Even though we own most of our property, we still may have a lease agreement for office and/or production facilities. The determination if these agreements are lease agreements does not require significant estimates or judgments on our part. Our leases may also contain non-lease components such as payments of maintenance, utilities, and taxes (“non-lease components”) which we account for separately as these non-lease components are readily determinable. At the commencement date of a lease, we recognize a liability to make lease payments and an asset representing the right to use the asset over the lease term. The lease liability is measured at the present value of the minimum rental payments discounted using our incremental borrowing rate over the lease term. The incremental borrowing rate is the rate of interest that we would have to pay to borrow on a fully collateralized basis over a similar term and amount equal to the lease payments in a similar economic environment at the time of lease initiation. We determine the incremental borrowing rate through discussion with our principal bank. The right-of-use asset is measured at cost, which includes the initial measurement of the lease liability and initial direct costs, net of lease incentives, if any.
The lease term used to measure right-of-use assets and lease liabilities may include renewal options which we deem are reasonably certain to be exercised. Operating lease costs are recognized on a straight-line basis over the lease term. Variable lease expense increases, based on indices that are fixed and included in the lease document, are included in the right-of-use asset and lease liability. Currently, we are only capitalizing one lease that we acquired in connection with the acquisition of PAL.
Our lease portfolio consists of one non-cancellable operating lease of office and production space that we assumed in our acquisition of PAL. This lease expires in March 2033. There was no operating lease payments included in our financial statements for this lease expense during the year ended October 31, 2024, although we did establish the right-of-use asset and lease liability in the fair value opening balance sheet of PAL.
CODA OCTOPUS GROUP, INC.
Notes to the Consolidated Financial Statements
October 31, 2024 and 2023
Other information related to operating leases were as follows (in $s, years for life and percentage for interest rate):
SCHEDULE OF OPERATING LEASES
| Description | | Year ended
October 31, 2024 | | | Year ended
October 31, 2023 | |
| Lease liability assumed at acquisition | | $ | 413,171 | | | | - | |
| Future minimum lease payments | | | 568,076 | | | | - | |
| Cash paid for amounts included in the measurement of lease liability | | | - | | | | - | |
| Remaining life of the lease in Years | | | 8.42 | | | | - | |
| Discount Rate | | | 6.75 | % | | | - | |
Impairment of Long-Lived Assets
Management reviews long-lived assets, including property and equipment, right of use assets and intangible assets, for possible impairment whenever events or changes in business circumstances indicate that the carrying amount of the assets may not be fully recoverable. Such events and changes may include: a significant decrease in market value, changes in asset use, negative industry or economic trends, and changes in the Company’s business strategy. The Company measures recoverability of these assets by comparing the carrying amounts to the future undiscounted cash flows that the assets or the asset group are expected to generate. If the carrying value of the assets is not recoverable, an impairment charge is recognized by discounting the undiscounted cash flow and determining the amount by which the carrying amount of the asset exceeds the fair value of the assets.
Research and Development
Research and development costs are comprised primarily of employee-related costs, stock-based compensation expense, engineering consulting expenses associated with new product and technology development, product commercialization, quality assurance and testing costs, as well as costs related to information technology, patent applications and examinations, materials, supplies, and an allocation of facilities costs. All research and development costs are expensed as they are incurred.
Stock-Based Compensation
The Company accounts for stock-option compensation expense in accordance with the authoritative guidance on stock-based payments. Under the provisions of the guidance, stock-option based compensation expense is measured at the grant date based on the fair value of the option using a Black-Scholes option pricing model and is recognized as expense on a straight-line basis over the requisite service period, which is generally the vesting period.
The authoritative guidance also requires that the Company measure and recognize stock-based compensation expense upon modification of the term of a stock award. The stock-based compensation expense for such modification is the sum of any unamortized expense of the award before modification and the modification expense. The modification expense is the incremental amount of the fair value of the award before the modification and the fair value of the award after the modification, measured on the date of modification. In the event the modification results in a longer requisite period than in the original award, the Company has elected to apply the pool method where the aggregate of the unamortized expense and the modification expense is amortized over the new requisite period on a straight-line basis. In addition, any forfeiture will be based on the original requisite period prior to the modification.
Calculating stock-based compensation expense requires the input of highly subjective assumptions, including the expected term of the stock-based awards, stock price volatility, and the pre-vesting option forfeiture rate. The Company estimates the expected life of options granted based on historical exercise patterns, which are believed to be representative of future behavior. The Company estimates the volatility of the Company’s common stock on the date of grant based on historical volatility. The assumptions used in calculating the fair value of stock-based awards represent the Company’s best estimates, but these estimates involve inherent uncertainties and the application of management judgment. As a result, if factors change and the Company uses different assumptions, its stock-based compensation expense could be materially different in the future. In addition, the Company is required to estimate the expected forfeiture rate and only recognize expense for those shares expected to vest. The Company estimates the forfeiture rate based on historical experience of its stock-based awards that are granted, exercised and cancelled. If the actual forfeiture rate is materially different from the estimate, stock-based compensation expense could be significantly different from what was recorded in the current period.
CODA OCTOPUS GROUP, INC.
Notes to the Consolidated Financial Statements
October 31, 2024 and 2023
The Company may grant restricted stock units (“RSUs”) to employees or consultants. RSU awards vest upon grant or fixed term, generally 36 months. The Company uses the closing trading price of its common stock on the date of RSUs vest as the fair value of awards of restricted stock units. Stock-based compensation from RSU awards is recognized on a straight-line basis over the RSU awards’ vesting period.
Income Taxes
The Company accounts for income taxes in accordance with Accounting Standards Codification 740, Income Taxes (ASC 740). Under ASC 740, deferred income tax assets and liabilities are recorded for the income tax effects of differences between the bases of assets and liabilities for financial reporting purposes and their bases for income tax reporting. The Company’s differences arise principally from the use of various accelerated and modified accelerated cost recovery systems for income tax purposes versus straight line depreciation used for book purposes and from the utilization of net operating loss carry-forwards.
Deferred tax assets and liabilities are the amounts by which the Company’s future income taxes are expected to be impacted by these differences as they reverse. Deferred tax assets are based on differences that are expected to decrease future income taxes as they reverse. Correspondingly, deferred tax liabilities are based on differences that are expected to increase future income taxes as they reverse. Note 11 Income Taxes discloses the amounts of deferred tax assets and liabilities and presents the impact of significant differences between financial reporting income and taxable income.
For income tax purposes, the Company uses the percentage of completion method of recognizing revenues on long-term contracts which is consistent with the Company’s financial reporting under GAAP.
From time to time, the Company engages in transactions in which the tax consequences may be subject to uncertainty. Significant judgment is required in assessing and estimating the tax consequences of these transactions. Accruals for unrecognized tax benefit liabilities, which represent the difference between a tax position taken or expected to be taken in a tax return and the benefit recognized for financial reporting purposes, are recorded when the Company believes it is not more-likely-than-not that the tax position will be sustained on examination by the taxing authorities based on the technical merits of the position. Adjustments to unrecognized tax benefits are recognized when facts and circumstances change, such as the closing of a tax audit, notice of an assessment by a taxing authority or the refinement of an estimate. Income tax benefit includes the effects of adjustments to unrecognized tax benefits, as well as any related interest and penalties. The Company currently does not have any uncertain tax positions.
Comprehensive Income
Comprehensive income is defined to include all changes in equity except those resulting from investments by owners and distributions to owners. Comprehensive income includes gains and losses on foreign currency translation adjustments and is included as a component of stockholders’ equity.
CODA OCTOPUS GROUP, INC.
Notes to the Consolidated Financial Statements
October 31, 2024 and 2023
Advertising
Advertising costs are expenses as incurred and are presented as a component of SG&A expense in the Consolidated Statements of Income and Comprehensive Income. Advertising expenses for the years ended October 31, 2024 and 2023, were $2,732 and $0 respectively.
Contingencies
From time to time, the Company may be involved in legal and administrative proceedings and claims of various types. The Company records liability in its consolidated financial statements for these matters when a loss is known or considered probable, and the amount can be reasonably estimated. Management reviews these estimates in each accounting period as additional information becomes known and adjusts the loss provision when appropriate. If the loss is not probable or cannot be reasonably estimated, a liability is not recorded in the consolidated financial statements. If a loss is probable but the amount of loss cannot be reasonably estimated, the Company discloses the loss contingency and an estimate of possible loss or range of loss (unless such an estimate cannot be made). The Company does not recognize gain contingencies until they are realized. Legal costs incurred in connection with loss contingencies are expensed as incurred. The Company currently does not have any loss contingencies.
NOTE 3 – RECENT ACCOUNTING PRONOUNCEMENTS
Accounting Pronouncements to be Adopted
In October 2023, the FASB issued ASU 2023-07, Segment Reporting (Topic 280): Improvements to Reportable Segment Disclosures. ASU 2023-07 will affect how we report segment information, starting with our Form 10-K for the year ended October 31, 2025, and our quarterly reports on Form 10-Q starting with our quarterly report for the quarter ended January 31, 2026. The ASU requires that we provide disclosures of significant segment expenses and other segment items that are regularly provided to our CODM and included in each reported measure of segment profit or loss. We will also have to disclose other segment items by reportable segment (i.e., the difference between reported segment revenues less the significant segment expenses (which are disclosed) less reported segment profit or loss). We will identify the CODM and their position within the company and details about the information that they regularly review to make capital allocation and other operating decisions about each segment, as well as an explanation of how the CODM uses the reported measures and other disclosures. The information needed for these disclosures is available, but we will need to determine the best way to provide that information for these required segment disclosures.
In December 2023, the FASB issued Accounting Standards Update 2023-09 entitled Improvements to Income Tax Disclosures (ASU 2023-09), which is primarily applicable to public companies and requires a significant expansion of the granularity of the income tax rate reconciliation as well as an expansion of other income tax disclosures. The majority of the disclosures will only be made on an annual basis, although there is a modest expansion of required quarterly income tax disclosures. The amendments in ASU 2023-09 require disclosure of specific income tax categories in the statutory to effective rate reconciliation and provide additional information for reconciling items that meet a quantitative threshold (if the effect of those reconciling items is equal to or greater than 5 percent of the amount computed by multiplying pretax income (or loss) by the applicable statutory income tax rate. There are also additional disclosures related to taxes paid to local jurisdictions, and to income taxes paid. This information is currently available to the Company but was not a required disclosure. The Company expects to adopt ASU 2023-09 on November 1, 2025.
CODA OCTOPUS GROUP, INC.
Notes to the Consolidated Financial Statements
October 31, 2024 and 2023
In March 2024, the FASB issued Accounting Standards Update 2024-01 entitled Scope Application of Profits Interest and Similar Awards (ASU 2024-01) to improve GAAP by adding an illustrative example to demonstrate how an entity should apply the scope guidance to determine whether profits interest and similar awards should be accounted for in accordance with FASB ASC 718, Compensation–Stock Compensation. While profits interest is not defined in GAAP, those interests are differentiated from capital interests held by investors that provide those holders with rights to the existing net assets in a partnership in a partnership or similar entity. The Company does not expect ASU 2024-01 to have any effect since the Company does not presently issue profits interest awards.
In November 2024, the FASB issued Accounting Standards Update 2024-03 entitled–Reporting Comprehensive Income–Expense Disaggregation Disclosures, Disaggregation of Income Statement Expense (ASU 2024-03). The FASB issued ASU 24-03 to improve the disclosure about a public business entity’s expense and to address requests from investors for more detailed information about the types of expenses (including purchases of inventory, employee compensation, depreciation, amortization and depletion) included in commonly presented expense captions (such as cost of sales, SG&A and research and development. This is a disclosure-only standard and the Company expects to adopt ASU 2024-03 on November 1, 2026. There is currently a Proposed Accounting Standards Update that would, if adopted, accelerate the effective date of this standard by one year. If that Proposed standard is adopted, we would expect to adopt ASU 2024-03 on November 1, 2025.
NOTE 4 – REVENUE
Revenue Recognition
The Company recognizes revenue under the Financial Accounting Standards Board’s Topic 606, Revenue from Contracts with Customers (“Topic 606”).
Topic 606 has established a five-step process to determine the amount of revenue to record from contracts with customers. The five steps are:
| | ● | Determine if we have a contract with a customer; |
| | | |
| | ● | Determine the performance obligations in that contract; |
| | | |
| | ● | Determine the transaction price; |
| | | |
| | ● | Allocate the transaction price to the performance obligations; and |
| | | |
| | ● | Determine when to recognize revenue. |
Revenues are earned under formal contracts with our customers and are derived from both sales and rental of underwater technologies and equipment for real time 3D imaging, mapping, defense, and survey applications and from the engineering services which we provide primarily to prime defense contractors. Our contracts do not include the possibility for additional contingent consideration so that our determination of the contract price does not involve having to consider potential additional variable consideration. Our sales do not include a right of return by the customer.
For the Marine Technology Business, all of our products are sold on a stand-alone basis and those market prices are evidence of the value of the products. To the extent that we also provide services (e.g., installation, training, post-sales technical support etc.), those services are either included as part of the product or are subject to written contracts based on the stand-alone value of those services. Revenue from the sales of services is recognized when those services have been provided to the customer and evidence of the provision of those services exists.
CODA OCTOPUS GROUP, INC.
Notes to the Consolidated Financial Statements
October 31, 2024 and 2023
Revenue derived from either our subscription package offerings or rental of our equipment is recognized when performance obligations are met, in particular, on a daily basis during the subscription or rental period.
For arrangements with multiple performance obligations, we recognize product revenue by allocating the transaction revenue to each performance obligation based on the relative fair value of each deliverable and recognize revenue when performance obligations are met including when equipment is delivered, and for rental of equipment, when installation and other services are performed.
Our contracts sometimes require customer payments in advance of revenue recognition and are recognized as revenue when the Company has fulfilled its obligations under the respective contracts. Until such time, we recognize this prepayment as deferred revenue.
For software license sales for which any services rendered are not considered distinct to the functionality of the software, we recognize revenue upon delivery of the software.
With respect to revenues related to our Services Business, there are contracts in place that specify the fixed hourly rate and other reimbursable costs to be billed based on material and direct labor hours incurred and, revenue is recognized on these contracts based on material and the direct labor hours incurred. Revenues from fixed-price contracts are recognized on the percentage-of-completion method, measured by the percentage of costs incurred (materials and direct labor hours) to date to estimated total services (materials and direct labor hours) for each contract. This method is used as we consider expenditures for direct materials and labor hours to be the best available measure of progress on these contracts.
On a quarterly basis, we examine all our fixed-price contracts to determine if there are any losses to be recognized during the period. Any such loss is recorded in the quarter in which the loss first becomes apparent based upon costs incurred to date and the estimated costs to complete as determined by experience from similar contracts. Variations from estimated contract performance could result in adjustments to operating results.
Recoverability of Deferred Costs
In accordance with Topic 606, we defer costs on projects for service revenue. Deferred costs consist primarily of incremental direct costs to customize and install systems, as defined in individual customer contracts, including costs to acquire hardware and software from third parties and payroll costs for our employees and other third parties. The pricing of these service contracts is intended to provide for the recovery of these types of deferred costs over the life of the contract.
We recognize such costs in accordance with our revenue recognition policy by contract. For revenue recognized under the percentage of completion method, costs are recognized as products are delivered or services are provided in accordance with the percentage of completion calculation. For revenue recognized over time, costs are recognized rateably over the term of the contract, commencing on the date of revenue recognition. At each quarterly balance sheet date, we review deferred costs, to ensure they are ultimately recoverable.
Any anticipated losses on uncompleted contracts are recognized when evidence indicates the estimated total cost of a contract exceeds its estimated total revenue.
CODA OCTOPUS GROUP, INC.
Notes to the Consolidated Financial Statements
October 31, 2024 and 2023
Other Revenue Disclosures
See Note 15 – “Disaggregation of Revenue” for a breakdown of revenues from external customers and cost of those revenues between our Product Segment and Services Segment including information on the split of revenues by geography.
Contracts in Progress (Unbilled Receivables and Deferred Revenue)
Unbilled Receivables includes earned revenue in excess of billings on incomplete contracts representing accumulated project expenses plus fees which have not been invoiced to customers as of the date of the balance sheet. The amount of unbilled contracts receivable may not exceed their net realizable value. Unbilled Receivables were $1,657,827, $894,251 and $602,115 as of October 31, 2024, 2023 and 2022, respectively.
Sales of equipment include a provision for warranty or through life support (TLS) services and is treated as deferred revenue, along with extended warranty sales or TLS, which may be purchased by customers. These amounts are amortized over the relevant warranty or TLS period (12 months is our standard warranty contract obligation or for TLS 24, 36 or 60 months) from the date of sale.
Deferred Revenue (current) includes paid customer invoices prior to delivery of the agreed service, customer prepaid support to be delivered within twelve months and provision for warranty services to be provided within twelve months. Deferred Revenue was $1,225,634 and $975,537 as of October 31, 2024, and 2023, respectively.
Deferred Revenue (current) consisted of the following as of October 31, 2024, 2023 and 2022:
SCHEDULE OF DEFERRED REVENUE
| | | 2024 | | | 2023 | | | 2022 | |
| | | | | | | | | | |
| Deferred Revenue | | $ | 670,339 | | | $ | 420,611 | | | $ | 430,962 | |
| Customer Technical Support Obligations | | | 275,347 | | | | 324,218 | | | | 283,369 | |
| Product Warranty | | | 279,948 | | | | 230,708 | | | | 229,238 | |
| Total Deferred Revenue (Current) | | $ | 1,225,634 | | | $ | 975,537 | | | $ | 943,569 | |
Deferred Revenue (current) includes customer prepaid support, TLS, to be delivered past the initial twelve months and provision for extended warranty services to be provided past the initial twelve months.
Deferred Revenue (non-current) was $56,121, $133,382 and $76,127 as of October 31, 2024, 2023 and 2022, respectively.
CODA OCTOPUS GROUP, INC.
Notes to the Consolidated Financial Statements
October 31, 2024 and 2023
NOTE 5 – FAIR VALUE
The Company follows the authoritative guidance for fair value measurement and the fair value option for financial assets and financial liabilities. The Company carries its financial instruments at fair value. Fair value is defined as an exchange price that would be received for an asset or paid to transfer a liability, or an exit price, in the principal or most advantageous market for the asset or liability in an orderly transaction between market participants on the measurement date. At October 31, 2024 and 2023, respectively, the Company’s financial assets and liabilities were in cash and cash equivalents. The cash equivalents are highly liquid investments with maturities of three months or less. Our recently acquired subsidiary, PAL, whose financial assets and liabilities were in cash and cash equivalents, follows the Company’s existing practice of keeping these assets in highly liquid investments with maturities of three- months or less.
The established fair value hierarchy requires an entity to maximize the use of observable inputs and minimize the use of unobservable inputs when measuring fair value. There are three levels of inputs that may be used to measure fair value:
| Level 1 | Quoted prices in active markets for identical assets. |
| Level 2 | Observable market-based inputs or unobservable inputs that are corroborated by market data. |
| Level 3 | Unobservable inputs that are supported by little or no market activity and that are significant to the fair value of the assets. Level 3 assets and liabilities include financial instruments whose value is determined using pricing models, discounted cash flow methodologies, or similar techniques, as well as instruments for which the determination of fair value requires significant management judgment or estimation. |
When applying fair value principles in the valuation of assets, the Company is required to maximize the use of quoted market prices and minimize the use of unobservable inputs. The Company calculates the fair value of its Level 1 and Level 2 instruments based on the exchange traded price of similar or identical instruments, where available, or based on other observable inputs.
There were no marketable securities required to be measured at fair value on a recurring basis as of October 31, 2024 and 2023.
CODA OCTOPUS GROUP, INC.
Notes to the Consolidated Financial Statements
October 31, 2024 and 2023
NOTE 6 – COMPOSITION OF CERTAIN FINANCIAL STATEMENT CAPTIONS
Certified Deposit Interest Bearing Accounts
The Company established certified deposit interest-bearing accounts with its current bankers HSBC NA and Jyske Bank in February 2023. These interest-bearing accounts are for rolling fixed short-term periods not exceeding 3 months and are classified in our financial statements as “cash equivalents”. The Company also maintains an interest-bearing deposit account in the UK that tracks the Bank of England base rate, which has no restrictions on access and has a current rate of 4.75%. The table below indicates the amounts which, at the date hereof, are held in certified deposit and unrestricted interest-bearing accounts, and interest earned in the period:
SCHEDULE OF INTEREST RATES AND AMOUNT HELD IN CERTIFIED DEPOSIT AND INTEREST BEARING ACCOUNTS
| Country | | Deposit October 31, 2024 | | | Interest October 31, 2024 | | |
Deposit October 31, 2023 | | | Interest October 31, 2023 | |
| | | | | | | | | | | | | |
| USA | | $ | 15,156,719 | | | $ | 823,816 | | | $ | 15,201,579 | | | $ | 486,756 | |
| UK | | | 764,659 | | | | 103,144 | | | | 1,516,641 | | | | 86,266 | |
| Denmark | | | - | | | | 11,815 | | | | 2,400,000 | | | | 69,508 | |
| | | | | | | | | | | | | | | | | |
| | | $ | 15,921,378 | | | $ | 938,775 | | | $ | 19,118,282 | | | $ | 642,530 | |
Inventory consisted of the following as of:
SCHEDULE OF COMPONENTS OF INVENTORY
| | | October 31, | | | October 31, | |
| | | 2024 | | | 2023 | |
| | | | | | | |
| Raw materials and parts | | $ | 10,368,350 | | | $ | 8,994,482 | |
| Work in progress | | | 193,062 | | | | 483,227 | |
| Finished goods | | | 3,340,464 | | | | 2,207,816 | |
| Stock in transit | | | 73,653 | | | | - | |
| Total Inventory | | $ | 13,975,529 | | | $ | 11,685,525 | |
CODA OCTOPUS GROUP, INC.
Notes to the Consolidated Financial Statements
October 31, 2024 and 2023
Other current assets consisted of the following as of:
SUMMARY OF OTHER CURRENT ASSETS
| | | October 31, | | | October 31, | |
| | | 2024 | | | 2023 | |
| | | | | | | |
| Deposits and other assets | | $ | 63,630 | | | $ | 23,081 | |
| Other US Tax Receivables/Prepaid Taxes | | | 240,909 | | | | 450,625 | |
| Employee Retention Credit Receivables | | | 212,300 | | | | 212,300 | |
| Other Foreign Tax Receivables | | | 321,996 | | | | 348,620 | |
| Total Other Current Assets | | $ | 838,835 | | | $ | 1,034,626 | |
Fixed assets consisted of the following as of:
SCHEDULE OF FIXED ASSETS
| | | October 31, | | | October 31, | |
| | | 2024 | | | 2023 | |
| | | | | | | |
| Buildings | | $ | 5,881,237 | | | $ | 6,386,705 | |
| Land | | | 200,000 | | | | 200,000 | |
| Office machinery and equipment | | | 1,872,693 | | | | 1,596,026 | |
| Rental assets | | | 2,784,921 | | | | 2,323,446 | |
| Furniture, fixtures and improvements | | | 1,549,965 | | | | 1,172,169 | |
| | | | | | | | |
| Totals | | | 12,288,816 | | | | 11,678,346 | |
| Less: accumulated depreciation | | | (5,465,826 | ) | | | (4,805,026 | ) |
Total Property and Equipment, net | | | 6,822,990 | | | | 6,873,320 | |
| Right of use assets | | | 413,171 | | | | - | |
| | | | | | | | | |
| Total Fixed Assets, net | | $ | 7,236,161 | | | $ | 6,873,320 | |
On January 16, 2024, the Company sold its flat located in Copenhagen, Denmark for a price of DKK 5,300,000 (equivalent of $771,807 at transaction date). Prior to the sale this was composed within our Fixed Assets – Property and Equipment. We realized a gain of $30,244 upon sale.
Depreciation expense for the years ended October 31, 2024 and 2023 was $710,059 and $603,467 respectively.
Property and equipment, net, by geographic areas were as follows:
SCHEDULE OF PROPERTY AND EQUIPMENT, NET, BY GEOGRAPHIC AREAS
| | | October 31, | | | October 31, | |
| | | 2024 | | | 2023 | |
| | | | | | | |
| USA | | $ | 1,743,840 | | | $ | 1,751,260 | |
| Europe | | | 5,079,150 | | | | 5,122,060 | |
| | | | | | | | | |
| Total Property and Equipment, net | | $ | 6,822,990 | | | $ | 6,873,320 | |
Accrued Expenses and Other Current Liabilities consisted of the following as of:
SCHEDULE OF ACCRUED EXPENSES AND OTHER CURRENT LIABILITIES
| | | October 31, | | | October 31, | |
| | | 2024 | | | 2023 | |
| | | | | | | |
| Accruals | | $ | 560,986 | | | $ | 384,880 | |
| Other Tax Payables | | | 924,735 | | | | 525,565 | |
| Employee Related | | | 118,875 | | | | 85,185 | |
| Total Accrued Expenses and Other Current Liabilities | | $ | 1,604,596 | | | $ | 995,630 | |
CODA OCTOPUS GROUP, INC.
Notes to the Consolidated Financial Statements
October 31, 2024 and 2023
Total Other Income, net consisted of the following for the year ended:
SCHEDULE OF OTHER INCOME
| | | October 31, | | | October 31, | |
| | | 2024 | | | 2023 | |
| | | | | | | |
| Grant Income | | $ | 34,422 | | | $ | - | |
| Other | | | 53,960 | | | | 39,146 | |
| Total Other Income | | | 88,382 | | | | 39,146 | |
| | | | | | | | | |
| Interest | | $ | 938,775 | | | | 642,530 | |
| | | | | | | | | |
| Total Other Income, net | | $ | 1,027,157 | | | $ | 681,676 | |
NOTE 7 – ACQUISITION OF PRECISION ACOUSTICS LIMITED
On October 29, 2024, the Company acquired all the issued and outstanding shares of PAL for $6,538,569 in cash. At the acquisition date, the Company had immediate access to PAL’s cash balance of $1,933,284, which resulted in a net cash outlay at the acquisition date of $4,605,285. The Company agreed to pay the sellers for all cash in PAL’s bank account on the date of its acquisition, which was in excess of the agreed working capital amount of $595,869 and, as part of the transaction, the Company paid the sellers $1,337,415 for the excess cash balance.
The Company acquired PAL to gain access to its expertise in acoustic and medical imaging technologies which we believe can be leveraged through development for use in the subsea market, the primary sector for the Marine Technology Business and more broadly to expand the Group’s collective capabilities in order to qualify to compete for larger Defense-related contracts. Prior to the acquisition, PAL was a non-key supplier to our Marine Technology Business, which purchased on average approximately $80,000 of acoustic materials from PAL. It expects to continue to purchase these materials, at a similar dollar level, from PAL in the future.
In addition to the cash paid at closing, the share purchase agreement provides for certain earn-out payments over a three-year period and which are conditional upon PAL meeting the defined targets (revenue and pre-tax) in each of the earn-out year. The potential earnout provision amounts are shown in the table below applying an exchange rate (from British Pound to USD) of $1.278973:
SCHEDULE OF POTENTIAL EARNOUT PROVISION AMOUNTS
| Earn Out | | 2025 FY | | 2026 FY | | 2027 FY |
| Revenue Target | | $ | 5,334,584 | | | $ | 5,867,914 | | | $ | 6,454,962 | |
| Pre-Tax Profit Target | | $ | 1,046,476 | | | $ | 1,295,597 | | | $ | 1,573,133 | |
| Earn Out Amount Payable based on Targets | | $ | 208,472 | | | $ | 418,223 | | | $ | 652,275 | |
Based on the projections the Company used, there would be no earnouts payable and, subsequently, no contingent liability for earnout payments has been recorded in the Company’s accounts. To the extent that the Company does not record a contingent liability for these payments, any amount actually earned under the earn out provisions would be expensed in the year the qualifying condition is met.
PAL had no material Income Statement activity in the two days from the acquisition to the Company’s fiscal year end. Therefore, the Company’s Income Statement in this Form 10-K for the year ended October 31, 2024, does not include any revenue or expenses relating to PAL.
In the event that the business combination between the Company and PAL had occurred at the beginning of the Company’s comparable annual reporting period, the unaudited supplemental pro-forma information concerning revenue and expenses for PAL (which have been translated from British Pound to USD using the exchange rate used by the Company for those reporting periods) is shown below:
SCHEDULE OF PROFORMA INFORMATION
| | | October 31, | | | October 31, | |
| | | 2024 | | | 2023 | |
| Net Revenue | | | | | | |
| Coda Octopus Group | | $ | 20,316,161 | | | $ | 19,352,088 | |
| Precision Acoustics | | | 4,942,389 | | | | 3,777,057 | |
| Combined Net Revenue | | | 25,258,550 | | | | 23,129,145 | |
| Net Revenue | | | 25,258,550 | | | | 23,129,145 | |
| Net Income | | | | | | | | |
| Amortization of acquired intangible assets, pro forma | | $ | (477,181) | | | $ | (477,181) |
| Coda Octopus Group | | | 3,645,996 | | | | 3,124,149 |
| Precision Acoustics | | | 483,776 | | | | 113,793 |
| Combined Net Income | | $ | 3,652,591 | | | $ | 2,760,761 |
| Net Income | | $ | 3,652,591 | | | $ | 2,760,761 |
Purchase Price Allocation
In accordance with the requirements of FASB ASU 805, Business Combinations, the acquisition of PAL was accounted for using the acquisition method of accounting. The Company determined the fair value of the PAL balance sheet as of October 29, 2024, the date of acquisition.
The Company has up to one-year from October 29, 2024, to make any measurement period adjustments to the fair value of the opening balance sheet.
The table below shows the fair value of the assets acquired and liabilities assumed in connection with the PAL acquisition.
SCHEDULE OF ASSETS ACQUIRED AND LIABILITIES ASSUMED IN ACQUISITION
| Description | | Amount | |
| Tangible assets and liabilities acquired | | | | |
| Cash (including excess cash amount purchased of $1,337,415) | | $ | 1,933,284 | |
| Accounts receivable | | | 698,595 | |
| Inventory | | | 980,594 | |
| Property, plant and equipment | | | 509,337 | |
| Right of Use Asset (Lease) | | | 417,881 | |
| Accounts payable | | | (362,305 | ) |
| Lease liability | | | (417,881 | ) |
| Deferred revenues | | | (498,422 | ) |
| Accruals and other liabilities | | | (151,532 | ) |
| Intangible assets and liabilities at fair value | | | | |
| Fair value of noncompete agreement | | | 224,637 | |
| Value of technology | | | 2,947,155 | |
| Expected value of earn out provision | | | - | |
| Goodwill | | | 257,226 | |
| Total purchase price | | $ | 6,538,569 | |
| Acquisition, net of acquired cash | | $ | 4,605,285 | |
PAL’s technology was valued using the multi-period excess earnings method related to the income approach since this is the main identifiable intangible asset. Significant inputs used to measure the fair value included estimates of projected revenue and costs associated with generating those revenues and a discount rate of 12.36%. The discount rate is a level 2 fair value measurement, and the other assumptions used in the determination of the opening value of the PAL balance sheet at fair value are level 3 inputs.
The fair value of the non-compete agreement was developed using the with and without income approach method.
Estimates of the potential loss of business resulting from certain employees leaving the business were made and compared to the value of the business assuming the employee did not leave during the four-year non-compete period. Revenue projections and related projected costs of revenue were made and discounted at a 12.36% discount rate. The discount rate is a level 2 fair value measurement, and the other assumptions used in the determination of the opening value of the PAL balance sheet at fair value are level 3 inputs.
CODA OCTOPUS GROUP, INC.
Notes to the Consolidated Financial Statements
October 31, 2024 and 2023
The Company did not record a liability related to the earn-out liability provision contained in the share purchase agreement because the forecast that the Company developed and used to determine the fair value of the intangible assets related to this acquisition indicated that no earn-out would be paid. In addition, historical PAL financial information indicated that PAL has never produced historical financial results that would lead the Company to believe that an earn-out payment would occur.
Goodwill represents the future economic benefits expected to arise from other intangible assets acquired that do not qualify for separate recognition, including an experienced workforce that will help accelerate product development and our go to market strategy, as well as expected future synergies generated by integrating PAL’s products with those in our existing platform. None of the goodwill is expected to be deductible for tax purposes.
We recorded as part of our SG&A expenses transaction related costs of $41,531, in the twelve-months ended October 31, 2024.
NOTE 8 – GOODWILL AND IDENTIFIED INTANGIBLE ASSETS
Intangibles consisted of the following as of:
SCHEDULE OF INTANGIBLE ASSETS
| | | | | October 31, 2024 | | | October 31, 2023 | |
| | | Average | | | | | | | | | | | | | | | | | | |
| Finite-lived | | Life | | Gross | | | Accumulated | | | | | | Gross | | | Accumulated | | | | |
| intangible assets | | (Years) | | Asset | | | Amortization | | | Net | | | Asset | | | Amortization | | | Net | |
| | | | | | | | | | | | | | | | | | | | | |
| Customer Relationships | | 10 | | $ | 919,503 | | | $ | (919,503 | ) | | $ | - | | | $ | 919,503 | | | $ | (906,422 | ) | | $ | 13,081 | |
| Non-Compete Agreements | | 4 | | | 423,548 | | | | (198,911 | ) | | | 224,637 | | | | 198,911 | | | | (198,911 | ) | | | - | |
| Value of Technology | | 7 | | | 2,947,155 | | | | - | | | | 2,947,155 | | | | - | | | | - | | | | - | |
| Patents | | 10 | | | 820,555 | | | | (305,313 | ) | | | 515,242 | | | | 581,739 | | | | (108,205 | ) | | | 473,534 | |
| Total intangible assets | | | | $ | 5,110,761 | | | $ | (1,423,727 | ) | | $ | 3,687,034 | | | $ | 1,700,153 | | | $ | (1,213,538 | ) | | $ | 486,615 | |
Estimated future annual amortization expenses of finite-lived assets as of October 31, 2024, is as follows:
SCHEDULE OF ESTIMATED FUTURE AMORTIZATION EXPENSES
| Years Ending October 31, | | Amount | |
| | | | |
| 2025 | | $ | 524,068 | |
| 2026 | | | 523,381 | |
| 2027 | | | 522,821 | |
| 2028 | | | 522,821 | |
| 2029 | | | 466,662 | |
| | | | | |
| Thereafter | | | 1,127,281 | |
| | | | | |
| Totals | | $ | 3,687,034 | |
Amortization of intangible assets for the years ended October 31, 2024, and 2023 was $60,476 and $64,063 respectively.
Goodwill consisted of the following as of:
SCHEDULE OF GOODWILL
| | | October 31, | | | October 31, | |
| | | 2024 | | | 2023 | |
| | | | | | | |
| Coda Octopus Colmek, Inc. | | $ | 2,038,669 | | | $ | 2,038,669 | |
| Coda Octopus Products, Ltd | | | 62,315 | | | | 62,315 | |
| Coda Octopus Martech, Ltd | | | 1,281,124 | | | | 1,281,124 | |
| Precision Acoustics Ltd | | | 257,226 | | | | - | |
| | | | | | | | | |
| Total Goodwill | | $ | 3,639,334 | | | $ | 3,382,108 | |
NOTE 9 – NET INCOME PER SHARE
The following table sets forth the computation of basic and fully diluted loss per common share for the years ended:
SCHEDULE OF COMPUTATION OF BASIC AND FULLY DILUTED LOSS PER COMMON SHARE
| Fiscal Period | | 2024 | | | 2023 | |
| Numerator: | | | | | | | | |
| Net Income | | $ | 3,645,996 | | | $ | 3,124,149 | |
| | | | | | | | | |
| Denominator: | | | | | | | | |
| Basic weighted average common shares outstanding | | | 11,166,956 | | | | 11,131,469 | |
| Unexercised portion of options and restricted stock awards | | | 123,371 | | | | 192,099 | |
| Diluted outstanding shares | | | 11,290,327 | | | | 11,323,568 | |
| | | | | | | | | |
| Net income per share | | | | | | | | |
| | | | | | | | | |
| Basic | | $ | 0.33 | | | $ | 0.28 | |
| Diluted | | $ | 0.32 | | | $ | 0.28 | |
CODA OCTOPUS GROUP, INC.
Notes to the Consolidated Financial Statements
October 31, 2024 and 2023
NOTE 10 – CAPITAL STOCK
Common Stock
2017 Stock Incentive Plan
On December 6, 2017, the Board of Directors adopted the 2017 Stock Incentive Plan (the “2017 Plan”). The purpose of the Plan is to advance the interests of the Company and its stockholders by enabling the Company and its subsidiaries to attract and retain qualified individuals through opportunities for equity participation in the Company, and to reward those individuals who contribute to the Company’s achievement of its economic objectives. The Plan was adopted subject to stockholders’ approval and was approved by Stockholders at the Company’s Annual General Meeting held on July 24, 2018.
The maximum number of shares of Common Stock available for issuance under the 2017 Plan is 913,612 shares. The shares available for issuance under the 2017 Plan may, at the election of the Compensation Committee, be either treasury shares or shares authorized but unissued, and, if treasury shares are used, all references in the 2017 Plan to the issuance of shares will, for corporate law purposes, be deemed to mean the transfer of shares from treasury.
2021 Stock Incentive Plan
On July 12, 2021, the Board of Directors adopted the 2021 Stock Incentive Plan (the “2021 Plan”). The 2021 Plan was approved by the Company’s stockholders at its Annual General Meeting held on September 14, 2021. The 2021 Plan is identical to the 2017 Plan in all material respects, except that the number of shares available for issuance thereunder is 1,000,000.
As of October 31, 2024, there were a total of 1,366,486 shares available for issuance under the 2017 and 2021 Plans.
A summary of stock options activity is as follows:
SCHEDULE OF STOCK OPTION ACTIVITY
| | | | | | Weighted | | | Weighted | | | | |
| | | Number of | | | Average | | | Average | | | | |
| | | Shares | | | Exercise | | | Remaining | | | Aggregate | |
| | | Subject | | | Price Per | | | Contractual | | | Intrinsic | |
| | | to Options | | | Share | | | Life (in years) | | | Value | |
| Balance at October 31, 2022 | | | 307,167 | | | | - | | | | | | | | | |
| Granted | | | - | | | | - | | | | | | | | | |
| Vested | | | - | | | | - | | | | | | | | | |
| Exercised | | | (199,496 | ) | | $ | 4.62 | | | | | | | | | |
| Forfeited or cancelled | | | (3,000 | ) | | $ | 6.23 | | | | | | | | | |
| Balance at October 31, 2023 | | | 104,671 | | | $ | 4.67 | | | | 3.40 | | | $ | 202,419 | |
| Granted | | | - | | | | - | | | | | | | | | |
| Vested | | | - | | | | - | | | | | | | | | |
| Exercised | | | - | | | | - | | | | | | | | | |
| Forfeited or cancelled | | | - | | | | - | | | | | | | | | |
| Balance at October 31, 2024 | | | 104,671 | | | $ | 4.67 | | | | 2.40 | | | $ | 202,419 | |
| Vested and expected to vest at October 31, 2024 | | | 104,671 | | | $ | 4.67 | | | | 2.40 | | | $ | 202,419 | |
| Exercisable at October 31, 2024 | | | 104,671 | | | $ | 4.67 | | | | 2.40 | | | $ | 202,419 | |
The following table summarizes information about stock options outstanding and exercisable under the Company’s Stock Option Plan at October 31, 2024:
SCHEDULE OF STOCK OPTIONS OUTSTANDING AND EXERCISABLE
| Options Outstanding | | | Options Exercisable | |
| | | | | | | | | | Weighted | | | | | | | | | | | | Weighted | |
| Range of | | | | | | Weighted | | | Average | | | | | | | | | Weighted | | | Average | |
| Exercise | | | | | | Average | | | Remaining | | | Range of | | | | | | Average | | | Remaining | |
Prices
per | | | Number | | | Exercise
Price Per | | | Contractual
Life | | | Exercise
Prices per | | | Number | | | Exercise
Price Per | | | Contractual
Life | |
| Share | | | Outstanding | | | Share | | | (in years) | | | Share | | | Exercisable | | | Share | | | (in years) | |
| $ | 4.62 | | | | 101,671 | | | $ | 4.62 | | | | 2.32 | | | $ | 4.62 | | | | 101,671 | | | $ | 4.62 | | | | 2.32 | |
| $ | 6.23 | | | | 3,000 | | | $ | 6.23 | | | | 2.85 | | | $ | 6.23 | | | | 3,000 | | | $ | 6.23 | | | | 2.85 | |
| | | | | | 104,671 | | | $ | 4.67 | | | | | | | | | | | | 104,671 | | | $ | 4.67 | | | | | |
Unamortized compensation expense in future years is $0.
CODA OCTOPUS GROUP, INC.
Notes to the Consolidated Financial Statements
October 31, 2024 and 2023
A summary of restricted stock award activity is as follows:
SCHEDULE OF RESTRICTED STOCK AWARDS
| | | Shares | | | Weighted Average Grant Date Fair Value | | | Non-Vested | | | Weighted Average Grant Date Fair Value | |
| | | | | | | | | | | | | |
| Outstanding at October 31, 2022 | | | 110,506 | | | $ | 8.10 | | | | 110,506 | | | $ | 8.10 | |
| | | | | | | | | | | | | | | | | |
| Granted | | | 100,428 | | | $ | 7.10 | | | | 98,546 | | | $ | 6.96 | |
| Vested | | | (108,568 | ) | | $ | 7.91 | | | | (108,568 | ) | | $ | 7.91 | |
| Treasury Stock | | | (1,932 | ) | | $ | 9.30 | | | | (1,932 | ) | | $ | 9.30 | |
| Forfeited or cancelled | | | (13,006 | ) | | $ | 5.77 | | | | (13,006 | ) | | $ | 5.77 | |
| | | | | | | | | | | | | | | | | |
| Outstanding at October 31, 2023 | | | 87,428 | | | $ | 7.04 | | | | 85,546 | | | $ | 7.04 | |
| | | | | | | | | | | | | | | | | |
| Granted | | | 21,208 | | | $ | 6.37 | | | | 21,208 | | | $ | 6.37 | |
| Vested | | | (72,542 | ) | | $ | 7.06 | | | | (70,660 | ) | | $ | 7.06 | |
| Treasury Stock | | | (2,394 | ) | | $ | 7.16 | | | | (2,394 | ) | | $ | 7.16 | |
| Forfeited or cancelled | | | (15,000 | ) | | $ | 7.39 | | | | (15,000 | ) | | $ | 7.39 | |
| | | | | | | | | | | | | | | | | |
| Outstanding at October 31, 2024 | | | 18,700 | | | $ | 6.42 | | | | 18,700 | | | $ | 6.42 | |
The aggregate intrinsic value in the table above represents the total pre-tax intrinsic value that option holders would have realized had all option holders exercised their options on the last trading day of fiscal years 2024 and 2023. The aggregate intrinsic value is the difference between the Company’s closing stock price on the last trading day of the fiscal year and the exercise price, multiplied by the number of in-the-money options (CODA: NASDAQ).
In certain situations, in 2024 and 2023, certain RSAs that vested were net share settled such that the Company withheld common shares with a value equivalent to the employees’ obligation for the applicable income and other employment taxes and remitted the cash to the appropriate taxing authorities. The total shares withheld were zero for 2024 and 109,154 for 2023 and were based on the value of the RSAs on their respective vesting dates as determined by the Company’s closing stock price. The Company has classified the withheld common shares as treasury stock and may issue these shares at a future date.
All stock options and restricted stock awards have been made pursuant to the 2017 Plan.
Total stock-based compensation expense from stock options and restricted stock awards was $137,676 and $645,196, respectively for the years ended October 31, 2024, and 2023. As of October 31, 2024, there was approximately $58,333 of total unrecognized stock-based compensation cost related to 18,700 unvested restricted stock awards.
Preferred Stock
Series A and Series C Preferred Stock
The Company is authorized to issue 5,000,000 shares of preferred stock with a par value of $0.001 per share. As of October 31, 2024, there were no shares of Preferred Stock issued or outstanding.
CODA OCTOPUS GROUP, INC.
Notes to the Consolidated Financial Statements
October 31, 2024 and 2023
NOTE 11 - INCOME TAXES
The Company provides for income taxes and the related accounts under the asset and liability method. Deferred tax assets and liabilities are determined based on the difference between the financial statement and tax bases of assets and liabilities using enacted tax rates and will be updated if the tax rate changes before the expected reversal dates. Valuation allowances are established when management determines it is more likely than not that some portion, or all, of the deferred tax assets will not be realized.
The provision (benefit) for income taxes comprises:
SCHEDULE OF PROVISION (BENEFIT) FOR INCOME TAXES
| | | October 31, | | | October 31, | |
| | | 2024 | | | 2023 | |
| | | | | | | |
| Current federal expense | | $ | 174,094 | | | $ | 264,955 | |
| Current state income tax expense | | | 53,147 | | | | 5,789 | |
| Foreign tax expense (benefit) | | | 486,429 | | | | (22,089 | ) |
| | | | | | | | | |
| Total current tax expense | | | 713,670 | | | | 248,655 | |
| | | | | | | | | |
| Deferred federal expense | | | 249,693 | | | | 14,941 | |
| Deferred state expense (benefit) | | | (11,585 | ) | | | 3,913 | |
| Deferred foreign tax expense | | | 13,514 | | | | 29,570 | |
| | | | | | | | | |
| Deferred tax expense | | | 251,622 | | | | 48,424 | |
| | | | | | | | | |
| Total Income Tax Expense | | $ | 965,292 | | | $ | 297,079 | |
CODA OCTOPUS GROUP, INC.
Notes to the Consolidated Financial Statements
October 31, 2024 and 2023
The expense for income taxes differed from the U.S. statutory rate due to the following:
SCHEDULE OF RECONCILIATION OF INCOME TAX BENEFIT
| | | October 31, | | | October 31, | |
| | | 2024 | | | 2023 | |
| | | | | | | |
| Statutory tax rate | | | 21.0 | % | | | 21.0 | % |
| R&D Relief | | | (8.8 | )% | | | (9.7 | )% |
| Change in valuation allowance | | | - | | | | (3.4 | )% |
| Foreign Tax expense | | | 7.5 | % | | | 2.1 | % |
| State Income Tax | | | 1.2 | % | | | (1.3 | )% |
| | | | | | | | | |
| Total | | | 20.9 | % | | | 8.7 | % |
Deferred income taxes reflect the net tax effects of temporary differences between the carrying amounts of assets and liabilities for financial reporting purposes and the amounts used for income tax purposes.
Significant components of the Company’s deferred tax assets and liabilities are as follows:
SCHEDULE OF COMPONENTS OF DEFERRED TAX ASSETS AND LIABILITIES
| | | October 31, | | | October 31, | |
| | | 2024 | | | 2023 | |
| Noncurrent deferred tax assets | | | | | | | | |
| Temporary differences | | | | | | | | |
| U.S. NOL carryforwards | | $ | - | | | $ | - | |
| Deferred Revenue | | | - | | | | - | |
| | | | | | | | | |
| Restricted Stock Awards | | | 42,441 | | | | 263,218 | |
| Book/Tax Depreciation | | | (7,666 | ) | | | (21,554 | ) |
| Foreign fixed assets | | | (213,484 | ) | | | (218,045 | ) |
| Foreign capital loss carryforwards | | | - | | | | 11,182 | |
| Foreign NOL carryforwards | | | 96,698 | | | | 176,585 | |
| | | | | | | | | |
| Total | | | (82,011 | ) | | | 211,386 | |
| | | | | | | | | |
| Valuation allowance | | | - | | | | - | |
| | | | | | | | | |
| Total Deferred Net (Liability) Asset | | $ | (82,011 | ) | | $ | 211,386 | |
As of October 31, 2024, we had no remaining U.S. federal net operating loss (NOL) carryforwards.
The Company’s tax jurisdictions are USA, UK, Denmark, India, and Australia (our India and Australian operations are currently dormant). As a result, the Company’ foreign derived income is subject to GILTI tax in the United States. The Company has elected to treat GILTI inclusions as period costs.
The Company has filed tax returns for federal, state, and foreign jurisdictions. The Company’s evaluation of uncertain tax matters was performed for the tax years ended October 31, 2024, and October 31, 2023. The Company has elected to retain its existing accounting policy with respect to the treatment of interest and penalties attributable to income taxes and continues to reflect interest and penalties attributable to income taxes, to the extent they arise, as a component of its income tax provision or benefit as well as its outstanding income tax assets and liabilities. The Company believes that its income tax positions and deductions would be sustained upon audit and does not anticipate any adjustments to result in a material change to its financial position.
The Company’s UK Operations, under the applicable UK tax rules, have certain carryforward trading losses (referred to in this Form 10-K disclosure as “UK NOLs”). Under the applicable UK tax rules, any trading tax losses incurred from 2017 up to and including the current fiscal year can be surrendered for group relief (between and among the Company’s “UK companies”) to offset or reduce current year tax liability relating to any of the UK companies. Any UK NOLs arising before 2017 in a UK company can only be used by the UK company to which it pertains (and cannot be used within the UK tax group). The benefit of these UK NOLs is available indefinitely unless the nature of the business with the tax benefit changes substantially. Under UK tax rules, the UK entities are also eligible for research and development (R&D) Tax Credit. The UK Marine Technology Business in any one financial year performs significant R&D work due to the nature of its business (researching and developing products and solutions) and typically receives R&D allowance. In the 2024 FY our UK R&D allowance was insufficient to completely eliminate tax liability and as such we have recorded an income tax provision for UK entities of $267,759 for 2024 FY, compared to $0 for 2023 FY, where we were able to offset all tax liability by applying our R&D allowance. Our UK Operations have the equivalent of $386,788 in NOL carryforwards which under the applicable rules can only be used by the entity in which the loss occurred and therefore is not available for the broader abatement of tax liability of the UK tax group. The new UK products business, PAL, also performs significant R&D work and prior to the acquisition, historically it benefited from UK R&D Tax Credit. PAL will also be included in our UK tax group and will be eligible, where applicable to use any available UK NOLs to offset tax obligation, if available
CODA OCTOPUS GROUP, INC.
Notes to the Consolidated Financial Statements
October 31, 2024 and 2023
NOTE 12 – LINE OF CREDIT
The Company entered into a $4,000,000 revolving line of credit facility with HSBC NA on November 27, 2019, with the interest rate established as the applicable prime rate. This revolving line of credit facility is subject to annual renewal and has been extended to November 2025. We have not utilized this line of credit and as a result the outstanding balance on the line of credit was $0 as of October 31, 2024 and 2023.
NOTE 13 – CONCENTRATIONS
Significant Customers
During the year ended October 31, 2024, the Company had one customer from whom it generated sales greater than 10% of net revenues. Revenues from this customer were $3,104,089, or 15.3% of net revenues during the period. Total accounts receivable from this customer as of October 31, 2024, was $294,149 or 8.1% of accounts receivable.
During the year ended October 31, 2023, the Company had two customers from whom it generated sales greater than 10% of net revenues. Revenues from these customers were $4,430,389, or 22.9% of net revenues during the period. Total accounts receivable from these customers as of October 31, 2023, was $173,930 or 6.6% of accounts receivable
NOTE 14 - EMPLOYEE BENEFIT PLANS
The Company’s U.S. subsidiaries maintain a 401(k)-retirement plan. The plan allows the Company to make matching contributions of 4% of employee compensation, subject to IRS contribution limits. U.S. employees who have at least six months of service with the Company are eligible. In addition, the Company’s UK subsidiaries operate statutory pension schemes which provide for the payment of certain contributions by the Company and the Employee. These schemes in the UK operate on a defined contribution money purchase basis and the contributions are charged to operations as they arise. Finally, the Company is obligated to provide pension funding according to the laws in which it operates including in both Denmark, Australia and India. The Company has an arrangement that fulfils this requirement. Costs related to the Company’s contribution to these employee benefit plans for the years ended October 31, 2024 and 2023 were $130,650 and $128,988, respectively
CODA OCTOPUS GROUP, INC.
Notes to the Consolidated Financial Statements
October 31, 2024 and 2023
NOTE 15 -SEGMENT ANALYSIS
We operate in two reportable segments, “Products Business” and “Service Business” which are managed separately based upon fundamental differences in their operations. Segment operating income is total segment revenue reduced by cost of revenues and operating expenses, Research and Development (“R&D”), and Selling, General & Administrative (“SG&A”) identifiable with the reporting business segment. Overheads include general corporate administrative costs. Up until October 29, 2024, the Products Segment was constituted by our Marine Technology Business. On October 29, 2024, we acquired an additional business unit within the Products Segment, PAL. For the purposes of this Note 15, PAL is excluded from the Consolidated Statements of Income and Comprehensive Income since this entity was acquired on October 29, 2024, and it had no material Income Statement activity in the two days from the acquisition date to the end of the Company’s fiscal end on October 31, 2024. However, the fair value of assets acquired, and liabilities assumed for PAL, have been included in our Consolidated Balance Sheet and in respect of the Segment information provided immediately below, PAL is included in the Supplemental Disclosure information in the table below but not in the income and expense statement.
The Company evaluates performance and resources based upon operating income.
There are inter-segment sales in the table below which have been eliminated from our financial statements. Inter-company sales are not included in our financial statements. For segment reporting purposes we have shown in the table below our inter-company sales during the reporting period.
Coda Octopus Products (with entities operating in the UK, USA and Denmark) constitute the Marine Technology Business (“Products Segment”) where it is a supplier to the underwater/subsea market and selling both hardware and software solutions which include imaging sonar technology solutions, diving and diving communications technology, geophysical products, rental equipment, customization, and field operations services. Coda Octopus Colmek, Inc. (a Utah corporation). PAL is a supplier of products to the ultrasound, acoustic measurement and NDT market. Coda Octopus Martech Ltd (a UK corporation) constitute the Marine Engineering Business (Services Segment) and are subcontractors mainly to prime Defense contractors where they provide engineering services.
The following table summarizes segment asset and operating balances by reportable segment as of and for the years ended October 31, 2024 and 2023, respectively.
The Company’s reportable business segments sell their goods and services in four geographic locations:
| | ● | Americas |
| | ● | Europe |
| | ● | Australia/Asia |
| | ● | Middle East/Africa |
CODA OCTOPUS GROUP, INC .
Notes to the Consolidated Financial Statements
October 31, 2024 and 2023
SCHEDULE OF SEGMENT REPORTING INFORMATION
| | | Products | | | Services | | | Overhead | | | Total | |
| | | | | | | | | | | | | |
| Year Ended October 31, 2024 | | | | | | | | | | | | | | | | |
| | | | | | | | | | | | | | | | | |
| Net Revenues | | $ | 12,806,603 | | | $ | 7,509,558 | | | $ | - | | | $ | 20,316,161 | |
| | | | | | | | | | | | | | | | | |
| Cost of Revenues | | | 2,824,541 | | | | 3,318,515 | | | | - | | | | 6,143,056 | |
| | | | | | | | | | | | | | | | | |
| Gross Profit | | | 9,982,062 | | | | 4,191,043 | | | | - | | | | 14,173,105 | |
| | | | | | | | | | | | | | | | | |
| Research & Development | | | 2,019,112 | | | | 223,317 | | | | - | | | | 2,242,429 | |
| Selling, General & Administrative | | | 3,814,860 | | | | 2,248,493 | | | | 2,283,192 | | | | 8,346,545 | |
| | | | | | | | | | | | | | | | | |
| Total Operating Expenses | | | 5,833,972 | | | | 2,471,810 | | | | 2,283,192 | | | | 10,588,974 | |
| | | | | | | | | | | | | | | | | |
| Income (Loss) from Operations | | | 4,148,090 | | | | 1,719,233 | | | | (2,283,192 | ) | | | 3,584,131 | |
| | | | | | | | | | | | | | | | | |
| Other Income | | | | | | | | | | | | | | | | |
| Other Income | | | 53,960 | | | | 34,422 | | | | - | | | | 88,382 | |
| Interest Income | | | 657,817 | | | | 198,239 | | | | 82,719 | | | | 938,775 | |
| | | | | | | | | | | | | | | | | |
| Total Other Income | | | 711,777 | | | | 232,661 | | | | 82,719 | | | | 1,027,157 | |
| | | | | | | | | | | | | | | | | |
| | | | | | | | | | | | | | | | | |
| Income Tax Expense | | | | | | | | | | | | | | | | |
| Current Tax Expense | | | 316,955 | | | | 169,374 | | | | 227,341 | | | | 713,670 | |
| Deferred Tax Expense (Benefit) | | | (5,655 | ) | | | 19,169 | | | | 238,108 | | | | 251,622 | |
| | | | | | | | | | | | | | | | | |
| Total Income Tax Expense | | | 311,300 | | | | 188,543 | | | | 465,449 | | | | 965,292 | |
| | | | | | | | | | | | | | | | | |
| Net Income (Loss) | | $ | 4,548,567 | | | $ | 1,763,351 | | | $ | (2,665,922 | ) | | $ | 3,645,996 | |
| | | | | | | | | | | | | | | | | |
| Supplemental Disclosures | | | | | | | | | | | | | | | | |
| | | | | | | | | | | | | | | | | |
| *Total Assets | | $ | 40,922,453 | | | $ | 13,404,567 | | | $ | 3,217,524 | | | $ | 57,544,544 | |
| | | | | | | | | | | | | | | | | |
| *Total Liabilities | | $ | 3,072,876 | | | $ | 842,450 | | | $ | 500,695 | | | $ | 4,416,021 | |
| | | | | | | | | | | | | | | | | |
| Revenues from Intercompany Sales - eliminated from sales above | | $ | 3,367,839 | | | $ | 238,143 | | | $ | 1,266,000 | | | $ | 4,871,982 | |
| | | | | | | | | | | | | | | | | |
| Depreciation and Amortization | | $ | 632,882 | | | $ | 88,166 | | | $ | 49,487 | | | $ | 770,535 | |
| | | | | | | | | | | | | | | | | |
| Purchases of Long-lived Assets | | $ | 345,191 | | | $ | 23,786 | | | $ | 89,103 | | | $ | 458,079 | |
| * | The Total Assets and Total Liabilities included in the Supplemental Disclosures include PAL |
CODA OCTOPUS GROUP, INC.
Notes to the Consolidated Financial Statements
October 31, 2024 and 2023
| | | Products | | | Services | | | Overhead | | | Total | |
| | | | | | | | | | | | | |
| Year Ended October 31, 2023 | | | | | | | | | | | | | | | | |
| | | | | | | | | | | | | | | | | |
| Net Revenues | | $ | 12,119,066 | | | $ | 7,233,022 | | | $ | - | | | $ | 19,352,088 | |
| | | | | | | | | | | | | | | | | |
| Cost of Revenues | | | 2,819,796 | | | | 3,501,237 | | | | - | | | | 6,321,033 | |
| | | | | | | | | | | | | | | | | |
| Gross Profit | | | 9,299,270 | | | | 3,731,785 | | | | - | | | | 13,031,055 | |
| | | | | | | | | | | | | | | | | |
| Research & Development | | | 2,043,890 | | | | 52,577 | | | | - | | | | 2,096,467 | |
| Selling, General & Administrative | | | 3,109,566 | | | | 2,463,087 | | | | 2,622,383 | | | | 8,195,036 | |
| | | | | | | | | | | | | | | | | |
| Total Operating Expenses | | | 5,153,456 | | | | 2,515,664 | | | | 2,622,383 | | | | 10,291,503 | |
| | | | | | | | | | | | | | | | | |
| Income (Loss) from Operations | | | 4,145,814 | | | | 1,216,121 | | | | (2,622,383 | ) | | | 2,739,552 | |
| | | | | | | | | | | | | | | | | |
| Other Income | | | | | | | | | | | | | | | | |
| Other Income | | | 39,146 | | | | - | | | | - | | | | 39,146 | |
| Interest Income | | | 544,892 | | | | 97,638 | | | | - | | | | 642,530 | |
| | | | | | | | | | | | | | | | | |
| Total Other Income | | | 584,038 | | | | 97,638 | | | | - | | | | 681,676 | |
| | | | | | | | | | | | | | | | | |
| | | | | | | | | | | | | | | | | |
| Income Tax Expense (Benefit) | | | | | | | | | | | | | | | | |
| Current Tax Expense (Benefit) | | | 272,126 | | | | 78,876 | | | | (102,347 | ) | | | 248,655 | |
| Deferred Tax Expense (Benefit) | | | 115,954 | | | | (54,382 | ) | | | (13,148 | ) | | | 48,424 | |
| | | | | | | | | | | | | | | | | |
| Total Income Tax Expense (Benefit) | | | 388,080 | | | | 24,494 | | | | (115,495 | ) | | | 297,079 | |
| | | | | | | | | | | | | | | | | |
| Net Income (Loss) | | $ | 4,341,772 | | | $ | 1,289,265 | | | $ | (2,506,888 | ) | | $ | 3,124,149 | |
| | | | | | | | | | | | | | | | | |
| Supplemental Disclosures | | | | | | | | | | | | | | | | |
| | | | | | | | | | | | | | | | | |
| Total Assets | | $ | 36,969,673 | | | $ | 13,604,262 | | | $ | 1,267,581 | | | $ | 51,841,516 | |
| | | | | | | | | | | | | | | | | |
| Total Liabilities | | $ | 2,263,761 | | | $ | 732,582 | | | $ | 416,407 | | | $ | 3,412,750 | |
| | | | | | | | | | | | | | | | | |
| Revenues from Intercompany Sales - eliminated from sales above | | $ | 4,602,741 | | | $ | 584,622 | | | $ | 1,200,000 | | | $ | 6,387,363 | |
| | | | | | | | | | | | | | | | | |
| Depreciation and Amortization | | $ | 523,339 | | | $ | 100,689 | | | $ | 43,502 | | | $ | 667,530 | |
| | | | | | | | | | | | | | | | | |
| Purchases of Long-lived Assets | | $ | 1,996,544 | | | $ | 25,404 | | | $ | 108,392 | | | $ | 2,130,340 | |
CODA OCTOPUS GROUP, INC.
Notes to the Consolidated Financial Statements
October 31, 2024 and 2023
NOTE 16 - DISAGGREGATION OF REVENUE
SCHEDULE OF DISAGGREGATE OF REVENUE FROM CONTRACTS FOR SALE WITH CUSTOMERS BY GEOGRAPHIC LOCATION
| | | Business | | | Business | | | Total | |
| | | For the Year Ended October 31, 2024 | |
| | | Marine | | | Marine | | | | |
| | | Technology | | | Engineering | | | Grand | |
| | | Business | | | Business | | | Total | |
| Disaggregation of Total Net Sales | | | | | | | | | | | | |
| | | | | | | | | | | | | |
| Primary Geographical Markets | | | | | | | | | | | | |
| Americas | | $ | 2,838,857 | | | $ | 4,448,704 | | | $ | 7,287,561 | |
| Europe | | | 3,372,430 | | | | 3,060,854 | | | | 6,433,284 | |
| Australia/Asia | | | 5,475,401 | | | | - | | | | 5,475,401 | |
| Middle East/Africa | | | 1,119,915 | | | | - | | | | 1,119,915 | |
| | | | | | | | | | | | | |
| Total Revenues | | $ | 12,806,603 | | | $ | 7,509,558 | | | $ | 20,316,161 | |
| | | | | | | | | | | | | |
| Major Goods/Service Lines | | | | | | | | | | | | |
| Equipment Sales | | $ | 7,210,169 | | | $ | 1,193,776 | | | $ | 8,403,945 | |
| Equipment Rentals | | | 2,328,781 | | | | - | | | | 2,328,781 | |
| Software Sales | | | 878,516 | | | | - | | | | 878,516 | |
| Engineering Parts | | | - | | | | 5,520,032 | | | | 5,520,032 | |
| Services | | | 2,389,137 | | | | 795,750 | | | | 3,184,887 | |
| | | | | | | | | | | | | |
| Total Revenues | | $ | 12,806,603 | | | $ | 7,509,558 | | | $ | 20,316,161 | |
| | | | | | | | | | | | | |
| Goods transferred at a point in time | | $ | 8,088,685 | | | $ | 1,248,751 | | | $ | 9,337,436 | |
| Services transferred over time | | | 4,717,918 | | | | 6,260,807 | | | | 10,978,725 | |
| | | | | | | | | | | | | |
| Total Revenues | | $ | 12,806,603 | | | $ | 7,509,558 | | | $ | 20,316,161 | |
CODA OCTOPUS GROUP, INC.
Notes to the Consolidated Financial Statements
October 31, 2024 and 2023
| | | | | | | | | | | | | |
| | | For the Year Ended October 31, 2023 | |
| | | Marine | | | Marine | | | | |
| | | Technology | | | Engineering | | | Grand | |
| | | Business | | | Business | | | Total | |
| Disaggregation of Total Net Sales | | | | | | | | | | | | |
| | | | | | | | | | | | | |
| Primary Geographical Markets | | | | | | | | | | | | |
| Americas | | $ | 4,263,883 | | | $ | 4,846,615 | | | $ | 9,110,498 | |
| Europe | | | 2,225,915 | | | | 2,386,407 | | | | 4,612,322 | |
| Australia/Asia | | | 4,607,786 | | | | - | | | | 4,607,786 | |
| Middle East/Africa | | | 1,021,482 | | | | - | | | | 1,021,482 | |
| | | | | | | | | | | | | |
| Total Revenues | | $ | 12,119,066 | | | $ | 7,233,022 | | | $ | 19,352,088 | |
| | | | | | | | | | | | | |
| Major Goods/Service Lines | | | | | | | | | | | | |
| Equipment Sales | | $ | 8,444,305 | | | $ | 944,737 | | | $ | 9,389,042 | |
| Equipment Rentals | | | 1,264,804 | | | | - | | | | 1,264,804 | |
| Software Sales | | | 851,976 | | | | - | | | | 851,976 | |
| Engineering Parts | | | - | | | | 4,075,850 | | | | 4,075,850 | |
| Services | | | 1,557,981 | | | | 2,212,435 | | | | 3,770,416 | |
| | | | | | | | | | | | | |
| Total Revenues | | $ | 12,119,066 | | | $ | 7,233,022 | | | $ | 19,352,088 | |
| | | | | | | | | | | | | |
| Goods transferred at a point in time | | $ | 9,296,281 | | | $ | 944,737 | | | $ | 10,241,018 | |
| Services transferred over time | | | 2,822,785 | | | | 6,288,285 | | | | 9,111,070 | |
| | | | | | | | | | | | | |
| Total Revenues | | $ | 12,119,066 | | | $ | 7,233,022 | | | $ | 19,352,088 | |