UNITED STATES
SECURITIES AND EXCHANGE COMMISSION
Washington, D.C. 20549
FORM 10-K
(Mark One)
| þ | ANNUAL REPORT PURSUANT TO SECTION 13 OR 15(d) OF THE SECURITIES EXCHANGE ACT OF 1934 |
For the fiscal year ended December 31, 2011
or
| ¨ | TRANSITION REPORT PURSUANT TO SECTION 13 OR 15(d) OF THE SECURITIES EXCHANGE ACT OF 1934 |
For the transition period from to
Commission file number 000-52045

Volcano Corporation
(Exact Name of Registrant as Specified in its Charter)
| | |
| Delaware | | 33-0928885 |
(State or Other Jurisdiction of Incorporation or Organization) | | (I.R.S. Employer Identification Number) |
| |
| 3661 Valley Centre Drive, Suite 200 | | |
| San Diego, California | | 92130 |
| (Address of Principal Executive Offices) | | (Zip Code) |
Registrant’s telephone number, including area code:
(800) 228-4728
Securities registered pursuant to Section 12(b) of the Act:
| | |
Title of each class | | Name of each exchange on which registered |
| Common Stock, $0.001 per share par value | | The NASDAQ Stock Market LLC |
Securities registered pursuant to Section 12(g) of the Act:
None
Indicate by check mark if the registrant is a well-known seasoned issuer, as defined in Rule 405 of the Securities Act. Yes x No ¨
Indicate by check mark if the registrant is not required to file reports pursuant to Section 13 or Section 15(d) of the Act. Yes ¨ No x
Indicate by check mark whether the registrant (1) has filed all reports required to be filed by Section 13 or 15(d) of the Securities Exchange Act of 1934 during the preceding 12 months (or for such shorter period that the registrant was required to file such reports), and (2) has been subject to such filing requirements for the past 90 days. Yes x No ¨
Indicate by check mark whether the registrant has submitted electronically and posted on its corporate Web site, if any, every Interactive Data File required to be submitted and posted pursuant to Rule 405 of Regulation S-T (§ 232.405 of this chapter) during the preceding 12 months (or for such shorter period that the registrant was required to submit and post such files). Yes x No ¨
Indicate by check mark if disclosure of delinquent filers pursuant to Item 405 of Regulation S-K (§229.405 of this chapter) is not contained herein, and will not be contained, to the best of registrant’s knowledge, in definitive proxy or information statements incorporated by reference in Part III of this Form 10-K or any amendment to this Form 10-K. x
Indicate by check mark whether the registrant is a large accelerated filer, an accelerated filer, a non-accelerated filer, or a smaller reporting company. See the definitions of “large accelerated filer,” “accelerated filer” and “smaller reporting company” in Rule 12b-2 of the Exchange Act.
| | | | | | |
| | | |
| Large accelerated filer | | x | | Accelerated filer | | ¨ |
| | | |
| Non-accelerated filer | | ¨ (Do not check if a smaller reporting company) | | Smaller reporting company | | ¨ |
Indicate by check mark whether the registrant is a shell company (as defined in Rule 12b-2 of the Act). Yes ¨ No x
The aggregate market value of the voting common equity held by non-affiliates of the registrant, based upon the closing price of a share of the registrant’s common stock on June 30, 2011 (which is the last business day of registrant’s most recently completed second fiscal quarter), as reported on the NASDAQ Global Market was approximately $1.7 billion. Approximately 138,000 shares of common stock held by executive officers and directors on June 30, 2011 have been excluded in that such persons may be deemed affiliates. This determination of affiliate status is not necessarily a conclusive determination for other purposes.
At February 15, 2012, 52,886,319 shares of Common Stock, par value $0.001, of the registrant were outstanding.
DOCUMENTS INCORPORATED BY REFERENCE
Part III of this Form 10-K incorporates information by reference to portions of the registrant’s definitive Proxy Statement for the Annual Meeting of Stockholders to be held on May 23, 2012. Such definitive Proxy Statement will be filed with the Securities and Exchange Commission not later than 120 days after December 31, 2011.
VOLCANO CORPORATION
ANNUAL REPORT ON FORM 10-K FOR THE YEAR ENDED DECEMBER 31, 2011
TABLE OF CONTENTS
1
Forward-looking statements: This annual report on Form 10-K (“Annual Report”) contains forward-looking statements regarding future events and our future results that are based on current expectations, estimates, forecasts, and projections about the industries in which we operate and the beliefs and assumptions of our management. In some cases, you can identify these “forward-looking statements” by words like “may,” “will,” “should,” “expects,” “plans,” “anticipates,” “believes,” “estimates,” “predicts,” “potential” or “continue” or the negative of those words and other comparable words. These statements include, but are not limited to, those concerning the following: our intentions, beliefs and expectations regarding our future financial performance, anticipated growth, trends in our business, trends in the medical field related to our products and technology, and the performance and competitive advantages of our products; our beliefs with respect to the usefulness of anticipated clinical data; the timing and success of our clinical trials, data presentations, regulatory submissions and anticipated product launches; our belief that our cash and cash equivalents and available-for-sale investments will be sufficient to satisfy our anticipated cash requirements; our belief that our current and planned facilities are sufficient for our business; our operating results; timing, costs and outcomes of current or future litigation; our expectations regarding our revenues and costs of producing our products; our expectations regarding our customers and distributors; and our intentions, beliefs and expectations regarding market penetration and expansion efforts. These statements are not guarantees of future performance or events. Our actual results may differ materially from those discussed here. For a detailed discussion of the risks and uncertainties that could contribute to such differences see the “Risk Factors” section in Part I, Item 1A of this Annual Report as well as the discussion in Part II, Item 7, “Management’s Discussion and Analysis of Financial Condition and Results of Operations,” and elsewhere throughout this Annual Report and in any other documents incorporated by reference into this Annual Report. Any forward-looking statement speaks only as of the date on which it is made, and except as required by law, we undertake no obligation to update forward-looking statements to reflect events or circumstances occurring after the date of this Annual Report.
Volcano has registered and common law trademarks in the U.S. and elsewhere in the world including, but not limited to, Axsun®, ChromaFlo®, ComboMap®, ComboWire®, Eagle Eye®, GlyDx®, PrimeWire®, PrimeWire Prestige®, Revolution®, s5™, s5i®, SmartMap®, SpinVision®, VH®, VIBE® and VOLCANO®. Other brand names or trademarks appearing in this Annual Report are the property of their respective holders.
PART I
Overview
We design, develop, manufacture and commercialize a broad suite of precision guided therapy tools including intravascular ultrasound, or IVUS, and fractional flow reserve, or FFR, products. We believe that these products enhance the diagnosis and treatment of vascular heart disease by improving the efficiency and efficacy of existing percutaneous interventional, or PCI, therapy procedures in the coronary or peripheral arteries. We are facilitating the adoption of functional PCI, in which our FFR technology is used to determine whether or not a stent is necessary, and IVUS is used to guide stent placement and optimization. We market our products to physicians and technicians who perform PCI procedures in hospitals and to other personnel who make purchasing decisions on behalf of hospitals.
Our products consist of multi-modality consoles which are marketed as stand-alone units or as customized units that can be integrated into a variety of hospital-based interventional surgical suites called catheterization laboratories, or cath labs. Our consoles have been designed to serve as a multi-modality platform for our phased array and rotational IVUS catheters, FFR pressure wires, image-guided therapy catheters and Medtronic’s Pioneer reentry device.
Our IVUS products include single-procedure disposable phased array and rotational IVUS imaging catheters and additional functionality options such as virtual histology tissue characterization, or VH, and ChromaFlo stent apposition analysis. Our FFR offerings can be accessed through our multi-modality platforms, and we also
2
provide FFR-only consoles. Our FFR disposables are single-procedure disposable pressure and flow guide wires used to measure the pressure and flow characteristics of blood around plaque enabling physicians to gauge the plaque’s physiological impact on blood flow and pressure. We are developing additional offerings for integration into the platform, including adenosine-free Instant™ wave-free ratio FFR, or iFR, forward-looking IVUS, or FL.IVUS, catheters, ultra-high resolution Focal Acoustic Computed Tomography catheters and ultra-high resolution Optical Coherence Tomography, or OCT, systems and catheters.
We derive our revenues from two reporting segments: medical and industrial. Our medical segment represents our core business, in which we derive revenues primarily from the sale of our multi-modality and FFR consoles and our IVUS and FFR single-use disposables. Our industrial segment derives revenues related to the sales of micro-optical spectrometers and optical channel monitors by Axsun Technologies, Inc., or Axsun, our wholly owned subsidiary, to telecommunication and industrial companies. We continue building direct sales capabilities in the U.S., certain parts of Europe, South Africa, and Japan and have numerous distributor relationships in other geographies. During the year ended December 31, 2011, we generated worldwide revenues of $343.5 million, which is composed of $332.5 million from our medical segment and $11.0 million from our industrial segment, and had operating income of $25.4 million. Our total assets as of December 31, 2011 were $496.7 million. Our revenue, operating income and total assets and other financial results for the last three fiscal years are described in the “Management’s Discussion and Analysis of Financial Condition and Results of Operations” and the “Consolidated Financial Statements” sections contained in this Annual Report. At December 31, 2011, we had a worldwide installed base of more than 6,800 consoles. We intend to grow and leverage this installed base of consoles to drive recurring sales of our single-use disposable catheters and guide wires, which accounted for approximately 81% of our medical segment revenues during the year ended December 31, 2011. In 2011, approximately 46% of the Company’s revenues were generated in the U.S., approximately 31% were generated in Japan, and approximately 18% were generated in Europe, the Middle East and Africa, with the balance of sales occurring in other international markets.
Our Strategy
Our strategy is to offer a multi-modality platform that seeks to deliver all of the benefits associated with conventional IVUS and FFR devices, while providing enhanced functionality and proprietary features that address the limitations associated with conventional forms of these technologies. We are seeking to make precision-guided, functional PCI a standard of care and to position the Company as a leading provider of precision-guided therapy. Furthermore, recent clinical data from studies involving IVUS and FFR, as well as updated clinical guidelines elevating the use of these technologies, we believe will help drive market adoption. In addition, we have a number of new offerings under development that will further leverage our multi-modality platform. Factors driving our strategy include:
| | • | | Accelerating the trend toward less invasive procedures. Our IVUS products offer continuous, real-time three-dimensional imaging, plaque visualization, color-coded identification of plaque composition, and automatic drawing of lumen and vessel borders allowing for automatic vessel sizing. Our FFR products offer physicians a simple pressure and flow based method to determine whether stenting or additional PCI is required. This strategy complements our focus on precision-guided therapy by providing sophisticated guidance tools that enhance the value of minimally invasive procedures. |
| | • | | Enhancing the outcomes of PCI procedures. We believe our products enabled with novel technological enhancements, provide clinically significant information that improves the outcomes of current and increasingly complex PCI procedures. |
| | • | | Providing documentation for necessity of procedures. Increasingly, hospitals and third-party payors are requesting proof of necessity for PCIs. We believe our IVUS and FFR technologies can assist clinicians in documenting the clinical necessity of these procedures. |
| | • | | Decreasing the number of interventional devices used per procedure and optimizing their usage. Our FFR products offer the opportunity to physiologically assess lesion severity and determine whether stents are needed. Additionally, our IVUS products provide intra-vascular imaging. As a result, our |
3
| | IVUS and FFR products have the potential to reduce the number of devices deployed by identifying the appropriate lesion for stenting and ensuring that stents are placed and expanded correctly, thereby enhancing patient outcomes and lowering treatment costs. |
| | • | | Improving ease of use of IVUS and FFR technologies to drive market adoption. We have designed our console offerings to be “always there, always on, and easy to use.” Our consoles are easily integrated into an existing or newly constructed cath lab facility. |
| | • | | Improving the diagnosis of cardiovascular disease.We believe our VH IVUS products can significantly improve the diagnosis of cardiovascular disease by addressing the limitations of diagnostic angiography, and allowing clinicians to identify patients and lesions at risk for future adverse coronary vascular system events. |
| | • | | Enabling new procedures to treat coronary artery disease peripheral artery disease and structural heart disease. Currently, the treatment of a number of vascular and structural heart diseases, including coronary, peripheral and carotid artery disease and atrial fibrillation, is limited by conventional catheter-based techniques and angiography. Because our technologies address many of these current limitations, we believe our products provide physicians the potential to diagnose and, optimally, treat these diseases percutaneously, and may address limitations in the treatment of structural heart disease. |
Our goal is to establish our IVUS and FFR products as the standard of care for PCI diagnostic and therapeutic procedures and expand the use of IVUS and FFR for these procedures. The key elements of our strategy for achieving this goal are to:
| | • | | Grow existing IVUS and FFR Markets globally. We feel that most PCI procedures today, particularly those of a more complex nature, benefit greatly from more precise guidance than angiography alone can provide. We feel that by making our devices easier to use and enabling faster interpretation of images, investing in thoughtful clinical studies and registries that prove the benefit of our technologies, educating physicians and hospital executives on the clinical need for our products and existing guidelines, training staff on the procedural use of our products, and providing access to all patients through the expansion of our installed base, that we can continue to grow and cultivate the current PCI market which represents, on an annual basis, more than three million procedures worldwide. A growing portfolio of image guided therapy devices, such as our VIBE RX Vascular Imaging Balloon, or VIBE RX, which combines a semi-compliant balloon catheter with on-board imaging, is another method to reduce friction and move more angiographic guided procedures to incorporate the precision guidance of our products. |
| | • | | Increase market share in existing IVUS and FFR markets. We continue to introduce product enhancements to meet physicians’ needs for improved visualization, characterization, and ease of use. We believe these enhancements make our products easier to use than competing products and provide substantially more and better information to improve procedural outcomes, thereby driving greater usage of our IVUS and FFR products within the existing PCI market. We believe we are the market leader in the IVUS market and intend to implement several strategies to increase our penetration in the FFR market. First, we have addressed limitations of conventional IVUS such as difficulty in use, lack of automation and grayscale imaging by developing technologies and introducing features such as automatic real-time drawing of lumen and vessel borders, color-coded identification of plaque composition, and automatic vessel sizing. Second, we developed PC-based IVUS and FFR consoles that can be integrated easily into cath labs, thereby making it easier for physicians to adopt and use our products. Third, we have increased the size of our direct sales force and initiated direct distribution strategies in key geographies. We have also entered into distribution and marketing agreements with leading cath lab equipment and stent manufacturers. We intend to grow and leverage our installed base of IVUS and FFR consoles to drive recurring sales of our single-procedure disposable catheters and guide wires. |
| | • | | Expand into new markets and develop clinical applications for and utilization of our technology in new markets.We plan to leverage our current technology and develop new technology to expand into new markets and increase clinical applications through clinical studies, conducted by us or in |
4
| | collaboration with other companies. This includes programs for (1) IVUS guided therapy products that combine IVUS with balloons and potentially other therapeutic devices, (2) micro-catheter technologies for use in coronary, peripheral and other vascular applications, (3) FL.IVUS for applications including chronic total occlusions in the coronary and peripheral arteries, and Forward-Looking Intra-Cardiac Echo , or FL.ICE, for other structural heart applications, (4) OCT light-based imaging systems, which we believe can be used in coronary, peripheral and other vascular applications, and (5) unique optical and micro-electro-mechanical systems technologies in telecommunications, industrial spectroscopy or medical OCT applications, including ophthalmology and dentistry. |
| | • | | Enhance product capabilities and introduce new products through collaborations or acquisitions. We have a successful track record of acquiring and licensing technologies and collaborating with third parties to create synergistic product offerings. For instance, we licensed the VH IVUS technology that now forms the core of our ability to determine the composition of plaque from The Cleveland Clinic Foundation. We also licensed the intellectual property rights allowing us to develop our Revolution rotational catheter from Koninklijke Philips Electronics N.V. In December 2007, we acquired CardioSpectra, Inc., or CardioSpectra, whose core product line, based on innovative OCT technology, is expected to complement our existing product offerings. During 2008, we acquired Novelis, Inc., or Novelis, which was developing FL.IVUS technology. In 2008 we also acquired substantially all of the assets of Impact Medical Technologies, LLC, which we used to develop innovative micro-catheter technologies; and Axsun which is a developer of optical laser and non-laser technologies. In August 2010, we acquired Fluid Medical, Inc., or Fluid Medical, which is developing advanced catheter-based forward-looking imaging technology. The Fluid Medical technology is complementary to our FL.IVUS technology and is expected to enable us to further develop products that address minimally invasive structural heart procedures, such as our FL.ICE program. We believe there will be additional opportunities to leverage these capabilities through select technology or company acquisitions as well as collaborations that enhance our capabilities or complement our markets. |
Our Products
Our multi-modality consoles are marketed as stand-alone units or units that can be integrated into cath labs. We offer consoles that combine IVUS and FFR technology, which are designed to allow the user to switch seamlessly between each modality. We also offer systems with either IVUS or FFR. The significantly expanded functionality of our offering enables the networking of patient information, control of IVUS and FFR information at both the operating table and in the cath lab control room, as well as the capability for images to be displayed on standard cath lab monitors. Our products include IVUS catheters, FFR guide wires, thrombus aspiration devices, and various options that provide additional functionality. We expect to continue to develop new products and technologies to expand the market adoption of our offering, and also expect our platform will support IVUS integrated with other interventional devices in the future.
Consoles
We design, develop, manufacture and commercialize multi-modality consoles that are proprietary, high-speed electronic systems that process the signals received from our IVUS catheters and wires. These consoles generate high-resolution images that can be displayed on a monitor and can be permanently stored on the system or another medium. Our consoles are mobile, proprietary and high speed electronic systems with different functionalities and sizes designed and manufactured to process the signals received only from our catheters and guide wires. Our IVUS market strategy includes offering devices to clinicians that are easy to use, reduce procedure times and provide a higher level of information. We have a family of consoles including our PC-based s5 and the IVUS In-Vision Gold, or IVG. The s5 family of consoles, which became our primary console product offering following its full commercial launch in July 2006, is smaller, lighter and less expensive to manufacture than our IVUS IVG console, and has enhanced functionality. The s5 family includes:
| | • | | s5: We believe this portable and mobile console is the lightest product on the market, and has a simple user interface. |
5
| | • | | s5i: This console is made up of components that can be customized to each cath lab’s specifications and integrated into virtually any cath lab while retaining the full functionality of the s5. When the s5i is integrated into the cath lab, it works seamlessly with the workflow of the cath lab in terms of acquiring and archiving patient images and data. |
Both platforms support digital IVUS, rotational IVUS, FFR, VH IVUS and ChromaFlo as well as our planned future offerings.
Our IVUS Products
Catheters.Our single-use disposable catheters operate and interface solely with our family of consoles. We are the only company that offers both digital and rotational catheters. We believe this allows us to meet the needs of a greater number of physicians than our competitors. Our IVUS catheters vary in their principal uses, frequencies, shaft sizes, shaft lengths, guide wire compatibility and distal tip lengths. These differences allow for the use of different catheters in various portions of the vascular system.
We launched our latest generation digital catheter, the Eagle Eye Platinum Digital IVUS Catheter, commercially in May 2010. During 2012, we expect to introduce an enhanced version of our Revolution rotational catheter, which we believe will be the highest frequency catheter on the market and will offer better resolution in the area close to the end of the catheter than competitive rotational catheters. In addition, we plan to introduce a new peripheral IVUS catheter, and a new, short tip version of the Eagle Eye Platinum IVUS catheter that will enable clinicians to get closer to a Chronic Total Occlusion. In addition, during 2011, we initiated development of our Focal Acoustic Computed Tomography catheter that is designed to provide a higher level of ultrasound resolution imaging than is available with current IVUS ultrasound catheters.
Additional Functionality. Our IVUS products incorporate key features that add valuable clinical functionality addressing a number of the historical limitations of conventional IVUS. We intend to develop additional functionality in the future. Currently, we offer:
ChromaFlo.Angiography alone does not always identify malapposed stents because the contrast injection that makes the lumen visible on x-ray can flow inside the stent, and in between the stent and vessel wall. When this occurs, the stent struts are too small to compete with the dark lumen of the x-ray, leaving the two dimensional image inconclusive or misleading. ChromaFlo stent apposition analysis uses sequential IVUS frames to differentiate circulating blood from stationary or anchored tissue. ChromaFlo can be particularly important when assessing stent placement as the detailed cross-sectional image clearly identifies moving blood inside and outside of the stent lumen, prompting physicians in many cases to expand the stent until all of the blood appears inside of the stent lumen. ChromaFlo can also help with the identification of luminal structures such as lumen border, bifurcations, dissections, and thrombus.
VH IVUS. Conventional IVUS allows the visualization of atherosclerotic plaque. However, it is limited to a subjective, and therefore qualitative, review of vascular and plaque dimensions and composition. Our VH IVUS product allows, for the first time, easy to read and interpret IVUS images with color-coded identification of plaque composition. Additionally, a key element of the VH IVUS product is the capability to provide automatic identification of lumen and vessel borders. This feature enables automated vessel sizing, which makes it easier and faster to use our IVUS products. Finally, our VH IVUS functionality offers the potential to determine plaque vulnerability and therefore stratification of risk. We have developed fully functional devices for each of these technologies and have used them in clinical studies. In January 2011, the New England Journal of Medicine published results from our clinical study Providing Regional Observations to Study Predictors of Events in the Coronary Tree, or PROSPECT, an international multi-center study, which demonstrated that VH IVUS tissue characterization software enables physicians to more accurately assess the risk of individual blockages than the use of the current standard-of-care—angiographic imaging—alone. The PROSPECT results demonstrated the ability to use VH IVUS to identify high-risk plaques that could potentially be treated to prevent future events,
6
and low-risk plaques that may not need intervention. We are in the process of participating in several additional clinical studies to correlate plaque vulnerability to its clinical significance and risk, and believe that these data will lead to further utilization of VH IVUS to triage coronary lesions.
Our FFR Products
Our FFR products consist of pressure and flow consoles and single-procedure disposable pressure and flow guide wires. We believe we are the only company that offers a full line of pressure and flow guide wires as well as a guide wire that can measure both pressure and flow. In addition, our FFR products can be integrated with our s5 family of multi-modality consoles. In August 2010, we commercially launched PrimeWire PRESTIGE, our latest generation pressure guide wire. We expect to introduce the PrestigePlus, the latest innovation to our FFR product line, in the U.S and Europe in 2012. In addition, we are working on the development of iFR, which is an FFR technology that does not require the administration of adenosine, used to widen blood vessels prior to the procedure. As a result, by enabling cardiologists to perform FFR without adenosine, iFR has the potential to widen the patient population that could be diagnosed with FFR, and reduce the costs and time associated with the use of FFR.
We believe that the release and publication of favorable trial data relating to the measurement of FFR in addition to angiography will lead to further adoption of FFR technology by clinicians.
Product Expansion
We currently have a number of products under development that will leverage our existing platform technology and we believe will expand our presence in interventional medicine and related markets. Our product pipeline includes:
Image Guided Therapies
The VIBE RX catheter is our first image-guided therapy device. A single VIBE RX catheter can quickly access, prepare, and assess challenging lesions. IVUS guidance provides precise, targeted balloon dilatation with immediate confirmation of interventional results. We began commercial shipments of our VIBE RX offering in Europe and South Africa in December of 2010, and commenced a limited market release of the product in Japan during 2011. We will initiate a full market release of the product in Japan during 2012. We are in discussions with regulatory authorities in the U.S. regarding the clinical requirements necessary to file for approval of the device in the U.S. Also in 2011, we completed a supply agreement with ev3, a Covidien company, under which we will supply our proprietary IVUS technology for use in ev3’s Plaque Excision Systems—catheters that remove plaque blocking peripheral arteries and interrupting blood flow.
Micro and Thrombectomy Catheters
During January 2012, we received 510(k) clearance for the Valet Micro catheter, which can be used to facilitate PCI procedures when Chronic Total Occlusions are present. We plan to initiate a limited market release of the Valet Micro catheter in the U.S. during the first quarter of 2012. The Valet is expected to be used as a conduit for the exchange and/or support of guidewires in peripheral and coronary vascularizations. In addition, we expect to introduce the ReFLOW™ Aspiration Catheter in early 2013, which is indicated for the removal of fresh, soft emboli and thrombi from vessels in the arterial system.
Forward Looking Imaging (FL.IVUS/FL.ICE)
A principal area of focus for us is the development of our forward-looking advanced imaging technologies. These proprietary technologies have potential applications for a number of minimally invasive diagnostic and therapeutic applications in the coronary, peripheral and structural heart vasculature. Our strategy is to integrate these offerings into our s5 family of consoles and target markets such as chronic total occlusions and other coronary, peripheral and structural heart indications. We expect to introduce our first FL.IVUS offering outside of the U.S. in the second half of 2012.
7
Optical Coherence Tomography (OCT)
We are developing our OCT products to complement our existing product offerings and further enhance our position as an imaging technology leader in the field of interventional medicine. Our early model OCT systems have been used in several clinical settings in Europe and South America. We believe our OCT products will be an important addition to our product line, as we expect that it will allow us to expand our reach into clinical situations where extremely high resolution imaging is paramount by providing high quality visualization of stent expansion and apposition. Our goal is to integrate this OCT functionality directly into our s5i integrated imaging suite of products. Our OCT system is designed to allow fast, easy imaging of highly detailed structures in the vasculature, including vessel wall defects, intra-luminal thrombus and stent struts. Our OCT resolution is able to visualize even very thin layers of cells covering drug eluting stent struts at follow-up. However, unlike IVUS, OCT cannot see through blood and requires contrast injections while imaging. OCT also does not penetrate the vessel wall, so only measurements within the lumen and the first one to two millimeter of the lumen wall are possible. This means that the user cannot measure the full volume and type of plaque or provide the ability to visualize from vessel wall to vessel wall in the presence of coronary disease. We believe OCT will complement IVUS in its ability to see small luminal structures. This will predominantly be a clinical research tool initially until further clinical data can be developed to understand how OCT can be applied to daily PCI practice.
Clinical Program
Our clinical studies are generally post-marketing studies using FDA-cleared and/or CE-marked products intended to provide data regarding diagnostic effectiveness and disease treatment outcomes, as well as the potential value of our products in providing therapy in markets and indications such as stent placement and optimization, plaque assessment and therapy guidance in the coronary and carotid arteries.
Our significant clinical studies include:
Assessment of Dual Anti-Platelet Therapy with Drug-Eluting Stents (ADAPT-DES)
ADAPT-DES is a prospective, multi-center, registry of up to 15,000 consecutive patients with coronary artery disease undergoing stent-assisted PCI using DES without major procedural complications. The objectives of this trial were to determine the frequency and timing of DES thrombosis. An IVUS sub-study enrolled patients at sites in the U.S. and Europe. The purpose of the sub-study was to determine whether one or more IVUS parameters are independent predictors of stent thrombosis. Enrollment was completed in the third quarter of 2010, with approximately 9,000 patients enrolled in the main study and more than 2,100 patients enrolled in the sub-study. The 30-day clinical data was presented at the Transcatheter Cardiovascular Therapeutics, or TCT, conference in November 2011. We expect one-year follow up clinical data and IVUS and VH data will be presented at the American College of Cardiology meeting in March 2012.
Vascular Evaluation for Revascularization: Defining the Indications for Coronary Therapy: A Pilot Study (VERDICT)
VERDICT is a prospective, global, multicenter study to determine the correlation between FFR and VH IVUS in patients with intermediate coronary lesions. The objectives of this study are to establish the correlation between FFR and VH IVUS-derived parameters; to assess the ability of operators to accurately assess angiographic and IVUS data and to examine the contemporary use of FFR and VH IVUS by operators in determining whether intermediate coronary lesions should undergo treatment. Enrollment started in September 2010 and we expect the trial will continue up to four years, including approximately 12 months for enrollment and three years of clinical follow-up. Baseline enrollment is expected to be completed in first quarter of 2012 and we expect to present data at the 2012 TCT meeting.
8
Fractional Flow Reserve and Intravascular Ultrasound Relationship Study (FIRST)
FIRST was a multi-center, prospective registry of patients with intermediate coronary lesions that underwent both VH IVUS and FFR interrogation. This study enrolled 350 patients at sites in the U.S. and Europe, who were undergoing a clinically indicated angiogram and who have intermediate coronary lesions. The primary objective of the study was to evaluate the relationship between angiography, IVUS, VH, and FFR measurements. Enrollment in this study started in September 2010 and was completed in the third quarter of 2011. Data from the study was presented at the 2011 TCT conference.
Adensonine Vasodilation Independent Stenosis Evaluation (ADVISE)
ADVISE was a pilot study to assess the ability of an investigational product, iFR, to provide a measurement of the severity of a coronary stenosis that is similar to FFR without the need for pharmacologic vasodilation. The results were presented during the Late Breaking Clinical Trial sessions at the TCT conference in November 2011. iFR was developed by physician-scientists at Imperial College London in partnership with us. ADVISE was an international multi-center study supported by Volcano and studied 157 stenoses in 131 patients to validate the iFR technology. iFR collected closely with FFR (r=0.90, p>0.001) with excellent diagnostic efficiency with receiver operating characteristic area under curve of 93 percent and overall diagnostic accuracy of 88 percent. We believe these outcomes demonstrate that the removal of adenosine from an FFR procedure would reduce costs and potential patient adverse events, and streamline workflow.
Adenosine Vasodilation Independent Stenosis Evaluation II (ADVISE II)
ADVISE II will study iFR in a larger number of lesions, as a follow-on to ADVISE. It will be a prospective, multi-center study intended to generate data to support global regulatory submissions for the iFR technology.
Evaluation of XIENCE PRIME™ or XIENCE V® versus Coronary Artery Bypass Surgery for Effectiveness of Left Main Revascularization (EXCEL)
EXCEL is a prospective, unblinded, randomized multi-center trial involving approximately 2,600 patients with left main coronary artery, orULMCA, disease and treatment groups of stenting with XIENCE PRIME or XIENCE V Everolimus Eluting Coronary Stent System versus coronary artery bypass grafting. Further, there will be a universal registry of approximately 1,000 patients who have angiographically significant left main disease but are not eligible for the randomized trial. All patients who are randomized to the PCI arm and have IVUS performed during the procedure will be included in the IVUS substudy. The purpose of the substudy is to determine how acute IVUS results will correlate with outcomes. There will be up to 160 global sites participating. Enrollment commenced in Europe in December 2010 and in the U.S in November 2011. Enrollment is expected to take approximately two years.
Sales, Marketing and Distribution
We sell consoles and disposables through our own direct sales force and distributors. In addition, we sell our consoles through our supply and distribution agreements with third parties. Our strategy is to leverage our installed base of consoles to drive recurring sales of our proprietary disposables. We provide training and clinical support to users of our products to increase their familiarity with product features and benefits, thereby increasing usage.
We have direct sales capability in the U.S., certain parts of Europe, Japan and South Africa. We intend to continue to increase our direct sales personnel over time. At December 31, 2011, we had over 240 direct sales and support professionals, including over 130 in the U.S., over 65 in Japan, and over 40 in Europe and the remaining in other geographies. In addition, we have numerous distributor relationships in these and other geographic areas.
9
In 2011, we completed our strategy to convert from a third-party distribution model in Japan to a direct sales model, a process we began in 2009. We previously sold our IVUS and FFR products in Japan primarily through three direct distributors: Goodman Company Ltd., or Goodman, Fukuda Denshi Co., Ltd., or Fukuda, and Johnson & Johnson K.K., Cordis Division, or Johnson & Johnson. In 2009, we terminated our distribution relationship with Goodman and implemented a direct sales program to replace that relationship. In 2010, we entered into an agreement to terminate our distribution agreement with Fukuda. In 2011, we ended our agreement with Johnson & Johnson. As a result, all of our business in Japan is now served by the Company’s direct sales force. We currently support our Japanese customers through our Tokyo-based subsidiary, Volcano Japan Co., Ltd., or Volcano Japan.
In Europe, we distribute our IVUS and FFR products through our subsidiary, Volcano Europe, B.V.B.A., or Volcano Europe. We sell our products directly to customers in certain European markets and utilize distributors in other European markets.
We have marketing agreements with leading healthcare company partners or their affiliates, including Medtronic, Inc., or Medtronic, General Electric Company, Siemens AG, Philips Medical Systems Nederland B.V., and Abbott. These agreements allow us to coordinate our marketing efforts with our strategic partners while still dealing directly with the customer.
At December 31, 2011, our global marketing team was comprised of over 35 individuals, covering product management, corporate communications and programs, clinical support, and education and training. We devote significant resources to training and educating physicians in the use and benefits of our products. We also promote our products through medical society meetings attended by interventionists.
Our relationships with physician thought leaders in interventional cardiology are an important component of our selling and marketing efforts. These relationships are typically built around research collaborations that enable us to better understand and articulate the most useful features and benefits of our products, and to develop new solutions to challenges in PCI medicine.
Financial Information About Geographic Areas
The following table sets forth our revenues by geography expressed as dollar amounts (in thousands):
| | | | | | | | | | | | | | | | | | | | |
| | | Years Ended December 31, | | | Percentage Change | |
| | | 2011 | | | 2010 | | | 2009 | | | 2010 to 2011 | | | 2009 to 2010 | |
Revenues (1): | | | | | | | | | | | | | | | | | | | | |
United States | | $ | 157,412 | | | $ | 134,645 | | | $ | 110,502 | | | | 16.9 | % | | | 21.8 | % |
Japan | | | 105,892 | | | | 79,277 | | | | 52,339 | | | | 33.6 | | | | 51.5 | |
Europe, the Middle East and Africa | | | 60,249 | | | | 57,614 | | | | 47,609 | | | | 4.6 | | | | 21.0 | |
Rest of world | | | 19,993 | | | | 22,610 | | | | 17,417 | | | | (11.6 | ) | | | 29.8 | |
| | | | | | | | | | | | | | | | | | | | |
| | $ | 343,546 | | | $ | 294,146 | | | $ | 227,867 | | | | 16.8 | | | | 29.1 | |
| | | | | | | | | | | | | | | | | | | | |
At December 31, 2011, approximately 45% of our long-lived assets, excluding financial assets, were located in the U.S., approximately 30% were located in Costa Rica, approximately 21% were located in Japan, and less than 5% were located elsewhere.
At December 31, 2010, approximately 51% of our long-lived assets, excluding financial assets, were located in the U.S., approximately 34% were located in Japan and less than 15% were located elsewhere.
At December 31, 2009, approximately 59% of our long-lived assets, excluding financial assets, were located in the U.S., approximately 33% are located in Japan, and less than 10% were located elsewhere.
10
Our international operations expose us and our representatives, agents, and distributors to risks inherent in operating in foreign jurisdictions, including the risks described in “Risk Factors—The risks inherent in our international operations may adversely impact our revenues, results of operations and financial condition.”
Competition
We compete primarily on the basis of our ability to assist in the diagnosis and treatment of vascular diseases safely and effectively, with ease and predictability of product use, adequate third-party reimbursement, brand name recognition and cost. We believe that we compete favorably with respect to these factors, although there can be no assurance that we will be able to continue to do so in the future or that new products that perform better than those we offer will not be introduced. We believe that our continued success depends on our ability to:
| | • | | innovate and maintain scientifically advanced technology; |
| | • | | apply our technology across products and markets; |
| | • | | successfully market our products; |
| | • | | develop proprietary products; |
| | • | | successfully conduct clinical studies that expand our markets; |
| | • | | obtain and maintain patent protection for our products; |
| | • | | Secure and preserve regulatory approvals; |
| | • | | achieve manufacturing efficiencies; |
| | • | | attract and retain skilled personnel; and |
| | • | | successfully add complementary offerings and technology through acquisitions, licensing agreements and strategic partnerships. |
Our primary imaging competitor globally is Boston Scientific, Inc., or Boston Scientific, but we also compete with Terumo Corporation in Japan. In the FFR market, our primary competitor is St. Jude Medical, Inc., or St. Jude, which acquired Radi Medical Systems AB, or Radi, in 2008. Because of the size of the vascular market opportunities, competitors and potential competitors have dedicated and will continue to dedicate significant resources to aggressively promote their products. New product developments that could compete with us more effectively are likely because the vascular disease market is characterized by extensive research efforts and technological progress. For example, OCT represents a potentially competitive technology with our IVUS technology. Competitors may develop technologies and products that are safer, more effective, easier to use or less expensive than ours.
We have encountered and expect to continue to encounter potential physician customers who, due to existing relationships with our competitors, are committed to or prefer the products offered by these competitors.
Through the Axsun subsidiary we compete on the basis of leading technology, high quality and the enhanced productivity that our products offer to customers in a variety of industries, including telecommunications, pharmaceutical manufacturing, high-speed industrial process control, chemical and petrochemical processing, medical diagnostics, and scientific discovery. Products developed by competitors based on lower performance tunable filter technology could compete on the basis of lower cost. In addition, customers may build similar functionality directly into their products. Our primary competitors in the telecommunications market include Optoplex Corporation, Aegis Lightwave, Inc. and BaySpec, Inc.
We expect that competitive pressures may result in price reductions and reduced margins over time for our products. Our products may be rendered obsolete or uneconomical by technological advances developed by one or more of our competitors.
Additional information regarding the risks associated with our competitive position and environment is described in “Risk Factors—Risks Related to Our Business and Industry.”
11
Intellectual Property
We believe that in order to maintain a competitive advantage in the marketplace, we must develop and maintain the proprietary aspects of our technologies. We rely on a combination of patent, trademark, trade secret, copyright and other intellectual property rights and measures to aggressively protect our intellectual property.
We require our employees and consultants to execute confidentiality agreements in connection with their employment or consulting relationships with us. We also require our employees and consultants who work on our products to agree to disclose and assign to us all inventions conceived during the term of their employment, while using our property or which relate to our business. Despite measures taken to protect our intellectual property, unauthorized parties may attempt to copy aspects of our products or to obtain and use information that we regard as proprietary. In addition, our competitors may independently develop similar technologies.
The medical device industry is characterized by the existence of a large number of patents and frequent litigation based on allegations of patent infringement. As the number of entrants into our market increases, the risk of an infringement claim against us grows. While we attempt to ensure that our products and methods do not infringe other parties’ patents and proprietary rights, our competitors may assert that our products, and the methods we employ, are covered by patents held by them. In addition, our competitors may assert that future products and methods we may employ infringe their patents. If third parties claim that we infringe upon their intellectual property rights, we may incur liabilities and costs and may have to redesign or discontinue selling the affected product. For example, in July 2010, St. Jude sued us for patent infringement alleging products that have been on the market for more than ten years infringe upon St. Jude’s patents. Additional information regarding our litigation with St. Jude is provided in Note 4 “Commitments and Other Contractual Obligations – Litigation” to our consolidated financial statements and risks related to our intellectual property rights are described in “Risk Factors—Risks Related to Our Intellectual Property and Potential Litigation.”
Patents and Trademarks
We continue to expand and protect our intellectual property position. At December 31, 2011, we had a broad portfolio of over 550 owned or licensed U.S. and international patents and nearly 250 pending applications for owned or licensed patents. Our patents expire at various dates through 2031. We intend to continue to expand our intellectual property position to protect the design and use of our products, principally in the areas of IVUS, FFR, OCT imaging and image guided therapies for the diagnosis and guidance of treatment of vascular and structural heart disease. We continue to invest in internal research and development of concepts within our current markets and within other potential future markets. This enables us to continue to build our patent portfolio in areas of company interest.
Additionally, we utilize trademarks, trade names or logos in conjunction with the sale of our products. We currently have registered and common law trademarks in the U.S. and elsewhere in the world including, but not limited to, Axsun®, ChromaFlo®, ComboMap®, ComboWire®, Eagle Eye®, GlyDx®, PrimeWire®, PrimeWire Prestige®, Revolution®, s5™, s5i®, SmartMap®, SpinVision®, VH®, VIBE® and VOLCANO®.
Research and Development
Our research efforts are directed towards the development of new products and technologies that expand our existing platform of capabilities and applications in support of PCI. At December 31, 2011, our research and development staff consisted of 162 full-time engineers and technicians. The majority of this staff is located in Rancho Cordova, California. We also have research and development staff in San Diego, California; Billerica, Massachusetts; Cleveland, Ohio; and Forsyth County, Georgia. Our research and development staff is focused on the development of new multi-modality systems and catheters, FFR consoles and guide wires, image-guided therapy systems, OCT and additional clinical applications that support our core business objectives.
Our product development process incorporates teams organized around each of our core technologies, with each team having representatives from research and development, marketing, regulatory, quality, clinical affairs and
12
manufacturing. Our team sets development priorities based on communicated customer needs. The feedback received from beta testing is incorporated into successive design iterations until a new product is ready for release.
Our research and development expenses were $53.1 million in 2011, $42.5 million in 2010, and $37.4 million in 2009. These totals include expenses related to research and development, clinical and regulatory affairs. In addition, in 2010 we recorded a $3.0 million reduction in in-process research and development expenses related to the reversal of expenses recognized in the prior year for a development milestone related to the acquisition of the FL.IVUS program from Novelis, as we believed we would no longer achieve the milestone. In 2009 we recognized in-process research and development expense of $14.0 million, which included an $11.0 million milestone payment for our OCT project acquired from CardioSpectra and the accrual of a $3.0 million milestone payment related to our FL.IVUS project acquired from Novelis.
Manufacturing
Our manufacturing facilities are located in Rancho Cordova, California, where we produce multi-modality consoles, FFR consoles, IVUS catheters and FFR guide wires, and Billerica, Massachusetts, where we produce our optical monitors, laser and non-laser light sources, and optical engines used in OCT imaging systems as well as micro-optical spectrometers and optical channel monitors.
Our console manufacturing strategy is to use third-party manufacturing partners to produce circuit boards, CPUs, and mechanical sub-assemblies. We perform incoming inspection, final assembly and product testing to assure quality control. Our manufacturing strategy for our single-procedure disposable products is to use third-party manufacturing partners for certain proprietary components used in the final assembly. We perform incoming inspection on these components, assemble them into finished devices and test the final product to assure quality control. A portion of the scanner and sensor manufacturing is performed at third party contractors’ facilities using automated assembly processes and equipment. We are dependent on these third parties for day-to-day control and protection of their systems. We conduct the remaining process operations including final testing on the scanners and sensors at our Rancho Cordova facility. We aim to continuously improve our manufacturing processes to reduce costs and improve margins. We believe that by moving to PC-based consoles and improving our manufacturing processes through broad adoption of lean principles, selective use of automation and continuous design enhancements, we will be able to continue to reduce the cost to manufacture our consoles and single-procedure disposable products.
We manufacture our products in accordance with FDA other required global regulations. We believe we are in material compliance with the U.S., European, Japanese, and regulations. The FDA and the European Union Notified Body have both inspected our manufacturing facilities during the last 20 months. The control systems for our optical and laser products are certified under ISO 9001:2008.
We are constructing a new facility in Costa Rica to increase our manufacturing capacity. We plan to complete construction in the first quarter of 2012 and receive clearance from U.S. and European regulators in the second quarter of 2012—at which time we expect to begin commercial manufacturing activities. We expect to invest a total of approximately $40 million in the completion of this facility and related improvements. During 2011, we commenced the hiring and training of plant management and staff for the facility.
Government Regulation
Our medical device products are subject to extensive and rigorous regulation by the FDA, as well as other federal and state regulatory bodies in the U.S. and comparable authorities in other countries. We currently market our products in the U.S. under authorizations from the FDA, which are based on clearances of pre-market notification submissions, or 510(k); or approval of premarket approval applications, or PMA. If we seek to market new products, or to market new indications for our existing products, we will be required to obtain 510(k) clearance or PMA approval, as applicable. In January 2011, the FDA announced twenty-five action items it intends to take with respect to the pre-market notification process. Although the FDA has not detailed the
13
specific modifications or clarifications that it intends to make to its guidance, policies and regulations pertaining to the review and regulation of devices such as ours which seek and receive market clearance through the 510(k) pre-market notification process, the FDA’s announced action items signal that additional regulatory requirements are likely. These reforms, when implemented, could impose additional regulatory requirements upon us which could delay our ability to obtain new clearances, increase the costs of compliance, or restrict our ability to maintain our current clearances.
FDA regulations govern the following activities that we perform, or that are performed on our behalf, to ensure that medical products distributed domestically or exported internationally are safe and effective for their intended uses:
| | • | | product design, development and manufacture; |
| | • | | product safety, testing, labeling and storage; |
| | • | | product marketing, sales and distribution; and |
| | • | | post-marketing safety surveillance, complaint handling, investigating reports of adverse events and malfunctions, reporting of serious injuries, including deaths, repairs, and recall of products. |
Failure to comply with applicable regulatory requirements can result in enforcement action by the FDA, which may be preceded by notices of deficiencies or noncompliance via inspectional observations on form FDA-483, or 483s, general correspondence known as “Untitled Letters,” and more formal letters called “Warning Letters.” If we do not adequately and appropriately address the cited deficiencies or noncompliance, including the repair, replacement or recall of affected products if necessary, within a reasonable period of time, the FDA may take any one or more the following actions, which could adversely affect our business:
| | • | | order a mandatory recall; |
| | • | | physically seize the affected products; |
| | • | | seek a court-ordered injunction and consent decree that could include, but may not be limited to, operating restrictions, additional government oversight of our operations, specific corrective and preventative actions, and partial suspension or total shutdown of production; |
| | • | | suspend review or refuse to clear pending 510(k) submissions or approvals pending for new products, new intended uses, or modifications to existing products; |
| | • | | after notice and an opportunity for a hearing, withdraw 510(k) clearances or PMA approvals that have already been granted; |
| | • | | impose civil monetary penalties; and |
| | • | | initiate criminal prosecution. |
See “Risk factors—Risks Related to Government Regulation.”
Employees
At December 31, 2011, we had 1,289 full time employees. None of our employees is presented by a labor union, and we believe our employee relations are good.
Seasonality
Our business is generally seasonal in nature and, historically, demand for our products has been the highest in the fourth quarter. Our working capital requirements vary from period to period depending on manufacturing volumes, the timing of deliveries and the payment cycles of our customers.
14
Corporate Information
We were incorporated in the state of Delaware in January 2000. Our principal executive offices are located in San Diego, California.
Available Information
Our corporate website is www.volcanocorp.com and our Annual Report on Form 10-K, Quarterly Reports on Form 10-Q, Current Reports on Form 8-K, and amendments to reports filed pursuant to Sections 13(a) and 15(d) of the Securities Exchange Act of 1934, as amended, are available free of charge on our website as soon as reasonably practicable after we electronically file such material with, or furnish it to, the U.S. Securities and Exchange Commission, or SEC. The SEC maintains an Internet site that contains reports, proxy and information statements, and other information regarding the Company, at www.sec.gov. These reports and other information concerning the company may also be accessed at the SEC’s Public Reference Room at 100 F Street, NE, Washington, DC 20549. The public may obtain information on the operation of the Public Reference Room by calling the SEC at 1-800-SEC-0330. The contents of these websites are not incorporated into this filing. Further, our references to the URLs for these websites are intended to be inactive textual references only.
Risks Related to Our Business and Industry
We are dependent on the success of our consoles and catheters and cannot be certain that IVUS and FFR technology or our IVUS and FFR products will achieve the broad acceptance necessary for us to sustain a profitable business.
Our revenues are primarily derived from sales of our intravascular ultrasound, or IVUS, and fractional flow reserve, or FFR, products, which include our multi-modality consoles and our single-procedure disposable catheters and fractional flow reserve wires. IVUS technology is widely used in Japan for determining the placement of stents in patients with coronary disease but the penetration rate in the U.S. and Europe for the same type of procedure is relatively low. Our wires are used to measure the pressure and flow characteristics of blood around plaque, enabling physicians to gauge the physiological impact of blood flow and pressure. We expect that sales of our IVUS and FFR products will continue to account for a majority of our revenues for the foreseeable future, however it is difficult to predict the penetration and future growth rate or size of the market for IVUS and FFR technology. The expansion of the IVUS and FFR markets depends on a number of factors, such as:
| • | | physicians accepting the benefits of the use of IVUS and FFR in conjunction with angiography; |
| • | | physician experience with IVUS and FFR products either used alone or jointly used in a single percutaneous coronary intervention, or PCI; |
| • | | the availability of training necessary for proficient use of IVUS and FFR products, as well as willingness by physicians to participate in such training; |
| • | | the additional procedure time required for use of IVUS and FFR compared to the perceived benefits; |
| • | | the perceived risks generally associated with the use of our products and procedures, especially our new products and procedures; |
| • | | the placement of our products in treatment guidelines published by leading medical organizations; |
| • | | the availability of alternative treatments or procedures that are perceived to be or are more effective, safer, easier to use or less costly than IVUS and FFR technology; |
| • | | hospitals’ willingness, and having sufficient budgets, to purchase our IVUS and FFR products; |
15
| • | | the size and growth rate of the PCI, market in the major geographies in which we operate; |
| • | | the availability of adequate reimbursement; and |
| • | | the success of our marketing efforts and publicity regarding IVUS and FFR technology. |
Even if IVUS and FFR technology gain wide market acceptance, our IVUS and FFR products may not adequately address market requirements and may not continue to gain market acceptance among physicians, healthcare payors and the medical community due to factors such as:
| • | | the lack of perceived benefits of information related to plaque composition available to the physician through use of our IVUS products, including the ability to identify calcified and other forms of plaque; |
| • | | the lack of perceived benefits of information related to pressure and flow characteristics of blood around plaque available to the physician through the use of our FFR products; |
| • | | the actual and perceived ease of use of our IVUS and FFR products; |
| • | | the quality of the images rendered by our IVUS products; |
| • | | the quality of the measurements provided by our FFR products; |
| • | | the cost, performance, benefits and reliability of our IVUS and FFR products relative to competing products and services; |
| • | | the lack of perceived benefit of integration of our IVUS and FFR products into the catheterization laboratory, or cath lab; and |
| • | | the extent and timing of technological advances. |
If IVUS and FFR technology generally, or our IVUS and FFR products specifically, do not gain wide market acceptance, we may not be able to achieve our anticipated growth, revenues or profitability and our results of operations would suffer.
The risks inherent in our international operations may adversely impact our revenues, results of operations and financial condition.
We derive, and anticipate that we will continue to derive, a significant portion of our revenues from operations in Japan and Europe. As we expand internationally, we will need to hire, train and retain qualified personnel for our manufacturing and direct sales efforts, retain distributors and train their and our manufacturing, sales and other personnel in countries where language, cultural or regulatory impediments may exist. We cannot ensure that distributors, physicians, regulators or other government agencies will accept our products, services and business practices. Further, we purchase, and in the future will manufacture, some components in foreign markets. The manufacture, sale and shipment of our products and services across international borders, as well as the purchase of components from non-U.S. sources, subject us to extensive U.S. and foreign governmental trade regulations. Current or future trade, social and environmental regulations or political issues could restrict the supply of resources used in production or increase our costs. Compliance with such regulations is costly. Any failure to comply with applicable legal and regulatory obligations could impact us in a variety of ways that include, but are not limited to, significant criminal, civil and administrative penalties, including imprisonment of individuals, fines and penalties, denial of export privileges, seizure of shipments and restrictions on certain business activities. Failure to comply with applicable legal and regulatory obligations could result in the disruption of our manufacturing, shipping and sales activities. Our international sales operations expose us and our representatives, agents and distributors to risks inherent in operating in foreign jurisdictions, including:
| • | | our ability to obtain, and the costs associated with obtaining, U.S. export licenses and other required export or import licenses or approvals; |
| • | | changes in duties and tariffs, taxes, trade restrictions, license obligations and other non-tariff barriers to trade; |
16
| • | | burdens of complying with a wide variety of foreign laws and regulations related to healthcare products; |
| • | | costs of localizing product and service offerings for foreign markets; |
| • | | business practices favoring local companies; |
| • | | longer payment cycles and difficulties collecting receivables through foreign legal systems; |
| • | | difficulties in enforcing or defending agreements and intellectual property rights; |
| • | | differing local product preferences, including as a result of differing reimbursement practices; |
| • | | possible failure to comply with anti-bribery laws such as the United States Foreign Corrupt Practices Act and similar anti-bribery laws in other jurisdictions, even though non-compliance could be inadvertent; |
| • | | fluctuations in foreign currency exchange rates and their impact on our operating results; and |
| • | | changes in foreign political or economic conditions. |
In addition, we face risks associated with potential increased costs associated with overlapping tax structures, including the tax costs associated with repatriating cash. For example, the Obama Administration has announced potential legislative proposals to tax profits of U.S. companies earned abroad. We derive a significant portion of our revenues from our international operations, and while it is impossible for us to predict whether these and other proposals will be implemented, or how they will ultimately impact us, they may materially impact our results of operations if, for example, any future potential profits earned abroad are subject to U.S. income tax, or we are otherwise disallowed deductions as a result of any such profits.
We cannot ensure that one or more of these factors will not harm our business. Any material decrease in our international revenues or inability to expand our international operations would adversely impact our revenues, results of operations and financial condition.
Declines in the number of PCI procedures performed for any reason will adversely impact our business.
Our IVUS and FFR products are used in connection with procedures. Physicians may choose to perform less PCI procedures. For example, recently the number of PCI procedures declined, in part due to concerns attributed to efficacy of therapeutic treatment options, economic constraints, reduced number of restenosis, the long-term efficacy of drug-eluting stents and concerns by clinicians and payers regarding the appropriateness of conducting PCI procedures. If the number of PCI procedures continues to decline, the need for IVUS and FFR procedures could also decline, which would adversely impact our operating results and our business prospects.
We have a limited operating history, have only recently achieved profitability and cannot assure you that we will continue to achieve and sustain profitability in future periods.
We were formed in January 2000 and achieved our first and second full year of profitability in 2010 and 2011. To the extent that we are able to increase revenues, we expect our operating expenses will also increase as we expand our business to meet anticipated growing demand for our products; as we devote resources to our sales, marketing and research and development activities and as we satisfy our debt service obligations. If we are unable to reduce our cost of revenues and our operating expenses, we may not achieve sustained profitability. We expect to experience quarterly fluctuations in our revenues due to the timing of capital purchases by our customers and to a lesser degree the seasonality of disposable consumption by our customers. Additionally, expenses will fluctuate as we make future investments in research and development, selling and marketing and general and administrative activities, including as a result of new product introductions, transition from distributor arrangements to a direct sales force in different markets, satisfy our debt service obligations, and fund our litigation costs. This will cause us to experience variability in our reported earnings and losses in future periods. You should not rely on our operating results for any prior quarterly or annual period as an indication of our future operating performance.
17
We have a significant amount of indebtedness. We may not be able to generate enough cash flow from our operations to service our indebtedness, and we may incur additional indebtedness in the future, which could adversely affect our business, financial condition and results of operations.
We have a significant amount of indebtedness, including $115.0 million in aggregate principal with additional accrued interest of indebtedness under our 2.875% Convertible Senior Notes due 2015, or the Notes. Our ability to make payments on, and to refinance, our indebtedness, including the Notes, and to fund planned capital expenditures, research and development efforts, working capital, acquisitions and other general corporate purposes depends on our ability to generate cash in the future. This, to a certain extent, is subject to general economic, financial, competitive, legislative, regulatory and other factors, some of which are beyond our control. If we do not generate sufficient cash flow from operations or if future borrowings are not available to us in an amount sufficient to pay our indebtedness, including payments of principal upon conversion of the Notes or on their maturity or in connection with a transaction involving us that constitutes a fundamental change under the indenture governing the Notes, or to fund our liquidity needs, we may be forced to refinance all or a portion of our indebtedness, including the Notes, on or before the maturity thereof, sell assets, reduce or delay capital expenditures, seek to raise additional capital or take other similar actions. We may not be able to execute any of these actions on commercially reasonable terms or at all. Our ability to refinance our indebtedness will depend on our financial condition at the time, the restrictions in the instruments governing our indebtedness and other factors, including market conditions. In addition, in the event of a default under the Notes, the holders and/or the trustee under the indenture governing the Notes may accelerate our payment obligations under the Notes, which could have a material adverse effect on our business, financial condition and results of operations. Our inability to generate sufficient cash flow to satisfy our debt service obligations, or to refinance or restructure our obligations on commercially reasonable terms or at all, would likely have an adverse effect, which could be material, on our business, financial condition and results of operations.
In addition, our significant indebtedness, combined with our other financial obligations and contractual commitments, could have other important consequences. For example, it could:
| • | | make us more vulnerable to adverse changes in general U.S. and worldwide economic, industry and competitive conditions and adverse changes in government regulation; |
| • | | limit our flexibility in planning for, or reacting to, changes in our business and our industry; |
| • | | place us at a competitive disadvantage compared to our competitors who have less debt; and |
| • | | limit our ability to borrow additional amounts for working capital, capital expenditures, research and development efforts, acquisitions, debt service requirements, execution of our business strategy or other purposes. |
Any of these factors could materially and adversely affect our business, financial condition and results of operations. In addition, if we incur additional indebtedness, which we are not prohibited from doing under the terms of the indenture governing the Notes, the risks related to our business and our ability to service our indebtedness would increase.
Competition from companies, particularly those that have longer operating histories and greater resources than us, may harm our business.
The medical device industry, including the market for IVUS and FFR products, is highly competitive, subject to rapid technological change and significantly affected by new product introductions and market activities of other participants. As a result, even if the size of the IVUS and FFR market increases, we can make no assurance that our revenues will increase. In addition, as the markets for medical devices, including IVUS and FFR products, develop, additional competitors could enter the market. To compete effectively, we will need to continue to demonstrate that our products are attractive relative to alternative devices and treatments. We believe that our continued success depends on our ability to:
| • | | innovate and maintain scientifically advanced technology; |
18
| • | | apply our technology across products and markets; |
| • | | develop proprietary products; |
| • | | successfully conduct, sponsor or participate in clinical studies that expand our markets; |
| • | | obtain and maintain patent protection for our products; |
| • | | obtain and maintain regulatory clearance or approvals; |
| • | | manufacture cost-effectively and with consistently adequate quality; |
| • | | successfully market our products; and |
| • | | attract and retain skilled personnel. |
With respect to our IVUS products, our primary competitor is Boston Scientific, Inc., or Boston Scientific. Our FFR products compete with the products of St. Jude Medical, Inc., or St. Jude. We also compete in Japan with respect to IVUS products with Terumo Corporation, or Terumo. Boston Scientific, St. Jude, Terumo and other potential competitors who are or may be substantially larger than us may enjoy competitive advantages, including:
| • | | more established distribution networks; |
| • | | entrenched relationships with physicians; |
| • | | products and procedures that are less expensive; |
| • | | broader ranges of products and services that may be sold in bundled arrangements; |
| • | | greater experience in launching, marketing, distributing and selling products; |
| • | | greater experience in obtaining and maintaining FDA and other regulatory clearances and approvals; |
| • | | established relationships with healthcare providers and payors; and |
| • | | greater financial and other resources for product development, sales and marketing, acquisitions of products and companies, and intellectual property protection. |
For these and other reasons, we may not be able to compete successfully against our current or potential future competitors, and sales of our IVUS and FFR products may decline.
Failure to innovate may adversely impact our competitive position and may adversely impact our ability to drive price increases for our products and our product revenues.
Our future success will depend upon our ability to innovate new products and introduce enhancements to our existing products in order to address the changing needs of the marketplace. We also rely on new products and product enhancements to attempt to drive price increases for our products in our markets. Frequently, product development programs require assessments to be made of future clinical need and commercial feasibility, which are difficult to predict. Customers may forego purchases of our products and purchase our competitors’ products as a result of delays in introduction of our new products and enhancements, failure to choose correctly among technical alternatives or failure to offer innovative products or enhancements at competitive prices and in a timely manner. In addition, announcements of new products may result in a delay in or cancellation of purchasing decisions in anticipation of such new products. We may not have adequate resources to introduce new products in time to effectively compete in the marketplace. Any delays in product releases may negatively affect our business.
We also compete with new and existing alternative technologies that are being used to penetrate the worldwide vascular imaging market without using IVUS technology. These products, procedures or solutions could prove to be more effective, faster, safer or less costly than our IVUS products. Technologies such as
19
angiography, angioscopy, multi-slice computed tomography, intravascular magnetic resonance imaging, or MRI, electron beam computed tomography, and MRI with contrast agents are being used in lieu of or for imaging the vascular system.
We also develop and manufacture optical monitors, laser and non-laser light sources, and optical engines used in Optical Coherence Tomography, or OCT, imaging systems as well as micro-optical spectrometers and optical channel monitors with applications in telecommunications, pharmaceutical manufacturing, high-speed industrial process control, and chemical and petrochemical processing, medical diagnostics, and scientific discovery. Products developed by competitors based on tunable filter technology could compete on the basis of lower cost and other factors. In addition, customers may build similar functionality directly into their products, which in turn could decrease the demand for our OCT imaging systems and related products.
The introduction of new products, procedures or clinical solutions by competitors may result in price reductions, reduced margins, loss of market share and may render our products obsolete. We cannot guarantee that these alternative technologies will not be commercialized and become viable alternatives to our products in the future, and we cannot guarantee that we will be able to compete successfully against them if they are commercialized.
The successful continuing development of our existing and new products depends on us maintaining strong relationships with physicians.
The research, development, marketing, and sales of our products are dependent upon our maintaining working relationships with physicians. We rely on these professionals to provide us with considerable knowledge and experience regarding the development, marketing and sale of our products. If we are unable to maintain our strong relationships with these professionals and continue to receive their advice and input, our existing and new products may not be developed and marketed in line with the needs and expectations of the professionals who use or would use and support our products and the development and marketing of our products could suffer, which could have a material adverse effect on our business and results of operations.
Delays in planned product introductions may adversely affect our business and negatively impact future revenues.
We are currently developing new products as well as product enhancements with respect to our existing products. We have in the past experienced, and may again in the future experience, delays in various phases of product development and commercial launch, including during research and development, manufacturing, limited release testing, marketing and customer education efforts. In particular, developing and integrating products and technologies of acquired businesses is time consuming and in has in the past resulted, and may again in the future result, in longer developmental timelines than we initially anticipated. We are currently engaged in ongoing litigation regarding our (a) High Definition Swept Source non-laser light source and (b) our efforts to develop and obtain a laser light source from third parties with LightLab Imaging, Inc., or LightLab, in Delaware Chancery Court. LightLab is a wholly-owned subsidiary of St. Jude. Depending on the outcome of this litigation, we may experience delays in the commercial launch of our OCT imaging systems. Any delays in our product launches may significantly impede our ability to successfully compete in our markets and may reduce our revenues.
We and our present and future collaborators may fail to develop or effectively commercialize products covered by our present and future collaborations if:
| • | | our collaborators become competitors of ours or enter into agreements with our competitors; |
| • | | we do not achieve our objectives under our collaboration agreements; |
| • | | we are unable to manage multiple simultaneous product discovery and development collaborations; |
20
| • | | we develop products and processes or enter into additional collaborations that conflict with the business objectives of our other collaborators; |
| • | | we or our collaborators are unable to obtain patent protection for the products or proprietary technologies we develop in our collaborations; or |
| • | | we or our collaborators encounter regulatory hurdles that prevent commercialization of our products. |
In addition, conflicts may arise with our collaborators, such as conflicts concerning the interpretation of clinical data, the achievement of milestones, the interpretation of financial provisions or the ownership of intellectual property developed during the collaboration. If any conflicts arise with our existing or future collaborators, they may act in their self-interest, which may be adverse to our best interest.
If we or our collaborators are unable to develop or commercialize products, or if conflicts arise with our collaborators, we will be delayed or prevented from developing and commercializing products which will harm our business and financial results.
If the clinical studies that we sponsor or co-sponsor are unsuccessful, or clinical data from studies conducted by other industry participants are negative, we may not be able to develop or increase penetration in identified markets and our business prospects may suffer.
We sponsor or co-sponsor several clinical studies to demonstrate the benefits of our products in current markets where we are trying to increase use of our products and in new markets. Implementing a study is time consuming and expensive, and the outcome is uncertain. The completion of any of these studies may be delayed or halted for numerous reasons, including, but not limited to, the following:
| • | | the death of one or more patients during a clinical study for reasons that may or may not be related to our products, including the advanced stage of their disease or other medical problems; |
| • | | regulatory inspections of manufacturing facilities, which may, among other things, require us or a co-sponsor to undertake corrective action or suspend the clinical studies; |
| • | | changes in governmental regulations or administrative actions; |
| • | | adverse side effects in patients, including adverse side effects from our or a co-sponsor’s drug candidate or device; |
| • | | the FDA institutional review boards or other regulatory authorities do not approve a clinical study protocol or place a clinical study on hold; |
| • | | patients do not enroll in a clinical study or do not follow up at the expected rate; |
| • | | our co-sponsors do not perform their obligations in relation to the clinical study or terminate the study; |
| • | | third-party clinical investigators do not perform the clinical studies on the anticipated schedule or consistent with the clinical study protocol and good clinical practices, or other third-party organizations do not perform data collection and analysis in a timely or accurate manner; and |
| • | | the interim results of the clinical study are inconclusive or negative, and the study design, although approved and completed, is inadequate to demonstrate safety and efficacy of our products. |
Some of the studies that we co-sponsor are designed to study the efficacy of a third party’s drug candidate or device. Such studies are designed and controlled by the third party and the results of such studies will largely depend upon the success of the third party’s drug candidate or device. These studies may be terminated before completion for reasons beyond our control such as adverse events associated with a third-party drug candidate or device. A failure in such a study may have an adverse impact on our business by either the attribution of the study’s failure to our technology or our inability to leverage publicity for proper functionality of our products as part of a failed study.
21
Clinical studies may require the enrollment of large numbers of patients, and suitable patients may be difficult to identify and recruit. Patient enrollment in clinical studies and completion of patient follow-up depend on many factors, including the size of the patient population, the study protocol, the proximity of patients to clinical sites, eligibility criteria for the study and patient compliance. For example, patients may be discouraged from enrolling in our clinical studies if the applicable protocol requires them to undergo extensive post-treatment procedures or if they are persuaded to participate in different contemporaneous studies conducted by other parties. Delays in patient enrollment or failure of patients to continue to participate in a study may result in an increase in costs, delays or the failure of the study. Such events may have a negative impact on our business by making it difficult to penetrate or expand certain identified markets. Further, if we are forced to contribute greater financial and clinical resources to a study, valuable resources will be diverted from other areas of our business.
Negative results from clinical studies conducted by other industry participants could harm our results.
Divestitures of any of our businesses or product lines may materially adversely affect our business, results of operations and financial condition.
We continue to evaluate the performance of all of our businesses and may sell a business or product line. Any divestitures may result in significant write-offs, including those related to goodwill and other intangible assets, which could have a material adverse effect on our business, results of operations and financial condition. Divestitures could involve additional risks, including difficulties in the separation of operations, services, products and personnel, the diversion of management’s attention from other business concerns, the disruption of our business and the potential loss of key employees. We may not be successful in managing these or any other significant risks that we encounter in divesting a business or product line.
If we choose to acquire new businesses, products or technologies, we may experience difficulty in the identification or integration of any such acquisition, and our business may suffer.
Our success depends on our ability to continually enhance and broaden our product offerings in response to changing customer demands, competitive pressures and technologies. Accordingly, we have acquired, and may in the future acquire, complementary businesses, products or technologies instead of developing them ourselves. We do not know if we will identify or complete any additional acquisitions, or whether we will be able to successfully integrate any acquired business, product or technology or retain key employees. Integrating any business, product or technology we acquire could be expensive and time consuming, disrupt our ongoing business and distract our management. If we are unable to integrate any acquired businesses, products or technologies effectively, our business will suffer. We have entered, and may in the future enter, markets through our acquisitions that we are not familiar with and have no experience managing. If we fail to integrate these operations into our business, our resources may be diverted from our core business and this could have a material adverse effect on our business, financial condition and results of operations.
Our business has become more decentralized geographically through our acquisitions and this may expose us to operating inefficiencies across these diverse locations, including difficulties and unanticipated expenses related to the integration of departments, information technology systems, and accounting records and maintaining uniform standards, such as internal controls, procedures and policies. In addition, we have, and in the future may increase, our exposure to risks related to business operations outside the U.S. due to our acquisitions.
We may also encounter risks, costs and expenses associated with any undisclosed or other unanticipated liabilities or use more cash and other financial resources on integration and implementation activities than we expect. In addition, any amortization or other charges resulting from acquisitions could negatively impact our operating results.
22
If our products and technologies are unable to adequately identify the plaque that is most likely to rupture and cause a coronary event, we may not be able to develop a market for our vulnerable plaque products or expand the market for existing products.
We are utilizing substantial resources toward developing products and technologies to aid in the identification, diagnosis and treatment of the plaque that is most likely to rupture and cause a coronary event, or vulnerable plaque. The Providing Regional Observations to Study Predictors of Events in the Coronary Tree study demonstrated the ability of IVUS and virtual histology, or VH, to stratify lesions according to risk. However, no randomized controlled trial has been performed to assess the benefit of treating or deferring treatment in these stratified lesions. If we are unable to develop products or technologies that can identify vulnerable plaque, a market for products to identify vulnerable plaque may not materialize and our business may suffer.
Fluctuations in foreign currency exchange rates could result in declines in our reported revenues and earnings.
We do not engage in foreign currency hedging arrangements for our revenues or operating expenses, and, consequently, foreign currency fluctuations may adversely affect our revenues and earnings. During the fiscal year ended December 31, 2011, 30.7% and 16.6% of our revenues were denominated in the yen and euro, respectively, 12.9% of our operating expenses were denominated in the yen and 9.6% of our operating expenses were denominated in the euro. Commencing October 2009, we began using foreign currency forward contracts to manage a portion of the foreign currency risk related to our intercompany receivable balances with our foreign subsidiaries whose functional currencies are the euro and yen. We cannot be assured our hedges will be effective or that the costs of the hedges will not exceed their benefits. Fluctuations in the rate of exchange between the U.S. dollar and foreign currencies, primarily the euro and the yen, could result in material amounts of cash being required to settle the hedge transactions or could adversely affect our financial results. In periods of a strengthening U.S. dollar relative to the yen or a weakening U.S. dollar relative to the euro, we would record less revenue and our results of operations could be negatively impacted.
General national and worldwide economic conditions may materially and adversely affect our financial performance and results of operations.
Our operations and performance depend significantly on national and worldwide economic conditions and the resulting impact on purchasing decisions and the level of spending on our products by customers in the geographic markets in which our IVUS and FFR and other products are sold or distributed. These economic conditions remain challenging in many countries and regions, including without limitation the U.S., Japan, Europe, the Middle East and Africa, where we have generated most of our revenues. In the U.S., the recovery from the recent recession has been below historic averages and the unemployment rate is expected to remain high for some time. Inflation has fallen over the last several years, but is now rising, and central banks around the world have begun tightening monetary conditions to attempt to control inflation. The March 2011 tsunami and associated events in Japan negatively impacted many of our customers, as well as the conditions in which our Tokyo-based subsidiary operates. Such events may also result in a downturn in Japan’s economy as a whole, which may adversely affect our ability to conduct business in Japan. The challenging global economic conditions have also led to concerns over the solvency of certain European Union member states, including Greece, Ireland, Italy, Portugal and Spain. On August 5, 2011, Standard & Poor’s downgraded the U.S. credit rating to AA+ from its top rank of AAA, and the current U.S. debt ceiling and budget deficit concerns have increased the possibility of other credit-rating agency downgrades that could have a material adverse effect on the financial markets and economic conditions in the U.S. and throughout the world. Likewise, the political unrest in the Middle East may have adverse consequences to the global economy or to our customers in the Middle East, which could negatively impact our business. In any event, uncertainty about future economic conditions makes it difficult for us to forecast operating results and to make decisions about future investments. If our customers do not obtain or do not have access to the necessary capital to operate their businesses, or are otherwise adversely affected by the deterioration in national and worldwide economic conditions, this could result in reductions in the sales of our
23
products, longer sales cycles and slower adoption of new technologies by our customers, which would materially and adversely affect our business. We experienced declines in the number of PCI procedures performed (and related reductions in sales of our IVUS products) and in sales of our non-medical products to telecommunication and industrial companies during 2011 due to, in part, the then-prevailing economic conditions. In addition, our customers’, distributors’ and suppliers’ liquidity, capital resources and credit may be adversely affected by their relative ability or inability to obtain capital and credit, which could adversely affect our ability to collect on our outstanding invoices or lengthen our collection cycles, distribute our products or limit our timely access to important sources of raw materials necessary for the manufacture of our consoles and catheters.
We have invested our excess cash in money market funds and corporate debt securities issued by banks and corporations. The interest paid on these types of investments and the value of certain securities may decline. While our investment portfolio has experienced reduced yields, we have not yet experienced a deterioration of the credit quality of our holdings or other material adverse effects. There can be no assurances that our investment portfolio will not experience any such deterioration in credit quality or other material adverse effects in future periods, or that national and worldwide economic conditions will not worsen.
Our transition to a direct sales force in Japan may not be successful or may cause us to incur additional expenses and experience reduced revenues sooner than initially planned. If we are not successful or incur such additional expenses sooner than expected, then our business and results of operations may be materially and adversely affected.
Historically, a significant portion of our annual revenues have been derived from sales to our Japanese distributors. We have recently completed the termination of our distributor relationships in Japan, and have fully transitioned to a direct sales force in Japan. There is no assurance that we will be successful in our transition to a direct sales force in Japan and that we will be able to continue to successfully place, sell and service our products in Japan through a direct sales force or to successfully insure the growth of our direct sales force that may be needed in the future. Our challenges and potential risks in connection with expanding our direct sales force in Japan include, but are not limited to, (a) the successful retention and servicing of current dealers and customers in Japan, (b) strong market adoption of our technology in Japan, (c) the achievement of our growth and market development strategies in Japan, (d) our ability to recruit, train and retain an expanded direct sales force in Japan, and (e) the effect of the recent earthquake, tsunami and nuclear power plant meltdown in Japan on operating conditions as well as end-user demand. In addition, we may incur significant additional expenses and reduced revenues. Our efforts to successfully expand our direct sales strategy in Japan or the failure to achieve our sales objectives in Japan may adversely impact our revenues, results of operations and financial condition and negatively impact our ability to sustain and grow our business in Japan.
Quality problems with our processes and products could harm our reputation for producing high-quality products and erode our competitive advantage, sales, and market share.
The manufacture of our products is a highly exacting and complex process, due in part to strict regulatory requirements. Failure to manufacture our products in accordance with product specifications could result in increased costs, lost revenues, customer dissatisfaction or voluntary product recalls, any of which could harm our profitability and commercial reputation. Problems may arise during manufacturing for a variety of reasons, including equipment malfunction, failure to follow specific protocols and procedures, problems with raw materials, natural disasters, and environmental factors. Quality is extremely important to us and our customers due to the serious and costly consequences of product failure. Our quality certifications are critical to the marketing success of our products. If we fail to meet these standards, our reputation could be damaged, we could lose customers, and our revenue and results of operations could decline. Aside from specific customer standards, our success depends generally on our ability to manufacture to exact tolerances precision-engineered components, subassemblies, and finished devices from multiple materials. If our components fail to meet these standards or fail to adapt to evolving standards, our reputation as a manufacturer of high-quality devices will be harmed, our competitive advantage could be damaged, and we could lose customers and market share.
24
Our manufacturing operations are dependent upon third-party suppliers, some of which are sole-sourced, which makes us vulnerable to supply problems, price fluctuations and manufacturing delays.
We rely on a number of sole source suppliers to supply transducers, substrates and processing for our scanners used in our catheters. We do not carry significant inventory of transducers, substrates or scanner subassemblies. If we had to change suppliers, we expect that it would take six to 24 months to identify appropriate suppliers, complete design work and undertake the necessary inspections and testing before the new transducers and substrates would be available. We are not parties to supply agreements with these suppliers but instead use purchase orders as needed.
Our reliance on these sole source suppliers subjects us to a number of risks that could impact our ability to manufacture our products and harm our business, including:
| • | | inability to obtain adequate supply in a timely manner or on commercially reasonable terms; |
| • | | interruption or delayed delivery of supply resulting from our suppliers’ difficulty in accessing financial or credit markets or otherwise secure cash and capital resources; |
| • | | interruption of supply resulting from modifications to, or discontinuation of, a supplier’s operations; |
| • | | delays in product shipments resulting from uncorrected defects, reliability issues or a supplier’s variation in a component; |
| • | | uncorrected quality and reliability defects that impact performance, efficacy and safety of products from replacement suppliers; |
| • | | price fluctuations due to a lack of long-term supply arrangements with our suppliers for key components; |
| • | | difficulty identifying and qualifying alternative suppliers for components in a timely manner; |
| • | | production delays related to the evaluation and testing of products from alternative suppliers and corresponding regulatory qualifications; and |
| • | | delays in delivery by our suppliers due to changes in demand from us or their other customers. |
In addition, because we do not have long term supply agreements with some of our suppliers, we are subjected to the following risks:
| • | | unscheduled price increases; |
| • | | lack of notice when the materials used to manufacture are not available; |
| • | | lack of notice of discontinued operations or manufacturing. |
We also utilize lean manufacturing processes that attempt to optimize the timing of our inventory purchases and supply levels of our inventories. Any significant delay or interruption in the supply of components or materials, or our inability to obtain substitute components or materials from alternate sources at acceptable prices and in a timely manner or to plan for sufficient inventory, could impair our ability to manufacture our products or meet the demand of our customers and harm our business. Identifying and qualifying additional or replacement suppliers for any of the components or materials used in our products, or obtaining additional inventory, if required, may not be accomplished quickly or at all and could involve significant additional costs. Any supply interruption from our suppliers or failure to obtain additional suppliers for any of the components or materials used to manufacture our products or sufficient inventory would limit our ability to manufacture our products and could therefore have a material adverse effect on our business, financial condition and results of operations.
We are constructing facilities in Costa Rica, may encounter a number of challenges relating to the construction, management and operation of such facilities, and the expansion has and will continue to increase our fixed costs, which may have a negative impact on our financial results and condition.
On September 23, 2010, we, through a wholly owned subsidiary, entered into a series of agreements to acquire real property and design and build manufacturing facilities in Costa Rica. We have never established or operated
25
manufacturing facilities outside the U.S., and cannot assure you that we will be able to successfully establish or operate these facilities in a timely or profitable manner, or at all. We depend upon Zona Franca Coyol, a third-party construction company, to assist us in the design, construction and validation of the manufacturing facilities. In addition, we will need to transfer our manufacturing processes, technology and know-how to our Costa Rica facilities. If we are unable to establish or operate these facilities or successfully transfer our manufacturing processes, technology and know-how in a timely and cost-effective manner, or at all, then we may experience disruptions in our operations, which could negatively impact our business and financial results.
We will need to obtain a number of permits and regulatory approvals prior, and subsequent, to commencing operations in such facilities. Our ability to obtain necessary permits and approvals may be subject to additional costs and possible delays beyond what we initially plan for. In addition, our manufacturing facilities, and those of our suppliers, must comply with applicable regulatory requirements. Failure of our manufacturing facilities to comply with regulatory and quality requirements would harm our business and our results of operations.
Our ability to operate this facility successfully will greatly depend on our ability to hire, train and retain an adequate number of employees, in particular employees with the appropriate level of knowledge, background and skills. We will compete with several other medical device companies with manufacturing facilities in Costa Rica to hire these skilled employees. Should we be unable to hire such employees, and an adequate number of them, our business and financial results could be negatively impacted.
As we continue construction on these manufacturing facilities, our fixed costs will increase. If we experience a demand in our products that exceeds our manufacturing capacity, we may not have sufficient inventory to meet our customers’ demands, which would negatively impact our revenues. If the demand for our products decreases or if we do not produce the output we plan or anticipate after the facilities are operational, we may not be able to spread a significant amount of our fixed costs over the production volume, thereby increasing our per unit fixed cost, which would have a negative impact on our financial condition and results of operations.
We also face particular commercial, jurisdictional and legal risks associated with our proposed expansion in Costa Rica. The success of this relationship and our activities in Costa Rica in general are subject to the economic, political and legal conditions or developments in Costa Rica.
Disruptions or other adverse developments during the construction and planned operations stage of our planned Costa Rica facilities could materially adversely affect our business. If our Costa Rica operations are disrupted for any reason, we may be forced to locate alternative manufacturing facilities, including facilities operated by third parties. Disruptions may include, but are not limited to: changes in the legal and regulatory environment in Costa Rica; slowdowns or work stoppages within the Costa Rican customs authorities; acts of God (including but not limited to potential disruptive effects from an active volcano near the facility or earthquakes, hurricanes and other natural disasters); and other issues associated with significant operations that are remote from our headquarters and operations centers. Additionally, continued growth in product sales could outpace the ability of our Costa Rican operation to supply products on a timely basis or cause us to take actions within our manufacturing operations which increase costs, complexity and timing. Locating alternative facilities would be time-consuming, would disrupt our production and cause shipment delays and could result in damage to our reputation and profitability. Additionally, we cannot assure you that alternative manufacturing facilities would offer the same cost structure as our Costa Rica facility.
If our facilities or systems are damaged or destroyed, we may experience delays that could negatively impact our revenues or other adverse effects.
Our facilities may be affected by natural or man-made disasters. If one of our facilities were affected by a disaster, we would be forced to rely on third-party manufacturers or to shift production to another manufacturing facility. In such an event, we would face significant delays in manufacturing which would prevent us from being able to sell our products. In addition, our insurance may not be sufficient to cover all of the potential losses and may not continue to be available to us on acceptable terms, or at all. Furthermore, although our computer and
26
communications systems are protected through physical and software safeguards, they are still vulnerable to fire, storm, flood, power loss, earthquakes, telecommunications failures, physical or software break-ins, software viruses, and similar events, and any failure of these systems to perform for any reason and for any period of time could adversely impact our ability to operate our business.
We may require significant additional capital to pursue our growth strategy, and our failure to raise capital when needed could prevent us from executing our growth strategy.
We believe that our existing cash and cash equivalents and short-term and long-term available-for-sale investments will be sufficient to meet our anticipated cash needs for at least the next 12 months. However, we may need to obtain additional financing to pursue our business strategy, to respond to new competitive pressures or to act on opportunities to acquire or invest in complementary businesses, products or technologies. The timing and amount of our working capital and capital expenditure requirements may vary significantly depending on numerous factors, including:
| • | | market acceptance of our products; |
| • | | the revenues generated by our products; |
| • | | the need to adapt to changing technologies and technical requirements, and the costs related thereto; |
| • | | the costs associated with expanding our manufacturing, marketing, sales and distribution efforts; |
| • | | the existence and timing of opportunities for expansion, including acquisitions and strategic transactions; and |
| • | | costs and fees associated with defending existing or potential litigation. |
In addition, we are required to make periodic interest payments to the holders of the Notes and to make payments of principal upon conversion or maturity. We may also be required to purchase the Notes for cash upon the occurrence of a change of control or certain other fundamental changes involving us. If our capital resources are insufficient to satisfy our debt service or liquidity requirements, we may seek to sell additional equity or debt securities or to obtain debt financing. The sale of additional equity or debt securities, or the use of our stock in an acquisition or strategic transaction, would result in additional dilution to our stockholders. Additional debt would result in increased expenses and could result in covenants that would restrict our operations. We have not made arrangements to obtain additional financing and our significant historical losses and the current national and global financial conditions may prevent us from obtaining additional funds on favorable terms, if at all.
We are dependent on our collaborations, and events involving these collaborations or any future collaborations could delay or prevent us from developing or commercializing products.
The success of our current business strategy and our near- and long-term viability will depend on our ability to execute successfully on existing strategic collaborations and to establish new strategic collaborations. Collaborations allow us to leverage our resources and technologies and to access markets that are compatible with our own core areas of expertise. To penetrate our target markets, we may need to enter into additional collaborative agreements to assist in the development and commercialization of future products. Establishing strategic collaborations is difficult and time-consuming. Potential collaborators may reject collaborations based upon their assessment of our financial, regulatory or intellectual property position or our internal capabilities. Our discussions with potential collaborators may not lead to the establishment of new collaborations on favorable terms or at all.
We have collaborations with a number of entities, including Medtronic, Inc., The Cleveland Clinic Foundation, General Electric Company, Siemens AG, Philips Medical Systems Nederland B.V., and Abbott. In each collaboration, we combine our technology or core capabilities with those of the third party to permit either greater penetration into markets or to enhance the functionality of our current and planned products. We have limited control over the amount and timing of resources that our current collaborators or any future collaborators
27
devote to our collaborations or potential products. These collaborators may breach or terminate their agreements with us or otherwise fail to conduct their collaborative activities successfully and in a timely manner. Further, our collaborators may not develop or commercialize products that arise out of our collaborative arrangements or devote sufficient resources to the development, manufacture, marketing or sale of these products. Moreover, in the event of termination of a collaboration agreement, we may not realize the intended benefits or we may not be able to replace the arrangement on comparable terms or at all.
If the third-party distributors that we rely on to market and sell our products are not successful, we may be unable to increase or maintain our level of revenues.
A portion of our revenue is generated by our third-party distributors, especially in international markets. If these distributors cease or limit operations or experience a disruption of their business operations, or are not successful in selling our products, we may be unable to increase or maintain our level of revenues, and any such developments could negatively affect our international sales strategy. Over the long term, we intend to grow our business internationally, and to do so we will need to attract additional distributors to expand the territories in which we do not directly sell our products. Our distributors may not commit the necessary resources to market and sell our products. If current or future distributors do not continue to distribute our products or do not perform adequately or if we are unable to locate distributors in particular geographic areas, we may not realize revenue growth internationally.
Our reported or future financial results could be adversely affected by the application of existing or future accounting standards.
U.S. generally accepted accounting principles and related implementation guidelines and interpretations can be highly complex and involve subjective judgments. Changes in these rules or their interpretation, the adoption of new guidance or the application of existing guidance to changes in our business could have a significant adverse effect on our financial results. For example, the accounting for convertible debt securities, and the accounting for the convertible note hedge transactions and the warrant transactions we entered into in connection with the offering of the Notes, is subject to frequent scrutiny by the accounting regulatory bodies and is subject to change. We cannot predict if or when any such change could be made and any such change could have an adverse impact on our reported or future financial results. In addition, in the event the conversion features of the Notes are triggered, we could be required under applicable accounting standards to reclassify all or a portion of the outstanding principal of the Notes as a current rather than long-term liability, which would result in a material reduction of our net working capital.
We cannot assure you that our net operating loss carryforwards will be available to reduce our tax liability.
Our ability to use our net operating loss carryforwards to reduce future income tax obligations may be limited or reduced. Generally, a change of more than 50 percentage points in the ownership of our shares, by value, over the three-year period ending on the date the shares were acquired constitutes an ownership change and may limit our ability to use our net operating loss carryforwards. Should additional ownership changes occur in the future, our ability to utilize our net operating loss carryforwards could be limited.
If we fail to properly manage our anticipated growth, our business could suffer.
Rapid growth of our business is likely to continue to place a significant strain on our managerial, operational and financial resources and systems. To execute our anticipated growth successfully, we must attract and retain qualified personnel and manage and train them effectively. We anticipate hiring additional personnel to assist in the commercialization of our current products and in the development of future products. We will be dependent on our personnel and third parties to effectively market and sell our products to an increasing number of customers. We will also depend on our personnel to develop and manufacture in anticipated increased volumes our existing products, as well as new products and product enhancements. Further, our anticipated growth will
28
place additional strain on our suppliers resulting in increased need for us to carefully monitor for quality assurance. Any failure by us to manage our growth effectively could have an adverse effect on our ability to achieve our development and commercialization goals.
Issues arising from the implementation of our new enterprise resource planning system could adversely affect our operating results and ability to manage our business effectively.
We have begun implementing a new enterprise resource planning, or ERP, system to further enhance operating efficiencies and provide more effective management of our business operations. The new ERP system is being deployed for use throughout our company in a number of “go live” phases, the first of which occurred during the fourth quarter of 2011 with company-wide deployment expected to be completed during the second quarter of 2012. Implementing a new ERP system is costly and involves risks inherent in the conversion to a new computer system, including loss of information, disruption to our normal operations, changes in accounting procedures and internal control over financial reporting, as well as problems achieving accuracy in the conversion of electronic data. Failure to properly or adequately address these issues could result in increased costs, the diversion of management’s and employees’ attention and resources and could materially adversely affect our operating results, internal controls over financial reporting and ability to manage our business effectively. While the ERP system is intended to further improve and enhance our information systems, large scale implementation of a new information system exposes us to the risks of starting up the new system and integrating that system with our existing systems and processes, including possible disruption of our financial reporting, which could lead to a failure to make required filings under the federal securities laws on a timely basis.
Any defects or malfunctions in the computer hardware or software we utilize in our products could cause severe performance failures in such products, which would harm our reputation and adversely affect our results of operations and financial condition.
Our existing and new products depend and will depend on the continuous, effective and reliable operation of computer hardware and software. For example, our IVUS products utilize sophisticated software that analyzes in real-time plaque composition and identifies lumen and vessel borders, which are then displayed in three-dimensional, color-coded images on a computer screen. Any defect, malfunction or other failing in the computer hardware or software utilized by our IVUS or other products, including products we develop in the future, could result in inaccurate readings, misinterpretations of data, or other performance failures that could render our products unreliable or ineffective and could lead to decreased confidence in our products, damage to our reputation, reduction in our sales and product liability claims, the occurrence of any of which could have a material adverse effect on our results of operations and financial condition. Although we update the computer software utilized in our products on a regular basis, there can be no guarantee that defects do not or will not in the future exist or that unforeseen malfunctions, whether within our control or otherwise, will not occur.
If we are unable to recruit, hire and retain skilled and experienced personnel, our ability to effectively manage and expand our business will be harmed.
Our success largely depends on the skills, experience and efforts of our officers and other key employees who may terminate their employment at any time. The loss of any of our senior management team, in particular our President and Chief Executive Officer, R. Scott Huennekens, could harm our business. We have entered into employment contracts or similar agreements with R. Scott Huennekens; our Chief Financial Officer, John T. Dahldorf; our Executive Vice President, Global Sales, Jorge J. Quinoy; and Michel Lussier, President of Volcano Europe and Clinical and Scientific Affairs, Advanced Imaging Systems, Scientific Affairs, and EMEA, but these agreements do not guarantee that they will remain employed by us in the future. The announcement of the loss of one of our key employees could negatively affect our stock price. Our ability to retain our skilled workforce and our success in attracting and hiring new skilled employees will be a critical factor in determining whether we will be successful in the future. We face challenges in hiring, training, managing and retaining employees in certain
29
areas including clinical, technical, sales and marketing. This could delay new product development and commercialization, and hinder our marketing and sales efforts, which would adversely impact our competitiveness and financial results.
The expense and potential unavailability of insurance coverage for our company, customers or products may have an adverse effect on our financial position and results of operations.
While we currently have insurance for our business, property, directors and officers, and product liability, insurance is increasingly costly and the scope of coverage is narrower, and we may be required to assume more risk in the future. If we are subject to claims or suffer a loss or damage in excess of our insurance coverage, we will be required to cover the amounts outside of or in excess of our insurance limits. If we are subject to claims or suffer a loss or damage that is outside of our insurance coverage, we may incur significant costs associated with loss or damage that could have an adverse effect on our financial position and results of operations. Furthermore, any claims made on our insurance policies may impact our ability to obtain or maintain insurance coverage at reasonable costs or at all. We do not have the financial resources to self-insure, and it is unlikely that we will have these financial resources in the foreseeable future.
Our product liability insurance covers our products and business operations, but we may need to increase and expand this coverage commensurate with our expanding business. Any product liability claims brought against us, with or without merit, could result in:
| • | | substantial costs of related litigation or regulatory action; |
| • | | substantial monetary penalties or awards; |
| • | | decreased demand for our products; |
| • | | reduced revenue or market penetration; |
| • | | injury to our reputation; |
| • | | withdrawal of clinical study participants; |
| • | | an inability to establish new strategic relationships; |
| • | | increased product liability insurance rates; and |
| • | | an inability to secure continuing coverage. |
Some of our customers and prospective customers may have difficulty in procuring or maintaining liability insurance to cover their operation and use of our products. Medical malpractice carriers are withdrawing coverage in certain regions or substantially increasing premiums. If this trend continues or worsens, our customers may discontinue using our products and potential customers may opt against purchasing our products due to the cost or inability to procure insurance coverage.
Compliance with changing corporate governance and public disclosure regulations may result in additional expenses.
Changing laws, regulations and standards relating to corporate governance and public disclosure, including the Sarbanes-Oxley Act of 2002, the Dodd-Frank Wall Street Reform and Consumer Protection Act, new SEC regulations and Nasdaq Global Select Market rules, are creating uncertainty for companies such as ours. To maintain high standards of corporate governance and public disclosure, we have invested, and intend to continue to invest, in reasonably necessary resources to comply with evolving standards. These investments have resulted in increased general and administrative expenses and a diversion of management time and attention from revenue-generating activities and may continue to do so in the future.
30
Risks related to government regulation
If we fail to obtain or maintain, or experience significant delays in obtaining, regulatory clearances or approvals for our products or product enhancements, our ability to commercially distribute and market our products could suffer.
Our products are subject to rigorous regulation by the FDA and numerous other federal, state and foreign governmental authorities. Our failure to comply with such regulations or to make adequate, timely corrections, could lead to the imposition of injunctions, suspensions or loss of marketing clearances or approvals, product recalls, manufacturing cessation, termination of distribution, product seizures, civil penalties, or some combination of such actions. The process of obtaining regulatory authorizations to market a medical device, particularly from the FDA, can be costly and time consuming, and there can be no assurance that such authorizations will be granted on a timely basis, if at all. If regulatory clearance or approvals are received, additional delays may occur related to manufacturing, distribution, or product labeling. In addition, we cannot assure you that any new or modified medical devices we develop will be eligible for the shorter 510(k) clearance process as opposed to the PMA process. We have no experience in obtaining PMA approvals.
In the member states of the European Economic Area, or EEA, our medical devices are required to comply with the essential requirements of the EU Medical Devices Directives before they can be marketed. Our products, including their design and manufacture, have been certified by the British Standards Institute, or BSI, a United Kingdom Notified Body, as being compliant with the requirements of the Medical Devices Directives. Consequently, we are entitled to affix a CE mark to our products and their packaging and this gives us the right to sell them in the EEA. If we fail to maintain compliance with the Medical Devices Directives, our products will no longer qualify for the CE mark and the relevant devices would not be eligible for marketing in the EEA.
We currently market our IVUS and FFR products in Japan under two types of regulatory approval known as a SHONIN and a NINSHO. As the holder of the SHONINs, we have the authority to import and sell those products for which we have the SHONINs as well as those products for which we have obtained a NINSHO. Responsibility for Japanese regulatory filings and future compliance resides with us. We cannot guarantee that we will be able to adequately meet Japanese regulatory requirements. Non-compliance with Japanese regulations may result in action to prohibit further importation and sale of our products in Japan, a significant market for our products. If we are unable to sell our IVUS and FFR products in Japan, we will lose a significant part of our annual revenues, and our business will be substantially impacted.
Foreign governmental authorities that regulate the manufacture and sale of medical devices have become increasingly stringent, and to the extent we continue to market and sell our products in foreign countries, we will be subject to rigorous regulation in the future. In such circumstances, where we utilize distributors in foreign countries to market and sell our products, we would rely significantly on our distributors to comply with the varying regulations, and any failures on their part could result in restrictions on the sale of our products in foreign countries. Regulatory delays or failures to obtain and maintain marketing authorizations, including 510(k) clearances and PMA approvals, could disrupt our business, harm our reputation, and adversely affect our sales.
Modifications to our products may require new regulatory clearances or approvals or may require us to recall or cease marketing our products until clearances or approvals are obtained.
Modifications to our products may require the submission of new 510(k) notifications or PMA applications. If a modification is implemented to address a safety concern, we may also need to initiate a recall or cease distribution of the affected device. In addition, if the modified devices require the submission of a 510(k) or PMA and we distribute such modified devices without a new 510(k) clearance or PMA approval, we may be required to recall or cease distributing the devices. The FDA can review a manufacturer’s decision not to submit a modification and may disagree. The FDA may also on its own initiative determine that clearance of a new 510(k) or approval of a new PMA submission is required. We have made modifications to our products in the past and may make additional modifications in the future that we believe do not or will not require clearance of a new 510(k) or approval of a new PMA. If we begin manufacture and distribution of the modified devices and the
31
FDA later disagrees with our determination and requires the submission of a new 510(k) or PMA for the modifications, we may also be required to recall the distributed modified devices and to stop distribution of the modified devices, which could have an adverse effect on our business. If the FDA does not clear or approve the modified devices, we may need to redesign the devices, which could also harm our business. When a device is marketed without a required clearance or approval, the FDA has the authority to bring an enforcement action, including injunction, seizure and, in egregious circumstances, criminal prosecution. The FDA considers such additional actions generally when there is a serious risk to public health or safety and the company’s corrective and preventive actions are inadequate to address the FDA’s concerns.
Where we determine that modifications to our products require clearance of a new 510(k) or approval of a new PMA or PMA supplement, we may not be able to obtain those additional clearances or approvals for the modifications or additional indications in a timely manner, or at all. For those products sold in the EEA, we must notify BSI, our EEA Notified Body, if significant changes are made to the products or if there are substantial changes to our quality assurance systems affecting those products. Delays in obtaining required future clearances or approvals would adversely affect our ability to introduce new or enhanced products in a timely manner, which in turn would harm our future growth.
The FDA is reviewing the 510(k) process and could change the criteria to obtain clearance which could affect our ability to obtain timely reviews and increase the resources needed to meet new criteria.
Over the past several years, concerns have been raised about whether the 510(k) program optimally achieves its intended goals. The FDA released for public comment in August 2010 a set of preliminary reports and recommendations from an internal 510(k) Working Group and Task Force on the Utilization of Science in Regulatory Decision Making. In January 2011, the FDA announced 25 action items it intends to take with respect to the pre-market notification process. Although the FDA has not detailed the specific modifications or clarifications that it intends to make to its guidance, policies and regulations pertaining to the review and regulation of devices such as ours which seek and receive market clearance through the 510(k) pre-market notification process, it has issued several draft guidance documents that, if implemented, will likely entail additional regulatory burdens. These additional regulatory burdens could delay our ability to obtain new clearances, increase the costs of compliance, or restrict our ability to maintain our current clearances. In the future, the FDA will announce which draft guidance documents it will finalize and implement, along with any other recommended improvements, and the timeline for their implementation.
If the FDA makes changes to the 510(k) program, we may be required to prepare and submit more data and information than is currently required, which could require additional resources and more expense, require more time to prepare a submission, and result in a longer review period by the FDA. Such changes could adversely affect our business.
If we or our suppliers fail to comply with the FDA’s Quality System Regulation or ISO Quality Management Systems, manufacturing of our products could be negatively impacted and sales of our products could suffer.
Our manufacturing practices must be in compliance with the FDA’s 21 CFR Part 820 Quality System Regulation, or QSR, which governs the facilities, methods, controls, procedures, and records of the design, manufacture, packaging, labeling, storage, shipping, installation, and servicing of our products intended for human use. We are also subject to similar state and foreign requirements and licenses, including the MDD—93/42/EEC and the ISO 13485 Quality Management Systems, or QMS, standard applicable to medical devices. In addition, we must engage in regulatory reporting in the case of potential patient safety risks and must make available our manufacturing facilities, procedures, and records for periodic inspections and audits by governmental agencies, including the FDA, state authorities and comparable foreign agencies. If we fail to comply with the QSR, QMS, or other applicable regulations and standards, our operations could be disrupted and our manufacturing interrupted, and we may be subject to enforcement actions if our corrective and preventive actions are not adequate to ensure compliance.
32
Failure to take adequate corrective action in response to inspectional observations or any notice of deficiencies from a regulatory inspection or audit could result in partial or total shut-down of our manufacturing operations unless and until adequate corrections are implemented, voluntary or FDA-ordered recall, FDA seizure of affected devices, court-ordered injunction or consent decree that could impose additional regulatory oversight and significant requirements and limitations on our manufacturing operations, significant fines, suspension or withdrawal of marketing clearances and approvals, and criminal prosecutions, any of which would cause our business to suffer. Furthermore, our key component suppliers may not currently be or may not continue to be in compliance with applicable regulatory requirements, which may result in manufacturing delays for our products and cause our revenue to decline.
The FDA, BSI, Japan’s Pharmaceutical & Medical Device Administration, or PMDA, and other regulatory agencies and bodies have previously imposed inspections and audits on us, and may in the future impose additional inspections or audits at any time which may conclude that our quality system is noncompliant with applicable regulations and standards. Such findings could potentially disrupt our business, harm our reputation and adversely affect our sales.
Our products may in the future be subject to product recalls or voluntary market withdrawals that could harm our reputation, business and financial results.
The FDA and similar foreign governmental authorities have the authority to require the recall of commercialized products in the event of material deficiencies or defects in design or manufacture that could affect patient safety. In the case of the FDA, the authority to require a recall must be based on an FDA finding that there is a reasonable probability that the device would cause serious adverse health consequences or death. Manufacturers may, under their own initiative, recall a product if any material deficiency in a device is found or suspected. For example, in 2010 we recalled our Xtract™ catheter in circumstances where no patient safety incident was reported but where we had evidence that the device’s integrity could be compromised under certain storage conditions. A government-mandated recall or voluntary recall by us or one of our distributors could occur as a result of component failures, manufacturing errors, design or labeling defects or other issues. Recalls, which include corrections as well as removals, of any of our products would divert managerial and financial resources and could have an adverse effect on our financial condition, harm our reputation with customers, and reduce our ability to achieve expected revenues.
We are required to comply with medical device reporting, or MDR, requirements and must report certain malfunctions, deaths, and serious injuries associated with our products, which can result in voluntary corrective actions or agency enforcement actions.
Under the FDA MDR regulations, medical device manufacturers are required to submit information to the FDA when they receive a report or become aware that a device has or may have caused or contributed to a death or serious injury or has or may have a malfunction that would likely cause or contribute to death or serious injury if the malfunction were to recur. All manufacturers placing medical devices on the market in the EEA are legally bound to report any serious or potentially serious incidents involving devices they produce or sell to the Competent Authority in whose jurisdiction the incident occurred. Were this to happen to us, the relevant Competent Authority would file an initial report, and there would then be a further inspection or assessment if there were particular issues. This would be carried out either by the Competent Authority or it could require that the BSI, as the Notified Body, carry out the inspection or assessment.
Malfunction of our products could result in future voluntary corrective actions, such as recalls, including corrections, or customer notifications, or agency action, such as inspection or enforcement actions. Malfunctions have been reported to us in the past, and, while we investigated each of the incidents and believe we have taken the necessary corrective and preventive actions, we cannot guarantee that similar or different malfunctions will not occur in the future. If malfunctions do occur, we cannot guarantee that we will be able to correct the malfunctions adequately or prevent further malfunctions, in which case we may need to cease manufacture and distribution of the affected devices, initiate voluntary recalls, and redesign the devices; nor can we ensure that
33
regulatory authorities will not take actions against us, such as ordering recalls, imposing fines, or seizing the affected devices. If someone is harmed by a malfunction or by product mishandling, we may be subject to product liability claims. Any corrective action, whether voluntary or involuntary, as well as defending ourselves in a lawsuit, will require the dedication of our time and capital, distract management from operating our business, and may harm our reputation and financial results.
We are subject to federal, state and foreign healthcare laws and regulations and implementation or changes to such healthcare laws and regulations could adversely affect our business and results of operations.
In an effort to contain rising healthcare costs, in March 2010, President Obama signed into law the Patient Protection and Affordable Care Act, as amended by the Health Care and Education Affordability Reconciliation Act, collectively, the PPACA, which may significantly affect the payment for, and the availability of, healthcare services and result in fundamental changes to federal healthcare reimbursement programs. The PPACA includes, among other things, the following measures:
| • | | a deductible 2.3% excise tax on any entity that manufactures or imports medical devices offered for sale in the U.S., with limited exceptions, effective 2013; |
| • | | a new Patient-Centered Outcomes Research Institute to oversee, identify priorities in and conduct comparative clinical effectiveness research; |
| • | | new reporting and disclosure requirements on device manufacturers for any “transfer of value” made or distributed to physicians and teaching hospitals, with the first report due on March 30, 2013; |
| • | | payment system reforms including a national pilot program on payment bundling to encourage hospitals, physicians and other providers to improve the coordination, quality and efficiency of certain healthcare services through bundled payment models, beginning on or before January 1, 2013; and |
| • | | an independent payment advisory board that will submit recommendations to reduce Medicare spending if projected Medicare spending exceeds a specified growth rate. |
We are unable to predict at this time the impact of such recently enacted federal healthcare reform legislation on the medical device industry in general, or on us in particular and what, if any, additional legislation or regulation relating to the medical device industry may be enacted in the future. An expansion in the government’s role in the U.S. healthcare industry may cause general downward pressure on the prices of medical device products, lower reimbursements for procedures using our products, reduce medical procedure volumes and adversely affect our business and results of operations. Although we cannot predict the many ways that the federal healthcare reform laws might affect our business, we will be subject to the 2.3% excise tax scheduled to take effect in 2013. It is unclear whether and to what extent, if at all, other anticipated developments resulting from the federal healthcare reform legislation, such as an increase in the number of people with health insurance and an increased focus on preventive medicine, may provide us additional revenue to offset this excise tax. If additional revenue does not materialize, or if our efforts to offset the excise tax through spending cuts or other actions are unsuccessful, the increased tax burden would adversely affect our financial performance, which in turn could cause the price of our stock to decline. In addition, a number of foreign governments are also considering or have adopted proposals to reform their healthcare systems. Because a significant portion of our revenues from our operations is derived internationally, if significant reforms are made to the healthcare systems in other jurisdictions, our sales and results of operations may be materially and adversely impacted.
We intend to market our products in a number of international markets. Although certain of our IVUS products have been approved for commercialization in Japan and in the EEA, in order to market our products in other foreign jurisdictions, we have had to, and will need to in the future, obtain separate regulatory approvals. The approval procedure varies among jurisdictions and can involve substantial additional testing. Approval or clearance of a device by the FDA does not ensure approval by regulatory authorities in other jurisdictions, and approval by one foreign regulatory authority does not ensure marketing authorization by regulatory authorities in other foreign jurisdictions or by the FDA. The foreign regulatory approval process may include all of the risks
34
associated with obtaining FDA approval in addition to other risks. In addition, the time required to obtain foreign approval may differ from that required to obtain FDA approval, and we may not obtain foreign regulatory approvals on a timely basis, if at all. We may not be able to file for regulatory approvals and may not receive necessary approvals to commercialize our products in any foreign market other than in the EEA and Japan.
We may be subject to federal, state and foreign healthcare fraud and abuse laws and regulations, and a finding of failure to comply with such laws and regulations could have a material adverse effect on our business.
Our operations may be directly or indirectly affected by various broad federal, state or foreign healthcare fraud and abuse laws. In particular, the Federal healthcare program Anti-Kickback Statute prohibits any person from knowingly and willfully offering, paying, soliciting or receiving remuneration, directly or indirectly, in return for or to induce the referring, ordering, leasing, purchasing or arranging for or recommending the ordering, purchasing or leasing of an item or service, for which payment may be made under federal healthcare programs, such as the Medicare and Medicaid programs. This statute has been interpreted to apply to arrangements between device manufacturers on one hand and prescribers and purchasers on the other. For example, the government has sought to apply the Anti-Kickback Statute to device manufacturers’ financial relationships with physician consultants. Among other theories, the government has alleged that such relationships are payments to induce the consultants to arrange for or recommend the ordering, purchasing or leasing of the manufacturers’ products by the hospitals, medical institutions and other entities with whom they are affiliated. Although there are a number of statutory exemptions and regulatory safe harbors protecting certain common activities from prosecution or other regulatory sanctions, the exemptions and safe harbors are drawn narrowly, and arrangements that involve remuneration that could induce prescribing, purchases, or recommendations may be subject to government scrutiny if they do not qualify for an exemption or a safe harbor. We are also subject to the federal Health Insurance Portability and Accountability Act of 1996 (HIPAA), which created federal criminal laws that prohibit executing a scheme to defraud any health care benefit program or making false statements relating to health care matters, and federal “sunshine” laws that require transparency regarding financial arrangements with health care providers, such as the reporting and disclosure requirements imposed by PPACA on device and drug manufacturers regarding any “transfer of value” made or distributed to physicians and teaching hospitals.
Also, the federal False Claims Act prohibits persons from knowingly filing, or causing to be filed, a false claim to, or the knowing use of false statements to obtain payment from the federal government. Suits filed under the False Claims Act, known as “qui tam” actions, can be brought by any individual on behalf of the government and such individuals, commonly known as “whistleblowers,” may share in any amounts paid by the entity to the government in fines or settlement. When an entity is determined to have violated the False Claims Act, it may be required to pay up to three times the actual damages sustained by the government, plus civil penalties for each separate false claim. Various states have also enacted laws modeled after the federal False Claims Act.
In addition, several states have adopted laws similar to each of the above federal laws, such as anti-kickback and false claims laws which may apply to items or services reimbursed by any third-party payor, including commercial insurers as well as laws that restrict our marketing activities with physicians, and require us to report consulting and other payments to physicians. Some states, such as California, Connecticut Massachusetts and Nevada, mandate implementation of commercial compliance programs to ensure compliance with these laws.
The risk of our being found in violation of these laws is increased by the fact that many of them have not been fully interpreted by the regulatory authorities or the courts, and their provisions are open to a variety of interpretations. Moreover, recent health care reform legislation has strengthened these laws. For example, the recently enacted PPACA, among other things, amends the intent requirement of the federal anti-kickback and criminal health care fraud statutes; a person or entity no longer needs to have actual knowledge of this statute or specific intent to violate it. In addition, PPACA provides that a claim including items or services resulting from a violation of the Federal Anti-Kickback Statute constitutes a false or fraudulent claim for purposes of the False Claims Act. Further, we expect there will continue to be federal and state laws and/or regulations, proposed and implemented, that could impact our operations and business. The extent to which future legislation or
35
regulations, if any, relating to health care fraud abuse laws and/or enforcement, may be enacted or what effect such legislation or regulation would have on our business remains uncertain. If our operations are found to be in violation of any of the laws described above or any other governmental regulations that apply to us, we may be subject to penalties, including civil and criminal penalties, damages, fines, exclusion from governmental health care programs, and the curtailment or restructuring of our operations, any of which could adversely affect our ability to operate our business and our financial results. We also are subject to foreign fraud and abuse laws, which vary by country. For instance, in the European Union, legislation on inducements offered to physicians and other healthcare workers or hospitals differ from country to country. Breach of the laws relating to such inducements may expose us to the imposition of criminal sanctions. It may also harm our reputation, which could in turn affect sales.
If our customers are unable to obtain coverage of or sufficient reimbursement for procedures performed with our products, it is unlikely that our products will be widely used.
Successful sales of our products depend on the availability of adequate coverage and reimbursement from third-party payors. Healthcare providers that purchase medical devices for treatment of their patients generally rely on third-party payors to reimburse all or part of the costs and fees associated with the procedures performed with these devices. Both public and private insurance coverage and reimbursement plans are central to new product acceptance. Customers are unlikely to use our products if they do not receive reimbursement adequate to cover the cost of our products and related procedures.
To the extent we sell our products internationally, market acceptance may depend, in part, upon the availability of coverage and reimbursement within prevailing healthcare payment systems. Coverage, reimbursement, and healthcare payment systems in international markets vary significantly by country, and by region in some countries, and include both government-sponsored healthcare and private insurance. We may not obtain international reimbursement approvals in a timely manner, if at all. Our failure to receive international coverage or reimbursement approvals would negatively impact market acceptance of our products in the international markets in which those approvals are sought.
To date, our products have generally been covered as part of procedures for which reimbursement has been available. However, in the U.S., as well as in foreign countries, government-funded programs (such as Medicare and Medicaid) or private insurance programs, together commonly known as third-party payors, pay the cost of a significant portion of a patient’s medical expenses. Coverage of and reimbursement for medical technology can differ significantly from payor to payor.
All third-party coverage and reimbursement programs, whether government funded or insured commercially, whether inside the U.S. or outside, are developing increasingly sophisticated methods of controlling healthcare costs. Such cost-containment programs adopted by third-party payors, including legislative and regulatory changes to coverage and reimbursement policies, could potentially limit the amount which healthcare providers are willing to pay for medical devices, which could adversely impact our business. The Centers for Medicare & Medicaid Services recently announced a three-year demonstration project to allow Medicare recovery auditors to audit Medicare payments for procedures prior to Medicare making payment for the procedure, versus following Medicare payment for the procedure as has historically been Medicare’s process. The demonstration project includes 11 states that cover a large percentage of the U.S. populace, and different states are expected to be more or less aggressive in their performance of pre-payment audits, including with respect to the types of procedures for which Medicare payments may be audited on a pre-payment basis and the percentage of those procedures that are in fact so audited. Certain procedures that use our products will be subject to such Medicare pre-payment audits, which could induce healthcare providers to be less willing to perform those procedures due to increased reimbursement concerns owing to such pre-payment, rather than post-payment, audits, and any such reduction in procedure volumes could adversely affect our business and results of operations.
36
We believe that future coverage of and reimbursement for our products may be subject to increased restrictions both in the U.S. and in international markets. For example, on August 2, 2011, President Obama signed the Budget Control Act of 2011 which provides an initial increase to the U.S. debt limit, imposes significant cuts in federal spending over the next decade and involves a second increase to the debt limit pending further deficit reduction by a bipartisan Congressional committee later this year. This committee could propose cuts to, and restructuring of, entitlement programs such as Medicare and aid to states for Medicaid programs. Third-party reimbursement and coverage for our products may not be available or adequate in either the U.S. or international markets. Future legislation, regulations, coverage or reimbursement policies adopted by third-party payors may adversely affect the growth of the markets for our products, reduce the demand for our existing products or our products currently under development, and limit our ability to sell our products on a profitable basis.
We may be subject to health information privacy and security standards that include penalties for noncompliance.
The Health Insurance Portability and Accountability Act of 1996, or HIPAA, and its implementing regulations safeguard the privacy and security of individually-identifiable health information. Certain of our operations may be subject to these requirements. Penalties for noncompliance with these rules include both criminal and civil penalties. In addition, the Health Information Technology for Economic and Clinical Health Act, or HITECH Act, expanded federal health information privacy and security protections. Among other things, HITECH makes certain of HIPAA’s privacy and security standards directly applicable to “business associates”—independent contractors or agents of covered entities that receive or obtain protected health information in connection with providing a service on behalf of a covered entity. HITECH also set forth new notification requirements for health data security breaches, increased the civil and criminal penalties that may be imposed against covered entities, business associates and possibly other persons, and gave state attorneys general new authority to enforce HIPAA and seek attorney’s fees and costs associated with pursuing federal civil actions. Occasionally, our field service representatives enter into “field service agreements” which obligate us to protect any protected health information that we may receive in the field in accordance with HIPAA and HITECH.
Compliance with environmental laws and regulations could be expensive, and failure to comply with these laws and regulations could subject us to significant liability.
We use hazardous materials in our research and development and manufacturing processes. We are subject to federal, state and local regulations governing use, storage, handling and disposal of these materials and associated waste products. We are currently licensed to handle such materials, but there can be no assurance that we will be able to retain these licenses in the future or obtain licenses under new regulations if and when they are required by governing authorities. We cannot completely eliminate the risk of contamination or injury resulting from hazardous materials, and we may incur liability as a result of any such contamination or injury. In the event of an accident, we could be held liable for damages or penalized with fines, and the liability could exceed our resources and any applicable insurance. We have also incurred and may continue to incur expenses related to compliance with environmental laws. Such future expenses or liability could have a significant negative impact on our business, financial condition and results of operations. Further, we cannot assure that the cost of compliance with these laws and regulations will not materially increase in the future. We may also incur expenses related to ensuring that our operations comply with environmental laws related to our operations, and those of prior owners or operators of our properties, at current or former manufacturing sites where operations have previously resulted in spills, discharges or other releases of hazardous substances into the environment. We could be held strictly liable under U.S. environmental laws for contamination of property that we currently or formerly owned or operated without regard to fault or whether our actions were in compliance with law at the time. Our liability could also increase if other responsible parties, including prior owners or operators of our facilities, fail to complete their clean-up obligations or satisfy indemnification obligations to us. Similarly, if we fail to ensure compliance with applicable environmental laws in foreign jurisdictions in which we operate, we may not be able to offer our products and may be subject to civil or criminal liabilities.
37
The use, misuse or off-label use of our products may result in injuries that could lead to product liability suits, which could be costly to our business.
Our currently marketed products have been cleared by the relevant regulatory authority in each jurisdiction where we market them. There may be increased risk of injury if physicians attempt to use our products in procedures outside of those indications cleared or approved for use, known as off-label use. Our sales force is trained according to company policy not to promote our products for off-label uses, and in our instructions for use in all markets we specify that our products are not intended for use outside of those indications cleared for use. However, we cannot prevent a physician from using our products for off-label applications. Our catheters and guide wires are intended to be single-procedure products. In spite of clear labeling and instructions against reuse, we are aware that certain physicians have elected to reuse our products. Reuse of our catheters and guide wires may increase the risk of product liability claims. Reuse may also subject the party reusing the product to regulatory authority inspection and enforcement action. Physicians may also misuse our product if they are not adequately trained, potentially leading to injury and an increased risk of product liability. If our products are defectively designed, manufactured or labeled, contain defective components or are misused, we may become subject to costly litigation by our customers or their patients. Product liability claims could divert management’s attention from our core business, be expensive to defend and result in sizable damage awards against us.
Risks related to our intellectual property and litigation
Our ability to protect our intellectual property and proprietary technology through patents and other means is uncertain.
Our success depends significantly on our ability to protect our intellectual property and proprietary technologies. Our policy is to obtain and protect our intellectual property rights. We rely on patent protection, as well as a combination of copyright, trade secret and trademark laws, and nondisclosure, confidentiality and other contractual restrictions to protect our proprietary technology. However, these legal means afford only limited protection and may not adequately protect our rights or permit us to gain or keep any competitive advantage. Our pending U.S. and foreign patent applications may not issue as patents or may not issue in a form that will be advantageous to us. Any patents we have obtained or will obtain may be challenged by re-examination, opposition or other administrative proceeding, or in litigation. Such challenges could result in a determination that the patent is invalid. In addition, competitors may be able to design alternative methods or devices that avoid infringement of our patents. To the extent our intellectual property protection offers inadequate protection, or is found to be invalid, we are exposed to a greater risk of direct competition. If our intellectual property does not provide adequate protection against our competitors’ products, our competitive position could be adversely affected, as could our business. Both the patent application process and the process of managing patent disputes can be time consuming and expensive. Furthermore, the laws of some foreign countries may not protect our intellectual property rights to the same extent as do the laws of the U.S. In addition, changes in U.S. patent laws could prevent or limit us from filing patent applications or patent claims to protect our products and/or technologies or limit the exclusivity periods that are available to patent holders. The Leahy-Smith America Invents Act, or the Leahy-Smith Act, was recently signed into law and includes a number of significant changes to U.S. patent law, including the transition from a “first-to-invent” system to a “first-to-file” system and changes to the way issued patents are challenged. These changes may favor larger and more established companies that have more resources than we do to devote to patent application filing and prosecution. The U.S. Patent and Trademark Office is currently developing regulations and procedures to administer the Leahy-Smith Act, and many of the substantive changes to patent law associated with the Leahy-Smith Act will not become effective until one year or 18 months after its enactment. Accordingly, it is not clear what, if any, impact the Leahy-Smith Act will ultimately have on the cost of prosecuting our patent applications, our ability to obtain patents based on our discoveries and our ability to enforce or defend our issued patents. However, it is possible that in order to adequately protect our patents under the “first-to-file” system, we will have to allocate significant additional resources, including on additional personnel, to the establishment and maintenance of a new patent application process designed to be more streamlined and competitive in the context of the new “first-to-file” system, which would divert valuable resources from other areas of our business.
38
In addition to pursuing patents on our technology, we have taken steps to protect our intellectual property and proprietary technology by entering into confidentiality agreements and intellectual property assignment agreements with our employees, consultants, corporate partners and, when needed, our advisors. Such agreements may not be enforceable or may not provide meaningful protection for our trade secrets or other proprietary information in the event of unauthorized use or disclosure or other breaches of the agreements, and we may not be able to prevent such unauthorized disclosure. Monitoring unauthorized disclosure is difficult, and we do not know whether the steps we have taken to prevent such disclosure are, or will be, adequate.
In the event a competitor infringes upon our patent or other intellectual property rights, litigation to enforce our intellectual property rights or to defend our patents against challenge, even if successful, could be expensive and time consuming and could require significant time and attention from our management. We may not have sufficient resources to enforce our intellectual property rights or to defend our patents against challenges from others.
The medical device industry is characterized by patent and other intellectual property litigation, and we could become subject to litigation that could be costly, result in the diversion of our management’s time and efforts, require us to pay damages or prevent us from selling our products.
The medical device industry is characterized by extensive litigation and administrative proceedings over patent and other intellectual property rights. Whether or not a product infringes a patent involves complex legal and factual issues, the determination of which is often uncertain. Our competitors may assert that they own U.S. or foreign patents containing claims that cover our products, their components or the methods we employ in the manufacture or use of our products. For example, we are currently involved with St. Jude in patent litigation regarding each party’s pressure guide wire products and whether these products infringe the patents of the other party. Because patent applications can take many years to issue and in many instances at least 18 months to publish, there may be applications now pending of which we are unaware, which may later result in issued patents that contain claims that cover our products. There could also be existing patents, of which we are unaware, that contain claims that cover one or more components of our products. As the number of participants in our industry increases, the possibility of patent infringement claims against us also increases.
Any interference proceeding, litigation or other assertion of claims against us, including our current patent litigation with St. Jude Medical, may cause us to incur substantial costs, could place a significant strain on our financial resources, divert the attention of our management from our core business and harm our reputation. If the relevant patents asserted against us were upheld as valid and enforceable and were found to be infringed, we could be required to pay substantial damages and/or royalties and could be prevented from selling our products unless we could obtain a license or were able to redesign our products to avoid infringement. Any such license may not be available on reasonable terms, if at all. If we fail to obtain any required licenses or make any necessary changes to our products or technologies, we may be unable to make, use, sell or otherwise commercialize one or more of our products in the affected country. In addition, if we are found to infringe willfully, we could be required to pay treble damages and attorney fees, among other penalties.
We expect to enter new product fields in the future. Entering such additional fields may subject us to claims of infringement. Defending any infringement claims would be expensive and time consuming.
We are aware of certain third-party U.S. patents in fields that we are targeting for development. We do not have licenses to these patents nor do we believe that such licenses are required to develop, commercialize or sell our products in these areas. However, the owners of these patents may initiate a lawsuit alleging infringement of one or more of these or other patents. If they do, we may be required to incur substantial costs related to patent litigation, which could place a significant strain on our financial resources and divert the attention of management from our business and harm our reputation. Adverse determinations in such litigation could cause us to redesign or prevent us from manufacturing or selling our products in these areas, which would have an adverse effect on our business by limiting our ability to generate revenues through the sale of these products.
39
From time to time in the ordinary course of business, we receive letters from third parties advising us of third-party patents that may relate to our business. The letters do not explicitly seek any particular action or relief from us. Although these letters do not threaten legal action, these letters may be deemed to put us on notice that continued operation of our business might infringe intellectual property rights of third parties. We do not believe we are infringing any such third-party rights, and we are unaware of any litigation or other proceedings having been commenced against us asserting such infringement. We cannot assure you that such litigation or other proceedings may not be commenced against us in the future.
Our rights to a worldwide license of certain IVUS patents owned or licensed by Boston Scientific may be challenged.
The marketing and sale of our current rotational IVUS catheters and pullback products depend on a license for IVUS-related patents owned or licensed by Boston Scientific. Boston Scientific was required to transfer the related intellectual property rights pursuant to a 1995 order of the Federal Trade Commission. We obtained rights to the license in 2003 through our former wholly-owned subsidiary, Pacific Rim Medical Ventures, which merged into us on December 30, 2004. In the event Boston Scientific disputes our rights to the license or seeks to terminate the license, we may be required to expend significant time and resources defending our rights. An adverse determination could cause us to redesign or prevent us from manufacturing or selling our rotational IVUS catheters and pullback products, which would have an adverse effect on our business. Additionally, in the event that the chain of title from the 1995 transfer of rights from Boston Scientific through the 2003 transfer to us is successfully challenged, we may have fewer rights to the technology than our business requires which will negatively impact our ability to continue our development of rotational IVUS catheters and pullback products or subject us to disputes with Boston Scientific or others with respect to the incorporation of this intellectual property into our products.
Our VH IVUS business depends on a license from The Cleveland Clinic Foundation, the loss of which would severely impact our business.
The marketing and sale of our VH IVUS functionality for IVUS depends on an exclusive license to patents owned by The Cleveland Clinic Foundation, the license to which we obtained in April 2002. We are aware that maintenance of the license depends upon certain provisions being met by us including payment of royalties, commercialization of the licensed technology and obtaining regulatory clearances or approvals. If The Cleveland Clinic Foundation were to claim that we committed a material breach or default of these provisions and we were not able to cure such breach or default, The Cleveland Clinic Foundation would have a right to terminate the agreement. The loss of the rights granted under the agreement could require us to redesign our VH IVUS functionality or prevent us from manufacturing or selling our IVUS products containing VH IVUS in countries covered by these patents. In addition, our exclusive license shall become non-exclusive if we fail to obtain regulatory clearances or approvals to commercialize the licensed technology within a proscribed time period. The cost of redesigning or an inability to sell our VH IVUS products would have a negative impact on our ability to grow our business and achieve our expected revenues.
Risks related to our common stock
We expect that the price of our common stock will fluctuate substantially.
The market price of our common stock could be subject to significant fluctuation. Factors that could cause volatility in the market price of our common stock include the following:
| • | | changes in earnings estimates, investors’ perceptions, recommendations by securities analysts or our failure to achieve analysts’ earnings estimates; |
| • | | quarterly variations in our or our competitors’ results of operations; |
| • | | changes in governmental regulations or in the status of our regulatory clearance or approvals; |
| • | | changes in availability of third-party reimbursement in the U.S. or other countries; |
| • | | the announcement of new products or product enhancements by us or our competitors; |
40
| • | | the announcement of an acquisition or other business combination or strategic transaction; |
| • | | possible sales of our common stock by investors who view the Notes as a more attractive means of equity participation in us; |
| • | | the conversion of some or all of the Notes and any sales in the public market of shares of our common stock issued upon conversion of the Notes; |
| • | | hedging or arbitrage trading activity that may develop involving our common stock, including in connection with the convertible note hedge transaction and warrant transaction we entered into in connection with the Notes offering and arbitrage strategies employed or that may be employed by investors in the Notes; |
| • | | announcements related to patents issued to us or our competitors; |
| • | | the announcement of pending or threatened litigation and developments in litigation involving us; |
| • | | sales of large blocks of our common stock, including sales by our executive officers and directors; and |
| • | | general market and economic conditions and other factors unrelated to our operating performance or the operating performance of our competitors. |
These factors may materially and adversely affect the market price of our common stock.
Additional equity issuances or a sale of a substantial number of shares of our common stock may cause the market price of our common stock to decline.
If our existing stockholders sell a substantial number of shares of our common stock or the public market perceives that existing stockholders might sell shares of our common stock, the market price of our common stock could decline. In addition, sales of a substantial number of shares of our common stock could make it more difficult for us to sell equity or equity-related securities in the future at a time and price that we deem reasonable or appropriate. Because we may need to raise additional capital in the future to continue to expand our business and develop new products, we may, among other things, conduct additional equity offerings. These future equity issuances, together with any additional shares of our common stock issued or issuable in connection with past or any future acquisitions, would result in further dilution to investors and could depress the market price of our common stock.
No prediction can be made regarding the number of shares of our common stock that may be issued or the effect that the future sales of shares of our common stock will have on the market price of our shares.
Our directors, officers and principal stockholders have significant voting power and may take actions that may not be in the best interests of our other stockholders.
As of February 15, 2012, our directors, officers and principal stockholders (those holding more than 5% of our common stock) collectively controlled a significant portion of our outstanding common stock. To the extent our directors, officers and principal stockholders continue to hold a significant portion of our outstanding common stock, these stockholders, if they act together, would be able to exert significant influence over the management and affairs of our company and most matters requiring stockholder approval, including the election of directors and approval of significant corporate transactions. This concentration of ownership may have the effect of delaying or preventing a change in control, might adversely affect the market price of our common stock and may not be in the best interests of our other stockholders.
Anti-takeover provisions in our amended and restated certificate of incorporation and bylaws and other agreements and in Delaware law could discourage a takeover.
Our amended and restated certificate of incorporation and bylaws and Delaware law contain provisions that might enable our management to resist a takeover. These provisions include:
| • | | a classified board of directors; |
41
| • | | advance notice requirements to stockholders for matters to be brought at stockholder meetings; |
| • | | a supermajority stockholder vote requirement for amending certain provisions of our amended and restated certificate of incorporation and bylaws; and |
| • | | the right to issue preferred stock without stockholder approval, which could be used to dilute the stock ownership of a potential hostile acquirer. |
We are also subject to the provisions of Section 203 of the Delaware General Corporation Law that, in general, prohibit any business combination or merger with a beneficial owner of 15% or more of our common stock unless the holder’s acquisition of our stock was approved in advance by our board of directors. These provisions might discourage, delay or prevent a change in control of our company or a change in our management. The existence of these provisions could adversely affect the voting power of holders of common stock and limit the price that investors might be willing to pay in the future for shares of our common stock.
We have adopted a stockholder rights plan that may discourage, delay or prevent a change of control and make any future unsolicited acquisition attempt more difficult. Under the rights plan:
| • | | the rights will become exercisable only upon the occurrence of certain events specified in the plan, including the acquisition of 20% of our outstanding common stock by a person or group, with limited exceptions; |
| • | | each right will entitle the holder, other than an acquiring person, to acquire shares of our common stock at a discount to the then prevailing market price; |
| • | | our board of directors may redeem outstanding rights at any time prior to a person becoming an acquiring person at a minimal price per right; and |
| • | | prior to a person becoming an acquiring person, the terms of the rights may be amended by our board of directors without the approval of the holders of the rights. |
In addition, the terms of our Notes may require us to purchase these Notes for cash in the event of a takeover of our company. The indenture governing the Notes also prohibits us from engaging in certain mergers or acquisitions unless, among other things, the surviving entity assumes our obligations under the Notes. These and other provisions applicable to the Notes may have the effect of delaying or preventing a takeover of our company that would otherwise be beneficial to our stockholders.
We have not paid dividends in the past and do not expect to pay dividends in the future.
We have never declared or paid cash dividends on our capital stock. We currently intend to retain all future earnings for the operation and expansion of our business and, therefore, do not anticipate declaring or paying cash dividends in the foreseeable future. The payment of dividends will be at the discretion of our board of directors and will depend on our results of operations, capital requirements, financial condition, prospects, contractual arrangements, any limitations on payments of dividends present in our current and future debt agreements, and other factors our board of directors may deem relevant. If we do not pay dividends, a return on our common stock will only occur if our stock price appreciates.
| Item 1B. | Unresolved Staff Comments |
None
42
The following table summarizes our principal facilities under lease as of December 31, 2011, the location and size of each such facility and their designed use.
| | | | | | | | | | |
Location | | Purpose (2) | | Square Feet
(Approximate) | | | Term | | Option(s) to
renew through |
San Diego, California | | Principal executive offices and research and development | | | 34,986 | | | July 2015 | | July 2018 |
Rancho Cordova, California | | Manufacturing operations and administrative functions | | | 75,626 | | | December 2014 | | December 2024 |
Rancho Cordova, California | | Research and development, marketing and regulatory operations | | | 144,000 | | | December 2014 | | December 2019 |
Rancho Cordova, California | | Production distribution operations | | | 30,015 | | | December 2014 | | December 2024 |
Rancho Cordova, California | | Shipping and receiving, quality inspection, systems refurbishment | | | 35,473 | | | December 2014 | | December 2024 |
Billerica, Massachusetts | | Axsun operations and administrative functions, research and development | | | 64,784 | | | October 2021 | | n/a |
Zaventem, Belgium | | Europe administrative functions, sales and product distribution | | | 10,882 | | | December 2013 | | December 2022 |
Tokyo, Japan (1) | | Japan sales operations and administrative functions | | | 14,542 | | | January 2015 | | n/a |
| (1) | The square footage, lease terms and renewal options reflect the terms of a lease agreement executed in January 2012. As of December 31, 2011, we had 9,752 square feet under lease through January 2012. |
| (2) | All facilities are utilized for activities in our medical segment. The Billerica, Massachusetts facility is utilized for activities both in our medical and industrial segments. |
We also lease facilities in Forsyth County, Georgia, Cleveland, Ohio and Mountain View, California for various research and development activities; Alpharetta, Georgia for limited research and development activities and sales administration activities; and Woodmead, South Africa for sales and distribution activities. Collectively, these facilities represent approximately 19,000 square feet of space. We are currently in the process of constructing a 100% owned, approximately 140,000 square feet manufacturing facility in Costa Rica.
We believe that our current and planned facilities are adequate to meet our needs for the foreseeable future.
The information set forth under Note 4 “Commitments and Other Contractual Obligations – Litigation” to our consolidated financial statements included in Part II, Item 8 of this Annual Report, is incorporated herein by reference.
| Item 4. | Mine Safety Disclosures |
Not applicable.
43
PART II
| Item 5. | Market for Registrant’s Common Equity, Related Stockholder Matters and Issuer Purchases of Equity Securities |
We completed our initial public offering on June 15, 2006. Our common stock is traded on the NASDAQ Global Market under the symbol “VOLC”. The following table sets forth the high and low sales price of our common stock for the periods indicated.
| | | | | | | | |
| | | Price Range | |
| | | Low | | | High | |
Year Ended December 31, 2011 | | | | | | | | |
First Quarter | | $ | 23.56 | | | $ | 28.95 | |
Second Quarter | | | 24.51 | | | | 32.29 | |
Third Quarter | | | 26.22 | | | | 33.51 | |
Fourth Quarter | | | 21.76 | | | | 30.57 | |
Year Ended December 31, 2010 | | | | | | | | |
First Quarter | | $ | 18.00 | | | $ | 25.75 | |
Second Quarter | | | 20.11 | | | | 24.65 | |
Third Quarter | | | 20.49 | | | | 26.16 | |
Fourth Quarter | | | 23.77 | | | | 28.90 | |
At February 15, 2012, the closing price of our common stock on the NASDAQ Global Market was $28.25 per share, and we had 40 stockholders of record.
44
Performance Graph
The following performance graph and related information shall not be deemed “soliciting material” or “filed” with the Securities and Exchange Commission, nor shall such information be incorporated by reference into any future filing under the Securities Act of 1933 or Securities Exchange Act of 1934, each as amended, except to the extent that we specifically incorporate it by reference into such filing.
The graph below compares total stockholder return on our common stock from December 31, 2006 through December 31, 2011 with the cumulative total return of (a) the NASDAQ Composite Index and (b) the NASDAQ Medical Equipment Index assuming a $100 investment made in each on December 31, 2006. Each of the three measures of cumulative total return assumes reinvestment of dividends, if any. The stock performance shown on the graph below is based on historical data and is not indicative of, or intended to forecast, possible future performance of our common stock.
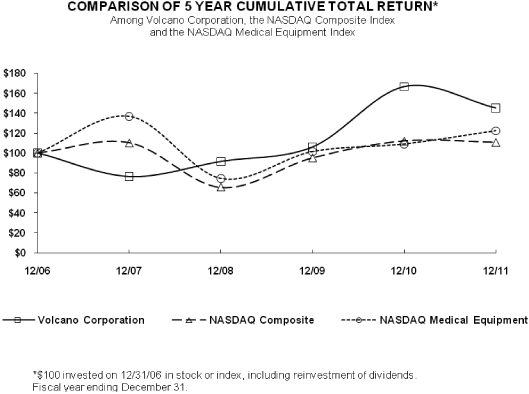
Equity Compensation Plan Information
For information concerning prior stockholder approval of and other matters relating to our equity incentive plans, see Item 12 in this annual report on Form 10-K.
Recent Sales of Unregistered Securities
None
Recent Purchase of our Registered Equity Securities
We did not purchase any shares of our common stock during the fourth quarter of 2011.
45
Dividends
We have never declared or paid any cash dividends on our capital stock. We currently intend to retain any future earnings to fund the development and expansion of our business, and therefore we do not anticipate paying cash dividends on our common stock in the foreseeable future. Any future determination to pay dividends will be at the discretion of our board of directors. None of our outstanding capital stock is entitled to any dividends.
| Item 6. | Selected Financial Data |
The selected financial data set forth below are derived from our consolidated financial statements. The consolidated statement of operations data for the years ended December 31, 2011, 2010 and 2009, and the consolidated balance sheet data at December 31, 2011 and 2010 are derived from our consolidated financial statements included elsewhere in this report. The consolidated statement of operations data for the years ended December 31, 2008 and 2007 and the consolidated balance sheet data at December 31, 2009, 2008 and 2007 are derived from our consolidated financial statements which are not included herein.
The following selected consolidated financial data should be read in conjunction with our consolidated financial statements and the related footnotes and “Management’s Discussion and Analysis of Financial Condition and Results of Operations” appearing elsewhere in this report (in thousands, except per share data):
| | | | | | | | | | | | | | | | | | | | |
| | | Years Ended December 31, | |
| | | 2011 | | | 2010 | | | 2009 | | | 2008 | | | 2007 | |
Consolidated Statement of Operations Data: | | | | | | | | | | | | | | | | | | | | |
Revenues | | $ | 343,546 | | | $ | 294,146 | | | $ | 227,867 | | | $ | 171,495 | | | $ | 130,614 | |
Cost of revenues, exluding amortization of intangibles | | | 114,533 | | | | 108,860 | | | | 91,489 | | | | 64,293 | | | | 51,559 | |
| | | | | | | | | | | | | | | | | | | | |
Gross profit | | | 229,013 | | | | 185,286 | | | | 136,378 | | | | 107,202 | | | | 79,055 | |
Operating expenses: | | | | | | | | | | | | | | | | | | | | |
Selling, general and administrative | | | 147,057 | | | | 133,174 | | | | 111,598 | | | | 84,369 | | | | 62,631 | |
Research and development | | | 53,098 | | | | 42,517 | | | | 37,372 | | | | 26,690 | | | | 20,315 | |
Amortization of intangibles | | | 3,447 | | | | 2,559 | | | | 4,224 | | | | 3,125 | | | | 3,067 | |
In-process research and development (1) | | | — | | | | (2,935 | ) | | | 14,030 | | | | 12,681 | | | | 26,188 | |
| | | | | | | | | | | | | | | | | | | | |
Total operating expenses | | | 203,602 | | | | 175,315 | | | | 167,224 | | | | 126,865 | | | | 112,201 | |
Operating income (loss) | | | 25,411 | | | | 9,971 | | | | (30,846 | ) | | | (19,663 | ) | | | (33,146 | ) |
Interest income | | | 908 | | | | 477 | | | | 756 | | | | 4,828 | | | | 5,841 | |
Interest expense | | | (7,107 | ) | | | (2,192 | ) | | | (5 | ) | | | (113 | ) | | | (199 | ) |
Exchange rate gain (loss) | | | (997 | ) | | | (904 | ) | | | 2,328 | | | | 1,809 | | | | 1,452 | |
Other, net | | | (112 | ) | | | (25 | ) | | | — | | | | 54 | | | | — | |
| | | | | | | | | | | | | | | | | | | | |
Income (loss) before income taxes | | | 18,103 | | | | 7,327 | | | | (27,767 | ) | | | (13,085 | ) | | | (26,052 | ) |
Income tax expense (benefit) (2) | | | (19,990 | ) | | | 2,087 | | | | 1,187 | | | | 620 | | | | 524 | |
| | | | | | | | | | | | | | | | | | | | |
Net income (loss) | | $ | 38,093 | | | $ | 5,240 | | | $ | (28,954 | ) | | $ | (13,705 | ) | | $ | (26,576 | ) |
| | | | | | | | | | | | | | | | | | | | |
Net income (loss) per share: | | | | | | | | | | | | | | | | | | | | |
Basic | | $ | 0.73 | | | $ | 0.10 | | | $ | (0.60 | ) | | $ | (0.29 | ) | | $ | (0.66 | ) |
| | | | | | | | | | | | | | | | | | | | |
Diluted | | $ | 0.70 | | | $ | 0.10 | | | $ | (0.60 | ) | | $ | (0.29 | ) | | $ | (0.66 | ) |
| | | | | | | | | | | | | | | | | | | | |
Shares used in calculating net income (loss) per share: | | | | | | | | | | | | | | | | | | | | |
Basic | | | 52,300 | | | | 50,551 | | | | 48,400 | | | | 47,376 | | | | 40,024 | |
| | | | | | | | | | | | | | | | | | | | |
Diluted | | | 54,596 | | | | 53,281 | | | | 48,400 | | | | 47,376 | | | | 40,024 | |
| | | | | | | | | | | | | | | | | | | | |
46
| | | | | | | | | | | | | | | | | | | | |
| | | At December 31, | |
| | | 2011 | | | 2010 | | | 2009 | | | 2008 | | | 2007 | |
Balance Sheet Data: | | | | | | | | | | | | | | | | | | | | |
Cash and cash equivalents | | $ | 107,016 | | | $ | 43,429 | | | $ | 56,055 | | | $ | 100,949 | | | $ | 122,913 | |
Short-term available-for-sale investments | | | 112,327 | | | | 175,283 | | | | 66,028 | | | | 48,941 | | | | 66,205 | |
Working capital | | | 293,057 | | | | 264,937 | | | | 158,668 | | | | 183,147 | | | | 210,094 | |
Intangible assets, net (3) | | | 15,245 | | | | 17,103 | | | | 11,623 | | | | 15,636 | | | | 9,385 | |
Total assets | | | 496,724 | | | | 431,566 | | | | 276,734 | | | | 275,479 | | | | 266,574 | |
Short and long-term debt, including current maturities | | | 95,809 | | | | 91,292 | | | | 160 | | | | 242 | | | | 198 | |
Total stockholders’ equity | | | 339,237 | | | | 274,336 | | | | 214,815 | | | | 229,732 | | | | 232,937 | |
These historical results are not necessarily indicative of results expected for any future period.
| (1) | In 2007, $26.2 million related to the acquisition of CardioSpectra. In 2008, $12.2 million related to the acquisition of Novelis. In 2009, $11.0 million was recorded for a milestone payment related to the OCT project we acquired from CardioSpectra and $3.0 million represented an accrual for the milestone payment related to the FL.IVUS project acquired from Novelis. In 2010, we recorded a reversal of the 2009 milestone payment accrual for the FL.IVUS project of $3.0 million as we believed we would no longer achieve the milestone. |
| (2) | During the quarter ended December 31, 2011, we concluded that it was more likely than not that we would be able to realize the benefit of a significant portion of our deferred tax assets in the future. Therefore, we reversed $22 million of the valuation allowance on the Company’s net federal and certain state deferred income tax assets. |
| (3) | Includes the effects of the Axsun acquisition in December 2008 and the Fluid Medical acquisition in 2010. |
47
| Item 7. | Management’s Discussion and Analysis of Financial Condition and Results of Operations |
The following discussion and analysis should be read in conjunction with “Selected Financial Data” and our consolidated financial statements and notes thereto included elsewhere in this Annual Report.
Overview
We design, develop, manufacture and commercialize a broad suite of precision guided therapy products including intravascular ultrasound, or IVUS, and fractional flow reserve, or FFR, products. We believe that these products enhance the diagnosis and treatment of vascular heart disease by improving the efficiency and efficacy of existing percutaneous interventional, or PCI, therapy procedures in the coronary or peripheral arteries. We are facilitating the adoption of functional PCI, in which our FFR technology is used to determine whether or not a stent is necessary, and IVUS is used to guide stent placement and optimization. We market our products to physicians and technicians who perform PCI procedures in hospitals and to other personnel who make purchasing decisions on behalf of hospitals.
Our products consist of multi-modality consoles which are marketed as stand-alone units or as customized units that can be integrated into a variety of hospital-based interventional surgical suites called catheterization laboratories, or cath labs. We have developed customized cath lab versions of these consoles and are developing additional functionality options as part of our cath lab integration initiative. Our consoles have been designed to serve as a multi-modality platform for our phased array and rotational IVUS catheters, FFR pressure wires, image-guided therapy catheters and Medtronic’s Pioneer reentry device. Our IVUS products include single-procedure disposable phased array and rotational IVUS imaging catheters and additional functionality options such as virtual histology, or VH, IVUS tissue characterization and ChromaFlo stent apposition analysis. Our FFR offerings can be accessed through our multi-modality platforms, and we also provide FFR-only consoles. Our FFR disposables are single-procedure disposable pressure and flow guide wires used to measure the pressure and flow characteristics of blood around plaque enabling physicians to gauge the plaque’s physiological impact on blood flow and pressure. We are developing additional offerings for integration into the platform, including adenosine-free Instant wave-free ratio FFR, or iFR, forward-looking IVUS, or FL.IVUS, catheters, Focal Acoustic Computed Tomography catheters and ultra-high resolution Optical Coherence Tomography, or OCT, systems and catheters.
Through Axsun Technologies, Inc., or Axsun, one of our wholly owned subsidiaries, we also develop and manufacture optical monitors for the telecommunication industry; laser and non-laser light sources, and optical engines used in the medical OCT imaging systems and advanced photonic components and sub-systems used in spectroscopy and other industrial applications. We believe Axsun’s proprietary OCT technology will provide us competitive advantages in the invasive imaging sector.
We have corporate infrastructure in the U.S., Europe and Japan. Our corporate office is located in San Diego, California. Our worldwide manufacturing and research and development operations are located in Rancho Cordova, California. We also have additional research and development facilities in Cleveland, Ohio; Forsyth County, Georgia and San Diego, California. We have sales offices in Alpharetta, Georgia and Tokyo, Japan; sales and distribution offices in Zaventem, Belgium and Woodmead, South Africa; and third-party distribution facilities in Tokyo, Japan. In addition, we have facilities in Billerica, Massachusetts for the manufacturing and operations of Axsun, our wholly owned subsidiary, and the research and development of OCT and FL.IVUS technology. During the first half of 2010, we completed our restructuring plan to close our facility in San Antonio, Texas and consolidated our OCT resources into our Billerica, Massachusetts facility. We are currently in the process of constructing a manufacturing facility in Costa Rica and expect to begin commercial manufacturing activities there in 2012. At December 31, 2011, we had 1,289 full time employees worldwide, including 507 manufacturing employees, 334 sales and marketing employees and 162 research and development employees.
We have focused on building our domestic and international sales and marketing infrastructure to market our products to physicians and technicians who perform PCI procedures in hospitals and to other personnel who
48
make purchasing decisions on behalf of hospitals. We sell our products directly to customers in the U.S., certain European markets and South Africa. During the third quarter of 2010, we transitioned our business from selling our products primarily through distributors to selling our products directly to customers in Japan. We utilize distributors in other geographic areas. Our distributors are involved in product launch planning, education and training, physician support and clinical trial management.
At December 31, 2011, we had a worldwide installed base of over 6,800 consoles. We intend to grow and leverage this installed base to drive recurring sales of our single-procedure disposable catheters and guide wires. In the year ended December 31, 2011, the sale of our single-procedure disposable catheters and guide wires accounted for $268.1 million, or 80.6% of our medical segment revenues, a $54.5 million, or 25.5% increase from 2010, in which the sale of our single-procedure disposable catheters and guide wires accounted for $213.5 million, or 78.8% of our medical segment revenues.
We manufacture our multi-modality and FFR consoles, IVUS catheters and FFR guide wires at our facility in Rancho Cordova, California. We use third-party manufacturing partners to produce circuit boards and mechanical sub-assemblies used in the manufacture of our consoles. We also use third-party manufacturing partners for certain proprietary components used in the manufacture of our single-procedure disposable products. We perform incoming inspection on these circuit boards, mechanical sub-assemblies and components, assemble them into finished products, and test the final product to assure quality control.
Our revenues have increased from $227.9 million in 2009 to $294.1 million in 2010 and to $343.5 million in 2011. Our operating loss was $30.8 million in 2009, which included an $11.0 million charge related to in-process research and development, or IPR&D, for a milestone payment related to the CardioSpectra acquisition and a $3.0 million charge related to the accrual of a milestone payment related to the Novelis acquisition. In 2010 we had operating income of $10.0 million, which included a reversal of the $3.0 million charge related to the Novelis milestone, as we believed we would no longer achieve the milestone. Our 2010 operating results also included $4.9 million in expenses resulting from the judgment related to our ongoing LightLab litigation (discussed in more detail in Note 4 “Commitments and Other Contractual Obligations – Litigation – LightLab” to our consolidated financial statements). Since our inception, 2010 is the first full fiscal year in which profitability was achieved. In 2011 we had operating income of $25.4 million, and this is the second full fiscal year we achieved profitability.
In the years ended December 31, 2011, 2010 and 2009, 47.3%, 43.0%, and 38.9%, respectively, of our revenues and 22.5%, 22.1%, and 21.0%, respectively, of our operating expenses were denominated in various non-U.S. dollar currencies, primarily the euro and the Japanese yen. We expect that a significant portion of our revenue and operating expenses will continue to be denominated in non-U.S. dollar currencies. As a result, we are subject to risks related to fluctuations in foreign currency exchange rates, which could affect our operating results in the future. Since our yen denominated sales exceeds our yen denominated costs, whenever the U.S. dollar strengthens relative to the yen, there is an adverse effect on our results of operations. Conversely, whenever the U.S. dollar weakens relative to the yen, there is a positive effect on our results of operations. On the contrary, because our euro denominated costs exceeds our euro denominated sales, whenever the U.S. dollar strengthens relative to the euro, there is a positive effect on our results of operations. Conversely, whenever the U.S. dollar weakens relative to the Euro, there is an adverse effect on our results of operations. For example, the average exchange rate of one U.S. dollar to yen decreased 9.3% from 87.8 in 2010 to 79.6 in 2011, which resulted in a net positive impact to our operational results in the amount of approximately $5.2 million. The average exchange rate of one euro to U.S. dollar increased 7.7% from 1.3 in 2010 to 1.4 in 2011, which resulted in a net positive impact to our operational results in the amount of approximately $1.7 million.
The economic conditions in many countries and regions where we generate our revenues remain uncertain. If our customers do not obtain or do not have access to the necessary capital to operate their businesses, or are otherwise adversely affected by any deterioration in national and worldwide economic conditions, this could result in reductions in the sales of our products, longer sales cycles and slower adoption of new technologies by
49
our customers, which would materially and adversely affect our business. In addition, our customers’ and suppliers’ liquidity, capital resources and credit may be adversely affected by their relative ability or inability to obtain capital and credit, which could adversely affect our ability to collect on our outstanding invoices and lengthen our collection cycles, or limit our timely access to important sources of raw materials necessary for the manufacture of our consoles and catheters.
In addition, the political unrest in the Middle East may have adverse consequences to the global economy or to our customers in the Middle East, which could negatively impact our business. The challenging global economic conditions have also led to concerns over the solvency of certain European Union member states, including Greece, Ireland, Italy, Portugal and Spain. Uncertainty about future economic conditions may make it more difficult for us to forecast operating results and to make decisions about future investments. For further discussion, see “Risk Factors—General national and worldwide economic conditions may materially and adversely affect our financial performance and results of operations.”
Financial Operations Overview
The following is a description of the primary components of our revenue and expenses.
Revenues.We derive our revenues from two reporting segments: medical and industrial. Our medical segment represents our core business, in which we derive revenues primarily from the sale of our consoles and single-procedure disposables. Our industrial segment derives revenues related to the sales of Axsun’s micro-optical spectrometers and optical channel monitors to telecommunication and other industrial companies. In the year ended December 31, 2011, we generated $343.5 million of revenues which is composed of $332.5 million from our medical segment and $11.0 million from our industrial segment. We experienced increases in revenues related to IVUS and FFR single-procedure disposables and FFR consoles in 2011 compared with 2010, while IVUS console sales remained relatively flat year over year. In the year ended December 31, 2011, 12.3% of our medical segment revenues were derived from the sale of our consoles, as compared with 15.0% in the year ended December 31, 2010. In the year ended December 31, 2011, IVUS single-procedure disposables accounted for 60.4% of our medical segment revenues, compared to 61.6% in 2010, while in the year ended December 31, 2011, 20.2% of our medical segment revenues were derived from the sale of our FFR single-procedure disposables, as compared with 17.2% in the year ended December 31, 2010. Other revenues consist primarily of service and maintenance revenues, shipping and handling revenues, sales of distributed products, spare parts sales, and license fees.
We expect to continue to experience variability in our quarterly revenues from console sales due in part to the timing of hospital capital equipment purchasing decisions. Further, we expect variability of our revenues based on the timing of our new product introductions, which may cause our customers to delay their purchasing decisions until the new products are commercially available. We may include in our arrangements with customers future deliverables, such as unspecified hardware upgrades or biomedical equipment education. In these cases, we may be required to defer the allocated arrangement consideration based on the relative estimated selling prices of the undelivered items until all our obligations have been met.
Our medical segment sales in the U.S. are generated by our direct sales representatives and our products are shipped to hospitals throughout the U.S. from our facilities in Rancho Cordova, California and Billerica, Massachusetts. Our medical segment international sales are generated by our direct sales representatives or through independent distributors and are shipped throughout the world from our facilities in Rancho Cordova, California; Billerica, Massachusetts; Zaventem, Belgium; Tokyo, Japan; and Woodmead, South Africa. Our industrial segment sales are generated by our direct sales representatives or through independent distributors and these products are shipped primarily to telecommunications and industrial companies domestically and abroad from our facility in Billerica, Massachusetts.
50
Cost of Revenues.Cost of revenues consists primarily of material costs for the products that we sell and other costs associated with our manufacturing process, such as personnel costs, rent, depreciation related to our manufacturing equipment and utilities. In addition, cost of revenues includes depreciation of company-owned consoles, royalty expenses for licensed technologies included in our products, service costs, provisions for warranty, distribution, freight and packaging costs and stock-based compensation expense related to manufacturing employees. We expect a trend of further improvement in our gross margin for IVUS and FFR products if we are successful in our ongoing efforts to streamline and improve our manufacturing processes, increase production volumes and transition certain manufacturing operations to Costa Rica.
Selling, General and Administrative.Selling, general and administrative expenses consist primarily of salaries and other related costs for personnel serving the sales, administrative and marketing functions. Other costs include stock-based compensation expense, professional fees for legal and accounting service, travel and entertainment expenses, facility costs, trade show, training and other promotional expenses. Due to ongoing litigation, legal expenses tend to be somewhat unpredictable in their timing and amount. We expect that our selling, general and administrative expenses will increase as we continue to expand our sales force and marketing efforts and invest in the necessary infrastructure to support our continued growth. We expect these expenses to grow at a slower rate than our revenues as we plan to leverage these costs as we continue to grow our business.
Research and Development.Research and development expenses consist primarily of salaries and related expenses for personnel, consultants, prototype materials, clinical studies, depreciation, regulatory filing fees, certain legal costs related to our intellectual property and stock-based compensation expense. We expense research and development costs as incurred. Due to product development timelines, research and development costs tend to be distributed unevenly between the periods. We expect our research and development expenses to increase as we continue to develop our products and technologies.
Amortization of Intangibles. We amortize intangible assets, consisting of our developed technology, licenses, customer relationships, assembled workforce, patents and trademarks, using the straight-line method over their estimated useful lives of up to 20 years. These assets are regularly tested for impairment and abandonment.
In-process Research and Development.IPR&D consists of our projects acquired in connection with acquisitions that had not reached technological feasibility and had no alternative future uses as of each acquisition date. Certain additional payments that may be required in connection with our acquisitions could result in future charges to IPR&D.
In December 2007, we acquired certain OCT assets in connection with our acquisition of CardioSpectra, Inc., or CardioSpectra, which were valued at $26.3 million. In-vivo testing and regulatory approval remained to be completed as of the acquisition date at an estimated cost of $7.2 million. In December 2009, we achieved a milestone specified in the CardioSpectra merger agreement and $11.0 million became payable by us to the former stockholders of CardioSpectra. We paid such amount to the former stockholders of CardioSpectra with the issuance of 609,360 shares of our common stock and $531,000 of cash in January 2010. The second milestone specified in the merger agreement was not achieved as of December 31, 2010, and as such was not paid. Although we have received CE mark approval for a preliminary version of our OCT product, this version is not intended to be commercialized. We believe there are significant incremental efforts and costs that must be incurred to complete a product that is suitable for commercialization and there is significant risk that a commercializable product may not result from our efforts. As of December 31, 2011, we estimate that we will incur $6.8 million of additional costs in order to obtain a commercializable OCT product for a total of approximately $28.2 million. Due to uncertainties in our OCT development program, we are currently unable to predict when we will launch our OCT product. Additional milestone payments of up to $17.0 million may be paid to the former stockholders of CardioSpectra upon achievement of the respective revenue targets described in the merger agreement (see Note 2 “Acquisitions” to our consolidated financial statements).
If we are unable to launch an OCT product in a timely manner, or at all, such as if we experience delays associated with significant design changes that result from unsuccessful human trials or discoveries during
51
human trials, we may jeopardize a potential competitive position, experience difficulties in obtaining our forecasted revenues and associated market share and we may not be required to pay some or all of the remaining milestone payments.
In May 2008, we acquired the FL.IVUS project in connection with our acquisition of Novelis, which was valued at $12.2 million. Under the terms of the merger agreement, a milestone payment of $3.0 million was eligible to be earned by the Novelis stockholders upon receipt of FDA approval of a 510(k) application relating to the Novelis FL.IVUS device only in the event that the original 510(k) application for such a device was filed with the FDA on or before December 31, 2009. At December 31, 2009, a 510(k) application had been made to the FDA. At that time, we believed that the 510(k) application would be approved and that the milestone would become payable. Accordingly, at December 31, 2009 we recorded an accrual for $3.0 million in relation to the potential milestone payment. Based on our internal assessments in relation to our ongoing interactions with the FDA regarding this 510(k) application, during the fourth quarter of 2010 it became apparent that our original 510(k) application would not be approved prior to its expiration. Accordingly, we reversed the accrual for the milestone payment, resulting in a $3.0 million credit to IPR&D expense during the fourth quarter of 2010.
We believe there are significant incremental efforts and costs that must be incurred to complete a product that is suitable for commercialization. As of December 31, 2011, we estimate that we will incur $4.2 million of additional costs in order to commercialize the first product using FL.IVUS for a total of $16.0 million. We originally expected the FL.IVUS project to receive regulatory approvals and be commercialized during 2009. As of December 31, 2011, the project was expected to be completed in 2013.
If the FL.IVUS project is not completed in a timely manner, such as if we experience delays associated with significant design changes that result from unsuccessful human trials or discoveries during human trials, we may jeopardize our competitive position and experience a potential loss of revenues and associated market share.
In August 2010 we acquired the Forward Looking Intra-Cardiac Echo, or FL.ICE, project in connection with our acquisition of Fluid Medical Inc., or Fluid Medical. This project was recorded as an intangible asset and was valued at $4.1 million. At the date of acquisition the estimated costs to complete were $5.9 million. At December 31, 2011, the estimated costs to complete are approximately $4.2 million for a total of $6.9 million. As of December 31, 2011, the FL.ICE project was expected to be completed in 2013.
The following table summarizes our significant IPR&D projects (in millions):
| | | | | | | | | | | | | | | | | | | | |
| | | As of Acquisition Date | | | Costs Incurred
Since Acquisition | | | Estimated Cost to
Complete, as of
December 31, 2011 | | | Total Estimated
Costs to Complete
since Acquisition
Date | |
Project Name | | Fair Value | | | Estimated Cost to Complete | | | | |
OCT | | $ | 26.3 | | | $ | 7.2 | | | $ | 21.4 | | | $ | 6.8 | | | $ | 28.2 | |
FL.IVUS | | | 12.2 | | | | 3.9 | | | | 11.8 | | | | 4.2 | | | | 16.0 | |
FL.ICE | | | 4.1 | | | | 5.9 | | | | 2.7 | | | | 4.2 | | | | 6.9 | |
Interest Income. Interest income is comprised of interest income earned from our cash and cash equivalents and our short-term and long-term available-for-sale investments.
Interest Expense. Interest expense is comprised of interest expense related to our convertible debt (including coupon interest, accretion of debt discount, and amortization of issuance costs), interest expense on the Final Judgment in our Massachusetts litigation (see Note 4 “Commitments and Contingencies – Litigation” to our consolidated financial statements) and interest expense related to our capital lease obligations.
Exchange Rate Gain (Loss). Exchange rate gain (loss) is comprised of foreign currency transaction and remeasurement gains and losses, and the effect of changes in value and net settlements of our foreign exchange forward contracts.
52
Provision for Income Taxes. Our effective tax rate is a blended rate resulting from the composition of taxable income in the global jurisdictions in which we conduct business. We apply the “with and without method—direct effects only”, in accordance with authoritative guidance, with respect to recognition of stock option excess tax benefits within stockholders equity (additional paid in capital). Therefore, provision for domestic income taxes is determined utilizing projected federal and state taxable income before the application of deductible excess tax benefits attributable to stock option exercises.
For the years ended December 31, 2011, 2010 and 2009, the provision for income taxes is comprised of federal, foreign and various state and local income taxes. In assessing the realizability of deferred tax assets, management considers whether it is more likely than not that some portion or all of the deferred tax assets will be realized. The ultimate realization of deferred tax assets is dependent upon the generation of future taxable income during the periods in which those temporary differences become deductible. During the fourth quarter of 2011, we concluded that it was more likely than not that we would be able to realize the benefit of a significant portion of our deferred tax assets in the future. We based this conclusion on historical and projected operating performance, as well as our expectation that our operations will generate sufficient taxable income in future periods to realize the tax benefit associated with the related deferred tax assets. As a result, we released $22 million of the valuation allowance on our net federal and state deferred tax assets.
Results of Operations
The following table sets forth items derived from our consolidated statements of operations for the years ended December 31, 2011, 2010 and 2009 presented in both absolute dollars (in thousands) and as a percentage of revenues, with the dollar and percentage change year over year:
| | | | | | | | | | | | | | | | | | | | | | | | | | | | | | | | | | | | | | | | |
| | | Years Ended December 31, | | | Changes 2011 vs.
2010 | | | Changes 2010
vs. 2009 | |
| | | 2011 | | | 2010 | | | 2009 | | | $ | | | % | | | $ | | | % | |
Revenues | | $ | 343,546 | | | | 100.0 | % | | $ | 294,146 | | | | 100.0 | % | | $ | 227,867 | | | | 100.0 | % | | $ | 49,400 | | | | 16.8 | | | $ | 66,279 | | | | 29.1 | |
Cost of revenues, excluding amortization of intangibles | | | 114,533 | | | | 33.3 | | | | 108,860 | | | | 37.0 | | | | 91,489 | | | | 40.2 | | | | 5,673 | | | | 5.2 | | | | 17,371 | | | | 19.0 | |
| | | | | | | | | | | | | | | | | | | | | | | | | | | | | | | | | | | | | | | | |
Gross profit | | | 229,013 | | | | 66.7 | | | | 185,286 | | | | 63.0 | | | | 136,378 | | | | 59.8 | | | | 43,727 | | | | 23.6 | | | | 48,908 | | | | 35.9 | |
Operating expenses: | | | | | | | | | | | | | | | — | | | | | | | | — | | | | | | | | | | | | | | | | | |
Selling, general and administrative | | | 147,057 | | | | 42.8 | | | | 133,174 | | | | 45.3 | | | | 111,598 | | | | 48.9 | | | | 13,883 | | | | 10.4 | | | | 21,576 | | | | 19.3 | |
Research and development | | | 53,098 | | | | 15.5 | | | | 42,517 | | | | 14.5 | | | | 37,372 | | | | 16.4 | | | | 10,581 | | | | 24.9 | | | | 5,145 | | | | 13.8 | |
Amortization of intangibles | | | 3,447 | | | | 1.0 | | | | 2,559 | | | | 0.8 | | | | 4,224 | | | | 1.9 | | | | 888 | | | | 34.7 | | | | (1,665 | ) | | | (39.4 | ) |
In-process research and development | | | — | | | | — | | | | (2,935 | ) | | | (1.0 | ) | | | 14,030 | | | | 6.1 | | | | 2,935 | | | | (100.0 | ) | | | (16,965 | ) | | | (120.9 | ) |
| | | | | | | | | | | | | | | | | | | | | | | | | | | | | | | | | | | | | | | | |
Total operating expenses | | | 203,602 | | | | 59.3 | | | | 175,315 | | | | 59.6 | | | | 167,224 | | | | 73.3 | | | | 28,287 | | | | 16.1 | | | | 8,091 | | | | 4.8 | |
| | | | | | | | | | | | | | | | | | | | | | | | | | | | | | | | | | | | | | | | |
Operating income (loss) | | | 25,411 | | | | 7.4 | | | | 9,971 | | | | 3.4 | | | | (30,846 | ) | | | (13.5 | ) | | | 15,440 | | | | 154.8 | | | | 40,817 | | | | (132.3 | ) |
Interest income | | | 908 | | | | 0.3 | | | | 477 | | | | 0.2 | | | | 756 | | | | 0.3 | | | | 431 | | | | 90.4 | | | | (279 | ) | | | (36.9 | ) |
Interest expense | | | (7,107 | ) | | | (2.1 | ) | | | (2,192 | ) | | | (0.8 | ) | | | (5 | ) | | | — | | | | (4,915 | ) | | | 224.2 | | | | (2,187 | ) | | | nm | * |
Exchange rate gain (loss) | | | (997 | ) | | | (0.3 | ) | | | (904 | ) | | | (0.3 | ) | | | 2,328 | | | | 1.0 | | | | (93 | ) | | | 10.3 | | | | (3,232 | ) | | | (138.8 | ) |
Other, net | | | (112 | ) | | | — | | | | (25 | ) | | | — | | | | — | | | | — | | | | (87 | ) | | | 348.0 | | | | (25 | ) | | | — | |
| | | | | | | | | | | | | | | | | | | | | | | | | | | | | | | | | | | | | | | | |
Income (loss) before income tax | | | 18,103 | | | | 5.3 | | | | 7,327 | | | | 2.5 | | | | (27,767 | ) | | | (12.2 | ) | | | 10,776 | | | | 147.1 | | | | 35,094 | | | | (126.4 | ) |
Income tax (benefit) expense | | | (19,990 | ) | | | (5.8 | ) | | | 2,087 | | | | 0.7 | | | | 1,187 | | | | 0.5 | | | | (22,077 | ) | | | (1,057.8 | ) | | | 900 | | | | 75.8 | |
| | | | | | | | | | | | | | | | | | | | | | | | | | | | | | | | | | | | | | | | |
Net income (loss) | | $ | 38,093 | | | | 11.1 | % | | $ | 5,240 | | | | 1.8 | % | | $ | (28,954 | ) | | | (12.7 | )% | | $ | 32,853 | | | | 627.0 | | | | $34,194 | | | | (118.1 | ) |
| | | | | | | | | | | | | | | | | | | | | | | | | | | | | | | | | | | | | | | | |
nm*—not meaningful.
53
The following table sets forth our revenues by segment and product (in thousands) and the changes in revenues between the specified periods:
| | | | | | | | | | | | | | | | | | | | | | | | | | | | |
| | | Years Ended December 31, | | | Changes 2011 vs.
2010 | | | Changes 2010 vs.
2009 | |
| | | 2011 | | | 2010 | | | 2009 | | | $ | | | % | | | $ | | | % | |
Medical segment: | | | | | | | | | | | | | | | | | | | | | | | | | | | | |
Consoles | | $ | 40,954 | | | $ | 40,630 | | | $ | 39,438 | | | $ | 324 | | | | 0.8 | | | $ | 1,192 | | | | 3.0 | |
Single-procedure disposables: | | | | | | | | | | | | | | | | | | | | | | | | | | | | |
IVUS | | | 200,970 | | | | 167,023 | | | | 130,785 | | | | 33,947 | | | | 20.3 | | | | 36,238 | | | | 27.7 | |
FFR | | | 67,082 | | | | 46,517 | | | | 31,125 | | | | 20,565 | | | | 44.2 | | | | 15,392 | | | | 49.5 | |
Other | | | 23,530 | | | | 16,943 | | | | 10,345 | | | | 6,587 | | | | 38.9 | | | | 6,598 | | | | 63.8 | |
| | | | | | | | | | | | | | | | | | | | | | | | | | | | |
Sub-total medical segment | | | 332,536 | | | | 271,113 | | | | 211,693 | | | | 61,423 | | | | 22.7 | | | | 59,420 | | | | 28.1 | |
Industrial segment | | | 11,010 | | | | 23,033 | | | | 16,174 | | | | (12,023 | ) | | | (52.2 | ) | | | 6,859 | | | | 42.4 | |
| | | | | | | | | | | | | | | | | | | | | | | | | | | | |
| | $ | 343,546 | | | $ | 294,146 | | | $ | 227,867 | | | $ | 49,400 | | | | 16.8 | | | $ | 66,279 | | | | 29.1 | |
| | | | | | | | | | | | | | | | | | | | | | | | | | | | |
The following table sets forth our revenues by geographic area (in thousands) and the changes in revenues in the specified periods:
| | | | | | | | | | | | | | | | | | | | | | | | | | | | |
| | | Years Ended December 31, | | | Changes 2011 vs.
2010 | | | Changes 2010 vs.
2009 | |
| | | 2011 | | | 2010 | | | 2009 | | | $ | | | % | | | $ | | | % | |
Revenues (1): | | | | | | | | | | | | | | | | | | | | | | | | | | | | |
United States | | $ | 157,412 | | | $ | 134,645 | | | | $110,502 | | | | $22,767 | | | | 16.9 | | | | $24,143 | | | | 21.8 | |
Japan | | | 105,892 | | | | 79,277 | | | | 52,339 | | | | 26,615 | | | | 33.6 | | | | 26,938 | | | | 51.5 | |
Europe, the Middle East and | | | | | | | | | | | | | | | | | | | | | | | | | | | | |
Africa | | | 60,249 | | | | 57,614 | | | | 47,609 | | | | 2,635 | | | | 4.6 | | | | 10,005 | | | | 21.0 | |
Rest of world | | | 19,993 | | | | 22,610 | | | | 17,417 | | | | (2,617 | ) | | | (11.6 | ) | | | 5,193 | | | | 29.8 | |
| | | | | | | | | | | | | | | | | | | | | | | | | | | | |
| | $ | 343,546 | | | $ | 294,146 | | | | $227,867 | | | | $49,400 | | | | 16.8 | | | | $66,279 | | | | 29.1 | |
| | | | | | | | | | | | | | | | | | | | | | | | | | | | |
| (1) | Revenues are attributed to geographies based on the location of the customer, except for shipments to original equipment manufacturers, which are attributed to the country of the origin of the equipment distributed. |
Comparison of Years Ended December 31, 2011 and 2010
Revenues.Overall, the increase in the medical segment revenue in the year ended December 31, 2011 compared with the year ended December 31, 2010 were driven by increased demand for our disposables, as well as higher revenues resulting from our direct sales efforts in Japan and favorable impacts of foreign exchange rates related to the yen and euro. Additionally, the increases in FFR disposable revenues were primarily due to the broader availability of FFR technology as this functionality has been incorporated into our multi-modality console, and in conjunction with an increased adoption of the technology based on clinical study data. The revenue increases related to our consoles resulted from increased sales of console units, especially the FFR consoles which achieved increased penetration into the market during 2011. The decrease in industrial segment revenues results from lower sales to our international telecommunication customers due to the telecommunications industry’s cyclical nature. The increase in other revenues is primarily due to higher sales of third-party products and higher service contract and rental revenues. We recognized increases in revenues across all our key geographic markets. The Japanese market’s growth is due to the continued success of our direct sales efforts and the favorable impact of foreign currency exchange related to the yen. The decrease in the rest of the world primarily relates to the decline in our industrial segment revenues to customers in China.
54
Cost of Revenues. The increase in the cost of revenues in the year ended December 31, 2011 compared with the year ended December 31, 2010 was primarily due to higher sales volume. Gross margin was 66.7% of revenues in the year ended December 31, 2011, up from 63.0% of revenues in the year ended December 31, 2010. This favorable gross margin was primarily the result of a decrease in the production costs of IVUS and FFR disposable products due to favorable product mix, and ongoing cost reduction initiatives, a decline in lower margin Axsun industrial sales, and favorable impacts of foreign currency exchange rates to the gross margin related to the yen and euro. These benefits were partially offset by increased depreciation costs from additions of company-owned consoles.
Selling, General and Administrative. The increase in selling, general and administrative expenses in the year ended December 31, 2011 compared with the year ended December 31, 2010 was primarily due to increased headcount resulting from the expansion of our U.S., Japan and Europe sales organizations, including continued growth in our Japan operation to support our direct sales efforts there; expansion of our Costa Rica general and administrative activities during the pre-production phase; unfavorable impacts of foreign currency exchange rates related to the yen and euro; increased information technology and infrastructure expenses to support company growth; and legal expenses related to our litigation matters. In addition, during the year ended December 31, 2010, we recorded a judgment of $4.9 million, which is discussed in more detail in Note 4 “Commitments and Other Contractual Obligations – Litigation – LightLab” to our consolidated financial statement.
Research and Development. The increase in research and development expenses in the year ended December 31, 2011 compared with the year ended December 31, 2010 was primarily due to increased spending on various product development projects, increased clinical expenses, mainly related to the VERDICT and FIRST clinical programs, and activities supporting other acquired technologies.
Amortization of Intangibles.The increase in amortization expense in the year ended December 31, 2011 compared with the year ended December 31, 2010 is primarily due to the addition of intangible assets and related to the amortization of the customer relationship intangibles we acquired upon the termination of a distributor relationship in November 2010.
In-process Research and Development.There was no IPR&D expense recorded in the year ended December 31, 2011. During 2010, we recorded $65,000 of IPR&D expense related to the milestone achieved under the OCT program offset by a $3 million reversal of an accrual for a milestone payment of $3.0 million recognized in 2009 related to our FL.IVUS project acquired from Novelis as we believed we would no longer achieve the milestone.
Interest Income.The increase in interest income was primarily due to a significant increase in our investment balances during the year ended December 31, 2011 as compared to the year ended December 31, 2010, resulting from the proceeds of our convertible debt offering which commenced on September 20, 2010 and favorable cash flows from operations.
Interest Expense. Interest expense during the year ended December 31, 2011 was primarily related to our convertible debt (including coupon interest, accretion of debt discount, and amortization of debt issuance costs) and interest expense on a judgment related to our LightLab litigation, while in the year ended December 31, 2010 interest expense was primarily related to our convertible debt issued on September 20, 2010.
Exchange Rate Gain (Loss). During the year ended December 31, 2011 and 2010 the impact of fluctuations in exchange rates was somewhat mitigated by our hedging practices. Through our hedging program we reduce the volatility of our exchange rate gains and losses resulting from the remeasurement of our intercompany receivable balances at current exchange rates.
Provision for Income Taxes. During the quarter ended December 31, 2011, we concluded that it was more likely than not that we would be able to realize the benefit of a significant portion of our deferred tax assets in the future. Therefore, we reversed $22 million of the valuation allowance on the Company’s net federal and certain state deferred income tax assets.
Stock option excess tax benefits of $165,000 and $433,000 were credited to additional paid-in-capital during the year ended December 31, 2011 and 2010, respectively. The reversal of the valuation allowance related to Convertible Senior Notes of $1.7 million was credited to additional paid in capital during the year ended December 31, 2011.
55
Comparison of Years Ended December 31, 2010 and 2009
Revenues.Overall, the increase in our medical segment revenue were driven by increased demand for our disposables, as well as higher revenues resulting from our direct sales efforts in Japan. Additionally, the increases in FFR disposable revenues were primarily due to the broader availability of FFR technology as this functionality has been incorporated into our multi-modality console, in conjunction with an increased adoption of the technology based on clinical study data. The increase in the revenues related to console sales in the year ended December 31, 2010 compared with the year ended December 31, 2009 was based on an increase in console unit sales. The increase in the industrial segment resulted from higher sales to our international telecommunications customers. The increase in other revenues is due primarily to higher service contract and rental revenues, partially offset by lower sales of distributed products. Increases in revenues were realized across all our key geographic markets.
Cost of Revenues. The increase in the cost of revenues during the year ended December 31, 2010 compared with the year ended December 31, 2009 was primarily due to higher sales volume. Gross margin was 63.0% of revenues in the year ended December 31, 2010, up from 59.8% of revenues in the year ended December 31, 2009. This gross margin improvement was primarily the result of favorable pricing from our transition to the direct sales model in Japan, a decrease in the production costs of IVUS and FFR disposable products due to ongoing cost reduction initiatives, increased overhead recovery rates due to higher volumes, and lower warranty related costs. These benefits were partially offset by increased depreciation costs from our console unit placement pool additions.
Selling, General and Administrative. The increase in selling, general and administrative expenses during the year ended December 31, 2010 compared with the year ended December 31, 2009 was primarily due to increased headcount resulting from the expansion of our U.S., Europe and Japan sales organizations, including continued growth in our Japan operation to support our direct sales efforts there, legal expenses related to our litigation matters, (including the LightLab litigation and associated judgment of $4.9 million which is discussed in more detail in Note 4 “Commitments and Other Contractual Obligations – Litigation – LightLab” to our consolidated financial statements), increased infrastructure expenses to support company growth, higher stock-based compensation expense, increased marketing expenses related to new product launches, and severance payments related to the resignation of two senior executives.
Research and Development. The increase in research and development expenses in the year ended December 31, 2010 compared with the year ended December 31, 2009 was primarily due to increased spending on various new and existing product development projects, including OCT and FL.IVUS and activities supporting other acquired technologies, and increased clinical and regulatory expenses.
Amortization of Intangibles. The decrease in amortization expense in the year ended December 31, 2010 compared with the year ended December 31, 2009 was primarily related to developed technology that we originally acquired from Jomed, NV that was fully amortized as of December 2009, partially offset by amortization expense related to developed technology acquired in February 2010.
In-process Research and Development.IPR&D expenses were a reduction of expenses of $2.9 million in the year ended December 31, 2010. This primarily resulted from the reversal of an accrual for a milestone payment of $3.0 million recognized in 2009 related to our FL.IVUS project acquired from Novelis as we believed we would no longer achieve the milestone. IPR&D expenses were $14.0 million in the year ended December 31, 2009. Of this amount, $11.0 million related to a milestone payment for our OCT project acquired from CardioSpectra and $3.0 million related to the accrual of a milestone payment for our FL.IVUS project acquired from Novelis.
Interest Income. The decrease in interest income in the year ended December 31, 2010 compared with the year ended December 31, 2009 was primarily due to a decrease in the weighted-average yield earned on our Investments.
56
Interest Expense. The increase in interest expense was primarily due to our convertible debt financing which was completed in September 2010. Interest expense during the year ended December 31, 2010 related to our convertible debt (including coupon interest, accretion of debt discount, and amortization of debt issuance costs) and interest expense on our capital lease obligations, while in the year ended December 31, 2009 interest expense was entirely related to our capital lease obligations.
Exchange Rate Gain (Loss). The exchange rate gain in the year ended December 31, 2009 was primarily related to the weakening of the U.S. dollar compared to the yen and the related effect on the valuation of euro-based monetary assets and liabilities held by Volcano Europe B.V.B.A., or Volcano Europe. In October 2009, approximately $23.4 million of intercompany receivable amounts owed to Volcano Corporation from Volcano Japan Co. Ltd., or Volcano Japan, were converted to long-term investment, resulting in a decrease in the amount of yen-based receivables being marked-to-market. In addition, in October 2009, we implemented a hedging program to mitigate the volatility of our exchange rate gains and losses resulting from the translation of our intercompany receivable balances at current exchange rates. During the year ended December 31, 2010, the impact of fluctuations in exchange rates was significantly reduced through our hedging practices.
Provision for Income Taxes. The income tax provision and the year-over-year increase were comprised primarily of taxes related to our Japanese operations, while the year-over-year increase also included amounts related to state taxes. Stock option excess tax benefits of $433,000 were credited to additional paid-in-capital during the year ended December 31, 2010.
Liquidity and Capital Resources
Sources of Liquidity
Historically, our sources of cash have included:
| | • | | issuance of equity and debt securities, including underwritten public offerings of our common stock and convertible bonds, cash generated from the exercise of stock options and participation in our employee stock purchase plan; |
| | • | | cash generated from operations, primarily from product sales; and |
Our historical cash outflows have primarily been associated with:
| | • | | cash used for operating activities such as the purchase and growth of inventory, expansion of our sales and marketing and research and development infrastructure and other working capital needs; |
| | • | | expenditures related to increasing our manufacturing capacity and improving our manufacturing efficiency; |
| | • | | capital expenditures related to the acquisition of equipment that we own and place at our customer premises and other fixed assets; |
| | • | | cash used to repay our debt obligations and related interest expense; and |
| | • | | cash used for acquisitions. |
Fluctuations in our working capital due to timing differences of our cash receipts and cash disbursements also impact our cash inflows and outflows.
On September 20, 2010, we issued $115.0 million principal amount of 2.875% Notes in an offering registered under the Securities Act of 1933, as amended. To hedge against potential dilution upon conversion of the Notes, we purchased call options on our common stock from JPMorgan Chase. In addition, to reduce the cost of the hedge, under separate transactions we sold warrants to JPMorgan Chase. We received proceeds of $100.5 million from issuance of the Notes, net of issuance costs ($4.4 million) and net payments related to our hedge transactions ($10.0 million).
57
At December 31, 2011, our cash and cash equivalents and available-for-sale investments totaled $250.3 million. We invest our excess funds in short-term and long-term securities issued by corporations, banks, the U.S. government, municipalities, and financial holding companies and in money market funds comprised of U.S. Treasury and agency securities.
At December 31, 2011, our accumulated deficit was $89.9 million. Since inception, we have generated significant operating losses. During the years ended December 31, 2011 and 2010, we achieved full years of profitability, and our business generated $43.6 million and $46.2 million in cash flows from operating activities, respectively.
Cash Flows (in thousands)
| | | | | | | | | | | | |
| | | Years Ended December 31, | |
| | | 2011 | | | 2010 | | | 2009 | |
Net cash provided by (used in) operating activities | | $ | 43,596 | | | $ | 46,183 | | | $ | (1,651 | ) |
Net cash provided by (used in) investing activities | | | 6,729 | | | | (172,894 | ) | | | (44,383 | ) |
Net cash provided by financing activities | | | 13,140 | | | | 116,935 | | | | 3,735 | |
Effect of exchange rate changes on cash and cash equivalents | | | 122 | | | | (2,850 | ) | | | (2,595 | ) |
| | | | | | | | | | | | |
Net change in cash and cash equivalents | | $ | 63,587 | | | $ | (12,626 | ) | | $ | (44,894 | ) |
| | | | | | | | | | | | |
Cash Flows from Operating Activities.Cash provided by operating activities of $43.6 million for 2011 reflected our net income of $38.1 million, adjusted for non-cash expenses, consisting primarily of $27.0 million of depreciation and amortization, including amortization or accretion of investment premium or discount, $13.0 million of stock-based compensation expense, $4.7 million accretion of debt discount on our Notes, and offset by $22.8 million deferred tax benefit. Additional sources of cash include increases in accrued compensation ($2.0 million) and deferred revenue ($1.9 million). Uses of cash included an increase in accounts receivable of $9.3 million due to increased sales, decrease in accounts payable of $2.4 million and decrease in accrued expenses and other liabilities of $6.5 million.
Cash provided by operating activities of $46.2 million for 2010 reflected our net income of $5.2 million, adjusted for non-cash expenses, consisting primarily of $19.8 million of depreciation and amortization, including amortization or accretion of investment premium or discount, and $12.5 million of stock-based compensation expense. Additional sources of cash include increases in accrued expenses and other liabilities ($10.7 million), and accrued compensation ($4.0 million). Uses of cash included an increase in accounts receivable of $6.4 million due to increased sales, increased prepaid and other assets of $1.5 million, and an adjustment for non-cash expenses related to a decrease in IPR&D expenses of $2.9 million primarily due to the reversal of an accrual for a development milestone payment related to the Novelis acquisition ($3.0 million).
Cash used in operating activities of $1.7 million for 2009 reflected our net loss of $29.0 million and non-cash investment amortization of $626,000. In addition, uses of cash include increases in accounts receivable and inventories of $8.9 million and $8.5 million, respectively, and a decrease of accounts payable of $1.1 million. The increase in accounts receivable is due to the increased sales volume and timing of cash receipts, the increase in inventory is due to anticipated increased sales volume and the decrease in accounts payable is primarily due to the timing of disbursements. These amounts were offset by benefits realized from non-cash expenses consisting of in-process research and development expense of $14.0 million related to milestones of the CardioSpectra and Novelis acquisitions, depreciation and amortization of $16.2 million and non-cash stock compensation expense of $10.9 million. In addition, sources of cash include an increase in accrued compensation of $1.4 million, primarily due to increased headcount and related accrued benefits, and an increase in accrued expenses and other current liabilities of $1.7 million primarily related to accrued commissions to Goodman and accrued legal costs for the LightLab litigation.
58
Cash Flows from Investing Activities.In 2011, $310.6 million was used to purchase short-term and long-term available-for-sale securities and $43.2 million was used for the purchases of long-term assets, including facility construction in Costa Rica, and capital expenditures for medical diagnostic equipment, manufacturing equipment and ERP systems. Additionally, we used $3.5 million for the acquisition of other intangible assets and other investments, including purchased technology and costs of patents. These purchases were partially offset by $365.6 million from the sale or maturity of Investments.
In 2010, $234.0 million was used to purchase short-term and long-term available-for-sale securities and $25.3 million was used for the purchases of long-term assets, including capital expenditures for medical diagnostic equipment and manufacturing equipment. Additionally, we used $4.2 million for the acquisition of Fluid Medical and $3.9 million for the acquisition of other intangible assets, including purchased technology and costs of patents. These purchases were partially offset by $97.2 million from the sale or maturity of Investments.
In 2009, $146.9 million was used to purchase short-term available-for-sale securities and $26.1 million was used for the purchases of long-term assets, including capital expenditures for medical diagnostic equipment and manufacturing equipment. These purchases were partially offset by $129.1 million from the sale or maturity of short-term available-for-sale investments.
Cash Flows from Financing Activities. Cash provided by financing activities in 2011 consisted primarily of $9.4 million from exercises of common stock options, and $3.6 million from the sale of common stock under our employee stock purchase plan.
Cash provided by financing activities in 2010 consisted primarily of net proceeds of $100.5 million from the convertible debt and related hedge transactions, $13.4 million from exercises of common stock options, and $2.7 million from the sale of common stock under our employee stock purchase plan.
Cash provided by financing activities in 2009 consisted primarily of proceeds from exercises of common stock options of $2.5 million and proceeds from the sale of common stock under our employee stock purchase plan of $2.1 million.
Future Liquidity Needs
Our primary short-term needs for capital, which are subject to change, include expenditures related to:
| | • | | medical diagnostic equipment that we own and place at our customers’ premises; |
| | • | | our facilities expansion needs, including costs of constructing a new manufacturing facility, acquiring or leasing additional facilities and associated building costs or tenant improvements; |
| | • | | the acquisition of equipment and other fixed assets for use in our current and future manufacturing and research and development facilities; |
| | • | | upgrades to our information technology infrastructure to enhance our capabilities and improve overall productivity; |
| | • | | support of our commercialization efforts related to our current and future products, including expansion of our direct sales force and field support resources in the U.S. and abroad, particularly in Japan where our strategy is to continue to pursue a direct sales model; |
| | • | | the continued advancement of research and development activities; |
| | • | | improvements to and increases in our manufacturing capacity and efficiency; and |
| | • | | acquisitions of technologies that enhance our capabilities or complement our markets. |
59
Our capital expenditures are largely discretionary and within our control. We expect that our product revenue and the resulting operating income, as well as the status of each of our product development programs, will significantly impact our cash management decisions.
At December 31, 2011, we believe our current cash and cash equivalents and our available-for-sale investments will be sufficient to fund working capital requirements, capital expenditures (including the expansion of our manufacturing operations into Costa Rica and the implementation of a new enterprise resource management system), and operations for at least the next 12 months. We intend to retain any future earnings to support operations and to finance the growth and development of our business, and we do not anticipate paying any dividends in the foreseeable future.
Our future liquidity and capital requirements will be influenced by numerous factors, including the extent and duration of any future operating losses, the level and timing of future sales and expenditures, the results and scope of ongoing research and product development programs, working capital required to support our sales growth, funds required to service our debt, the receipt of and time required to obtain regulatory clearances and approvals, our sales and marketing programs, our need for infrastructure to support our sales growth, the continuing acceptance of our products in the marketplace, competing technologies and changes in the market and regulatory environment and cash that may be required to settle our foreign currency hedges.
Our ability to fund our longer-term cash needs is subject to various risks, many of which are beyond our control—See “Risk Factors—We may require significant additional capital to pursue our growth strategy, and our failure to raise capital when needed could prevent us from executing our growth strategy.” Should we require additional funding, such as additional capital investments, we may need to raise the required additional funds through bank borrowings or public or private sales of debt or equity securities. We cannot assure that such funding will be available in needed quantities or on terms favorable to us, if at all.
At December 31, 2011, we have federal and state net operating loss carry forwards of approximately $68.5 million and $39.6 million, respectively, available to reduce future taxable income if we remain profitable. Pursuant to Internal Revenue Code Section 382, use of net operating loss carry forwards related to acquisitions of approximately $29.4 million may be limited. We expect to utilize our available net operating loss carry forwards to reduce future tax obligations in the event we are successful in maintaining continued profitability. However, future limitations on our ability to use net operating loss carry forwards and other minimum state taxes may increase our overall tax obligations.
Off-Balance Sheet Arrangements
In conjunction with the sale of our products in the ordinary course of business, we provide standard indemnification to business partners and customers for losses suffered or incurred for patent, copyright or any other intellectual property infringement claims by any third parties with respect to our products. The term of these indemnification arrangements is generally perpetual. The maximum potential amount of future payments we could be required to make under these agreements is unlimited. At December 31, 2011, we have not incurred any costs to defend lawsuits or settle claims related to these indemnification arrangements.
60
Contractual Obligations
The following table summarizes our significant contractual obligations and commercial commitments that are not reflected in our balance sheet at December 31, 2011 for each of the periods indicated (in thousands):
| | | | | | | | | | | | | | | | | | | | |
| | | Payment Due By Period | |
| | Total | | | Less
Than
1 Year | | | 1-2
Years | | | 3-5
Years | | | More
than
5 Years | |
Contractual Obligations and Commercial Commitments | | | | | | | | | | | | | | | | | | | | |
Capital lease obligations (including interest) | | $ | 163 | | | $ | 102 | | | $ | 54 | | | $ | 7 | | | $ | — | |
Operating lease obligations (1) | | | 27,904 | | | | 7,765 | | | | 14,803 | | | | 2,201 | | | | 3,135 | |
Non-cancelable purchase commitments (2) | | | 32,646 | | | | 22,992 | | | | 1,609 | | | | 8,045 | | | | — | |
Convertible senior notes | | | 115,000 | | | | — | | | | — | | | | 115,000 | | | | — | |
Interest on convertible senior notes | | | 12,132 | | | | 3,306 | | | | 6,613 | | | | 2,213 | | | | — | |
Clinical programs (3) | | | — | | | | — | | | | — | | | | — | | | | — | |
Commitments for construction of Costa Rica facility | | | 11,860 | | | | 11,860 | | | | — | | | | — | | | | — | |
| | | | | | | | | | | | | | | | | | | | |
Total (4) | | $ | 199,705 | | | $ | 46,025 | | | $ | 23,079 | | | $ | 127,466 | | | $ | 3,135 | |
| | | | | | | | | | | | | | | | | | | | |
| (1) | We lease office space and have entered into other lease commitments in the U.S. as well as locations in Europe and Asia. Operating lease obligations include future minimum lease payments under all our non-cancelable operating leases at December 31, 2011. |
| (2) | Consists of non-cancelable commitments primarily for the purchase of production materials and other inventory items. |
| (3) | We have commitments to provide funding of $4.6 million to a clinical study conducted by a third-party and at December 31, 2011, we have a remaining obligation of up to $2.5 million. We will be billed as services are performed under the agreement. In addition, we have entered into agreements with other third parties to sponsor clinical studies. Generally, we contract with one or more clinical research sites for a single study and no one agreement is material to our consolidated results of operations or financial condition. We are usually billed as services are performed based on enrollment and are required to make payments over periods ranging from less than one year up to three years. Our actual payments under these agreements will vary based on enrollment. At December 31, 2011, we estimate our contractual obligations related to these clinical studies are approximately $3.3 million over the next two years. |
| (4) | The total above does not include milestone payments of up to an aggregate of $17.0 million which may be due to the former shareholders of CardioSpectra (see Note 2 “Acquisitions” to our consolidated financial statements) upon the achievement of certain milestones (and may, at our election, be payable in either cash or stock), and up to an estimated $3.3 million in payments for clinical studies which are billed as services are performed (see (3) above). |
Critical Accounting Policies:
Our financial statements have been prepared in accordance with U.S. generally accepted accounting principles, or GAAP. The preparation of these financial statements requires us to make estimates and judgments that affect the reported amounts of assets, liabilities, revenues and expenses.
Critical accounting policies are those that are both important to the portrayal of our financial condition and results of operations and require management’s most difficult, subjective or complex judgments, often as a result of the need to make estimates about the effect of matters that are inherently uncertain. As the number of variables and assumptions affecting the possible future resolution of the uncertainties increase, those judgments become even more subjective and complex. In order to provide an understanding about how our management forms its judgments about future events, including the variables and assumptions underlying the estimates, and the sensitivity of those judgments to different circumstances, we have identified our critical accounting policies below.
61
Revenue Recognition
We recognize revenues when persuasive evidence of an arrangement exists, delivery has occurred or services have been rendered, the price is fixed or determinable and collectability is reasonably assured. Revenue from the sale of our products is generally recognized when title and risk of loss transfers to the customer, the terms of which are generally free on board shipping point. We use contracts and customer purchase orders to determine the existence of an arrangement. We use shipping documents and third-party proof of delivery to verify that title has transferred. We assess whether the fee is fixed or determinable based upon the terms of the agreement associated with the transaction. To determine whether collection is probable, we assess a number of factors, including past transaction history with the customer and the creditworthiness of the customer.
We prospectively adopted Financial Accounting Standards Board (FASB) Accounting Standards Update (ASU), No. 2009-13,Revenue Recognition (Topic 605): Multiple-Deliverable Revenue Arrangements(ASU 2009-13), and ASU No. 2009-14,Software (Topic 985):Certain Revenue Arrangements That Include Software Elements (ASU 2009-14), on January 1, 2010. We have applied ASU 2009-13 to our revenue arrangements containing multiple deliverables that were entered into or significantly modified on or after January 1, 2010. These deliverables can consist of consoles, options for the console, single-procedure disposable products, among other items and are considered separate units of accounting. We allocate arrangement consideration based on the relative selling prices of the separate units of accounting contained within an arrangement containing multiple deliverables. Selling prices are determined using fair value, when available, or our estimate of selling price when fair value is not available Prior to the adoption of ASU 2009-13, we used the residual method to allocate the arrangement consideration when we had not established fair value of delivered items and deferred all arrangement consideration when fair value was not available for undelivered items. Typically, we recognize revenue for each unit of accounting upon delivery of the item and complete all obligations under an arrangement with multiple deliverables within one year.
All costs associated with the provision of service are recognized in cost of revenues as incurred. Amounts billed in excess of revenue recognized are included as deferred revenue in the consolidated balance sheets.
We sell our products through direct sales representatives in the U.S. and a combination of direct sales representatives and independent distributors in international markets. Sales to distributors are recorded when title and risk of loss transfer upon shipment (generally FOB shipping point). No direct sales customers or distributors have price protection. Estimated returns, which are historically nominal, are recorded as an allowance for sales return and as a reduction in revenues.
Fair Value
We record our Investments at fair value. At December 31, 2011, our cash and investments totaled $250.3 million. FASB ASC Topic 820,Fair Value Measurements and Disclosures, or ASC 820, establishes three levels of inputs that may be used to measure fair value (see Note 3 “Financial Statement Details” to our consolidated financial statements included in this Annual Report). Each level of input represents varying degrees of subjectivity and difficulty involved in determining fair value. Valuations using Level 1 and 2 inputs are generally based on price quotations and other observable inputs in active markets and do not require significant management judgment or estimation. We utilize a third-party pricing service to assist us in obtaining fair value pricing for these investments. While pricing for these securities is based on proprietary models, the inputs used are based on observable market information, therefore we have classified our inputs as Level 1 and Level 2. We do not value any of our investments using Level 3 inputs.
We also record our foreign exchange forward contracts at fair value. At December 31, 2011, the fair value of our foreign exchange forward contracts of $92,000 was included in prepaid and other current assets and $71,000 was included in accrued expenses and other current liabilities in our consolidated balance sheet. We classified these fair value inputs as Level 2.
62
Inventory Valuation
Inventories are valued at the lower of first-in, first-out cost or market value. Inventory provisions are recorded for materials that have become obsolete or are no longer used in current production and for inventory that has a market value less than the carrying value in inventory. We regularly monitor potential inventory excess, obsolescence and lower market values compared to standard costs and, when necessary, reduce the carrying amount of our inventory to its market value. Specific reserves are maintained to reduce the carrying value of inventory items on hand that we know may not be used in finished goods. If our estimates for potential inventory losses prove to be too low, then our future earnings will be affected when the related additional inventory losses are recorded.
Long-lived Assets
Our long-lived assets consist of property and equipment and intangible assets. Equipment and capitalized software are carried at cost and depreciated over the estimated useful lives of the assets, which are generally three to ten years, and leasehold improvements are amortized over the lesser of the lease term or the estimated useful lives of the improvements, which is generally between three and ten years. The straight-line method is used for depreciation and amortization. Intangible assets primarily consist of developed technology, customer relationships, licenses, patents and trademarks, which are amortized using the straight-line method over periods ranging from three to 20 years, representing the estimated useful lives of the assets. We capitalize external legal costs and filing fees associated with obtaining patents on our new discoveries and amortize these costs using the straight-line method over the legal life of the patent or the product’s estimated useful life, up to 20 years. Acquired intellectual property is recorded at cost and is amortized over its estimated useful life. We believe the useful lives we assigned to these assets are reasonable.
The long-lived assets are evaluated for impairment whenever events or changes in circumstances indicate that the carrying value may not be recoverable. When evaluating long-lived assets for potential impairment, we first compare the carrying value of the asset to the asset’s estimated future cash flows (undiscounted and without interest charges). If the estimated future cash flows are less the carrying value of the asset, we calculate an impairment loss. The impairment loss calculation compares the carrying value of the asset to the asset’s estimated fair value, which may be based on estimated future cash flows (discounted and with interest charges). The impairment loss calculation contain uncertainties because they require management to make assumptions and to apply judgment to estimate future cash flows and asset fair values, including forecasting useful lives of the assets and selecting the discount rate that reflects the risk inherent in future cash flows.
No impairment of long-lived assets and identifiable intangibles was identified or recorded during the years ended December 31, 2011, 2010 or 2009.
Goodwill
We evaluate goodwill for impairment annually as of October 1, or more frequently if events or changes in circumstances indicate the carrying value of the goodwill may not be recoverable. We test for goodwill impairment at the reporting unit level, which is at the operating segment level. Our goodwill is allocated entirely to our medical segment.
The impairment evaluation involves comparing the fair value of each reporting unit to its carrying value, including goodwill. Fair value reflects the price a market participant would be willing to pay in a potential sale of the reporting unit. If the fair value exceeds carrying value, then it is concluded that no goodwill impairment has occurred. If the carrying value of the reporting unit exceeds its fair value, a second step is required to measure possible goodwill impairment loss. In the second step, the implied fair value of the goodwill is determined by allocating the fair value of all of the reporting unit’s assets and liabilities other than goodwill in a manner similar to a purchase price allocation. The resulting implied fair value of the goodwill that results from the allocation is
63
then compared to the carrying amount of the goodwill and an impairment charge is recorded for the difference. These analyses contain uncertainties because they require management to make assumptions and to apply judgment to estimate industry economic factors.
Stock-based Compensation
We account for stock-based compensation under the provisions of FASB ASC Topic 718,Compensation—Stock Compensation,or ASC 718, which requires the measurement and recognition of compensation expense for all stock-based awards made to employees and directors based on estimated fair values on the grant date. We estimate the fair value of stock-based awards on the date of grant using the Black-Scholes-Merton option pricing model, or Black-Scholes model. The value of the portion of the award that is ultimately expected to vest is recognized as expense over the requisite service periods using the straight-line method. We estimate forfeitures at the time of grant and revise our estimate in subsequent periods if actual forfeitures differ from those estimates. See Note 5 “Stockholders’ Equity” to our consolidated financial statements for a complete discussion of our equity compensation programs and the fair value assumptions used to determine our stock-based compensation expense.
We have used the Black-Scholes model to estimate fair value of our stock-based awards which requires various judgmental assumptions including estimating stock price volatility, risk-free interest rate, and expected option life. If we had made different assumptions, the amount of our deferred stock-based compensation, stock-based compensation expense, gross margin, net income (loss) and net income (loss) per share amounts could have been significantly different. We believe that we have used reasonable methodologies, approaches and assumptions to determine the fair value of our common stock and that deferred stock-based compensation and related amortization were recorded properly for accounting purposes. If any of the assumptions used change significantly, stock-based compensation expense may differ materially in the future from that recorded in the current period. For example, we granted stock options for 442,470 shares of our common stock during the year ended December 31, 2011. Using our assumptions, we calculated approximately $5.0 million of stock compensation expense related to these awards that will generally be amortized over four years. Given a ten percent change in our volatility assumption, the value of these awards would have differed by approximately $900,000. Given a one-hundred basis point change in our risk-free interest rate assumption, the value of these awards would have differed by approximately $200,000. Given a one year change in our expected option life assumption, the value of these awards would have differed by approximately $600,000. In addition, given a one-hundred basis point change in our weighted-average forfeiture rate assumption, our stock-compensation expense recorded in the year ended December 31, 2011 would have differed by approximately $10,000.
Income Taxes
We account for income taxes in accordance with FASB ASC Topic 740,Income Taxes. Our deferred tax assets are determined by multiplying the differences between the financial reporting and tax reporting bases for assets and liabilities by the enacted tax rates expected to be in effect when such differences are expected to be recovered or settled.
The calculation of tax liabilities involves dealing with uncertainties in the application of complex global tax regulations. The impact of an uncertain income tax position is recognized at the largest amount that is “more likely than not” to be sustained upon audit by the relevant taxing authority. An uncertain income tax position will not be recognized if it has less than a 50% likelihood of being sustained. If the estimate of tax liabilities proves to be less than the ultimate assessment, a further charge to expense would result.
The realization of our deferred tax assets, which have a net carrying value of $32.8 million at December 31, 2011, is dependent upon our ability to generate sufficient future taxable income. In assessing the realizability of deferred tax assets, management considers whether it is more likely than not that some portion or all of the deferred tax assets will be realized. The ultimate realization of deferred tax assets is dependent upon the generation of future taxable income during the periods and jurisdictions in which those temporary differences
64
become deductible. During the fourth quarter of 2011, we concluded that it was more likely than not that we would be able to realize the benefit of a significant portion of our deferred tax assets in the future. We based this conclusion on historical and projected operating performance, as well as our expectation that our operations will generate sufficient taxable income in future periods to realize the tax benefit associated with the some of our deferred tax assets. As a result, we released $22 million of the valuation allowance on our net federal and state deferred tax assets. We believe it is more likely than not that the benefit from a portion of our state tax credit carry forwards and foreign net operating loss carry forwards will not be realized. In recognition of this risk, we will continue to provide a full valuation allowance on the deferred tax assets relating to these items. We will continue to assess the need for a valuation allowance on the deferred tax asset by evaluating both positive and negative evidence that may exist. Any adjustment to the net deferred tax asset valuation allowance would be recorded in the income statement for the period that the adjustment is determined to be required.
Recent Accounting Pronouncements
In December 2010, the FASB updated the accounting guidance relating to the test for potential impairment of goodwill that we are required to perform annually. The updated guidance requires companies to perform the second step of the impairment test to measure the amount of impairment loss, if any, when it is more likely than not that a goodwill impairment exists because the carrying amount of a reporting unit is zero or negative. In considering whether it is more likely than not that a goodwill impairment exists, an entity shall evaluate whether there are adverse qualitative factors. The updated guidance is effective for us beginning in fiscal year 2012. The adoption of this guidance is not expected to have a material impact on our consolidated financial statements.
In May 2011, the FASB amended the guidance regarding fair value measurement and disclosure. The amended guidance clarifies the application of existing fair value measurement and disclosure requirements. The amendment is effective for us beginning in fiscal year 2012. The adoption of this amendment is not expected to have a material impact on our consolidated financial statements.
In June 2011, the FASB amended requirements for the presentation of comprehensive income, to increase the prominence of other comprehensive income (OCI) in financial statements. Companies will have the option to present the components of net income and comprehensive income in either one or two consecutive financial statements. This amendment eliminates the option to present other comprehensive income in the statement of stockholders’ equity. We adopted this amendment and presented comprehensive income in the Consolidated Statements of Comprehensive Income (Loss) for the year ended December 31, 2011, 2010 and 2009 in this Annual Report on Form 10-K.
Inflation
We do not believe that inflation has had a material impact on our historical results of operations; however, there can be no assurance that our business will not be materially affected by inflation in the future.
| Item 7A. | Quantitative and Qualitative Disclosures About Market Risk |
Market risk represents the risk of changes in the value of market risk sensitive instruments caused by fluctuations in interest rates, foreign exchange rates and commodity prices. Changes in these factors could cause fluctuations in our results of operations and cash flows. In the ordinary course of business, we are exposed to interest rate and foreign exchange risk. Fluctuations in interest rates and the rate of exchange between the U.S. dollar and foreign currencies, primarily the euro and yen, could adversely affect our financial results.
We do not carry significant inventory of transducers, substrates or scanner subassemblies. If we had to change suppliers, we expect that it would take six to 24 months to identify appropriate suppliers, complete design work and undertake the necessary inspections and testing before the new transducers, substrates and subassemblies would be available.
65
Interest Rate Risk
Our exposure to interest rate risk at December 31, 2011 is related to the investment of our excess cash into highly liquid financial investments as well as our convertible debt which has a fixed rate. Fixed rate investments and borrowings may have their fair market value adversely impacted from changes in interest rates.
At December 31, 2011, we held $250.3 million in cash and cash equivalents and available-for-sale investments of which $219.3 million consisted of highly liquid financial investments with original final maturities of one year or less and the remaining amount was long-term available-for-sale investments with original final maturities over one year. Based upon our balance of cash and cash equivalents and investments, the impact of an increase or decrease in interest rates of 10 basis points would cause a corresponding increase or decrease in our annual interest income of approximately $250,000 from these investments.
We invest in cash and cash equivalents and available-for-sale investments in accordance with our investment policy. The primary objectives of our investment policy are to preserve principal, maintain proper liquidity to meet operating needs and maximize yields consistent with our tolerance for investment risk. Our investment policy specifies credit quality standards for our investments. We do not hold mortgage-backed securities. Due to the generally short-term nature of the majority of our investments, we have assessed that there is no material exposure to interest rate risk arising from them.
Foreign Currency Exchange Risk
We are exposed to foreign currency risk related primarily to our operations in Europe and Japan. Fluctuations in the rate of exchange between the U.S. dollar and foreign currencies, primarily the euro and the yen, could adversely affect our financial results. During the year ended December 31, 2011, 16.6% and 30.7% of our revenues were denominated in the euro and yen, respectively, and 9.6% and 12.9% of our operating expenses were denominated in the euro and the yen, respectively. Since our yen denominated sales exceeds our yen denominated costs, whenever the U.S. dollar strengthens relative to the yen, there is an adverse effect on our results of operations. Conversely, whenever the U.S. dollar weakens relative to the yen, there is a positive effect on our results of operations. On the contrary, because our euro denominated costs exceeds our euro denominated sales, whenever the U.S. dollar strengthens relative to the euro, there is a positive effect on our results of operations. Conversely, whenever the U.S. dollar weakens relative to the Euro, there is an adverse effect on our results of operations. For example, the average exchange rate of one U.S. dollar to yen decreased 9.3% from 87.8 in 2010 to 79.6 in 2011, which resulted in a net positive impact to our operational results of $5.2 million. The average exchange rate of one euro to U.S. dollar increased 7.7% from 1.3 in 2010 to 1.4 in 2011, which resulted in a net positive impact to our operational results of $1.7 million.
Exchange rate fluctuations resulting from the remeasurement of the inter-company balances between Volcano Corporation, our U.S. entity, and Volcano Japan; and Volcano Corporation and Volcano Europe, and other non-U.S. dollar denominated liabilities into U.S. dollars are recorded as foreign currency transaction gains or losses and are included in exchange rate gain in the consolidated statement of operations. On October 1, 2009, approximately $23.4 million of intercompany receivable owed to Volcano Corporation from Volcano Japan was converted into a long-term investment, resulting in a decrease in the amount of yen-based receivables being marked-to-market. In April 2008, $22.6 million of intercompany receivable owed to Volcano Corporation from Volcano Europe was converted into equity, resulting in a decrease in the amount of euro-based receivables being marked-to-market. These conversions thereby reduce the impact of the exchange rate fluctuations in our consolidated statements of operations.
Commencing October 2009, we began using foreign exchange forward contracts to manage a portion of the foreign currency risk for foreign subsidiaries with monetary assets and liabilities denominated in the yen and the euro. We only use derivative financial instruments to reduce the risk that our earnings and cash flows will be adversely affected by changes in exchange rates; we do not hold any derivative financial instruments for trading or speculative purposes. We primarily use foreign exchange forward contracts to hedge foreign currency
66
exposures, and they generally have terms of one year or less. Realized and unrealized gains or losses on the value of financial contracts used to hedge the exchange rate exposure of these monetary assets and liabilities are also included in the determination of net income, as these transactions have not been designated for hedge accounting treatment. These contracts effectively fix the exchange rate at which these specific monetary assets and liabilities will be settled so that gains or losses on the forward contracts offset the losses or gains from changes in the value of the underlying monetary assets and liabilities. These contracts contain net settlement features. If we experience unfavorable changes in foreign exchange rates, we may be required to use material amounts of cash to settle the transactions which may adversely affect the operating results that we report with respect to the corresponding period. During the years ended December 31, 2011, 2010 and 2009, we recorded exchange rate losses of $1.3 million, $3.2 million and an exchange rate gain of $715,000, respectively, related to our foreign exchange forward contracts.
We currently hold foreign exchange forward contracts with two counterparties. The bank counterparties in these contracts exposes us to credit-related losses in the event of their nonperformance. However, to mitigate that risk, we only contract with counterparties who meet our minimum credit quality guidelines. In addition, our exposure in the event of a default by our counterparty is limited to the changes in value of our hedged balances. At December 31, 2011, we were in a net asset position with our counterparty for $21,000.
Market Price Sensitive Instruments
In order to reduce the potential equity dilution that would result upon conversion of the Notes, we entered into convertible note hedge transactions (the Hedge) entitling us to purchase up to 3.9 million shares of our common stock at an initial stock price of $29.64 per share, subject to adjustment. Upon conversion of the Notes, the Hedge is expected to reduce the equity dilution if the daily volume-weighted average price per share of our common stock exceeds the strike price of the Hedge. We also entered into warrant transactions with the counterparties of the Hedge entitling them to acquire up to 3.9 million shares of our common stock, subject to adjustment, at an initial strike price of $34.88 per share, subject to adjustment. The warrant transactions could have a dilutive effect on our earnings per share to the extent that the price of our common stock during a given measurement period (the quarter or year to date period) at maturity of the warrants exceeds the strike price of the warrants. In addition, non-performance by the counterparties under the Hedge would potentially expose us to dilution of our common stock to the extent our stock price exceeds the conversion price. See Note 3 “Financial Statement Details—Convertible Debt” for additional information.
67
| Item 8. | Financial Statements and Supplementary Data |
VOLCANO CORPORATION
INDEX TO CONSOLIDATED FINANCIAL STATEMENTS
68
REPORT OF INDEPENDENT REGISTERED PUBLIC ACCOUNTING FIRM
The Board of Directors and Stockholders
Volcano Corporation:
We have audited the accompanying consolidated balance sheets of Volcano Corporation and subsidiaries (the Company) as of December 31, 2011 and 2010, and the related consolidated statements of operations, comprehensive income (loss), stockholders’ equity, and cash flows for the years then ended. These consolidated financial statements are the responsibility of the Company’s management. Our responsibility is to express an opinion on these consolidated financial statements based on our audits.
We conducted our audits in accordance with the standards of the Public Company Accounting Oversight Board (United States). Those standards require that we plan and perform the audit to obtain reasonable assurance about whether the financial statements are free of material misstatement. An audit includes examining, on a test basis, evidence supporting the amounts and disclosures in the financial statements. An audit also includes assessing the accounting principles used and significant estimates made by management, as well as evaluating the overall financial statement presentation. We believe that our audits provide a reasonable basis for our opinion.
In our opinion, the consolidated financial statements referred to above present fairly, in all material respects, the financial position of Volcano Corporation and subsidiaries as of December 31, 2011 and 2010, and the results of their operations and their cash flows for the years then ended, in conformity with U.S. generally accepted accounting principles.
As discussed in Note 1 to the consolidated financial statements, the Company changed its method of accounting for revenue arrangements containing multiple elements in 2010 and changed its presentation of comprehensive income in 2011 due to the adoption of new accounting pronouncements.
We have also audited, in accordance with the standards of the Public Company Accounting Oversight Board (United States), Volcano Corporation’s internal control over financial reporting as of December 31, 2011, based on criteria established inInternal Control – Integrated Framework issued by the Committee of Sponsoring Organizations of the Treadway Commission (COSO), and our report dated February 29, 2012, expressed an unqualified opinion on the effectiveness of the Company’s internal control over financial reporting.
/s/ KPMG LLP
San Diego, California
February 29, 2012
69
REPORT OF INDEPENDENT REGISTERED PUBLIC ACCOUNTING FIRM
The Board of Directors and Stockholders of Volcano Corporation
We have audited the accompanying consolidated statements of operations, comprehensive income (loss), stockholders’ equity, and cash flows of Volcano Corporation for the year ended December 31, 2009. These financial statements are the responsibility of the Company’s management. Our responsibility is to express an opinion on these financial statements based on our audit.
We conducted our audit in accordance with the standards of the Public Company Accounting Oversight Board (United States). Those standards require that we plan and perform the audit to obtain reasonable assurance about whether the financial statements are free of material misstatement. An audit includes examining, on a test basis, evidence supporting the amounts and disclosures in the financial statements. An audit also includes assessing the accounting principles used and significant estimates made by management, as well as evaluating the overall financial statement presentation. We believe that our audit provides a reasonable basis for our opinion.
In our opinion, the financial statements referred to above present fairly, in all material respects, the consolidated results of Volcano Corporation’s operations and its cash flows for the year ended December 31, 2009, in conformity with U.S. generally accepted accounting principles.
/s/ Ernst & Young LLP
Sacramento, California
March 5, 2010
70
REPORT OF INDEPENDENT REGISTERED PUBLIC ACCOUNTING FIRM
The Board of Directors and Stockholders
Volcano Corporation:
We have audited Volcano Corporation’s internal control over financial reporting as of December 31, 2011, based on criteria established inInternal Control – Integrated Framework issued by the Committee of Sponsoring Organizations of the Treadway Commission (COSO). Volcano Corporation’s management is responsible for maintaining effective internal control over financial reporting and for its assessment of the effectiveness of internal control over financial reporting, included in the accompanying Management’s Report on Internal Control Over Financial Reporting. Our responsibility is to express an opinion on Volcano Corporation’s internal control over financial reporting based on our audit.
We conducted our audit in accordance with the standards of the Public Company Accounting Oversight Board (United States). Those standards require that we plan and perform the audit to obtain reasonable assurance about whether effective internal control over financial reporting was maintained in all material respects. Our audit included obtaining an understanding of internal control over financial reporting, assessing the risk that a material weakness exists, and testing and evaluating the design and operating effectiveness of internal control based on the assessed risk. Our audit also included performing such other procedures as we considered necessary in the circumstances. We believe that our audit provides a reasonable basis for our opinion.
A company’s internal control over financial reporting is a process designed to provide reasonable assurance regarding the reliability of financial reporting and the preparation of financial statements for external purposes in accordance with generally accepted accounting principles. A company’s internal control over financial reporting includes those policies and procedures that (1) pertain to the maintenance of records that, in reasonable detail, accurately and fairly reflect the transactions and dispositions of the assets of the company; (2) provide reasonable assurance that transactions are recorded as necessary to permit preparation of financial statements in accordance with generally accepted accounting principles, and that receipts and expenditures of the company are being made only in accordance with authorizations of management and directors of the company; and (3) provide reasonable assurance regarding prevention or timely detection of unauthorized acquisition, use, or disposition of the company’s assets that could have a material effect on the financial statements.
Because of its inherent limitations, internal control over financial reporting may not prevent or detect misstatements. Also, projections of any evaluation of effectiveness to future periods are subject to the risk that controls may become inadequate because of changes in conditions, or that the degree of compliance with the policies or procedures may deteriorate.
In our opinion, Volcano Corporation maintained, in all material respects, effective internal control over financial reporting as of December 31, 2011, based on criteria established inInternal Control – Integrated Framework issued by the Committee of Sponsoring Organizations of the Treadway Commission.
We also have audited, in accordance with the standards of the Public Company Accounting Oversight Board (United States), the consolidated balance sheets of Volcano Corporation and subsidiaries as of December 31, 2011 and 2010, and the related consolidated statements of operations, comprehensive income (loss), stockholders’ equity, and cash flows for the years then ended, and our report dated February 29, 2012, expressed an unqualified opinion on those consolidated financial statements.
/s/ KPMG LLP
San Diego, California
February 29, 2012
71
VOLCANO CORPORATION
CONSOLIDATED BALANCE SHEETS
(in thousands, except per share data)
| | | | | | | | |
| | | December 31, | |
| | | 2011 | | | 2010 | |
Assets | | | | | | | | |
Current assets: | | | | | | | | |
Cash and cash equivalents | | $ | 107,016 | | | $ | 43,429 | |
Short-term available-for-sale investments | | | 112,327 | | | | 175,283 | |
Accounts receivable, net | | | 69,469 | | | | 59,133 | |
Inventories | | | 41,306 | | | | 40,499 | |
Prepaid expenses and other current assets | | | 19,939 | | | | 6,643 | |
| | | | | | | | |
Total current assets | | | 350,057 | | | | 324,987 | |
Restricted cash | | | 692 | | | | 638 | |
Long-term available-for-sale investments | | | 30,919 | | | | 26,804 | |
Property and equipment, net of accumulated depreciation of $65,027 and $46,299, respectively | | | 81,097 | | | | 56,503 | |
Intangible assets, net | | | 15,245 | | | | 17,103 | |
Goodwill | | | 2,487 | | | | 2,487 | |
Other non-current assets | | | 16,227 | | | | 3,044 | |
| | | | | | | | |
Total assets | | $ | 496,724 | | | $ | 431,566 | |
| | | | | | | | |
Liabilities and Stockholders’ Equity | | | | | | | | |
Current liabilities: | | | | | | | | |
Accounts payable | | $ | 12,911 | | | $ | 13,895 | |
Accrued compensation | | | 20,251 | | | | 18,241 | |
Accrued expenses and other current liabilities | | | 16,689 | | | | 21,960 | |
Deferred revenues | | | 7,077 | | | | 5,898 | |
Current maturities of long-term debt | | | 72 | | | | 56 | |
| | | | | | | | |
Total current liabilities | | | 57,000 | | | | 60,050 | |
Convertible senior notes | | | 95,663 | | | | 91,162 | |
Other long-term debt | | | 74 | | | | 74 | |
Deferred revenues | | | 3,168 | | | | 2,466 | |
Other | | | 1,582 | | | | 3,478 | |
| | | | | | | | |
Total liabilities | | | 157,487 | | | | 157,230 | |
| | |
Commitments and contingencies(Note 4) | | | | | | | | |
| | |
Stockholders’ equity: | | | | | | | | |
Preferred stock, par value of $0.001; 10,000 shares authorized; no shares issued and outstanding at December 31, 2011 and December 31, 2010 | | | — | | | | — | |
Common stock, par value of $0.001; 250,000 shares authorized at December 31, 2011 and December 31, 2010; 52,651 and 51,366 shares issued and outstanding at December 31, 2011 and December 31, 2010, respectively | | | 53 | | | | 51 | |
Additional paid-in capital | | | 430,490 | | | | 402,895 | |
Accumulated other comprehensive loss | | | (1,382 | ) | | | (593 | ) |
Accumulated deficit | | | (89,924 | ) | | | (128,017 | ) |
| | | | | | | | |
Total stockholders’ equity | | | 339,237 | | | | 274,336 | |
| | | | | | | | |
Total liabilities and stockholders’ equity | | $ | 496,724 | | | $ | 431,566 | |
| | | | | | | | |
See notes to consolidated financial statements.
72
VOLCANO CORPORATION
CONSOLIDATED STATEMENTS OF OPERATIONS
(in thousands, except per share data)
| | | | | | | | | | | | |
| | | Years Ended December 31, | |
| | | 2011 | | | 2010 | | | 2009 | |
Revenues | | $ | 343,546 | | | $ | 294,146 | | | $ | 227,867 | |
Cost of revenues, excluding amortization of intangibles | | | 114,533 | | | | 108,860 | | | | 91,489 | |
| | | | | | | | | | | | |
Gross profit | | | 229,013 | | | | 185,286 | | | | 136,378 | |
Operating expenses: | | | | | | | | | | | | |
Selling, general and administrative | | | 147,057 | | | | 133,174 | | | | 111,598 | |
Research and development | | | 53,098 | | | | 42,517 | | | | 37,372 | |
Amortization of intangibles | | | 3,447 | | | | 2,559 | | | | 4,224 | |
In-process research and development | | | — | | | | (2,935 | ) | | | 14,030 | |
| | | | | | | | | | | | |
Total operating expenses | | | 203,602 | | | | 175,315 | | | | 167,224 | |
| | | | | | | | | | | | |
Operating income (loss) | | | 25,411 | | | | 9,971 | | | | (30,846 | ) |
Interest income | | | 908 | | | | 477 | | | | 756 | |
Interest expense | | | (7,107 | ) | | | (2,192 | ) | | | (5 | ) |
Exchange rate gain (loss) | | | (997 | ) | | | (904 | ) | | | 2,328 | |
Other, net | | | (112 | ) | | | (25 | ) | | | — | |
| | | | | | | | | | | | |
Income (loss) before income tax | | | 18,103 | | | | 7,327 | | | | (27,767 | ) |
Income tax (benefit) expense | | | (19,990 | ) | | | 2,087 | | | | 1,187 | |
| | | | | | | | | | | | |
Net income (loss) | | $ | 38,093 | | | $ | 5,240 | | | $ | (28,954 | ) |
| | | | | | | | | | | | |
Net income (loss) per share: | | | | | | | | | | | | |
Basic | | $ | 0.73 | | | $ | 0.10 | | | $ | (0.60 | ) |
| | | | | | | | | | | | |
Diluted | | $ | 0.70 | | | $ | 0.10 | | | $ | (0.60 | ) |
| | | | | | | | | | | | |
Shares used in calculating net income (loss) per share: | | | | | | | | | | | | |
Basic | | | 52,300 | | | | 50,551 | | | | 48,400 | |
| | | | | | | | | | | | |
Diluted | | | 54,596 | | | | 53,281 | | | | 48,400 | |
| | | | | | | | | | | | |
See notes to consolidated financial statements.
73
VOLCANO CORPORATION
CONSOLIDATED STATEMENTS OF COMPREHENSIVE INCOME (LOSS)
(in thousands, except per share data)
| | | | | | | | | | | | |
| | | Years Ended December 31, | |
| | | 2011 | | | 2010 | | | 2009 | |
Net income (loss) | | $ | 38,093 | | | $ | 5,240 | | | $ | (28,954 | ) |
Other comprehensive income | | | | | | | | | | | | |
Foreign currency translation adjustments | | | (819 | ) | | | 3,494 | | | | (931 | ) |
Changes in unrealized gain (loss) on available-for-sale investments | | | 30 | | | | (8 | ) | | | (72 | ) |
| | | | | | | | | | | | |
Other comprehensive income (loss) | | | (789 | ) | | | 3,486 | | | | (1,003 | ) |
| | | | | | | | | | | | |
Comprehensive income (loss) | | $ | 37,304 | | | $ | 8,726 | | | $ | (29,957 | ) |
| | | | | | | | | | | | |
See notes to consolidated financial statements.
74
VOLCANO CORPORATION
CONSOLIDATED STATEMENTS OF STOCKHOLDERS’ EQUITY
(in thousands)
| | | | | | | | | | | | | | | | | | | | | | | | |
| | | Common Stock | | | Additional
Paid-In
Capital | | | Accumulated
Other
Comprehensive
Loss | | | Accumulated
Deficit | | | Total
Stockholders’
Equity | |
| | | Shares | | | Amount | | | | | |
Balance at December 31, 2008 | | | 47,883 | | | $ | 48 | | | $ | 337,063 | | | $ | (3,076 | ) | | $ | (104,303 | ) | | $ | 229,732 | |
Issuance of common stock under equity compensation plans, net of shares repurchased | | | 907 | | | | 1 | | | | 4,155 | | | | | | | | | | | | 4,156 | |
Employee stock-based compensation cost | | | | | | | | | | | 10,613 | | | | | | | | | | | | 10,613 | |
Non-employee stock-based compensation cost | | | | | | | | | | | 271 | | | | | | | | | | | | 271 | |
Net loss | | | | | | | | | | | | | | | | | | | (28,954 | ) | | | (28,954 | ) |
Other comprehensive loss | | | | | | | | | | | | | | | (1,003 | ) | | | | | | | (1,003 | ) |
| | | | | | | | | | | | | | | | | | | | | | | | |
Balance at December 31, 2009 | | | 48,790 | | | | 49 | | | | 352,102 | | | | (4,079 | ) | | | (133,257 | ) | | | 214,815 | |
Issuance of common stock under equity compensation plans | | | 1,967 | | | | 1 | | | | 16,111 | | | | | | | | | | | | 16,112 | |
Employee stock-based compensation cost | | | | | | | | | | | 11,752 | | | | | | | | | | | | 11,752 | |
Non-employee stock-based compensation cost | | | | | | | | | | | 673 | | | | | | | | | | | | 673 | |
Issuance of common stock related to acquisitions | | | 609 | | | | 1 | | | | 10,468 | | | | | | | | | | | | 10,469 | |
Equity component of convertible senior notes | | | | | | | | | | | 22,263 | | | | | | | | | | | | 22,263 | |
Call options purchased in connection with convertible senior note | | | | | | | | | | | (27,190 | ) | | | | | | | | | | | (27,190 | ) |
Issuance of warrants | | | | | | | | | | | 17,149 | | | | | | | | | | | | 17,149 | |
Portion of convertible bond issuance costs attributed to equity component | | | | | | | | | | | (866 | ) | | | | | | | | | | | (866 | ) |
Tax benefit related to stock-based compensation | | | | | | | | | | | 433 | | | | | | | | | | | | 433 | |
Net income | | | | | | | | | | | | | | | | | | | 5,240 | | | | 5,240 | |
Other comprehensive income | | | | | | | | | | | | | | | 3,486 | | | | | | | | 3,486 | |
| | | | | | | | | | | | | | | | | | | | | | | | |
Balance at December 31, 2010 | | | 51,366 | | | | 51 | | | | 402,895 | | | | (593 | ) | | | (128,017 | ) | | | 274,336 | |
Issuance of common stock under equity compensation plans | | | 1,285 | | | | 2 | | | | 13,024 | | | | | | | | | | | | 13,026 | |
Employee stock-based compensation cost | | | | | | | | | | | 12,855 | | | | | | | | | | | | 12,855 | |
Non-employee stock-based compensation cost | | | | | | | | | | | 115 | | | | | | | | | | | | 115 | |
Reversal of valuation allowance related to Convertible Senior Notes and tax benefit related to stock-based compensation | | | | | | | | | | | 1,601 | | | | | | | | | | | | 1,601 | |
Net Income | | | | | | | | | | | | | | | | | | | 38,093 | | | | 38,093 | |
Other comprehensive loss | | | | | | | | | | | | | | | (789 | ) | | | | | | | (789 | ) |
| | | | | | | | | | | | | | | | | | | | | | | | |
Balance at December 31, 2011 | | | 52,651 | | | $ | 53 | | | $ | 430,490 | | | $ | (1,382 | ) | | $ | (89,924 | ) | | $ | 339,237 | |
| | | | | | | | | | | | | | | | | | | | | | | | |
See notes to consolidated financial statements.
75
VOLCANO CORPORATION
CONSOLIDATED STATEMENTS OF CASH FLOWS
(in thousands)
| | | | | | | | | | | | |
| | | Years Ended December 31, | |
| | | 2011 | | | 2010 | | | 2009 | |
Operating activities | | | | | | | | | | | | |
Net income (loss) | | $ | 38,093 | | | $ | 5,240 | | | $ | (28,954 | ) |
Adjustments to reconcile net loss to net cash provided by (used in) operating activities: | | | | | | | | | | | | |
In-process research and development expense | | | — | | | | (2,935 | ) | | | 14,030 | |
Depreciation and amortization | | | 23,214 | | | | 18,699 | | | | 16,181 | |
Amortization (accretion) of investment premium (discount), net | | | 3,805 | | | | 1,130 | | | | 626 | |
Accretion of debt discount on convertible senior notes | | | 4,668 | | | | 1,211 | | | | — | |
Non-cash stock compensation expense | | | 12,991 | | | | 12,467 | | | | 10,885 | |
Other non-cash adjustments | | | (2,350 | ) | | | 2,711 | | | | 255 | |
Deferred income taxes | | | (22,771 | ) | | | — | | | | — | |
Changes in operating assets and liabilities, net of acquisitions: | | | | | | | | | | | | |
Accounts receivable | �� | | (9,337 | ) | | | (6,420 | ) | | | (8,858 | ) |
Inventories | | | 831 | | | | (946 | ) | | | (8,498 | ) |
Prepaid expenses and other assets | | | (540 | ) | | | (1,507 | ) | | | 251 | |
Accounts payable | | | (2,362 | ) | | | 714 | | | | (1,112 | ) |
Accrued compensation | | | 1,976 | | | | 4,037 | | | | 1,393 | |
Accrued expenses and other liabilities | | | (6,541 | ) | | | 10,654 | | | | 1,674 | |
Deferred revenues | | | 1,919 | | | | 1,128 | | | | 476 | |
| | | | | | | | | | | | |
Net cash provided by (used in) operating activities | | | 43,596 | | | | 46,183 | | | | (1,651 | ) |
| | | | | | | | | | | | |
Investing activities | | | | | | | | | | | | |
Purchase of short-term and long-term available-for-sale securities | | | (310,573 | ) | | | (233,960 | ) | | | (146,932 | ) |
Sale or maturity of short-term and long-term available-for-sale securities | | | 365,639 | | | | 97,204 | | | | 129,098 | |
Capital expenditures | | | (43,248 | ) | | | (25,302 | ) | | | (26,146 | ) |
Cash paid for acquisitions, net of cash acquired | | | — | | | | (4,200 | ) | | | (613 | ) |
Cash paid for other intangibles and investments | | | (3,482 | ) | | | (3,864 | ) | | | (315 | ) |
Proceeds from foreign currency exchange contracts | | | 2,355 | | | | 1,584 | | | | 525 | |
Payment for foreign currency exchange contracts | | | (3,962 | ) | | | (4,356 | ) | | | — | |
| | | | | | | | | | | | |
Net cash provided by (used in) investing activities | | | 6,729 | | | | (172,894 | ) | | | (44,383 | ) |
| | | | | | | | | | | | |
Financing activities | | | | | | | | | | | | |
Repayment of debt | | | (51 | ) | | | (30 | ) | | | (205 | ) |
Proceeds from sale of common stock under employee stock purchase plan | | | 3,554 | | | | 2,741 | | | | 2,122 | |
Proceeds from exercise of common stock options | | | 9,472 | | | | 13,371 | | | | 2,450 | |
Proceeds from issuance of convertible senior notes | | | — | | | | 115,000 | | | | — | |
Payment of debt issuance costs | | | — | | | | (4,428 | ) | | | — | |
Purchase of call options | | | — | | | | (27,190 | ) | | | — | |
Proceeds from issuance of warrants | | | — | | | | 17,149 | | | | — | |
Tax benefit related to stock-based compensation | | | 165 | | | | 433 | | | | — | |
Repurchases of common stock | | | — | | | | — | | | | (416 | ) |
Release of restricted cash | | | — | | | | — | | | | 70 | |
Increases of restricted cash | | | — | | | | (111 | ) | | | (286 | ) |
| | | | | | | | | | | | |
Net cash provided by financing activities | | | 13,140 | | | | 116,935 | | | | 3,735 | |
Effect of exchange rate changes on cash and cash equivalents | | | 122 | | | | (2,850 | ) | | | (2,595 | ) |
| | | | | | | | | | | | |
Net increase (decrease) in cash and cash equivalents | | | 63,587 | | | | (12,626 | ) | | | (44,894 | ) |
Cash and cash equivalents, beginning of year | | | 43,429 | | | | 56,055 | | | | 100,949 | |
| | | | | | | | | | | | |
Cash and cash equivalents, end of year | | $ | 107,016 | | | $ | 43,429 | | | $ | 56,055 | |
| | | | | | | | | | | | |
Supplemental disclosures of cash flow information: | | | | | | | | | | | | |
Cash paid for interest | | $ | 3,395 | | | $ | 63 | | | $ | 5 | |
Cash paid for income taxes | | $ | 2,387 | | | $ | 248 | | | $ | 1,810 | |
Supplemental disclosures of non-cash investing activities: | | | | | | | | | | | | |
Issuance of common stock related to milestone payment | | $ | — | | | $ | 10,469 | | | $ | — | |
Capitalized interest | | $ | 1,190 | | | $ | 42 | | | $ | — | |
See notes to consolidated financial statements.
76
VOLCANO CORPORATION
NOTES TO CONSOLIDATED FINANCIAL STATEMENTS
1. Organization and Summary of Significant Accounting Policies
Our Company
Volcano Corporation, or we, us, our, Volcano or the Company, was incorporated under the laws of the State of Delaware on January 12, 2000. We design, develop, manufacture and commercialize a broad suite of precision guided therapy products including intravascular ultrasound, or IVUS, and fractional flow reserve, or FFR, products that we believe enhance the diagnosis and treatment of vascular and structural heart disease. We are facilitating the adoption of functional percutaneous coronary intervention, or PCI, in which our FFR technology is used to determine whether or not a stent is necessary, and IVUS is used to guide stent placement and optimization. We market our products to physicians and technicians who perform PCI procedures in hospitals and to other personnel who make purchasing decisions on behalf of hospitals.
Our products consist of multi-modality consoles which are marketed as stand-alone units or as customized units that can be integrated into a variety of hospital-based interventional surgical suites called catheterization laboratories, or cath labs. Our consoles have been designed to serve as a multi-modality platform for our phased array and rotational IVUS catheters, FFR pressure wires, image-guided therapy catheters and Medtronic’s Pioneer reentry device.
Our IVUS products include single-procedure disposable phased array and rotational IVUS imaging catheters and additional functionality options such as virtual histology tissue characterization, or VH, and ChromaFlo stent apposition analysis. Our FFR offerings can be accessed through our multi-modality platforms, and we also provide FFR-only consoles. Our FFR disposables are single-procedure disposable pressure and flow guide wires used to measure the pressure and flow characteristics of blood around plaque enabling physicians to gauge the plaque’s physiological impact on blood flow and pressure. We are developing additional offerings for integration into the platform, including adenosine-free Instant™ wave-free ratio FFR, or iFR, forward-looking IVUS or FL.IVUS, catheters, Focal Acoustic Computed Tomography catheters and ultra-high resolution Optical Coherence Tomography, or OCT, systems and catheters.
We also develop and manufacture optical monitors for the telecommunication industry; laser and non-laser light sources, and optical engines used in the medical OCT imaging systems and advanced photonic components and sub-systems used in spectroscopy and other industrial applications.
Basis of Presentation and Principles of Consolidation
Our consolidated financial statements include the accounts Volcano Corporation and its wholly–owned subsidiaries. All significant intercompany balances and transactions have been eliminated in consolidation. Certain amounts have been reclassified to conform to the current year presentation.
Use of Estimates
The preparation of financial statements in conformity with U.S. generally accepted accounting principles requires management to make estimates and assumptions that affect the reported amounts of assets and liabilities and disclosure of contingent assets and liabilities at the date of the financial statements and the reported amounts of revenue and expenses during the reporting period. Estimates are used for, but not limited to, the allowance for doubtful accounts, inventory reserves, depreciation and amortization, intangible assets, long-term investments in subsidiaries, sales returns, deferred revenues, business combinations, warranty costs, certain accruals, long-lived asset impairment calculations, deferred tax assets and liabilities and contingencies. Actual results could differ materially from the estimates and assumptions we use in the preparation of our consolidated financial statements.
77
Foreign Currency Translation
The euro is the functional currency of Volcano Europe, as it is the primary currency within the economic environment in which Volcano Europe operates. Assets and liabilities of Volcano Europe’s operations are translated into U.S. dollars at period-end exchange rates, and revenues and expenses are translated into U.S. dollars at average exchange rates in effect during each reporting period. Adjustments resulting from the translation are reported in other comprehensive income or loss.
On July 1, 2009, we adopted the Japanese yen as the functional currency for Volcano Japan. Consistent with the considerations specified in FASB ASC Topic 830,Foreign Currency Matters, the change was made to reflect developments with our Japan operations, including increases in direct sales denominated in the Japanese yen and growth in the local infrastructure that has enabled the day-to-day operations of Volcano Japan to become relatively self-contained and integrated into the Japanese economic environment. At December 31, 2011 and 2010, assets and liabilities of Volcano Japan’s operations are translated into U.S. dollars at period-end exchange rates. Commencing July 1, 2009, revenues and expenses are translated into U.S. dollars at average exchange rates in effect during each reporting period and adjustments resulting from the translation are reported on our consolidated balance sheets in accumulated other comprehensive loss.
Prior to July 1, 2009, the U.S. dollar was the functional currency of Volcano Japan. For the six months ended June 30, 2009, yen-based expenses were converted into U.S. dollars at average exchange rates in effect during the reporting period and adjustments resulting from the translation were recorded as foreign currency transaction gains or losses and included in exchange rate gain or loss in the consolidated statement of operations.
Exchange rate fluctuations resulting from the remeasurement of the inter-company balances between Volcano Corporation, our U.S. entity, and Volcano Japan, and Volcano Corporation and Volcano Europe, and other non-U.S. dollar denominated balances into U.S. dollars are recorded as foreign currency transaction gains or losses and are included in exchange rate gain (loss) in the consolidated statements of operations. On October 1, 2009, approximately $23.4 million of intercompany receivable owed to Volcano Corporation from Volcano Japan was converted into a long-term investment, resulting in a decrease in the amount of yen-based receivables being marked-to-market. The conversion thereby reduced the impact of the exchange rate fluctuations in our consolidated statements of operations.
The functional currency of Volcano Costa Rica is the U.S. dollar since it is an extension of the Company’s U.S. operations.
Cash and Cash Equivalents
Cash primarily consisted of cash in bank deposits. Cash equivalents consist of money market funds and other highly liquid investments with an original maturity of three months or less on the date of acquisition.
Available-for-Sale Investments
Our short-term available-for-sale investments consisted of highly liquid financial investments with maturity of one year or less that were not previously classified as cash equivalents. Our long-term available-for-sale investments consisted of investments with maturities over one year. All investments are classified as available-for-sale and are recorded at market value using the specific identification method. Unrealized gains or losses are reflected in other comprehensive income or loss.
Financial Instruments
Financial instruments included in our financial statements are comprised of cash and cash equivalents, available-for-sale investments, foreign exchange forward contracts, accounts receivable, accounts payable,
78
certain accrued liabilities and debt. The carrying amounts of cash and cash equivalents, available-for-sale investments, accounts receivable, accounts payable, accrued liabilities and short-term debt approximate their fair values due to the short-term nature of those instruments. The fair value of our long-term investments approximate their carrying values based upon market rates of interest. The fair value of our Convertible Senior Notes is influenced by interest rates, our stock price, and stock price volatility, which is determined by market trading.
In October 2009, we began using foreign exchange forward contracts to manage a portion of the foreign currency risk for our monetary assets denominated in the yen and the euro. We only use derivative financial instruments to reduce the risk that our earnings and cash flows will be affected by changes in exchange rates; we do not hold any derivative financial instruments for trading or speculative purposes. We primarily use forward exchange contracts to hedge foreign currency exposures related to our intercompany receivable balances, and they generally have terms of one year or less. Realized and unrealized gains or losses on the value of financial contracts used to hedge the exchange rate exposure of these monetary assets and liabilities are also included in the determination of net income, as these transactions have not been qualified for hedge accounting. These contracts contain net settlement features. We offset fair value amounts recognized for receivables and payables arising from our foreign exchange forward contracts with each counterparty.
Concentration of Credit Risk
Financial instruments which subject us to potential credit risk consist of our cash and cash equivalents, available-for-sale investments and accounts receivable. We have established guidelines to limit our exposure to credit risk by placing investments with high credit quality financial institutions, diversifying our investment portfolio and holding investments with maturities that maintain safety and liquidity. We place our cash and cash equivalents with high credit quality financial institutions. Deposits with these financial institutions may exceed the amount of insurance provided; however, these deposits typically are redeemable upon demand. Therefore we believe the financial risks associated with these financial instruments are minimal.
Trade accounts receivable are recorded at the net invoice value and are not interest bearing. We consider receivables past due based on the contractual payment terms. We perform ongoing credit evaluations of our customers, and generally we do not require collateral on our accounts receivable. We estimate the need for allowances for potential credit losses based on historical collection activity and the facts and circumstances relevant to specific customers and we record a provision for uncollectible accounts when collection is uncertain. To date, we have not experienced significant credit related losses.
No single customer accounted for more than 10% of our revenues for 2011, 2010 or 2009. No single customer accounted for more than 10% of our trade receivables at December 31, 2011, 2010 or 2009.
We currently hold foreign exchange forward contracts with two counterparties. The bank counterparties in these contracts expose us to credit-related losses in the event of their nonperformance and we do not require collateral for their performance. However, to mitigate that risk, we only contract with counterparties who meet our minimum credit quality guidelines. In addition, our exposure in the event of a default by our counterparties is limited to the changes in value of our hedged balances.
In connection with the issuance of our 2.875% Convertible Senior Notes due 2015, or the Notes, we purchased call options from JPMorgan Chase Bank, National Association, or JPMorgan Chase. Non-performance by JPMorgan Chase under these call options would potentially expose us to dilution of our common stock to the extent our stock price exceeds the conversion price. See Note 3 “Financial Statement Details—Convertible Debt” for additional information.
We purchase integrated circuits and other key components for use in our products. For certain components, which are currently single sourced, there are relatively few sources of supply. Although we believe that other
79
suppliers could provide similar components on comparable terms, establishment of additional or replacement suppliers cannot be accomplished quickly. Any significant supply interruption could have a material adverse effect on our business, financial condition and results of operations. For further discussion, see “Risk Factors—Our manufacturing operations are dependent upon third party suppliers, which makes us vulnerable to supply problems, price fluctuations and manufacturing delays.”
Inventories
Inventories are valued at the lower of first-in, first-out cost or market value. Inventory provisions are recorded for materials that have become obsolete or are no longer used in current production and for inventory that has a market value less than the carrying value in inventory. We regularly monitor potential inventory excess, obsolescence and lower market values compared to standard costs and, when necessary, reduce the carrying amount of our inventory to its market value. Specific reserves are maintained to reduce the carrying value of inventory items on hand that we know may not be used in finished goods. If our estimates for potential inventory losses prove to be too low, then our future earnings will be affected when the related additional inventory losses are recorded.
Restricted Cash
At December 31, 2011 and 2010, we had restricted cash totaling $692,000 and $638,000, respectively. Restricted cash consists of approximately $602,000 and $314,000 at December 31, 2011 and 2010, respectively, which was restricted as to withdrawal to provide collateral for our performance obligations to customers in foreign jurisdictions; $0 and $202,000 at December 31, 2011 and 2010, respectively, in certificates of deposit were restricted as to withdrawal and serves as a security deposit for a leased facility that expired in 2010; and the remaining amounts at December 31, 2011 and 2010 serve as collateral to various operating leases. The certificates of deposit and cash in the bank will remain restricted as to withdrawal until such time as the current obligation is terminated.
Long-Lived Assets
Our long-lived assets consist of property and equipment and intangible assets. Property and equipment are stated at cost, net of accumulated depreciation and amortization. Equipment and capitalized software are depreciated over the estimated useful lives of the assets, which range generally from three to ten years. Leasehold improvements are amortized over the lesser of the lease term including renewal periods that are reasonably assured or the estimated useful lives of the improvements, which are between three and ten years. The straight-line method is used for depreciation and amortization. Land is stated at cost and is not depreciated. Significant improvements which substantially extend the useful lives of assets are capitalized. Expenditures for maintenance and repairs are charged to expense as incurred.
Assets held under capital leases are recorded at the net present value of the minimum lease payments of the leased asset at the inception of the lease. Amortization expense is computed using the straight-line method over the shorter of the estimated useful lives of the assets or the period of the related lease and is included in our depreciation expense.
We record intangible assets at historical cost and amortize them over their estimated useful lives. Intangible assets consist of acquired developed technology, licenses, customer relationships, assembled technology, patents and trademarks, as well as acquired in-process technology. Intangible assets related to developed technology, licenses, patents and trademarks, customer relationships, and assembled technology are amortized using the straight-line method over their estimated useful lives of up to 20 years. Amortization of acquired in-process technology will not commence until the technology reaches market feasibility. Upon a decision by management to abandon an in-process technology project, the related intangible assets are charged to expense.
80
Our long-lived assets are evaluated for impairment whenever events or changes in circumstances indicate that the carrying value may not be recoverable. When evaluating long-lived assets for potential impairment, we first compare the carrying value of the asset to the asset’s estimated future cash flows (undiscounted and without interest charges). If the estimated future cash flows are less than the carrying value of the asset, we calculate an impairment loss. The impairment loss calculation compares the carrying value of the asset to the asset’s estimated fair value, which may be based on estimated future cash flows (discounted and with interest charges). No impairment of long-lived assets and identifiable intangibles was identified or recorded during the years ended December 31, 2011, 2010 or 2009.
Goodwill
At December 31, 2011 and 2010, our goodwill resulted from the acquisitions of Axsun and Fluid Medical, Inc. The impairment evaluation for goodwill is conducted annually as of October 1, or more frequently if events or changes in circumstances indicate the carrying value of the goodwill may not be recoverable. We test for goodwill impairment at the reporting unit level, which is at the operating segment level. Our goodwill is allocated entirely to our medical segment.
The impairment evaluation involves comparing the fair value of each reporting unit to its carrying value, including goodwill. Fair value reflects the price a market participant would be willing to pay in a potential sale of the reporting unit. If the fair value exceeds carrying value, then it is concluded that no goodwill impairment has occurred. If the carrying value of the reporting unit exceeds its fair value, a second step is required to measure possible goodwill impairment loss. In the second step, the implied fair value of the goodwill is determined by allocating the fair value of all of the reporting unit’s assets and liabilities other than goodwill in a manner similar to a purchase price allocation. The resulting implied fair value of the goodwill that results from the allocation is then compared to the carrying amount of the goodwill and an impairment charge is recorded for the difference. There was no impairment of goodwill during the years ended December 31, 2011, 2010 or 2009.
Other Non-Current Assets
The other non-current assets include $2.5 million of individually insignificant investments we have made in various private entities engaged in emerging product development activities, which are accounted for using the cost method.
Revenue Recognition
We recognize revenues when persuasive evidence of an arrangement exists, delivery has occurred or services have been rendered, the price is fixed or determinable and collectability is reasonably assured. Revenue from the sale of our products is generally recognized when title and risk of loss transfer to the customer. Installation and training are generally not required elements of our sales transactions as most of our products do not require these services. In instances where installation and training are required elements of the sales transaction, revenue is recognized upon completion.
We prospectively adopted Financial Accounting Standards Board, or FASB, Accounting Standards Update, or ASU, No. 2009-13,Revenue Recognition (Topic 605): Multiple-Deliverable Revenue Arrangements,or ASU 2009-13, and ASU No. 2009-14,Software (Topic 985):Certain Revenue Arrangements That Include Software Elements,or ASU 2009-14, on January 1, 2010. We have applied ASU 2009-13 to our revenue arrangements containing multiple deliverables that were entered into or significantly modified on or after January 1, 2010. These deliverables can consist of consoles, options for the console, single-procedure disposable products, among other items and are considered separate units of accounting. We allocate arrangement consideration based on the relative selling prices of the separate units of accounting contained within an arrangement containing multiple deliverables. Selling prices are determined using fair value, when available, or our estimate of selling price when fair value is not available. Prior to the adoption of ASU 2009-13, we used the residual method to allocate the
81
arrangement consideration when we had not established fair value of delivered items and deferred all arrangement consideration when fair value was not available for undelivered items. Typically, we recognize revenue for each unit of accounting upon delivery of the item and complete all obligations under an arrangement with multiple deliverables within one year. The adoption of ASU 2009-13 and ASU 2009-14 in 2010 did not have a material effect on our consolidated financial position or results of operations.
All costs associated with the provision of service are recognized in cost of revenues as incurred. Amounts billed in excess of revenue recognized are included as deferred revenue in the consolidated balance sheets.
We sell our products through direct sales representatives in the U.S. and a combination of direct sales representatives and independent distributors in international markets. Sales to distributors are recorded when title and risk of loss transfer upon shipment (generally FOB shipping point). No direct sales customers or distributors have price protection. Estimated returns, which are historically nominal, are recorded as an allowance for sales return and as a reduction in revenues.
Shipping and Handling Costs
Shipping and handling costs billed to customers are included in revenues. Shipping and handling costs we incur associated with shipping products to our customers are included in cost of revenues.
Product Warranty Costs
We typically offer a one-year warranty for parts and labor on our products commencing upon the transfer of title and risk of loss to the customer. We accrue the estimated cost of product warranties when we invoice our customers, based on historical results. The warranty obligation is affected by product failure rates, material usage and service delivery costs incurred in correcting a product failure. Should actual product failure rates, material usage or service delivery costs differ from these estimates, revisions to the estimated warranty liability would be required. We periodically assess the adequacy of our recorded warranty liabilities and adjust the amounts as necessary.
Research and Development
Company-sponsored research and development expenses include the costs of technical activities that are useful in developing new products, services, processes or techniques, as well as expenses for technical activities that may significantly improve existing products or processes and are expensed as incurred.
Clinical Studies
We recognize research and development costs for activities associated with clinical studies performed by third parties as incurred. All other costs relative to setting up clinical study sites are recognized as research and development expense as incurred. Clinical study site costs related to patient enrollment are accrued as patients are entered into the studies. Equipment that has alternative future use and is used at clinical study sites for participation in the studies is capitalized and expensed over the estimated life of the equipment.
Income Taxes
We use the asset and liability method of accounting for income taxes. Deferred tax assets and liabilities are recognized for the estimated future tax consequences attributable to differences between the financial statement carrying amounts of existing assets and liabilities and their respective tax bases, and tax operating loss and tax credit carryforwards. Deferred tax assets and liabilities are measured using enacted tax rates expected to apply to taxable income in the years in which those temporary differences are expected to be recovered or settled. To the extent a deferred tax asset cannot be recognized under the preceding criteria, allowances are established.
82
In assessing the realizability of deferred tax assets, management considers whether it is more likely than not that some portion or all of the deferred tax assets will be realized. The ultimate realization of deferred tax assets is dependent upon the generation of future taxable income during the periods in which those temporary differences become deductible. During the fourth quarter of 2011, we concluded that it was more likely than not that we would be able to realize the benefit of a significant portion of our deferred tax assets in the future. We based this conclusion on historical and projected operating performance, as well as our expectation that our operations will generate sufficient taxable income in future periods to realize the tax benefit associated with the deferred tax assets. As a result, we released $22 million of the valuation allowance on our net federal and state deferred tax assets. We believe it is more likely than not that the benefit from certain international net operating losses and a portion of our state deferred tax assets will not be realized. In recognition of this risk, we will continue to provide a valuation allowance on the deferred tax assets relating to these items. We will continue to assess the need for a valuation allowance on the deferred tax asset by evaluating both positive and negative evidence that may exist. Any adjustment to the net deferred tax asset valuation allowance would be recorded in the income statement for the period that the adjustment is determined to be required. At December 31, 2010 and 2009, within the U.S. and selected international jurisdictions, all deferred tax assets, without offsetting liabilities in the same jurisdiction, were fully offset by a valuation allowance.
FASB ASC Topic 740,Income Taxes, or ASC 740, clarifies the accounting for uncertainty in income taxes recognized in the financial statements. ASC 740 provides that a tax benefit from an uncertain tax position may be recognized when it is more likely than not that the position will be sustained upon examination, including resolutions of any related appeals or litigation processes, based on the technical merits of the position. Income tax positions must meet a more-likely-than-not recognition threshold to be recognized. ASC 740 also provides guidance on measurement, derecognition, classification, interest and penalties, accounting in interim periods, disclosure and transition.
We accrue interest and penalties on underpayment of income taxes related to unrecognized tax benefits as a component of income tax expense in our consolidated statements of operations. The amounts recognized for interest and penalties during the years ended December 31, 2011, 2010 and 2009 were $34,000, $25,000, and $23,000, respectively.
Net Income (Loss) Per Share
Basic and diluted net income (loss) per share is presented in accordance with FASB ASC Topic 260,Earnings per Share. Basic net income (loss) per share is computed by dividing consolidated net income (loss) by the weighted-average number of common shares outstanding during the period. Diluted net income (loss) per share is computed by dividing consolidated net income (loss) by the weighted-average number of common shares outstanding and dilutive common stock equivalent shares outstanding during the period. Our potentially dilutive shares include outstanding common stock options, restricted stock units, incremental shares issuable upon the conversion of the Notes or exercise of the warrants relating to the Notes (See Note 3 “Financial Statement Details — Convertible Debt”). Such potentially dilutive shares are excluded when the effect would be to reduce net loss per share or increase net income per share as discussed in the following paragraph. For the year ended December 31, 2011, 2010 and 2009, potentially dilutive shares totaling 1.7 million, 834,000, and 3.9 million, respectively, have not been included in the computation of diluted net income (loss) per share, as the result would be anti-dilutive.
Diluted net income per common share includes 12,000 and zero incremental shares related to the Notes for the year ended December 31, 2011 and 2010. Because the principal amount of the Notes will be settled in cash upon conversion, only the conversion spread relating to the Notes may be included in our calculation of diluted net income per common share. As such, the Notes have no impact on diluted net income per common share until the price of our common stock exceeds the conversion price (initially $29.64, subject to adjustments) of the Notes. During the year ended December 31, 2011, 12,000 shares related to the Notes were included in the computation of the diluted net income per common share because the average market price of our common stock
83
during the three months ended September 30, 2011 exceeded the conversion price of the Notes. The average price of our common stock did not exceed the conversion price during any quarter of the year ended December 31, 2010.
The diluted net income per common share does not include any incremental shares related to the exercise of the warrants for the year ended December 31, 2011 and 2010. The warrants will not have an impact on diluted net income per common share until the price of our common stock exceeds the strike price of the warrants (initially $34.875, subject to adjustments). When the market price of our stock exceeds strike price, as applicable, we will include, in the diluted net income per common share calculation, the effect of the additional shares that may be issued upon exercise of the warrants using the treasury stock method.
The call options to purchase our common stock, which we purchased to hedge against potential dilution upon conversion of the Notes (see Note 3 “Financial Statement Details — Convertible Debt”), are not considered for purposes of calculating the total dilutive weighted average shares outstanding, as their effect would be anti-dilutive. Upon exercise, the call options will mitigate the dilutive effect of the Notes.
The basic and diluted net income (loss) per common share calculations for the years ended December 31, 2011, 2010, and 2009 are as follows (in thousands, except per share data):
| | | | | | | | | | | | |
| | | Years Ended December 31, | |
| | | 2011 | | | 2010 | | | 2009 | |
Net income (loss) | | $ | 38,093 | | | $ | 5,240 | | | $ | (28,954 | ) |
| | | | | | | | | | | | |
Weighted average common shares outstanding for basic | | | 52,300 | | | | 50,551 | | | | 48,400 | |
Dilutive potential common stock outstanding: | | | | | | | | | | | | |
Stock options | | | 1,896 | | | | 2,325 | | | | — | |
Restricted stock units | | | 377 | | | | 391 | | | | — | |
Employee stock purchase plan | | | 11 | | | | 14 | | | | — | |
Convertible senior notes | | | 12 | | | | — | | | | — | |
| | | | | | | | | | | | |
Weighted average common shares outstanding for diluted | | | 54,596 | | | | 53,281 | | | | 48,400 | |
| | | | | | | | | | | | |
Net income (loss) per share: | | | | | | | | | | | | |
Basic | | $ | 0.73 | | | $ | 0.10 | | | | (0.60 | ) |
| | | | | | | | | | | | |
Diluted | | $ | 0.70 | | | $ | 0.10 | | | | (0.60 | ) |
| | | | | | | | | | | | |
Stock-Based Compensation
We account for stock-based compensation under the provisions of FASB ASC Topic 718,Compensation—Stock Compensation, or ASC 718, which requires the measurement and recognition of compensation expense for all stock-based awards made to employees and directors based on estimated fair values on the grant date. We adopted ASC 718 on January 1, 2006 using the modified prospective method. We estimate the fair value of stock-based awards on the date of grant using the Black-Scholes-Merton option pricing model, or Black-Scholes model. The value of the portion of the award that is ultimately expected to vest is recognized as expense over the requisite service periods using the straight-line method. We estimate forfeitures at the time of grant and revise our estimate in subsequent periods if actual forfeitures differ from those estimates. See Note 5 “Stockholders’ Equity” for a complete discussion of our equity compensation programs and the fair value assumptions used to determine our stock-based compensation expense.
We account for stock-based compensation awards and warrants granted to non-employees in accordance with FASB ASC Topic 505-50,Equity-Based Payments to Non-Employees, orASC 505-50. Under ASC 505-50, we determine the fair value of the warrants or stock-based compensation awards granted as either the fair value of the consideration received or the fair value of the equity instruments issued, whichever is more reliably
84
measurable. If the fair value of equity instruments issued is used, it is measured using the stock price and other measurement assumptions as of the earlier of either (1) the date at which commitment for performance by the counterparty to earn the equity instruments is reached, or (2) the date at which the counterparty’s performance is complete.
Comprehensive Income (Loss)
Comprehensive income (loss) represents the net income (loss) for the period plus the results of certain changes to stockholders’ equity that are not reflected in the consolidated statements of operations. Our comprehensive income (loss) consists of net income (losses), unrealized net gains and losses on investments and foreign currency translation adjustments.
Recent Accounting Pronouncements
In December 2010, the FASB updated the accounting guidance relating to the test for potential impairment of goodwill that we are required to perform annually. The updated guidance requires companies to perform the second step of the impairment test to measure the amount of impairment loss, if any, when it is more likely than not that a goodwill impairment exists because the carrying amount of a reporting unit is zero or negative. In considering whether it is more likely than not that a goodwill impairment exists, an entity shall evaluate whether there are adverse qualitative factors. The updated guidance is effective for us beginning in fiscal year 2012. The adoption of this guidance is not expected to have a material effect on our consolidated financial statements.
In May 2011, the FASB amended the guidance regarding fair value measurement and disclosure. The amended guidance clarifies the application of existing fair value measurement and disclosure requirements. The amendment is effective for us beginning in fiscal year 2012. The adoption of this amendment is not expected to have a material effect on our consolidated financial statements.
In June 2011, the FASB amended requirements for the presentation of comprehensive income, to increase the prominence of other comprehensive income (OCI) in financial statements. Companies will have the option to present the components of net income and comprehensive income in either one or two consecutive financial statements. This amendment eliminates the option to present other comprehensive income in the statement of stockholders’ equity. We adopted this amendment and presented comprehensive income in the Consolidated Statements of Comprehensive Income (Loss) for the years ended December 31, 2011, 2010 and 2009 in this annual report on Form 10-K.
2. Acquisitions
CardioSpectra Acquisition
On December 18, 2007, we acquired CardioSpectra, Inc., or CardioSpectra, a privately held corporation, for an aggregate purchase price of $27.0 million. The acquisition of CardioSpectra’s OCT technology is expected to complement our existing product offerings and further enhance our position as an imaging technology leader in the field of interventional medicine. The acquisition was accounted for as an asset purchase. We have included the operating results associated with the CardioSpectra acquisition in our consolidated financial statements from the date of acquisition.
Subject to the terms of the Merger Agreement, we may be required to make milestone payments. The milestone payments are payable, at our sole discretion, in cash, shares of our common stock, or a combination of both and will be accounted for if and when the milestone payments become payable. We have used and will continue to use commercially reasonable efforts to cause the milestones to occur. However, if we reasonably determine that a technical failure or commercial failure has occurred with respect to all or a part of the OCT program, we may, at our sole discretion, terminate all or part of the OCT cardiovascular program.
85
In December 2009, the first milestone specified in the CardioSpectra merger agreement was achieved and at December 31, 2009, the corresponding milestone payment totaling $11.0 million was recorded as in-process research and development, or IPR&D, expense. In January 2010, we paid the milestone payment with the issuance of 609,360 shares of our common stock and $531,000 of cash. The second milestone specified in the merger agreement was not achieved as of December 31, 2010, and as such, the second milestone payment was not paid and no IPR&D was recorded. Additional remaining milestone payments of up to $17.0 million may be paid upon achievement of the respective revenue targets described in the merger agreement. As of December 31, 2011, we have not achieved the respective revenue targets. Therefore, we have not recorded any liability related to these milestones.
Novelis Acquisition
On May 15, 2008, we acquired all of the outstanding equity interests in Novelis, Inc., or Novelis, a privately-held company, which developed proprietary ultrasonic visualization and therapy technology for minimally invasive diagnostic and therapeutic devices. The core product line of Novelis is based on FL.IVUS technology. The aggregate purchase price was $12.3 million including transaction costs. The acquisition was accounted for as an asset purchase. We have included the operating results associated with the Novelis acquisition in our consolidated financial statements from the date of acquisition.
Under the terms of the merger agreement, a milestone payment of $3.0 million was eligible to be earned by the Novelis stockholders upon receipt of FDA approval of the original 510(k) application relating to the Novelis FL.IVUS device, but only in the event that the original 510(k) application for such a device was filed with the FDA on or before December 31, 2009. At December 31, 2009 a 510(k) application had been made to the FDA. At that time, we believed that the 510(k) application would be approved and that the milestone would become payable. Accordingly, at December 31, 2009 we recorded an accrual for $3.0 million in relation to the potential milestone payment. Based on our internal assessments in relation to our ongoing interactions with the FDA regarding this 510(k) application, during the fourth quarter of 2010 it became apparent that our 510(k) application would not be approved prior to its expiration. Accordingly, we reversed the accrual for the milestone payment, resulting in a $3.0 million credit to IPR&D expense during the fourth quarter of 2010.
Axsun Acquisition
On December 24, 2008, we acquired all of the outstanding equity interests in Axsun, a privately-held company that develops and manufactures optical monitors for the telecommunications industry, laser and non-laser light sources and optical engines used in OCT imaging systems and advanced photonic components and subsystems used in spectroscopy and other industrial applications. The aggregate purchase price of $23.8 million consisted of $22.3 million paid in cash, assumed liabilities of $6.5 million, and transaction costs of $725,000, net of cash received of $5.8 million. The acquisition was accounted for as a business combination. We have included the operating results associated with the Axsun acquisition in our consolidated financial statements from the date of acquisition.
Fluid Medical Acquisition
On August 5, 2010, we acquired all of the outstanding equity interests in Fluid Medical, Inc., or Fluid Medical, a privately-held company, which is engaged in the development of imaging technology for use in various structural heart applications, including, but not limited to, mitral valve repair. Fluid Medical’s technology and intellectual property provide forward field of view imaging on highly maneuverable catheters that have the potential to enable or enhance visualization for procedures currently done with inadequate imaging. This technology is expected to result in a Forward-Looking Intra-Cardiac Echo, or FL.ICE catheter that will initially be focused on minimally invasive structural heart applications, such as percutaneous aortic and mitral valve therapies.
86
The purchase price of $4.2 million consisted of $3.6 million in cash payments and $150,000 of debt forgiveness related to working capital loans we made to Fluid Medical prior to the acquisition. We retained $400,000 as a “hold-back” liability to satisfy any claims for indemnification made within 18 months following the closing, the majority of which was released in February 2012. The transaction was accounted for as a business combination and, as such we recorded $1.6 million of goodwill reflecting the amount by which the purchase consideration exceeded the acquired net assets. This goodwill was allocated to our medical segment and is not deductible for income tax purposes. We recorded $184,000 of acquisition-related costs related to this transaction, which were recognized in our statement of operations for the year ended December 31, 2010 as selling, general and administrative expense.
The purchase price allocation as of the acquisition date is summarized as follows (in thousands):
| | | | |
| | | August 5,
2010 | |
Current assets: | | | | |
Cash and cash equivalents | | $ | 46 | |
Property and equipment | | | 117 | |
In-process research and development | | | 4,050 | |
| | | | |
Total assets acquired | | | 4,213 | |
Current liabilities: | | | | |
Accrued compensation | | | (22 | ) |
Other long-term liabilities | | | (1,556 | ) |
| | | | |
Total liabilities acquired | | | (1,578 | ) |
| | | | |
Net assets acquired | | $ | 2,635 | |
| | | | |
The IPR&D asset we recorded represents an estimate of the fair value of in-process technology related to Fluid Medical’s imaging technology program, which is still in the prototype phase. As such, pursuant to ASC 805, amortization of the IPR&D will not occur until it reaches market feasibility. Costs incurred in connection with this project subsequent to the date of acquisition will be expensed as incurred. In the event the project is abandoned, we will record an impairment charge for this amount.
3. Financial Statement Details
Cash and Cash Equivalents and Available-for-Sale Investments
We invest our excess funds in securities issued by the U.S. government, corporations, banks, municipalities, financial holding companies and in money market funds comprised of these same types of securities. Our cash and cash equivalents and investments are placed with high credit quality financial institutions. Additionally, we diversify our investment portfolio in order to maintain safety and liquidity. As of December 31, 2011, all of our investments will mature within 17 months. These investments are recorded at their estimated fair value including accrued interest receivable, with unrealized gains or losses reported as a separate component of accumulated other comprehensive income or loss.
Fair value is defined as an exit price that would be received from the sale of an asset or paid to transfer a liability in the principal or most advantageous market for the asset or liability in an orderly transaction between market participants on the measurement date. Authoritative guidance establishes a three-level hierarchy for disclosure that is based on the extent and level of judgment used to estimate the fair value of assets and liabilities.
| | • | | Level 1—Valuations based on quoted prices for identical assets or liabilities in active markets at the measurement date. Since valuations are based on quoted prices that are readily and regularly available in an active market, valuation of these products does not entail a significant degree of judgment. Our Level 1 assets consist of money market funds and U.S. Treasury and agency debt securities. |
87
| | • | | Level 2—Valuations based on quoted prices for similar assets and liabilities in active markets; quoted prices for identical or similar assets and liabilities in markets that are not active; or other inputs that are observable or can be corroborated by observable market data, such as alternative pricing sources with reasonable levels of price transparency. Our Level 2 assets consist of corporate debt securities including commercial paper, corporate bonds, certificates of deposit and foreign currency forward contracts. |
| | • | | Level 3—Valuations based on inputs that are unobservable and significant to the overall fair value measurement. We have not measured the fair value of any of our assets using Level 3 inputs. |
We utilize a third-party pricing service to assist us in obtaining fair value pricing for our investments. Pricing for securities is based on proprietary models. Inputs are documented in accordance with the fair value disclosure hierarchy. We utilize third-party financial institutions to assist us in obtaining fair value pricing for our foreign currency forward contracts.
During the twelve months ended December 31, 2011 and 2010, no transfers were made into or out of the Level 1, 2, or 3 categories. We will continue to review our fair value inputs on a quarterly basis.
Financial assets and liabilities measured at fair value on a recurring basis are summarized below at December 31, 2011 and 2010 (in thousands):
| | | | | | | | | | | | | | | | |
| | | Fair Value Measurements at December 31, 2011 | |
| | | Total | | | Level 1 | | | Level 2 | | | Level 3 | |
Assets: | | | | | | | | | | | | | | | | |
Current: | | | | | | | | | | | | | | | | |
Cash | | $ | 41,744 | | | $ | 41,744 | | | $ | — | | | $ | — | |
Money market funds | | | 65,272 | | | | 65,272 | | | | — | | | | — | |
| | | | | | | | | | | | | | | | |
Sub-total cash and cash equivalents | | | 107,016 | | | | 107,016 | | | | — | | | | — | |
| | | | | | | | | | | | | | | | |
Corporate debt securities | | | 74,274 | | | | — | | | | 74,274 | | | | — | |
U.S. Treasury and agency debt securities | | | 38,053 | | | | 38,053 | | | | — | | | | — | |
| | | | | | | | | | | | | | | | |
Sub-total short-term investments | | | 112,327 | | | | 38,053 | | | | 74,274 | | | | — | |
| | | | | | | | | | | | | | | | |
Foreign currency forward contracts | | | 92 | | | | — | | | | 92 | | | | — | |
| | | | | | | | | | | | | | | | |
Sub-total other current assets | | | 92 | | | | — | | | | 92 | | | | — | |
| | | | | | | | | | | | | | | | |
Long Term: | | | | | | | | | | | | | | | | |
Corporate debt securities | | | 20,898 | | | | — | | | | 20,898 | | | | — | |
U.S. Treasury and agency debt securities | | | 10,021 | | | | 10,021 | | | | — | | | | — | |
| | | | | | | | | | | | | | | | |
Sub-total long-term investments | | | 30,919 | | | | 10,021 | | | | 20,898 | | | | — | |
| | | | | | | | | | | | | | | | |
Total Assets | | $ | 250,354 | | | $ | 155,090 | | | $ | 95,264 | | | $ | — | |
| | | | | | | | | | | | | | | | |
Liabilities: | | | | | | | | | | | | | | | | |
Foreign currency forward contracts | | $ | 71 | | | $ | — | | | $ | 71 | | | $ | — | |
| | | | | | | | | | | | | | | | |
88
| | | | | | | | | | | | | | | | |
| | | Fair Value Measurements at December 31, 2010 | |
| | | Total | | | Level 1 | | | Level 2 | | | Level 3 | |
Assets: | | | | | | | | | | | | | | | | |
Cash | | $ | 23,381 | | | $ | 23,381 | | | $ | — | | | $ | — | |
Money market funds | | | 20,048 | | | | 20,048 | | | | — | | | | — | |
| | | | | | | | | | | | | | | | |
Sub-total cash and cash equivalents | | | 43,429 | | | | 43,429 | | | | — | | | | — | |
| | | | | | | | | | | | | | | | |
Corporate debt securities | | | 97,712 | | | | — | | | | 97,712 | | | | — | |
U.S. Treasury and agency debt securities | | | 77,571 | | | | 77,571 | | | | — | | | | — | |
| | | | | | | | | | | | | | | | |
Sub-total short-term investments | | | 175,283 | | | | 77,571 | | | | 97,712 | | | | — | |
| | | | | | | | | | | | | | | | |
Long Term: | | | | | | | | | | | | | | | | |
Corporate debt securities | | | 16,802 | | | | — | | | | 16,802 | | | | — | |
U.S. Treasury and agency debt securities | | | 10,002 | | | | 10,002 | | | | — | | | | — | |
| | | | | | | | | | | | | | | | |
Sub-total long-term investments | | | 26,804 | | | | 10,002 | | | | 16,802 | | | | — | |
| | | | | | | | | | | | | | | | |
Total Assets | | $ | 245,516 | | | $ | 131,002 | | | $ | 114,514 | | | $ | — | |
| | | | | | | | | | | | | | | | |
Liabilities: | | | | | | | | | | | | | | | | |
Foreign currency forward contracts | | $ | 299 | | | $ | — | | | $ | 299 | | | $ | — | |
| | | | | | | | | | | | | | | | |
Our investments have been classified as available-for-sale. At December 31, 2011, available-for-sale investments are detailed as follows (in thousands):
| | | | | | | | | | | | | | | | |
| | | Amortized
Cost | | | Gross Unrealized
Gains | | | Gross Unrealized
Losses | | | Estimated
Fair Value | |
Short-term: | | | | | | | | | | | | | | | | |
Corporate debt securities | | $ | 74,233 | | | $ | 44 | | | $ | 3 | | | $ | 74,274 | |
U.S. Treasury and agency debt securities | | | 38,050 | | | | 4 | | | | 1 | | | | 38,053 | |
| | | | | | | | | | | | | | | | |
Short-term available-for-sale investments | | $ | 112,283 | | | $ | 48 | | | $ | 4 | | | $ | 112,327 | |
| | | | | | | | | | | | | | | | |
Long-term: | | | | | | | | | | | | | | | | |
Corporate debt securities | | $ | 20,930 | | | $ | 1 | | | $ | 33 | | | $ | 20,898 | |
U.S. Treasury and agency debt securities | | | 10,017 | | | | 4 | | | | — | | | | 10,021 | |
| | | | | | | | | | | | | | | | |
Long-term available for sale investments | | $ | 30,947 | | | $ | 5 | | | $ | 33 | | | $ | 30,919 | |
| | | | | | | | | | | | | | | | |
Available-for-sale investments that are in an unrealized loss position at December 31, 2011 are detailed as follows (in thousands):
| | | | | | | | |
| | | Estimated
Fair Value | | | Gross Unrealized
Losses | |
Corporate debt securities | | $ | 27,664 | | | $ | 36 | |
U.S. Treasury and agency debt securities | | | 9,502 | | | | 1 | |
| | | | | | | | |
| | $ | 37,166 | | | $ | 37 | |
| | | | | | | | |
At December 31, 2011, twelve of our corporate debt securities and two of our U.S. Treasury and agency debt securities are in an unrealized loss position caused by interest rate increases. We fully expect to receive par value with full principal and interest when these securities mature. These investments have been in an unrealized loss position for less than 12 months. We do not consider these investments to be other-than-temporarily impaired at December 31, 2011.
89
At December 31, 2010, available-for-sale investments are detailed as follows (in thousands):
| | | | | | | | | | | | | | | | |
| | | Amortized
Cost | | | Gross Unrealized
Gains | | | Gross Unrealized
Losses | | | Estimated
Fair Value | |
Short-term: | | | | | | | | | | | | | | | | |
Corporate debt securities | | $ | 97,685 | | | $ | 41 | | | $ | 14 | | | $ | 97,712 | |
U.S. Treasury and agency debt securities | | | 77,585 | | | | 8 | | | | 22 | | | | 77,571 | |
| | | | | | | | | | | | | | | | |
Short-term available-for-sale investments | | $ | 175,270 | | | $ | 49 | | | $ | 36 | | | $ | 175,283 | |
| | | | | | | | | | | | | | | | |
Long-term: | | | | | | | | | | | | | | | | |
Corporate debt securities | | $ | 16,830 | | | $ | 1 | | | $ | 29 | | | $ | 16,802 | |
U.S. Treasury and agency debt securities | | | 10,002 | | | | — | | | | — | | | | 10,002 | |
| | | | | | | | | | | | | | | | |
Long-term available for sale investments | | $ | 26,832 | | | $ | 1 | | | $ | 29 | | | $ | 26,804 | |
| | | | | | | | | | | | | | | | |
Derivative Financial Instruments
Our derivative financial instruments include foreign exchange forward contracts. Commencing October 2009, we begin using foreign exchange forward contracts to manage a portion of the foreign currency risk related to our intercompany receivable balances with our foreign subsidiaries whose functional currencies are the euro and yen. We record derivative financial instruments as either assets or liabilities in our consolidated balance sheets and measure them at fair value. At December 31, 2011 and 2010, the notional amount of our outstanding contracts was $59.3 million and $54.0 million, respectively. At December 31, 2011, our outstanding derivatives had maturities of 228 days or less. The fair value of our foreign exchange forward contracts of $92,000 and $0 was included in prepaid and other current assets and $71,000 and $299,000 was included in accrued expense and other current liabilities in our consolidated balance sheet at December 31, 2011 and 2010, respectively. For the year ended December 31, 2011, 2010 and 2009, $1.3 million and $3.2 million of losses and $715,000 of gains, respectively, related to our derivative financial instruments are included in exchange rate gain (loss) in our consolidated statements of operations.
In connection with our convertible debt offering (discussed in more detail below) we purchased call options on our common stock from JPMorgan Chase. The call options give us the right to purchase up to approximately 3.9 million shares of our common stock at $29.64 per share subject to certain adjustments that generally correspond to the adjustments to the conversion rate for the underlying debt. Additionally, we sold warrants to JPMorgan Chase, which give JPMorgan Chase the right to purchase up to approximately 3.9 million shares of our common stock at $34.875 per share, subject to certain adjustments. In accordance with the authoritative guidance, we concluded that the call options and warrants were indexed to our stock. Therefore, the call options and warrants were classified as equity instruments and are not being marked to market prospectively.
Accounts Receivable, Net
Accounts receivable, net consists of the following (in thousands):
| | | | | | | | |
| | | December 31, | |
| | | 2011 | | | 2010 | |
Trade accounts receivable | | $ | 69,553 | | | $ | 59,162 | |
Less: allowance for doubtful accounts | | | 84 | | | | 29 | |
| | | | | | | | |
| | $ | 69,469 | | | $ | 59,133 | |
| | | | | | | | |
90
The change in the allowance for doubtful accounts for the years ended December 31, 2011, 2010 and 2009 is summarized in the following table (in thousands):
| | | | | | | | | | | | |
| | | Years Ended December 31, | |
| | | 2011 | | | 2010 | | | 2009 | |
Balance at beginning of year | | $ | 29 | | | $ | 307 | | | $ | 354 | |
Additions (recoveries) charged to selling, general and administrative expense | | | 55 | | | | (12 | ) | | | (46 | ) |
Write-offs | | | — | | | | (246 | ) | | | (10 | ) |
Foreign currency translation adjustments | | | — | | | | (20 | ) | | | 9 | |
| | | | | | | | | | | | |
Balance at end of year | | $ | 84 | | | $ | 29 | | | $ | 307 | |
| | | | | | | | | | | | |
Inventories
Inventories consist of the following (in thousands):
| | | | | | | | |
| | | December 31, | |
| | | 2011 | | | 2010 | |
Finished goods (1) | | $ | 17,770 | | | $ | 20,996 | |
Work-in-process | | | 9,419 | | | | 7,946 | |
Raw materials | | | 14,117 | | | | 11,557 | |
| | | | | | | | |
| | $ | 41,306 | | | $ | 40,499 | |
| | | | | | | | |
| (1) | Finished goods inventory includes consigned inventory of $4.9 million and $3.3 million at December 31, 2011 and 2010, respectively. |
Property and Equipment
Property and equipment consists of the following (in thousands):
| | | | | | | | |
| | | December 31, | |
| | | 2011 | | | 2010 | |
Medical diagnostic equipment | | $ | 64,375 | | | $ | 55,836 | |
Other equipment | | | 33,953 | | | | 27,721 | |
Leasehold improvements | | | 8,514 | | | | 8,062 | |
Purchased software | | | 5,113 | | | | 3,331 | |
Land | | | 3,046 | | | | 3,046 | |
Construction-in-progress (1) | | | 31,123 | | | | 4,806 | |
| | | | | | | | |
| | | 146,124 | | | | 102,802 | |
Less: Accumulated depreciation and amortization | | | 65,027 | | | | 46,299 | |
| | | | | | | | |
| | $ | 81,097 | | | $ | 56,503 | |
| | | | | | | | |
| (1) | At December 31, 2011, construction-in-progress includes $974,000 and $217,000 of capitalized interest related to the construction of our manufacturing facility in Costa Rica and implementation of ERP system worldwide, respectively. At December 31, 2010, construction-in-process includes $42,000 of capitalized interest related to the construction of our manufacturing facility in Costa Rica. |
Property and equipment includes certain medical diagnostic equipment that is located at customer premises. We retain the ownership of the equipment and have the right to remove the equipment if it is not being utilized according to expectations. Depreciation expense relating to the equipment of $10.9 million, $8.2 million and $4.8 million is recorded in cost of revenues during the years ended December 31, 2011, 2010 and 2009,
91
respectively. The net book value of this equipment was $25.9 million and $28.6 million at December 31, 2011 and December 31, 2010, respectively. Also included in medical diagnostic equipment is property and equipment used for demonstration and evaluation purposes. Depreciation expense for equipment used for demonstration and evaluation purposes recorded in selling, general and administrative expenses totaled $1.2 million, $1.5 million and $1.8 million during the years ended December 31, 2011, 2010 and 2009, respectively. The net book value of this equipment was $1.4 million and $1.6 million at December 31, 2011 and December 31, 2010, respectively. Medical diagnostic equipment is recorded at our cost to acquire or manufacture the equipment and is depreciated over its estimated useful life (generally three to five years).
Depreciation expense for the years ended December 31, 2011, 2010 and 2009 was $19.8 million, $16.0 million, and $12.0 million, respectively.
Intangible Assets
Intangible assets consisted of acquired developed technology, licenses, customer relationships, assembled technology, patents and trademarks, as well as acquired in-process technology. Intangible assets related to developed technology, licenses, patents and trademarks, customer relationships, and assembled technology are amortized using the straight-line method over their estimated useful lives of up to 20 years. Amortization of acquired in-process technology will not commence until the technology reaches market feasibility. Upon a decision by management to abandon an in-process technology project, the related intangible assets are charged to expense. During the year ended December 31, 2011, we recorded intangible asset additions of $1.4 million related to internally developed patents and trademarks, $104,000 related to customer relationships and $161,000 related to licensed technology.
During the year ended December 31, 2010, we recorded intangible asset additions of $8.1 million primarily consisting of $4.1 million of acquired IPR&D, $2.0 million related to acquisition of developed technology, $1.4 million of customer relationships, and $429,000 related to internally developed patents and trademarks.
Intangible assets subject to amortization, by major class, consist of the following (in thousands):
| | | | | | | | | | | | | | | | |
| | | December 31, 2011 | |
| Intangible assets subject to amortization | | Cost | | | Accumulated
Amortization | | | Net | | | Weighted-
Average Life
(in years) (1) | |
Developed technology | | $ | 22,651 | | | $ | 15,995 | | | $ | 6,656 | | | | 8.2 | |
Licenses | | | 7,195 | | | | 6,054 | | | | 1,141 | | | | 10.0 | |
Customer relationships | | | 4,082 | | | | 3,067 | | | | 1,015 | | | | 3.3 | |
Patents and trademarks | | | 4,015 | | | | 1,632 | | | | 2,383 | | | | 9.0 | |
Assembled workforce | | | 274 | | | | 274 | | | | — | | | | 4.0 | |
| | | | | | | | | | | | | | | | |
| | | 38,217 | | | | 27,022 | | | | 11,195 | | | | 7.3 | |
Intangible assets not yet subject to amortization | | | | | | | | | | | | | | | | |
| | | | |
In-process research and development (2) | | | 4,050 | | | | — | | | | 4,050 | | | | n/a | |
| | | | | | | | | | | | | | | | |
| | $ | 42,267 | | | $ | 27,022 | | | $ | 15,245 | | | | | |
| | | | | | | | | | | | | | | | |
| (1) | Weighted average life of intangible assets is presented excluding fully amortized assets. |
| (2) | IPR&D represented an estimate of fair value of acquired in-process technology, which is still in the prototype phase. As such, pursuant to ASC 805, amortization of the IPR&D will not occur until it reaches market feasibility. In the event the project is abandoned, we will record an impairment charge for this amount. |
92
| | | | | | | | | | | | | | | | |
| | | December 31, 2010 | |
| Intangible assets subject to amortization | | Cost | | | Accumulated
Amortization | | | Net | | | Weighted-
Average Life
(in years) (1) | |
Developed technology | | $ | 22,651 | | | $ | 14,666 | | | $ | 7,985 | | | | 8.2 | |
Licenses | | | 7,034 | | | | 5,400 | | | | 1,634 | | | | 10.0 | |
Customer relationships | | | 3,978 | | | | 2,005 | | | | 1,973 | | | | 3.4 | |
Patents and trademarks | | | 2,655 | | | | 1,262 | | | | 1,393 | | | | 7.1 | |
Assembled workforce | | | 274 | | | | 206 | | | | 68 | | | | 4.0 | |
| | | | | | | | | | | | | | | | |
| | | 36,592 | | | | 23,539 | | | | 13,053 | | | | 7.1 | |
Intangible assets not yet subject to amortization | | | | | | | | | | | | | | | | |
| | | | |
In-process research and development (2) | | | 4,050 | | | | — | | | | 4,050 | | | | n/a | |
| | | | | | | | | | | | | | | | |
| | $ | 40,642 | | | $ | 23,539 | | | $ | 17,103 | | | | | |
| | | | | | | | | | | | | | | | |
We recorded amortization of intangible assets totaling $3.5 million, $2.6 million and $4.2 million for years ended December 31, 2011, 2010 and 2009, respectively.
At December 31, 2011, future amortization expense related to our intangible assets subject to amortization is expected to be as follows (in thousands):
| | | | |
2012 | | $ | 3,046 | |
2013 | | | 2,196 | |
2014 | | | 1,571 | |
2015 | | | 1,156 | |
2016 | | | 997 | |
Thereafter | | | 2,229 | |
| | | | |
| | $ | 11,195 | |
| | | | |
Goodwill
The change in goodwill for the years ended December 31, 2011 and 2010 is summarized in the following table (in thousands):
| | | | | | | | |
| | | Years Ended December 31, | |
| | | 2011 | | | 2010 | |
Balance at beginning of year | | $ | 2,487 | | | $ | 931 | |
Additions | | | — | | | | 1,556 | |
| | | | | | | | |
Balance at end of year | | $ | 2,487 | | | $ | 2,487 | |
| | | | | | | | |
Goodwill of $0.9 million was recorded in connection with the 2008 Axsun acquisition, and $1.6 million was recorded in connection with the 2010 Fluid Medical acquisition.
93
Accrued Warranty
Accrued warranty liability is included in accrued expenses and other current liabilities in the consolidated balance sheets. The change in the accrued warranty liability for the years ended December 31, 2011, 2010 and 2009 is summarized in the following table (in thousands):
| | | | | | | | | | | | |
| | | Years Ended December 31, | |
| | | 2011 | | | 2010 | | | 2009 | |
Balance at beginning of year | | $ | 852 | | | $ | 1,159 | | | $ | 1,104 | |
Warranties issued | | | 1,864 | | | | 1,384 | | | | 1,844 | |
Settlements | | | (1,639 | ) | | | (1,691 | ) | | | (1,789 | ) |
| | | | | | | | | | | | |
Balance at end of year | | $ | 1,077 | | | $ | 852 | | | $ | 1,159 | |
| | | | | | | | | | | | |
Restructuring Activity
In June 2009, we implemented a restructuring plan to consolidate our resources related to the research and development of our OCT technology. As part of the restructuring plan, during the first quarter of 2010 we closed our San Antonio, Texas facility and relocated such operations to our Billerica, Massachusetts facility. Approximately 20 employees were impacted by the restructuring plan. One-time benefits to affected employees included relocation or a separation agreement including severance payments, continuing medical benefits, and outplacement assistance. Sixteen employees entered into separation agreements. All terminations were completed as of May 31, 2010 and no outstanding liability related to this restructuring as of December 31, 2011 and 2010.
We accrued relocation costs and the costs of one-time termination benefits to employees who were not required to render service beyond a minimum retention period of 60 days. The remaining one-time termination benefits were recorded to expense ratably over required service periods. Additionally, costs related to moving equipment between the facilities were expensed during the period incurred. As a result, we recorded $63,000 as research and development expense during the year ended December 31, 2010. In addition, during the first quarter of 2010 we recorded $454,000 of additional restructuring costs as selling, general and administrative expense for the termination of the operating lease and related contract costs, and a charge for the impairment of certain property and equipment.
On April 26, 2010, we entered into a lease termination agreement with the landlord of our San Antonio facility. Total termination costs of $330,000 included a lump-sum lease-termination payment, broker commissions and the surrender of our security deposit. We are correspondingly released from any future obligations under this facility lease. The termination payment represented a savings over the original estimated restructuring liability related to the remaining lease payments and resulted in a benefit of $116,000 that was recorded during the second quarter. At December 31, 2010, there were no future obligations remaining in accrued liabilities related to this restructuring activity.
94
At December 31, 2010 and 2009, our restructuring liability included in accrued expenses and other current liabilities of our consolidated balance sheets (in thousands) is detailed as follows:
| | | | | | | | | | | | | | | | | | | | |
| | | Relocation | | | One time
termination
benefits | | | Facility
moving costs | | | Operating
lease
commitments | | | Total | |
Beginning balance | | $ | — | | | $ | — | | | $ | — | | | $ | — | | | $ | — | |
Additions | | | 82 | | | | 347 | | | | — | | | | — | | | | 429 | |
Cash payments | | | (26 | ) | | | (248 | ) | | | — | | | | — | | | | (274 | ) |
| | | | | | | | | | | | | | | | | | | | |
Liability as of December 31, 2009 | | | 56 | | | | 99 | | | | — | | | | — | | | | 155 | |
Additions | | | — | | | | 34 | | | | 29 | | | | 446 | | | | 509 | |
Cash payments | | | (56 | ) | | | (118 | ) | | | (29 | ) | | | (330 | ) | | | (533 | ) |
Reversals | | | — | | | | (15 | ) | | | — | | | | (116 | ) | | | (131 | ) |
| | | | | | | | | | | | | | | | | | | | |
Liability as of December 31, 2010 | | $ | — | | | $ | — | | | $ | — | | | $ | — | | | $ | — | |
| | | | | | | | | | | | | | | | | | | | |
Capital Lease Obligations
We lease certain equipment under capital lease arrangements. See Note 4 “Commitments and Other Contractual Obligations” for more information.
Convertible Debt
In September 2010, we issued $115.0 million aggregate principal amount of Notes, in an offering registered under the Securities Act of 1933, as amended. Interest is payable semiannually in arrears on March 1 and September 1, commencing on March 1, 2011.
The Notes are general unsecured obligations that rank pari passu with our other existing and future unsecured obligations. Prior to June 1, 2015, the Notes are convertible only upon certain specified events. The initial conversion rate for the Notes is 33.7339 shares of common stock per $1,000 principal amount of the Notes, representing an initial effective conversion price of approximately $29.64 per share of common stock. The conversion rate is subject to adjustment for certain events as outlined in the indenture governing the Notes but will not be adjusted for accrued and unpaid interest.
We received proceeds of $100.5 million from issuance of the Notes, net of debt issuance costs ($4.4 million) and net payments related to our hedge transactions ($10.0 million) which are described in more detail below. We recorded total debt issuance costs (including broker fees) of approximately $4.4 million, which have been allocated on a pro-rata basis to the debt ($3.5 million) and equity ($866,000) components of the transaction. The debt component is primarily included in non-current liabilities and is being accreted to interest expense over five years, the term of the Notes. The equity component was netted against the proceeds and included in additional paid-in capital.
The carrying values of the liability and equity components of the Notes are reflected in our consolidated balance sheets as follows (in thousands):
| | | | | | | | |
| | | December 31,
2011 | | | December 31,
2010 | |
Liabilities: | | | | | | | | |
Principal amount of the 2.875% Convertible Senior Notes | | $ | 115,000 | | | $ | 115,000 | |
Unamortized discount of liability component | | | (17,275 | ) | | | (21,211 | ) |
Unamortized debt issuance costs | | | (2,062 | ) | | | (2,627 | ) |
| | | | | | | | |
Carrying value of liability component | | $ | 95,663 | | | $ | 91,162 | |
| | | | | | | | |
Equity—net carrying value | | $ | 22,263 | | | $ | 22,263 | |
| | | | | | | | |
95
Interest expense related to the Notes was included in interest expense on the consolidated statements of operations as follows (in thousands):
| | | | | | | | |
| | | Year Ended
December 31, 2011 | | | Year Ended
December 31, 2010 | |
Contractual coupon interest | | $ | 3,306 | | | $ | 918 | |
Amortization of debt issuance costs | | | 729 | | | | 200 | |
Accretion of debt discount | | | 3,945 | | | | 1,052 | |
Less: capitalized interest | | | 1,190 | | | | 42 | |
| | | | | | | | |
| | $ | 6,790 | | | $ | 2,128 | |
| | | | | | | | |
We may not redeem the Notes prior to maturity. However, in the event of a fundamental change, as defined in the indenture, the holders of the Notes may require us to purchase all or a portion of their Notes at a purchase price equal to 100% of the principal amount of the Notes, plus accrued and unpaid interest, if any, to the repurchase date. Holders, who convert their Notes in connection with a make-whole fundamental change, as defined in the indenture, may be entitled to a make-whole premium in the form of an increase in the conversion rate.
Prior to June 1, 2015, the Notes are convertible only under the following circumstances: (1) during any fiscal quarter commencing after December 31, 2010 (and only during such fiscal quarter), if the last reported sale price of our common stock for at least 20 trading days (whether or not consecutive) during the period of 30 consecutive trading days ending on the last trading day of the immediately preceding fiscal quarter is greater than or equal to 130% of the applicable conversion price on each applicable trading day; (2) during the five business day period after any ten consecutive trading day period (the “Measurement Period”) in which, for each trading day of such Measurement Period, the trading price per $1,000 principal amount of notes on such trading day was less than 98% of the product of the last reported sale price of our common stock on such trading day and the applicable conversion rate on such trading day; or (3) upon the occurrence of specified distributions and corporate events. As of December 31, 2011, the “if-converted” value of the Notes did not exceed its principal amount and none of the conditions allowing holders of the Notes to convert had been met. The total fair value of the Notes at December 31, 2011 was $123.5 million.
We determined that the embedded conversion option in the Notes is not required to be separately accounted for as a derivative under ASC 815, Derivatives and Hedging. However, since the Notes are within the scope of ASC 470, Topic 20, Debt withConversion and Other Options, we are required to separate the Notes into a liability component and equity components. The carrying amount of the liability component is calculated by measuring the fair value of a similar liability (including any embedded features other than the conversion option) that does not have an associated equity component. The carrying amount of the equity component representing the embedded conversion option is determined by deducting the fair value of the liability component from the initial proceeds ascribed to the Notes as a whole. The excess of the principal amount of the liability component over its carrying amount is amortized to interest cost over the expected life of a similar liability that does not have an associated equity component using the effective interest method. The equity component is not remeasured as long as it continues to meet the conditions for equity classification in ASC 815, Topic 40,Contracts in an Entity’s Own Equity, or ASC 815.
We are using an effective interest rate of 7.65% to calculate the accretion of the bond discount, which is being recorded as interest expense over the expected remaining term of the Notes. (The amount by which interest expense calculated using the effective interest rate of 7.65% exceeds the interest expense related to the coupon rate of 2.875%, is non-cash interest expense.) The effective rate is based on the interest rate for a similar instrument that does not have a conversion feature. We may be required to pay additional interest upon occurrence of certain events as outlined in the indenture governing the Notes. As of December 31, 2011, the remaining term of the Notes is 3.67 years.
96
Upon conversion of a Note, holders of the Notes will receive up to the principal amount of the converted Note in cash and any excess conversion value (conversion spread) in shares of our common stock. The amount of cash and the number of shares of our common stock, if any, will be based on a 25 trading day observation period as described in the indenture. As described in Note 1 “Organization and Summary of Significant Accounting Policies”, the conversion spread will be included in the denominator for the computation of diluted net income per common share, using the treasury stock method.
As discussed above, to hedge against potential dilution upon conversion of the Notes, we also purchased call options on our common stock from JPMorgan Chase. The call options give us the right to purchase up to approximately 3.9 million shares of our common stock at $29.64 per share subject to certain adjustments that generally correspond to the adjustments to the conversion rate for the Notes. We paid an aggregate of $27.2 million to purchase these call options. The call options will expire on September 1, 2015, unless earlier terminated or exercised. To reduce the cost of the hedge, in a separate transaction we sold warrants to JPMorgan Chase. These warrants give JPMorgan Chase the right to purchase up to approximately 3.9 million shares of our common stock at $34.875 per share, subject to certain adjustments. These warrants will be exercisable and will expire in equal installments for a period of 50 trading days beginning on December 1, 2015. We received an aggregate of $17.1 million from the sale of these warrants. In accordance with ASC 815, we concluded that the call options and warrants were indexed to our stock. Therefore, the call options and warrants were classified as equity instruments and will not be marked to market prospectively unless certain conditions as described in the Notes occur. The net amount of $10.0 million paid to JPMorgan Chase was recorded as a reduction to additional paid-in capital. The settlement terms of the call options provide for net share settlement and the settlement terms of the warrants provide for net share or cash settlement at our option.
4. Commitments and Contingencies
Litigation—LightLab
On January 7, 2009, LightLab Imaging, Inc., or LightLab, filed a complaint against us and our wholly owned subsidiary, Axsun, in the Superior Court of Massachusetts, Suffolk County, seeking injunctive relief and unspecified damages (the Massachusetts Action). LightLab develops and sells OCT products for cardiovascular imaging and other medical uses. On July 6, 2010, LightLab was acquired by St. Jude Medical, Inc., or St. Jude.
Prior to our acquisition of Axsun, Axsun had entered into a development and supply agreement, or the Agreement, with LightLab, in which, among other things, Axsun agreed to supply tunable lasers to LightLab for use in LightLab’s OCT imaging products until April 2016, with exclusivity in the field of coronary artery imaging expiring in April 2014. Since the acquisition, Axsun has continued to supply lasers to LightLab. The complaint includes allegations that Volcano interfered with the Agreement and with LightLab’s advantageous business relationship with Axsun, that Axsun breached the Agreement, that Axsun and Volcano misappropriated LightLab’s confidential information and trade secrets, and violated Chapter 93A, a Massachusetts statute that provides for recovery of up to three times damages plus attorneys fees (93A).
The Judge ordered that the trial in the Massachusetts Action proceed in separate phases, with a jury trial first on liability, followed by a jury trial on damages, and then non-jury hearings on liability under 93A and on injunctive relief. The jury trial on liability commenced on January 4, 2010 and the jury returned a verdict on February 4, 2010 that included findings that the contract specifications for the lasers Axsun supplies and previously supplied to LightLab are trade secrets of LightLab, that Axsun agreed not to sell any tunable lasers to Volcano for any purpose or to third parties for use in cardiology imaging during the exclusivity period in the contract, and that Axsun breached its contract with LightLab. The jury further found that Volcano intentionally interfered with LightLab’s advantageous business relationship with Axsun.
A trial in the Massachusetts Action with respect to damages was set to commence on April 7, 2010, or Damages Trial. In lieu of conducting the Damages Trial, the parties agreed and stipulated that the sum of $200,000 would be treated as if it were the jury’s verdict against the defendants in the Damages Trial (the Stipulation).
97
Upon the entry of the Stipulation, LightLab waived its rights, if any, to make any additional claims for special damages relating to lasers received in 2009 that do not meet the version 6 specification, for special damages claimed by LightLab in prior pleadings, and for the repair and/or replacement of any of the lasers specified in the Stipulation. In addition, Axsun waived its rights, if any, to make any claim for recovery from LightLab for certain engineering charges in connection with a development and supply agreement with LightLab, and for return by LightLab of any of the lasers specified in the Stipulation.
Under the Stipulation, all parties expressly reserved their otherwise properly preserved rights of appeal. These rights include LightLab’s appellate rights, if any, regarding its claim for alleged lost profits in excess of the above-referenced $200,000 stipulated amount to the extent LightLab is able to establish that it has properly preserved such rights.
The injunctive relief phase of the Massachusetts Action commenced on April 12, 2010. In a ruling issued October 5, 2010, the Court rejected LightLab’s claims for protection of five alleged trade secrets relating to laser technologies, and denied all of LightLab’s requests for permanent injunctions with respect to those trade secrets. The ruling followed a two-week trial on five of a number of trade secret claims alleged by LightLab.
In a summary judgment ruling issued January 26, 2011, the Court rejected the remainder of LightLab’s claims for protection of its remaining trade secrets, and denied all of LightLab’s claims for permanent injunctions with respect to those trade secrets. This judgment completed the trade secret portion of the Massachusetts Action.
In a ruling issued January 28, 2011, the Court found that Volcano and Axsun violated 93A, and awarded LightLab additional damages of $400,000 and reasonable attorneys’ fees.
On February 10, 2011, and on April 7, 2011, the Court entered a Final Judgment and an Amended Final Judgment, respectively, in the Massachusetts Action: a) in favor of Volcano and Axsun on LightLab’s claims for trade secret misappropriation on items 1-30 on LightLab’s list of alleged trade secrets, b) ordered Volcano and Axsun to collectively pay $600,000 in damages (which amount includes the $200,000 agreed to in the Stipulation and the $400,000 ordered in the 93A ruling) and $4.5 million in attorneys’ fees, (resulting in a total of $4.9 million recorded to selling, general and administrative expense and accrued in other current liabilities during the fourth quarter of 2010), c) in favor of LightLab on its claims against Axsun for breach of contract, breach of implied covenant of good faith and fair dealing, for violation of 93A, and misappropriation of trade secrets for disclosing three particular items to Volcano in December 2008 – the specifications for the two lasers provided by Axsun to LightLab and one Axsun laser prototype made in 2008, d) in favor of LightLab on its claims against Volcano for intentional interference with a contract and advantageous business relationship, unjust enrichment, violation of 93A, and misappropriation of trade secrets for the same three trade secrets described above. In addition, the Court denied a majority of LightLab’s requested injunctions, and entered limited injunctive relief, none of which management believes have a material effect upon Volcano. The Final Judgment and Amended Final Judgment are substantially similar. The Amended Final Judgment corrects non-substantive clerical errors. On April 15, 2011, LightLab filed a notice of appeal, with respect to various decisions of the Court, including, a) the Court’s decisions adverse to LightLab’s claims for trade secret misappropriation in items 1-30 of LightLab’s alleged list of trade secrets, including the Court’s post-trial finding of fact and rulings of law adverse to LightLab on items 1 – 5, the Court’s two summary judgment decisions adverse to LightLab on items 6 – 23 and 25 – 30 (item 24 having been voluntarily dismissed by LightLab), and various rulings requiring evidence of use or intent to use as a prerequisite for injunctive relief; b) the Court’s post-trial decisions denying permanent injunctive relief that LightLab requested as terms of the Final Judgment; c) the Court’s pre-trial rulings excluding certain lost profits damages evidence that LightLab sought to introduce at trial; d) various discovery and pre-trial orders denying LightLab discovery about Axsun’s work for Volcano; e) the Court’s order barring LightLab from claiming that the sale of Axsun to Volcano itself constituted a breach of the LightLab-Axsun supply contract; and f) the denial of LightLab’s motion to alter or amend the Final Judgment, which motion sought to obtain additional declaratory relief barring Axsun from “supplying” tunable lasers to Volcano. Volcano and Axsun did
98
not intend to cross appeal the Amended Final Judgment, and on July 5, 2011, Volcano and Axsun satisfied their payment obligations under the Amended Final Judgment by making a payment to Lightlab in the amount of approximately $5.4 million.
On February 5, 2010, Volcano and our wholly owned subsidiary, Axsun, commenced an action in the Delaware Chancery Court (the Chancery Court Action), against LightLab seeking a declaration of Volcano and Axsun’s rights with respect to certain OCT technology, the High Definition Swept Source. The complaint was served on LightLab on March 19, 2010. LightLab then filed a counter-claim that included a claim against Axsun and Volcano for violations of 93A. Volcano and Axsun moved to dismiss LightLab’s 93A counter-claim, and LightLab responded to that motion by amending its 93A counter-claim. The 93A counterclaim has been stayed pending further action by the Chancery Court. This case has been stayed until such time as Volcano has achieved certain development and regulatory milestones.
Additionally, on May 24, 2011, LightLab commenced a separate action in Delaware Chancery Court (the Second Chancery Court Action), against Volcano and Axsun alleging that Axsun is inappropriately assisting Volcano in the development of a third-party laser. The complaint seeks injunctive relief and unspecified damages. After Volcano and Axsun moved to dismiss the Second Chancery Court Action, LightLab filed an amended complaint against Volcano and Axsun, adding additional allegations regarding misappropriation of trade secrets. Volcano and Axsun have submitted an answer to the amended complaint. In addition, Volcano and Axsun moved for judgment on the pleadings, seeking to dismiss a portion of LightLab’s amended complaint, and have filed an additional motion to stay the remainder of the Second Chancery Court Action. Those motions are currently pending.
Litigation—St. Jude
On July 27, 2010, St. Jude filed a lawsuit against Volcano in federal district court in Delaware (collectively, with the counterclaims described below, (the Delaware Patent Action), alleging that our pressure guide wire products infringe five patents owned by St. Jude. St. Jude is seeking injunctive relief and monetary damages. This action does not involve OCT technology and is separate from the Massachusetts Action.
On September 20, 2010, Volcano filed its response, in which we denied the allegations that our PrimeWire® products infringe any valid claim of St. Jude’s asserted patents. In addition, Volcano filed a counterclaim in which we have alleged that St. Jude’s PressureWire® products and its RadiAnalyzer® Xpress product infringe three Volcano patents. In our counterclaim, Volcano is seeking injunctive relief and monetary damages. A trial has been scheduled for October 15, 2012 for the Delaware Patent Action.
Litigation—Other
We may also be a party to various other claims in the normal course of business. Legal fees and other costs associated with such actions are expensed as incurred and were not material in any period reported. Additionally, we assess, in conjunction with our legal counsel, the need to record a liability for litigation and contingencies. Reserve estimates are recorded when and if it is determined that a loss related matter is both probable and reasonably estimable. We are not able to predict or estimate the ultimate outcome or range of possible losses relating to the Massachusetts Action, the Chancery Court Action, the Delaware Patent Action, the Second Chancery Court Action, or any of the other lawsuits, claims or counterclaims described above. However, we believe that the ultimate disposition of these matters, individually and in the aggregate, including the matters discussed above, will not have a material impact on our consolidated results of operations, financial position or cash flows. Our evaluation of the likely impact of these matters could change in the future and unfavorable outcomes and/or defense costs, depending upon the amount and timing, could have a material adverse effect on our results of operations or cash flows in future periods.
99
Licenses
In July 2003, we entered into a license agreement whereby we were granted the rights to certain IVUS technology and patents for total consideration of $6.5 million. This license fee was recorded as an intangible asset and is being amortized over the estimated useful lives of the patents and technology of ten years. In addition, we are paying royalties during the license period related to the sale of our products using the licensed technology. The royalties are calculated on a per unit basis using a sliding scale. During the years ended December 31, 2011, 2010 and 2009, royalty expense related to the use of this licensed technology of $833,000, $680,000, and $690,000, respectively, and is recorded in cost of revenues.
In April 2002, we entered into a license agreement with a medical research clinic whereby we were granted a license to certain patents and technology. During the years ended December 31, 2011, 2010 and 2009, we recorded royalty expense of $450,000, $441,000, and $415,000, respectively, in cost of revenues related to this agreement.
In June 2010, we entered into a license agreement whereby we were granted to certain patents and technology. During the years ended December 31, 2011 and 2010, we recorded royalty expense of $522,000 and $119,000 respectively, in cost of revenues related to this agreement.
We have entered into certain other licensing agreements with third parties which require us to make annual royalty payments based on either a minimum dollar amount or as a percentage of net sales, whichever is higher. None of these other agreements are material to our consolidated results of operations or financial position.
Leases
We lease our domestic and certain foreign facilities and other equipment under non-cancelable capital and operating lease agreements, which expire at various dates through 2021. In addition to the minimum future lease commitments presented below, the leases generally require that we pay property taxes, insurance, maintenance and repair costs. Certain leases also contain escalation clauses and renewal option clauses calling for increased rents. Where a lease contains an escalation clause or a concession such as a rent holiday, rent expense is recognized using the straight-line method over the term of the lease.
At December 31, 2011, future minimum lease commitments under non-cancelable leases are as follows (in thousands):
| | | | | | | | |
| Year Ending December 31, | | Capital | | | Operating | |
2012 | | $ | 102 | | | $ | 7,765 | |
2013 | | | 35 | | | | 7,525 | |
2014 | | | 19 | | | | 7,278 | |
2015 | | | 5 | | | | 1,591 | |
2016 | | | 2 | | | | 610 | |
Thereafter | | | — | | | | 3,135 | |
| | | | | | | | |
Net minimum lease payments | | $ | 163 | | | $ | 27,904 | |
| | | | | | | | |
| | | | | | | | |
Less: | | | | | | | | |
Amounts representing interest | | | 17 | | | | | |
Current | | | 72 | | | | | |
| | | | | | | | |
Long-term | | $ | 74 | | | | | |
| | | | | | | | |
Total rental expense was $6.9 million, $6.5 million, and $5.7 million for the years ended December 31, 2011, 2010 and 2009, respectively.
100
Commitments and Other Contractual Obligations
We have obligations under non-cancelable purchase commitments. The majority of these obligations related to inventory, primarily raw materials. At December 31, 2011, the future minimum payments under these non-cancelable purchase commitments totaled $32.6 million. Approximately $23.0 million of these commitments will require payment in 12 months, in which 21.5 million of these commitments will require payment prior to March 31, 2012. The remaining amount will require payments at various dates through 2016.
We have commitments to provide funding of $4.6 million to a clinical study conducted by a third-party and at December 31, 2011, we have a remaining obligation of up to $2.5 million. We will be billed as services are performed under the agreement. In addition, we have entered into agreements with other third parties to sponsor clinical studies. Generally, we contract with one or more clinical research sites for a single study and no one agreement is material to our consolidated results of operations or financial condition. We are usually billed as services are performed based on enrollment and are required to make payments over periods ranging from less than one year up to three years. Our actual payments under these agreements will vary based on enrollment.
In 2010, we acquired a parcel of land in Costa Rica for $3.0 million. In connection with the land acquisition, we also entered into a Fixed Price Building Construction Agreement and a Design, Architecture, Engineering and Construction Management Contract for the completion of a 140,000 square feet operational manufacturing facility. The estimated cost of the construction is approximately $30.5 million which we expect to incur through mid-2012. As of December 31, 2011, the total amount paid related to the construction of the Costa Rica manufacturing facility, including the cost of securing the land for the construction site, is $21.7 million, of which $16.5 million was paid during the year ended December 31, 2011.
Indemnification
Our supplier, distributor and collaboration agreements generally include certain provisions for indemnification against liabilities if our products are recalled, infringe a third party’s intellectual property rights or cause bodily injury due to alleged defects in our products. In addition, we have agreements with our present and former directors and executive officers indemnifying them against liabilities arising from service in their respective capacities to Volcano. We maintain directors’ and officers’ insurance policies that may limit our exposure to such liabilities. To date, we have not incurred any material costs as a result of such indemnifications and have not accrued any liabilities related to such obligations in the accompanying consolidated financial statements.
Sole source suppliers
We rely on a number of sole source suppliers to supply transducers, substrates and processing for our scanners used in our catheters. We do not carry significant inventory of transducers, substrates or scanner subassemblies. If we had to change suppliers, we expect that it would take six to 24 months to identify appropriate suppliers, complete design work and undertake the necessary inspections and testing before the new transducers and substrates would be available. We are not parties to supply agreements with these suppliers but instead use purchase orders as needed.
5. Stockholders’ Equity
Common Stock
The Company is authorized to issue 250,000,000 shares of common stock at $0.001 par value per share.
Stockholders Rights Plan
In May 2006, our stockholders approved a stockholder rights plan and a classified board of directors with staggered terms of election. Pursuant to the stockholder rights plan, we declared and paid a dividend of one right
101
for each share of common stock. Unless redeemed prior to the time the rights are exercised, upon the occurrence of certain events, the rights will entitle the holders to receive shares of our preferred stock, or shares of an acquiring entity.
Our increase of the authorized shares to 250,000,000 shares, the stockholder rights plan and the classified board of directors became effective upon the consummation of our initial public offering.
Warrants
In connection with our convertible debt offering discussed in Note 3 “Financial Statement Details—Convertible Debt,” we issued approximately 3.9 million warrants that are exercisable at a price of $34.875 per share in equal installments for a period of 50 trading days beginning on December 1, 2015.
Preferred Stock
The Company is authorized to issue 10,000,000 shares of undesignated preferred stock at $0.001 par value per share. The Board of Directors may determine the rights, preferences, privileges, qualifications, limitations and restrictions granted or imposed upon any series of preferred stock. As of December 31, 2011 and 2010, no preferred stock was outstanding.
Equity Compensation Plans
In October 2005, our stockholders approved the 2005 Equity Compensation Plan, or the 2005 Plan. Upon adoption of the 2005 Plan, issuance of stock awards under our 2000 Long Term Incentive Plan ceased.
On July 29, 2009, our stockholders approved an amendment and restatement of our 2005 Plan and the plan was renamed to the Amended and Restated 2005 Equity Compensation Plan, or the 2005 Amended Plan. The 2005 Amended Plan provides for the grant of incentive stock options, non-statutory stock options, stock appreciation rights, restricted stock awards, restricted stock unit awards, or RSU, performance stock awards, performance cash awards and other stock awards. The 2005 Amended Plan does not allow repricing of stock options without express approval of the stockholders and clarifies that a change in control must actually occur in order for change in control benefits to be realized. Our 2005 Amended Plan provides for an aggregate of 16,212,558 shares of our common stock that may be issued or transferred to our employees, non-employee directors and consultants, including increases of 2,050,000 and 2,500,000 shares which were approved by our stockholders on July 29, 2009 and May 2, 2011, respectively. Commencing July 29, 2009, the number of shares of common stock available for issuance under the 2005 Amended Plan was reduced by one share for each share of stock issued pursuant to a stock option or a stock appreciation right and one and sixty-three hundredths (1.63) shares for each share of common stock issued pursuant to a restricted stock award, restricted stock unit, or RSU, award, performance stock award or other stock award. On May 2, 2011, the plan was amended again and the number of shares of common stock available for issuance under the 2005 Amended Plan was reduced by one share for each share of stock issued pursuant to a stock option or a stock appreciation right and two and twelve hundredths (2.12) shares for each share of common stock issued pursuant to a restricted stock award, RSU, award, performance stock award or other stock award. Shares net exercised or retained to cover a participant’s minimum tax withholding obligations do not again become available for issuance under the 2005 Amended Plan.
The maximum term of options granted under the 2005 Amended Plan is seven years. For an initial grant to an employee, 25% of the options generally vest on the first anniversary of the original grant date, with the balance vesting monthly over the remaining three years. For subsequent grants to an employee, the options generally vest monthly over a four-year term. We may grant options that are exercisable immediately regardless of the vesting status of the option with us retaining a right to repurchase exercised unvested shares at the original exercise price of the option. Recipients of stock options shall be eligible to purchase shares of our common stock at an exercise price no less than the estimated fair market value of such stock on the date of grant.
102
At December 31, 2011, we have granted stock options and RSUs under the 2005 Amended Plan. Stock options previously granted under the 2000 Long Term Incentive Plan and the 2005 Plan that are cancelled or expired will increase the shares available for grant under the 2005 Amended Plan. At December 31, 2011, 4,222,127 shares remained available to grant under the 2005 Amended Plan.
Stock Option Activity
Stock option activity for the year ended December 31, 2011 is as follows:
| | | | | | | | | | | | | | | | |
| | | Stock
Options | | | Weighted-
Average
Exercise
Price | | | Weighted-
Average
Remaining
Contractual Life
(in years) | | | Aggregate
Intrinsic Value
(in thousands) | |
Outstanding at December 31, 2010 | | | 4,611,639 | | | $ | 13.74 | | | | | | | | | |
Granted | | | 442,470 | | | | 27.92 | | | | | | | | | |
Exercised | | | (867,159 | ) | | | 10.92 | | | | | | | | | |
Forfeited or expired | | | (48,593 | ) | | | 16.63 | | | | | | | | | |
| | | | | | | | | | | | | | | | |
Outstanding at December 31, 2011 | | | 4,138,357 | | | | 15.81 | | | | 3.75 | | | $ | 34,969 | |
| | | | | | | | | | | | | | | | |
Exercisable at December 31, 2011 | | | 3,278,861 | | | | 13.76 | | | | 3.26 | | | $ | 33,122 | |
| | | | | | | | | | | | | | | | |
Vested and expected to vest at December 31, 2011 | | | 4,077,977 | | | | 15.68 | | | | 3.72 | | | $ | 34,853 | |
| | | | | | | | | | | | | | | | |
Options outstanding at December 31, 2011 are summarized as follows:
| | | | | | | | | | | | | | | | | | | | |
| | | Options Outstanding | | | Options Vested | |
| | | Number
Outstanding | | | Weighted-
Average
Remaining
Contractual Life
(in years) | | | Weighted-
Average
Exercise Price | | | Number
Outstanding | | | Weighted-
Average
Exercise Price | |
$0.33–$6.49 | | | 595,834 | | | | 2.5 | | | $ | 2.50 | | | | 595,834 | | | $ | 2.50 | |
$8.36–$12.63 | | | 415,043 | | | | 2.5 | | | | 11.26 | | | | 376,399 | | | | 11.15 | |
$12.96–$13.69 | | | 527,820 | | | | 3.8 | | | | 13.42 | | | | 410,751 | | | | 13.38 | |
$13.77–$14.91 | | | 422,032 | | | | 4.1 | | | | 14.41 | | | | 288,637 | | | | 14.49 | |
$16.01–$18.90 | | | 202,103 | | | | 3.1 | | | | 17.47 | | | | 177,193 | | | | 17.49 | |
$19.07 | | | 663,466 | | | | 5.1 | | | | 19.07 | | | | 297,214 | | | | 19.07 | |
$19.11 | | | 579,197 | | | | 2.1 | | | | 19.11 | | | | 579,197 | | | | 19.11 | |
$19.77–$27.47 | | | 561,262 | | | | 5.3 | | | | 24.52 | | | | 246,636 | | | | 22.81 | |
$27.63–$32.22 | | | 157,600 | | | | 6.4 | | | | 29.39 | | | | 525 | | | | 28.63 | |
$32.52 | | | 14,000 | | | | 6.5 | | | | 32.52 | | | | 1,458 | | | | 32.52 | |
| | | | | | | | | | | | | | | | | | | | |
$0.33–$32.52 | | | 4,138,357 | | | | 3.8 | | | | 15.81 | | | | 2,973,844 | | | | 13.75 | |
| | | | | | | | | | | | | | | | | | | | |
Non-vested stock option activity for the year ended at December 31, 2011 is as follows:
| | | | | | | | |
| | | Non-vested
Stock
Options | | | Weighted-Average
Grant Date Fair
Value | |
Outstanding at December 31, 2010 | | | 1,534,686 | | | $ | 5.75 | |
Granted | | | 442,470 | | | | 11.34 | |
Vested | | | (771,640 | ) | | | 7.20 | |
Forfeited or expired | | | (41,003 | ) | | | 7.40 | |
| | | | | | | | |
Outstanding at December 31, 2011 | | | 1,164,513 | | | | 6.85 | |
| | | | | | | | |
103
The weighted-average grant-date fair value of stock options granted during the year ended December 31, 2011 was $11.34, $8.19 and $5.92, respectively.
Restricted Stock Unit Activity
RSU activity for the year ended December 31, 2011 is as follows:
| | | | |
| | | Restricted
Stock Units | |
Outstanding at December 31, 2010 | | | 745,490 | |
Granted | | | 408,509 | |
Vested | | | (246,983 | ) |
Forfeited or expired | | | (41,031 | ) |
| | | | |
Outstanding at December 31, 2011 | | | 865,985 | |
| | | | |
These time-vested RSUs entitle the holder to shares of common stock as the units vest in equal annual installments over a four-year period. The weighted-average grant-date fair value of each RSU granted during the year ended December 31, 2011, 2010 and 2009 was $26.62, $19.17 and $13.69, respectively.
During the year ended December 31, 2011, we released 246,983 shares of common stock based on the vesting terms of certain RSU agreements.
There was no common stock held in treasury as of December 31, 2011 and 2010.
Employee Stock Purchase Plan Activity
In June 2007, our stockholders approved the adoption of our 2007 Employee Stock Purchase Plan, or Purchase Plan. The Purchase Plan provides eligible employees the opportunity to purchase shares of our common stock at the lower of up to 85% of the fair market value on the first or last day of the applicable offering period, by having withheld from their salary an amount up to 15% of their compensation, without paying brokerage fees or commissions on purchases. Our Purchase Plan is deemed to be compensatory, and therefore, Purchase Plan expense has been included in our consolidated statements of operations for the years ended December 31, 2011, 2010 and 2009. We pay for the administrative expenses of the Purchase Plan. No employee may purchase more than $25,000 worth of common stock (calculated at the time the purchase right is granted) in any calendar year, nor may purchase more than 750 shares in any six-month purchase period.
Commencing January 1, 2008, common stock reserved for issuance under the Purchase Plan automatically increases by the lower of 1 1/2% of our outstanding common stock or 600,000 shares on the first day of January of each year. In November 2009, 2010, and 2011, the Board of Directors exercised its right not to increase the number of shares of common stock available for issuance under the Purchase Plan that was scheduled to occur on January 1, 2010, January 1, 2011, and January 1, 2012, respectively. As a result, at December 31, 2011, the number of shares of common stock reserved for issuance under the Purchase Plan remained at 1,100,000, and 415,198 shares of common stock were available for issuance under the Purchase Plan.
During the years ended December 31, 2011, 2010, and 2009, 171,251, 187,215, and 175,323 shares, respectively, were purchased at an average per share price of $20.75, $14.64, and $12.11, respectively.
104
Fair Value Assumptions
The fair value of each stock option is estimated on the date of grant using the Black-Scholes model utilizing the following weighted-average assumptions:
| | | | | | | | | | | | |
| | | 2011 | | | 2010 | | | 2009 | |
Risk-free interest rate | | | 1.9 | % | | | 2.3 | % | | | 2.1 | % |
Expected life (years) | | | 4.4 | | | | 4.6 | | | | 5.0 | |
Estimated volatility | | | 47.4 | % | | | 46.4 | % | | | 46.2 | % |
Expected dividends | | | None | | | | None | | | | None | |
Weighted-average grant date fair value | | $ | 11.34 | | | $ | 8.19 | | | $ | 5.92 | |
The risk-free interest rate for periods within the contractual life of the stock option is based on the implied yield available on U.S. Treasury constant maturity securities with the same or substantially equivalent remaining terms at the time of grant.
For options granted January 1, 2006 through December 31, 2007, we adopted a temporary “shortcut approach” as permitted by Staff Accounting Bulletin No. 107 to develop an expected life of an employee stock option. Under this approach, the expected life was presumed to be the mid-point between the vesting date and the contractual end of the option term. Since January 1, 2008, we have used our historical stock option exercise experience to estimate the expected term of our stock options.
Historically, the estimated volatility was calculated using the historical volatility of the common stock of comparable companies using weekly price observations over a period generally commensurate with the expected term of our options. We did not exclude any period due to discrete historical events. We used the historical volatility of similar companies due to the limited trading history of our common stock. Since the completion of our initial public offering, we have also included the weekly price observations of our common stock, weighted for the number of price observations, in our estimate of volatility.
As of January 1, 2011 we determined that the trading history of our common stock is sufficient in relation to the expected term of our stock options to begin using the volatility calculated on our common stock without further consideration of the volatility of comparable companies’ common stock. As such, for any options granted during the twelve months ended December 31, 2011, we have solely utilized the volatility of our own common stock in determining the grant date fair value.
We use a zero value of the expected dividend value factor since we have not declared any dividends in the past and we do not anticipate declaring any dividends in the foreseeable future.
The first offering period under the Purchase Plan commenced in September 2007. The fair value of each purchase option under the Purchase Plan is estimated at the beginning of each purchase period using the Black-Scholes model utilizing the following weighted-average assumptions:
| | | | | | | | | | | | |
| | | Years Ended December 31, | |
| | | 2011 | | | 2010 | | | 2009 | |
Risk-free interest rate | | | 0.1 | % | | | 0.2 | % | | | 0.6 | % |
Expected life (years) | | | 0.5 | | | | 0.5 | | | | 0.5 | |
Estimated volatility | | | 36.4 | % | | | 36.6 | % | | | 61.2 | % |
Expected dividends | | | None | | | | None | | | | None | |
Fair value of purchase right | | $ | 6.76 | | | $ | 5.15 | | | $ | 4.66 | |
The computation of the expected volatility assumption used in the Black-Scholes model for purchase rights is based on the trading history of our common stock. The expected life assumption is based on the six-month
105
term of each offering period. The risk-free interest rate is based on the U.S. Treasury constant maturity securities with the same or substantially equivalent remaining term in effect at the beginning of the offering period. We use a zero value for the expected dividend value factor since we have not declared any dividends in the past and we do not anticipate declaring any dividends in the foreseeable future.
Stock-Based Compensation Expense
The following table sets forth stock-based compensation expense included in our consolidated statements of operations (in thousands):
| | | | | | | | | | | | |
| | | Years Ended December 31, | |
| | | 2011 | | | 2010 | | | 2009 | |
Cost of revenues | | $ | 459 | | | $ | 760 | | | $ | 809 | |
Selling, general and administrative | | | 10,850 | | | | 10,210 | | | | 8,604 | |
Research and development | | | 1,682 | | | | 1,497 | | | | 1,472 | |
| | | | | | | | | | | | |
| | $ | 12,991 | | | $ | 12,467 | | | $ | 10,885 | |
| | | | | | | | | | | | |
Included in our stock-based compensation expense is $115,000, $673,000 and $271,000 of stock-based compensation expense related to non-employees in the years ended December 31, 2011, 2010 and 2009, respectively. In the years ended December 31, 2011, 2010 and 2009, we recorded $1,044,000, $928,000 and $841,000, respectively, of stock-based compensation expense related to the Purchase Plan. At December 31, 2011 and 2010, there was $202,000 and $223,000, respectively, of total stock-based compensation cost capitalized in inventories.
We estimate forfeitures and only recognize expense for those shares expected to vest. Our estimated forfeiture rates in the years ended December 31, 2011, 2010 and 2009 are based on our historical forfeiture experience.
Stock option excess tax benefits of $165,000 and $433,000 were credited to additional paid-in-capital during the year ended December 31, 2011 and 2010.
The total intrinsic value of stock options exercised during the year ended December 31, 2011, 2010 and 2009 was $14.7 million, $23.5 million and $7.4 million, respectively, and represents the difference between the exercise price of the option and the fair value of our common stock on the dates exercised. The total grant-date fair value of stock options vested during the year ended December 31, 2011, 2010 and 2009 was $5.6 million, $7.3 million and $7.5 million, respectively.
At December 31, 2011, there was $9.7 million, $12.6 million, and $164,000 of total unrecognized employee compensation cost related to stock options, RSUs and the Purchase Plan, respectively, which is expected to be recognized over a weighted average of 2.3 years, 2.6 years, and 0.2 years, respectively.
106
6. Income Taxes
The income tax expense (benefit) is as follows (in thousands):
| | | | | | | | | | | | |
| | | Years Ended December 31, | |
| | | 2011 | | | 2010 | | | 2009 | |
Current: | | | | | | | | | | | | |
Federal | | $ | — | | | $ | — | | | $ | (148 | ) |
State | | | 498 | | | | 584 | | | | 133 | |
Foreign | | | 2,283 | | | | 1,588 | | | | 1,492 | |
| | | | | | | | | | | | |
| | $ | 2,781 | | | $ | 2,172 | | | $ | 1,477 | |
| | | | | | | | | | | | |
Deferred: | | | | | | | | | | | | |
Federal | | $ | 5,735 | | | $ | 2,727 | | | $ | (4,678 | ) |
State | | | (2,147 | ) | | | 404 | | | | 630 | |
Foreign | | | (519 | ) | | | (426 | ) | | | (696 | ) |
| | | | | | | | | | | | |
| | $ | 3,069 | | | $ | 2,705 | | | $ | (4,744 | ) |
| | | | | | | | | | | | |
Valuation allowance | | $ | (25,840 | ) | | $ | (2,790 | ) | | $ | 4,454 | |
| | | | | | | | | | | | |
Income tax expense (benefit) | | $ | (19,990 | ) | | $ | 2,087 | | | $ | 1,187 | |
| | | | | | | | | | | | |
Losses before income taxes relating to non-U.S. operations were $133,000, $685,000 and $738,000 in the years ended December 31, 2011, 2010 and 2009, respectively.
The income tax expense (benefit) in the accompanying consolidated statements of operations differ from the expense (benefit) calculated by applying the U.S. federal statutory income tax rate of 35% to income (loss) before income taxes expense (benefit) due to the following (in thousands):
| | | | | | | | | | | | |
| | | Years Ended December 31, | |
| | | 2011 | | | 2010 | | | 2009 | |
U.S. federal statutory income tax expense (benefit) | | $ | 6,339 | | | $ | 2,564 | | | $ | (9,718 | ) |
State income tax expense (benefit), net of federal income tax expense | | | (1,800 | ) | | | 584 | | | | 717 | |
Valuation allowance | | | (25,840 | ) | | | (2,790 | ) | | | 4,303 | |
Foreign tax rate differential | | | 156 | | | | 196 | | | | 1,750 | |
Credits | | | (1,405 | ) | | | (678 | ) | | | (1,097 | ) |
In-process research and development | | | — | | | | — | | | | 4,911 | |
Other | | | 2,560 | | | | 2,211 | | | | 321 | |
| | | | | | | | | | | | |
Income tax expense (benefit) | | $ | (19,990 | ) | | $ | 2,087 | | | $ | 1,187 | |
| | | | | | | | | | | | |
107
The components of our deferred tax assets are as follows (in thousands):
| | | | | | | | |
| | | December 31, | |
| | | 2011 | | | 2010 | |
Deferred tax assets: | | | | | | | | |
Net operating loss carryovers | | $ | 13,451 | | | $ | 17,630 | |
Tax credit carryovers | | | 9,430 | | | | 7,326 | |
Accruals and deferred revenue | | | 6,284 | | | | 5,855 | |
Stock based compensation | | | 8,634 | | | | 7,044 | |
Original issue discount | | | 1,473 | | | | 1,728 | |
| | | | | | | | |
Total deferred tax assets | | | 39,272 | | | | 39,583 | |
Deferred tax liabilities: | | | | | | | | |
Depreciation and amortization | | | (6,506 | ) | | | (3,456 | ) |
| | | | | | | | |
Deferred tax assets: | | | 32,766 | | | | 36,127 | |
| | | | | | | | |
Valuation allowance | | | (9,421 | ) | | | (36,989 | ) |
| | | | | | | | |
Net deferred tax assets (liabilities) | | $ | 23,345 | | | $ | (862 | ) |
| | | | | | | | |
The net change in the total valuation allowance was a decrease of $27.5 million in 2011. At December 31, 2011, based on the weight of available evidence, including cumulative profitability in recent years and the availability of expected future taxable income, the Company concluded that it is more likely than not that the benefits of some of the Company’s deferred income tax assets will be realized. Accordingly, the Company reversed the valuation allowance on the Company’s federal and a portion of its state gross deferred income tax assets. In February 2009, the California 2009-2010 budget legislature was enacted into law, allowing companies to elect, for income tax purposes, to apply a single sales factor apportionment for years beginning after January 1, 2011. Based upon its anticipated election, the Company is continuing to maintain a valuation allowance to offset a portion of its California deferred tax assets as realization of a portion of such assets does not meet the more-likely-than-not threshold required under accounting guidelines. At December 31, 2010 and 2009, a valuation allowance was established within the U.S. and selected international jurisdictions to offset deferred tax assets, as realization of such assets is not more likely than not.
Included in our net deferred tax asset balance at December 31, 2011 is a $1.7 million net deferred tax asset representing future tax deductions of original issue discount in excess of book expense related to the Company’s hedge transaction associated with its Notes. The Company concluded that it is more likely than not that the benefit of the deferred income tax will be realized. Accordingly, the Company reversed the valuation allowance on this asset. The benefit attributable to such asset was recognized as an increase to additional-paid-in-capital. As of December 31, 2010, the aforementioned deferred tax asset of $1.7 million and corresponding valuation allowance were recorded with an offset to additional-paid-in-capital.
As a result of certain realization requirements of ASC 718, the table of deferred tax assets shown above does not include certain deferred tax assets at December 31, 2011 and 2010 that arose directly from tax deductions related to equity compensation in excess of compensation recognized for financial reporting. Equity will be increased by approximately $47.8 million if and when such deferred tax assets are ultimately realized. We use the with-and-without approach ignoring indirect effects for purposes of determining when excess tax benefits have been realized. Stock option excess tax benefits of $165,000 and $433,000 were credited to additional paid-in-capital during the year ended December 31, 2011 and 2010.
At December 31, 2011, we have federal and state net operating loss carry forwards of approximately $68.5 million and $39.6 million, respectively. The federal and state net operating loss carry forwards begin to expire in 2021 and 2012, respectively, unless previously utilized. In addition, we have federal and state research and experimentation tax credit carry forwards of approximately $5.8 million and $6.8 million, respectively. The
108
federal credits begin to expire in 2022. The California state credits carry forward indefinitely. The Massachusetts state credit carry forwards begin to expire in 2019. Foreign net operating losses are approximately $14.6 million and carry forward indefinitely.
Pursuant to Internal Revenue Code Section 382, use of net operating loss carry forwards related to acquisitions of approximately $29.4 million may be limited. These carry forwards will expire if we are unable to generate sufficient taxable income within the carry forward period.
At December 31, 2011, the total amount of gross unrecognized tax benefits, including interest and penalties, was approximately $1.1 million. If recognized, these benefits would affect our effective tax rate. The aggregate change in the balances of these benefits is as follows (in thousands):
| | | | | | | | | | | | |
| | | Years Ended December 31, | |
| | | 2011 | | | 2010 | | | 2009 | |
Balance at beginning of year | | $ | 878 | | | $ | 578 | | | $ | 313 | |
Increases related to tax positions taken during the current year | | | 205 | | | | 306 | | | | 264 | |
Increases (decreases) related to tax positions taken during a prior period | | | (18 | ) | | | (6 | ) | | | 1 | |
| | | | | | | | | | | | |
Balance at end of year | | $ | 1,065 | | | $ | 878 | | | $ | 578 | |
| | | | | | | | | | | | |
We accrue interest and penalties on underpayment of income taxes related to unrecognized tax benefits as a component of income tax expense in our consolidated statements of operations. The amounts recognized for interest and penalties during the years ended December 31, 2011, 2010 and 2009 were $34,000, $25,000, and $23,000, respectively.
We are open for audit by the U.S. Internal Revenue Service and state tax jurisdictions from our inception in 2000 through 2011. We were audited by the Belgian tax authorities for the 2005 and 2006 years. There were no significant adjustments as a result of this audit. We continue to be open for audit by Belgium and various European tax jurisdictions from the inception of Volcano Europe in 2003 through 2011, and by South Africa from the inception of Volcano South Africa in 2008 through 2011. We were audited by the Japanese tax authorities for the 2005 through 2007 years. There were no significant adjustments as a result of this audit. We continue to be open for audit by the Japanese tax authorities from the inception of Volcano Japan in 2004 through 2011.
7. Segment and Geographic Information
Our chief operating decision-maker reviews financial information presented on a consolidated basis, accompanied by disaggregated information about segment revenues by product and geographic region for purposes of making operating decisions and assessing financial performance. We have two reporting segments, the first being the medical segment which include the manufacture, sale, discovery, development and commercialization of products for the diagnosis of atherosclerosis in the coronary arteries and peripheral vascular system. In addition we have an industrial segment which includes the discovery, development, manufacture and sale of micro-optical spectrometers and optical channel monitors to telecommunications and other industrial companies.
We do not assess the performance of our segments on other measures of income or expense, such as depreciation and amortization, operating income or net income. We do not produce reports for, or measure the performance of, our segments on any asset-based metrics. Therefore, segment information is presented only for revenues by product.
109
The following table sets forth our revenues by segment and product (in thousands):
| | | | | | | | | | | | | | | | | | | | |
| | | Years Ended December 31, | | | Percentage Change | |
| | 2011 | | | 2010 | | | 2009 | | | 2010 to 2011 | | | 2010 to 2009 | |
Medical segment: | | | | | | | | | | | | | | | | | | | | |
Consoles | | $ | 40,954 | | | $ | 40,630 | | | $ | 39,438 | | | | 0.8 | % | | | 3.0 | % |
Single-procedure disposables: | | | | | | | | | | | | | | | | | | | | |
IVUS | | | 200,970 | | | | 167,023 | | | | 130,785 | | | | 20.3 | | | | 27.7 | |
FM | | | 67,082 | | | | 46,517 | | | | 31,125 | | | | 44.2 | | | | 49.5 | |
Other | | | 23,530 | | | | 16,943 | | | | 10,345 | | | | 38.9 | | | | 63.8 | |
| | | | | | | | | | | | | | | | | | | | |
Sub-total medical segment | | | 332,536 | | | | 271,113 | | | | 211,693 | | | | 22.7 | | | | 28.1 | |
Industrial segment | | | 11,010 | | | | 23,033 | | | | 16,174 | | | | (52.2 | ) | | | 42.4 | |
| | | | | | | | | | | | | | | | | | | | |
| | $ | 343,546 | | | $ | 294,146 | | | $ | 227,867 | | | | 16.8 | % | | | 29.1 | % |
| | | | | | | | | | | | | | | | | | | | |
The following table sets forth our revenues by geography expressed as dollar amounts (in thousands) and the changes in revenues in the specified periods expressed as percentages:
| | | | | | | | | | | | | | | | | | | | |
| | | Years Ended December 31, | | | Percentage Change | |
| | | 2011 | | | 2010 | | | 2009 | | | 2010 to 2011 | | | 2009 to 2010 | |
Revenues (1): | | | | | | | | | | | | | | | | | | | | |
United States | | $ | 157,412 | | | $ | 134,645 | | | $ | 110,502 | | | | 16.9 | % | | | 21.8 | % |
Japan | | | 105,892 | | | | 79,277 | | | | 52,339 | | | | 33.6 | | | | 51.5 | |
Europe, the Middle East and Africa | | | 60,249 | | | | 57,614 | | | | 47,609 | | | | 4.6 | | | | 21.0 | |
Rest of world | | | 19,993 | | | | 22,610 | | | | 17,417 | | | | (11.6 | ) | | | 29.8 | |
| | | | | | | | | | | | | | | | | | | | |
| | $ | 343,546 | | | $ | 294,146 | | | $ | 227,867 | | | | 16.8 | | | | 29.1 | |
| | | | | | | | | | | | | | | | | | | | |
| (1) | Revenues are attributed to geographies based on the location of the customer, except for shipments to original equipment manufacturers, which are attributed to the country of the origin of the equipment distributed. |
At December 31, 2011, approximately 44.8% of our long-lived assets, excluding financial assets, are located in the U.S., approximately 30.2% are located in Costa Rica, 20.7% are located in Japan, and less than 5% are located in our remaining geographies. At December 31, 2010, approximately 51% of our long-lived assets, excluding financial assets, were located in the U.S., approximately 34% were located in Japan, and less than 15% were located in our remaining geographies.
At December 31, 2011 and 2010, goodwill of $2.5 million has been allocated entirely to our medical segment and relates to our U.S. operations.
8. Employee Benefits
Defined Contribution Plans
We have a defined contribution 401(k) plan for our U.S. employees who are at least 21 years of age. Employees are eligible to participate in the plan beginning on the first day of the month following their first date of hire. Under the terms of the plan, employees may make voluntary contributions as a percent of compensation or as a fixed amount per pay period. During the years ended December 31, 2011, 2010, and 2009, we have made discretionary contributions equal to 25% of participant contributions up to a maximum of 6% of the participant’s annual salary totaling $928,000, $793,000, and $710,000, respectively.
We also sponsor additional defined contribution plans for most of our European employees. Contributions under all plans were $412,000, $361,000 and $315,000 in the years ended December 31, 2011, 2010 and 2009, respectively.
110
9. Quarterly Information (Unaudited)
The following table sets forth our unaudited quarterly summary consolidated statements of operations in each of the quarters for the years ended December 31, 2011 and 2010. The information for each of these quarters is unaudited and has been prepared on the same basis as our consolidated financial statements. This data should be read in conjunction with our consolidated financial statements and related notes. These operating results may not be indicative of results to be expected for any future period (amounts in thousands, except per share data).
| | | | | | | | | | | | | | | | | | | | |
| | | Quarter Ended (unaudited) | | | Year ended
December 31 | |
| 2011 | | March 31 | | | June 30 (1) | | | September 30 | | | December 31 (2) | | |
Revenue | | $ | 80,995 | | | $ | 84,036 | | | $ | 85,767 | | | $ | 92,748 | | | $ | 343,546 | |
Gross profit | | | 53,121 | | | | 57,273 | | | | 56,229 | | | | 62,390 | | | | 229,013 | |
Operating (loss) income | | | 3,718 | | | | 7,607 | | | | 5,407 | | | | 8,679 | | | | 25,411 | |
Net (loss) income | | | 1,156 | | | | 4,888 | | | | 2,627 | | | | 29,422 | | | | 38,093 | |
Net (loss) income per share: | | | | | | | | | | | | | | | | | | | | |
Basic | | $ | 0.02 | | | $ | 0.10 | | | $ | 0.05 | | | $ | 0.56 | | | $ | 0.73 | |
Diluted | | $ | 0.02 | | | $ | 0.09 | | | $ | 0.05 | | | $ | 0.54 | | | $ | 0.70 | |
Includes the following stock-based compensation expense: | | | | | | | | | | | | | | | | | | | | |
Cost of revenues | | $ | 163 | | | | (4 | ) | | | 146 | | | $ | 154 | | | $ | 459 | |
Selling, general and administrative | | | 2,589 | | | | 2,747 | | | | 2,720 | | | | 2,794 | | | | 10,850 | |
Research and development | | | 342 | | | | 451 | | | | 450 | | | | 439 | | | | 1,682 | |
| | |
| | | Quarter Ended (unaudited) | | | Year ended
December 31 | |
| 2010 | | March 31 | | | June 30 | | | September 30 | | | December 31 (3) | | |
Revenue | | $ | 66,572 | | | $ | 73,452 | | | $ | 72,886 | | | $ | 81,236 | | | $ | 294,146 | |
Gross profit | | | 39,934 | | | | 46,359 | | | | 46,931 | | | | 52,062 | | | | 185,286 | |
Operating (loss) income | | | (3,608 | ) | | | 6,029 | | | | 6,554 | | | | 996 | | | | 9,971 | |
Net (loss) income | | | (4,036 | ) | | | 5,416 | | | | 5,585 | | | | (1,725 | ) | | | 5,240 | |
Net (loss) income per share: | | | | | | | | | | | | | | | | | | | | |
Basic | | $ | (0.08 | ) | | $ | 0.11 | | | $ | 0.11 | | | $ | 0.03 | | | $ | 0.10 | |
Diluted | | $ | (0.08 | ) | | $ | 0.10 | | | $ | 0.10 | | | $ | 0.03 | | | $ | 0.10 | |
Includes the following stock-based compensation expense: | | | | | | | | | | | | | | | | | | | | |
Cost of revenues | | $ | 203 | | | | 198 | | | | 185 | | | $ | 174 | | | $ | 760 | |
Selling, general and administrative | | | 2,538 | | | | 2,522 | | | | 2,503 | | | | 2,647 | | | | 10,210 | |
Research and development | | | 342 | | | | 388 | | | | 360 | | | | 407 | | | | 1,497 | |
| (1) | In March 2011, we changed our estimate for forfeitures which resulted in a total reduction of $218,000 of stock compensation expense. During the three months ended June 30, 2011, $120,000 of this reduction was initially capitalized in inventory and recognized in cost of revenue as the inventory was subsequently sold. |
| (2) | During the quarter ended December 31, 2011, we concluded that it was more likely than not that we would be able to realize the benefit of a significant portion of our deferred tax assets in the future. Therefore, we reversed $22 million of the valuation allowance on the Company’s net federal and certain state deferred income tax assets. |
| (3) | During the quarter ended December 31, 2010, we recorded a $3.0 million reduction in in-process research and development expenses related to the reversal of an accrual for a milestone payment of $3.0 million originally recognized in 2009 related to our FL.IVUS project acquired from Novelis, as we believed we no longer would achieve the milestone. Additionally, the fourth quarter of 2010 includes expense of $4.9 million in relation to the LightLab legal settlement discussed in Note 4, “Commitments and Other Contractual Obligations—Litigation—LightLab.” |
111
| Item 9. | Changes in and Disagreements With Accountants on Accounting and Financial Disclosure |
None
| Item 9A. | Controls and Procedures |
Evaluation of Disclosure Controls and Procedures
Under the supervision and with the participation of our management, including our Chief Executive Officer and our Chief Financial Officer, we carried out an evaluation of the effectiveness of the design and operation of our disclosure controls and procedures as defined in Rules 13a-15(e) and 15d-15(e) under the Securities Exchange Act of 1934, as amended, or the Exchange Act. Based on that evaluation, our Chief Executive Officer and our Chief Financial Officer have concluded that, at December 31, 2011, such disclosure controls and procedures were effective.
Disclosure controls and procedures are controls and other procedures that are designed to ensure that information required to be disclosed in our reports filed or submitted under the Exchange Act is recorded, processed, summarized and reported within the time periods specified in the SEC’s rules and forms. Disclosure controls and procedures include, without limitation, controls and procedures designed to ensure that information required to be disclosed in our reports filed or submitted under the Exchange Act is accumulated and communicated to management, including our Chief Executive Officer and Chief Financial Officer, or persons performing similar functions, as appropriate, to allow timely decisions regarding required disclosure.
Limitations on the Effectiveness of Controls
Our disclosure controls and procedures are designed to provide reasonable, not absolute, assurance that the objectives of our disclosure control system are met. Because of inherent limitations in all control systems, no evaluation of controls can provide absolute assurance that all control issues, if any, within a company have been detected. Our Chief Executive Officer and Chief Financial Officer have concluded, based on their evaluation as of the end of the period covered by this report, that our disclosure controls and procedures were sufficiently effective to provide reasonable assurance that the objectives of our disclosure control system were met.
Changes in Internal Control Over Financial Reporting
Under the supervision and with the participation of our management, including our Chief Executive Officer and our Chief Financial Officer, we carried out an evaluation of any potential changes in our internal control over financial reporting during our last fiscal year. There were no changes in our internal control over financial reporting during the year ended December 31, 2011 that our certifying officers concluded materially affected, or are reasonably likely to materially affect, our internal control over financial reporting.
Management’s Report on Internal Control Over Financial Reporting
As required by the SEC rules and regulations for the implementation of Section 404 of the Sarbanes-Oxley Act, our management is responsible for establishing and maintaining adequate internal control over financial reporting. Our internal control over financial reporting is designed to provide reasonable assurance regarding the reliability of financial reporting and the preparation of our consolidated financial statements for external reporting purposes in accordance with accounting principles generally accepted in the U.S. of America. Our internal control over financial reporting includes those policies and procedures that:
| | (1) | Pertain to the maintenance of records that, in reasonable detail, accurately and fairly reflect the transactions and dispositions of the assets of the Company, |
| | (2) | Provide reasonable assurance that transactions are recorded as necessary to permit preparation of consolidated financial statements in accordance with accounting principles generally accepted in the |
112
| | U.S. of America, and that our receipts and expenditures are being made only in accordance with authorizations of our management and directors, and |
| | (3) | Provide reasonable assurance regarding prevention or timely detection of unauthorized acquisition, use or disposition of our assets that could have a material effect on the consolidated financial statements. |
Because of its inherent limitations, internal control over financial reporting may not prevent or detect misstatements in our consolidated financial statements. Also, projections of any evaluation of effectiveness to future periods are subject to the risk that controls may become inadequate because of changes in conditions, or that the degree or compliance with the policies or procedures may deteriorate. Management assessed the effectiveness of the Company’s internal control over financial reporting as of December 31, 2011. In making these assessments, management used the criteria set forth by the Committee of Sponsoring Organizations of the Treadway Commission (COSO) inInternal Control—Integrated Framework.Based on our assessments and those criteria, management determined that the Company maintained effective internal control over financial reporting as of December 31, 2011.
Audit Report of the Independent Registered Public Accounting Firm
KPMG LLP, our independent registered public accounting firm that has audited our consolidated financial statements included herein, has issued an audit report on our internal control over financial reporting as of December 31, 2011, which report is included under Item 8 of this Annual Report on Form 10-K.
| Item 9B. | Other Information |
None
113
PART III
| Item 10. | Directors, Executive Officers and Corporate Governance. |
The information required by this item will be set forth in our Proxy Statement relating to the Annual Meeting of Stockholders to be held on May 23, 2012 and is incorporated in this report by reference.
| Item 11. | Executive Compensation. |
The information required by this item will be set forth in our Proxy Statement relating to the Annual Meeting of Stockholders to be held on May 23, 2012 and is incorporated in this report by reference.
| Item 12. | Security Ownership of Certain Beneficial Owners and Management and Related Stockholder Matters. |
The information required by this item will be set forth in our Proxy Statement relating to the Annual Meeting of Stockholders to be held on May 23, 2012 and is incorporated in this report by reference.
| Item 13. | Certain Relationships and Related Transactions, and Director Independence. |
The information required by this item will be set forth in our Proxy Statement relating to the Annual Meeting of Stockholders to be held on May 23, 2012 and is incorporated in this report by reference.
| Item 14. | Principal Accounting Fees and Services. |
The information required by this item will be set forth in our Proxy Statement relating to the Annual Meeting of Stockholders to be held on May 23, 2012 and is incorporated in this report by reference.
114
PART IV
| Item 15. | Exhibits, Financial Statement Schedules. |
| | (a) | Index of Financial Statements: |
| | (1) | The financial statements required by Item 15(a) are filed in Item 8 of this Annual Report on Form 10-K. |
| | (2) | Schedules required by Item 15(a) are omitted because they are not required, are not applicable or the information is included in the consolidated financial statements or notes thereto. |
| | |
Exhibit
Number | | Description |
| |
| 2.1 | | Asset Purchase Agreement, dated July 10, 2003, by and among Jomed Inc., Jomed N.V., Jomed GmbH, Jomed Benelux S.A. and the Registrant (filed as Exhibit 2.1 to the Registrant’s Registration Statement on Form S-1, as amended (File No. 333-132678), as originally filed on March 24, 2006, and incorporated herein by reference). |
| |
| 2.2† | | Asset Transfer Agreement, dated July 3, 2003, by and between Pacific Rim Medical Ventures Corp and Koninklijke Philips Electronics N.V. (filed as Exhibit 2.2 to the Registrant’s Registration Statement on Form S-1, as amended (File No. 333-132678), as originally filed on March 24, 2006, and incorporated herein by reference). |
| |
| 2.3 | | Agreement and Plan of Merger, dated December 7, 2007, by and among the Registrant, Corazon Acquisition, Inc., CardioSpectra, Inc. and Christopher E. Banas and Paul Castella, as the Shareholders’ Representatives (filed as Exhibit 2.1 to the Registrant’s Current Report on Form 8-K/A (File No. 000-52045), as originally filed on March 4, 2008, and incorporated herein by reference). |
| |
| 2.4 | | Agreement and Plan of Merger, dated as of May 14, 2008, by and among Volcano Corporation, Lava Merger, Inc., Novelis Inc. and Paul Magnin (filed as Exhibit 2.1 to the Registrant’s Current Report on Form 8-K (File No. 000-52045), as originally filed on May 19, 2008, and incorporated herein by reference). |
| |
| 2.5 | | Agreement and Plan of Merger, dated as of December 22, 2008, by and among Volcano Corporation, Hummingbird Merger, Inc., Axsun Technologies, Inc. and William Seifert (filed as Exhibit 2.5 to the Registrant’s Annual Report on Form 10-K (File No. 000-52045), as originally filed on March 10, 2009, and incorporated herein by reference). |
| |
| 3.1 | | Amended and Restated Certificate of Incorporation of the Registrant (filed as Exhibit 3.1 to the Registrant’s Quarterly Report on Form 10-Q (File No. 000-52045), as originally filed on August 9, 2006, and incorporated herein by reference). |
| |
| 3.2 | | Bylaws of the Registrant, as revised (filed as Exhibit 3.1 to the Registrant’s Current Report on Form 8-K (File No. 000-52045), as originally filed on May 4, 2011, and incorporated herein by reference). |
| |
| 3.3 | | Certificate of Designation of Series A Junior Participating Preferred Stock (filed as Exhibit 3.2 to the Registrant’s Quarterly Report on Form 10-Q (File No. 000-52045), as originally filed on August 9, 2006, and incorporated herein by reference). |
| |
| 4.1 | | Reference is made to Exhibits 3.1, 3.2 and 3.3. |
| |
| 4.2 | | Specimen Common Stock certificate of the Registrant (filed as Exhibit 4.1 to the Registrant’s Registration Statement on Form S-1/A, as amended (File No. 333-132678), as originally filed on May 24, 2006, and incorporated herein by reference). |
115
| | |
Exhibit
Number | | Description |
| |
| 4.3 | | Fourth Amended and Restated Investor Rights Agreement, dated February 18, 2005, by and among the Registrant and certain stockholders (filed as Exhibit 4.2 to the Registrant’s Registration Statement on Form S-1, as amended (File No. 333-132678), as originally filed on March 24, 2006, and incorporated herein by reference). |
| |
| 4.4 | | Rights Agreement, dated June 20, 2006, by and between the Registrant and American Stock Transfer & Trust Company (filed as Exhibit 4.1 to the Registrant’s Quarterly Report on Form 10-Q (File No. 000-52045), as originally filed on August 9, 2006, and incorporated herein by reference). |
| |
| 4.5 | | Indenture, dated September 20, 2010, by and between the Registrant and Wells Fargo Bank (filed as Exhibit 4.1 to the Registrant’s Current Report on Form 8-K (File No. 000-52045), as originally filed on September 20, 2010, and incorporated herein by reference). |
| |
| 4.6 | | Supplemental Indenture, dated September 20, 2010 by and between Registrant and Wells Fargo Bank, N.A. (filed as Exhibit 4.2 to the Registrant’s Current Report on Form 8-K (File No. 000-52045), as originally filed on September 20 2010, and incorporated herein by reference). |
| |
| 4.7 | | From of 2.875% Convertible Senior Notes due 2015 (filed as Exhibit 4.3 to the Registrant’s Current Report on Form 8-K (File No. 000-52045), as originally filed on September 20, 2010, and incorporated herein by reference). |
| |
| 10.1* | | Form of Indemnification Agreement for directors and executive officers (filed as Exhibit 10.1 to the Registrant’s Registration Statement on Form S-1, as amended (File No. 333-132678), as originally filed on March 24, 2006, and incorporated herein by reference). |
| |
| 10.2* | | 2000 Long Term Incentive Plan and forms of Stock Option Agreements thereunder (filed as Exhibit 10.2 to the Registrant’s Registration Statement on Form S-1/A, as amended (File No. 333-132678), as originally filed on May 5, 2006, and incorporated herein by reference). |
| |
| 10.3* | | Amended and Restated 2005 Equity Compensation Plan (filed as Exhibit 10.1 to the Registrant’s Quarterly Report on Form 10-Q (File No. 000-52045), as filed on August 8, 2011, and incorporated herein by reference). |
| |
| 10.3a* | | 2005 Equity Compensation Plan Forms of Stock Option Agreements and Stock Grant Agreement thereunder (forms filed as Exhibit 10.3 to the Registrant’s Registration Statement on Form S-1/A, as amended (File No. 333-132678), as originally filed on May 5, 2006, and incorporated herein by reference). |
| |
| 10.3b* | | 2005 Equity Compensation Plan Form of Grantee Restriction Agreement (filed as Exhibit 10.3a to the Registrant’s Annual Report on Form 10-K, as amended (File No. 000-52045), as originally filed on March 23, 2007, as amended, and incorporated herein by reference). |
| |
| 10.3c* | | Amended and Restated 2005 Equity Compensation Plan Form of Restricted Stock Unit Grant Notice and Form of Restricted Stock Unit Agreement (filed as Exhibit 10.2 to the Registrant’s Current Report on Form 8-K (File No. 000-52045), as originally filed on February 11, 2010, and incorporated herein by reference). |
| |
| 10.3d* | | Amended and Restated 2005 Equity Compensation Plan Form of Stock Option Agreement (filed as Exhibit 10.3 to the Registrant’s Current Report on Form 8-K (File No. 000-52045), as originally filed on February 11, 2010, and incorporated herein by reference). |
| |
| 10.3e* | | Form of Restricted Stock Unit Grant Notice and Form of Restricted Stock Unit Agreement with deferred delivery under the Volcano Corporation 2005 Equity Compensation Plan, as amended and restated (filed as Exhibit 10.2 to the Registrant’s Quarterly Report on Form 10-Q (File No. 000-52045), as originally filed on May 7, 2010, and incorporated herein by reference). |
116
| | |
Exhibit
Number | | Description |
| |
| 10.4* | | 2007 Employee Stock Purchase Plan (filed as Exhibit 99.2 to the Registrant’s Registration Statement on Form S-8 (File No. 333-145761), filed with the SEC on August 29, 2007, and incorporated herein by reference). |
| |
| 10.5† | | License Agreement by and between the Registrant and The Cleveland Clinic Foundation, dated April 30, 2002 (filed as Exhibit 10.15 to the Registrant’s Registration Statement on Form S-1, as amended (File No. 333-132678), as originally filed on March 24, 2006, and incorporated herein by reference). |
| |
| 10.6* | | Amended and Restated Employment Agreement by and between the Registrant and R. Scott Huennekens, dated February 28, 2008 (filed as Exhibit 10.1 to the Registrant’s Current Report on Form 8-K (File No. 000-52045), as originally filed on March 4, 2008, and incorporated herein by reference). |
| |
| 10.7* | | Employment Agreement by and between the Registrant and Jorge J. Quinoy, dated December 10, 2008 (filed as Exhibit 10.1 to the Registrant’s Current Report on Form 8-K (File No. 000-52045), as originally filed on December 12, 2008, and incorporated herein by reference). |
| |
| 10.8* | | Amended and Restated Employment Agreement by and between the Registrant and John T. Dahldorf, dated February 28, 2008 (filed as Exhibit 10.2 to the Registrant’s Current Report on Form 8-K (File No. 000-52045), as originally filed on March 4, 2008, and incorporated herein by reference). |
| |
| 10.9* | | 2010 Commission Plan between the Registrant and Jorge Quinoy (filed as Exhibit 10.9 to the Registrant’s Annual Report on Form 10-K (File No. 000-52045), as originally filed on March 1, 2011, and incorporated herein by reference). |
| |
| 10.10* | | 2011 Commission Plan between the Registrant and Jorge Quinoy (filed as Exhibit 10.4 to the Registrant’s Quarterly Report on Form 10-Q (File No. 000-52045), as originally filed on May 6, 2011, and incorporated herein by reference) . |
| |
| 10.11* | | Managing Director Agreement, dated March 20, 2006, by and between Volcano Europe NV and Michel Lussier (filed as Exhibit 10.30 to the Registrant’s Registration Statement on Form S-1, as amended (File No. 333-132678), as originally filed on March 24, 2006, and incorporated herein by reference). |
| |
| 10.12* | | Addendum to Managing Director Agreement, dated February 4, 2011, by and between Volcano Europe NV and Michel Lussier (filed as Exhibit 10.11 to the Registrant’s Annual Report on Form 10-K (File No. 000-52045), as originally filed on March 1, 2011, and incorporated herein by reference). |
| |
| 10.13* | | Employment Agreement, dated February 4, 2011, by and between the Registrant and Michel Lussier (filed as Exhibit 10.12 to the Registrant’s Annual Report on Form 10-K (File No. 000-52045), as originally filed on March 1, 2011, and incorporated herein by reference). |
| |
| 10.14* | | Employment Agreement, dated August 1, 2010, by and between the Registrant and Darin Lippoldt (filed as Exhibit 10.13 to the Registrant’s Annual Report on Form 10-K (File No. 000-52045), as originally filed on March 1, 2011, and incorporated herein by reference). |
| |
| 10.15* | | Employment Offer Letter, dated June 23, 2008, by and between the Registrant and David Sheehan (filed as Exhibit 10.14 to the Registrant’s Annual Report on Form 10-K (File No. 000-52045), as originally filed on March 1, 2011, and incorporated herein by reference). |
| |
| 10.16 | | Standard Multi-Tenant Office Lease—Gross, dated June 13, 2005, by and between Ethan Conrad and the Registrant, as amended (filed as Exhibit 10.18 to the Registrant’s Registration Statement on Form S-1, as amended (File No. 333-132678), as originally filed on March 24, 2006, and incorporated herein by reference). |
117
| | |
Exhibit
Number | | Description |
| |
| 10.17 | | Third Amendment to Standard Multi-Tenant Office Lease—Gross, dated June 13, 2005, by and between Ethan Conrad and the Registrant, dated December 24, 2008 (filed as Exhibit 10.18 to the Registrant’s Annual Report on Form 10-K (File No. 000-52045), as originally filed on March 1, 2011, and incorporated herein by reference). |
| |
| 10.18 | | Termination Agreement, dated September 22, 2010, by and among the Registrant, Volcano Japan Co., Ltd. and Fukuda Denshi Co., Ltd. (filed as Exhibit 10.18 to the Registrant’s Annual Report on Form 10-K (File No. 000-52045), as originally filed on March 1, 2011, and incorporated herein by reference). |
| |
| 10.19† | | Supply Agreement, dated July 21, 2003, by and between the Registrant and AVE Galway Limited (filed as Exhibit 10.21 to the Registrant’s Registration Statement on Form S-1, as amended (File No. 333-132678), as originally filed on March 24, 2006, and incorporated herein by reference). |
| |
| 10.20 | | License Agreement, dated July 21, 2003, by and between the Registrant and AVE Galway Limited (filed as Exhibit 10.22 to the Registrant’s Registration Statement on Form S-1, as amended (File No. 333-132678), as originally filed on March 24, 2006, and incorporated herein by reference). |
| |
| 10.21 | | Termination Agreement, dated May 19, 2008, between the Registrant and Goodman Company, Ltd. (filed as Exhibit 10.2 to the Registrant’s Quarterly Report on Form 10-Q (File No. 000-52045), as originally filed on August 7, 2008, and incorporated herein by reference). |
| |
| 10.22† | | Supply and Distribution Agreement, dated March 16, 2006, between General Electric Medical Systems Scs and the Registrant (filed as Exhibit 10.28 to the Registrant’s Registration Statement on Form S-1, as amended (File No. 333-132678), as originally filed on March 24, 2006, and incorporated herein by reference). |
| |
| 10.23† | | Termination of Option to Distribute Agreement, dated January 27, 2006, by and between Medtronic Vascular, Inc. and the Registrant (filed as Exhibit 10.31 to the Registrant’s Registration Statement on Form S-1/A, as amended (File No. 333-132678), as originally filed on May 24, 2006, and incorporated herein by reference). |
| |
| 10.24* | | Software Development and License Agreement, dated May 10, 2006, by and between Paieon, Inc. and the Registrant (filed as Exhibit 10.32 to the Registrant’s Registration Statement on Form S-1/A, as amended (File No. 333-132678), as originally filed on May 24, 2006, and incorporated herein by reference). |
| |
| 10.25* | | Manufacturing Services Agreement, dated July 14, 2006, by and between Volcano Corporation and Endicott Interconnect Technologies, Inc. (filed as Exhibit 10.3 to the Registrant’s Quarterly Report on Form 10-Q (File No. 000-52045), as originally filed on August 9, 2006, and incorporated herein by reference). |
| |
| 10.26* | | Director Compensation Policy, as revised. |
| |
| 10.27* | | 2010 Executive Compensation (filed as Exhibit 10.1 to the Registrant’s Quarterly Report on Form 10-Q (File No. 000-52045), as originally filed on May 7, 2010, and incorporated herein by reference). |
| |
| 10.28 | | Sublease Agreement, dated February 12, 2009, by and between the Registrant and Fair Isaac Corporation (filed as Exhibit 10.2 to the Registrant’s Quarterly Report on Form 10-Q (File No. 000-52045), as originally filed on May 7, 2009, and incorporated herein by reference). |
| |
| 10.29 | | Distributor Termination Agreement, dated July 8, 2009, by and between Volcano Corporation, Volcano Japan Co., Ltd. and Goodman Company, Ltd. (filed as Exhibit 10.1 to the Registrant’s Current Report on Form 8-K (File No. 000-52045), as originally filed on July 8, 2009, and incorporated herein by reference). |
118
| | |
Exhibit
Number | | Description |
| |
| 10.30 | | Office Lease, dated December 28, 2009, by and between the Registrant and Kilroy Realty, L.P. (filed as Exhibit 10.26 to the Registrant’s Annual Report on Form 10-K (File No. 000-52045), as originally filed on March 5, 2010, and incorporated herein by reference). |
| |
| 10.31 | | Assignment and Assumption of Sublease, and Consent to Assignment and Assumption of Sublease, dated December 28, 2009, by and between the Registrant and Fair Isaac Corporation (filed as Exhibit 10.27 to the Registrant’s Annual Report on Form 10-K (File No. 000-52045), as originally filed on March 5, 2010, and incorporated herein by reference). |
| |
| 10.32 | | Trust, Land Purchase and Right of First Refusal Agreement by and among Volcarica, Socieded de Responsabilidad Limitada, Zona Franca Coyol, Sociedad Anonima and Banco Improsa, Sociedad Anonima, dated as of September 23, 2010 (filed as Exhibit 10.4 to the Registrant’s Current Report on Form 8-K (File No. 000-52045), as originally filed on September 29, 2010, and incorporated herein by reference). |
| |
| 10.33 | | Fixed Price Building Construction Agreement for Phase One by and between Volcarica, Socieded de Responsabilidad Limitada and Zona Franca Coyol, Sociedad Anonima, dated as of September 23, 2010 (filed as Exhibit 10.5 to the Registrant’s Current Report on Form 8-K (File No. 000-52045), as originally filed on September 29, 2010, and incorporated herein by reference). |
| |
| 10.34 | | Design, Architecture, Engineering and Construction Management Contract by and between Volcarica, Socieded de Responsabilidad Limitada and Zona Franca Coyol, Sociedad Anonima, dated as of September 23, 2010 (filed as Exhibit 10.6 to the Registrant’s Current Report on Form 8-K (File No. 000-52045), as originally filed on September 29, 2010, and incorporated herein by reference). |
| |
| 10.35 | | Base Call Option Transaction Confirmation, dated September 14, 2010, between Volcano Corporation and JPMorgan Chase Bank, National Association, London Branch (filed as Exhibit 10.4 to the Registrant’s Current Report on Form 8-K (File No. 000-52045), as originally filed on September 15, 2010, and incorporated herein by reference). |
| |
| 10.36 | | Base Warrants Confirmation, dated September 14, 2010, between Volcano Corporation and JPMorgan Chase Bank, National Association, London Branch (filed as Exhibit 10.5 to the Registrant’s Current Report on Form 8-K (File No. 000-52045), as originally filed on September 15, 2010, and incorporated herein by reference). |
| |
| 10.37 | | Additional Call Option Transaction Confirmation, dated September 16, 2010, between Volcano Corporation and JPMorgan Chase Bank, National Association, London Branch (filed as Exhibit 10.6 to the Registrant’s Current Report on Form 8-K (File No. 000-52045), as originally filed on September 20, 2010, and incorporated herein by reference). |
| |
| 10.38 | | Additional Warrants Confirmation, dated September 16, 2010, between Volcano Corporation and JPMorgan Chase Bank, National Association, London Branch (filed as Exhibit 10.7 to the Registrant’s Current Report on Form 8-K (File No. 000-52045), as originally filed on September 20, 2010, and incorporated herein by reference). |
| |
| 12.1 | | Ratio of earnings to fixed charges. |
| |
| 21.1 | | Subsidiaries of the Registrant. |
| |
| 23.1 | | Consent of Independent Registered Public Accounting Firm. |
| |
| 23.2 | | Consent of Independent Registered Public Accounting Firm. |
| |
| 24.1 | | Power of Attorney (See signature pages hereto). |
| |
| 31.1 | | Certification of the President & Chief Executive Officer pursuant to Rule 13a-14(a)/15d-14(a) of the Securities Exchange Act of 1934. |
119
| | |
Exhibit
Number | | Description |
| |
| 31.2 | | Certification of the Chief Financial Officer pursuant to Rule 13a-14(a)/15d-14(a) of the Securities Exchange Act of 1934. |
| |
| 32.1** | | Certification of the President & Chief Executive Officer pursuant to 18 U.S.C. Section 1350, as adopted pursuant to Section 906 of the Sarbanes-Oxley Act of 2002. |
| |
| 32.2** | | Certification of the Chief Financial Officer pursuant to 18 U.S.C. Section 1350, as adopted pursuant to Section 906 of the Sarbanes-Oxley Act of 2002. |
| |
| 101.INS*** | | XBRL Instance Document. |
| |
| 101.SCH*** | | XBRL Taxonomy Extension Schema Document. |
| |
| 101.CAL*** | | XBRL Taxonomy Extension Calculation Linkbase Document. |
| |
| 101.DEF*** | | XBRL Taxonomy Extension Definition Linkbase Document. |
| |
| 101.LAB*** | | XBRL Taxonomy Extension Label Linkbase Document. |
| |
| 101.PRE*** | | XBRL Taxonomy Extension Presentation Linkbase Document. |
| † | Portions of the exhibit have been omitted pursuant to a request for confidential treatment. The confidential portions have been filed with the SEC. |
| * | Management contract or compensatory plan or arrangement. |
| ** | The certifications attached as Exhibits 32.1 and 32.2 accompany this annual report on Form 10-K pursuant to 18 U.S.C. Section 1350, as adopted pursuant to Section 906 of the Sarbanes-Oxley Act of 2002, and shall not be deemed “filed” by the Registrant for purposes of Section 18 of the Securities Exchange Act of 1934, as amended. |
| *** | Pursuant to applicable securities laws and regulations, we are deemed to have complied with the reporting obligation relating to the submission of interactive data files in such exhibits and are not subject to liability under any anti-fraud provisions of the federal securities laws as long as we have made a good faith attempt to comply with the submission requirements and promptly amend the interactive data files after becoming aware that the interactive data files fail to comply with the submission requirements. Users of this data are advised that, pursuant to Rule 460T, these interactive data files are deemed not filed and otherwise are not subject to liability. |
120
SIGNATURES
Pursuant to the requirements of Section 13 or 15(d) of the Securities Exchange Act of 1934, the registrant has duly caused this report to be signed on its behalf by the undersigned, thereunto duly authorized, on this 29th day of February 2012.
| | |
| Volcano Corporation |
| |
| By: | | /s/ R. SCOTT HUENNEKENS |
| | | R. Scott Huennekens |
| | | President and Chief Executive Officer |
POWER OF ATTORNEY
KNOW ALL PERSONS BY THESE PRESENTS, that each person whose signature appears below constitutes and appoints R. Scott Huennekens and John T. Dahldorf, and each of them, as his true and lawful attorneys-in-fact and agents, with full power of substitution and resubstitution, for him and in his name, place, and stead, in any and all capacities, to sign any and all amendments to this report, and to file the same, with all exhibits thereto, and other documents in connection therewith, with the Securities and Exchange Commission, granting unto said attorneys-in-fact and agents, and each of them, full power and authority to do and perform each and every act and thing requisite and necessary to be done in connection therewith, as fully to all intents and purposes as he might or could do in person, hereby ratifying and confirming that all said attorneys-in-fact and agents, or any of them or their or his substitute or substitutes, may lawfully do or cause to be done by virtue hereof.
Pursuant to the requirements of the Securities Exchange Act of 1934, this report has been signed below by the following persons on behalf of the registrant and in the capacities and on the dates indicated:
| | | | |
Signature | | Title | | Date |
| | |
/s/ R. SCOTT HUENNEKENS R. Scott Huennekens | | President and Chief Executive Officer and Director (principal executive officer) | | February 29, 2012 |
| | |
/s/ JOHN T. DAHLDORF John T. Dahldorf | | Chief Financial Officer (principal financial officer and principal accounting officer) | | February 29, 2012 |
| | |
/s/ MICHAEL J. COYLE Michael J. Coyle | | Director | | February 29, 2012 |
| | |
/s/ KIERAN T. GALLAHUE Kieran T. Gallahue | | Director | | February 29, 2012 |
| | |
/s/ LESLEY H. HOWE Lesley H. Howe | | Director | | February 29, 2012 |
| | |
/s/ ALEXIS V. LUKIANOV Alexis V. Lukianov | | Director | | February 29, 2012 |
121
| | | | |
Signature | | Title | | Date |
| | |
/s/ RONALD A. MATRICARIA Ronald A. Matricaria | | Director | | February 29, 2012 |
| | |
/s/ JOHN ONOPCHENKO John Onopchenko | | Director | | February 29, 2012 |
| | |
/s/ ROY T. TANAKA Roy T. Tanaka | | Director | | February 29, 2012 |
| | |
/s/ Eric J. Topol Eric J. Topol | | Director | | February 29, 2012 |
| | |
/s/ Leslie V. Norwalk Leslie V. Norwalk | | Director | | February 29, 2012 |
122
EXHIBIT INDEX
| | |
Exhibit
Number | | Description |
| |
| 2.1 | | Asset Purchase Agreement, dated July 10, 2003, by and among Jomed Inc., Jomed N.V., Jomed GmbH, Jomed Benelux S.A. and the Registrant (filed as Exhibit 2.1 to the Registrant’s Registration Statement on Form S-1, as amended (File No. 333-132678), as originally filed on March 24, 2006, and incorporated herein by reference). |
| |
| 2.2† | | Asset Transfer Agreement, dated July 3, 2003, by and between Pacific Rim Medical Ventures Corp and Koninklijke Philips Electronics N.V. (filed as Exhibit 2.2 to the Registrant’s Registration Statement on Form S-1, as amended (File No. 333-132678), as originally filed on March 24, 2006, and incorporated herein by reference). |
| |
| 2.3 | | Agreement and Plan of Merger, dated December 7, 2007, by and among the Registrant, Corazon Acquisition, Inc., CardioSpectra, Inc. and Christopher E. Banas and Paul Castella, as the Shareholders’ Representatives (filed as Exhibit 2.1 to the Registrant’s Current Report on Form 8-K/A (File No. 000-52045), as originally filed on March 4, 2008, and incorporated herein by reference). |
| |
| 2.4 | | Agreement and Plan of Merger, dated as of May 14, 2008, by and among Volcano Corporation, Lava Merger, Inc., Novelis Inc. and Paul Magnin (filed as Exhibit 2.1 to the Registrant’s Current Report on Form 8-K (File No. 000-52045), as originally filed on May 19, 2008, and incorporated herein by reference). |
| |
| 2.5 | | Agreement and Plan of Merger, dated as of December 22, 2008, by and among Volcano Corporation, Hummingbird Merger, Inc., Axsun Technologies, Inc. and William Seifert (filed as Exhibit 2.5 to the Registrant’s Annual Report on Form 10-K (File No. 000-52045), as originally filed on March 10, 2009, and incorporated herein by reference). |
| |
| 3.1 | | Amended and Restated Certificate of Incorporation of the Registrant (filed as Exhibit 3.1 to the Registrant’s Quarterly Report on Form 10-Q (File No. 000-52045), as originally filed on August 9, 2006, and incorporated herein by reference). |
| |
| 3.2 | | Bylaws of the Registrant, as revised (filed as Exhibit 3.1 to the Registrant’s Current Report on Form 8-K (File No. 000-52045), as originally filed on May 4, 2011, and incorporated herein by reference). |
| |
| 3.3 | | Certificate of Designation of Series A Junior Participating Preferred Stock (filed as Exhibit 3.2 to the Registrant’s Quarterly Report on Form 10-Q (File No. 000-52045), as originally filed on August 9, 2006, and incorporated herein by reference). |
| |
| 4.1 | | Reference is made to Exhibits 3.1, 3.2 and 3.3. |
| |
| 4.2 | | Specimen Common Stock certificate of the Registrant (filed as Exhibit 4.1 to the Registrant’s Registration Statement on Form S-1/A, as amended (File No. 333-132678), as originally filed on May 24, 2006, and incorporated herein by reference). |
| |
| 4.3 | | Fourth Amended and Restated Investor Rights Agreement, dated February 18, 2005, by and among the Registrant and certain stockholders (filed as Exhibit 4.2 to the Registrant’s Registration Statement on Form S-1, as amended (File No. 333-132678), as originally filed on March 24, 2006, and incorporated herein by reference). |
| |
| 4.4 | | Rights Agreement, dated June 20, 2006, by and between the Registrant and American Stock Transfer & Trust Company (filed as Exhibit 4.1 to the Registrant’s Quarterly Report on Form 10-Q (File No. 000-52045), as originally filed on August 9, 2006, and incorporated herein by reference). |
| |
| 4.5 | | Indenture, dated September 20, 2010, by and between the Registrant and Wells Fargo Bank (filed as Exhibit 4.1 to the Registrant’s Current Report on Form 8-K (File No. 000-52045), as originally filed on September 20, 2010, and incorporated herein by reference). |
123
| | |
Exhibit
Number | | Description |
| |
| 4.6 | | Supplemental Indenture, dated September 20, 2010 by and between Registrant and Wells Fargo Bank, N.A. (filed as Exhibit 4.2 to the Registrant’s Current Report on Form 8-K (File No. 000-52045), as originally filed on September 20 2010, and incorporated herein by reference). |
| |
| 4.7 | | From of 2.875% Convertible Senior Notes due 2015 (filed as Exhibit 4.3 to the Registrant’s Current Report on Form 8-K (File No. 000-52045), as originally filed on September 20, 2010, and incorporated herein by reference). |
| |
| 10.1* | | Form of Indemnification Agreement for directors and executive officers (filed as Exhibit 10.1 to the Registrant’s Registration Statement on Form S-1, as amended (File No. 333-132678), as originally filed on March 24, 2006, and incorporated herein by reference). |
| |
| 10.2* | | 2000 Long Term Incentive Plan and forms of Stock Option Agreements thereunder (filed as Exhibit 10.2 to the Registrant’s Registration Statement on Form S-1/A, as amended (File No. 333-132678), as originally filed on May 5, 2006, and incorporated herein by reference). |
| |
| 10.3* | | Amended and Restated 2005 Equity Compensation Plan (filed as Exhibit 10.1 to the Registrant’s Quarterly Report on Form 10-Q (File No. 000-52045), as filed on August 8, 2011, and incorporated herein by reference). |
| |
| 10.3a* | | 2005 Equity Compensation Plan Forms of Stock Option Agreements and Stock Grant Agreement thereunder (forms filed as Exhibit 10.3 to the Registrant’s Registration Statement on Form S-1/A, as amended (File No. 333-132678), as originally filed on May 5, 2006, and incorporated herein by reference). |
| |
| 10.3b* | | 2005 Equity Compensation Plan Form of Grantee Restriction Agreement (filed as Exhibit 10.3a to the Registrant’s Annual Report on Form 10-K, as amended (File No. 000-52045), as originally filed on March 23, 2007, as amended, and incorporated herein by reference). |
| |
| 10.3c* | | Amended and Restated 2005 Equity Compensation Plan Form of Restricted Stock Unit Grant Notice and Form of Restricted Stock Unit Agreement (filed as Exhibit 10.2 to the Registrant’s Current Report on Form 8-K (File No. 000-52045), as originally filed on February 11, 2010, and incorporated herein by reference). |
| |
| 10.3d* | | Amended and Restated 2005 Equity Compensation Plan Form of Stock Option Agreement (filed as Exhibit 10.3 to the Registrant’s Current Report on Form 8-K (File No. 000-52045), as originally filed on February 11, 2010, and incorporated herein by reference). |
| |
| 10.3e* | | Form of Restricted Stock Unit Grant Notice and Form of Restricted Stock Unit Agreement with deferred delivery under the Volcano Corporation 2005 Equity Compensation Plan, as amended and restated (filed as Exhibit 10.2 to the Registrant’s Quarterly Report on Form 10-Q (File No. 000-52045), as originally filed on May 7, 2010, and incorporated herein by reference). |
| |
| 10.4* | | 2007 Employee Stock Purchase Plan (filed as Exhibit 99.2 to the Registrant’s Registration Statement on Form S-8 (File No. 333-145761), filed with the SEC on August 29, 2007, and incorporated herein by reference). |
| |
| 10.5† | | License Agreement by and between the Registrant and The Cleveland Clinic Foundation, dated April 30, 2002 (filed as Exhibit 10.15 to the Registrant’s Registration Statement on Form S-1, as amended (File No. 333-132678), as originally filed on March 24, 2006, and incorporated herein by reference). |
| |
| 10.6* | | Amended and Restated Employment Agreement by and between the Registrant and R. Scott Huennekens, dated February 28, 2008 (filed as Exhibit 10.1 to the Registrant’s Current Report on Form 8-K (File No. 000-52045), as originally filed on March 4, 2008, and incorporated herein by reference). |
| |
| 10.7* | | Employment Agreement by and between the Registrant and Jorge J. Quinoy, dated December 10, 2008 (filed as Exhibit 10.1 to the Registrant’s Current Report on Form 8-K (File No. 000-52045), as originally filed on December 12, 2008, and incorporated herein by reference). |
124
| | |
Exhibit
Number | | Description |
| |
| 10.8* | | Amended and Restated Employment Agreement by and between the Registrant and John T. Dahldorf, dated February 28, 2008 (filed as Exhibit 10.2 to the Registrant’s Current Report on Form 8-K (File No. 000-52045), as originally filed on March 4, 2008, and incorporated herein by reference). |
| |
| 10.9* | | 2010 Commission Plan between the Registrant and Jorge Quinoy (filed as Exhibit 10.9 to the Registrant’s Annual Report on Form 10-K (File No. 000-52045), as originally filed on March 1, 2011, and incorporated herein by reference). |
| |
| 10.10* | | 2011 Commission Plan between the Registrant and Jorge Quinoy (filed as Exhibit 10.4 to the Registrant’s Quarterly Report on Form 10-Q (File No. 000-52045), as originally filed on May 6, 2011, and incorporated herein by reference) . |
| |
| 10.11* | | Managing Director Agreement, dated March 20, 2006, by and between Volcano Europe NV and Michel Lussier (filed as Exhibit 10.30 to the Registrant’s Registration Statement on Form S-1, as amended (File No. 333-132678), as originally filed on March 24, 2006, and incorporated herein by reference). |
| |
| 10.12* | | Addendum to Managing Director Agreement, dated February 4, 2011, by and between Volcano Europe NV and Michel Lussier (filed as Exhibit 10.11 to the Registrant’s Annual Report on Form 10-K (File No. 000-52045), as originally filed on March 1, 2011, and incorporated herein by reference). |
| |
| 10.13* | | Employment Agreement, dated February 4, 2011, by and between the Registrant and Michel Lussier (filed as Exhibit 10.12 to the Registrant’s Annual Report on Form 10-K (File No. 000-52045), as originally filed on March 1, 2011, and incorporated herein by reference). |
| |
| 10.14* | | Employment Agreement, dated August 1, 2010, by and between the Registrant and Darin Lippoldt (filed as Exhibit 10.13 to the Registrant’s Annual Report on Form 10-K (File No. 000-52045), as originally filed on March 1, 2011, and incorporated herein by reference). |
| |
| 10.15* | | Employment Offer Letter, dated June 23, 2008, by and between the Registrant and David Sheehan (filed as Exhibit 10.14 to the Registrant’s Annual Report on Form 10-K (File No. 000-52045), as originally filed on March 1, 2011, and incorporated herein by reference). |
| |
| 10.16 | | Standard Multi-Tenant Office Lease—Gross, dated June 13, 2005, by and between Ethan Conrad and the Registrant, as amended (filed as Exhibit 10.18 to the Registrant’s Registration Statement on Form S-1, as amended (File No. 333-132678), as originally filed on March 24, 2006, and incorporated herein by reference). |
| |
| 10.17 | | Third Amendment to Standard Multi-Tenant Office Lease—Gross, dated June 13, 2005, by and between Ethan Conrad and the Registrant, dated December 24, 2008 (filed as Exhibit 10.18 to the Registrant’s Annual Report on Form 10-K (File No. 000-52045), as originally filed on March 1, 2011, and incorporated herein by reference). |
| |
| 10.18 | | Termination Agreement, dated September 22, 2010, by and among the Registrant, Volcano Japan Co., Ltd. and Fukuda Denshi Co., Ltd. (filed as Exhibit 10.18 to the Registrant’s Annual Report on Form 10-K (File No. 000-52045), as originally filed on March 1, 2011, and incorporated herein by reference). |
| |
| 10.19† | | Supply Agreement, dated July 21, 2003, by and between the Registrant and AVE Galway Limited (filed as Exhibit 10.21 to the Registrant’s Registration Statement on Form S-1, as amended (File No. 333-132678), as originally filed on March 24, 2006, and incorporated herein by reference). |
| |
| 10.20 | | License Agreement, dated July 21, 2003, by and between the Registrant and AVE Galway Limited (filed as Exhibit 10.22 to the Registrant’s Registration Statement on Form S-1, as amended (File No. 333-132678), as originally filed on March 24, 2006, and incorporated herein by reference). |
| |
| 10.21 | | Termination Agreement, dated May 19, 2008, between the Registrant and Goodman Company, Ltd. (filed as Exhibit 10.2 to the Registrant’s Quarterly Report on Form 10-Q (File No. 000-52045), as originally filed on August 7, 2008, and incorporated herein by reference). |
125
| | |
Exhibit
Number | | Description |
| |
| 10.22† | | Supply and Distribution Agreement, dated March 16, 2006, between General Electric Medical Systems Scs and the Registrant (filed as Exhibit 10.28 to the Registrant’s Registration Statement on Form S-1, as amended (File No. 333-132678), as originally filed on March 24, 2006, and incorporated herein by reference). |
| |
| 10.23† | | Termination of Option to Distribute Agreement, dated January 27, 2006, by and between Medtronic Vascular, Inc. and the Registrant (filed as Exhibit 10.31 to the Registrant’s Registration Statement on Form S-1/A, as amended (File No. 333-132678), as originally filed on May 24, 2006, and incorporated herein by reference). |
| |
| 10.24* | | Software Development and License Agreement, dated May 10, 2006, by and between Paieon, Inc. and the Registrant (filed as Exhibit 10.32 to the Registrant’s Registration Statement on Form S-1/A, as amended (File No. 333-132678), as originally filed on May 24, 2006, and incorporated herein by reference). |
| |
| 10.25* | | Manufacturing Services Agreement, dated July 14, 2006, by and between Volcano Corporation and Endicott Interconnect Technologies, Inc. (filed as Exhibit 10.3 to the Registrant’s Quarterly Report on Form 10-Q (File No. 000-52045), as originally filed on August 9, 2006, and incorporated herein by reference). |
| |
| 10.26* | | Director Compensation Policy, as revised. |
| |
| 10.27* | | 2010 Executive Compensation (filed as Exhibit 10.1 to the Registrant’s Quarterly Report on Form 10-Q (File No. 000-52045), as originally filed on May 7, 2010, and incorporated herein by reference). |
| |
| 10.28 | | Sublease Agreement, dated February 12, 2009, by and between the Registrant and Fair Isaac Corporation (filed as Exhibit 10.2 to the Registrant’s Quarterly Report on Form 10-Q (File No. 000-52045), as originally filed on May 7, 2009, and incorporated herein by reference). |
| |
| 10.29 | | Distributor Termination Agreement, dated July 8, 2009, by and between Volcano Corporation, Volcano Japan Co., Ltd. and Goodman Company, Ltd. (filed as Exhibit 10.1 to the Registrant’s Current Report on Form 8-K (File No. 000-52045), as originally filed on July 8, 2009, and incorporated herein by reference). |
| |
| 10.30 | | Office Lease, dated December 28, 2009, by and between the Registrant and Kilroy Realty, L.P. (filed as Exhibit 10.26 to the Registrant’s Annual Report on Form 10-K (File No. 000-52045), as originally filed on March 5, 2010, and incorporated herein by reference). |
| |
| 10.31 | | Assignment and Assumption of Sublease, and Consent to Assignment and Assumption of Sublease, dated December 28, 2009, by and between the Registrant and Fair Isaac Corporation (filed as Exhibit 10.27 to the Registrant’s Annual Report on Form 10-K (File No. 000-52045), as originally filed on March 5, 2010, and incorporated herein by reference). |
| |
| 10.32 | | Trust, Land Purchase and Right of First Refusal Agreement by and among Volcarica, Socieded de Responsabilidad Limitada, Zona Franca Coyol, Sociedad Anonima and Banco Improsa, Sociedad Anonima, dated as of September 23, 2010 (filed as Exhibit 10.4 to the Registrant’s Current Report on Form 8-K (File No. 000-52045), as originally filed on September 29, 2010, and incorporated herein by reference). |
| |
| 10.33 | | Fixed Price Building Construction Agreement for Phase One by and between Volcarica, Socieded de Responsabilidad Limitada and Zona Franca Coyol, Sociedad Anonima, dated as of September 23, 2010 (filed as Exhibit 10.5 to the Registrant’s Current Report on Form 8-K (File No. 000-52045), as originally filed on September 29, 2010, and incorporated herein by reference). |
126
| | |
Exhibit
Number | | Description |
| |
| 10.34 | | Design, Architecture, Engineering and Construction Management Contract by and between Volcarica, Socieded de Responsabilidad Limitada and Zona Franca Coyol, Sociedad Anonima, dated as of September 23, 2010 (filed as Exhibit 10.6 to the Registrant’s Current Report on Form 8-K (File No. 000-52045), as originally filed on September 29, 2010, and incorporated herein by reference). |
| |
| 10.35 | | Base Call Option Transaction Confirmation, dated September 14, 2010, between Volcano Corporation and JPMorgan Chase Bank, National Association, London Branch (filed as Exhibit 10.4 to the Registrant’s Current Report on Form 8-K (File No. 000-52045), as originally filed on September 15, 2010, and incorporated herein by reference). |
| |
| 10.36 | | Base Warrants Confirmation, dated September 14, 2010, between Volcano Corporation and JPMorgan Chase Bank, National Association, London Branch (filed as Exhibit 10.5 to the Registrant’s Current Report on Form 8-K (File No. 000-52045), as originally filed on September 15, 2010, and incorporated herein by reference). |
| |
| 10.37 | | Additional Call Option Transaction Confirmation, dated September 16, 2010, between Volcano Corporation and JPMorgan Chase Bank, National Association, London Branch (filed as Exhibit 10.6 to the Registrant’s Current Report on Form 8-K (File No. 000-52045), as originally filed on September 20, 2010, and incorporated herein by reference). |
| |
| 10.38 | | Additional Warrants Confirmation, dated September 16, 2010, between Volcano Corporation and JPMorgan Chase Bank, National Association, London Branch (filed as Exhibit 10.7 to the Registrant’s Current Report on Form 8-K (File No. 000-52045), as originally filed on September 20, 2010, and incorporated herein by reference). |
| |
| 12.1 | | Ratio of earnings to fixed charges. |
| |
| 21.1 | | Subsidiaries of the Registrant. |
| |
| 23.1 | | Consent of Independent Registered Public Accounting Firm. |
| |
| 23.2 | | Consent of Independent Registered Public Accounting Firm. |
| |
| 24.1 | | Power of Attorney (See signature pages hereto). |
| |
| 31.1 | | Certification of the President & Chief Executive Officer pursuant to Rule 13a-14(a)/15d-14(a) of the Securities Exchange Act of 1934. |
| |
| 31.2 | | Certification of the Chief Financial Officer pursuant to Rule 13a-14(a)/15d-14(a) of the Securities Exchange Act of 1934. |
| |
| 32.1** | | Certification of the President & Chief Executive Officer pursuant to 18 U.S.C. Section 1350, as adopted pursuant to Section 906 of the Sarbanes-Oxley Act of 2002. |
| |
| 32.2** | | Certification of the Chief Financial Officer pursuant to 18 U.S.C. Section 1350, as adopted pursuant to Section 906 of the Sarbanes-Oxley Act of 2002. |
127
| | |
Exhibit
Number | | Description |
| |
| 101.INS*** | | XBRL Instance Document. |
| |
| 101.SCH*** | | XBRL Taxonomy Extension Schema Document. |
| |
| 101.CAL*** | | XBRL Taxonomy Extension Calculation Linkbase Document. |
| |
| 101.DEF*** | | XBRL Taxonomy Extension Definition Linkbase Document. |
| |
| 101.LAB*** | | XBRL Taxonomy Extension Label Linkbase Document. |
| |
| 101.PRE*** | | XBRL Taxonomy Extension Presentation Linkbase Document. |
| | † | Portions of the exhibit have been omitted pursuant to a request for confidential treatment. The confidential portions have been filed with the SEC. |
| | * | Management contract or compensatory plan or arrangement. |
| | ** | The certifications attached as Exhibits 32.1 and 32.2 accompany this annual report on Form 10-K pursuant to 18 U.S.C. Section 1350, as adopted pursuant to Section 906 of the Sarbanes-Oxley Act of 2002, and shall not be deemed “filed” by the Registrant for purposes of Section 18 of the Securities Exchange Act of 1934, as amended. |
| | *** | Pursuant to applicable securities laws and regulations, we are deemed to have complied with the reporting obligation relating to the submission of interactive data files in such exhibits and are not subject to liability under any anti-fraud provisions of the federal securities laws as long as we have made a good faith attempt to comply with the submission requirements and promptly amend the interactive data files after becoming aware that the interactive data files fail to comply with the submission requirements. Users of this data are advised that, pursuant to Rule 460T, these interactive data files are deemed not filed and otherwise are not subject to liability. |
128