Filed by Liberty Media Corporation
Pursuant to Rule 425 under the Securities Act of 1933
and deemed filed pursuant to Rule 14a-6 of the Securities Exchange Act of 1934
Subject Company: Liberty Media Corporation
Commission File No.: 000 - 51990
| Liberty Media Investor Meeting 9.26.2008
|
| Today’s Agenda 9:00 - 9:05 Good Morning Courtnee Ulrich 9:05 - 9:25 Liberty Media Greg Maffei Liberty Entertainment 9:25 – 9:55 DIRECTV Chase Carey 9:55 – 10:10 Liberty Sports Group Mark Shuken 10:10-10:40 Starz/Overture Films Bob Clasen 10:40-10:50 �� Liberty Capital Greg Maffei 10:50-11:00 Break 11:00 – 11:10 Liberty Interactive Greg Maffei 11:10 – 11:40 QVC Michael George 11:40 – 12:15 e-commerce Courtnee Ulrich Panel Discussion Ryan DeLuca Dan Haight Jim Holland 12:15 – 1:00 Conclusion and Q&A John Malone Greg Maffei
|
| Innovate, Execute, Grow Gregory B. Maffei President and CEO
|
| Since we met last September… Completed swap: NWS for DTV and RSNs · Bought 7% more of DTV Introduced Liberty Entertainment tracking stock Announced split-off of Liberty Entertainment Repurchased 14% of LCAPA in response to market conditions Completed three attractive e-commerce acquisitions at Liberty Interactive
|
| Liberty Performance Liberty has outperformed its peers since the initial tracker issuance
|
| What We Do Well 1. Innovate, especially financially 2. Manage our portfolio of businesses 3. Empower operating managers
|
| Financial Innovation Liberty Entertainment · NWS swap – value accretion and increased asset basis · DTV collar and 78.3m share purchase · Encouraged DTV buyback and completed voting standstill Liberty Capital · Share buybacks - reduced outstanding shares by 14% · Tax-efficient transactions, e.g., §355 swaps · Timely transactions - shorts, exchangeable debt, Sprint derivative · Arranged debt facility for mezzanine investments Liberty Interactive · Arranged credit capacity in better times
|
| Swap / Transaction History News Corp – up $6.5b since deal announcement · NWS down >42%, DTV+3.5% Time Warner - swapped 68.5m TWX shares at ~$21 vs. current $13.96 · Up ~$800m on trade and tax benefits CBS - swapped 7.6m CBS shares tax-free at $30.82 v. current $14.72 OnCommand - sold OnCommand for $380m · $332m in cash and hedged LNET position with puts at $30.88/share vs. current $2.67 OpenTV - sold 39.4m OPTV shares at $2.98 vs. current $1.49 IDT - Swapped 17.2m IDT shares at ~$13.50 vs. current $0.70
|
| Be Safe Protect our downside · Financial innovation limits our equity and other exposure Ensure liquidity · For operations, debt maturities, and opportunities Manage exposure · Counterparty exposure limited to high quality names Corporate cash in AAA and Treasury funds · Not perfect: some risk in money market funds
|
| Manage Our Portfolio Allocate capital · Invest in attractive opportunities · Divest unattractive and non-core businesses and assets tax-efficiently Encourage efficiencies and synergy · Consolidate overlapping costs, especially overhead · Incent managers to work together Create options · Preserve structural flexibility Construct investor choice · “Purer plays” through trackers and spins |
| Empower Our Managers Part of Liberty’s appeal is (relative) autonomy Encourage CEOs and management teams to work together · Financial incentives · CEO council · Marketing summit, marketing wiki · Strategic purchasing initiative Offer platforms for learning that require Liberty’s scale · NetLeaders Forum Share best practices · e-commerce companies provide Internet DNA to QVC Provide capital, deal expertise and financial sophistication
|
| Objectives and Strategy Liberty Entertainment · Complete split-off, reduce discount to SOP · Explore DTV options · Consider content and distribution investments Liberty Capital · Rationalize assets tax-efficiently · Deploy cash derived from tax shield · Repurchase stock opportunistically with excess capital Liberty Interactive · Improve operating results at QVC · Expand QVC’s footprint: international, internet, other platforms · Acquire additional attractive e-commerce businesses · Expand liquidity and rationalize passive stakes
|
| Chase Carey President & CEO
|
| The DIRECTV Group Cautionary Statement This presentation includes certain statements that may be considered to be, “forward-looking statements” within the meaning of the Private Securities Litigation Reform Act of 1995 (“PSLRA”). These forward-looking statements generally can be identified by words such as “believe,” “expect,” “estimate,” “anticipate,” “intend,” “plan,” “foresee,” “project” or other similar words or phrases. Similarly, statements that describe our objectives, plans or goals also are forward-looking statements. All of these forward- looking statements are subject to certain risks and uncertainties that could cause actual results to differ materially from historical results or from those expressed or implied by the relevant forward-looking statement. Such risks and uncertainties include, but are not limited to: economic conditions; product demand and market acceptance; ability to improve customer service or create new and desirable programming content and interactive features; government action; political, economic and social uncertainties in many Latin American countries in which DTVLA operates; foreign currency exchange rates; competition; the outcome of legal proceedings; ability to achieve cost reductions; ability to renew programming contracts under favorable terms; technological risk; limitations on access to distribution channels reliance on satellites as a significant part of our infrastructure and we may face other risks described from time to time in periodic reports filed by us with the SEC. Non-GAAP Financials This presentation includes financial measures that are not determined in accordance with GAAP, such as Operating Profit before Depreciation and Amortization, Free Cash Flow and Cash Flow before Interest and Taxes. These financial measures should be used in conjunction with other GAAP financial measures and are not presented as an alternative measure of operating results, as determined in accordance with GAAP. DIRECTV management uses these measures to evaluate the profitability of DIRECTV U.S.’ subscriber base for the purpose of allocating resources to discretionary activities such as adding new subscribers, upgrading and retaining existing subscribers and for capital expenditures. A reconciliation of these measures to the nearest GAAP measure is posted on our website and is included at the end of this presentation package.
|
| Goal: Deliver The Best TV Experience Through Leadership In: Content Technology Service
|
| Financial Objectives Solid Top Line Growth Increasing Margins Strong Cash Flow Growth
|
| Strong First Half Results The DIRECTV Group $M except OPBDA Margin 1H 2007 1H 2008 Change Revenue 8,043 9,398 17% Operating Profit Before D&A (OPBDA) 2,063 2,539 23% OPBDA Margin 25.6% 27.0% 137 Bps Cash Flow Before Interest & Taxes 653 1,335 104% Free Cash Flow 510 917 80%
|
| High Quality Subscriber Growth Net Subscriber Full Year Full Year First Half Additions (K) 2006 2007 2008 DIRECTV U.S. 820 878 404 Dish Network 1,065 675 10 Cable 163 (520) (270) Verizon FiOS 205 742 439 AT&T U-Verse 3 228 318 Total Pay TV Market 2,256 2,003 900 |
| Unique Marketing Strengths |
| Direct Sales Expansion Direct Sales as a % of Total Gross Additions ~50% 42% 34% 25% 2005 2006 2007 2008E |
| Target Opportunistically Weak Cable Market Disruptions Unique Content Advantages · HD · Sports
|
| Build Key Niches Commercial MDU Ethnic Rural
|
| Manage Churn DIRECTV U.S. Average Monthly Churn 1.70% 1.60% 1.51% 1.42% .71% .57% .52% .40% .99% 1.03% .99% 1.02% Full Year Full Year Full Year First Half 2005 2006 2007 2008 Involuntary Voluntary |
| Tighter Credit Policies/Key Customer Terms Dealer Compensation Implemented Realigned 1 and 2 Year Raised Commitments Minimum Upfront Fee Credit Score Required for High Risk Subs 2005 Upfront Fee Increased for High Risk Subs Enhanced Fraud Protection System Minimum Commitment Period Increased to 18 months Credit Cards Required Increased Focus on Collecting Social Security Numbers 2008 Stricter Credit Policies
|
| Customer Segmentation 38% of Customers Drive 63% of Profits TIER 5 15% Customers 34% Profit TIER 4 23% Customers 29% Profit Demographics Index 120 Men 35+ 125 Married 121 Homeowner Income >$70K 130 145 College/Grad School
|
| Communication / Loyalty
|
| ARPU Growth DIRECTV U.S. Full Year Full Year Full Year First Half 2005 2006 2007 2008 Packages / Premiums / $55.70 $58.50 $60.30 $59.70 Sports / PPV Advanced Services / Equipment / 8.90 9.70 12.20 13.60 Lease Fees Other / Ad Sales 5.00 5.50 6.60 7.50 Total ARPU $69.61 $73.74 $79.05 $80.79 Year-over-Year ARPU 4.0% 5.9% 7.2% 7.8% Growth
|
| Advanced Product Leadership Total HD and/or DVR Subscribers 41% 30% 21% 13% 6.6M 4.6M 3.0M 2.0M Penetration of Total Subscribers Cumulative Advanced Subscribers 2004 2005 2006 2007
|
| Focus on Quality Subscribers DIRECTV U.S. Gross Additions’ Mix 28% 15% 8% 7% Higher Risk 72% 85% 92% 93% Lower Risk Full Year Full Year Full Year First Half 2005 2006 2007 2008 |
| DIRECTV on Demand |
| Advertising Opportunities Interactive Telescoping Local Advertising DVR Insertion Audience Measurement
|
| Content Leadership |
| HD Advantage Based on August survey of websites *Excludes Games-only Regional Sports Networks and VOD National HD Premiums Local 130* 75* 32 24 DIRECTV DISH Comcast Time Warn Los Angeles Denver Philadelphia Los Angeles |
| Sports Leadership |
| Original / Unique Programming |
| Interactive / Enhanced Services |
| User Interface |
| Technology and Engineering Improve Reliability Upgradeable Add Functionality Next Gen/Whole Home Experience |
| Ultimate Customer Experience |
| Optimize Quality and Efficiencies Simplify and Standardize Technology Advancements · Home Installation · Wireless Handheld · New Diagnostic Tools Increased Self-Care · Web · IVR |
| Owned and Operated Network Best Practices Accurate Metrics Flexibility and Speed % of Network States Served Volume 180 Connect ~20% California, Oregon, Washington, Idaho, Montana, Wyoming, Colorado, Utah, Arkansas, New Jersey, Pennsylvania, Virginia Premier ~10% Oklahoma, Missouri, Nebraska, Iowa, N. Dakota, S. Dakota, Minnesota, Wisconsin Bruister ~5% Mississippi, Alabama, Georgia, Tennessee, Florida, Louisiana Total ~35% |
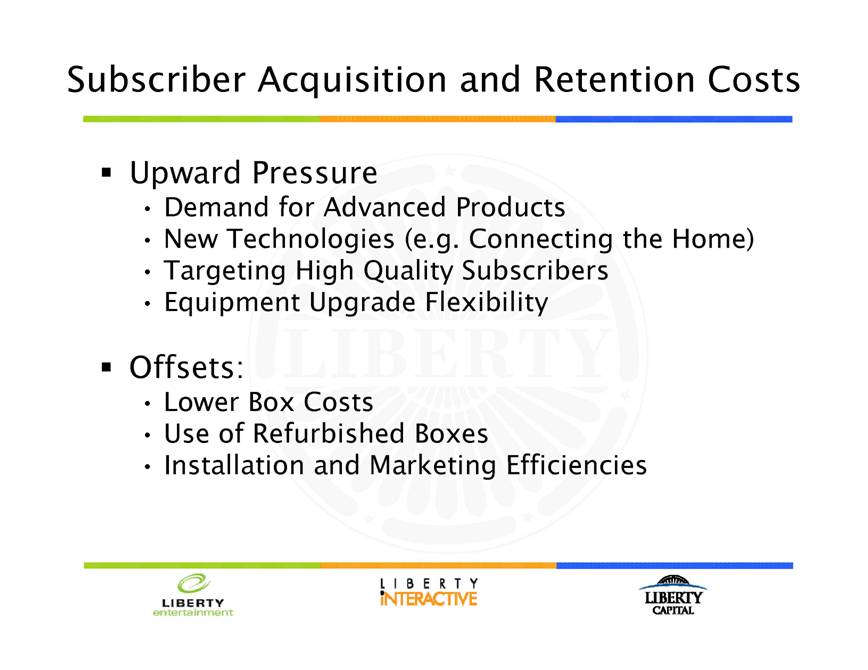
| Subscriber Acquisition and Retention Costs Upward Pressure · Demand for Advanced Products · New Technologies (e.g. Connecting the Home) · Targeting High Quality Subscribers · Equipment Upgrade Flexibility Offsets: · Lower Box Costs · Use of Refurbished Boxes · Installation and Marketing Efficiencies |
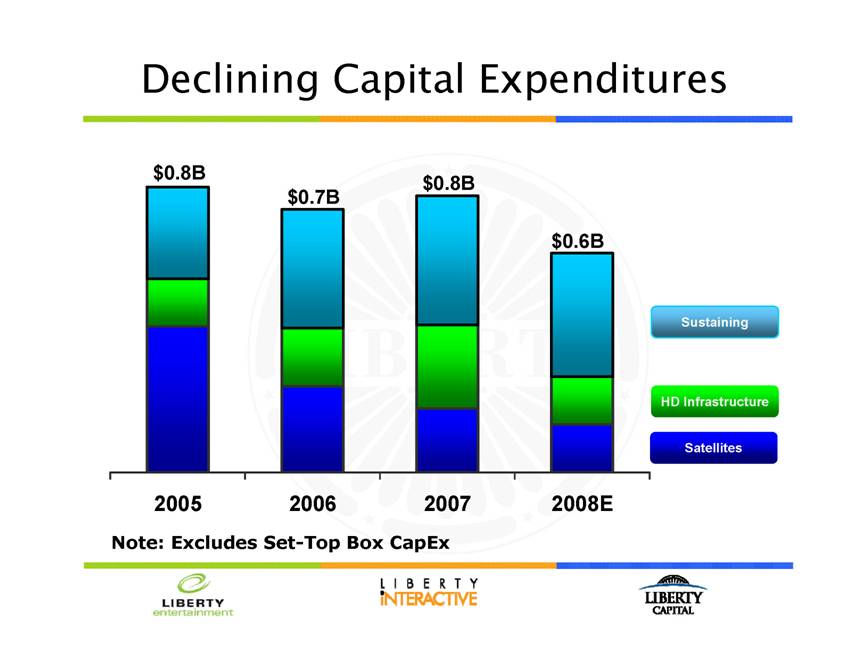
| Declining Capital Expenditures $0.8B $0.7B $0.8B $0.6B Sustaining HD Infrastructure Satellites 2005 2006 2007 2008E Note: Excludes Set-Top Box CapEx |
| DIRECTV U.S. 3 Year Outlook Revenues of $20B in 2010 · 1.5M – 2M New Subscribers Additions (cum) · ARPU Growth of 5%+ OPBDA Margin Approaches 30% Cash Flow Before Interest and Taxes of ~$4B in 2010 ~40% CAGR from 2007 |
| DIRECTV Latin America 4th Largest Pay-TV Provider Outside the U.S. with 5.5M Sub scribers Sky Mexico 1.7M Subscribers 59% Televisa 41% DIRECTV PanAmericana 2.1M Subscribers 100% DIRECTV
Sky Brazil 1.7M Subscribers 74% DIRECTV 26% Globo
|
| Latin America Market Overview Large TV Market with Low Pay-TV Penetration · Brazil – 11%; Mexico – 28%; PanAmericana – 36% Competitive Landscape: · Cable is Main Competitor · Digital Roll-Out Only in Major Urban Markets · Bundle Product Offers Increasing: Telmex, Telefonica Low Penetration of Advanced Products |
| DIRECTV Latin American Strategy Adapt DIRECTV U.S. roadmap to Latin America Content and Technology Leadership Customer Service Superiority Multi-Box and DVR Expansion Introduce HD and Secure Leadership Position Expand Pre-Paid Offer into New Countries |
| DIRECTV Latin America 2006 2007 2008E Cumulative Subscribers 2,711K 3,279K ~4,000K Revenue $1,013M $1,719M ~$2,200M+ Operating Profit Before Depreciation $244M $394M ~$625+M and Amortization (OPBDA) OPBDA Margin 24% 23% 28% Cash Flow Before Interest & Taxes $0M $140M ~$250M Note: Excludes Mexico |
| Conclusions DIRECTV U.S. • Meeting or Exceeding Operating Targets • Generating Substantial Cash Flow Growth DIRECTV Latin America • Momentum Building • Tremendous Upside for Value Creation Strong Balance Sheet • Remains Underleveraged • $6.5B in Buybacks Over Past 2.5 Years • Half Remaining on Current $3B Program |
|
|
| Non-GAAP Financial Reconciliations (Unaudited) The DIRECTV Group Reconciliation of Operating Profit Before Depreciation and Amortization to Operating Profit Six Months Ended June 30, 2008 2007 (Dollars in Millions) Operating Profit Before Depreciation and Amortization $2,539 $2,063 Subtract: Depreciation and amortization expense 1,081 760 Operating Profit $1,458 $1,303 Revenue $9,398 $8,043 OPBDA Margin 27.0% 25.6%
The DIRECTV Group Reconciliation of Cash Flow Before Interest and Taxes and Free Cash Flow to Net Cash Provided by Operating Activities Six Months Ended June 30, 2008 2007 (Dollars in Millions) Cash Flow Before Interest and Taxes $1,335 $653 Adjustments: Cash paid for interest (124) (113) Interest income 37 71 Interest income 37 71 Income taxes paid (331) (101) Subtotal - Free Cash Flow 917 510 Add Cash Paid For: Property and equipment 959 1,234 Satellites 77 112 Net Cash Provided by Operating Activities $1,953 $1,856 Reconciliation of Operating Profit Before Depreciation and Amortization to Operating Profit Twelve Months Ended December 31, 2008 Outlook 2007 2006 (Dollars in Millions) Operating Profit Before Depreciation and Amortization ~625+ $394 $244 Subtract: Depreciation and amortization expense ~225+ 235 165 Operating Profit ~$400 $159 $79 Revenue ~$2,200 $1,719 $1,013 OPBDA Margin ~28% 22.9% 24.1% DIRECTV Latin America Reconciliation of Cash Flow Before Interest and Taxes and Free Cash Flow to Net Cash Provided by Operating Activities Twelve Months Ended December 31, 2008 Outlook 2007 2006 (Dollars in Millions) Cash Flow Before Interest and Taxes ~$250 $140 $0 Adjustments: Cash paid for interest (27) (12) Interest income 18 16 Income taxes paid* ~(100) (51) (14) Add Cash Paid For: Property and equipment ~450 336 175 Net Cash Provided by Operating Activities ~$600 $416 $165 *Outlook data combines interest received, interest paid and income taxes paid under income taxes paid
|
| Mark Shuken President & CEO
|
| LSG Overview 3 Regional Sports Networks (RSNs) · FSN Northwest · FSN Rocky Mountain · FSN Pittsburgh Acquired from News Corp (Feb. 28, 2008) Keys: · Exclusive media rights · Affiliate distribution & fees · LMC synergies and growth strategies |
| Exclusive Relationships MLB (Mariners, Rockies, Pirates) NBA (Jazz) NFL (Seahawks, Broncos, Steelers) NHL (Penguins) College (Washington, Washington State, Oregon State, Colorado, Pitt, Gonzaga) Conferences (PAC-10, Big 12, ACC, SEC) |
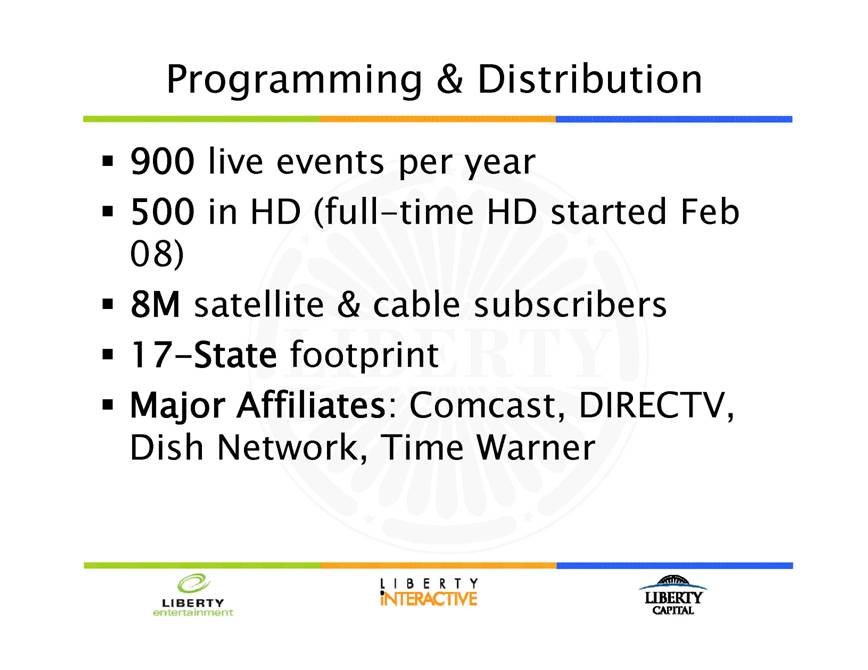
| Programming & Distribution 900 live events per year 500 in HD (full-time HD started Feb 08) 8M satellite & cable subscribers 17-State footprint Major Affiliates: Comcast, DIRECTV, Dish Network, Time Warner |
| Business Model Advantages Proprietary, top-tier content Long-term strategic, revenue and cost certainty Multimedia rights and interactive future Advertising and sponsorship: core vs. DVR Operational agility, innovation and flexibility Accretive value in acquisitions |
| Financial Metrics Revenue mix: · 80% affiliate fees · 20% advertising & sponsorship 2008 EBITDA target margin- 15% |
| Growth Opportunities Core: increase earnings & asset value Expand portfolio vertically & horizontally Integrate LMC levers for mutual benefit Enhance DIRECTV brand, content & value Multimedia, interactive, digital strategies RSN synergies and best practices |
| Benefits from Liberty Aggressive, growth-oriented mandates Creative acquisition/deal structures DIRECTV: sports as driver Liberty Entertainment relationship Team, league, international relationships Financial expertise and partnerships |
| Bob Clasen CEO 2007: The New Starz, Controlling our Own Destiny 2008: Executing on the Plan
|
| Starz, LLC
|
|
|
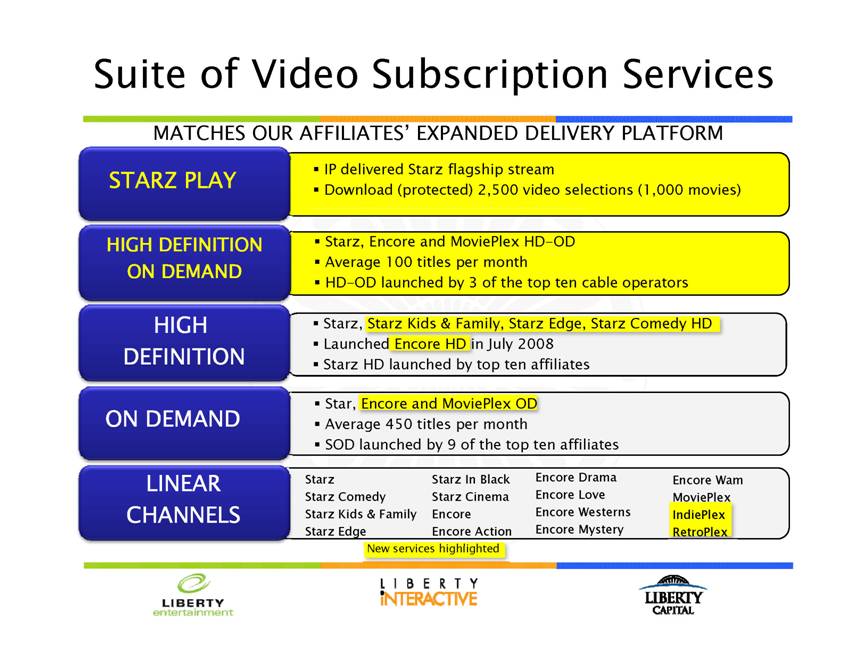
| Suite of Video Subscription Services MATCHES OUR AFFILIATES’ EXPANDED DELIVERY PLATFORM STARZ PLAY HIGH DEFINITION ON DEMAND HIGH DEFINITION IP delivered Starz flagship stream Download (protected) 2,500 video selections (1,000 movies) Starz, Encore and MoviePlex HD-OD Average 100 titles per month HD-OD launched by 3 of the top ten cable operators Starz, Starz Kids & Family, Starz Edge, Starz Comedy HD Launched Encore HD in July 2008 Starz HD launched by top ten affiliates ON DEMAND LINEAR CHANNELS Star, Encore and MoviePlex OD Average 450 titles per month SOD launched by 9 of the top ten affiliates Starz Starz In Black Encore Drama Encore Love Starz Comedy Starz Cinema Encore Westerns Starz Kids & Family Encore Encore Mystery Starz Edge Encore Action Encore Wam MoviePlex IndiePlex RetroPlex New services highlighted
|
| Starz Leads in On-Demand Among 300 different on-demand services, Starz networks occupy three of the top five slots in terms of number of minutes % Platform Minutes 25% 20% 15% 10% 5% 0% +300 more… Top 10 Providers (4 genres) account for 60% of platform minutes used and almost 50% of orders SOD, MOD and EOD are Top 10 Networks based on platform minutes and orders SOURCE: Data provided by affiliate and Rentrak On Demand Essentials Competitive Performance Report, Total Play Time (minutes), Jan-June 2008
|
| More Customers 18 17 32 31.3 30.7 (Millions) 17 16.3 16.1 16 15.5 15.1 15 14 Q2 '06 Q4 '06 Q2 '07 Q4 '07 Q2 '08 (Millions) 30 28 27.3 27.1 26 24 28.4 Q2 '06 Q4 '06 Q2 '07 Q4 '07 Q2 '08 Subscriber information derived from Starz estimates
|
| Starz Originals Head Case Therapist Dr. Elizabeth Goode is an unconventional “it therapist” to Hollywood’s celebrity elite Martin Lawrence Presents: 1st Amendment Stand-up Stand-up Comedy show, Executive Produced by Martin Lawrence and hosted by Doug Williams Crash TV adaptation of award-winning motion picture “Crash” has a star studded production team onboard for the series · Paul Haggis – Crash, Million Dollar Baby, Casino Royale, The Black Donnelly’s · Bobby Moresco – Crash, Million Dollar Baby, The Black Donnelly’s · Don Cheadle –Crash, Hotel Rwanda Traitor · Tom Nunan – Crash, The Illusionist · Glen Mazzara – The Shield, Life |
| Starz Ratings #1 or tied for#1 among premium pay flagships in 11 of the first 26 weeks of 2008 Never before ranked first in the weekly ratings SOURCE: Nielsen Galaxy Explorer Live HH coverage area Total Day ratings, December 31, 2007-June 29, 2008. Subject to qualifications available on request.
|
| Revenue Up Revenue ($Millions) $550 $540 $530 $548 $523 $520 $519 $510 $500 1H '06 1H '07 1H '08 |
| Costs Down Programming costs continue to moderate $360 $359 $340 ($Millions) $320 $319 $312 $300 $280 1H '06 1H '07 1H '08 |
| Income Up Adjusted OIBDA
($ $Millions)
$160 $140 $120
$142 $128 $100 $91 $80 $60 1H '06 1H '07 1H '08 |
|
|
| Overture Films Production and theatrical distribution of creatively compelling motion pictures: · Release 8-12 films per year · Recognizable star-power · Production budgets average $15-20m · DVD distribution through Anchor Bay Entertainment · On-air distribution through Starz and Encore networks Provides Starz networks with access to talent, new promotional opportunities and exclusive content Released six theatrical films to date: Mad Money, Sleepwalking, The Visitor, Henry Poole is Here, Traitor and Righteous Kill · The Visitor rated “indie success of the summer” by Hollywood Reporter, ranked in top 15 films nearly every week during its run · Righteous Kill scored the highest opening weekend box office of any of our films to date, garnering $16.3m |
| Anchor Bay Entertainment Transformed company from focus on catalog and genre to higher quality, first-run motion pictures Mad Money was the biggest selling new theatrical release the day it streeted on DVD, will generate about $50m in gross revenue over 10 year ultimate More limited theatricals followed by DVD release. This month Surfer, Dude, with Matthew McConaughey, Willie Nelson and Woody Harrelson Wow! Wow! Wubbzy! hit on Nick Jr. and Noggin, produced by Film Roman, released on DVD this month |
|
STARZ PLAY PPV, VOD, SVOD & EST/DTO BROADBAND CHANNELS DIGITAL CONTENT DEVELOPMENT & DISTRIBUTION DIGITAL MARKETING & PROMOTION
· IP delivered Starz flagship stream · Download (protected) 2,500 video selections (1,000 movies) · 10+ partnerships exploiting 500+ title owned content library from Overture and Starz · Satellite/cable/telco PPV/VOD is largest driver · Internet partners · Ad supported, video centric websites built around owned content and brands · Existing channels: Manga.com (anime) and StarzBunnies.com (animated comedy shorts) · Channels/Sites in development … Animation Site, Horror Site, Movie-Fan Site · Development, syndication and licensing of content developed specifically for online/wireless platforms (e.g. 30-Second Bunnies Theatre, Manga Minutes Podcast) · Development/distribution of online games from existing IP (e.g. Righteous Kill: The Game) · Websites supporting our brands (starz.com, overturefilms.net) and individual properties · Video and other content syndication relationships with various internet and wireless partners including You Tube, MySpace, AOL, MSN, Yahoo, Heavy, Sling, and iMeem among others
|
| Space Chimps, co-produced with Vanguard and released by Fox, generated about $30m at box office Film Roman: 20th season of The Simpsons, 13th of King of the Hill. The Goode Family for ABC, Deadspace prequel to EA game: and three Marvel projects Toronto Studio: Three CGI films in production for other studios
|
| Managed in three divisions – television, theatrical animation Centralized acquisitions - building a library of content with all rights Coordinated marketing & promotion Unified TV production for Starz Entertainment, Anchor Bay & third parties Coordinated support functions - HR, finance, IT, legal |
| Example: Mad Money Cost: $6m domestic rights acquisition plus $27m P&A $22m box office gross $50m home video gross Pay-Per-View/VOD – Starz Entertainment affiliates Pay TV fees from Starz channels Sold to basic cable by Starz TV syndication team Digital distribution via Starz Play, third party Internet outlets LONG TERM RIGHTS FOR ALL PLATFORMS
|
| Public assets: Time Warner $1.3 Sprint 0.5 Other & derivatives 2.7 Public asset market value $4.5 Private assets: (analyst consensus) Atlanta Braves $0.5 Starz Media 0.4 TruePosition 0.3 Other 0.6 Private asset market value $1.8 Net debt (2.2) LCAPA equity value (NAV) $4.1 Current LCAPA market value $1.5 Valuation Gap $2.6 % discount (pre-tax) 63.0%
|
| Liberty Capital Action Plan Rationalize non-core assets tax efficiently •Convert to cash and attractive assets Reinvest in businesses • growth Reduce discount C h hh h •Capture through share repurchase |
| Strategic acquisitions · Bodybuilding.com · Red Envelope · Celebrate Express · QVC brand acquisitions Growth strategies · Differentiate product and service offerings · Build brand awareness · Enhance QVC.com, e.g., online community · Expand internationally · Leverage best practices across portfolio · Exploit new sales and marketing channels
|
| QVC US vs. HSN Rev Growth 2005-08E QVC US HSN 12% 9% Adjusted OIBDA Growth 2005-08E 16% -50% Adjusted OIBDA Margin 2005 23% 17% Adjusted OIBDA Margin 2008E 24% 8% QVC has steadily grown revenue · Maintained consistent and high adjusted OIBDA margins HSN estimated 2008 adjusted OIBDA* is 50% of its 2005 level QVC has invested for future growth · Adjusted to exclude stock and other equity-based compensation
2008 estimates based on YTD 6/30 growth rates and margins; HSN information based on SEC filings |
| 1. COMPELLING CONTENT Fashion | Jewelry | Beauty | Wellness | Home Style | Cooking & Dining | Electronics |
| QVC.TV 7/28/08 · Introducing QVC TV experience to new broadband customers · Convenience and additional options 2ND LIVE STREAM Q1 2009 · counter programming · niche events · behind the scenes · clearance events
|
| TOP RATED 94% TOP BOX CUSTOMER SATISFACTION 97% CORE CUSTOMER RETENTION
· More personalized sales / service · Online/offline personalization · Self service · Improved delivery · Expanded multi line shipping to reduce customer costs · Faster deliveries through regional hubs · More delivery options · Green packaging initiatives
Fashion | Jewelry | Beauty | Wellness | Home Style | Cooking & Dining | Electronics |
| iQdoU? launched 4Q/07 · Strong emotional connection · Good gains on brand attributes · Leveraged event spend lifted sales
Fashion | Jewelry | Beauty | Wellness | Home Style | Cooking & Dining | Electronics |
| iQdoU? Phase II · Screen Test Format: live, unrehearsed; spontaneous · Deepens customer connection; affinity · Cuts through the sea of commercial-sameness |
| Don’t Miss a Moment |
| Leveraged Marketing
|
| Fashion Week · First step in ongoing partnership with IMG/Fashion Week · Integrated marketing/programming effort · Leverages our top tier designers; many of whom have runway shows at FW · Breaks through home shopping stereotype |
| GDP ($B) MULTI CHANNEL COUNTRY HOMES (M) · ENTERING ITALY MARKET US $ 13,843 90,200 Japan $ 4,384 30,140 · Reached agreement with Germany $ 3,322 32,878 timb for dtt distribution China $ 3,250 141,060 · Operations will begin UK $ 2,772 16,825 on/before Q4 2010 France $ 2,560 10,832 · Projected 10mm+ subs Italy $ 2,105 6,761 by entry Spain $ 1,439 3,604 · CONTINUING Brazil $ 1,313 17,480 DISCUSSIONS IN OTHER
TOP MARKETS Russia $ 1,290 11,027
|
| · New ecommerce brands · Leverage QVC / Liberty assets; · Attract new customers to Q experience · First ODAT site launched (with Backcountry.com) · Product Brand investments where value creation possible · Several discussions underway · Exploratory discussions with cable / internet players about commerce partnerships |
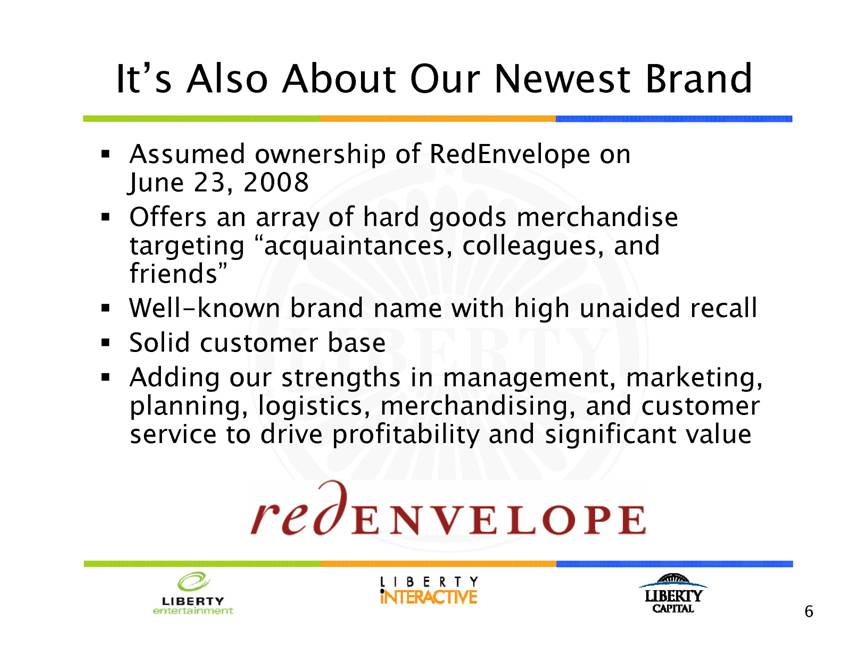
| 5/07 5/08 Red Envelope- online gift retailer 2/06 Provide Backcountry.com- acquired by Provide Commerce- multiple sites for Commerce specialty provider of outdoor enthusiasts, perishable goods one-deal-at-a-time model 2006 2007 - 12/07 Express- online and online retailer of Bodybuilding.com costumes and catalog retailer of party leading sports nutrition accessories supplies & costumes, e-tailer, supersite for combined with bodybuilding BUYSEASONS community
|
| Blended acquisition multiple of <10x ’08E adjusted OIBDA appears low · Relative to strong top-line and adjusted OIBDA growth · Compared to trading multiples (AMZN, NILE >20x) Significant growth as a group in the second quarter · Revenue up 97%, adjusted OIBDA up 108%, in part due to acquisitions · Assuming all businesses consolidated on January 1, 2007, revenue+41%, adjusted OIBDA+75% e-commerce companies generated 10% of 2Q LINT revenue
AMZN, NILE information from Bloomberg |
| This presentation includes a presentation of adjusted OIBDA, which is a non-GAAP financial measure, for Starz Entertainment, the US operations of QVC, Liberty Interactive (which is not an entity, but rather a group of assets tracked by the Liberty Interactive tracking stock) and the e- commerce businesses collectively included in Liberty Interactive (Bodybuilding.com, BUYSEASONS, Backcountry.com and Provide Commerce) for certain applicable periods, together with a reconciliation of that non-GAAP measure to that business’ operating income, determined under GAAP, for the corresponding periods. Liberty Media defines adjusted OIBDA as revenue less cost of sales, operating expenses, and selling, general and administrative expenses (excluding stock and other equity-based compensation) and excludes depreciation, amortization and restructuring and impairment charges that are included in the measurement of operating income pursuant to GAAP. Liberty Media believes adjusted OIBDA is an important indicator of the operational strength and performance of its businesses, including the ability to service debt and fund capital expenditures. In addition, this measure allows management to view operating results and perform analytical comparisons and benchmarking between businesses and identify strategies to improve performance. Because adjusted OIBDA is used as a measure of operating performance, Liberty Media views operating income as the most directly comparable GAAP measure. Adjusted OIBDA is not meant to replace or supercede operating income or any other GAAP measure, but rather to supplement such GAAP measures in order to present investors with the same information that Liberty Media’s management considers in assessing the results of operations and performance of its assets. Please see the reconciling schedules set forth below.
|
| Reconciliation of e-commerce Adjusted OIBDA to Operating Income ($m) Q2 2007 Q2 2008 Liberty Interactive Group e-commerce businesses Adjusted OIBDA $ 13 27 Depreciation and Amortization (5) (7) Stock Compensation Expense (1) (6) Operating Income $ 7 14 Reconciliation of e-commerce Adjusted Pro Forma OIBDA to Operating Income ($m) Q2 2007 Q2 2008 Liberty Interactive Group e-commerce businesses Pro Forma Adjusted OIBDA pro forma for acquisitions $ 15 27 Less Adjusted OIBDA of non-consolidated businesses (2) - Depreciation and Amortization (5) (7) Stock Compensation Expense (1) (6) Operating Income $ 7 14
|
| Reconciliation of Liberty Interactive Adjusted OIBDA to Operating Income
Trailing Twelve Q3 2007 Q4 2007 Q1 2008 Q2 2008 Months ended ($m) June 30, 2008 Liberty Interactive Group
Adjusted OIBDA $ 363 546 $ 401 410 1,720 Depreciation and Amortization (135) (139) (139) (136) (549) Stock Compensation Expense (7) (6) (5) (12) (30) Operating Income $ 221 401 257 262 1,141
|
| Consumer Internet-enabled: Supplier NOT order aggregators Benefits Benefits Direct from the supplier
Virtual model Removes cost from transaction Overnight delivery via FedEx/UPS
Great value 7-day freshness guarantee Prime varieties Accurate fulfillment 3 confirmation e-mails
Enhanced profitability Broader customer reach Monthly feedback Improved quality Optimize production |
| Founded in 1996, acquired by Liberty June 2007 Located in Salt Lake City and Park City, Utah, 700 employees We run seven category-leading online stores that focus on high-end outdoor gear, snowboarding, skiing and closeout gear The largest and fastest growing outdoor gear and action sports e-tailer We offer 120,000 products from over 450 core brands
|
