UNITED STATES
SECURITIES AND EXCHANGE COMMISSION
WASHINGTON, D.C. 20549
FORM 10-K
(MARK ONE)
| x | ANNUAL REPORT PURSUANT TO SECTION 13 OR 15(D) OF THE SECURITIES EXCHANGE ACT OF 1934 |
FEBRUARY 29, 2012 FOR THE FISCAL YEAR ENDED FEBRUARY 29, 2012
OR
| ¨ | TRANSITION REPORT PURSUANT TO SECTION 13 OR 15(D) OF THE SECURITIES EXCHANGE ACT OF 1934 |
For the transition period from to .
Commission file number 000-53633
OCZ TECHNOLOGY GROUP, INC.
(Exact name of Registrant as specified in its charter)
| | |
| Delaware | | 04-3651093 |
(State or other jurisdiction of incorporation or organization) | | (I.R.S. Employer Identification No.) |
6373 San Ignacio Avenue San Jose, California | | 95119 |
| (Address of principal executive offices) | | (Zip Code) |
Registrant’s telephone number, including area code: (408) 733-8400
Securities registered pursuant to Section 12(b) of the Act: None
Securities registered pursuant to Section 12(g) of the Act:
| | |
| Common stock, $0.0025 par value | | The NASDAQ Capital Market |
| (title of each class) | | (name of each exchange on which registered) |
Indicate by check mark if the registrant is a well-known seasoned issuer, as defined in Rule 405 of the Securities Act. Yes ¨ No x
Indicate by check mark if the registrant is not required to file reports pursuant to Section 13 or Section 15(d) of the Act. Yes ¨ No x
Indicate by check mark whether the registrant (1) has filed all reports required to be filed by Section 13 or 15(d) of the Securities Exchange Act of 1934 during the preceding 12 months (or for such shorter period that the registrant was required to file such reports), and (2) has been subject to such filing requirements for the past 90 days. Yes x No ¨
Indicate by check mark whether the registrant has submitted electronically and posted on its corporate Web site, if any, every Interactive Data File required to be submitted and posted pursuant to Rule 405 of Regulation S-T (§229.405 of this chapter) during the preceding 12 months (or for such shorter period that the registrant was required to submit and post such files). Yes x No ¨
Indicate by check mark if disclosure of delinquent filers pursuant to Item 405 of Regulation S-K (§229.405 of this chapter) is not contained herein, and will not be contained, to the best of registrant’s knowledge, in definitive proxy or information statements incorporated by reference in Part III of this Form 10-K or any amendment to this Form 10-K. Yes x No ¨
Indicate by check mark whether the registrant is a large accelerated filer, an accelerated filer, a non-accelerated filer, or a smaller reporting company. See definitions of “large accelerated filer,” “accelerated filer” and “smaller reporting company” in Rule 12b-2 of the Exchange Act. (Check One):
| | | | | | |
| Large Accelerated Filer | | ¨ | | Accelerated Filer | | ¨ |
| Non-Accelerated Filer | | ¨ (do not check if a smaller reporting company) | | Smaller reporting company | | x |
Indicate by check mark whether the registrant is a shell company (as defined in Rule 12b-2 of the Exchange Act). Yes ¨ No x
Based upon the closing sales price of the Common Stock on The NASDAQ Capital Market on August 31, 2011, the aggregate market value of the voting Common Stock held by non-affiliates of the Registrant was $260.6 million. Shares of Common Stock held by each executive officer and director and by each person who owns 5% or more of the outstanding Common Stock have been excluded in that such persons are deemed to be affiliates. This calculation does not reflect a determination that certain persons are affiliates of the Registrant for any other purpose.
The number of shares outstanding of the Registrant’s common stock, $0.0025 par value, was 67,327,099 as of May 1, 2012.
DOCUMENTS INCORPORATED BY REFERENCE
Proxy statement to be filed with the Securities and Exchange Commission within 120 days after the end of the fiscal year to which this report relates, to the extent indicated in Part III.
OCZ TECHNOLOGY GROUP, INC.
FORM 10-K
TABLE OF CONTENTS
2
FORWARD LOOKING STATEMENTS
This Annual Report on Form 10-K, including the following sections, contains forward-looking statements within the meaning of within the meaning of Section 27A of the Securities Act of 1933, as amended (the “Securities Act”) and Section 21E of the Securities Exchange Act of 1934, as amended (the “Exchange Act”), particularly, our expectations regarding results of operations, our ability to expand our market penetration, our ability to expand our distribution channels, customer acceptance of our products, our ability to meet the expectations of our customers, product demand and revenue, cash flows, product gross margins, our expectations to continue to develop new products and enhance existing products, our expectations regarding the amount of our research and development expenses, our expectations relating to our selling, general and administrative expenses, our efforts to achieve additional operating efficiencies and to review and improve our business systems and cost structure, our expectations to continue investing in technology, resources and infrastructure, our expectations concerning the availability of products from suppliers and contract manufacturers, anticipated product costs and sales prices, our expectations that we have sufficient capital to meet our requirements for at least the next twelve months, and our expectations regarding materials and inventory management. These forward-looking statements involve risks and uncertainties, and the cautionary statements set forth below and those contained in the section entitled “Risk Factors” identify important factors that could cause actual results to differ materially from those predicted in any such forward-looking statements. We caution investors that actual results may differ materially from those projected in the forward-looking statements as a result of certain risk factors identified in this Form 10-K and other filings we have made with the Securities and Exchange Commission. More information about potential factors that could affect our business and financial results is set forth under “Risk Factors” and “Management’s Discussion and Analysis of Financial Condition and Results of Operations.”
3
PART I
General
OCZ Technology Group, Inc., a Delaware corporation (“OCZ”) was formed in 2002. OCZ is a leader in the design, manufacturing, and distribution of high performance and reliable Solid-State Drives (“SSDs”) and premium computer components. OCZ has built on its expertise in high-speed memory to become a leader in the enterprise and consumer SSD markets, a technology that competes with traditional rotating magnetic hard disk drives (“HDDs”). SSDs are faster, more reliable, generate less heat and use significantly less power than the HDDs used in the majority of computers today. OCZ designs and manufactures SSDs in a variety of form factors and interfaces including SATA, SAS, PCIe, as well as the development of flash management software, caching and virtualization software to provide a total solution for enterprise clients. We are also a provider of flash controller silicon and firmware for SSDs. In addition to SSD technology, OCZ offers enterprise-class power management products.
Overview
We are a leader in the design, manufacture and distribution of high-performance solid state drives, or SSDs. We operate in one business segment and focus primarily on two markets:
| | • | | HDD Replacement Format Market— SSDs can be substituted for hard disk drives (HDDs) in both high-performance storage and consumer mobile computing and offers significant advantages in terms of performance, reduced heat, and in the case of portable units, battery life. |
| | • | | Storage Area Network (“SAN”) Acceleration/Replacement Market— Optimal for I/O intensive workloads, such as database applications, data warehouses, search engines, and compute-intensive applications, PCIe SSDs enabled with our Virtualized Controller Architecture (“VCA”) are a cost-effective, high performance alternative in datacenter and enterprise storage applications. |
Within both the HDD and SAN markets, we offer a wide range of SSD products for enterprise customers, primarily used for data centers, cloud computing, enterprise computing devices and storage area networks. For small to medium business and consumers, we offer SSDs for the HDD replacement format market that include servers, workstations, high-performance computing devices and a broad array of consumer devices including PCs, laptops, tablets, gaming devices and mobile handsets.
We sell our SSDs and components directly to enterprise customers and original equipment manufacturers, or OEMs, through our direct sales force, and to other end customers through a channel of systems integrators, information technology (“IT”), integrators, and fulfillment and retail distributors, including online retailers that are focused on technology.
As the growth in the market for SSDs began to accelerate over the last several years, we have evolved from high performance DRAM memory modules to serve this emerging SSD market as our primary focus. Our strong foundation in memory technology provided a solid research and development platform and natural transition to develop our SSD capabilities given the technological similarities between these product categories. We have enhanced our SSD capabilities through four acquisitions: (i) certain assets from Solid Data Inc., a provider of solid-state storage systems and solutions, (ii) Indilinx Co., Ltd. (“Indilinx”), a leading fabless provider of flash controller silicon and software for SSDs, (iii) the UK Design Team of PLX Technology, Inc., a developer of system-on-chip solutions, and (iv) Sanrad Inc. (“Sanrad”), a privately-held provider of flash caching and virtualization software and hardware. The acquisitions of Indilinx and the UK Design Team, both completed in fiscal 2012, have enhanced our capabilities in firmware and controller technology, as well as development and commercialization of fully-integrated SSD products. The acquisition of Sanrad, completed in January 2012, provides technology that we believe will allow us to increase datacenter performance and efficiency by putting more virtual machines, or VMs, on a server without slowing down the VM’s ability to access stored data.
4
Currently, our products are purchased by over 400 customers, most of which are distributors or etailers in 60 countries.
For our fiscal years ended February 29, 2012, February 28, 2011 and February 28, 2010, our ten largest customers accounted for 41%, 49% and 51% of net sales, respectively. For our fiscal year ended February 29, 2012, Memoryworld Gmbh & Co. accounted for 10% of our net revenue. For our fiscal years ended February 28, 2011 and February 28, 2010, NewEgg accounted for 17% and 19% of our net revenue, respectively. During each of these periods, no other customers accounted for more than 10% of our net revenue.
Industry Background
Solid State Drives
The worldwide market for SSDs is in very early stages of development, yet continues to grow rapidly and is increasingly accepted as a mainstream storage device in both the HDD replacement format and SAN acceleration/replacement markets. The need for data storage has continued to grow rapidly in recent years due to the growth in volume of data produced and shared, as well as the increase in computing, networking and cloud architectures. Emergent technologies such as virtualization have placed new demands on storage infrastructure and necessitated a re-architecture of storage solutions. Furthermore, enterprises are increasingly dependent on the collection, analysis and reporting of data, which has driven the need for higher performing and more reliable data storage devices. Finally, the rapid growth in the number of devices that utilize data across both Enterprise and Consumer markets has also increased the need for faster access to information.
SSDs have rapidly gained market acceptance across the HDD replacement format and SAN acceleration/replacement markets in a brief period of time; these markets had been dominated by traditional mechanical hard disk drives, or HDDs. As the benefits of deploying SSDs increase and outweigh the lower up-front cost benefits of HDDs, many segments of the market have rapidly shifted to adopt SSD technology. Historically, cost effectiveness on a per-gigabyte basis limited the adoption of SSDs across all market segments. SSD manufacturers have increasingly incorporated the use of MLC and eMLC NAND flash memory, which has allowed manufacturers to lower their total bill of materials, thereby enabling SSDs to be priced competitively with HDDs. As the price per gigabyte of SSDs continues to decline and relative performance continues to improve, SSD adoption is expected to accelerate.
Technological advancements and evolutionary trends have catalyzed the market adoption of SSDs. The major technological advancements have included:
| | • | | Advancement of MLC technology—MLC or multi-level cell, is a memory element capable of using multiple levels of a cell to store information, as opposed to SLC, or single-level cell memory. The use of multiple levels of a cell increases total usable capacity and decreases latency when accessing stored data. |
| | • | | Introduction of sophisticated tiering software—Tiering software has added intelligence to the datacenter and storage stack, allowing applications to automatically recognize and differentiate frequently used data from less frequently used data. Tiering allows for frequently used data to be directed towards SSDs, where rapid access is a principal requirement. This allows users to retrieve data and run applications with the lowest possible latency by leveraging the improved performance of SSDs to manage mission-critical functions. |
| | • | | Introduction of storage virtualization—Storage virtualization provides companies with tools to address the underutilization of resources and the poor economics of silo-based storage, as well as the flexibility to respond to changing business requirements. In a storage virtualized environment, organizations achieve the full benefits of consolidation, improved resource usage and comprehensive disaster recovery. Storage virtualization also reduces power and cooling costs. |
| | • | | Advancement of controller and firmware design—Advancements in controller and firmware have provided SSDs with many of the advanced features that define HDDs’ value proposition and critical |
5
| | features. These features include drive bootability, error correction and TRIM support. TRIM support is an active optimization used with SSDs where a drive can automatically wipe inactive data, boosting capacity and speed while preserving active data on the drive. Controller and firmware technology allows SSD manufacturers to enhance the performance characteristics of SSD components. |
| | • | | Broadened mix of interface technologies—The broadened range of interfaces compatible with SSDs has increased adoption, particularly in the enterprise market. Common interfaces such as PCIe, SATA and SAS are expected to dominate enterprise SSD deployment in the future. |
Power Supply Units
Power supply units (“PSU”) are the main source of conversion between main alternating current and the direct current used by computers and other electronic devices. As modern electronics, computers, servers and workstations become more complicated, the increased power handling and efficiency of AC/DC conversion become paramount. Key drivers in the power supply unit industry are the release of new PCs and industry standards, as well as growing regulatory requirements in the European Union, North America and Japan for increased power consumption.
Our Product Groups
OCZ operates its business in one reportable segment comprised of two product groups of SSD storage and then power supplies, memory processing, and other. We discontinued our DRAM memory products as of February 28, 2011. The following table summarizes our revenue by product group:
| | | | | | | | | | | | | | | | | | | | | | | | |
| | | Fiscal Year Ended February 29/28, | |
| | | 2012 | | | 2011 | | | 2010 | |
Net revenue | | (Dollars in millions) | |
SSD | | $ | 338.9 | | | | 92.7 | % | | $ | 133.2 | | | | 70.0 | % | | $ | 43.5 | | | | 30.2 | % |
Power supplies/memory/other | | | 26.9 | | | | 7.3 | | | | 56.9 | | | | 30.0 | | | | 100.5 | | | | 69.8 | |
| | | | | | | | | | | | | | | | | | | | | | | | |
Total net revenue | | $ | 365.8 | | | | 100.0 | % | | $ | 190.1 | | | | 100.0 | % | | $ | 144.0 | | | | 100.0 | % |
| | | | | | | | | | | | | | | | | | | | | | | | |
Solid State Drives
Our SSD products are primarily used in PCs, servers, data storage systems and industrial equipment that require increased speed, efficient power consumption and increased reliability.
| | • | | MLC-Based SSDs— Our MLC-based drives are used in consumer, mobile computing, PCs, HPC, workstations, servers, enterprise and cloud computing applications, and are available in a variety of interfaces such as SATA II, SATA III, PCIe, SAS, mSATA and our proprietary High Speed Data Link, or HSDL. These drives currently feature low power consumption, read/write speeds up to 6.5GB/s and up to 16TB of storage density. |
| | • | | SLC-Based SSDs—Our SLC-based drives are primarily used in enterprise, HPC, servers, workstations, storage area networks, data centers and cloud computing applications, and support a variety of interfaces such as SATA II, SATA III, PCIe, and SAS. These drives currently feature low power consumption, read/write speeds up to 2.8GB/s, lower latency, enhanced endurance/reliability and up to 1.6TB of storage density. |
| | • | | Portable SSDsand USB Drives—Our portable SSD and USB drives currently support USB 2.0 and USB 3.0, which are primarily used for mobile computing and PCs. These drives currently feature 260 MB per second read/write and up to 128GB in density. Additionally, we recently demonstrated a prototype of “Lightfoot,” an external Intel Thunderbolt SSD that we believe will become the fastest interface in the new generation of high-performance portable storage. |
6
Our SSD products can be integrated with storage systems and servers through various standard interfaces. Given the ubiquity of the HDD interfaces in the storage industry, these SSDs provide scalability, flexibility, and ease of integration into existing storage. We support all of the most popular, fastest-growing interfaces:
| | • | | PCIe—We offer PCIe interface for the HDD replacement format and SAN acceleration/replacement markets as PCIe has the least amount of latency, while maintaining high bandwidth, and maximum performance between the host and the solid state memory. Our PCIe drives currently offer up to 500,000 IOPS for 4KB random write. |
| | • | | SATA—We offer SATA interface across all of our markets as SATA provides the optimum level of performance and reliability. Our SATA drives currently offer up to 90,000 IOPS for 4KB random write. |
| | • | | SAS—We offer SAS interface primarily for enterprise and server clients as SAS is one of the fastest growing interfaces in the SSD market. Our SAS drives currently offer up to 70,000 IOPS for 4KB random read. |
| | • | | HSDL—We offer a proprietary high-speed data link, or HSDL, interface for the enterprise market as HSDL is capable of running up to 20Gbps of data bandwidth per channel, surpassing the speed of existing storage interfaces. Our HSDL drives currently offer up to 250,000 IOPS for 4KB random write. |
Controllers
Our Indilinx-based products and solutions are comprised of advanced solid state drive controllers, SSD reference designs, and software, which enable the rapid development and deployment of high performance solid state drives. Ndurance 2.0, a Indilinx flash management technology, overcomes critical NAND flash memory shortcomings to ensure that SSDs with consumer-grade NAND flash can be reliably used in both enterprise and client computing environments over a lifetime well beyond the manufacturer-rated endurance limits. Our technology powers a wide range of storage solutions, from cost-sensitive consumer devices to performance-optimized systems demanded by mission-critical enterprise applications. Our SATA platforms currently can support up to 6 Gbps, a maximum capacity of 1 TB, and wide compatibility with NAND flash memory SLC and MLC, Asynchronous, ONFI2, Sync, and Toggle Mode.
Flash Caching and Virtualization Technology
Our VXL software delivers flash caching and virtualization technology into server virtualization platforms. Key capabilities of the VXL include:
| | • | | efficient dynamic distribution of host-based flash resources to guest virtual machines via its application optimized cache engine; |
| | • | | supports key enterprise-class storage data center requirements like high availability, storage virtualization, and resilience; |
| | • | | runs on VMware ESX, Microsoft Hyper-V, and Xen-based hypervisors; |
| | • | | guarantees cache migration for vMotion – cached data is treated as a virtualized storage entity and can be migrated between physical servers along with the virtual volumes without performance loss; |
| | • | | allows for caching over highly available mirrored volumes, ensuring that a single flash resource is used to accelerate both copies of the data, doubling the efficiency of flash utilization; |
| | • | | no agent required on the application virtual machine; and |
| | • | | central management is provided, so that IT does not need to manage each accelerated virtual machine separately. |
7
Power Supplies
We manufacture power supplies that are designed to power PCs and industrial devices while maintaining interoperability with other system components, adhering to industry standards and increasing output efficiency through superior design. Our power supplies are designed to operate at higher temperatures and under more demanding internal conditions with stricter load regulation than is required under normal circumstances. Power supplies are sold under both the OCZ and PC Power & Cooling brands, and are able to address a wide range of computing applications.
| | • | | High Wattage Power Supplies—We currently offer high wattage power supplies with density up to 1200 watts, featuring 50 C operation, 80%+ efficiency and 1% load regulation, in multiple formats. The target applications are OEM application servers, workstations, storage area networks, and high performance computing. |
| | • | | Low Noise Power Supplies—We currently offer low noise power supplies with density up to 750 watts, featuring low audible noise. The target applications are PCs and video/audio workstations, and home theater PCs. |
| | • | | Modular PSUs—We currently offer modular PSUs with density up to 1000 watts, featuring removable reconfigurable cables. The target applications are end-user upgrades, overclocking and case modding, gaming computers and home theater PCs. |
| | • | | High Efficiency PSUs—We currently offer high efficiency PSUs with density up to 1000 watts that are green friendly with 85% plus efficiency. The target applications are end-user upgrades, gaming computers and home theater PCs. |
The OCZ Solution
We believe our primary competitive advantages arise from our internal research and development expertise and the ability to capitalize on that expertise to develop differentiated solutions for our customers. This has enabled us to incorporate advanced functionality and capabilities and to develop and commercialize products that are optimized for our customers’ requirements quickly and efficiently. Our solutions offer key benefits to our customers including:
| | • | | Superior performance at lower price points—Our Virtualized Controller Architecture, or VCA, and firmware incorporates proprietary technology and design to pool resources to create a “super controller”. This pooling of resources delivers an increase in raw performance beyond standard single-chip solutions and enables additional features not available on other multi-chip solutions. Our VCA is designed to support a broad range of interfaces with minimal software porting. |
| | • | | Leading PCIe product portfolio—We have enhanced our PCIe product offerings with our new Z-Drive R4 enterprise SSD, launched in August 2011, that offers 2.8GB/s bandwidth and speeds up to 500K IOPS and is based on MLC NAND Flash technology. We have increased our SAN acceleration/replacement customer base due to our enhanced PCIe product offering. Our recently-launched products incorporate fully-integrated, proprietary controller technology acquired from Indilinx Co. Ltd. Our Z-Drive R4 is a multi-controller PCIe solution that incorporates our VCA 2.0 firmware technology. Our Z-Drive R4 CloudServ is capable of transferring multiple gigabytes per second and delivering over a million IOPS with a level of concentrated performance that enables system architects looking for a easy to deploy SAN replacement to design more productive and less complex infrastructures while lowering costs associated with hardware failure, maintenance, structural footprint, and energy consumption. |
| | • | | Compelling value proposition versus legacy HDDs—Our broad array of HDD replacement format SSD products provides performance advantages as compared to HDDs, and our incorporation of MLC-based technology increases our ability to compete on price as well. Our SATA III SSDs are innovatively engineered to deliver industry-leading file transfer rates and superior system responsiveness, all while providing a more durable, reliable, and energy efficient storage solution compared to traditional hard drives. |
8
| | • | | Vertically integrated commercialized controller technology—We believe ownership and increasing integration of our own controller technology will enable us to produce all of the elements of performance and feature differentiation outside of the NAND flash development. This includes our controller software which we believe allows us to tailor our SSDs for specific end markets to deliver superior functionality and performance. |
| | • | | Improved performance via virtualization—We believe our recent acquisition of Sanrad’s flash caching and virtualization software and hardware will enable us to increase datacenter performance and efficiency and address the SAN Acceleration market with a total solution which includes PCIe SSDs like the Z-Drive Series and the Sanrad VXL software. VXL flash caching and storage virtualization software distributes flash caching resources on demand across virtual machines (VMs), maximizing the full potential of virtualization by dissolving SAN bottlenecks which normally result from the use of traditional HDD storage. Sanrad’s virtualization software and solutions are designed to run in VMware ESX, Microsoft Hyper-V, or Citrix Xen virtualization platforms to allow enterprises to realize the benefit of a single unified virtualized environment. |
Flexible and Customizable Component Solutions
We provide flexible and customizable component solutions to address the specific application needs of our end users. Our design principles allow us to develop proprietary components to deliver a broad range of products with superior features. As of our fiscal year ended February 29, 2012 we offered over 200 products.
Rapid Time to Market
We strive to reduce the design and development time required to incorporate the latest technologies and to deliver the next generation of products and solutions. Our in-house design competencies and control of the design of many of the pieces used within our component solutions enable us to rapidly develop, build and test components.
Extensive Distribution Channels
We have built a diverse and extensive distribution network reaching a wide range of customers in approximately 60 countries. This network includes traditional retailers and etailers, as well as OEMs, systems integrators and distributors.
Strategic Relationship
We have engineering and marketing relationships (for example, being a nominated “solutions partner” or “certified supplier”) with certain motherboard manufacturers and integrated circuit manufacturers and chipset/platform providers such as Advanced Micro Devices, Inc., Marvell Technology Group Ltd,, NVIDIA Corporation, ASUS, Gigabyte Technology, ASRock, and MSI Computer Corporation. We believe that these relationships enable us to respond to changing consumer needs to develop product ranges which are compatible with multiple platforms and to develop other products designed to obtain optimum performance from a specific platform.
Customer Service
We seek to build brand loyalty by offering product warranties, comprehensive return and replacement policies and accessible technical support. Members of our customer service staff have technical expertise which we believe supports us in maintaining our reputation for technical expertise and attentive customer care.
Suppliers
Typically, NAND flash represents a significant majority of our component costs for our SSD products. We are dependent on a small number of suppliers that supply key components used in the manufacture of our products.
9
From time to time, our industry experiences shortages which has resulted in foundries putting their customers, ourselves included, on component allocation. Except as described below we have no long-term supply contracts, our suppliers may not supply the quantities of components we may need to meet our production goals. Micron, SK Hynix, Toshiba and Intel currently supply substantially all of the NAND flash used in our SSD products. We also purchase numerous other components for our SSDs that are readily available in the market.
From time to time, we enter into various inventory related purchase commitments with our suppliers. We had approximately $19.9 million in non-cancelable purchase commitments with certain suppliers as of February 29, 2012. Two key suppliers represent a substantial portion of these commitments.
One commitment of approximately $16.9 million relates to a continuity of supply arrangement which we entered into during the year ended February 29, 2012. Another commitment requires us to purchase approximately $2.6 million of specified components from a certain supplier by the end of April 2013. All purchases from these suppliers are expected to sell in the normal course of business. We do not have any long term supplier contracts or obligations to purchase raw materials.
Manufacturing
OCZ’s SSD products are assembled and tested in our manufacturing facility in Taiwan. We also use other contract-manufacturing suppliers in both the United States and Taiwan to support both our SSD and power supply business. In order to maintain OCZs high quality standards all products are tested at our facilities regardless of assembly location.
This past year our Taiwan factory was relocated to a new facility. With recent technology upgrades our facility capacity has increased to accommodate demand for both client and enterprise OCZ SSDs. The recent investment in our manufacturing facilities has helped improve and expand our ability to manufacture the highest quality products our customers expect.
We do not own or operate semiconductor fabrication or packaging facilities to support our vertical integration of Indilinx controllers and OCZ branded Flash. We currently outsource our semiconductor wafer manufacturing and IC packaging/solutions.
Research and Development
We believe that the timely development of new products is essential to maintaining our competitive position. Our research and development activities are focused primarily on new high-speed SSDs, controller platforms, power supplies and ongoing improvement in manufacturing processes and technologies and continual improvement in test routines and software. We plan to continue to devote research and development efforts to the design of new products which address the requirements of our target markets.
Our engineering staff continually explores practical applications of new technologies, works closely with our customers and provides services throughout the product life cycle, including architecture definition, component selection, schematic design, layout, manufacturing and test engineering. We design our products to be compatible with existing industry standards and, where appropriate, develop and promote new standards. An important aspect of our research and development effort is to understand the challenges presented by our customers’ requirements and satisfy them by utilizing our industry knowledge, proprietary technologies and technical expertise.
Our research and development expenses totaled approximately $32.1 million, $7.7 million and $5.3 million in the fiscal years ended February 29, 2012, February 28, 2011 and February 28, 2010, respectively.
Intellectual Property
We protect our intellectual property through a variety of measures, including trade secrets, non-disclosure agreements, trademarks, copyrights and patents. Currently, we have 16 patents issued in the United States and over 60 pending US utility applications. In addition, we have 13 international patents issued in Korea and Australia, and
10
over 50 applications pending in Europe, Korea, Japan and China. Several of the pending worldwide applications have received favorable office actions requiring relatively minor amendments. We are further aggressively expanding our intellectual property portfolio by continuously filing new patent applications. We maintain our patents and trademarks as part of our intellectual property to extend the durations as necessary to achieve our business goals.
Competition
We conduct business in markets characterized by intense competition, rapid technological change, constant price pressures and evolving industry standards. We compete against global technology vendors such as Intel Corporation and Samsung Electronics Co., Ltd. Our primary competitors in the SSD industry include Fusion-io, Inc., Intel Corporation, SanDisk Corporation, Micron Technology, Inc. (Crucial), SMART Modular Technologies Inc., and STEC, Inc. Our primary competitors in the specialized power supply chassis and cooling manufacturing industry include Antec, Inc., Thermaltake Technology Inc. USA and Enermax Technology Corporation. We currently compete or may compete with, among others, EMC Corporation Hitachi, Ltd., Seagate Technology, Toshiba, and Western Digital. Our flash caching and virtualization software and hardware primarily competes with products from suppliers of software-hardware solutions, including Fusion IO and other software-hardware solutions being developed by privately held companies.
We expect to face competition from existing competitors and new and emerging companies that may enter our existing or future markets with similar or alternative products, which may be less costly or provide additional features. In the PC market in Asia, we expect to face increasing competition from local competitors such as A-DATA Technology Co., Ltd. and GSkill International Enterprise. We also face competition from current and prospective customers that evaluate our capabilities against the merits of manufacturing products internally. In addition, some of our significant suppliers, including LSI Corporation, Samsung Electronics Co., Ltd., Infineon Technologies AG and Micron Technology, Inc., are also our competitors, many of whom have the ability to manufacture competitive products at lower costs as a result of their higher levels of integration. Competition may also arise due to the development of cooperative relationships among our current and potential competitors or third parties to increase the ability of their products to address the needs of our prospective customers. Accordingly, it is possible that new competitors or alliances among competitors may emerge and rapidly acquire significant market share.
We believe that the principal competitive factors in our target markets include the following:
| | • | | first to market with new emerging technologies; |
| | • | | flexible and customizable products to fit customers’ objectives; |
| | • | | high product performance reliability; |
| | • | | early identification of emerging opportunities; |
| | • | | interoperability of products; |
| | • | | localized and responsive customer support on a worldwide basis. |
We believe that we compete favorably with respect to most of these factors. Our competitors include many large domestic and international companies that have substantially greater financial, technical, marketing, distribution and other resources, broader product lines, lower cost structures, greater brand recognition and longer-standing relationships with customers and suppliers than we do. As a result, our competitors may be able to respond better tonew or emerging technologies or standards and to changes in customer requirements. Further,
11
some of our competitors are in a better financial and marketing position from which to influence industry acceptance of a particular industry standard or competing technology than we are our competitors may also be able to devote greater resources to the development, promotion and sale of products, and may be able to deliver competitive products at a lower price.
Backlog
Sales of our products are generally made pursuant to purchase orders. We include in backlog only those customer orders for which we have accepted purchase orders and to which we expect to ship within 45 days. Since orders constituting our current backlog are subject to changes in delivery schedules or cancellation with only limited or no penalties, we believe that the amount of our backlog is not necessarily an accurate indication of our future net sales.
Employees
As of our fiscal year ended February 29, 2012, we employed 708 full-time employees, of which 356 were in general and administration (including operations, finance, administration, human resources and information technology), 265 were in research and development, and 87 were in sales and marketing. Approximately 450 employees are located outside the United States, principally in Taiwan, Korea, United Kingdom, Netherlands, Israel, and Canada. Our employees are not represented by any collective bargaining agreements. We have never experienced a work stoppage and believe that our employee relations are good.
Environmental Matters
Our business involves purchasing finished goods as components from different vendors and then integration of these components into system level finished products of our own design at our facilities. Accordingly, we are not involved in the actual manufacturing of components, which can often involve significant environmental regulations with respect to the materials used, as well as work place safety requirements. Our operations and properties, however, are subject to domestic and foreign laws and regulations governing the storage, disposal and recycling of computer products. For example, our products may be subject to the European Union’s Directive 2002/96/EC Waste Electrical and Electronic Equipment and Directive 2002/95/EC on Restriction on the Certain Hazardous Substances in Electrical and Electronic Equipment. To date, we have not been the subject of any material investigation or enforcement action by either U.S. or foreign environmental regulatory authorities. Further, because we do not engage in primary manufacturing processes like those performed by our suppliers who are industrial manufacturers, we believe that costs related to our compliance with environmental laws should not materially adversely affect us.
Available Information
Our Annual Report on Form 10-K, Quarterly Reports on Form 10-Q, Current Reports on Form 8-K and amendments to those reports filed or furnished pursuant to Section 12(a) or 15(d) of the Securities Exchange Act of 1934, as amended are available free of charge on our website (www.ocztechnology.com under the “Investor Relations – Regulatory Info – SEC Filings” caption) as soon as reasonably practicable after we electronically file such material with, or furnish it to, the Securities and Exchange Commission (the “SEC”). The contents of our web site are not intended to be incorporated by reference into this report or in any other report or document we file or furnish, and any references to our web site are intended to be textual references only.
The public may also read or copy any materials that we file with the SEC at the SEC’s Public Reference Room at 100 F Street, NE, Washington, D.C. 20549. The public may obtain information on the operation of the Public Reference Room by calling the SEC at 1.800.SEC.0330. The SEC maintains a website that contains reports, proxy and information statements, and other information regarding issuers, including OCZ, that file electronically with the SEC. The address of the website is http://www.sec.gov.
12
In addition to the other information described elsewhere in this Annual Report, you should carefully consider the following risk factors, which could materially adversely affect our business, financial condition and results of operations. The risks described below are not the only risks facing OCZ. Additional risks and uncertainties not currently known to us or that we currently deem to be immaterial may materially adversely affect our business, financial condition and results of operations.
Risks Related to Our Business
We are subject to the cyclical nature of the markets in which we compete and a continued downturn could adversely affect our business.
The markets in which we compete, including SSDs, flash and power supply markets, are highly cyclical and characterized by constant and rapid technological change, rapid product obsolescence and price erosion, evolving standards, short product life cycles and wide fluctuations in product supply and demand. These markets have experienced significant downturns often connected with, or in anticipation of, maturing product cycles of both manufacturers’ and their customers’ products and declines in general economic conditions. These downturns have been characterized by diminished product demand, production overcapacity, high inventory levels and accelerated erosion of average selling prices.
Our historical operating results have been subject to substantial fluctuations and we may experience substantial period-to-period fluctuations in future operating results. A downturn in these markets could have a material adverse effect on the demand for our products and therefore a material adverse effect on our business, financial condition and results of operations. Moreover, changes in end-user demand for the products sold by any individual customer can have a rapid and disproportionate effect on demand for our products from that customer in any given period, particularly if the customer has accumulated excess inventories of products purchased from us. Our net sales and results of operations could be materially and adversely affected in the future due to changes in demand from individual customers or cyclical changes in the industries utilizing our products.
We have experienced quarterly and annual losses in the past and may experience losses in the future.
We have experienced losses on a quarterly and annual basis in the past. We have expended, and will continue to expend, substantial funds to pursue engineering, research and development projects, enhance sales and marketing efforts and otherwise operate our business. We may not be profitable on a quarterly or annual basis in the future.
Sales to a limited number of customers represent a significant portion of our net sales, and the loss of any key customer would materially harm our business.
Our dependence on a limited number of customers means that the loss of a major customer or any reduction in orders by a major customer would materially reduce our net sales and adversely affect our results of operations. We expect that sales to relatively few customers will continue to account for a significant percentage of our net sales for the foreseeable future. However, these customers or our other customers may not use our products at current levels in the future, if at all. We have no firm, long-term volume commitments from any of our major customers and we generally enter into individual purchase orders with our customers, in certain cases under master agreements that govern the terms and conditions of the relationship. We have experienced cancellations of orders and fluctuations in order levels from period-to-period and expect that we will continue to experience such cancellations and fluctuations in the future. Customer purchase orders may be cancelled and order volume levels can be changed, cancelled or delayed with limited or no penalties. We may not be able to replace cancelled, delayed or reduced purchase orders with new orders.
For our fiscal years ended February 29, 2012, February 28, 2011 and February 28, 2010, our ten largest customers accounted for 41%, 49% and 51% of net sales, respectively. For our fiscal year ended February 29,
13
2012, Memoryworld Gmbh & Co. accounted for 10% of our net revenue. For our fiscal years ended February 28, 2011 and February 28, 2010, NewEgg accounted for 17% and 19% of our net revenue, respectively. During each of these periods, no other customers accounted for more than 10% of our net revenue.
Our dependence on a small number of suppliers for components, including integrated circuit devices, and inability to obtain a sufficient supply of these components on a timely basis could harm our ability to fulfill orders and therefore materially harm our business.
Typically, integrated circuit, or “IC”, devices represent a significant majority of our component costs for our SSD products. We are dependent on a small number of suppliers that supply key components used in the manufacture of our products. Since we generally do not have long-term supply contracts, our suppliers may not supply the quantities of components we may need to meet our production goals. Micron, SK Hynix, Toshiba and Intel currently supply substantially all of the IC devices used in our flash memory products.
Additionally, because of constraints on working capital, we have delayed payments to a number of vendors which could have an adverse effect on our ability to source product. Moreover, from time to time, our industry experiences shortages in IC devices and foundry services which have resulted in foundries putting their customers, ourselves included, on component allocation. While to date neither delayed payment nor component shortages has disrupted our business in a material way, in the future, we may not be able to obtain the materials that we need to fill orders in a timely manner or at competitive prices. As a result, our reputation could be harmed, we may lose business from our customers, our revenues may decline, and we may lose market share to our competitors.
Our customers are primarily in the computing markets and fluctuations in demand in these markets may adversely affect sales of our products.
Sales of our products are dependent upon demand in the computing markets. We may experience substantial period-to-period fluctuations in future operating results due to factors affecting the computing markets. From time to time, these markets have experienced downturns, often in connection with, or in anticipation of, declines in general economic conditions. A decline or significant shortfall in demand in any one of these markets could have a material adverse effect on the demand for our products and therefore a material adverse effect on our business, financial condition and results of operations.
Customer demand is difficult to accurately forecast and, as a result, we may be unable to optimally match production to customer demand.
We make significant decisions, including determining the levels of business that we will seek and accept, production schedules, component procurement commitments, personnel needs and other resource requirements, based on our estimates of customer’s future requirements. The short-term nature of commitments by many of our customers and the possibility of unexpected changes in demand for their products reduces our ability to accurately estimate future customer requirements. On occasion, customers may require rapid increases in production, which can challenge our resources and can reduce margins. We may not have sufficient capacity at any given time to meet our customers’ demands. Conversely, downturns in the markets in which our customers compete can, and have, caused our customers to significantly reduce the amount of products ordered from us or to cancel existing orders leading to lower-utilization of our facilities. Because many of our costs and operating expenses are relatively fixed, reduction in customer demand would have an adverse effect on our gross margins, operating income and cash flow.
During an industry downturn, there is also a higher risk that our trade receivables would be uncollectible, which would be materially adverse to our cash flow and business.
Order cancellations or reductions, product returns and product obsolescence could result in substantial inventory write-downs.
To the extent we manufacture products in anticipation of future demand that does not materialize, or in the event a customer cancels or reduces outstanding orders, we could experience an unanticipated increase in our
14
inventory. Slowing demand for our products may lead to product returns which would also increase our inventory. In the past, we have had to write-down inventory due to obsolescence, excess quantities and declines in market value below our costs.
The markets for our products are characterized by frequent transitions in which products rapidly incorporate new features and performance standards. A failure to develop products with required feature sets or performance standards or a delay as short as a few months in bringing a new product to market could significantly reduce our net sales for a substantial period, which would have a material adverse effect on our business, financial condition and results of operations.
We have experienced, and may in the future experience, delays in the development and introduction of new products. These delays could provide a competitor a first-to-market opportunity and allow a competitor to achieve greater market share. In the past, we have had revenue fluctuations in our Indilinx product revenue due to product delays, and similar delays could occur again in the future. Defects or errors found in our products after commencement of commercial shipment could result in delays in market acceptance of these products. Lack of market acceptance for our new products will jeopardize our ability to recoup research and development expenditures, hurt our reputation and harm our business, financial condition and results of operations. Accordingly, our future product development efforts may not result in future profitability or market acceptance.
Our growth strategy includes expanding our presence in the SSD market which is highly competitive.
The SSD market is highly competitive. Certain of our competitors are more diversified than us and may be able to sustain lower operating margins in their SSD business based on the profitability of their other businesses. We expect competition in this market to increase as existing manufacturers introduce new products and process technologies, new manufacturers enter the market, industrywide production capacity increases and competitors aggressively price products to increase market share. We only have limited experience competing in this market. Our growth strategy includes expanding our presence in this market, and we may not be successful in doing so.
The market for enterprise Flash-based SSD products is relatively new and evolving, which makes it difficult to forecast end user adoption rates and customer demand for our products.
The enterprise flash-based SSD market is new and rapidly evolving. As a result, we may encounter risks and uncertainties related to our business and future prospects. It is difficult to predict, with any precision, end user adoption rates, customer demand for our products or the future growth rate and size of this market. The rapidly evolving nature of the markets in which we sell our products, as well as other factors that are beyond our control, reduce our ability to accurately evaluate our future outlook and forecast quarterly or annual performance. Furthermore, our ability to predict future sales is limited and our SSD product may never reach mass adoption.
We may be unable to sustain our past growth or manage our future growth, which may have a material adverse effect on our future operating results.
We have experienced significant growth over the last few years. Our future success will depend upon various factors, including market acceptance of our current and future products, competitive conditions, our ability to manage increased sales, if any, the implementation of our growth strategy and our ability to manage our anticipated growth. We intend to finance our anticipated growth through cash flows generated from our sales, borrowings under debt arrangements and the net proceeds from the recent follow-on public offering. However, if our net sales decline, we may not have the cash flow necessary to pursue our growth.
We anticipate adding personnel, particularly in the Operations and Sales and Marketing departments, which will increase our general, administrative and operations expenses. Because these expenses are generally fixed, particularly in the short-term, if we do not achieve our anticipated growth, our operating results may be adversely impacted. Our future success will depend on our ability to manage anticipated growth. If we are unable to anticipate or manage growth effectively, our operating results could be adversely affected.
15
Industry consolidation could adversely affect our business by reducing the number of our potential significant customers and increasing our reliance on our existing key customers.
Many significant participants in our customers’ industries are merging and consolidating as a result of competitive pressures and we expect this trend to continue. Consolidation will likely decrease the number of potential significant customers for our products and services. Fewer significant customers will increase our reliance on key customers and, due to the increased size of these companies, may negatively impact our bargaining position and profit margins. Consolidation in some of our customers’ industries may result in increased customer concentration and the potential loss of customers. The loss of, or a reduced role with, key customers due to industry consolidation could negatively impact our business.
We may make acquisitions that involve numerous risks. If we are not successful in integrating an acquisition, our operations may be adversely affected.
As part of our business and growth strategy, we expect to acquire or make significant investments in businesses, products or technologies that allow us to complement our existing product offering, expand our market coverage, increase our engineering workforce or enhance our technological capabilities. For example in 2007, we acquired PC Power and Cooling, Inc., a producer of PC thermal management products, and substantially all the assets of Silicon Data Inc., doing business as Hypersonic PC Systems, a manufacturer of boutique high performance gaming PCs and laptops. We stopped the manufacture and sale of certain Hypersonic PC products in our fiscal year ended February 28, 2010. On March 25, 2011, we acquired Indilinx Co., Ltd, a privately-held fabless provider of flash controller silicon and software for SSDs, on October 24, 2011, we acquired the UK Design Team of PLX Technology, Inc., a developer of system-on-chip solutions, and on January 9, 2012, we acquired Sanrad Inc., a privately-held provider of flash caching and virtualization software and hardware. Acquisitions or investments expose us to the risks commonly encountered in acquisitions of businesses, including, among others:
| | • | | lower than anticipated sales and profitability; |
| | • | | problems integrating the purchased operations, technologies or products; |
| | • | | costs associated with the acquisition; |
| | • | | negative effects on profitability resulting from the acquisition; |
| | • | | adverse effects on existing business relationships with suppliers and customers; |
| | • | | risks associated with entering markets in which we have no or limited prior experience; |
| | • | | loss of key employees of the acquired business; and |
| | • | | litigation arising from the acquired company’s operations before the acquisition. |
Our inability to overcome problems encountered in connection with any acquisition could divert the attention of management from other strategic opportunities and operational matters, utilize scarce corporate resources and otherwise harm our business. In addition, we are unable to predict whether or when any prospective acquisition candidate will become available or the likelihood that any acquisition will be completed. Even if we do find suitable acquisition opportunities, we may not be able to consummate the acquisitions on commercially acceptable terms or realize the anticipated benefits of any acquisitions we do undertake.
We may make acquisitions that are dilutive to existing stockholders, result in unanticipated accounting charges or otherwise adversely affect our results of operations.
We may grow our business through business mergers and/or other acquisitions of businesses, products or technologies that allow us to complement our existing product offerings, expand our market coverage, increase our engineering workforce or enhance our technological capabilities. If we make any future acquisitions, we could issue stock that would dilute our stockholders’ percentage ownership, incur substantial debt, reduce our
16
cash reserves or assume contingent liabilities. Furthermore, acquisitions may require material charges and could result in adverse tax consequences, substantial depreciation, deferred compensation charges, in-process research and development charges, the amortization of amounts related to deferred compensation and identifiable purchased intangible assets or impairment of goodwill, any of which could negatively impact our results of operations.
We may not be able to maintain or improve our market share because of the intense competition in the markets we serve.
We conduct business in markets characterized by intense competition, rapid technological change, constant price pressures and evolving industry standards. Our competitors include many large domestic and international companies that have substantially greater financial, technical, marketing, distribution and other resources, broader product lines, lower cost structures, greater brand recognition and longer-standing relationships with customers and suppliers than we do. As a result, our competitors may be able to respond better to new or emerging technologies or standards and to changes in customer requirements. Further, some of our competitors are in a better financial and marketing position from which to influence industry acceptance of a particular industry standard or competing technology than we are. Our competitors may also be able to devote greater resources to the development, promotion and sale of products, and may be able to deliver competitive products at a lower price.
We compete against global technology vendors such as Intel Corporation and Samsung Electronics Co., Ltd. Our primary competitors in the solid state storage maker industry include Fusion-io, Inc., Intel Corporation, SanDisk Corporation, Micron Technology, Inc. (Crucial), SMART Modular Technologies Inc., and STEC, Inc. Our primary competitors in the specialized power supply chassis and cooling manufacturing industry include Antec, Inc., Thermaltake Technology Inc. USA and Enermax Technology Corporation. We currently compete or may compete with, among others, EMC Corporation, Hitachi, Ltd., Seagate Technology, Toshiba, and Western Digital. Our flash caching and virtualization software and hardware primarily competes with products from suppliers of software-hardware solutions, including Fusion IO and other software-hardware solutions being developed by privately held companies.
We expect to face competition from existing competitors and new and emerging companies that may enter our existing or future markets with similar or alternative products, which may be less costly or provide additional features. In the PC market in Asia, we expect to face increasing competition from local competitors such as A-DATA Technology Co., Ltd. and GSkill International Enterprise. We also face competition from current and prospective customers that evaluate our capabilities against the merits of manufacturing products internally. In addition, some of our significant suppliers, including LSI Corporation, Samsung Electronics Co., Ltd., Infineon Technologies AG and Micron Technology, Inc., are also our competitors, many of whom have the ability to manufacture competitive products at lower costs as a result of their higher levels of integration. Competition may also arise due to the development of cooperative relationships among our current and potential competitors or third parties to increase the ability of their products to address the needs of our prospective customers. Accordingly, it is possible that new competitors or alliances among competitors may emerge and rapidly acquire significant market share.
We expect that our competitors will continue to improve the performance of their current products, reduce their prices and introduce new products that may offer greater performance and improved pricing, any of which could cause a decline in sales or loss of market acceptance of our products. In addition, our competitors may develop enhancements to, or future generations of, competitive products that may render our technology or products obsolete or uncompetitive.
The future growth of our OEM-focused products is dependent on achieving design wins into commercially successful OEM systems and the failure to achieve design wins or of OEM customers to incorporate our products in their systems could adversely affect our operating results and prospects.
We rely on OEMs to select our OEM-focused products to be designed into their systems, which we refer to as a design win. We often incur significant expenditures in the development of a new product without any
17
assurance that an OEM will select our product for design into its system. Additionally, in some instances, we may be dependent on third parties to obtain or provide information that we need to achieve a design win. Some of these third parties may not supply this information to us on a timely basis, if at all. Furthermore, even if an OEM designs one of our products into its system, we cannot be assured that its product will be commercially successful or that we will receive any net sales as a result of that design win. Our OEM customers are typically not obligated to purchase our products and can choose at any time to stop using our products if their own systems are not commercially successful, if they decide to pursue other systems strategies, or for any other reason. If we are unable to achieve design wins or if our OEM customers’ systems incorporating our products are not commercially successful, our net sales would suffer.
Our future success is dependent on our ability to retain key personnel, including our executive officers, and attract qualified personnel. If we lose the services of these individuals or are unable to attract new talent, our business will be adversely affected.
Our future operating results depend in significant part upon the continued contributions of our key technical and senior management personnel, many of whom would be difficult to replace. We are particularly dependent on the continued service of Ryan M. Petersen, our Chief Executive Officer, Arthur F. Knapp, our Chief Financial Officer, Alex Mei, our Chief Marketing Officer, Bumsoo Kim, our Chief Executive Officer and President of Indilinx, Hyun Mo Chung, our Senior Vice President of R&D and Chief Technology Officer of Indilinx, Arthur James Viggo Tout, our Senior Vice President of Worldwide Engineering and Vice President and General Manager for OCZ Technology, Ltd., Oded llan, our President and Chief Executive Officer of OCZ Israel, Ltd., and Dr. Allon Cohen, our Vice President of Product Management and Marketing for OCZ Israel, Ltd. Our future operating results also depend in significant part upon our ability to attract, train and retain qualified management, manufacturing and quality assurance, engineering, marketing, sales and support personnel. We are continually recruiting such personnel. However, competition for such personnel is intense, and we may not be successful in attracting, training or retaining such personnel now or in the future. There may be only a limited number of persons with the requisite skills to serve in these positions and it may be increasingly difficult for us to hire such persons over time. The loss of any key employee, the failure of any key employee to perform in his or her current position, our inability to attract, train and retain skilled employees as needed or the inability of our officers and key employees to expand, train and manage our employee base could materially and adversely affect our business, financial condition and results of operations.
We have and will continue to incur increased costs as a result of being a U.S. publicly-reporting company.
We have incurred, and will continue to face, increased legal, accounting, administrative and other costs as a result of being a publicly-reporting company that we did not incur as a private company. The Sarbanes-Oxley Act of 2002, as well as rules subsequently implemented by the SEC, and the Public Company Accounting Oversight Board, have required changes in the corporate governance practices of public companies. In July 2010, the Dodd-Frank Wall Street Reform and Protection Act, or the Dodd Frank Act, was enacted. There are significant corporate governance and executive compensation-related provisions in the Dodd-Frank Act that require the SEC to adopt additional rules and regulations in these areas. We expect these rules and regulations to increase our legal and financial compliance costs, to make legal, accounting and administrative activities more time-consuming and costly and to result in a diversion of management’s time from our other business activities. We have also incurred substantially higher costs to obtain directors’ and officers’ insurance. In addition, as we gain experience with the costs associated with being a publicly-reporting company, we may identify and incur additional overhead costs.
If we fail to maintain an effective system of internal controls over financial reporting, we may not be able to report our financial results accurately or detect fraud, which could harm our business and the trading price of our common stock.
Effective internal controls are necessary for us to produce reliable financial reports and are important in our effort to prevent financial fraud. Beginning with our fiscal year ended February 28, 2011, we have been required
18
to periodically evaluate the effectiveness of the design and operation of our internal controls. These evaluations may result in the conclusion that enhancements, modifications or changes to our internal controls are necessary or desirable. While management evaluates the effectiveness of our internal controls on a regular basis, these controls may not always be effective. There are inherent limitations on the effectiveness of internal controls including collusion, management override, and failure of human judgment. Because of this, control procedures are designed to reduce rather than eliminate business risks. If we fail to maintain an effective system of internal controls, we may be unable to produce reliable financial reports or prevent fraud and it could harm our financial condition and results of operations and result in loss of investor confidence and a decline in our share price.
Our indemnification obligations to our customers and suppliers for product defects and adverse decisions in lawsuits relating to product performance issues could require us to pay substantial damages.
A number of our product sales and product purchase agreements provide that we will defend, indemnify and hold harmless our customers and suppliers from damages and costs which may arise from product warranty claims or claims for injury or damage resulting from defects in our products. We maintain insurance to protect against certain claims associated with the use of our products, but our insurance coverage may not be adequate to cover all or any part of the claims asserted against us. A successful claim brought against us that is in excess of, or excluded from, our insurance coverage could substantially harm our business, financial condition and results of operations.
We may also be subject to lawsuits from customers and consumers relating to product defects and performance issues. For example, on March 24, 2011, a purported class action suit was filed in the United States District Court for the Northern District of California San Jose Division alleging that certain of our SSDs sold on or after January 1, 2011 did not meet certain performance criteria and as a result we engaged in certain deceptive practices and violated various laws. Among other things, the suit seeks unspecified actual and compensatory damages, as well as punitive damages, restitution, disgorgement and injunctive and other equitable relief. We believe that the lawsuit has no merit and we intend to vigorously defend against this litigation. An adverse decision in this or other litigation could materially harm our business, financial condition and results of operations.
Our operations in the United States and foreign countries are subject to political and economic risks, which could have a material adverse effect on our business and operating results.
Our financial success may be sensitive to adverse changes in general political and economic conditions in the United States such as changes in regulatory requirements, taxes, recession, inflation, unemployment and interest rates. Such changing conditions could reduce demand in the marketplace for our products or increase the costs involved for us to manufacture our products.
Net revenue outside of the United States accounted for approximately 70% of net revenue for the fiscal year ended February 29, 2012. Net revenue outside of the United States accounted for approximately 64% and 57% of net revenue in fiscal years ended February 28, 2011 and February 28, 2010, respectively. We anticipate that international net revenue will continue to constitute a meaningful percentage of our total net revenue in future periods. In addition, a significant portion of our design and manufacturing is performed at our facilities in Taiwan. As a result, our operations may be subject to certain risks, including changes in regulatory requirements, tariffs and other barriers, increased price pressure, timing and availability of export licenses, difficulties in accounts receivable collections, difficulties in protecting our intellectual property, natural disasters, difficulties in staffing and managing foreign operations, difficulties in managing distributors, difficulties in obtaining governmental approvals for products that may require certification, restrictions on transfers of funds and other assets of our subsidiaries between jurisdictions, foreign currency exchange fluctuations, the burden of complying with a wide variety of complex foreign laws and treaties, potentially adverse tax consequences and uncertainties relative to regional, political and economic circumstances.
19
We are also subject to the risks associated with the imposition of legislation and regulations relating to the import or export of high technology products. We cannot predict whether quotas, duties, taxes or other charges or restrictions upon the importation or exportation of our products will be implemented by the United States or other countries. Some of our customers’ purchase orders and agreements are governed by foreign laws, which often differ significantly from those of the United States. Therefore, we may be limited in our ability to enforce our rights under such agreements and to collect damages, if awarded. These factors may have a material adverse effect on our business, financial condition and results of operations.
Our inability to effectively manage our operations in foreign countries could harm our operating results.
A significant portion of our design and manufacturing operations are carried out outside of the United States at our foreign facilities. Further, international sales have accounted for a significant portion of our overall sales. In some of the countries in which we operate or sell our products, it is difficult to recruit, employ and retain qualified personnel to manage and oversee our local operations, sales and other activities. Further, given our executive officers’ existing managerial burdens, their lack of physical proximity to the activities being managed and the inherent limitations of cross-border information flow, our executive officers who reside in the United States may be unable to effectively oversee the day-to-day management of our foreign subsidiaries and operations. The inability of or failure by our domestic and international management to effectively and efficiently manage our overseas operations could have a negative impact on our business and adversely affect our operating results.
Worldwide economic and political conditions may adversely affect demand for our products.
The recent economic slowdown in the United States and worldwide has adversely affected and may continue to adversely affect demand for our products. Another decline in the worldwide computing markets or a future decline in economic conditions or consumer confidence in any significant geographic area would likely decrease the overall demand for our products, which could have a material adverse effect on us. For example, a decline in economic conditions in China could lead to declining worldwide economic conditions. If economic conditions decline, whether in China or worldwide, we could be materially adversely affected.
The occurrence and threat of terrorist attacks and the consequences of sustained military action in the Middle East have in the past, and may in the future, adversely affect demand for our products.
In addition, terrorist attacks may negatively affect our operations directly or indirectly and such attacks or related armed conflicts may directly impact our physical facilities or those of our suppliers or customers. Furthermore, these attacks may make travel and the transportation of our products more difficult and more expensive, ultimately affecting our sales.
Also as a result of terrorism, the United States has been and may continue to be involved in armed conflicts that could have a further impact on our sales, our supply chain and our ability to deliver products to our customers. Political and economic instability in some regions of the world could negatively impact our business. The consequences of armed conflicts are unpredictable and we may not be able to foresee events that could have a material adverse effect on us.
More generally, any of these events could cause consumer confidence and spending to decrease or result in increased volatility to the United States economy and worldwide financial markets. Any of these occurrences could have a material adverse effect on our business, financial condition and results of operations.
Unfavorable currency exchange rate fluctuations could result in our products becoming relatively more expensive to our overseas customers or increase our manufacturing costs, each of which could adversely affect our profitability.
Our international sales and our operations in foreign countries make us subject to risks associated with fluctuating currency values and exchange rates. Because sales of our products have been denominated to date primarily in U.S. dollars, increases in the value of the U.S. dollar could increase the price of our products so that
20
they become relatively more expensive to customers in the local currency of a particular country, leading to a reduction in sales and profitability in that country. Future international activity may result in increased foreign currency denominated sales. Gains and losses on the conversion to U.S. dollars of accounts receivable, accounts payable and other monetary assets and liabilities arising from international sales or operations may contribute to fluctuations in our results of operations. In addition, as a result of our foreign sales and operations, we have revenues, costs, assets and liabilities that are denominated in foreign currencies. Therefore, decreases in the value of the U.S. dollar could result in significant increases in our manufacturing costs that could have a material adverse effect on our business and results of operations.
Our worldwide operations could be subject to natural disasters and other business disruptions, which could materially adversely affect our business and increase our costs and expenses.
Our worldwide operations could be subject to natural disasters and other business disruptions, which could harm our future revenue and financial condition and increase our costs and expenses. For example, our corporate headquarters in San Jose, California and our manufacturing facilities in Taiwan are located near major earthquake fault lines. Taiwan is also subject to typhoons during certain times of the year. In the event of a major earthquake, typhoon or hurricane, or other natural or manmade disaster, we could experience business interruptions, destruction of facilities and/or loss of life, any of which could materially adversely affect our business and increase our costs and expenses.
The 2011 earthquake and tsunami, and other collateral events, in Japan may adversely affect the demand for our products and services in the Japanese market or cause shortages of some components, which may cause a decline in revenues and negatively affect our operating results.
Revenue sourced from the Japanese market was approximately $1.7 million, zero, and $4.2 million in the fiscal years ended February 29, 2012, February 28, 2011 and February 28, 2010, respectively.
The 2011 earthquake and tsunami in Japan, and other collateral events, including, among others, the catastrophic loss of lives, businesses, infrastructure, and delays in transportation, may have a direct negative impact on us or an indirect impact on us by affecting our employees, customers, or the overall economy in Japan and may reduce the demand for our products and services. As a result, these events could cause a decline in our revenue in Japan and our results of operations could be materially and adversely affected.
Although we generally do not purchase component parts from manufacturers in Japan, we have from time to time purchased NAND flash memory from Toshiba. The earthquake and tsunami in Japan have disrupted the manufacturing operations of several component suppliers located in Japan. Depending on the length of these disruptions, we, and other manufacturers of electronic equipment, may need to locate alternate component suppliers to fulfill our needs. Depending on the number of manufacturers looking for alternate sources of components, it may be difficult to locate alternative suppliers. Some of the other manufacturers may also look to purchase components from some of our other suppliers. Because we do not have long-term supply contracts with our component manufacturers and we are relatively small customers of these suppliers, our component suppliers may reduce the amount of components that they sell to us in order to fulfill or partially fulfill some of these additional orders. Our component manufacturers may also increase prices in response to any increased demand.
Our ability to compete successfully and achieve future growth will depend, in part, on our ability to protect our intellectual property, as well as our ability to operate without infringing the intellectual property of others.
We attempt to protect our intellectual property rights through trade secret laws, non-disclosure agreements, confidentiality procedures and employee disclosure and invention assignment agreements. To a lesser extent, we also protect our intellectual property through patents, trademarks and copyrights. It is possible that our efforts to protect our intellectual property rights may not:
| | • | | prevent our competitors from independently developing similar products, duplicating our products or designing around the patents owned by us; |
21
| | • | | prevent third-party patents from having an adverse effect on our ability to do business; |
| | • | | provide adequate protection for our intellectual property rights; |
| | • | | prevent disputes with third parties regarding ownership of our intellectual property rights; |
| | • | | prevent disclosure of our trade secrets and know-how to third parties or into the public domain; |
| | • | | prevent the challenge, invalidation or circumvention of our existing patents; |
| | • | | result in patents that lead to commercially viable products or provide competitive advantages for our products; and |
| | • | | result in issued patents and registered trademarks from any of our pending applications. |
If any of our issued patents are found to be invalid or if any of our patent applications are rejected, our ability to exclude competitors from making, using or selling the same or similar products as ours could be compromised. We have occasionally applied for and may in the future apply for patent protection in foreign countries. The laws of foreign countries, however, may not adequately protect our intellectual property rights.
Many U.S. companies have encountered substantial infringement problems in foreign countries. Because we conduct a substantial portion of our operations and sell some of our products overseas, we have exposure to foreign intellectual property risks.
In addition, the industries in which we compete are characterized by vigorous protection and pursuit of intellectual property rights. We believe that it may be necessary, from time to time, to initiate litigation against one or more third parties to preserve our intellectual property rights. From time to time, we have received, and may receive in the future, notices that claim we have infringed upon, misappropriated or misused other parties’ proprietary rights. Any of the foregoing events or claims could result in litigation. Such litigation, whether as plaintiff or defendant, could result in significant expense to us and divert the efforts of our technical and management personnel, whether or not such litigation is ultimately determined in our favor. In the event of an adverse result in such litigation, we could be required to pay substantial damages, cease the manufacture, use and sale of certain products, expend significant resources to develop or acquire non-infringing technology, discontinue the use of certain processes or obtain licenses to use the infringed technology. Product development or license negotiating would likely result in significant expense to us and divert the efforts of our technical and management personnel. We may not be successful in such development or acquisition and necessary licenses may not be available on reasonable terms, or at all.
Our indemnification obligations for the infringement by our products of the intellectual property rights of others could require us to pay substantial damages.
We currently have in effect a number of agreements in which we have agreed to defend, indemnify and hold harmless our customers and suppliers from damages and costs which may arise from the infringement by our products of third-party patents, trademarks or other proprietary rights. We may periodically have to respond to claims and litigate these types of indemnification obligations. Any such indemnification claims could require us to pay substantial damages. Our insurance does not cover intellectual property infringement.
We could incur substantial costs as a result of violations of or liabilities under environmental laws.
Our business involves purchasing finished goods as components from different vendors and then assembly of these components into finished products at our facilities. We therefore are not involved in the actual manufacturing of components, which can often involve significant environmental regulations with respect to the materials used, as well as work place safety requirements. Our operations and properties, however, do remain subject in particular to domestic and foreign laws and regulations governing the storage, disposal and recycling of computer products. For example, our products may be subject to the European Union’s Directive 2002/96/EC
22
Waste Electrical and Electronic Equipment and Directive 2002/95/EC on Restriction on the Certain Hazardous Substances in Electrical and Electronic Equipment. Our failure to comply with present and future requirements could cause us to incur substantial costs, including fines and penalties, investments to upgrade our product cycle or curtailment of operations. Further, the identification of presently unidentified environmental conditions, more vigorous enforcement by regulatory agencies, enactment of more stringent laws and regulations, or other unanticipated events may arise in the future and give rise to material environmental liabilities and related costs which could have a material adverse effect on our business, financial condition and results of operations.
We are subject to a variety of federal, state and foreign laws and regulatory regimes. Failure to comply with governmental laws and regulations could subject us to, among other things, mandatory product recalls, penalties and legal expenses which could have an adverse effect on our business.
Our business is subject to regulation by various federal and state governmental agencies. Such regulation includes the radio frequency emission regulatory activities of the Federal Communications Commission, the anti-trust regulatory activities of the Federal Trade Commission and Department of Justice, the consumer protection laws of the Federal Trade Commission, the import/export regulatory activities of the Department of Commerce, the product safety regulatory activities of the Consumer Products Safety Commission, the regulatory activities of the Occupational Safety and Health Administration, the environmental regulatory activities of the Environmental Protection Agency, the labor regulatory activities of the Equal Employment Opportunity Commission and tax and other regulations by a variety of regulatory authorities in each of the areas in which we conduct business. We are also subject to regulation in other countries where we conduct business. In certain jurisdictions, such regulatory requirements may be more stringent than in the United States. We are also subject to a variety of federal and state employment and labors laws and regulations, including the Americans with Disabilities Act, the Federal Fair Labor Standards Act, the WARN Act and other regulations related to working conditions, wage-hour pay, over-time pay, employee benefits, anti-discrimination, and termination of employment.
We have received information that a distributor in the United Arab Emirates may have re-exported some of our products into Iran and that a distributor in Lebanon may have re-exported our products into Syria. We also discovered that we sent products to persons in Iran and in Cuba (although that person later changed his address to one in Mexico) and provided sales support materials for a presentation in Iran. We have voluntarily disclosed potential violations of the Iranian Transaction Regulations and the Export Administration Regulations of the U.S. Department of Treasury, Office of Foreign Assets Control and the U.S. Department of Commerce, Office of Export Enforcement. We have terminated our relationships with these distributors. While we attempt to ensure that our distributors comply with applicable law, their actions are not within our complete control, and there are risks that our products may be re-exported to certain jurisdictions in contravention of our requirements or instructions in the future.
Noncompliance with applicable regulations or requirements could subject us to investigations, sanctions, mandatory product recalls, enforcement actions, disgorgement of profits, fines, damages, civil and criminal penalties, or injunctions. In addition from time to time we have received, and expect to continue to receive, correspondence from former employees terminated by us who threaten to bring claims against us alleging that we have violated one or more labor and employment regulations. In certain instances former employees have brought claims against us and we expect that we will encounter similar actions against us in the future. An adverse outcome in any such litigation could require us to pay contractual damages, compensatory damages, punitive damages, attorneys’ fees and costs.
Any enforcement action could harm our business, financial condition and results of operations. If any governmental sanctions are imposed, or if we do not prevail in any possible civil or criminal litigation in the future, our business, financial condition and results of operations could be materially adversely affected. In addition, responding to any action will likely result in a significant diversion of management’s attention and resources and an increase in professional fees.
23
Changes in the applicable tax laws could materially affect our future results.
We operate in different countries and are subject to taxation in different jurisdictions. Changes in the applicable tax laws of such jurisdictions or the interpretations of such tax laws could increase our effective tax rate and adversely affect our after-tax profitability.
Risks Related to our Debt
Our indebtedness could impair our financial condition, harm our ability to operate our business, limit our ability to borrow additional funds or capitalize on acquisition or other business opportunities.
In February 2011 we signed an agreement with Silicon Valley Bank for asset-based financing of up to $25 million (the “SVB Agreement”). This agreement, which expired on May 6, 2012, replaced the $17.5 million debt capability available under our prior joint factoring arrangements with Silicon Valley Bank and Faunus Group International, Inc. (collectively, the “Factoring Loan Agreements”).
On May 10, 2012 we signed an agreement with Wells Fargo Capital Finance (“WFCF”) for a $35 million senior secured credit facility to replace the SVB Agreement, which expired on May 6, 2012. As in the SVB Agreement, borrowings under the WFCF facility are limited to a borrowing base based on our receivables. The WFCF facility has a 5-year term and provides for a committed expansion up to $60 million of cumulative borrowings and for a potential further expansion to $100 million of total borrowings, in each case if certain conditions are met. The WFCF facility contains minimum liquidity levels and certain financial covenants if these levels are not met. There are also two interest rate options using either a “Base Rate” or a “LIBOR Rate” as defined, both of which contain an “Applicable Margin” spread ranging from 1.25% to 2.75% depending on the “Excess Availability” as defined. We may incur additional debt in the future, subject to certain limitations contained in our debt instruments.
The degree to which we are leveraged and the restrictions governing our indebtedness, such as a minimum liquidity threshhold, could have important consequences including, but not limited to, the following:
| | • | | it may limit our ability to service all of our debt obligations; |
| | • | | it may impair our ability to incur additional indebtedness or obtain additional financing in the future for working capital, capital expenditures, acquisitions, general corporate purposes or other purposes; |
| | • | | some of our debt is and will continue to be at variable rates of interest, which may result in higher interest expense in the event of increases in interest rates; |
| | • | | our debt agreements contain, and any agreements to refinance our debt likely will contain, financial and restrictive covenants, and our failure to comply with them may result in an event of default which, if not cured or waived, could have a material adverse effect on us; |
| | • | | our level of indebtedness will increase our vulnerability to general economic downturns and adverse industry conditions; |
| | • | | our debt service obligations could limit our flexibility in planning for, or reacting to, changes in our business and our industry; and |
| | • | | it may limit our ability to engage in certain transactions or capitalize on acquisition or other business opportunities. |
Historically we have failed to comply with one or more loan covenants and had to receive waivers from Silicon Valley Bank for such non-compliances. We could violate one or more loan covenants in the future. If we are in violation of covenants in the WFCF facility or in similar agreements in the future and do not receive a waiver, the lender could choose to accelerate payment on all outstanding loan balances. If we needed to obtain replacement financing, we may not be able to quickly obtain equivalent or suitable replacement financing. If we are unable to secure alternative sources of funding, such acceleration would have a material adverse impact on our financial condition.
24
The terms of the WFCF facility may restrict our ability to engage in certain transactions.
Pursuant to the terms of the WFCF facility, we are subject to liquidity thresholds and financial covenants and cannot engage in certain transactions, including disposing of certain assets, incurring additional indebtedness, declaring dividends, or acquiring or merging with another entity unless certain conditions are met or unless we receive prior approval from WFCF. If WFCF does not consent to any of these actions or if we are unable to comply with these covenants, we could be prohibited from engaging in transactions which could be beneficial to our business and our stockholders.
To service our debt, we will require cash and we may not be able to generate sufficient cash flow from operations to satisfy these obligations or to refinance these obligations on acceptable terms, or at all.
Our ability to generate cash depends on many factors beyond our control. Our ability to make payments on our debt and to fund working capital requirements, capital expenditures and research and development efforts will depend on our ability to generate cash in the future. Our historical financial results have been, and we expect our future financial results will be, subject to substantial fluctuation based upon a wide variety of factors, many of which are not within our control including, among others, those described in this section.
Unfavorable changes in any of these factors could harm our operating results and our ability to generate cash to service our debt obligations. If we do not generate sufficient cash flow from operations to satisfy our debt obligations, we may have to undertake alternative financing plans, such as refinancing or restructuring our debt, selling assets, reducing or delaying capital investments or seeking to raise additional capital. Also, certain of these actions would require the consent of our lenders. The terms of our financing agreements contain limitations on our ability to incur debt.
We may not be able to obtain refinancing on acceptable terms or at all or sell assets on a timely basis, at reasonable prices or at all. Our inability to generate sufficient cash flow to satisfy our debt obligations, or to refinance our obligations on commercially reasonable terms, would have an adverse effect on our business, financial condition and results of operations.
Risks Related to our Common Stock
The price of our common stock may be volatile and subject to wide fluctuations.
The market price of the securities of technology companies has been especially volatile. In addition, our common stock was listed on the OTCBB since January 14, 2010 and only recently began trading on the NASDAQ Capital Market on April 23, 2010. Accordingly, we have an extremely limited history of public trading of our common stock within the United States. The market price of our common stock may be subject to wide fluctuations. If our net sales do not increase or increase less than we anticipate, or if operating or capital expenditures exceed our expectations and cannot be adjusted accordingly, or if some other event adversely affects us, the market price of our common stock could decline. Broad market and industry factors may adversely affect the market price of our common stock, regardless of our actual operating performance. Factors that could cause fluctuations in our stock price may include, among other things:
| | • | | actual or anticipated variations in quarterly operating results; |
| | • | | changes in financial estimates by us or by any securities analysts who might cover our stock, or our failure to meet the estimates made by securities analysts; |
| | • | | changes in the market valuations of other companies operating in our industry; |
| | • | | announcements by us or our competitors of significant acquisitions, strategic partnerships or divestitures; |
| | • | | additions or departures of key personnel; and |
| | • | | a general downturn in the stock market. |
25
The market price of our stock also might decline in reaction to events that affect other companies in our industry, even if these events do not directly affect us. In the past, companies that have experienced volatility in the market price of their stock have been the subject of securities class action litigation. If we were to become the subject of securities class action litigation, it could result in substantial costs and a diversion of management’s attention and resources.
We may experience significant period-to-period quarterly and annual fluctuations in our net sales and operating results, which may result in volatility in our share price.
We may experience significant period-to-period fluctuations in our net sales and operating results in the future due to a number of factors and any such variations may cause our share price to fluctuate. It is likely that in some future period our operating results will be below the expectations of securities analysts or investors. If this occurs, our share price could drop significantly.
A number of factors, in addition to those cited in other risk factors applicable to our business, may contribute to fluctuations in our sales and operating results, including:
| | • | | the timing and volume of orders from our customers; |
| | • | | the rate of acceptance of our products by our customers, including the acceptance of design wins; |
| | • | | the demand for and life cycles of the products incorporating our products; |
| | • | | the rate of adoption of our products in the end markets we target; |
| | • | | cancellations or deferrals of customer orders in anticipation of new products or product enhancements from us or our competitors or other providers; |
| | • | | changes in product mix; and |
| | • | | the rate at which new markets emerge for products we are currently developing or for which our design expertise can be utilized to develop products for these new markets. |
The sale of our outstanding common stock and exercise of outstanding warrants and options are not subject to lock-up restrictions and may have an adverse effect on the market price of our stock.
As of May 1, 2012, we had 67,327,099 shares of common stock outstanding, options to purchase an aggregate of 7,935,527 shares of common stock outstanding, and warrants to purchase an aggregate of 3,477,521 shares of common stock outstanding. Since only 5,009,955 shares of our common stock, including shares issuable upon exercise of options and warrants, are subject to resale restrictions, subject to certain exceptions, the other holders of our common stock could sell substantial amounts of their holdings. The sale or even the possibility of sale of such stock or the stock underlying the options and warrants could have an adverse effect on the market price for our securities or on our ability to obtain a future public financing. If and to the extent that warrants and/or options are exercised, stockholders could be diluted.
Future sales of shares could depress our share price.
We currently have four effective registration statements pursuant to which the selling stockholders identified in the prospectuses that are part of those registration statements may sell from time to time up to an aggregate of (i) 21,159,510 shares of outstanding common stock and (ii) 4,961,835 shares of common stock issuable upon exercise of outstanding warrants. In addition, we issued 1,775,296 shares of common stock upon the closing of the Sanrad acquisition and will issue up to 313,286 shares of common stock post-closing in connection with the Sanrad acquisition, most of which may be eligible for resale within six months of January 9, 2012. Sales by those selling stockholders, especially if in heavy volume and at the same time, could negatively affect our stock price. Moreover, the perception in the public market that these stockholders might sell our common stock could depress the market price of the common stock. Additionally, we may sell or issue shares of common stock in a public offering, one or more additional financings or in connection with future acquisitions, which will result in additional dilution and may adversely affect market prices for our common stock.
26
No prediction can be made as to the precise effect, if any, that sales of shares of our common stock or the availability of such shares for sale will have on the market prices prevailing from time to time. Nevertheless, the possibility that substantial amounts of common stock may be sold in the public market may adversely affect prevailing market prices for our common stock and could impair our ability to raise capital through the sale of our equity securities.
Anti-takeover provisions in our organizational documents and our stockholder rights plan may discourage our acquisition by a third party, which could limit your opportunity to sell your shares at a premium.
Our fourth amended and restated certificate of incorporation includes provisions that could limit the ability of others to acquire control of us, modify our structure or cause us to engage in change of control transactions, including, among other things, provisions that restrict the ability of our stockholders to call meetings and provisions that authorize our board of directors, without action by our stockholders, to issue additional common stock.
These provisions could deter, delay or prevent a third party from acquiring control of us in a tender offer or similar transactions, even if such transaction would benefit our stockholders.
On October 25, 2011, our Board of Directors authorized a stockholder rights plan and declared a dividend of one preferred share purchase right for each share of our common stock outstanding to stockholders of record at the close of business on November 4, 2011. When exercisable, each right will entitle the registered holder to purchase from us one one-hundredth of a share of our Series A Junior Participating Preferred Stock at a price of $35.00, subject to adjustment.
The rights are designed to assure that all of our stockholders receive fair and equal treatment in the event of any proposed takeover of us and to guard against partial tender offers, open market accumulations and other abusive tactics to gain control of us without paying all stockholders a control premium. The rights will cause substantial dilution to a person or group that acquires beneficial ownership of 20% or more of our common stock on terms not approved by our Board of Directors. However, the rights may have the effect of making an acquisition of us, which may be beneficial to our stockholders, more difficult, and the existence of such rights may prevent or reduce the likelihood of a third-party making an offer for an acquisition of us.
| ITEM 1B. | UNRESOLVED STAFF COMMENTS |
Not Applicable.
Our corporate headquarters are located in San Jose, California. We lease one building comprising approximately 82,000 square feet. In addition to our executive offices, this facility also includes personnel from engineering, sales, marketing, operations and administration and a warehouse. We lease a building in Taiwan that represents approximately 108,000 square feet primarily for manufacturing and also includes additional research and development and a warehouse. We also lease a number of small facilities in both foreign and domestic locations for additional engineering, marketing, purchasing and sales personnel and for storage that total approximately 33,000 square feet.
We consider each facility to be in good operating condition and adequate for its present use, and believe that each facility has sufficient capacity to meet our current and anticipated operating requirements. We lease the properties under lease terms expiring at various dates through 2018. If needed, we expect that suitable replacement and additional space will be available in the future on commercially reasonable terms.
The Company is a party to various legal proceedings related to the on-going operation of its business, including claims both by and against the Company. At any time, such proceedings typically involve claims
27
related to product liability, contract disputes, wage and hour laws, employment practices, or other actions brought by employees, consumers, competitors, or suppliers. The Company establishes accruals for its potential exposure, as appropriate, for claims against the Company when losses become probable and reasonably estimable. However, future developments or settlements are uncertain and may require the Company to change such accruals as proceedings progress. Resolution of any currently known matters, either individually or in the aggregate, is not expected to have a material effect on the Company’s financial condition, results of operations, or liquidity.
In July 2010, OCZ received notice that a former vendor had filed legal proceedings in Taiwan demanding payment for materials which OCZ contended were defective. At that time OCZ accrued approximately $1.25 million for this contingency and an additional $100,000 during the third quarter of fiscal 2011 for potential interest costs. In December 2010, OCZ paid a ‘counter bond’ in cash to the Taoyuan District Court in the amount of $1.28 million for the specific purpose of satisfying OCZ’s obligation under the court order. On April 25, 2011, the Taoyuan District Court found in favor of the former vendor and OCZ was ordered to pay approximately $1.2 million plus interest of approximately $150,000. During June 2011, these payments were made to the vendor and the case was formally closed.
On March 24, 2011, a purported class action suit was filed in the United States District Court for the Northern District of California San Jose Division alleging that certain of OCZ’s SSDs sold after January 1, 2011 did not meet certain performance criteria and as a result OCZ engaged in certain deceptive practices and violated various laws. Among other things, the suit seeks unspecified actual and compensatory damages, as well as punitive damages, restitution, disgorgement, and injunctive and other equitable relief. As of February 29, 2012, the Company has not recognized this contingency within the financial statements presented as OCZ believes that the lawsuit has no merit and intends to vigorously defend against this litigation. On May 18, 2011, OCZ filed a Motion to Dismiss Plaintiff’s Complaint, or alternatively, to Strike Certain Allegations. The Motion was granted in part and denied in part on October 4, 2011. On November 18, 2011, plaintiff filed an amended complaint and, on December 20, 2011, the Company again filed a Motion to Dismiss or Alternatively to Strike Certain Allegations. The Motion was heard on March 27, 2012 and is awaiting decision by the court. A class certification hearing is tentatively set for May 21, 2012 (assuming the plaintiff moves for certification and depending upon when the plaintiff does so); as of May 14, 2012, plaintiff has not so moved. A trial date of May 28, 2013 has been set.
On September 7, 2011 a complaint for patent infringement was filed by Solid State Storage Solutions, Inc. in the United States District Court for the Eastern District of Texas alleging patent infringement against OCZ and eight other companies. The Company was served with a copy of the complaint on October 26, 2011 and filed six affirmative defenses in response on December 23, 2011. The plaintiff seeks an injunction and unspecified damages, special damages, interest and compulsory royalty payments. As of February 29, 2012, the Company has not recognized this contingency within the financial statements presented as OCZ believes the complaint has no merit and OCZ intends to vigorously defend against this litigation.
In 2009, we received inquiries from the U.S. Department of Commerce and the Federal Bureau of Investigation regarding the potential re-export of our products from the United Arab Emirates into Iran. We consequently launched an internal investigation performed by outside counsel. The investigation concluded that while between 2004 and 2008, we maintained a relationship with a distributor in the United Arab Emirates, we have not found any specific facts confirming these suspicions or any information about when such re-exports would have occurred or who may have received the products. However, we did provide approximately $500 in sales support materials to the distributor in connection with a sales presentation in Iran. We have terminated our relationship with this distributor.
28
The investigation separately discovered that in 2007 and 2008, in a total of three instances, we sent one of our high speed Reaper memory module products free of charge as either samples or replacement parts to individuals in Iran and an individual who claimed an address in Cuba but subsequently changed the address to one in Mexico.
We also have received information that a distributor in Lebanon to whom we sold Neural Impulse Actuators in September 2008 may have re-exported one of these units into Syria and in general was interested in distributing our products in Syria, but we have not found specific facts confirming when such re-export would have occurred or who may have received the product. We have terminated our relationship with this distributor.
We have voluntarily disclosed these transactions to the U.S. Department of Commerce and the U.S. Department of the Treasury and have cooperated fully with requests for information from these entities as well as the Federal Bureau of Investigation. On May 3, 2011, we received a letter from the U.S. Department of Commerce informing us that it had reviewed its findings of the investigation and it concluded that although the activity was in fact in violation of U.S. export laws, the U.S. Department of Commerce decided not to refer this matter for criminal or administrative prosecution and it closed this matter with the issuance of a warning letter only.
| ITEM 4. | MINE SAFETY DISCLOSURES |
Not Applicable.
29
PART II
| ITEM 5. | MARKET FOR REGISTRANT’S COMMON EQUITY. RELATED STOCKHOLDER MATTERS AND ISSUER PURCHASES OF EQUITY SECURITIES |
From June 21, 2006 through April 1, 2009, our common stock was traded on the Alternative Investment Market (“AIM”) of the London Stock Exchange under the symbol “OCZ.” From April 2, 2009 to January 13, 2010, our common stock was not publicly traded and we did not undertake any efforts to determine whether transfers or trades occurred during this period of time and if transfers or trades did occur, the price(s) at which such transfers or trades occurred. On January 14, 2010 our common stock was listed on the Over-the-Counter Bulletin Board (“OTCBB”) and was traded on the OTCBB from February 10, 2010 to April 22, 2010. Since April 23, 2010, our common stock has been quoted on The NASDAQ Capital Market under the symbol “OCZ”. The quotations below reflect the high and low bid prices for our common stock since March 1, 2010 as reported on AIM, OTCBB and The NASDAQ Capital Market, as applicable. The quotations below reflect inter-dealer prices, without retail mark-up, mark-down or commission and may not necessarily represent actual transactions
| | | | | | | | |
The NASDAQ Capital Market | | High | | | Low | |
Fiscal 2012: | | | | | | | | |
Fourth quarter (December 1, 2011 – February 29, 2012) | | $ | 10.05 | | | $ | 6.26 | |
Third quarter (September 1, 2011 – November 30, 2011) | | | 8.75 | | | | 4.14 | |
Second quarter (June 1, 2011 – August 31, 2011) | | | 10.94 | | | | 4.84 | |
First quarter (March 1, 2011 – May 31, 2011) | | | 10.48 | | | | 6.25 | |
| | |
Fiscal 2011: | | | | | | | | |
Fourth quarter (December 1, 2010 – February 28, 2011) | | $ | 9.16 | | | $ | 3.81 | |
Third quarter (September 1, 2010 – November 30, 2010) | | | 4.42 | | | | 1.90 | |
Second quarter (June 1, 2010 – August 31, 2010) | | | 3.89 | | | | 1.80 | |
Period of April 23, 2010 – May 31, 2010 | | | 5.05 | | | | 3.30 | |
| | |
OTCBB | | High | | | Low | |
Fiscal 2011: | | | | | | | | |
Period of March 1, 2010 – April 22, 2010 | | $ | 6.00 | | | $ | 3.95 | |
The closing sales price for our common stock on May 1, 2012 was $5.99, as reported by The NASDAQ Capital Market.
As of May 1, 2012, there were 74 holders of record of our common stock.
30
Stock Price Performance Graph
The following graph shows a comparison of cumulative total stockholder return calculated on a dividend reinvested basis, for us, the NASDAQ Composite Index and the Standard & Poor’s 500 Information Technology Sector Index assuming an investment of $100 on February 28, 2007. Periods prior to February 28, 2010 reflect the trading prices of our common stock on the AIM of the London Stock Exchange. No dividends have been declared on our common stock. The graph covers the period from February 28, 2007 to the last trading day of our year ended February 29, 2012. The comparison below are based upon historical data and are not indicative of, nor intended to forecast, the future performance of our common stock.
Comparison Of Cumulative Return From February 28, 2007
Among OCZ Technology Group, Inc., The NASDAQ Composite Index and the S&P 500 Information
Technology Sector Index
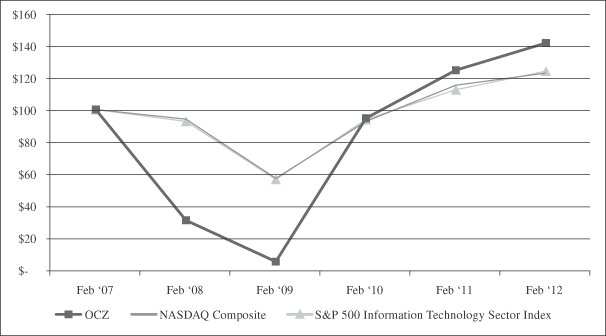
Notwithstanding anything to the contrary set forth in any of our previous filings made under the Securities Act of 1933, as amended, or the Securities Exchange Act of 1934, as amended, that might incorporate future filings made by us under those statutes, the preceding Stock Performance Graph is not to be incorporated by reference into any such prior filings, nor shall such graph be incorporated by reference into any future filings made by us under those statutes.
Dividends
We have not paid any cash dividends on any of our shares to date, and we do not anticipate declaring or paying any cash dividends on our common stock. Any future determination as to the declaration and payment of dividends, if any, will be at the discretion of our Board of Directors and will be contingent upon our then existing conditions, operating results, revenues and earnings, if any, contractual restrictions, capital requirements, business prospects and general financial condition, and other factors our Board of Directors may deem relevant.
31
The payment of any dividends will also be subject to the requirements of the Delaware General Corporation Law and certain restrictions contained in the WFCF facility. For as long as such agreement remains in effect, we would need the written consent of WFCF before making a cash dividend payment. There are currently no restrictions that materially limit our ability to pay stock dividends, or that we reasonably believe are likely to limit materially the future payment of stock dividends.
Recent Sales of Unregistered Securities
We have sold or issued the following securities that were not registered under the Securities Act during the last fiscal year.
On March 25, 2011, OCZ issued 4,160,630 shares of common stock in connection with the acquisition of Indilinx Co., Ltd. In connection with this acquisition, a registration statement for 4,160,630 shares was filed with the SEC on May 17, 2011, amended on June 15 and June 17, 2011 and declared effective as of June 17, 2011.
On January 9, 2012, OCZ issued 2,088,582 of common stock in connection with the acquisition of Sanrad Inc.
Securities Authorized for Issuance under Equity Compensation Plans
The following table provides certain information as of February 29, 2012 with respect to our existing equity compensation plans.
| | | | | | | | | | | | |
Plan category | | Number of securities to be
issued upon exercise of
outstanding options | | | Weighted-average exercise
price of outstanding
options | | | Number of securities remaining
available for future
issuances under
equity compensation plans | |
Equity compensation plans approved by security holders | | | 5,935,605 | | | $ | 5.83 | | | | 3,756,006 | |
Equity compensation plans not approved by security holders | | | — | | | | — | | | | — | |
| | | | | | | | | | | | |
Total | | | 5,935,605 | | | $ | 5.83 | | | | 3,756,006 | |
| | | | | | | | | | | | |
| ITEM 6. | SELECTED FINANCIAL DATA |
The following selected financial data should be read in conjunction with the consolidated financial statements and related notes thereto appearing elsewhere in this annual report on Form 10-K. We have derived the consolidated statement of operations data for fiscal 2012, 2011 and 2010 and consolidated balance sheet data as of February 29, 2012 and February 28, 2011 from audited consolidated financial statements included elsewhere in this report. The consolidated statement of operations data for fiscal 2009 and 2008 and consolidated balance sheet data as of February 28, 2010, February 28, 2009 and February 29, 2008 were derived from audited consolidated financial statements that are not included in this annual report on Form 10-K. You should read the following selected consolidated financial data with “Management’s Discussion and Analysis of Financial Condition and Results of Operations”, our consolidated financial statements and the notes to consolidated financial statements, which are included in this annual report on Form 10-K.
32
SELECTED CONSOLIDATED FINANCIAL DATA
| | | | | | | | | | | | | | | | | | | | |
| | | Year Ended February 29/28, | |
| | | 2012 | | | 2011 | | | 2010 | | | 2009 | | | 2008 | |
| | | (In thousands, except for per share data) | |
Consolidated Statements of Operations Data: | | | | | | | | | | | | | | | | | | | | |
Net revenue | | $ | 365,774 | | | $ | 190,116 | | | $ | 143,959 | | | $ | 155,982 | | | $ | 118,352 | |
Gross profit | | | 82,436 | | | | 24,154 | | | | 18,656 | | | | 19,791 | | | | 22,933 | |
Total operating expenses | | | 94,373 | | | | 41,154 | | | | 31,202 | | | | 30,685 | | | | 22,399 | |
(Loss) income from operations | | | (11,937 | ) | | | (17,000 | ) | | | (12,546 | ) | | | (10,894 | ) | | | 534 | |
Net (loss) income | | | (17,667 | ) | | | (30,027 | ) | | | (13,534 | ) | | | (11,724 | ) | | | 1,437 | |
Net (loss) income per common share, basic | | | (0.35 | ) | | | (1.05 | ) | | | (0.64 | ) | | | (0.56 | ) | | | 0.07 | |
Net (loss) income per common share, diluted | | | (0.35 | ) | | | (1.05 | ) | | | (0.64 | ) | | | (0.56 | ) | | | 0.07 | |
| |
| | | As of February 29/28, | |
| | | 2012 | | | 2011 | | | 2010 | | | 2009 | | | 2008 | |
| | | (In thousands) | |
Consolidated Balance Sheet Data: | | | | | | | | | | | | | | | | | | | | |
Cash and cash equivalents (1) | | $ | 92,339 | | | $ | 17,514 | | | $ | 1,224 | | | $ | 420 | | | $ | 1,544 | |
Inventory, net (1) | | | 108,664 | | | | 22,798 | | | | 9,846 | | | | 16,787 | | | | 14,827 | |
Total assets (1) | | | 358,703 | | | | 89,269 | | | | 47,849 | | | | 57,703 | | | | 52,947 | |
Total current liabilities | | | 100,842 | | | | 66,793 | | | | 41,561 | | | | 38,780 | | | | 22,649 | |
Total liabilities | | | 112,201 | | | | 76,210 | | | | 41,561 | | | | 38,780 | | | | 23,149 | |
Total stockholders’ equity (1) | | | 246,502 | | | | 13,059 | | | | 6,288 | | | | 18,923 | | | | 29,798 | |
| (1) | The significant increases in this item from fiscal 2011 to 2012 were primarily due to follow-on public equity offerings in April 2011 and February 2012 which provided approximately $194.2 million of net proceeds. |
33
| ITEM 7. | MANAGEMENT’S DISCUSSION AND ANALYSIS OF FINANCIAL CONDITION AND RESULTS OF OPERATIONS |
The following discussion and analysis should be read together with our Consolidated Financial Statements and the notes to those statements included elsewhere in this Annual Report on Form 10-K. All statements contained in this Report on Form 10-K that are not purely historical are forward-looking statements and are statements based upon our current expectations, assumptions, estimates and projections about the future. These forward-looking statements involve risk and uncertainties and our actual results regarding the future could differ materially from those indicated as more fully described in “Risk Factors” in item 1A of this Form 10-K. We assume no obligation to update publicly any forward-looking statements.
Business Overview
OCZ Technology Group, Inc., a Delaware corporation (“OCZ”) was formed in 2002. OCZ is a leader in the design, manufacturing, and distribution of high performance and reliable Solid-State Drives (“SSDs”) and premium computer components. OCZ has built on its expertise in high-speed memory to become a leader in the enterprise and consumer SSD markets, a technology that competes with traditional rotating magnetic hard disk drives (“HDDs”). SSDs are faster, more reliable, generate less heat and use significantly less power than the HDDs used in the majority of computers today. OCZ designs and manufactures SSDs in a variety of form factors and interfaces including SATA, SAS, PCIe, as well as flash caching and virtualization software to provide a total solution for enterprise clients. In addition to SSD technology, OCZ also offers enterprise-class power management products.
Our Corporate Headquarters are located in San Jose, California. Subsidiaries and/or offices are located in Canada, Israel, Korea, Netherlands, Taiwan and the United Kingdom. Our fiscal year ends on the last day of February.
Historically, we primarily focused on developing, manufacturing, and selling high-performance DRAM memory modules to computing enthusiasts through catalog and online retail channels. As the market for SSDs began to develop over the last several years, we shifted our focus to serve this emerging market as our primary focus. We believe that our strong R&D foundation in memory has provided a solid R&D platform and natural transition to develop our SSD capabilities, given the technological similarities between product categories. We began to implement a strategy to shift our focus towards the emerging SSD market in early 2009, which has resulted in our revenue mix shifting heavily towards SSDs, which became a majority of our business beginning in 2010 and now represents more than 92% of our net revenues. In August 2010, we announced that we planned to deemphasize our legacy memory products by discontinuing certain low margin commodity DRAM module products. By February 28, 2011, the end of our fiscal year 2011, we had discontinued our legacy memory products to focus on SSDs in accordance with our previously announced plans in January 2011. Throughout this period, we have continued to invest in research and development surrounding a wide array of SSD types and interfaces.
In addition to our SSD product line, we design, develop, manufacture, and distribute other high performance components for computing devices and systems including AC/DC switching power supplies. We offer our customers flexibility and customization by providing a broad variety of solutions which are interoperable and are designed to enable computers to run faster and more reliably, efficiently, and cost effectively. Through our diversified and global distribution channel, we offer approximately 200 products to more than 400 customers, including leading online and offline retailers and OEMs.
We develop flexible and customizable component solutions quickly and efficiently to meet the ever changing market needs and we provide superior customer service. We believe our high performance computer components offer the speed, density, size, and reliability necessary to meet the special demands of:
| | • | | mission critical servers and high end workstations; |
| | • | | industrial equipment and computer systems; |
34
| | • | | computer and computer gaming enthusiasts; |
| | • | | personal computer (“PC”) upgrades to extend the useable life of existing PCs; |
| | • | | high performance computing and scientific computing; |
| | • | | video and music editing and content creation; |
| | • | | home theater PCs and digital home convergence products; and |
| | • | | digital photography and digital image manipulation computers. |
As of our fiscal year ended February 29, 2012, we had over 400 customers, most of which are distributors or retailers in 60 countries. We perform the majority of our research and development efforts in-house, which increases communication and collaboration between design teams, streamlines the development process, and reduces time-to-market.
On January 9, 2012, the Company acquired Sanrad Inc. by the issuance of approximately 2.1 million shares of common stock valued at $16.9 million. Sanrad is a privately held provider of flash caching and virtualization software and hardware. It has R&D facilities located in Tel Aviv, Israel and its technology allows data centers to fully leverage their flash based storage investments, extending the lifespan of the storage infrastructure and maximizing efficiency. This acquisition is expected to help accelerate the customer adoption of OCZ’s offerings in the PCIe based flash storage systems.
On October 24, 2011, we completed an acquisition of certain assets from PLX Technology, Inc. This transaction provides further access to advanced technology in an effort to maintain and expand our market position as a leader in the design, manufacture and distribution of high performance SSDs. Pursuant to the agreement, OCZ acquired access to substantial IP, capital equipment and the UK Design Team, which consists primarily of approximately 40 engineers located in Abingdon, United Kingdom in exchange for cash consideration of $2.2 million. PLX will retain among other net assets, patents related to the technology and their existing line of products which they will continue to support and supply to their customer base.
On March 25, 2011, we completed the acquisition of 100% of the equity interests of Indilinx Co., Ltd., (“Indilinx”) a privately-held company organized under the laws of the Republic of Korea. Indilinx’s products and solutions are comprised of advanced SSD controllers, SSD reference designs, and software, which enable the rapid development and deployment of high performance solid state drives. This technology powers a wide range of storage solutions from cost-sensitive consumer devices to performance-optimized systems demanded by mission-critical enterprise applications.
For the fiscal years ended February 29, 2012, February 28, 2011 and February 28, 2010 our net revenue was $365.8 million, $190.1 million and $144.0 million respectively and our net loss was $17.7 million, $30.0 million and $13.5 million respectively. For our fiscal years ended February 29, 2012, February 28, 2011 and February 28, 2010, our ten largest customers accounted for 41%, 49% and 51% of net sales, respectively. For our fiscal year ended February 29, 2012, Memoryworld Gmbh & Co. accounted for 10% of our net revenue. For our fiscal years ended February 28, 2011 and February 28, 2010, NewEgg accounted for 17% and 19% of our net revenue, respectively. During each of these periods, no other customers accounted for more than 10% of our net revenue.
35
Results of Operations for Fiscal Years Ended February 29, 2012, February 28, 2011 and February 28, 2010
The following table sets forth our financial results, as a percentage of net revenue for the periods indicated.
| | | | | | | | | | | | |
| | | Year Ended
February 29/28, | |
| | | 2012 | | | 2011 | | | 2010 | |
Net revenue | | | 100 | % | | | 100 | % | | | 100 | % |
Cost of revenue | | | 77.5 | | | | 87.3 | | | | 87.0 | |
| | | | | | | | | | | | |
Gross Profit | | | 22.5 | | | | 12.7 | | | | 13.0 | |
Operating expenses: | | | | | | | | | | | | |
Research and development | | | 8.8 | | | | 4.0 | | | | 3.7 | |
Sales and marketing | | | 7.8 | | | | 8.0 | | | | 7.1 | |
General, administrative and operations | | | 7.6 | | | | 9.6 | | | | 10.3 | |
Impairment of goodwill and intangible assets | | | — | | | | — | | | | 0.6 | |
Acquisition related charges | | | 0.8 | | | | — | | | | — | |
Special inventory charge | | | 0.8 | | | | — | | | | — | |
| | | | | | | | | | | | |
Total operating expenses | | | 25.8 | | | | 21.6 | | | | 21.7 | |
| | | | | | | | | | | | |
Loss from operations | | | (3.3 | ) | | | (8.9 | ) | | | (8.7 | ) |
Other income (expense) – net | | | — | | | | (0.6 | ) | | | 0.5 | |
Interest and financing costs | | | (0.3 | ) | | | (1.7 | ) | | | (1.2 | ) |
Revaluation to fair value of common stock warrants | | | (1.2 | ) | | | (4.1 | ) | | | — | |
| | | | | | | | | | | | |
Loss before income tax | | | (4.8 | ) | | | (15.3 | ) | | | (9.4 | ) |
Provision for income tax | | | — | | | | 0.5 | | | | — | |
| | | | | | | | | | | | |
Net loss | | | (4.8 | )% | | | (15.8 | )% | | | (9.4 | )% |
| | | | | | | | | | | | |
Comparison of Fiscal Years Ended February 29, 2012, February 28, 2011 and February 28, 2010
Net revenue
Our consolidated net revenue by product group for each of the three years ended February 2012, 2011, and 2010, are presented in the table below. Also presented is the related dollar and percentage change in consolidated net revenue by product group, as compared with the prior year, for each of the two years ended February 2012 and 2011.
| | | | | | | | | | | | |
| | | Year Ended February 29/28 | |
| | | 2012 | | | 2011 | | | 2010 | |
| | | (In thousands, except percentages) | |
Net revenue by product group: | | | | | | | | | | | | |
SSD | | $ | 338,904 | | | $ | 133,202 | | | $ | 43,510 | |
Power supplies/memory and other | | | 26,870 | | | | 56,914 | | | | 100,449 | |
| | | | | | | | | | | | |
Net revenue | | $ | 365,774 | | | $ | 190,116 | | | $ | 143,959 | |
| | | |
Increase (decrease): | | | | | | | | | | | | |
SSD | | $ | 205,702 | | | $ | 89,692 | | | | | |
Power supplies/memory and other | | | (30,044 | ) | | | (43,535 | ) | | | | |
| | | | | | | | | | | | |
Total increase | | $ | 175,658 | | | $ | 46,157 | | | | | |
| | | |
Percent change: | | | | | | | | | | | | |
SSD | | | 154 | % | | | 206 | % | | | | |
Power supplies/memory and other | | | (53 | )% | | | (43 | )% | | | | |
Total percent change | | | 92 | % | | | 32 | % | | | | |
2012 compared to 2011
The increase in consolidated net revenue of approximately $175.7 million, an increase of 92% from fiscal year ended February 2011 to fiscal 2012, was due to increased worldwide demand for SSD products. During fiscal 2012, the storage market was characterized by rapid growth and rapid technological advances and OCZ
36
was able to deliver significant new SSD products throughout the year to meet the evolving customer needs and requirements for faster, reliable storage capabilities. Memory processing, power supplies, and other revenue declined in fiscal year ended February 2012 compared to fiscal year ended February 2011 by approximately 53%, as expected, reflecting our decision to end the legacy memory products and focus strategically on gaining SSD market share.
2011 compared to 2010
The increase in consolidated net revenue of approximately $46.2 million, an increase of 32% from fiscal year ended February 2010 to fiscal 2011, was due to increased worldwide demand for SSD products. Memory processing, power supplies, and other revenue declined from fiscal year ended February 2011 compared to fiscal year ended February 2010 by approximately 43%, as expected, reflecting our decision to end the legacy memory products and focus strategically on gaining SSD market share.
Gross profit
Our gross profit for each of the three years ended February 2012, 2011, and 2010, are presented in the table below. Also presented is the related dollar and percentage change in gross profit, as compared with the prior year, for each of the two years ended February 2012 and 2011.
| | | | | | | | | | | | |
| | | Year Ended February 29/28 | |
| | | 2012 | | | 2011 | | | 2010 | |
| | | (In thousands, except percentages) | |
Gross profit | | $ | 82,436 | | | $ | 24,154 | | | $ | 18,656 | |
As a percentage of net revenue | | | 22.5 | % | | | 12.7 | % | | | 13.0 | % |
Increase | | $ | 58,282 | | | $ | 5,498 | | | | | |
Percent change | | | 241 | % | | | 29 | % | | | | |
2012 compared to 2011
The increase in gross profit from fiscal year ended February 2011 to February 2012 is directly related to the increase of net revenue by 92% over 2011, the change in product mix and our key initiative to purchase the majority of our NAND flash, which accounts for the majority of product costs, directly from manufacturers rather than on the spot market through brokers. In the fourth quarter of fiscal 2012, gross profit was a record 25% and we expect that going forward our margins will continue to grow through a product mix shift towards enterprise customers, the vertical integration of our technology and stronger, more effective purchasing power.
2011 compared to 2010
Gross profit as a percentage of net revenue was relatively flat from fiscal year ended February 2010 to February 2011 due to continued purchasing of NAND flash on the spot market through brokers. The increase in net revenue from February 2010 to February 2011 led to an increase in gross profit dollars of 29%.
Research and development expenses consist primarily of salaries and related costs including stock-based compensation, prototype material expenses and licensed technology fees.
Our research and development expense and the expense as a percentage of net revenue, for each of the three years ended February 2012, 2011, and 2010, are presented in the table below. Also presented is the related dollar
37
and percentage change in research and development expense, as compared with the prior year, for each of the two years ended February 2012 and 2011.
| | | | | | | | | | | | |
| | | Year Ended February 29/28 | |
| | | 2012 | | | 2011 | | | 2010 | |
| | | (In thousands, except percentages) | |
Research and development | | $ | 32,116 | | | $ | 7,677 | | | $ | 5,331 | |
As a percentage of net revenue | | | 8.8 | % | | | 4.0 | % | | | 3.7 | % |
Increase | | $ | 24,439 | | | $ | 2,346 | | | | | |
Percent change | | | 318 | % | | | 44 | % | | | | |
2012 compared to 2011
The significant increase of approximately $24.4 million in research and development expenses in the fiscal year ended February 2012 compared to 2011, included increased salaries and other compensation expense of $11.3 million, increased engineering project costs of $7.5 million, increased licensed technology fees, tooling and other software development costs of $2.2 million, increased general overhead costs (including depreciation) of $1.8 million, increased stock-based compensation expense of $1.3 million and increased travel of approximately $0.3 million.
The increase in compensation expense is due to increased engineering staff of approximately 170 personnel or a 185% increase in R&D headcount from 2011 to 2012. Approximately 100 engineers were added as a result of our current year acquisitions in Korea, England and Israel. Direct hiring in our Corporate Headquarters in San Jose, California resulted in an additional labor force of approximately 70 positions. The increase in engineering project costs were primarily related to expedited material and tooling costs related to prototype builds which have no alternative future use as well as lab/test equipment and supplies required for new product introductions during fiscal 2012. The quality and increased technological capabilities of new product introductions in 2012 over 2011 in terms of research and development efforts were significant and an increase in spending followed. The increase in licensed technology fees, and additional software tools relate to costs incurred primarily in the fourth quarter of fiscal 2012 and are also related to new product introductions but also included tape-out of two SSD controllers which are expected to be launched in fiscal 2013. As a result of the significant investment in research and development in 2012, we were able to successfully introduce numerous new SSD products to the market on an accelerated basis including but not limited to the Z-Drive PCIe series, the Deneva 2 series, the Indilinx Everest-based Octane and Petrol Series, RevoDrive 3 Max IOPS and the Talos 2 serial attached SCSI (SAS) SSD series. We plan to continue to enhance our technological strengths across the various SSD segments in fiscal 2013.
2011 compared to 2010
The increase of approximately $2.3 million in research and development expenses in the fiscal year ended February 2011 compared to 2010, included increased salaries and other compensation expense of $1.7 million, increased engineering project costs of $0.2 million, increased depreciation related to engineering lab and test equipment of $0.1 million, increased stock-based compensation of $0.2 million and increased general overhead costs of approximately $0.1 million. The increase in compensation expense is due to increased engineering staff of approximately 30 personnel from 2010 to 2011.
Sales and marketing expenses consist primarily of advertising and promotional expenses, salaries and related costs including commissions and stock-based compensation.
Our sales and marketing expense and the expense as a percentage of net revenue, for each of the three years ended February 2012, 2011, and 2010, are presented in the table below. Also presented is the related dollar
38
and percentage change in sales and marketing expense, as compared with the prior year, for each of the two years ended February 2012 and 2011.
| | | | | | | | | | | | |
| | | Year Ended February 29/28 | |
| | | 2012 | | | 2011 | | | 2010 | |
| | | (In thousands, except percentages) | |
Sales and marketing | | $ | 28,490 | | | $ | 15,270 | | | $ | 10,249 | |
As a percentage of net revenue | | | 7.8 | % | | | 8.0 | % | | | 7.1 | % |
Increase | | $ | 13,220 | | | $ | 5,021 | | | | | |
Percent change | | | 87 | % | | | 49 | % | | | | |
2012 compared to 2011
The increase of approximately $13.2 million in sales and marketing expenses in the fiscal year ended February 2012 compared to 2011, included increased advertising and promotional costs of $6.6 million, increased salaries and other compensation expense (including commission expense) of $4.8 million, increased direct sales expense including travel of $1.1 million, increased general overhead costs (including depreciation) of $0.2 million and increased stock-based compensation expense of $0.5 million.
The increase in advertising and promotional expenses from 2011 to 2012 is primarily due to increases in web based and periodical advertising and increased attendance at domestic and international trade shows in order to accelerate marketing of new product introductions. The net revenue increase of approximately 92% and the number of new and diverse product offerings required that we increase staffing and investment in both sales and marketing personnel which, in turn, has resulted in key new customer wins with server manufacturers and in datacenter markets.
2011 compared to 2010
The increase of approximately $5.0 million in sales and marketing expenses in the fiscal year ended February 2011 compared to 2010, included increased advertising and promotional costs of $4.5 million, increased salaries and other compensation expense (including commission expense) of $0.5 million. Other changes in expenses were insignificant.
General, administrative and operations expenseconsist generally of salaries and related costs, legal and other professional fees, allowances for doubtful accounts and product shipping costs, net of delivery revenue.
Our general, administrative and operations expense and the expense as a percentage of net revenue, for each of the three years ended February 2012, 2011, and 2010, are presented in the table below. Also presented is the related dollar and percentage change in general, administrative and operations expense, as compared with the prior year, for each of the two years ended February 2012 and 2011.
| | | | | | | | | | | | |
| | | Year Ended February 29/28 | |
| | | 2012 | | | 2011 | | | 2010 | |
| | | (In thousands, except percentages) | |
General, administrative and operations | | $ | 27,946 | | | $ | 18,207 | | | $ | 14,711 | |
As a percentage of net revenue | | | 7.6 | % | | | 9.6 | % | | | 10.3 | % |
Increase | | $ | 9,739 | | | $ | 3,496 | | | | | |
Percent change | | | 53 | % | | | 24 | % | | | | |
39
2012 compared to 2011
The increase of approximately $9.7 million in general, administrative and operations expenses in the fiscal year ended February 2012 compared to 2011, included increased salaries and other compensation expense of $5.7 million, increased product shipping costs of $1.8 million, increased legal and professional fees of $1.5 million, increased stock-based compensation expense of $0.7 million, increased allowance for doubtful accounts of $0.7 million, increased general overhead costs (including depreciation) of $0.9 million and $1.0 million related to our new factory in Taiwan. Total increases of $12.3 million in 2012 were offset by certain non-recurring charges of $2.6 million which occurred in 2011 related to supplier legal proceedings, severance costs, and the acquisition of certain assets of Solid Data Systems, Inc.
2011 compared to 2010
The increase of approximately $3.5 million in general, administrative and operations expenses in the fiscal year ended February 2011 compared to 2010, included increased salaries and other compensation expense of $0.6 million, increased stock-based compensation expense of $0.1 million, an increase in the allowance for doubtful accounts of $0.7 million and certain non-recurring charges of $2.6 million which occurred in 2011 related to legal proceedings related to a certain supplier ($1.3 million), severance costs ($0.3 million) and the acquisition of Solid Data Systems, Inc. ($1.0 million). Total increases of $4.0 million were offset by $0.5 million related to a lease termination in fiscal 2010.
Impairment of goodwill and intangible assets
Our impairment of goodwill and intangible assets and the expense as a percentage of net revenue, for each of the three years ended February 2012, 2011, and 2010, are presented in the table below. Also presented is the related dollar and percentage change in goodwill and intangible asset impairment expense, as compared with the prior year, for each of the two years ended February 2012 and 2011.
| | | | | | | | | | | | |
| | | Year Ended February 29/28 | |
| | | 2012 | | | 2011 | | | 2010 | |
| | | (In thousands, except percentages) | |
Impairment of goodwill and intangible assets | | $ | 38 | | | $ | — | | | $ | 911 | |
As a percentage of net revenue | | | — | | | | — | | | | 0.6 | % |
Increase (decrease) | | $ | 38 | | | $ | (911 | ) | | | | |
Percent change | | | 100 | % | | | 100 | % | | | | |
2012 compared to 2011
The increase of $38,000 in impairment of goodwill and intangible assets from fiscal year ended February 2011 compared to 2012, was due to an impairment charge of $38,000 in the third quarter of fiscal year 2012 to write down the carrying value of a completed in-process research and development project acquired in the Indilinx acquisition that did not align with the current OCZ product strategy.
2011 compared to 2010
The decrease of approximately $0.9 million in impairment of goodwill and intangible assets from fiscal year ended February 2010 compared to 2011, was due to the February 2010 decision to discontinue the manufacturing and selling of Hypersonic PC Systems products which were purchased from Silicon Data in 2007. Therefore, the $911,000 carrying value of goodwill and related intangibles recorded from that acquisition were determined to be fully impaired and were written off in entirety during fiscal year ended February 28, 2010.
40
Acquisition related chargesconsist primarily of legal, advisory, accounting and other professional services.
Our acquisition related charges and the expense as a percentage of net revenue, for each of the three years ended February 2012, 2011, and 2010, are presented in the table below. Also presented is the related dollar and percentage change in acquisition related charges, as compared with the prior year, for each of the two years ended February 2012 and 2011.
| | | | | | | | | | | | |
| | | Year Ended February 29/28 | |
| | | 2012 | | | 2011 | | | 2010 | |
| | | (In thousands, except percentages) | |
Acquisition related charges | | $ | 2,808 | | | $ | — | | | $ | — | |
As a percentage of net revenue | | | 0.8 | % | | | — | | | | — | |
Increase | | $ | 2,808 | | | $ | — | | | | | |
Percent change | | | 100 | % | | | — | | | | | |
2012 compared to 2011
The increase of approximately $2.8 million in acquisition related charges in the fiscal year ended February 2012 compared to 2011, included $1.7 million related to the acquisition of Indilinx in Q1 2012, $0.9 million related to the acquisition of Sanrad in Q4 2012 and $0.2 million related to the acquisition of the UK Design Team from PLX Technology, Inc. in Q3 2012.
2011 compared to 2010 – No changes or activity to report.
Special inventory chargesconsist primarily of a one-time adjustment related to prior generation SSD products and related components.
Our special inventory charge and the expense as a percentage of net revenue, for each of the three years ended February 2012, 2011, and 2010, are presented in the table below. Also presented is the related dollar and percentage change in special inventory charges, as compared with the prior year, for each of the two years ended February 2012 and 2011.
| | | | | | | | | | | | |
| | | Year Ended February 29/28 | |
| | | 2012 | | | 2011 | | | 2010 | |
| | | (In thousands, except percentages) | |
Special inventory charge | | $ | 2,975 | | | $ | — | | | $ | — | |
As a percentage of net revenue | | | 0.8 | % | | | — | | | | — | |
Increase | | $ | 2,975 | | | $ | — | | | | | |
Percent change | | | 100 | % | | | — | | | | | |
2012 compared to 2011
During the first quarter of fiscal 2012, we recorded a special inventory charge of approximately $3.0 million. This adjustment was to write-off prior generation SSD products and related components which were part of a bill of materials targeted toward the low margin consumer markets rather than the higher margin enterprise markets which we began targeting, particularly as a result of the equity funding completed in April 2011. This strategy change was adopted late in May 2011 and was the result of various product roadmap collaboration meetings with Indilinx beginning after the acquisition closed on March 25, 2011. The key business requirement was to have the newly combined R&D teams focus on future product development for the enterprise markets.
2011 compared to 2010 – No changes or activity to report.
Other income (expense) – net consists of foreign currency transaction gains and loss, and miscellaneous income and expense.
41
Our other income (expense) – net and the expense as a percentage of net revenue, for each of the three years ended February 2012, 2011, and 2010, are presented in the table below. Also presented is the related dollar and percentage change in other income (expense) – net, as compared with the prior year, for each of the two years ended February 2012 and 2011.
| | | | | | | | | | | | |
| | | Year Ended February 29/28 | |
| | | 2012 | | | 2011 | | | 2010 | |
| | | (In thousands, except percentages) | |
Other income (expense), net | | $ | (132 | ) | | $ | (1,068 | ) | | $ | 727 | |
As a percentage of net revenue | | | — | | | | (0.6 | )% | | | 0.5 | % |
Decrease (increase) | | $ | 936 | | | $ | (1,795 | ) | | | | |
Percent change | | | 88 | % | | | (247 | )% | | | | |
2012 compared to 2011
The decrease in other expense from fiscal year ended February 2011 to fiscal year February ended 2012 was due to the write-off of the notes receivable and business investment in BCInet of approximately $1.0 million in Fiscal 2011. Other increases in income (expense) between 2012 and 2011 related to foreign currency transaction gains and losses and miscellaneous charges were approximately $0.1 million.
2011 compared to 2010
The increase in other expense from fiscal year ended February 2011 to fiscal year February ended 2010 was directly related to the business investment in BCInet resulting in income of approximately $0.7 million in fiscal 2010 and the subsequent write off of the notes receivable and investment of approximately $1 million in fiscal 2011. Other changes in income (expense) between 2011 and 2010 related to foreign currency transaction gains and losses and other miscellaneous charges were insignificant.
Interest and financing costsconsist primarily of loan origination fees, interest on bank borrowings and customer early payments discounts.
Our interest and financing costs and the expense as a percentage of net revenue, for each of the three years ended February 2012, 2011, and 2010, are presented in the table below. Also presented is the related dollar and percentage change in interest and financing costs, as compared with the prior year, for each of the two years ended February 2012 and 2011.
| | | | | | | | | | | | |
| | | Year Ended February 29/28 | |
| | | 2012 | | | 2011 | | | 2010 | |
| | | (In thousands, except percentages) | |
Interest and financings costs | | $ | (1,308 | ) | | $ | (3,174 | ) | | $ | (1,716 | ) |
As a percentage of net revenue | | | (0.3 | )% | | | (1.7 | )% | | | (1.2 | ) |
Decrease (increase) | | $ | 1,866 | | | $ | (1,458 | ) | | | | |
Percent change | | | 59 | % | | | (85 | )% | | | | |
2012 compared to 2011
The decrease in interest and financing costs of approximately $1.9 from fiscal year ended February 2011 to 2012 was due to the repayment during the first quarter of fiscal 2012 of significant borrowings that existed at the end of fiscal February 2011. Utilization of the SVB line of credit began at the end of November 2011 to ensure critical inventory purchase requirements were secured which resulted in approximately $0.4 million of interest fees paid compared to interest fees paid of approx $1.3 million in fiscal 2011. Other decreases were related to loan cancellation fees and borrowing expenses incurred in fiscal 2011.
42
2011 compared to 2010
The increase in interest and financing costs of approximately $1.5 million from fiscal year ended February 2010 to 2011 was primarily due to increased borrowings of $9.7 million, higher borrowing expenses related to factoring of accounts receivable and termination penalties and fees associated with cancellation of factoring loan agreements.
Revaluation to fair value of common stock warrants consists of the expense (income) related to changes in the fair value of certain derivative warrants classified as non-current liabilities on the Consolidated Balance Sheet .
Our revaluation expense related to the non-current warrant liability and the expense as a percentage of net revenue, for each of the three years ended February 2012, 2011, and 2010, are presented in the table below. Also presented is the related dollar and percentage change in revaluation expense related to the non-current warrant liability, as compared with the prior year, for each of the two years ended February 2012 and 2011.
| | | | | | | | | | | | |
| | | Year Ended February 29/28 | |
| | | 2012 | | | 2011 | | | 2010 | |
| | | (In thousands, except percentages) | |
Revaluation to fair value of common stock warrants | | $ | (4,290 | ) | | $ | (7,924 | ) | | $ | — | |
As a percentage of net revenue | | | (1.2 | )% | | | (4.1 | )% | | | — | |
Decrease | | $ | 3,634 | | | $ | — | | | | | |
Percent change | | | 46 | % | | | — | | | | | |
2012 compared to 2011
The decrease in expense of $3.6 million related to the revaluation of the non-current warrant liability from fiscal year ended February 2011 to fiscal year February ended 2012 was influenced by the decrease in the trading price of the common stock underlying the warrant instrument.
2011 compared to 2010
The increase in expense of $7.9 million related to the revaluation of the non-current warrant liability from fiscal year ended February 2010 to fiscal year February ended 2011 was influenced by the increase in the trading price and increased volatility of the common stock underlying the warrant instrument. These financial instruments did not exist in fiscal 2010.
Provision for (benefit from) income taxes.
| | | | | | | | | | | | |
| | | Year Ended February 29/28 | |
| | | 2012 | | | 2011 | | | 2010 | |
| | | (In thousands, except percentages) | |
Income tax provision (benefit) | | $ | — | | | $ | 861 | | | $ | (1 | ) |
As a percentage of net revenue | | | — | | | | 0.5 | % | | | — | |
(Decrease) increase | | $ | (861 | ) | | $ | 862 | | | | | |
Percent change | | | 100 | % | | | 100 | % | | | | |
2012 compared to 2011
We did not record a tax benefit in the fiscal year ended February 29, 2012 at the statutory combined federal and state income tax rates of approximately 40% due to the uncertainty surrounding the future realization of the potential tax benefit associated with net operating loss carryforwards.
43
2011 compared to 2010
The income tax benefit amounted to $1,000 in fiscal year ended February 28, 2010 and the tax provision in fiscal year ended February 2011 amounted to $861,000 in fiscal year ended February 28, 2011 due primarily to an $836,000 increase in the valuation allowance on the deferred tax assets. We did not record a tax benefit in fiscal year ended February 28, 2010 or fiscal year ended February 28, 2011 at the statutory combined federal and state income tax rates of approximately 40% due to the uncertainty surrounding the future realization of the potential tax benefit associated with net operating loss carryforwards.
Liquidity and Capital Resources
| | | | | | | | | | | | |
| | | Year Ended February 29/28 | |
| | | 2012 | | | 2011 | | | 2010 | |
| | | (In thousands) | |
Net cash (used in) provided by operating activities | | $ | (90,126 | ) | | $ | (26,614 | ) | | $ | 640 | |
Net cash used in investing activities | | | (7,435 | ) | | | (1,572 | ) | | | (1,291 | ) |
Net cash provided by financing activities | | | 172,406 | | | | 44,600 | | | | 1,507 | |
Since our inception, we have historically not generated sufficient cash from operations and have relied upon funds from equity offerings and debt financings.
Operating activities. Net cash used in operating activities was $90.1 million for fiscal year ended February 29, 2012. The net cash used in operating activities in 2012 resulted from a net loss of $17.7 million, adjusted for $23.7 million in non-cash charges and $96.1 million for use of cash associated with the net change in assets and liabilities. Non-cash charges in fiscal year 2012 included depreciation, fair value adjustments for warrants, stock based compensation and increases to inventory and bad debt reserves. The net change in assets and liabilities included increases in accounts payable and accrued liabilities of $50.8 million offset by increases in accounts receivable, inventory and prepaid expenses of $146.9 million.
Net cash used in operating activities was $26.6 million for fiscal year ended February 28, 2011. The net cash used in operating activities in fiscal year 2011 resulted from a net loss of $30 million, adjusted for $16.3 million in non-cash charges and $12.9 million for use of cash associated with the net change in assets and liabilities. Non-cash charges in fiscal year 2011 included depreciation, fair value adjustments for warrants, stock based compensation and increases to inventory and bad debt reserves. The net change in assets and liabilities included increases in accounts payable and accrued liabilities of $16.1 million offset by increases in accounts receivable, inventory and prepaid expenses of $29.0 million.
Net cash provided by operating activities was $0.6 million for fiscal year ended February 28, 2010. Net cash provided by operating activities during the fiscal year 2010 was due primarily to an increase in accounts payable and accrued liabilities of $1.6 million, a decrease in inventories of $6.6 million, a decrease in accounts receivable of $3.0 million and a decrease in prepaid expenses of $0.3 million, partially offset by a non-cash gain on disposition of the NIA product line of $0.7 million, and a net loss of $13.5 million adjusted for $3.3 million in non-cash charges. The decreases in accounts receivable and inventory in fiscal year 2010 was primarily due to lower sales levels while the increase in accounts payable and accrued expenses was due to us paying vendors later because of working capital constraints.
Investing activities. Net cash used in our investing activities was $7.4 million for fiscal year ended February 29, 2012. Of this amount, $3.5 million was related to the purchase of fixed assets primarily to support our growth of our new manufacturing facility in Taiwan, $2.5 million was related to the purchase of intellectual property and licenses to support our engineering efforts and approximately $1.4 million was related to current year acquisitions, net of cash received.
Net cash used in our investing activities was $1.3 million and $1.6 million for fiscal year ended February 28, 2010 and fiscal year ended February 28, 2011, respectively. Of these amounts, $887,000 and $1.5 million,
44
respectively, were related to the purchase of fixed assets including those needed to support our growth and establishment of a warehouse and manufacturing facility in Taiwan. We continue to invest in our surface mount technology (“SMT”) production line to move manufacturing, assembly and test capabilities in-house. We will also invest in our infrastructure in order to improve our controls and procedures as part of growing our business and meeting regulatory requirements associated with being a public company.
Financing activities. Net cash provided by our financing activities was $172.4 million for fiscal year ended February 29, 2012. Net cash was principally provided by financing activities in fiscal year 2012 was due to net proceeds of $194.2 million from the issuance of common stock in two follow-on public offerings and proceeds of $1.7 million from the exercise of employee stock options, partially offset by the repayment of bank loans of $24.9 million.
Net cash provided by our financing activities was $1.5 million and $44.6 million for fiscal year ended February 28, 2010 and fiscal year ended February 28, 2011, respectively. Cash provided by financing activities in fiscal year ended February 28, 2011 primarily reflects our common stock issuance of $34.7 million. We also increased our short term bank borrowings by $9.7 million as of fiscal year ended February 28, 2011 as compared to fiscal year ended February 28, 2010. Cash provided by financing activities in fiscal year ended February 28, 2010 was primarily due to common stock and preferred stock issuances of $7,000 and $281,000, respectively, as well as increases in bank loans of $919,000 and $500,000 borrowings from Ryan M. Petersen, our Chief Executive Officer, made to us in fiscal year ended February 28, 2010.
Other factors affecting liquidity and capital resources.
We have historically not generated sufficient cash from operations and have relied upon equity offerings and debt financing such as receivable factoring, increased trade terms from vendors, and bank lines of credit as we have grown.
In February 2011 we signed an agreement with Silicon Valley Bank for asset-based financing of up to $25 million (the “New SVB Agreement”). This new agreement, which was to expire in February 2012, expanded the $17.5 million debt capability available under the prior joint factoring arrangements with Silicon Valley Bank and Faunus Group International, Inc. The agreement contains financial covenants for quarterly EBITDA as defined in the agreement and a monthly quick ratio computation (our cash and accounts receivable divided by current liabilities). Interest rates range between prime +1.5% to prime +2.5%. There are also provisions for letter of credit sub-limits and various operational, reporting, negative and affirmative covenants with which we must comply. On January 31, 2012 the Company executed an amendment to provide a formal waiver of the Sanrad acquisition as well as to extend the SVB Agreement until May 6, 2012. On April 25, 2012 the Company executed an amendment to provide a formal waiver of the covenant for EBITDA levels for the period ending February 29, 2012. As of February 29, 2012, we had no borrowings under the SVB Agreement. The applicable interest rate is prime + 1.50%. The bank’s prime rate was 4.0% at February 29, 2012.
On May 10, 2012 we signed an agreement with Wells Fargo Capital Finance (“WFCF”) for a $35 million senior secured credit facility to replace the SVB Agreement, which expired on May 6, 2012. As in the SVB Agreement, borrowings under the WFCF facility are limited to the borrowing base based on our receivables. The WFCF facility has a 5-year term and provides for a committed expansion up to $60 million of cumulative borrowings and for a potential further expansion to $100 million of total borrowings if certain conditions are met. The WFCF facility contains minimum liquidity levels and certain financial covenants if these levels are not met. There are also two interest rate options using either a “Base Rate” or a “LIBOR Rate” as defined, both of which contain an “Applicable Margin” spread ranging from 1.25% to 2.75% depending on the “Excess Availability” as defined. We may incur additional debt in the future, subject to certain limitations contained in our debt instruments.
45
We expect to experience growth in our working capital requirements as we continue to expand our business. We cannot assure that we will find additional debt or equity financing allowing us to grow. We intend to fund this continued expansion through the combination of cash generated by operations, increased debt facilities, and potential future equity offerings. We anticipate that working capital will constitute a material use of our cash resources.
In April 2011, we consummated a follow-on offering pursuant to which we issued 11,730,000 shares of common stock at $8.50 per share. We received approximately $94 million in net proceeds from the offering, which includes the over-allotment option being exercised in full, after deducting underwriting discounts and commissions and estimated offering expenses. We have been using the net proceeds from the offering for general corporate purposes.
In February 2012, we consummated a follow-on offering pursuant to which we issued 12,000,000 shares of common stock at $9.00 per share. We received approximately $101 million in net proceeds from the offering, after deducting underwriting discounts and commissions and offering expenses of approximately $7.3 million. On March 13, 2012, the underwriters of the February 2012 follow-on offering have partially exercised their over-allotment option to purchase an additional 1,013,991 primary shares. The net proceeds from the over-allotment option exercise are approximately $8.0 million, bringing the total net proceeds from the offering to approximately $109 million, after deducting underwriting discounts and commissions and estimated offering expenses.
We believe that our current cash and cash equivalents, combined with the February 2012 follow-on offering proceeds, will be sufficient to meet our anticipated cash needs for working capital and capital expenditures for at least 12 months. Our long-term future capital requirements and financing needs will depend on many factors, including our level of revenues, the timing and extent of spending to support our product development efforts, the expansion of sales and marketing activities, the timing of our introductions of new products, the costs to ensure access to adequate manufacturing capacity and associated infrastructure and the continuing market acceptance of our products. If the sources of cash and cash equivalents are insufficient to satisfy our liquidity requirements, we could be required, or could elect, to seek additional funding through public or private equity or debt financing and additional funds may not be available on terms acceptable to us or at all.
There is no assurance that we will maintain compliance with all covenants of our Loan Agreements in the future. If we are in violation of covenants in the Loan Agreements and do not receive a waiver, the lender could choose to accelerate payment effectively causing all outstanding loan balances to become due.
Off-Balance Sheet Arrangements
We do not have any off-balance sheet arrangements.
Inflation
Inflation was not a material factor in either revenue or operating expenses during our fiscal years ended February 29, 2012, February 28, 2011 and February 28, 2010.
Critical Accounting Policies and Estimates
Our discussion and analysis of our financial condition and results of operations are based upon our consolidated financial statements, which have been prepared in accordance with accounting principles generally accepted in the United States of America (“GAAP”). The preparation of these financial statements requires us to make estimates and judgments that affect the reported amount of assets and liabilities and disclosure of contingent assets and liabilities at the date of the financial statements and the reported amount of revenues and expenses for each period. Information with respect to our critical accounting policies which we believe could
46
have the most significant effect on our reported results and require subjective or complex judgments is contained in the notes to the consolidated financial statements in this report for the fiscal year ended February 29, 2012.
We believe the following are our most critical accounting policies as they require our more significant judgments in the preparation of our financial statements.
Revenue recognition. We record all of our product sales net of allowances for returns, product rebates, sales credits, and market development funds. We recognize revenue when there is persuasive evidence of an arrangement, product shipment by a common carrier has occurred, risk of loss has passed, the terms are fixed and collection is probable. We generally use customer purchase orders and/or contracts as evidence of an arrangement and the underlying payment terms to determine if the sales price is fixed. We also purchase credit insurance for the majority of our accounts.
We offer certain customers limited product return rights. To estimate reserves for future sales returns, we regularly review our history of actual returns and monitor the inventory levels of our customers. Reserves for future returns are adjusted as necessary, based on returns experience, future expectations and communication with our customers.
Probability of collection is assessed for each customer as it is subjected to a credit review process that evaluates its financial position, ability to pay, and the potential coverage by our credit insurer. If it is determined from the outset of an arrangement that collection is not probable, the customer is required to pay cash in advance of shipment. We provide for price protection credits on a case-by-case basis after assessing the market competition and product technology obsolescence. These credits are recorded as a reduction to revenue at the time we reduce the product prices.
Advertising.We engage in a variety of methods of advertising and marketing media which generally includes ad placement in periodicals, internet-based advertising, and customer marketing arrangements. Advertising costs are recorded as either a sales and marketing expense or a deduction from revenue. Advertising costs reimbursed by us to a customer must have an identifiable benefit to us and an established fair value in order to be classified as an operating expense. If these criteria are not met, the cost is classified as a reduction from revenue.
Product warranties. We offer our customers warranties on certain products sold to them. These warranties typically provide for the replacement of its products if they are found to be faulty within a specified period. Concurrent with the sale of products, a provision for estimated warranty expenses is recorded with a corresponding increase in cost of goods sold. The provision is adjusted periodically based on historical and anticipated experience. Actual expense of replacing faulty products under warranty, including parts and labor, are charged to this provision when incurred.
Inventory. Inventory is valued at the lower of cost or market value with cost being valued using the average cost method. Inventory consists of raw materials, work in progress and finished goods. We write down inventory for slow moving and obsolete inventory based on assessments of future demands and market conditions.
Income taxes. We account for income taxes using an asset and liability approach, which requires us to recognize deferred tax assets and liabilities for the expected future tax consequences of events that have been recognized in a company’s financial statements or tax returns. Under this method, deferred tax assets and liabilities are determined based on the difference between the asset or liability carrying amounts and tax basis of assets and liabilities using the enacted tax rates. In addition, a valuation allowance is established to reduce any deferred tax asset for which it is determined that it is more likely than not that some portion of the deferred tax asset will not be realized. Our Canadian subsidiary pays taxes in Canada. We do not file consolidated tax returns.
47
Impairment of Goodwill and Intangible Assets.Significant judgments are required in assessing impairment of goodwill and intangible assets, including indentifying reporting units, assigning assets and liabilities to reporting units and determining the fair value of each reporting unit, which includes estimating future cash flows, determining appropriate discount and growth rates and other assumptions. Changes in these estimates and assumptions could materially affect the determination of fair value, whether an impairment exists and, if so, the amount of that impairment. Circumstances that could affect the valuation of goodwill and intangible assets include, among other things, a significant change in our business climate and buying habits of our customers along with increased costs to provide systems and technologies required to support the technology.
Goodwill.Goodwill is tested for impairment at the reporting unit level at least annually in the fourth quarter of each fiscal year or more often if events or changes in circumstances indicate the carrying value may not be recoverable. We evaluate the recoverability of goodwill on the basis of market capitalization, a decrease in the Company’s financial position and, if necessary, discounted cash flows on the Company level, which is the sole reporting unit. Based on our analysis, we did not record any impairment charge during the fiscal years ended February 29, 2012 and February 28, 2011. As of February 29, 2012, we had $60.9 million of goodwill.
Intangible assets.Intangible assets consist of purchased intellectual property and are measured at fair value. We amortize all intangible assets on a straight-line basis over their expected lives. We evaluate our intangible assets for impairment by assessing the recoverability of these assets whenever adverse events or changes in circumstances or business climate indicate that expected undiscounted future cash flows related to such intangible assets may not be sufficient to support the net book value of such assets. An impairment charge is recognized in the period of identification to the extent that the carrying amount of an asset exceeds the fair value of such asset. Based on our analysis, we recorded an impairment charge of $38,000 in the third quarter of fiscal year 2012 to write down the carrying value of a completed in-process research and development project acquired in the Indilinx acquisition that did not align with our current product strategy. No impairment was recorded in fiscal year 2011. As of February 29, 2012, we had $8.4 million of intangible assets, net.
Stock-based compensation.Stock-based compensation is measured based on the grant-date fair value. Fair value is estimated using the Black-Scholes model. Compensation expense for stock options is recognized on the straight-line basis over the period earned and vested. Restricted stock grants are measured based on the fair market value of the underlying stock on the date of grant and compensation expense for restricted stock grants is recognized on the straight-line basis over the requisite service period. Non-vested stock options and restricted stock grants are included in the diluted shares outstanding calculation when their effect is dilutive.
The amount of compensation expense recognized using the Black-Scholes model requires us to exercise judgment and make assumptions relating to the factors that determine the fair value of stock option grants. The fair value calculated by this model is a function of several factors, including the grant price, the expected future volatility and the expected term of the option and the risk-free interest rate of return over the estimated option period. The expected term and expected future volatility of the options require judgment. In addition, we are required to estimate the expected forfeiture rate and only recognize expense for those stock options expected to vest. We estimate the forfeiture rate based on historical experience and to the extent the actual forfeiture rate is different from the estimate, share-based compensation expense is adjusted accordingly.
New Accounting Pronouncements
In December 2010, the FASB issued ASC No. 2010-28, Intangibles—Goodwill and Other (Topic 350): When to Perform Step 2 of the Goodwill Impairment Test for Reporting Units with Zero or Negative Carrying Amounts (a consensus of the FASB Emerging Issues Task Force). ASU No. 2010-28 addresses questions about entities that have reporting units with zero or negative carrying amounts. The amendments modify Step 1 of the goodwill impairment test for reporting units with zero or negative carrying amounts. For those reporting units, an entity is required to perform Step 2 of the goodwill impairment test if it is more likely than not that a goodwill
48
impairment exists. In determining whether it is more likely than not that goodwill impairment exists, an entity should consider whether there are any adverse qualitative factors indicating that impairment may exist. The qualitative factors are consistent with the existing guidance and examples in paragraph 350-20-35-30, which requires that goodwill of a reporting unit be tested for impairment between annual tests if an event occurs or circumstances change that would more likely than not reduce the fair value of a reporting unit below its carrying amount. In addition, current GAAP will be improved by eliminating an entity’s ability to assert that a reporting unit is not required to perform Step 2 because the carrying amount of the reporting unit is zero or negative despite the existence of qualitative factors that indicate the goodwill is more likely than not impaired. As a result, goodwill impairments may be reported sooner than under current practice. The provisions of ASC No. 2010-28 are effective for fiscal years, and interim periods within those years, beginning after Dec. 15, 2010. Early adoption is not permitted. The Company does not expect the adoption of this ASU to have a material impact on its consolidated financial statements.
In December 2010, the FASB issued ASU No. 2010-29, Business Combinations (Topic 805) — Disclosure of Supplementary Pro Forma Information for Business Combinations. ASU No. 2010-29 clarifies that, when presenting comparative financial statements, SEC registrants should disclose revenue and earnings of the combined entity as though the current period business combinations had occurred as of the beginning of the comparable prior annual reporting period only. The amendments expand the supplemental pro forma disclosures to include a description of the nature and amount of material, nonrecurring pro forma adjustments directly attributable to the business combination included in the reported pro forma revenue and earnings. ASU 2010-29 is effective prospectively for material (either on an individual or aggregate basis) business combinations entered into in fiscal years beginning on or after December 15, 2010 with early adoption permitted. The Company is currently in the process of determining the impact, if any, of the adoption of the ASU on its consolidated financial statements.
In May 2011, the Financial Accounting Standards Board (“FASB”) issued Accounting Standards Update (“ASU”) No. 2011-04, “Fair Value Measurement (Topic 820): Amendments to Achieve Common Fair Value Measurement and Disclosure Requirements in U.S. GAAP and International Financial Reporting Standards” (“IFRS”). The amendments in this ASU generally represent clarification of Topic 820, but also include instances where a particular principle or requirement for measuring fair value or disclosing information about fair value measurements has changed. This update results in common principles and requirements for measuring fair value and for disclosing information about fair value measurements in accordance with GAAP and IFRS. The amendments are effective for interim and annual periods beginning after December 15, 2011 and are to be applied prospectively. Early application is not permitted. OCZ does not expect the adoption of ASU 2011-04 will have a material impact on the Company’s Condensed Consolidated Financial Statements.
In June 2011, the FASB issued ASU No. 2011-05, “Comprehensive Income (Topic 220): Presentation of Comprehensive Income” (amended further under ASU No. 2011-12 in December 2011). This guidance eliminates the current option to report other comprehensive income and its components in the statement of changes in equity. The guidance allows two presentation alternatives; present items in net income and other comprehensive income in one continuous statement, referred to as the statement of comprehensive income, or in two separate, but consecutive, statements of net income and other comprehensive income. This guidance is effective as of the beginning of a fiscal year that begins after December 15, 2011. Early adoption is permitted, but full retrospective application is required under both sets of accounting standards. The Company is currently evaluating which presentation alternative it will utilize.
In September 2011, the FASB issued ASU No. 2011-08, “Intangibles—Goodwill and Other (Topic 350): Testing Goodwill for Impairment”, which simplifies how entities test goodwill for impairment. Previous guidance under Topic 350 required an entity to test goodwill for impairment using a two-step process on at least an annual basis. First, the fair value of a reporting unit was calculated and compared to its carrying amount, including goodwill. Second, if the fair value of a reporting unit was less than its carrying amount, the amount of impairment loss, if any, was required to be measured. Under the amendments in this update, an entity has the
49
option to first assess qualitative factors to determine whether the existence of events or circumstances leads the entity to determine that it is more likely than not that its fair value is less than its carrying amount. If after assessing the totality of events or circumstances, an entity determines that it is not more likely than not that the fair value of the reporting unit is less than its carrying amount, then the two-step impairment test is unnecessary. If the entity concludes otherwise, then it is required to test goodwill for impairment under the two-step process as described in Topic 350 under paragraphs 350-20-35-4 and 350-20-35-9 under Topic 350. The amendments are effective for annual and interim goodwill impairment tests performed for fiscal years beginning after December 15, 2011 and early adoption is permitted. The Company has adopted this as of February 29, 2012.
In December 2011, the FASB issued Accounting Standards Update (ASU) No, 2011-11, Balance Sheet (Topic 210): Disclosures about Offsetting Assets and Liabilities. The amendments in this ASU require an entity to disclose information about offsetting and related arrangements on its financial position. This includes the effect or potential effect of rights of offset associated with an entity’s recognized assets and recognized liabilities and require improved information about financial instruments and derivative instruments that are either (1) offset in accordance with Section 210-20-45 or Section 815-10-45 or (2) subject to an enforceable master netting arrangement or similar agreement, irrespective of whether they are offset in accordance with Section 210-20-45 or Section 915-10-45. The amendments are effective for annual reporting periods beginning on or after January 1, 2013 and retrospective disclosure is required for all comparative periods presented. No early adoption is permitted. Currently, the Company does not enter into any right of offset arrangements and expects implementation to have little or no impact.
| ITEM 7A. | QUANTITATIVE AND QUALITATIVE DISCLOSURES ABOUT MARKET RISK |
Foreign Currency Exchange Risk
Although the functional currency of most our foreign entities is their local currency, we bill almost all of our sales for our products in U.S. dollars. Accordingly, our results of operations and cash flows are subject to a limited extent to fluctuations due to changes in foreign currency exchange rates. In the event our foreign sales and expenses increase, and we also increase our sales denominated in currencies other than U.S. dollars, our operating results may be more affected by fluctuations in the exchange rates of other currencies. The volatility of applicable rates is dependent on many factors that we cannot forecast with reliable accuracy. At this time we do not, but we may in the future, invest in derivatives or other financial instruments in an attempt to hedge our foreign currency exchange risk.
Interest Rate Sensitivity
Interest income and expense are sensitive to changes in the general level of U.S. interest rates. However, because our interest income historically has been negligible and we have no borrowings as of February 29, 2012, we believe that there is no material risk of exposure.
50
| ITEM 8. | FINANCIAL STATEMENTS AND SUPPLEMENTARY DATA |
INDEX TO CONSOLIDATED FINANCIAL STATEMENTS OF OCZ TECHNOLOGY GROUP, INC.
51
REPORT OF INDEPENDENT REGISTERED PUBLIC ACCOUNTING FIRM
To the Board of Directors and Stockholders
OCZ Technology Group, Inc.
We have audited the accompanying consolidated balance sheets of OCZ Technology Group, Inc. as of February 29, 2012 and February 28, 2011, and the related consolidated statements of operations, stockholders’ equity and comprehensive income (loss), and cash flows for each of the three years in the period ended February 29, 2012. These financial statements are the responsibility of the Company’s management. Our responsibility is to express an opinion on these financial statements based on our audits.
We conducted our audits in accordance with the standards of the Public Company Accounting Oversight Board (United States). Those standards require that we plan and perform the audit to obtain reasonable assurance about whether the financial statements are free of material misstatement. The Company is not required to have, nor were we engaged to perform, an audit of its internal control over financial reporting. Our audit included consideration of internal control over financial reporting as a basis for designing audit procedures that are appropriate in the circumstances, but not for the purpose of expressing an opinion on the effectiveness of the Company’s internal control over financial reporting. Accordingly, we express no such opinion. An audit includes examining, on a test basis, evidence supporting the amounts and disclosures in the financial statements. An audit also includes assessing the accounting principles used and significant estimates made by management, as well as evaluating the overall financial statement presentation. We believe that our audits provide a reasonable basis for our opinion.
In our opinion, the financial statements referred to above present fairly, in all material respects, the financial position of the Company as of February 29, 2012 and February 28, 2011, and the results of its operations and its cash flows for each of the three years in the period ended February 29, 2012, in conformity with U.S. generally accepted accounting principles.
/s/ Crowe Horwath LLP
Crowe Horwath LLP
Sherman Oaks, California
May 14, 2012
52
OCZ TECHNOLOGY GROUP, INC.
CONSOLIDATED BALANCE SHEETS
(in thousands, except share and per share data)
| | | | | | | | |
| | | February 29,
2012 | | | February 28,
2011 | |
Assets | | | | | | | | |
Current Assets: | | | | | | | | |
Cash and cash equivalents | | $ | 92,339 | | | $ | 17,514 | |
Restricted cash | | | 62 | | | | 1,300 | |
Accounts receivable, net of allowances of $6,416 and $2,881 | | | 72,543 | | | | 31,687 | |
Inventory, net | | | 108,664 | | | | 22,798 | |
Prepaid expenses and other current assets | | | 10,661 | | | | 2,875 | |
| | | | | | | | |
Total current assets | | | 284,269 | | | | 76,174 | |
Property and equipment, net | | | 4,998 | | | | 3,046 | |
Intangibles, net | | | 8,380 | | | | 18 | |
Goodwill | | | 60,914 | | | | 9,989 | |
Other assets | | | 142 | | | | 42 | |
| | | | | | | | |
Total assets | | $ | 358,703 | | | $ | 89,269 | |
| | | | | | | | |
LIABILITIES AND STOCKHOLDERS’ EQUITY | | | | | | | | |
Current liabilities: | | | | | | | | |
Loans payable | | $ | — | | | $ | 20,011 | |
Accounts payable | | | 88,093 | | | | 40,645 | |
Accrued and other liabilities | | | 12,749 | | | | 6,137 | |
| | | | | | | | |
Total current liabilities | | | 100,842 | | | | 66,793 | |
Common stock warrant liability | | | 11,087 | | | | 9,417 | |
Other long-term liabilities | | | 272 | | | | — | |
| | | | | | | | |
Total liabilities | | | 112,201 | | | | 76,210 | |
| | | | | | | | |
Commitments and contingencies (Note 11) | | | | | | | | |
Stockholders’ equity: | | | | | | | | |
Preferred stock, $0.0025 par value, 20,000,000 shares authorized; No shares issued or outstanding at fiscal years ended February 29, 2012 and February 28, 2011. | | | — | | | | — | |
Common stock, $0.0025 par value; 120,000,000 shares authorized; 66,581,428 and 35,401,908 shares issued and outstanding as of February 29, 2012 and February 28, 2011, respectively. | | | 166 | | | | 88 | |
Additional paid-in capital | | | 320,095 | | | | 68,749 | |
Accumulated deficit | | | (73,157 | ) | | | (55,490 | ) |
Accumulated other comprehensive loss | | | (602 | ) | | | (288 | ) |
| | | | | | | | |
Total stockholders’ equity | | | 246,502 | | | | 13,059 | |
| | | | | | | | |
Total liabilities and stockholders’ equity | | $ | 358,703 | | | $ | 89,269 | |
| | | | | | | | |
The accompanying notes are an integral part of these Consolidated Financial Statements.
53
OCZ TECHNOLOGY GROUP, INC.
CONSOLIDATED STATEMENTS OF OPERATIONS
(in thousands, except per share amounts)
| | | | | | | | | | | | |
| | | Year Ended February 29/28, | |
| | | 2012 | | | 2011 | | | 2010 | |
Net revenue | | $ | 365,774 | | | $ | 190,116 | | | $ | 143,959 | |
Cost of revenue | | | 283,338 | | | | 165,962 | | | | 125,303 | |
| | | | | | | | | | | | |
Gross profit | | | 82,436 | | | | 24,154 | | | | 18,656 | |
| | | | | | | | | | | | |
Research and development | | | 32,116 | | | | 7,677 | | | | 5,331 | |
Sales and marketing | | | 28,490 | | | | 15,270 | | | | 10,249 | |
General, administrative and operations | | | 27,946 | | | | 18,207 | | | | 14,711 | |
Impairment of goodwill and intangible assets | | | 38 | | | | — | | | | 911 | |
Acquisition related charges | | | 2,808 | | | | — | | | | — | |
Special inventory charge | | | 2,975 | | | | — | | | | — | |
| | | | | | | | | | | | |
Total operating expenses | | | 94,373 | | | | 41,154 | | | | 31,202 | |
| | | | | | | | | | | | |
Loss from operations | | | (11,937 | ) | | | (17,000 | ) | | | (12,546 | ) |
Other income (expense) - net | | | (132 | ) | | | (1,068 | ) | | | 727 | |
Interest and financing costs | | | (1,308 | ) | | | (3,174 | ) | | | (1,716 | ) |
Revaluation to fair value of common stock warrants | | | (4,290 | ) | | | (7,924 | ) | | | — | |
| | | | | | | | | | | | |
Loss before income taxes | | | (17,667 | ) | | | (29,166 | ) | | | (13,535 | ) |
Provision for (benefit from) income taxes | | | — | | | | 861 | | | | (1 | ) |
| | | | | | | | | | | | |
Net loss | | $ | (17,667 | ) | | $ | (30,027 | ) | | $ | (13,534 | ) |
| | | | | | | | | | | | |
Net loss per share: | | | | | | | | | | | | |
Basic | | $ | (0.35 | ) | | $ | (1.05 | ) | | $ | (0.64 | ) |
| | | | | | | | | | | | |
Diluted | | $ | (0.35 | ) | | $ | (1.05 | ) | | $ | (0.64 | ) |
| | | | | | | | | | | | |
Shares used in net loss per share computation: | | | | | | | | | | | | |
Basic | | | 50,900 | | | | 28,700 | | | | 21,300 | |
| | | | | | | | | | | | |
Diluted | | | 50,900 | | | | 28,700 | | | | 21,300 | |
| | | | | | | | | | | | |
The accompanying notes are an integral part of these Consolidated Financial Statements.
54
OCZ TECHNOLOGY GROUP, INC.
CONSOLIDATED STATEMENTS OF STOCKHOLDERS’ EQUITY AND COMPREHENSIVE INCOME (LOSS)
(in thousands)
| | | | | | | | | | | | | | | | | | | | | | | | | | | | | | | | |
| | | Preferred Stock | | | Common Stock | | | Additional | | | Accumulated
Other | | | | | | | |
| | | Shares
Number | | | Shares
Amount | | | Shares
Number | | | Shares
Amount | | | Paid-in
Capital | | | Comprehensive
(Loss) | | | Accumulated
Deficit | | | Stockholders’
Equity | |
Balance at February 28, 2009 | | | — | | | $ | — | | | | 21,278 | | | $ | 53 | | | $ | 30,911 | | | $ | (112 | ) | | $ | (11,929 | ) | | $ | 18,923 | |
Net Loss | | | — | | | | — | | | | — | | | | — | | | | — | | | | — | | | | (13,534 | ) | | | (13,534 | ) |
Currency translation | | | — | | | | — | | | | — | | | | — | | | | — | | | | (52 | ) | | | | | | | (52 | ) |
| | | | | | | | | | | | | | | | | | | | | | | | | | | | | | | | |
Comprehensive loss | | | | | | | | | | | | | | | | | | | | | | | | | | | | | | | (13,586 | ) |
| | | | | | | | | | | | | | | | | | | | | | | | | | | | | | | | |
Issuance of Common Stock under option award plans | | | — | | | | — | | | | — | | | | — | | | | 7 | | | | — | | | | — | | | | 7 | |
Issuance of Preferred Stock | | | 61 | | | | — | | | | — | | | | — | | | | 281 | | | | — | | | | — | | | | 281 | |
Stock based compensation | | | — | | | | — | | | | — | | | | — | | | | 663 | | | | — | | | | — | | | | 663 | |
| | | | | | | | | | | | | | | | | | | | | | | | | | | | | | | | |
Balance at February 28, 2010 | | | 61 | | | | — | | | | 21,278 | | | | 53 | | | | 31,862 | | | | (164 | ) | | | (25,463 | ) | | | 6,288 | |
| | | | | | | | | | | | | | | | | | | | | | | | | | | | | | | | |
Net Loss | | | — | | | | — | | | | — | | | | — | | | | — | | | | — | | | | (30,027 | ) | | | (30,027 | ) |
Currency translation | | | — | | | | — | | | | — | | | | — | | | | — | | | | (124 | ) | | | — | | | | (124 | ) |
| | | | | | | | | | | | | | | | | | | | | | | | | | | | | | | | |
Comprehensive loss | | | | | | | | | | | | | | | | | | | | | | | | | | | | | | | (30,151 | ) |
| | | | | | | | | | | | | | | | | | | | | | | | | | | | | | | | |
Issuance of derivative warrants | | | — | | | | — | | | | — | | | | — | | | | (2,081 | ) | | | — | | | | — | | | | (2,081 | ) |
Issuance of Common Stock | | | — | | | | — | | | | 12,539 | | | | 31 | | | | 34,718 | | | | — | | | | — | | | | 34,749 | |
Issuance of Common Stock for acquisition | | | — | | | | — | | | | 160 | | | | | | | | 644 | | | | — | | | | — | | | | 644 | |
Issuance of Common Stock under option award plans | | | — | | | | — | | | | 928 | | | | 2 | | | | 1,011 | | | | — | | | | — | | | | 1,013 | |
Issuance of Common Stock for warrants | | | — | | | | — | | | | 497 | | | | 2 | | | | 1,567 | | | | — | | | | — | | | | 1,569 | |
Conversion of Preferred stock into Common Stock | | | (61 | ) | | | — | | | | — | | | | — | | | | — | | | | — | | | | — | | | | — | |
Stock based compensation | | | — | | | | — | | | | — | | | | — | | | | 1,028 | | | | — | | | | — | | | | 1,028 | |
| | | | | | | | | | | | | | | | | | | | | | | | | | | | | | | | |
Balance at February 28, 2011 | | | — | | | | — | | | | 35,402 | | | | 88 | | | | 68,749 | | | | (288 | ) | | | (55,490 | ) | | | 13,059 | |
| | | | | | | | | | | | | | | | | | | | | | | | | | | | | | | | |
Net Loss | | | — | | | | — | | | | — | | | | — | | | | — | | | | — | | | | (17,667 | ) | | | (17,667 | ) |
Currency translation | | | — | | | | — | | | | — | | | | — | | | | — | | | | (314 | ) | | | — | | | | (314 | ) |
| | | | | | | | | | | | | | | | | | | | | | | | | | | | | | | | |
Comprehensive loss | | | | | | | | | | | | | | | | | | | | | | | | | | | | | | | (17,981 | ) |
| | | | | | | | | | | | | | | | | | | | | | | | | | | | | | | | |
Issuance of Common Stock in a public offering, net | | | — | | | | — | | | | 23,730 | | | | 59 | | | | 194,130 | | | | — | | | | — | | | | 194,189 | |
Issuance of Common Stock –acquisition of Indilinx | | | — | | | | — | | | | 4,161 | | | | 11 | | | | 32,193 | | | | — | | | | — | | | | 32,204 | |
Issuance of Common Stock –acquisition of Sanrad | | | — | | | | — | | | | 2,088 | | | | 5 | | | | 16,912 | | | | — | | | | — | | | | 16,917 | |
Issuance of Common Stock under option award plans | | | — | | | | — | | | | 819 | | | | 2 | | | | 1,678 | | | | — | | | | — | | | | 1,680 | |
Issuance of Common Stock for warrants | | | — | | | | — | | | | 381 | | | | 1 | | | | 2,852 | | | | — | | | | — | | | | 2,853 | |
Stock based compensation | | | — | | | | — | | | | — | | | | — | | | | 3,581 | | | | — | | | | — | | | | 3,581 | |
| | | | | | | | | | | | | | | | | | | | | | | | | | | | | | | | |
Balance at February 29, 2012 | | | — | | | $ | — | | | | 66,581 | | | $ | 166 | | | $ | 320,095 | | | $ | (602 | ) | | $ | (73,157 | ) | | $ | 246,502 | |
| | | | | | | | | | | | | | | | | | | | | | | | | | | | | | | | |
The accompanying notes are an integral part of these Consolidated Financial Statements.
55
OCZ TECHNOLOGY GROUP, INC.
CONSOLIDATED STATEMENTS OF CASH FLOWS
(in thousands)
| | | | | | | | | | | | |
| | | Year Ended February 29/28, | |
| | | 2012 | | | 2011 | | | 2010 | |
Cash flows from operating activities: | | | | | | | | | | | | |
Net loss | | $ | (17,667 | ) | | $ | (30,027 | ) | | $ | (13,534 | ) |
Adjustments to reconcile net loss to net cash (used in) provided by operating activities: | | | | | | | | | | | | |
Depreciation of property and equipment | | | 1,708 | | | | 1,116 | | | | 1,009 | |
Amortization of intangibles | | | 589 | | | | 70 | | | | 111 | |
Impairment of goodwill and intangible assets | | | 38 | | | | — | | | | 911 | |
Accounts receivable allowances | | | 6,008 | | | | 1,260 | | | | 644 | |
Stock-based compensation | | | 3,581 | | | | 1,028 | | | | 663 | |
Revaluation of common stock warrants | | | 4,290 | | | | 7,924 | | | | — | |
Deferred income taxes | | | — | | | | 836 | | | | — | |
Net loss on disposal of property and equipment | | | 755 | | | | 644 | | | | 104 | |
Loss (gain) on disposition of product line | | | — | | | | 1,043 | | | | (668 | ) |
Inventory reserve | | | 6,702 | | | | 2,381 | | | | — | |
Changes in operating assets and liabilities, net of effect of acquisitions: | | | | | | | | | | | | |
Accounts receivable | | | (46,786 | ) | | | (12,567 | ) | | | 2,971 | |
Inventory | | | (92,473 | ) | | | (15,333 | ) | | | 6,566 | |
Prepaid expenses and other assets | | | (7,680 | ) | | | (1,064 | ) | | | 301 | |
Accounts payable | | | 46,923 | | | | 14,327 | | | | 924 | |
Accrued and other liabilities | | | 3,886 | | | | 1,748 | | | | 638 | |
| | | | | | | | | | | | |
Net cash (used in) provided by operating activities | | | (90,126 | ) | | | (26,614 | ) | | | 640 | |
| | | | | | | | | | | | |
Cash flows from investing activities: | | | | | | | | | | | | |
Property and equipment purchases | | | (3,462 | ) | | | (1,533 | ) | | | (887 | ) |
Purchased Intangibles | | | (2,490 | ) | | | | | | | | |
Acquisition of Indilinx, net of cash received | | | (14 | ) | | | — | | | | — | |
Acquisition of PLX UK Design Team | | | (2,200 | ) | | | — | | | | — | |
Acquisition of Sanrad, net of cash received | | | 731 | | | | — | | | | — | |
(Increase) decrease in deposits | | | — | | | | (4 | ) | | | 50 | |
Asset acquisition earn out payments | | | — | | | | (35 | ) | | | (454 | ) |
| | | | | | | | | | | | |
Net cash used in investing activities | | | (7,435 | ) | | | (1,572 | ) | | | (1,291 | ) |
| | | | | | | | | | | | |
Cash flows from financing activities: | | | | | | | | | | | | |
Proceeds from issuance of common stock, net | | | 194,189 | | | | 34,749 | | | | 7 | |
Proceeds from issuance of preferred stock | | | — | | | | — | | | | 281 | |
Proceeds from employee stock programs, net | | | 1,680 | | | | 1,013 | | | | — | |
Proceeds from exercise of warrants for common shares | | | 233 | | | | 981 | | | | — | |
Proceeds from (repayments of) bank loan, net | | | (24,934 | ) | | | 9,657 | | | | 919 | |
Restricted cash for letters of credit | | | 1,238 | | | | (1,300 | ) | | | — | |
(Repayment) increase of shareholder loan | | | — | | | | (500 | ) | | | 500 | |
Repayment of notes payable | | | — | | | | — | | | | (200 | ) |
| | | | | | | | | | | | |
Net cash provided by financing activities | | | 172,406 | | | | 44,600 | | | | 1,507 | |
| | | | | | | | | | | | |
Effect of foreign exchange rate changes on cash and cash equivalents | | | (20 | ) | | | (124 | ) | | | (52 | ) |
| | | | | | | | | | | | |
Net increase in cash and cash equivalents | | | 74,825 | | | | 16,290 | | | | 804 | |
Cash and cash equivalents at beginning of period | | | 17,514 | | | | 1,224 | | | | 420 | |
| | | | | | | | | | | | |
Cash and cash equivalents at end of period | | $ | 92,339 | | | $ | 17,514 | | | $ | 1,224 | |
| | | | | | | | | | | | |
Supplemental disclosures: | | | | | | | | | | | | |
Interest paid | | $ | 434 | | | $ | 1,286 | | | $ | 823 | |
Income taxes paid | | | — | | | | 25 | | | | — | |
Non-cash investing and financing activities: | | | | | | | | | | | | |
Issuance of common stock for Indilinx acquisition | | | 32,204 | | | | — | | | | — | |
Issuance of common stock for Sanrad acquisition | | | 16,917 | | | | — | | | | — | |
Issuance of common stock for cashless warrant exercises | | | 2,620 | | | | 588 | | | | — | |
The accompanying notes are an integral part of these Consolidated Financial Statements.
56
OCZ TECHNOLOGY GROUP, INC.
NOTES TO THE CONSOLIDATED FINANCIAL STATEMENTS
OCZ Technology Group, Inc., a Delaware corporation (“OCZ”) was formed in 2002. OCZ is a leader in the design, manufacturing, and distribution of high performance and reliable Solid-State Drives (“SSDs’’) and premium computer components. OCZ has built on its expertise in high-speed memory to become a leader in the enterprise and consumer SSD markets, a technology that competes with traditional rotating magnetic hard disk drives (“HDDs’’). SSDs are faster, more reliable, generate less heat and use significantly less power than the HDDs used in the majority of computers today. OCZ designs and manufactures SSDs in a variety of form factors and interfaces including SATA, SAS, PCIe, as well as flash caching and virtualization software to provide a total solution for enterprise clients. In addition to SSD technology, OCZ also offers enterprise-class power management products. During fiscal year ended February 29, 2012, OCZ completed three strategic acquisitions including Indilinx Co., Ltd, a Korean company in March 2011, a UK based research and development Design Team in October 2011 from PLX Technology Inc. and Sanrad Inc., with principal operations in Israel, in January 2012. These acquisitions were strategic opportunities from a technology and competitive standpoint and we expect them to add considerably to our operating leverage as we move forward.
| 2. | Summary of Significant Accounting Policies |
Basis of preparation
The accompanying consolidated financial statements include the accounts of OCZ and its wholly-owned subsidiaries in Canada, Israel, Korea and the United Kingdom. All significant intercompany transactions and balances have been eliminated. OCZ’s fiscal year begins on March 1 and ends on February 28 or 29. The significant accounting policies used in the preparation of the financial statements are summarized below.
Reclassifications
Certain prior year balances and account groupings have been reclassified to conform to the current year presentation. There was no material impact on previously reported total assets, total liabilities, stockholders’ equity, net results from operations or cash flows.
Use of estimates
The preparation of these financial statements in conformity with generally accepted accounting principles (“GAAP’’) in the United States of America requires management to make estimates, assumptions and exercise judgement that affect the reported amounts of assets, liabilities, revenues and expenses and related note disclosures. The level of uncertainty in estimates and assumptions increases with the length of time until the underlying transactions are completed. Actual results may differ from those estimates.
On an ongoing basis, we evaluate our estimates, including, among others, those related to bad debts and other related allowances, inventories and related reserves, income taxes, warranty obligations, stock compensation, contingencies and litigation. We base our estimates on historical experience and on other assumptions that we believe are reasonable under the circumstances, the results of which form the basis for our judgments about the carrying values of assets and liabilities when those values are not readily apparent from other sources. Estimates have historically approximated actual results. However, future results will differ from these estimates under different assumptions and conditions.
Cash equivalents
Cash equivalents are considered highly liquid investments purchased with an original maturity of three months or less.
57
Restricted Cash
Restricted cash represents amounts designated for uses other than current operations. As of fiscal year ended February 29, 2012, approximately $62,000 of cash was restricted for irrevocable letters of credit related to the lease of our Corporate Headquarters in San Jose, California. As of February 28, 2011, approximately $1.3 million of cash was restricted for irrevocable letters of credit related to future inventory purchases.
Concentration of credit risks
Financial instruments which potentially subject us to concentrations of credit risk consist of cash and cash equivalents and accounts receivable. We maintain credit insurance on the majority of our receivables. During the periods presented herein, we had deposits in banks in excess of the Federal Deposit Insurance Corporation insurance limit. We have not experienced any losses in such accounts, and do not believe we are exposed to any significant risk on trade receivables, cash and cash equivalents.
Comprehensive income (loss)
Comprehensive income (loss) consists of net income (loss) and other comprehensive income (loss). Other comprehensive income (loss) consists of foreign currency translation adjustments, which are also recognized as a separate component of stockholders’ equity. Comprehensive loss as of February 29, 2012, February 28, 2011 and February 28, 2010 consists of the following components, net of related tax effects:
| | | | | | | | | | | | |
| | | Year Ended | |
| | | February 29,
2012 | | | February 28,
2011 | | | February 28,
2010 | |
| | | (In thousands) | |
Net loss | | $ | (17,667 | ) | | $ | (30,027 | ) | | $ | (13,534 | ) |
Change in unrealized loss on foreign currency translation adjustments, net of tax effect | | | (314 | ) | | | (124 | ) | | | (52 | ) |
| | | | | | | | | | | | |
Comprehensive loss | | $ | (17,981 | ) | | $ | (30,151 | ) | | $ | (13,586 | ) |
| | | | | | | | | | | | |
Trade accounts receivable and allowances
Trade accounts receivable is stated at the amount which management expects to collect and do not bear interest. OCZ records trade accounts receivable at invoiced amounts and maintains a valuation allowance for doubtful accounts and estimated product returns. Management considers the following factors when determining the collectability of specific customer accounts: customer credit worthiness, transaction history, current economic trends and customer insurability. OCZ has historically purchased credit insurance for the majority of our customer accounts. Total allowances for doubtful accounts as of February 29, 2012 and February 28, 2011 were approximately $2.0 million and $1.5 million, respectively. Total other accounts receivable allowances including estimated product returns as of February 29, 2012 and February 28, 2011 were approximately $4.4 million and $1.4 million, respectively.
Inventory
Inventory is stated at the lower of cost or market using the average cost method. OCZ establishes provisions for excess and obsolete inventories to reduce such inventories to their estimated net realizable value after evaluation of historical sales, future demand, market conditions and expected product life cycles. Such provisions are charged to cost of revenue in the Consolidated Statements of Operations.
During the first quarter of fiscal 2012, we recorded a special inventory charge of approximately $3.0
million. This adjustment was to write-off prior generation SSD products and related components which were part of a bill of materials targeted toward the low margin consumer markets rather than the higher margin
58
enterprise markets which we began targeting, particularly as a result of the equity funding completed in April 2011. This strategy change was adopted late in May 2011 and was the result of various product roadmap collaboration meetings with Indilinx beginning after the acquisition closed on March 25, 2011. The key business requirement was to have the newly combined R&D teams focus on future product development for the enterprise markets.
Property and equipment
Property and equipment is recorded at cost. The cost of maintenance and repairs is expensed as incurred. Depreciation and amortization is computed using the straight line method over the estimated useful lives of the assets as follows:
| | |
| Vehicles | | 3 years |
| Furniture and fixtures | | 3 — 5 years |
| Equipment | | 3 — 5 years |
| Leasehold improvements | | Shorter of remaining lease term or estimated useful life. |
Goodwill
Goodwill represents the excess of the purchase price over the estimated fair value of the identifiable assets acquired and liabilities assumed in business acquisitions. Goodwill is reviewed at least annually for impairment in the fourth quarter of the fiscal year, at the Company level, which is the sole reporting unit, and at any other time at which events occur or circumstances indicate that the carrying amount of goodwill may exceed its fair value. Such indicators would include a significant reduction in the Company’s market capitalization, a decrease in operating results or a deterioration in the Company’s financial position. Based on our analysis, we did not record any impairment charge during the fiscal years ended February 29, 2012 and February 28, 2011. As of February 29, 2012, we had $60.9 million of goodwill.
Impairment of long-lived assets
Long-lived assets consist of property and equipment and purchased intangible assets. Purchased intangible assets from business combinations include trademarks and tradenames, customer relationships, the amortization of which is charged to sales and marketing expenses, and core and developed technology, the amortization of which is charged to cost of revenue. During the fourth quarter of the fiscal year, OCZ evaluates the recoverability of assets to be held and used by comparing the carrying amount of the asset to estimated future net undiscounted cash flows expected to be generated by the asset. Impairment is recognized to the extent the sum of the expected future undiscounted cash flows is less than the carrying amount of the asset.
Income taxes
Income taxes are accounted for using an asset and liability approach whereby deferred tax assets and liabilities are recorded for differences in the financial reporting bases and tax bases of assets and liabilities. If it is more likely than not that some portion of deferred tax assets will not be realized, a valuation allowance is recorded.
GAAP prescribes a comprehensive model for how companies should recognize, measure, present, and disclose in their financial statements uncertain tax positions taken or expected to be taken on a tax return. Tax positions shall initially be recognized in the financial statements when it is more likely than not the position will be sustained upon examination by the tax authorities. Such tax positions shall initially and subsequently be measured as the largest amount of tax benefit that is greater than 50% likely of being
59
realized upon ultimate settlement with the tax authority assuming full knowledge of the position and all relevant facts. It is management’s policy to recognize interest and penalties related to tax uncertainties to income tax expense. We have no amounts accrued for interest or penalties as of February 29, 2012 and do not expect the total amount of unrecognized tax benefits to significantly change in the next 12 months.
We do not file consolidated tax returns, however, we do file tax returns in other applicable international jurisdictions.
All tax periods after February 28, 2008 remain open and subject to audit by the IRS. All tax periods after December 31, 2006 remain open and subject to audit by the State of California.
Fair value of financial instruments
The carrying value of OCZ’s financial instruments, including cash equivalents, accounts receivable, accounts payable, certain accrued liabilities and loans payable approximate fair value due to their short maturities.
Revenue recognition
We record product revenue net of allowances for returns, product rebates, sales credits, and marketing development funds. Revenue is recognized when there is persuasive evidence of an arrangement, product shipment by a common carrier has occurred, risk of loss has passed, the terms are fixed and collection is probable. We generally use customer purchase orders and/or contracts as evidence of an arrangement and the underlying payment terms to determine if the sales price is fixed. We also purchase credit insurance for the majority of our accounts.
Probability of collection is assessed for each customer as it is subjected to a credit review process that evaluates the customer’s financial position, ability to pay, and the potential coverage by our credit insurer. If it is determined from the outset of an arrangement that collection is not probable, the customer is required to pay cash in advance of shipment. We provide for price protection credits on a case-by-case basis after assessing the market competition and product technology obsolescence. These credits are recorded as a reduction to revenue at the time we reduce the product prices.
Deferred income
During the fiscal years ended February 28, 2011 and 2010, OCZ offered terms to a certain customer which deferred revenue recognition of sales transactions until such time that our customer sold the product to its end customers. We deferred the profit margin related to those shipments totaling $995,000 and $453,000, as of February 28, 2011 and 2010, respectively, for this customer arrangement. The revenue and related cost of revenue were removed from the financial statements for the fiscal years ended February 28, 2011 and 2010, resulting in deferred margin. Deferred margin as of fiscal years ended February 28, 2011 and 2010 was $215,000 and $95,000, respectively; which was included in accrued and other liabilities. During fiscal year 2012, OCZ amended its agreement with this certain customer which resulted in no deferral of revenue or cost of revenue as of February 29, 2012.
Research and development costs
Costs of researching and developing new technology or significantly altering existing technology are expensed as incurred.
Shipping and handling
For the fiscal years ended February 29, 2012, February 28, 2011 and February 28, 2010, shipping and handling costs were approximately $4.4 million, $2.7 million and $2.8 million, respectively, and were
60
recorded in general, administrative and operations expense. Shipping and handling costs charged to customers were recorded as a reduction to general, administrative and operations expense and were insignificant during fiscal years ended February 29, 2012, February 28, 2011 and February 28, 2010.
Advertising
OCZ engages in a variety of methods of advertising and marketing media which generally includes ad placement in periodicals, internet-based advertising, and customer marketing arrangements. Advertising costs are recorded as either a sales and marketing expense or a deduction from revenue. Advertising costs reimbursed by the Company to a customer must have an identifiable benefit to the Company and an established fair value in order to be classified as an operating expense. If these criteria are not met, the cost is classified as a reduction from revenue. Advertising costs are expensed as incurred and in the fiscal years ended February 2012, 2011 and 2010 these costs, including customer marketing arrangements, were approximately $14.4 million, $8.2 million and $3.5 million, respectively.
Currency translation
The majority of our sales are invoiced in United States Dollars (“USD”). Invoices in Euro and British Pound were insignificant during the fiscal years ended February 29, 2012, February 28, 2011 and February 28, 2010.
The functional currency of our Canadian, Korean and UK entities is their local currency. All of our other foreign operations functional currency is the USD. When the local currency is the functional currency, gains and losses from translation of these foreign currency financial statements into US dollars are recorded as a separate component of other comprehensive income (loss) in stockholders’ equity. For subsidiary and branch operations where the functional currency is the US dollar, gains and losses resulting from remeasurement of foreign currency denominated balances into US dollars are included in other income (expense), net. Foreign currency transaction gains and (losses) for the fiscal years ended February 2012, 2011 and 2010 were approximately $170,000, $(195,000) and $111,000, respectively and were included in other income (expense), net in the accompanying Consolidated Statement of Operations for the fiscal years ended February 2012, 2011, and 2010, respectively.
Product warranties
We offer our customers warranties on certain products sold to them. These warranties typically provide for the replacement of products if they are found to be faulty within a specified period. Concurrent with the sale of products, a provision for estimated warranty expenses is recorded with a corresponding increase in cost of goods sold. The provision is adjusted periodically based on historical and anticipated experience. Actual expense of replacing faulty products under warranty, including parts and labor, are charged to this provision when incurred.
Stock-based compensation
OCZ measures and recognizes compensation expense for all stock based compensation awards based upon the grant-date fair value of those awards. Fair value is estimated using the Black-Scholes model. Compensation expense for stock options is recognized on the straight-line basis over the requisite service period.
The amount of compensation expense recognized using the Black-Scholes model requires us to exercise judgment and make assumptions relating to the factors that determine the fair value of stock option grants. The fair value calculated by this model is a function of several factors, including the grant price, the expected future volatility and the expected term of the option and the risk-free interest rate of the option. The expected term and expected future volatility of the options require judgment. In addition, we are required to estimate the expected forfeiture rate and only recognize expense for those stock options expected
61
to vest. We estimate the forfeiture rate based on historical experience and to the extent the actual forfeiture rate is different from the estimate, share-based compensation expense is adjusted accordingly.
Stock based compensation charged to expenses was approximately $3.6 million, $1.0 million and $0.7 million for the fiscal years ended February 2012, 2011 and 2010, respectively. As of February 29, 2012, total unamortized stock-based compensation costs related to non-vested options amounted to approximately $13 million and will be recognized in future periods through February 2016.
The fair value of options grants was determined using the Black-Scholes option pricing model with the following assumptions:
| | | | | | | | | | | | |
| | | Year Ended | |
| | | February 29,
2012 | | | February 28,
2011 | | | February 28,
2010 | |
Expected life (in years) | | | 4.19 | | | | 4.40 | | | | 4.28 | |
Expected Volatility | | | 78 | % | | | 45 | % | | | 58 | % |
Risk-free interest rate | | | 1.2 | % | | | 1.9 | % | | | 2.0 | % |
Dividend yield | | | 0.0 | % | | | 0.0 | % | | | 0.0 | % |
| 3. | Recent Accounting Pronouncements |
In December 2010, the FASB issued updated accounting guidance related to the calculation of the carrying amount of a reporting unit when performing the first step of a goodwill impairment test. More specifically, this update will require an entity to use an equity premise when performing the first step of a goodwill impairment test, and if a reporting unit has a zero or negative carrying amount, the entity must assess and consider qualitative factors and whether it is more likely than not that a goodwill impairment exists. The new accounting guidance is effective for public entities, for impairment tests performed during entities’ fiscal years (and interim periods within those years) that begin after December 15, 2010. The adoption of this guidance did not have any impact on the Company’s results of operations or financial position.
In December 2010, the FASB issued updated accounting guidance to clarify that pro forma disclosures should be presented as if a business combination occurred at the beginning of the prior annual period for purposes of preparing both the current reporting period and the prior reporting period pro forma financial information. These disclosures should be accompanied by a narrative description about the nature and amount of material, non-recurring pro forma adjustments. The new accounting guidance is effective for business combinations consummated in periods beginning after December 15, 2010 and should be applied prospectively as of the date of adoption. The adoption of this guidance is reflected in the pro forma disclosures in Note 4.
In May 2011, the FASB issued new accounting guidance that amends some fair value measurement principles and disclosure requirements. The new guidance states that the concepts of highest and best use and valuation premise are only relevant when measuring the fair value of non-financial assets and prohibits the grouping of financial instruments for purposes of determining their fair values when the unit of account is specified in other guidance. Early application is not permitted for public companies. The Company will adopt this guidance upon its effective date for periods beginning after December 15, 2011 and does not anticipate that this adoption will have a significant impact on the Company’s financial position or results of operations.
In June 2011, the FASB issued new disclosure guidance related to the presentation of the Statement of Comprehensive Income. This guidance eliminates the current option to report other comprehensive income and its components in the statement of changes in equity. In December 2011, the FASB issued revised accounting guidance, which deferred the guidance relating to the presentation of reclassification adjustments. All other requirements of the previously issued guidance were not affected by the issuance of this revised guidance. The Company will adopt this guidance upon its effective date for periods ending on or after December 15, 2011, and does not anticipate that this adoption will have any impact on the Company’s financial position or results of operations.
62
In September 2011, the FASB issued new accounting guidance intended to simplify goodwill impairment testing. Entities will be allowed to perform a qualitative assessment on goodwill impairment to determine whether a quantitative assessment is necessary. This guidance is effective for the Company’s interim and annual periods beginning January 1, 2012. Early adoption of the standard is permitted. The Company will adopt this standard for the annual period beginning March 1, 2012. The adoption of this guidance is not expected to have a material effect on the Company’s consolidated financial statements.
Indilinx
On March 25, 2011, OCZ completed the acquisition of 100% of the equity interests of Indilinx Co., Ltd., (“Indilinx”) a privately-held company organized under the laws of the Republic of Korea. Indilinx’s products and solutions are comprised of advanced solid state drive (“SSD”) controllers, SSD reference designs, and software, which enable the rapid development and deployment of high performance solid state drives. The technology powers a wide range of storage solutions from cost-sensitive consumer devices to performance-optimized systems demanded by mission-critical enterprise applications. At the time of acquisition, Indilinx’s products included the Barefoot SSD controller which meets the demanding performance requirements of PC and Server applications and also helps facilitate the use of new high performance NAND flash memory, and the Amigos SSD controller which is ideally suited for embedded systems, mobile PCs, and other applications which require the speed, reliability, and power benefits of SSDs in a smaller form factor and at lower price points.
The acquisition of Indilinx is expected to expand OCZ’s presence in the embedded, hybrid storage, and industrial markets. The acquisition is also intended to broaden OCZ’s intellectual property resulting from Indilinx’s portfolio of approximately 26 patents and patent applications. In addition, the acquisition provided an assembled workforce, the implicit value of future cost savings as a result of combining entities, and is expected to provide OCZ with future unidentified new products and technologies. These opportunities were significant factors to the establishment of the purchase price, which exceeded the fair value of Indilinx’s net tangible and intangible assets acquired, resulting in goodwill of approximately $36.8 million that was recorded in connection with this acquisition.
The purchase price, net of $0.6 million of cash acquired, was $32.2 million, which consisted of (i) 4.2 million shares of OCZ common stock with a total fair value of approximately $32.2 million, based on the price of OCZ common stock at the time of close, and (ii) approximately $0.6 million of cash paid, representing the fair value of outstanding vested and unvested stock options of Indilinx. The unvested stock options of Indilinx represented the fair value attributed to Indilinx equity awards for which services had already been substantially rendered as of the close of the acquisition. The cash portion of the purchase price was paid from existing cash balances. The Company also incurred a total of $1.7 million of transaction costs which were primarily general and administrative in nature in the quarter ended May 31, 2011. These transaction costs are classified as “Acquisition related charges” on the Consolidated Statement of Operations for the year ended February 29, 2012.
The assets and liabilities of Indilinx were recorded at fair value at the date of acquisition. The Company will continue to evaluate certain assets and liabilities as new information is obtained about facts and circumstances that existed as of the acquisition date and, if known, would have resulted in the recognition of those assets and liabilities as of that date. Changes to the assets and liabilities recorded may result in a corresponding adjustment to goodwill, and the measurement period will not exceed one year from the acquisition date. Further, any associated restructuring activities will be expensed in future periods and not recorded through purchase accounting. There were no contingent consideration arrangements in connection with the acquisition.
63
The results of operations of Indilinx are included in OCZ’s Consolidated Statements of Operations from March 25, 2011, the date of acquisition. The following table summarizes the allocation of the purchase price based on the fair value of the assets acquired and the liabilities assumed at the date of acquisition:
| | | | |
| | | (In thousands) | |
Cash acquired | | $ | 554 | |
Other current assets | | | 170 | |
Fixed assets | | | 431 | |
Other tangible assets acquired | | | 216 | |
Intangible assets: | | | | |
Existing technology | | | 64 | |
In-process technology | | | 1,520 | |
Customer lists and related relationships | | | 75 | |
Trademarks and trade names | | | 125 | |
Goodwill | | | 36,845 | |
| | | | |
Total assets acquired | | | 40,000 | |
Loans payable | | | (4,381 | ) |
Accounts payable | | | (519 | ) |
Other accrued liabilities | | | (2,327 | ) |
| | | | |
Net assets acquired | | | 32,773 | |
Less: cash acquired | | | (554 | ) |
| | | | |
Net purchase price | | $ | 32,219 | |
| | | | |
The purchase price set forth in the table above was allocated based on the fair value of the tangible and intangible assets acquired, and liabilities assumed, as of March 25, 2011. The Company used an overall discount rate of approximately 15% to estimate the fair value of the intangible assets acquired, which was derived based on financial metrics of comparable companies operating in Indilinx’s industry. In determining the appropriate discount rates to use in valuing each of the individual intangible assets, the Company adjusted the overall discount rate giving consideration to the specific risk factors of each asset. The following methods were used to value the identified intangible assets:
| | • | | The fair value of the existing technology assets acquired was established based on their highest and best use by a market participant using the “Royalty Savings Method”. In the Royalty Savings Method, the value of an asset is estimated by capitalizing the royalties saved because the Company owns the asset. Expected cash flows were discounted at the Company’s weighted average cost of capital of 15%; |
| | • | | As of the acquisition date, Indilinx was developing new versions and incremental improvements to its Barefoot product and the next generation SSD products. The in-process projects were at a stage of development that required further research and development to determine technical feasibility and commercial viability. The fair value of the in-process technology assets acquired was based on the valuation premise that the assets would be “In-Use” using a discounted cash flow model; |
| | • | | The fair value of the customer contracts and related relationships assets acquired was based on the Royalty Savings Method; |
| | • | | The fair value of trade names/trademarks assets acquired was established based on the Royalty Savings Method. |
64
Identified intangible assets are being amortized over the following useful lives:
| | • | | Existing technology is estimated to have a useful life of one year; |
| | • | | In-process technology will be amortized upon completion over its projected remaining useful life as assessed on the completion date. The completion of the in-process projects are expected within the next twelve months; |
| | • | | Customer contracts and related relationships are being amortized over their estimated useful life of five years; |
| | • | | Trade names/trademarks are being amortized over their estimated useful life of ten years. |
The existing technology, patents/core technology, customer contracts, and related relationships and trade names/trademarks are amortized using the straight-line method, which reflects future projected cash flows.
During the fiscal year ended February 29, 2012, two in-process technology projects were completed. Research and development efforts related to the first project completed focused on a flash storage controller for portable devices in which further development efforts were subsequently terminated resulting in an impairment charge of approximately $38,000 in fiscal year February 2012 because the project did not align with the current OCZ product strategy. The second in-process technology project, which was completed successfully in December 2011, was related to the Everest 2 controller platform which delivers industry-best performance SATA-based drives. The fair value associated with this existing technology is approximately $681,000 and was amortized on a straight-line basis to cost of revenue beginning in December 2011 over its projected useful life of five years.
The residual purchase price of $36.8 million has been recorded as goodwill related to the acquisition of Indilinx.
PLX UK Design Team
On October 24, 2011, we completed the acquisition of the UK Design Team and certain assets and liabilities from PLX Technology Inc. This transaction has further strengthened the Company’s global research and development team and provides further access to advanced technology in an effort to accelerate solid state development, reducing the time to market for the next generation of SSD products, while also reducing development costs. Pursuant to the agreement, OCZ obtained a non-exclusive perpetual license related to consumer storage technology, capital equipment and the UK Design Team workforce, which consists of approximately 40 engineers located in Abingdon, United Kingdom in exchange for cash consideration of $2.2 million. The Company also incurred a total of approximately $0.2 million of transaction costs which were primarily general and administrative in nature and such costs are classified as “Acquisition related charges” on the Consolidated Statement of Operations for the year ended February 29, 2012.
The following table summarizes the allocation of the purchase price based on the fair value of the assets acquired and the liabilities assumed at the date of acquisition:
| | | | |
| | | (In thousands) | |
Prepaid assets | | $ | 20 | |
Fixed assets | | | 499 | |
Intellectual property technology license | | | 1,015 | |
Goodwill | | | 794 | |
| | | | |
Total assets acquired | | | 2,328 | |
Accrued liabilities | | | (128 | ) |
| | | | |
Net purchase price | | $ | 2,200 | |
| | | | |
The purchase price set forth in the table above was allocated based on the fair value of the tangible and intangible assets acquired, and liabilities assumed, as of October 24, 2011.
65
Ralph Schmitt, PLX Technology Inc.’s CEO, is also a member of OCZ’s Board of Directors. Throughout the term of the negotiations and up to the date of the acquisition, he removed himself from all discussions and had no authority to make decisions or influence the outcome of the arrangement.
On November 10, 2011, OCZ UK Limited was formed in the United Kingdom and all employees and acquired assets were transferred into this new entity. The results of operations from the acquisition of the UK Design Team are included in OCZ’s Consolidated Statements of Operations from October 24, 2011, the date of acquisition.
Sanrad
On January 9, 2012, OCZ completed the acquisition of 100% of the equity interests of Sanrad Inc., (“Sanrad”) a United States based privately-held company and its wholly-owned subsidiary organized under the laws of Israel. Sanrad’s products and solutions are comprised of cutting-edge cloud storage acceleration and virtualization software and hardware for datacenters. Sanrad’s virtualization software and solutions transforms storage access in virtualized environments with NAND flash allowing data centers to fully leverage their storage investments. At the time of acquisition, Sanrad’s products included VXL software which is deployed as a virtual appliance on the host server, distributing FLASH resources on demand across application virtual machines to maximize the performance of key applications.
The acquisition of Sanrad is expected to expand OCZ’s presence in the enterprise solid state drive strategy and is expected to accelerate the adoption of OCZ’s PCIe-based flash storage solutions in virtualized environments. The acquisition is also intended to broaden OCZ’s intellectual property resulting from Sanrad’s portfolio of three key patents and patent applications. In addition, the acquisition provided an assembled workforce, the implicit value of future cost savings as a result of combining entities, and is expected to provide OCZ with future unidentified new products and technologies. These opportunities were significant factors to the establishment of the purchase price, which exceeded the fair value of Sanrad’s net tangible and intangible assets acquired, resulting in goodwill of approximately $13.3 million that was recorded in connection with this acquisition.
The purchase price, net of $0.7 million of cash acquired, was approximately $16.2 million, which consisted of approximately 2.1 million shares of OCZ common stock with a total fair value of $16.9 million, based on the price of OCZ common stock at the time of close which was $8.10. The Company also incurred a total of approximately $0.9 million of transaction costs which were primarily general and administrative in nature in the year ended February 29, 2012. These transaction costs are classified as “Acquisition related charges” on the Consolidated Statement of Operations for the year ended February 29, 2012.
The assets and liabilities of Sanrad were recorded at fair value at the date of acquisition. The Company will continue to evaluate certain assets and liabilities as new information is obtained about facts and circumstances that existed as of the acquisition date and, if known, would have resulted in the recognition of those assets and liabilities as of that date. Changes to the assets and liabilities recorded may result in a corresponding adjustment to goodwill, and the measurement period will not exceed one year from the acquisition date. Further, any associated restructuring activities will be expensed in future periods and not recorded through purchase accounting. There are no contingent consideration arrangements in connection with the acquisition.
The results of operations of Sanrad are included in OCZ’s Consolidated Statements of Operations from January 9, 2012, the date of acquisition.
66
The following table summarizes the allocation of the purchase price based on the fair value of the assets acquired and the liabilities assumed at the date of acquisition:
| | | | |
| | | (In thousands) | |
Cash and cash equivalents | | $ | 731 | |
Other current assets | | | 150 | |
Fixed assets | | | 23 | |
Intangible assets: | | | | |
Existing technology | | | 3,600 | |
Trade names/trademarks | | | 100 | |
Goodwill | | | 13,286 | |
| | | | |
Total assets acquired | | | 17,890 | |
Accrued liabilities | | | (973 | ) |
| | | | |
Net assets acquired | | | 16,917 | |
Less: cash acquired | | | (731 | ) |
| | | | |
Net purchase price | | $ | 16,186 | |
| | | | |
The purchase price set forth in the table above was allocated based on the fair value of the tangible and intangible assets acquired, and liabilities assumed, as of January 9, 2012. The Company used an overall discount rate of approximately 12% to estimate the fair value of the intangible assets acquired, which was derived based on financial metrics of comparable companies operating in Sanrad’s industry. In determining the appropriate discount rates to use in valuing each of the individual intangible assets, the Company adjusted the overall discount rate giving consideration to the specific risk factors of each asset. The following methods were used to value the identified intangible assets:
| | • | | The fair value of the existing technology assets acquired was established based on their highest and best use by a market participant using the “Income Approach.” The Income Approach included an analysis of the markets, cash flows and risks associated with achieving such cash flows to calculate the fair value; expected cash flows were discounted at the Company’s weighted average cost of capital of 10%; |
| | • | | The fair value of trade names/trademarks assets acquired was established based on their highest and best use by a market participant using the “Royalty Savings Method”. In the Royalty Savings Method, the value of an asset is estimated by capitalizing the royalties saved because the Company owns the asset. Expected cash flows were discounted at the Company’s weighted average cost of capital of 10%. |
Identified intangible assets are being amortized over the following useful lives:
| | • | | Existing technology is estimated to have a useful life of five years; |
| | • | | Trade names/trademarks are being amortized over their estimated useful life of two years. |
The trade names/trademarks are amortized using the straight-line method, which reflects future projected cash flows. Existing technology will begin to be amortized over an expected useful life of five years based on the pattern in which the economic benefits are being consumed, which will be upon generation of revenue. No revenue has been generated as of February 29, 2012 and we expect economic benefits to occur in fiscal year 2013.
The residual purchase price of approximately $13.3 million has been recorded as goodwill.
Pro Forma Financial Information
The unaudited pro forma financial information presented below for the years ended February 29, 2012 and February 28, 2011 summarizes the combined results of operations as if the Indilinx and Sanrad acquisitions
67
had been completed on March 1, 2010. The unaudited pro forma financial information for fiscal 2012 combines the results for OCZ for the year ended February 29, 2012, which includes the results of Indilinx subsequent to March 25, 2011 and the results of Sanrad subsequent to January 8, 2012, the dates of acquisitions, and the historical results of Indilinx from March 1, 2011 through March 25, 2011 and the historical results of Sanrad from March 1, 2011 through January 8, 2012. The unaudited pro forma financial information for the year ended February 28, 2011 combines the results for OCZ for the year ended February 28, 2011 and the historical results of Indilinx and Sanrad for the year ended December 31, 2010.
The pro forma financial information is presented for informational purposes only and does not purport to be indicative of what would have occurred had the merger actually been completed on such date or of results which may occur in the future.
| | | | | | | | |
| | | Year Ended | |
| | | February 29,
2012 | | | February 28,
2011 | |
| | | (In thousands, except per share amounts) | |
Net revenue | | $ | 366,330 | | | $ | 193,028 | |
Net loss | | $ | (20,843 | ) | | $ | (34,617 | ) |
Net loss per share — basic and diluted | | $ | (0.36 | ) | | $ | (0.99 | ) |
For the period from the acquisition closing through February 29, 2012, Indilinx products contributed revenue, excluding intercompany sales, of $1.8 million and a net operating loss of $4.9 million. For the period from the acquisition closing through February 29, 2012, Sanrad reported a net operating loss of $0.4 million and contributed net revenue that was insignificant.
OCZ’s financial instruments consist primarily of cash equivalents, accounts receivable, accounts payable, accrued liabilities and loans payable. The carrying value of these financial instruments approximates fair value as they are short-term to maturity. Derivative liabilities consist of common stock warrants and are classified as Level 3 liabilities under the Fair Value Hierarchy.
The applicable accounting guidance establishes a framework for measuring fair value and expands required disclosure about the fair value measurements of assets and liabilities. This guidance requires the Company to classify and disclose assets and liabilities measured at fair value on a recurring basis, as well as fair value measurements of assets and liabilities measured on a nonrecurring basis in periods subsequent to initial measurement, in a three-tier fair value hierarchy as described below.
The guidance defines fair value as the exchange price that would be received for an asset or paid to transfer a liability in the principal or most advantageous market for the asset or liability in an orderly transaction between market participants on the measurement date.
Valuation techniques used to measure fair value must maximize the use of observable inputs and minimize the use of unobservable inputs. The guidance describes three levels of inputs that may be used to measure fair value:
| | • | | Level 1 — Observable inputs that reflect quoted prices for identical assets or liabilities in active markets. |
| | • | | Level 2 — Observable inputs other than Level 1 prices, such as quoted prices for similar assets or liabilities; quoted prices in markets that are not active; or other inputs that are observable or can be corroborated by observable market data for substantially the full term of the assets or liabilities. The Company primarily uses broker quotes for valuation of its short-term investments. |
| | • | | Level 3 — Unobservable inputs that are supported by little or no market activity and that are significant to the fair value of the assets or liabilities. |
68
The Company uses the market approach to measure fair value for its financial assets and liabilities. The market approach uses prices and other relevant information generated by market transactions involving identical or comparable assets or liabilities. During fiscal years ending February 2012 and 2011, there were no nonrecurring fair value measurements of assets subsequent to initial recognition.
The following table sets forth the fair value of the Company’s financial assets and liabilities measured at fair value on a recurring basis at February 29, 2012 and February 28, 2011 based on the three-tier fair value hierarchy:
| | | | | | | | | | | | | | | | |
| | | Level 1 | | | Level 2 | | | Level 3 | | | Total | |
| | | (In thousands) | |
February 29, 2012 | | | | | | | | | | | | | | | | |
Assets | | | | | | | | | | | | | | | | |
Cash equivalents: | | | | | | | | | | | | | | | | |
Cash deposits with third-party financial institutions | | $ | 8,469 | | | $ | — | | | $ | — | | | $ | 8,469 | |
Money market funds | | | 83,870 | | | | — | | | | — | | | | 83,870 | |
| | | | | | | | | | | | | | | | |
Total assets measured and recorded at fair value | | $ | 92,339 | | | $ | — | | | $ | — | | | $ | 92,339 | |
| | | | | | | | | | | | | | | | |
Liabilities | | | | | | | | | | | | | | | | |
Common stock warrant liability: | | $ | — | | | $ | — | | | $ | 11,087 | | | $ | 11,087 | |
| | | | | | | | | | | | | | | | |
Total liabilities measured and recorded at fair value | | $ | — | | | $ | — | | | $ | 11,087 | | | $ | 11,087 | |
| | | | | | | | | | | | | | | | |
| | | | |
February 28, 2011 | | | | | | | | | | | | | | | | |
Assets | | | | | | | | | | | | | | | | |
Cash equivalents: | | | | | | | | | | | | | | | | |
Cash deposits with third-party financial institutions | | $ | 6,890 | | | $ | — | | | $ | — | | | $ | 6,890 | |
Money market funds | | | 10,624 | | | | — | | | | — | | | | 10,624 | |
| | | | | | | | | | | | | | | | |
Total assets measured and recorded at fair value | | $ | 17,514 | | | $ | — | | | $ | — | | | $ | 17,514 | |
| | | | | | | | | | | | | | | | |
Liabilities | | | | | | | | | | | | | | | | |
Common stock warrant liability | | $ | — | | | $ | — | | | $ | 9,417 | | | $ | 9,417 | |
| | | | | | | | | | | | | | | | |
Total liabilities measured and recorded at fair value | | $ | — | | | $ | — | | | $ | 9,417 | | | $ | 9,417 | |
| | | | | | | | | | | | | | | | |
During the fiscal year ended February 29, 2012, there were no transfers between Level 1 and Level 2 fair value instruments. There were no transfers of instruments to Level 3, and the only instruments transferred out of Level 3 in fiscal year 2012 were the common stock warrants which were settled. The following table presents a reconciliation of the recurring Level 3 measurements on a gross basis at February 29, 2012 and February 28, 2011:
| | | | | | | | |
| | | February 29,
2012 | | | February 28,
2011 | |
| | | ( In thousands) | |
Beginning Balance | | $ | 9,417 | | | $ | — | |
Issuance of Common Stock Warrants | | | | | | | 2,081 | |
Warrants exercised at fair value | | | (2,620 | ) | | | (588 | ) |
Revaluation of warrant liability to current fair value | | | 4,290 | | | | 7,924 | |
| | | | | | | | |
Ending Balance | | $ | 11,087 | | | $ | 9,417 | |
| | | | | | | | |
69
The fair value of the warrant liability for the fiscal years ended February 29, 2012 and February 28, 2011 was calculated using the following assumptions:
| | | | | | | | |
| | | Year Ended | |
| | | February 29,
2012 | | | February 28,
2011 | |
Share price | | $ | 8.60 | | | $ | 7.57 | |
Expected life (in years) | | | 3.06 | | | | 4.06 | |
Risk free interest rate | | | 0.87 | % | | | 2.11 | % |
Volatility | | | 78 | % | | | 45 | % |
Dividend yield | | | 0 | % | | | 0 | % |
| 6. | Accounts Receivable and Allowances |
| | | | | | | | |
| | | February 29,
2012 | | | February 28,
2011 | |
| | | (In thousands) | |
Accounts receivable trade | | $ | 78,959 | | | $ | 34,568 | |
Allowance for doubtful accounts, sales returns, and other allowances | | | (6,416 | ) | | | (2,881 | ) |
| | | | | | | | |
Accounts receivable, net of allowances | | $ | 72,543 | | | $ | 31,687 | |
| | | | | | | | |
The following table summarizes the activity during fiscal years February 29, 2012, February 28, 2011 and February 28, 2010 related to the allowances for trade accounts receivable:
| | | | | | | | | | | | | | | | | | | | |
| | | Balance at beginning
of period | | | Charges to
expense | | | Charges
(reversals) of
revenue | | | Deductions
from reserve | | | Balance at end
of period | |
| | | (In thousands) | |
Fiscal year ended February 29, 2012 | | $ | 2,881 | | | $ | 1,820 | | | $ | 4,188 | | | $ | (2,473 | ) | | $ | 6,416 | |
| | | | | | | | | | | | | | | | | | | | |
Fiscal year ended February 28, 2011 | | $ | 2,853 | | | $ | 1,260 | | | $ | 204 | | | $ | (1,436 | ) | | $ | 2,881 | |
| | | | | | | | | | | | | | | | | | | | |
Fiscal year ended February 28, 2010 | | $ | 2,279 | | | $ | 644 | | | $ | (35 | ) | | $ | (35 | ) | | $ | 2,853 | |
| | | | | | | | | | | | | | | | | | | | |
Ending inventory by major category is presented in the following table:
| | | | | | | | |
| | | February 29,
2012 | | | February 28,
2011 | |
| | | (In thousands) | |
Raw materials | | $ | 73,978 | | | $ | 13,072 | |
Work in progress | | | 20,581 | | | | 9,556 | |
Finished goods | | | 17,289 | | | | 3,316 | |
| | | | | | | | |
| | | 111,848 | | | | 25,944 | |
Inventory reserve | | | (3,184 | ) | | | (3,146 | ) |
| | | | | | | | |
Net Inventory | | $ | 108,664 | | | $ | 22,798 | |
| | | | | | | | |
70
Ending balances by major class of depreciable asset are presented in the following table:
| | | | | | | | |
| | | February 29,
2012 | | | February 28,
2011 | |
| | | (In thousands) | |
Vehicles | | $ | 97 | | | $ | 111 | |
Furniture and fixtures | | | 259 | | | | 40 | |
Equipment | | | 6,935 | | | | 5,900 | |
Leasehold Improvements | | | 738 | | | | 538 | |
| | | | | | | | |
| | | 8,029 | | | | 6,589 | |
Less: accumulated depreciation | | | (3,031 | ) | | | (3,543 | ) |
| | | | | | | | |
Net property and equipment | | $ | 4,998 | | | $ | 3,046 | |
| | | | | | | | |
Depreciation and amortization expense related to property and equipment for the fiscal years ended February 2012, 2011 and 2010 amounted to approximately $1.7 million, $1.1 million and $1.0 million, respectively.
| 9. | Goodwill and Other Intangible Assets |
The following is a summary of goodwill and intangible assets for the fiscal years ended February 29, 2012 and February 28, 2011:
| | | | | | | | | | | | | | | | | | | | | | | | |
| | | February 29, 2012 | | | February 28, 2011 | |
| | | Gross
Carrying
Amount | | | Accumulated
Amortization | | | Net
Carrying
Amount | | | Gross
Carrying
Amount | | | Accumulated
Amortization | | | Net
Carrying
Amount | |
| | | (In thousands) | |
Identifiable intangibles: | | | | | | | | | | | | | | | | | | | | | | | | |
Existing and core technology | | $ | 4,345 | | | $ | (93 | ) | | $ | 4,252 | | | $ | — | | | $ | — | | | $ | — | |
In-process technology | | | 801 | | | | — | | | | 801 | | | | — | | | | — | | | | — | |
Customer relationships/contracts | | | 75 | | | | (14 | ) | | | 61 | | | | — | | | | — | | | | — | |
Trademarks and trade names | | | 505 | | | | (300 | ) | | | 205 | | | | 446 | | | | (428 | ) | | | 18 | |
Licensed Technology | | | 3,505 | | | | (444 | ) | | | 3,061 | | | | — | | | | — | | | | — | |
| | | | | | | | | | | | | | | | | | | | | | | | |
Subtotal of identifiable intangibles | | $ | 9,231 | | | $ | (851 | ) | | $ | 8,380 | | | $ | 446 | | | $ | (428 | ) | | $ | 18 | |
Goodwill | | | 60,914 | | | | — | | | | 60,914 | | | | 9,989 | | | | — | | | | 9,989 | |
| | | | | | | | | | | | | | | | | | | | | | | | |
Total goodwill and other intangibles | | $ | 70,145 | | | $ | (851 | ) | | $ | 69,294 | | | $ | 10,435 | | | $ | (428 | ) | | $ | 10,007 | |
| | | | | | | | | | | | | | | | | | | | | | | | |
The changes in the carrying amount of goodwill for the fiscal years ended February 29, 2012 and February 28, 2011 are as follows:
| | | | | | | | |
| | | February 29,
2012 | | | February 28,
2011 | |
| | | (In thousands) | |
Balance at beginning of period | | $ | 9,989 | | | $ | 9,954 | |
Acquisition of Indilinx | | | 36,845 | | | | — | |
Acquisition of PLX UK Design Team | | | 794 | | | | — | |
Acquisition of Sanrad | | | 13,286 | | | | — | |
Acquisition earn out payments | | | — | | | | 35 | |
| | | | | | | | |
Balance at end of period | | $ | 60,914 | | | $ | 9,989 | |
| | | | | | | | |
We acquired certain assets of Solid Data Systems in November 2010 and paid approximately $350,000 cash and issued 160,000 shares in restricted stock with a value of $644,000. We determined that we acquired as
71
identifiable assets in-process research and development (“IPRD”) and fixed assets, with goodwill also resulting from the transaction. Following the acquisition, we determined that we would not operate the business and determined the value of the goodwill and fixed assets acquired to be fully impaired. IPRD was initially capitalized but was then written off when it was determined that the asset would not contribute to reaching technological feasibility since the course of the related research project was substantially redirected and essentially abandoned. The total write-off related to this acquisition is $994,000 which is included in general and administrative expense in the Consolidated Statement of Operations for fiscal year ended February 28, 2011.
In fiscal 2012, we purchased $2.5 million of intangibles consisting of a $2.0 million technology license with an estimated useful life of three years and a $0.5 million technology license with an estimated useful life of two years. Amortization of these intangibles is recorded on a straight-line basis.
Existing technology obtained in the acquisition of Sanrad in the amount of $3.6 million will begin to be amortized over an expected useful life of five years based on the pattern in which the economic benefits are being consumed, which will be upon generation of revenue. No revenue has been generated as of February 29, 2012 and we expect economic benefits to occur in fiscal year 2013.
For the years ended February 2012, 2011 and 2010, we recorded approximately $627,000, $70,000 and $180,000 of amortization and impairment expense, respectively, for identified intangibles, of which approximately $93,000 was included in cost of revenue during 2012. No amortization was included in cost of revenue during fiscal years ended February 2011 and 2010.
The estimated future amortization expense of intangible assets with definite lives is as follows as of February 29, 2012:
| | | | | | | | | | | | |
| | | Cost of Revenue | | | Operating
Expenses | | | Total | |
| | | (In thousands) | |
Years ending February 28 or 29, | | | | | | | | | | | | |
2013 | | $ | 141 | | | $ | 1,415 | | | $ | 1,556 | |
2014 | | | 136 | | | | 1,238 | | | | 1,374 | |
2015 | | | 136 | | | | 582 | | | | 718 | |
2016 | | | 136 | | | | 28 | | | | 164 | |
2017 and thereafter | | | 102 | | | | 65 | | | | 167 | |
| | | | | | | | | | | | |
Total | | $ | 651 | | | $ | 3,328 | | | $ | 3,979 | |
| | | | | | | | | | | | |
| 10. | Accrued and Other Liabilities |
Accrued and other liabilities consist of the following:
| | | | | | | | |
| | | February 29,
2012 | | | February 28,
2011 | |
| | | (In thousands) | |
Wages and other compensation | | $ | 5,516 | | | $ | 1,472 | |
Sales and marketing programs | | | 2,944 | | | | 2,417 | |
Uninvoiced goods and services | | | 2,946 | | | | 749 | |
Professional fees | | | 336 | | | | 255 | |
Other liabilities | | | 1,007 | | | | 1,244 | |
| | | | | | | | |
Total | | $ | 12,749 | | | $ | 6,137 | |
| | | | | | | | |
| 11. | Commitments and Contingencies |
Lease commitments
We lease office and warehouse facilities under lease terms expiring at various dates through 2018. Certain leases contain provisions which allow for early termination of the obligation prior to the end of the lease
72
term. Rent expense amounted to approximately $1,490,000, $816,000 and $783,000, for the years ended February 29, 2012, February 28, 2011 and February 28, 2010, respectively. As of the fiscal year ended February 29, 2012, the future minimum payments due under these non cancellable lease agreements are as follows:
| | | | |
Years ending February 29/28 | | Future Minimum
Lease Payments | |
| | | (In thousands) | |
2013 | | $ | 1,653 | |
2014 | | | 1,675 | |
2015 | | | 1,787 | |
2016 | | | 1,529 | |
2017 | | | 1,257 | |
2018 and thereafter | | | 1,310 | |
| | | | |
Total | | $ | 9,211 | |
| | | | |
Non-cancelable Purchase commitments
From time to time, the Company enters into various inventory related purchase commitments with its suppliers. The Company had approximately $19.9 million in non-cancelable purchase commitments with certain suppliers as of February 29, 2012. Two key suppliers represent a substantial portion of these commitments. One commitment of approximately $16.9 million relates to a continuity of supply arrangement which the Company has entered into during the year ended February 29, 2012. Another commitment requires the Company to purchase approximately $2.6 million of specified components from a certain supplier by the end of April 2013. All purchases from these suppliers are expected to sell in the normal course of business.
Warranties
The Company accrues for estimated warranty costs at the time of product shipment. Management periodically reviews the estimated fair value of its warranty liability and records adjustments based on the terms of warranties provided to customers, historical and anticipated warranty claims experience, and estimates of the timing and cost of warranty claims. Activity for the Company’s warranty accrual, which is included in accrued liabilities, is summarized below:
| | | | | | | | | | | | |
| | | February 29,
2012 | | | February 28,
2011 | | | February 28,
2010 | |
| | | (In thousands) | |
Balance at beginning of period | | $ | 100 | | | $ | 68 | | | $ | 132 | |
Accrual for current period warranties | | | 493 | | | | 287 | | | | 138 | |
Acquired warranty obligation from Indilinx acquisition | | | 467 | | | | — | | | | — | |
Acquired warranty obligation from Sanrad acquisition | | | 55 | | | | — | | | | — | |
Warranty costs incurred | | | (691 | ) | | | (255 | ) | | | (202 | ) |
| | | | | | | | | | | | |
Balance at end of period | | $ | 424 | | | $ | 100 | | | $ | 68 | |
| | | | | | | | | | | | |
Contingencies
In July 2010, we received notice that a former vendor had filed legal proceedings in Taiwan demanding payment for materials which we contended were defective. As of February 28, 2011 we accrued approximately $1.3 million for this contingency including potential interest costs. On April 25, 2011 the Taoyuan District Court found in favor of the former vendor and we were ordered to pay approximately $1.2 million plus interest of approximately $150,000. During June 2011, these payments were made to the vendor and the case was formally closed.
73
On March 24, 2011, a purported class action suit was filed in the United States District Court for the Northern District of California San Jose Division alleging that certain of our SSDs sold on or after January 1, 2011 did not meet certain performance criteria and as a result we engaged in certain deceptive practices and violated various laws. Among other things, the suit seeks unspecified actual and compensatory damages, as well as punitive damages, restitution, disgorgement and injunctive and other equitable relief. We believe that the lawsuit has no merit and we intend to vigorously defend against this litigation.
On September 7, 2011 a complaint for patent infringement was filed by Solid State Storage Solutions, Inc. in the United States District Court for the Eastern District of Texas alleging patent infringement against OCZ and eight other companies. The Company was served with a copy of the complaint on October 26, 2011 and filed six affirmative defenses in response on December 23, 2011. The plaintiff seeks an injunction and unspecified damages, special damages, interest and compulsory royalty payments. As of February 29, 2012, the Company has not recognized this contingency within the financial statements presented as OCZ believes the complaint has no merit and OCZ intends to vigorously defend against this litigation.
In February 2011 we signed a new agreement with Silicon Valley Bank (“SVB”) for asset-based financing of up to $25 million (the “New SVB Agreement”), which replaced the previous $10.0 million Loan and Security Agreement (“SVB Agreement”). This new agreement, which was amended and restated in February 2012, expires on May 6, 2012, expands the $17.5 million debt capability available under the prior joint factoring loan arrangements with SVB and Faunus Group International, Inc. (“FGI”). Upon completion of the New SVB Agreement, we also terminated our Sale of Accounts and Security Agreement (“FGI Agreement”) with FGI. As part of the termination of the FGI Agreement, a contractual penalty of $170,000 was paid to FGI and is included in the “Interest and financing costs” caption on the Consolidated Statement of Operations for the year ended February 28, 2011.
The New SVB Agreement contains financial covenants for quarterly EBITDA, as defined in the agreement, and a monthly quick ratio computation (our cash and accounts receivable divided by current liabilities). Interest rates range between prime +1.5% to prime +2.5%. There are also provisions for letter of credit sub-limits and various operational, reporting, restriction of cash dividends, negative and affirmative covenants with which we must comply. On January 31, 2012 the Company executed an amendment to provide a formal waiver of the Sanrad acquisition as well as to extend the SVB Agreement until May 6, 2012. On April 25, 2012 the Company executed an amendment to provide a formal waiver of the covenant for EBITDA levels for the period ending February 29, 2012. As of February 29, 2012, we had no borrowings under the SVB Agreement. The applicable interest rate is prime + 1.50%. The bank’s prime rate was 4.0% at February 29, 2012.
On May 10, 2012 we signed an agreement with Wells Fargo Capital Finance (“WFCF”) for a $35 million senior secured credit facility to replace the SVB Agreement, which expired on May 6, 2012. As in the SVB Agreement, borrowings under the WFCF facility will be limited to a borrowing base based on our receivables. The WFCF facility has a 5-year term and provides for a committed expansion up to $60 million of cumulative borrowings and for a potential further expansion to $100 million of total borrowings, in each case if certain conditions are met. The WFCF facility contains minimum liquidity levels and certain financial covenants if these levels are not met. There are also two interest rate options using either a “Base Rate” or a “LIBOR Rate” as defined, both of which contain an “Applicable Margin” spread ranging from 1.25% to 2.75% depending on the “Excess Availability” as defined. We may incur additional debt in the future, subject to certain limitations contained in our debt instruments.
Preferred Stock
OCZ has 20,000,000 authorized shares of preferred stock. On October 25, 2011, we classified 100,000 of these shares as Series A Junior Participating Preferred Stock in connection with the Board’s same day
74
approval and adoption of a stockholder rights plan. Under the plan, OCZ declared and paid a dividend of one preferred share purchase right for each share of OCZ common stock held by our stockholders of record as of the close of business on November 4, 2011. Each preferred share purchase right entitles the holder to purchase from us one one-hundredth of a share of Series A Junior Participating Preferred Stock, par value $0.0025 per share, at a price of $35.00, subject to adjustment. The rights are not exercisable until the distribution date. The distribution date is defined as when an acquisition of 20% or more of our common stock by an acquiring person has occurred. The stockholder rights plan may have the effect of deterring or delaying a change in control of OCZ.
Common Stock
During the fiscal year ended February 28, 2010, OCZ issued 60,990 shares of its Series A preferred stock at $5.00 per share, which were converted into 62,733 shares of common stock on May 4, 2010.
In March 2010, OCZ consummated a private placement financing pursuant to which it issued 5,151,662 shares of its common stock at $3.00 per share. OCZ received gross proceeds of approximately $15.45 million. In connection with the financing, OCZ entered into a registration rights agreement which required OCZ to file a registration statement with the SEC no later than May 21, 2010, to register 5,151,662 shares of its common stock and 2,575,833 shares of its common stock issuable upon exercise of certain warrants described below under “Warrants”. The registration statement was filed with the SEC on May 21, 2010, last amended on July 20, 2010 and declared effective also on July 20, 2010.
In May 2010, all shares of OCZ’s Series A preferred stock were converted into shares of common stock. Under the terms of OCZ’s certificate of incorporation with respect to OCZ’s Series A preferred stock, each share of Series A preferred stock was to be automatically converted into shares of common stock on the sixtieth (60th) trading day following the commencement of trading of OCZ’s common shares on a public stock exchange (“Mandatory Conversion”), including the over the counter bulletin board (the “OTCBB”). The trading of OCZ’s common shares commenced on OTCBB on February 10, 2010, and the 60th trading day following the commencement of trading was May 4, 2010. The number of shares of OCZ’s common stock issued upon Mandatory Conversion was determined by dividing $5.00 by the Denominator Price, which was the 60 Day Average of $4.86. Based on the 60 Day Average of $4.86, and after taking into account fractional shares, on May 4, 2010, 60,990 shares of OCZ’s Series A preferred stock were converted into 62,733 shares of OCZ’s common stock.
On November 2, 2010, OCZ consummated a private placement financing pursuant to which it issued 7,139,960 shares of its common stock at $3.08125 per share. OCZ received gross proceeds of approximately $22.0 million. In connection with the financing, OCZ entered into a registration rights agreement which required OCZ to file a registration statement with the SEC no later than December 17, 2010, to register the 7,139,960 shares and 1,784,996 shares of its common stock issuable upon exercise of certain warrants, described below under “Warrants”. The registration statement was filed with the SEC on December 10, 2010, amended on December 22, 2010 and declared effective as of January 3, 2011.
On November 15, 2010, OCZ issued 160,000 shares of its common stock in connection with the acquisition of certain intellectual property from Solid Data Systems, Inc. Of this amount issued, 38,000 shares are subject to various escrow provisions for a 3-year period with a potential release of 50% of the shares after 18 months.
On December 9, 2010, OCZ issued 4,210 shares of common stock valued at approximately $20,000 in connection with an engagement letter dated December 9, 2009 by and between OCZ Technology Group, Inc., and Merriman Capital, Inc., for various financial consulting services.
On January 7, 2011, OCZ issued 150,000 shares of common stock valued at $750,000 in connection with a securities purchase agreement between OCZ Technology Group, Inc., and MICSYS Technology Co., Ltd., who is a vendor.
On March 25, 2011, OCZ issued 4,160,630 shares of common stock in connection with the acquisition of Indilinx Co., Ltd. In connection with this acquisition, a registration statement for 4,160,630 shares was filed
75
with the SEC on May 17, 2011, amended on June 15 and June 17, 2011 and declared effective as of June 17, 2011.
On April 13, 2011, OCZ issued 11,730,000 shares of common stock in a public offering. The net proceeds to the Company were approximately $93.5 million, which is net of underwriters’ discounts and commissions and related legal, accounting, printing, and other costs totaling $6.2 million.
On January 9, 2012, OCZ issued 2,088,582 shares of common stock in connection with the acquisition of Sanrad Inc.
On February 13, 2012, OCZ issued 12,000,000 shares of common stock at a price of $9.00 per share in a follow-on public offering. The net proceeds to the Company were approximately $101 million from the offering, after deducting underwriting discounts and commissions and offering expenses of approximately $7.3 million. On March 13, 2012, the underwriters of the February 2012 public offering of 12,000,000 shares of common stock have partially exercised their over-allotment option to purchase an additional 1,013,991 primary shares. The net proceeds from the over-allotment option exercise are approximately $8.0 million, bringing the total net proceeds from the offering to approximately $109 million, after deducting underwriting discounts and commissions and estimated offering expenses.
During the fiscal year ended February 29, 2012, we issued 819,199 shares of common stock in connection with the exercise of stock options and 381,193 shares of common stock in connection with the exercise of warrants. During fiscal year ended February 29, 2012, we granted options to purchase an aggregate of 3,292,500 shares of common stock under our stock option plan exercisable at the fair market value per share on the date of grant.
The following table summarizes weighted average shares outstanding for each of the three years ended February 29, 2012, February 28, 2011 and February 28, 2010. for the purpose of computing earnings per share for the respective periods.
| | | | | | | | | | | | |
| | | Year Ended | |
| | | February 29,
2012 | | | February 28,
2011 | | | February 28,
2010 | |
| | | (In thousands) | |
Shares outstanding, beginning | | | 35,400 | | | | 21,300 | | | | 21,300 | |
Weighted-average shares issued | | | 15,500 | | | �� | 7,400 | | | | — | |
| | | | | | | | | | | | |
Weighted-average shares, basic | | | 50,900 | | | | 28,700 | | | | 21,300 | |
Effect of dilutive stock options and warrants | | | — | | | | — | | | | — | |
| | | | | | | | | | | | |
Weighted-average shares, diluted | | | 50,900 | | | | 28,700 | | | | 21,300 | |
| | | | | | | | | | | | |
The diluted weighted-average shares are the same as basic weighted-average shares for all years presented because potential common shares are only considered when their effect would be dilutive. In the years ended February 29, 2012, February 28, 2011 and February 28, 2010, there were approximately 3,026,479, 6,376,000 and 1,935,000 of potentially dilutive shares, consisting of options and warrants excluded from the net loss per share computations, respectively, because their effect was anti-dilutive.
Warrants
During the fiscal year ended February 28, 2010, OCZ issued warrants to purchase up to 140,520 shares of its Series A preferred stock at $5.00 per share. Under the terms of OCZ’s certificate of incorporation with respect to OCZ’s Series A preferred stock, each share of Series A preferred stock was to be automatically converted into shares of common stock on the sixtieth (60th) trading day following the commencement of trading of OCZ’s common shares on a public stock exchange (“Mandatory Conversion”), including the over the counter bulletin board (the “OTCBB”), which occurred on May 4, 2010. The number of shares of OCZ’s common stock warrants issued upon Mandatory Conversion was determined by dividing $5.00 by the Denominator Price, which was the 60 Day Average of $4.86. On May 4, 2010, warrants to purchase 140,520
76
shares of OCZ’s Series A preferred stock were converted into warrants to purchase 144,541 shares of OCZ’s common stock at $4.86 per share. Such warrants were issued in reliance on Regulation S of the Securities Act. All warrants related to this issuance expired in August 2010.
In March 2010, OCZ issued warrants to purchase up to 2,575,833 shares of its common stock at $5.25 per share. These warrants are subject to certain anti-dilution adjustments and, as a result of the November 2, 2010 financing, these warrants were subject to a price adjustment calculation which resulted in a new exercise price of $4.87 per share. These warrants will expire on March 23, 2015 and may be exercised by the holders on a cashless basis. During the fiscal years ended February 29, 2012 and February 28, 2011, 416,666 and 116,667 warrants were exercised on a cashless basis resulting in the issuance of 199,567 and 80,198 common shares, respectively. Total warrants exercised in fiscal year 2012 and fiscal year 2011 amounted to 416,666 and 159,999, respectively. As of February 29, 2012, there are 1,999,168 warrants outstanding.
The warrants for the 2,575,833 shares contain certain provisions which cause them to be classified as derivative liabilities pursuant to Accounting Standards Codification subtopic 815-40,“Derivatives and hedging—Contracts in Entity’s Own Equity” (ASC 815-40). Accordingly, upon issuance the warrants were recorded as a derivative liability and valued at a fair market value of approximately $2,081,000 which also reduced the proceeds assigned to the equity shares issued in the fund raising. The fair value of these warrants was increased to $11,087,380 as of February 29, 2012. The revaluation adjustments recorded in the Consolidated Statement of Operations for the fiscal years ended February 2012 and 2011 were approximately $4,290,000 and $7,924,000 respectively. OCZ is required to continue to adjust the warrants to fair value through current period operations for each reporting period.
In connection with the March 2010 financing, OCZ issued to a placement agent a warrant to purchase up to 154,550 shares of its common stock at $3.00 per share and, at the time of such exercise, to receive a subsequent warrant to purchase up to an additional 77,275 shares of the Company’s common stock at $5.25 per share. The placement agent warrants contain certain piggyback registration rights. These warrants will expire on March 23, 2015 and may be exercised by the holders on a cashless basis. During the fiscal year-end February 28, 2011, 148,600 warrants were exercised resulting in the issuance of the additional 77,275 warrants. During the fiscal year ended February 29, 2012, 74,300 warrants were exercised on a cashless basis resulting in the issuance of approximately 17,000 common shares. As of February 29, 2012 there are a total of 8,925 warrants outstanding.
In November 2010, OCZ issued warrants to purchase up to an aggregate of 1,784,996 shares of its common stock at an exercise price of $5.25 per share. These warrants became exercisable on May 3, 2011. During the fiscal year ended February 29, 2012, 240,568 warrants were exercised on a cashless basis resulting in the issuance of approximately 100,000 common shares. As of February 29, 2012 there are a total of 1,544,428 warrants outstanding.
In connection with the November 2010 financing, OCZ issued to a placement agent a warrant to purchase up to 214,198 shares of the Company’s common stock at an exercise price of $3.08125 per share and, at the time of such exercise, to receive a subsequent warrant to purchase up to an additional 53,549 shares of the Company’s common stock at an exercise price of $5.25 per share. The placement agent warrants contain certain piggyback registration rights. All of these warrants will expire on November 2, 2015 and may be exercised by the holders on a cashless basis. During the fiscal year ended February 28, 2011, 214,198 warrants were exercised resulting in the issuance of the additional 53,549 warrants. During fiscal year ended February 29, 2012, 53,549 warrants were exercised on a cashless basis resulting in the issuance of approximately 12,000 common shares. At February 29, 2012 there are no warrants outstanding.
In December 2010, OCZ issued warrant instruments in connection with certain service agreements. These warrants are exercisable into an aggregate of 27,000 shares of common stock at an exercise price of $4.03 per share and expire between November 12, 2011 and May 12, 2012. During the fiscal year ended February 29, 2012, all 27,000 warrants were exercised and at February 29, 2012 there are no warrants outstanding.
77
In January 2011, OCZ issued a warrant to a vendor in connection with a securities purchase agreement. The warrant is exercisable into an aggregate of 25,000 shares of common stock at an exercise price of $5.00 per share and expire by January 6, 2012. During the fiscal year ended February 29, 2012, all 25,000 warrants were exercised and at February 29, 2012 there are no warrants outstanding.
The following table summarizes warrant activity for fiscal years ended February 29, 2012 and February 28, 2011:
| | | | | | | | | | | | | | | | |
| | | Number of
Shares | | | Exercise
Price Range | | | Total
Exercise
Price | | | Weighted
Average
Exercise
Price | |
Balance at February 28, 2010 | | | 274,695 | | | $ | 2.25-5.00 | | | $ | 1,082,123 | | | $ | 3.93 | |
Warrants granted | | | 4,912,401 | | | | 3.00-5.25 | | | | 23,953,126 | | | | 4.88 | |
Warrants granted – Series A conversion | | | 4,022 | | | | 4.86 | | | | 19,547 | | | | 4.86 | |
Warrants exercised for common shares | | | (326,108 | ) | | | 1.85-4.87 | | | | (980,163 | ) | | | 3.01 | |
Warrants exercised for common shares—cashless | | | (330,864 | ) | | | 3.08-4.87 | | | | (1,228,166 | ) | | | 3.71 | |
Warrant exchange rate differences | | | | | | | | | | | (56,187 | ) | | | | |
Warrants expired or forfeited | | | (144,542 | ) | | | 5.00 | | | | (722,147 | ) | | | 5.00 | |
| | | | | | | | | | | | | | | | |
Balance at February 28, 2011 | | | 4,389,604 | | | | 3.00-5.25 | | | $ | 22,068,133 | | | | 5.03 | |
Warrants granted | | | — | | | | | | | | — | | | | | |
Warrants exercised for common shares | | | (52,000 | ) | | | 4.03-5.00 | | | | (233,810 | ) | | | 4.50 | |
Warrants exercised for common shares—cashless | | | (785,083 | ) | | | 4.87-5.25 | | | | (3,956,659 | ) | | | 5.03 | |
| | | | | | | | | | | | | | | | |
Balance at February 29, 2012 | | | 3,552,521 | | | $ | 3.00-5.25 | | | $ | 17,877,664 | | | $ | 5.03 | |
| | | | | | | | | | | | | | | | |
Stock incentive plan
In December 2004, we adopted a stock incentive plan with 1,800,000 shares of common stock authorized for issuance. The shares subject to the stock incentive plan was subsequently increased to 5,232,873. With the additional 2,500,000 shares approved by our stockholders in October 2010, and an additional 4,500,000 shares approved by our stockholders in September 2011, the total shares authorized for issuance under the stock incentive plan increased to 12,232,873. The shares to be purchased are subject to forfeiture conditions, rights of repurchase, rights of first refusal and other transfer restrictions as the Board may determine. The options granted will expire in a term not to exceed 10 years from grant date.
78
The following table summarizes option activity for fiscal years ended February 29, 2012 and February 28, 2011:
| | | | | | | | | | | | |
| | | Number of
Shares
Available
for Grant | | | Number of
Stock
Options
Outstanding | | | Weighted
Average
Exercise
Price Per
Option | |
Balance as of February 28, 2010 | | | 1,659,614 | | | | 2,779,111 | | | $ | 2.20 | |
Authorized | | | 2,500,000 | | | | — | | | | — | |
Granted | | | (2,678,842 | ) | | | 2,678,842 | | | $ | 4.73 | |
Exercised | | | | | | | (927,915 | ) | | $ | 1.26 | |
Forfeited or cancelled | | | 504,982 | | | | (504,982 | ) | | $ | 2.62 | |
| | | | | | | | | | | | |
Balance as of February 28, 2011 | | | 1,985,754 | | | | 4,025,056 | | | $ | 4.05 | |
Authorized | | | 4,500,000 | | | | — | | | | — | |
Granted | | | (3,292,500 | ) | | | 3,292,500 | | | $ | 7.02 | |
Exercised | | | — | | | | (819,199 | ) | | $ | 2.24 | |
Forfeited or cancelled | | | 562,752 | | | | (562,752 | ) | | $ | 5.25 | |
| | | | | | | | | | | | |
Balance as of February 29, 2012 | | | 3,756,006 | | | | 5,935,605 | | | $ | 5.83 | |
| | | | | | | | | | | | |
Options vested and exercisable at February 29, 2012 | | | | | | | 1,484,660 | | | | | |
| | | | | | | | | | | | |
Options vested and expected-to-vest at February 29, 2012 | | | | | | | 5,935,605 | | | | | |
| | | | | | | | | | | | |
The weighted-average fair value of options granted for the fiscal years ended February 2012 and 2011 was approximately $4.16 and $1.79, respectively.
The following table summarizes information regarding stock options outstanding and exercisable at February 29, 2012:
| | | | | | | | | | | | | | | | | | | | |
| | | Stock Options Outstanding | | | Stock Options Exercisable | |
Range of
Exercise Prices | | Number
Outstanding at
February 29, 2012 | | | Weighted Average
Remaining
Contractual Life
(Years) | | | Weighted
Average
Exercise
Price | | | Number
Exercisable at
February 29, 2012 | | | Weighted
Average
Exercise Price | |
| $ 0.40 — 2.04 | | | 462,632 | | | | 7.40 | | | $ | 1.24 | | | | 263,929 | | | $ | 1.23 | |
| 2.05 — 3.68 | | | 766,808 | | | | 7.77 | | | | 2.88 | | | | 328,281 | | | | 3.01 | |
| 3.69 — 5.31 | | | 1,202,368 | | | | 8.68 | | | | 4.68 | | | | 385,264 | | | | 4.51 | |
| 5.32 — 6.95 | | | 787,626 | | | | 9.70 | | | | 6.06 | | | | 16,501 | | | | 5.81 | |
| $ 6.96 — 8.59 | | | 2,716,171 | | | | 8.92 | | | | 7.90 | | | | 490,685 | | | | 8.15 | |
| | | | | | | | | | | | | | | | | | | | |
| | | 5,935,605 | | | | 8.71 | | | $ | 5.83 | | | | 1,484,660 | | | $ | 4.81 | |
| | | | | | | | | | | | | | | | | | | | |
The weighted-average remaining contractual life for all exercisable stock options at February 29, 2012 was 7.3 years. The weighted-average remaining contractual life of all vested and expected-to-vest stock options at February 29, 2012 was 8.7 years.
Aggregate intrinsic value of options exercisable at February 29, 2012 was $5.6 million. The aggregate intrinsic value of stock options vested and expected-to-vest net of estimated forfeitures was $16.4 million at February 29, 2012. Aggregate intrinsic value represents the difference between our closing price on the last trading day of the fiscal period, which was $8.60 as of February 29, 2012, and the exercise price multiplied by the number of options outstanding or exercisable. The intrinsic value of exercised stock options is calculated based on the difference between the exercise price and the current market value at the time of exercise. The aggregate intrinsic value of exercised stock options was $5.2 million, $4.1 million, and zero during the years ended February 29, 2012, February 28, 2011 and February 28, 2010, respectively.
79
Stock-based Compensation
The following table summarizes stock-based compensation costs in OCZ’s Consolidated Statements of Operations for the fiscal years ended February 2012, 2011 and 2010.
| | | | | | | | | | | | |
| | | February 29,
2012 | | | February 28,
2011 | | | February 28,
2010 | |
| | | (In thousands) | |
Employee stock-based compensation in: | | | | | | | | | | | | |
Research and development expense | | $ | 1,707 | | | $ | 360 | | | $ | 184 | |
Sales and marketing expense | | | 690 | | | | 231 | | | | 166 | |
General, administrative and operations expense | | | 1,184 | | | | 437 | | | | 313 | |
| | | | | | | | | | | | |
Total stock-based compensation | | $ | 3,581 | | | $ | 1,028 | | | $ | 663 | |
| | | | | | | | | | | | |
As of February 29, 2012, total unamortized stock-based compensation costs related to non-vested options amounted to approximately $13.3 million and will be recognized in future periods through February 2016.
The fair value of each option grant is estimated on the date of grant using the Black-Scholes single option pricing model with the following assumptions:
| | | | | | | | | | | | |
| | | Year Ended | |
| | | February 29,
2012 | | | February 28,
2011 | | | February 28,
2010 | |
Expected life (in years) | | | 4.19 | | | | 4.40 | | | | 4.28 | |
Expected Volatility | | | 78 | % | | | 45 | % | | | 58 | % |
Risk-free interest rate | | | 1.2 | % | | | 1.9 | % | | | 2.0 | % |
Dividend yield | | | 0.0 | % | | | 0.0 | % | | | 0.0 | % |
The expected life for stock options under the stock incentive plan represents the weighted-average period that the stock options are expected to remain outstanding. The Company’s computation of expected life was determined based on historical experience of similar awards, giving consideration to the contractual terms of the stock-based awards, vesting schedules, and expectations of future employee behavior.
The risk-free interest rate assumption is based upon observed interest rates appropriate for the term of OCZ’s employee stock options and employee stock purchase plan awards. The dividend yield assumption is based on the Company’s history and lack of an expectation of dividend payouts.
| 15. | Employee Savings and Retirement Plan |
We maintain a 401(k) plan, known as the “OCZ Pension Plan.” Eligibility to participate in the plan is subject to certain minimum service requirements. Employees may voluntarily contribute up to $17,000 per annum (or $22,500 for individuals over 50 years of age); which is the IRS maximum. At our discretion we may decide to initiate employer matching contributions upon approval by the Board of Directors and members of the Compensation Committee in the near future. Any employer contributions are immediately 100% vested under the current plan document. We did not make any contributions during the fiscal years ended February 29, 2012, February 28, 2011 or February 28, 2010.
80
Income/(loss) before income tax expense/(benefit) consists of the following:
| | | | | | | | | | | | |
| | | Year Ended | |
| | | February 29,
2012 | | | February 28,
2011 | | | February 28,
2010 | |
| | | (In thousands) | |
Domestic | | $ | (20,172 | ) | | $ | (28,712 | ) | | $ | (12,826 | ) |
International | | | 2,505 | | | | (454 | ) | | | (709 | ) |
| | | | | | | | | | | | |
Total | | $ | (17,667 | ) | | $ | (29,166 | ) | | $ | (13,535 | ) |
| | | | | | | | | | | | |
The primary components of deferred income tax assets and liabilities are as follows:
| | | | | | | | |
| | | February 29,
2012 | | | February 28,
2011 | |
| | | (In thousands) | |
Intangible assets | | $ | (482 | ) | | $ | 218 | |
Accrued liabilities and allowances | | | 6,979 | | | | 4,452 | |
Stock based compensation | | | — | | | | — | |
Foreign tax credit | | | 84 | | | | 84 | |
Net operating loss carry forwards | | | 17,508 | | | | 13,162 | |
State deferred tax effect on federal | | | (959 | ) | | | (410 | ) |
| | | | | | | | |
Gross deferred tax assets | | | 23,130 | | | | 17,506 | |
Valuation allowance | | | (23,130 | ) | | | (17,506 | ) |
| | | | | | | | |
Net deferred tax assets | | $ | — | | | $ | — | |
| | | | | | | | |
Reported as: | | | | | | | | |
Current deferred tax assets | | $ | — | | | $ | — | |
Non-current deferred tax assets | | | — | | | | — | |
| | | | | | | | |
Net deferred tax assets | | $ | — | | | $ | — | |
| | | | | | | | |
The provision (benefit) for income taxes consists of the following:
| | | | | | | | | | | | |
| | | Year Ended | |
| | | February 29,
2012 | | | February 28,
2011 | | | February 28,
2010 | |
| | | (In thousands) | |
Deferred: | | | | | | | | | | | | |
Federal provision | | $ | — | | | $ | 713 | | | $ | — | |
State provision | | | — | | | | 123 | | | | — | |
Current: | | | | | | | | | | | | |
Foreign provision (benefit) | | | — | | | | 25 | | | | (1 | ) |
| | | | | | | | | | | | |
Total | | $ | — | | | $ | 861 | | | $ | (1 | ) |
| | | | | | | | | | | | |
As of fiscal year ended February 29, 2012, we have approximately $46.6 million and $18.9 million for Federal and California State, respectively, of net operating loss carry-forwards available to offset future taxable income. Any unused Federal carry forwards will expire between 2027 and 2032 and any unused California State carry-forwards will expire between 2019 and 2024.
81
The effective income tax rate differs from the statutory federal income tax rate as shown in the following table:
| | | | | | | | | | | | |
| | | Year Ended | |
| | | February 29,
2012 | | | February 28,
2011 | | | February 28,
2010 | |
| | | (%) | | | (%) | | | (%) | |
Statutory federal income tax benefit rate | | | (34.0 | ) | | | (34.0 | ) | | | (34.0 | ) |
State taxes, net of federal tax benefit | | | (5.8 | ) | | | (5.8 | ) | | | (5.8 | ) |
Valuation allowances | | | 39.8 | | | | 42.5 | | | | 39.8 | |
Foreign tax differential | | | — | | | | 0.3 | | | | — | |
| | | | | | | | | | | | |
Effective tax rate | | | — | % | | | 3.0 | % | | | — | % |
| | | | | | | | | | | | |
| 17. | Segment and Geographic Information |
Operating segments are defined as components of an enterprise that engage in business activities for which separate financial information is available and evaluated by the chief operating decision maker in deciding how to allocate resources and assessing performance. OCZ reviews financial data and operates its business in one reportable business segment comprised of two revenue product groups including SSD storage and then power supplies, memory processing and other. These products are sold primarily into the HDD format and SAN acceleration/replacement markets. The DRAM memory products were discontinued as of February 28, 2011, consequently, certain prior year line item category descriptions and balances have been reclassified to conform to the current year presentation. The overall totals remained the same.
The following table sets forth the net revenues for each of our product groups for the fiscal years ended February 2012, 2011 and 2010:
| | | | | | | | | | | | |
| | | Year Ended | |
| | | February 29,
2012 | | | February 28,
2011 | | | February 28,
2010 | |
| Product group net revenue | | (In thousands) | |
SSD | | $ | 338,904 | | | $ | 133,202 | | | $ | 43,510 | |
Power supplies/Memory/Other | | | 26,870 | | | | 56,914 | | | | 100,449 | |
| | | | | | | | | | | | |
Total | | $ | 365,774 | | | $ | 190,116 | | | $ | 143,959 | |
| | | | | | | | | | | | |
Our net revenues by major geographic area (based on shipping destination), major customers and the Company’s property and equipment, net by geographic region for the fiscal years ended February 2012, 2011 and 2010 are set forth below.
| | | | | | | | | | | | |
| | | Year Ended | |
| | | February 29,
2012 | | | February 28,
2011 | | | February 28,
2010 | |
| Net revenue by major geographic area | | (In thousands) | |
United States | | $ | 108,773 | | | $ | 67,492 | | | $ | 62,489 | |
Canada | | | 15,331 | | | | 9,804 | | | | 7,667 | |
Germany | | | 74,374 | | | | 33,318 | | | | 12,977 | |
Other Europe/Middle East/Africa | | | 114,346 | | | | 57,956 | | | | 43,558 | |
Rest of World | | | 52,950 | | | | 21,546 | | | | 17,268 | |
| | | | | | | | | | | | |
Total | | $ | 365,774 | | | $ | 190,116 | | | $ | 143,959 | |
| | | | | | | | | | | | |
82
Major customers
During the year ended February 29, 2012, Memoryworld Gmbh & Co. represented approximately 10% of net revenue. During the years ended February 28, 2011 and 2010, Newegg.com represented approximately 17% and 19% of net revenue. No other individual customer represented 10% or more of net revenue as of February 29, 2012, February 28, 2011 or February 28, 2010.
Our top ten customers represented approximately 41% and 49% of net revenue for the years ended February 29, 2012 and February 28, 2011, respectively.
As of February 29,2012, Memoryworld Gmbh & Co. accounted for approximately 18% of trade receivables. As of February 28,2011, Newegg.com represented approximately 14% of trade receivables. No other individual customer represented 10% or more of trade receivables as of February 29, 2012 or February 28, 2011.
Property and equipment
| | | | | | | | |
| | | February 29,
2012 | | | February 28,
2011 | |
| | | (In thousands) | |
Property and equipment, net: | | | | | | | | |
United States | | $ | 901 | | | $ | 475 | |
Taiwan | | | 2,966 | | | | 2,560 | |
United Kingdom | | | 715 | | | | — | |
Rest of World | | | 416 | | | | 11 | |
| | | | | | | | |
Total | | $ | 4,998 | | | $ | 3,046 | |
| | | | | | | | |
| 18. | Supplementary Financial Information – Quarterly Financial Data (unaudited) |
The following table sets forth quarterly consolidated information:
| | | | | | | | | | | | | | | | | | | | | | | | | | | | | | | | |
| | | Year Ended February 29, 2012 | | | Year Ended February 28, 2011 | |
| | | Q4 | | | Q3 | | | Q2 | | | Q1 | | | Q4 | | | Q3 | | | Q2 | | | Q1 | |
| | | Feb 29 | | | Nov 30 | | | Aug 31 | | | May 31 | | | Feb 28 | | | Nov 30 | | | Aug 31 | | | May 31 | |
Net revenue | | $ | 110,442 | | | $ | 103,084 | | | $ | 78,454 | | | $ | 73,794 | | | $ | 64,566 | | | $ | 53,222 | | | $ | 38,045 | | | $ | 34,283 | |
Gross profit | | | 27,586 | | | | 23,175 | | | | 16,931 | | | | 14,744 | | | | 10,709 | | | | 7,661 | | | | 1,620 | | | | 4,164 | |
Operating income (loss) | | | (8,001 | ) | | | 2,346 | | | | (1,943 | ) | | | (4,339 | ) | | | (454 | ) | | | (4,574 | ) | | | (8,568 | ) | | | (3,404 | ) |
Net income (loss) per share—basic | | $ | (0.19 | ) | | $ | (0.02 | ) | | $ | 0.06 | | | $ | (0.20 | ) | | $ | (0.27 | ) | | $ | (0.29 | ) | | $ | (0.29 | ) | | $ | (0.19 | ) |
Net income (loss) per share—diluted | | $ | (0.19 | ) | | $ | (0.02 | ) | | $ | 0.06 | | | $ | (0.20 | ) | | $ | (0.27 | ) | | $ | (0.29 | ) | | $ | (0.29 | ) | | $ | (0.19 | ) |
On May 10, 2012 we signed an agreement with Wells Fargo Capital Finance (“WFCF”) for a $35 million senior secured credit facility. Borrowings under the WFCF facility will be limited to a borrowing base based on our receivables. The WFCF facility has a 5-year term and provides for a committed expansion up to $60 million of cumulative borrowings and for a potential further expansion to $100 million of total borrowings, in each case if certain conditions are met. The WFCF facility contains minimum liquidity levels and certain financial covenants if these levels are not met. There are also two interest rate options using either a “Base Rate” or a “LIBOR Rate” as defined, both of which contain an “Applicable Margin” spread ranging from 1.25% to 2.75% depending on the “Excess Availability” as defined.
83
| ITEM 9. | CHANGES IN AND DISAGREEMENTS WITH ACCOUNTANTS ON ACCOUNTING AND FINANCIAL DISCLOSURE |
Not applicable
| ITEM 9A. | CONTROLS AND PROCEDURES |
Evaluation of Disclosure Controls and Procedures
Disclosure controls and procedures are controls and procedures designed to reasonably assure that information required to be disclosed in our reports filed under the Securities Exchange Act of 1934 as amended, (the “ Exchange Act “), such as this report, is recorded, processed, summarized and reported within the time periods specified in the SEC’s rules and forms and to reasonably assure that such information is accumulated and communicated to our management, including the Chief Executive Officer and the Chief Financial Officer, as appropriate to allow timely decisions regarding required disclosure.
Under the supervision and with the participation of our management, including our Chief Executive Officer and Chief Financial Officer, we evaluated the effectiveness of the design and operation of our disclosure controls and procedures as of the end of the period covered by this report. Based on this evaluation, our Chief Executive Officer and Chief Financial Officer concluded that our disclosure controls and procedures (as defined in Rules 13a-15(f) and 15d-15(f) under the Exchange Act) were effective as of our fiscal year ended February 29, 2012.
Management’s Report on Internal Control over Financial Reporting
Our management is responsible for establishing and maintaining adequate internal control over financial reporting. Internal control over financial reporting is a process designed by, or under the supervision of, our Chief Executive Officer and Chief Financial Officer to provide reasonable assurance regarding the reliability of financial reporting and the preparation of financial statements for external purposes in accordance with generally accepted accounting principles and includes those policies and procedures that (1) pertain to the maintenance of records that in reasonable detail accurately and fairly reflect the transactions and dispositions of our assets; (2) provide reasonable assurance that transactions are recorded as necessary to permit preparation of financial statements in accordance with generally accepted accounting principles, and that our receipts and expenditures are being made only in accordance with authorizations of our management and directors; and (3) provide reasonable assurance regarding prevention or timely detection of unauthorized acquisition, use or disposition of our assets that could have a material effect on the financial statements.
Under the supervision and with the participation of our management, including our Chief Executive Officer and Chief Financial Officer, we conducted an evaluation of the effectiveness of our internal control over financial reporting based on criteria established in “Internal Control—Integrated Framework” issued by the Committee of Sponsoring Organizations of the Treadway Commission. Based on this evaluation, our management concluded that our internal control over financial reporting was effective as of February 29, 2012.
The Annual Report on Form 10-K does not include an attestation report of OCZ’s registered public accounting firm because such a report is not required for a smaller reporting company.
Limitations on the Effectiveness of Controls
Internal control over financial reporting cannot provide absolute assurance of achieving financial reporting objectives because of its inherent limitations. Internal control over financial reporting is a process that involves human diligence and compliance and is subject to lapses in judgment and breakdowns resulting from human failures. Internal control over financial reporting also can be circumvented by collusion or improper management
84
override. Because of such limitations, there is a risk that material misstatements may not be prevented or detected on a timely basis by internal control over financial reporting. However, these inherent limitations are known features of the financial reporting process. Therefore, it is possible to design into the process safeguards to reduce, though not eliminate, this risk.
Changes in Internal Control over Financial Reporting
There were no changes to our internal control over financial reporting (as defined in Rules 13a-15(f) and 15d-15(f) under the Exchange Act) that occurred during fiscal year ended February 29, 2012 that have materially affected, or are reasonably likely to materially affect, our internal control over financial reporting.
| ITEM 9B. | OTHER INFORMATION |
OCZ’s Board of Directors has set August 13, 2012 as the date of the 2012 Annual Meeting of Stockholders, which will be more than thirty days prior to the anniversary date of the 2011 annual meeting of stockholders. Therefore, in accordance with Rule 14a-5(f) under the Securities Exchange Act of 1934 (the “Exchange Act”) and other applicable rules of the Securities and Exchange Commission, we are hereby notifying our stockholders that May 24, 2012 will be the deadline for submitting stockholder proposals for inclusion in our proxy statement for the 2012 Annual Meeting pursuant to Rule 14a-8 of the Exchange Act, which we believe is a reasonable time before we will begin the printing and mailing of our proxy materials for the 2012 Annual Meeting. All stockholder proposals must be in compliance with applicable laws and regulations and our bylaws in order to be considered for inclusion in the proxy statement and form of proxy for the 2012 Annual Meeting. Stockholders are advised to review our bylaws, which contain additional procedural and substantive requirements. In addition, if we are not notified by such deadline of an intent to present a proposal at our 2012 Annual Meeting, management will have the right conferred by the proxies to exercise its discretionary voting authority with respect to such proposal, if presented at the meeting.
In order for a stockholder proposal regarding the nomination of a director or other business to be brought at the Annual Meeting outside of Rule 14a-8 to be considered timely under our bylaws, notice of the proposal must have been received by the Secretary at the Company’s principal headquarters prior to May 24, 2012. In order for either type of proposal to be considered, such notice must also contain certain information specified in our bylaws.
85
PART III
| ITEM 10. | DIRECTORS, EXECUTIVE OFFICERS AND CORPORATE GOVERNANCE |
The information required by this Item 10 of Form 10-K that is found in our 2012 Proxy Statement to be filed with the SEC in connection with the solicitation of proxies for the Company’s 2012 Annual Meeting of Stockholders (“2012 Proxy Statement”) is incorporated by reference to our 2012 Proxy Statement. The 2012 Proxy Statement will be filed with the SEC within 120 days after the end of the fiscal year to which this report relates. For information with respect to our executive officers, see “Executive Officers” at the end of Part I, Item 1 of this report.
| ITEM 11. | EXECUTIVE COMPENSATION |
The information required by this Item 11 of Form 10-K that is found in our 2012 Proxy Statement is incorporated by reference to our 2012 Proxy Statement.
| ITEM 12. | SECURITY OWNERSHIP OF CERTAIN BENEFICIAL OWNERS AND MANAGEMENT AND RELATED STOCKHOLDER MATTERS |
The information required by this Item 12 of Form 10-K that is found in our 2012 Proxy Statement is incorporated by reference to our 2012 Proxy Statement.
| ITEM 13. | CERTAIN RELATIONSHIPS AND RELATED TRANSACTIONS, AND DIRECTOR INDEPENDENCE |
The information required by this Item13 of Form 10-K that is found in our 2012 Proxy Statement is incorporated by reference to our 2012 Proxy Statement.
| ITEM 14. | PRINCIPAL ACCOUNTANT FEES AND SERVICES |
The information required by this Item 14 of Form 10-K that is found in our 2012 Proxy Statement is incorporated by reference to our 2012 Proxy Statement.
| ITEM 15. | EXHIBITS, FINANCIAL STATEMENT SCHEDULES |
The information required by this item is included in Item 8 of Part II of this report.
| | 2. | FINANCIAL STATEMENT SCHEDULES |
None.
The information required by this item is included on the exhibit index that follows the signature page of this report.
86
PART IV
SIGNATURES
Pursuant to the requirements of Section 13 or 15(d) of the Securities Exchange Act of 1934, the Registrant has duly caused this report to be signed on its behalf by the undersigned, thereunto duly authorized, in San Jose, California on May 14, 2012.
| | |
OCZ TECHNOLOGY GROUP, INC. |
| |
By: | | /s/ Ryan M. Petersen |
| | Ryan M. Petersen |
| | President and Chief Executive Officer |
| |
By: | | /s/ Arthur F. Knapp, Jr. |
| | Arthur F. Knapp, Jr. |
| | Chief Financial Officer |
Pursuant to the requirements of the Securities Exchange Act of 1934, this report has been signed by the following persons below on behalf of the registrant in the capacities and on the dates indicated.
| | | | |
Name | | Title | | Date |
| | |
/s/ Ryan M. Petersen Ryan M. Petersen | | Chief Executive Officer and Director (Principal Executive Officer) | | May 14, 2012 |
| | |
/s/ Arthur F. Knapp, Jr. Arthur F. Knapp, Jr. | | Chief Financial Officer (Principal Financial and Accounting Officer) | | May 14, 2012 |
| | |
/s/ Adam J. Epstein Adam J. Epstein | | Director | | May 14, 2012 |
| | |
/s/ Richard L. Hunter Richard L. Hunter | | Director | | May 14, 2012 |
| | |
/s/ Russell J. Knittel Russell J. Knittel | | Director | | May 14, 2012 |
| | |
/s/ Ralph Schmitt Ralph Schmitt | | Director | | May 14, 2012 |
87
EXHIBIT INDEX
| | |
EXHIBIT NO. | | DESCRIPTION |
| |
| 2.1 | | Agreement and Plan of Merger dated December 17, 2004 of OCZ Technology Group, Inc., an Indiana corporation, with and into OCZ Technology Group, Inc., a Delaware corporation. (1) |
| |
| 2.2 | | Asset Purchase Agreement dated May 25, 2007 by and among OCZ Technology Group, Inc., PC Power and Cooling, Inc. and Douglas Dodson. (1) |
| |
| 2.3 | | Asset Purchase Agreement dated October 25, 2007 by and among OCZ Technology Group, Inc., Silicon Data Inc., a New York corporation, Fred Cohen, and Eyal Akler. (1) |
| |
| 2.4 | | Share Purchase Agreement, dated March 14, 2011, by and among OCZ Technology Group, inc., Indilinx Co., Ltd., the shareholders of the Indilinx Co., Ltd. and DLS Law Firm, as Seller Representative. (13) |
| |
| 2.5 | | First Amendment to Share Purchase Agreement, dated March 22, 2011, by and among OCZ Technology Group, inc., Indilinx Co., Ltd., the shareholders of the Indilinx Co., Ltd. and DLS Law Firm, as Seller Representative. (14) |
| |
| 2.6 | | Agreement and Plan of Merger, dated January 9, 2012, by and among OCZ Technology Group, Inc., Melrose Merger Sub, Inc., Sanrad Inc. and certain stockholders of Sanrad Inc. (18) |
| |
| 3.1 | | Fourth Amended and Restated Certificate of Incorporation as filed with the Delaware Secretary of State on September 30, 2009, including the Certificate of Designations of Series A Junior Participating Preferred Stock. (10) |
| |
| 3.2 | | Fourth Amended and Restated Bylaws. (1) |
| |
| 4.1 | | Specimen common stock certificate of OCZ Technology Group, Inc. (10) |
| |
| 4.2 | | Rights Agreement, dated as of October 25, 2011, between OCZ Technology Group, Inc. and Computershare Trust Company, N.A., as Rights Agent (4) |
| |
| 10.1 | | OCZ Technology Group, Inc. 2004 Stock Incentive Plan. (17) |
| |
| 10.2 | | Executive Employment Agreement dated April 4, 2006 by and between OCZ Technology Group, Inc. and Ryan M. Petersen. (1) |
| |
| 10.3 | | Executive Employment Agreement dated April 4, 2006 by and between OCZ Technology Group, Inc. and Arthur F. Knapp, Jr. (1) |
| |
| 10.4 | | Executive Employment Agreement dated April 4, 2006 by and between OCZ Technology Group, Inc. and Alex Mei. (1) |
| |
| 10.5 | | Executive Employment Agreement dated December 17, 2008 by and between OCZ Technology Group, Inc. and Kerry Smith. (1) |
| |
| 10.6 | | Lease dated March 22, 2011 by and between SI 25 LLC and OCZ Technology Group, Inc. for the property located in San Jose, California, USA. (20) |
| |
| 10.7 | | Lease dated April 21, 2005 by and between Buckgolf Inc., & Greengolf Inc. and OCZ Canada Inc. dated for the property located in Markham, Ontario, Canada. (1) |
| |
| 10.8 | | Lease Extension Agreement, dated May 21, 2010, by and among Buckgolf Inc. & Greengolf Inc. and OCZ Canada Inc. (11) |
| |
| 10.9 | | English summary of lease for the property located in Taipei County, Taiwan. (1) |
| |
| 10.10 | | English summary of lease for the property located in Lujhu Township, Taiwan. (1) |
88
| | |
EXHIBIT NO. | | DESCRIPTION |
| |
| 10.11 | | Lease dated October 6, 2011 for the property located in Taoyuan County, Taiwan. (20) |
| |
| 10.12 | | Form of Indemnification Agreement for Directors and Officers of OCZ Technology Group, Inc. (1) |
| |
| 10.13 | | Loan and Security Agreement dated July 2009 by and between OCZ Technology Group, Inc. and Silicon Valley Bank. (1) |
| |
| 10.14 | | Sale of Accounts and Security Agreement by and between OCZ Technology Group, Inc. and Faunus Group International, Inc. dated July 6, 2009. (1) |
| |
| 10.15 | | Asset Purchase Agreement dated August 31, 2009, by and between OCZ Technology Group, Inc. and BCInet, Inc. (1) |
| |
| 10.16 | | Secured Promissory Note, dated August 31, 2009, issued by BCInet, Inc. to OCZ Technology Group, Inc. in the amount of $311,215. (1) |
| |
| 10.17 | | Secured Promissory Note, dated August 31, 2009, issued by BCInet, Inc. to OCZ Technology Group, Inc. in the amount of $170,000. (1) |
| |
| 10.18 | | Secured Convertible Promissory Note, dated August 31, 2009, issued by BCInet, Inc. to OCZ Technology Group, Inc. in the amount of $414,200. (1) |
| |
| 10.19 | | Series A Preferred Stock Purchase Agreement dated August 31, 2009 by and between BCInet, Inc. and OCZ Technology Group, Inc. (1) |
| |
| 10.20 | | Security Agreement dated August 31, 2009 by and between BCI net, Inc. and OCZ Technology Group, Inc. (2) |
| |
| 10.21 | | Promissory Note dated August 19, 2009 from OCZ Technology Group, Inc. to The Ryan Petersen and Sarita Nuez Family Trust. (3) |
| |
| 10.22 | | Distribution Agreement June 2009, by and between OCZ Technology Group, Inc. and Bell Microproducts Canada. (6) |
| |
| 10.23 | | Securities Purchase Agreement dated March 23, 2010 by and among OCZ Technology Group, Inc. and the institutional and accredited investors listed therein (5) |
| |
| 10.24 | | Registration Rights Agreement dated March 23, 2010 by and among OCZ Technology Group, Inc. and the Purchasers (as defined therein). (5) |
| |
| 10.25 | | Form of Warrant for the institutional and accredited investors. (5) |
| |
| 10.26 | | Form of Warrant for Placement Agent (as defined therein). (5) |
| |
| 10.27 | | Second Amendment to the Loan and Security Agreement dated May 10, 2010 by and between OCZ Technology Group, Inc. and Silicon Valley Bank. (19) |
| |
| 10.28 | | Offer Letter dated December 30, 2009 memorializing the terms of Mr. Adam J. Epstein’s services as a non-executive director. (9) |
| |
| 10.29 | | Offer Letter dated December 30, 2009 memorializing the terms of Mr. Richard L. Hunter’s services as a non-executive director. (9) |
| |
| 10.30 | | Securities Purchase Agreement dated October 29, 2010 by and among OCZ Technology Group, Inc. and the institutional and accredited investors listed therein. (7) |
| |
| 10.31 | | Registration Rights Agreement dated October 29, 2010 by and among OCZ Technology Group, Inc. and the Purchasers (as defined therein). (7) |
| |
| 10.32 | | Form of Warrant for the institutional and accredited investors. (7) |
89
| | |
EXHIBIT NO. | | DESCRIPTION |
| |
| 10.33 | | Form of Warrant for Placement Agent (as defined therein). (7) |
| |
| 10.34 | | Amended and Restated Loan and Security Agreement dated February 7, 2011 by and between OCZ Technology Group, Inc. and Silicon Valley Bank. (8) |
| |
| 10.35 | | Registration Rights Agreement, dated March 25, 2011, by and among OCZ Technology Group, Inc. and the Sellers (as defined therein). (14) |
| |
| 10.36 | | Escrow Agreement, dated March 25, 2011, by and among OCZ Technology Group, Inc. and DLS Law Firm, as Seller Representative. (14) |
| |
| 10.37 | | Employment Agreement, dated March 25, 2011, by and between OCZ Technology Group, Inc. and Bumsoo Kim. (14) |
| |
| 10.38 | | Employment Agreement, dated March 25, 2011, by and between OCZ Technology Group, Inc. and Hyun Mo Chung. (14) |
| |
| 10.39 | | Amendment No. 1 and Limited Waiver to Amended and Restated Loan and Security Agreement, dated March 28, 2011, by and between OCZ Technology Group, Inc. and Silicon Valley Bank. (15) |
| |
| 10.40 | | Amendment No. 2 to Amended and Restated Loan and Security Agreement, dated April 21, 2011, by and between OCZ Technology Group, Inc. and Silicon Valley Bank. (15) |
| |
| 10.41 | | Amendment No. 3 and Limited Waiver to Amended and Restated Loan and Security Agreement, dated June 21, 2011, by and between OCZ Technology Group, Inc. and Silicon Valley Bank. (15) |
| |
| 10.42 | | Amendment No. 4 and Limited Waiver to Amended and Restated Loan and Security Agreement, dated July 14, 2011, by and between OCZ Technology Group, Inc. and Silicon Valley Bank. (15) |
| |
| 10.43 | | OCZ Severance Plan for Management and Key Employees. (16) |
| |
| 10.44 | | Amendment No. 5 to Amended and Restated Loan and Security Agreement and Consent, dated October 31, 2011, by and between OCZ Technology Group, Inc. and Silicon Valley Bank. (20) |
| |
| 10.45 | | Amendment No. 6 to Amended and Restated Loan and Security Agreement and Consent, dated January 31, 2012, by and between OCZ Technology Group, Inc. and Silicon Valley Bank. (20) |
| |
| 10.46 | | Limited Waiver to Amended and Restated Loan and Security Agreement, dated April 25, 2012, by and between OCZ Technology Group, Inc. and Silicon Valley Bank. (20) |
| |
| 21.1 | | List of Subsidiaries of the Registrant. (20) |
| |
| 23.1 | | Consent of Independent Registered Public Accounting Firm – Crowe Horwath LLP. (20) |
| |
| 31.1 | | Chief Executive Officer’s Certification required by Rule 13(a)-14(a). (20) |
| |
| 31.2 | | Chief Financial Officer’s Certification required by Rule 13(a)-14(a). (20) |
| |
| 32.1 | | Chief Executive Officer and Chief Financial Officer Certification pursuant to 18 U.S.C. 1350, as adopted to section 906 of the Sarbanes-Oxley Act of 2002. (20) |
90
| | |
EXHIBIT NO. | | DESCRIPTION |
| |
| 101 | | The following materials from Registrant’s Annual Report on Form 10-K for the year ended February 29, 2012, formatted in Extensible Business Reporting Language (XBRL): Consolidated Balance Sheets at February 29, 2012 and February 28, 2011; (ii) Consolidated Statements of Operations for the Years Ended February 29, 2012, February 28, 2011 and February 28, 2010; (iii) Consolidated Statements of Stockholders’ Equity and Comprehensive Income (Loss) for the Years Ended February 29, 2012, February 28, 2011 and February 28, 2010; (iv) Consolidated Statements of Cash Flows for the Years Ended February 29, 2012, February 28, 2011 and February 28, 2010; and (v) Notes to Consolidated Financial Statements, tagged as blocks of text. |
| |
| | XBRL information is furnished and not filed herewith, is not part of a registration statement or prospectus for purposes of Sections 11 or 12 of the Securities Exchange Act of 1933, as amended, is deemed not filed for purposes of Section 18 of the Securities Exchange Act of 1934, as amended, and otherwise is not subject to liability under these sections. |
| (1) | Incorporated by reference to the Registrant’s Form 10 filed on September 30, 2009. |
| (2) | Incorporated by reference to the Registrant’s Form 10 filed on November 12, 2009. |
| (3) | Incorporated by reference to the Registrant’s Form 10 filed on December 4, 2009. |
| (4) | Incorporated by reference to the Registrant’s Form 8-K filed on October 28, 2011. |
| (5) | Incorporated by reference to the Registrant’s Form 8-K filed on March 26, 2010. |
| (6) | Incorporated by reference to the Registrant’s Form 8-K filed on February 25, 2010. |
| (7) | Incorporated by reference to the Registrant’s Form 8-K filed on November 4, 2010. |
| (8) | Incorporated by reference to the Registrant’s Form 8-K filed on February 11, 2011. |
| (9) | Incorporated by reference to the Registrant’s Form 10-K filed on May 20, 2010. |
| (10) | Incorporated by reference to the Registrant’s Form S-3 filed on December 1, 2011 (File No. 333-178247). |
| (11) | Incorporated by reference to the Registrant’s Form 8-K filed on May 27, 2010. |
| (12) | Incorporated by reference to the Registrant’s Form 8-K filed on June 23, 2010. |
| (13) | Incorporated by reference to the Registrant’s Form 8-K filed on March 18, 2011. |
| (14) | Incorporated by reference to the Registrant’s Form 8-K filed on March 28, 2011. |
| (15) | Incorporated by reference to the Registrant’s Form 10-Q filed on July 15, 2011. |
| (16) | Incorporated by reference to the Registrant’s Form 8-K filed on September 30, 2011. |
| (17) | Incorporated by reference to the Registrant’s Form S-8 filed on October 14, 2011 (File No. 333-177323). |
| (18) | Incorporated by reference to the Registrant’s Form 8-K filed on January 13, 2012. |
| (19) | Incorporated by reference to the Registrant’s Form 8-K filed on May 11, 2010. |
91