0001370431 cik0001370431:NoExpiryMember cik0001370431:UnabsorbedDepreciationMember 2021-03-31
UNITED STATES
SECURITIES AND EXCHANGE COMMISSION
WASHINGTON, D.C. 20549
FORM
20-F
(Mark One)
| ☐ | Registration statement pursuant to section 12(b) or (g) of the Securities Exchange Act of 1934 |
or
| ☒ | Annual report pursuant to section 13 or 15(d) of the Securities Exchange Act of 1934 |
For fiscal year ended March 31, 2022
or
| ☐ | Transition report pursuant to section 13 or 15(d) of the Securities Exchange Act of 1934 |
From the transition period from to
or
| ☐ | Shell company report pursuant to section 13 or 15(d) of the Securities Exchange Act of 1934 |
Date of event requiring this shell company report
From the transition period from to
Commission file number
001-33175
Vedanta Limited
(Exact Name of Registrant as specified in its charter)
486 Republic of India | 1 st Floor, ‘C’ wing, Unit 103Corporate Avenue, Atul Projects, Chakala, Andheri (East), Mumbai - 400 093, Maharashtra, India | |
(Jurisdiction of Incorporation or Organization) | (Address of Principal Executive Offices) |
Prerna Halwasiya
Compliance Officer
Core-6, 3rd Floor, Scope Complex, 7, Lodhi Road
New Delhi-110003, India
(91) 95-9966-7760
comp.sect@vedanta.co.in
(Name, Telephone,
E-mail
and/or facsimile number and Address of Company Contact Person)Securities registered or to be registered pursuant to Section 12(g) of the Act.
Title of Each Class
American Depositary Shares
each representing four equity shares
par value
₹
1 per equity share
None
(Title of Class)
Securities for which there is a reporting obligation pursuant to Section 15(d) of the Act.
None
(Title of Class)
Indicate the number of outstanding shares of each of the issuer’s classes of capital or common stock as of the close of the period covered by the annual report.
As of March 31, 2022, 3,717,504,871 equity shares, par value
₹
1 per equity share. were issued and outstanding.
Indicate by check mark if the registrant is a well-known seasoned issuer, as defined in Rule 405 of the Securities Act.
Yes ☒ No ☐
If this report is an annual or transition report, indicate by check mark if the registrant is not required to file reports pursuant to Section 13 or 15(d) of the Securities Exchange Act of 1934.
Yes ☐ No ☒
Indicate by check mark whether the registrant (1) has filed all reports required to be filed by Section 13 or 15(d) of the Securities Exchange Act of 1934 during the preceding 12 months (or for such shorter period that the registrant was required to file such reports), and (2) has been subject to such filing requirements for the past 90 days.
Yes ☒ No ☐
Indicate by check mark whether the registrant has submitted electronically, every Interactive Data File required to be submitted pursuant to Rule 405 of Regulation
S-T
(§232.405 of this chapter) during the preceding 12 months (or for such shorter period that the registrant was required to submit such files).Yes ☒ No ☐
Indicate by check mark whether the registrant is a large accelerated filer, an accelerated filer, a
non-accelerated
filer, or an emerging growth company. See definition of “large accelerated filer,” “accelerated filer” and “emerging growth company” in Rule12b-2
of the Exchange Act.Large accelerated filer ☒ | Accelerated filer ☐ | Non-accelerated filer ☐ | ||
| Emerging growth company ☐ |
If an emerging growth company that prepares its financial statements in accordance with U.S. GAAP, indicate by check mark if the registrant has elected not to use the extended transition period for complying with any new or revised financial accounting standards† provided pursuant to Section 13(a) of the Exchange Act. ☐
† The term “new or revised financial accounting standard” refers to any update issued by the Financial Accounting Standards Board to its Accounting Standards Codification after April 5, 2012.
Indicate by check mark whether the registrant has filed a report on and attestation to its management’s assessment of the effectiveness of its internal control over financial reporting under Section 404(b) of the Sarbanes-Oxley Act (15 U.S.C. 7262(b)) by the registered public accounting firm that prepared or issued its audit report. ☒
Indicate by check mark which basis of accounting the registrant has used to prepare the financial statements included in this filing:
US GAAP ☐ | International Financial Reporting Standards as issued by the International Accounting Standards Board ☒ | Other ☐ |
If “Other” has been checked in the previous question, indicate by check mark which financial statement item the registrant has elected to follow.
Item 17 ☐ Item 18 ☐
If this is an annual report, indicate by check mark whether the registrant is a shell company (as defined in Rule
12b-2
of the Securities Exchange Act of 1934).Yes ☐ No ☒
TABLE OF CONTENTS
PAGE NO. | ||||||
ITEM 1. | 4 | |||||
ITEM 2. | 4 | |||||
ITEM 3. | 4 | |||||
ITEM 4. | 35 | |||||
ITEM 4A. | 136 | |||||
ITEM 5. | 136 | |||||
ITEM 6. | 174 | |||||
ITEM 7. | 198 | |||||
ITEM 8. | 202 | |||||
ITEM 9. | 223 | |||||
ITEM 10. | 225 | |||||
ITEM 11. | 258 | |||||
ITEM 12. | 258 | |||||
ITEM 13. | 260 | |||||
ITEM 14. | 260 | |||||
ITEM 15. | 260 | |||||
ITEM 16A. | 262 | |||||
ITEM 16B. | 262 | |||||
ITEM 16C. | 263 | |||||
ITEM 16D. | 263 | |||||
ITEM 16E. | 263 | |||||
ITEM 16F. | 264 | |||||
ITEM 16G. | 264 | |||||
ITEM 16H. | 264 | |||||
ITEM 16I. | 264 | |||||
ITEM 17. | 264 | |||||
ITEM 18. | 264 | |||||
ITEM 19. | 265 | |||||
| 274 | ||||||
F-1 | ||||||
CONVENTIONS USED IN THIS ANNUAL REPORT
In this Annual Report, we refer to information regarding the zinc, oil and gas, iron ore, copper, aluminium, steel and power industries and our competitors from market research reports, analyst reports and other publicly available sources. Although we believe that this information is reliable, we have not independently verified the accuracy and completeness of the information. We caution you not to place undue reliance on this data.
On February 25, 2012, Vedanta Resources Limited (“Vedanta” or “VRL”), the parent company of Sterlite Industries (India) Limited (“Sterlite” or “SIIL”), Sesa Goa Limited (“Sesa Goa”), Vedanta Aluminium Limited (“Vedanta Aluminium”), Sterlite Energy Limited (“Sterlite Energy”), Cairn India Limited (“Vedanta Limited - oil and gas business”) and The Madras Aluminium Company Limited (“MALCO”) announced an”.
all-share
merger of majority owned subsidiaries, Sesa Goa and SIIL, to create Sesa Sterlite Limited (“Sesa Sterlite” or “SSL”) and a consolidation of various subsidiaries held by Vedanta to effect the consolidation and simplification of Vedanta’s corporate structure through two series of transactions (together the“Re-organization
Transactions” consisting of the “Amalgamation andRe-organization
Scheme” and the “Cairn India Consolidation”). TheRe-organization
transactions were completed during fiscal year 2014 and the name of the merged entity was changed to Sesa Sterlite Limited with effect from September 18, 2013. The name of Sesa Sterlite Limited was changed to Vedanta Limited (“VEDL”), with effect from April 21, 2015. Cairn India Limited (now Vedanta Limited’s - oil and gas business) merged into Vedanta Limited by way of a scheme of arrangement and the Board of Directors of both the companies made the merger operative on April 11, 2017 (the “Cairn India Merger”). All references to Vedanta Limited - oil and gas business and its subsidiaries are referred to as “Cairn”. See “Item 4: Information on the Company - A. History and Development of our Company
Sterlite Energy was a wholly owned subsidiary of SIIL, and SIIL, Vedanta Aluminium, Sesa Goa, MALCO and Cairn India Limited (now Vedanta Limited - oil and gas business) were subsidiaries of Vedanta, the ultimate holding company. Therefore, the
Re-organization
Transactions and Cairn India Merger fall within the purview of the common control business combination transactions. The accounting policies described in Notes 1 and 3(a)C. - “Business Combinations” of the consolidated financial statements included elsewhere in this Annual Report requires that financial statements of the combined entity, Vedanta Limited, be retroactively adjusted, as if the transaction had occurred at the earliest reporting period (or from the date the entity came under common control, where such a date is later).In this Annual Report, references to the “ADS offering” is to the initial public offering of our equity shares in the form of American Depositary Shares (“ADSs”), each currently representing four equity shares, in the United States (or the “US”) completed in June 2007.
Unless otherwise indicated, our accompanying financial information has been prepared in accordance with International Financial Reporting Standards (“IFRS”), as issued by the International Accounting Standards Board (“IASB”), for fiscal years ended March 31, 2020, 2021 and 2022. References to a particular “fiscal year or “FY” are to our fiscal year ended March 31 of that year. Our fiscal quarters end on June 30, September 30 and December 31. References to a year other than a “fiscal” year are to the Calendar Year (“CY”) ended December 31.
Our consolidated financial statements are reported in Indian Rupees or “”. Unless otherwise specified, translation of amounts for the convenience of the reader has been made in this Annual Report (i) from Indian Rupees to US dollars at the rate of 75.87 per $ 1 based on the exchange rate quoted by the Federal Reserve Bank of New York as of March 31, 2022; (ii) from Australian dollars to US dollars at the rate of AUD 1.3335 per $ 1 based on the exchange rate quoted by the Federal Reserve Bank of New York as of March 31, 2022; (iii) from South African Rand to US dollars at the rate of ZAR 14.6150 per $ 1 based on the exchange rate quoted by the Federal Reserve Bank of New York as of March 31, 2022 ; (iv) from British Pound to US dollars at the rate of GBP 0.7603 per $ 1 based on the exchange rate quoted by the Federal Reserve Bank of New York as of March 31, 2022 and (v) from Namibian dollars to US dollars at the rate of NAD 14.4848 per $ 1 based on the exchange rate quoted at www.oanda.com as of March 31, 2022. As of July 15, 2022, the exchange rate between US dollars and Indian Rupees was $ 1 = 79.7400 as quoted by the Federal Reserve Bank of New York. All financial information presented in US dollars has been rounded to nearest decimal. Any amount less than US dollar 0.5 million has been presented as “0”.
₹
₹
₹
In this Annual Report, references to “US” or the “United States” are to the United States of America, its territories and its possessions. References to “UK” are to the United Kingdom. References to “India” are to the Republic of India. References to “Namibia” are to the Republic of Namibia. References to “South Africa” are to the Republic of South Africa. References to “Ireland” are to the Republic of Ireland. References to “Sri Lanka” are to the Democratic Socialist Republic of Sri Lanka. References to “UAE” are to the United Arab Emirates. References to “$”, “dollars” or “US dollars” are to the legal currency of the United States. References to “Indian Rupees”, or “” are to the legal currency of the Republic of India. References to “AUD”, “Australian dollars” are to the legal currency of the Commonwealth of Australia. References to “NAD” or “Namibian dollars” are to the legal currency of Namibia. References to “ZAR” or “RAND” are to the legal currency of the Republic of South Africa. References to “¢” are to US cents. References to “RMB”, “Renminbi”, “CNY” or “Chinese Yuan” are to the legal currency of the People’s Republic of China. References to “JPY” are to the legal currency of Japan.
₹
1
References to “lb” are to the imperial pounds (mass) equivalent to 0.4536 kilograms, references to “mt” or “tons” are to metric tons, references to “mmt” are to million metric tons, references to “tpd” are to tons per day, references to “tpa” are to tons per annum, a unit of mass equivalent to 1,000 kilograms or 2,204.6 lb, references to “mtpa” are to million tons per annum, “mmtpa” are to million metric tons per annum, references to “wmt” are to wet metric tons, references to “dmt” are to dry metric tons, references to “oz” are to ounces, with one kilogram being equivalent to 32.1507 oz and one ton equivalent to 32,151 oz, references to “mm” are to millimeters, references to “ha” are to hectares, references to “kms” are to kilometers, a unit of area equal to 10,000 square meters or 107,639 square feet, references to “GW” are to giga watts, references to “kt” are to kilo tons, references to “bbls” are to barrels, references to “blpd” are to barrels of liquid per day, references to “boe” are barrel of oil equivalent, references to “mmboe” are to million barrels of oil equivalent, references to “bboe” are to billion barrel of oil equivalent, references to “mmbopd” are to million barrels of oil per day, references to “kbopd” are to kilo barrels of oil per day, references to “bopd” are to barrels of oil per day, references to “boepd” are to barrels of oil equivalent per day, references to “tcm” are to trillion cubic meters, references to “mmscmd” are to million metric standard cubic meter per day, references to “mscf” are to thousand standard cubic feet, references to “mmscf” are to million metric standard cubic feet, references to “mmscfd” are to million metric standard cubic feet per day, references to “TWh” are to terawatt TWh hours, references to “bcf” are to billion cubic feet, ‘bwpd” are barrels of water per dayx and references to “TcRc” are to treatment and refining charges. References to net oil and gas production are to the entitlement interest production of Vedanta Limited’s - oil and gas business and its subsidiaries, in which the Ravva royalty is not netted off. References to “GoI” are to Government of India.
We conduct our businesses both directly and through a consolidated group of companies that we have ownership interests in. See “Item 4. Information on the Company” for more information on these companies and their relationships to us. Unless otherwise stated in this Annual Report or unless the context otherwise requires, references in this Annual Report to “we”, “us”, “our”, “Vedanta Limited”, “Sesa Sterlite Limited (SSL)”, “Sesa Sterlite”, “SSL”, “our Company”, “the Company” or “our consolidated group of companies” mean Vedanta Limited, its consolidated subsidiaries and its predecessors, collectively, including Cairn India Limited (now Vedanta Limited - oil and gas business) and its subsidiaries (“Cairn”), Monte Cello BV (“Monte Cello”), Copper Mines of Tasmania Proprietary Limited (“CMT”), Thalanga Copper Mines Proprietary Limited, Bharat Aluminium Company Limited (“BALCO”), Hindustan Zinc Limited (“HZL”), Fujairah Gold FZC, Talwandi Sabo Power Limited (“TSPL”), THL Zinc Ventures Limited, THL Zinc Limited, THL Zinc Holding B.V., THL Zinc Namibia Holdings (Proprietary) Limited (“Skorpion”), Skorpion Zinc (Proprietary) Limited, Skorpion Mining Company (Proprietary) Limited, Namzinc (Proprietary) Limited, Amica Guesthouse (Proprietary) Limited, Rosh Pinah Health Care (Proprietary) Limited, Black Mountain Mining (Proprietary) Limited (“BMM”), Vedanta Lisheen Holdings Limited (“Lisheen”), Vedanta Lisheen Mining Limited, Killoran Lisheen Mining Limited, Lisheen Milling Limited, Vedanta Exploration Ireland Limited, Lisheen Mine Partnership, Sterlite Ports Limited, Vizag General Cargo Berth Private Limited (“VGCB”), Paradip Multi Cargo Berth Private Limited, Lakomasko B.V., MALCO Energy Limited (“MALCO Energy”) (formerly known as Vedanta Aluminium), Sesa Resources Limited, Sesa Mining Corporation Limited, Bloom Fountain Limited (“BFL”), Goa Sea Port Private Limited, Western Cluster Limited (“WCL”), Maritime Ventures Private Limited, ESL Steels Limited (formerly known as Electrosteel Steels Limited) (“ESL”) and Avanstrate Inc. (“ASI”), Avanstrate Korea, Avanstrate Taiwan, Ferro Alloys Corporation Limited (“FACOR”), Facor Power Limited (“FPL”), Facor Realty and Infrastructure Limited (“FRIL”), Cairn India Holdings Limited (“CIHL”), Cairn Energy Hydrocarbons Limited (“CEHL”), Cairn Energy Gurajat Block 1 Limited, CIG Mauritius Holdings Private Limited (“CIGMHPL”), CIG Mauritius Private Limited (“CIGMPL”), Cairn Lanka (Pvt) Ltd. (“CLPL”), Hindustan Zinc Alloys Private Limited (“HZAPL”), Vedanta Zinc Football & Sports Foundation (“VZFSF”), Desai Cement Company Private Limited (“DCCPL”).
Our consolidated financial information does not include our controlling shareholder Vedanta, its shareholders and various companies owned directly or indirectly by it (other than us and our consolidated group of companies described above), including without limitations, Vedanta Resources Holdings Limited (“VRHL”), Konkola Copper Mines Plc, Twin Star Holdings Limited (“Twin Star”), Welter Trading Limited (“Welter Trading”), the Anil Agarwal Discretionary Trust (“Trust”), Conclave PTC Limited (“Conclave”), Volcan Investments Limited (“Volcan”), Volcan Investments Cyprus Limited, Sterlite Technologies Limited, Valliant (Jersey) Limited, Vedanta Resources Jersey II Limited, Vedanta Resources Finance Limited, Vedanta Resources Cyprus Limited, Richter Holding Limited (“Richter”), Westglobe Limited (“Westglobe”), Finsider International Company Limited (“Finsider”), Vedanta Resources Jersey Limited, Vedanta Finance UK Limited, Vedanta Resources Investments Limited, Vedanta Holdings Jersey Limited, Vedanta Holdings Mauritius Limited, Vedanta Holdings Mauritius II Limited, Vedanta UK Investments Limited, Vedanta Netherlands Investments BV, Vedanta Netherlands Investments II BV and Vedanta Resources Finance II Plc. References to the “Group” is to Vedanta Limited and its subsidiaries on a consolidated basis and references to the “Vedanta Group” is to Vedanta and its subsidiaries on a consolidated basis.
In this Annual Report, references to the London Metal Exchange Limited (“LME”) price of zinc, copper, aluminium are to the cash seller and settlement price on the LME for zinc, copper or aluminium for the period indicated. References to primary market share in this Annual Report are to the market that includes sales by producers of metal from copper concentrate or alumina, as applicable, and do not include sales by producers of recycled metal or imports.
2
SPECIAL NOTE REGARDING FORWARD-LOOKING STATEMENTS
This Annual Report contains “forward-looking statements” as defined in the safe harbor provisions of the US Private Securities Litigation Reform Act of 1995. These forward-looking statements are based on our current expectations, assumptions, estimates and projections about our company and our industry. These forward-looking statements are subject to various risks and uncertainties. Generally, these forward-looking statements can be identified by the use of forward-looking terminology such as “anticipate,” “believe,” “estimate,” “expect,” “intend,” “will,” “project,” “seek,” “should” and similar expressions. These forward-looking statements include, among other things, the discussions of our business strategy and expectations concerning our market position, future operations, margins, profitability, liquidity and capital resources. We caution you that reliance on any forward-looking statement involves risks and uncertainties, and that, although we believe that the assumptions on which our forward-looking statements are based are reasonable, any of those assumptions could prove to be inaccurate and, as a result, the forward-looking statements based on those assumptions could be materially incorrect. Factors which could cause these assumptions to be incorrect include, but are not limited to:
| • | changes resulting directly or indirectly due to COVID-19 pandemic; |
| • | regulatory, legislative and judicial developments and future regulatory actions and conditions in our operating areas; |
| • | dependence on obtaining and maintaining mining leases for our mining sites and approvals from regulatory authorities for increasing oil and gas production; |
| • | compliance with extensive environmental and health and safety regulations; |
| • | the future capital requirements of our business and the availability of financing on favorable terms; |
| • | volatility in the prices of or demand for zinc, oil and gas, iron ore, copper, aluminium, steel or power or increase in supply of zinc, oil and gas, iron ore, copper, aluminium, steel or power; |
| • | events that could cause a decrease in our production and higher cost of production for zinc, oil and gas, iron ore, copper, aluminium or power; |
| • | unavailability or increased costs of raw materials for our products; |
| • | general risks related to Vedanta Limited’s commercial power business and challenges in operationalization of investment in aluminium and power business; |
| • | interruptions in the availability of exploration, production or supply equipment or infrastructure and/or increased costs; |
| • | our actual economically recoverable lead-zinc ore, copper ore or coal reserves being lower than we have estimated; |
| • | our ability to expand our business, effectively manage our growth or implement our strategy; |
| • | our ability to retain our senior management team and hire and retain sufficiently skilled labor to support our operations; |
| • | increasing competition in the zinc, oil and gas, iron ore, copper, aluminium, steel or power industries; |
| • | political or economic instability in and around India or around the regions in which we operate; |
| • | worldwide economic and business conditions; |
| • | reliance on third party contractors and providers of equipment which may not be readily available and whose costs may increase; |
| • | our ability to successfully consummate strategic acquisitions; |
| • | our ability to simplify our group structure and reduction in non-controlling stake in group companies; |
| • | the outcome of outstanding litigation in which we are involved; |
| • | our ability to maintain good relations with respective local communities and our trade unions and avoid protests, strikes and lock-outs; |
| • | the continuation of tax holidays, exemptions and deferred tax schemes we currently enjoy; |
| • | changes in tariffs, royalties, customs duties and government assistance; |
| • | terrorist attacks and other acts of violence, natural disasters, increasing impact of climate change and other environmental conditions and outbreaks of infectious diseases and other public health concerns in India, Asia and elsewhere ; |
| • | fluctuations in currency exchange rates; |
| • | failure of digital infrastructure and cyber security attacks due to negligence or IT security failures; |
| • | our ability to discover new reserves, enhance existing reserves or develop new operations in sufficient quantities to maintain or grow the current level of our reserves; and |
| • | any actions of our controlling shareholder, Vedanta. |
3
These and other factors are more fully discussed in “Item 3. Key Information - D. Risk Factors,” “Item 5. Operating and Financial Review and Prospects” and elsewhere in this Annual Report. In the light of these and other uncertainties, you should not conclude that we will necessarily achieve any plans, objectives or projected financial results referred to in any of the forward-looking statements. Except as required by law, we do not undertake to release revisions to any of these forward-looking statements to reflect future events or circumstances.
PART I
ITEM 1. | IDENTITY OF DIRECTORS, SENIOR MANAGEMENT AND ADVISERS |
Not applicable
ITEM 2. | OFFER STATISTICS AND EXPECTED TIMETABLE |
Not applicable
ITEM 3. | KEY INFORMATION |
A. Selected Consolidated Financial Data
The selected consolidated financial data presented below as of March 31, 2021, and 2022 and for the years ended March 31, 2020, 2021 and 2022 has been derived from our consolidated financial statements included herein, which have been prepared in conformity with IFRS as issued by the IASB. The consolidated financial statements as of March 31, 2021, and 2022 and for the years ended March 31, 2020, 2021, and 2022 have been audited by S.R. Batliboi & Co. LLP, India, our independent registered public accounting firm, and included elsewhere in this Annual Report.
The selected consolidated financial data presented below as of March 31, 2018, 2019 and 2020, and for the years ended March 31, 2018, and 2019 has been derived from our consolidated financial statements, which also have been prepared in conformity with IFRS as issued by the IASB, and which have not been included in this Annual Report.
Our historical results do not necessarily indicate our expected results for any future period. The translation of Indian Rupee amounts to US dollars presented in the tables below, are solely for the convenience of the reader and are based on the noon buying rate of 75.87 per $ 1 in the City of New York for cable transfers of Indian Rupees, as certified for customs purposes by the Federal Reserve Bank of New York on March 31, 2022. No representation is made that the Indian Rupee amounts represent US dollar amounts or have been, could have been or could be converted into US dollars at such rates or at any other rates.
₹
You should read the following information in conjunction with “Item 5. Operating and Financial Review and Prospects” and the consolidated financial statements included elsewhere in this Annual Report.
For the Year Ended March 31, | ||||||||||||||||||||||||
2018 | 2019 | 2020 | 2021 | 2022 | 2022 | |||||||||||||||||||
( ₹ in millions except shares and per share data) | ($ in millions except shares and per share data) | |||||||||||||||||||||||
INCOME STATEMENT DATA | ||||||||||||||||||||||||
Revenue | 909,549 | 909,012 | 835,446 | 868,630 | 1,311,917 | 17,292 | ||||||||||||||||||
Profit/ (Loss) for the year | 47,284 | 76,229 | (42,100 | ) | 146,990 | 257,079 | 3,388 | |||||||||||||||||
Earnings per share | ||||||||||||||||||||||||
Basic | 3.80 | 13.43 | (16.54 | ) | 30.47 | 56.11 | 0.74 | |||||||||||||||||
Diluted | 3.79 | 13.38 | (16.54 | ) | 30.28 | 55.72 | 0.73 | |||||||||||||||||
CASH FLOW DATA | ||||||||||||||||||||||||
Cash flow from operating activities | 348,407 | 208,420 | 182,393 | 295,952 | 282,819 | 3,727 | ||||||||||||||||||
Cash flow used in investing activities | (52,153 | ) | (133,147 | ) | (116,866 | ) | (167,358 | ) | (36,608 | ) | (482 | ) | ||||||||||||
Cash flow used in financing activities | (357,144 | ) | (45,643 | ) | (87,356 | ) | (131,371 | ) | (208,166 | ) | (2,744 | ) | ||||||||||||
BALANCE SHEET DATA | ||||||||||||||||||||||||
Total assets | 1,764,429 | 1,930,910 | 1,755,405 | 1,771,247 | 1,929,507 | 25,432 | ||||||||||||||||||
Short-term borrowings | 313,700 | 315,053 | 212,231 | 189,600 | 168,944 | 2,227 | ||||||||||||||||||
Long-term borrowings | 267,888 | 347,209 | 367,244 | 379,622 | 362,023 | 4,772 | ||||||||||||||||||
Non-controlling interests | 157,377 | 150,608 | 169,374 | 149,452 | 171,356 | 2,257 | ||||||||||||||||||
Equity attributable to equity holders of the parent | 596,800 | 581,388 | 512,521 | 584,597 | 635,766 | 8,380 | ||||||||||||||||||
DIVIDENDS | ||||||||||||||||||||||||
Dividend per share | 21.2 | 18.85 | 3.9 | 9.50 | 45 | 0.59 | ||||||||||||||||||
Weighted average number of equity shares used in computing earnings per share | ||||||||||||||||||||||||
Basic | 3,709,778,760 | 3,705,502,141 | 3,702,554,614 | 3,704,196,924 | 3,706,455,160 | 3,706,455,160 | ||||||||||||||||||
Diluted | 3,717,466,311 | 3,721,449,633 | 3,702,554,614 | 3,727,544,981 | 3,732,148,735 | 3,732,148,735 | ||||||||||||||||||
4
B. Capitalization and Indebtedness
Not applicable
C. Reasons for the Offer and Use of Proceeds
Not applicable
D. Risk Factors
This Annual Report contains forward-looking statements that involve risks and uncertainties. Our actual results could differ materially from those anticipated in these forward-looking statements as a result of a number of factors, including those described in the following risk factors and elsewhere in this Annual Report. If any of the following risks actually occur, our business, financial condition and results of operations could suffer, and the trading price of our equity shares could decline.
Summary
The following summary provides an overview of the risks related to our businesses we are exposed to in the normal course of our business activities. The summary does not purport to be complete and is qualified in its entirety by reference to the full risk factors discussion immediately following this summary. We encourage you to read the full risk factors carefully.
| • | Our operations are subject to governmental, health and safety and environmental regulations, which require us to obtain and comply with the terms of various approvals, licenses and permits. Any failure to obtain, renew or comply with the terms of such approvals, licenses, and permits in a timely manner may have a material adverse effect on our business, financial condition and results of operations. |
| • | We are exposed to the political, economic, legal, regulatory, and social risks of the countries in which we operate, and these may have a material adverse effect on our business, results of operations, financial condition, or prospects. |
| • | Material changes in the regulations that govern our businesses, or the interpretation of recent legislation, could have a material adverse effect on our business, financial condition and result of operations. |
| • | We have significant asset concentration risks, and any interruption in the operations at those assets could have a material adverse effect on our business, financial condition, and results of operations. |
| • | Our business requires substantial capital expenditures and other resources to maintain ongoing operations and to grow our business through projects, expansions, and acquisitions, where these projects, expansions and acquisitions are subject to additional risks that could adversely affect our business, financial condition, and results of operations. |
| • | If our planned expansions and new projects are delayed, or if we experience cost overruns in our projects, our business, financial condition, and results of operations may be materially and adversely affected. |
| • | If we are unable to secure additional reserves of oil and gas, zinc, copper, iron ore and bauxite that can be extracted at competitive costs or cannot extract existing reserves at competitive costs, our profitability and operating margins could decline. |
| • | Our operations are subject to risks that could result in decreased production, increased cost of production and increased cost of or disruptions in transportation, power generation, mining, and oil exploration. |
| • | Climate change risks, if not managed adequately, can affect our operations and profitability. |
| • | We are exposed to competitive pressures in our various business segments in which we operate which could result in lower prices or sales volumes of the products we produce, which may cause our profitability to suffer. |
| • | We depend upon third parties for supply of a portion of our raw material requirements, for the continuance of our operations, and for execution of our projects and supply of equipment and services, as well as for off take of our production volumes. |
| • | Defects in title or loss of any leasehold interests in our properties could limit our ability to conduct operations on such properties or result in significant unanticipated costs. |
| • | Commodity prices and the copper treatment and refinery charges or TcRc may be volatile, which may have a material adverse effect on our revenue, results of operations and financial condition. |
| • | There are uncertainties inherent in estimating our ore reserves and mineral resources and oil, condensate and sales-gas reserves, and if the actual amounts of such reserves and resources (“R&R”) are less than estimated, its results of operations and financial condition may be materially and adversely affected. |
| • | We are controlled by Vedanta and our other shareholders’ ability to influence matters requiring shareholder approval will be extremely limited |
5
| • | Vedanta may decide to allocate business opportunities to other members of the Vedanta Group instead of us, which may have a material adverse effect on our business, results of operations, financial condition, and prospects. |
| • | A substantial portion of our assets and operations are located in India and we are subject to regulatory, economic, social and political uncertainties in India. |
1. Risks Relating to Our Business
i) Our operations are subject to governmental, health and safety and environmental regulations, which require us to obtain and comply with the terms of various approvals, licenses and permits. Any failure to obtain, renew or comply with the terms of such approvals, licenses, and permits in a timely manner may have a material adverse effect on our business, financial condition and results of operations
Numerous governmental permits, approvals and licenses are required for our operations as the industries in which we operate and seek to operate are subject to several laws and extensive regulation by national, state and local authorities in jurisdictions including India, South Africa, Namibia, UAE, Ireland, Australia, Japan, South Korea, Taiwan, Liberia and any other jurisdictions where we may operate in the future. Our operations are also subject to laws, regulations and standards relating to employment, protection of the health and safety of our employees, and the environment, including conservation and climate change. Evolving regulations, standards and stakeholder expectations could result in increased cost, litigation or threaten the viability of operations in extreme cases. For instance, we are required to obtain various environmental and labor-related approvals in connection with our operations in India, including clearances from the Ministry of Environment, Forests and Climate Change (“MoEF&CC”), GoI and from the relevant pollution control boards in various states in India in which we operate in order to establish and operate our facilities. Some of these approvals are valid for certain specified periods of time and require periodic renewals, such as consents to operate under the Air (Prevention and Control of Pollution) Act, 1981, as amended, and the Water (Prevention and Control of Pollution) Act, 1981 from the relevant Pollution Control Boards.
Further, our oil and gas exploration and mining activities depend on the grant or renewal of various exploration and mining licenses and production sharing contracts (“PSC”) and other regulatory approvals that are valid for a specific period of time. In addition, such licenses and contracts contain various obligations and restrictions, including restrictions on assignment or any other form of transfer of a mining lease or on the employment of a person who is not an Indian national. For instance, in connection with our mining operations in India, mining leases are typically granted for a period of 50 years and stipulate conditions including approved limits on extraction. Similarly, in connection with our oil and gas operations in India, Cairn is required to enter into a PSC or a Revenue Sharing Contracts (“RSC”) and obtain an exploration license, before it can commence exploration activities and if exploration is successful, Cairn is then required to procure a petroleum mining lease from the relevant government authority which typically extends for a period of 20 years in order to conduct petroleum operations.
Our current oil and gas reserves and production are significantly dependent on the Rajasthan block (RJ Block) in India. The PSC for the block was initially valid until May 14, 2020. On April 7, 2017, the Ministry of Petroleum and Natural Gas (“MoPNG”) issued a policy on the grant of extension to the PSCs relating to the.” and “” for further details. Furthermore, under the terms of our PSCs, we are obliged to sell our entitlement of crude oil in the Indian domestic market until such time as the total availability of the crude oil and condensate from all Indian domestic petroleum production activities meets the total Indian national demand for crude oil and India achieves self-sufficiency. There is currently a mismatch between the demand for and the supply of crude oil in India, with the domestic demand outweighing the domestic production, and this mismatch is expected to continue in the long term. Further, to the extent our Indian blocks yield crude oil that is not suitable for processing by refineries in India or on account of any downward shift in demand for such crude oil from our buyers, it may be difficult for us to monetize such domestic crude oil reserves, and this could have a material adverse effect on our oil and gas business, financial condition and results of operations.
Pre-New
Exploration Licensing Policy Exploration Blocks(“Pre-NELP
Extension Policy”) signed by the GoI. ThePre-NELP
Extension Policy defines the framework for granting of extension forPre-NELP
Exploration Blocks. Under thePre-NELP
Extension Policy, the Government’s share of profit petroleum during the extended period of contracts would be at higher rates for the applicable fields. On October 26, 2018, the GoI granted its approval for aten-year
extension of the PSC for the RJ Block under thePre-NELP
Extension Policy, subject to certain conditions. The applicability of thePre-NELP
Extension Policy (entailing additional 10% higher profit petroleum to the GoI) to RJ Block PSC has been challenged by Cairn before the Delhi High Court. The Delhi High Court passed a judgment on May 31, 2018, directing extension of PSC on same terms. This judgment was appealed by the GoI. The division bench of the Delhi High Court vide its order dated March 26, 2021 has allowed the appeal of the GoI. We have filed a Special Leave Petition (SLP) in the Honourable Supreme Court of India (“Hon’ble Supreme Court”) against this order. Meanwhile, the Company has paid additional 10% Profit Petroleum to the GoI w.e.f. May 15, 2020, in absence of any stay on the same. The GoI has from time to time also granted adhoc extension of the Rajasthan PSC, which is presently valid till August 14, 2022. See “Item 8. Financial Information - A. Consolidated Statements and Other Financial Information - Legal Proceedings
Item 4. Information on the Company
6
The Government approval is also required, generally, for the continuation of mining as well as oil and gas exploration and production activities in India and other jurisdictions, and such approval can be revoked for a variety of circumstances by the GoI, Indian courts or other authorities. Any general suspension of mining activities by the Government of a jurisdiction governing our mining operations could have the effect of suspending or limiting production from our operations. For example, our total iron ore production declined from 13.8 mmt in fiscal year 2012 to 0.6 mmt in fiscal year 2015 due to the forced suspension of mining activities in Goa. The suspension orders were withdrawn by the Goa State Government in 2015 and operations recommenced in January 2015. The Hon’ble Supreme Court passed its final order on the matter on February 7, 2018, wherein it set aside the second renewal of the mining leases granted by the state of Goa. The Hon’ble Supreme Court directed all lease holders operating under such second renewal to stop all mining operations with effect from March 16, 2018 until fresh mining leases (not fresh renewals or other renewals) and fresh environmental clearances are granted under the Mines and Minerals (Development and Regulation) Act (“MMDR Act”). Our mines in Goa were affected by this judgement of the Hon’ble Supreme Court. Subsequent to this judgement, the Company had filed for representation before the Goa State Government seeking extension of the validity of our leases in accordance with the provisions of the Mines and Minerals (Development and Regulation) Amendment Act, 2015 (“MMDR Amendment Act”) which provides that all leases granted prior to the commencement of MMDR Amendment Act were deemed to be granted for a tenure of 50 years, which was not considered by the Goa State Government citing directions in the Hon’ble Supreme Court order dated February 7, 2018. Writ Petition filed before the High Court of Bombay at Goa against the letter of the Goa State Government was dismissed by the High Court of Bombay on the ground that it will not be proper for the High Court of Bombay to grant the relief sought therein. The Company has challenged the order of High Court of Bombay before the Hon’ble Supreme Court, in which notice has been issued to parties and the Goa State Government has filed a supportive affidavit. Separately, the Company and Goa State Government has filed review petition against the order dated February 7, 2018. The review petition was dismissed by order dated July 9, 2021, on the grounds of limitation and the SLP which was filed against the order of High Court of Bombay was disposed of by order dated September 7, 2021. In May 2022 we have received notices from the Goa State Government directing us to comply with the provisions of Rule 12 (1) (hh) of the Mineral (other than Atomic and Hydrocarbons Energy Minerals) Concession Rules, 2016 within a period of one month with effect from May 6, 2022, to June 6, 2022. The compliance under the said provision requires the lessees to remove any ore or mineral, engines, machinery, plant, buildings structures, tramways, railways and other work, erections and conveniences on the leased land within the above-mentioned period of one month. Anything on the leased land which has not been removed by the lessee within a period of one from the date of direction shall become the deemed property of the Goa State Government.
Even after receiving appropriate orders for continuation of mining operations in Goa, our iron ore business will remain largely dependent on export sales of iron ore to China. For instance, in fiscal year 2017, 100% of sales to external customers for our Goa mining operations was from exports to customers in China. As a result, the performance and growth of our iron ore business is necessarily dependent on the health of the Chinese economy, which may be materially and adversely affected by political instability or regional conflicts, economic slowdown elsewhere in the world or otherwise. In addition, any worsening of international relations between India and China, any negative changes in Chinese regulatory or trade policies relating to the import of iron ore or other limitations, restrictions or negative changes in our ability to export iron ore to China, could have a material adverse effect on our iron ore business.
Separately, the Expert Committee on iron ore, as constituted on directions of the Hon’ble Supreme Court, has filed its reports on dump handling and ceiling on annual extractions before the Hon’ble Supreme Court recommending the immediate enhancement of the annual extraction ceiling to 30 million MT, and subsequently to 37 million MT after the development of infrastructure. The Expert Committee on iron ore’s report is yet to be accepted and the matter is pending before the Hon’ble Supreme Court.
Our global presence exposes us to a number of jurisdictions in which regulations or laws have been or are being considered to limit or reduce greenhouse gas (“GHG”) emissions. The likely effect of these changes will be to increase the cost for fossil fuels, impose levies for emissions in excess of certain permitted levels and increased administrative costs for monitoring and reporting. Increasing regulation of GHG emissions, including the progressive introduction of carbon emissions trading mechanisms and tighter emission reduction targets, is likely to raise costs and reduce demand growth. These regulations in the jurisdictions of our major customers and in relation to international shipping could also have an adverse effect on the demand for our products. Our smelting and mineral processing operations are energy intensive and depend heavily on fossil fuels and supply chain disruptions related to coal procurement can impact our operations. Any failure to comply with applicable laws, regulations or recognized international standards, or to obtain or renew the necessary permits, approvals and licenses may result in the loss of the right to operate our facilities or continue our operations, the imposition of significant administrative liabilities, or costly compliance procedures, or other enforcement measures that could have the effect of closing or limiting production from our operations. If we were to fail to meet environmental requirements or to have a major accident or disaster, we may also be subject to administrative, civil and criminal proceedings by governmental authorities, as well as civil proceedings by environmental groups and other individuals, which could result in substantial fines, penalties and damages against us, as well as subject to orders that could limit or halt or even cause closure of our operations, any of which could have a material adverse effect on our business, financial condition and results of operations.
7
For example, in March 2013, the Tamil Nadu Pollution Control Board (“TNPCB”) ordered the closure of the 400,000 tpa copper smelter at Tuticorin in Tamil Nadu, India due to complaints regarding a noxious gas leak by local residents. The plant was allowed to reopen vide an order of the National Green Tribunal (“NGT”) but was ultimately ordered to close by the High Court of Madras vide its judgement dated August 18, 2020.
Separately, The TNPCB through its order dated April 9, 2018, rejected the Company’s application for renewal of Consent to Operate (“CTO”) for its existing copper smelter plant in Tuticorin and operations at the plant have been suspended. This was ultimately challenged before the High Court of Madras, which, vide its judgement dated August 18, 2020, had dismissed our challenge.
Both of the above matters are presently under challenge in SLP before the Hon’ble Supreme court. The case was listed and heard on March 15, 2022, and was part heard. The matter was to be further listed on March 22, 2022, however, due to the reconstitution of the bench, the case was not listed. The Hon’ble Supreme Court has on May 20, 2022, ordered for the interlocutory application that was filed by Vedanta Limited before the Hon’ble Supreme Court for the maintenance of status quo as on March 15, 2022, consequent to an order passed by the Collector of Tuticorin requiring Vedanta Limited employees to vacate the plant premises to be listed for hearing along with the main matter on the next date of listing. As of the date of this annual report, the Company’s copper smelter plant in Tuticorin remains closed. Prolonged shutdown of our copper smelter at Tuticorin could be credit negative and marginally increase its leverage. See “” for further details.
Item 8: Financial Information - A. Consolidated Statements and Other Financial Information - Legal Proceedings
ESL’s CTO for one of the steel plant at Bokaro is subject to the decision of the High Court of Jharkhand against the orders issued by the Jharkhand State Pollution Control Board (“JSPCB”) rejecting ESL’s application for the renewal of its CTO, which expired in December 2017. The High Court of Jharkhand granted a stay against orders on MoEF&CC (in relation to the revocation of environmental clearance) and JSPCB and allowed the plant operations to continue till the next date of hearing and also allowed ESL to apply for statutory clearance without prejudice to its rights and contentions. Pursuant to this order ESL has applied for forest diversion proposal on October 4, 2018, without prejudice to its rights and contentions. On September 16, 2020, the High Court of Jharkhand passed an order that the plant operations were to continue only until September 23, 2020. ESL filed a special leave petition before the Hon’ble Supreme Court and in an urgent hearing on September 22, 2020, the Hon’ble Supreme Court granted ESL a stay of the aforementioned order and granted ESL permission to continue operating the plant until further orders from the Hon’ble Supreme Court. See the section entitled “” for more information.
Business - Litigation - Proceedings relating to the challenge against the CTO and environmental clearance for ESL
In addition, if we were to fail to meet environmental requirements or to have a major accident or disaster, it may also be subject to administrative, civil and criminal proceedings by governmental authorities, as well as civil proceedings by environmental groups and other individuals, which could result in substantial fines, penalties and damages against us as well as orders that could limit or halt or even cause closure of our operations, any of which could have a material adverse effect on its business, results of operations and financial condition.
Changes to regulations related to climate change in the jurisdictions where we operate, demands from our investors, and other market related factors are some of the transition risks for the business. We are in the processes of systematically assessing these risks. The company has also undertaken a comprehensive ESG management program to ensure that we are able to systematically manage environmental and social risks.
ii) We are exposed to the political, economic, legal, regulatory and social risks of the countries in which we operate, and these may have a material adverse effect on our business, results of operations, financial condition or prospects
We have operations and projects in India, South Africa, Namibia, UAE, Ireland, Australia, Japan, South Korea, Taiwan and Liberia. We are exposed to the political, economic, legal, regulatory and social risks of the countries in which we operate or intend to operate. These risks potentially include expropriation and nationalization of property, instability in political, economic or financial systems, uncertainty arising from underdeveloped legal and regulatory systems, corruption, civil strife or labor unrest, acts of war, armed conflict, terrorism, outbreaks of infectious diseases, prohibitions, limitations or price controls on hydrocarbon exports and limitations or the imposition of tariffs or duties on imports of certain goods. For instance, the sudden announcement of a 15% export tax on finished steel and came into effect from May 22, 2022. The combination of a finished steel export tax, an increase of iron ore export taxes and a removal of import duties on coking coal have eased cost of production in the region have negatively affected domestic Indian price sentiment. As Covid-19 cases recede, there is visibility gradual re-opening of various cities in China which will help demand recovery. If the re-opening does go through smoothly, the current low to negative margins is unlikely to continue and support prices in the near term in both China and Far east markets. With the government’s efforts to normalise logistics, production has improved and if pent-up demand does not come through then we might see a wave of low-priced steel exports to clear the system.
8
Countries in which we have operations or intend to have operations have transportation, telecommunications and financial services infrastructures that may present logistical challenges not associated with doing business in more developed locales. Furthermore, we may have difficulty in ascertaining our legal obligations and enforcing any rights that we may have.
For example, GoI has disputed our exercise of the call option to purchase the remaining ownership interest of the GoI in BALCO. See “” and “”.
Item 3: Risk Factors - Proceedings against the GoI which has disputed our exercise of the call option to purchase its remaining ownership interest in BALCO
Item 4: Information on the Company - B. Business Overview - Our Business - Call Options over Shares
Political, legal, economic and commercial instability or community disputes in the countries and territories in which we operate could affect our operations. Some of our current and potential operations are located in or near communities that may regard such operations as having a detrimental effect on their environmental, economic or social circumstances, though necessary efforts are taken for a healthy relationship and engagement with the local community through various initiatives including Corporate Social Responsibility (“CSR”) activities on health, education, nutrition, livelihood, building physical and social infrastructure among others.
The continued success of our existing operations and future projects are in part dependent upon maintaining broad support and a healthy relationship with the respective local communities. Failure to identify and manage local concerns and expectations can give rise to disputes or have a negative impact on relations with local communities, and therefore affect our business and reputation. The consequences of community reaction, on various media including social media, could also have a material adverse impact on the cost, profitability, and ability to finance or even the viability of an operation. Such events could lead to disputes with national or local governments or with local communities and give rise to material reputational damage. For instance, community protests were organized to protest the expansion of Vedanta Limited’s copper plant in Tamil Nadu.
Subsequently, TNPCB rejected the application filed to renew our CTO which expired on March 31, 2018, for our 400,000 tpa copper smelter at Tuticorin. The matter is currently” for further details.
sub-judice
and our SLP in the Hon’ble Supreme Court regarding the same was listed for hearing on March 22, 2022, however, due the reconstitution of the bench, the case was not listed. Next date of hearing is yet to be intimated. See “Item 8: Financial Information - A. Consolidated Statements and Other Financial Information - Legal Proceedings
If our operations are delayed or shut down as a result of political and community instability, our revenue growth may be constrained, and the long-term value of our business could be adversely impacted. Once we establish operations in a particular country, it may be expensive and logistically difficult to discontinue such operations, should economic, political, physical or other conditions deteriorate subsequently. All of these factors could have a material adverse effect on our business, results of operations, financial condition or prospects.
iii) Material changes in the regulations that govern our businesses, or the interpretation of recent legislation, could have a material adverse effect on our business, financial condition and result of operations
Mining in India is subject to a complex and comprehensive set of laws and regulatory requirements. See “.” These laws and regulatory requirements are subject to change. If we are affected, directly or indirectly, by the application or interpretation of any such statute, enforcement proceedings initiated under it, it may have a material adverse effect on our business, financial condition and result of operations.
Item 4: Information on the Company - B. Business Overview - Our Business - Regulatory matters
For example, the Mineral Laws (Amendment) Act dated March 13, 2020 (“MLAA”) brought forth amendments to the MMDR Act. The MLAA has (i) liberalised the eligibility requirement to participate in coal auctions; (ii) removed the requirement for state governments to obtain prior approval of the Central Government to grant mining concessions; and (iii) enabled the transfer of approvals (other than coal, lignite and atomic minerals), whereby all the rights, approvals, clearances and licenses vested with the previous lessee will be extended to the successful bidder for a period of two years. During these two years, the successful bidder is required to obtain all the required clearances in its own name.
Further, the National Mineral Policy of 2019, which replaced the erstwhile National Mineral Policy 2008, introduces incentives to enhance mergers and acquisitions in the mining sector. If Vedanta Limited is affected, directly or indirectly, by the application or interpretation of any such statute, as and when notified, including any enforcement proceedings initiated under it and any adverse publicity that may be generated due to prosecution, it may have a material adverse effect on its business, financial condition and result of operations.
In addition, our oil and gas business is also subject to complex and comprehensive regulations in India. New or changed regulations could require changes to the manner in which we conduct our business, and result in an increase in compliance costs, which could have a material adverse effect on our business, financial condition and results of operation.
9
For example, upon the expiry of oil and gas licenses in India, contractors are generally required under the terms of relevant licenses or local law to conduct decommissioning or abandonment activities with regard to the equipment and wells and generally make good production sites. There can be no assurance that, in the future, we will not incur decommissioning charges in excess of those currently provided for, since local or national governments may require decommissioning to be carried out in circumstances where there is no express obligation to do so, particularly in case of future oil and gas license renewals.
The costs, liabilities and requirements associated with complying with existing and future laws and regulations may be substantial and time-consuming and may delay the commencement or continuation of oil and gas exploration or metal mining and production activities. This and any changes to applicable regulations could require changes to the manner in which we conduct our business and result in an increase in compliance costs, which could have a material adverse effect on our business, financial condition and results of operations.
iv) We have significant asset concentration risks, and any interruption in the operations at those assets could have a material adverse effect on our business, financial condition and results of operations
Our results of operations have been and are expected to continue to be substantially dependent on the reserves, production and the cost of production at certain of our key assets, and any interruption in the exploration, development and production activities at those assets for any reason could have a material adverse effect on our business, financial condition and results of operations.
For example, the RJ Block produced 91.4% of our average daily net operated production from our oil and gas business in fiscal year 2022 and oil and gas from the RJ Block constituted 96.3% of our net aggregate proved oil and gas reserves on a barrel of oil equivalent basis as of March 31, 2022. Our ongoing capital expenditure program has focused on development and exploration activities across all the assets with approximately 49.1% of the capital expenditure for fiscal year 2022 having been invested in the RJ Block.
Further, our Rampura Agucha mine produced 56.8% of the total mined zinc metal and 21.2% of total mined lead metal in concentrate that we produced in fiscal year 2022 and constituted 29.2% of our total proven and probable ore reserves as of March 31, 2022 in India. Any interruption in the operations at these assets could have a material adverse effect on our results of business, financial condition, results of operations and prospects.
v) Our business requires substantial capital expenditures and other resources to maintain ongoing operations and to grow our business through projects, expansions and acquisitions, where these projects, expansions and acquisitions are subject to additional risks that could adversely affect our business, financial condition and results of operations
| • | Capital requirements |
In addition, future debt financing may limit our ability to withstand competitive pressures and render us more vulnerable to economic downturns. If we fail to generate or obtain sufficient additional capital in the future, we could be forced to reduce or delay capital expenditures, sell assets or restructure or refinance our indebtedness. In addition, there can be no assurance that our planned or any proposed future expansions and projects will be completed on time or within budget, which may adversely affect our cash flow. We evaluate acquisition opportunities in the course of our business and such acquisitions could be of a material nature.
Oil and gas exploration activities are capital intensive and inherently uncertain in their outcome. There is a risk that we or the operators of assets in which we have an interest may undertake exploration activities and incur significant costs in so doing with no assurance that such expenditure will result in the discovery of hydrocarbons in commercially viable quantities.
| • | Demands on management |
10
| • | Acquisition risks non-Indian companies, we may not be able to satisfy certain Indian regulatory requirements for such acquisitions and may need to obtain the prior approval of the Reserve Bank of India (“RBI”) which we may not be able to obtain. The funding of such acquisitions by us may require certain approvals from regulatory authorities in India. In addition, acquisitions and investments involve a number of risks, including possible adverse effects on our operating results, diversion of management’s attention, failure to retain key personnel, risks associated with unanticipated events or liabilities and difficulties in the assimilation of the operations, technologies, systems, services and products of the acquired businesses or investments. Any failure to achieve successful integration of such acquisitions or investments could have a material adverse effect on our business, financial condition and results of operations. |
vi) If our planned expansions and new projects are delayed, or if we experience cost overruns in our projects, our business, financial condition and results of operations may be materially and adversely affected
We have in recent years initiated significant expansion plans for our existing operations and planned greenfield projects, which involve significant capital expenditure. Our planned expansions and new projects are subject to a number of risks that may adversely affect the prospects and profitability of such projects, including the following:
| • | unfavorable results from feasibility studies; |
| • | failure to obtain, or experience delays or higher than expected costs in obtaining, the required agreements, authorizations, licenses and permits to develop a project, including the prior consultation procedure and agreements with local communities; |
| • | permits, authorizations or rights granted to third parties that could conflict with, and require the Company to alter its expansion or new project plans; |
| • | delays or higher than expected costs in obtaining the necessary equipment, machinery, materials, supplies, labor or services and in implementing new technologies to develop and operate a project; |
| • | conflicts with local communities and/or strikes or other labor disputes may delay the implementation or the development of projects; |
| • | accidents, natural disasters and equipment failures, as well as major public health issues such as the COVID-19 pandemic, could result in delays, cost overruns, or the suspension or cancelation of projects; and |
| • | changes in market conditions or regulations may make a project less profitable than expected at the time the Company initiated work on it. |
We do not currently have all of the leases, licenses, permits, consents and approvals that are or will be required for our planned expansion and new projects. There can be no assurance that we will be able to obtain or renew all necessary leases, licenses, permits, consents and approvals in a timely manner.
For example, the Environmental Clearance for the proposed copper smelter plant 2 (Tuticorin expansion project) expired on December 31, 2018. Our application for renewal of such environmental clearance was rejected by the MoEF&CC and so a fresh application was made. In the interim, the High Court of Madras ordered us to suspend all activities pertaining to the expansion project and the State Industries Promotion Corporation of Tamil Nadu (“SIPCOT”) cancelled the land allotted to us for the proposed expansion project, which decision was later stayed by High Court of Madras. Further, the TNPCB issued orders on June 7, 2018, directing the withdrawal of the consent to establish (“CTE”) for the expansion project, which is valid until March 31, 2023. The Company has filed Appeals before the TNPCB Appellate Authority challenging withdrawal of CTE by the TNPCB and the matter was listed on June 8, 2022, for Vedanta to file a counter against the impleadment made by one Ms. Fatima Babu and also for TNPCB to file its counter in the matter. The matter was last heard on June 8, 2022, wherein the TNPCB filed its counter in the matter. The mater is next listed for July 6, 2022. On July 6, 2022, Vedanta filed an abeyance petition requesting the TNPCB Appellate Authority to proceed with the matter only subsequent to the adjudication of the matter at the Hon’ble Supreme Court pertaining to the closure of existing operations. The matter is next listed for September 7, 2022. See “for further details.
Item 4: Information on the Company - B. Business Overview - Our Business -Copper Business”
Moreover, the Environmental Clearance for the expansion of our Alumina Refinery at Lanjigarh was challenged before the NGT, where the MoEF&CC, the Odisha State Pollution Control Board and Vedanta Limited have been made parties. Pleading in the matter is complete and pending for hearing of arguments, however, the same has not been posted owing to the paucity of judges in the NGT. It is pertinent to note that the NGT has not passed any interim order staying the project as prayed by the appellant. See “.” for further details.
Item 8. Financial Information - A. Consolidated Statements and Other Financial Information - Legal Proceedings
11
Moreover, we are currently undertaking exploration programs in our Rajasthan and other oil blocks. Also, Vedanta Limited- oil and gas business has secured 51 blocks (41 blocks in OALP I and 10 blocks in OALP II and III) and 2 Discovered Small Fields (“DSF”) blocks in the Open Acreage Licensing Policy (“OALP”) introduced by the GoI and RSCs has been signed for these blocks. Vedanta Limited- oil and gas business has committed the work program to be completed during the currency of initial exploration phase and in the event of
non-fulfillment
of the committed work program, the liquidated damages would become payable for the shortfall as specified in the RSC. Any delays in this exploration program or shortfall in achieving the necessary output levels could materially and adversely affect our business, financial condition and results of operations.In fiscal year 2013, we announced an expansion of our
zinc-lead
mines capacity to 1.2 mtpa (later revised to 1.25 mtpa) in a phased manner until fiscal year 2022 in our Zinc India business. This will involve sinking of underground shafts and developing underground mines. Benefits from these growth projects started in fiscal year 2016, even though project activities will continue until fiscal year 2023. Annual capital expenditure towards these projects is expected to be approximately $ 100 million. Major projects related to this expansion are completed. The risk still remains as we are reporting its expenditure and project is not yet completed.We acquired ESL under the Insolvency and Bankruptcy Code, 2016 (“IBC”) in fiscal year 2018, in line with the Resolution Plan approved by National Company Law Tribunal (“NCLT”), Kolkata. ESL was incorporated in December 2006 to set up an integrated steel plant designed to produce 2.5 mtpa of steel. This project started operations in fiscal year 2009 and the first phase of 1.5 mtpa steel plant was completed in fiscal year 2012. Subsequently, the next phase to reach to the full design capacity was started but was not completed due to various reasons. As a result, project materials including semi-constructed blast furnace and horizontal coke oven plant are not in operation. The usability of project material will depend on life cycle assessment, finalization of technology and detailed project report. Hence, expansion cost may increase if it is discovered later that some of the project material is not usable.
Furthermore, the GoI is contemplating a proposal to demarcate certain forest areas in India, based on the permissibility of using such land for mining purposes. The identification of designated areas where mining activities will, or will not, be permitted will be based on mapping forest and coal reserves as well as field-level studies. While this proposal remains in discussion, the MoEF&CC has denied the grant of environmental and forest diversion clearances applied for in certain areas identified as restricted areas. In the event the proposal is implemented, our current and any future mining activities and related expansion plans and new projects may be affected, which would adversely affect our business prospects and results of operations or otherwise hinder our borrowing capabilities. Any delay in completing planned expansions, revocation of existing clearances, failure to obtain or renew regulatory approvals,
non-compliance
with applicable regulations or conditions stipulated in the approvals obtained, suspension of current projects, or cost overruns or operational difficulties once the projects are commissioned may have a material adverse effect on our business, results of operations or financial condition. Further, our decision to undertake or continue any of these projects will be based on assumptions of future demand for our products which may not materialize. As a consequence of project delays, cost overruns, changes in demand for our products and other reasons, we may not achieve the reductions in the cost of production or other economic benefits expected from these projects, which could adversely affect our business, financial condition and results of operations.vii) If we are unable to secure additional reserves of oil and gas, zinc, copper, iron ore and bauxite that can be extracted at competitive costs or cannot extract existing reserves at competitive costs, our profitability and operating margins could decline
If our existing oil and gas, zinc, copper, iron ore and bauxite reserves cannot be extracted at competitive costs or if we cannot secure additional reserves that can be extracted at competitive costs, we may become more dependent upon third parties for the metal ore, or our production volumes will decline. As our reserves decline as we extract the mineral ore or crude oil, our future profitability and operating margins depend upon our ability to access reserves that have geological characteristics enabling extraction at competitive costs. Replacement reserves may not be available when required or, if available, may not be of a quality capable of being extracted at costs comparable to the existing or exhausted mines and fields.
We may not be able to accurately assess the geological characteristics of any reserves that we acquire, which may adversely affect our business, financial condition and results of operation. Because the value of reserves is calculated based on that part of our mineral and oil and gas deposits that are economically and legally exploitable at the time of the reserve calculation, a decrease in commodity prices may result in a reduction in the value of any reserves that we obtain as less of the deposits contained therein would be economically exploitable at lower prices. For example, we recognised an impairment of assets at our oil and gas business in fiscal year 2020 of an amount equal to 135,031 million which was triggered majorly due to significant fall in crude oil prices.
₹
Exhaustion of reserves at particular mines or oil fields may also have an adverse effect on our operating results that is disproportionate to the percentage of overall production represented by such mines or oil fields. Further, with depletion of reserves we will face higher unit extraction costs.
Our future production depends significantly upon our success in finding or acquiring and developing additional reserves, adopting and using the appropriate technology. If we are unsuccessful, we may not meet our production targets, which could adversely affect our business, financial condition and results of operations.
12
Our ability to obtain additional reserves in the future could be limited by restrictions under our existing or future debt agreements, competition from other metal and oil and gas companies, lack of suitable acquisition candidates, government regulatory and licensing restrictions, difficulties in obtaining mining leases and surface rights or the inability to acquire such properties on commercially reasonable terms, or at all. To increase production from our existing mines or oil fields, we must apply for governmental and joint operation partner approvals, which we may not be able to obtain in a timely manner, or at all.
The results of appraising discoveries are uncertain which may result in reductions in projected reserves and production declines and may involve unprofitable efforts, not only from dry wells, but also from wells that are productive but uneconomic to develop. Furthermore, as our ore reserves decline as we mine the ore, our future segment results and segment margins depends upon our ability to access ore reserves with geological characteristics that allow mining at competitive costs and replacement reserves may not be available when required. Appraisal and development activities may be subject to delays in obtaining governmental approvals or consents,
shut-ins
of connected wells, insufficient storage or transportation capacity or exhaustion and depletion of reserves or other geological and mechanical conditions all of which may result in a material increase of our costs of operations or delay anticipated revenues.viii) Our operations are subject to risks that could result in decreased production, increased cost of production and increased cost of or disruptions in transportation, power generation, mining and oil exploration
We are subject to operating conditions and events common to the industry in which we operate which are beyond our control that could, among other things, increase our mining, transportation or production costs, disrupt or halt operations at our mines and production facilities permanently or for varying lengths of time or interrupt the delivery of our products to our customers. The occurrence of any of these conditions or events could have a material adverse effect on our business, financial condition and results of operations. These conditions and events include:
| • | Disruptions in extraction and production due to equipment failures, unexpected maintenance problems and other interruptions: |
Further, our oil & gas processing facilities designed to separate oil, gas and water may not function as designed over the life of the fields. This may result in the hydrocarbon not meeting sales specifications of pipelines, which may mean that any such hydrocarbon either not being evacuated through our existing pipelinesor cannot be sold, may be sold at a significant discount to the sales price agreed in the relevant sales contract.
| • | Availability of raw materials for production and energy requirements: |
For example, we established our aluminium business in Odisha. The entity entered into a joint venture agreement with Odisha Mining Corporation Limited (“OMC”) through which OMC would provide us with bauxite supply, but during fiscal year 2016, the joint venture agreement was terminated by OMC by a separate action. As a result, Vedanta Limited had to procure bauxite from global suppliers to meet its requirements, resulting in high logistics costs and complexity in supply chain pushing up the cost of production for captive alumina. The remaining alumina requirements are also purchased from global suppliers at index-linked prices. However, in April 2018, we entered into a long-term contract with OMC for the supply of bauxite for five years from its Kodingamali bauxite mines as per state policy, which accounts for approximately 50% of our total bauxite requirement.
13
Our oil processing facility in the northern fields of the RJ Block require reliable fuel supply for power generation and heating, to ensure the quality of our crude oil production. Currently, the fuel supply for power generation and heating requirements are being met through associated natural gas from the Mangala field, supplemented as required by natural gas from the Raageshwari Deep Gas (“RDG”) field. While the current gas supply is adequate to ensure a continuous efficient fuel supply, there is no guarantee that the current estimates of the future fuel requirements can be supplied from the gas associated with existing and future oil production, supplemented by supply of remaining gas from the RDG field, after accounting for gas sales. Thus, the facilities have been augmented by alternative energy source in form of grid power supply. Sustained failure of power systems due to unavailability of fuel supply and/or grid power availability could lead to disruption in operations, having a material adverse effect on our results of operations and financial condition.
In addition, oil extraction from Mangala, Bhagyam and Aishwariya fields require significant quantities of polymer (for injection), which is mostly imported and any supply chain disruptions, similar to those faced during
COVID-19
pandemic, may present a material risk to our operational and financial outcomes.| • | Availability of water: |
We inject hot water and polymer to maintain reservoir pressure and to optimize crude oil recovery at Mangala, Bhagyam and Aishwarya fields. The primary source of water for injection in these fields is the produced water to which water from Thumbli saline aquifer is added to make up the total injection requirements. Extraction of saline water also requires the approval of the relevant government authorities. There can be no assurance that the estimated impact of the expected water extraction on the flow of groundwater is accurate. A failure to extract the required amount of water during the life of the existing and currently planned developments or an inaccurate prediction of the impact on the flow of groundwater, or delay or cancellation of the approval from the government authorities to extract saline water, may require us to access alternative sources of water. Although the relevant government authority has given its consent for the extraction of saline groundwater from Thumbli, it is possible that we will be perceived to be directly or indirectly responsible for any shortage of fresh water or deterioration in water quality. In such an event, the local authorities may require us to access alternative water sources or hold us responsible for any contamination of the fresh water supply by saline groundwater from the aquifer. We have filed for approval from Central Ground Water Authority (“CGWA”) for extraction of saline water and the final approval is awaited.
| • | Disruptions to or increased costs of transport services : |
| • | Inadequate plant operating and maintenance procedures : |
14
| • | Dependence on third parties: sub-contractors and thereby have limited influence and control over the risks that arises. Ensuring the delivery of services and equipment, executing the projects as per schedule, of the right quality and managing safety and security of personnel and materials at the sites as well as during transportation, and ensuring all regulatory compliances are met, could pose a potential challenge. Any delays in any of these aspects could have an adverse impact on operations and project completion by way of cost and schedule overruns and adversely effects our operational and financial performance. We review the progress jointly with the partner at regular intervals to mitigate this potential risk. Further, our business partners may be unable or unwilling to fully compensate us against costs we may incur on their behalf or on behalf of the joint venture. For instance, the external contractors may not be able to complete construction and installation on time, within budget, or to the specifications set forth in our contracts with them, or the contractors may otherwise cause delays in meeting project milestones or achieving commercial operation by the scheduled completion date or operational deliverables, which could in turn cause forecast budgets to be exceeded or result in delayed payment by customers, invoke liquidated damages, penalty clauses or performance guarantees or result in termination of contracts. See “Item 8: Financial Information - A. Consolidated Statements and Other Financial Information - Legal Proceedings - Proceedings against TSPL relating to its delay in commissioning various units of the power plant |
| • | Power purchase agreements : see “ Item 8: Financial Information - A. Consolidated Statements and Other Financial Information - Legal Proceedings ” and “ Item 4: Information on the Company - B. Business Overview ” . |
| • | Regulatory compliance: 2 ) emission from thermal power plants through installation of Flue Gas Desulphurization (“FGD”). Noncompliance of the published norms within prescribed timelines will have an adverse impact on operations by way of environmental compensation.” |
| • | Flow assurance concerns of crude oil: 24-inch insulated oil pipeline and connecting spur lines should be kept at a temperature greater than the temperature at which crude oil starts to solidify (i.e. pour point). Maintaining the temperature of the crude oil above pour point temperature has required the installation of a specialized heating system and heating stations at various points along the pipeline. If the specialized heating system does not perform as expected, or there are problems associated with the performance of the heating stations, or there are problems supplying fuel to the power generation systems at these heating stations, then the temperature of crude oil may not be maintained, which would have an adverse impact on the rate at which oil can be transported through the pipeline. Any reduction in the crude oil production, ultimate recovery, or in the oil transportation may have a material adverse effect on our business, financial condition and results of operations. |
| • | Tailings dam failure: |
15
| • | Accidents at mines, oil fields, smelters, refineries, oil processing terminals, cargo terminals and related facilities: open-pit mining operations include flooding of theopen-pit and collapses of theopen-pit wall. Hazards associated with our underground mining operations include underground fires and explosions, including those caused by flammable gas,cave-ins or ground falls, discharge of gases and toxic chemicals, flooding, sinkhole formation and ground subsidence and other accidents and conditions resulting from drilling and removing and processing material from an underground mine. If any of these hazards or accidents result in significant injury to employees and damage to equipment or other property, we may experience unexpected production loss, increased production costs, and increased capital expenditures to repair or replace equipment or property, as well as claims from affected employees and environmental and other authorities for any alleged breaches of applicable laws or regulations. Disruptions to mining, delays and costs on account of such hazards or accidents could have a material adverse effect on our business, financial condition and results of operations. |
Furthermore, oil and gas exploration and production operations by us or operators of assets in which we have an interest will involve risks normally incidental to such activities, including blowouts, oil spills, gas leaks, explosions, fires, equipment damage or failure, natural disasters, geological uncertainties, unusual or unexpected rock formations and abnormal pressures. Offshore operations are also subject to natural disasters as well as to hazards inherent in marine operations and damage to pipelines, platforms, facilities and
sub-sea
facilities from trawlers, anchors and vessels. Our producing fields are located in areas that can be subject to extreme weather conditions, flooding, fire, theft, earthquake and other natural disasters. Additionally, we or the operators of assets in which we have an interest may face interruptions or delays in the availability of oil field services, equipment or infrastructure, including seismic survey vessels, rigs, pipelines and storage tanks, on which oil and gas exploration and production activities are dependent. Such interruptions or delays could result in disruptions to exploration activities, production, oil and gasoff-take
arrangements and increased costs.| • | Strikes and industrial actions or disputes: |
ix) Climate change risks, if not managed adequately, can affect our operations and profitability.
The impact of climate change and climate change-driven responses, such as a global transition to a low carbon economy on our operations and our customers’ operations, remains uncertain, but the regulatory, market-risks associated with climate change as well as the physical effects of climate change could have an adverse effect on us and our customers as experts believe that climate change may be associated with more extreme weather conditions. Extreme weather due to climate change can lead to epidemics as well as business disruptions. Climate change events can result in physical damage to our building infrastructure and other physical assets, disrupt the continued functioning of infrastructures such as the transportation network and utilities in the locations where we operate and decrease in morale of employees. Some of our locations can experience extreme weather events like floods and cyclones for droughts. These events can impact our production capacity or hamper our supply chains.
Vedanta manufactures basic metals that are used in several applications, downstream in our industry. Several of these applications related to use in the emerging renewable energy, electric mobility and electronics industries. We do not anticipate the demand for our products to decline as a consequence. We remain committed to ensuring that we minimize the GHG intensity of all our products and have taken short-mid-and-long-term targets to achieve this. In FY 2022, we launched Restora and Restora Ultra - low-carbon, green aluminium line of products.
x) We are exposed to competitive pressures in our various business segments in which we operate which could result in lower prices or sales volumes of the products we produce, which may cause our profitability to suffer
The mines and minerals, commercial power generation, oil and gas and steel industries are highly competitive. We continue to compete with other industry participants in the search for and acquisition of mineral and oil and gas assets and licenses. Competitors include companies with, in many cases greater financial resources, local contacts, staff and facilities than ours. Competition for exploration and production licenses as well as for other investment or acquisition opportunities may increase in the future. This may lead to increased costs in the carrying out of our activities, reduced available growth opportunities and may have a material adverse effect on our businesses, financial condition, results of operations and prospects.
xi) We depend upon third parties for supply of a portion of our raw material requirements, for the continuance of our operations, and for execution of our projects and supply of equipment and services, as well as for offtake of our production volumes
We source a majority of our copper concentrate and a portion of alumina requirements from third parties. The smelter at Tuticorin has been closed during the fiscal year 2019 and remains closed, therefore the copper anodes and blister are being procured from external sources for production of copper cathode at the Silvassa Refinery. For example, in fiscal year 2022, we sourced 100% of our copper anode and blister and 55.38% of our alumina requirement was sourced from third parties. Profitability and operating margins of our copper and aluminium business depends on the ability of the suppliers to ensure timely delivery of the contracted volumes. For our aluminium business, sourcing of key raw materials such as bauxite and alumina from third parties are key drivers of our cost of production and hence our profitability and margins. Almost 50% of our requirements for bauxite and alumina are dependent on third party suppliers. Similarly, sourcing coal at a competitive price impacts profitability and margins.
Further, in common with many exploration and production companies, we and the operators of assets often contract or lease services and equipment from third party providers. Such services and equipment can be scarce and may not be readily available at the times and places required. In addition, the costs of third-party services and equipment have increased significantly over recent years and may continue to rise. Scarcity of services and equipment and increased prices may in particular result from any significant increase in regional exploration and development activities, which in turn may be the consequence of increased or continued high hydrocarbon or mineral prices. The scarcity of such services and equipment, as well as their potentially high costs, could delay, restrict or lower the profitability and viability of projects which may have a material adverse effect on our businesses, prospects, financial condition and results of operations.
16
In our oil and gas business, we have infrastructure and oil sales agreements with the GoI nominated public sector refineries and domestic private sector refineries for expected levels of crude oil production from the RJ Block until March 2023. Stoppage of
off-take
or supply could result if the buyers fail to take delivery of volumes anticipated by these sales agreements.Additionally, two private sector buyers accounted for approximately 80% of the total sales of RJ Block in fiscal year 2022 and any unforeseen disruption at these buyer’s facilities would affect sales volume and therefore revenue generation. Further, we are subject to the risk of delayed
off-take
or payment for delivered production volumes or counterparty default. Any of these could have an adverse impact on our crude oil sales and cash flows. In certain cases, the relevant counterparty, either legally or as a result of geographic, infrastructure or other constraints or factors, is in practice the sole potential purchaser of the relevant production output. This is particularly the case for sales of gas which relies on the availability or construction of transmission and other infrastructure facilities, enabling the supply of gas produced to be supplied to end users. The absence of competitors for the transmission or purchase of gas produced by us may expose us to offtake and production delays, adverse pricing or other contractual terms or may restrict the availability of transmission or other necessary infrastructure.Such delays or defaults or adverse pricing or other adverse contractual terms or restricted infrastructure availability could have a material adverse effect on our business, financial condition and results of operations.
xii) Defects in title or loss of any leasehold interests in our properties could limit our ability to conduct operations on such properties or result in significant unanticipated costs
Our ability to mine the land on which we have been granted mining lease rights and to make use of our other industrial and office premises is dependent on the acquisition of surface rights. Surface rights and title to land are required to be negotiated separately with landowners, although there is no guarantee that these rights will be granted. Any delay outside of the ordinary course of business in obtaining or inability to obtain or any challenge to the title or leasehold rights to surface rights could negatively affect our business, financial condition and results of operations.
In addition, there may be certain irregularities in title in relation to some of our owned and leased properties. For example, some of the agreements for such arrangements may not have been duly executed and/or adequately stamped or registered in the land records of the local authorities or the lease deeds may have expired and not yet been renewed. Since registration of land title in India is not centralized and has not been fully computerized, the title to land may be defective as a result of a failure on our part, or on the part of a prior transferee, to obtain the consent of all such persons or duly complete stamping and registration requirements. The uncertainty of title to land may impede the process of acquisition, independent verification and transfer of title, and any disputes in respect of land title that we may become party to may take several years and considerable expense to resolve if they become the subject of court proceedings. Further, certain of these properties may not have been constructed or developed in accordance with local planning and building laws and other statutory requirements, or it may be alleged that such irregularities exist in the construction and development of our
built-up
properties. For example, BALCO has 1,804.67 acres of government land out of which 1,751 acres is situated in forest land, which was given on lease by the Chattisgarh state government. The lease deed has not been executed as on date as a petition was filed in the Hon’ble Supreme Court against BALCO in relation to the alleged encroachment of land on which our Korba smelter is situated. Any such dispute, proceedings or irregularities may have an impact on our business, financial condition and results of operations. The matter, at present, is pending before the Hon’ble Supreme Court for consideration on Central Empowered Committee’s report. The Hon’ble Supreme Court shall hear the matter in due course. For further details see“
Item 8: Financial Information - A. Consolidated Statements and Other Financial Information - Legal Proceedings.
”
For example, ESL has about 455.23 acres of land which is claimed by the Forest Authorities to be forest land. This is an alleged violation which resulted in the revocation of the environmental clearance. The revocation of environmental clearance has been challenged in the High Court of Jharkhand. The High Court of Jharkhand has granted interim relief for plant operations pending regularization. However, in the business interest, we have initiated the process of regularizing the same, without prejudice to all our legal rights and contentions, as per government process. The MoEF&CC has granted
ex-post
factoin-principle
approval dated December 17, 2019, on the application submitted by ESL for conversion of 455.23 acres of forest land subject to conditions. ESL is working out appropriate solution to secure the revised environmental clearance in due course.MoEF&CC vide its letter dated February 2, 2022, has deferred the grant of Environment Clearance (“EC”) till Forest Clearance (“FC”)Any unfavourable judgement will result in adverse impact on our operations at ESL.
Stage-II
is granted to ESL. ESL has submitted its reply against MoEF&CC letter vide letter dated February 11, 2022 for reconsidering the decision and not linking EC with FC since as per the applicable law and available precedents, grant of FC Stage - II is not a condition precedent for grant of EC. For further details see“
Item 8: Financial Information - A. Consolidated Statements and Other Financial Information - Legal Proceedings.
”
17
xiii) Third party interests in our subsidiary companies, restrictions due to stock exchange listings of our subsidiary companies as well as third party interest in assets of our subsidiary companies will restrict our ability to deal freely with our subsidiaries or such assets of our subsidiary companies, which may have a material adverse effect on our results of operations and financial condition
We do not wholly own all of our operating subsidiaries, although we hold the majority of the total outstanding share capital in all of our subsidiaries. Although we have direct or indirect management control of HZL, BALCO, Black Mountain Mining, ESL, FPL and Avanstrate, each of these companies has other shareholders who, in some cases, hold substantial interests. As a result of the non-controlling interests in our subsidiaries and affiliates and the Indian stock exchanges listings of HZL, these subsidiaries may be subject to additional legal or regulatory requirements, or we may be prevented from taking certain courses of action without the prior approval of a particular or a specified percentage of shareholders and/or regulatory bodies (under shareholders’ agreements, relationship agreements or by operation of law). The existence of minority or other interests in, and stock exchange listings of our subsidiaries may limit our ability to increase our equity interests in these subsidiaries, combine similar operations, utilize synergies that may exist between the operations of different subsidiaries, move funds among the different parts of our businesses or reorganize the structure of our business in a tax efficient manner, which may have a material adverse effect on our business, financial condition and results of operations.
Oil and Natural Gas Corporation Limited (“ONGC”) amongst others is our joint operation partner with respect to all operating assets of our oil and gas business, and we operate all of our oil and gas assets except KGONN-2003/1. Accordingly, any mismanagement of an oil and gas asset by us may give rise to liabilities to our joint operation partners in respect of such asset. There is also a risk that other parties with interests in our assets may elect not to participate in certain activities relating to those assets which require such party’s consent. In such circumstances, it may not be possible for such activities to be undertaken by us alone or in conjunction with other participants at the desired time or at all. In addition, other joint operation partners may default in their obligations to fund capital or other funding obligations in relation to the assets. In certain circumstances, we may be required under the terms of the relevant operating agreement to contribute all or part of any such funding shortfall, which will increase the cost of operations. In order to mitigate such risks, execution of projects is undertaken after aligning the partners for the oil & gas development activities.
xiv) Proceedings against the GoI which has disputed our exercise of the call option to purchase its remaining ownership interest in BALCO
There are certain proceedings that are currently ongoing with respect to the exercise of a call option to acquire the remaining shares of BALCO held by the GoI, in accordance with the terms of the shareholders’ agreement between the GoI and us. The amount claimed under this proceeding is presently unquantifiable. The arbitration tribunal formed under the directions of the High Court of Delhi declared an award rejecting BALCO’s claim regarding the exercise of the option on January 22, 2011. According to the award, certain clauses of the shareholders’ agreement were held to be void, ineffective and inoperative as being in violation of sub section (2) of Section 111A of the erstwhile Companies Act, 1956. We filed an application before the High Court of Delhi to set aside this award under Section 34 of the Arbitration and Conciliation Act, 1996. The application would be listed for hearing in due course. There is no assurance that the outcome of our challenge of the award will be favorable to us. In such an event, we may be unable to purchase the GoI’s remaining 49.0% interest in BALCO or may be required to pay a higher purchase price, should it decide to consummate such purchase, which may have a material adverse effect on our business, financial condition and results of operations. See “
Item 4: Information on the Company - B. Business Overview - Our Business -
Call Options over Shares in
BALCO Call Options over Shares
”
and Item 8:Financial Information - Legal proceedings - Proceedings against the GoI which has disputed our exercise of the call option to purchase its remaining ownership interest in BALCO.
xv) Proceedings by the GoI which has disputed our exercise of the call option to purchase its remaining ownership interest in HZL
We commenced arbitration proceedings against the GoI with respect to exercise of our call option to acquire the remaining shares of HZL held by the GoI, in accordance with the terms of the shareholders’ agreement between the GoI and us. The GoI denied our right to exercise the option on the basis that the shareholders’ agreement contravenes the provisions of Section 111A of the erstwhile Companies Act, 1956 and is therefore void. While the arbitration was in process, a PIL was filed seeking restraint on disposal of residual shares by GoI. The Hon’ble Supreme Court passed a final order on November 18, 2021, allowing the GoI’s proposal to divest its entire stake in HZL in the open market in accordance with the rules and regulations of Securities and Exchange Board of India (“SEBI”). The Hon’ble Supreme Court also directed the Central Bureau of Investigation to register a regular case in relation to the process followed for the disinvestment of HZL in the year 2002 by the GoI.
Due to the abovementioned Hon’ble Supreme Court of India order, Vedanta Limited has filed an application for the withdrawal of its arbitration claim for the second call option and a final order allowing for the withdrawal of the arbitration matter has been passed. See “”.
Item 4: Information on the Company - B.
Business Overview - Our Business - Call options over shares
18
xvi) Future production from our assets may vary from the forecast
We estimate the annual metal production and the mine life through a detailed mine plan for both open pit and underground mines and the oil and gas production rates and field life through the Field Development Plans (FDP). These mine plans and FDP are prepared based on our estimates of future mine and field performance. Future performance is subject to a number of risks including but not limited to geological conditions being more complex than originally predicted, ore grade being different from estimates, future producer or injector well performance, plant operating efficiencies being less than originally forecasted, inadequate power, water or utility supplies, and other constraints. Any material falls in production from the current production level or from the estimates due to some or all of the risks detailed above may adversely impact our business, financial condition and results of operations.
For example, in our oil and gas business, plateau production rates from the RJ Block may be less than forecast. The estimates of production rates and field life contained in the FDP for the Mangala, Bhagyam, Aishwariya, Raageshwari and Saraswati fields in the RJ Block are based on our estimates of future field performance. Future field performance is subject to a number of risks that are beyond our control.
xvii) If we do not continue to invest in new technologies and equipment, our technologies and equipment may become obsolete and our cost of production may increase relative to our competitors, or such implemented technologies might not achieve the objective, which would have a material adverse effect on our results of operations, financial condition and prospects
Our profitability and competitiveness are in large part dependent upon our ability to maintain a low cost of production as we sell commodity products with prices, we are unable to influence. Unless we continue to invest in newer technologies and equipment and are successful at integrating such newer technologies and equipment to make our operations more efficient, our cost of production relative to our competitors may increase and we may cease to be profitable or competitive. Newer technologies and equipment are expensive, and the necessary investments may be substantial. Moreover, such investments entail additional risks including whether they will achieve the desired objectives to justify the capital expenditures incurred in deploying the new technology.
For example, the FDP for the northern fields of the RJ Block assume the use of enhanced oil recovery techniques to extract an additional incremental percentage of the estimated oil in place in the reservoirs. Enhanced oil recovery screening studies of these northern fields have concluded that polymer flooding or alkaline surfactant polymer flooding, two common enhanced oil recovery techniques, are the preferred enhanced oil recovery options. In terms of scale, the project is one of the largest of its kind across the globe. Risks associated with the project include improper chemical selection, inadequate subsurface response to injected fluid(s) and inadequate processing of produced fluids thereby impacting performance of surface facilities and continuous sourcing of polymer for ongoing operations.
Further, if we fail to maintain the polymer at the correct temperature in the reservoir, it may degrade and not function properly, thereby reducing the incremental amount of crude oil that is expected to be recovered. There is also a risk that the polymer handling facilities at the surface may perform at lower than designed efficiency, which may lead to degradation of the polymer and ultimately lead to higher consumption. All these factors could have a material and adverse effect on our business, financial condition and results of operations.
The use of enhanced oil recovery technique may significantly increase the operational expenditure necessary to extract crude oil. The economic viability of such recovery techniques will be determined by the incremental cost of such techniques compared to the then prevailing price of crude oil in the international markets. There can be no assurance that the price of crude oil will allow such techniques to be an economically viable proposition at the time we intend to implement these enhanced recovery techniques. This could have a material adverse effect on our ability to compete, our business, financial condition and results of operations.
xviii) We are subject to restrictive covenants for the credit facilities including term loans and working capital facilities provided to us and our subsidiaries
Our financing agreements contain certain restrictive covenants and events of default that limit our ability to undertake certain types of transactions or ability to expand, any of which could adversely affect our business. These covenants require us to maintain certain financial ratios and in certain cases, obtain the prior consent of our lenders for various activities, including, among others,
| • | any change in our capital structure, |
| • | issue of equity, preferential capital or debentures, |
| • | raising any loans and deposits from the public, |
| • | undertaking any new project, |
| • | effecting any scheme of acquisition, merger, amalgamation or reconstitution and |
| • | implementing a new scheme of expansion or creation of a subsidiary. |
19
Our future borrowings may also contain similar restrictive provisions. Low commodity prices may adversely impact our profitability and therefore our ability to meet the financial covenants and ratios. If we fail to meet our debt service obligations or covenants (or receive approvals from our lenders to undertake certain transactions) under the financing agreements, the relevant lenders could declare us to be in default under the terms of agreements, accelerate the maturity of our obligations or take over the financed project or other security made available to the lenders. We cannot assure you that, in the event of any such acceleration, we will have sufficient resources to repay borrowings. In such an event, we may be forced to renegotiate our financing agreements with our lenders on terms that may not be favourable to us. Our future borrowings may also contain similar restrictive provisions.
xix) A downgrade in the Company’s credit ratings and outlook may adversely affect its ability to access capital
The Company’s current rating is “AA” with a stable outlook by CRISIL Ratings and India Ratings. CRISIL Ratings after revising the outlook to ‘Positive’ from ‘Stable’ in October 2021, upgraded its rating on the long-term bank facilities and debt instruments of Vedanta Limited to ‘CRISIL AA’ from ‘CRISIL AA-’ in February 2022. The outlook on ratings was also revised to ‘Stable’ from ‘Positive’. The short-term rating on bank facilities and commercial paper has been reaffirmed at ‘CRISIL A1+’. The upward rating action factors in stronger-than-expected operating profitability, driven by elevated commodity prices during fiscal 2022, volume growth across businesses, and sustained cost efficiency, especially in the Aluminium business. India Ratings, also after revising the outlook to ‘Positive’ from ‘Stable’ in December 2021, upgraded its ratings on long-term bank facilities to “IND AA” from “IND
AA-”
in March 2022 with a stable outlook. The rating upgrade reflects the group’s continuous deleveraging and India Ratings’ expectation of an improvement in the consolidated operational cash flow in FY 2022 and FY 2023, following a significant increase in the operating profitability, led by high metal prices partly offset by raw material input inflation. The short-term rating on commercial paper has been reaffirmed at ‘IND A1+’ A downgrade in the rating may adversely affect Vedanta Limited’s ability to access capital and could likely result in more stringent covenants and higher interest rates.xx) We are involved in several civil, criminal and tax litigation matters, arbitration proceedings and any final judgment against us could have a material adverse effect on our business, result of operations, financial condition and prospects
We are involved in several legal and arbitration proceedings including matters relating to, alleged violations of environmental, tax, Indian laws and regulations, land and labor disputes and other related issues. A final judgment against us or our directors in one or more of these disputes may result in damages that we will be required to pay to the other party, injunctions against us any of which may require us to cease or limit our operations and such decisions or judgments may have a material adverse effect on our business, results of operations, financial condition and prospects.
Also, SEBI initiated criminal proceedings in 2001 before the Court of the Metropolitan Magistrate, Mumbai, against us for alleged price manipulation against our Non - executive Chairman, Mr. Anil Agarwal and Mr. Tarun Jain (who was the Chief Financial Officer of MALCO at the time of the alleged price manipulation). When SEBI’s order was overturned in October 2001, we filed a petition before the High Court of Bombay to defend those criminal proceedings on the grounds that the Securities Appellate Tribunal of India had overruled SEBI’s order on price manipulation. An order has been passed by the High Court of Bombay in our (then Sterlite) favour, granting an interim stay of the criminal proceedings.
If any such matters are held against us, we may be prohibited from accessing the Indian capital market for a specified period of time and may become liable to pay penalties which may have material adverse effect on our operations, results of operations, financial condition and prospects.
For a detailed discussion of material litigation matters pending against us, see “”.
Item 8: Financial Information - A. Consolidated Statements and Other Financial Information - Legal Proceedings
xxi) We may be liable for additional taxes if the tax holidays, exemptions and tax deferral schemes which we currently benefit from expire without renewal, and the benefits of the tax holidays, exemptions and tax deferral schemes are limited by the minimum alternative tax
We currently benefit from significant tax holidays, exemptions and tax deferral schemes. These tax holidays, exemptions and tax deferral schemes are for limited periods. For example, HZL’s captive power plant at Dariba benefits from tax holiday on the profits generated from transfers of power to HZL’s other units. We also have windmills located in states such as Gujarat, Karnataka, Tamil Nadu, Maharashtra and Rajasthan and refining and processing plants at Pantnagar, which are eligible for tax holiday. However, Fiscal Year 2021 was the last year of claim by the Pantnagar tax holiday unit.
Our captive power plants will continue to have the benefit of any existing tax exemptions, which were available before March 31, 2017, until such tax exemptions expire. The expiry or loss of existing tax holidays, exemptions and tax deferral schemes or the failure to obtain new tax holidays, exemptions or tax deferral schemes will likely increase our tax obligations and any increase could have a material adverse effect on our business, financial condition and results of operations.
20
In addition, we are subject to a Minimum Alternate Tax (“MAT”) which sets a minimum amount of tax that must be paid each year based on our book profits. The effective MAT rate is 17.47%, after applying surcharge and education cess, for Indian companies. The MAT prevents us from taking full advantage of any tax holidays, exemptions or tax deferral schemes that may be available to us.
The Taxation Law (Amendment) Act, 2019, reduced MAT base tax rate from 18.5% to 15% plus applicable surcharge and cess. The effective MAT rate for all Indian companies for fiscal year 2020, 2021 and 2022 was 17.47%, 17.47% and 17.47% respectively Further, companies opting for concessional tax regime would not be required to pay MAT. See “”. For
Government Policy - Taxes, royalties and cess payments
non-resident
foreign companies, effective MAT rate as per the Tax (Amendment) Act, 2019 reduced from 20.01% to 16.38% of the book profit.The Taxation Laws (Amendment) Act, 2019 has also introduced concessional tax regime for Indian companies pursuant to which (a) Indian companies incorporated on or after October 1, 2019 commencing manufacturing on or before March 31, 2023 can opt to be taxed at an effective tax rate of 17.16% subject to certain prescribed conditions and (b) other Indian companies can opt to be taxed at the effective rate of 25.17% subject to certain prescribed conditions and after foregoing certain benefits/exemptions. In both of these cases, the provisions of MAT would not be applicable. Under this new enactment, the Company can choose to opt for the new tax rates in the Fiscal Year 2020 (i.e., assessment year 2020-2021) or in any other financial year in the future. When a company exercises this option, the chosen provision will apply to the financial year in which option is exercised and all subsequent years. The Finance Act 2022 has amended the Income Tax Act to extend the last date for commencement of manufacturing or production, under section 115BAB of the Act, from March 31, 2023, to March 31, 2024.
xxii) The GoI may allege a breach of a covenant by us and seek to exercise a put or call right with respect to shares of HZL, which may result in substantial litigation and serious financial harm to our business, results of operations, financial condition and prospects
Under the terms of the shareholders’ agreement between the GoI and erstwhile SIIL, we agreed that we would ensure that HZL would implement a 1 mmtpa greenfield zinc smelter plant at Kapasan in the state of Rajasthan (the “Kapasan Project”), within 5 years from April 11, 2002. The shareholders’ agreement provided that if within one year from this date, we reviewed the feasibility of the Kapasan Project and determined that it was not in the best economic interests of HZL, which determination required the report of an independent expert, and the board of directors of HZL confirmed this determination, then we would not be obliged to ensure that HZL implement the Kapasan Project. In 2003, HZL notified the GoI that the Kapasan Project would not be undertaken and that a report of an independent expert may not be required. While we have not received any notice of breach under the provisions of the shareholders’ agreement between the GoI and us with respect to HZL, the GoI may claim that we have breached the covenant related to the Kapasan Project as mentioned in the shareholders’ agreement triggering an event of default. The GoI, under the terms of the shareholders’ agreement, may become entitled to the right, which is exercisable at any time within 90 days from the day it became aware of such event of default, to either sell any or all of the shares of HZL held by the GoI to us at a price equivalent to 150.0% of the market value of such shares, or purchase any or all of the shares of HZL held by us at a price equivalent to 50.0% of the market value of such shares.
The closing market price of HZL’s shares on the National Stock Exchange of India Limited (“NSE”) on July 15, 2022, was 285.35. ($3.76) per share. Based solely on this price, if GoI became entitled to sell and exercised this right to sell all of its 1,247,950,590 shares of HZL at a price equivalent to 150.0% of their market value, we would be required to pay 534,154 million ($ 7,040.38 million) for those shares. Assuming the same July 15, 2022, closing market price of HZL’s shares, if GoI became entitled to purchase all of the 2,743,154,310 shares of HZL held by us at a price equivalent to 50.0% of their market value, we would receive 391,380 million ($ 5,158.55 million) for those shares.
₹
₹
₹
xxiii) Attracting and retaining talent at technical, managerial and leadership level as well as shortage of skilled labor in the natural resources industry could increase our costs and limit our ability to maintain or expand our operations, which could adversely affect our results of operations
Our efforts to execute our business plans will place significant demands on our management and other resources and we will be required to continue to improve operational, financial, and other internal controls. Our ability to maintain and grow our business will depend on our ability to attract, train and retain personnel with skills that enable us to keep pace with growing demands and evolving industry standards. We are dependent to a large degree, on the continued service and performance of our senior management team and other key team members in our business divisions. These key personnel possess technical and business capabilities that are difficult to replace. The loss or diminution of services of members of our senior management or other key team members, or our failure to retain our key personnel at various managerial positions could have an adverse effect on our results of operations, financial condition and prospects. In addition, our business develops and expands, we believe that our future success will depend on our ability to attract and retain highly skilled and qualified personnel, which is not guaranteed.
21
Mining, metal refining, metal smelting and fabrication operations and oil and gas extraction, require a skilled and experienced labor force. If we experience a shortage of skilled and experienced labor, our labor productivity could decrease and costs could increase, our operations may be interrupted or we may be unable to maintain our current production or increase our production as otherwise planned, which could have a material adverse effect on our results of operations, financial condition and business prospects.
In addition, certain key employees of our company may have claims pending against them from their prior employment. None of these claims relate to any activity by any of these employees in their engagement with us. While these claims have no impact on our company, an adverse outcome of these claims against any of the key employees may negatively impact our reputation.
xxiv) Our insurance coverage may prove inadequate to satisfy future claims against us
We maintain insurance, which we believe is typical in the respective industries in which we operate and in amounts which we believe to be commercially appropriate. Nevertheless, we may become subject to liabilities against which we may not have adequate insurance coverage or at all. Our insurance policies contain certain customary exclusions and limitations on coverage which may result in our claims not being honored to the full extent of the losses or damages we have suffered. For example, the loss due to pot failures in our aluminum smelters are not fully covered by insurance. The exploration and production of crude oil and natural gas is inherently hazardous. A range of factors incorporating natural and
man-made
factors may result in oil spills, fires, equipment failure, loss of well control, leakage of hydrocarbons or hydrogen sulphide etc., which can result in death, injury and damage to production facilities and the environment. In addition, our operating entities in India can only seek insurance from domestic insurance companies or foreign insurance companies operating in joint ventures with Indian insurance companies and these insurance policies may not continue to be available at economically acceptable premiums. The occurrence of a significant adverse event, the risks of which are not fully covered or honored by such insurers could have a material adverse effect on our business, financial condition and results of operations.xxv) The
Re-organization
Transactions may not result in expected benefitsAt the time of announcing the” for further details.
Re-organization
Transactions, we estimated cost savings and tax efficiencies arising from the transaction, due to operational and financial synergies. These synergies may not be realized or may be materially lower than estimated and the extent to which any of the other benefits will actually be achieved, if at all, or the timing of any such benefits, cannot be predicted with certainty. If we are unable to realize the estimated cost savings or the other benefits that we expect to achieve through the consolidation, or if we are prevented from taking advantage of the anticipated tax efficiencies, or if we are unable to offset the incremental costs we incur over time as a result of the consolidation with such savings and benefits, there could be a material adverse effect on our business, financial condition and results of operations. Further, subsequent to the Amalgamation andRe-organization
Scheme becoming effective, a SLP challenging the orders of the High Court of Bombay at Goa was filed before the Hon’ble Supreme Court by the Commissioner of Income Tax, Goa and the Ministry of Corporate Affairs (MCA) in July 2013 and April 2014, respectively. Further, a creditor and a shareholder challenged the Amalgamation andRe-organization
Scheme in the High Court of Madras in September 2013. Currently, the Hon’ble Supreme Court has admitted the SLPs and the matter is likely to be listed in due course. There is no assurance that the SLPs will be determined in our favor, and accordingly, there is no assurance that the courts will not negate the effectiveness of theRe-organization
Transactions. In such circumstance, we may not be able to achieve financial, operational, strategic and other potential benefits from the consolidation pursuant to theRe-organization
Transactions. See “Item 8: Financial Information - A. Consolidated Statements and Other Financial Information - Legal Proceedings
xxvi) We may incur significant costs or loss of reputation in case of leakage of business sensitive information
We are dependent on the capacity and reliability of the communications, information and technology systems supporting our operations. We are exposed to operational risks, such as data entry or operational errors or interruptions of our financial, accounting, compliance and other data processing systems, whether caused by the failure to prevent or mitigate data losses and other security breaches, or other cyber security threats or attacks, fire or other disaster and power or telecommunications failure, which could result in a disruption of our business, liability to third parties, regulatory intervention, or reputational damage, and thus have a material adverse effect on our business.
Although we have
back-up
systems and cyber security measures in place, ourback-up
procedures, cyber defense, and capabilities in the event of a failure, interruption, or breach of security may not be adequate. Insurance and other safeguards may not be available or may only partially reimburse us for losses related to operational failures or cyber-attacks.22
As we grow and our reliance on information technology and systems increases, protecting our systems from cyber security attacks and threats may become increasingly challenging and costly. The threats to the security of our digital infrastructure continue to evolve rapidly and we rely on digital systems and network technology. We may be unable to prevent or address, any disruption to the operation of our information technology systems in a timely manner. Any such failure could result in our inability to perform, or result in prolonged delays in the performance of, critical business and operational functions, the loss of key business information and data, or a failure to comply with regulatory requirements. There may be a risk of operational unavailability, impact on service and safety with the extensive usage of remote access including privileged access to IT infrastructure and remote access on plant site as well due to the pandemic. Users may become victim of targeted Covid-19/other theme based phishing attacks (spear phishing) which may cause significant data loss including Personally Identifiable Information (“PII”) and may impact regulatory compliances. The threats to the security of our digital infrastructure continue to evolve rapidly and we rely on digital systems and network technology. Any significant breach or failure of our digital infrastructure and/or cyber security attacks due to negligence, information technology security failure, disgruntled employees or any other reason could seriously disrupt our operations resulting in loss or misuse of data or sensitive information, disruption to our business, damage to our assets, legal or regulatory breaches and potentially legal liability. These could result in significant costs and/or reputational consequences. Increased cyber warfare trends targeting essential services may cause operations disruption and remote working may impact the cyber incident responsiveness and increase response and recovery time.
xxvii) Our operations may be disrupted due to unauthorized access and occupants
We face a risk of authorized access to our various sites and offices. Any access that is not authorized could lead to loss of our sensitive data and may cause harm to our property. This could have a material adverse effect on our business and financial condition.
For instance, our steel plant situated at Bokaro, Jharkhand is not fully fenced by boundary walls and only 25% of boundary wall is available in the plant area (total boundary length of 12 kilometers), which may lead to unauthorized access. Also, there are villages inside the premises of the plant and the presence of villagers inside the plant premises creates a risk of an unsafe working environment and prevents seamless implementation of various process controls. While we have implemented various security measures including physical and automated security solutions to enhance deterrence against intrusions, theft and encroachment, we may not be able to prevent future intrusions, theft or encroachment in totality until such time physical boundary walls are in place, which may impact our business, financial condition and operations.
xxviii) Our oil and gas business involves joint venture partnerships under the PSC framework. Difference of opinion between the partners and the regulator may occur in relation to cost recovery and other PSC provisions and such difference may affect the financial position of the Company.
The operating blocks of our oil and gas vertical operate under the PSC regime. These operating blocks have joint venture partners.
Pursuant to the provisions of the Joint Operating Agreement, our joint venture partner(s) has an obligation to pay the cash calls raised for the smooth functioning of petroleum operations. However, the joint venture partner has withheld payment of certain cash calls and settled payments at exchange rates to its own benefit.
In addition, resolving the issue of cost oil finalization by October 25, 2019, was one of the conditions of extension of the RJ Block PSC. Our joint venture partner has taken positions which are contrary to our application and interpretation of RJ Block Joint Operating Agreement, PSC and certain office memorandum/notifications issued by the GoI. We, as Operator, have served a Notice of Arbitration pursuant to the RJ Block Joint Operating Agreement and the PSC to our joint venture partner dated March 1, 2019, and a detailed schedule of claim was filed on February 1, 2019. However, Directorate General of Hydrocarbons (“DGH”) vide their letter dated December 3, 2019, have delinked this issue as a
pre-condition
to PSC extension.In May 2018, DGH raised a demand for the GoI’s additional share of profit oil for the period up to March 31, 2017, based on the computation of disallowance of cost incurred over the initially approved FDP of pipeline project of $ 202 million and retrospective
re-allocation
of certain common costs between Development Areas (“DA’s”) of RJ Block aggregating to $ 364 million, representing the share of Vedanta Limited and its subsidiary.Subsequently, in January 2020, the Company received notifications from DGH on audit exceptions arising out of its audit for the FY 2017 - 18, which comprises the consequential effects on profit oil due to the aforesaid matters and certain new matters on cost allowability plus interest aggregating to $ 645 million, representing share of Vedanta Limited and its subsidiary, which have been suitably responded to by the Company. DGH vide letter dated April 28, 2022, has notified audit exceptions to the Contractor for the period till May 14, 2020, which are similar to the exceptions raised for FY 2016-17 and FY 2017-18.
23
xxix) The outbreak, or threatened outbreak, of any severe communicable disease, such as the ongoing COVID-19 pandemic, may adversely impact Vedanta Limited’s business, financial condition and results of operations.
The magnitude of COVID-19 pandemic, although badly impacted millions of people worldwide including India, has been declining due to rollout of large-scale vaccination, improvement in health infrastructure and diminished lethal power of the subsequent variants of the COVID-19 virus. The operations of Vedanta Limited have been largely insulated from the adverse impact of the virus during FY 2021-2022 as the GoI ensured business continuity and active measures undertaken by the business units for the safety of the employees like vaccination drives at various locations and encouraging people to follow COVID-appropriate behavior.
However, due to the evolving nature of the virus and emergence of its new variants, any adverse impact of the fresh spread of the pandemic in India in terms of availability of manpower, transportation bottlenecks etc. cannot be ruled out. Also, any new outbreak of the pandemic in other countries may create logistical challenges and adversely impact commodity demand and price, affecting our business.
xxx) If we fail to maintain an effective system of internal control over financial reporting, we may be unable to accurately report our financial results or prevent fraud, and investor confidence in our company and the market price of our shares may be adversely affected.
We are required to maintain internal control over financial reporting and to report any material weakness in those controls. We must perform system and process evaluation and testing of our internal controls over financial reporting to allow management to report on the effectiveness of our internal controls over financial reporting. Also, our independent registered public accounting firm, after conducting its own independent testing, may issue a report that is qualified if it is not satisfied with our internal controls.
During the FY 2020-21, we have identified material weaknesses in our internal control over financial reporting and concluded that as of March 31, 2021, our disclosure controls and procedures and our internal control over financial reporting were not effective which is subsequently remediated.
See “Item 15 - Controls and Procedures.”
We face operational risks in our various businesses and there may be losses due to deal errors, inaccurate reporting, breaches of confidentiality, and fraud. Any error tampering or manipulation could result in losses that may be difficult to detect. Despite our efforts to ensure the integrity of our financial reporting process, we cannot assure you that additional material weaknesses or significant deficiencies in our internal control over financial reporting will not be identified in the future. Any failure to maintain or improve existing controls or implement new controls could result in additional material weaknesses or significant deficiencies and cause us to fail to meet our periodic reporting obligations. In addition, any such failure could result in material misstatements in our financial statements and adversely affect the results of annual management evaluations regarding the effectiveness of our internal control over financial reporting. Any of the foregoing could cause investors to lose confidence in our reported financial information, leading to a decline in our share price.
24
2. Risks Relating to Our Industry
i) Commodity prices and the copper treatment and refinery charges or TcRc may be volatile, which may have a material adverse effect on our revenue, results of operations and financial condition.
Historically, the international commodity prices for copper, zinc, oil and gas, iron ore and aluminium and the prevailing market TcRc rate for copper have been volatile and subject to wide fluctuations in response to relatively minor changes in the supply of, and demand for, such commodities, market uncertainties, the overall performance of world or regional economies and the related cyclicality in industries, we directly serve and a variety of other factors. Commodity prices and the market TcRc rate for copper may continue to be volatile and subject to wide fluctuations in the future for a variety of reasons.
For instance, we purchase copper concentrate / anodes / blisters at the LME price for copper metal for the relevant quotational period less a TcRc, that we negotiate with our suppliers, but which is influenced by the prevailing market rate for the TcRc. The TcRc has historically fluctuated independently and significantly from the copper LME price. We attempt to make the LME price a pass-through cost for us as both our copper concentrate / anodes / blister purchases and sales of finished copper products are based on LME prices. Nevertheless, we are also exposed to differences in the LME price between the quotational periods for the purchase of copper concentrate and sale of the finished copper products, and any decline in the copper LME price between these periods will adversely affect us. See “”.
Item 5: Operating and Financial Review and Prospects - Factors Affecting Results of Operations - Metal and Oil Prices, Copper TcRc and Power Tariff
For example, between fiscal year 2021 and fiscal year 2022, the average LME prices of zinc, aluminium, brent, copper, lead, iron ore and silver increased by 34.5%, 53.7%, 82.1%, 40.5%, 22.3%, 6.6% and 7.4% respectively. Historically, international prices for aluminium, crude oil and natural gas have fluctuated as a result of many macro-economic, geo-political and regional factors.
Substantial or extended declines in international crude oil and gas prices could have an adverse effect on the economics of existing and proposed projects, capex outlay, business, financial condition and results of operations.
Similarly, a portion of our alumina requirements are sourced internally from our captive refinery at Lanjigarh and balance volumes are sourced from global suppliers mostly at index-linked prices. The exposure to global prices indices affects the profitability of our aluminium operations. During fiscal year 2022, 55.38% of our alumina requirement was sourced from third parties. Further, the units of power generated by our commercial power generation business are also subject to price volatility.
The market price of the alumina that we purchase from third parties and the market price of the aluminium metals that we sell have experienced volatility in the past and any increases in the market price of the raw material relative to the market price of the metal that we sell would adversely affect the profitability and operating margins of our aluminium business, which could have a material adverse effect on our business, financial condition and results of operations.
Further, for our public sector undertaking (“PSU”) buyers at our RJ Block and all our buyers at Ravva and Cambay blocks, the crude oil is benchmarked to Bonny Light, an international low Sulphur crude oil published in Platt’s Crude Oil Market Wire on a daily basis. The pricing formula for PSU buyers also adjusts for differences in yield and quality. From fiscal year 2021, the private buyers at RJ Block are linked to Dated Brent. Any change in the prices of international crude benchmarks of Dated Brent and Bonny Light would impact the revenue from our oil and gas business.
The implied price realization of crude oil generally lies within the stated guidance of 2.0% - 4.0% discount to Dated Brent for Rajasthan, 3%
-7%
to Dated Brent for Cambay and 1% - 5% to Dated Brent for Ravva, due to the prevailing oil market conditions. Movements in discount affect our revenue realization and any increase in quality differentials may adversely impact our revenues and profits. The current uncertainty in the market due to the various waves ofCOVID-19
global pandemic and potential demand reduction due to rising interest rates globally may have an adverse impact on our crude oil sales and on the revenue.Additionally, our profitability in our steel business is largely dependent on the prices of imported coking coal and movement in iron ore prices in the Indian domestic market which is volatile. Both coking coal and iron ore constitutes approximately 70% of our cost of production. Prices of iron and steel are determined not only by current demand and supply, but also by forecasted demand and supply. Prices are influenced by several macro-economic factors which include global economic slowdown,
US-China
trade war, Dollar strengthening, supply chain destocking, government spend on infrastructure, the emphasis on developmental projects, demand-supply forces, the PMI in India and production and inventory levels across the globe specially China.25
Price is also influenced by the demand of the various industries steel is used for. If the auto industry is strong, for example, demand for steel may be higher and the same goes for construction, packaging, and other businesses that rely heavily upon steel.
We largely sell our iron and steel products in the Indian domestic market and prices of our products are subject to demand and supply factors and macro-economic factors. Any adverse movement in prices will have direct adverse impact on realization and resultant margin.
ii) There are uncertainties inherent in estimating our ore reserves and mineral resources and oil, condensate and
sales-gas
reserves, and if the actual amounts of such reserves and resources are less than estimated, our results of operations and financial condition may be materially and adversely affected.There are uncertainties inherent in estimating the quantity of ore reserves and mineral resources and in projecting future rates of production, including factors beyond our control. Estimating the amount of ore reserves and mineral resources is a subjective process, and the accuracy of any estimate is a function of the quality of available data and engineering and geological interpretation and judgment. Estimates of different competent persons or experts may vary, and results of exploration, mining and production subsequent to the date of an estimate may lead to revision of estimates. For example, fluctuations in the market price of ore and other commodities, reduced recovery rates or increased production costs due to inflation or other factors may render proven and probable ore reserves containing relatively lower grades of mineralisation uneconomic to exploit and may ultimately result in a restatement of ore reserves. If the assumptions upon which estimates of ore reserves or resources have been based prove to be incorrect, or if ore reserve estimates differ materially from mineral quantities or grades that we may actually recover, estimates of mine or field life may prove inaccurate and market price fluctuations and changes in operating and capital costs may render certain ore reserves, mineral deposits or oil and gas deposits uneconomical to extract.
For example, there are differences between our estimates, on our reserves and contingent resources and the estimates of DeGolyer and MacNaughton (D&M), independent petroleum engineering consultants, due to their different methodologies.
As a result, the ore reserves and mineral resources data contained in this annual report are subject to material assumptions and uncertainties. In the event that any of these assumptions and estimates turns out to be incorrect, we may need to revise our estimates downwards and this may adversely affect our business plans and the total value of our asset base, which could increase our costs and decrease profitability. If this occurs, our results of operations and financial condition may be materially and adversely affected.
iii) Changes in tariffs, royalties, cess, customs duties, export duties, government assistance may reduce our Indian market domestic premium and global trade restrictions, which would adversely affect our profitability and results of operations
Copper, zinc and aluminium are sold in the Indian market and they attract import duties. The GoI may reduce or abolish customs duties on any of these commodities in the future, although the timing and extent of such reductions cannot be predicted. As we sell the majority of the commodities we produce in India, any reduction in Indian tariffs on imports will increase imports of these commodities in India, which may impact our domestic market share and would have an adverse effect on our business, financial condition and results of operations. However, it is less probable that GoI may cut import duties at any time since its emphasis is on “Atmanirbhar Bharat” with particular focus on boosting domestic manufacturing.
We pay royalties to the state governments of Chhattisgarh and Rajasthan based on our extraction of bauxite and lead-zinc ore, respectively. Most significant of these is the royalty that HZL is required to pay to the state government of Rajasthan, where all of HZL’s mines are located, at a rate of 10%, with effect from September 1, 2014, of the zinc LME price payable on the zinc metal contained in the concentrate produced and 14.5% of the lead LME price payable on the lead metal contained in the concentrate produced and at a rate of 7% of silver LME price chargeable on silver-metal produced. Any upward revision to the royalty rates being charged currently may adversely affect our profitability. Additionally, the Department of Mines and Geology (“DMG”) of the State of Rajasthan has alleged additional demands for payment through several show cause notices to HZL for mining minerals associated with lead and zinc such as cadmium and silver. See “Similarly, our oil and gas business pay royalties and cess to the state governments and the Central Government in India at rates determined by the respective governments, linked to the volume or value of oil produced. Any adverse changes in these fiscal terms may adversely affect our profitability. Cess earlier being levied on volume was adversely affecting the net realization in a declining oil price scenario. In the budget of fiscal year 2016, levy of cess was made on an ad valorem basis. We are required to pay royalties to the state government of Tasmania in Australia based on our extraction of copper ore. We also pay royalties to the government from our Zinc International business. In our iron ore business, in Goa, we are required to pay royalty on iron ore to the state governments of Goa at 15% of the average price declared periodically by the Indian Bureau of Mines. In Karnataka, royalty at 15% is borne by the buyer. We used to pay export duty on export of iron ore fines and lumps at the rate of 30% ad valorem on the Free on Board (“FOB”) value of exports with effect from December 31, 2011, and up to April 29, 2015 (the rate being 20% prior to December 30, 2011). With effect from April 30, 2015 and up to February 29, 2016, the export duty on iron ore fines having Fe content less than 58% is 10% and on iron ore fines having Fe content equal to or more than 58% is 30% and on iron ore lumps it is 30%. With effect from March 1, 2016 till date, the export duty on iron ore fines and lumps having Fe content less than 58% is nil and export duty on iron ore fines and lumps having Fe content equal to or more than 58% is 30%. In April 2014, the Hon’ble Supreme Court ordered to create the Iron Ore Goa Permanent Fund, wherein all lease holders have to contribute 10% of sales value to this fund, see “” for details.
Item 8. Financial Information - A. Consolidated
Statements and Other Financial Information - Legal Proceedings - Demands against HZL by DMG- Demand for Royalty”.
Item 5 -
Operating and
Financial
Review
and
Prospects
- Factors
Affecting
Results of Operations
-
Government Policy
26
Changes in tax laws could also result in additional taxes payable by us. For example, the GoI raised the export duty on iron ore fines and lumps twice during fiscal year 2011, first to 20% with effect from March 1, 2011, and then to 30% with effect from December 31, 2011. Currently, export duty is applicable on iron ore only having Fe content equal to or more than 58%.
Towards the end of fiscal year 2015, the MMDR Amendment Act was notified which brings greater transparency in granting of mineral concessions through an
e-auction
process. It also removes certain uncertainties relating to automatic renewals of mine leases for future periods. However, for existing mining leases, it notifies an amount not exceeding royalty, to be contributed to District Mineral Foundation (“DMF”) for the benefit of people affected by mining and an additional amount equivalent to 2% of royalty to National Mineral Exploration Trust. DMF contribution was notified at 30% of the base royalty rate for the mines allocated other than through auction before September 2015.In order to boost exports, GoI introduced the Scheme for Remission of Duties and Taxes on Exported Products (RoDTEP) for export of goods with effect from January 1, 2021. The RoDTEP scheme seeks remission of Central, State and Local duties/taxes/levies at different stages, which are incurred in the process of manufacture and distribution of exported products but are currently not being refunded under any other duty remission scheme. The scheme included
non-ferrous
metal manufacturing sectors like aluminium, copper, zinc and lead with RoDTEP rates as percentage of FOB with certain cap of rebates. However, certain sectors like steel, pharma and chemicals have not been provided support under RoDTEP Scheme on account of budgetary considerations. Also, certain categories of exports or exporters were excluded from being eligible for rebate under RoDTEP Scheme like products manufactured or exported by 100% Export Oriented Unit (EoU) or Special Economic Zones (SEZ), exports for which electronic documentation in ICEGATE EDI has not been generated/ exports fromnon-EDI
ports, products manufactured or exported against an Advance Authorization (AA), products manufactured partly or wholly in a bonded warehouse etc. Government, however, reserves the right to modify any of the categories as mentioned above for inclusion or exclusion under the scope of RoDTEP, at a later date based on the recommendations of the RoDTEP Committee. As part of aluminium manufacturing business of Vedanta Limited is located in SEZ and some part of aluminium export is made under Advance Authorization, any adverse decision of the Committee set up by GoI for determination of RoDTEP rates for AA/EoU/SEZ exports may impact the revenue we receive from export sales.Further, the GoI has enacted the Goods and Service Tax (“GST”) regime with effect from July 1, 2017, which is a unified, taxation system, intended to integrate the Indian economy into a single unified market. The GST regime replaced the then existing indirect tax regime consisting of central excise law and service tax law at the central level and respective state value- added tax law, entry tax law and luxury tax law at the state level. However, any significant future amendments under the GST regime may affect the overall tax efficiency and may result in significant additional taxes becoming payable.
Global protectionist measures, including anti-dumping laws, countervailing duties and tariffs and government subsidization adopted or currently contemplated by governments in some of our export markets could adversely affect our sales. Anti-dumping duty proceedings or any resulting penalties or any other form of import restrictions may limit our access to export markets for its products, and in the future additional markets could be closed to Vedanta Limited as a result of similar proceedings, thereby adversely impacting its sales and/or limiting its opportunities for growth.
In addition, we are subject to the general risk of doing business overseas and may therefore be affected by global trade wars. For example, there is global economic uncertainty following the announcement by the United States to levy certain import tariffs on certain Chinese goods. Also, the decision of Organization of the Petroleum Exporting Countries (“OPEC”) and OPEC plus countries on oil production can have major impact on international crude oil prices and thereby impact our oil and gas business.
Vedanta Limited is actively monitoring the developments and any other indirect impact due to border issues and trade sanctions that may arise across its operations and dynamically evaluating all opportunities and risks to ensure business continuity, there can be no assurance that any of the above circumstances would not adversely affect Vedanta Limited’s results of operation and financial condition.
iv) The upstream oil and gas industry is dependent on a limited number of global vendors for key equipment and services
There are a limited number of highly specialized vendors or third parties globally catering to the requirements of upstream oil and gas industry for key equipment and services such as rigs and other oilfield equipment and services. These vendors or third parties may not perform the agreed services within the stipulated time or budget. Furthermore, the drilling equipment, facilities and infrastructure owned and operated by the third parties (contracted by Vedanta Limited) are highly complex and subject to malfunction and breakdown. Any malfunctions or breakdowns may be outside our control and result in delays, which could be substantial. Many of these equipment and services involve long lead times to delivery. Inability or delay in sourcing the equipment and services of the required specifications and quality may result in delay of our exploration, development and production projects, and consequently have an adverse effect on our business, financial condition and results of operations. Vedanta Limited- Oil and gas business is entering into integrated contracts with global vendor partners for completeresponsibility of project execution, with rewards linked to final delivery as a means to mitigate this risk.
end-to-end
27
v) There are particular risks and hazards associated with mining and oil exploration activities
Our mining operations include
open-pit
and underground mining, both of which involve significant hazards and risks. Hazards associated with ouropen-pit
mining operations include flooding of the open pit, collapses of theopen-pit
wall, accidents related to the operation of largeopen-pit
mining and rock transportation equipment, accidents related to the preparation and ignition of large scale open pit blasting operations, production disruptions due to weather and hazards related to the disposal of mineralized wastewater, such as groundwater and waterway contamination. Hazards associated with our underground mining operations include underground fires and explosions, including those caused by flammable gas,cave-ins
or ground falls, discharges of gases and toxic chemicals, flooding, sinkhole formation and ground subsidence and other accidents and conditions resulting from drilling and removing and processing material from an underground mine. If any of these hazards or accidents result in significant injury to employees and damage to equipment or other property, we may experience unexpected production delays, increased production costs, and increased capital expenditures to repair or replace equipment or property, as well as claims from affected employees and environmental and other authorities for any alleged breaches of applicable laws or regulations.Disruptions to mining and oil extraction, delays and costs on account of such hazards or accidents could have a material adverse effect on our business, financial condition and results of operations.
vi) We may be affected by competition law in India and any adverse application or interpretation of the Competition Act could adversely affect our business
The Competition Act, 2002, as amended (the “Competition Act”), regulates practices having an appreciable adverse effect on competition in the relevant market in India. Under the Competition Act, any formal or informal arrangement, understanding or action in concert, which causes or is likely to cause an appreciable adverse effect on competition is considered void and results in the imposition of substantial monetary penalties. Further, any agreement among competitors which, directly or indirectly, involves the determination of purchase or sale prices, limits or controls production, supply, markets, technical development, investment or provision of services, shares the market or source of production or provision of services by way of allocation of geographical area, types of goods or services or number of clients in the relevant market or, directly or indirectly, results in
bid-rigging
or collusive bidding is presumed to have an appreciable adverse effect on competition. The Competition Act also prohibits abuse of a dominant position by any enterprise. The Competition Commission of India (the “CCI”) has extra-territorial powers and can investigate any agreements, abusive conduct or combination occurring outside India if such agreement, conduct or combination has an appreciable adverse effect on competition in India. Our operations in India are currently not subject to any outstanding proceedings under the Competition Act. However, if our operations in India are affected, directly or indirectly, by the application or interpretation of any provision of the Competition Act, or any enforcement proceedings initiated by the CCI, or any adverse publicity that may be generated due to scrutiny or prosecution by the CCI or if any prohibition or substantial penalties are levied under the Competition Act, it would adversely affect our business, cash flows and results of operation.3. Risk Relating to Our Relationship with Vedanta
i) We are controlled by Vedanta and our other shareholders’ ability to influence matters requiring shareholder approval will be extremely limited
We are a majority-owned and controlled subsidiary of Vedanta. Volcan and its wholly owned subsidiary hold 100% of the share capital and 100% of the voting rights of Vedanta. Volcan is a holding company, 100% beneficially owned and controlled by the Trust. Conclave is the trustee of the Trust and the sole registered shareholder of Volcan and consequently controls all voting and investment decisions of the Trust. Vedanta shares beneficially owned by Volcan may be deemed to be beneficially owned by the Trust, of which Mr. Anil Agarwal is the protector and since October 16, 2014, one of the beneficiaries. Vedanta, Volcan, the Trust, Conclave and Mr. Anil Agarwal are collectively referred to as “Volcan Parties”. We cannot assure you that Vedanta, and in turn we, will be able to operate completely independent of the Volcan Parties. Lack of independence could have a material adverse effect on the other holders of our other equity shares and ADSs.
As long as Vedanta, through its subsidiaries, owns a majority of our outstanding equity shares, Vedanta may have the ability to control or influence significant matters requiring board approval and to take shareholder action without the vote of any other shareholder, and the holders of our equity shares and ADSs will not, in such circumstances, be able to affect the outcome of any shareholder vote. Vedanta will have the ability to control all matters affecting us. In the event Vedanta ceases to be our majority shareholder, we will be required to immediately repay some of our outstanding long-term debt which could impact our liquidity.
Vedanta’s voting control may discourage transactions involving a change of control of our company, including transactions in which holders of our equity shares and ADSs might otherwise receive a premium over the then current market prices. Vedanta is not prohibited from selling a controlling interest in us to a third party and may do so without the approval of other holders of our other equity shares and ADSs and without providing for a purchase of our other equity shares or ADSs. Accordingly, our other equity shares and ADSs may be worth less than they would be if Vedanta did not maintain voting control over us.
28
ii) Vedanta may decide to allocate business opportunities to other members of the Vedanta Group instead of us, which may have a material adverse effect on our business, results of operations, financial condition and prospects
Vedanta’s control of us means it can determine the allocation of business opportunities among us, itself and its other subsidiaries. Vedanta may determine to have any other entity instead of us, pursue business opportunities in the zinc, oil and gas, copper, iron ore, aluminium or commercial power generation business, or any other business, or cause such companies or us to undertake corporate strategies, the effect of which is to benefit such companies instead of us and which could be detrimental to our interests. If Vedanta were to take any such actions, our business, results of operations, financial condition and prospects could be materially and adversely affected, and the value of our equity shares may decline.
iii) We have issued several guarantees as security for the obligations of certain of our subsidiaries and other companies within the Vedanta Group and we will have liability under these guarantees in the event of any failure by such entities to perform their obligations, which could have a material adverse effect on our results of operations and financial condition
We have issued several guarantees in respect of the obligations of certain of our subsidiaries and other companies within the Vedanta Group, including guarantees on the issuance of customs and excise duty bonds, performance bank guarantees while bidding for supply contracts or in lieu of advances received from customers, bank guarantees for securing supplies of materials and services etc. Our outstanding guarantees cover obligations aggregating 62,810 million and 64,490 million ($ 850 million) as of March 31, 2021 and March 31, 2022, respectively the liabilities for which have not been recorded in our consolidated financial statements. These are contractual guarantees and are enforceable if the terms and conditions of the contracts are not met and the maximum liability on these contracts is the amount mentioned above. The Group does not anticipate any liability on these guarantees. See “” of Notes to the Consolidated Financial Statements.
₹
₹
Note 33: Commitments, guarantees, contingencies and other disclosures
iv) Any disputes that arise between us and Vedanta or other companies in the Vedanta Group could harm our business operations
Disputes may arise between Vedanta or other companies in the Vedanta Group and us in a number of areas, including:
| • | intercompany agreements setting forth services and prices for services between us and Vedanta or other companies in the Vedanta Group; |
| • | business combinations involving us; |
| • | sales or distributions by Vedanta of all or any portion of its ownership interest in us; or |
| • | business opportunities that may be attractive to us and Vedanta, or other companies in the Vedanta Group. |
We may not be able to resolve any potential conflicts, and even if we do, the resolution may be less favorable than if we were dealing with an unaffiliated party.
Our agreements with Vedanta and other companies in the Vedanta Group may be amended upon agreement between the parties. As we are controlled by Vedanta, Vedanta may require us to agree to amendments to these agreements that may be less favorable to us than the original terms of the agreements.
v) Some of our directors and executive officers may have conflicts of interest because of their positions in Vedanta
Some of our directors and executive officers are directors or executive officers of Vedanta. Presence of executive officers of Vedanta on our Board could create or appear to create potential conflicts of interest and other issues with respect to their fiduciary duties to us when our directors and officers are faced with decisions that could have different implications for Vedanta than for us.
Our management, including our senior management, is not solely focused on our business, and may be distracted by, or have conflicts as a result of, the demands of Vedanta or other businesses within the Vedanta Group, which may materially and adversely affect our business, financial condition, and results of operations.
vi) As a foreign private issuer and a “controlled company” within the meaning of the New York Stock Exchange (“NYSE”) rules, we are subject to different NYSE rules than
non-controlled
domestic US issuers. Consequently, the corporate governance standards which we are required to adhere to are different than those applicable to such companies, which may limit the information available to, and the shareholder rights of, holders of our ADSsWe qualify as “controlled company” within the meaning of the NYSE rules as Vedanta has effective control of a majority of our equity shares. This will allow Vedanta to, among other things, control the composition of our Board of directors and direct our management and policies.
29
As a foreign private issuer and a “controlled company,” we are exempt from complying with certain corporate governance requirements of the NYSE, including the requirement that a majority of our Board of directors consist of independent directors. As the corporate governance standards applicable to us are different than those applicable to domestic. The Company’s ADS have been delisted from NYSE effective close of trading on NYSE on November 8, 2021. This follows the filing done by the Company of Form 25 with Securities and Exchange Commission (“SEC”) on October 29, 2021. As a consequence of the delisting becoming effective, termination of the Deposit Agreement under which the ADS were issued has also become effective close of trading on NYSE on November 8, 2021.
non-controlled
US issuers, holders of our equity shares and ADSs may not have the same protections afforded under the NYSE rules as shareholders of companies that do not have such exemptions. It is also possible that the Anil Agarwal family’s significant ownership interest of us as a result of its majority ownership of Vedanta’s majority shareholder, Volcan, could adversely affect investors’ perceptions of our corporate governance. For a summary of the differences between the corporate governance standards applicable to us as a listed company in India and as a foreign private issuer and “controlled company” in the United States and such standards applicable to a domesticnon-controlled
US issuer, see“Item 10. Additional Information - B. Memorandum and Articles of Association - Comparison of Corporate Governance Standards”
See
“
Item No.4 Information on the Company - A History and Development of our Company”.
4. Risks Relating to Investments in Indian Companies, Global Economic Conditions and International Operations
i) A substantial portion of our assets and operations are located in India and we are subject to regulatory, economic, social and political uncertainties in India
A substantial portion of our assets and employees are located in India and we intend to continue to develop and expand our facilities in India. Consequently, our financial performance and the market price of our equity shares will be affected by changes in exchange rates and controls, interest rates, changes in government policies, including taxation policies, the outbreak of infectious diseases, including the
COVID-19
pandemic, social and civil unrest and other political, social and economic developments in or affecting India.The GoI exercises significant influence over many aspects of the Indian economy. Since 1991, successive Indian governments have pursued policies of economic liberalization, including by significantly relaxing restrictions on the private sector. Nevertheless, the role of the Indian Central and State governments in the Indian economy as producers, consumers and regulators has remained significant and we cannot assure that such liberalization policies will continue. The rate of economic liberalization could change, and specific laws and policies affecting metals and mining companies, foreign investments, currency exchange rates and other matters affecting investment in India could change as well. The Provisional Estimates of National Income of India by Ministry of Statistics and Programme Implementation shows a 8.7% GDP growth in fiscal year
2021-2022,
after registering negative GDP growth of 6.6% in fiscal year2020-2021.
Most of the economic indicators were showing revival towards aV-shaped
recovery. However, the repetitive outbreak spread ofCOVID-19
pandemic, high inflation rate, rising interest rates, restrained consumption expenditure and weak sentiment may disrupt the economic revival in India.In particular, the Indian economy continues to be disrupted by the
COVID-19
pandemic, where given the rapidly changing implications of the spread of theCOVID-19
pandemic, it is difficult to assess the full nature and extent of the impact that the outbreak will have on the Indian economy. Declining economic growth may reduce the revenue collection of GoI while expenditure may rise to foster investment in the country as private investment has been low and run the welfare schemes to provide relief to the vulnerable sections of the society to help them survive in theCOVID-19
pandemic scenario. In such a scenario, ability of Central as well as State Governments to continue reforms in terms of reduction in duties and taxes for corporates may be restrained. On the contrary, Governments may look to raise duties and taxes in order to recover the loss of revenue, which might impact our business. Similarly, internationalgeo-political
situation and pace of economic recovery elsewhere in the world may impact decision making of GoI and thereby affect investment climate in India.ii) As the domestic Indian market constitutes the major source of our revenue, the downturn in the rate of economic growth in India or other countries due to the unprecedented and challenging global market and economic conditions, or any other such downturn for any other reason, will be detrimental to our results of operations
In fiscal year 2022, approximately 56.1% of our revenue was derived from commodities that we sold to customers in India. The performance and growth of our business are necessarily dependent on the health of the overall Indian economy. Any downturn in the rate of economic growth in India, whether due to political instability or regional conflicts, economic slowdown elsewhere in the world or otherwise, may have a material adverse effect on demand for the commodities we produce. The Indian economy is also largely driven by the performance of the agriculture sector, which depends on the quality of the monsoon, which is difficult to predict. In the past, economic slowdowns have harmed manufacturing industries, including companies engaged in the steel, copper, zinc, aluminium and power sectors, as well as the customers of manufacturing industries. Any future slowdown in the Indian economy could have a material adverse effect on the demand for the commodities we produce and, as a result, on our business, financial condition and results of operations.
30
In addition, the Indian securities market and the Indian economy are influenced by economic and market conditions in other countries. Although economic conditions are different in each country, investors’ reactions to developments in one country can have adverse effect on the securities of companies in other countries, including India. A loss of investor confidence in the financial systems of other emerging markets may cause volatility in Indian financial markets and, indirectly, in the Indian economy in general. Any worldwide financial instability could also have a negative impact on the Indian economy, including the movement of exchange rates and interest rates in India. Any slowdown in the Indian economy, or future volatility in global commodity prices, could adversely affect the growth of our business in India.
The Indian economy and financial markets are also significantly influenced by worldwide economic, financial and market conditions. Any financial turmoil, especially in the United States, UK, Europe or China, may have a negative impact on the Indian economy. Although economic conditions differ in each country, investors’ reactions to any significant developments in one country can have adverse effects on the financial and market conditions in other countries. A loss in investor confidence in the financial systems, particularly in other emerging markets, may cause increased volatility in Indian financial markets.
iii) Terrorist attacks and other acts of violence involving India, the MENA region or other neighboring countries could adversely affect our operations directly, or may result in a more general loss of customer confidence and reduced investment in these countries that reduces the demand for our products, which would have a material adverse effect on our business, financial condition and results of operations
Terrorist attacks and other acts of violence or war involving India or other neighboring countries may adversely affect the Indian markets and the worldwide financial markets. The occurrence of any of these events may result in a loss of business confidence, which could potentially lead to economic recession and generally have a material adverse effect on our business, financial condition, and results of operations.
Further, any wars, acts of terrorism and uncertain political or economic prospects or instability in the Europe, particularly in Russia and Ukraine have adversely impacted global financial markets and an increase in the price of crude oil. The conflict in these two countries may continue in unforeseeable future and broaden across the region and lead to significant political uncertainties in a number of countries.
In addition, any deterioration in international relations may result in investor concern regarding regional stability which could adversely affect the price of our equity shares and ADSs.
South Asia has also experienced instances of civil unrest, terrorist attacks, military advancements and hostilities among neighboring countries from time to time, especially between India and Pakistan or China. Such activity or terrorist attacks could adversely affect the Indian economy by disrupting communications and making travel more difficult and could create the perception that investments in Indian companies involve a high degree of risk. Furthermore, if India were to become engaged in armed hostilities, particularly hostilities that were protracted or involved the threat or use of nuclear weapons, we might not be able to continue our operations.
iv) If natural disasters or environmental conditions in India, including floods and earthquakes, affect our mining and production facilities, our revenue could decline
Our mines and production facilities are spread across India, and our sales force is spread throughout the country. Natural calamities such as floods, rains, heavy downpours and earthquakes could disrupt our mining and production activities and distribution chains and damage our storage facilities.
Substantially all of our facilities and employees are located in India and there can be no assurance that we will not be affected by natural disasters in the future. If there were a drought or general water shortage in India or any part of India where our operations are located, the GoI or local, state or other authorities may restrict water supplies to us and other industrial operations in order to maintain water supplies for drinking and other public necessities which would cause us to reduce or close our operations. Our business and operating activities could be disrupted if we do not respond, or are perceived not to respond, in an appropriate manner to any major crisis or if we are not able to restore or replace critical operational capacity.
Any incidents or outages in the future could have a material adverse effect on the Company’s operations and financial condition.
31
v) Currency fluctuations among the Indian Rupee, the US dollar and other currencies could have a material adverse effect on our results of operations
Although substantially all of our revenue is tied to commodity prices that are typically priced by reference to the US dollar, most of our expenses are incurred and paid in Indian Rupees and, to a lesser extent, Australian dollars, Euros, Namibian dollars and South African Rands. In addition, in fiscal year 2022, 43.9% of our revenue was derived from commodities that we sold to customers outside India. The exchange rates between the Indian Rupee and the US dollar and between other currencies and the US dollar have changed substantially in recent years and may fluctuate substantially in the future. See “”. Our results of operations or financial condition could be adversely affected if the US dollar depreciates against the Indian Rupee or other currencies. We seek to mitigate the impact of short-term movements in currency on our businesses by hedging our short-term exposures progressively based on their maturity. However, large or prolonged movements in exchange rates may have a material adverse effect on our business, financial condition and results of operations.
Item 10: Additional Information – D. Exchange Controls
vi) If India’s inflation worsens or the prices of oil or other raw materials were to rise, we may not be able to pass the resulting increased costs to our customers and this may adversely affect our profitability or cause us to suffer operating losses
India has experienced significant price inflation in the past. In addition, international prices of crude oil and natural gas have recently experienced significant volatility. Inflation, increased transportation costs and an increase in energy prices generally, which may be caused by a rise in the price of oil, or an increase in the price of coking coal and iron ore in particular, could cause the Company’s costs for raw material inputs required for production of our products to increase, which may have a material adverse effect on our results of operations and financial condition if we cannot pass these added costs on to customers.
vii) Stringent labor laws in India may adversely affect our profitability
India has stringent labor legislation that protects the interests of workers, including legislation that sets forth detailed procedures for industrial dispute resolution and employee compensation for injury or death sustained in the course of employment, and imposes financial obligations on employers upon employee layoffs. This may make it difficult for us to maintain flexible human resource policies, discharge employees or downsize, which may adversely affect our business, financial condition and results of operations.
viii) Political, economic and social risks associated with investments in countries other than India could have an adverse effect on our business
In addition to operating in India, we currently operate and have projects in various other jurisdictions including South Africa, Namibia, UAE, Ireland, Australia, Japan, South Korea, Taiwan and Liberia. Certain of these countries are subject to political, economic and social developments that may, individually or in combination, create risks for investors that may be more difficult to predict or measure than would be the case in certain developed economies. Any political instability could have an adverse impact on the economy as a whole. Political disruptions and civil unrest that may occur in any of these countries could potentially have an adverse effect on exports and, consequently, on our business, financial condition and results of operations. For example, the Ebola epidemic in Liberia resulted in stoppage of drilling and exploration work for iron ore during fiscal year 2015. We evacuated staff in Liberia owing to the Ebola risk in 2015. In consideration of the suspension of exploration in Liberia, low iron ore prices,
geo-political
factors and no plans for any substantive expenditure resulting in continued uncertainty in the project, an impairment charge of $ 228 million had been recognized, in fiscal year 2016. However, due toCovid-19
pandemic there was no such impact.ix) Global economic conditions have been unprecedented and challenging and have had, and continue to have, an adverse effect on the Indian financial markets and the Indian economy in general, which has had, and may continue to have, a material adverse effect on our business, our financial performance and the prices of our equity shares and ADSs
Global market and economic conditions have been unprecedented and challenging and have resulted in heightened volatility in the financial market in most major economies in the recent years. Continued concerns about the systemic impact of potential long-term and wide-spread recession, energy costs, geopolitical issues, the availability and cost of credit and the global housing and mortgage markets have contributed to increased market volatility and diminished expectations across various economies. These conditions, combined with volatile oil prices, declining business and consumer confidence and increased unemployment, have contributed to volatility of unprecedented levels.
32
As a result of these market conditions, the cost and availability of credit has been and may continue to be adversely affected by illiquid credit markets and wider credit spreads. Governments and Central Banks in several countries had adopted accommodative monetary policies in order to enhance liquidity and availability of financing and reduce interest rates to help the corporate sector and individuals’ tide over the liquidity crisis. Restructuring of loans and deferment of period to consider a loan as
Non-Performing
Assets (“NPA”) came as a rescue to a large number of borrowers. However, expansionary monetary policy with increased infusion of liquidity has generated inflationary pressure in some economies. Also, expansion of credit with less stringent norms may increase the risk of NPA with the commercial banks as the financial ability of many borrowers may be affected due to significantly lower business prospect due to pandemic. Inflationary pressure and concern of NPA in the medium term may cause liquidity tightening measure by the Central Banks. Also, as borrowing by governments have increased, this may raise overall interest rates. Continued turbulence in the international markets and economies and prolonged declines in business consumer spending may adversely affect our liquidity and financial condition, and the liquidity and financial condition of our customers, including our ability to refinance maturing liabilities and access the capital markets to meet liquidity needs. These global market and economic conditions have had an adverse effect on the Indian financial markets and the Indian economy in general, which has had, and may continue to have, a material adverse effect on our business, our financial performance and the prices of our equity shares and ADSs.x) There are certain differences in shareholder rights and protections between the laws of India and the United States and between governance standards for a US public company and a foreign private issuer such as us
We are incorporated in India and investors should be aware that there are certain differences in the shareholder rights and protections between the laws of India and the United States. There are also certain differences in the corporate governance standards for a domestic US issuer and those applicable to a foreign private issuer such as us. See “” and see
Item 10. Additional Information - B. Memorandum and Articles of Association – Comparison of Shareholders
’
Rights
“Item 4. Information on the Company - A History and Development of our Company”.
The SEBI and the various Indian stock exchanges are responsible for improving and setting standards for disclosure and other regulatory standards for the Indian securities markets. SEBI has issued regulations and guidelines on disclosure requirements, insider trading and other matters. Nevertheless, there may be less information made publicly available in respect of Indian companies than is regularly made available by public companies in the United States as a result of differences between the level of regulation and monitoring of the Indian securities markets and of the transparency of the activities of investors and brokers in India compared to the United States. Similarly, our disclosure obligations under the rules of the NSE and BSE Limited (“BSE”), on which our equity shares are listed, may be less than the disclosure obligations of public companies on the NYSE.
The Company’s ADS have been delisted from NYSE effective close of trading on NYSE on November 8, 2021. This follows the filing done by the Company of Form 25 with Securities and Exchange Commission on October 29, 2021. As a consequence of the delisting becoming effective, termination of the Deposit Agreement under which the ADS were issued has also become effective close of trading on NYSE on November 8, 2021. The said action has no impact on the current listing status or trading of the Company’s equity shares on BSE and NSE.
xi) The filing of an insolvency petition under the new bankruptcy code in India by our creditors may affect the Company’s revenues, financial condition and results of operations
The Insolvency and Bankruptcy Code, 2016, as amended (“Bankruptcy Code”) was notified on August 5, 2016. The Bankruptcy Code encompassing all companies, partnerships and individuals (other than financial firms) and allows creditors to assess the viability of a debtor as a business decision and agree on a plan for its revival or a speedy time bound liquidation. The Bankruptcy Code creates a new institutional framework, consisting of a regulator, insolvency professionals, information utilities and adjudicatory mechanisms, which will facilitate a formal and quicker insolvency resolution and liquidation process. Under the Bankruptcy Code, any financial or operational creditor as well as the Company may approach the NCLT to initiate a corporate insolvency resolution process against a debtor upon default in repayment of at least 100,000 equivalent to approximately $ 1,318. However, the threshold of default for initiating a corporate insolvency resolution process against a debtor has been increased to 10,000,000 (equivalent to approximately $ 131,804) through a Notification dated March 24, 2020, issued by the MCA. On receipt of an application from a creditor, the NCLT is required to either admit or reject the application within a period of 14 days from the date of the application. If application is admitted, an interim resolution professional is appointed for managing the affairs of the debtor and a moratorium is declared for a period of 180 days which can further be extended by 90 days prohibiting, inter alia, institution/continuation of suits against the debtor and transfer/disposal of assets of the debtor. The committee of creditors formed by the interim resolution professional is required to formulate a resolution plan to be approved by the NCLT. If no resolution plan is agreed upon by the creditors or if the NCLT rejects the resolution plan, liquidation proceedings are commenced against the debtor. If the Bankruptcy Code provisions are invoked by any of our creditors, it may adversely and materially affect our revenues, financial conditions and results of operations.
₹
₹
33
5. Risks Relating to Our ADSs
i) Fluctuations in the exchange rate between the Indian Rupee and the US dollar could have a material adverse effect on the value of our ADSs, independent of our actual operating results
Our ADSs have been delisted from the NYSE effective close of trading on November 8, 2021, the price of the ADSs was quoted in US dollars. Our equity shares are quoted in Indian Rupees on the NSE and BSE. Any dividends in respect of our equity shares are paid in Indian Rupees and subsequently converted into US dollars for distribution to ADSs holders.
Currency exchange rate fluctuations would have affected the dollar equivalent of the Indian Rupee price of our equity shares on the NSE and BSE and, as a result, the prices of our ADSs, as well as the US dollar value of the proceeds a holder would receive upon the sale in India of any of our equity shares withdrawn from the depositary under the deposit agreement and the US dollar value of any cash dividends, we pay on our equity shares. Holders may not be able to convert Indian Rupee proceeds into US dollars or any other currency, and there is no guarantee of the rate at which any such conversion will occur, if at all. Currency exchange rate fluctuations would have also affected the value received by ADSs holders from any dividends paid by us in respect of our equity shares. Holders of our ADSs would have bear all of the risks with respect to a decline in the value of the Indian Rupee as compared to the US dollar, which would adversely affect the price of our ADSs and the US dollar value of any dividends we pay that are received by ADSs holders.
ii) Transfers of the underlying shares by person’s resident outside India to residents of India are subject to certain pricing norms
Under current Indian exchange control regulations, subject to certain conditions and reporting requirements, no prior regulatory approval is required for the sale of any equity shares of an Indian company, by a person resident outside India to a resident of India, provided that the sale of such shares has been carried out a price which is not higher than the fair market value prescribed under the Indian exchange control regulations.
iii) Holders of ADSs may be restricted in their ability to exercise preemptive rights under Indian law and thereby may suffer future dilution of their ownership positions
Under the Indian Companies Act, 2013 the holders of equity shares of a company incorporated in India have a preemptive right to subscribe and pay for a proportionate number of shares to maintain their existing ownership percentages prior to the issuance of any new equity shares by the company, unless the preemptive rights have been waived by adopting a special resolution passed by 75% of the shareholders present and voting at a general meeting.
Holders of ADSs may be unable to exercise preemptive rights for the underlying equity shares of the ADSs unless a registration statement under the Securities Act of 1933, as amended, or the Securities Act is effective with respect to such rights or an exemption from the registration requirements of the Securities is available. We are not obligated to prepare and file such a registration statement and our decision to do so will depend on the costs and potential liabilities associated with any such registration statement, as well as any other factors we consider appropriate at the time. No assurance can be given that we would file a registration statement under these circumstances. If we issue any such securities in the future, such securities may be issued to the depositary, which may sell the securities for the benefit of the holders of the ADSs. The value the depositary would receive from the sale of such securities cannot be predicted. To the extent that holders of ADSs are unable to exercise preemptive rights granted in respect of our equity shares represented by their ADSs, their proportional ownership interests in us would be diluted. The Company’s ADS have been delisted from NYSE effective close of trading on NYSE on November 8, 2021. This follows the filing done by the Company of Form 25 with Securities and Exchange Commission on October 29, 2021. As a consequence of the delisting becoming effective, termination of the Deposit Agreement under which the ADS were issued has also become effective close of trading on NYSE on November 8, 2021. See. Further, the Company will continue to be subject to reporting obligations under the U.S. Securities Exchange Act of 1934 until such time as it can terminate its registration under the Exchange Act.
“
Item No.4 Information on the Company - A History and Development of our Company - title Delisting from NYSE”
iv) We may be classified as a passive foreign investment company, which could result in adverse United States federal income tax consequences to US Holders
Based on the market prices of our equity shares and ADSs and the composition of our income and assets, including goodwill, although not clear, we do not believe we were a(“PFIC”) for United States federal income tax purposes for our taxable year ended March 31, 2022. However, the application of the PFIC rules is subject to uncertainty in several respects and, therefore, the US Internal Revenue Service may assert that, contrary to our belief, we were a PFIC for such taxable year. Moreover, although the asset test (defined below) is required to be calculated based on the fair market value of our assets, we did not do a valuation of our assets and our belief that we were not a PFIC for our taxable year ended March 31, 2022, is, in part, based on the book value of our assets. A”.
passive foreign investment company
non-United
States corporation will be considered a passive foreign investment company, or PFIC, for any taxable year if either (1) at least 75.0% of its gross income for such year is passive income or (2) at least 50.0% of the total value of its assets (based on an average of the quarterly values of the assets during such year) is attributable to assets, including cash, that produce or are held for the production of passive income, or passive assets. In addition, a separate determination must be made after the close of each taxable year as to whether we were a PFIC for that year. Because the aggregate value of our assets for purposes of the PFIC test will generally be determined by reference to the market price of our ADSs and equity shares, fluctuations in the market price of the ADSs and equity shares may cause us to become a PFIC. In addition, changes in the composition of our income or assets may cause us to become a PFIC. Accordingly, we cannot assure you that we will not be a PFIC for the taxable year that will end on March 31, 2023, or any future taxable year. If we were a PFIC for any taxable year during which a US Holder (as defined under “Item 10: Additional Information - E. Taxation - United States Federal Income Taxation”) holds an ADSs or an equity share, certain adverse United States federal income tax consequences could apply to the US Holder. See “Item 10: Additional Information - E. Taxation - United States Federal Income Taxation - Passive Foreign Investment Company
34
v) If a United States person is treated as owning at least 10% of our ADSs or equity shares, such holder may be subject to adverse U.S. federal income tax consequences
If a United States person is treated as owning (directly, indirectly or constructively) at least 10% of the value or voting power of our ADSs or equity shares, such person may be treated as a “United States shareholder” with respect to each “controlled foreign corporation” in our group (if any). If our group includes one or more U.S. subsidiaries, certain of our
non-U.S.
subsidiaries could be treated as controlled foreign corporations (regardless of whether we are not treated as a controlled foreign corporation). A United States shareholder of a controlled foreign corporation may be required to report annually and include in its U.S. taxable income its pro rata share of “Subpart F income,” “global intangiblelow-taxed
income” and investments in U.S. property by controlled foreign corporations, regardless of whether we make any distributions. An individual that is a United States shareholder with respect to a controlled foreign corporation generally would not be allowed certain tax deductions or foreign tax credits that would be allowed to a United States shareholder that is a U.S. corporation. Failure to comply with these reporting obligations may subject you to significant monetary penalties and may prevent the statute of limitations with respect to your U.S. federal income tax return for the year for which reporting was due from starting. We cannot provide any assurances that we will assist investors in determining whether any of ournon-U.S.
subsidiaries are treated as a controlled foreign corporation or whether such investor is treated as a United States shareholder with respect to any of such controlled foreign corporations or furnish to any United States shareholders information that may be necessary to comply with the aforementioned reporting and tax paying obligations. A United States holder of our ADSs or equity shares should consult its own advisors regarding the potential application of these rules to their investment in our ADSs or equity shares.ITEM 4. | INFORMATION ON THE COMPANY |
A. | History and Development of our Company |
Our Company Identification Number is L13209MH1965PLC291394. Our registered office is presently situated at 1st Floor, ‘C’ wing, Unit 103, Corporate Avenue, Atul Projects, Chakala, Andheri (East), Mumbai - 400 093, Maharashtra, India. Our registered office was relocated from the state of Goa to the state of Maharashtra, with effect from February 2, 2017. The telephone number of our registered office is (91) 022 6643 4500. The register of members of the Company is maintained at the registered office of the Company and also at the office of the Company’s Registrar and Transfer Agent, KFin Technologies Limited (formerly knowns as KFin Technologies Private Limited), Hyderabad. Our website address is http://www.vedantalimited.com.
Our equity shares are listed and traded on the NSE and the BSE.
Our equity shares are beneficially held by the Twin Star, Finsider, Welter Trading, Vedanta Holdings Mauritius Limited, Vedanta Holdings Mauritius II Limited and Vedanta Netherlands Investments B.V., which are in turn wholly-owned subsidiaries of Vedanta. Twin Star, Finsider, Welter Trading, Vedanta Holdings Mauritius Limited, Vedanta Holdings Mauritius II Limited and Vedanta Netherlands Investments B.V. held 46.4%, 4.40%, 1.0%, 2.9%, 13.3% and 1.7%, respectively, of our share capital as of July 15, 2022.
SIIL was incorporated in Kolkata, the state of West Bengal, India as Rainbow Investment Limited on September 8, 1975, under the laws of India. SIIL’s name was subsequently changed to Sterlite Cables Limited on October 19, 1976, and then to SIIL on February 28, 1986.
SIIL acquired a 51.0% interest in BALCO from the GoI on March 2, 2001. The exercise of our call option to purchase the remaining 49.0% of the shareholding of GoI in BALCO is still under dispute.
On April 11, 2002, SIIL acquired, through Sterlite Opportunities and Ventures Limited (“SOVL”), a 26.0% interest in HZL from the GoI and a further 20.0% interest through an open market offer. On November 12, 2003, SIIL acquired through SOVL, a further 18.9% interest in HZL following the exercise of a call option granted by the GoI, increasing SIIL’s interest in HZL to 64.9%. In addition, SOVL has a call option which became exercisable on April 11, 2007, to acquire the GoI’s remaining ownership interest in HZL. The exercise of this option has been contested by the GoI and is still under dispute. As per the order of the High Court of Madras dated March 29, 2012, SOVL merged into SIIL.
In 2007, Vedanta, through its subsidiaries, acquired 51.0% of Sesa Goa from Mitsui Co. Limited which was subsequently increased to 55.13% by fiscal year 2013. Sesa Goa was incorporated as a private company under the laws of India in Panaji, state of Goa, India on June 25, 1965, as Sesa Goa Private Limited. It became a public limited company following a public offering of its shares in 1981. On December 8, 2011, Sesa Goa along with its subsidiary Sesa Resources Limited, completed the acquisition of 20.1% of the equity share capital of Cairn India Limited (now Vedanta Limited - oil and gas business). Prior to the Cairn India Merger with Vedanta Limited, we had a total ownership interest of 59.89% in Cairn India Limited (now Vedanta Limited - oil and gas business) (including equity interests held through its other subsidiary, TMHL)
35
On February 25, 2012, an
all-share
merger of Sesa Goa and SIIL to create Sesa Sterlite was announced to give effect to the consolidation and simplification of corporate structure through two series of transactions (together the“Re-organization
Transactions” consisting of the “Amalgamation andRe-organization
Scheme” and the “Cairn India Consolidation”). Pursuant to the share purchase agreement dated February 25, 2012, between BFL, a wholly owned subsidiary of Sesa Goa and VRHL, BFL acquired 38.7% shareholding in Cairn India Limited (now Vedanta Limited - oil and gas business) and an associated debt of $ 5,998 million by way of acquisition of TEHL, for a nominal cash consideration of $ 1 (“Cairn India Consolidation”).On March 2, 2012, Sesa Goa acquired 100.0% of the equity share capital of Goa Energy Private Limited engaged in the business of power generation fromVideocon Industries. The name was subsequently changed to Goa Energy Limited on January 4, 2013.
On August 19, 2013, Sesa Goa furnished to the Securities and Exchange Commission a notice, as required under Rule
12g-3(f)
under the Securities Exchange Act of 1934, as amended (“Exchange Act”) which provided that Sesa Goa was the successor issuer to SIIL under the Exchange Act. TheRe-organization
Transactions were made effective in the month of August 2013. In accordance with theRe-organization
Transactions:| i. | SIIL merged with and into Sesa Goa through the issue of Sesa Goa shares to SIIL shareholders (other than MALCO) on a 3 for 5 basis resulting in the issue of 1,944,874,125 Sesa Goa shares to SIIL shareholders. The holders of SIIL ADSs received 3 Sesa Goa ADSs for every 5 existing SIIL ADSs. The outstanding convertible bonds of SIIL have become convertible bonds of Sesa Goa with equivalent rights and obligations; |
| ii. | MALCO’s power business was sold to Vedanta Aluminium for cash consideration of ₹ |
| iii. | MALCO merged with and into Sesa Goa through the issue of Sesa Goa shares to the shareholders of MALCO on a 7 for 10 basis, resulting in the issue of 78,724,989 Sesa Goa shares to the shareholders of MALCO and therefore MALCO’s holding in SIIL was cancelled; |
| iv. | Sterlite Energy merged with and into Sesa Goa for no consideration; |
| v. | Vedanta Aluminium’s aluminium business merged with and into Sesa Goa for no consideration; and |
| vi. | Through a separate but concurrent amalgamation under Indian and Mauritian law, Ekaterina Limited, a Mauritian company and a wholly owned subsidiary of Vedanta which held Vedanta’s 70.5% ownership interest in Vedanta Aluminium, merged with and into Sesa Goa. SIIL held the remaining 29.5% of the shares of Vedanta Aluminium and upon this concurrent amalgamation scheme becoming effective, Vedanta Aluminium became a wholly-owned subsidiary of Sesa Sterlite. |
Further, the notice provided that the equity shares of Sesa Goa with a par value of 1 each, would be traded in the United States in the form of ADSs, where each ADSs would represent four equity shares of Sesa Goa and such ADSs would be deemed to be registered under Section 12(b) of the Exchange Act by operation of Rule
₹
12g-3(a)
under the Exchange Act. The ADSs of Sesa Goa were registered for trading on the NYSE on September 13, 2013.Pursuant to the Amalgamation and
Re-organization
Scheme effective on August 17, 2013, our name changed to Sesa Sterlite Limited with effect from September 18, 2013. On September 23, 2013, Sesa Goa submitted to the SEC that the name of Sesa Goa Limited was changed to Sesa Sterlite Limited following the approval from the Registrar of Companies, state of Goa on September 18, 2013. Subsequent to the effectiveness of theRe-organization
Transactions, a SLP challenging the orders of the High Court of Bombay at Goa was filed by the Commissioner of Income Tax, Goa and the Ministry of Corporate Affairs at the Hon’ble Supreme Court. Further, a creditor and a shareholder have challenged the Amalgamation andRe-organization
Scheme in the High Court of Madras. These petitions are pending for hearing and admission.With effect from August 26, 2013, TEHL, TMHL and Cairn India Limited (now Vedanta Limited - oil and gas business) (including all of its subsidiaries) became subsidiaries of Sesa Goa pursuant to the Cairn India Consolidation. As a result, Sesa Sterlite held 58.8% of the total shareholding of Cairn India Limited (now Vedanta Limited - oil and gas business) as of August 26, 2013. As of March 31, 2016, the Company held 59.9% of the total shareholding of Cairn. During fiscal year 2015, Goa Energy Limited and Sterlite Infra Limited, wholly owned subsidiaries, merged with the Company. The High Court of Bombay had approved the scheme of amalgamation of the Goa Energy Limited on March 12, 2015, and the High Court of Madras had approved the Scheme of Amalgamation of Sterlite Infra Limited on March 25, 2015.
On April 22, 2015, Sesa Sterlite Limited submitted to the SEC regarding the name change to Vedanta Limited following the approval from the Registrar of Companies, Goa on April 21, 2015.
36
On June 14, 2015, the Company announced the merger of Cairn India Limited (now Vedanta Limited - oil and gas business) with the Company by way of a Scheme of Arrangement (the “Cairn India Merger”). Thereafter on July 22, 2016, the Company and Cairn India Limited (now Vedanta Limited - oil and gas business) announced the revised terms to the Cairn India Merger. The NCLT, Mumbai Bench approved the Cairn India Merger and their respective shareholders and creditors on March 23, 2017. Thereafter, the board of directors of the Company made the Cairn India Merger operative on April 11, 2017. As per the revised terms of the Cairn India Merger, the Company issued one equity share of face value 1 each and four 7.5% Redeemable Preference Shares in the Company with a face value of 10 each to the
₹
₹
non-controlling
shareholders of Cairn India Limited (now Vedanta Limited - oil and gas business) business for each equity share held. No shares were issued to the Company or any of its subsidiaries for their shareholding in Cairn India Limited (now Vedanta Limited - oil and gas business). The Company continues to be listed on the BSE and NSE.Cairn India Limited (now Vedanta Limited - oil and gas business) business shareholders who became the shareholders of the Company, also received an interim dividend of 17.70 per equity share as approved by the board of the Company on March 30, 2017.
₹
On December 28, 2017, the Company acquired 51.6% equity shares in ASI, a Japanese manufacturer of LCD glass substrate for a cash consideration of 1 million ($ 0.01 million) and acquired debts for 9,640 million ($ 139 million). Additionally, a loan of 460 million ($ 7 million) was extended to ASI in fiscal year 2018.
₹
₹
₹
Vedanta Limited completed the acquisition of Electrosteel Steels Limited along with its integrated steel plant on June 4, 2018. The said name was changed from Electrosteel Steels Limited to ESL Steel Limited with effect from September 26, 2020. ESL primarily caters to the construction, infrastructure, and automotive sectors in India with its wire rod, TMT and DI pipe products. Since acquisition, Vedanta Limited has been able to transform the performance of ESL in a short period of time, increasing Earnings Before Interest, Taxes, Depreciation and Amortization, Impairment, and other items (“EBITDA” or “Segment profit”) as defined in note 5 “Segment information of Notes to the Consolidated Financial Statement” 2 times in FY 2022 compared to FY 2018. EBITDA is segment profit which is fully discussed in “Item 5. Operating and Financial Review and Prospects”.
Furthermore, Vedanta Limited acquired the assets of Sindhudurg unit of Global Coke Limited on July 28, 2019, which provided backward integration opportunity for the Company’s existing pig iron division and increased the Company’s footprint in met coke market in southwestern part of India.
On September 21, 2020, Vedanta Limited acquired 100% control over Ferro Alloys Corporation Limited (“FACOR”). FACOR is a company in the business of producing Ferro Alloys and owns a ferro chrome plant with a capacity of 80,000 TPA, two operational chrome mines and 100 MW of captive power plant through its subsidiary, FACOR Power Limited (“FPL”).
Vedanta Limited has also successfully turned around the acquisitions in the past including Hindustan Zinc Limited and BALCO as briefly detailed below: -.
| • | Vedanta Limited transformed Hindustan Zinc Limited (HZL) to world’s second largest zinc-lead miner. The established reserves and resources stood at 448 MT in FY 2022 up from 146 MT in FY 2004. Since acquisition by Vedanta Limited, HZL’s revenues have increased to₹ ₹ |
| • | Post-acquisition, BALCO revenue increased to ₹ ₹ |
During the Fiscal Year 2022, the following events took place:
1. | Acquisition of assets of Bhachau and Khambhalia coke manufacturing units of Gujarat NRE Coke Limited |
Vedanta Limited strengthened its position in the Met Coke sector with the acquisitions of assets of Gujarat NRE Coke Limited which were in Liquidation under the Indian Bankruptcy Code (IBC). This acquisition will complement our existing iron ore business via backward integration through provision of the Met Coke requirement to our existing facilities. The total capacity of Bhachau and Khambalia plants in Gujarat is ~1MTPA. Acquisition was implemented by Vedanta’s direct wholly owned subsidiary Malco Energy Limited.
2. | Acquisition of assets of Nicomet Industries Limited |
Vedanta Limited acquired assets of Nicomet Industries Limited, a leading Nickel and Cobalt producer based in Goa, which was also in Liquidation under IBC. With this acquisition, Vedanta has become India’s sole and largest producer of Nickel, which is widely used in batteries of electric vehicles. This acquisition was also implemented by Malco Energy Limited.
3. | Acquisition of Desai Cement Company Private Limited |
Vedanta Limited via its indirect wholly owned subsidiary Sesa Mining Corporation Limited (SMCL), acquired Desai Cement Company Private Limited (DCCPL), a cement manufacturing plant based out of Goa. The acquisition was made under ‘Waste to Wealth’ theme to utilize slag from our Goa plants for the manufacturing of cement, thereby not only reducing waste but also generating value.
37
4. | Voluntary open offer |
VRL (the Acquirer) together with Twin Star Holdings Limited (“PAC 1”), Vedanta Holdings Mauritius Limited (“PAC 2”) and Vedanta Holdings Mauritius II Limited (“PAC 3” together with PAC 1 and PAC 2 to be referred as “PACs”), in their capacity as the persons acting in concert announced a voluntary open offer in accordance with Securities and Exchange Board of India (Substantial Acquisition of Shares and Takeovers) Regulations, 2011, as amended (“SEBI (SAST) Regulations”), for the acquisition of up to 371,750,500 equity shares, representing 10% of the voting share capital of Vedanta Limited at a price of 160 per equity share of Vedanta Limited. In terms of Regulations 18(4) and 18(5) of the SEBI (SAST) Regulations, the Acquirer and PACs further decided to: (a) increase the number of Equity Shares to be acquired in the Open Offer to up to 651,000,000 equity shares, representing 17.51% of voting share capital of Vedanta Limited; and (b) increase the offer price to 235.00 (Indian Rupees Two Hundred Thirty-Five) per equity share including interest of 1.29 per equity share. Total consideration for the offer is approximately 153,000 million ($ 2,092 million). In accordance with the SEBI (SAST) Regulations, the date of commencement of the tendering period (“Offer Opening Date”) was Tuesday, March 23, 2021, and date of closure of the tendering period (“Offer Closing Date”) was April 7, 2021. The details relating to the Offer are set out in the final letter of offer made available on SEBI’s website (www.sebi.gov.in).
₹
₹
₹
₹
In continuation to the updates regarding the Open Offer, the Acquirer issued a press release dated April 14, 2021, that 374,231,161 equity shares of VEDL have been validly tendered in the voluntary Open Offer. Following this acquisition, the shareholding of the Acquirer in VEDL has increased from 55.1% to 65.2%.
Our Form
20-F
and other filings can be viewed on our website atwww.vedantalimited.com as
well as the SEC website atwww.sec.gov
.5. | Further acquisition of shareholding in Vedanta Limited |
Post the aforesaid voluntary open offer above, the acquirer and PACs have acquired 167,500,000 equity shares of the Company representing 4.51% of fully diluted voting share capital, through a block deal on the stock exchanges thereby increasing acquirer’s indirect shareholding in the Company from 65.2% to 69.7%.
6. | Delisting from New York Stock Exchange |
The ADS of the Company have been delisted from NYSE effective close of trading on NYSE on November 8, 2021. This follows the filing done by the Company of Form 25 with SEC on October 29, 2021. As a consequence of the delisting becoming effective, the Deposit Agreement under which the ADS were issued (the “Deposit Agreement”) was terminated at the close of trading on NYSE on November 8, 2021. Further, the Company will continue to be subject to reporting obligations under the U.S. Securities Exchange Act of 1934 until such time as it can terminate its registration under the Exchange Act.
The Company’s equity shares continue to be listed on BSE and NSE in India.
7. | Scheme of Arrangement |
The Board of Directors of the Company, basis the recommendations of the Audit and Risk Management Committee and Committee of Independent Directors of the Company, at its meeting held on October 29, 2021 approved the Scheme of Arrangement between the Company and its shareholders under Section 230 and other applicable provisions of the Companies Act, 2013 (“Act”) (“Scheme”). The Scheme inter alia provides for capital reorganization of the Company, whereby it is proposed to transfer amounts standing to the credit of the General Reserves to the Retained Earnings of the Company with effect from the Appointed Date, as defined. The Scheme is subject to receipt of regulatory approvals/ clearances from the National Company Law Tribunal, Mumbai Bench, SEBI (through BSE Limited and National Stock Exchange of India Limited), BSE Limited and National Stock Exchange of India Limited (collectively referred to as “Stock Exchanges”) and such other approvals/ clearances as may be applicable.
Pursuant to the Scheme, the Company will possess greater flexibility to undertake capital related decisions and reflect a much efficient balance sheet of the Company. The Scheme is in the interest of all stakeholders including public shareholders.
Update and documents on the aforesaid Scheme is available on the Company’s website at
https://www.vedantalimited.com/Pages/SchemeArrangement.aspx
38
B. Business Overview
OUR INDUSTRY
Unless otherwise indicated, all data relating to the zinc industry contained in this Annual Report is primarily derived from Wood Mackenzie. Unless otherwise indicated, all data relating to the aluminum industry contained in this Annual Report is primarily derived from CRU Aluminum Market Outlook (“CRU”). Unless otherwise indicated, all data relating to the oil and gas industry contained herein is primarily derived from US Energy Information Administration. Unless otherwise indicated, all data relating to the iron ore industry contained herein is primarily derived from the Resources and Energy Quarterly. Unless otherwise indicated, all data relating to the steel industry contained herein is primarily derived from the World Steel Association and Joint Plant Committee.
Unless otherwise indicated, all financial and statistical data relating to the power industry in India in this Annual Report is derived from the research presentations of National Power Portal and Central Electricity Authority. The data may have been
re-classified
for the purpose of presentation.Unless otherwise stated, the years mentioned in this disclosure contained herein are calendar years.
MARKET REVIEW
Global Economy and Commodity Markets
After contracting sharply by
-3.34%
inpandemic-hit
CY 2020, the world economy is estimated to have grown 5.8% in CY 2021 - the strongest post-recession recovery over more than last eight decades, as per World Bank. The International Monetary Fund (IMF) also estimated a global economic growth of 6.1% in CY 2021, driven by the widespread vaccination drive across countries and policy support to counter the socio-economic impact of the pandemic. With countries relaxing lockdowns, demand for goods and services too received a boost, leading to a sharp uptick in global trade. Notwithstanding logistical bottlenecks, global trade reached a record level of about US$ 28.5 trillion in CY 2021, nearly 25% higher than CY 2020, and a close to 13% increase over thepre-pandemic
level of CY 2019.However, new mutations of the coronavirus caused fresh outbreaks in CY 2021, leading to mobility disruptions. A slowdown in industry operations, port lockdowns, shortage in shipping containers, unfavourable weather conditions, and backlogs affected global trade. Together, these factors hindered global recovery and created a supply-demand mismatch. Rising inflation, driven by supply side constraints, labour market factors, and high commodity prices, created a challenge for governments and industries across countries.
The geopolitical tension between Ukraine and Russia has created a setback in the global recovery. Commodity prices reached all time high and likely to remain uncertain in the short term. Supply chain disruption intensified further due to the ongoing war. According to IMF, global growth is expected to slow significantly in CY 2022 to 3.6% from the earlier projections of 4.4%.
Country-wise growth prospects
The US economy witnessed a growth of 5.7% in CY 2021, the highest since 1984, indicating its resilient recovery. Generous fiscal stimulus packages have aided this economic recovery but also created challenges like high inflation, which is at a
40-year
high due to the supply-demand mismatch and labour shortage. IMF has downgraded the growth prospect of US economy for calendar year 2022 to 3.7% driven by the tightening of the policy to control inflation and the trade disruption fuelled by the Ukraine Russia crisis.The Chinese economy started CY 2021 on a strong note with the resurgence in global and domestic demand but witnessed challenges in the second half of the year. Disruptions in the real estate sector, the power sector crisis and its impact on industrial production, and the government’s strict Zero-COVID strategy enhanced uncertainties and dampened growth. Low private consumption, withdrawal of private investments and slump in production and economic activities due to the COVID protocols, have had a cascading effect on the economy and impeded its growth prospects in CY 2022. The growth prospect of China has been revised down to 4.4% in CY 2022 due to the war affected external demand disruption and stringent COVID protocols.
European Union witnessed record growth in the first half of CY 2021, following resurgence of domestic demand, modest consumer spending and healthy growth in public and private investment. Rise in
COVID-19
infections, high energy prices, particularly that of natural gas, supply chain disruptions together with geopolitical tension between Ukraine and Russia impacted Europe’s economic recovery, leading to uncertainties. The European Commission estimates annual inflation to reach 6.8% in CY 2022. Inflation in EU rose 8.8% in May 2022, mainly driven by supply bottlenecks, high energy prices in the short-term and worsening of the standoff between Ukraine and Russia. Overall, despite challenges caused by supply-chain disruption and high inflation, most economies witnessed modest growth in 2021 due to the low base effect and recovery in economic activities.39
Globally, governments and central banks have been vigilant about their strategies to counter inflation given that the factors involved are different from those causing regular cyclical inflation. Among the global economies, the US witnessed a sharp spike in inflation, which reached 8.6% on abasis in May 2022, the highest in four decades. The US Federal Reserve has raised increase interest rates by 150 basis points (1.5 percentage points) since March 2022 and is expected to increase multiple times in CY 2022 to counter the rising inflation. It also believes that sufficient time has been provided for the economy to recover from the pandemic. The European Central Bank has decided to end net asset purchases under the Pandemic Emergency Purchase Program (PEPP) from the third quarter of CY 2022.
year-on-year
The World Bank expects the global economy to decelerate to 2.9% in CY 2022 as a result of continuing pandemic-related uncertainties, diminishing fiscal support from governments and supply chain bottlenecks . Global merchandise trade is projected to slow down to 3% in CY 2022 as per World Trade Organisation (“WTO”).
Opportunities for the Company
The commodity market is expected to face frequent fluctuations until the supply chain disruption is brought under control and demand growth sustains. Commodity prices are expected to remain elevated in CY 2023 due to high energy prices, resultant production cut in some parts of the world, particularly Europe and supply chain disruptions. But the outlook remains cautious amid possibility of the removal of monetary support in the major economies as well as spread of new variant of the
Covid-19
virus.We believe our diversified commodity portfolio and relentless emphasis on reducing costs and digital implementation position us well to take advantage of the expected increase in demand and the resulting improvement in commodity prices.
The Indian Economy
After the downslide in CY 2020, the Indian economy recovered resiliently in CY 2021, supported by the largest vaccination drive in the world. Compared to a contraction of 6.6% in FY 2021, the Indian economy is expected to grow by 8.7% in FY 2022, as per the Provisional Estimates of National Income of the National Statistical Office (NSO) of India.
The manufacturing sector saw healthy growth of 9.9% in FY 2022, with the Purchasing Managers’ Index (PMI) remained in the expansionary zone (i.e., above 50) levels since June 2021 despite the challenges caused by the second wave of the pandemic. The service sector is also expected to grow by 8.4% in FY 2022 as steady recovery has been observed in service PMI since August 2021. The strong support provided by the government’s stimulus packages, increased infrastructure spending and an accommodative monetary policy of the Reserve Bank of India (RBI) have assisted India to sustain its economic recovery.
India registered highest ever merchandise exports of $421.89 billion in FY 2022, which is 44.6% higher than FY 2021 and 34.6% more as compared to exports made in FY 2020. Indian exporters were able to take the advantage of global supply disruptions and high commodity prices in the global export market in FY 2022. With signing of new Free Trade Agreements (FTA) with countries like UAE and Australia and upcoming FTAs with UK, Canada, Israel, EU etc. which are in different stages of negotiations, coupled with PLI schemes, India has set the target of $1 trillion of export of merchandise from India by 2030.
Consumption scenario in India, as indicated by Private Final Consumption Expenditure (PFCE) and Government Final Consumption Expenditure (GFCE) improved in FY 2022 from previous year by 17.1% and 10.1%, respectively, though their shares in GDP were down (PFCE: 59.6% in FY 2022 vs. 60.8% in FY 2021; GFCE: 11.1% in FY 2022 vs. 12.1% in FY 2021). Overall investment scenario in India, as measured by Gross Fixed Capital Formation (GFCF), improved from 26.6% of GDP in FY 2021 to 28.6% of GDP in FY 2022. This was mainly backed by continued capital expenditure by government which grew by 39.3% in FY 2022, on the back of 26.8% in FY 2021 during April-February period.
Improved economic activity in FY 2022 was also reflected by massive rise in GST collection which grew by 30.8% in FY 2022 to 14,87,313 crore.
₹
Non-food
credit growth also accelerated for FY 2022 to 8.7% as compared to 5.5% during the last year.However, India’s inflation rate as measured by Consumer Price Index (CPI) remained high in FY 2022, briefly dipping in September 2021 before ending the financial year at 6.95% in March 2022, breaching the upper tolerance limit of 6%. High energy prices, particularly crude oil prices, drove the Wholesale Price Index (WPI) to second highest level since 2004. As many countries have already started considering reversing their pandemic-time expansionary monetary policy by taking a more hawkish stance, the Reserve Bank of India has also increased interest rates by 90 basis points to raise the policy Repo Rate to 4.9% to control inflation.
40
Policy Initiatives by Indian Government
The GoI has taken various initiatives to make the country a global hub of manufacturing and become globally competitive. For example, government has rolled out the PLI scheme with an outlay of 1.97 lakh crore for 13 sectors. The scheme provides incentives based on the sales value and differential incentive slabs, which is targeted to make India’s domestic manufacturing sector globally competitive, reduce import bills, enhance domestic capacity and export and create as many as 1 crore additional jobs. The National Master Plan of PM GatiShakti is another initiative that is targeted to ensure seamless connectivity for the movement of people, goods and services from one mode of transport to other, providing last-mile connectivity of infrastructure and reducing travel time for people. This will be achieved through integrated inter-ministerial planning and coordination for infrastructure connectivity projects, under a digital platform.
₹
The National Monetization Pipeline (NMP) again is another initiative which is expected to help efficiently manage public assets and provide benefits to the common public. With a monetisation potential of 6 lakh crore through the utilisation of core assets of the government over FY
₹
2022-2025,
it is projected to bring private investments to provide universal access to high quality and affordable infrastructure to citizens by unlocking the value of investments in brownfield public sector assets.Many initiatives have also been introduced to facilitate ease of doing business in India. The National Single Window System (NSWS) provides a single platform to enable investors to identify and obtain approvals and clearances needed in India. NSWS will, in effect, help realise the vision of Atmanirbhar Bharat by not only giving easy access to information about schemes like Make in India, the PLI scheme,
Start-up
India, etc. but also handholding the investor through the processes in a transparent manner.Remission of Duties and Taxes on Export Products (“RoDTEP”) has been introduced to enable refund of currently
un-refunded
duties/taxes/levies on the production and distribution of the exported product at the central, state and local level. This is expected to encourage domestic players to expand business internationally. Although certain industries like iron and steel, pharma, chemicals etc. were left out of the scheme and certain categories of exports like Products manufactured or exported by 100% EOU, FTZ, EPZ, SEZ or Products manufactured partly or wholly in a bonded warehouse etc. were excluded from the benefit, government reserves the right to modify any of the categories or industries for inclusion or exclusion under the scope of RoDTEP at a later date based on the recommendations of the RoDTEP Committee.Amendments in the Mineral Conservation and Development (Amendment) Rules and the Minerals (Other than Atomic and Hydro Carbons Energy Mineral) Concession Rules also contribute to the ease of doing business for mining.
All such initiatives are likely to support Indian economy get back to strong growth trajectory and expand demand for mineral, metal and fuels.
Outlook
Although the Indian economy made a smart comeback in FY 2022, it is likely to face some headwind in FY 2023 due to geopolitical tensions, high commodity prices, supply chain bottlenecks, threat of surging
Covid-19
cases and global slowdown. Current crisis between Ukraine and Russia and the consequent surge in crude oil and other commodity prices has triggered a round of downward revisions in India’s real GDP growth projections by various agencies. The Reserve Bank of India (RBI) in April 2022, revised down its GDP growth projection for FY 2023 to 7.2% from its earlier projection of 7.8%.The RBI attributed the downward revision in its growth outlook to several factors including escalation of the geopolitical situation and the accompanying surge in international crude oil and other commodity prices, tightening of global financial conditions, persistence of supply-side disruptions, significantly weaker external demand and uncertainties about the pace of monetary policy normalisation in major advanced economies.
The World Bank in June, 2022 trimmed down India’s GDP forecast for FY 2023 to 7.5% from 8.7% estimated in January, 2022, while IMF also followed the same by reducing the forecast to 8.2% from earlier 9%, citing worsening supply bottlenecks, higher oil prices which are expected to weigh on private consumption and investment and rising inflation risks caused by Ukraine Russia crisis.
OPPORTUNITIES FOR VEDANTA LIMITED
India-focused growth agenda
Despite challenges in the global economy due to
COVID-19,
India continues to fight back with its one of the largest vaccination drives in the world and resilient domestic consumption. The country’s economic growth is supported by a sound fiscal policy framework, strong regulatory mechanism, wide-ranging structural reforms undertaken by the GoI and states.We expect India will continue to exert the economic growth in fiscal year 2022 with the appropriate measure taken by the GoI amid escalating global inflation and
geo-political
issues.41
Going forward, we expect India to focus on the domestic growth through infrastructure development and effective utilization of these new and existing infrastructures. GoI’s vision to focus on the laying the foundation for the blueprint of Amrit Kaal, the next 25 years till 100 years of India’s independence, aiming at improving the quality of life of its people, big public investment for infrastructure, enhancement of productivity, transition to green energy, climate action and financing of investments. Big public investment for modern infrastructure to make ready India at 100 years of independence will help in accelerating the growth of the economy and is expected to make India and Indian businesses globally competitive. The policy reforms by Indian government will create direct or indirect investment and business opportunities for Vedanta Limited and improve demand for the products of Vedanta Limited in the country. Some of such reform agenda are discussed as below.
Policy Supports
| 1. | Economic Relief Package COVID-19 PandemicCOVID-19 pandemic during Q1 of FY 2021- 2022. In order to support the Indian economy, the Ministry of Finance introduced a relief package of₹ |
| a) | Economic Relief from Pandemic: Providing financial support to the most affected sectors like health, travel and tourism, NBFC-MFIs etc. through loans at affordable rates and loan guarantees, the extension of Aatma Nirbhar Bharat Rozgar Yojna and support under Pradhan Mantri Garib Kalyan Yojna. |
| b) | Strengthening Public Health: More than ₹ |
| c) | Impetus for Growth and Employment: 8 schemes are announced supporting agriculture in the form of additional subsidy on fertilizers, export risk cover, digitalization of India, manufacturing and power sector. |
| 2. | Amendments in Mineral Auction Rule and Mineral Evidence Rules |
| 3. | Amendments in Minerals Concession Rules: |
| a. | Allowed sale of 50% of mineral produced from the captive leases, after making additional payments. |
| b. | Allowed disposal of overburden/ waste rock/ mineral below the threshold value, generated during the mining activity. |
| c. | Allowed part surrender of mining lease areas. |
| d. | Allowed transfer of composite license or mining lease of all types of mines. |
| e. | Interest on delayed payments revised from existing 24% to 12% |
| f. | Rationalized of penalty provisions. |
| 4. | Product Fiscal Support for Development of Semiconductors and Display Manufacturing: ₹ |
The schemes will provide support to the companies associated with silicon semiconductor fab, display fab, compound semiconductors/silicon photonics/sensors (including MEMS) fabs, semiconductor packaging (ATMP / OSAT), semiconductor design.
Scheme for Display Fab
₹
₹
₹
Vedanta Limited has been actively pursuing to set up semiconductor and display manufacturing units in India and take the advantage of the supports formulated by the government.
42
| 5. | National Monetisation Pipeline: 2021-2022, NMP estimates aggregate monetisation potential of₹ |
Currently, assets and infrastructure under the central government line ministries and Central Public Sector Enterprise in infrastructure are being considered. The pipeline does not include monetization proposals through disinvestment or programs linked to
no-core
assets. Rights for the identified assets will be leased to the private sector for a tenure of40-50
years. However, ownership of the assets shall continue to remain with the concerned public entity.| 6. | PM Gati Shakti National Master Plan (NMP): |
The plan will increase the efficiency and effectiveness of the public projects and will accelerate the project development.
| 7. | Trade Agreements with UAE and Australia: |
India’s Real GDP Growth Projections
In spite of that, India is projected to be the fastest growing major economy in the world in 2022 and 2023, with IMF estimating its GDP growth to be 8.2% in 2022 and 6.9% in 2023.
The economic growth of India is supported by strong thrust on physical and health infrastructure building. In the Union Budget for FY 2023 outlay for capital expenditure sharply increased by 35.4% from 5.54 lakh crore in FY 2022 to 7.50 lakh crore in FY 2023. The capex provision for FY 2023 is projected to be 2.9% of GDP and more than 2.2 times the expenditure of FY 2020. Along withto States for creation of capital assets, the ‘Effective Capital Expenditure’ of the Central Government is estimated at 10.68 lakh crore in FY 2023, which is likely to be around 4.1% of GDP.
₹
₹
Grants-in-Aid
₹
Government has also envisaged to expand the National Highways network by 25,000 km, complete 80 lakh houses for the identified eligible beneficiaries of PM Awas Yojana and provide tap water to 3.8 crore households under Har Ghar, Nal Se Jal project in 2022-2023.
In the quarter ended March 2022, India witnessed a big increase in new investment proposals. 660 new project proposals with an investment of 5.1 trillion to create new productive capacities were recorded during the quarter. This is big compared to the average of 3.1 trillion worth of new investment projects that were recorded during the preceding three quarters.
₹
₹
Demand for bank credit has also picked pace in the last few months. Outstandingat 8.7% in FY 2022. The growth accelerated further to 12.6% in May, 2022.
non-food
credit disbursed by scheduled commercial banks (SCBs) was growingyear-on-year
India’s health infrastructure is also much better equipped to face new waves of
Covid-19
cases and accelerated vaccination drive has made Indian economy resilient for fresh shock.With government’s focus on self-reliant India backed by supports like PLI scheme and infrastructure spending, Indian economy is likely to healthy growth which will also auger well for metals, mineral and energy sectors.
43
1. | Zinc |
Overview
The financial year started with growing worries about inflation, and a slightly less dovish tone from the US Federal Reserve, hit zinc prices in Q1 FY 2022. The news rattled financial markets and also prompted profit taking in metal markets. The decline in the zinc price and the other metals was given added impetus by the strengthening of the dollar and confirmation that China’s State Reserve Bureau will start selling parcels of metal, zinc included, in the Q2 FY 2022. However, the zinc price subsequently recovered some of its lost ground.
The zinc market had been bracing itself for smelter disruption since October 2021, when high energy prices and carbon emission taxes in Europe prompted some smelters to reduce output at a time of peak power costs. However, significant cutbacks are yet to materialise and zinc’s price has retreated from its year high (LME) of $3,800/t and above. Even though there is still no real evidence of sizeable smelter cutbacks, premiums for spot refined metal in all regions have increased while annual contract premium offers in Europe and the US for CY 2022 are more than double that of CY 2021.
Global Scenario
Despite the Ukraine Russia crisis impacting many commodities markets, zinc market is mostly stable given that Ukraine is of modest importance as a zinc consumer. Its ~20 Kt per annum of zinc consumption is largely supplied by Kazzinc. With Ukraine’s 500 Kt of continuous galvanizing capacity being idled amidst the conflict, the zinc normally destined for the country will be readily
re-directed
into the tight refined markets in other parts of the world.Global zinc consumption growth is likely to slow from the 7.1% in CY 2021 to 2.3% in CY 2022 and average 1.7% during CY 2023 and CY 2024 as global government’s switch focus from job creation to
de-carbonisation
and infrastructure. Compared with zinc’s recentpre-pandemic
history, this is still a robust growth rate, sufficient to lift consumption to 14.5 Mt, and thus surpassing the 2017all-time
high of 14.2Mt. In CY 2023 and CY 2024, the pace of growth is projected to moderate further with average growth of 1.7% pa or approximately 250 Kt per annum, lifting consumption to just under 15 Mt.Majority of the growth is likely to be driven by investments in infrastructure and other forms of construction in the developing regions, especially Asia, as opposed to developed nations that have matured. Demand in Asia is expected to grow at an average of 1.8% during this period. China is expected to remain the largest market contributing to over 70% of the increased global zinc consumption, despite a sharp slowdown in its real estate construction.
Market and opportunities
Every year, India loses approximately 3 to 4% of GDP due to corrosion and Indian industries have now slowly started recognizing this fact, leading them to actively seek solutions. In the construction sector, the need for corrosion protection rebars has recently been picked by few domestic rebar manufacturers who are working in collaboration with the International Zinc Association (IZA) to bring continuous galvanized rebar plant in India. Indian Railways, considering safety and longevity of rail tracks and are working on different mechanisms to protect the web area of rail from corrosion.
Zinc thermal metallization which has been considered globally as the best method to prevent corrosion of railway tracks is proposed to be soon adopted in India.
Galvanizing has been the key driving force of zinc demand mainly in construction and infrastructure and automobiles. The 1,18,101 crore (equivalent to 1,181,010 million) allotment for Ministry of Road transport and highways will boost zinc consumption for road crash barriers and galvanized steel bridges. Also, we expect the 100% electrification of broad-gauge railway routes to be completed by December 2023 will contribute towards zinc demand in India as electrification in railways requires galvanization of electric monopoles.
₹
₹
Products and customers
HZL is the largest primary zinc producer in India with an estimated 83% market share in primary market and 80% including all form of zinc in FY 2022, according to the International Zinc Association. Around 65% of the refined zinc produced by oursold in the domestic market, and the rest is being exported to South-East Asia, Middle East and other global market. Over 65% of zinc demand comes from galvanising steel, predominantly used in the construction and infrastructure sectors. We also produce Continuous Galvanising Grade (“CGG”), SHG in Jumbo forma and two grades of zinc alloys for use in
smelters is
die-casting.
We are working closely with our customers and enhancing our zinc product portfolio in terms of value-added products (“VAP”). Our focus is to increase the supply of VAP to 25% of total zinc sales in fiscal year 2023 from 20% in fiscal year 2022.44
2. | Oil and Gas |
India’s Oil Demand expected to decline in the short run amid
COVID-19
The
COVID-19
pandemic remains the overarching concern in the global economy. ContinuedCOVID-19
flare-ups
and lingering supply bottlenecks are likely to have an impact on the growth of the global economy. The oil prices soared past $100, surging over 7% for the first time in more than seven years after Russian Government announced a military operation in Ukraine.India’s fuel consumption showed flattish growth due to fresh restrictions to control the surge of a new variant of coronavirus. Further, as the economy continued to rebound from the deep impact of the second wave, the rise in demand for transport fuel was negated by a fall in industrial fuel. As per Petroleum Planning and Analysis Cell, the overall domestic consumption of petroleum products in India has grown by 4.3% from 194.3 mmt during the period April 2020 - March 2021, to 202.7 mmt, during the period April 2021 - March 2022.
Oil and gas projects have resumed as downstream demand is steadily recovering. The seventh bid round under the OALP was conducted recently.
Products and customers
Vedanta Limited is the largest private sector producer of crude oil in India. Our crude is sold to hydrocarbon refineries and our natural gas is used by the fertiliser industry and the city gas sector in India.
Market drivers and opportunities
As per International Energy Agency (“IEA”) April 2022 outlook, world oil demand is now expected to average 99.4 mb/d in CY 2022, up by 1.9 mb/d from CY 2021.
Global oil supply rose in March 2022 by 450 kb/d to 99.1 mb/d, led by
non-OPEC+.
Despite the disruption to Russian oil supplies, lower demand expectations, steady output increases from OPEC+ members along with the US and other non OPEC+ countries, and massive stock releases from IEA member countries should prevent a sharp deficit from developing.Global oil inventories have decreased for 14 consecutive months, with February stocks 714 mb below the
end-2020
level and OECD countries accounting for 70% of the decline. OECD total industry stocks fell by 42.2 mb to 2611 mb in February 2022, nearly double the seasonal trend.In March 2022, output from the OPEC+ alliance’s members with quotas was up by a mere 40 kb/d, far below the planned 400 kb/d increase, and 1.5 mb/d below their target. Output from
non-OPEC+
producers, most notably the US, also fell short of expectations at the start of the year.Non-OPEC+
output is now seen growing by 2 mb/d in 2022.Oil markets struggling to navigate supply losses and dislocations stemming from Ukraine Russia crisis received support from US. IEA member countries agreed on April 1, 2022, to tap their emergency reserves for the second time in the space of a month, this time to the tune of 120 mb. The volumes will provide relief to an already tight oil market that’s facing uncertainty. Crude prices have eased by nearly $10/bbl following announcements of the US and IEA stock releases, with ICE Brent last trading at around $104/bbl.
Lower demand expectations and steady output increases from Middle East OPEC+ members along with the US and other countries outside the OPEC+ alliance should bring the market back to balance. But the outlook is still mired in uncertainty, with unforeseen contingencies such as the stringent lockdowns in China.
India is the world’s third largest oil consumer, the fourth-largest refiner and a net exporter of refined products. As proven oil reserves are limited compared with domestic needs, we expect India’s import dependency to increase significantly in the coming decades. The country currently meets 85% of its oil consumption and 54.3% of its gas consumption through imports.
As per the India Energy Policy Review 2021 by IEA, rising vehicle ownership and road transport use are the major contributors to oil demand with India’s transportation energy consumption projected to grow at an average annual growth rate of 4.4%, compared with the world average of 1.4% per year till 2040.
According to the DGH Annual Hydrocarbon Outlook, Fiscal Year 2020-2021, India’s prognosticated conventional hydrocarbon resource potential is estimated at ~42 BToe (unrisked) of which nearly 28% (12 BToe) is converted tocategory.
In-place
volume through discoveries. The remaining potential falls in theyet-to-find
With the increasing demand and thus imports, India’s depleting energy security can prove to be a major concern. To utilize its existing resources and decrease the overburdening import bills, the Government has prioritised the reduction of oil and gas imports, increasing domestic upstream activities, diversifying its supply sources and increasing Indian investments in overseas oil fields in the Middle East and Africa. The government also aims to increase the share of natural gas in the country’s energy mix to 15% by 2030, from the current 6.7% aided by enabling policy interventions.
The Government is cognizant that several policy reforms are needed to revitalise the exploration and production ecosystem.
45
Since 2016, six rounds under the OALP have been concluded for 126 Exploration and Production (E&P) blocks. The Government has recently launched the OALP Bid
Round-VII
for International Competitive Bidding. Successful award ofRound-VII
Blocks under the OALP which is expected to be completed soon, would add further 15,766 sq. km of exploration acreage; and cumulative acreage under OALP will be increased to 207,692 sq. km.The government has recently come up with self-certification policy and natural gas marketing reforms to improve ease of doing business and attract more investments. With the objective of increasing domestic gas production of natural gas and to move towards a
gas-based
economy, in October 2020 the GoI allowed complete marketing and pricing freedom for natural gas produced fromnon-regulated
fields, including sale to affiliate companies. To facilitate ease of doing business, government rationalized 37 processes in 3 categories required during the life cycle of exploration and development of a block under a PSC contract, of which for 22 such processes, documents shall be accepted on self-certification basis and no approval is required.Vedanta Limited has a world-class resource base, with 58 blocks in India. With a strengthened growth pipeline in exploration and development, we believe we are well-positioned to meet India’s growing demand and contribute to India’s vision of becoming Aatmnirbhar.
3. | Iron Ore |
Iron ore prices remain volatile throughout the year
The iron ore prices were the highest in the
Quarter-1
of the year and then started falling. Prices have been driven by high demand in China and (fears of) disrupted supply in Brazil and elsewhere. The iron ore price is forecast to remain well above $ 140 a tonne until 2023.Iron ore prices surged in April 2021, lifting from around $ 150 per tonne at the start to the month to close out at over $ 228 per tonne in May 2021 - the highest level since 2011. Prices have subsequently started falling in the month of August, averaging around $ 150 a tonne during August 2021 and lowering $ 110 per tonne during parts of December 2021 and again raising to around $150 per tonne in March 2022.
Prices (and premium prices in particular) have thus remained at near
10-year
highs for two months without significant retreat. Prices have been pushed up by consistently high steel production in China, which has been driven byCOVID-19
related stimulus measures. Correction in prices was on account Higher Supplies and huge stock piling on the Chinese port.Market Drivers and Opportunities
An increase in iron ore demand in China and expected lower supply in the short term will be the primary drivers for prices in FY 2022-2023. Prompted by an increased focus on new infrastructure investment and improved credit conditions in China, the prices should be supported near the current high levels for the remainder of 2022. This price is further backed by a shortfall in supply, primarily due to the Ukraine Russia crisis, and an expectation of lower production in Australia and Brazil in Q2 and Q3 of CY 2022 due to anticipation of an elongate seasonal rainfall disrupting production. In China, a transition towards a less emission environment can lead to reduced production in the long run. Boosted by these factors, for CY 2022, the spot price for 62 % Fe iron ore fines (FOB) is forecasted to average US$110 per ton.
Downside Risk: Continued deterioration in China’s residential property market is one of the downside risks to this view. China attempted to address rising property prices and high debt levels in the sector throughout 2021, which resulted in fewer construction activities at the start of 2022. With property building accounting for roughly 30% of China’s total steel demand, further deterioration in this sector would have a considerable impact on the country’s overall iron ore demand.
Owing to these downside risks, the real benchmark iron ore price is expected to average US$80 per tonne in CY 2023, down from a forecast average price of roughly US$110 per tonne (62 % Fe fines, FOB) in CY 2022.
Products and customers
Iron ore, a key ingredient in steel which is ultimately used in the construction, infrastructure and automotive sectors. Our iron ore mining operations ceased in Goa from March 2018, pursuant to the order from Hon’ble Supreme Court. Meanwhile, the permitted mining capacity at Karnataka is 5.60 million tons.
4. | Copper |
Global refined copper consumption remained at 24.4 Mt in CY 202123.5 Mt in CY 2020. We expect global refined consumption to expand by 2.3% this year, 2.5% in CY 2023 and 3.1% in CY 2024 to 25 Mt, 25.6 Mt and 26.4 Mt, respectively. Refined copper consumption in India remained at 0.6 Mt in CY 2021. We expect it to expand by 10% in CY 2022. However, on the supply side, India grappled with availability constraints of refined copper due to Vedanta Limited’s Tuticorin smelter closure for the fourth year in a row.
vis-a-vis
46
After consolidating within a US$10,000 to US$10,600/t trading range through much of April 2022, copper prices faltered alongside the other base metals to end the month languishing 8% below its US$10,580/t peak at the beginning of the month. Growing concerns over global demand prospects initiated by the war in Ukraine were intensified by the deteriorating picture in China, while a resurgent US dollar and rising exchange inventories
ex-China
triggered a shift in sentiment and a correction in prices.Products and consumers
Refined copper is predominantly used in manufacturing cables, transformers and motors as well as castings and alloy-based products. The Tuticorin smelter closure adversely impacted our production in India.
Market drivers and opportunities
Over the medium and long term, we believe copper consumption in India and China is likely to increase, driven by population growth, urbanisation, the rise of aspiring middle class and demand for electric vehicles. These trends are supported by enabling government measures and initiatives. In addition, this high prices for commodities remain a key factor going forward.
Demand in the US remains strong, underpinned by a robust
end-use
market as well as incremental capacity expansions. This has seen COMEX prices trade predominately at a premium to those on the LME in recent weeks and has in turn attracted more cathode into the US. Trade data for the first couple of months of the year suggests a ~50% increase in refined cathode imports compared to year ago levels, with a sharp rise in imports from Chile and Peru in particular. Producers are likely looking to benefit from the shorter shipping times and the higher premia which are being underpinned by elevated freight costs.5. | Aluminium |
LME prices and world trade scenario
The LME aluminium price has seen significant volatility this fiscal year, especially in the last quarter. Post the covid resurgence, the aluminium market is in a growth phase now with dedicated focus to accelerate development. Since lockdown restrictions eased in May 2021, the global recovery has been strong, but with marked differences across countries and sectors. During Q2 and Q3 FY 2022, the energy price skyrocketed due to covid induced closure of coal mines in Australia and higher Indonesian coal demand from China and geopolitical instability in Africa and Eastern Europe. Pertaining to exceptionally higher energy prices, several European smelters closed during the FY 2022 causing a significant deficit in the European markets. The geopolitical crisis in Europe during Q4 of FY 2022 has further worsened the metal availability and energy security of Europe. FY 2022 also witnessed demand growth stabilisation around the world. During the year, India’s primary aluminium demand grew at an average of 14%. However, overall export sales of aluminium from country grew by 6% during FY 2022.
The global production of primary aluminium stood at 67.4 million tonnes in CY 2021, while global demand at 69 million tonnes. Thus, demand outstripped primary supply by ~1.6 million tonnes in CY 2021. However, global market for CY 2022 is estimated to be in deficit by ~1 million tonnes. Consumption is expected to grow over the next decade with innovation in automobile industry across vehicular light-weighting and increasing adoption of electric vehicles. The rapidly urbanising Asia–Pacific and African economies (mainly emerging markets) with demand mainly growing in packaging, automobile, construction and power sectors is expected to keep the global aluminium market buoyant for the years to come.
With a rise in global demand and sluggish pace of supply-chain normalisation, the global shipping industry came under immense pressure in CY 2021. CY 2021 started with a robust growth in the traded volume. The world traded volume growth picked in Q2 of CY 2021, then the growth moderated. In Q1 of CY 2022 however the Ukraine-Russia crisis dominated the global trade and the energy market. Several supply-chain disruptions in global market led to higher volatility in CY 2021 and the Q1 of CY 2022.
The recent Ukraine Russia crisis saw huge spikes in aluminium prices with the LME touching $ 4,000/t for the first time. With the majority of Rusal’s sales going to European regions, the impending risk of sanctions against aluminium exports will lead to massive metal deficit in the world. The major effect of this will be felt in the European region. The regional premiums have also experienced quite an upside owing to the increasing volatility of the market. Global metal flow is likely to be disrupted, and if the market volatility continues, it might also lead to demand destruction.
Products and consumers
Vedanta Limited operates one of the largest single-location smelters in the world at its Jharsuguda facility with ~2.2 mtpa present aluminium capacity. For the fiscal year 2022, the estimated share for Vedanta Limited (including BALCO) in India for aluminium was approximately 47% among the primary aluminium producers in India, based on internal estimates. Our product range includes aluminium ingots, primary foundry alloys, wire rods, billets, slabs and rolled products. The Company caters to electrical, automotive, building and construction segments, along with a host of other industries, well supported by its high-quality value-added product portfolio. Around 36% of our total aluminium sales globally were value-added products.
47
During Fiscal year 2022, approximately 27% of our total sales were to the Indian market, specifically for the use in electrical, construction and transportation industries, of which 68% of domestic sales were for value-added products.
During the year, we expanded our market reach in North American destinations, primarily in VAP, wherein we increased our billet sales in Europe and Americas. International sales to our established customers in other key Asian, European and North and South American markets increased to 1.66 million tonslast year at 1.36 million tons.
vis-à-vis
In this Fiscal year, we have launched our new Green/Low Carbon aluminium brand named Restora (Manufactured using renewable energy) and Restora Ultra (Manufactured from recovered aluminium from dross).
Indian market drivers and opportunities
Post covid lockdown, India has witnessed impressive economic recovery. With the continued structural support from the government through various schemes focusing infrastructure and manufacturing and increasing adoption of electric vehicles, demand and industrial activity is expected to witness stellar growth. Total aluminium consumption in India increased in FY 2022 from FY 2021 levels. We believe the long-term demand for aluminium in India and theProduction Linked Incentive for domestic manufacturing, National Infrastructure Pipeline and National Rail Plan have been rolled out that will push the aluminium demand in the country, propelled by infrastructure, automotive and power sector. The Indian government is investing over $ 1 billion in its ‘Make in India’ initiative. The aluminium consumption is expected to rise in India with these initiatives lined up in the country, which is in line with India’s 5 trillion-dollar economy vision.
sub-continent
will remain robust backed by increased industrial activity and government focus on the infrastructure sector in the country. Several government initiatives likeMake-in-India,
We believe there is a huge potential for increasing aluminium usage in India in building and construction, automotive and packaging industries. We continue to expand our value-added product portfolio in line with evolving market demand, positioning us for growth in the Indian aluminium market.
6. | Power |
Domestic demand driving capacity expansion
Vedanta Limited operates over 9,000 MW diversified power portfolio in India consisting of 97% thermal power and 3% from renewable energy sources.
India is the third largest electricity producer and second largest consumer of electricity in the world with an installed capacity of 399 GW as of March 2022 and estimated power consumption of 1,894.70 TWh in FY 2022. The electricity generation target for FY2022 has been fixed at 1,356 billion units (BU), 9.83% higherBetween FY 2016 and FY 2021, the country’s electricity generation grew at 1% CAGR, driven by government initiatives and schemes to increase rural electrification and providepower supply.
Y-o-Y.
round-the-clock
Products and consumers
Of our cumulative power portfolio, 35.3% is used for commercial power, while the remaining 64.7% is intended for captive use. Entire power generated for commercial purposes is backed by long-term Power Purchase Agreements with state distribution companies.
The Ministry of Power, GoI issued an order dated June 28, 2019, that has directed the DISCOMs (electricity distribution companies in India) to service entire payments for any power supplied since August 2019 on advance basis. This has brought down the billing payment cycle across India.
Market Drivers and Opportunities
India’s power demand is likely to touch 1,894.70 TWh by FY2022 (7% CAGR) from 2007 baseline, driven predominantly by multiple factors such as (expansion in industrial activities, growing population, rising per capita income, policy support and increasing electricity penetration.). The Government has also been supportive of growth in the power sector, through various reforms such as, delicensing the electrical machinery industry and allowing 100% Foreign Direct Investment (“FDI”). From April 2000 to December 2021, total FDI in the sector was $ 15.8 billion, of which $ 11.2 billion was invested in
non-conventional
power sources above.The Government had opened the coal sector for commercial mining, with revenue sharing based model, which is expected to ease any coal availability issues during peak demand season.
At Vedanta, we are looking at expanding the renewable energy generation portfolio. Notification by the Ministry of Power on biomass
co-firing
allows blending up to 5% - 10% biomass, considering it as renewable power.48
This has opened additional avenues for utilising renewable power in existing thermal power plants. Vedanta has successfully completed pilot projects for using biomass for power generation in its thermal power plants at Jharsuguda that supply power for aluminium production.
As of March 31, 2022, India had total installed capacity of 399 GW, of which thermal constituted 236 GW, nuclear 7 GW, hydro 47 GW and renewables at 109 GW. The total captive power installed capacity stood at 70 GW.
The target for renewable energy has also been increased to 227 GW by 2022, of which 114 GW will be produced through solar power.
Vedanta’s power portfolio is well positioned to capitalise on India’s growing demand for power.
7. | Steel |
The construction sector is boosting steel demand
Global crude steel production was 456.6 Mt in the first three months of CY 2022, down by 6.8% compared to the same period in CY 2021. Asia and Oceania produced 331.3 Mt of crude steel in the first quarter of CY 2022, a decrease of 7.8% on the first quarter of CY 2021. The EU (27) produced 36.8 Mt of crude steel in the first quarter of CY 2022, down by 3.8% compared to the same quarter of CY 2021. North America’s crude steel production in the first three months of CY 2022 was 28.1 Mt, a decrease of 0.9% compared to the first quarter of CY 2021. Russia and other CIS + Ukraine produced 24.0 Mt of crude steel in the first quarter of CY 2022, a decrease of 8.5% on the first quarter of CY 2021. World steel forecasts that steel demand will grow by 0.4% in CY 2022 to reach 1,840.2 Million Mt after increasing by 2.7% in CY 2021. In CY 2023 steel demand will see further growth of 2.2% to reach 1,881.4 Million Mt. The current forecast is made against the backdrop of the crisis in Ukraine and is subject to high uncertainty.
India did exports of 13.5 million tons in FY 2022 with a growth of 25.12% as compared to FY 2021 (10.79 million tons).
Products and consumers
We completed the acquisition of ESL, an integrated steel plant on June 4, 2018. ESL is primarily selling Wire rod, TMT and DI pipe products in India mainly to the construction, infrastructure and automotive sectors.
Market drivers and opportunities
Global steel demand growth for CY 2022 will rise just 0.4% year-over-year, according to the World Steel Association’s latest Short Range Outlook report. The ongoing decline, which began in
mid-2021,
is shaped by Chinese government restrictions on real-estate and construction growth along with rising inflation worldwide and the instability surrounding the Ukraine Russia crisis. Current year’s global steel demand total at 1.84 billion metric tons, to be followed by a 2.2% rise in CY 2023 to 1.89 billion metric tons.OUR BUSINESS
Overview
We are a globally diversified natural resources company with
low-cost
operations. Our business is principally located in India. We have operations and projects in India, South Africa, Namibia, UAE, Ireland, Australia, Japan, South Korea, Taiwan and Liberia and have over 15,000 employees worldwide. We are primarily engaged in zinc, oil and gas, iron ore, copper, aluminium, commercial power generation and steel businesses and are also developing and operating port operation, glass businesses and infrastructure assets. We have expanded our existing business across oil and gas, copper, zinc, aluminium and iron ore and acquired new businesses, such as, the steel business through acquisition of ESL in 2018 and FACOR in 2020. We believe our experience in operating and expanding our businesses in India will allow us to capitalize on attractive growth opportunities arising from India’s large mineral reserves, relatively low cost of operations and large and inexpensive labor and talent pools. We believe we are also well-positioned to take advantage of the significant growth in industrial production and investments in infrastructure in India, China, Southeast Asia and the Middle East, which we expect will continue to generate strong demand for metals, oil and gas and power.We are the leading and only integrated zinc producer with an 83% market share by sales volume of the Indian zinc market in fiscal year 2022, according to the International Zinc Association (“IZA”), and among the primary producers of aluminium with approximately 47% primary market share amongst the total domestic sales in India based on internal estimates in fiscal year 2022. Together with our joint operation partners, we account for approximately 25% of India’s domestic crude oil production as of March 31, 2022, according to the provisional data published by Petroleum Planning and Analysis Cell of MoPNG.
We are one of the two custom copper smelters in India with a 22% primary market share by sales volume in fiscal year 2022, according to the International Copper Association (India).
49
I. | Zinc Business |
Our fully integrated Zinc India business is owned and operated by HZL. In FY 2022, HZL was the second largest
zinc-lead
miner and fourth largestzinc-lead
smelter based on production volumes and in the first quartile in terms of all zinc mining operations worldwide, according to Wood Mackenzie Production Rankings. We have a 64.9% ownership interest in HZL, with the remainder owned by the GoI (29.5%) and institutional and public shareholders (5.6%). We have exercised the second call option to acquire the GoI’s remaining ownership interest in HZL. HZL had initiated arbitration proceeding which have now been withdrawn and tribunal dissolved. HZL’s operations include five lead-zinc mines, one rock phosphate mine, four hydrometallurgical zinc smelters, two lead smelters, one pyrometallurgical lead-zinc smelter, eight sulphuric acid plants, six captive power plants in northwest India, and processing and refining facilities for zinc, lead and silver at Pantnagar, located in the state of Uttarakhand in northern India. HZL’s mines supply almost all of its concentrate requirements. The silver refinery of HZL has been added to the London Bullion Market Association’s (LBMA) good delivery list for silver with effect from April 16, 2018. HZL is India’s third refiner to be listed on LBMA. LBMA lists those refineries whose gold and silver bars have been found, when originally tested, to meet the required standard for acceptability in the London bullion market. HZL is among the top 10 silver producers globally.Our Zinc International business comprises (i) 100% stake in Skorpion, which owns the Skorpion mine and refinery in Namibia and (ii) 74% stake in Black Mountain Mining, which owns the Black Mountain mine and the Gamsberg mine in South Africa.
II. | Oil and Gas Business |
Our oil and gas business is primarily owned and operated by Vedanta Limited and its subsidiary – CIHL. The oil and gas business segment has a diversified asset base with 58 blocks in India. The blocks are primarily located across the Indian basins in Barmer, Krishna-Godavari, Cambay, Assam, Gujarat Kutch and Cauvery.
Vedanta Limited is primarily engaged in the business of exploration, development and production of crude oil, gas and related
by-products.
Oil and gas business continues to contribute significantly to India’s domestic crude oil production. Vedanta Limited operates approximately 25% of India’s domestic crude oil production as of March 31, 2022.III. | Iron Ore Business |
We are engaged in the exploration, mining and processing of iron ore. In India, we own the rights to reserves consisting of 71.41 million tons of iron ore at an average grade of 45.3%, as of March 31, 2022. In addition, we manufacture pig iron and metallurgical coke, and also operate two waste heat recovery plants of 30 MW each in Goa.
Our mining operations are carried out in the states of Goa and Karnataka, both of which became subject to suspension of mining activities due to alleged environmental and other violations by miners, which has adversely impacted our production of iron ore since August 2011. In Goa the suspension was imposed by the state government of Goa and this suspension was upheld by the Hon’ble Supreme Court on the mining activities in the state of Goa from September 2012 to April 2014 and in Karnataka suspension imposed by the state government of Karnataka until April 2013. Although we resumed operations in Karnataka after receiving the stage I forest clearance from the state government of Karnataka and a temporary working permission from the MoEF&CC, the temporary working permission expired on July 31, 2014. Karnataka operations were halted for the period from August 1, 2014, to February 27, 2015. We resumed operations in Karnataka after all statutory clearances were in place from February 28, 2015. Following the Hon’ble Supreme Court’s order in April 2014, High Court of Bombay at Goa in August 2014 has pronounced the order to renew mining leases in Goa. The MoEF&CC and the state government of Goa have also revoked their suspension orders subject to limits imposed by the Hon’ble Supreme Court, for renewal of the leases and CTO from the Government of Goa. In August 2015, our mining operations resumed in our principal mines after completion of necessary statutory formalities and fulfillment of conditions annexed by the Hon’ble Supreme Court and the state government of Goa. The Hon’ble Supreme Court passed its final order in the matter on February 7, 2018, wherein it set aside the second renewal of the mining leases granted by the state of Goa. The Hon’ble Supreme Court directed all lease holders operating under a second renewal to stop all mining operations with effect from March 16, 2018, until new mining leases (not new renewals or other renewals) and new environmental clearances are granted under the MMDR Act. Our mines in the state of Goa were impacted consequent to the judgement of the Hon’ble Supreme Court. We have filed review petition against the SC judgment dated February 7, 2018. The review petition was dismissed by order dated July 9, 2021 on the grounds of limitation and the SLP which was filed against the order of High Court of Bombay was disposed of by order dated September 7, 2021. We have recently received Notices from the State Government of Goa directing us to comply with the provisions of Rule 12 (1) (hh) of the Mineral (other than Atomic and Hydrocarbons Energy Minerals) Concession Rules, 2016 within a period of one month with effect from May 6, 2022 to June 6, 2022. The compliance under the said provision requires the lessees to remove any ore or mineral, engines, machinery, plant, buildings structures, tramways, railways and other work, erections and conveniences on the leased land within the above-mentioned period of one month. Anything on the leased land which has not been removed by the lessee within a period of one from the date of direction shall become the deemed property of the Government.
WCL has acquired three iron ore mining concessions in Liberia (Bomi hill mine, Bea Mountain and Mano River). Exploration is done at all three concessions. We are going to start iron ore mining at Bomi Hill mine very soon.
50
IV. | Copper Business |
Our copper business is principally one of custom smelters. Our assets include a smelter, a refinery, a phosphoric acid plant, a sulphuric acid plant, a copper rod plant and three captive power plants at Tuticorin in Southern India, a refinery and a copper rod plant and three blister/secondary material processing plant at Silvassa in Western India, a precious metal refinery that produces gold and silver, a doré anode plant and a copper rod plant at Fujairah in the UAE. We own the Mt. Lyell copper mine in Tasmania, Australia. The operation of Mt Lyell mine was suspended in January 2014, following a mud slide incident. Subsequently, the operations at Mt. Lyell copper mine has been placed under care and maintenance since July 9, 2014, following a rock falling on the ventilation shaft in June 2014.
The Government of Tamil Nadu has issued orders dated May 28, 2018, with a direction to permanently seal the existing copper smelter plant unit at Tuticorin. The Company has filed an appeal before NGT, Principal Bench challenging the closure order for sealing of the existing plant. Separately, SIPCOT vide its letter dated May 29, 2018, cancelled 342.22 acres of the land allotted to us for the proposed expansion project, which has been stayed by High court of Madras. Further the TNPCB issued orders on June 7, 2018, directing the withdrawal of the Consent to Establish, which was valid till March 31, 2023. The Company had filed a writ petition before Madras High Court challenging the various orders passed against the Company in 2018 and 2013. On August 18, 2020, the Madras High Court delivered the judgement wherein it dismissed all the Writ Petitions filed by the Company. The Company has approached the Hon’ble Supreme Court and challenged the said High Court of Madras order by way of a SLP to Appeal and also filed an interim relief for care and maintenance of the plant. The matter was then listed on December 2, 2020, before Hon’ble Supreme Court Bench. The Bench after having heard both the sides concluded that at this stage the interim relief in terms of trial run could not be allowed. Further, considering the voluminous nature of documents and pleadings, the matter shall be finally heard on merits. Further, Hon’ble Supreme Court held that the case will be listed once physical hearing resumes in the Hon’ble Supreme Court. The matter was again mentioned before the bench on March 17, 2021, wherein the matter was posted for hearing on August 17, 2021. However, the matter was not taken up on August 17, 2021. The matter was listed and taken up for hearing on March 15, 2022, and was part heard. The matter was to be further heard on March 22, 2022, however due to reconstitution of the bench the matter was not listed. The Hon’ble Supreme Court has, on May 20, 2022, ordered for the interlocutory application that was filed by Vedanta Limited before the Hon’ble Supreme Court for the maintenance of status quo as on March 15, 2022 consequent to an order passed by the Collector of Tuticorin requiring Vedanta Limited employees to vacate the plant premises to be listed for hearing along with the main matter on the next date of listing. See “for further details.
Item 8 – Financial Information - A. Consolidated Statements and Other Financial Information - Legal Proceedings”
V. | Aluminium Business |
Our aluminium business is based out of Chhattisgarh and Odisha. We operate the business in Chhattisgarh through BALCO, in which we have a 51% ownership interest, with the remainder owned by the GoI. We have exercised our option to acquire the GoI’s remaining 49% ownership interest, although the exercise is currently subject to dispute. BALCO’s operations include two bauxite mines, one coal mine, 1,710 MW captive power plants, an alumina refinery (operations of which have been suspended since September 2009), a 245,000 tpa aluminium smelter, a 325,000 tpa aluminium smelting and fabrication facilities in Central India.
Our aluminum operations in Odisha were earlier operated through Vedanta Aluminium Limited, which is now merged with Vedanta Limited pursuant to the
Re-organization
Transactions. The operations include 2.0 million tpa alumina refinery at Lanjigarh with associated 75 MW coal based captive power plant. The alumina refinery at Lanjigarh was commissioned in March 2010 and second stream was restarted in April 2016 increasing the alumina refinery’s total capacity to 1.4 million tpa. We also capitalized a debottlenecking project for the alumina refinery in March 2017 increasing the refinery’s total capacity to 2.0 million tpa.At Jharsuguda, the Company operates two smelters with a combined capacity of 1.75 million tpa. The first is one of 0.5 million tpa, which is fully operational. The second is one of 1.25 million tpa capacity which is in the process of being ramped up to increase its total capacity to 1.75 mtpa, subject to obtaining the required approvals from the GoI. We also have associated 1,215 MW and 1,800 MW (three units of 600 MW each) coal based captive power plants at Jharsuguda. Our 1.25 million tpa smelter initially commenced production on December 1, 2015 and 1,855 pots have been capitalized as of March 31, 2022
VI. | Power Business |
We operate multiple power plants across locations in India. Our power business comprises of 600 MW thermal power plant in Jharsuguda, Odisha, 300 MW thermal power plant in BALCO, Chhattisgarh, 106.5 MW thermal power plant in Tamil Nadu and 80 MW thermal power plant and 31.5 MW liquid fuel power plant in Tamil Nadu and a 1,980 MW thermal power plant in Mansa, Punjab.
We, currently, operate a 600 MW thermal coal-based commercial power facility at Jharsuguda and it has a power purchase agreement with GRIDCO Limited, a nominee of the state government of Odisha (“GRIDCO”).
51
BALCO used to operate two independent power plants units with a total installed capacity of 600 MW which are a part of its 4 x 300 MW power plant. However, it now just operates a 300 MW unit as an independent power plant. The other 300 MW unit has been converted to a captive power plant, as per order received from Chhattisgarh State Electricity Regulatory Commission (“CSERC”) for conversion of 300 MW capacity from IPP to CPP.
In July 2008, Sterlite Energy succeeded in an international bidding process and was awarded the project for the construction of a 1,980 MW (comprising three units of 660 MW each) coal-based commercial thermal power plant at Talwandi Sabo in the State of Punjab in India. The power plant was set up through Vedanta Limited’s wholly owned subsidiary TSPL. All 3 units have been fully commissioned now.
Our power business also includes 273.5 MW of wind power plants operated by HZL and 106.5 MW power plant at MALCO situated at Mettur Dam in southern India. The MALCO plant has been put under care and maintenance from May 26, 2017.
VII. | Steel Business |
We operate the steel business through ESL in which we have 95.49% ownership interest as at March 31, 2022 ESL owns and operates an integrated steel manufacturing facility near Bokaro, Jharkhand and has a current capacity of 1.5 mtpa which we plan to expand to 3 mtpa in the upcoming year(s). It primarily consists of one sinter plant, a vertical coke oven plant, two blast furnaces, an oxygen plant, a lime calcination plant, a dolo calcination plant, a steel melting shop, a wire rod mill, a bar mill, a captive power plant and a DI pipe plant. One blast furnace and horizontal coke oven is under commissioning. ESL is selling primarily TMT bars, wire rods, DI pipes, pig iron and steel billets in open market and has established its presence in the domestic market as well as international market
ESL, our subsidiary filed an application for renewal of CTO on August 24, 2017, for the period of five years which was denied by Jharkhand State Pollution Control Board (“JSPCB”) on August 23, 2018. On August 25, 2018, the High Court of Jharkhand granted stay against said order of denial of CTO by JSPCB to allow to continue the operations. Further, the MoEF&CC passed an order revoking the environmental clearance of ESL. ESL challenged the revocation of the environmental clearance before Jharkhand High Court and on September 27, 2018, the High Court of Jharkhand stayed the order of MoEF&CC. In December 2019, ESL has been granted the Stage I forest clearance by MoEF&CC. ESL is working out appropriate solution to secure the revised environmental clearance in due course. MoEF&CC, on August 25, 2020, has granted a Terms of Reference to ESL for 3 MTPA plant with conditions like fresh EIA/EMP reports and public hearing. The High Court of Jharkhand had extended the interim protection granted in the pending writ petitions till September 16, 2020. High Court of Jharkhand on September 16, 2020, pronounced and revoked the interim stay for plant continuity with effect from September 23, 2020. ESL filed a SLP before Hon’ble Supreme Court against September 16, 2020, order for grant of interim status quo order and plant continuity. Vide order dated September 22, 2020, Hon’ble Supreme Court issued notice and allowed plant operations to continue till further orders. Public hearing has been concluded on December 16, 2020, and ESL has applied for grant of EC to MoEF&CC on January 11, 2021 on Parivesh Portal of MoEF&CC and presented before EAC on February 11, 2021. The EAC conducted three meeting and on July 29, 2021, meeting recommended the grant to EC to ESL subject to certain conditions, including the forest clearance.
The MoEF&CC vide its letter dated August 25, 2021, rejected “as of now” the grant of EC to ESL due to stay on the standard operating procedure for identification and handling of violation cases under Environmental Impact Assessment, 2006 notification issued by MoEF&CC on July 7, 2021, for violation cases by Madras High Court (Madurai Bench). However, it was clarified that once the aforesaid standard operating procedure is upheld or stay is vacated, the recommendation will be considered without going to the EAC again. An interlocutory application was filed in the pending Hon’ble Supreme Court matter against the rejection of the environmental clearance on as of now basis due to the stay on the aforesaid standard operating procedure. The Hon’ble Supreme Court pronounced the judgment on December 9, 2021 (special leave petition along with the interlocutory application) and passed the following: (i) the special leave petition was granted, (ii) the impugned order passed by High Court of Madras was set aside, and (iii) the MoEF&CC was directed to process the environmental clearance application of ESL according to the applicable law within a period of three months. MoEF&CC vide its letter dated February 2, 2022, has deferred the grant of EC till Forest Clearance” for further details. Any unfavourable judgement will result in adverse impact on our operations at ESL.
Stage-II
is granted to ESL. ESL has submitted its reply against MoEF&CC letter vide letter dated February 11, 2022, for reconsidering the decision and not linking EC with FC since as per the applicable law and available precedents, grant of FC Stage – II is not a condition precedent for grant of EC. See “Item 8 – Financial Information—A. Consolidated Statements and Other Financial Information—Legal Proceedings
52
Strategy
Our strategic goal is to become one of the top diversified natural resources company globally, and our strategy is based on the following five key pillars:
– | Delivering profitable production growth across the portfolio |
We view strict cost management and increases in productivity as fundamental aspects of our day to day operations and continuously seek to improve efficiency. We continued to be in the first quartile in terms of cost of production in our zinc mining operations worldwide in fiscal year 2022, according to Wood Mackenzie, and we intend to continue to improve our production processes, methods and increase operational efficiencies to further reduce our costs of production in all our businesses. Our current initiatives include:
| • | seeking improvements in operations to maximize throughput, faster ramp up of mining operations, improve plant availability and efficiency to achieve production, increase in our existing facilities with minimum capital expenditures to optimize our asset utilization; |
| • | reducing logistics costs through various initiatives; |
| • | reducing energy costs and consumption, including through continued investment in advanced technologies to reduce power consumption in the refining and smelting processes and in captive power plants to provide the required power; |
| • | a strong development and exploration effort seeking to increase reserves, particularly in our zinc and oil and gas business; |
| • | building and managing our captive power plants to supply a majority of the power requirements of our operations; |
| • | gaining access to relatively large and inexpensive labor and talent pools in India; |
| • | increasing automation to reduce the manpower required for a given level of production volume; |
| • | continuing to improve recovery ratios such that more finished product is obtained from a given amount of raw material; |
| • | reducing purchase costs, including by entering into long-term contracts for raw materials, making investments in mining operations and optimizing the mix of raw material sourcing between long-term contracts and the commodities spot markets to address fluctuations in demand and supply; |
| • | Operationalize acquired coal blocks and materialize 100% Tranche V coal; |
| • | Lanjigarh expansion from 2 to 5 MTPA; |
| • | Increasing Value added product capacity to 90% at aluminium; |
| • | full capacity ramp up at the Jharsuguda-II; |
| • | improving value added product portfolio at zinc, Aluminum and steel business to improve realisations; |
| • | seeking better utilization of by-products, including through adding additional processing capabilities to produceend-products from theby-products that can be sold at higher prices and help lower the cost of production of our core metals. For example, silver and sulphuric acid areby-products of zinc and lead. We are amongst top ten silver producers of the world, according to Wood Mackenzie; |
| • | commissioning of minor metal plants viz cadmium plant, copper matte, Antimony plant, Cobalt plant, RZO plant etc. at Dariba and Chandaria to increase minor metal credits to cost; |
| • | Exploration and appraisal drilling across the portfolio in Rajasthan, Cambay, Northeast and Offshore blocks; |
| • | Drilling pilot wells for shale to establish potential; |
| • | New opportunities basket for execution based on results of evaluation by global players as part of strategic alliance; |
| • | ASP pilot project in Bhagyam and Aishwariya fields; |
| • | Infill wells across operating fields to augment reserve base; |
| • | execution of phase II of Gamsberg project and competition thereof by fiscal year 2023-24; |
| • | Ramp up the performance of our Gamsberg Plant to achieve Designed capacity; |
| • | Completion by Magnetite project by half of fiscal year 2023; |
| • | faster progress on Skorpion refinery conversion project and Gamsberg smelter project through government support, capex and opex reduction; |
53
| • | ramping up production volumes of silver; |
| • | ramping up shaft at Sindesar khurd and Rampura Agucha mines; |
| • | ramp up of mining capacities at Rajpura Dariba and Zawar mines to 2 mtpa and 5 mtpa respectively; |
| • | debottlenecking of smelters at Dariba and Chanderiya; |
| • | ramp up production at fumer plant; |
| • | aggressive exploration program focusing on delineating and upgrading Reserves and Resources (R&R) within its license areas across mines; |
| • | ramp up of underground mines towards their design capacity; |
| • | to expand our R&R base through targeted and disciplined exploration programmes by developing both green field and brown field opportunities; |
| • | disciplined capex and prioritizing capital to high return, low risks project maximizing cash flows for providing the flexibility to invest further; |
| • | resumption of mining operations in Goa through continuous engagement with the Government and the judiciary; |
| • | increase our footprint in iron ore by continuing to participate in auctions across the country, including Jharkhand; |
| • | securing environmental clearance for expansion and debottlenecking of pig iron plant to increase production capacity by 1.7 LTPA; |
| • | advocacy for removal of E-auction/trade barrier in Karnataka; |
| • | engage with government and relevant authorities to enable the restart of operations for copper business in India; |
| • | to expand operations of Avanstarte Inc during the fiscal year 2023 to the China Market; and |
| • | acquiring attractive, complementary assets in the natural resources segment that add value to our portfolio. |
– | Consolidation and simplification of the group structure |
We are continuously seeking to increase our direct ownership of our underlying businesses to simplify and derive additional synergies and better align cash flows and debt as an integrated group by consolidating our corporate structure and integrating our operations. For example, during fiscal year 2017, we successfully completed our merger with Cairn India Limited (now Vedanta Limited - oil and gas business) and during fiscal year 2018, we had initiated the liquidation of TMHL, TEHL and SSMHL as part of an internal restructuring which has been accepted by Director of Insolvency, Mauritius in fiscal year 2020. TMHL was dissolved with effect from May 19, 2019, TEHL was dissolved with effect from May 21, 2019 and SSMHL was dissolved with effect from May 21, 2019.
We own majority ownership interests in BALCO and HZL and have offered to acquire the remaining shares of both BALCO and HZL from the GoI. As on date, these offers have not been accepted by the GoI and therefore there is no certainty that these acquisitions will proceed. See “.”
Item 4 – Information on the Company - B. Business Overview - Our Business - Options to Increase Interests in HZL and BALCO
With approval granted by NCLT, Kolkata Bench, for the Scheme of Amalgamation, Vedanta Star Limited has merged with Electrosteel Steels Limited and we now directly hold 95.49% in ESL.
– | Continuing to add reserves and resources for long-term value |
Our acquisitions of HZL, BALCO, Sesa Rexsources Limited, Skorpion, Black Mountain Mining, Sterlite Energy, WCL, Cairn India Limited (now Vedanta Limited - oil and gas business), ESL, ASI and FACOR have contributed substantially to our growth. We continually seek new growth and acquisition opportunities in the metals and mining and related businesses in India and elsewhere, including through government privatization programs, where we can leverage our skills and experience. We continue to closely monitor the resource markets in our existing lines of business as well as seek out opportunities in complementary businesses such as coal mining. We also intend to continue to seek out new exploration opportunities for future growth. By selecting opportunities for growth and acquisition carefully and leveraging our skills and experience, we seek to continue to expand our business while maintaining a strong balance sheet and good credit profile.
54
– | Accelerating cash flows and deleveraging |
We aim to increase our cash flows from operations and decrease capital expenditures, and the indebtedness required to fund capital expenditures. As on March 2022, our projects have an estimated total capital expenditure cost of 990,635 ($ 13,057 million), of which 575,170 million ($ 7,581 million) had been incurred. Net cash from operating activities was 282,819 million ($ 3,727 million) in fiscal year 2022, 4.44% decrease from 295,952 million in fiscal year 2021. We paid interest of 52,217 million ($ 688 million) on our indebtedness in fiscal year 2022, a 2.4 % decrease from 53,499 million in fiscal year 2021.
₹
₹
₹
₹
₹
₹
– | Protect and preserve license to operate |
Health and safety continue to be a high priority for us and we are committed to protect and preserve our license to operate. Our business strategy is about ensuring that growth is maximized in a way that is both sustainable and responsive. The four core pillars - responsible stewardship, building strong relationships, adding and sharing values and strategic communication are designed to support the long term development, ensuring long lasting relationship and providing superior returns to all our stakeholders.
We are leading a ‘zero harm’ culture across the organization and we will continue to strengthen our strategy of responsible stewardship. We aim to focus on zero fatality and reduction in loss time injuries across the businesses.
Basis of Presentation of Mineral reserves and resources
The Securities and Exchange Commission (“SEC”) adopted amendments to its current disclosure rules effective from to modernize the mineral property disclosure requirements for mining registrants. The amendments include the adoption of S-K 1300, which will govern disclosure for mining registrants (the “SEC Mining Modernization Rules”). The SEC Mining Modernization Rules replace the historical property disclosure requirements for mining registrants that were included in the SEC’s Industry Guide 7 and better align disclosure with international industry and regulatory practices. Descriptions in this report of our mineral deposits are prepared in accordance with S-K 1300, as well as similar information provided by other issuers in accordance with S-K 1300, may not be comparable to similar information that is presented elsewhere outside of this report. HZL’s Rampura Agucha, Rajpura Dariba, Sindesar Khurd, Zawar and Kayad mines were considered material properties. Please refer to the Technical Report Summaries filed as exhibits hereto for additional information with respect to our material properties and Material Mining Properties section below.
The qualified persons that have reviewed and approved the scientific and technical information contained in this annual report are identified in the footnotes to the tables summarizing the mineral reserves and resources estimates below. Our HZL India mines reserve estimates at March 31, 2022 were prepared by our engineers and geologists and reviewed by A&B Global Mining Consultants (“ABGM”) , which are third party mining and geological consultants.
The estimates of proven and probable reserves at HZL’s Rampura Agucha, Rajpura Dariba, Sindesar Khurd, Zawar and Kayad mines and the estimates of mine life included in this annual report have been prepared by the qualified persons referred to herein, and in accordance with the technical definitions established by the SEC. Under S-K 1300.
Mineral resource
A ‘Mineral Resource’ is a concentration or occurrence of material of intrinsic economic interest in or on the earth’s crust in such form, quality and quantity that there are reasonable prospects for eventual economic extraction. Mineral Resources are further sub-divided, in order of increasing geological confidence, into inferred, indicated and measured as categories.
Mineral reserve.
Mineral Reserve is the economically mineable part of a Measured Mineral Resource and/or Indicated Mineral Resource. Mineral Reserves are subdivided in order of increasing confidence into Probable Mineral Reserves or Proved Mineral Reserves.
Mineral resource and reserve classifications are differentiated under subpart 1300 of Regulation S-K, in part, as follows:
| • | Probable Mineral Reserve |
| • | Proved Mineral Reserve |
| • | Indicated resources |
| • | Inferred Mineral Resource |
| • | Measured resources |
We periodically revise our reserves and resources estimates every year. During fiscal year 2022, we performed an analysis of our reserves and resources estimates for certain operations, which is reflected in new estimates as of March 31, 2022. Reserves and resource estimates for each operation assume that we either have or expect to obtain all the necessary rights and permits to mine, extract and process mineral reserves or resources at each mine. Certain figures in the tables, discussions and notes have been rounded.
For our other mines (see below), the reported metal reserves are defined as being either “ore reserves” if reported in accordance with the Australasian Code for Reporting of Exploration Results, Mineral Resources and ore reserves, 2004 Edition, prepared by the Joint ore reserves Committee of the Australasian Institute of Mining and Metallurgy, Australian Institute of Geoscientists and Minerals Council of Australia (the “JORC Code”) or “mineral reserves” if reported in accordance with the South African Code for Reporting of Exploration Results, Mineral Resources and Mineral Reserves which sets out minimum standards, recommendations and guidelines for public reporting of exploration results, Mineral Resources and Mineral Reserves in South Africa (the “SAMREC Code”). The meanings and definitions are the same.
The reported ore reserves of each mine are derived following a systematic evaluation of geological data and a series of technical and economic studies by our geologists and engineers.
| • | The ore reserves of Skorpion’s Skorpion mine were audited by SRK Consultants (UK) Ltd as of March 31, 2022. |
| • | The ore reserves of Black Mountain Mining’s Black Mountain mine and Gamsberg mine were audited by SRK Consultants (UK) Ltd as of March 31, 2022. |
| • | The proved oil, condensate, and sales-gas reserves blocks of Vedanta Limited - oil and gas business and its subsidiaries were evaluated by DeGolyer and MacNaughton (“D&M”) as of March 31, 2022. |
| • | The ore reserves of our iron ore mines in India were audited by SRK Consulting (UK) Limited as of March 31, 2022. |
| • | The ore reserves of our iron ore mine in Liberia were audited by Roscoe Postle Associates Inc. as of April 6, 2014. |
| • | The ore reserves of BALCO’s Mainpat and Bodai-Daldali bauxite mines were audited by SRK Consulting (UK) Limited as of March 31, 2020. |
An “ore reserve” is the economically mineable part. It includes diluting materials and allowances for losses which may occur when the material is mined. Appropriate assessments and studies have been carried out and include consideration of and modification by realistically assumed mining, metallurgical, economic, marketing, legal, environmental, social and governmental factors. These assessments demonstrate that at the time of reporting that extraction could reasonably be justified. Ore reserves are further
sub-divided
in order to increase confidence into probable ore reserves and proven ore reserves.In addition to the ore reserves we have identified further mineral deposits as either extensions of or additions to our existing operations that are subject to ongoing exploration and evaluation.
55
Our Zinc India Business
Overview
Our Zinc India business is owned and operated by HZL. HZL’s fully integrated zinc operations include five lead-zinc mines, one rock phosphate mine, four hydrometallurgical zinc smelters, two lead smelters, one pyrometallurgical lead-zinc smelter, eight sulphuric acid plants and six captive power plants at our Chanderiya, Dariba and Zawar facilities in the state of Rajasthan and processing facilities for zinc and lead as well as a silver refinery at Pantnagar, located in the State of Uttarakhand in northern India. HZL sources all of its concentrate requirements from its mines. HZL’s operations also includes 39.6 MW solar power projects installed at its Agucha, Debari and Dariba complexes and a 40.67 MW waste heat recovery power plant adjunct to its captive power plants.
We first acquired an interest in HZL in April 2002 and have since then significantly improved its operating performance through expansion and by improving operational efficiencies and reducing unit costs.
HZL pays royalties to the state government of Rajasthan based on its extraction of lead-zinc ore. With effect from September 2014, the royalty rate increased from 8.4% to 10.0% of the LME zinc metal price payable on the zinc metal contained in the concentrate produced and from 12.7% to 14.5% of the LME lead metal price payable on the lead metal contained in the concentrate produced. For silver, HZL pays royalty at a rate of 7% of the silver LBMA price chargeable on silver-metal produced. The royalties are subject to change. Further, the MMDR Amendment Act, notified towards the end of fiscal year 2015, notifies an amount not exceeding royalty to be contributed to the DMF for the benefit of people affected by mining and an additional 2.0% of royalties to the National Mineral Exploration Trust (NMET). DMF contribution has now been notified at 30.0% of base royalty rates. See “”.
Item. 3 — Key Information — D. Risk Factors — Risks Relating to Our Industry — Changes in tariffs, royalties, cess, customs duties, export duties and government assistance may reduce our Indian market domestic premium, which would adversely affect our profitability and results of operations
We have a 64.9% ownership interest in HZL, while the balance share is owned by the GoI (29.5%) and institutional and public shareholders (5.6%). We have exercised the second call option by a letter dated July 21, 2009 to acquire the GoI’s remaining ownership interest in HZL. HZL had initiated an arbitration proceeding, which have now been withdrawn and the tribunal dissolved . See”.
“Item 4
- Call Options over Shares - Call Options over shares in HZL
a. | Principal Products |
| o | Zinc |
We produce and sell zinc ingots in five international standard grades: Special High Grade (SHG - 99.995%), High Grade (HG - 99.95%), Continuous Galvanising Grade (CGG - 99.5%), Prime Western (PW - 98.0%) and Hindustan Zinc
Die-casting
Alloy (HZDA - 95.0%). We sell most of our zinc ingots to Indian steel producers for galvanizing steel to improve its durability. Some of our zinc is also sold to alloy, dry cell battery, die casting and chemical manufacturers.o | Lead |
We produce and sell primary lead ingots of 99.99% and 99.97% purity, primarily to battery manufacturers and to a small extent to chemical manufacturers.
b. | By-products |
| o | Sulphuric Acid |
Sulphuric acid is a
by-product
of our zinc and lead smelting operations. We sell sulphuric acid to fertilizer and cement manufacturers and in other industries also.| o | Silver |
Silver occurs naturally in our zinc and lead ore and is a
by-product
of our lead smelting operations. We produce and sell silver ingots primarily to industrial users and traders of silver.c. | Lead-Zinc Mines |
HZL normally sources all of the lead-zinc ore required for its business from its underground mines at Rampura Agucha, Zawar, Rajpura Dariba, Sindesar Khurd and Kayad in the state of Rajasthan in northwest India. Lead-zinc ore extracted from the mines is conveyed to beneficiation plants that processes the ore into zinc and lead concentrates. With good ore mineralogy providing a high metal recovery ratio, the Rampura Agucha mine including its satellite Kayad mine accounted for 53.6% of HZL’s total mined metal in zinc and lead concentrate produced in fiscal year 2022, with the Zawar, Rajpura Dariba and Sindesar Khurd mines accounting for the remaining 15.8%, 4.7% and 25.9%, respectively. Then zinc and lead concentrates are transported by road to the nearby Chanderiya, Dariba and Debari smelters.
Our mining capacities are governed by reserve and resources, mine plan and environmental clearances. Based on such approvals, the capacities are approximately 6.15 mtpa, 4.8 mtpa, 6.0 mtpa, 2 mtpa and 1.2 mtpa for Rampura Agucha mine, the Zawar mine, the Sindesar Khurd mine, the Rajpura Dariba mine and the Kayad mine respectively, in fiscal year 2022.
56
d. | Zinc Smelters |
HZL has two types of zinc smelters, namely hydrometallurgical and pyrometallurgical. Four of HZL’s smelters are hydrometallurgical and one is pyrometallurgical.
The hydrometallurgical smelting process is a roast, leach and electrowin (“RLE”) process. Zinc concentrate is first oxidized in roaster and the gases generated are cleaned and sent to the sulphuric acid plant. The primary output from the roaster, called calcine, is sent to the leaching and purification plant to produce purified zinc sulphate. The purified zinc solution then goes through an electrolysis process to produce zinc cathodes. Finally, zinc cathodes are further processed and casted into zinc ingots at the processing and refining facilities in the state of Uttarakhand in northern India.
The pyrometallurgical smelter uses the imperial smelting process (“ISP
TM
”), where the process starts with sintering to remove the sulphur from concentrate and then generated gases are cleaned and sent to the sulphuric acid plant. The output of the sinter machine is fed into an imperial smelting furnace to smelt with preheated metallurgical coke and air. During the smelting process, molten lead is extracted from bottom of the imperial smelting furnace and zinc rises up as vapor. Vapor is condensed in molten lead bath. The molten lead is cooled to separate out the zinc, which is then passed through a refining process to remove impurities and pure zinc metal is casted into ingots. The lead removed through this process is sent to refinery to produce pure lead metal. In this process, silver is also produced as aby-product
which is sent to our facilities in Uttarakhand for refining and casting into silver ingots.e. | Lead Smelters |
HZL has two lead smelters in Chanderiya and Dariba. The smelter in Chanderiya uses Ausmelt
™
technology and the smelter in Dariba uses Shuikoushan Smelting Technology (“SKS”) oxygen bottom blowing technology. There is also a lead-zinc smelter at Chanderiya which uses the pyrometallurgical imperial smelting furnace process.HZL’s lead smelter located in Dariba is based on SKS oxygen bottom blowing technology, where lead concentrate is smelted directly in SKS furnace along with fluxes. SKS furnace produces lead bullion and slag. SKS furnace slag is then reduced in blast furnace to produce bullion. Lead bullion produced in the process is then treated in lead refinery plant to produce high purity electrolytic grade lead cathodes through electrolysis. The lead cathodes are further processed and casted into ingots at the processing and refining facilities in the state of Uttarakhand. Slag from blast furnace is fumed to produce zinc oxide dust.
Off-gas
containing sulphur dioxide gas is cleaned and treated in the sulphuric acid plant. HZL’s lead smelter located in Chanderiya is based on Top Submerged Lance (“TSL”) technology where lead concentrate is smelted directly in a vertical furnace along with flux. Lead bullion produced in this process is then treated in the lead refinery plant to produce high purity lead ingots.Off-gas
containing sulphur dioxide gas is then cleaned and treated in the sulphuric acid plant.f. | Finishing and Delivery to Customers |
The zinc and lead cathodes are transported from its hydrometallurgical plants in Rajasthan to its facilities in Uttarakhand in northern India where they are further processed into zinc and lead ingots. One of the residues from smelting is anode slime and another is high grade lead material, both of which are also transported to Uttarakhand facilities from which silver is processed and casted into silver ingots. The facilities in Uttarakhand, process, refine the zinc, lead and silver and distribute the finished products nationwide, making it a centralized finished goods center for our customers. Zinc and lead ingots are also shipped from the facilities in Uttarakhand for exports, although some quantities of zinc and lead ingots are also produced in Rajasthan for both domestic and export customers. The sulphuric acid
by-product
is soldex-works
from its facilities in Rajasthan to customers in India.g. | Recognition |
| • | Certified as 2.41 times water positive company. |
| • | Sixth Largest Producer of Primary Silver in the World and contribute to over 10% of our domestic demand. |
| • | 22 MW solar power project at Rampura Agucha, 12 MW at Debari and 4 MW at Dariba are all registered under Gold Standard, which is the most rigorous certification given globally for carbon offset projects. |
| • | Hindustan Zinc is included in the list of B rated companies for climate change carbon disclosure project (CDP) and A for Water CDP. |
| • | HZL actively participated in ‘Business Leaders Group COP26’ and was engaged for shaping the agenda for COP26 which was held at Glasgow (UK) in November 2021. |
| • | The Company is ranked 1st in Asia-Pacific and globally 5th in Dow Jones Sustainability Index in 2021 amongst Mining and Metal companies. (1st in environment Dimension among the metal and mining sector globally). |
| • | The Company won the 1st Bronze Medal and been featured in the prestigious Sustainability Yearbook for the fifth year in a row by S&P Global. |
57
h. | Expansion Projects |
| • | Environmental Clearance for Zawar mine expansion from 4.8 million tons to 6.5 million tons under process. |
| • | Employment visa for the people coming for Fumer commissioning is in adavanced stage. Target commissioning by Q1 of FY 2023. |
| • | MoU signed with Government of Gujarat to set up 300 KTPA greenfield zinc smelter at Doswada (coastal smelter). Detailed feasibility studies ongoing. |
Principal Facilities
Overview
The following map shows the locations of HZL’s facilities in the State of Rajasthan:
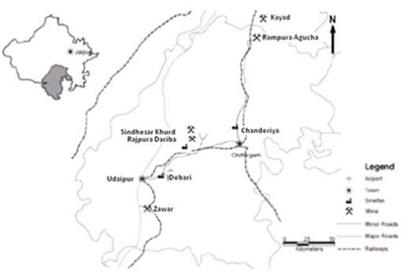
Mines
| v | Rampura Agucha |
The Rampura Agucha lead-zinc mine is located near Gulabpura in the North-west State of Rajasthan.
The good ore mineralogy of the mine provides a high metal recovery ratio and a low overall cost of production for zinc concentrate extracted from the mine. The mining and processing facilities are modern and in good condition.
The ore body is currently mined by underground methods. The open pit operation ceased from the end of March 2018. The capacity of the mine and concentrator was expanded between 2003 and 2010 to 6.2 mtpa for mine and 6.5 mtpa for mill through the purchase of additional mining equipment, upgrades to the truck fleet, improvements to the operational efficiency of the plant and the installation of a new semi-autogenous (“SAG”), mill and ball mill circuit.
In the underground mines, the ore body is mined by long hole open stoping with pastefill method and loading hauling sequence by using 60 ton truck and a
17/21-ton
loader. Ore is fed to the primary crusher and waste is disposed at the waste dump. The mining equipment is largely owner operated. The processing facility is a conventional crushing, milling and differential lead-zinc floatation plant. Ore is crushed in a series of crushing circuits and then milled in four streams. The zinc and lead concentrates produced are sent to the different smelters of HZL and the tailing portion goes to the tailings dam after thickening. Since 2004, exploration at Rampura Agucha has resulted in significant increases in the reserves at the mine. Following an extensive drilling program with an objective to upgrade mineral resources and make them reserves conversion ready, better understanding of ore body configuration, addition of mineral resources. As per subpart 1300 of Regulation S-K, R&R Statement released on March 31, 2022, the Proved and Probable Reserves are 47.0 million tons with an average grade of 11.8% zinc, 1.3% lead and 44 ppm silver net of depletion and the Measured and indicated resources are 10.3 million tons with an average garde of 14.7% zinc, 2.2% lead and 64 ppm silver and Inferred resources with 17.6 million tons with an average garde of 6% zinc, 3.6% lead and 97 ppm silver. The drill spacing for the definition of proven reserves were approximately 50 meters by 50 meters while for probable reserves was 100 meters by 100 meters. Open pit mine operation has ceased from the end of March 2018, and underground mine operations are continuously ramping up in sustaining ore production from Rampura Agucha.58
As of March 31, 2022, the estimated life of mine of Rampura Agucha is 9 years approx. based on (i) current reserves; and (ii) planned production determined based on theplan. During fiscal year 2022, the Rampura Agucha underground mine produced 4.51 million tons of ore with 11.16% zinc and 1.64% lead. It produced 454,664 tons of zinc metal in concentrate and 45,828 tons of lead metal in concentrate. The main shaft has completed up to a depth of 950 meters as planned with completion of the north and south vent.
life-of-mine
The gross book value of the Rampura Agucha mine’s fixed assets and mining equipment (including assets related to the Rampura Agucha’s underground mining operations and the Kayad mine) was 105,771 million ($ 1,394 million) as of March 31, 2022. The mining lease of Rampura Agucha mine is valid up to March 2030.
₹
Power is primarily supplied from the HZL’s captive thermal and solar power plants with two backup 5 MW generators
on-site.
| v | Rajpura Dariba |
Rajpura Dariba is an underground lead-zinc mine and processing facility located northeast of Udaipur in the Rajsamand district in the state of Rajasthan, northwest India.
Mining at Rajpura Dariba commenced in 1983 and is carried out using the vertical crater retreat method and blasting hole mining method with mined out stopes backfilled with cemented classified mill tailings. In certain areas, the ground conditions adversely affect slope stability and dilution. These ground conditions are result of the weak graphitic nature of the shear zone combined with the dissolution of fractured and sheared dolomites by percolating acidic groundwater derived for overlying adjacent oxidized zones. HZL’s Rajpura Dariba’s mine lease is valid until May 2030. The mine is serviced by two vertical shafts approximately 600 meters deep. The main shaft is 6 meters in diameter and the auxiliary shaft is 4.5 meters in diameter. The main shaft has the capacity to hoist 0.7 mtpa of ore and is equipped with a modern multi-rope koepe winder. All personnel and materials are hoisted in a large, counterbalanced cage which is operated by the koepe winder. The surface infrastructure includes ventilation fans, compressors and ore loading facilities. A 2.2 km surface decline was commissioned in September 2013 to increase the ore production.
The ore is crushed underground before being piled on the surface. It is then crushed again and milled before undergoing a lead flotation process to get final lead concentrate. Lead flotation tails are sent to the zinc flotation process to get final zinc concentrate. In one flotation the zinc rougher concentrate is being cleaned in column flotation cells. Then zinc flotation tails proceed to a backfill plant where these are cycloned with the underflow proceeding to intermediate storage where cement is added in preparation for use as underground fill. The cyclone overflow is thickened to recover water ahead of disposal in the tailings dam. The final lead and zinc concentrates are thickened, filtered and stored before they are sent to HZL’s smelters.
Power for the mine is supplied largely from HZL’s 160 MW captive power plants at Dariba and through a contract with a state-owned entity.
The gross book value of the Rajpura Dariba mine’s fixed assets and mining equipment is approximately 19,546 million ($ 258 million) as of March 31, 2022.
₹
As of March 31, 2022, HZL estimates the remaining mine life at Rajpura Dariba to be around 16 years based on (i) current reserves; and (ii) planned production which is determined based on aplan. As per subpart 1300 of Regulation S-K, R&R Statement released on March 31, 2022, the Proved and Probable Reserves are 28.9 million tons with an average grade of 4.9% zinc, 1.6% lead and 60 ppm silver net of depletion and the Measured and indicated resources are 5.3 million tons with an average garde of 7.1% zinc, 2.2% lead and 71 ppm silver and Inferred resources with 33.6 million tons with an average garde of 6.3% zinc, 1.9% lead and 96 ppm silver. An exploration program is also underway to identify new resources adding to existing mineral inventory along with resource upgradation plan with objective to increase confidence and make them classified into higher resource category so as make them reserves conversion ready. The exploration plan continues to be focused on maintaining the reserves sustained even after annual mining depletion. The drill spacing for measured resources was approximately 25 X 25m while for indicated resources is 50 x 50m
life-of-mine
The orebody is correlated with a geological
cut-off
grade of 3.0% TMC (“Total Metal Content”) (lead and zinc combined), to create mineralized envelope, the orebody contacts generally have a sharp natural contact. The average grade for each individual stope was defined incorporating design dilution and mine recovery factors. These parameters are based on a reconciliation of historical production. Stopes with average grades below derived economiccut-off
grade applied on individual 3D stope shapes were excluded and hence do not become the part of ore reserve estimates and statements. As the stopes are all accessed using the existing infrastructure and as there is sufficient capacity on the tailings dam, the capital expenditure was limited to the replacement of mining equipment and was therefore considered not to have a material impact on thecut-off
grade.In fiscal year 2022, 1.25 million tons of ore at a feed grade of 4.78% zinc and 1.08% lead ore was mined at Rajpura Dariba mine which produced 40,635 tons of zinc metal in concentrate and 7,422 tons of lead metal in concentrate.
59
| v | Sindesar Khurd |
The Sindesar Khurd mine is a large-scale underground mine deposit that was explored during 1992 to 1995. Mine production began at the Sindesar Khurd mine in April 2006 and HZL’s mining permit is valid until March 2049. The Sindesar Khurd mine lies on the same geological belt as the Rajpura Dariba mine. The mine is approachable from Rajpura Dariba mines by road.
The mineralization has been traced over almost 2.5 kilometers along strike and 1.3 kilometer vertical extension. In the mine area, dip is steep westerly, while the dip turns into easterly direction in the lower-southern part of the deposit. The current “mine block” extends over 1,500 meters along strike and up to 570 meters depth extension.
The deposit has been drilled to a depth of approximately 1,300 meters below surface and the ore body is traced over approximately 2 kilometers along with the strike with an 1,100 meters vertical extension. While the deposit is still open in depth in the southern extension of the present mine block, the area below the mine block and towards the north extension only has narrow and low to moderate grade mineralization intersected.
Exploration at the south part of Sindesar Khurd has been continuing since March 2005 with a drilling program aimed at increasing the size of the ore body. A continuous exploration program from underground is also underway with the aim to upgrade the reserve status so that the stopes planned to be mined out shall be extracted with maximum recovery and thereby reducing mining losses. The drill spacing for proven reserves was 12.5 to 25 meters while for probable reserves was less than 25 to 50 meters.
As per subpart 1300 of Regulation S-K. R&R Statement released on March 31, 2022, the Proved and Probable Reserves are 45.4 million tons with an average grade of 3.0% zinc, 2.0% lead and 100 ppm silver net of depletion and the Measured and indicated resources are 43.8 million tons with an average garde of 4% zinc, 2.2% lead and 111 ppm silver and Inferred resources with 15.5 million tons with an average garde of 3.4% zinc, 1.9% lead and 96 ppm silver.
Access to the mine is through shaft and declines (North and South) from the surface while ore is hauled through the declines by low profile dump trucks or LPDTs. The ore body is accessed via horizontal drives on number of levels. The mine currently utilizes blast holes toping with back filling mining method with stope panels varying from 25 to 50 meters in strike.
Ore produced from the mine is treated at 2.0 mmtpa beneficiation plant commissioned in 2011 at Sindesar Khurd. The beneficiation plant underwent debottlenecking in January 2015 to increase its capacity from 2 to 2.8 mtpa at Sindesar Khurd. Lead and zinc concentrates are sent to their respective high-rate thickeners installed separately for lead concentrate and zinc concentrate generated from the concentrator. At Sindesar Khurd mine, the new 1.5 mtpa capacity beneficiation plant was commissioned in January 2017 which has increased the mine’s total beneficiation capacity to 4.3 mtpa. In fiscal year 2019, another 1.5 mtpa beneficiation plant was commissioned which is taking the total milling capacity to 6.2 mtpa. Tailing dewatering and disposal section comprises of hydro cyclone, tailing thickener, neutralization tank, pumping ofpond and reclaimed water pumping.
tailing-to-tailing
Lead and zinc concentrates are thickened, filtered and stored before they are sent to HZL’s smelters. Power for the mill and the mine is supplied from HZL’s captive power plant located at Dariba itself. The gross book value at this mine is approximately 72,012 million ($ 949 million) as of March 31, 2022.
₹
As of March 31, 2022, HZL estimates the remaining mine life at Sindesar Khurd to be around 8 years based on (i) reserves; and (ii) planned production which is determined based on a life of mine plan.
In fiscal year 2022, 5.23 million tons of ore at a grade of 3.33% zinc and 2.02% lead ore was mined at the Sindesar Khurd mine. From the ore produced at Sindesar Khurd mine 166,378 tons of zinc metal in concentrate and 97,353 tons of lead metal in concentrate was produced in fiscal year 2022.
| v | Zawar |
Zawar consists of four mines namely, Mochia, Balaria, Zawar Mala and Baroi. The deposit is located near Udaipur city, in the state of Rajasthan in northwest India. The deposits lie within a 36.2 square kilometers mining lease granted by the state government of Rajasthan which is valid until March 31, 2030.
The mineralization ranges over 2.5 to 3.0 kilometers each at Mochia, Balaria and Baroi mines each and 0.6 kilometers at Zawarmala mine. The mineralization ranges below 1 kilometer vertically, while the deposit is still open in depth. An exploration program from the surface and underground is ongoing for lateral and depth extension along with upgrading the resource to reserve.
The mines are accessed through adit, shaft and declines from the surface, while ore is hauled through decline by LPDTs, shaft and locomotivesThe ore body is accessed through horizontal drives on a number of levels. The mine currently utilizes a
.
sub-level
open stoping mining method with stope sizes ranging from 60 to 80 meters in strike.60
As per subpart 1300 of Regulation S-K. R&R Statement released on March 31, 2022, the Proved and Probable Reserves are 37.9 million tons with an average grade of 2.8% zinc, 1.2% lead and 23 ppm silver net of depletion and the Measured and indicated resources are 36.8 million tons with an average garde of 3.4% zinc, 2% lead and 28 ppm silver and Inferred resources with 79.3 million tons with an average garde of 3.6% zinc, 2.1% lead and 34 ppm silver.
Ore produced from the mine is treated at a beneficiation plant at Zawar mines for differential or bulk flotation of zinc and lead metals. The beneficiation plant has undergone debottlenecking to increase its capacity from 1.5 to 2.7 mtpa. Another beneficiation plant having capacity of 2 mtpa was commissioned in fiscal year 2019, increasing capacity to 4.7 mtpa at Zawar. The ore is primarily crushed underground and then hoisted to the surface or crushed at the surface and then transported to beneficiation plant. Thereafter the ore is crushed to 12 to 15 mm in size before being milled to 74 microns. Tailing dewatering and disposal section comprises of hydro cyclone, tailing thickener, pumping of tailings to tailing pond and reclaimed water pumping for reuse. Lead and zinc concentrates are thickened, filtered and then stored before they are sent to HZL’s smelters.
In fiscal year 2022, 4.41 million tons of ore mined at a grade of 2.45% zinc and 1.55% lead, which produced 99,673 tons of zinc metal in concentrate and 60,838 tons lead metal in concentrate.
The gross book value of the Zawar fixed assets and mining equipment was approximately 46,132 million ($ 608 million) as of March 31, 2022.
₹
Power is supplied through a combination of an 91.5 MW thermal coal-based captive power plant initially commissioned in December 2008 and a 6 MW captive power plant.
As of March 31, 2022, HZL estimates the remaining mine life of the Zawar mine to be 8 years based on (i) current reserves; and (ii) planned production which is determined based on aplan. The focus of underground mine exploration at Zawar is to enhance the ore reserves and expand the mine life by 3 years while surface exploration is mainly focused to identify new mineralized areas and exploring the extension areas of existing mineralization in strike as well as in depth and enhance mineral inventory. Underground exploratory drilling is carried out on a grid of between 25 to 30 meters as a infill drilling from existing development for final delineation of ore bodies.
life-of-mine
| v | Kayad Mine |
The Kayad lead—zinc mine is located in Ajmer, in the state of Rajasthan.
The Kayad lead—zinc mine deposit was initially prospected by Airborne Mineral Survey and Exploration wing of Geological Survey of India and drilling commenced in August 1988 and was completed in December 1991. The detailed exploration of Kayad deposit was commenced by HZL in the month of June 1999 and continues with a total of 178 kilometers in 1,132 drill holes. According to the reserve report, the proven and probable reserves. As per subpart 1300 of Regulation S-K. R&R Statement released on March 31, 2022, the Proved and Probable Reserves are 1.93 million tons with an average grade of 7.6% zinc, 0.9% lead and 18 ppm silver net of depletion and the Measured and indicated resources are 2.6 million tons with an average garde of 8% zinc, 1.1% lead and 21 ppm silver and Inferred resources with 2.4 million tons with an average garde of 6.6% zinc, 0.9% lead and 14 ppm silver. As of March 31, 2022, HZL estimates the remaining mine life of the Kayad Mine to be 2 years based on (i) current reserves; and (ii) planned production which is determined based on aplan.
life-of-mine
The groundbreaking of the mine commenced on June 11, 2011. The access is through a decline which divides into two declines at 420 meters reduce level. Development ore production was achieved in the second quarter of fiscal year 2013, and the mine started operations in fiscal year 2014. The mining method practiced in Kayad is long hole open stoping with cemented rock filling or rock filling in the steeper portions of the deposit; while transverse stoping method at flat portion along with cemented rock filling or rock filling. About 61.5 kilometers of development is planned by 2021. The mining is highly mechanized with twin boom jumbo drills used for face drilling, rock bolting machines used for support and 17 tons, and 21 tons diesel load haul dump vehicles coupled with 30 tons, 50 tons and 60 tons low profile dump trucks for loading and hauling. For production, drilling Simba and Solo Drills are being used. The run of mine is stacked in the surface ore stockpile and transported by trucks to the Rampura Agucha mine for beneficiation.
A mine lease of 480.5 hectares was granted to Kayad mine by the state of Rajasthan and is valid until February 2048, subject to further renewal. We have obtained surface land rights over 49.8 hectares. We have also obtained mine plan approval from the Indian Bureau of Mines and received environmental clearance from the MoEF&CC for an increase in lead—zinc ore production capacity from 1.0 mtpa to 1.2 mtpa. We have also obtained consents under various environmental laws to operate the mine, including from the State Pollution Control Board.
In fiscal year 2022, 0.93 million tons of ore at a grade of 4.57% zinc and 0.66% lead ore was mined at Kayad mine which produced 39,685 tons of zinc metal in concentrate and 4,582 tons of lead metal in concentrate. A 33 KV power line was commissioned on February 2, 2012, to meet the constructional power requirements of the mine. Currently, most of the power is being taken from captive power plant in Zawar and some power is taken from state grid. A one megavolt amperes diesel generator is kept as a backup power supply for emergency operations in the event of power failure. For proper power distribution, a two megavolt amperes underground
sub-station
is commissioned in each of the north and south sections.61
Summary of Mine Reserves
The following table shows our proved and probable zinc, lead and silver as of March 31, 2022 prepared in accordance with Subpart 1300 of Regulation S-K:
Proven Reserves | Probable Reserves | Total Proven and Probable Reserves | ||||||||||||||||||||||||||||||||||||||||||||||||||||||
Mine | Quantity | Zinc Grade | Lead Grade | Silver Grade | Quantity | Zinc Grade | Lead Grade | Silver Grade | Quantity | Zinc Grade | Lead Grade | Silver Grade | Limited Ownership | Reserve Life | ||||||||||||||||||||||||||||||||||||||||||
(million tons) | (%) | (%) | (g/t) | (million tons) | (%) | (%) | (g/t) | (million tons) | (%) | (%) | (g/t) | % | Years | |||||||||||||||||||||||||||||||||||||||||||
Rampura Agucha | 14.7 | 12.4 | 1.8 | 65 | 32.3 | 11.6 | 1.1 | 35 | 47.0 | 11.8 | 1.3 | 44 | 64.9 | 9 | ||||||||||||||||||||||||||||||||||||||||||
Rajpura Dariba | 5.8 | 5.3 | 1.4 | 66 | 23.1 | 4.8 | 1.6 | 59 | 28.9 | 4.9 | 1.6 | 60 | 16 | |||||||||||||||||||||||||||||||||||||||||||
Sindesar Khurd | 21.4 | 3.3 | 2.4 | 125 | 24.0 | 2.8 | 1.6 | 78 | 45.4 | 3.0 | 2.0 | 100 | 8 | |||||||||||||||||||||||||||||||||||||||||||
Zawar | 23.5 | 2.8 | 1.2 | 23 | 14.4 | 2.8 | 1.2 | 24 | 37.9 | 2.8 | 1.2 | 23 | 8 | |||||||||||||||||||||||||||||||||||||||||||
Kayad | 0.6 | 6.9 | 1.1 | 20 | 1.3 | 7.9 | 0.8 | 16 | 1.9 | 7.6 | 0.9 | 18 | 2 | |||||||||||||||||||||||||||||||||||||||||||
Total | 66.0 | 5.3 | 1.7 | 69 | 95.2 | 6.3 | 1.4 | 50 | 161.2 | 5.9 | 1.5 | 58 | 64.9 | |||||||||||||||||||||||||||||||||||||||||||
References to “g/t” are grams per ton
Additional information:
| 1. | The reserve estimates for each of the mines have been prepared by the mining engineer of the respective operation and the same have been audited by ABGM. The reserves presented for the HZL mines have been adjusted to incorporate losses for mine dilution and mining recovery according to the subpart 1300 of regulation S-K. A comprehensive site visit was conducted in the week of July 17 to July 25, 2022. The objectives of the site visits were to conduct the following: |
| • | Physical verification of the mining operations and onsite infrastructure. |
| • | Obtain outstanding information required to complete the technical report. |
| • | Interact with the mine technical team to obtain further clarifications. |
Three consultants from ABGM attended the site visits at the various mines.
| • | Devendra Vyas: Managing Director and Principal Mining Engineer |
| • | Andre van der Merwe: General Manager and Principal Consultant (Geophysics, Hydrogeology, Geology, Mineral Processing and Environmental Engineering) |
| • | Pieter Groenewald: Head – Technical Services and Principal Consultant (Rock Engineering and Hydrogeology) |
Dr Heather King who reviewed the Mineral Resource estimates and statements is independent of HZL and registered as a professional with the South African Council for Natural Scientific professions (SACNASP) and the Geological Society of South Africa (GSSA). Dr Heather King is suitably qualified and experienced to act as the Qualified Person for the Mineral Resources. Dr Heather King was unable to visit the site.
| 2. | The dynamic cut-off grade in terms of zinc equivalent was used for calculating reserves and resources. The zinc equivalentcut-off grade for (i) Rampura Agucha mine is 3.46% for main lens and 3.68% for galena lenses (lead equivalent), (ii) Rajpura Dariba is 2.82%, (iii) Sindesar Khurd is 2.17%, (iv) Zawar is 2.00% and (v) Kayad Mines is 2.72%. |
| 3. | The metallurgical recovery factor for the following HZL mines is as follows: |
Mine | Metallurgical Recovery Factor | |||
Rampura Agucha | ||||
Zinc | 95.96 | % | ||
Lead | 94.75 | % | ||
Rajpura Dariba | ||||
Zinc | 96.39 | % | ||
Lead | 95.91 | % | ||
Sindesar Khurd | ||||
Zinc | 96.16 | % | ||
Lead | 97.57 | % | ||
Zawar | ||||
Zinc | 95.37 | % | ||
Lead | 96.92 | % | ||
| 4. | The commodity price for zinc, lead and silver considered for the evaluation of reserves is $ 2,759 per ton, $ 2,057 per ton and $ 21.24 per ounce (“oz”), respectively. The currency conversion factor used to estimate the reserves was US dollars per Indian Rupees 76.65. |
| 5. | The reserve quantities disclosed are for the entire mine. |
Smelters
Overview
The following table sets forth the total capacities as of March 31, 2022 at HZL’s Chanderiya, Debari, Zawar, Dariba and Pantnagar facilities:
Facility | Capacity | |||||||||||||||||||
Zinc | Lead | Silver | Sulphuric Acid | Captive Power | ||||||||||||||||
(tpa) | (tpa) | (tpa) | (tpa) | (MW) | ||||||||||||||||
Chanderiya | 585,000 | 90,000 | — | 859,000 | 259.2 | |||||||||||||||
Dariba | 240,000 | 120,000 | — | 710,500 | 189.67 | |||||||||||||||
Debari | 88,000 | — | — | 387,600 | 7.3 | |||||||||||||||
Pantnagar (1) | — | — | 800 | — | — | |||||||||||||||
Zawar | — | — | — | — | 90 | |||||||||||||||
Total | 913,000 | 210,000 | 800 | 1,957,100 | 546.17 | |||||||||||||||
| (1) | The processing plant at Pantnagar is a refining and processing facility for zinc and lead ingots from zinc and lead cathodes produced at the Chanderiya and Dariba smelters. Therefore, their production capacities do not increase the total production capacity of HZL’s facilities. |
The following table sets out HZL’s mineral resources attributable into Measured, indicated and inferred resources as of March 31, 2022:
Measured resources | Indicated resources | Measured and Indicated resource | Inferred resources | |||||||||||||||||||||||||||||||||||||||||||||||||||||||||||||
Mine | Quantity tons) | Grade | Quantity tons) | Grade | Quantity tons) | Grade | Quantity tons) | Grade | ||||||||||||||||||||||||||||||||||||||||||||||||||||||||
Zinc | Lead | Silver | Zinc | Lead | Silver | Zinc | Lead | Silver | Zinc | Lead | Silver | |||||||||||||||||||||||||||||||||||||||||||||||||||||
| (%) | (%) | (%) | (%) | |||||||||||||||||||||||||||||||||||||||||||||||||||||||||||||
Rampura Agucha | 10.2 | 14.7 | 2.2 | 64 | 0.1 | 17.6 | 3 | 80 | 10.3 | 14.7 | 2.2 | 64 | 17.6 | 6 | 3.6 | 97 | ||||||||||||||||||||||||||||||||||||||||||||||||
Rajpura Dariba | 3 | 7.3 | 2.1 | 68 | 2.2 | 6.8 | 2.4 | 74 | 5.3 | 7.1 | 2.2 | 71 | 33.6 | 6.3 | 1.9 | 96 | ||||||||||||||||||||||||||||||||||||||||||||||||
Sindesar khurd | 29.9 | 4.3 | 2.6 | 134 | 13.9 | 3.3 | 1.5 | 62 | 43.8 | 4 | 2.2 | 111 | 15.5 | 3.4 | 1.9 | 96 | ||||||||||||||||||||||||||||||||||||||||||||||||
Zawar | 26.4 | 3.4 | 2 | 29 | 10.3 | 3.2 | 2 | 27 | 36.8 | 3.4 | 2 | 28 | 79.3 | 3.6 | 2.1 | 34 | ||||||||||||||||||||||||||||||||||||||||||||||||
Kayad | 0.2 | 9.6 | 1.6 | 33 | 2.4 | 7.9 | 1.1 | 20 | 2.6 | 8 | 1.1 | 21 | 2.4 | 6.6 | 0.9 | 14 | ||||||||||||||||||||||||||||||||||||||||||||||||
Total | 69.7 | 5.6 | 2.3 | 81 | 28.9 | 4 | 1.7 | 47 | 98.8 | 5.2 | 2.1 | 71 | 148.4 | 4.5 | 2.2 | 62 | ||||||||||||||||||||||||||||||||||||||||||||||||
62
Chanderiya
The Chanderiya facility is located approximately 120 kilometers east of Udaipur in the state of Rajasthan. The facility contains 4 smelters, 3 associated captive power plants and 3 sulphuric acid plants:
| • | an ISP ™ pyrometallurgical lead-zinc smelter with a capacity of 105,000 tpa of zinc and 35,000 tpa of lead that was commissioned in 1991; |
| • | two RLE hydrometallurgical zinc smelters with a capacity of 240,000 tpa each that were commissioned in May 2005 and December 2007. Pursuant to the improvement in operational efficiencies and debottlenecking of plant, zinc smelting capacity of both the plants increased from 170,000 tpa to present; |
| • | an Ausmelt ™ lead smelter with a capacity of 50,000 tpa that was commissioned in February 2006 which is further increased to 55,000 tpa in FY 2020; |
| • | associated 154 MW (2 captive plants of 77 MW each) and 80 MW coal-based captive power plants (whose capacity is further increased to 91.5 MW in October 2021) commissioned in May 2005 and April 2008, respectively; |
| • | a 14.8 MW fuel based captive power plant transferred from Debari in March 2009 and which was originally commissioned at Debari in March 2003; and |
| • | 3 sulphuric acid plants with a total capacity of 859,000 tpa of sulphuric acid. |
Concentrate requirements for the facility are supplied by HZL’s mines. The 154 MW and 91.5 MW thermal power plant along with 13.7 MW WHRB (Waste Heat Recovery Boilers) power generation facility at Chanderiya provide all of the power for the facility. In addition, two liquid fuel power generation capacity of 14.8 MW are also available. The captive power plants require approximately 105,000 metric tons of coal at 6,000 gross calorific value (“GCV”) per month, which is currently met through imports and domestic sources. The impure silver obtained as a
by-product
fromzinc-lead
smelting at this smelter is refined at the Pantnagar plant.Dariba
The Dariba hydrometallurgical zinc smelter is located in the Rajsamand district of Rajasthan which was commissioned in March 2010 having capacity of 220,000 tpa which has increased to 234,000 tpa pursuant to debottlenecking of plant in fiscal year 2019 and further increased to 240,000 in fiscal year 2020. The Dariba facility also includes a 306,000 tpa sulphuric acid plant. In July 2011, we commissioned a new 100,000 tpa lead smelter and pursuant to the improvement in operational efficiencies which was completed in March 2018, the capacity increased by 20,000 tpa to 120,000 tpa. It also includes a 98,500 tpa sulphuric acid plant. A majority of the power requirements of the facility is sourced from the 170 MW coal-based captive power plant and 19.67 MW WHRB power generation facility at Dariba. A new roaster was commissioned in April 2013 in the Dariba facility with an associated sulphuric acid plant capacity of 306,000 tpa. Zinc cathodes are sent to its refining facilities at Pantnagar in Uttarakhand state for refining and processing. The anode slime obtained as a residue from lead smelting at this smelter is refined and processed into silver ingots at the Pantnagar plant.
Debari
The Debari hydrometallurgical zinc smelter is located in the state of Rajasthan. The hydrometallurgical zinc smelter was commissioned in 1968, uses RLE technology and has a capacity of 80,000 tpa which was increased to 88,000 tpa in April 2008, pursuant to improvements made to its operational efficiencies. The Debari facility also includes a 387,600 tpa sulphuric acid plant. A majority of the power requirements of the facility is sourced from the coal-based captive power plant at Chanderiya and Zawar and 7.3 MW WHRB power generation facility. In addition, 2 liquid fuel-based power generation capacity of 14.8 MW are also available.
Haridwar
The zinc ingot processing and refining plant in Haridwar in the state of Uttarakhand was commissioned in July 2008. This plant processes and casts zinc ingots from zinc cathodes produced in the Chanderiya smelter and therefore its production capacity does not increase the total production capacity of HZL’s facilities. After expiry of tax holiday benefit, production activities have stopped at the smelter in fiscal year 2018.
Pantnagar
The Pantnagar plant, which is located in the state of Uttarakhand in northwest India, includes a 518 tpa silver refinery that was commissioned in December 2011, a zinc ingot and a lead ingot refining and processing plant that was commissioned in February 2012. Pursuant to the improvement in operational efficiencies and debottlenecking of existing facility, which was completed in March 2019, the Silver smelting capacity increased by 282 tpa (82 tpa in FY 2018 and 200 tpa in FY 2019) to 800 tpa. The Pantnagar plant refines and processes zinc and lead ingots from zinc and lead cathodes that are produced by our Chanderiya and Dariba smelters and also refines the impure silver obtained as a
by-product
from lead smelting conducted at our Chanderiya and Dariba smelters. Therefore, the Pantnagar plant does not increase the total zinc and lead production capacity of HZL’s facilities. Haridwar and Pantnagar facility is also used for nationwide distribution of finished goods as well as for exports.63
Production Volumes
The following table sets out HZL’s total production from its Chanderiya, Debari, Dariba and the Pantnagar facilities for fiscal years ended March 31, 2020, 2021 and 2022:
For the Year Ended March 31, | ||||||||||||||
Facility | Product | 2020 | 2021 | 2022 | ||||||||||
(tons, except for silver which is in kgs) | ||||||||||||||
Chanderiya | ||||||||||||||
ISP TM pyrometallurgical lead-zinc smelter | Zinc | 21,505 | (1,239 | ) | 35,918 | |||||||||
| Lead | 54,963 | 62,512 | 52,467 | |||||||||||
| Silver | — | — | — | |||||||||||
First hydrometallurgical zinc smelter | Zinc | 194,354 | 212,259 | 215,986 | ||||||||||
| Zinc | 209,921 | 220,608 | 224,966 | |||||||||||
Ausmelt TM lead smelter | Lead | 39,953 | 32,478 | 42,517 | ||||||||||
Sulphuric acid plants | Sulphuric acid | 546,001 | 512,980 | 528,711 | ||||||||||
Dariba | ||||||||||||||
Hydrometallurgical zinc smelter | Zinc | 200,689 | 214,465 | 231,721 | ||||||||||
Lead Smelter | Lead | 86,454 | 119,409 | 96,201 | ||||||||||
Sulphuric acid plant | Sulphuric acid | 426,623 | 516,687 | 567,958 | ||||||||||
Debari | ||||||||||||||
Hydrometallurgical zinc smelter | Zinc | 61,817 | 69,353 | 67,217 | ||||||||||
Sulphuric acid plant | Sulphuric acid | 267,844 | 280,296 | 277,711 | ||||||||||
Pantnagar | ||||||||||||||
Silver Refinery | Silver | 609,808 | 705,676 | 647,014 | ||||||||||
Total | Zinc | 688,286 | 715,446 | 775,808 | ||||||||||
Lead (1) | 181,370 | 214,399 | 191,185 | |||||||||||
Silver | 609,808 | 705,676 | 647,014 | |||||||||||
Sulphuric acid | 1,240,468 | 1,309,963 | 1,374,380 | |||||||||||
| (1) | Excludes lead containing a high content of silver (high silver lead) produced from the pyrometallurgical lead-zinc smelter for captive use, which was 7,088 tons, 6,424.40 tons and 6,951 tons in fiscal years 2020, 2021 and 2022 respectively. |
The following table sets out HZL’s total ore, zinc concentrate, lead concentrate and bulk concentrate production for fiscal years ended March 31, 2020, 2021 and 2022:
Year Ended March 31, | ||||||||||||||
Mine (Type of Mine) | Product | 2020 | 2021 | 2022 | ||||||||||
(tons, except percentages) | ||||||||||||||
Rampura Agucha (Underground) | Ore mined | 3,940,097 | 4,272,902 | 4,511,122 | ||||||||||
| Ore grade – Zinc | 11.13 | % | 10.89 | % | 11.16 | % | ||||||||
| Lead | 1.62 | % | 1.61 | % | 1.64 | % | ||||||||
| Recovery – Zinc | 87.36 | % | 88.84 | % | 90.32 | % | ||||||||
| Lead | 52.55 | % | 55.57 | % | 62.75 | % | ||||||||
| Zinc concentrate | 767,935 | 832,646 | 900,085 | |||||||||||
| Lead concentrate | 60,695 | 67,764 | 73,563 | |||||||||||
Kayad (Underground) | Ore mined | 1,139,071 | 1,174,825 | 933,951 | ||||||||||
| Ore grade – Zinc | 6.86 | % | 5.15 | % | 4.57 | % | ||||||||
| Lead | 0.92 | % | 0.80 | % | 0.66 | % | ||||||||
| Recovery – Zinc | 93.05 | % | 93.17 | % | 93.72 | % | ||||||||
| Lead | 72.53 | % | 74.21 | % | 74.85 | % | ||||||||
| Zinc concentrate | 138,219 | 110,447 | 78,166 | |||||||||||
| Lead concentrate | 13,143 | 11,772 | 7,570 | |||||||||||
Rajpura Dariba (Underground) | Ore mined | 1,037,608 | 1,215,169 | 1,252,363 | ||||||||||
| Ore grade – Zinc | 4.85 | % | 4.60 | % | 4.78 | % | ||||||||
| Lead | 1.18 | % | 1.22 | % | 1.08 | % | ||||||||
| Recovery – Zinc | 84.24 | % | 84.41 | % | 84.94 | % | ||||||||
| Lead | 69.33 | % | 69.64 | % | 68.46 | % | ||||||||
| Zinc concentrate | 78,365 | 81,375 | 83,098 | |||||||||||
| Lead concentrate | 19,119 | 21,838 | 19,859 | |||||||||||
Sindesar Khurd (Underground) | Ore mined | 5,077,646 | 4,842,264 | 5,230,479 | ||||||||||
| Ore grade – Zinc | 3.37 | % | 3.39 | % | 3.33 | % | ||||||||
| Lead | 2.05 | % | 2.20 | % | 2.02 | % | ||||||||
| Recovery – Zinc | 91.27 | % | 91.81 | % | 92.22 | % | ||||||||
| Lead | 88.83 | % | 90.00 | % | 88.65 | % | ||||||||
| Zinc concentrate | 325,195 | 318,820 | 343,288 | |||||||||||
| Lead concentrate | 166,776 | 173,017 | 167,725 | |||||||||||
Zawar (Underground) | Ore mined | 3,270,668 | 3,951,282 | 4,410,641 | ||||||||||
| Ore grade – Zinc | 2.52 | % | 2.48 | % | 2.45 | % | ||||||||
| Lead | 1.94 | % | 1.83 | % | 1.55 | % | ||||||||
| Recovery – Zinc | 86.29 | % | 90.57 | % | 91.98 | % | ||||||||
| Lead | 84.05 | % | 86.12 | % | 89.03 | % | ||||||||
| Zinc concentrate | 139,241 | 170,706 | 189,450 | |||||||||||
| Lead concentrate | 92,014 | 102,535 | 99,324 | |||||||||||
Total | Ore mined | 14,465,090 | 15,456,442 | 16,338,556 | ||||||||||
Zinc concentrate | 1,448,955 | 1,513,994 | 1,594,087 | |||||||||||
Lead concentrate | 351,747 | 376,926 | 368,041 | |||||||||||
64
Principal Raw Materials
The principal inputs of HZL’s zinc smelting business are zinc and lead concentrates and power. HZL has in the past been able to secure an adequate supply of the principal inputs for its business.
| o | Zinc and Lead Concentrates |
Zinc and lead concentrates are the principal raw material of HZL’s smelters. HZL’s lead-zinc mines have provided all of its requirements for zinc and lead concentrates in fiscal year 2022. We expect HZL’s mines to continue to provide nearly all of its zinc and lead concentrate requirements for the foreseeable future.
| o | Power |
Most of HZL’s operations are powered by the coal-based captive power plants at Chanderiya, Dariba and Zawar. HZL imports the required thermal coal from a number of third-party suppliers and part of the requirement is sourced by way of linkage with Southeastern Coalfields Limited (a subsidiary of Coal India Limited), Western Coal Field and Northern Coal Field (“NCL”).
In past, the coal supplies to Chanderiya had stopped due to pending decision at Ministry of Coal on the linkage supply to plants which have been allocated coal blocks. In February 2014, the coal block allocated to the Chanderiya lead zinc smelter captive power plant was deallocated by the Ministry of Coal. As of January 2016, the coal supplies to Dariba captive power plant stopped due to the expiry of the existing fuel supply agreement and further renewal of such agreement has not yet been sanctioned by Southeastern Coalfields Limited. Linkage coal supplies to HZL’s power plants at Zawar are continuing and the linkage quantity for these plants has been restricted to 50.0% of 0.4 million tons. The remaining coal requirements are met through the import of coal from various countries.
HZL currently has Fuel Supply Agreement (“FSA”) of 0.9 million tons of coal linkage with Ministry of Coal for the supply of Coal. The FSA was signed in September 2017 with Ministry of Coal for coal supplies to Chanderiya and Dariba. Also, a new FSA was signed for Chanderiya in February 2019 from NCL.
HZL Captive Power Plant operations in lieu of short supply of linkage coal from Coal India Limited (CIL) and to cater 100.0% requirement for Coal, is met by sourcing imported coal from various sources/origin around the globe on long term/ spot basis with remaining operations source their required power from existing Captive Power Plants or from local power companies.
| o | Metallurgical Coke |
In addition, HZL’s pyrometallurgical smelter at Chanderiya and lead smelter at Dariba requires metallurgical coke that is used in the smelting process. HZL currently sources its metallurgical coke requirements from third parties under long-term/spot contracts and the open market.
Distribution, Logistics and Transport
Zinc and lead concentrates from HZL’s lead-zinc mines are transported to the Chanderiya and Debari smelters by road. Zinc and lead ingots, silver and sulphuric acid
by-products
are transported primarily by road to customers in India directly or via HZL’s depots. Zinc and lead cathodes are mostly transported by rail to its processing and refining facilities in Uttarakhand state in northern India. Zinc and lead ingots are transported for exports to ports in India primarily by rail, from where they are loaded on ships. The facilities in Uttarakhand also serve as finished goods center for nationwide distribution of its finished products.Sales and Marketing
HZL’s 10 largest customers accounted for approximately 33.7%, 26.5% and 26.8% of its revenue in fiscal years 2020, 2021 and 2022 respectively. No customer accounted for greater than 10.0% of HZL’s zinc business revenue in fiscal year 2020 and 2022. One customer accounted for greater than 10% of HZL’s zinc business revenue in fiscal years 2021.
HZL’s marketing office is located in Mumbai, and it has field sales and marketing offices in most major metropolitan centers in India. In fiscal year 2022, HZL sold approximately 65% of the zinc metal it produced in the Indian market and exported approximately. 35% of our Zinc India segment revenue. In lead metal, approximately 87% of total sales was made by HZL in the domestic market, while the remainder of approximately 13% was exported.
In fiscal year 2022, HZL accounted for more than 90% of domestic sales of zinc metal under annual contracts and approximately 68% of export sales under annual contracts specifying quantity, grade and price, with the remainder sold on the spot market. The contract sales price is linked to prevailing LME price with an additional physical market premium.
65
Projects and Developments
HZL has been actively conducting exploration, which has resulted in net ore reserves of 150.3 million tons across all mines in fiscal year 2021. Based on long-term evaluation of assets and in consultation with mining experts, we have finalized the next phase of growth, which will involve sinking of underground shafts and developing underground mines. The plan comprises developing a 4.5 mmtpa underground mine at Rampura Agucha mine and expanding the Sindesar Khurd mine from 2.0 mmtpa to 6.0 mmtpa, Zawar mines from 1.2 mmtpa to 4.5 mmtpa, Rajpura Dariba mine from 0.6 mmtpa to 2.0 mmtpa and Kayad mine from 0.4 mmtpa to 1.2 mmtpa. The growth plan will increase mined metal production capacity to 1.25 mmtpa. The estimated cost for these projects amounts to 122,100 million ($ 1,669 million). HZL spent 2,940 million ($ 39 million) on these projects in fiscal year 2022.
₹
₹
Market Share and Competition
HZL is the largest primary zinc producer in India, with a 83% market share in FY 2022, according to the International Zinc Association. Around 65% of the refined zinc produced by HZL’s smelters is sold in the domestic market, and the rest is being exported to South-East Asian and Middle Eastern markets. Over 70% of the Indian zinc demand comes from galvanising steel, predominantly used in the construction and infrastructure sectors. HZL also produces CGG, EPG and two grades of zinc for use in
die-casting
alloys. The Company is working closely with its customers to increase the proportion of VAP in its zinc portfolio. It strives to increase the supply of VAP to 25% of total zinc sales in FY 2022, from 16% in fiscal year 2021.Our Business
Our zinc international business comprises THL Zinc Namibia Holdings (Proprietary) Limited (“Skorpion”), which owns the Skorpion mine and refinery in Namibia and Black Mountain Mining (“BMM”), which owns the Black Mountain mine and the Gamsberg mine in South Africa.
I. | Skorpion |
Overview
Skorpion was incorporated on June 16, 1998 and is headquartered at the Skorpion Zinc mine site, which is situated 25 kilometers north of Rosh Pinah Namibia. Skorpion’s wholly owned subsidiaries are: Skorpion Zinc (Proprietary) Limited, Namzinc (Proprietary) Limited, Amica Guesthouse (Proprietary) Limited and Skorpion Mining Company (Proprietary) Limited. Skorpion Zinc (Proprietary) Limited is an investment holding company, owning the entire share capital in Namzinc (Proprietary) Limited and Skorpion Mining Company (Proprietary) Limited. On March 31, 2020 the mine was put into care and maintenance and on April 30, 2020, the refinery was also put into care and maintenance. Up and till being put into care and maintenance, Namzinc (Proprietary) Limited operated a zinc refinery, which procures oxide zinc ore from Skorpion Mining Company (Proprietary) Limited, which in turn extracted the ore from an open pit zinc deposit. Skorpion Mining Company (Proprietary) Limited is a member of the Chamber of Mines in Namibia.
Principal Products
Skorpion produced SHG zinc ingots of LME grade. Skorpion offered the product to customer’s primarily through short term or spot contracts, covering the sale of all zinc ingots produced at the integrated mine and refinery of Skorpion.
Principal Facilities
The following map shows the location of Skorpion mines in Namibia:
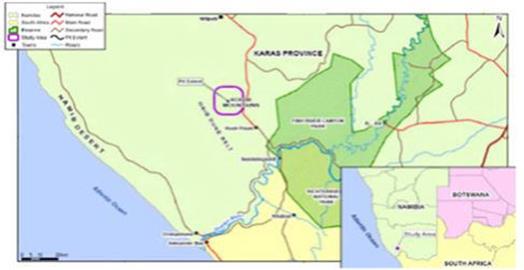
66
Mines
Skorpion Mines
The Skorpion Zinc Deposit is located in the southern Namib Desert of Namibia, approximately 20 kilometers north-west of the small mining town of Rosh Pinah, 75 kilometers from the Atlantic coastline, and about 40 kilometers from the perennial Orange River, which forms the border with South Africa. The deposit lies just inside the “Sperrgebiet” or forbidden area, now known as Diamond Area 1. The extracted ore is sent to the refinery for further processing.
As of March 31, 2022, the remaining mine life of the Skorpion mine is approximately 14 months (excluding the period the mine is put into care and maintenance) based on (i) reserves; and (ii) planned production which is determined on the basis of aplan. The Skorpion mine has an attached electrolytic refinery with the capacity to produce approximately 150,000 tons of SHG zinc ingots annually. Further opportunities to extend the life of the mine are currently being evaluated based on the sulphide ore bodies in the nearby areas. On March 31, 2020, the board approved a request from management to spend $ 1 million (increased to $ 2 million in December 2020) to refresh the feasibility study that was previously performed for the refinery conversion project in order to treat sulphide zinc concentrate from the Gamsberg Mine in South Africa owned by Namzinc’s sister company, Black Mountain Mining (Proprietary) Limited, and start prework for the conversion. Further, Namzinc Board has approved another $ 1 million pre project capital expenditure in FY 2021 to strengthen the Refinery Conversion feasibility to bring it to final stage for board approval.
life-of-mine
Significant progress has been made to make the Refinery Conversion Project economically feasible which include 1) two technology partners (licensors) have completed their technical studies and issued reports; 2) An engineering technical feasibility and bankable feasibility study has been also completed by external parties; 3) Project capital expenditure and business case has been finalized based on the information from the feasibility studies; 4) Management are in the final stages of negotiation with Nampower for the cost of electricity, a significant part of the variable costs in the refinery. A favorable power tariff will ensure a positive internal rate of return and overall viability of the conversion project; and 5) In the addition to the above a civil construction partner has been identified and will be appointed on approval by the board.
In the beginning of FY2021, an additional opportunity was identified to increase the Refinery capacity from 150 ktpa to 300 ktpa and by doing that ensure that the full beneficiation cycle is complete and full advantage is ensure by selling SHG zinc into the market.
The increased sulphide conversion is expected to cost $ 430 million and will have a
18-24
months construction period. This will result in a plant capacity of 300 kilo tons per annum of zinc metal produced at an estimated cost of production of $ 640 per metric ton. During July 2021, the Namzinc Board approved $ 380 million in respect of the Skorpion Zinc Refinery Conversion Project.On March 31, 2020, the mine was put into care and maintenance after a series of slope failures that occurred in the fiscal year 2020. The pit has been assessed by a series of industry experts who have concluded that the pit is minable but a new mine plan will need to be developed. The directors currently expect mining operations to resume in August 1, 2023 and aligns with the expected completion of the refinery conversion project. The directors estimate this will take eight months from the restart of mining operations to fully mine the declared ore resources in the pit.
Following the mine going into care and maintenance, the refinery has also been put into care and maintenance on April 30, 2020. All Namzinc (Propriety) Limited’s employees have been retrenched effective May 1, 2020, and staff required for the care and maintenance activities of the company have been rehired.
Summary of Mine Reserves
The following table sets out the proved and probable zinc reserves as of March 31, 2022:
Proved Reserve | Probable Reserve | Total Proved and Probable Reserves | Vedanta Limited Interest | Reserve life | ||||||||||||||||||||||||||||
Mine | Quantity | Zinc Grade | Quantity | Zinc Grade | Quantity | Zinc Grade | ||||||||||||||||||||||||||
| (million tons) | (%) | (million tons) | (%) | (million tons) | (%) | (%) | (Years) | |||||||||||||||||||||||||
Skorpion | 0.2 | 7.7 | 0.6 | 11.2 | 0.8 | 10.3 | 100.0 | 1.17 | ||||||||||||||||||||||||
Total | 0.2 | 7.7 | 0.6 | 11.2 | 0.8 | 10.3 | 100.0 | 1.17 | ||||||||||||||||||||||||
Additional information:
| 1. | The estimate of ore reserves was reviewed by SRK Consultants (UK) Ltd. in accordance reported in accordance with the Australasian Code for the Reporting of Exploration Results, Mineral Resources and Ore Reserves, the JORC Code, 2012 Edition (“JORC”). |
| 2. | The cut-off grade used with our reserve estimate is between 3% to 5%. |
| 3. | The metallurgical recovery factor for Skorpion mine ranges from 70% to 88.5%. |
| 4. | The commodity price considered for the evaluation of reserves is $ 2,500 per ton and currency conversion factor that were used to estimate our reserves was Namibian Dollar per US dollars 15.10. |
| 5. | The reserve quantities disclosed are for the entire mine. |
67
Skorpion Facility
The following table sets out the total capacity of the facility at Skorpion as of March 31, 2022:
Facility | Capacity | |||
Zinc (tpa) | ||||
Skorpion | 150,000 | |||
Project Increase | 150,000 | |||
Total | 300,000 | |||
Production Volumes
The following table sets out the total production from Skorpion zinc refinery, total ore and zinc concentrate production at the Skorpion mine, for fiscal years ended March 31, 2020, 2021 and 2022:
Mine (Type of Mine) | Product | Fiscal Year | ||||||||||||
2020 | 2021 | 2022 | ||||||||||||
(tons except percentage) | ||||||||||||||
Zinc refinery | Zinc | 66,967 | 825 | — | ||||||||||
Skorpion (Open-pit) | Ore mined | 1,038,936 | — | — | ||||||||||
| Ore grade - Zinc | 7.63 | % | — | — | ||||||||||
| Recovery - Zinc | 79.85 | % | — | — | ||||||||||
Principal Raw Materials
The Skorpion mine did not use any oxides in fiscal year 2022.
Power
The maximum power demand of the Skorpion mine is 85 MW and power is supplied from South Africa and is governed by a
tri-partite
US Dollar- denominated contract between Namibia Power Corporation (Proprietary) Limited, Eskom Holdings Limited and Skorpion, that currently links the annual increases in power costs to a US inflationary index. Thetri-partite
contract expired in January 2021. Management is currently in negotiations with NamPower for a new contract to increase demand and finalize a price.Distribution, Transport and Logistics
Zinc at the Skorpion mine is cast into ingots and transported from the refinery to the port of Luderitz, approximately 300 kilometers away by trucks each having a maximum capacity of 35 tons. On the return trip from Luderitz, these trucks carry sulphur transported to site, which is imported by ship. All other
re-agents
and consumables are trucked in by a transport contractor.Sales and Marketing
Skorpion’s 10 largest customers accounted for approximately, 98.52% and 100% of its revenue in fiscal years 2020 and 2021 respectively. Three of Skorpion’s customers accounted for approximately 82.98% and 88.47% of Skorpion’s revenue in fiscal years 2020 and 2021. Skorpion did not have any sales during fiscal year 2022.
Skorpion’s marketing office is located in Rosh Pinah.
Most of the zinc metal that Skorpion produced in fiscal year 2021 was sold under spot or short-term contracts. Approximately 45% of the metal produced is sold in the Southern African Customs Union market and balance is sold to other regions. The contract sales price is linked to prevailing LME price with an additional market premium. Thus, the price that Skorpion receives for its zinc is dependent upon and is subject to fluctuations in the LME price.
Market Share and Competition
The Skorpion mine produces high-grade, high purity SHG zinc ingots that are registered on the LME. It is a 100% export-oriented unit with around 20Kt to 35Kt of the total production sold in the Africa region. It is the only Mining and Zinc Refinery unit in African region.
68
II. | Black Mountain Mining |
Overview
BMM consists of the Black Mountain underground mine and the Gamsberg
open-pit
mine. We own a 69.6% interest in BMM, Exxaro Resources Limited (through its wholly owned subsidiary, Exxaro Base Metals and Industrial Mineral Holdings (Pty) Ltd) holds 24.4% interest and the remaining 6% is held by Employee Trust in BMM. The employee trust scheme runs for 7 years from April 1, 2017. The employee trust is consolidated into BMM and therefore Vedanta Limited’s effective share of BMM is 74%.The planned production rate for the underground mine is 1.68 mtpa plant feed and the shaft hoisting capacity is approximately 1.22 mtpa from Deeps mine and 0.5 mtpa from Swartberg. All production stopes in the Deeps mine are backfilled and waste filled, integrated into the mining sequence. The planned production at Gamsberg phase 1
open-pit
mine is 4 mtpa plant feed.During fiscal year 2022, 1,547,578 tons of ore at 2.11% zinc and 2.14% lead were mined from the Black Mountain mine, which produced approximately 53,686 tons of zinc concentrate and 40,463 tons of lead concentrate, containing 24,852 tons of zinc metal and 27,393 tons of lead metal respectively. In addition, the Black Mountain mine also produced 5,083 tons of copper in concentrate and 24 tons of silver in concentrate.
During fiscal year 2022, 3,018,753 tons of ore at 6.18% zinc was mined from the Gamsberg mine, which produced approximately 358,199 tons of zinc concentrate, containing 168,880 tons of zinc.
Principal Products
BMM produces zinc, copper and lead in concentrate and all the zinc and copper concentrate are shipped overseas. A small portion of the lead concentrate is sold locally, with the bulk shipped overseas. The BMM mine started producing Magnetite during the period from the mine tailings.
By-products
Silver
Silver is a
by-product
of our copper and lead concentrate.Principal Facilities
The following maps shows the specific location of the Black Mountain mine in Northern Cape in South Africa:
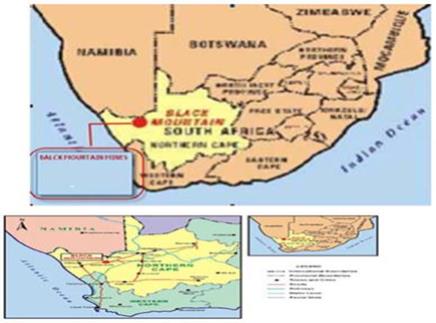
69
Mines
The Black Mountain underground operation mines a polymetallic ore body, with an attached concentrator producing approximately 53,686 tons of zinc concentrate and 40,463 tons of lead concentrate respectively. In addition, the Black Mountain mine also produced 5,083 tons of copper in concentrate and 24 tons of silver in concentrate.
The Black Mountain mine is operated pursuant to mining right 58/2008 MR granted pursuant to the Mineral and Petroleum Resources Development Act, 28 of 2002 of South Africa which entitles us to mine for lead, copper, zinc and associated minerals in, on and under an area in the district of Namaqualand measuring 24,195 hectares for a period of 30 years from 2008 to 2038.
Four major stratiform exhalative sediment hosted base metal deposits are located in a 10 by 30 km area, centered on Aggeneys. The deposits are situated in the supracrustal rocks of the
mid-Proterozoic
age Bushmanland group of the Namaqualand metamorphic complex. The deeps ore body, which is currently being mined, is considered to start at 166 meters above mean sea level, with a down plunge extent of 1.1 km with the deepest position of the ore body being 1,680 meters below the surface. Mineralization in the deeps is hosted by iron formations, massive sulphide and sulphide quartzite. The massive sulphide rock is either banded, massive or occurs as fine-grained mylonite. Banding is expressed as1-5
m thick sulphide bands alternating with quartz rich bands of similar thickness.Underground drilling of the deeps ore body was started in December 2000 and were completed in 2012. As of March 31, 2022, BMM estimates the remaining mine life of the Deeps mine to be 3 years based on (i) reserves; and (ii) planned production which is determined on the basis of aplan.
life-of-mine
Two equal mining methods are deployed, ramp in stope cut and fill and long hole mining. The production rate is 1.68 mtpa plant feed and the shafts combined hoisting capacity is approximately 145,000 tons per month. All production stopes at Deeps are backfilled and waste filled, integrated into the mining sequence.
Power at the zinc mine at Black Mountain is supplied from two 40 MVA transformers at the Eskom Aggeneys substation. Water is supplied by the Pelladrift Water Board, which supplies potable water to the mine from the Orange River for both human consumption and industrial water requirements.
Zinc, lead and copper concentrate from the mine are road hauled to the port of Saldanha with delivery terms to export customers on a cost, insurance and freight basis. Since October 2015, there has been a change in strategy to move the concentrate directly to Saldanha by road, with delivery terms to export customers on a cost insurance and freight basis.
Swartberg was mined on a small scale (25,800 tons per month) from 1995 but production was stopped in 2006 in an effort to procure the Deeps mine in full production. Mining at Swartberg wasplan.
re-introduced
in the year 2012 by a diamond drilling campaign to explore the ore bodies on strike. Down- plunge in depth at this mine was started in the same year. BMM estimates the remaining mine life of the Swartberg mine to be 3 years based on (i) reserves; and (ii) planned production which is determined on the basis of alife-of-mine
The Gamsberg ore body is situated approximately 22 kms from Black Mountain. The Gamsberg Project was officially approved by the Company’s Board in November 2014. In April 2015, the project schedule was revised after optimizing the mining cost. The
pre-start
mining (creating access to the mine to enable the start of bulk prestripping) started in July 27, 2015 and the major milestone of creation of north access ramp was achieved by end of April 2017. Bulkpre-stripping
commenced in April 2017 and the totalpre-stripping
of 68 million tons as against the project target tons was completed in July 2018.The plant and infrastructure order was placed in October 2016 and site construction started in early June 2017. The milestone of first ore feed as part of the commissioning was achieved by end of September 2018, with all construction activities getting completed in October 2018 and trial saleable production started. First shipment was done in December 2018. The plant reached a steady state of production in February 2019 and the plant was capitalized during March 2019. The plant produced 305,190 and 358,199 tons of zinc concentrate in fiscal years 2021 and 2022 respectively.
70
Summary of Mine Reserves
The following table sets out the proved and probable zinc and lead reserves as of March 31, 2022:
Mine | Proved Reserve | Probable Reserve | Total Proved and Probable Reserves | Vedanta Limited ownership | Reserve life | |||||||||||||||||||||||||||||||||||||||||||||||||||
Quantity | Zinc Grade | Lead Grade | Silver | Quantity | Zinc Grade | Lead Grade | Silver | Quantity | Zinc Grade | Lead Grade | Silver | |||||||||||||||||||||||||||||||||||||||||||||
| (million tons) | (%) | (%) | (g/t) | (million tons) | (%) | (%) | (g/t) | (million tons) | (%) | (%) | (g/t) | (%) | (Years) | |||||||||||||||||||||||||||||||||||||||||||
Black Mountain-Deeps | 0.5 | 2.2 | 2.5 | 31 | 2.4 | 2.5 | 1.2 | 20 | 3.0 | 2.5 | 1.5 | 22 | 74.0 | 3 | ||||||||||||||||||||||||||||||||||||||||||
Proved Reserve | Probable Reserve | Total Proved and Probable Reserves | Vedanta Limited ownership | Reserve life | ||||||||||||||||||||||||||||||||||||||||||||||||||||
Quantity | Zinc Grade | Lead Grade | Silver | Quantity | Zinc Grade | Lead Grade | Silver | Quantity | Zinc Grade | Lead Grade | Silver | |||||||||||||||||||||||||||||||||||||||||||||
| (million tons) | (%) | (%) | (g/t) | (million tons) | (%) | (%) | (g/t) | (million tons) | (%) | (%) | (g/t) | (%) | (Years) | |||||||||||||||||||||||||||||||||||||||||||
Black Mountain-Swartberg | — | — | — | — | 48.0 | 0.6 | 2.0 | 33 | 48.0 | 0.6 | 2.0 | 33 | 74.0 | 3 | ||||||||||||||||||||||||||||||||||||||||||
Proved Reserve | Probable Reserve | Total Proved and Probable Reserves | Vedanta Limited ownership | Reserve life | ||||||||||||||||||||||||||||||||||||||||||||||||||||
Quantity | Zinc Grade | Lead Grade | Silver | Quantity | Zinc Grade | Lead Grade | Silver | Quantity | Zinc Grade | Lead Grade | Silver | |||||||||||||||||||||||||||||||||||||||||||||
| (million tons) | (%) | (%) | (g/t) | (million tons) | (%) | (%) | (g/t) | (million tons) | (%) | (%) | (g/t) | (%) | (Years) | |||||||||||||||||||||||||||||||||||||||||||
Black Mountain-Gamsberg | 69.7 | 6.4 | 0.5 | — | 27.1 | 4.9 | 0.5 | — | 96.8 | 6.0 | 0.5 | — | 74.0 | 14 | ||||||||||||||||||||||||||||||||||||||||||
References to “g/t” are grams per ton
Additional information:
Deeps and Swartberg
| 1. | The estimate of ore reserves was reviewed by SRK Consultants (UK) Ltd. in accordance reported in accordance with the Australasian Code for the Reporting of Exploration Results, Mineral Resources and Ore Reserves, the JORC Code, 2012 Edition (“JORC”). |
| 2. | The cut-off rand value used with our reserve estimate is between ZAR 368 and ZAR 1,275 per ton. |
| 3. | The metallurgical recovery factor for zinc is between 75.9% and 77.6%, for lead between 83.5% and 84.7%, and copper is between 69.8% and 76.0%. |
| 4. | The commodity prices for zinc were between $ 2,305 and $ 2,886 per ton, for lead between $ 1,922 and $ 2,062 per ton and for copper between $ 6,511 and $ 8,655 per ton. The average currency conversion factor that was used to estimate our reserves was South African Rand per US were between R 15.10 and R 16.36. |
| 5. | The reserve quantities disclosed are for the entire mine and our share in the reserve quantities is 74%. |
Gamsberg
| 1. | The estimate of ore reserves was reviewed by SRK Consultants (UK) Ltd. in accordance reported in accordance with the Australasian Code for the Reporting of Exploration Results, Mineral Resources and Ore Reserves, the JORC Code, 2012 Edition (“JORC”). |
| 2. | The zinc cut-off grade used with our reserve estimate is 1.72%. |
| 3. | The commodity price for zinc considered for evaluation of reserves was between $ 2,337 and $ 2,500 per ton. The average currency conversion factor that was used to estimate our reserves was South African Rand per USD were between R14.42 and R 16.36. |
| 4. | The reserve quantities disclosed are for the entire mine and our share in the reserve quantities is 74%. |
71
Production Volumes
The following table sets out the total ore, zinc and lead concentrate production at the Black Mountain mine for each of fiscal years ended March 31, 2020, 2021 and 2022:
Mine (Type of Mine) | Product | For the year ended March 31, | ||||||||||||||||
2020 | 2021 | 2022 | ||||||||||||||||
| (tons, except percentages) | ||||||||||||||||||
Black Mountain (Underground) | Ore mined | 1,486,754 | 1,357,068 | 1,547,578 | ||||||||||||||
| Ore grade | Zinc | 2.23 | % | 2.43 | % | 2.11 | % | |||||||||||
| Lead | 2.67 | % | 2.32 | % | 2.14 | % | ||||||||||||
| Recovery | Zinc | 79.68 | % | 79.39 | % | 75.17 | % | |||||||||||
| Lead | 85.71 | % | 84.08 | % | 81.56 | % | ||||||||||||
| Concentrate | Zinc | 56,857 | 62,263 | 53,686 | ||||||||||||||
| Lead | 54,694 | 40,006 | 40,463 | |||||||||||||||
Gamsberg (Open pit) | Ore mined | 3,437,460 | 1,915,561 | 3,018,753 | ||||||||||||||
| Ore grade | Zinc | 6.55 | % | 6.24 | % | 6.18 | % | |||||||||||
| Lead | 0.40 | % | 0.22 | % | 0.57 | % | ||||||||||||
| Recovery | Zinc | 61.7 | % | 68.37 | % | 69.91 | % | |||||||||||
| Lead | — | — | 7.12 | % | ||||||||||||||
| Concentrate | Zinc | 228,258 | 305,190 | 358,199 | ||||||||||||||
| Lead | — | — | 3,938 | |||||||||||||||
Principal Raw Material
There are no major raw materials used in Black Mountain or Gamsberg Mine, except for diesel and backfill cement used underground for TMM machines and backfill of stopes respectively, and chemical reagents, which are used in the floatation process to produce zinc and lead concentrates.
Distribution, Logistics and Transport
Zinc concentrate, lead concentrate and copper concentrate from the mine is hauled by road to the port of Saldanha with delivery terms to export customers on a cost, insurance and freight basis.
Sales and Marketing
BMM produces zinc, lead and copper concentrates that are sold in international markets on a spot basis or a frame contract basis. The commercial terms negotiated include taking into account the percentage of payable metals, treatment and refining charges and applicable prices. Some of the customers of Black Mountain mine are Louis Dreyfus Company Metals Suisse SA and Trafigura PTE Limited.
Gamsberg Mine produces zinc and lead concentrates that are sold in international markets on a spot basis or a frame contract basis. The commercial terms negotiated include taking into account the percentage of payable metals, treatment and refining charges and applicable prices. Some of the customers of Gamsberg Mine are Korea Zinc, MRI Trading AG and Nobel Resources Limited.
The contract sales price is linked to the prevailing LME price with an additional market premium. Thus, the price that BMM and Gamsberg receives for its zinc and lead is dependent upon and is subject to fluctuations in the LME price.
Lisheen
The Lisheen mine is located in County Tipperary, Republic of Ireland. Mining and milling activities at the Lisheen mine ceased in December 2015 and the mine has closed. Concentrator and other plant infrastructure were sold, and the rehabilitation of the mine completed. The site transitioned from passive closure to aftercare in June 2021 and land sales where portions of
sub-divided
land are being sold have been largely completed.Our Oil and Gas Business
Overview
Our oil and gas business is primarily owned and operated by Vedanta Limited and its subsidiary – CIHL. The oil and gas business segment has a diversified asset base with 58 blocks in India. The blocks are primarily located across the Indian basins in Barmer, Krishna-Godavari, Cambay, Assam, Gujarat Kutch and Cauvery.
Vedanta Limited - oil and gas business is primarily engaged in the business of exploration, development and production of crude oil, gas and related
by-products.
Our oil and gas business continues to contribute significantly to India’s domestic crude oil production. Vedanta Limited operates approximately 25% of India’s domestic crude oil production as of March 31, 2022.72
The following table sets forth details of the assets of Vedanta Limited - oil and gas business and its subsidiaries including their percentage interest and those of their partners as of March 31, 2022:
Asset | Basin | Our interest | JV partners | Area (in sq. km) | ||||||||||
India | ||||||||||||||
1 | RJ-ON-90/1 | Barmer | 70 | % | ONGC | 3,111 | ||||||||
2 | CB/OS-2 | Cambay | 40 | % | ONGC, Tata Petrodyne | 207 | ||||||||
3 | RAVVA | KG Offshore | 22.50 | % | ONGC, Ravva Oil Singapore, Videocon Industries Limited | 312 | ||||||||
4 | KG-ONN-2003/1 | KG Onshore | 49 | % | ONGC | 315 | ||||||||
5 | KG-OSN-2009/3 | KG Offshore | 100 | % | — | 1,988 | ||||||||
6 | AA-ONHP-2017/1 | Assam | 100 | % | — | 715 | ||||||||
7 | AA-ONHP-2017/6 | Assam | 100 | % | — | 279 | ||||||||
8 | AA-ONHP-2017/14 | Assam | 100 | % | — | 1,719 | ||||||||
9 | AA-ONHP-2017/4 | Assam | 100 | % | — | 839 | ||||||||
10 | AA-ONHP-2017/5 | Assam | 100 | % | — | 758 | ||||||||
11 | AA-ONHP-2017/8 | Assam | 100 | % | — | 611 | ||||||||
12 | AA-ONHP-2017/9 | Assam | 100 | % | — | 18 | ||||||||
13 | AA-ONHP-2017/11 | Assam | 100 | % | — | 785 | ||||||||
14 | AA-ONHP-2017/15 | Assam | 100 | % | — | 1,367 | ||||||||
15 | AA-ONHP-2017/2 | Assam | 100 | % | — | 73 | ||||||||
16 | AA-ONHP-2017/3 | Assam | 100 | % | — | 268 | ||||||||
17 | AA/ONDSF/Hazarigaon/2018 | Assam | 100 | % | — | 31 | ||||||||
18 | KG-ONHP-2017/1 | KG Onshore | 100 | % | — | 2,321 | ||||||||
19 | KG-ONHP-2017/2 | KG Onshore | 100 | % | — | 668 | ||||||||
20 | KG-ONHP-2017/3 | KG Onshore | 100 | % | — | 49 | ||||||||
21 | KG/ONDSF/Kaza/2018 | KG Onshore | 100 | % | — | 115 | ||||||||
22 | KG-OSHP-2017/1 | KG Offshore | 100 | % | — | 177 | ||||||||
23 | KG-DWHP-2017/1 | KG Deepwater | 100 | % | — | 4,617 | ||||||||
24 | CY-OSHP-2017/1 | Cauvery Offshore | 100 | % | — | Offshore 1,613 | ||||||||
25 | CY-OSHP-2017/2 | Cauvery Offshore | 100 | % | — | Offshore 2,291 | ||||||||
26 | GK-ONHP-2017/1 | Gujarat Kutch Onland | 100 | % | — | | Onshore 2,409 Offshore 281 | |||||||
27 | GK-OSHP-2017/1 | Gujarat Kutch Offshore | 100 | % | — | | Onshore 126 Offshore 2,834 | |||||||
28 | GS-OSHP-2017/1 | Gujarat Kutch Offshore | 100 | % | — | 2,627 | ||||||||
29 | GS-OSHP-2017/2 | Gujarat Kutch Offshore | 100 | % | — | 674 | ||||||||
30 | MB-OSHP-2017/2 | Mumbai Offshore | 100 | % | — | 2,690 | ||||||||
31 | RJ-ONHP-2017/5 | Barmer | 100 | % | — | 917 | ||||||||
32 | RJ-ONHP-2017/6 | Barmer | 100 | % | — | 925 | ||||||||
33 | RJ-ONHP-2017/7 | Barmer | 100 | % | — | 603 | ||||||||
34 | RJ-ONHP-2017/1 | Barmer | 100 | % | — | 542 | ||||||||
35 | RJ-ONHP-2017/2 | Barmer | 100 | % | — | 1,072 | ||||||||
36 | RJ-ONHP-2017/3 | Barmer | 100 | % | — | 1,430 | ||||||||
37 | RJ-ONHP-2017/4 | Barmer | 100 | % | — | 1,087 | ||||||||
38 | CB-ONHP-2017/1 | Cambay | 100 | % | — | 1,490 | ||||||||
39 | CB-ONHP-2017/7 | Cambay | 100 | % | — | 1,335 | ||||||||
40 | CB-ONHP-2017/10 | Cambay | 100 | % | — | 2,766 | ||||||||
41 | CB-ONHP-2017/6 | Cambay | 100 | % | — | 19 | ||||||||
42 | CB-ONHP-2017/2 | Cambay | 100 | % | — | 317 | ||||||||
43 | CB-ONHP-2017/3 | Cambay | 100 | % | — | 83 | ||||||||
44 | CB-ONHP-2017/4 | Cambay | 100 | % | — | 95 | ||||||||
45 | CB-ONHP-2017/5 | Cambay | 100 | % | — | 990 | ||||||||
46 | CB-ONHP-2017/11 | Cambay | 100 | % | — | 70 | ||||||||
47 | HF-ONHP-2017/1 | Himalaya Foreland | 100 | % | — | 666 | ||||||||
48 | GV-ONHP-2017/1 | Ganga Valley | 100 | % | — | 1,817 | ||||||||
49 | CB-ONHP-2018/1 | Cambay | 100 | % | — | 185 | ||||||||
50 | GK-OSHP-2018/1 | Kutch | 100 | % | — | 1,732 | ||||||||
51 | GK-OSHP-2018/2 | Kutch | 100 | % | — | 813 | ||||||||
52 | MN-OSHP-2018/1 | Mahanadi | 100 | % | — | 1,825 | ||||||||
53 | RJ-ONHP-2018/1 | Barmer | 100 | % | — | 417 | ||||||||
54 | AA-ONHP-2018/1 | Assam | 100 | % | — | 249 | ||||||||
55 | CB-ONHP-2018/3 | Cambay | 100 | % | — | 519 | ||||||||
56 | CB-ONHP-2018/4 | Cambay | 100 | % | — | 559 | ||||||||
57 | KG-ONHP-2018/1 | KG Onshore | 100 | % | — | 2,601 | ||||||||
58 | KG-ONHP-2018/2 | KG Onshore | 100 | % | — | 230 | ||||||||
Total | 62,242 | |||||||||||||
73
Rajasthan,block, Barmer Basin (operator, 70% participating interest)
RJ-ON-90/1
The Rajasthan,(the “Rajasthan block”) is an onshore block. It is Cairn’s principal production asset where Vedanta Limited along with CEHL owns a 70% participating interest pursuant to the PSC. Cairn’s joint operation partner, ONGC, has a 30% participating interest. The RJ Block is spread over 3,111 square kms in the west of Barmer district and consists of three contiguous development areas: (i) Development Area 1, primarily comprising the Mangala, Aishwariya, Raageshwari, Guda and Saraswati fields; (ii) Development Area 2, primarily comprising of the Bhagyam, (NI and NE) and Shakti fields; and (iii) Development Area 3, comprising of the Kaameshwari West fields.
RJ-ON-90/1
The Mangala field was discovered in January 2004. This was followed by many other discoveries including the Aishwariya and Bhagyam fields. In the RJ Block, 38 discoveries have been established since inception. Exploration activities and studies indicate that the block has further potential for reserves that would support future growth opportunities.
Vedanta Limited - oil and gas business also own and operate significant infrastructure assets to facilitate the processing, transportation, and sale of crude oil produced in the RJ Block. For fiscal year 2022, Vedanta Limited – oil and gas business’s net average daily production was 56,287 boepd from the RJ Block.
Cambay,
CB/OS-2
block, Cambay Basin (operator, 40% participating interest)The Cambay
CB/OS-2
(the “Cambay block”) is an offshore block which is located in the Cambay Basin of the state of Gujarat in western India. Vedanta Limited - oil and gas business’s operations in the Cambay block are centered on the Lakshmi and Gauri oil and gas fields and theCB-X
development area. Based on exploration and development activities undertaken by Vedanta Limited - oil and gas business, the Cambay block has yielded natural gas discoveries in its offshore Lakshmi and Gauri fields and onshoreCB-X
field and crude oil discoveries in the former two fields. Vedanta Limited - oil and gas business along with its Joint venture partners ONGC and TATA Petrodyne, commenced its gas production from the Lakshmi gas field in 2002 and from the Gauri field in 2004. Production ofco-mingled
crude oil, which consists of crude oil plus condensate, from the Gauri field commenced in 2005. Lakshmi and Gauri offshore fields cover areas of 121.1 square kms and 52.7 square kms, respectively, in the Cambay Basin and lie off the coast of the state of Gujarat in water depths of approximately 20 meters.CB-X
is an onshore gas field situated in the Cambay block and covers an area of 33.3 square kms. Currently, there is no production fromCB-X
field. For fiscal year 2022, Vedanta Limited - oil and gas business’s net average daily production was 2,463 boepd from the Cambay block.Ravva,
PKGM-1
block, Krishna Godavari Basin, Eastern India (operator, 22.5% participating interest)Vedanta Limited - oil and gas business’s production operations in the Krishna-Godavari Basin are centered on the Ravva
PKGM-1
(the “Ravva block”), lying off the coast of Andhra Pradesh in Eastern India, in water depths up to 40 meters. Developed in partnership with ONGC, Videocon Industries Limited and Ravva Oil Singapore, Vedanta Limited - oil and gas business became the operator of Ravva block in 1996. For fiscal year 2022, Vedanta Limited - oil and gas business’s net average daily production was 2,260 boepd from the Ravva block.KG Onshore,Krishna Godavari Basin (49% participating interest)
KG-ONN-2003/1,
The onshore blocklocated in the Krishna Godavari basin in the state of Andhra Pradesh, was awarded in NELP V round to a joint venture between Vedanta Limited - oil and gas business and ONGC.
KG-ONN-2003/1,
Nagayalanka-1Z
was the first discovery in the block. For fiscal year 2022, net average daily production was 531 boepd from the KG block. Production from the existing well had commenced in the first quarter of fiscal year 2019. Drilling of three development wells was completed in fiscal year 2019 and all three wells are online. We have further identified opportunities to drill three firm wells to accelerate production. Drilling is expected to commence during first half of fiscal year 2023.KG Offshore,Krishna Godavari Basin (operator, 100% participating interest)
KG-OSN-2009/3,
The offshore blockcovers an area of 1,988 square kms and is located in the Krishna Godavari Basin off the coast of the state of Andhra Pradesh. The block is currently in the initial exploration phase and several extensions were sought on excusable delay and the removal of access restriction imposed by Ministry of Defence. Further, due to the
KG-OSN-2009/3
COVID-19
pandemic, force majeure was invoked in the block on the grounds that the pandemic made it impossible to conduct petroleum operations. Having regard to the invocation, DGH had granted extension to the exploration activities till November 10, 2021. Further, vide letter dated August 13, 2021, we have applied for the surrender of the block due to impossibility of conduct of petroleum operations in absence of unconditional and unfettered access. We are under discussion with DGH for further progress in the block.Open Acreage Licensing Policy (“OALP”) (100% participating interest)
Under the OALP, revenue-sharing contracts have been signed for 41 blocks in October 2018 and for 10 exploration blocks as part of the OALP Round II & III (OALP–II&III) in July 2019. These blocks offer a rich conventional and unconventional resource play. The secured blocks increased the acreage of Vedanta Limited’s oil and gas business to approximately 65,000 sq. km.
74
Discovered Small Fields (“DSF2”) (100% participating interest)
Vedanta Limited - oil and gas business has won two discovered small fields in DSF
round-2
named as Hazarigaon and Kaza gas field located in Assam and KG basins respectively.Principal Products
(i) | Oil |
Cairn produces crude oil of various grades with different degrees and contents across fields. The crude oil in the majority of fields in the RJ Block is medium sweet oil with high pour point. Conversely, the crude oil produced from the Ravva block and Cambay block are light sweet in nature.
(ii) | Gas |
The Rajasthan, Ravva and Cambay blocks produce natural gas, as well as natural gas commingled with crude oil. While Cairn has been historically selling gas from the offshore blocks of Ravva and Cambay, it commenced gas sales in the RJ Block in fiscal year 2014, following the regulatory approval in March 2013.
Production
The table below shows oil and gas production results for fiscal years 2020, 2021 and 2022.
Average Daily Production | Units | 2020 | 2021 | 2022 | % Change (2021 Vs. 2022) | |||||||||||||||
Net operated* | Boepd | 85,651 | 67,732 | 61,560 | (9 | %) | ||||||||||||||
Oil | Bopd | 77,129 | 59,333 | 52,061 | (12 | %) | ||||||||||||||
Gas | Mmscfd | 51 | 50 | 57 | 14 | % | ||||||||||||||
| * | Including KG-ONN production of 531 boepd in which Vedanta Limited - oil and gas business is anon-operator. |
Estimate of Reserves
Set forth in the table below is certain data regarding the estimates of net reserves from fields within the RJ block, Ravva block, Cambay block, KG Onland block and OALP block as of March 31, 2022. Volumes reported in this table are in millions of barrels of oil equivalent.
Domestic Asset | Basin | Exploration Activity | Development Activity | Net Proved Reserves | ||||||||||||
Rajasthan block | Barmer | ✓ | ✓ | 84.44 | ||||||||||||
Cambay block | Cambay | — | ✓ | 1.30 | ||||||||||||
Ravva block | KG Offshore | — | ✓ | 0.92 | ||||||||||||
KG-ONN block | KG Onland | — | ✓ | 0.82 | ||||||||||||
OALP block (Hazarigaon) | Assam | — | ✓ | 0.19 | ||||||||||||
Total | 87.67 | |||||||||||||||
Technology
The technology landscape is continuously changing at a rapid pace. Such changes create an opportunity to adapt and develop competitive advantage. It is imperative for Vedanta Limited – oil and gas business to adapt cutting edge technology to generate incremental value. The agility to inculcate technology as part of business has been demonstrated over the years ranging from enhanced oil recovery mechanism to project’s concept optimization, hydraulic fracturing, 4D seismic technology etc.
Enhanced oil recovery methods are tertiary recovery methods of producing oil, which is not recovered during the application of primary and/or secondary water-flood recovery methods. Cairn has successfully executed one of the world’s largest polymer flood enhanced oil recovery projects at Mangala. Driven by its encouraging results, Cairn has implemented polymer flood programs on a large-scale at Bhagyam and Aishwariya fields. Both the fields are currently under polymer injection and has been ramped up to its design capacity.
In addition to the application of polymer flood enhanced oil recovery, Cairn is also working towards implementation of the alkaline-surfactant-polymer flood process in the Mangala field as described in sections above. Similar to the lines of Mangala ASP pilot, Cairn is also planning to implement the ASP pilots in Bhagyam and Aishwariya fields.
75
For decline and reservoir management, we are using traditional first principle-based approaches augmented byequipment availability. The culture is shifting from reactive to proactive maintenance through the adoption of predictive analytics-based apps, asset performance management, drone-based transmission line inspections, control room, field logbooks, among others.
new-age
data driven techniques in Artificial Intelligence and Machine Learning (AI/ML) such as water flood optimisation in Aishwarya Upper Fatehgarh (“UF”) and polymer optimisation in Mangala fields, well reservoir management job planning and tracking. Improvement programmes are driven to havebest-in-class
Hydraulic fracturing or fraccing or hydro-frac is the process of providing a conductive path for hydrocarbons to flow from the reservoir to the wellbore, in low permeability reservoirs. The application of this technology is helping in the development of tight gas formation of RDG field. The field development continues to leverage this and other technologies like auto-driller, next generation automated pipe handling rigs etc. to deliver value and efficiency to the project. As a result of the successful application of these technologies, Cairn has been able to connect more reservoirs and deliver value to the field development.
Maintenance reliability dashboard was updated with the implementation of Mean Time Between Failures (MTBF), Mean Time to Recovery (MTTR), equipment availability and Preventive/Breakdown
(PM-BD)
ratio to integrate preventive maintenance hours, breakdown hours,run-hours
and number of breakdowns. This has enabled faster decision making with better visualisation and analysis of data giving ability to solve problems and identify opportunities along with better maintenance planning.Predictive analysis by introducing equipment on ‘asset sentinel’ platform on cloud technology enabled improved asset availability and productivity, troubleshooting and early warning alerts through a combination of first principle and machine learning models.
Multi-Position Flow Valve (MP WFV) has been implemented in the ongoing
CB/OS-2
drilling campaign to utilize gas zones asin-situ
gas lift mechanism, this equipment chokes the flow of gas coming into the well to provide effective gas lift and increase oil production. During well life, as and when required the sleeve can further be shifted to other positions allowing larger amount of gas into the wellbore. Drill pipe swivel for deployment of lower completion in Extended Reach Drilling (ERD) wells allows the drill pipe running string to be rotated above the liner/screen hanger packer running tool, such that the lower completion does not rotate. This removes axial friction and reduces buckling in the running string and allows more weight to be transmitted down to the lower completion.Gas Dynamic Generator (GDG) has been successfully implemented at both
CB/OS-2
and Ravva assets. It is a gas lift enhancement technology which creates a specific spectrum of high frequency, high energy shock waves at the exit point of agas-lift
valve that significantly reduces the diameter of gas bubbles (micro-dispersed gas bubbles). These smaller bubbles extend the duration of the bubble regime hence enhance lifting efficiency and increasing oil production. Additionally, in Ravva to improve slickline intervention in highly deviated wells,U-line
Roller Bogies were implemented successfully which helped in smooth conveyance of slickline tool string to higher angle depths.SandAid system, a chemical sand control system has been implemented in
CB/OS-2
asset which provides a strengthened attraction between particles with no significant damage to formation permeability and contributes to the longevity of the well. The solution remains ductile and adapt to changing reservoir conditions,re-agglomerates
and allows to explore maximum sand free rate (MSFR).In OALP blocks, our objective is to reduce cycle time from exploration to production by adopting innovative technology. We have implemented a Full Tensor Gravity Gradiometry
™
(FTG) airborne survey to optimize time and cost-intensive seismic data acquisition to fast-track drilling. This is the largest onshore FTG survey program in India covering an area of 1,200 LKM in Assam blocks, 8,000 LKM in Kutch blocks, 15,229 LKM in Cambay blocks and 11,439 LKM in RJ blocks.In addition, we applied Satellite-based
Sub-Terrain
prospecting (STeP®
), which includes eight remote sensing and computational technologies within asix-month
time frame covering an area of 3650 sq.km. This is the first application in oil and gas exploration in India to provide information to optimize and prioritize areas for exploration focus.Principal Facilities
Overview
The following map shows the locations of Cairn’s blocks in India:
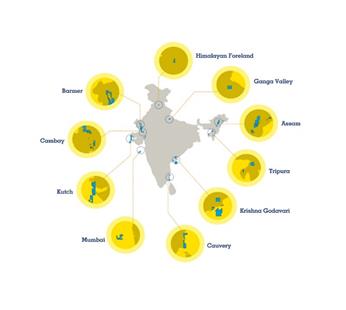
| * | Map not to scale |
76
| Ø | Rajasthan |
| Ø | Rajasthan Block Production Sharing Contract (“RJ block PSC”) |
Vedanta Limited - oil and gas business along with CEHL are working in partnership with its joint venture partner, ONGC in connection with the RJ block located in the Barmer district. The RJ block PSC was signed in May 1995 between the GoI and a consortium consisting of ONGC and Shell India Production Development BV.
Vedanta Limited - oil and gas business acquired interest in the RJ block from Shell India Production Development B.V. in two tranches and held 100% interest on June 20, 2003. Under the RJ block PSC, the GoI has an option to acquire a participating interest of 30.0% in any development area containing a commercial discovery. The GoI exercised their right in all three development areas, specifically, Development Area 1 in 2005, Development Area 2 in 2007 and Development Area 3 in 2009, acting through its nominee ONGC, and acquired a 30.0% participating interest in each. As of March 31, 2022, ONGC holds 30.0%, Vedanta Limited - oil and gas business holds 35.0% participating interest in the RJ block and the remaining 35.0% interest being held by CEHL, which is a wholly owned subsidiary of Vedanta Limited.
As per terms of the RJ block PSC and permissions from the GoI, the crude oil and condensate produced from the RJ block is being sold to both, the public sector undertakings refineries and private refineries. As of March 31, 2022, commercial sales arrangements are in place
in-line
with the production with public sector undertakings and private refineriesThe RJ block PSC established a Management Committee for the RJ block which consists of four members, two of whom are nominated by and represents the GoI and the licensee, i.e. ONGC, taken together, and two of whom are nominated by and represents Vedanta Limited - oil and gas business and CEHL. The Management Committee must unanimously approve annual work programs, budgets, proposals for the declaration of a discovery as commercial, FDP, and the delineation of or additions to a development area as provided in RJ block PSC.
The RJ block PSC was initially valid until May 2020, unless it is terminated in accordance with its terms, but may be extended by mutual agreement among the parties for up to an additional term of five years, provided in case of commercial production of natural gas which is expected to continue beyond 2020, the PSC shall be extended for a period of 35 years from May 15, 1995. There is also a provision to further extend the RJ block PSC by agreement of the parties if production of crude oil or of natural gas is expected to continue after the relevant period.
By way of a notification dated April 7, 2017, the MoPNG issued a policy for the grant of extension to the PSCs signed by the GoI awarding
Pre-NELP
Extension Policy. ThePre-NELP
Extension Policy defines the framework for granting extensions forPre-NELP
blocks.Pre-NELP
Extension Policy, amongst others, provides for an increased share of profit petroleum by 10% for the GoI during the extended term of the RJ block PSC.The Division Bench of the Delhi High Court in March 2021 set aside the single judge order of May 2018 which allowed extension of PSC on same terms and conditions. We have filed SLP before the Supreme Court of India against order of Delhi High Court dated March 26, 2021.
See “Item 8 - Financial Information - A. Consolidated Statements and Other Financial Information - Legal Proceedings” for further details.
The RJ block had benefitted from a tax holiday of seven years from fiscal year 2009 (the year of commencement of commercial production from the RJ block) to March 31, 2016. However, during the seven-year tax holiday, MAT rules were applicable which resulted in a taxation of book profits computed in accordance with the generally accepted accounting principles as used in India. Any MAT paid can be carried forward for a total period of 15 years from the year of payment and used to reduce corporate tax to be paid in future years in excess of MAT payable in those years.
Under the RJ block PSC, all crude oil sales made to the GoI or Government Companies as well as private buyers are valued at a weighted average F.O.B. selling price per barrel of a basket of international crude oil as agreed by all parties which is quoted in Platts, a provider of energy information. For any delivery period in which sales take place, the price is set at a price per barrel determined by calculating the average for the month of such delivery of the mean of the high and low F.O.B prices.
The crude oil produced at the RJ block is benchmarked to Dated Brent and Bonny Light, a low sulphur crude oil published in Platts Crude Oil Marketwire on a daily basis. The pricing formula also adjusts for differences in yield and quality.
In the event of any dispute, difference or claim between the parties to the RJ block PSC arising out of or in connection with any of the terms and conditions of the said PSC or concerning any interpretation or performance thereof which cannot be settled amicably may be referred a sole expert, to be appointed by the parties to the dispute jointly, who is to be an independent and impartial person of international standing with relevant qualifications and experience. Under the provisions of the RJ block PSC, the decision of the sole expert is final and binding on the parties and not subject to arbitration. The RJ block PSC also provides for settlement of any dispute, difference or claim between the parties through arbitration.
77
Operations
The RJ block achieved net production of 20.5 mmboe in fiscal year 2022, down by 8%, primarily driven by natural reservoir decline at the MBA fields. The decline was partially offset by addition of volumes from ramp up of gas volumes, commissioning of Aishwariya Barmer Hill facility, impact of polymer injection in Bhagyam and Aishwariya fields, new infill wells brought online in Mangala field and reduced operational downtime. The overall equipment effectiveness (OEE) of the Mangala Processing Terminal stood at over 95.6% for the year.
Development Area 1, primarily comprising the Mangala, Aishwariya, Saraswati, Guda and Raageshwari oil and gas fields, produced a net average 48,711 boepd during fiscal year 2022, lower by 11% year on year, with the Mangala field being the largest contributor. During fiscal year 2022, Development Area 2, primarily comprising Bhagyam, NE and NI fields, produced on an average 7,488 boepd, higher by 17% year on year. Production was from Kaameshwari in Development Area 3 during the year and averaged at 88 barrels of oil per day in fiscal year 2022.
The RJ block received approval from the GoI to begin selling natural gas in March 2013. The eight-inch gas pipeline which runs along the oil pipeline is being used to supply gas to domestic buyers, sales through GIGL pipeline commenced in November 2018. This is an efficient application diligent usage of resources in an environmentally friendly way. During fiscal year 2022, the average gas production from RDG field was 157.8 mmscfd and average sales was 127.7 mmscfd. Construction of new RDG gas facility got completed in fiscal year 2021.
The following table sets out the net average oil and gas daily production from the RJ block for the years ended March 31, 2020, 2021 and 2022:
Average Daily Production | Units | 2020 | 2021 | 2022 | % Change (2021 vs 2022) | |||||||||||||
Net operated | Boepd | 79,720 | 61,215 | 56,287 | (8 | %) | ||||||||||||
Oil | Bopd | 72,143 | 53,992 | 47,717 | (12 | %) | ||||||||||||
Gas | Mmscfd | 45 | 43 | 51 | 19 | % | ||||||||||||
Net Development Area 1 | Boepd | 72,741 | 54,719 | 48,711 | (11 | %) | ||||||||||||
Net Development Area 2 | Boepd | 6,797 | 6,399 | 7,488 | 17 | % | ||||||||||||
Net Development Area 3 | Boepd | 183 | 97 | 88 | (9 | %) | ||||||||||||
Mangala
The Mangala field commenced production in August 2009 and continues to be the largest contributor to production from the Rajasthan asset. To increase the ultimate oil recovery and support for production volumes, Cairn embarked on an enhanced oil recovery project, which was successfully executed in fiscal year 2016.
In order to accelerate recovery from Mangala field, surface facility upgradation was carried out in fiscal year 2021 which resulted in increase in liquid handling capacity by 30% at the Mangala processing terminal. In addition, several infill projects have been executed in Mangala field to increase the ultimate oil recovery and support production volumes.
Cairn executed an infill drilling campaign of 4 horizontal wells and 1 vertical well in FM3 and FM5 sands during fiscal year 2022. Drilling has been completed and 4 wells have been hooked till March 31, 2022.
Bhagyam
Bhagyam, the second largest field in Rajasthan, forms part of Development Area 2 and commenced production in January 2012.
To enhance recovery from the Bhagyam field, enhanced oil recovery program was carried out in during fiscal year 2021. Polymer injections has been ramped to its design capacity and Bhagyam is currently under full field polymer injection.
To accelerate recovery from the Bhagyam field, an infill drilling campaign consisting of 14 wells has been identified. Drilling is expected to commence during first half of fiscal year 2023.
Aishwariya
Aishwariya, the third largest discovery in Rajasthan, commenced production in March 2013.
To enhance recovery from the Aishwariya field, enhanced oil recovery program was carried out in Lower Fatehgarh (LF) region during fiscal year 2021. Polymer injections has been ramped to its design capacity and the field is currently under full field polymer injection.
To replicate this success, expansion of polymer flood to UF has been identified to increase recovery by improving sweep efficiency. The project entails drilling of 25 wells and 7 conversion wells. Drilling is expected to commence during first half of fiscal year 2023.
78
South Satellite fields including Raageshwari, Saraswati, Guda and Kaameshwari
The Raageshwari oil field commenced production in March 2012, while the Saraswati field commenced production in May 2011. Kaameshwari and Guda oil fields commenced production in May and June 2017, respectively.
Availability of the integrated processing and evacuation facility has reduced operating costs and has therefore made these fields economically viable.
Facilities
Mangala Processing Terminal
The Mangala processing terminal is spread over an area of 1.6 square kms and is a core asset. The Mangala processing terminal processes crude oil produced from various oil fields in the RJ block. The Mangala processing terminal is currently operational with four oil processing trains. The aggregate liquid handling name plate capacity of the oil processing trains is 1,300 kblpd. The oil processing train primarily consists of slug catchers, production heaters, a production separator and settling tank for oil water separation and degassing. Stabilized crude after meeting export crude specification is transported to refineries through a
24-inch
diameter continuously heated and insulated pipeline. The Mangala processing terminal’s integrated production facilities support the FDP approved production, which is in line with Cairn’s unified RJ block offtake capability.Raageshwari Gas Processing Facility
The Raageshwari gas terminal about 70 kms from the Mangala processing terminal, comprises facilities to remove condensable hydrocarbon liquids and water from the gas produced from Raageshwari gas terminal wells. Gas produced and processed at Raageshwari gas terminal was supplied solely to Mangala processing terminal and to the heating stations along the oil export pipeline from Mangala processing terminal. In March 2013, Vedanta Limited - oil and gas business commenced the commercial sale of gas from the RDG field. This was the first step towards unlocking the natural gas potential of the Rajasthan assets. The construction of the new gas facility completed during fiscal year 2021. The upgraded facility along with existing and early production facility shall have the capacity to process approximately 245 mmscfd of gas. On the pipeline front, GSPL India Gasnet Limited (“GIGL”) has commissioned a pipeline connecting Raageshwari Gas Terminal to Pali and thereon connecting to Palanpur in Gujarat. Gas flow via GIGL line commenced during the third quarter of fiscal year 2019.
Power facilities
At the RJ block, captive power is generated at the Mangala processing terminal via steam turbine generators and Raageshwari gas terminal via gas engines. The total power capacity across Mangala processing terminal and Raageshwari gas terminal aggregates to 102.3 MW. The gas used as fuel is the associated gas from the fields at Rajasthan. For power requirements exceeding the power generation capacity, which is based on associated gas availability, Cairn taps into the Rajasthan state grid power or buys it through open access from the energy exchanges at lower rates.
Mangala Development Pipeline
The Mangala development pipeline is designed to evacuate the crude oil and transport gas from the RJ block. Beginning at the Mangala processing terminal and Raageshwari terminal respectively, the
24-inch
crude oil and8-inch
gas pipeline passes through eight districts across two states, Rajasthan and Gujarat. The pipeline ends at Bhogat near Jamnagar on the western coast of India. There are buffer crude storage terminals at Radhanpur and Viramgam for sales to Indian Oil Corporation andoff-take
lines at Salaya for sales to the Reliance India Limited and Nayara Energy Limited refineries in Jamnagar. Since its commissioning, total cumulative crude oil sales of 636 million barrels have been achieved through the existing pipeline facilities up to March 31, 2022. With the use of drag reducing agents, the proven dispatch capacity of the Mangala development pipeline has been enhanced to around 250,000 bbls per day. Given its length, the Mangala development pipeline incorporates a pipeline intrusion detection system to provide surveillance along its entire length by using fibre optics. Vedanta Limited - oil and gas business’s pipeline operations received accreditation of ISO: 14001 systems in fiscal year 2018 and ISO45001 in fiscal year 2019.In fiscal year 2014, gas sales commenced through the
8-inch
gas pipeline. Capacity was further enhanced through installation of higher capacity gas compressors at Raageshwari and Viramgam terminals to nearly double gas sales capability, as well as modification of impellers of the mainline booster pumps at Viramgam. During fiscal year 2016, stabilization of the compressors and optimization of plant operations aided production. GSPL India Gasnet Limited (“GIGL”) commissioned a pipeline connecting Raageshwari Gas Terminal to Pali and thereon connecting to Palanpur in Gujarat. Gas flow via GIGL line commenced during the third quarter of fiscal year 2019 resulting in higher sales.In November 2015, the Salaya-Bhogat pipeline and terminal at Bhogat were commissioned and the first cargo of 500,000 barrels of Rajasthan crude oil was successfully loaded in December 2015, through the Bhogat terminal for Mangalore Refinery and Petrochemicals Limited (“MRPL”). The terminal has provided access to a larger market for Rajasthan crude oil.
79
Bhogat Terminal Facilities
The Bhogat terminal in the Jamnagar district, Gujarat, is a
160-hectare
site located eight kms from the Arabian Sea coast. The terminal will facilitate the storage and evacuation of crude oil by sea. The terminal consists of tankages with storages capacity of around 2.1 million barrels of Rajasthan crude. It also has associated facilities for the operation of terminal and marine export of crude. The evacuation facility includes two24-inch
sub-sea
export pipelines from the Bhogat landfall point to the single point mooring system to enable crude transfer and a single point mooring system andsub-sea
pipeline end manifold in deep sea to enable tanker berthing and loading. The terminal was commissioned in November 2015 and the dispatch of Rajasthan crude to MRPL has commenced. In fiscal year 2018 supplies of RJ crude to Bharat Petroleum Corporation Limited (“BPCL “) commenced from Bhogat terminal. During fiscal year 2020, we successfully loaded cargos from Bhogat terminal during monsoon season by deploying additional marine support infrastructure to ensure safe operations.Exploration
Cairn is rejuvenating its oil and gas exploration efforts in the prolific Barmer Basin. The Rajasthan portfolio provide access to multiple play types with oil in high permeability reservoirs, tight oil and tight gas. We have completed drilling of 3 exploration wells during fiscal year 2022. We also performed appraisal activities in tight oil (Vijaya and Vandana (V&V) and DP fields) and Felsic (oil) zone in RDG. We are also evaluating further opportunities to drill low to medium risk and medium to high reward exploration wells to build on the resource portfolio.
| Ø | Ravva |
Ravva Block PSC
The PSC for the exploration, development and production of the Ravva block (the “Ravva PSC”) was signed on October 28, 1994 between GoI and a consortium consisting of ONGC, Videocon Industries Limited (formerly Videocon Petroleum Limited), Ravva Oil Singapore and Cairn Energy India Pty Limited (formerly known as Command Petroleum (India) Pty Limited) (“Command Petroleum”) with Command Petroleum being designated as the operator. In 1996, Cairn Energy Plc acquired Command Petroleum, including its interest in the Ravva block, and subsequently Vedanta Limited - oil and gas business (since merged with Vedanta Limited) became the operator.
As at March 31, 2022 Vedanta Limited - oil and gas business holds a 22.5% working interest in the Ravva block with the remaining interests currently held by ONGC (40%), Videocon Industries Limited (25%) and Ravva Oil Singapore (12.5%) (together the “Ravva Joint Operating Partners”). Ravva PSC was originally valid until October 27, 2019 and has now been extended for 10 years by GoI in accordance with the provision of the “Policy on the Grant of the extension to PSC Signed by Government awarding small, medium sized and discovered field to private joint ventures” dated March 28, 2016. The PSC addendum recording this extension has been executed by all parties.
The extension policy, amongst others, provides for an increased share of profit petroleum of 10% for the GoI during the extended term of the Ravva PSC and payment of royalty and cess as per prevailing rate in accordance with the Petroleum and Natural Gas Rules, 1959 (“PNG Rules”) and Oil Industry (Development) Act, 1974 (“OIDA Act”). Under the Ravva PSC, Vedanta Limited - oil and gas business is entitled to recover 100% of development and production costs from crude oil and natural gas sales before any profit is allocated among the parties. The recovery of exploration cost during the extension period shall be governed in accordance with the provision of Office Memorandum 2013 and 2019 issued by MoPNG on Exploration in Mining lease area post expiry of the Exploration period which provides that the exploration cost can be recovered after the approval of FDP by management committee.
As per the terms of the Ravva PSC, the crude oil and condensate produced from the Ravva block is being sold to the public sector undertakings refineries. As of March 31, 2022, commercial sales arrangements are in place in line with the production with public sector undertakings. All sales to the GoI nominees are to be valued at a monthly average of high and low of F.O.B. selling price per barrel in US dollars based on a pricing formula based on Bonny Light crude oil, ascertained by Platts.
The Ravva PSC provides that royalties and cess are payable on production and sales respectively. Until October 27, 2019 the royalty rate on crude oil and casing head condensate was set at 481 per metric ton ($ 0.87 per barrel), regardless of the value of the crude oil. A levy on the production of crude oil under the provisions of the OIDA Act (the “OIDA Cess”) was set by the Ravva PSC at 900 per metric ton of crude oil production ($ 1.63 per barrel).
₹
₹
Post Ravva PSC extension, the royalty payable on natural gas is set at 10% of the wellhead value of the natural gas (typically 9% of natural gas revenue). OIDA Cess is not payable on natural gas production. Royalties and OIDA Cess on crude oil are as per prevailing rate of 10% of Well Head price and 20% of sales prices respectively under PNG Rules and OIDA Act. Payment of royalty and OIDA cess payments are recoverable under the Ravva PSC before any profit is allocated among the parties. As ONGC originally discovered the Ravva block, Vedanta Limited - oil and gas business and other members of the Ravva Joint Operating Partner are obliged to make a series of production payments to ONGC based on cumulative crude oil production. The method of calculating the production payments is set out below.
Particulars | Gross Payment Owed to ONGC ($ million) | Net Payment by Vedanta Limited - oil and gas business ($ million) | ||||||
For every 25 million barrels produced up to 75 million barrels | 9.0 | 3.4 | ||||||
For every 5 million barrels produced between 75-100 million barrels | 1.8 | 0.7 | ||||||
For every 5 million barrels produced between 100-225 million barrels | 1.7 | 0.6 | ||||||
For every 5 million barrels produced between 225-250 million barrels | 1.4 | 0.5 | ||||||
For every 5 million barrels produced over 250 million barrels | 0.9 | 0.3 | ||||||
80
Disputes have arisen between the Ravva Joint Operating Partners over the interpretation of the Ravva PSC which have required arbitration. For example, a dispute arose between the GoI and Ravva Joint Operating Partners on the issue as to how the ONGC Carry is to be recovered and calculated, along with other issues.
The Ravva PSC obliges the contractor parties to pay a proportionate share of ONGC’s exploration, development, production and contract costs in consideration for ONGC’s payment of costs related to the construction and other activities it conducted in Ravva prior to the effective date of the Ravva PSC (the ONGC Carry). The question as to how the ONGC Carry is to be recovered and calculated, along with other issues, was submitted to an International Arbitration Tribunal in August 2002.
See
“
Item 8 – Financial Information - A. Consolidated Statements and Other Financial Information - Legal Proceedings
”
for further details
Operations
The production of Ravva block decreased from 3,479 boepd in fiscal year 2021 to 2,260 boepd in fiscal year 2022. This was primarily due to natural field decline. Previous year production included impact of infill drilling campaign.
The following table sets out the net average daily production of oil and gas from the Ravva block for the years ended March 31, 2020, 2021 and 2022:
Average Daily Production | Units | 2020 | 2021 | 2022 | % Change (2021 vs. 2022) | |||||||||||||
Net operated | Boepd | 1,976 | 3,479 | 2,260 | (35 | %) | ||||||||||||
Oil | Bopd | 1,518 | 2,715 | 1,893 | (30 | %) | ||||||||||||
Gas | Mmscfd | 3 | 5 | 2 | (52 | %) | ||||||||||||
Facilities
Currently, there are eight unmanned offshore platforms and a
225-acre
onshore processing facility at Surasaniyanam, Andhra Pradesh, for processing the natural gas and crude oil produced from the offshore field. The Ravva onshore terminal operates under internationally recognized environmental standard (ISO 14001) and occupational health and safety standard (OHSAS18001). The onshore processing facility has the capacity to handle 90,000 barrels per day of liquid, 110,000 bbls of water injection per day and natural gas compression capacity of around 60 mmscfd of natural gas. The terminal also has the capacity to store 1.0 mmbbls of crude oil and captive power generation capacity of 10 MW.Cambay
Cambay Block PSC
Exploration, development and production of the Cambay block is governed by a PSC between the GoI and a consortium consisting of ONGC, Tata Petrodyne Limited (“Tata”) and Vedanta Limited - oil and gas business (the “Cambay Joint Operating Partners”) which was signed on June 30, 1998 (the “Cambay PSC”) and runs until 2023 unless the Cambay PSC is terminated earlier in accordance with its terms and may be extended for a further period of not exceeding five years, provided that in the event of commercial production of
non-associated
natural gas the Cambay PSC may be extended for period not exceeding 35 years from the June 30, 1998.By way of a notification dated April 7, 2017, the MoPNG issued a policy for the grant of extension to the PSC signed by the GoI awarding
Pre-NELP
Exploration Blocks which defines the framework for granting extensions forPre-NELP
blocks. ThePre-NELP
Extension Policy, amongst others, provides for an increased share of profit petroleum of 10% for the GoI during the extended term of the Cambay PSC. The extension application has been filed by the Cambay Joint Operating Partners under MoPNG Policy dated April 7, 2017 for the grant of extension to the PSC, for a period of ten years beyond the existing PSC period (i.e., till June 29, 2033), to commercially monetize the remaining resources in the block.Vedanta Limited - oil and gas business’s participating interest in the Cambay Basin joint operation consists of a 40% interest in the Lakshmi, Gauri and
CB-X
development areas. The remaining interests in these development areas are held by ONGC (50%) and Tata (10%).Operations
The Cambay block started production in calendar year 2002. During fiscal year 2022, the block produced 2,463 boepd, lower by 5% year on year. This was primarily due to natural field decline partially offset by well interventions and production optimization measures.
81
The following table sets out the net average oil and gas daily production from the Cambay block for the years ended March 31, 2020, 2021 and 2022:
Average Daily Production | Units | 2020 | 2021 | 2022 | % Change (2021 Vs. 2022) | |||||||||||||
Net operated | Boepd | 3,475 | 2,601 | 2,463 | (5 | %) | ||||||||||||
Oil | Bopd | 3,030 | 2,196 | 1,976 | (10 | %) | ||||||||||||
Gas | Mmscfd | 2.7 | 2.4 | 3 | 20 | % | ||||||||||||
| Ø | Facilities |
An
82-acre
onshore processing facility at Suvali processes natural gas and crude oil from the Lakshmi and Gauri fields. This facility has a capacity to process 150 mmscfd of natural gas and 16,000 bopd of crude oil and includes a three-stage separator oil processing train, four storage tanks of combined capacity of 40,000 bbls as well as 4.8 MW captive power generation capacity. As part of the asset’s long-term facility augmentation plan, the liquid handling capacity has been augmented. The oil processing capacity has been increased by debottlenecking the liquid processing train by adding additional heater and heat exchangers. Also commissioning of new Effluent Treatment Plant (ETP) of additional 6,000 bwpd produced water processing and treatment capacity is underway. This will result in increase in the overall produced water treatment capacity to 12,000 bwpd. The processing plant and offshore infrastructure are certified to ISO 14001 and ISO 45001 standards.Power Generation facilities
Cairn’s current power generation facilities are set up to address the captive power requirements to run its routine business operations. The total installed capacity across upstream and midstream operations are 204.3 MW. The following table sets forth information relating to the existing power capacity as of March 31, 2022:
Fiscal year commissioned | Capacity (MW) | Location | Fuel used | |||||
2010 and 2014 | 60 | Rajasthan Mangala processing terminal | Steam turbine | |||||
2010 | 3.3 | Rajasthan Raageshwari gas terminal | Gas based | |||||
2019 | 2 | Rajasthan Raageshwari gas terminal | Gas based | |||||
2021 | 37 | Rajasthan Raageshwari gas terminal | Gas based | |||||
2010 | 14.4 | Gujarat Viramgam terminal | Gas Based | |||||
2015 | 39.9 | Gujarat Bhogat Terminal | Gas Based | |||||
2010 | 32.9 | Pipeline Above Ground Installations (AGI’s) | Gas Based | |||||
2003 | 4.8 | Cambay | Gas based | |||||
1999 and 2003 | 10 | Ravva | Gas based | |||||
| Ø | KG Onshore |
KG-ONN-2003/1,
The onshore blocklocated in the Krishna Godavari basin in the state of Andhra Pradesh, was awarded in NELP V round to a joint venture between Vedanta Limited—oil and gas business and ONGC. Vedanta Limited—oil and gas business and ONGC entered into a PSC on September 23, 2005 (thePSC”). Vedanta Limited—oil and gas business has 49% participating interest in the block.
KG-ONN-2003/1,
“KG-ONN-2003/1
The Declaration of Commerciality for the two Nagayalanka discoveriesPSC. Production from the existing well had commenced in the first quarter of fiscal year 2019. Drilling of three development wells was completed in fiscal year 2019 and all the three wells are online. We have further identified opportunities to drill three firm wells to accelerate production. Drilling is expected to commence during first half of fiscal year 2023.
(Nagayalanak-1z
and NagayalankaSE-1)
was approved at the management committee meeting held in July 2014. Operatorship was then transferred to ONGC as per theKG-ONN-2003/1
Average Daily Production | Units | 2020 | 2021 | 2022 | Change (2021 Vs. 2022) | |||||||||||||||
Net operated | Boepd | 480 | 437 | 531 | 21 | % | ||||||||||||||
Oil | Boepd | 438 | 430 | 456 | 6 | % | ||||||||||||||
Gas | Mmscfd | 0.2 | 0.0 | 0.5 | 919 | % | ||||||||||||||
82
| Ø | KG Offshore |
KG-OSN-2009/3, Krishna Godavari Basin (operator, 100% participating interest)
The offshore blockcovers an area of 1,988 square kms and is located in the Krishna Godavari Basin off the coast of the state of Andhra Pradesh. The block is currently in the initial exploration phase and several extensions were sought on excusable delay and the removal of access restriction imposed by Ministry of Defence. Further, due to the
KG-OSN-2009/3
COVID-19
pandemic, force majeure was invoked in the block on the grounds that the pandemic made it impossible to conduct petroleum operations. Having regard to the invocation, DGH had granted extension to the exploration activities till November 10, 2021. Further, vide letter dated August 13, 2021, we have applied for the surrender of the block due to impossibility of conduct of petroleum operations in absence of unconditional and unfettered access. We are under discussion with DGH for further progress in the block.| Ø | Blocks awarded under Open Acreage Licensing Policy (“OALP”) |
Vedanta Limited’s oil and gas business were awarded 51 blocks under OALP I, II and III and RSC have been signed for them with $ 800 million commitment. The 51 blocks, comprising 40 onshore and 11 offshore blocks, are located primarily in established basins, and with some optimally located close to existing infrastructure.
Full Tensor Gravity Gradiometry
™
(FTG) airborne survey for prioritising area of hydrocarbon prospectivity has been completed in Assam, Cambay, Rajasthan and Kutch region. Seismic acquisition program has been completed in Assam, Rajasthan, Cambay, and Offshore region.Till March 31, 2022, 11 wells have been drilled (3 in Rajasthan, 6 in Cambay and 2 in North-east). We intend to continue the exploration across Rajasthan, Cambay, and North-east in fiscal year 2023 to unlock the full potential of the OALP blocks.
Till date three hydrocarbon discoveries have been notified under the OALP portfolio.
| • | Rajasthan (2 Discoveries): KW2-Updip-1 -1 notified as oil discovery during fiscal year 2022 and monetisation is under planning. |
| • | Cambay (1 Discovery): Jaya-1 is a gas and condensate discovery, and monetisation is under planning. |
Geophysical and geotechnical site survey is ongoing in Offshore region Drilling is expected to commence during first half of fiscal year 2023.
Discovered Small Fields (“DSF2”)
Vedanta Limited - oil and gas business has won two discovered small fields in DSF
round-2
named as Hazarigaon and Kaza gas field located in Assam and KG basins respectively. These discovered fields are providing synergy to existing Vedanta Limited—oil and gas business blocks in the vicinity.Hazarigaon:
Hazarigaon-1
well and monetisation is under planning.Sales and Marketing
Cairn’s ten largest customers accounted for approximately 100% of its revenue in fiscal years 2020, 2021 and 2022 respectively. Four of Cairn’s customers accounted for approximately 91% of its business revenue in fiscal year 2022.
In fiscal year 2022, Cairn sold 100% of the oil and gas it produces in the Indian market.
100% of the oil and gas that Cairn produced in fiscal year 2022 was sold under annual/monthly contracts specifying quantity and price. For Rajasthan, during fiscal year 2022, crude oil price for private companies was benchmarked to Dated Brent, international benchmark crude for low sulphur crude grades. For PSU companies, Cambay and Ravva blocks, the price was benchmarked to Bonny Light, West African low sulphur crude that is frequently traded in the region, with appropriate adjustments for crude quality. The crude oil price benchmarks are based on crude oil sales agreement.
83
Projects and Developments
The Oil & Gas business has a robust portfolio of infill development and enhanced oil recovery projects to add volumes in the near term and manage natural field decline. Some of Vedanta Limited - oil and gas business’s principal projects are set out below:
Infill Projects
Mangala -
Tight Oil (A
BH) -
Aishwariya Barmer hill stage II drilling program established confidence in reservoir understanding of ABH. Based on the success of it, drilling of 5 additional wells were conceptualized. These were drilled by the fourth quarter of fiscal year 2022. Of these, 2 wells have been hooked up till March 31, 2022.
NI Infill -
hook-up
of 3 producer wells in the NI field. Drilling and hook up of 3 well campaign has been successfully completed during fiscal year 2022.Tight Gas (RDG) -
Satellite Fields -
hooked-up.
Offshore (Cambay) -
hooked-up.
| Ø | Reserves and Other Oil and Gas Information |
The definitions used for proved, proved developed and proved undeveloped oil and gas reserves are in accordance with the Securities and Exchange Commission Rule
4-10
of RegulationS-X.
Proved oil and natural gas reserves are those estimated quantities of crude oil, natural gas and natural gas liquids that geological and engineering data demonstrate with reasonable certainty to be economically producible in future years from known reservoirs, under existing economic and operating conditions including a12-month
average price prior to the end of the reporting period, unless prices are defined by contract, and cost at the date of estimation.DeGolyer and MacNaughton performed an independent evaluation of our 100% estimated reserves base as of March 31, 2022. See the reserves appraisal report by DeGolyer and MacNaughton, dated May 13, 2022, included as exhibit to this Annual Report.
All the proved reserves presented herein are based on PSC with the GoI. As such, all net reserves are based on an entitlement calculation which converts Cairn’s share of cost recovery and profit petroleum under each contract to a volume equivalent of net reserves in accordance with SEC guidance on calculating net reserves subject to these agreements. For further information on our proved reserves, see “”.
Supplementary Information on Oil and Gas Exploration and Production
| Ø | Proved Reserves |
Proved reserves estimates are based on the requirement of reasonable certainty with technical and commercial assessments based on conventional industry practices. Only technologies that have been tested in the field and have been demonstrated to provide reasonably certain results with consistency and repeatability in the formation being evaluated or in an analogous formation are applied. To determine a reasonable certainty of commercial recovery, the process involves a general method of reserves assessment that relies on the integration of three types of data:
| 1. | Well data used to assess the local characteristics and conditions of reservoirs and fluids. |
| 2. | Field-scale seismic data to allow the interpolation and extrapolation of these characteristics within and outside the immediate area of the local well control. |
| 3. | Data from relevant analogous fields. The data includes appraisal wells or sidetrack holes, full logging suites, core data, and fluid samples. |
84
In the fields in which estimates of proved reserves have been prepared, reserves have only been estimated from those quantities of oil or gas in place that are above a penetrated hydrocarbon contact or above a lowest known hydrocarbon elevation. In the estimation of reserves associated with improved recovery operations, reserves are based on existing field performance parameters or from the performance of an analogous reservoir located in an adjacent field producing from the same geologic formation, in the same environment of deposition, with a similar geologic structure, containing the same drive mechanism, and containing in aggregate reservoir properties no more favorable than the reservoir of interest. In the estimation of reserves associated with enhanced oil recovery, estimates of reserves have been prepared on the basis of the performance of a pilot project that has exhibited a positive production response located within the field and reservoir in which the reserves have been attributed.
The table below sets forth our estimated net proved developed and undeveloped reserves of crude oil and natural gas by region as of March 31, 2022, based on average fiscal year 2022 prices:
Particulars | Oil (mmbbls) | Natural Gas (bcf) | Total oil and gas products (mmboe) | |||||||||
Proved developed Reserves | ||||||||||||
India | 64.91 | 67.77 | 76.20 | |||||||||
Proved undeveloped Reserves | ||||||||||||
India | 10.17 | 7.75 | 11.46 | |||||||||
Total proved reserves | 75.08 | 75.52 | 87.66 | |||||||||
Note: Gas is converted to oil equivalent using a factor of 6,000 cubic feet of gas per 1 barrel of oil equivalent.
The table below summarizes information about the changes in total proved reserves for 2020, 2021 and 2022:
| Ø | Total Proved Developed and Undeveloped Reserves |
Reserves quantity information | Oil (mmbbls) | Natural Gas (bcf) | Total oil and gas products (mmboe) | |||||||||
March 31, 2019 | 126.83 | 95.37 | 142.72 | |||||||||
Revisions of previous estimates | 5.40 | 42.37 | 12.47 | |||||||||
Improved recovery | — | — | — | |||||||||
Purchases or (sales) of minerals | — | — | — | |||||||||
Extensions and discoveries | 0.04 | 0.00 | 0.04 | |||||||||
Production | (28.23 | ) | (18.71 | )�� | (31.35 | ) | ||||||
March 31, 2020 | 104.04 | 119.03 | 123.88 | |||||||||
Revisions of previous estimates | 21.47 | 9.21 | 23.00 | |||||||||
Improved recovery | — | — | — | |||||||||
Purchases or (sales) of minerals | — | — | — | |||||||||
Extensions and discoveries | 0.67 | 0.00 | 0.67 | |||||||||
Production | (21.88 | ) | (18.46 | ) | (24.96 | ) | ||||||
March 31, 2021 | 104.30 | 109.78 | 122.59 | |||||||||
Revisions of previous estimates | (10.23 | ) | (14.57 | ) | (12.66 | ) | ||||||
Improved recovery | — | — | — | |||||||||
Purchases or (sales) of minerals | — | — | — | |||||||||
Extensions and discoveries | — | 1.12 | 0.19 | |||||||||
Production | (19.00 | ) | (20.80 | ) | (22.46 | ) | ||||||
March 31, 2022 | 75.07 | 75.53 | 87.66 | |||||||||
| * | Includes impact of 10-year extension of the PSC forRJ-ON-90/1 PKGM-1 blocks. |
| Ø | Proved Developed and Undeveloped Reserves |
Total proved reserves as of March 31, 2021, were 122.60 mmboe. For the year ending March 31, 2022, total revisions of 12.66 mmboe were comprised of an increase of 7.33 mmboe based on technical revisions due to changes in production performance and a decrease of 19.99 mmboe due to revisions based on commodity prices. These total revisions were comprised of an increase of 0.55 mmboe for the Cambay blocka decrease of 13.90 mmboe for the RJ blockand an increase of 0.68 mmboe for the Ravva block
(CB/OS-2),
an increase of 0.01 mmboe for the Nagayalanka block(KG-ONN-2003/1),
(RJ-ON-90/1),
(PKGM-1).
No revisions were made due to improved recovery. Extensions and discoveries of 0.19 mmboe were on account of inclusion of the Hazarigaon field which was approved for development in the Hazarigaon block(AA-ONHP-2018/01).
After adjusting for production of 22.46 mmboe, the total proved reserves as of March 31, 2022, were 87.66 mmboe.85
Proved developed reserves as of March 31, 2021, were 115.42 mmboe. For the year ending March 31, 2022, total revisions of 16.94 mmboe were comprised of a decrease of 2.16 mmboe based on changes in production performance and the progression from proved undeveloped to proved developed reserves, and a decrease of 14.78 mmboe due to revisions based on commodity prices. These total revisions were comprised of a decrease of 0.02 mmboe for the Cambay block, an increase of 0.01 mmboe for the Nagayalanka block, a decrease of 17.61 mmboe for the RJ block, and an increase of 0.68 mmboe for the Ravva block. No revisions were made due to improved recovery. Extensions and discoveries of 0.19 mmboe were on account of inclusion of the Hazarigaon field which was approved for development in the Hazarigaon block. After adjusting for production of 22.46 mmboe, the total proved developed reserves as of March 31, 2022, were 76.20 mmboe.
Proved undeveloped reserves as of March 31, 2021, were 7.17 mmboe. For the year ending March 31, 2022, total revisions were 4.28 mmboe. Technical revisions were comprised of an increase of 9.49 mmboe based on the progression from proved undeveloped to proved developed of reserves and revision of existing technical estimates. These technical revisions were offset by a decrease of 5.21 mmboe due to changes in commodity prices. These total revisions comprised an increase of 0.57 mmboe in the Cambay block, no change in the Nagayalanka block, an increase of 3.71 mmboe in the RJ block, and no change in the Ravva block. No revisions were made due to improved recovery. No revisions were made due extensions and discoveries. The proved undeveloped reserves as of March 31, 2022, were 11.46 mmboe. There are no material amounts of proved undeveloped reserves that remain undeveloped for five years or more.
| Ø | Internal controls over reserves estimation process |
Cairn maintains an internal staff of petroleum engineers, geoscientists and economists who work closely with our independent reserves engineers to ensure the integrity, accuracy and timeliness of data furnished to our independent reserves engineers in their estimation process and who have knowledge of the specific properties under evaluation. All the activities of reserves estimation are being coordinated by Chief Reservoir Engineer/SBU R&R Head(s) who is/are primarily responsible for overseeing the preparation of our reserves estimates and for the internal control over our reserves estimation. The Chief Reservoir Engineer/SBU R&R Head has more than 30 years of industry experience, in the exploration and production sectors as a practicing reservoir engineer, with broad experience in reserves assessment, field development and management.
During each fiscal year, our technical team meets with DeGolyer and MacNaughton (“D&M”) who are provided with full access to complete and accurate information pertaining to the properties to be evaluated and all applicable personnel. In addition, other pertinent data is provided such as seismic information, geologic maps, well logs, production tests, material balance calculations, well performance data, operating procedures and relevant economic information.
| Ø | Independent reserves estimation |
Reserves estimates presented herein for our Indian assets are based on the D&M Reserves Reports, completed on May 13, 2022, a copy of which has been filed as an exhibit to this Annual Report.
D&M, a Delaware corporation with offices in Dallas, Houston, Calgary, Moscow and Algiers, has been providing consulting services to the oil and gas industry for more than 75 years. The firm has more than 150 professionals, including engineers, geologists, geophysicists, petro physicists and economists that are engaged in the appraisal of oil and gas properties, the evaluation of hydrocarbon and other mineral prospects, basin evaluations, comprehensive field studies and equity studies related to the domestic and international energy industry. D&M restricts its activities exclusively to consultation and does not accept contingency fees, nor does its own operating interests in any oil, gas or mineral properties, or securities or notes of its clients. The firm subscribes to a code of professional conduct, and its employees actively support their related technical and professional societies. The firm is a Texas Registered Engineering Firm.
Federico Dordoni, Senior Vice President with D&M was responsible for the preparation of the D&M Reserves Report. Mr. Dordoni studied at the Buenos Aires Institute of Technology (ITBA) University and graduated with a degree in Petroleum Engineering in the year 2004. He is a registered professional engineer in the State of Texas and a member of the International Society of Petroleum Engineers. He has more than 17 years of experience in oil and gas reservoir studies and reserves evaluations.
The D&M Reserves Report covered 100% of our total proved reserves. In connection with the preparation of the D&M Reserves Report, D&M prepared its own estimates of our proved reserves. In the process of the reserves evaluation, D&M did not independently verify the accuracy and completeness of information and data furnished by Cairn with respect to ownership interests, oil and gas production, well test data, historical costs of operation and development, product prices, or any agreements relating to current and future operations of the fields and sales of production. However, if in the course of the examination something came to the attention of D&M that brought into question the validity or sufficiency of any such information or data, D&M did not rely on such information or data until it had satisfactorily resolved its questions relating thereto or had independently verified such information or data. D&M independently prepared reserves estimates to conform to the guidelines of the SEC, including the criteria of “reasonable certainty,” as it pertains to expectations about the recoverability of reserves in future years, under existing economic and operating conditions, consistent with the definition in Rule
4-10(a)
of RegulationS-X.
D&M issued the D&M Reserves Report based upon its evaluation. D&M’s primary economic assumptions in estimates included oil and gas sales prices determined according to SEC guidelines, future expenditures and other economic assumptions (including interests, royalties and taxes) as provided by Cairn. The assumptions, data, methods and procedures used, including the percentage of our total reserves reviewed in connection with the preparation of the D&M Reserves Report were appropriate for the purpose served by such report, and D&M used all methods and procedures as it considered necessary under the circumstances to prepare such reports.86
However, uncertainties are inherent in estimating quantities of reserves, including many factors beyond our and our independent reserves engineers’ control. Reserves engineering is a subjective process of estimating subsurface accumulations of oil and natural gas that cannot be measured in an exact manner, and the accuracy of any reserves estimate is a function of the quality of available data and its interpretation. As a result, estimates by different engineers often vary, sometimes significantly. In addition, physical factors such as the results of drilling, testing and production subsequent to the date of an estimate, economic factors such as changes in product prices or development and production expenses, and regulatory factors, such as royalties, development and environmental permitting and concession terms, may require revision of such estimates. Cairn’s operations may also be affected by unanticipated changes in regulations concerning the oil and gas industry in the countries in which Cairn operates, which may impact our ability to recover the estimated reserves. Accordingly, oil and natural gas quantities ultimately recovered will vary from reserves estimates.
| Ø | Oil and gas production, production prices and production costs |
The following tables set forth our production of crude oil and natural gas on entitlement interest basis, by geographic area for the years ended March 31, 2020, March 31, 2021, and March 31, 2022:
Geography (4) | For the year ended March 31, | |||||||||||||||||||||||||||||||||||
2020 | 2021 | 2022 | ||||||||||||||||||||||||||||||||||
Crude Oil | Natural Gas (1) | Total | Crude Oil | Natural Gas (1) | Total | Crude Oil | Natural Gas (1) | Total | ||||||||||||||||||||||||||||
(mmbbls) | (bcf) | (mmboe) | (mmbbls) | (bcf) | (mmboe) | (mmbbls) | (bcf) | (mmboe) | ||||||||||||||||||||||||||||
India (2) | 28.23 | 18.71 | 31.35 | 21.88 | 18.46 | 24.96 | 19.00 | 20.80 | 22.46 | |||||||||||||||||||||||||||
Mangala (3) | 18.64 | — | 18.64 | 12.88 | — | 12.88 | 10.09 | — | 10.09 | |||||||||||||||||||||||||||
Others | 9.59 | 18.71 | 12.71 | 9.00 | 18.46 | 12.08 | 8.91 | 20.80 | 12.37 | |||||||||||||||||||||||||||
Total | 28.23 | 18.71 | 31.35 | 21.88 | 18.46 | 24.96 | 19.00 | 20.80 | 22.46 | |||||||||||||||||||||||||||
Notes:
| (1) | Natural gas production figures are the production volumes of natural gas available for sale, excluding flared and re-injected gas and gas consumed in operations. |
| (2) | For the computation of EI production, Ravva royalty fees have not been netted off. |
| (3) | Mangala field is separately included as it contains more than 15% of our total proved reserves. |
| (4) | Cairn along with Petro SA filed closure application with PASA to exit from South Africa operations and the same has been accepted and closure certificate has been granted by PASA on September 20, 2019. |
The following table sets forth our average sales prices by geographic area and
by-product
type for the last three years:Particulars | During the year ended March 31, | |||||||||||||
2020 | 2021 | 2022 | ||||||||||||
Average sale prices in India (in $) | ||||||||||||||
Oil | per barrel | 59.4 | 38.67 | 68.22 | ||||||||||
Natural gas | per mscf | 5.5 | 4.22 | 9.06 | ||||||||||
The following table sets forth our average production costs by geographic area for the last three fiscal years:
For the year ended March 31, | ||||||||||||
Geography | 2020 | 2021 | 2022 | |||||||||
($ per boe) | ||||||||||||
India - Oil and gas | 22.4 | 21.7 | 35.7 | |||||||||
The cost of production for oil and gas business consists of:
| • | expenditure incurred towards the production of crude oil and natural gas including statutory levies, such as cess, royalties (except RJ block) and production payments payable pursuant to the PSCs as well as operational expenditures such as costs relating to manpower, repairs and maintenance of facilities, power generation and fuel for such facilities, water injection, insurance, storage, transportation and freight of crude oil and natural gas, among others. The total production cost is divided by the net interest quantity of oil and gas produced to determine the cost of production per barrel of oil equivalent See “ Item 5. Operating and Financial Review and Prospects – Factors Affecting Results of Operations—Royalty and cess payments” |
87
| Ø | Drilling and other exploratory and development activities |
The following table sets forth the number of net productive and dry exploratory and development wells drilled for the last three fiscal years. For more information about our”.
on-going
exploration and production activities, see “Information on the Company — Business Overview — Our Business — Our Oil and Gas Business — Principal Facilities
Productive and Dry Exploratory and Development Wells | 2020 | 2021 | 2022 | |||||||||
(Number of wells) | ||||||||||||
Net productive exploratory wells drilled: | ||||||||||||
India | 4.9 | 1.7 | 5.0 | |||||||||
Total productive exploratory wells drilled | 4.9 | 1.7 | 5.0 | |||||||||
Net dry exploratory wells drilled: | ||||||||||||
India | — | — | 5.4 | |||||||||
Total dry exploratory wells drilled | — | — | 5.4 | |||||||||
Total number of net exploratory wells drilled | 4.9 | 1.7 | 10.4 | |||||||||
Net productive development wells drilled: | ||||||||||||
India | 68.4 | 13.5 | 21.4 | |||||||||
Total productive development wells drilled | 68.4 | 13.5 | 21.4 | |||||||||
Net dry development wells drilled: | ||||||||||||
India | — | — | 1.8 | |||||||||
Total dry development wells drilled | — | — | 1.8 | |||||||||
Total number of net development wells drilled | 68.4 | 13.5 | 23.2 | |||||||||
| Ø | Present activities |
The following table summarizes the number of wells in the process of being drilled as of March 31, 2022.
Gross | Net | |||||||
(Number of wells) | ||||||||
Number of wells being drilled | ||||||||
India | 11 | 7.4 | ||||||
Total wells drilling | 11 | 7.4 | ||||||
| Ø | Oil and gas properties, wells, operations and acreage |
Cairn’s blocks containing proved reserves have leases which currently expire in May 14, 2030 for RJ block, October 27, 2029 for Ravva block, June 29, 2023 for Cambay block, September 24, 2031 for
KG-ONN
block, and April 24, 2034 forAA-ONHP-2018/01.
Estimates of proved reserves disclosed as of March 31, 2022, and all preceding periods for each block represent only those quantities that were estimated to be recoverable prior to the expiration date of the respective PSC. No reserves were estimated or included for quantities that may be recoverable after the expiration date of the PSCs.The following tables show the number of gross and net productive oil and natural gas wells and total gross and net developed and undeveloped oil and natural gas acreage in which Cairn had interests as of March 31, 2022.
| Ø | Gross and Net Productive Wells and Gross and Net Developed and Undeveloped Acreage |
As of March 31, 2022 | ||||||||||||||||
Oil | Natural gas | |||||||||||||||
Gross | Net | Gross | Net | |||||||||||||
(Number of wells) | ||||||||||||||||
Gross and net productive wells (1) | ||||||||||||||||
India | 589 | 391.3 | 98 | 64.6 | ||||||||||||
Total gross and net productive wells | 589 | 391.3 | 98 | 64.6 | ||||||||||||
As of March 31, 2022 | ||||||||
Gross | Net | |||||||
(acres) | ||||||||
Gross and net acreage (2) | ||||||||
Developed acreage | ||||||||
India | 57,298 | 32,186 | ||||||
Total developed acreage | 57,298 | 32,186 | ||||||
Undeveloped acreage (3) | ||||||||
India | 15,929,733 | 15,594,190 | ||||||
Total undeveloped acreage | 15,929,733 | 15,594,190 | ||||||
Notes:
| (1) | A gross well or acre is a well or acre in which a working interest is owned, while a net well or acre is deemed to exist when the sum of fractional ownership working interests in gross wells or acres equals one. |
| (2) | Developed acreage is acreage assignable to productive wells; productive wells include producing wells and wells mechanically capable of producing. |
| (3) | Undeveloped acreage encompasses those leased acres on which wells have not been drilled or completed to a point that would permit the production of economic quantities of oil or gas regardless of whether such acreage contains proved reserves. Users of this information should not confuse undeveloped acreage with undrilled acreage held by production under the terms of the lease. Cairn’s lease holdings comprise earlier five blocks and new 53 blocks acquired under OALP and DSF-2 round in India. |
88
| Ø | Delivery Commitments |
(i) | Crude Oil |
Vedanta Limited - oil and gas business sells crude oil from its various operating fields under production under a variety of contractual obligations. Prior to start of every fiscal year under the various PSCs between Vedanta Limited - oil and gas business and GoI, GoI nominates volumes that would be
up-lifted
by its nominee refinery based upon the expected production from the field during the year. Vedanta Limited - oil and gas business is free totie-up
with other domestic refineries (including private refineries) for the surplus available volume that is not nominated by GoI.For fiscal year 2022, GoI has nominated approximately 92 kbpd of RJ block and 20 kbpd of Ravva and Cambay block. Vedanta Limited - oil and gas business has reasonable endeavor crude oil sales agreements and there is no minimum committed quantity, thus, resulting in no financial implication.
(ii) | Natural Gas |
The delivery commitments for Vedanta Limited - oil and gas business’s share of gas sales from RJ block (participating interest) for the month of May 2022 is approximately 77.1 mmscf per day which is based on estimated gas production from the fields.
For Cambay block, Vedanta Limited - oil and gas business’s share of gas sales commitment (participating interest) for the month of May 2022 is approximately 1.41 mmscf per day. This delivery commitment changes on a monthly basis based on estimated gas production from the fields. For Ravva block, there is no annual commitment for gas sales for fiscal year 2022.
Vedanta Limited - oil and gas business believes its domestic proved reserves will be sufficient to deliver the above-mentioned contracted volumes.
Distribution, Logistics and Transport
Rajasthan |
The Mangala processing terminal has been designed as a centralized hub facility to handle crude oil production from the fields in the RJ block that have been discovered by Cairn. Once crude oil reaches the Mangala processing terminal, generally via the pipeline, it is processed and transported to public-sector customers or private refineries that have purchased it. See “” for more details.
Facilities—Mangala Processing Terminal
Cambay |
The
82-acre
onshore processing facility at Suvali processes natural gas and crude oil from the Lakshmi and Gauri fields. It has a capacity to process 150 mmscfd of natural gas and 16 kbopd of crude oil and includes a three-stage separator oil processing train, four storage tanks with combined capacity of 40,000 bbls as well as 4.8 MW captive power generation capacity. The processing plant and offshore infrastructure are certified to ISO 14001 and ISO 45001 standards.The crude oil produced from Suvali Onshore Terminal is transported via truck tankers approximately 15 km to Adani Hazira Port Private Limited. Thereafter, the crude cargo is sold to coastal refineries via sea tankers.
The processed natural gas is sold through the Gujarat State Petronet Limited pipeline facility to Gujarat Gas Limited.
Ravva |
Currently, there are eight unmanned offshore platforms and a
225-acre
onshore processing facility at Surasaniyanam for processing the natural gas and crude oil produced from the offshore field. The Ravva onshore terminal operates as per the internationally recognized environmental standard (ISO 14001) and the occupational health and safety standard (OHSAS18001). The onshore processing facility has the capacity to handle 90 kbopd of crude oil, 110,000 bbls of water injection per day and natural gas compression capacity of around 60 mmscfd of natural gas. The terminal also has the capacity to store 1.0 mmbbls of crude oil.The crude oil produced from the wells in the Ravva block is sent to the onshore processing terminal via subsea pipelines. The crude oil is processed and stored in the storage tanks at the terminal. Thereafter, the crude oil is transported to local refineries (nominated by GoI) via a
20-inch
export pipeline (approximately 16 km long) from the terminal to a ship tanker, which is moored to the single point mooring buoy located in the field. The single point mooring buoy and associated equipment are together termed as tanker mooring and loading facility.Natural gas from the wells after treatment is transported to buyer’s (GAIL) pipeline.
89
Market | share and Competition |
The oil and gas exploration and production industry in India has tremendous potential for investment. Acreages to explore and exploit hydrocarbon resources are offered under an open acreage licensing system by the MoPNG under the Hydrocarbon Exploration and Licensing Policy. The GoI has launched special bid rounds for small discoveries, thereby further enhancing competition to acquire acreage.
Vedanta Limited- oil and gas business, faces competition from Indian companies, including Indian National Oil Companies- ONGC and Oil India Limited (“OIL”) as well as private players like Reliance Industries Limited. The GoI has a major stake in ONGC and OIL. ONGC has been awarded the majority of the exploration blocks in the nine NELP licensing rounds and has also acquired 24 blocks under the five OALP auctions that have been held to date. OIL has won 25 blocks under the five OALP bid rounds.
Many of these competitors have access to financial or other resources substantially in excess of those available to Vedanta Limited- oil and gas business and accordingly may be better positioned to acquire and exploit prospects, hire personnel and market production. In addition, many of Vedanta Limited’s competitors may be better able to withstand the effect of external changes in industry conditions such as worldwide crude oil and natural gas prices and levels of supply and the application of government regulations, which affect Vedanta Limited’s business, and which are beyond Vedanta Limited’s control.
Vedanta Limited – oil and gas business are a significant contributor to India’s domestic crude oil production, operating approximately 25% as derived from the provisional data published by Petroleum Planning and Analysis Cell of MoPNG statistics as of March 31, 2022.
| Ø | Seasonality |
Our oil and gas business are not subject to seasonality as demand for oil and gas is consistent throughout the year.
Our Iron Ore Business
Overview
Our iron ore business is carried out in the states of Goa and Karnataka. Our iron ore business includes exploration, mining and processing of iron ore. In fiscal year 2022, we produced approximately 5.40 million dmt of saleable iron ore fines and lumps. The sales for fiscal year 2022 were at 6.8 million dmt as compared to sales of 6.5 million dmt in fiscal year 2021.
We currently operate a metallurgical coke plant and a pig iron plant with an installed capacity of 522,000 TPA and 832,000 TPA respectively in Goa and Maharashtra. The second metallurgical coke plant with an installed capacity of 120,000 TPA was acquired in first half of fiscal year 2020, at Sindudhurg, Maharashtra, which became operational on September 9, 2019.
On August 26, 2011, the Hon’ble Supreme Court passed an order suspending mining activities in the Chitradurga and Tumkur districts of Karnataka. In view of this order, our activities at this mine were stopped with immediate effect. On April 18, 2013, this suspension was lifted by the Court and in December 2013, the operations were resumed after getting necessary regulatory clearances. Although we resumed operations in Karnataka based on the stage I forest clearance from the state government of Karnataka and a temporary working permission from the MoEF&CC, the temporary working permission expired on July 31, 2014. Karnataka operations were halted for the period from August 1, 2014, to February 27, 2015. We resumed our operations in Karnataka after all statutory clearances were in place from February 28, 2015.
On August 22, 2011, we acquired a 51.0% ownership interest in WCL, a Liberian iron ore exploration company which was a wholly owned subsidiary of Elenilto Minerals & Mining LLC, for a cash consideration of $ 90 million. On December 20, 2012, we acquired the remaining 49.0% of the outstanding common shares of WCL from Elenilto Minerals & Mining LLC for a cash consideration of $ 34 million.
In October 2015, we proposed to the state government of Jharkhand to set up a 1 mtpa pig iron plant in Jharkhand, for Dhobil mining lease. On May 6, 2016,
Stage-I
MoU was signed between the state government of Jharkhand and Vedanta Limited to set up a 1 mtpa hot metal plant. Further on November 1, 2017, Stage II MoU was signed. The exploration drilling in our lease area commenced in May 2017 and report was submitted to the state government of Jharkhand in October 2017. The exploration report was examined by a technical committee comprising experts from Geological Survey of India, IBM and state geology and mining departments. In March 2018, the technical committee approved report for the purposes of issuing a letter of intent to Vedanta Limited for the grant of a mining lease for the Dhobil iron ore mine. In December 2018, State Govt recommended our case to Ministry of Mines, Government of India, seeking prior approval for grant of mining lease to Vedanta Limited. Ministry of Mines raised query on State Government proposal. In March 2021, we moved to the High Court of Jharkhand for an early decision on issuance of Letter of Intent for mining lease. Court had passed direction to State Government of Jharkhand to take decision in 4 weeks, however no reply was submitted by the State Government of Jharkhand and the matter is pending in High Court of Jharkhand. On March 28, 2021, GoI has enacted amendments in MMDR Act 1957, in which one of the amendments is deletion of Section 10A2(b) of the Act under which our right to get Dhobil lease was saved. Further, an opinion has been obtained on the point that in the case the mining lease is not being given to us, whether in that case we are entitled for reimbursement of investments made by us and as per opinion Section 10A(2) (b) (inserted by the Mines and Minerals (Development and Regulation) Amendment Act, 2021 (“MMDR Amendment Act, 2021”) which specifically provides that the holder of a prospecting license whose right to obtain a mining lease had lapsed on March 28, 2021, shall be reimbursed the expenditure incurred towards reconnaissance or prospecting operations, however this is subject to the rules to be framed under Section 13 (2) (u) of the MMDR Act by the Central Government, which is yet to be notified.90
Principal Products
Iron ore
Our iron ore reserves consist of both lump and fine ore. As of March 31, 2022, the percentage of lump ore in the reserves was approximately 20.0% in Karnataka. The mine in Karnataka consists of average 45.3% grade deposits. We sell lump ore from our mines in Karnataka primarily to domestic pig iron or steel producers. The majority of other iron ore produced by Goa mines was sold to purchasers in China, but during the fiscal year 2022, no iron ore were mined from Goa mine pursuant to the Hon’ble Supreme Court’s order.
Pig iron
We produce basic, foundry and nodular grade pig iron in various sub grades for steel mills and foundries.
Metallurgical coke
We also produce metallurgical coke, which is primarily used for captive consumption for producing pig iron in India.
Desai Cements
We produce Granulated Blast Furnace Slag, Portland Slag Cement and Ordinary Slag Cement in various grades for RMC Manufacturers and Construction Companies
Nickel Business
Vedanta Limited’s nickel business processes nickel/cobalt bearing raw material and plans to produce nickel sulphate (battery grade) & cobalt sulphate in phase I and nickel metal in phase II of the operations.
Principal Facilities
The following map shows details of the locations of our iron ore business in India and around the world.
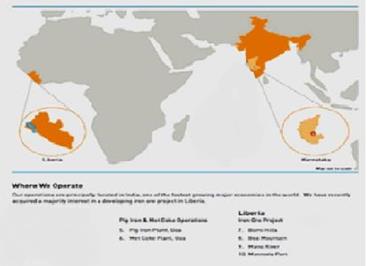
Mine in Karnataka - A. Narrain (ML No 2677)
Our main operation in Karnataka is at the A. Narrain mine Meghalahalli, Chitradurga, ML 2677, which is located approximately 200 kms northwest of Bangalore. The open pit mine is operated by us and is well connected by rail, with the nearest stations, Sasalu and Amruthapura, and M/s Mineral Enterprises served by Chikkajajur (MMEC) railway siding located 16 kms, 17 kms and 4 kms respectively, from the mine. The nearest port at Mangalore is approximately 430 kms from the mine and the nearest airport is located at Bangalore, approximately 230 kms from the mine.
The leasehold area of the mine is 160.59 hectares, which is classified into two blocks, namely the south block, which is 123.03 hectares, and the north block, which is 37.56 hectares. These two blocks are joined by a narrow stretch of land approximately 40 meters in width and 660 meters in length along the eastern side of the leasehold area. We have operated the mine since 1994
91
The MoEF&CC granted us the environmental clearance for production of 6.0 mmtpa in fiscal year 2009 but due to conditions introduced by the Hon’ble Supreme Court, the production capacity of the mine was reduced to 2.29 mmtpa. However, in April 2018, the Central Empowered Committee enhanced the production capacity of the mine to 4.51 mmtpa. Our application to further enhance production capacity was favorably considered by Central Empowered Committee (Hon’ble Supreme Court appointed body), on March 4, 2020 and the annual mining capacity has been increased upto 5.89 MTPA. The State Government of Karnataka has allocated the production quantity of 4.82 MTPA from FY 2020 onwards. In FY 2021, the state government of Karnataka increased the production quantity of to 5.58 MTPA effective from FY 2021 onwards.
The geological formation of this region belongs to the Archean-Proterozoic age. The geology of the mine consists of Archean formations locally termed “Dharwars” which contain rich and large iron ore deposits. The leasehold area forms part of the Chitradurga-Tumkur schist belt and part of a regional isoclinal fold. The strike direction of the ore body dips westerly at an angle of about 60 degrees to 70 degrees. Hematite is the principal ore mineral and limonite; goethite and magnetite constitute the associated minor minerals of the mine. The mineralized horizon extends over a length of about two kms. The footwall comprised decomposed quartzite and phyllite, and the stratigraphy is crosscut by late dolerite dykes and sills which are manifested by pink clayey zones in the mine area.
Currently, the north and the south block of the mine have mechanized mining operations. The
open-pit
mines have a bench height of seven meters, haulage roads of 12 meters to 15 meters in width and an overall pit slope of less than 26 degrees. The mine is equipped with dry process facilities for processing all grades of ore.The lateritic overburden is removed either by blasting or ripping/dozing, loaded onto and transported by 30 ton trucks. The ore mined is processed at the mine’s processing facilities, which involves crushing and dry screening processes. The processed ore is then transported by road to the railway yard, for onward transport to customers in Karnataka, Goa and other places. Ore produced in Karnataka ranges from 56.0% to 62.0% iron content and comprises 80.0% fines and 20.0% lumps.
Since the mine was taken over by us, exploration at the mine involved the drilling of a total of 73,951 meters in 660 boreholes as of March 31, 2020. No exploration took place since FY 2021. The deposit is extensively sampled in vertical and inclined drill hole grid intervals inside direction of 50 meters and in cross section average of 25 meters with most of the holes covering a depth of 50 meters to 200 meters. Power at the mine is supplied by a 725 KV and 320 KV generator. All power supplied to the mine and plant is through generators.
The net value of fixed assets, including capitalwas 7,280.22 million ($ 95.96 million) as of March 31, 2022
works-in-progress,
₹
During the FY 2020, a parcel of land relating to the iron ore business having carrying value of 1,211 million ($ 16 million) was reclassified from Land and Building to other financial asset due to an ongoing legal dispute relating to title of the land. During the previous year, the financial asset was fully impaired.
₹
The economic
cut-off
grade at the mine is determined by the requirement to meet various sales contracts and the need to maintain stockpiles to meet the contract specifications.The reserves in proved reserve category at the Karnataka mines are estimated based on drilled boreholes spaced at 50 meters along predefined section lines and occasionally off of the section lines, the probable reserves are estimated based on drilled boreholes spaced at 50 meters from the proved reserves and the possible reserves are estimated based on drilled boreholes spaced at 25 meters from the probable reserves. As the area is drilled at approximately 50 meter by 50 meter grids, the physical continuity of the ore is well demonstrated.
Mine in Liberia - WCL
WCL comprises three concession areas (Bomi Hills, Bea Mountain and Mano River). In view of the Ebola epidemic, exploration in Liberia has been suspended in fiscal year 2015.
The table below sets out proved and probable iron ore reserves as of March 31, 2022, at mines that we own or have rights to:
Proved Reserves | Probable Reserves | Total Proved and Probable Reserves | ||||||||||||||||||||||
Mine | Quantity | Iron Grade | Quantity | Iron Grade | Quantity | Iron Grade | ||||||||||||||||||
(Million tons) | (%) | (Million tons) | (%) | (Million tons) | (%) | |||||||||||||||||||
A. Narrain | 11.44 | 55.5 | 59.97 | 43.4 | 71.41 | 45.3 | ||||||||||||||||||
Total iron ore reserves | 11.44 | 55.5 | 59.97 | 43.4 | 71.41 | 45.3 | ||||||||||||||||||
92
Additional Information
| 1. | The reserve estimates have been prepared by the Geologists and Mining Engineers at Vedanta Limited and SRK Consulting (UK) Limited reviewed in accordance with JORC code. The estimates were independently audited by SRK in 2022. |
| 2. | Ore reserves are estimated at a variable cut-off grade based on ore type; the minimumcut-off grade was 30.0% Fe for Siliceous Ore and 45.0% Fe for normal ore. |
| 3. | The ore bodies are of relatively significant size with good continuity of the mineralized zones and little internal dilution, the contacts are well constrained, free digging and diluting material can also carry grade, a mining recovery of 98.0%; a mining dilution of 2.0%; is considered. |
During the year ended March 31, 2016, the Group recognized an impairment charge in respect of the exploratory assets in West Africa (Western Cluster, Liberia) on account of low iron ore prices,
geo-political
factors, and also due to the fact that there are no plans for any substantive expenditure given the continued uncertainty in the project. Therefore, the Company did not receive any certification of reserves and resources for the current period.Subsequent to the Balance Sheet date, WCL has signed a Memorandum of Undertaking with Government of Liberia to start its Iron ore mining operations in Liberia, which could not be started earlier due to the outbreak of Ebola epidemic in 2014. Activities to begin the operations are commenced in June 2022.
Amona plant
We commenced operations at the Amona plant in Goa in 1992 and have been engaged in the manufacture and sale of pig iron since then. Our metallurgical coke plant at Amona produces a range of coke fractions from over 70 mm for foundries, 20 mms to 70 mms for blast furnaces and 6 mms to 20 mms for the ferrous alloy industry. Approximately 80.0% to 90.0% of the total production of metallurgical coke is consumed by us for our pig iron production and the remainder is sold to customers primarily located in India. The cost of the input coal blend is the single most important cost component for the production of coke. Our production consists primarily of low ash coking coal and we import 100.0% of low ash coking coal each year. In order to ensure a stable raw material supply, we have long-term supply contracts for the procurement of such coal. Electric power for us is supplied by our power unit which generates power from the waste heat of our metallurgical coke plant and the blast furnace gas from us.
Vazare Plant
On July 28, 2019, Vedanta Limited acquired Sindhudurg plant of Global Coke Limited which was under liquidation as per the IBC for a cash consideration of 335 million ($ 4 million) The assets acquired mainly included land, building and plant and machinery of similar value as the cash consideration. The acquisition complements backward integration opportunity for Company’s existing pig iron division and also increase the Company’s footprint in met coke market in southwestern part of India.
₹
GNRE Plant
On May 20, 2021, the Company acquired Assets of Bhachau and Khambalia coke manufacturing units of Gujarat NRE Coke Limited under the provisions of Insolvency and Bankruptcy Code 2016 (including all amendments for the time being in force) for a cash consideration of 1,659.9 million ($21.88 million) The acquisition will complement our existing iron ore business via backward integration through provision of the Met Coke requirement to our existing facilities and also increase Company’s footprint in met coke market in western part of India.
₹
The following table sets out the total rated capacities as of March 31, 2022 at our Amona and Vazare facility:
Particulars | Rated capacity | |||||||||||
Metallurgical Coke | Pig Iron | Power | ||||||||||
(tpa) | (tpa) | (MW) | ||||||||||
Amona Plant | 522,000 | 832,000 | 60 | |||||||||
Vazare Plant | 120,000 | — | — | |||||||||
Production
The table below sets out our total production of saleable ore for fiscal years ended on March 31, 2020, 2021 and 2022:
Mine/Mine Type | Year Ended March 31 | |||||||||||||
Product | 2020 | 2021 | 2022 | |||||||||||
(Millions Dry Metric tons) | ||||||||||||||
Goa (open-pit) | Iron ore | — | — | — | ||||||||||
Sesa Resources Limited (open-pit) | Iron ore | — | — | — | ||||||||||
A. Narrain (open-pit) | Iron ore | 4.36 | 5.02 | 5.40 | ||||||||||
Total iron Ore | Iron ore | 4.36 | 5.02 | 5.40 | ||||||||||
Amona Plant | Metallurgical coke | 0.43 | 0.45 | 0.48 | ||||||||||
| Pig iron | 0.68 | 0.60 | 0.79 | |||||||||||
Vazare Plant | Metallurgical coke | 0.04 | 0.04 | 0.10 | ||||||||||
93
Principal Raw Materials
| o | Iron ore operations |
There are no direct raw materials used in our iron ore mining and processing operations. Indirect raw materials include power, fuel and lubricants. We procure these indirect materials from various vendors. The electricity required for our operations is supplied by the government grid and supplemented by our owned and hired diesel generator sets. The prices of fuel and necessary lubricants are volatile, and the price of power is dependent on tariffs imposed by state governments.
| o | Pig iron operations |
The principal raw materials for the manufacture of pig iron are iron ore, metallurgical coke, limestone and dolomite. Iron ore is largely sourced from mines in Karnataka and Goa. The iron ore is transported from Karnataka by truck and railway rakes and from Goa by truck barges. Iron ore requirements are met through supplies from our own mines, and through purchases from other mines in Karnataka and Goa. Our metallurgical coke requirements are met by supplies from our metallurgical coke division. Limestone and dolomite are purchased from mines in Karnataka and transported to us by trucks.
| o | Metallurgical coke |
The principal raw materials for the manufacture of metallurgical coke are hard and semi-hard coking coals. These raw materials are imported from various international suppliers primarily from Australia.
Power
Electricity for our metallurgical coke and pig iron manufacturing operations is supplied by captive power plant, which generates power from the waste gases of our metallurgical coke plant and the blast furnace.
Distribution, Logistics and Transport
Sales from our Karnataka mines to Indian domestic customers take place on an
ex-mine
basis, and the transportation is handled by the customer.Sales and Marketing
In view of regulatory restrictions, our entire iron ore from Karnataka has to be sold domestically.
Pig iron -
ex-works
basis, with material being sent on afreight-to-pay
Metallurgical coke
The sale of metallurgical coke to the other customers is done on a spot basis with delivery schedule over the month.
We have a marketing office in Goa to sell our pig iron and metallurgical coke products. Our sales and chartering needs are managed from the office at Goa.
Our ten largest customers accounted for approximately 45.28%, 56.64% and 55.92% of revenue for iron ore business in fiscal years, 2020, 2021 and 2022 respectively. One of the customer accounted for more than 10.0% of our revenue in fiscal year 2020, two customers accounted for more than 10% of our revenue in fiscal year 2021 and two of the customer accounted for more than 10.0% of our revenue in fiscal year 2022.
Market Share and Competition
The total sales of iron ore for fiscal year 2022 was 6.84 million dmt. Domestic sales of iron ore for fiscal year 2022 was 5.87 million dmt, and total exports for fiscal year 2022 was 0.97 million dmt. Out of the total sales in fiscal year 2022, 83.45% was from Karnataka mines and the remaining 16.55% was from Goa.
94
Our primary competitors in both the public and private sectors in India include National Mineral Development Corporation, Rungta Mines Limited, Mineral Sales Private Limited and Essel Mining and Industries Limited. In addition, our international competitors include Fortescue Metal Group, Sierra Leone, Vale, BHP Billiton Limited and Rio Tinto.
Seasonality
Our iron ore mining operations in Karnataka are not substantially affected by seasonality.
Our Copper Business
Overview
Our copper business is principally of custom smelting and includes a smelter, a refinery, a phosphoric acid plant, a sulphuric acid plant, a copper rod plant and three captive power plants at Tuticorin in southern India, a refinery and a copper rod plant and three blister/secondary material processing plant at Silvassa in western India, a precious metal refinery, a doré anode plant and a copper rod plant at Fujairah in the UAE. In addition, we own the Mt. Lyell copper mine in Tasmania, Australia.
The Government of Tamil Nadu has issued orders dated May 28, 2018 with a direction to permanently seal the existing copper smelter plant unit at Tuticorin. Separately, SIPCOT vide its letter dated May 29, 2018, cancelled 342.22 acres of the land allotted to us for the proposed expansion project, which has been stayed by High court of Madras. Further the TNPCB issued orders on June 7, 2018 directing the withdrawal of the Consent to Establish, which was valid till March 31, 2023. The Company has filed appeal before the Appellate Tribunal of the TNPCB challenging the withdrawal of the said Consent to Establish. The Company had filed writ petitions before Madras High Court challenging the various orders passed against the company in 2018 and the hearing was concluded on January 8, 2020. On August 18, 2020, the Madras High Court delivered the judgement wherein it dismissed the Writ Petitions filed by the Company. The Company has approached the Hon’ble Supreme Court and challenged the said High Court of Madras order by way of a SLP to Appeal and also filed an interim relief for care and maintenance of the plant. The matter was then listed on December 2, 2020 before Hon’ble Supreme Court Bench. The Bench after having heard both the sides concluded that at this stage the interim relief in terms of trial run could not be allowed. The matter was listed for hearing on August 17, 2021. However, the matter was not taken up on August 17, 2021. The matter was listed and taken up for hearing on March 15, 2022, and was part heard. The matter was to be further heard on March 22, 2022, however due to reconstitution of the bench the matter was not listed. The Hon’ble Supreme Court has, on May 20, 2022, ordered for the interlocutory application that was filed by Vedanta Limited before the Hon’ble Supreme Court for the maintenance of status quo as on March 15, 2022, consequent to an order passed by the Collector of Tuticorin requiring Vedanta Limites employees to vacate the plant premises to be listed for hearing along with the main matter on the next date of listing. See “” for further details.
Item 8 - Financial Information - A. Consolidated Statements and Other Financial Information - Legal Proceedings.
On June 17, 2022, Board of Directors of the Company has approved evaluation of various options to potentially monetize, in part or full, its Sterlite Copper plant at Tuticorin alongside the associated facilities. Accordingly, an Expression of Interest in this regard has been released on June 20, 2022. However, these evaluations are only exploratory in nature and no firm commitments have been executed at this stage.
Principal Products
| – | Copper Cathode |
Our copper cathodes are square shaped with purity levels of 99.9% copper. These cathodes meet international quality standards and are registered as LME “A” grade. The major uses of copper cathodes are in the manufacture of copper rods for the wire and cable industry and copper tubes for consumer durable goods. Copper cathodes are also used for making alloys like brass, bronze and alloy steel, with applications in transportation, electrical appliances and machines, defense and construction.
| – | Copper Rods |
Our copper continuous cast rods meet all the requirements of international quality standards including the ASTM B 49: 2010 or the BS EN 1977:1998 standards. Our copper rods are currently used primarily for power and communication cables, transformers and magnet wires.
| – | Sulphuric Acid |
We produce sulphuric acid at our sulphuric acid plant through conversion of sulphur dioxide gas that is generated from the copper smelter. A significant amount of the sulphuric acid produced at the Tuticorin smelter is consumed by our phosphoric acid plant in the production of phosphoric acid, and the remainder is sold to fertilizer manufacturers and other industries.
95
| – | Phosphoric Acid |
We produce phosphoric acid at our phosphoric acid plant by chemical reaction of sulphuric acid and rock phosphate, which we import. Phosphoric acid is sold to fertilizer manufacturers and other industries.
| – | Anode Slime |
We produce anode slimes from the copper refining process that contain gold and silver which we currently sell primarily to Fujairah and balance to third parties. We sell the anode slimes to Fujairah Gold FZC as the doré anode plant has been shifted to our precious metal refinery at Fujairah.
| – | Other By-products |
Gypsum and slag are
by-products
of our copper smelting operations which we sell to third parties.Supply of Copper Concentrate
As a custom smelter, we source a significant majority of our copper concentrate from third party suppliers at the LME price less a TcRc. The smelter at Tuticorin has been closed during the fiscal year 2019, therefore copper anodes and blister has been procured from external sources for production of copper cathode in Silvassa Refinery.
Delivery to Customers
The copper cathodes, copper rods, sulphuric acid, phosphoric acid and other
by-products
such as gypsum are shipped for export or transported by road to customers in India.Principal Facilities
1. | Our Copper Mine |
Mt. Lyell Mine - Tasmania
The following map shows the location of the Mt. Lyell mine in Tasmania:
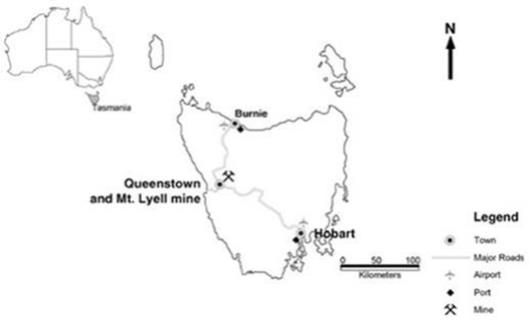
The Mt. Lyell mine is located at Queenstown, Australia. It comprises of an underground copper mine and a copper processing facility and is owned and operated by CMT. The Mt. Lyell mine is owned and operated under the terms and conditions as stipulated in mining leases 9M/2013 (previously 1M95) and 10M/2013 (previously 5M95) granted by the state government of Tasmania. Mining lease 9M/2013 was granted on January 1, 1995 for a period of 15 years and the mining lease 10M/2013 was granted on February 1, 1995 for a period of 14 years and 11 months. Both leases have been renewed for a period of 18 years and are valid up to December 30, 2027. The mine is also covered by the Copper Mines of Tasmania (Agreement) Act 1999, which, in conjunction with an agreement between the state government of Tasmania and CMT entered into pursuant to that Act, limits CMT’s environmental liabilities to the impact of current operations, thereby insulating CMT from any historical legacy claims. The operation of Mt Lyell mine was suspended in January 2014, following a mudslide incident.
96
Monte Cello acquired CMT in 1999 from Mt. Lyell Mining Company Limited when Mt. Lyell Mining Company Limited entered into voluntary administration due to hedging difficulties. We acquired Monte Cello and CMT, from Twin Star’s subsidiary in 2000.
The principal deposits in the Mt. Lyell region are all of the volcanic disseminated pyrite-chalcopyrite type, which accounts for 86.0% of the known ore in the region. The geology of the Mt. Lyell mine consists of a series of intercalated felsic to mafic-intermediate volcanics. Lithologies are highly altered quartz-sericite-chlorite volcanics with individual units delineated largely by the relative abundance of phyllosilicates. Volcaniclastic and rhyolitic lithologies occur sporadically throughout the sequence, as does pervasive iron mineralization in the form of haematite, magnetite and siderite.
Chalcopyrite is the principal ore mineral and occurs chiefly in higher grade lenses enveloped by lower grade halos. The overall structure of Mt. Lyell is that of a steeply dipping overturned limb of a large anticline. The hanging wall (stratigraphic footwall) of the ore body consists of weakly mineralized chloritic schists with disseminated pyrite. The footwall is sharply defined by the Great Lyell Fault—Owen Conglomerate contact which truncates the ore body at its southern end.
The Mt. Lyell mine is under care and maintenance following a rock falling on the ventilation shaft in June 2014. The western tharsis deposit lies to the west of the Prince Lyell ore body. Additional targets include Tasman and Crown, Glen Lyell, Copper Clays and NW Geophysics. The tailings dam is a valley-fill type and excess water is discharged via a spillway. The water quality is sampled before the water is released from the site. The tailings dam was raised as CMT’s accepted closure plan is to flood the tailings.
The processing plant is approximately 32 years old and has been partially refurbished following CMT’s acquisition with the addition of crushers, a float cell and a regrind mill at the surface. The condition of the process plant is ageing but is well maintained to ensure it remains in safe and efficient condition.
Power at the mine is supplied through an electricity supply agreement with TasNetworks Proprietary Limited and Hydro Tasmania Proprietary Limited.
The net value of fixed assets, including capitalwas approximately AUD 9.7 million ($7.27 million) and AUD 12.1 million ($ 9 million) as of March 31, 2022 and as at March 31, 2021 respectively.
work-in-progress
At the time of finalization of reserve statement as on March 31, 2022, no mineral reserves have been determined due to government statutory restrictions imposed post the mud slide incident in January 2014.
2. | Our Smelter and Refineries |
Overview
(i) | Tuticorin |
Our Tuticorin facility, established in 1997, is located in Tamil Nadu in southern India. Our Tuticorin facility currently consists of a 400,000 tpa copper smelter, a 246,000 tpa copper refinery, a 96,000 tpa copper rod plant, a 1,300,000 tpa sulphuric acid plant, a 230,000 tpa phosphoric acid plant and three captive power plants with capacities of 7.5 MW, 24.0 MW and 160.0 MW. The coal-based power plant of 160 MW is primarily used for captive consumption
Tuticorin facility will meet most of the facility’s power requirements once the proposed expansion to 800,000 tpa is complete.
The smelter at the Tuticorin facility utilizes IsaSmelt
TM
furnace technology. The refinery uses IsaProcessTM
technology to produce copper cathode and the copper rod plant uses Properzi Continuously Cast and Rolled, copper rod technology from Continuus-Properzi spa., Italy, to produce copper rods.On March 29, 2013, the TNPCB ordered the closure of the copper smelter at Tuticorin due to complaints about a noxious gas leak by local residents. On April 1, 2013, Vedanta Limited (then Sterlite Industries India Limited) filed an application in the NGT challenging the order of the TNPCB on the basis that the plant’s emissions were within permissible limits. NGT ordered in favour of Vedanta Limited on August 8, 2013, clearing all allegations raised against Vedanta Limited with respect to gas leak incident. However, the TNPCB filed a civil appeal in 2013 against the order of NGT.
TNPCB granted renewal of the CTO to the existing copper smelter which was valid till March 31, 2018. The application for renewal of CTO from April 1, 2018, for existing copper smelter, required as per procedure established by law, was rejected by TNPCB vide rejection order dated April 9, 2018. The Company then filed an appeal before the TNPCB Appellate Authority challenging the rejection order. During the pendency of the appeal, TNPCB vide its order dated May 23, 2018, ordered closure of existing copper smelter plant and disconnection of power supply with immediate effect. Further, the Government of Tamil Nadu, issued orders dated May 28, 2018, with a direction to seal the existing copper smelter plant permanently. Consequently, TNPCB issued another notice dated May 28, 2018, directing sealing and closure of the unit. The Company believes these actions by the authorities were not taken in accordance with the procedure prescribed under applicable laws.
97
Subsequently, the Directorate of Industrial Safety and Health passed orders dated May 30, 2018, directing the immediate suspension and revocation of the Factory License and the Registration Certificate for the existing smelter plant.
Then the Company had appealed before the NGT, Principal Bench. Hearing the appeal, the NGT has referred the matter to an Independent Committee presided by retired Chief Justice of the Meghalaya High Court along with one expert member each from MoEF&CC and Central Pollution Control Board (CPCB) which heard all the affected parties including Company and through the reports produced on the issue of environmental compliance as well as the impact on inhabitants as perceived or actual. The Independent Committee visited the plant in September 2018 and heard TNPCB as well as Vedanta Limited’s defence on the violations pointed out by TNPCB for rejection of CTO renewal application and heard interveners supporting and opposing reopening of Sterlite Copper and State authorities and TNPCB.
The NGT through an order dated December 15, 2018, has set aside the impugned orders passed by State of Tamil Nadu and TNPCB and directed TNPCB to pass fresh orders of renewal of consent and authorization to handle hazardous substances, subject to appropriate conditions for protection of environment in accordance with law within three weeks from this order date. It has also allowed to restore electricity for operations of the plant. The order is subjected to Vedanta Limited complying with certain directions as specified in the order.
Meanwhile, Madurai bench of Madras High Court ordered to maintain ‘Status quo’ till January 21, 2019, in response to a Public Interest Litigation (PIL) filed by one of the Tuticorin resident challenging the order of NGT. This Public Interest Litigation (PIL) was later withdrawn in light of appeal filed before Hon’ble Supreme Court by State of Tamil Nadu and TNPCB.
The State of Tamil Nadu and TNPCB approached Hon’ble Supreme Court in Civil Appeals on January 2, 2019, challenging the judgment of NGT dated December 15, 2018 and this appeal was clubbed with the previously filled appeal by TNPCB against the NGT order dated August 8, 2013. The Hon’ble Supreme Court heard all the parties during January and February 2019 on maintainability as well as merits. The Hon’ble Supreme Court vide its judgment dated February 18, 2019, set aside the judgments of NGT dated December 15, 2018 and August 8, 2013 solely on the basis of maintainability holding that the same were not maintainable before NGT. The Hon’ble Supreme Court did not venture into the merits of the matter. The Hon’ble Supreme Court gave the Company liberty to approach Madras High Court for filing a writ petition against the orders challenged in aforesaid appeals before NGT. The Hon’ble Supreme Court also indicated mentioning the matter before Chief Justice of Madras High Court for an expeditious hearing considering that the Company’s plant has been shut for a long period and the Company is exporting a product which is an important import substitute.
The Company then filed a writ petition before Madras High Court challenging the various orders passed against the Company in 2018 and 2013. The case was heard on March 1, 2019, wherein the Company pressed for interim relief for care and maintenance of the plant. No interim relief was granted to the company. The High Court of Madras Division Bench proceeded to hear the matter on a continuous basis, as a specially ordered case. The hearings were concluded on January 8, 2020. On August 18, 2020, the Madras High Court delivered the judgement wherein it dismissed the Writ Petitions filed by the Company. The Company approached the Hon’ble Supreme Court and challenged the said High Court of Madras order by way of a SLP to Appeal. The SLP was admitted on August 31, 2020, wherein the court had directed the parties to file their counters and rejoinders if any. Subsequent to the same, the counter affidavits and the rejoinders were filed by the parties and the matter was listed on November 16, 2020, wherein Vedanta Limited had informed the court for a need to look at a workable approach and an option to resume the plant operations (at least on a trial basis so that allegations of pollution could be checked). Pursuant to the same an IA was filed by the Company. The Matter was then listed on December 2, 2020, before Hon’ble Supreme Court Bench comprising of Justices Rohinton Nariman, Naveen Sinha and K M Joseph. The Bench after having heard both the sides concluded that at this stage the interim relief in terms of trial run could not be allowed. Further, considering the voluminous nature of documents and pleadings, the matter shall be finally heard on merits. In a subsequent development, the State and TNPCB had filed an SLP as well, but on the limited point of expunging of certain paras in the Madras High Court judgement, wherein adverse remarks were made against the state government officials and TNPCB officials. Matter was listed on January 21, 2021, wherein we had also appeared. The State TNPCB SLP has been clubbed with our main SLP matter. During hearing, judge also indicated that physical hearing would start soon. We mentioned the matter before the bench on March 18, 2021, wherein the bench posted the matter for final hearing on August 17, 2021. The matter was listed and taken up for hearing on March 15, 2022, and was part heard. The matter was to be further heard on March 22, 2022, however due to reconstitution of the bench the matter was not listed. The Hon’ble Supreme Court has, on May 20, 2022, ordered for the interlocutory application that was filed by Vedanta Limited before the Hon’ble Supreme Court for the maintenance of status quo as on March 15, 2022, consequent to an order passed by the Collector of Tuticorin requiring Vedanta Limited employees to vacate the plant premises to be listed for hearing along with the main matter on the next date of listing.
The Company filed an IA for interim access to plant for care and maintenance and also sought the running of the Oxygen plant to support the nation during the COVID crisis. Vide orders dated April 27, 2021, the Hon’ble Supreme Court allowed the operation of the Oxygen Plant on a stand-alone basis, under the supervision of a committee, till July 31, 2021.
On June 17, 2022, Board of Directors of the Company has approved evaluation of various options to potentially monetize, in part or full, its Sterlite Copper plant at Tuticorin alongside the associated facilities. Accordingly, an Expression of Interest in this regard has been released on June 20, 2022. However, these evaluations are only exploratory in nature and no firm commitments have been executed at this stage.
98
Silvassa
Our Silvassa facility, established in 1997, is located in the union territory of Dadra and Nagar Haveli in western India. Silvassa facility consists of a 133,000 MT of blister/secondary material processing plant which is developed by converting its existing two rod plants, a 216,000 tpa copper refinery plant, and a new Copper Rod Mill with an installed capacity of 258,000 tpa that was commissioned in October 2019. Its refinery uses IsaProcess
TM
technology in the production of copper cathode and its copper rod plants use Contirod technology to produce copper wire rods. Our Silvassa facility draws on the state power grid to satisfy its power requirements.Capacities
The following table sets forth the total capacities as of March 31, 2022, at our Tuticorin and Silvassa facilities:
Capacity | ||||||||||||||||||||||||
Facility | Copper Anode (1) | Copper Cathode (2) | Copper Rods (2) | Sulphuric Acid (3) | Phosphoric Acid (3) | Captive Power | ||||||||||||||||||
(tpa) | (tpa) | (tpa) | (tpa) | (tpa) | (MW) | |||||||||||||||||||
Tuticorin (4) | 400,000 | 246,000 | 96,000 | 1,300,000 | 230,000 | 191.5 | ||||||||||||||||||
Silvassa | 175,000 | 216,000 | 258,000 | (5) | — | — | — | |||||||||||||||||
Total | 575,000 | 462,000 | 354,000 | 1,300,000 | 230,000 | 191.5 | ||||||||||||||||||
| (1) | Copper anode is an intermediate product produced by copper smelters and is not sold to customers. It is used for the production of copper cathode by copper refineries. Approximately one ton of copper anode is required for the production of one ton of copper cathode. |
| (2) | Copper cathode is used as an input material for copper rods. Approximately one ton of copper cathode is required for the production of one ton of copper rods. |
| (3) | Sulphuric acid is used as a starting material for phosphoric acid. Approximately 2.8 tons of sulphuric acid are required for the production of one ton of phosphoric acid. |
| (4) | Currently the operations are suspended as detailed above. |
| (5) | Silvassa New CCR plant with a capacity of 258,000 tpa commissioned in October 2019. |
In the fiscal year 2020, with new technology intervention, the company has converted its two rod plants into blister/secondary material plant with an installed capacity of 133,000 MT of Anode production per annum. During the year, these plants have produced secondary material of 129,085 tons which further supported the refinery at Silvassa in copper cathodes.
Fujairah
Fujairah Gold FZC is located in the Fujairah Free Zone 2. Our Fujairah facility is strategically located on the coast of the Arabian Sea. The precious metal refinery was commissioned in March 2009 and began production in April 2009, with a capacity of 20 tons of gold and 105 tons of silver. Outotec Oyj, Finland, supplied the technology for the precious metal refinery. Fujairah Gold FZC commissioned a copper rod plant at a project cost of $13 million, with an annual capacity of 12.5 tons per hour with production having commenced in May 2010 and generated a production of 53,791 metric tons of rod, 42 kilograms of gold and 4,420 kilograms of silver in fiscal year 2022. Continuus Properzi spa, Italy, has supplied the rod mill equipment for this project, and the copper cathode required for the copper rod plant is being sourced from the smelters of the Vedanta Group and third parties. The doré anode plant that was shifted from Tuticorin to Fujairah was commissioned in June 2012 for smelting of “anode slime” to “doré anode” which is the raw material for the precious metal refinery.
Production Volumes
The following table sets out our total production from Tuticorin and Silvassa for fiscal years ended March 31, 2020, 2021 and 2022:
Facility | Product | Units | For the Year Ended March 31, | |||||||||||||
2020 | 2021 | 2022 | ||||||||||||||
Tuticorin (4) | Copper anode (1) | Tons | — | — | — | |||||||||||
| Sulphuric acid (2) | Tons | — | — | — | ||||||||||||
| Phosphoric acid (2) | Tons | — | — | — | ||||||||||||
| Copper cathode (3) | Tons | — | — | — | ||||||||||||
| Copper rods (3) | Tons | — | — | — | ||||||||||||
Silvassa | Copper cathode (3) | Tons | 77,487 | 101,435 | 125,104 | |||||||||||
| Copper rods (3) | Tons | 100,216 | 122,390 | 126,445 | ||||||||||||
Fujairah | Rod | Metric ton | 68,865 | 57,993 | 53791 | |||||||||||
| Gold | Kg | 33 | 35 | 42 | ||||||||||||
| Silver | Kg | 2,700 | 5,180 | 4420 | ||||||||||||
| (1) | Copper anode is an intermediate product produced by copper smelters and is not sold to customers. It is used for the production of copper cathode by copper refineries. Approximately one ton of copper anode is required for the production of one ton of copper cathode. |
| (2) | Sulphuric acid is used as a starting material for phosphoric acid. Approximately 2.8 tons of sulphuric acid are required for the production of one ton of phosphoric acid. |
| (3) | Copper cathode is used as a starting material for copper rods. Approximately one ton of copper cathode is required for the production of one ton of copper rods. |
| (4) | Currently the operations are suspended as detailed above. |
Since Mt. Lyell mine has been placed under care and maintenance following a rock falling on the ventilation shaft in June 2014, there was no copper extraction from these mines for fiscal years ended March 31, 2020, 2021 and 2022.
99
Principal Raw Materials
Overview
The principal inputs of our copper business are copper concentrate, rock phosphate, power, fuel and sulphuric acid. Other inputs include coke, lime, reagents and oxide ore. We have in the past been able to secure an adequate supply of the principal inputs for our copper production.
Copper Concentrate
Copper concentrate is the principal raw material of our copper smelter. We source our copper concentrate requirements either through long-term contracts or on spot markets. We purchase copper concentrate at the LME price less a TcRc that we negotiate with our suppliers, but which is influenced by the prevailing market rate for the TcRc. The smelter at Tuticorin has been closed since fiscal year 2019, therefore copper anodes and blister has been procured from external sources for production of copper cathode in Silvassa Refinery.
In general, Vedanta Limited’s long-term agreements run for a period of three to five years and are renewable at the end of the period. The quantity of supply for each contract year is fixed at the beginning of the year and terms like TcRc and freight differential are negotiated each year depending upon market conditions. For copper blisters and anodes, the long-term agreements are limited to a period of one year. In fiscal year 2022, we sourced approximately 89% of our copper anodes / blister requirements through long-term agreements.
Vedanta Limited also purchases copper concentrate on a spot basis to fill any gaps in its requirements based on production needs for quantity and quality. These deals are struck on the best possible TcRc during the period and are specific for short-term supply.
Power
The electricity requirements of our copper smelter and refinery at Tuticorin are primarily met by theoperations and maintenance of our captive power plants at Tuticorin. Our Silvassa facility relies on the state power grid for its power requirements.
on-site
captive power plants. This plant uses coal that is imported from third parties. Our other captive power plants at Tuticorin operate on furnace oil that is procured through long-term contracts with various oil companies. During fiscal year 2022, no power was consumed for production purpose as the plant at the Tuticorin has been closed since FY 2019. We have outsourced theday-to-day
Distribution, Logistics and Transport
Copper concentrate sourced from third parties is received at the port of Tuticorin and then transported by road to the Tuticorin facility.
Once processed at the Tuticorin facility, copper anodes are either refined at Tuticorin or transported by road to Silvassa. The smelter at Tuticorin was closed since the fiscal year 2019 and has not reopened. Accordingly, we have been procuring copper anodes and blister from external sources for production of copper cathode in Silvassa Refinery. Copper cathodes, copper rods, sulphuric acid, phosphoric acid and other
by-products
are shipped for export or transported by road to customers in India.Sales and Marketing
The 10 largest customers of our copper business accounted for approximately 40.6%, 47.61% and 45.25% of our copper business revenue in fiscal years 2020, 2021 and 2022 respectively.
Our copper sales and marketing head office is located in Mumbai, and we have field sales and marketing offices in most major metropolitan centers in India. We sell our copper rods and cathodes in both the domestic and export markets. In fiscal years 2020, 2021 and 2022 exports accounted for approximately 29%, 7.58% and 10.76% of the revenue of our copper business, respectively. Our export sales were primarily to China, UAE, Qatar, Belgium, Nepal and Taiwan. We also sell phosphoric acid and other
by-products
in both the domestic and export markets.Domestic sales are normally made on the basis of prevailing LME prices as selected by the customer. The price for copper we sell in India is normally higher than the price we charge in the export markets due to the tariff structure on costs, smaller order sizes that domestic customers place and the packaging, storing and truck loading expenses that we incur when supplying domestic customers.
Our export sales of copper are made on the basis of both long-term sales agreements and spot sales. The sales prices of our copper exports include the LME price plus a producer’s premium. We do not enter into fixed price long-term copper sales agreements with our customers.
100
Market Share and Competition
We own one of the two custom copper smelters in India and had a primary market share of 22% by sales volume in India. The other major custom copper smelter in India is owned by Hindalco Industries Limited, with the remainder of the primary copper market in India primarily served by imports and Hindustan Copper Limited.
Copper is a commodity product and we compete primarily on the basis of price and service, with price being the most important consideration when supplies of copper are abundant. Our metal products also compete with other materials, including aluminium and plastics that can be used in similar applications by
end-users.
Copper is sold directly to consumers or on terminal markets such as the LME. Prices are established based on the LME price, though as a regional producer we are able to charge a premium to the LME price which reflects the cost of obtaining the metal from an alternative source.Projects and Developments
Vedanta Limited had undertaken expansion projects to setup copper smelter plant II at Tuticorin costing 44,240 million ($ 583 million) to increase its total copper capacity to 800,000 tpa.
₹
Vedanta Limited has incurred 8,090 million ($ 105 million) on these projects as of March 31, 2022. However, the expansion of the smelter was temporarily put on hold due to pending environmental clearances.
₹
The application for renewal of the Environmental Clearance for the proposed Expansion Project has expired on December 31, 2018. We made a fresh application dated March 12, 2018, before the Expert Appraisal Committee of the MoEF&CC wherein a
sub-
committee was directed to visit the Expansion Project site prior to prescribing the Terms of Reference.In the meantime, the Madurai Bench of the High Court of Madras in a Public Interest Litigation held vide its order dated May 23, 2018, that the application for renewal of the Environmental Clearance for the Expansion Project shall be processed after a mandatory public hearing and the said application shall be decided by the competent authority on or before September 23, 2018. In the interim, the High Court of Madras ordered the Company to cease construction and all other activities on site for the proposed Expansion Project with immediate effect. Separately, State Industries Promotion Corporation of Tamil Nadu (“SIPCOT”) vide its letter dated May 29, 2018, cancelled 342.22 acres of the land allotted to us for the proposed Expansion Project. Further the TNPCB issued orders on June 7, 2018, directing the withdrawal of the CTE which was valid till March 31, 2023.
Hearing the case of expansion project, Madras High Court vide its order dated October 3,2018 has granted an interim stay in favour of the Company against order of SIPCOT dated May 29, 2018, cancelling 342.22 acres of the land allotted to us. The MoEF&CC has updated on its website that Vedanta Limited’s environmental clearance for expansion project will be considered for ToR either upon verdict of the NGT case or upon filing of a Report from the State Government/ District Collector, Thoothukudi. The existing EC has expired on December 31, 2018. We had applied for fresh environmental clearance in February 2018, but the application was not processed citing the pending litigation. Presently the EC application file has been closed by MoEF&CC.
The Company has also filed Appeals before the TNPCB Appellate Authority challenging withdrawal of CTE by the TNPCB, the matter is pending for adjudication. Matter was last listed on June 8, 2022, for Vedanta Limited to file counter to an implead application made by one Fatima Babu. The matter was last heard on June 8, 2022, wherein the TNPCB filed its counter in the matter. The matter is next listed for September 7, 2022. The Company has recognised a provision on impairment on its expansion project of 6, 692 million ($ 88 million).
₹
Our Aluminium Business
Our aluminium business is in Chhattisgarh and Odisha. We operate the business in the state of Chhattisgarh through BALCO, in which we have a 51.0% ownership interest, whereas our aluminium operations in Odisha were previously operated through Vedanta Aluminium, which was merged into Vedanta Limited pursuant to the
Re-organization
Transactions.(a) | BALCO |
Overview
Our aluminium business in Chhattisgarh is owned and operated by BALCO. BALCO’s aluminium operations comprises two bauxite mines, the Chotia coal block, 1,710 MW power plants, an alumina refinery (operations of which had been suspended since September 2009), a 245,000 tpa aluminium smelter, a 325,000 tpa aluminium smelter and fabrication facility, all of which are located in Korba in the State of Chhattisgarh in Central India.
101
Mining operations at BALCO’s Chotia Coal Mine Block have been suspended as low GCV has rendered operations being uneconomical. Further the Company has made a request for surrender of mining lease and discharge of CMDPA to the office of Nominated Authority in June 2021.
BALCO’s Bodai-Daldali bauxite mines is located in Kawardha district of Chhattisgarh. Bauxite is transferred to our alumina refinery in Lanjigarh, which converts bauxite to alumina and supplies alumina back to BALCO. In return, BALCO pays conversion price to us based on our actual cost of production plus reasonable margin. Balance of the BALCO’s alumina requirements are sourced from third parties and from Vedanta Limited on sale basis at Arm’s length price. Mining operations at Bodai-Daldali bauxite mine located in the Kawardha district have been suspended since April 2020 as low ore quality has rendered operations becoming uneconomical.
BALCO’s other bauxite mine is in Mainpat bauxite mine, which is an open pit mine located in the Surguja district of the state of Chhattisgarh. The Mainpat mine has been in production since 1993. Mining lease of the Mainpat mine has been renewed and is valid until July 8, 2042. During fiscal year 2020, mining operations were disrupted and under temporary suspension since October 11, 2019, as ore quality rendered operations uneconomical.
We own a 51.0% ownership interest in BALCO and have management control of the company. On March 19, 2004, we exercised an option to acquire the remaining ownership interest in BALCO, which is owned by the GoI. The exercise of this option has been contested by the GoI. See “” for more information.
Item 4. Information on the Company—B. Business Overview—Our Business—Call Options over Shares
Principal Products
| • | Primary Aluminium |
Primary aluminium is produced from the smelting of metallurgical grade alumina. BALCO produces primary aluminium in the form of ingots and wire rods for sale. Ingots are used extensively for aluminium castings and fabrication in the construction and transportation industries. Wire rods are used in various electrical applications, especially in the form of electrical conductors and cables.
| • | Rolled Products |
Rolled products, namely coils and sheets, are value-added products that BALCO produces from primary aluminium. Rolled products are used for a variety of purposes in different industries, including manufacturing of aluminium foil, printing, transportation, consumer durables, building and architecture, electrical and communications, packaging and general engineering industries.
Delivery to Customers
Ingots, wire rods and rolled products are transported by trucks to customers in India and by rail and trucks to ports for export.
Principal Facilities
Overview
The following map shows details of the locations of BALCO’s facilities in the State of Chhattisgarh:
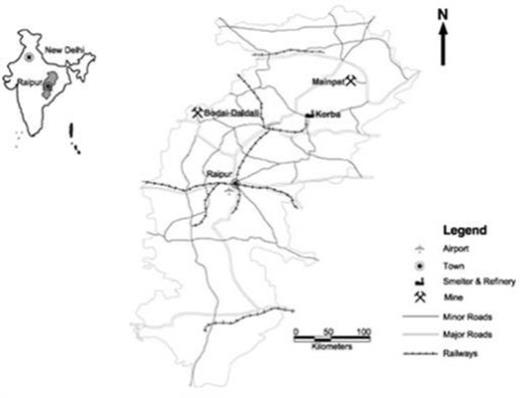
102
Bauxite Mines
Chhattisgarh Mines – Mainpat and Bodai-Daldali
BALCO has two captive bauxite mines, namely the Mainpat bauxite mine and the Bodai-Daldali bauxite mine, in the state of Chhattisgarh in Central India. The Mainpat mine is an
open-pit
bauxite mine located in the Surguja district of Chhattisgarh. Mainpat mine has been in production since 1993 and has a leased hold area of 6.39 square kilometers. The bauxite extraction limit for the mine granted by MoEF&CC is 750,000 tpa. Mining lease of Mainpat mine has been renewed until July 8, 2042, and environmental clearances for the Mainpat mine has been renewed by MoEF&CC and is valid until September 16, 2038. BALCO had applied for renewal of forest clearance for forest landco-terminus
for the mining lease period, which is valid until July 8, 2042. During fiscal year 2020, mining operations were disrupted and were under temporary suspension since October 11, 2019, as ore quality rendered operations uneconomical.The Bodai-Daldali deposits are located approximately 260 kilometers from Korba in the Kawardha district of the state of Chhattisgarh. Bodai-Daldali was commissioned in 2004 by BALCO with a lease hold area of 6.26 square kilometers renewable mining lease that is valid until March 26, 2047. The bauxite extraction limit for Bodai-Daldali Mines granted by MoEF&CC is 1,250,000 tpa.
Chhattisgarh bauxite deposits are situated over a plateau with steep scarps on both sides, at an elevation of approximately 1,040 meters above the mean sea level for Mainpat, and approximately 940 meters above the mean sea level for Bodai-Daldali. The bauxite is generally one meter to three meters thick and lies within a laterite sequence overlying thick tertiary basalts of the Deccan traps. The cover of laterite and thin topsoil is up to 5 meters thick but is generally less than 2 meters. Majorly, the Bauxite outcrops around plateau rims.
A typical profile of the Chhattisgarh deposits comprises topsoil and soft overburden above the laterite. The upper laterite consists of hard, loose or indurated bauxite pebbles and boulders with a clear contact with the underlying hard bauxites. The bauxite occurs in discontinuous lenses up to four meters in thickness with laterite in filling joints and fractures with the bauxite. The contact with the softer lower laterite is usually gradational and irregular.
The bauxite ranges from hard to very hard with a natural moisture content of 3.0% to 10.0%, an
in-situ
density of 2.3 tons per cubic meter. It comprises primarily gibbsite with bohemite and minor diaspore. The reactive silica content is low and iron is present in the form of hematite and aluminous goethite.All mining and transportation at both mines are undertaken by contractors. One thin topsoil layer is removed by an excavator and is either transported to an adjacent storage point or an area that is being backfilled. The laterite layer is drilled and blasted. The overburden is then removed by backhoe, excavators and
15-ton
dumpers. Broken ore is hand-sorted, leaving waste material behind. Ore productivity is around 2 to 3 tons per person per day in the dry season which decreases to 1.25 to 1.75 tons per person per day in the wet season.The exploration drilling program has been completed and the entire area is covered based on a
50-meter
square pattern and is reduced to a25-meter
centers for detailed mine planning. Sampling is normally in 0.4 meter lengths and core is currently split and retained for future reference. Bauxite samples are tested for silica and aluminium oxide at laboratories situated on site and at the Korba plant. Selected sample arere-assayed
as part of a quality control program.Since the commencement of operations, the Mainpat mine has produced approximately 8.13 million tons of bauxite. During fiscal year 2020, the mine produced 55,700 tons of bauxite until October 2019. Thereafter, mining operations were temporarily suspended as ore quality rendered operations uneconomical.
Total production at the Bodai-Daldali mine since the commencement of production has been 8.47 million tons of bauxite, with production in fiscal year 2020 totaling approximately 469,800 tons at 44.53% aluminium oxide and there is no production in fiscal year 2021 and 2022. Power is supplied
on-site
by state electricity board (CSPDCL) and diesel generators. Water requirement for mines is fulfilled by surface water from rain water harvesting and pond developed at mines.The mining recovery factors applied to determine the reserves for both mines are 65.0% from ore. The grade dilution factor is reconciled between the actual mined / dispatched grades obtained and
in-situ
grade values. The grade correction / dilution factors applied for Mainpat and Bodai-Daldali Bauxite mines are Al2O3 97%, SiO2 103%. The parameters for Mainpat Mines are derived from the reconciliation of actual production against the geological model, while the parameters for Bodai-Daldali are based on estimates.103
(i) | Korba Facility |
Overview
BALCO’s smelting facility is located at Korba in the state of Chhattisgarh and consists of a 245,000 tpa aluminium smelter and a 325,000 tpa aluminium smelter, 1,710 MW captive power plants, and an alumina refinery
(non-operational)
and fabrication facility. Out of the 1,710 MW, 540 MW captive power plant was commissioned in March 2006 and 900 MW was commissioned in fiscal year 2016. The remaining 270 MW power plant was transferred from power business to aluminum business on April 1, 2016 (Presently, the 270 MW power plant is under suspension) and one unit of 300 MW was converted from IPP to CPP from April 1, 2017 vide order dated January 1, 2019. BALCO now has only one 300 MW power unit operating as Independent Power Plant (reported in the power segment). The following table sets forth the total capacities as of March 31, 2022 at BALCO’s KorbaCapacity | ||||||
Facility | Alumina | Aluminium | Power plant | |||
(tpa) | (tpa) | (MW) | ||||
Korba | 200,000 | 245,000 | 1,710 | |||
Korba Smelter II | — | 325,000 (1) | ||||
For the 325,000 tpa smelter, 84 pots were operationalized during fiscal year 2015. An additional 84 pots were operationalized during fiscal year 2017 and the remaining 168 pots commenced commercial production from May 1, 2017.
Refinery
Commissioned in 1973, uses the conventional high-pressure Bayer process and has a capacity of 200,000 tpa of alumina. The operations of the refinery have stopped since September 2009
.
Smelters
The smelter uses
pre-baked
GAMI technology and has a capacity of 245,000 tpa, was commissioned in November 2006. BALCO has set up a 325,000 tpa smelter at the Korba facility, of which 84 pots commenced commercial production in September 2014. An additional 84 pots were operationalized in August 2016 and the remaining 168 pots commenced commercial production on May 1, 2017.Fabrication Facility
The fabrication facility at Korba has two parts, a cast house and a sheet rolling shop.
Cast House
The cast house uses continuous rod casters from Continuus-Properzi S.P.A and has a foundry which has twin-roll continuous casters with a SNIF degasser and hydraulically driven semi-continuous ingot casting machine to produce ingots and wire rods.
Sheet Rolling Shop
The sheet rolling shop has three parts: a hot rolling mill with a capacity of 75,000 tpa, an older cold rolling mill with a capacity of 30,000 tpa and a newer cold rolling mill commissioned in 2004 with a capacity of 36,000 tpa. Molten metal is cast into slabs and then either
hot-rolled
and sold ashot-rolled
sheets or converted into cold-rolled sheets in the cold rolling mills. Alternatively, molten metal is directly used in strip casting and then fed to the cold rolling mills to convert it into cold-rolled sheets or coils.Power Plants
Smelting requires a substantial continuous supply of power and interruptions can cause molten metal to solidify and damage or destroy the pots. Power for the Korba facility is mostly provided by the coal-based 540 MW captive power plant commissioned in March 2006. The surplus generation from the power plant is supplied to the State Electricity Board and other customers. 270 MW power plant was transferred from power business to aluminium business on April 1, 2016 (presently the 270 MW power plant is under suspension). BALCO constructed a CPP 900 MW coal-based thermal power facility in the state of Chhattisgarh. The power generated from CPP 900 MW (3 units of 300 MW each) units is being utilized in the 325,000 tpa smelter. The surplus generation from the power plant is supplied to the State Electricity Board and other customers. One of the 3 units of 300 MW was converted to CPP from April 1, 2017 vide order dated January 1, 2019.
Thermal coal is a key raw material required for the operation of BALCO’s captive power plants. The major coal supplier in India is Coal India Limited and its subsidiaries (mainly, South Eastern Coalfields Limited) and coal mined from the captive Chotia coal block. The balance coal requirements is met from imports. The total volume of coal consumed annually by coal-fueled power plants is largely dependent on the amount of generation. During fiscal year 2022, total coal consumed by 135 x 4 MW and 300 x 3 MW power plants was 2.45 million and 4.05 million tons respectively.
104
Production Volumes
The following table sets out BALCO’s total production from its Korba facility for fiscal years ended March 31, 2020, 2021 and 2022:
For the Year Ended March 31, | ||||||||||||||
Facility | Product | 2020 | 2021 | 2022 | ||||||||||
(tons) | ||||||||||||||
Korba | Ingots/Busbar/Billets | 315,813 | 374,867 | 360,744 | ||||||||||
| Alloy Ingots | 44,693 | 46,185 | 57,622 | |||||||||||
| Rods | 172,002 | 118,691 | 130,124 | |||||||||||
| Rolled products | 28,831 | 29,864 | 33,185 | |||||||||||
Total (1) | 561,339 | 569,607 | 581,675 | |||||||||||
| (1) | Reflects total of ingots, rods and rolled products. |
The following table sets out the total bauxite ore production for each of BALCO’s mines for fiscal years ended March 31, 2020, 2021 and 2022:
For the Year Ended March 31, | ||||||||||||||
Mine (Type of Mine) | Products | 2020 | 2021 | 2022 | ||||||||||
(tons, except for percentages) | ||||||||||||||
Mainpat (Open pit) | Bauxite ore mined | 55,700 | — | — | ||||||||||
| Ore grade | 42.60 | % | — | — | ||||||||||
Bodai-Daldali (Open pit) | Bauxite ore mined | 469,800 | — | — | ||||||||||
| Ore grade | 44.53 | % | — | — | ||||||||||
Total | 525,500 | — | — | |||||||||||
Principal Raw Materials
The principal inputs of BALCO’s operations are alumina, power, carbon and certain other raw materials. In the past, Vedanta Limited has been able to secure an adequate supply of the principal inputs for its aluminium business.
| • | Alumina |
Alumina is the primary raw material used in the production of aluminium. BALCO sources its alumina requirements from Lanjigarh and from third- party suppliers in international markets In fiscal years 2020, 2021 and 2022, BALCO purchased 0.80 million tons, 0.92 million tons and 0.93 million tons of imported alumina at an average price of $ 373, $ 326 and $ 414 per ton respectively, on a cost, insurance and freight or CIF basis at the ports in Andhra Pradesh in India.
| • | Power |
Smelting primary aluminium requires a substantial, continuous supply of electricity. As a result, power is a key input at BALCO’s Korba facility, where it is provided by three coal-based captive power plants of 270 MW (currently under suspension), 540 MW and CPP 900 MW (one unit of 300 MW was converted from IPP to CPP from April 1, 2017 vide order dated January 1, 2019 taking it from 600 MW to 900 MW). Our captive power plant has historically been dependent upon coal allocations from Coal India Limited. BALCO acquired the Chotia coal block through an
e-auction.
The total reserves at the Chotia block are 17.9 million tons with an annual production capacity of one million tons. However, based on changes proposed in the mining methodology in Mining Plan 4th Revision (with effect from April 2019), the balance extractable reserve wasre-assessed
as 19.66MT and during FY 2019-2020, 1.0MT coal was produced from Chotia II, reducing the on date extractable coal reserve to 18.66MT and no major coal production (only MT produced) in this FY 2021 due to ongoing pandemic situation. And nil production in FY 2022 as the Mining operations at BALCO’s Chotia Coal Mine Block have been suspended as low GCV has rendered operations being uneconomical. BALCO’s total coal requirement at full capacity is approximately 6 million tons for power generation for smelting.Power for BALCO’s captive bauxite mines are provided by
on-site
diesel generators. BALCO constructed a 1,200 MW coal-based thermal power facility, all the four units were commissioned during fiscal year 2016 and the last unit commenced commercial production on May 1, 2016. Of the 1,200 MW facility, power generated from three 300 MW units is supplied to the 325,000 tpa smelter and the power from the balance 300 MW units is sold to third parties (reported in power segment).| • | Water |
Water is also an important input for BALCO’s captive power plants. BALCO sources its water requirements at Korba from a nearby canal, with the water transported by pipelines. BALCO is currently in a dispute with the NTPC regarding the right of way for its water pipeline that supplies water to its 270 MW captive power plant, which has been built through NTPC premises. See “” for further details.
Item 3D - Risks relating to our business
105
| • | Carbon |
Carbon is an important raw material to the aluminium smelting process. Carbon is used in the process of electrolysis, in the form of cathodes and anodes. Anodes are made up of carbonaceous material of high purity. For
pre-baked
anodes, green carbon paste made of calcined petroleum coke and coal tar pitch is compacted or pressed into the required form. These anodes are baked before their use in electrolytic cells, or pots.BALCO has
in-house
facilities to manufacture carbon anodes to meet its entire carbon anode requirements. Calcined petroleum coke, coal tar pitch and fuel oil are the key ingredients for the manufacture of carbon anodes. There is an adequate supply of these raw materials domestically as well as globally. Their prices are generally determined by movements in global prices and local regulations. Based on commercial advantages, we source from several suppliers in India and globally.| • | Other Raw Materials |
BALCO also uses other raw materials such as fluorides and other chemicals. For these raw materials, there are several sources of supplies in the domestic and international markets and we do not foresee any difficulty in securing supplies when needed.
Distribution, Logistics and Transport
Bauxite mined from the Mainpat and Bodai-Daldali mines is transported by road and rail to Lanjigarh alumina refinery for conversion to alumina. The alumina from Lanjigarh is delivered by rail to Korba. The alumina purchases from third party suppliers are transported to the Korba facility by ocean shipping and rail. BALCO’s aluminium products are transported from the Korba facility to domestic customers through a combination of road and rail and shipped for export.
Sales and Marketing
BALCO’s ten largest customers for aluminium accounted for 53.6% ,53.2% and 50.71% of its revenue from the aluminium business in fiscal years 2020, 2021 and 2022 respectively. One of BALCO’s customers accounted for more than 15% of BALCO’s revenue in fiscal year 2022. Two of BALCO’s customers accounted for more than 15% of BALCO’s revenue in fiscal year 2021 and 2020. BALCO sells its products to both domestic and export markets. BALCO’s key customers include conductor manufacturers, railways, equipment and machinery manufacturers among other customers. We follow an
LME-based
pricing and product-wise premiums for both our domestic and global customers. Our sales are currently on both spot and long-term basis.Projects and Developments
On October 7, 2006, BALCO entered into a memorandum of understanding with the state government of Chhattisgarh, India, and the Chhattisgarh State Electricity Board, under which, among other things, feasibility studies will be undertaken to build a thermal coal-based 1,200 MW power facility, along with an integrated coal mine in the state of Chhattisgarh at an estimated cost of 46,500 million ($ 613 million). The project was disrupted in September 2009 due to the collapse of a chimney under construction during heavy rains and lightning at Korba. There were 40 fatalities in the accident and SEPCO Electric Power Construction Corporation, our contractor and the 81,000 million ($ 1,067 million). The first of two phases of this project commenced with the setting up of a 325,000 tpa aluminium smelter at an estimated cost of 38,000 million ($ 501 million), which uses
₹
sub-contractor
Gamon Dunkerley and Company Limited, are the subject of an investigation by the Chhattisgarh government. The next hearing will be listed in due course. The lower court is awaiting the order of the High Court of Chhatishgarh. We instituted an enquiry which was conducted by the Indian Institute of Technology Roorkee, an expert in the civil engineering field in India. The project was resumed in January 2010. BALCO has constructed 1,200 MW (300 MW x 4) thermal power plant. All the four units were commissioned during Fiscal Year 2016 and the last unit commenced commercial production on May 1, 2016. In addition, on August 8, 2007, BALCO entered into a memorandum of understanding with the state government of Chhattisgarh for a potential investment to build an aluminium smelter with a capacity of 650,000 tpa at Chhattisgarh at an estimated cost of₹
₹
pre-baked
GAMI technology. BALCO has received environmental clearances for both phases of the project. Construction has commenced and trial production started in February 2014 from the 325,000 tpa aluminium smelter and 84 pots started commercial production from September 2014. During fiscal year 2017, Company started commercial production from another 84 pots from August 1, 2016. Balance 168 pots are operationalized from May 1, 2017.The 1,200 MW power facility was completed and capitalized in all aspects in April 2016 and 325,000 tpa aluminium smelter was fully capitalized in May 2017.
On May 13, 2021, the Board approved the expansion of Rolled Product Capacity from existing 50 KTPA to 130 KTPA at a cost of 3,480 million ($ 46 Million) which will improve the plant’s VAP capacity and overall premium. Further, on July 26, 2021, the Board has approved the BALCO smelter expansion by 414 KTPA, subject to requisite government approvals at a cost of ~ 66,110 million ($ 871 million) which will help to reach 92% VAP portfolio at BALCO. This includes investment made to build new township for improved safety and security
₹
₹
106
Market Share and Competition
For the fiscal year 2022, the estimated market share for Vedanta (including BALCO) in India for aluminium was approximately 47% among the primary aluminium producers in India, based on internal estimates.
Coal mining operations
Thermal coal is a key raw material required for the operation of BALCO’s captive power plants. In September 2014, the Hon’ble Supreme Court canceled all the coal blocks that had been awarded to companies in India by the Ministry of Coal between 1992 and 2012. Consequently, in February 2015, the GoI conducted an auction to award mining rights to successful bidders for all such coal blocks. During the fourth quarter of fiscal year 2015, BALCO was successful in securing the Chotia coal block in the GoI coal block auctions. The Chotia coal block was acquired to support BALCO’s captive power plants. BALCO was also successful in its bid for the Gare Palma IV/1 coal block, but the GoI challenged and rejected the award and BALCO does not intend to file any further petitions to appeal for its bid on the coal block.
The Chotia coal block is located in Korba district in the state of Chhattisgarh. The total reserves at the Chotia block are 17.9 million tons with an annual production capacity of one million tons. However, based on changes proposed in the mining methodology in Mining Plan 4th Revision (with effect from April 2019), the balance extractable reserve was
re-assessed
as 19.66MT and during FY2019-20,
1.0MT coal was produced from Chotia II, reducing the on date extractable coal reserve to 18.66MT and no major coal production (only 0.002 MT produced) in FY 2021 due to ongoing pandemic situation. There was nil production in FY 2022 as the Mining operations at BALCO’s Chotia Coal Mine Block have been suspended as low GCV has rendered operations being uneconomical.Mine and Location | Means of Access | Ownership | Operator | Title, leases or Options | History | Mine type and mineralization style | Power source | Facilities, use and condition | ||||||||
Chotia Coal Mine, Tehsil-Podiuprodha District Korba State: Chhattisgarh | -Public road -Coal transported by road to BALCO plant in Korba District -Distance between mines and BALCO plant is 73 Km | BALCO-100.0% | -MDO-Mode Currently no MDO exists as mining operations are temporarily suspended due to COVID-19. | -Mining lease granted. -Mining lease is valid for 20 years -Lease executed on October 16, 2015 -Valid until-October 15, 2035 | Mines commenced coal production in 2006 (by prior allottee, M/s Prakash Industries Ltd.) However, BALCO commenced coal mining operations in 2015 | -Open Cast and Underground -Opencast is operational since 2006 (by prior allottee, M/s Prakash Industries Ltd.) -No infrastructure is developed by prior allottee for underground hence no coal production from underground mine. Mining Plan has been revised by BALCO accordingly. -Thermal coal is mined from barakar formation of permian age of Gondwana supergroup -Low moisture thermal coal | Electricity is available from Rural Feeder of Chhattisgarh State Electricity Board | Site office, explosive magazine, diesel pump, store, weigh bridge, residential complex is available at site |
107
We source coal from the following principal sources:
| • | Captive Coal Block at Chotia – BALCO sources coal from its own coal mine which has annual coal production capacity of one million tons and BALCO produced 0.002 million tons and 1.0 million tons during fiscal year 2021 and 2020 respectively and 0.67 million tons during fiscal year 2019. No production was generated in FY 2022, as the Mining operations at BALCO’s Chotia Coal Mine Block have been suspended since July 1, 2021 since low GCV has rendered operations uneconomical. |
| • | Other Sources – BALCO sources coal from other sources such as the GoI’s coal mining companies, long-term coal supply agreements and from imports. In fiscal year 2021, the total coal purchased from these other sources was 7.48 million tons. Set forth below is a map depicting the location of our coal properties for our coal mining operations: |
Set forth below is a map depicting the location of our coal properties for our coal mining operations:
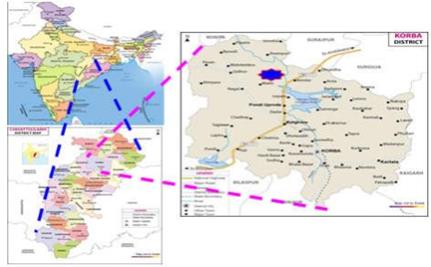
Set forth below are maps depicting access to Chotia coal blocks:
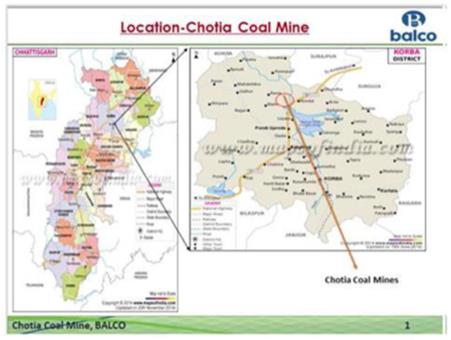
(a) Our Aluminium Business in Odisha
Our aluminium business in Odisha was previously operated by Vedanta Aluminium Limited, which was merged with us pursuant to the
Re-organization
Transactions. Our Odisha aluminium operations include a 2.0 million tpa alumina refinery at Lanjigarh, with an associated 75 MW captive power plant.108
We have a greenfield 500,000 tpa aluminium smelter (“Plant 1”), together with an associated 1,215 MW (nine units with a capacity of 135 MW each). We also have another 1,250,000 tpa smelter (“Plant 2”) facilities in Jharsuguda along with associated 1,800 MW (three units of 600 MW each) coal- based captive power plant in Jharsuguda. The 1.25 million tpa smelter initially commenced its production on December 1, 2015 and 1,855 pots have been capitalized as of March 31, 2022. This facility is in the process of being ramped up to increase its total capacity to 1.75 mtpa, subject to obtaining the required approvals from the GoI.The alumina refinery at Lanjigarh produced 1.97 million tons of alumina in fiscal year 2022. The smelters at Jharsuguda reported cast metal production of 1.69 million tons in fiscal year 2022. The net power generation was 8,506 million units and 10,141 million units from the 1,215 MW power plant and 1,800 MW power plant respectively in fiscal year 2022.
| Ø | Principal Products |
Primary aluminium is produced from the smelting of metallurgical grade alumina in smelters. We produce primary aluminium in the form of ingots, primary foundry alloys, wire rods, billets and slabs for sale. Ingots are used extensively for aluminium castings and fabrication in the construction and transportation industries. Primary foundry alloys find usage in automotive industries mainly. Wire rods are used in various electrical applications especially in the form of electrical conductors and cables. Billets are used extensively in construction (windows and door frames), transportation, engineering, consumer durables, automotive forgings and many other applications. Slabs are used generally in rolling mills for manufacturing aluminium foil and sheet products.
| Ø | Delivery to Customers |
Our products are transported by trucks and rakes to customers in India. Exports are delivered through ocean shipping, and inland movement to ports is typically by rakes.
| Ø | Principal Facilities |
The following map shows the details of the locations of the aluminium facilities in the State of Odisha:
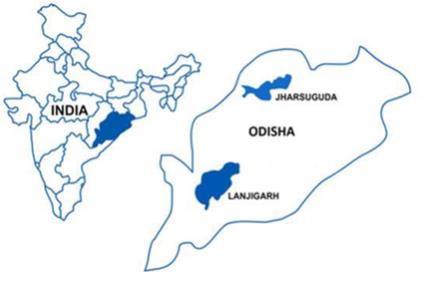
The following table sets forth the capacities as on March 31, 2022 at our Lanjigarh and Jharsuguda facilities:
Facility | Capacity (tpa) | |||
Lanjigarh Alumina Refinery | 2,000,000 | |||
Jharsuguda Aluminium Smelter | 500,000 | |||
Jharsuguda Aluminium Smelter (partially completed) | 1,250,000 | |||
| Ø | Lanjigarh |
Alumina refinery and captive power plant
The Lanjigarh alumina refinery is in the Kalahandi district in the state of Odisha. In March 2007, we began the progressive commissioning of a 1 mtpa greenfield alumina refinery, expandable to 1.4 mtpa of installed capacity and an associated 75 MW captive power plant, expandable to 90 MW. The captive power plant is fully operational and can meet the power requirements of the refinery. The second production stream of the Lanjigarh alumina refinery was commissioned in March 2010. Production of alumina at the refinery at Lanjigarh was suspended since December 5, 2012, due to inadequate availability of bauxite and the plant recommenced operations on July 12, 2013.
109
Initially in 2008, we planned to expand our alumina refining capacity at Lanjigarh to 6 mtpa and construct an associated 210 MW captive power plant. The expansion of the alumina refinery and related mining operations in and around the Niyamgiri was put on hold in October 20, 2010, when the MoEF&CC directed us to hold from further expansion.
Against this order, we filed a writ petition in the High Court of Odisha and the Court dismissed our petition. We subsequently made an application to the MoEF&CC. The environmental clearance for the Lanjigarh expansion project was received on November 20, 2015 for up to 4 mtpa, and an additional environmental clearance for up to 6 mtpa is subject to the completion of land acquisition of the balance area of 666.03 HA. Further, a consent to establish for 4 mtpa and a CTO for 2 mtpa has also been obtained. As approvals for expansion of the Lanjigarh refinery to 4 mtpa has been received, second stream operations have commenced at the Alumina refinery from April 2016 and the debottlenecked capacity has reached 2 mtpa (although this is contingent on the bauxite quality). However, on February 18, 2016, an individual challenged the environmental clearance granted for the alumina refinery expansion at Lanjigarh before the NGT, Kolkata, wherein MoEF&CC, Odisha State Pollution Control Board and us have been made parties. and the matter remains sub judice for hearing and no stay has been granted of the environmental clearance. On August 6, 2021, we received environmental clearance for 6 MTPA. On May 2, 2022, the matter was listed for final hearing before a special bench of the NGT, wherein the bench disposed off the appeal by directing the Environmental Clearance received for 6 MTPA on August 6, 2021 to remain intact for the expansion project. Certain additional directions were also passed with regards to payment of Environmental Compensation and a setting up of a Committee to formulate additional conditions on water drawl from Tel river, Fly Ash utilisation, Red Mud utilisation/disposal and approve restoration plan for utilising the compensation amount. See “” for further details.
Item 8. Financial Information - A. Consolidated Statements and Other Financial Information – Legal Proceedings
| Ø | Jharsuguda |
Aluminium smelter and Captive Power Plant
We have a greenfield 500,000 tpa aluminium smelter together with an associated 1,215 MW (nine units with a capacity of 135 MW each). We also have another 1,250,000 tpa smelter facilities in Jharsuguda along with associated 1,800 MW (three units of 600 MW each) coal-based captive power plant in Jharsuguda. The 1.25 million tpa smelter initially commenced its production on December 1, 2015 and 1,855 pots have been capitalized as of March 31, 2022. This facility is in the process of being ramped up to increase its total capacity to 1.75 mtpa, subject to obtaining the required approvals from the GoI.
In this respect, the Board has approved 100 KTPA smelter expansion on May 13, 2021, along with investment in the railway infrastructure to sustain the increased volume and operation. Further, various VAP capacity expansion projects have been approved by the Board.
Production Volumes
The following table sets out total production from our Lanjigarh and Jharsuguda facilities for fiscal years 2020, 2021 and 2022. The numbers reported for Jharsuguda are cast metal production volumes.
For the year ended March 31 | ||||||||||||||
Facility | Product | 2020 | 2021 | 2022 | ||||||||||
(tons) | ||||||||||||||
Lanjigarh | Calcined alumina | 1,810,702 | 1,840,894 | 1,967,910 | ||||||||||
Jharsuguda | Ingots | 792,890 | 863,117 | 1,052,179 | ||||||||||
| Primary Foundry Alloys | 21,611 | 11,371 | — | |||||||||||
| Billets | 309,088 | 264,693 | 3,90,766 | |||||||||||
| Wire rods | 161,694 | 201,756 | 2,00,332 | |||||||||||
| Hot metal | 30,713 | 22,535 | 13,496 | |||||||||||
| Slab | 26,648 | 36,403 | — | |||||||||||
| Cast Bar | — | — | 29,924 | |||||||||||
| Ø | Principal Raw Materials |
The principal inputs of the aluminium operations are bauxite, alumina, power, carbon, water and certain other raw materials.
(i) | Bauxite |
Currently, bauxite is being sourced primarily through imports (36.7%) and Odisha Mining Corporation (63.3%).
We have entered into long term agreement with Odisha Mining Corporation (“OMC”) in accordance with state policy and supply of bauxite to the Lanjigarh refinery has started from first quarter of fiscal year 2019. The long-term linkage agreement is for upto 70.0% of the saleable stock that has been signed between OMC and Vedanta Limited for a period of five years. The balance 30.0% will be sold through auction, through national
e-auction
to be conducted regularly on fixed intervals of six months.110
(ii) | Alumina |
Alumina is the primary raw material used in the production of aluminium. Currently for Jharsuguda operations, alumina is being sourced from Lanjigarh (54.1%), other domestic sources (5.9%) and remaining (40.0%) through imports from Indonesia, Australia, Vietnam and other countries. The alumina sourced externally is metallurgical grade calcined alumina with a minimum alumina content of 98.6% on a dry basis. In fiscal years 2020, 2021 and 2022, we purchased 1.07 million tons, 1.02 million tons and 1.36 million tons of alumina at an average price of $ 367 per mt, $ 305 per mt and $ 432 per mt respectively on a cost, insurance and freight basis at the ports situated in the state of Andhra Pradesh.
(iii) | Power |
Smelting of primary aluminium requires a substantial and continuous supply of electricity. As a result, power is a key input at our Jharsuguda facility. The power is provided by nine units of 135 MW each and three units of 600 MW each at Jharsuguda. All power plants are coal-based thermal power plants. The three 600 MW units were converted to captive power plants based on an order issued by the Odisha Electricity Regulatory Commission with effect from April 1, 2015. We have been sourcing coal through coal linkages from Coal India and its subsidiaries (primarily, Mahanadi Coalfields Limited and South Eastern Coalfields Limited among others). The balance of requirements are met from imports and
e-auctions
from Coal India Limited.The total volume of coal consumed annually by coal-fueled power plants is largely dependent on the amount of generation. During fiscal year 2022, total coal consumed by 135 x 9 MW and 600 x 3 MW power plants was 7.79 million tons and 8.51 million tons respectively.
We secured the Jamkhani coal block in the captive coal block auctions conducted by the Ministry of Coal, GoI. It will cater to power generation for Jharsuguda smelting operations. We have signed the Coal Mine Development and Production Agreement (“CMDPA”) with GoI and received Vesting Order for the coal block. The mine currently has a capacity of 2.6 mtpa. The production at this mine is expected to commence from July 2022. We expect it to improve our coal materialization performance for Jharsuguda.
The Company has secured the Radhikapur West coal block in tranche 11 of the coal block auction. The Company entered into the CMDPA with the GoI on January 11, 2021. This has a mine capacity of 6 mtpa. The production at this mine is expected to commence from September 2022.
During the year, the Company won the Kuraloi (A) North Coal Block during the first tranche of auction under the MMDR Act. Vedanta Limited entered into the CMDPA in respect of such coal block with the GoI on 3 September 2021. The mine has a capacity of 8 mtpa, which can additionally help us to meet the group’s coal requirements. The production at this mine is expected to commence from September 2023.
(iv) | Water |
Water is also an important input for our captive power plants. We source our water requirements at Jharsuguda from Hirakud Dam situated over a distance of 33 km, with the water transported by pipelines. Water from the dam is stored at water reservoir inside the plant, from where the water is purified in a demineralize plant to make it fit for use in the power plant.
(iv) | Carbon |
We have our
in-house
facilities to manufacture carbon anodes to meet our entire carbon anode requirements. Calcined petroleum coke, coal tar pitch and fuel oil are the key ingredients for the manufacture of carbon anodes. There is an adequate supply of these raw materials domestically as well as globally. Their prices are generally determined by movements in global prices and local regulations. Based on commercial advantages, we source from several suppliers in India and globally.(v) | Other Raw Materials |
We also use other raw materials such as fluorides and other chemicals. For these raw materials, there are several sources of supplies in the domestic and international markets, and we do not foresee any difficulty in securing supplies when needed.
| Ø | Distribution, Logistics and Transport |
The alumina purchased from third party suppliers is transported to the Jharsuguda facility by rail from ports. Our aluminium products are transported from the Jharsuguda facility to domestic customers through a combination of road and rail and shipped for export.
111
| Ø | Sales and Marketing |
Our 10 largest customers of Jharsuguda accounted for approximately 66.0%, 65.0% and 67% of Odisha aluminium business in fiscal years 2020, 2021 and 2022 respectively. One of our customers accounted for greater than 10% of aluminium business revenue in fiscal year 2022. Three of our customers in fiscal years 2021 accounted for greater than 25% and two of our customers in fiscal year 2020 accounted for greater than 10.0% of aluminium business revenue.
Currently, we sell only primary products and have equal focus on both the Indian and the exports market. Our key customers include cables and conductor manufacturers, transport sector and electrical equipment and machinery manufacturers. We follow an
LME-based
pricing and product-wise premiums for both our domestic and global customers. Our sales are currently on both spot and long term basis.Ø | Projects and Developments |
Initially in 2008, we planned to expand our alumina refining capacity at Lanjigarh to 6 mtpa and construct an associated 210 MW captive power plant. The expansion of the alumina refinery and related mining operations in and around the Niyamgiri was put on hold in October 20, 2010, when the MoEF&CC directed us to hold from further expansion.
On August 6, 2021, we received environmental clearance for 6 MTPA. See “” for details. As of March 31, 2022, we spent 51,903 million ($ 681 million) on the Lanjigarh expansion project (up to 6 mtpa) including other auxiliary assets. Total Project cost for refinery expansion upto 5 MTPA is estimated at 108,120 million ($ 1,425 million). On February 3, 2021, the expansion plan to increase the capacity of the Lanjigarh alumina refinery to 5 MTPA was approved by Vedanta Limited Board, subject to requisite Government approvals and further on May 13, 2021, the Board approved the estimated cost of 46,810 Million ($ 617 million). The completion of this expansion plan will place the Lanjigarh alumina refinery as one of the world’s largest single-location alumina refinery complex.
Item 8. Financial Information—A. Consolidated Statements and Other Financial Information – Legal Proceedings
₹
₹
₹
We had invested an estimated 150,380 million ($ 1,982 million) to set up 1,250,000 tpa aluminium smelter at Jharsuguda. As of March 31, 2022, we have already spent 230,265 million ($ 3,035 million) on this project.
₹
₹
112
Our Power Generation Business
Overview
We have been building and managing power plants since 1997. As of March 31, 2022, the total power generating capacity of our thermal power plants, wind power plants and
gas-based
plants was approximately 9,300 MW, which includes our seventeen thermal coal-based captive power plants (plant at Tuticorin is inactive) with a total power generation capacity of 5,685.5 MW. The following table sets forth information relating to our existing power plants as of March 31, 2022:Fiscal Year Commissioned | Capacity (MW) | Location | Fuel Used | |||||
1988 (1) | 270 | Korba | Thermal Coal | |||||
1997 | 24 | Tuticorin | Liquid fuel | |||||
1999 | 75 | Mettur Dam | Thermal Coal | |||||
2003 | 14.8 | Debari | Liquid fuel | |||||
2003 | 6 | Zawar | Liquid fuel | |||||
2003 | 14.8 | Chanderiya (2) | Liquid fuel | |||||
2003 | 4.8 | Cambay | Gas based | |||||
1999 and 2003 | 10 | Ravva | Gas based | |||||
2005 | 7.5 | Tuticorin | Liquid fuel | |||||
2010 | 15 | Pantnagar | Liquid fuel | |||||
2005 | 154 | Chanderiya | Thermal coal | |||||
2006 | 540 | Korba | Thermal coal | |||||
2008 | 75 | Lanjigarh | Thermal coal | |||||
2007 | 107.2 | Gujarat and Karnataka | Wind (3) | |||||
2007 | 30 | Amona | Gas based | |||||
2008 | 91.5 | Chanderiya | Thermal coal | |||||
2009 | 90 | Zawar | Thermal coal | |||||
2009 | 16 | Gujarat and Karnataka | Wind (3) | |||||
2009 | 675 | Jharsuguda | Thermal coal | |||||
2009 | 25 | Mettur Dam | Thermal coal | |||||
2019 | 2 | Rajasthan Raageshwari Gas terminal | Gas based | |||||
2010 | 540 | Jharsuguda | Thermal coal | |||||
2010 | 3.3 | Rajasthan Raageshwari Gas terminal | Gas based | |||||
2010 | 14.4 | Gujrat Viramgam Terminal | Gas based | |||||
2010 | 32.9 | Pipeline Above Ground Installations | Gas based | |||||
2011 | 1,200.00 | Jharsuguda | Thermal coal | |||||
2011 | 47.7 | Rajasthan and Karnataka | Wind (3) | |||||
2011 | 170 | Dariba | Thermal coal | |||||
2012 | 102.6 | Karnataka, Maharashtra, Rajasthan and Tamil Nadu | Wind (3) | |||||
2012 | 600 | Jharsuguda | Thermal coal | |||||
2012 | 30 | Amona | Gas based | |||||
2012, 2013 and 2014 | 120 | Bokaro | Thermal Coal | |||||
2013 | 600 | Jharsuguda | Thermal coal | |||||
2013 | 80 | Tuticorin | Thermal coal | |||||
2013 | 6.5 | Mettur Dam | Thermal coal | |||||
2014 | 80 | Tuticorin | Thermal coal | |||||
2010 and 2014 | 60 | Rajasthan Mangala Processing terminal | Gas Based | |||||
2015 | 39.9 | Gujrat Bhogat terminal | Gas Based | |||||
2015 | 660 | Mansa- Talwandi Sabo Road, Mansa, Punjab | Thermal coal | |||||
2016 | 660 | Mansa- Talwandi Sabo Road, Mansa, Punjab | Thermal coal | |||||
2016 | 1200 | Korba | Thermal coal | |||||
2017 | 660 | Mansa- Talwandi Sabo Road, Mansa, Punjab | Thermal coal | |||||
2017 | 12 | Debari | Solar | |||||
2017 | 4 | Dariba | Solar | |||||
2018 | 22 | Agucha | Solar | |||||
2020 | 0.766 | Chanderiya | Solar | |||||
2020 | 0.25 | Dariba | Solar | |||||
2020 | 0.072 | Debari | Solar | |||||
2020 | 0.15 | Zawar | Solar | |||||
2020 | 0.083 | Agucha | Solar | |||||
2021 | 37 | Rajasthan Raageshwari gas terminal | Gas based | |||||
2021 | 100 | Bhadrak, Orissa | Thermal Coal | |||||
Total | 9,331.22 | |||||||
Power generation plant at Tuticorin and Mettur is inactive
Note: At HZL, we also have 40.67 MW of power capacity through waste heat recovery from roasters and Steam Turbo Generator
| (1) | Commissioned prior to our acquisition of BALCO in 2001. The 270 MW power plant was transferred from power business to aluminium business on April 1, 2016. |
| (2) | Transferred from Debari to Chanderiya in March 2009. |
| (3) | Our wind power plants are not for captive use. |
ESL was acquired in 2018, however the commissioning date is pre acquisition date.
113
Power Sales volumes
The following table sets out total power sales volumes in MU for the last three fiscal years:
Facility | For Fiscal Year Ended March 31, | |||||||||||
2020 | 2021 | 2022 | ||||||||||
BALCO 300 MW (2) | 1,726 | 1,596 | 1,139 | |||||||||
Jharsuguda coal based independent thermal power plant (1) | 776 | 2,835 | 2,060 | |||||||||
HZL Wind Power Plant | 437 | 351 | 414 | |||||||||
TSPL | 8,223 | 6,479 | 8,259 | |||||||||
Total | 11,162 | 11,261 | 11,872 | |||||||||
| (1) | Three Jharsuguda 600 MW power plants were transferred from the power to aluminium business on April 1, 2015. |
| (2) | One of the 300 MW IPP unit at BALCO was converted to CPP as on April 1, 2017 vide order dated January 1, 2019. The figures reported for 2019 are for 600 MW IPP operations until order date. The figures reported for 2020, 2021 and 2022 are for 300 MW IPP operations. |
As the MALCO plant has been put under care and maintenance from May 26, 2017, therefore no production of power after May 26, 2017.
Commercial power plants
We have a 2,400 MW coal based thermal power plant facility (comprising four units of 600 MW each) in Jharsuguda in the state of Odisha. The power plant was earlier operated through Sterlite Energy and is now a part of Vedanta pursuant to the 82,000 million ($ 1,121 million). The first unit of commercial operation commenced on November 10, 2010. The second unit was operational on March 30, 2011, and the third unit was operational on August 19, 2011. The fourth unit commenced operation on April 26, 2012. On June 17, 2015, we filed a petition before Odisha Electricity Regulatory Commission (OERC) to convert 2,400 MW IPP into captive generating plant to cater the power needs of 1.25 mtpa smelter at Jharsuguda and consequently, the Odisha Electricity Regulatory Commission (OERC) issued an order dated January 27, 2016 of conversion of three units into captive generating plants with effect from April 1, 2015, while retaining the IPP status of one unit (Unit 2) to fulfill the obligations under the power purchase arrangements (PPA) with GRIDCO. As a result, three out of four 600 MW units were converted to captive generating plants. We had applied to the Ministry of Coal for allotment of coal blocks and long term coal linkages, which are long term supply contracts for delivery of coal to meet contract specific requirements for captive use. In January 2008, the Ministry of Coal jointly allocated the coal blocks in Rampia and Dip Side Rampia in the state of Odisha to six companies, including Sterlite Energy. The six companies entered into an agreement to jointly promote a new company called Rampia Coal Mine and Energy Private Limited (RCMEPL), which was incorporated in February 2008.
Re-organization
Transactions. The plant has been built with an estimated investment of approximately₹
The Company invested in RCMEPL, a joint venture incorporated in India that was set up for the purpose of developing coal blocks. The Company acquired 27.2 million equity shares of 1 each, representing 17.39% of the total equity shares. However, due to the cancellation of coal blocks by the Hon’ble Supreme Court, an impairment loss of 27.2 million was recognized in respect of such investment in FY 2015.
₹
₹
₹
IPPs in Odisha source coal from GoI’s coal mining companies and long-term coal supply agreements with various state government under PPAs and linkage auction coal. During fiscal year 2022, 1.7 million tons of coal was purchased from these sources towards Vedanta Limited’s Jharsuguda IPP as compared to 0.45 million tons and 2.34 million tons purchased during fiscal year 2020 and 2021 respectively.
The typical coal volume required for full scale operations of 600 MW IPP ranges between 2.5 million to 3.5 million tons. However, actual coal consumption is largely dependent on the amount of power generation.
Additionally, a coal linkage of 2.6 mmtpa is allotted to us to meet the coal requirements of 600 MW Unit#2 IPP, for which fuel supply agreement was entered with Mahanadi Coalfields Limited with an assurance of supplying up to 90.0% of the total quantity.
PPA with GRIDCO
In September 2006, Sterlite Energy entered into a PPA with GRIDCO, which was amended in August 2009 and further amended in December 2012, in which GRIDCO was granted the right to purchase up to 25.0% of the power sent out from the power plant after adjustments for auxiliary consumption by us. Further, if the coal block is allocated within the state, GRIDCO shall at all the time have right on behalf of the state government of Odisha to receive additional 7.0% of the power generated (after adjustments for auxiliary consumption by the power plant) from the Jharsuguda power project at variable cost, otherwise, if no coal block is allocated within the state, then additional 5.0% of the power generated (after adjustments for auxiliary consumption by the power plant) at variable cost. GRIDCO will have the right to purchase power from us for a period of 25 years from the date of commercial operation of the last unit i.e., April 26, 2012. The tariff for the PPA is revised once in every five years via the mandate of OERC.
114
Power to be purchased by GRIDCO is required to be evacuated by GRIDCO from the bus bar (which is the discharge point of power plant) of the project.
The tariff for the sale of power by us to GRIDCO will be determined by the OERC as follows:
For the sale of power up to 25.0%:
| (i) | a fixed capacity charge which shall be determined by the OERC as per the terms and conditions of tariff regulations issued from time to time and will be related to target availability. Recovery of fixed capacity charges below the level of target availability shall be done on a pro rata basis and calculated proportionately to the capacity requisitioned to by GRIDCO; and |
| (ii) | a variable energy charge, which shall comprise fuel cost. The energy charges shall be calculated as per the methodology prescribed by the OERC from time to time. |
For the sale of power for 7.0% or 5.0% depending on the allocation of coal blocks within the state of Odisha a variable energy charge is applicable, which shall comprise fuel cost and shall be calculated on the basis of the
ex-bus
energy scheduled to be sent out from the generating station. The energy charges shall be calculated as per the methodology prescribed by the OERC, from time to time.On June 12, 2013, the Orissa Electricity Regulatory Commission (OERC) pronounced a decision and working methodology on tariff determination in relation to the procurement of power by GRIDCO for the period from November 2010 to March 2014. Aggrieved by the order, Company filed a review petition before the OERC that was nevertheless disposed by the OERC on September 25, 2013. Aggrieved by the decision of OERC, Company filed an appeal on limited grounds with Appellate Tribunal for Electricity (APTEL) on October 28, 2013. The appeal on limited grounds was dismissed by APTEL on May 10, 2016 but directing the OERC to consider the post-merger debt equity related claim of Vedanta Limited on merits.
Additionally, GRIDCO filed an appeal against the OERC tariff order dated June 12, 2013, in APTEL on the transmission constraint issue. This appeal was dismissed by APTEL on May 10, 2016, as it upheld the decision on transmission constraints as passed in the original OERC order. Simultaneously, APTEL also dismissed our appeal filed on October 28, 2013, vide order dated May 10, 2016, while upholding the issue of transmission constraints.
The OERC through its order dated April 17, 2017, allowed that, for calculating plant availability factor achieved during the month (“PAFM”) of the IPP, the carrying capacity of the line at 400 MW in a sustainable mode should be taken into consideration. Accordingly, while calculating the PAFM of the installed capacity of
Unit-II
of IPP should be taken as 400 MW or actual injection whichever is higher. The aforesaid mechanism should be adopted for the period from November 2010 until the transmission line constrain was resolved. The said order confirmed the findings of transmission line constraint and provided for a mechanism for calculating PAFM and thus allowing Vedanta Limited to claim higher annual fixed charge.Aggrieved by the aforesaid order of OERC, GRIDCO filed an application to review the order. The hearings in review petition have been concluded and order has received on May 16, 2018, in which OERC dismissed the review petition of GRIDCO.
Further GRIDCO has gone for appeal before APTEL on July 27, 2018. On March 6, 2019, appeal has been admitted the pleading in the matter has been completed. We believe that we have a good case to defend. Our principal defense is based on the premises that the order sought to be challenged is principally only an order fixing the modalities for calculation of PAFM due to capacity constraint. The decision on capacity constraint’s existence has already achieved finality and any further challenge to it is barred by 4,480 million ($ 59 million) within one month from the date of Judgement to Vedanta Limited. GRIDCO has filed a civil appeal against order dated November 22, 2021, before the Hon’ble Supreme Court which is awaited to be listed.
res-judicata.
Arguments have been concluded in the matter. The APTEL vide Order dated November 22, 2021, has dismissed the appeal and has directed GRIDCO to pay₹
The entire amount payable by GRIDCO withheld beyond the due date shall accrue a late payment surcharge at the rate of 1.25% per month from the due date to the actual date of payment. The Company has not made any accruals towards the said amount in the books.
On September 12, 2016, GRIDCO raised a demand for payment towards Environment Management Fund (“EMF”) as per the data available to GRIDCO. The State Government notified the levy of a contribution towards EMF by Thermal Power Plant (“TPP”) at the rate of 6 paisa per unit of energy sold outside the state. The Company has challenged such notification on the ground that it has not been backed by any legislation and is a policy decision of the government that has no legal basis. GRIDCO has started recovering 30 million ($ 0.41 million) per month from December 2016 onwards towards arrears of EMF. To date, GRIDCO has kept 270 million ($ 4 million) on hold. The Company has made a provision in this respect. Further, in interim order dated November 7, 2017, the High Court of Odisha has granted the stay on payment of EMF levy.
₹
₹
115
OERC through its order dated February 26, 2018, has approved the claim of the Company in relation to the revised debt equity structure post its merger with Sesa Goa in 2013. The OERC in its order has allowed GRIDCO to pay the total amount in six half yearly instalments without interest from FY 2009-2014. The Company has filed review petition with OERC in May 2018, primarily on the limited issue of
non-grant
of interest to it. The OERC has disposed the matter vide order dated January 8,2021 by dismissing our review petition summarily on the ground thatex-facie
there are no grounds of review in the present matter and disallowing our claim of carrying cost for tariff period2010-14.
Subsequently, we have filed an appeal against the order dated January 8, 2021, and order dated February 26, 2018, before the APTEL. The listing of the matter is awaited. The Company, based on legal advice, firmly believes that its right to interest (time value of money) is protected under the Electricity laws and OERC has erred in allowing interest-free payment to GRIDCO.The Company also filed Multi Year Tariff (“MYT”) petition for fixation of tariff for the period starting fiscal year 2015 to fiscal year 2019. The hearing on the matter has concluded and the order has been issued by OERC on June 29, 2018. The tariff has been approved as per the CERC Tariff Regulation, 2014-2019 till October 9, 2014, and beyond this period based on OERC Tariff Regulation, 2014. The order does not have any significant impact on the basis of revenue recognition in the books except while allowing interest on working capital one month receivable has been considered instead of two months allowed as per PPA. We have file reviewed petition on limited issue of interest on working capital and rate of interest. OERC vide order dated November 3, 2021, disposed of the review petition and rejected our plea.
GRIDCO Power purchase agreement amendment matter (Short supply issue) See “” for details.
Item 8. Financial Information - A. Consolidated Statements and Other Financial Information – Legal Proceedings
We were not able to supply power to GRIDCO up to December 2019 due to
non-supply
of linkage coal from Mahanadi Coalfields Limited (“MCL”) despite the continuousfollow-up
from GRIDCO and the Company. However, effective January 2020, we have recommenced power supply to GRIDCO consequent to the resumption of linkage coal supply from MCL.One customer of our Odisha power business accounted for 100.0% of Odisha power business in fiscal years 2020, 2021 and 2022.
Talwandi Sabo
In July 2008, Sterlite Energy succeeded in an international bidding process and was awarded the project for the construction of a 1980 MW coal-based thermal commercial power plant at Talwandi Sabo in the state of Punjab in India. The project was bid as 115,460 million ($1,521 million). The boiler light up and synchronization of the first unit was achieved in fiscal year 2014, and coal logistics were established in fiscal year 2014.
Case-2
tariff based competitive bidding implying that the developer had to quote for capacity charges and efficiency. Fuel costs subject to quoted efficiency was to be pass-through. All necessary approvals for the project have been obtained and commissioning of this project was carried out in stages. The estimated cost of the project was ₹
The first and second 660 MW units of the Talwandi Sabo power plant were capitalized in fiscal years 2015 and 2016 respectively. The third 660 MW unit was capitalized on September 1, 2016, after successful completion of trial runs.
In May 2008, Sterlite Energy entered into an 66,560 million ($ 877 million). A novation agreement in favor of TSPL was executed in November 2009. The contract was revised upwards by $74 million on November 15, 2012, to reflect the
on-shore
and offshore engineering, procurement and construction contract with SEPCO Electric Power Construction Corporation (“SEPCO”), for Sterlite Energy’s Talwandi Sabo thermal power project for ₹
set-up
and commissioning of three units of power at the Talwandi Sabo thermal power plant.SEPCO’s obligations under the contract include testing and delivery of plant and equipment, system design and engineering of plant and equipment in accordance with technical specifications, supervision of civil, structure and manufacturing work, custom clearance, port clearance, inland transportation of offshore as well as onshore plant and equipment, unloading, storage and preservation for all equipment and material required, ash disposal among others within the period specified in the contracts. The fixed contract price is payable in multiple installments according to a fixed payment schedule. SEPCO has provided performance guarantees with respect to various parameters, for instance, net unit heat rate of 2,222.80 kwph/kcal and net unit electric output of 611.82 MW. On February 3, 2016, TSPL terminated the SEPCO EPC contract, due to delays in setting up the project, and for certain defects and deviations not being resolved in a timely manner. However, on April 16, 2016, the parties reached an agreement for the settlement of the EPC contract issues. The revised value of the contract stands at $ 1,041.8 million for offshore supply and service, and 21,371 million for onshore supply and service.
₹
116
After commencing all units, TSPL requires around 10 million tpa of coal. TSPL has been allotted the linkages from Mahanadi Coal Fields Limited, Odisha for 7.72 million tpa. According to the fuel supply agreement with Mahanadi Coal Fields, 95.0% allocated coal quantity is 7.334 million tpa, which is to be supplied through domestic sources and the remaining 0.386 million tpa is supplied through imported sources. The linkage coal quantity will be transported from a distance of approximately 1,600 km by rail.
TSPL sources coal from sources such as the GoI’s coal mining companies and imports. In fiscal year 2022, the total coal purchased from these sources was 5.77 million metric tons.
The total volume of coal consumed annually by our coal-fueled power plants is largely dependent on the amount of generation and ranges between 6.99 million to 8.16 million metric tons for plant load factor (“PLF”) ranging from 60.0% to 70.0%.
In TSPL, there is only one customer which accounted for 100.0% of TSPL power business in fiscal years 2020, 2021 and 2022.
There are some dispute with customers which are subjudice.
See “Item 8. Financial Information - A. Consolidated Statements and Other Financial Information – Legal Proceedings
| Ø | BALCO |
BALCO’s power business includes only one unit of 300 MW power plant at BALCO’s Korba facility. The 270 MW power plant was transferred from power business to aluminium business on April 1,2016 and is no longer operational. BALCO had constructed an IPP 600 MW coal-based thermal power facility in the state of Chhattisgarh which had received approval to operate on January 14, 2015, from the regulatory authorities. One unit of 300 MW was commissioned during fiscal year 2016, and the second unit was commissioned in March 2016 and commenced commercial production on May 1, 2016. One unit of 300 MW has been converted from IPP to CPP from April 1,2017 vide order dated January 1, 2019.
Ø | HZL – Wind Power Plants |
As of March 31, 2022, wind power plants have the combined power generation capacity of 273.5 MW which was commissioned in earlier fiscal years in the States of Gujarat, Karnataka, Tamil Nadu, Maharashtra and Rajasthan in India at a total cost of 14,540 million. The electricity from these wind power plants is sold to State Electricity Boards.
₹
| Ø | MALCO Energy Limited – Mettur Power Plant |
Mettur power plant is a 106.5 MW coal based thermal power plant operated by MALCO Energy Limited in the state of Tamil Nadu.
The plant has been set up in stages, with the first 75 MW set up in the year 1999 to cater to the requirements of the aluminium smelter operated by MALCO. The aluminium operations were closed since November 2008. An additional 25 MW unit was added in 2009. Further, 6.50 MW steam turbine generator was added in 2013, increasing the total capacity to 106.5 MW.
MALCO entered into an energy purchase agreement with Tamil Nadu Electricity Board in January 2009 for the supply of power until April 2009 and entered into an agreement with Power Trading Corporation Limited for the supply of power to Tamil Nadu Electricity Board from April 2009 until May 2011, which was subsequently
re-entered
with Tamil Nadu Electricity Board from June 2011 until May 31, 2016. MALCO had entered into an agreement with NTPC Vidyut Vyapar Nigam Limited for supply of power (66.3 MW) to Telangana State Southern Power Distribution Company Limited from June 2016 to May 2017. The tariff for power supply is same as provided in the energy purchase agreement. Currently, MALCO does not have any energy purchase agreement for the supply of power. Due to prevailing business conditions, MALCO plant has been put under care and maintenance from May 26, 2017.MALCO used to source its entire coal through imports (from various countries including Indonesia, Russia and South Africa). The total volume of coal consumed annually by our coal-fueled power plants is largely dependent on the amount of generation and ranges between 0.5 million to 0.55 million tons at 100.0% PLF.
In fiscal year 2022, no coal was purchased from these sources.
No revenue was earned in MALCO from the power business during the fiscal years 2020, 2021 and 2022 since the plant is under care and maintenance.
Our Steel Business
Overview
ESL’s manufacturing facility is a greenfield integrated steel plant located near Bokaro, Jharkhand, India, which has a current capacity of 1.5 mtpa and the potential to increase to 2.5 mtpa. It primarily consists of one sinter plant, a vertical coke oven plant, two blast furnaces, an oxygen plant, a lime calcination plant, a steel melting shop, a wire rod mill, a bar mill, a captive power plant and a DI pipe plant. One blast furnace and horizontal coke oven is under commissioning. ESL is selling primarily TMT bars, wire rods, DI pipes, Pig iron and steel billets in open market and has established its presence in the domestic market.
117
Principal Products
– TMT Bars
TMT Bars are thermo mechanically treated steel bars which are produced by controlled quenching and self-tempering process. ESL TMT bars are produced in Fe500, Fe500D and Fe500D CRS variety as per IS 1786/2008 grade. We sell our TMT Bars primarily to construction industry.
– Wire rod
Steel wire rod is rolled from steel billet in a wire rod mill and is used primarily for the manufacture of wire. The steel for wire rod is produced by all the modern steelmaking processes, including the basic oxygen and electric furnace processes. Steel wire rod is usually cold drawn into wire suitable for further processing such as cold rolling, cold heading, cold upsetting, cold extrusion, cold forging or hot forging. We sell our wire rod primarily to automobile and white goods industries.
– DI pipe
DI pipe is a pipe made of ductile cast iron commonly used for potable water transmission and distribution. The ductile iron used to manufacture the pipe is characterized by the spheroidal or nodular nature of the graphite within the iron. Protective internal linings and external coatings are often applied to DI pipes to inhibit corrosion, the standard internal lining is cement mortar and standard external coatings include bonded zinc, asphalt or water-based paint. Our DI pipe is primarily used in sanitation, sewerage and irrigation.
– Pig iron
Pig iron is an intermediate product of the iron industry, also known as crude iron, which is first obtained from a smelting furnace in the form of oblong blocks. Pig iron has a very high carbon content, typically ranging from 3.8% to 4.7%, along with silica and other constituents of dross, which makes it very brittle and not useful directly as a material except for limited applications. Pig iron is made by smelting iron ore into a transportable ingot of impure high carbon-content iron in a blast furnace as an ingredient for further processing steps. Pig iron is further processed and is used in steel plants.
– Steel Billet
A billet is a length of metal that has a round or square cross-section. Billets are created directly via continuous casting or extrusion or indirectly via hot rolling an ingot or bloom. Billets are further processed via profile rolling and drawing. Final products include TMT and wire rod.
By Product
Granulated slag
Granulated blast-furnace slag is obtained by quenching molten iron slag from a blast furnace in water or steam, to produce a glassy, granular product that is then dried and grounded into a fine powder. Granulated slag is used in the production of quality-improved slag cement by cement industry.
Principal Facilities
The following map shows details of the locations of ESL’s facilities in the State of Jharkhand:
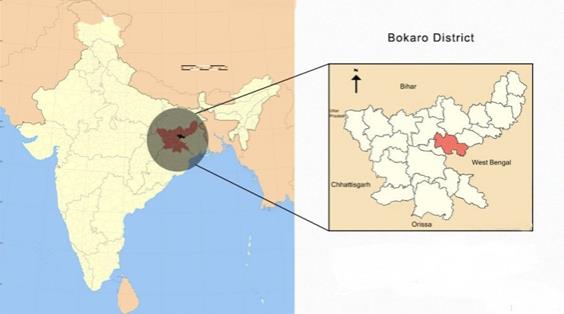
118
| • | Coke oven |
Coke is prepared from coking coal or bituminous coal by heating it strongly in the absence of air. As a result, the volatile matter and moisture escapes out. The resulting coke is a hard, strong, porous and coherent mass. Coke plant is often described as a process of destructive distillation since it involves the separation of volatile matter based on the difference of boiling point. For the purpose of coking, two coke ovens have been designed, i.e. vertical coke oven of 0.5 mtpa and horizontal coke oven of 0.5 mtpa. Currently only vertical coke oven has been commissioned. It is of
non-recovery/waste-heat
recovery type i.e. heat is recovered from the flue gases for power generation in the captive power plant.Coke is preferred to coal in the blast furnace operation because it is stronger and can take the burden of blast furnace charge, it creates a permeable bed for the flow of hot gases and molten metal, and it acts a better source of heat and reducing agent. The vertical coke oven has 4 batteries having 35 ovens each. The annual capacity of coke oven is 0.5 mtpa.
| • | Sinter plant |
Sintering is agglomeration of iron ore fine particles (ranging from 0mm to 8mm) along with flux fine particles at high temperature (ranging from 1200° C to 1300°C) using coke fine particles as solid fuel to raise the temperature. During agglomeration at high temperature all constituent materials fuse together and become a porous heterogeneous solid mass (lump) called Sinter. The formation of such lumps is caused by an incipient fusion of ore particles at the contact surface which binds together and formation of diffusion bond through recrystallization and crystal growth of hematite and magnetite which keeps the particles together without melting. There are two sets of 105 square meter sintering machines with annual output of 2.25 mt of sinter. Sinter produced is transferred to blast furnace for hot metal production.
| • | Blast furnace |
The blast furnace is a furnace lined with refractory brick, where iron ore, coke and fluxes are alternately charged and hot blast at 1000°C to 1200°C is blown into the furnace to chemically reduce iron oxides into liquid iron called hot metal. The end products are usually molten metal and slag phases tapped from the bottom, and flue gases exiting from the top of the furnace. We have three blast furnaces (two operational) for production of hot metal, namely
BF-2
having furnace size of 1050 cubic meter,BF-3
having furnace size of 350 cubic meter andBF-1
having furnace size of 1,050 cubic meter (semi-constructed). We are producing at the run rate of 1.5 mt of hot metal annually.| • | Steel melting shop |
Steel is an alloy of iron and carbon. Carbon percentage in steel is less than 2.0%. The molten hot metal coming from the blast furnace is oxidized in the basic oxygen furnace. The scrap is charged into the furnace first since it may contain moisture. Then the molten metal from the blast furnace is added. Fluxes like limestone and dolomite are also added. The oxygen is blown from top and the resulting hot metal after removal of slag is taken to argon rinsing station where ferro-alloys and aluminium are added to adjust the chemistry and to remove oxygen respectively. The molten metal is sent to ladle refining furnace if required in order to produce different grades of steel. The steel from ladle is taken to ladle turret and poured onto the tundish. Tundish pours the molten metal onto the mould and cast into steel billet.
| • | Rolling mills |
There are two types of rolling mills, i.e., bar mill and wire rod mill. ESL’s bar mill is a continuous mill with horizontal-vertical combination. Bar mill is having annual production capacity of 0.7 mtpa. In our bar mill, slit rolling process is adopted for 10mm, 12mm and 16mm of TMT bars. The designed maximum finishing rolling speed is 18 m/s. The mill is designed to make TMT bars of size ranging from 10mm to 40mm but TMT bars of diameter 8mm are also being made using the 125x125mm steel billets. TMT bar mill has 18 number of stands having horizontal vertical combination.
ESL’s wire rod mill is a tandem rolling mill with stands in horizontal-vertical combination. Wire rod mill has annual production capacity of 0.5 mtpa. The designed maximum rolling speed is 110m/s. The mill is designed to make wire rods of size ranging from 5.5mm to 16mm using the 150x150x12000 mm steel billets. The billets after being
de-scaled
are sent to mills via output roller table. Our wire rod mill has 30 stands having horizontal vertical combination.| • | DI pipe plant |
The molten metal is taken from blast furnace and stocked in mixer. From the mixer the liquid metal is taken by ladle and transferred to induction furnace where the composition of the liquid metal is corrected to desired level. The composition depends upon the size and thickness of the ductile pipe to be made. After attaining the metal composition, the temperature is risen to a desired level based on the type of pipe to be made. From induction furnace the molten metal is transferred to magnesium-converter which enhance the ductility of iron. Then it is fed to centrifugal casting machine. After the pipe is cast, it is soon transferred to annealing furnace for stress relieving. As soon as the pipes come out of annealing furnace, it is fed in zinc coating machine for zinc coating. After zinc coating it is passed for hydro-testing for checking the leakage of water from cast and annealed pipe. The tested pipes are checked surface wise and cleared for cement mortal lining, thereafter, passed for bitumen or epoxy coating and finally dispatched after 12 hours of curing.
119
| • | Power plant |
ESL has its own captive thermal power plant of 80 MW capacity of current capacity, expandable to 120 MW. Captive power plant has three centralized fluorised bed commercial boiler of coal based and two steam turbo generator of 60 MW each. We also have two waste heat recovery boilers of 75 tons each which is fired by coke oven flue gases. The power requirement is met partially by captive power plant and remaining is purchased through grid.
Production volumes
The following table sets out ESL’s total production from Bokaro facility for fiscal years ended March 31, 2020, 2021 and 2022:
SI. No. | Product | 2020 (tons) | 2021 (tons) | 2022 (tons) | ||||||||||
| 1 | TMT | 468,396 | 337,583 | 398,579 | ||||||||||
| 2 | Wire rod | 412,948 | 360,874 | 420,509 | ||||||||||
| 3 | DI pipe | 154,721 | 134,605 | 163,882 | ||||||||||
| 4 | Pig iron | 167,305 | 188,979 | 185,855 | ||||||||||
| 5 | Steel billet | 27,456 | 165,273 | 91,344 | ||||||||||
Total | 1,230,826 | 1,187,314 | 1,260,169 | |||||||||||
Principal Raw Materials
The principal inputs of ESL’s operations are iron ore and coking coal. In the past ESL has been able to secure an adequate supply of the principal inputs for its business.
–
Iron
ore
Iron ore is sourced from merchant mines in Odisha and Jharkhand and is transported by railway and road. ESL has also bought 2 captive mines in Barbil region, Odisha which will provide iron ore security from long term point of view. Iron Ore is also bought from Karnataka basis cost benefit analysis.
– Coking Coal
Our metallurgical coke requirements are met by captive metallurgical coke plant and the principal raw materials for the manufacture of metallurgical coke are hard-high fluidity coals, prime hard, semi-hard and pulverized coal injection coking coals. These raw materials are imported from various international suppliers primarily from Australia, US, Russia, Indonesia etc. The availability is subject to seasonal supply constraints on specific mines and grades. The prices are subject to volatile index movements of international coking coal prices.
Distribution, Logistics and Transport
Raw material mainly coking coal and pulverized coal injection are imported by vessel and then transported through rail/road from Indian port to plant. Domestic raw materials which is mainly iron ore is transported through rail and road. Finished and semi-finished goods are transported by road only.
Sales and Marketing
The 10 largest customers of our steel business accounted for approximately 29.74% 30.37% and 34.6% of our steel business revenue in fiscal years 2022, 2021 and 2020 respectively. None of our customers accounted for greater than 10.0% of steel business revenue in fiscal years 2022, 2021 and 2020.
The 10 largest customers are mainly from construction and original equipment manufacturing industry and are spread across India. We have marketing offices in Kolkata, West Bengal, as well as two sales offices in Delhi and Mumbai, along with regional managers for sales in four regions across India. In fiscal years 2022, 2021, and 2020 the export sale accounted for 9%, 8% and 0.4% respectively. Currently, sales is majorly focused on domestic market and the decision to export is taken where prices are lucrative. Pricing is fixed as per the domestic market trend and is at par with major producer’s month on month. We supply on
order-to-order
basis, with delivery schedule defined in purchase orders.Market Share and Competition
The total crude steel production of all producers of crude steel in India for fiscal year 2022 stood at 120 million ton (“MT”). The share of Steel Authority of India Limited, Rashtriya Ispat Nigam Limited, Tata Steel Limited, Arcelor Mittal, JSW Steel Limited, Jindal Steel and Power Limited together was 65.5% of the total production of crude steel for fiscal year 2022 i.e. 78.592 MT. Vedanta Limited’s total production of hot metal in fiscal year 2022 stood at 1.355 MT.
120
Port Business
We have a 100.0% interest in Vizag General Cargo Berth Private Limited (“VGCB”) as of March 31, 2022, a consortium between Vedanta Limited and Leighton which won the bid to mechanise the coal handling facilities and upgrade the general cargo berth for handling coal at the outer harbour of Vishakhapatnam port, on the east coast of India.
The capacity of the upgraded berth is 10.18 mtpa. VGCB had entered into an agreement on June 10, 2010, with the port authority, Vishakhapatnam Port Trust, to mechanise the coal handling facilities and upgrade the general cargo berth on a design-build-finance-operate-transfer basis for 30 years commencing on the date of award of concession. Vishakhapatnam Port Trust receives a royalty of 38.1% of the gross revenue as per TAMP tariff from the cargo handling activities as set out in the concession agreement.
Construction was completed on April 8, 2013, and commercial operations started in same year. The project cost was approximately 6,228 million (approximately $96 million). As of March 31, 2022, the total cost (Gross block) was 6,831.67 million ($90.04 million) including interest capitalisations.
₹
During the fiscal year 2022 VGCB had handled a volume of 6.48 million tons i.e., 49% higher volumes compared to fiscal year 2021. The EBITDA for VGCB for fiscal year 2022 is 446 million ($5.88 million).
₹
Sterlite Ports Limited, a 100.0% subsidiary of Vedanta Limited has received an award of letter dated March 31, 2016, for redevelopment of berths 8, 9, barge berths and mechanical ore handling plant at the Port of Mormugao, Goa on a design-build-finance-operate-transfer basis for 19 mmtpa capacity multi-cargo port terminal. A special purpose company, “Goa Sea Port Private Limited” was incorporated on July 5, 2016, as a wholly owned subsidiary of Sterlite Ports Limited. Goa Sea Port Private Limited entered into an agreement on September 22, 2016, with the Mormugao Port Trust, to operate the berth on a build-finance-operate transfer basis for 30 years commencing on the date of award of concession.
On February 15, 2020, Goa Sea Port Private Limited received a letter from the Mormugao Port Trust terminating the MPT Concession Agreement (the “Termination Letter”) on the basis that both Goa Sea Port Private Limited and the Mormugao Port Trust had not fulfilled the conditions precedent required of them under the MPT Concession Agreement. Under the MPT Concession Agreement, the Mormugao Port Trust was required to obtain the relevant environmental clearance approvals for the project along with the handover of the project site whilst Goa Sea Port Private Limited was required to, inter alia, provide the relevant financing arrangements including a performance bank guarantee in respect of the project. As a result of a delay in obtaining the environmental clearance approvals, the Mormugao Port Trust was not able to hand over the project site to Goa Sea Port Private Limited. In turn, Goa Sea Port Private Limited was not able to fulfil its certain financing arrangement responsibilities as the project site was not handed over to it. Pursuant to the Termination Letter, the Mormugao Port Trust had offered to return the performance bank guarantee to Goa Sea Port Private Limited unconditionally and to also allow Goa Sea Port Private Limited to participate in future public-private partnership projects with respect to the development or redevelopment the Port of Mormugao. At this juncture Company has accepted the termination of concession agreement.
Glass substrate business
On December 28, 2017, the Group acquired 51.63% equity stake in AvanStrate Inc. (“ASI”) for a cash consideration of 1 million ($ 0.01 million) and acquired debts for 9,832 million ($ 130 million). Additionally, a loan of 469 million ($ 6 million) was extended to ASI. ASI is involved in the manufacturing of glass substrate. The financial results of ASI for the fiscal year 2022 have been included in the consolidated financial statements of the Group.
₹
₹
₹
As per the shareholding agreement entered with the other major shareholder holding 46.6% in ASI, the Group has call option, conversion option to convert part of its debt given to ASI into equity of ASI as well as it has issued put option to the other majority shareholder. These are exercisable as per the terms mentioned in the shareholding agreement.
The fair values and business combination has been accounted for on a provisional basis under IFRS 3, as it relates to property, plant and equipment and other intangible assets, and the resultant bargain gain of 335 million ($ 4 million) has been recognized in the consolidated statements of profit or loss.
₹
Significant recovery in Panel and Glass Industry and successful start of new business during the last one year has led to increase in demand and profitability in the glass substrate business. Accordingly, the Group has assessed the recoverable value of all its assets and liabilities which do not require to record any impairment charge during the year ended March 31, 2022.
ASI is one of the 4 manufacturers globally specializing in LCD glass substrates for LCD Panels. These glass substrate sheets are the main inputs in LCD Panels used in TV’s, computers, mobile phone screens and other display devices.
Ferro Alloys business
Overview
FACOR has Charge Chrome Plant (CCP) which was established in 1983 and is one of the India’s largest producers and exporters of Ferro Alloys, an essential ingredient for production of steel and stainless steel.
121
FACOR has the capacity to produce 80,000 TPA of Charge Chrome / Ferro Chrome along with a 100 MW power plant in Bhadrak, Orissa. It has also established a mining complex at Jajpur and Dhenkanal districts in Orissa for the mining of Chrome Ore having annual capacity of 250,000 TPA.
– Mining division
Sukinda Chromite valley has 93% of total resources in India and currently 100% ore production of India is coming from this Sukinda valley. Ferro Alloys Corporation Ltd. (FACOR) contributes 8% of Indian chrome ore production. Chromite deposit in Sukinda Valley is the richest deposit in India covering about 40 square kilometers was discovered in Jajpur District. FACOR has 2 open pit running mines and 1 underground mines in the Odisha state.
The Ostapal Chromite Mines and Kalarangiatta Chromite Mines are spread over an area of 72.84 Hectares and 23.80 Hectares respectively, over the Sukinda Valley in the Jajpur District of Odisha and both are currently in operation. The Kathpal Chromite Mines, FACOR is spread over an area of 113.31 Hectares in the Dhenkanal District of Odisha. This mine is currently not in operation. The company requires to mine out chromite to feed its Charge Chrome Plant, at Randia, District- Bhadrak, Odisha to produce better quality of Ferro Chrome/Charge Chrome.
– Charge Chrome Plant (CCP)
High Carbon Ferrochrome / Charge Chrome are produced in Submerged Electric Arc Furnace of rating 45 MVA. Furnace is of stationary and semi-closed top. The process adopted is high temperature smelting process, in which chrome ore is reduced with the help of the reductant like coke. The gangue material in the ore is removed by suitable fluxing material. The raw materials like chrome ore, coke and fluxes are selected to obtain desired grade in the output as per the requirement of the customer. All the incoming raw materials are analyzed for quality before feeding into the furnace.
The charge mix containing chrome, coke and flux is taken into the furnace with the help of computerized batching system. The necessary heat required for a process is provided by electric energy to the charge through the electrodes. At the tip of the electrode electric arcing taken place and generates high heat energy to smelt chrome ore into HC Fe Cr/ Charge Chrome with coke (carbon) as reducing agent. In the process of smelting, gangue content in chrome ore forms the slag whose composition and fluidity are maintained by flux addition. Both hot metal and slag are tapped at regular intervals depending upon the power consumption. The slag is granulated. The metal is handled through decantation process and skimming process before cast in the metal casting beds prepared with slag dust and plastic clay. The metal after cooling is handled manually into different size fractions as per the requirement of the customer. This is a continuous process in which charge mix is taken regularly and slag and metal taped at regular intervals. Stage wise inspection is carried out to get the quality product.
Principal Products
High Carbon Ferrochrome
– Specifications
Carbon: 7 -8.5%, Chromium: 57 -63%, Silicon: 4% max, Sulfur: 0.050% max, Phosphorous: 0.040% max and Iron.
Application areas
Ferro Chrome used for making Stainless steel, carbon steel, ball-bearing steels, tool steels as well as other alloy steels.
Agglomeration – Briquetting Process
Chrome ore friable and fines cannot be used directly in the smelting furnace for the reasons of safety and bad performances. Friable fines and chrome ore concentrates are therefore briquetted and used along with friable lump for the production. To make the briquette sufficiently hard, the chrome ore fines are dried for removal of moisture. The dried fine is mixed thoroughly with certain quantity (~2%) of hydrated lime powder and molasses (~5-6%) in the mixer muller and fed to the briquetting press. Briquetting segments are used in press. The screened briquettes are allowed to cure for about 7 days in the storage yard.
There are four dryers installed with 3 of 20 MT per hour and the other with 10 MT per hour drying capacity. There are two briquetting presses available each with 20 MT per hour briquetting capacity.
Metal Recovery Plant (MRP)
The slag skulls and slag metal mixture generated in the handling yard is fed into the ground hopper of Metal Recovery Plant. It is discharged on the belt conveyor by a feeder and is conveyed to screen (6 and 20mm aperture). After screening the +20mm fraction is fed to crusher for further breaking below 20mm size and is again screened and the process of recirculation after screening is continued along with new fed slag and mixture. The -20mm fraction is jigged to get the 0-4mm hatch metal and 4-10mm and +10mm as jigged metal. Middling after processing slag at MRP will be recycled in the furnace as remelt. The slag handling capacity of the Metal recovery plant is 30 MT per hour with 20% of metallics in it.
122
Power Plant
The electricity requirements of our Charge Chrome plant at Bhadrak are primarily met by the on-site captive 100MW power plant. Major Equipment for this Plant has been sourced from a range of established manufacturers including Bharat Heavy Electricals Limited, Thyssenkrupp Industries India, ABB Limited and Thermax Limited, all well-known suppliers in the thermal power industry. Pneumatic ash conveying supplied by M/s Mecaber Beekay. FPL having 3 nos of boiler and two nos turbo generator connected with common steam distribution header One boiler capacity is 155 TPH with steam quality 100 kg/cm2 and temp. is 540 degree centigrade, First unit boiler-1 and TG-1 commissioned on date 8.07.2011 with coal handling plant, CHP capacity is 200 TPH, FPL have railway siding as well as wagon tippling unit, water is sourced from Salandi river having intake well adjacent to river, also having two nos reservoir, pretreatment unit ,demineralization unit to supply make up water to boiler which make is M/s Thermax, FPL have effluent water treatment plant as zero discharge scheme as required by SPCB.As turbine is water cooled condenser Cooling tower supplied by M/S Paharpur of 7 cells is available
Principal Facilities
The following map shows details of the locations of FACOR’s facilities in the State of Odisha.
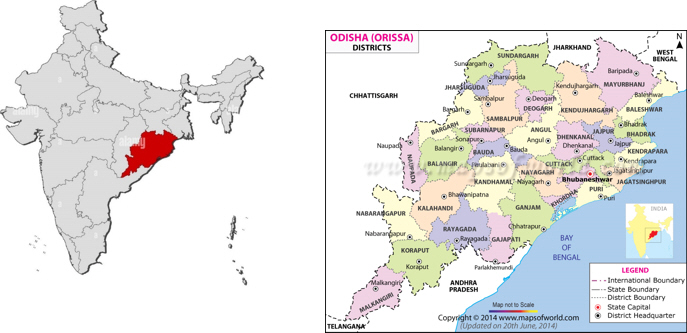
Production Volume
The following table sets out FACOR’s total production for fiscal years ended March 31, 2021, and 2022:
Particulars | 2021 | 2022 | ||||||
ROM Production (MT) | 147,437 | 2,49,901 | ||||||
HCFC Production (MT) | 68,331 | 75,301 | ||||||
Power Generation (MU) | 274 | 294 | ||||||
HCFC Sales (MT) | 70,863 | 76,865 | ||||||
Principal Raw Materials
The principal inputs of Ferro Chrome business are Chrome Ore, Reductant, power, fuel, Molasse and Hydrate lime etc. Other inputs include Anthracite coal, coke fines, Quartz and Magnesite etc.
Chrome Ore
Supplement of Chromium in the form of its oxide, Cr2O3. Available in Fines, Friable and Lump forms. Ore is sourced from Own captive mines and the same is transported by Road to our Charge Chrome plant.
123
Reductant
It is the source of Carbon to reduce the chromium oxide and the suitable materials are metallurgical coke, anthracite coal and etc.
Flux
It is used to control the composition of the slag, ensures to join the gangue contents in the chromite
Distribution, Logistics and Transport
Raw material mainly Ore, coal and Coke are transported through rail/road from Mines and other locations to plant. Finished and semi-finished goods are transported by road only.
Sales and Marketing
During the FY2022, we were able to export 42% (incl 27% deemed export) of our Ferrochrome production whilst our domestic sales figures contributed to 58%. We are occasionally seen as price benchmark for the Indian FeCr market. The total sales figures of High Carbon Ferrochrome accounted for 76,865 T while Chrome Ore sales figures were highly decent (first ever sale of Chrome ore, sold 23604 T in FY2022). Apart from that, we sold our by-product, Slag material (for FY2022 – 213,487 T).
Our main product which we offer is premium quality High Carbon Ferro Chrome along with chrome ore, having consistent supplies, timely deliveries, best in class Service and Quality Assurance.
Projects and Development
Mining division is planned for expansion from 250 Kt to 390 Kt in FY 23. Also, 33 MVA SAF project is underway for capacity enhancement.
33 MVA Project comprises of:
| – | 33 MVA Semi-closed Submerged Arc Furnace (“SAF”) |
| – | GCP and Raw material/Finished product storage and handling facilities |
| – | Extension of MRSS |
| – | Electrics/Instrumentation/Automation/Communication and FDA System |
| – | Plant Water system |
| – | Utility System (Dust extraction/ACVS/Compressed Air/Fire Fighting System) |
| – | 20 TPH Briquetting Plant |
There is plan for Relining of existing furnace 45MVA along with new COB plant commissioning for enhanced capacity of 50TPH.
Exploration and Development Activities
We are engaged in ongoing exploration and development activities to locate additional ore bodies in India, Australia, South Africa, Namibia and Ireland. We spent approximately 18,313 million ($ 241 million) in fiscal year 2022 on exploration and development.
₹
The focus of our exploration has been sediment hosted zinc deposits in India and oil and gas exploration in India and South Africa.
Call Options over Shares
1. | Call Options Over Shares in HZL |
On April 11, 2002, we acquired a 26.0% interest in HZL from the GoI through our subsidiary, SOVL (which merged with us with effect from April 1, 2012). At the time of the acquisition, we owned 80.0% and Sterlite Technologies Limited owned the remaining 20.0% in SOVL. In February 2003, Sterlite Technologies Limited transferred its 20.0% interest to us. We subsequently acquired a further 20.0% interest in HZL through an open market offer. The total cash consideration paid by us for the acquisition of the 46.0% interest in HZL was 7,776 million ($ 112 million at the time of acquisition). Upon our acquisition of the 26.0% interest in HZL, we and the GoI entered into a shareholders’ agreement to regulate, among other things, the management of HZL and dealings in HZL’s shares.
₹
124
Under the shareholders’ agreement, the GoI granted us two call options to acquire all the shares in HZL held by the GoI at the time of exercise. We exercised the first call option on August 29, 2003 and acquired an additional 18.9% of HZL’s issued share capital at a cost of 3,239 million ($ 44 million) on November 12, 2003, increasing our interest in HZL to 64.9%.
₹
The shareholders’ agreement provides that prior to selling shares in HZL to a third party, either party must first issue a sale notice offering those shares to the other party at the price it intends to sell them to the third party. However, a transfer of shares, representing not more than 5.0% of the equity share capital of HZL, by the GoI to the employees of HZL is not subject to such right of first refusal by us. The GoI has transferred shares representing 1.5% of HZL’s share capital to the employees of HZL. The shareholders’ agreement also provides that if the GoI proposes to make a sale of its shares in HZL by a public offer prior to the exercise of our second call option, then we shall have no right of first refusal.
The second call option provides us a right to acquire the GoI’s remaining 29.54% shareholding in HZL, subject to the right of the GoI to transfer up to 3.5% of the issued share capital of HZL to employees of HZL, in which case the number of shares that we may purchase under the second call option will be reduced accordingly. This call option became exercisable on April 11, 2007 and remains exercisable for as long as the GoI has not sold its remaining interest pursuant to a public offer of its shares. Under the shareholders’ agreement, upon the issuance of a notice of exercise of the second call option by us to the GoI, we shall be under an obligation to complete the purchase of the shares, if any, then held by the GoI, within a period of 60 days from the date of such notice. The exercise price for the second call option will be equal to the fair market value of the shares as determined by an independent appraiser. In determining the fair market value of the shares, the independent appraiser may take into consideration a number of factors including, but not limited to, discounted cash flows, valuation multiples of comparable transactions, trading multiples of comparable companies, SEBI guidelines and principles of valuation, the minority status of the shares, the contractual rights of the shares and the current market price of the shares.
Based solely on the market price of HZL’s shares on the NSE on July 15, 2022, of 285.35 ($ 3.76) per share, and not including the other factors that the independent appraiser may consider, one possible estimation of the exercise price to acquire all of the GoI’s 1,247,950,590 shares in HZL would be 356,103 million ($ 4,693.59 million).
₹
₹
By a letter dated July 21, 2009, we exercised the second call option. The GoI disputes the validity of the call option and has refused to act upon it. Consequently, we invoked arbitration and filed a statement of claim. The arbitral proceedings was stayed due to the Status quo order by Hon’ble Supreme Court but pursuant to the recent Hon’ble Supreme Court order dated August 13, 2020 we had written to the arbitral tribunal for commencement of arbitration proceedings and tribunal is yet to confirm the date for resumption of arbitration proceedings. While the Arbitration was in process, a Public Interest Litigation (“PIL”) was filed seeking restraint on disposal of residual shares by GoI, the Hon’ble Supreme Court on January 19, 2016, ordered the status quo to be maintained with respect to the proposed disinvestment of government interest in HZL until further orders are passed by the Hon’ble Supreme Court. The Hon’ble Supreme Court, on August 13, 2020, removed the status quo order in place to the extent that arbitration proceedings can continue with respect to our claim call option rights under the shareholder agreement. The matter before the tribunal has not been taken up yet. The GoI without prejudice to the position on the put or call option issue received approval from the central government cabinet for divestment and the government is looking to divest through the auction route.
On January 9, 2012, we offered to acquire the GoI’s interests in HZL for 154,920 million ($ 2,118 million). We have, by way of letters dated April 10, 2012, and July 6, 2012, sought to engage with the GoI on the same terms as the offer. This offer was separate from the contested exercise of the call options, and we proposed to withdraw the ongoing litigation in relation to the contested exercise of the options should the offer be accepted. To date, the offer has not been accepted by the GoI and therefore there is no certainty that the acquisition will proceed. Vedanta Limited has filed application for withdrawal of the arbitration proceedings before the arbitration tribunal, pursuant to the Hon’ble Supreme Court order dated December 17, 2021. Final order allowing for the withdrawal of arbitration matter has been passed.
₹
2. | Call Options over shares in BALCO |
On March 2, 2001, we acquired a 51.0% interest in BALCO from the GoI for a cash consideration of 5,533 million ($ 73 million). On March 2, 2001, we entered into a shareholders’ agreement with the GoI and BALCO to regulate, among other things, the management of BALCO and dealings in BALCO’s shares. The shareholders’ agreement provides that as long as we hold at least 51.0% of the share capital of BALCO, we are entitled to appoint one more director to the board of BALCO than the GoI and are also entitled to appoint the managing director. There are various other matters reserved for approval by both the GoI and us under the shareholders’ agreement, including amendments to BALCO’s articles of association, the commencement of a new business,issues of shares or convertible debentures and the provision of loans or guarantees or security to other companies under the same management as BALCO.
₹
non-pre-emptive
Under the shareholders’ agreement, if either we or the GoI wish to sell its shares in BALCO to a third party, the selling party must first offer the shares to the other party at the same price at which it is proposing to sell the shares to the third party. The other party shall then have the right to purchase all, but not less than all, of the shares so offered. If a shareholder does not exercise its right of first refusal, it shall have a tag along right to participate in the sale pro rata and on the same terms as the selling party, except that if the sale is by the GoI by way of a public offer, the tag along right will not apply. However, a transfer of shares representing not more than 5.0% of the equity share capital of BALCO by the GoI to the employees of BALCO is not subject to such right of first refusal by us.
125
The GoI also granted us an option to acquire the remaining shares in BALCO held by the GoI at the time of exercise. The exercise price is the higher of:
| a) | the fair value of the shares on the exercise date, as determined by an independent valuer; and |
| b) | the original sale price ( ₹ |
On March 19, 2004, we exercised our option to acquire the remaining 49.0% of BALCO’s issued share capital held by the GoI at that time. Thereafter, the GoI sought several extensions to complete the sale of the shares. On June 7, 2006, the GoI contended that the clauses of the shareholders’ agreement relating to our option violated the provisions of section 111A of the erstwhile Companies Act, 1956 by restricting the right of the GoI to transfer its shares and that as a result the shareholders’ agreement was null and void. The GoI has also expressed an intention to exercise its right to sell 5.0% of BALCO to BALCO employees.
Subsequently, the dispute was referred to arbitration and the arbitration tribunal rendered award rejecting our claim. We filed an application to the High Court of Delhi to set aside this award and the matter will be listed for hearing in due course.
The GoI without prejudice to the position on the put or call option issue has received approval from the central government cabinet for divestment and the government is looking to divest through the auction route.
Employees
As of March 31, 2022, we had 16,738 employees. The number of our employees as of March 31, 2020, 2021 and 2022 is as follows:
Business Segment | Entity | Location | Primary Company Function | Total employees for the year ended March 31, | ||||||||||||||
2020 | 2021 | 2022 | ||||||||||||||||
Zinc India | Hindustan Zinc Limited | India | Zinc and lead production | 4,181 | 3,711 | 3,492 | ||||||||||||
Zinc International | Black Mountain | South Africa | Zinc and lead Mining | 820 | 797 | 851 | ||||||||||||
| Skorpion | Namibia | Zinc and lead Mining and refining | 568 | 141 | 123 | |||||||||||||
Oil and gas | Cairn | India | Oil and Gas | 1,561 | 1,408 | 1,351 | ||||||||||||
| Vedanta Limited | India | Iron Ore | 2,552 | 2,487 | 2,986 | |||||||||||||
Copper | Vedanta Limited | India | Copper smelting and refining | 842 | 649 | 546 | ||||||||||||
| CMT | Australia | Copper mining | 22 | 23 | 23 | |||||||||||||
| Fujairah Gold FZC | UAE | Precious metal refinery | 66 | 58 | 55 | |||||||||||||
Aluminium | BALCO | India | Aluminium production | 2,410 | 1,946 | 1,751 | ||||||||||||
| Vedanta Limited | India | Aluminium production | 3,750 | 3,452 | 3,393 | |||||||||||||
Power | Vedanta Limited | India | Commercial power generation | 269 | 261 | 173 | ||||||||||||
| TSPL | India | Commercial power generation | 69 | 62 | 65 | |||||||||||||
| MALCO Energy Limited | India | Commercial power generation | 16 | 26 | 27 | |||||||||||||
Steel | ESL Steel Limited | India | Steel | 2,063 | 1,851 | 1,724 | ||||||||||||
Others | — | — | — | 169 | 169 | 178 | ||||||||||||
Total | 19,358 | 17,041 | 16,738 | |||||||||||||||
The majority of our workforce is unionized. Employees of HZL and BALCO are members of registered trade unions such as Bharat Aluminium Mazdoor Sangh for BALCO and Hindustan Zinc Workers Federation for HZL and are affiliated with national trade unions such as the Indian National Trade Union Congress. We believe that relations with our employees and unions are good, though we have in the past and may in the future experience strikes and industrial actions or disputes. See “”.
Item 3. Key Information—D. Risk Factors—Risks Relating to Our Business—Our operations are subject to risks that could result in decreased production, increased cost of production and increased cost of or disruptions in transportation, power generation, mining and oil exploration
Our ESG Approach
The Vedanta Sustainability Framework (VSF) is integral to the Company’s core business strategy. It helps us conduct our business in line with our values, while delivering high-quality and cost competitive products.
Collectively we have 8 policies, over 87 standards and guidance notes along with a robust monitoring mechanism to help our businesses integrate sustainable operating methods in their operating model. We are using the Vedanta Sustainability Assurance Program (“VSAP”) to ensure framework compliance, including a program of audits. The VSF facilitates the institutionalization of sustainability at each of our businesses. It does so, by adopting global best practices that are reflected in our policies, standards, and guidance notes. Our sustainability performance and work on climate change can be found in our Annual Sustainability report (ASR) and TCFD report. Vedanta produces these reports annually and latest reports are available on our website www.vedantalimited.com.
126
With the aim to become ESG leader across world, our sustainability vision has been revised in FY 2022 and has changed to “Transforming for Good”. This vision is supported by three pillars – “Transforming Communities”, which aims to keep communities around our operations at the centre of business decisions to get social license to operate and to make Vedanta a partner of choice, “Transforming the Planet”, which aims to ensure reducing impact of our operations on the environment by reducing our emissions, our consumption of resources and improving circularity of our products, and “Transforming the Workplace”, which focuses on health and safety of our workforce, ensuring gender parity, diversity and inclusivity and following world class levels of corporate governance. These pillars are further divided into nine aims that serve as broad target commitments for the Group. The nine aims are listed below:
Aim 1. Keep community welfare at the core of business decisions.
Aim 2. Empowering over 2.5 million families with enhanced skillsets
Aim 3. Uplifting over 100 million women and children through Education, Nutrition, Healthcare and welfare
Aim 4.
Net-zero
carbon by 2050 or sooner.Aim 5. Achieving net water positivity by 2030
Aim 6. Innovating for a greener business model
Aim 7. Prioritizing safety and health of all employees
Aim 8. Promote gender parity, diversity and inclusivity
Aim 9. Adhere to global business standards of corporate governance
Further, our
Net-Zero
Carbon aim breaks into 10 commitments:| 1. | Net Zero Carbon by 2050 or sooner* |
| 2. | Use 2.5 GW of Round-The-Clock |
| 3. | Pledge US$ 5b over the next 10 years to accelerate transition to Net-Zero |
| 4. | No additional coal-based thermal power and coal-based power only till end of power plants life |
| 5. | Decarbonize 100% of our Light Motor Vehicle (LMV) fleet by 2030 and 75% of our mining fleet by 2035 |
| 6. | Commit to accelerate adoption of hydrogen as fuel and seek to diversify to H2 fuel or related businesses |
| 7. | Ensure all our businesses account for their Scope 3 emissions by 2025 |
| 8. | Work with long-term tier-1 suppliers to submit their GHG reduction strategies by 2025 and align with our commitments by 2030 |
| 9. | Disclose our performance in alignment with TCFD requirements |
| 10. | Help communities adapt to the impacts of climate change through our social impact/CSR programs |
The ESG KPIs have been incorporated in our Business Plans and specific focus has been given to projects having highest impact on a particular aim
(A-class
projects) at both Business Units (BUs) and Group level. The organization has also created a robust governance structure to oversee implementation of its ESG vision. The structure includes the ESGsub-committee
of the Board, ESG ManCom, Transformation Offices at the Group andBU-level
and 12 Communities of Practices aimed at achieving 9 aims to drive adoption of ESG KPIs and implementation of our programs.In a geographically diverse business like ours, we are fostering a culture of zero harm, and we are committed to Zero fatal accidents in our operations. During fiscal year 2022, we unfortunately had 12 fatalities of business partner employees from 8 incidents across our operations. Each incident was investigated by Group level senior investigation team and reported to Vedanta Limited’s Board of Directors. The lessons learned from these accidents has been shared across all of our operating businesses with aim to horizontally deploy these learnings and monitor implementation plans to prevent repetition of incidents. There were no Vedanta Direct employees’ fatality in the current FY.
To address the fatalities at the workplace and reduce risk in operations, structural initiatives are driven across our sites and cover:
| 1. | VFL Program – leaders spending more time on the ground and driving safety personally. |
| 2. | Critical Risk Management – This year the Critical Risk Management program has been initiated by engaging an expert agency across Vedanta, who will assist us in identification, assessment, remedial actions plan preparation and closure of all critical risk. All these critical risk controls will be driven by Leadership level team (BU CEOs). |
| 3. | Infrastructure improvements: - Specific drive for improving infrastructures and providing engineering controls for prevention of fatalities has been launched across Vedanta. This will help build a fool proof infrastructure for improving safety at sites. |
127
| 4. | Capability Building – We have released 5 digital safety standards training modules across Vedanta for ease of learning and quick reference. This will be mandatory for every employee. We also launched ICAM (Incident Cause Analysis Methodology) trainings for improving quality of investigation across our businesses. This year our employees have attended Comprehensive health, environment, safety and sustainability Digital training module for competency improvement. |
| 5. | Digital intervention for improving HSE (Health Safety & Environment) performance: - This year we have started work on Artificial intelligence-based Camera surveillance program to detect unsafe acts and condition and timely closure of these observations to improve workplace safety. Further we have also ordered for implementation of Enablon (globally renowned HSE Platform across Vedanta). This will help in transparent and uniform reporting and strong analytics for data-based decisions to improve safety. This software is under implementation across Vedanta sites. |
| 6. | Assurance: - Cross Business Audits was initiated at Vedanta sites, with the aim to promote cross-learning and improving the on-ground implementation of Vedanta Safety Standards. These audits were carried out by our internal subject matter experts from line function supported by HSE team members. |
In fiscal year 2022, we continued efforts to improve the implementation of our tailing’s management standard for the Group. We are further committed to adopt the Global standard on tailing’s management released by ICMM and expect to align and mitigate high level points (points critical to ensure safety of tailing facility) by FY 2025. Starting in 2019, we have engaged with globally renowned third-party agencies to assess our tailing facilities. The latest assessment and audit in FY2022 is based on GISTM (Global standard on tailings management by ICMM). The audit has reviewed the design and the quality of the management systems of the tailings dam facilities. Recommendations from the review are under consideration and implementation and we are closely tracking performance against the recommendations.
We manage our environmental footprint to the most rigorous global standards and have developed specific objectives and targets, particularly with regard to water and GHG (Green House Gases) management. We have been able to recycle 118% of the
fly-ash
generated at our operations. We also have many control programs in place across our businesses, for example, all of our operations are ISO 14001 certified; systems to reduce water and energy consumption, minimize land disturbance, minimize waste production and contain pollution are in place.Support during
COVID-19
pandemicIndia experienced its third Covid wave in FY 2022. Though, milder than its previous variants, it still had an impact on society, which had to abide by multiple lockdown regimes issued by state and local governments.
Owing to our moral response, our operations have prompted to protect our employees and our communities. Our response towards this crisis is aligned with the government’s response to emergency lockdown, testing, diagnosis, isolation, treatment and referral services across all the Business Units to prevent the spread of the pandemic. In addition, ensured vaccination of employees, family members and Community living nearby with two doses of Covid Vaccine. All these resulted in 100% recovery of identified positive cases.
Fortunately, we are equipped with resources that we can utilize to benefit and support the nation. During this ongoing pandemic, we have vetted out all our possible resources to support the government in the fight against the Covid-19 pandemic and establishing Covid Hospitals.
In this battle of combating
Covid-19
outbreak, Vedanta have reached out to communities across 9 states. As a basic need of Hospital beds, Vedanta have procured around 1680 beds for District/State hospitals and establishment of Makeshift hospitals. Along with this, as a focus on the medical equipment, around 37 ventilators, 200+ flow meters, 502 oxygen concentrators, 177 oxygen regulators ,22 nebulizers and 30 ICU beds were supplied across various locations covering around 343 villages. Total 26,806 filled oxygen cylinders were supplied to the medical institutions and 2331.34 MT liquid oxygen supplied. Adding to this, around 1lakh+ empty oxygen cylinders were also contributed.Being in the process of appropriate utilisation of resources and engaging SHG women for provision of alternate form of income during Covid lockdown, SHG Women were involved in making masks in most of the locations across Vedanta. With the Help of this, around 1,90,492 masks (3 ply/ 2ply) have been distributed in the community, creation of
all-round
need addressal at both the ends. Vedanta companies together bought in 11250N-95
masks, 15000+ PPE kits into the communities. Towards addressing daily needs of needed communities, group companies together provided 5187 ration kits and 2,72,830+ sanitizers. Across 312 villages in various locations, awareness sessions are carried in different innovative modes like Wall paintings, digital and print awareness through audio and digital campaigns etc., on Covid preparedness/ prevention/Vaccination.Insurance
We maintain property insurance which protects against losses relating to our assets arising from fire, business interruption, earthquakes or terrorism and freight insurance which protects against losses relating to the transport of our equipment, product inventory and concentrates. We do not have insurance for certain types of environmental hazards, such as pollution or other hazards arising from our disposal of waste products or fraud, which is being evaluated. The occurrence of a significant adverse event, the risks of which are not fully covered by insurance, could have a material adverse effect on our financial condition or results of operations. Moreover, no assurance can be given that we will be able to maintain existing levels of insurance in the future at the same rates. See
“
Item 3. Key Information
-D.
Risk Factors—Risks Relating to Our Business- Our insurance coverage may prove inadequate to satisfy future claims against us.”
128
We and our directors and officers are subject to US securities and other laws. In order to attract and retain qualified board members and executive officers, we have obtained directors’ and officers’ liability insurance. There can be no assurance that we will be able to maintain directors’ and officers’ liability insurance at a reasonable cost, or at all.
Regulatory Matters
(i) | Mining Laws |
The MMDR Amendment Act was promulgated on March 27, 2015 to amend The Mines and Minerals (Development and Regulation) Act, 1957 (“MMDR Act”), the Minerals (Other than Atomic and Hydrocarbons Energy Minerals) Concession Rules, 2016 (“MC Rules”), and the Mineral Conservation and Development Rules, 1988, as amended (“MCD Rules”), and it governs mining rights and the operations of mines in India. The MCD Rules outline the procedures for obtaining a prospecting license or the mining lease, the terms and conditions of such licenses and the model form in which they are to be issued. The GoI announced the National Mineral Policy in 1993 which was revisited in 2008 and further in 2019. The MMDR Amendment Act has brought about significant changes in the legal regime for the mining sector including defining bauxite, iron ore, limestone and manganese ore as notified minerals, creation of a new category of mining license i.e. the prospectinglease, grant of mining lease for a period of 50 years for all minerals other than coal, lignite and atomic minerals, establishment of DMF, auction of notified and other minerals by competitive bidding, including
license-cum-mining
e-auction
etc. The MMDR Act was further amended by the Mines and Minerals (Development and Regulation) Amendment Act, 2016 which permits the transfer of captive mine leases (granted before January 12, 2015) without having to go through an auction process and also allows the dumping of waste outside of the mining area by including dumping sites within the definition of lease area. The amendment received presidential assent on May 6, 2016.The MLAA brought forth amendments in the MMDR Act. The MLAA has (i) liberalised the eligibility requirement to participate in coal auctions; (ii) removed the requirement for State Governments to obtain prior approval of Central Government to grant mining concessions; and (iii) enabled the transfer of approvals (other than coal, lignite and atomic minerals), whereby all the rights, approvals, clearances and licenses vested with the previous lessee will be extended to the successful bidder for a period of two years. During these two years, the successful bidder is required to obtain all the required clearances.
Grant of a Mining Lease
Only the government of the applicable state may grant a mining lease for minerals other than coal, lignite and atomic minerals. The mining lease agreement governs the terms on which the lessee may use the land for the purpose of mining operations. If the land on which the mines are located belongs to private parties, the lessee must acquire the surface rights relating to the land from such private parties. If a private party refuses to grant the required surface rights to the lessee, the lessee is entitled to inform the state government and deposit with the state government compensation for the acquisition of the surface rights. If the state government deems that such amount is fair and reasonable, the state government has the power to order a private party to permit the lessee to enter the land and carry out such operations as may be necessary for the purpose of mining. For determining what constitutes a fair amount of compensation payable to the private party, state governments are guided by the principles of the Right to Fair Compensation and Transparency in Land Acquisition Rehabilitation and Resettlement Act, 2014 or Land Acquisition Act, which generally governs the acquisition of land by governments from private individuals. In case of land owned by the government, the surface right to operate in the lease area is granted by the government upon application as per the norms of that state government. If the mining operations in respect of any mining lease results in the displacement of any persons, the consent of such affected persons, and their resettlement and rehabilitation as well as payment of benefits in accordance with the guidelines of the applicable state government, including payment for the acquired land owned by those displaced persons, needs to be settled or obtained before the commencement of the mining project. However, with the changes brought in by way of the MMDR Amendment Act, for all minerals other than coal, lignite and atomic minerals, mining leases shall now be granted for a period of 50 years through auction process. All mining leases granted for such minerals before the MMDR Amendment Act shall be valid for 50 years. On expiry of the lease, instead of being renewed, the leases shall be put up for auction. The MC Rules provide that a holder of a captive mine is entitled to a first right of refusal when the lease is auctioned at the expiry of the lease period. The MMDR Amendment Act specifies that any lease granted before the commencement of the MMDR Amendment Act, shall be extended: (i) up to March 31, 2030 for minerals used for captive purposes (specific
end-use)
and up to March 31, 2020 for minerals used for other than captive purposes, or (ii) until the completion of renewal period, or (iii) for a period of 50 years from the date of grant of such lease, whichever is later. This provision shall not apply to mining leases for which renewal has been rejected, granted, or lapsed.Protection of the Environment
The MMDR Act also deals with the measures required to be taken by the lessee for the protection and conservation of the environment from the adverse effects of mining. The National Mining Policy emphasizes that no mining lease would be granted to any party without a proper mining plan, including an environmental plan approved and enforced by statutory authorities and which provides for controlling environmental damage, restoration of mined areas and for planting trees according to prescribed norms. The MMDR Amendment Act now also provides for the creation of a DMF and a NMET. The DMF is to be established by the state government for the benefit of persons in districts affected by mining related operations. The NMET was established by the central government for regional and detailed mine exploration through Notification No. G.S.R 633(E) dated August 14, 2015. Licensees and lease holders of leases granted other than through auction shall contribute to the DMF at a rate of 30% of the royalty and leases granted through auction at a rate of 10% of royalty. The contribution to NMET is to be made at two percent of royalty.
129
Labor Conditions
Working conditions of mine laborers are regulated by the Mines Act, 1952, as amended from time to time. The Act sets forth standards of work, including number of hours of work, leave requirements, medical examination, weekly days of rest, night shift requirements and other requirements to ensure the health and safety of mine workers.
Royalties
Royalties on the minerals extracted or a dead rent component, whichever is higher, are payable to the relevant state government by the lessee in accordance with the MMDR Act. The mineral royalty is payable in respect of an operating mine from which minerals are removed or consumed and is computed in accordance with a prescribed formula. The GoI has been granted broad powers to modify the royalty scheme under the MMDR Act but may not do so more than once every three years. In addition, the lessee must pay the occupier of the surface land over the mining lease an annual compensation determined by the state government. The amount depends on whether the land is agricultural or
non-agricultural.
(ii) | Oil and Gas Laws |
Regulation of Exploration and Production
The MoPNG is the principal regulator of oil and natural gas exploration and production in India. The MoPNG established the DGH in 1993 to promote the sound management of Indian petroleum and natural gas resources with due regard to the environmental, safety, technological and economic aspects of petroleum activities. The DGH is responsible for, inter alia, ensuring correct reservoir management practices, reviewing and monitoring exploratory programs, the development plans of oil companies, and monitoring the production and the optimal utilization of gas fields.
The MoPNG oversees the Oil Industry Safety Directorate, which develops standards for safety, fire-fighting, training programs and information dissemination, and conducts periodic safety audits of all petroleum-handling facilities. It also oversees the Oil Industry Development Board, which provides financial and other assistance for the conductive development of the oil industry. The safety standards prescribed by the Oil Industry Safety Directorate, and the safety regulations prescribed by the Directorate General of Mines Safety in respect of onshore petroleum mining installations, must be complied with.
The Oilfields (Regulation and Development) Act, 1948
The Oilfields (Regulation and Development) Act, 1948 provides for the regulation of oilfields and for the development of mineral oil resources. The Oilfields (Regulation and Development) Act empowers the GoI to frame rules on the granting of mining leases and petroleum exploration or prospecting licenses, the conservation and development of mineral oils and gas the production of oil and gas, and the regulation of oilfields and gas fields.
Petroleum Exploration License and Petroleum Mining Lease under the Petroleum and Natural Gas Rules, 1959
The Petroleum and Natural Gas Rules provide the framework for the granting of petroleum exploration licenses and petroleum mining leases. Rule 4 of the Petroleum and Natural Gas Rules prohibits the prospecting or exploitation of any activity unless a petroleum exploration license or petroleum mining lease has been granted under the Petroleum and Natural Gas Rules. A Petroleum Mining Lease entitles the lessee to an exclusive right to extract oil and gas petroleum from the relevant contract area. Petroleum Exploration Licenses and Petroleum Mining Leases are granted by the MoPNG for offshore areas and by the relevant state governments, with the prior approval of the Government, for onshore areas. In 2006, the Government amended the Petroleum and Natural Gas Rules so that a licensee or lessee is obligated to provide all data obtained under the license or lease. Such data shall be the property of the Government, provided that the licensee or lessee shall have the right to make use of such data, free of cost, for the purposes of petroleum operations under the license or lease. The Government also has the right to disclose to the public all
non-proprietary
data without the consent of the licensee. The Government has the sole authority to determine what is proprietary.The Territorial Waters, Continental Shelf, Exclusive Economic Zone and other Maritime Zones Act, 1976
The Territorial Waters, Continental Shelf, Exclusive Economic Zone and other Maritime Zones Act, 1976 regulates the exploration and exploitation of resources of the continental shelf and exclusive economic zone.
The Essential Commodities Act, 1955
The Essential Commodities Act, 1955 makes provisions controlling the production, supply and distribution of certain essential commodities, which include petroleum and petroleum products.
130
The Petroleum Act, 1934 read with the Petroleum Rules, 2002
The Petroleum Act, 1934 regulates the law relating to the import, transport, storage, production, refining and blending of petroleum and other inflammable substances. The Petroleum Rules, 2002 now regulate these activities.
Mines Act, 1952 read with Oil Mines Regulation, 2017
The Oil Mines Regulations 2017 provides for greater focus on safety and precautionary measures to be adhered in conducting the petroleum operations namely compliance with specific Oil Industry Safety Directorate standards, recommended practices, guidelines and Indian Standards, preparation and implementation of a safety management plan, carrying out safety audits in mines and additional obligations of owners, agents or managers of mines.
The Petroleum and Natural Gas Regulatory Board Act, 2006
The Petroleum and Natural Gas Regulatory Board Act, 2006 provides for the establishment of the Petroleum and Natural Gas Regulatory Board. The board regulates the refining, processing, storage, transportation, distribution, marketing and sale of petroleum products and natural gas (excluding production of crude oil and natural gas). It strives to protect the interests of consumers and entities engaged in specific activities relating to petroleum, petroleum products and natural gas and to ensure uninterrupted and adequate supply of petroleum, petroleum products and natural gas in all parts of the country and to promote competitive markets.
The Petroleum and Minerals Pipelines (Acquisition of Right of User in Land) Act, 1962
The Petroleum and Minerals Pipelines (Acquisition of Right of User in Land) Act, 1962 provides the framework governing the acquisition of right of user in land for laying pipelines for the transportation of petroleum and minerals and other matters connected therewith. This law is limited to the acquisition procedure, restrictions on use of land and compensation payable to the persons interested in the land.
Hydrocarbon Exploration and Licensing Policy
The MoPNG through its notificationdated March 30, 2016, introduced a new exploration and licensing policy named Hydrocarbon Exploration and Licensing Policy (“HELP”). This is a fundamental change in the Indian oil and gas sector, which introduces a new contractual and fiscal model for the award of hydrocarbon acreages. Four main facets of HELP are: single license, open acreages, revenue sharing model and marketing and pricing freedom. The uniform license will enable the contractor to explore conventional as well as unconventional oil and gas resources including shale gas/oil, tight gas and gas hydrates under a single license. The concept of OALP will enable exploration and production companies to choose the blocks from the designated area. Under the OALP, Vedanta Limited has been awarded 41 blocks in the fiscal year 2019 and 10 blocks in fiscal year 2020.
O-32011/4/2013-ONG-I
Policy reforms to increase exploration activities and enhance production
On February 28, 2019, GoI notified policy reforms to increase exploration activities, attract domestic and foreign investment in unexplored/unallocated areas of sedimentary basins, and enhance domestic production of oil and gas from existing fields. These policy reforms heralded a fundamental shift. For instance, going forward, exploration blocks in
Category-II
and Category–III Basins will be awarded on the basis of international competitive bids based exclusively on exploration work programme. It entails no revenue or production sharing with Government except in case of a windfall gain.Similarly, concessional royalty rates would be levied on early commencement of production. Marketing and pricing freedom has been given to those new gas discoveries whose FDP will be approved for the first time after the date of policy. The policy also ushered ease of doing business by establishing Empowered Coordination Committee and Dispute Resolution Mechanism.
Policy framework to promote and incentivize enhanced recovery methods for oil and gas
On October 10, 2018, GoI notified policy framework to promote and incentivize enhanced recovery (“ER”) methods for oil and gas. The Policy envisages fiscal incentives in form of partial waiver of applicable Cess/Royalty.
Fields should be having a minimum three years of commercial production to avail ER incentives. However, fields with unconventional hydrocarbon (“UHC”) production would be eligible from the start of commercial production. Fields going in for Improved Recovery (“IR”) would be eligible on crossing the prescribed benchmark of increasing production beyond current recovery of 60% in case of oil and beyond current recovery of 80% in case of gas.
The policy, having a sunset clause, will be effective for ten years from the date of its notification. However, the fiscal incentives will be available for a period of 120 months from the date of commencement of production in ER/UHC projects.
131
Streamlining working of PSCs in
pre-NELP
and NELP BlocksOn August 14, 2018, GoI notified Policy Framework for Streamlining the Working of PSCs in respect of
Pre-NELP
and NELP Blocks. Amongst others, this policy reform focuses on the North Eastern region by providing extended exploration period and marketing and pricing freedom to future gas discoveries as well as existing discoveries which were yet to commence commercial production as on July 1, 2018.Unconventional Hydrocarbons policy
On August 20, 2018, GoI notified Policy framework for exploration and exploitation of unconventional hydrocarbons under existing PSCs, coal bed methane (“CBM”) contracts and nomination fields. This policy allows access to unconventional hydrocarbons under the existing PSCs, CBM contracts and Nomination fields. In the PSC regime, the policy envisages a separate ring-fencing for cost recovery of cost incurred on exploration, development and production from the total value of petroleum produced and saved from new commercial discoveries. The Government share of Profit Petroleum for new discoveries will be 10% over and above the percentage of Profit Petroleum shared with the Government under existing PSCs.
(iii) | Regulations pertaining to our oil and gas blocks located in South Africa |
Petroleum Resources Development Act - South Africa
The Mineral and Petroleum Resources Development Act is the law governing exploitation of minerals and petroleum in South Africa. An exploration license has been granted to Cairn South Africa Pty Limited for exploration of petroleum resources in South Africa under the law. PASA is the nodal agency for all approvals. Cairn South Africa Pty Limited has not yet entered into the second phase of exploration, and accordingly the Deed for extension has not been executed. PASA has notified that the exploration right has expired. Accordingly, along with joint venture partner Petro SA, closure application with PASA was filed on September 19, 2018, to exit from South Africa operations. The application has been accepted and closure certificate has been granted by PASA on September 20, 2019.
(iv) | Environment Laws |
Our business is subject to environmental laws and regulations. The applicability of these laws and regulations varies from operation to operation and depends on jurisdiction in which we operate. Our operations require environmental and other permits covering, amongst other things, water use and discharges, stream diversions, solid waste disposal and air and other emissions. Major environmental laws applicable to our operations include The Environment (Protection) Act, 1986, Forest (Conservation) Act, 1980, or Forest Act and the Forest Conservation Rules, 2003, Hazardous Wastes (Management and Handling) Rules, 1989, Water (Prevention and Control of Pollution) Act, 1974, Water (Prevention and Control of Pollution) Cess Act, 1977, Air (Prevention and Control of Pollution) Act, 1981, The Coal Mines (Nationalization) Act, 1973, or Coal Nationalization Act, Coking Coal Mines (Nationalization) Act, 1972, Coal Mines (Taking Over of Management) Act, 1973, Coking Coal Mines (Emergency Provision) Act, 1971, Coal Bearing Areas (Acquisition and Development) Act, 1957, Coal Mines (Conservation and Development) Act, 1974 and the New Coal Distribution Policy, 2007.
The Environmental Protection Act, 1986, the Water (Prevention and Control of Pollution) Act, 1974 and the Air (Prevention and Control of Pollution) Act, 1981 provide for the prevention, control and abatement of pollution. Pollution control boards have been set up in states in India to exercise the powers under these statutes for the purpose of preventing and controlling pollution. Companies must obtain the clearance of state pollution control boards before emitting or discharging effluents into the environment. All new projects or activities and expansion and modernization of existing projects require an EC.
The Hazardous Waste (Management and Handling) Rules, 1989 define waste oil and oil emulsions as hazardous wastes and impose an obligation on each occupier and operator of any facility generating hazardous waste to dispose of such hazardous wastes properly. It also imposes obligations in respect of the collection, treatment and storage of hazardous wastes. Each occupier and operator of any facility generating hazardous waste is required to obtain an approval from the relevant state Pollution Control Board for collecting, storing and treating the hazardous waste.
In addition, the Merchant Shipping Act, 1958 provides for liability in respect of loss or damage caused outside the ship by contamination resulting from the escape or discharge of oil from the ship, wherever such escape or discharge occurs.
(v) | Power Sector |
Licensing Requirements
Under the Electricity Act, 2003 (“Electricity Act”), the transmission, distribution of, and trading in electricity require licenses from the appropriate Central or State Electricity Regulatory Commissions (respectively, “CERCs” and “SERCs”, and collectively, “ERCs”), unless exempted, however generation of electricity does not require a license.
132
(vi) | Employment and Labor Laws |
We are subject to various Labor, health and safety laws which govern the terms of employment of our laborers at our mining and manufacturing facilities, their working conditions, the benefits available to them and the general relationship between our management and such laborers. These include the Industrial Disputes Act, 1947, Factories Act, 1948, Contract Labor (Regulation and Abolition) Act, 1970, Employee State Insurance Act, 1948, Payment of Wages Act, 1936, Minimum Wages Act, 1948, Workmen’s Compensation Act, 1923, Payment of Gratuity Act, 1972, Payment of Bonus Act, 1965, and Employees’ Provident Funds and Miscellaneous Provisions Act, 1952.
(vii) | Other Laws |
The Right to Fair Compensation and Transparency in Land Acquisition, Rehabilitation and Resettlement Act, 2013, or Land Acquisition Act
The Land Acquisition Act was notified with effect from January 1, 2014. The law replaces the 120 year old legislation the Land Acquisition Act, 1894 and is a unified legislation for acquisition of land and adequate rehabilitation mechanisms for all affected persons. As per the provisions of the Land Acquisition Act, the central government or appropriate state government is empowered to acquire any land from private persons for ‘public purpose’ subject to payment of compensation to the persons from whom the land is so acquired. There is also a mandatory requirement under the Act for social impact assessment accompanying every land acquisition, to consider the social costs and benefits arising of such acquisition and a participative process has been prescribed for such acquisition by imposing the condition of obtaining consent of the requisite majority prescribed under the Act i.e. consent of at least 80.0% of people whose land is acquired for private projects and of at least 70.0% of the landowners in the case of public-private partnership projects and discussions and objections at every stage of the acquisition proceedings. It also provides for compensation as high as four times more than the existing practice in rural areas and two times in urban areas. In December 2014, an ordinance (The Right to Fair Compensation and Transparency in Land Acquisition, Rehabilitation and Resettlement (Amendment) Ordinance, 2014) was promulgated to amend the Right to Fair Compensation and Transparency in Land Acquisition, Rehabilitation and Resettlement Act, 2013. The ordinance was
re-promulgated
in a modified form in April 2015, and again in May 2015. Right to Fair Compensation and Transparency in Land Acquisition, Rehabilitation and Resettlement (Second Amendment) Bill, 2015 was introduced in Lok Sabha on May 11, 2015 to replace the April ordinance and was referred to a joint Parliamentary Committee for detailed examination.Companies Act, 1956 and Companies Act, 2013
The Companies Act, 2013 to replace the Companies Act, 1956 which currently governs the formation, financing, functioning and winding up of companies, received assent in August 2013 and the 470 section legislation has been partially notified. The Companies Act, 2013 seeks to consolidate and amend the law relating to the companies and intends to improve corporate governance and to further strengthen regulations for corporates. The major features introduced by the 2013 Act include formulation of a corporate social responsibility policy and spending towards such activities, increased responsibility of independent directors and setting up of a National Financial Reporting Authority. Some new concepts such as
one-person
company, small companies, dormant company, class action suits, and registered valuers have also been included.C. Organizational Structure
The following diagram summarizes the corporate structure of our consolidated group of companies and our relationship with Vedanta and other key entities as of March 31, 2022:
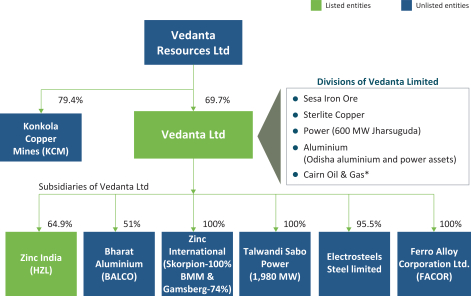
133
*50.0% of the share in the RJ Block is held by a subsidiary of Vedanta Limited
| # | Post voluntary open offer in April 2021, the controlling stake of VRL increased to 65.2%. On November 23, 2021, VRL bought additional stake in Vedanta Limited of 4.6% through creeping acquisition. Post creeping acquisition, total shareholding of VRL in Vedanta Limited increased to 69.7% as on March 31, 2022. |
| 1. | We have exercised our option to acquire the remaining 49.0% of BALCO owned by the GoI on March 19, 2004. The exercise of this option has been contested by the GoI. The GoI has the right and has expressed an intention to sell 5.0% of BALCO to BALCO employees. See “ — B. Business Overview — Our Business — Call Options over shares |
| 2. | Ownership stake in ESL Steel Limited (‘ESL’) increased to 95.49% during 3 rd quarter of fiscal year 2020 from 90% in fiscal year 2019 through their erstwhile subsidiary VSL subsequent to Exit offer as per original NCLT application. Further, with effect from March 25, 2020, in view of the Scheme of Amalgamation granted by NCLT, Kolkata, Vedanta Limited now directly holds 95.49% in Electrosteel Steels Limited. |
| 3. | Konkola Copper Mines Plc (“KCM”) ceased to be a related party with effect from May 21, 2019. A provisional liquidator was appointed to manage KCM’s affairs on May 21, 2019, after ZCCM Investments Holdings Plc (“ZCCM-IH”), an entity majorly owned by the Government of Zambia and a 20.6% shareholder in KCM, filed a winding up petition against KCM. KCM’s majority shareholder, VRHL and its parent company i.e., VRL, are contesting the winding up petition in the Zambian courts. VRHL applied for a stay of the winding up petition in the High Court of Zambia but was unsuccessful. VRHL subsequently filed an appeal against the High Court of Zambia ruling. The appeal hearing took place on August 25, 2020, and the ruling was delivered on November 20, 2020. The Appeal Court ruled in favor of Vedanta and concluded that a dispute as defined in the Shareholders Agreement exist between the parties and that the disputes are arbitrable and referable to arbitration. The Appeal Court ordered a stay of thewinding-up proceedings in accordance with section 10 of the Zambian Arbitration Act, 19 of 2000 and that the matter be referred to arbitration. Costs were awarded in Vedanta’s favour in both Courts in Zambia. On December 2, 2020, ZCCM filed an application for leave to appeal the Court of Appeal’s ruling to the Hon’ble Supreme Court, Zambia. Vedanta has opposed the application, which was argued on March 17, 2021. On April 29, 2021, the Court of Appeal dismissed ZCCM’s application for leave to appeal to the Hon’ble Supreme Court, costs were awarded in Vedanta’s favor. ZCCM has renewed its application for leave to appeal in front of a single judge of the Hon’ble Supreme Court. The hearing date was set down for June 4, 2021. On September 2, 2021, ZCCM was granted leave to appeal by a single Judge of the Hon’ble Supreme Court. ZCCM filed its Notice of Appeal and Memorandum of Appeal on September 7, 2021. A motion was filed by Vedanta on September 16, 2021, to the full bench of the Hon’ble Supreme Court, Zambia, to reverse, vary or set aside the ruling of the single Judge. The motion was scheduled to be heard by the Hon’ble Supreme Court on November 2, 2021. On November 8, 2021, ZCCM filed its Heads of Arguments and Record of Appeal in the Hon’ble Supreme Court of Appeal, Zambia. On December 15, 2021, Vedanta filed into the Hon’ble Supreme Court its Heads of Arguments in Opposition to ZCCM’s appeal, and on December 16, 2021, Vedanta filed a preliminary objection against ZCCM’s Hon’ble Supreme Court Appeal pursuant to Rule 19(1) of the Hon’ble Supreme Court Rules, Chapter 25 of the Laws of Zambia. On December 29, 2021, KCM filed into the Hon’ble Supreme Court its Heads of Arguments relating to ZCCM’s appeal. On January 4, 2022, KCM filed a Notice to Raise Preliminary Issues to VRHL’s Hon’ble Supreme Court Preliminary Objection to the appeal, pursuant to Order 18 Rule 19/26, Order 33 Rule 7 of the Rules of the Hon’ble Supreme Court of England, 1999 Edition. On January 14, 2022, ZCCM filed its Skeleton Arguments in Opposition to Vedanta’s Preliminary Objection against ZCCM’s Hon’ble Supreme Court Appeal. ZCCM also filed its Heads of Arguments in Reply to Vedanta’s Heads of Arguments in Opposition to the appeal. On January 18, 2022, Vedanta’s motion to the full bench was denied. The Hon’ble Supreme Court gave permission that Vedanta and KCM could file responses to each other’s Preliminary Objections by the next sitting of the Hon’ble Supreme Court. On February 1, 2022, Vedanta and KCM’s Preliminary Objections were heard by a panel of three Hon’ble Supreme Court judges. On March 22, 2022, the Hon’ble Supreme Court of Zambia ruled in Vedanta’s favour, bringing an end to ZCCM’s appeal. |
Notwithstanding the Court of Appeal’s judgement, on December 28, 2020, KCM’s acting CEO announced a ‘reorganization and restructuring’ of KCM by the provisional liquidator into two subsidiary companies, KCM Smelter Co Limited and Konkola Mineral Resources Limited taking effect from February 1, 2021. VRHL has filed an application for directions on the provisional liquidator’s powers in light of the Court of Appeal’s ruling of November 20, 2020, and have asked for guidance from the High Court of Zambia whether these powers include the ability to reorganize and restructure KCM. The hearing of the preliminary issues took place on March 30, 2021 whereby the judge reserved her ruling. The ruling was delivered on May 7, 2021. The Judge ruled that in light of the stay of the winding up proceedings ordered by the Court of Appeal in November 2020 and the referral of the matter to arbitration, court does not have the jurisdiction to consider an additional application requesting to give directions on the powers of the provisional liquidator. Therefore, leave to appeal was denied.
VRHL and VRL have also commenced arbitration proceedings against
ZCCM-IH
with seat in Johannesburg consistent with their position that arbitration is the agreed dispute resolution process. ZCCM filed and served its Defense and Counterclaims on Vedanta on July 14, 2020, and Vedanta’s reply to the Defense and Counterclaims was served on ZCCM on January 31, 2021. ZCCM filed its response to Vedanta’s reply on April 15, 2021. An initial hearing of prioritized matters took place from May 31, 2021, to June 3, 2021, with the substantive dispute being heard in November 2021 and February 2022. On July 7, 2021, the arbitral tribunal granted a partial final Award in which it has ruled that ZCCM has breached, and is in continuing breach of, the dispute resolution provisions in the shareholders’ agreement between amongst others ZCCM, Vedanta and the Government of Zambia.134
The Partial Final Award that was delivered by the arbitrator on July 7, 2021, has been registered in the Register of Arbitral Awards at the Registry of the Commercial Division of the High Court, Zambia. The Notice of Registration of the Partial Final Award was filed into Court on August 3, 2021, and subsequently served on ZCCM on August 5, 2021. On September 20, 2021, a separate High Court of Zambia application was filed on behalf of Vedanta to strike out or dismiss the winding up petition on the basis that ZCCM is estopped from relying on the grounds for pursuing the
winding-up
petition. The application also seeks to discharge the Provisional Liquidator. On November 4, 2021, KCM filed into the High Court of Zambia a Notice to raise a Preliminary Objection to VRHL’s application for an order to strike out and/or dismiss the petition pursuant to Order III Rule 2 of the High Court of Zambia Rules Chapter 27 of the Laws of Zambia. On November 5, 2021, ZCCM filed into the High Court of Zambia a Motion to Raise Preliminary Issues Pursuant to section 60(3) of the Corporate Insolvency Act No.9 of 2017. On November 19, 2021, Vedanta filed into the High Court of Zambia Composite Skeleton Arguments and List of Authorities in opposition to KCM and ZCCM’s Motions to Raise Preliminary Objections to Vedanta’s application for an order to strike out and/or dismiss the petition. On December 13, 2021, KCM and ZCCM’s Preliminary Objections filed against Vedanta’s application in the High Court, Zambia for registration and enforcement of the partial final award were heard. Judgement was reserved.On April 12, 2022, Vedanta’s application was dismissed by Judge Mikalile with costs. On April 26, 2022, Vedanta filed its Notice of Appeal and Memorandum of Appeal in the Court of Appeal with the view of challenging Judge Mikalile’s Ruling based on three (3) grounds of appeal.
By a Consent Settlement Agreement dated March 15, 2022, made between the Official Receiver and one Mr Milingo Lungu in his capacity as Provisional Liquidator of KCM at the time, the parties purportedly agreed that the said Mr Lungu would resign as PL for KCM with immediate effect and that he would hand over to the Official Receiver as PL of KCM. As per the said agreement, on March 17, 2022, Mr Lungu resigned as PL for KCM with immediate effect and on April 10, 2022, the Official Receiver allegedly replaced Mr Lungu as the PL contrary to the provisions of the law. The Official Receiver’s decision to contrive to get Mr Lungu into purportedly resigning as the PL and thereafter appointing herself as the PL is against the provisions of the Corporate Insolvency Act.
In view of the foregoing, on May 10, 2022, Vedanta filed an application for leave to commence judicial review proceedings with the firm view of challenging the authority of the Official Receiver as the PL of KCM. The Judicial Review Application came up for hearing on June 30, 2022. Should the Zambia High Court grant the order sought by Vedanta, then the KCM Board will be restored. The Court adjourned its ruling to August 9, 2022.
The hearing to determine all other pending matters in the arbitration, except for the parties’ respective claims for damages) was scheduled to take place for 5 weeks commencing on February 21, 2022. On February 16, 2022, VRL, VRHL and ZCCM signed an agreement to postpone the hearing for an initial period of one month, in order to afford the parties an opportunity to negotiate a commercial settlement between them of the disputes that form the subject matter of the arbitration. If the parties do not reach a settlement, arbitration proceedings will resume in January 2023. The discussions are ongoing.
The principal members of our consolidated group of companies are as follows:
| 1. | Vedanta Limited Re-organization Transactions and the name of the Company changed from “Sesa Sterlite Limited” to Vedanta Limited pursuant to a fresh certificate of incorporation issued by the Registrar of Companies on April 21, 2015. Our ADSs were listed on the NYSE, however effective from November 8, 2021, the ADS was closed for trading on NYSE. Vedanta, through its subsidiaries, owned 55.1% of our issued share capital as on March 31, 2021, and controls our management. However, post voluntary open offer in April 2021, the controlling stake of VRL increased to 65.18%. On November 23, 2021, VRL bought additional stake in Vedanta limited by 4.55% post which VRL shareholding increased to 69.7%. The remainder of our share capital i.e., 34.82% is held by Life Insurance Corporation of India, ICICI Prudential Asset Management Company, HDFC asset Management Company limited, Black Rock Inc, Vanguard Group Inc, Employee benefit trust and other institutional and public shareholders. Vedanta Limited and Cairn India Limited (now Vedanta Limited—oil and gas business) announced the Cairn India Merger which became operative on April 11, 2017. All substantive approvals for effecting the merger of Cairn India Limited (now Vedanta Limited—oil and gas business) with Vedanta Limited were received on March 27, 2017. |
| 2. | BALCO “Item 4. Information on the Company—B. Business Overview—Our Business—Call Options over Shares” |
| 3. | HZL “Item 4. Information on the Company—B. Business Overview—Our Business—Call Options over Shares” |
| 4. | Skorpion |
135
| 5. | BMM |
| 6. | Talwandi Sabo Power Limited build-own-operate |
| 7. | Electrosteel Steels Limited paid-up share capital of ESL through VSL. During the 3rd quarter of fiscal year 2020, the Company has increased their holding to 95.49% through their subsidiary VSL subsequent to Exit offer as per original NCLT application. On March 25, 2020, NCLT, Kolkata granted the approval for the Scheme of Amalgamation of VSL with Electrosteel Steels Limited. With effect from March 25, 2020, in view of the Scheme of Amalgamation granted by NCLT, Kolkata, Vedanta Limited now directly holds 95.49% in Electrosteel Steels Limited. |
| 8. | Ferro Alloy Corporation Limited |
Volcan is the key entity that controls us. See “”
Item 7. Major Shareholders and Related Party Transactions - A. Major Shareholders
D. Property, Plants and Equipment
See “-.
B. Business Overview—Our Business—Our Copper Business—‘Principal Facilities’ and ‘Projects and Developments’,” “- B. Business Overview - Our Business—Our Zinc Business—‘Principal Facilities’ and ‘Projects and Developments’,” “- B. Business Overview—Our Business—Our Aluminium Business—‘Principal Facilities’ and ‘Projects and Developments’,” and “- B. Business Overview—Our Business—Our Zinc International Business—‘Principal Facilities’ and ‘Projects and Developments’
ITEM 4A. | UNRESOLVED STAFF COMMENTS |
Not applicable.
ITEM 5. | OPERATING AND FINANCIAL REVIEW AND PROSPECTS |
The following discussion of our business, financial condition and results of operations should be read in conjunction with our consolidated financial statements and the related notes included elsewhere in this Annual Report. Some of the statements in the following discussion are forward-looking statements that reflect our current views with respect to future events and financial performance. Our actual results could differ materially from those anticipated in these forward-looking statements as a result of certain factors, such as those set forth under “Item 3. Key Information—D. Risk Factors” and elsewhere in this Annual Report. Our consolidated financial statements and the financial information discussed below have been prepared in accordance with IFRS as issued by the IASB.
136
Overview
We are a diversified natural resource company engaged in exploring, extracting and processing minerals and oil and gas. We produce zinc, lead, silver, oil and gas, copper, aluminium, iron ore, steel, glass substrate and commercial power and have a presence across India, South Africa, Namibia, UAE, Ireland, Australia, Japan, South Korea, Taiwan and Liberia. We have experienced significant growth through various expansion projects, acquisition of our zinc and aluminium businesses in 2002 and 2001 respectively, through the GoI’s disinvestment programs, the acquisition of the zinc business of Anglo American Plc in Namibia, South Africa and Ireland in fiscal year 2011, acquisition of oil and gas business in 2012, acquisition of 90.0% controlling stake in ESL under IBC, in line with the Resolution Plan approved by NCLT, Kolkata and further acquisition of additional 5.5% stake in ESL through open market in fiscal year 2020 and by successfully growing our acquired businesses. We have continued our expansion plans through the recent acquisition of FACOR in FY 2021 leading to growth of Ferro Chrome plant capacity of 80,000 TPA, acquisition of DCCPL in FY 2022 through our subsidiary Sesa Mining Corporation Limited, and acquisition of assets of Gujarat NRE Coke Limited and Nicomet Industries Limited in FY 2022 through our subsidiary Malco Energy Limited leading to strengthening of our Met Coke business and becoming India’s largest producer of Nickel.
We have further strengthened our presence across commodities through an all share merger with Sesa Goa in August 2013 through the
Re-organization
Transactions. We believe our experience in operating and expanding our business in India will allow us to capitalize on attractive growth opportunities arising from India’s large mineral reserves, relatively low cost of operations and large and inexpensive labor and talent pools.Our revenue increased from 835,446 million in fiscal year 2020 to 868,630 million in fiscal year 2021, representing an increase of 33,184 million and increased to 1,311,917 million ($ 17,292 million) in fiscal year 2022, representing an increase of 443,287 million or 51.0%. This is primarily driven by higher commodity prices, higher volumes at aluminium, copper, TSPL, iron ore business and FACOR, increased premium at aluminium and HZL, rupee depreciation, partially offset by lower power sales at VAL and BALCO.
₹
₹
₹
₹
₹
The operating loss in fiscal year 2020 was 39,934 million while there was operating profit of 186,852 million in fiscal year 2021 and 389,627 million ($ 5,135 million) in fiscal year 2022.
₹
₹
₹
The following tables are derived from our selected consolidated financial data and set forth:
| • | the revenue from external customers for each of our business segments as a percentage of our revenue on a consolidated basis; |
| • | the operating profit/(loss) for each of our business segments as a percentage of our operating profit on a consolidated basis; and |
| • | the segment profit/(loss) for each of our business segments as a percentage of our segment profit on a consolidated basis. |
For the year ended March 31 | ||||||||||||
Particulars | 2020 | 2021 | 2022 | |||||||||
(in percentages) | ||||||||||||
Revenue: | ||||||||||||
Zinc – India | 21.7 | 25.2 | 21.8 | |||||||||
Zinc – International | 3.7 | 3.1 | 3.4 | |||||||||
Oil and Gas | 15.2 | 8.7 | 9.5 | |||||||||
Iron Ore | 4.1 | 5.2 | 4.8 | |||||||||
Copper | 10.8 | 12.5 | 11.5 | |||||||||
Aluminium | 31.8 | 33.0 | 38.7 | |||||||||
Power | 7.0 | 6.2 | 4.2 | |||||||||
Other (ii) | 5.7 | 6.1 | 6.1 | |||||||||
Total | 100 | 100 | 100 | |||||||||
Operating Profit / (loss): | ||||||||||||
Zinc – India | 161.6 | 49 | 33.9 | |||||||||
Zinc – International | (6.4 | ) | 2.6 | 2.6 | ||||||||
Oil and Gas | (256.5 | ) | 5.8 | 18.9 | ||||||||
Iron Ore | 11.8 | 8.6 | 5.2 | |||||||||
Copper | (32.8 | ) | (2.9 | ) | (1.2 | ) | ||||||
Aluminium | 11.1 | 32 | 38.4 | |||||||||
Power | 27.0 | 4.5 | 1.2 | |||||||||
Other (ii) | (15.8 | ) | 0.4 | 1.1 | ||||||||
Total | (100 | ) | 100 | 100 | ||||||||
Segment Profit /(loss) (i) : | ||||||||||||
Zinc – India | 41.5 | 42.5 | 35.7 | |||||||||
Zinc – International | 1.8 | 3.0 | 3.4 | |||||||||
Oil and Gas | 34.6 | 11.8 | 13.2 | |||||||||
Iron Ore | 4.0 | 6.6 | 5.0 | |||||||||
Copper | (1.4 | ) | (0.6 | ) | (0.3 | ) | ||||||
Aluminium | 9.5 | 28.3 | 38.3 | |||||||||
Power | 7.8 | 5.1 | 2.4 | |||||||||
Other (ii) | 2.2 | 3.3 | 2.3 | |||||||||
Total | 100 | 100 | 100 | |||||||||
137
| (i) | Segment profit is presented as required by IFRS 8 and is calculated by adjusting depreciation, amortization and impairment and other items as defined in note 5 Segment information of Notes to the Consolidated Financial Statements Note 5: Segment information of Notes to the Consolidated Financial Statements |
Year ended March 31, 2020
Particulars | Copper | Zinc India | Zinc International | Aluminium | Power | Iron Ore | Oil and Gas | Others | Total | |||||||||||||||||||||||||||
( ₹ in million) | ||||||||||||||||||||||||||||||||||||
Segment profit / (loss) | ( 2,894 | ) | 87,140 | 3,798 | 19,936 | 16,490 | 8,312 | 72,683 | 4,638 | 210,103 | ||||||||||||||||||||||||||
Depreciation and amortisation | (1,471 | ) | (22,610 | ) | (6,329 | ) | (17,183 | ) | (5,701 | ) | (2,413 | ) | (40,077 | ) | (4,706 | ) | (100,490 | ) | ||||||||||||||||||
Impairment | (6,692 | ) | — | — | — | — | (1,201 | ) | (135,031 | ) | (5,098 | ) | (148,022 | ) | ||||||||||||||||||||||
Other items* | (2,028 | ) | — | (42 | ) | 1,681 | — | — | — | — | (1,525 | ) | ||||||||||||||||||||||||
Operating profit / (loss) | ( 13,085 | ) | 64,530 | ( 2,573 | ) | 4,434 | 10,789 | 4,698 | ( 102,425 | ) | ( 5,166 | ) | ( 39,934 | ) | ||||||||||||||||||||||
| * | Other items represent provision for receivables from KCM of ₹ ₹ ₹ |
Year ended March 31, 2021
Particulars | Copper | Zinc India | Zinc International | Aluminium | Power | Iron Ore | Oil and Gas | Others | Total | |||||||||||||||||||||||||||
( ₹ in million) | ||||||||||||||||||||||||||||||||||||
Segment profit / (loss) | ( 1,753 | ) | 116,200 | 8,100 | 77,523 | 14,070 | 18,176 | 32,166 | 9,133 | 273,615 | ||||||||||||||||||||||||||
Depreciation and amortisation | (1,533 | ) | (24,617 | ) | (3,211 | ) | (16,926 | ) | (5,749 | ) | (2,208 | ) | (21,274 | ) | (5,660 | ) | (81,178 | ) | ||||||||||||||||||
Asset under construction written off | — | — | — | (1,811 | ) | — | — | — | (629 | ) | (2,440 | ) | ||||||||||||||||||||||||
Other items* | (2,086 | ) | — | (40 | ) | 950 | — | — | — | (2,135 | ) | (3,145 | ) | |||||||||||||||||||||||
Operating profit / (loss) | ( 5,372 | ) | 91,583 | 4,849 | 59,736 | 8,321 | 15,968 | 10,892 | 709 | 186,852 | ||||||||||||||||||||||||||
| * | Other items represent provision for receivables from KCM of ₹ ₹ ₹ ₹ |
Year ended March 31, 2022
Particulars | Copper | Zinc India | Zinc International | Aluminium | Power | Iron Ore | Oil and Gas | Others | Total | Total | ||||||||||||||||||||||||||||||
( ₹ in million) | ($ in million) | |||||||||||||||||||||||||||||||||||||||
Segment profit/(loss) | ( 1,131 | ) | 161,620 | 15,343 | 173,374 | 10,816 | 22,670 | 59,886 | 10,383 | 452,961 | 5,971 | |||||||||||||||||||||||||||||
Depreciation and amortisation | (1,467 | ) | (28,082 | ) | (5,126 | ) | (19,960 | ) | (5,700 | ) | (2,385 | ) | (22,949 | ) | (5,479 | ) | (91,148 | ) | (1,201 | ) | ||||||||||||||||||||
Impairment reversal/ (charge) | - | - | - | - | - | - | 62,745 | - | 62,745 | 827 | ||||||||||||||||||||||||||||||
Exploration cost written off | - | - | - | - | - | - | (26,181 | ) | - | (26,181 | ) | (345 | ) | |||||||||||||||||||||||||||
Asset under construction written off | - | - | - | - | - | - | - | (701 | ) | (701 | ) | (9 | ) | |||||||||||||||||||||||||||
Other Items* | (2,126 | ) | (1,342 | ) | (46 | ) | (3,757 | ) | (370 | ) | - | - | (69 | ) | (8,049 | ) | (108 | ) | ||||||||||||||||||||||
Operating profit/(loss) | ( 4,724 | ) | 132,196 | 10,171 | 149,657 | 4,746 | 20,285 | 73,501 | 4,134 | 389,627 | 5,135 | |||||||||||||||||||||||||||||
| * | Other items represent provision for receivables from KCM of ₹ ₹ ₹ ₹ ₹ ₹ |
138
| (ii) | Others includes steel which represents 4.9%, 5.4% and 5.1% of Revenue, 0.9%, 1.7% and (8.6%) of Operating Profit and 1.5%, 3.2% and 2.8% of segment profit in FY 2022, FY 2021 and FY 2020 respectively. |
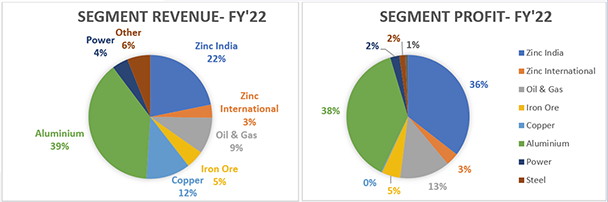
Factors Affecting Results of Operations
Our results of operations are primarily affected by commodity prices, input commodity inflation and deflation, our cost of production, our production output, government policy in India and exchange rates.
Metal and Oil Prices, Copper TcRc and Power Tariff
Overview
Our results of operations are significantly affected by the commodity prices of natural resources that we produce, which are based on LME / LBMA prices in our zinc and aluminium business, other benchmark prices in our oil, gas, iron ore and steel businesses and by the TcRc of copper in our copper business. The TcRc of copper, the commodity prices of the metals that we produce, and the benchmark price of oil, gas and iron ore can fluctuate significantly as a result of changes in the supply of and demand for zinc, lead, silver, oil, gas, iron ore, copper, aluminium and steel among others. While natural resources producers are unable to influence the market rate of the TcRc or commodity prices directly, events such as changes in smelting or commodity production capacities, temporary price reductions or other attempts to capture market share by individual natural resources producers, including our consolidated group of companies, may have an effect on market prices. Moreover, the prices realized by us can, to some extent, be affected by the terms we are able to negotiate for the contractual arrangements we enter into with buyers. Price variations and market cycles have historically influenced and are expected to continue to influence our financial performance.
During fiscal year 2022, the increase in zinc, aluminium, brent, lead, copper and silver positively affected our revenue and operating profit which was partially offset by decrease in iron ore price. During fiscal year 2022, the average LME prices of zinc, aluminium, brent, copper, lead and silver increased by 34.5%, 53.7%, 82.1%, 40.5%, 22.3% and 7.4% respectively and the average price of iron ore decreased by 8.4%.
Global commodity market is currently facing high uncertainty amid the geo-political tension between the Ukraine Russia crisis in addition to the prior crisis in the supply chain disruption. Commodity market has faced major disruptions since early CY 2022 which has revamped the global trade pattern and consumption of the commodities compelling the prices to reach all time high levels. The World Bank has expressed that the commodity prices will remain elevated through the end of CY 2024. Lower than expected Chinese commodity demand influenced by strict pandemic restriction had slowed down the commodity market growth in mid-2021, but the war has turned the commodity market upheaval. To support the ongoing recovery of the global economies, central banks had kept the policy rates accommodative for economy to bounce back from the COVID-19 related economic crisis. However, fueled by the rising energy prices, revival of demand but continued supply constraints, world economy is facing the risk of high inflation. Sharp hike in the inflation has created a pressure on the economies and their central banks to reconsider accommodative and expansionary monetary policies. To control rising inflation, a number of central banks have raised interest rates and rolled out measures to reduce excess liquidity in the market. Rising interest rates by central banks and continuity of the war and slowing Chinese economy have created further uncertainty in the commodity market. According to IMF, global economic crisis may delay the investment related to the climate change initiatives and is expected to make economies more vulnerable to the commodity prices. USA’s economy has witnessed improvement in the unemployment rate, but high cost of energy and other commodity is expected to keep the uncertainty around. Europe has been impacted by the geo-political crisis more adversely with the dependency of energy supply and other major commodities from Russia. In addition to the inflation pressure and economic recovery from the pandemic, European countries have been facing additional fiscal pressure from the spending on the energy security and defence budget.
139
Zinc and Aluminium
The revenue of our zinc and aluminium businesses fluctuates based on the volume of our sales and the respective LME prices of zinc, lead and aluminium and the LBMA price of silver. Our zinc business is fully integrated, and its profitability is dependent upon the difference between the LME price of zinc and lead, LBMA price of silver and our cost of production, which includes the costs of mining and smelting. For the portion of our aluminium business where the bauxite is sourced from BALCO’s own bauxite mines, profitability is dependent upon the LME price of aluminium less our cost of production, which includes the costs of bauxite mining or purchase of bauxite from third parties, transportation costs, refining of bauxite into alumina and smelting of alumina into aluminium. For the portion of our aluminium business where alumina is sourced from third parties, profitability is dependent upon the LME price of aluminium less cost of the sourced alumina and our cost of production.
Zinc LME prices remained volatile during year FY 2022, starting off the year at $ 2,766 per ton levels and gradually recovering to pre-COVID levels. Prices are currently at $ 4,260 per ton at March 2022 end.
During fiscal year 2022, 83.2% and 45.8% of BALCO and Jharsuguda’s alumina requirements, respectively, were met through imports and domestic supplies from third parties, and the balance were supplied by our Lanjigarh alumina refinery. The following table sets forth the daily average zinc aluminium LME prices for each of the last three fiscal years:
For the Year Ended March 31, | ||||||||||||
Particulars | 2020 | 2021 | 2022 | |||||||||
(in $ per ton/ounce) | ||||||||||||
Zinc LME | 2,402 | 2,422 | 3,257 | |||||||||
Aluminium LME | 1,749 | 1,805 | 2,774 | |||||||||
Lead LME | 1,952 | 1,868 | 2,285 | |||||||||
Silver LBMA * | 16.5 | 22.9 | 24.6 | |||||||||
| * | silver is denominated in $/ ounce |
The average LME aluminium prices for the year FY 2022 was $ 2,774 per ton, an increase of approximately 54% over FY 2021 average of $ 1,805 per ton. Throughout the fiscal year, the aluminium market witnessed significant volatility but overall, the market had been significantly bullish for FY 2022. The LME prices averaged around $ 2,400 per ton in quarter 1 of FY 2022 and $ 2,648 per ton in quarter 2 of FY 2022, primarily driven by the higher metal demand post the
Covid-19
induced economic demand slump. Commodity market became more bullish pertaining to the higher energy cost and Ukraine Russia crisis. In the last two quarters the prices were at $ 2,762 per ton in quarter 3 of FY 2022 and $3,280 per ton in quarter 4 of FY 2022. The demand showed bullish sentiments, which was backed by reduced no. of covid cases across the globe and the demand increased by approximately 10% in FY 2021 to approximately 69 million tons from approximately 63 million tons in FY 2020. The global demand for primary aluminium have been increased by approximately 1% in FY 2022 to approximately 70 million tons, the biggest boost coming from construction and transport sector across geographies backed by government stimulus.Steel
The revenue of our steel business fluctuates based on the volume of our sales and the prices of steel in domestic market in fiscal year 2022. More than 90.0% of the sales in steel business happened in domestic market (99.0% in fiscal year 2021) and its prices are directly affected by the demand and supply of steel in the domestic market. Our major raw materials are iron ore and coking coal. Iron ore is entirely sourced from domestic market. Coking coal is mostly imported and is generally purchased based on index price or spot prices. Any fluctuation in coking coal and iron ore prices impacts our cost of production. The steel prices are influenced by many factors including demand, supply, raw material cost, capacity utilization and improvement in manufacturing process. The profitability of our steel business is determined based on the sale price less the purchase price of raw material including manufacturing cost.
The following table sets forth the prices for each of the last three fiscal years:
($ per ton) | ||||||||||||
For the year ended March 31, | ||||||||||||
Particulars | 2020 | 2021 | 2022 | |||||||||
Pig irons | 354 | 382 | 546 | |||||||||
Billet | 418 | 336 | 613 | |||||||||
TMT | 494 | 539 | 688 | |||||||||
Wire rod | 519 | 537 | 707 | |||||||||
DI pipe | 602 | 545 | 629 | |||||||||
Average steel price ($ per ton) | 495 | 488 | 660 | |||||||||
Average sales realization increased 35%from $ 488 per ton in fiscal year 2021 to $ 660 per ton in fiscal year 2022. Prices of iron and steel are influenced by several macro-economic factors. These include global economic slowdown,
y-o-y
US-China
trade war, supply chain destocking, government spend on infrastructure, the emphasis on developmental projects, demand-supply forces, the PMI in India and production and inventory levels across the globe, specially China.140
Crude oil and natural gas
Movement in the price of crude oil and discount to oil prices based on quality parameters significantly affect the results of operation of our oil and gas business and decline in crude oil and natural gas prices may adversely affect our revenues and profits. Historically, international prices for oil have been volatile and have fluctuated widely due to many factors that are beyond our control, including, but not limited to overall economic condition, supply and demand dynamics for crude oil and natural gas, political developments, the ability of petroleum producing nations to set and maintain production levels and prices, the price and availability of other energy sources and weather conditions.
The following table sets out the average price of Dated Brent, an international benchmark of oil blend for each of last three fiscal years:
For the Year Ended March 31, | ||||||||||||
Particular | 2020 | 2021 | 2022 | |||||||||
($ per barrel) | ||||||||||||
Dated Brent | 60.9 | 44.6 | 81.1 | |||||||||
Crude oil price averaged $ 81.1 per barrel in FY 2022, compared to $ 44.6 per barrel in the previous year driven by vaccination effort, easing of lockdown restrictions and economic growth optimism.
Two years after shaking markets,
COVID-19
once again caused record infections from Omicron variant which introduced some uncertainty into oil markets but this time the surge had muted impact on oil consumption. Indeed, mobility indicators remain robust and oil demand has been stronger than expected in recent month. Resurgence ofCOVID-19
infections and renewed lockdowns in key economies delayed economic recovery specially in the Euro-zone, Japan, and India, which kept growth rates low in the first half of CY 2021. However, vaccination efforts and the easing of lockdown restrictions lend optimism boosted oil demand supported by rising mobility and travelling activities.Global oil supply increased by 5.4 Mbpd to 97.3 Mbpd in FY 2022. The main drivers of oil supply growth were USA, Russia, Saudi Arabia, and Iraq.
In FY 2022, world oil demand substantially outpaced FY 2021 historically low levels with an increase of 6.8 mb/d to 98.5 Mbpd.
Realization discount to Brent
The prices of various crude oil are based upon the price of the key benchmark crude oil such as Dated Brent, West Texas Intermediate, and Dubai/Oman. The crude oil prices move based upon market factors such as demand and supply. The regional producers price their crude oil on a premium or discount over the benchmark crude oil based upon differences in quality and competitiveness of various grades.
For Rajasthan, sales to private refiners are benchmarked to Dated Brent with a fixed discount of 2.7% for FY 2022 and sales to PSU refiners continue to be based on Bonny Light, a West African low sulphur crude oil that is frequently traded in the region. For Ravva and Cambay blocks, the crude oil is also benchmarked to Bonny Light, with appropriate adjustments for crude quality. For fiscal year 2022, the discount to Dated Brent averaged 4.6% for Rajasthan 7.2 % for Cambay and 3.3% for Ravva, due to the prevailing oil market conditions. Dated Brent reflects the values of North Sea cargo loading within the next
10-25
days, it incorporates the Brent, Forties, Oseberg and Ekofisk crude oil with the most competitive grade setting the price.Movements in the discount range affect our revenue realization and any increase in quality differentials may adversely impact our revenues and profit.
Iron Ore
The revenue of the iron ore business fluctuates based on the volume of sales and the market price of iron ore. The prices for iron ore are significantly dependent on the global and regional imbalances between the demand and supply of iron ore, worldwide steel-making capacity and transportation costs. The profitability of the iron ore business is dependent on its selling price, grade and cost of production which includes cost of extracting, processing iron ore and royalty.
The following table sets forth the daily average iron ore prices (62.0% iron) for each of the last three fiscal years:
For the Year Ended March 31, | ||||||||||||
Particulars | 2020 | 2021 | 2022 | |||||||||
(in $ per dmt) | ||||||||||||
China imported iron ore fines (62.0% iron, cost and freight Tianjin Port) | 94.84 | 166.9 | 152.8 | |||||||||
For Iron ore prices, Year 2021 opened with a strong upward trend with index being relatively on a higher side touching a high of $ 229.55 in May 21 and further, hovering at the near same levels (above $ 200) till July 21. Post which, prices had been declining continously from Aug 21 to Nov 21 to as low as $ 87.2 in November. Further, Index again commenced an upward journey post January while touching a high of $ 162.75 mainly due to Russia Ukraine War scenario.
141
Copper
The revenue of our copper business fluctuates based on the volume of our sales and the LME price of copper. However, as our copper business is primarily one of custom smelting and refining, the profitability of our copper business is significantly dependent upon the market rate of the TcRc. We purchase copper concentrate at the LME linked price for the relevant quotational period less a TcRc that we negotiate with our suppliers but which is influenced by the prevailing market rate for the TcRc. The market rate for the TcRc is significantly dependent upon the availability of copper concentrate, worldwide copper smelting capacity and transportation costs. The TcRc that we are able to negotiate is also substantially influenced by the TcRc terms established by certain large Japanese custom smelters. The profitability of our copper business as to the portion of our copper business where we source copper concentrate from third parties, which accounted for 100% of our copper concentrate requirements, is thus dependent upon the amount by which the TcRc we are able to negotiate exceeds our smelting and refining costs. Sinc fiscal year 2019, as the smelter operations at Tuticorin were shut, the Company procured Anodes and Cathodes with negotiated Rc. The profitability of our copper operations is also affected by the prices we receive upon the sale of
by-products,
such as sulphuric acid and gypsum and precious metals, which are generated during the copper smelting and refining process. The prices we receive forby-products
can vary significantly, including as a result of changes in supply and demand and local market factors in the location theby-product
is produced. The following table sets forth the average TcRc that we have realized for each of the last three fiscal years:For the Year Ended March 31, | ||||||||||||
Particulars | 2020 | 2021 | 2022 | |||||||||
Copper TcRc (in US cents per pound) | 2.8 | (1) | 3.3 | (1) | 5.7 | (1) | ||||||
Copper LME (in US $ per tonne) | 5,855 | 6,897 | 9,689 | |||||||||
| (1) | Above TcRc is computed net of premium paid on purchase of cathodes in fiscal year 2020, fiscal year 2021 and fiscal year 2022. |
Power
We operate 600 MW unit as an independent power plant at Jharsuguda. It has a power supply agreement with GRIDCO. BALCO used to operate 600 MW (2 X 300 MW) independent power plants. Now, it just operates 300 MW unit as an IPP. The other 300 MW unit has been converted to a captive power plant (“CPP”), as per order received from CSERC dated January 1, 2019, for conversion of 300 MW capacity from IPP to CPP from April 1, 2017. The MALCO plant has been put under care and maintenance from May 26, 2017.
The 1,980 MW thermal power plant at Talwandi Sabo was set up for commercial power sales. It has a PPA with PSPCL. The fuel cost subject to quoted efficiency will be a pass-through and revenue is linked to the Plant Availability Factor.
The average power realization price for TSPL for the years ended March 31, 2020, 2021 and 2022 are 3.7/unit, 3.0/unit and 3.6/unit respectively based on Plant Availability Factor. The average power realization price (excluding TSPL) for the years ended March 31, 2020, 2021 and 2022 was 3.6, 3.1 and 3.1 per unit respectively.
₹
₹
₹
₹
₹
₹
India Market Premium
Generally, our products in India are sold at a premium to the LME market price due to a number of factors including the customs duties levied on imports by the GoI, the costs to transport metals to India and regional market conditions. See” As a result, we endeavor to sell large quantities of our products in India.
“Government Policy.
Hedging
We engage in hedging strategies to a limited extent to partially mitigate our exposure to fluctuations in commodity prices, as further described in “” of Notes to the Consolidated Financial Statements.
Note 25: Financial Instruments
Costs of Production
Our results of operations are, to a significant degree, dependent upon our ability to efficiently run our operations and maintain low costs of production. Efficiencies relating to recovery of metal from the ore, oil and gas extraction, process improvements,
by-product
management and increasing productivity help drive our costs down. Costs associated with mining and metal production include ore extraction and processing costs at our captive mines, energy costs, labor costs and other manufacturing expenses. Costs of production also include cost of alumina for our aluminium business.The cost of production of our oil and gas business include expenditure incurred towards the production of crude oil and natural gas including statutory levies, such as cess, royalties (excluding the RJ block) and production payments payable pursuant to the PSC’s. Cess forms a major component of the cost of production and any change in the rate of the cess will impact the result of the operations.
142
The cost of production of copper for our custom smelting and refining operations consists of cost of converting copper concentrate into copper cathodes but does not include the cost of copper concentrate. We purchase copper concentrate at the LME price for copper metal for the relevant quotational period less a TcRc that we negotiate with our suppliers, but which is influenced by the prevailing market rate for the TcRc. We attempt to make the LME price a pass through for us as both the copper concentrate purchases, and sales of finished copper products are based on LME prices. The profitability of the copper custom smelting and refining business is therefore dependent upon the amount by which the TcRc that we negotiate with our external suppliers exceeds our smelting and refining costs.
Energy cost is the most significant component of the cost of production in our metal production businesses. Most of our power requirements are met by captive power plants, which are primarily coal fueled. Thermal coal, diesel fuel and fuel oil, which are used to operate our power plants, and metallurgical coke, which is used in the zinc smelting process, are currently sourced from a combination of long term and spot contracts. Our iron ore business meets most of its power requirement through its 60 MW captive power plant and from the grid run by the electricity department of the government and in the event the requirement of power is not satisfied through the grid, then we use generators. Our aluminium smelters, which have high energy consumption due to the power intensive nature of aluminium smelting operation, sources its thermal coal requirement from Coal India Limited and its subsidiaries through linkages, linkage auctions and
E-Auctions,
Importers and Traders. Mahanadi Coalfields Limited and Southeastern Coal Fields Limited, subsidiaries of Coal India Limited are the majority suppliers. The latest linkage auction coal from Tranche V, 15mtpa quantity, started to materialize from January 2022. We also strategically bid for captive coal blocks as and when they are offered for auctions by Ministry of Coal, GoI. During the fourth quarter of fiscal year 2015, BALCO was successful in securing one coal mine in coal block auctions conducted by the GoI, namely the Chotia Coal block. The productions commenced at the Chotia mine during the fourth quarter of fiscal year 2016. The total reserves at the Chotia block are 19.66 million tons as on April 1, 2020, with the annual production capacity of one million tons and during FY20, 1.0MT coal was produced from Chotia II, reducing the on date extractable coal reserve to 18.66MT and no major coal production (only 0.002 MT produced) in FY 2021 due to ongoing pandemic situation. There was nil production in FY 2022 as low GCV has rendered operations being uneconomical. Further, the Company has made a request for surrender of mining lease and discharge of CMDPA to the office of Nominated Authority in June 2021.We secured the Jamkhani coal block in the captive coal block auctions conducted by the Ministry of Coal, GoI. It will cater to power generation for Jharsuguda smelting operations. We have signed the Coal Mine Development and Production Agreement (“CMDPA”) with GoI and received Vesting Order for the coal block. The mine currently has a capacity of 2.6 mtpa. The production at this mine is expected to commence from July, 2022. We expect it to improve our coal materialization performance for Jharsuguda.
The Company has secured the Radhikapur West coal block in tranche 11 of the coal block auction. The Company entered into the CMDPA with the GoI on January 11, 2021. This has a mine capacity of 6 mtpa. The production at this mine is expected to commence from September, 2022
During the year, the Company won the Kuraloi (A) North Coal Block during the first tranche of auction under the MMDR Act. Vedanta entered into the CMDPA in respect of such coal block with the GoI on September 3, 2021. The mine has a capacity of 8 mtpa, which can additionally help us to meet the group’s coal requirements. The production at this mine is expected to commence from September, 2023.
HZL continues to import significant coal requirement from third party suppliers and balance is sourced through linkage. HZL’s operations source their back - up power from liquid fuel-bases captive power plants or from local power companies. The liquid fuel is sourced from third - party suppliers on yearly contracts.
For our zinc, iron ore and captive bauxite ore operations at BALCO, where we source the ore from our own mines, ore extraction and processing costs affect our cost of production. In our iron ore businesses, the ore extraction and processing costs to produce saleable ore are generally a small percentage of our overall cost of production of the finished metals. In our alumina refinery at Lanjigarh, alumina is produced from bauxite ore. The cost of production of alumina is dependent on the cost of bauxite and cost of converting it to alumina. In fiscal year 2022, the cost of bauxite makes up for almost 52.0% of the cost of production, wherein bauxite logistics is a major component. Our bauxite sourcing is from several sources including Odisha Mining Corporation (“OMC”) captive mines at BALCO and other global suppliers.
In iron ore, logistics represents approximately 25.0% to 30.0% of the total cost of production in the case of exports. In addition, a significant cost of production in our zinc and iron ore business is the royalty that HZL pays on the lead-zinc ore that is mined, which royalty is a function of the LME prices of zinc and lead, and the iron ore pays on extraction of iron ore at the rate declared by the Indian Bureau of Mines. See “”
Government Policy—Taxes, royalties and cess payments.
In steel, cost comprises of iron ore fines, lumps, pellets and mill scale, coking coal comprises of hard coking, semi soft coking coal, high fluidity coal and fluxes which includes limestone and Dolomite. This cost also includes conversion cost of hot metal into saleable products such as Wire Road, TMT Bar, DI Pipe, Pig iron and billets. Iron ore and coking coal are major cost drivers.
143
In the commercial power generation business, production costs are primarily coal costs, and the coal are largely sourced from the domestic market.
We outsource a majority of BALCO’s mining operations, a substantial portion of HZL’s and iron ore’s mining operations, Oil and Gas operations and a limited number of functions at our copper and zinc operations to third party contractors. The operations and maintenance activities at the Jharsuguda 1215 MW and 2400 MW power facilities, BALCO’s 540 MW and 1,200 MW power facilities and TSPL 1,980 MW power facilities are substantially outsourced to third party contractors.
Other manufacturing expenses include, among other things, additional materials and consumables that are used in the production processes and routine maintenance to sustain ongoing operations. None of these represents a significant portion of our costs of production.
Cost of production as reported for our metal products includes an offset for any amounts which we receive upon the sale of the
by-products
from the refining or smelting processes. We present costs of production for our metal products on the following basis:| (i) | cost of production before by-product revenue, which represents the direct costs relating to production and conversion costs of metal (such as energy costs, ore extraction costs and processing costs at our captive mines, labor costs and other manufacturing expenses), excluding depreciation, impairment charges and finance costs, and |
| (ii) | cost of production net of by-product revenues which represents cost of production beforeby-product revenue offset by any amounts which we receive upon sale ofby-products from such operations. Offsettingby-product revenues is useful to the management and investors to compare our cost competitiveness with our peers in the industry as it is a common metric used by our peers in the industry. |
| (iii) | Cost of production before by-product revenue and net ofby-product revenue is divided by the daily average exchange rate for the year to calculate US dollar cost of production per lb or per ton of metal as reported. |
The following table sets forth our average realized TcRc and cost of production for each of our metals, power, oil and gas for each of the last three fiscal years:
Particulars | For the Year Ended March 31, | |||||||||||||
Unit of Measurement | 2020 | 2021 | 2022 | |||||||||||
(in US dollars per ton, except as indicated) | ||||||||||||||
TcRc (1) | ¢/lb | 2.8 | 3.3 | 5.7 | ||||||||||
Cost of production before by-product revenue(2) | ||||||||||||||
Zinc India (3) | $/ton | 1,495 | 1,401 | 1,723 | ||||||||||
Zinc International (4) | $/ton | 1,797 | 1,479 | 1,673 | ||||||||||
Oil and Gas (5) | $/boe | 22.4 | 21.7 | 35.7 | ||||||||||
Iron ore (6) | $/ton | 17.1 | 17.2 | 14.9 | ||||||||||
Copper smelting and refining (7) | ¢/lb | 23.2 | 14.2 | 14.9 | ||||||||||
Aluminium (8) | $/ton | 1,690 | 1,347 | 1,858 | ||||||||||
Steel | $/ton | 415 | 386 | 576 | ||||||||||
Power – Jharsuguda 600 MW plant (10) | ₹ | 3.9 | 2.5 | 2.7 | ||||||||||
Cost of production net of by-product revenue(2) | ||||||||||||||
Zinc India (3) | $/ton | 1,371 | 1,286 | 1,567 | ||||||||||
Zinc International (4) | $/ton | 1,665 | 1,307 | 1,442 | ||||||||||
Oil and Gas (5) | $/boe | 22.4 | 21.7 | 35.7 | ||||||||||
Iron ore (6) | $/ton | 17.1 | 17.2 | 14.9 | ||||||||||
Copper smelting and refining (7) | ¢/lb | 23.2 | 14.2 | 14.9 | ||||||||||
Aluminium (8) | $/ton | 1,690 | 1,347 | 1,855 | ||||||||||
Steel (9) | $/ton | 415 | 386 | 576 | ||||||||||
Power – Jharsuguda 600 MW plant (10) | ₹ | 3.9 | 2.5 | 2.7 | ||||||||||
| (1) | Represents our average realized TcRc for the year and TcRc is computed net of premium paid on purchase of cathodes in fiscal year 2020, 2021 and 2022. |
| (2) | Cost of production per unit is not a recognized measure under IFRS as issued by the IASB. We have included cost of production as it is a key performance indicator used by the management to assess the performance of our operations. We also believe it is a measure used by investors and analysts to evaluate companies in our industry. Our results of operations are, to a significant degree, dependent upon our ability to efficiently run our operations and maintain low costs of production. Efficiencies relating to recovery of metal from the ore, process improvements, by-product management and increasing productivity help drive our costs down. Our computation of cost of production should be considered in addition to, and not as a substitute for other measures of financial performance and liquidity reported in accordance with IFRS as issued by the IASB. Cost of production is a measure intended for monitoring the operating performance of our operations. This measure is presented by other metal companies, though our measure may not be comparable to similarly titled measures reported by other companies. |
144
| (3) | Cost of production of zinc before by-product revenue increased from $ 1,401 per ton for fiscal year 2021 to $ 1,723 per ton for fiscal year 2022. The increase is mainly due to higher coal prices and input commodity inflation partly offset by higher volume, better Sulphuric Acid realizations and improved recoveries. The cost of production of zinc net ofby-product revenue increased from $ 1,286 per ton in fiscal year 2021 to $ 1,567 per ton in fiscal year 2022. The increase was due to aforementioned reasons partially offset by higher sulphuric acid credit on account of higher net sales realisation (“NSR”) in fiscal year 2022. |
| (4) | Cost of production for Zinc International net of by-product credit increased from $1,307 per ton to $1,442 per ton, an increase of 10.4%. This was mainly driven by higher mining costs, TCRCs, exchange rate appreciation and annual inflation offset by higher production at Gamsberg. Cost of production before by-product revenue increased from $1,479 to $1,673. |
| (5) | Cost of production for oil and gas, increased to $ 35.7 per net boe in fiscal year 2022 from $ 21.7 per net boe in fiscal year 2021, primarily on account of increase in cess on ad-valorem basis due to increase in average Brent price realizations and Increase in JV expenses due to increase in Polymer prices. |
| (6) | Cost of production for iron ore, decreased from $ 17.2 per ton in fiscal year 2021 to $ 14.9 per ton in fiscal year 2022. We bought 1.1 million tonnes low grade iron ore in auctions held by Goa Government in Auction No -25,26 and 27. These ore along with opening stock of ore purchased in 23rd and 24th auction and fresh royalty paid ore moved out of mines post the Hon’ble Supreme Court order, were then beneficiated and around 1.1 million tonnes were exported. |
| (7) | Cost of production for copper has increased from ¢/lb 14.2 to ¢/lb 14.9 primarily on account of higher fuel cost in fiscal year 2022, partially offset by operational efficiencies. |
| (8) | Cost of production for Aluminium before adjusting by-product revenue increased from $ 1,347 per ton in fiscal year 2021 to $ 1,858 per ton in fiscal year 2022. The increase is on account of headwinds in cost due to rising commodity prices and the coal crisis, we undertook several structural initiatives to make our business immune from market induced volatilities. The cost of production net ofby-product credit increased from $ 1,347 per ton in fiscal year 2021 to $ 1,855 per ton in fiscal year 2022. |
| (9) | Cost of production for steel business has increased from $ 386 per ton to $ 576 per ton in the fiscal year 2022. This was primarily due to increase of coking coal prices and significant losses in operational inefficiencies. |
| (10) | Power cost at Jharsuguda 600 MW plant has marginally increased from ₹ ₹ |
We present below the cost of production for our metal products on the following basis:
| (i) | Cost of production before by-product revenue, which represents the direct costs relating to production and conversion costs of metal (such as energy costs, ore extraction costs and processing costs at our captive mines, labor costs and other manufacturing expenses), excluding depreciation, impairment charges and finance costs, and |
| (ii) | Cost of production net of by-product revenues which represents cost of production beforeby-product revenue offset by any amounts we receive upon sale ofby-products from such operations. Offsettingby-product revenues is useful to the management and investors to compare our cost competitiveness with our peers in the industry as it is a common metric used by our peers in the industry. |
We explain the cost of production for each metal as set forth below:
| • | In the case of Zinc India operations, where we have integrated operations from production of zinc ore to zinc metal, cost of production before by-product revenue is the cost of extracting ore and conversion of the ore into zinc metal ingots. Payment of royalty and provision towards contribution to DMF and NMET is included in determining the cost of production. Cost of production net ofby-product revenue represents cost of production beforeby-product revenue, net of revenue earned from theby-product sulphuric acid, which is deducted from the cost of production consistent with the industry practice. The total cash cost beforeby-product revenue and net ofby-product revenue is divided by the total number of tons of zinc metal produced to calculate the cost of production beforeby-product revenue and net ofby-product revenue per ton of zinc metal. Our Zinc India segment primarily consists of zinc ingot production and lead is only aco-product of zinc while silver is aby-product arising from lead smelting process. Accordingly, the cost of production presented for Zinc India operations is only for zinc ingot production and the cost of production of lead and silver are not presented. |
| • | Our Zinc International operations consist of the Skorpion mine and refinery in Namibia, Black Mountain mine, which includes new Gamsberg mine in South Africa and the Lisheen mine in Ireland which ceased operations in December 2015. Skorpion produces special high-grade zinc ingots. As a result, the cost of production before by-product revenue with respect to the Skorpion mine consists of the total direct cost of mining zinc ore and producing zinc in the refinery through a leaching, refining and electrowinning process. Skorpion mine does not produce any materialby-products. Skorpion Zinc has been under Care and Maintenance since the start of April 2020, following cessation of mining activities due to geotechnical instabilities in the open pit. Activities to restart the mine are progressing well. Cost of production beforeby-product revenue of zinc at Black Mountain mine consists of direct mining costs, concentrate costs, TcRc and direct services cost. Cost of production net ofby-product revenue represents cost of production beforeby-product revenue, net of revenue from copper consistent with the industry practice. At Black Mountain mine lead is only aco-product of zinc while silver is aby-product of lead. Accordingly, the cost of production presented for Black Mountain mine is only for zinc production and the cost of production of lead and silver are not presented. Royalties paid are also included in the cost of production. The total cash cost beforeby-product revenue and net ofby-product revenue is divided by the total number of tons of zinc metal produced or zinc metal in concentrate produced to calculate the cost of production beforeby-product revenue and net ofby-product revenue per ton of zinc metal produced or zinc metal in concentrate produced. Gamsberg mine has been ramping up well in fiscal year 2022. Cost of production beforeby-product revenue of zinc at Gamsberg consists of direct mining costs, concentrate costs, TcRc and direct services cost. Gamsberg mine does not produce any materialby-products. |
145
| • | The cost of production in our oil and gas business consists of expenditure incurred towards the production of crude oil and natural gas including statutory levies, such as cess, royalties (except the RJ block) and production payments payable pursuant to the PSC’s as well as operational expenditures such as costs relating to manpower, repairs and maintenance of facilities, power generation and fuel for such facilities, water injection, insurance, and storage, transportation and freight of crude oil and natural gas, among others. Cess forms a major component of the cost of production and any change in the rate of the cess will impact the result of the operations. The total production cost is divided by the entitlement interest quantity of oil and gas produced to determine the cost of production per barrel of oil equivalent. |
| • | In the case of iron ore, cost of production relates to the iron ore mining and processing cost. Payment of royalty fees and provision towards contribution to DMF and NMET are included in determining the cost of production at Goa, whereas at Karnataka iron ore business royalties are under scope of buyer. The total cost is divided by the total number of tons of iron ore produced to calculate the cost of production per ton of iron ore. Our iron ore segment also includes met coke and pig iron. However, the cost of production presented for iron ore operations does not include met coke and pig iron. |
| • | Our iron ore operations in Goa were recommenced in August 2015, after receiving necessary approvals from the Goa state government. Our iron ore operations had been suspended till fiscal year 2015 due to the continued mining ban in the state of Goa. The Hon’ble Supreme Court passed its final order in the matter on February 7, 2018 wherein it set aside the second renewal of the mining leases granted by the State of Goa. The Hon’ble Supreme Court directed all lease holders operating under a second renewal to stop all mining operations with effect from March 16, 2018 until fresh mining leases (not fresh renewals or other renewals) and fresh environmental clearances are granted under the Mines and Minerals (Development and Regulation) (MMDR) Act. We continue to engage with the Government for the resumption of mining operations. |
| • | In the case of copper, cost of production before by-product and free copper revenue relates only to our custom smelting and refining operations (and not for our mining operations) and consists of the cost of converting copper concentrate into copper cathodes, including the cost of freight of copper anodes from Tuticorin to Silvassa. Cost of production net ofby-product and free copper revenue represents cost of production beforeby-product and free copper revenue, net of revenue earned from the sale ofby-product, sulphuric acid and copper metal recovered in excess of paid copper metal are deducted from the cash costs, in line with the cost reporting practice of custom smelters globally. The total cash costs beforeby-product and free copper revenue and net ofby-product and free copper revenue are divided by the total number of pounds of copper metal produced to calculate the cost of production beforeby-product and free copper revenue and net ofby-product and free copper revenue per pound of copper metal produced. |
| • | The TNPCB through an order, dated April 9, 2018, rejected the consent renewal application of Vedanta Limited for its copper smelter plant at Tuticorin. It directed Vedanta Limited not to resume production operations without formal approval/consent (vide order dated April 12, 2018), and directed the closure of the plant and the disconnection of electricity (vide order dated May 23, 2018). |
| • | The Government of Tamil Nadu also issued an order dated May 28, 2018 directing the TNPCB to permanently close and seal the existing copper smelter at Tuticorin; this was followed by the TNPCB on May 28, 2018. Vedanta Limited filed a composite appeal before the NGT against all the above orders passed by the TNPCB and the Government of Tamil Nadu. In December 2018, NGT set aside the impugned orders and directed the TNPCB to renew the CTO. The order passed by the NGT was challenged by Tamil Nadu State Govt. in Hon’ble Supreme Court. |
| • | The Hon’ble Supreme Court on February 18, 2019 set aside the NGT judgment dated December 15, 2018 on the grounds of maintainability, allowing Vedanta Limited the liberty to approach the High Court of Madras to challenge all the orders collectively, stating that no plea of alternative remedy shall be allowed. |
| • | Based on the said order, Vedanta Limited has filed a writ petition before the Principal Bench of the High Court of Madras and has additionally filed an application seeking interim relief for care and maintenance of the plant. The High Court of Madras vide its judgement dated August 18, 2020 dismissed the writ petition filed by the Company. The Company has approached the Hon’ble Supreme Court and challenged the said High Court of Madras order by way of a SLP to Appeal and also filed an interim relief for care and maintenance of the plant. The matter was then listed on December 2, 2020 before Hon’ble Supreme Court Bench. The Bench after having heard both the sides concluded that at this stage the interim relief in terms of trial run could not be allowed. Further, considering the voluminous nature of documents and pleadings, the matter shall be finally heard on merits. Further, Hon’ble Supreme Court held that the case will be listed once physical hearing resumes in Hon’ble Supreme Court. After a series of computer-generated hearing dates, the matter was taken up on March 15, 2022 and was part heard. The matter was to be further heard on March 22, 2022, however due to reconstitution of the bench the matter was not listed. The Hon’ble Supreme Court has, on May 20, 2022, ordered for the interlocutory application that was filed by Vedanta Limited before the Hon’ble Supreme Court for the maintenance of status quo as on March 15, 2022 consequent to an order passed by the Collector of Tuticorin requiring Vedanta Limited employees to vacate the plant premises to be listed for hearing along with the main matter on the next date of listing. |
| • | Cost of production of aluminium is weighted average cost of production of our Jharsuguda and BALCO aluminium smelters. The cost of production before by-product revenue includes cost of purchased alumina and the cost of captive alumina produced at Lanjigarh. Cost of production net ofby-product revenue represents cost of production beforeby-product revenue, net of revenue earned from the sale ofby-products, such as vanadium, which is consistent with the industry practice. The total cash cost beforeby-product revenue and net ofby-product revenue is divided by the total quantity of hot metal produced to determine the cost of production beforeby-product revenue and net ofby-product revenue per ton of aluminium hot metal produced. Hot metal production volumes are used instead of the cast metal production volumes disclosed, elsewhere in this Annual Report, for calculating cost of production. This is because, the hot metal production, which excludes the value-added cost of casting, is the measure generally used in the aluminium metal industry for calculating measures of cost of production. |
146
| • | In the case of steel, the cost of production after by-product revenue includes the cost of producing hot metal which includes iron bearing raw material comprises of iron ore fines, lumps, pellets and mill scale, Coking coal comprises of hard coking, semi soft coking coal, high fluidity coal, limestone and Dolomite etc. This Cost also includes conversion cost of hot metal into saleable products such as Wire Road, TMT Bar, DI Pipe, Pig iron and billets. The total cost beforeby-product revenue and net ofby-product revenue is divided by total quantity to determine the cost of production beforeby-product and net ofby-product revenue per ton of steel produced. |
| • | Cost of production before by-product revenue and net ofby-product revenue is divided by the daily average exchange rate for the period to calculate US dollar cost of production per lb or per ton of metal or per barrel of oil equivalent as reported. |
| • | Cost of production of power for Jharsuguda 600 MW power plant (excluding 274 MW HZL wind power plant, the TSPL 1,980 MW, IPP 300 MW BALCO power plant and the 106.5 MW MALCO’s power plant) includes the cost of coal and other liquid fuels used for generating power and other overhead costs such as operating, maintenance and manpower costs. The total cost is divided by the total net units generated to calculate the cost of production per unit of energy produced. |
For the Year Ended March 31, | ||||||||||||||||||||
Segments | 2018 | 2019 | 2020 | 2021 | 2022 | |||||||||||||||
( ₹ in millions, except Production output and Cost of production) | ||||||||||||||||||||
Zinc—India: | ||||||||||||||||||||
| Segment revenue | 216,136 | 206,562 | 181,590 | 219,316 | 286,241 | |||||||||||||||
| Segment profit | (122,596 | ) | (105,995 | ) | (87,140 | ) | (116,200 | ) | (161,620 | ) | ||||||||||
93,540 | 100,567 | 94,450 | 103,116 | 124,621 | ||||||||||||||||
| Cost of lead metal sold | (15,027 | ) | (20,664 | ) | (19,450 | ) | (21,370 | ) | (22,703 | ) | ||||||||||
| Others (c) | (3,097 | ) | (6,386 | ) | (2,075 | ) | (7,478 | ) | (2,371 | ) | ||||||||||
Total before adjusting for by-product revenues | 75,416 | 73,517 | 72,925 | 74,268 | 99,547 | |||||||||||||||
By-product revenue | (5,791 | ) | (6,335 | ) | (6,059 | ) | (6,083 | ) | (9,046 | ) | ||||||||||
Total after adjusting for by-product revenues | 69,625 | 67,182 | 66,866 | 68,185 | 90,501 | |||||||||||||||
| Production output (in tons) | 791,461 | 696,283 | 688,286 | 715,446 | 775,808 | |||||||||||||||
| Cost of production before by-product revenue (per ton) (a) | $ | 1,479 | $ | 1,511 | $ | 1,495 | $ | 1,401 | $ | 1,723 | ||||||||||
| Cost of production net of by-Product revenue (per ton) (a) | $ | 1,365 | $ | 1,381 | $ | 1,371 | $ | 1,286 | $ | 1,567 | ||||||||||
| Cost of production net of by-Product revenue (per ton) (a) | ₹ | 87,971 | ₹ | 96,488 | ₹ | 97,150 | ₹ | 95,304 | ₹ | 1,16,655 | ||||||||||
Zinc—International: | ||||||||||||||||||||
Segment revenue | 34,458 | 27,383 | 31,275 | 27,290 | 44,844 | |||||||||||||||
Segment profit | (14,145 | ) | (6,962 | ) | (3,798 | ) | (8,100 | ) | (15,343 | ) | ||||||||||
20,313 | 20,421 | 27,477 | 19,190 | 29,501 | ||||||||||||||||
Treatment and Refining Charges (TcRc) | 332 | 959 | 5,646 | 6,242 | 3,128 | |||||||||||||||
Cost of lead metal sold | (3,160 | ) | (3,392 | ) | (3,031 | ) | (2,114 | ) | (3,369 | ) | ||||||||||
Others (c) | (4,027 | ) | (1,789 | ) | (4,258 | ) | (4,164 | ) | (5,125 | ) | ||||||||||
Total before adjusting for by-product revenues | 13,458 | 16,199 | 25,834 | 19,154 | 24,135 | |||||||||||||||
By-product revenue | (1,950 | ) | (2,701 | ) | (1,893 | ) | (2,235 | ) | (3,327 | ) | ||||||||||
Total after adjusting for by-product revenues | 11,508 | 13,498 | 23,941 | 16,919 | 20,808 | |||||||||||||||
Production output (in tons) | 111,390 | 101,015 | 202,859 | 174,708 | 193,732 | |||||||||||||||
Cost of production before by-product revenue (per ton) (a) | $ | 1,875 | $ | 2,295 | $ | 1,797 | $ | 1,479 | $ | 1,673 | ||||||||||
Cost of production net of by-product revenue (per ton) (a) | $ | 1,603 | $ | 1,912 | $ | 1,665 | $ | 1,307 | $ | 1,442 | ||||||||||
Oil and Gas | ||||||||||||||||||||
Segment revenue | 95,359 | 132,228 | 126,608 | 75,308 | 124,301 | |||||||||||||||
Segment profit | (54,500 | ) | (76,525 | ) | (72,683 | ) | (32,166 | ) | (59,886 | ) | ||||||||||
40,859 | 55,703 | 53,925 | 43,142 | 64,415 | ||||||||||||||||
Unsuccessful Exploration Cost | (1 | ) | (497 | ) | (27 | ) | (71 | ) | — | |||||||||||
Other income | — | 283 | 254 | 273 | 233 | |||||||||||||||
-Pre award cost | — | — | — | — | — | |||||||||||||||
Others (c) | (93 | ) | (1,455 | ) | (4,446 | ) | (3,549 | ) | (4,906 | ) | ||||||||||
Total before adjusting for by-product revenues | 40,765 | 54,034 | 49,706 | 39,795 | 59,742 | |||||||||||||||
By-product revenue | — | — | — | — | — | |||||||||||||||
Total after adjusting for by-product revenues | 40,765 | 54,034 | 49,706 | 39,795 | 59,742 | |||||||||||||||
Net Production (in mmboe) | 29.42 | 28.83 | 31.35 | 24.72 | 22.47 | |||||||||||||||
Cost of production before by-product revenue (per boe)(a) | $ | 21.5 | $ | 26.8 | $ | 22.4 | $ | 21.7 | $ | 35.70 | ||||||||||
Cost of production net of by-product revenue (per boe)(a) | $ | 21.5 | $ | 26.8 | $ | 22.4 | $ | 21.7 | $ | 35.70 | ||||||||||
Iron Ore | ||||||||||||||||||||
Segment revenue | 31,298 | 29,114 | 34,630 | 45,284 | 63,500 | |||||||||||||||
Segment profit | (3,100 | ) | (6,321 | ) | (8,312 | ) | (18,176 | ) | (22,670 | ) | ||||||||||
28,198 | 22,793 | 26,318 | 27,108 | 40,830 | ||||||||||||||||
Cost of Intermediary product sold | (12,501 | ) | (18,410 | ) | (18,119 | ) | (17,448 | ) | (31,933 | ) | ||||||||||
Export Duty | (1298 | ) | (823 | ) | (1,162 | ) | (1,182 | ) | (1,966 | ) | ||||||||||
Others (c) | (4,447 | ) | 449 | (1,723 | ) | (1,241 | ) | (620 | ) | |||||||||||
Total before adjusting for by-product revenues | 9,952 | 4,009 | 5,314 | 7,237 | 6,311 | |||||||||||||||
By-product revenue | — | — | — | — | — | |||||||||||||||
Total after adjusting for by-product revenues | 9,952 | 4,009 | 5,314 | 7,237 | 6,311 | |||||||||||||||
147
For the Year Ended March 31, | ||||||||||||||||||||
Segments | 2018 | 2019 | 2020 | 2021 | 2022 | |||||||||||||||
( ₹ in millions, except Production output and Cost of production) | ||||||||||||||||||||
Production output (in million dmt) | 7.1 | 4.4 | 4.4 | 5.7 | 5.7 | |||||||||||||||
Cost of production before by-product revenue (per dmt) (a) | $ | 21.9 | $ | 13.2 | $ | 17.1 | $ | 17.2 | $ | 14.9 | ||||||||||
Cost of production net of by-product revenue (per dmt) (a) | $ | 21.9 | $ | 13.2 | $ | 17.1 | $ | 17.2 | $ | 14.9 | ||||||||||
Copper 1 | ||||||||||||||||||||
Segment revenue | 246,766 | 107,390 | 90,526 | 108,897 | 151,511 | |||||||||||||||
Segment profit | (10,378 | ) | 2,339 | 2,894 | 1,753 | 1,131 | ||||||||||||||
236,388 | 109,729 | 93,420 | 110,650 | 152,642 | ||||||||||||||||
Purchased concentrate/rock | (221,176 | ) | (104,033 | ) | (90,046 | ) | (105,188 | ) | (144,980 | ) | ||||||||||
Cost for downstream products | (2,009 | ) | (1,241 | ) | (1,058 | ) | (851 | ) | (1,014 | ) | ||||||||||
Others (c) | (5,148 | ) | (1,547 | ) | 498 | (2,260 | ) | (3,598 | ) | |||||||||||
Total before adjusting for by-product and free copper revenues | 8,055 | 2,908 | 2,814 | 2,351 | 3,050 | |||||||||||||||
By-product revenue | (2,502 | ) | — | — | — | — | ||||||||||||||
Free Copper net sale | (2,287 | ) | — | — | — | — | ||||||||||||||
Total after adjusting for by-product and free copper revenues | 3,266 | 2,908 | 2,814 | 2,351 | 3,050 | |||||||||||||||
Production output (in tons) | 403,168 | 89,517 | 77,490 | 101,435 | 125,104 | |||||||||||||||
Cost of production before by-product and free copper revenue (a) | ¢/lb 14.1 | ¢/lb 21.1 | ¢/lb 23.2 | ¢/lb 14.2 | ¢/lb 14.9 | |||||||||||||||
Cost of production net of by-product and free copper revenue (a) | ¢/lb 5.7 | ¢/lb 21.1 | ¢/lb 23.2 | ¢/lb 14.2 | ¢/lb 14.9 | |||||||||||||||
Aluminium | ||||||||||||||||||||
Segment revenue | 228,435 | 292,286 | 265,773 | 286,442 | 508,809 | |||||||||||||||
Segment profit | (26,661 | ) | (22,058 | ) | (19,936 | ) | (77,523 | ) | (1,73,374 | ) | ||||||||||
201,774 | 270,228 | 245,837 | 208,919 | 335,435 | ||||||||||||||||
Cost for downstream products | (5,722 | ) | (7,733 | ) | (7,801 | ) | (7,438 | ) | (11,185 | ) | ||||||||||
Others (c) | (375 | ) | (1,118 | ) | (9,181 | ) | 6,615 | (11,794 | ) | |||||||||||
Total before adjusting for by-product revenues | 195,677 | 261,377 | 228,855 | 193,782 | 312,456 | |||||||||||||||
By-product revenue | (76 | ) | (35 | ) | (27 | ) | (142 | ) | (498 | ) | ||||||||||
Total after adjusting for by-product revenues | 195,601 | 261,342 | 228,828 | 193,640 | 311,958 | |||||||||||||||
Production output (hot metal) (in tons) | 1,608,420 | 1,900,739 | 1,911,266 | 1,940,344 | 2,258,443 | |||||||||||||||
Cost of production before by-product revenue (per ton) (a) | $ | 1,888 | $ | 1,968 | $ | 1,690 | $ | 1,348 | $ | 1,858 | ||||||||||
Cost of production net of by-product revenue (per ton) (a) | $ | 1,887 | $ | 1,967 | $ | 1,690 | $ | 1,347 | $ | 1,855 | ||||||||||
Cost of production net of by-product revenue (per ton) (a) | ₹ | 121,595 | ₹ | 137,495 | ₹ | 119,726 | ₹ | 99,797 | ₹ | 138,348 | ||||||||||
Steel | ||||||||||||||||||||
Segment revenue | — | 41,955 | 42,827 | 46,676 | 64,738 | |||||||||||||||
Segment profit | — | (7,913 | ) | (5,879 | ) | (8,707 | ) | (7,012 | ) | |||||||||||
— | 34,042 | 36,948 | 37,969 | 57,726 | ||||||||||||||||
Selling and Dist. expenses | — | (1,083 | ) | (1,444 | ) | (2,004 | ) | (2,252 | ) | |||||||||||
Others | — | (249 | ) | 687 | (1,961 | ) | (1,471 | ) | ||||||||||||
Total before adjusting for by-product revenues | — | 32,710 | 36,191 | 34,004 | 54,003 | |||||||||||||||
Production output (in tons) (b) | — | 1,027,578 | 1,230,825 | 1,187,310 | 1,260,168 | |||||||||||||||
Cost of production before by-product revenue (per ton)(a) | — | $ | 455 | $ | 415 | $ | 386 | $ | 576 | |||||||||||
Cost of production net of by-product (per ton)(a) | — | $ | 455 | $ | 415 | $ | 386 | $ | 576 | |||||||||||
Cost of production net of by-product (per ton)(a) | — | ₹ | 31,833 | ₹ | 29,404 | ₹ | 28,639 | ₹ | 42,854 | |||||||||||
Power | ||||||||||||||||||||
Segment revenue | 56,518 | 65,237 | 58,599 | 53,752 | 58,255 | |||||||||||||||
Segment profit | (16,650 | ) | (15,275 | ) | (16,490 | ) | (14,070 | ) | (10,816 | ) | ||||||||||
39,868 | 49,962 | 42,109 | 39,682 | 47,439 | ||||||||||||||||
Cost of power at TSPL, BALCO, HZL and MALCO Energy | (36,177 | ) | (45,499 | ) | (38,881 | ) | (31,935 | ) | (41,455 | ) | ||||||||||
Others (c) | (381 | ) | (11 | ) | (238 | ) | (729 | ) | (403 | ) | ||||||||||
Total | 3,310 | 4,452 | 2,990 | 7,018 | 5,581 | |||||||||||||||
Production output (in MU) (b) | 1,172 | 1,039 | 776 | 2,835 | 2,113 | |||||||||||||||
Cost of production before by-product revenue (per unit) | ₹ | 2.80 | ₹ | 4.30 | ₹ | 3.90 | ₹ | 2.5 | ₹ | 2.7 | ||||||||||
Cost of production net of by-product revenue (per unit) | ₹ | 2.80 | ₹ | 4.30 | ₹ | 3.90 | ₹ | 2.50 | ₹ | 2.7 | ||||||||||
| (a) | Exchange rates used in calculating cost of production were based on www.oanda.com, reference rates for the years ended March 31, 2018, 2019, 2020, 2021 and 2022 of ₹ ₹ ₹ ₹ ₹ |
| (b) | Production does not include units generated from the TSPL 1,980 MW, the 274 MW HZL wind power plant, IPP 300 MW BALCO power plant and MALCO Energy’s 106.5 MW power plant. |
| (c) |
148
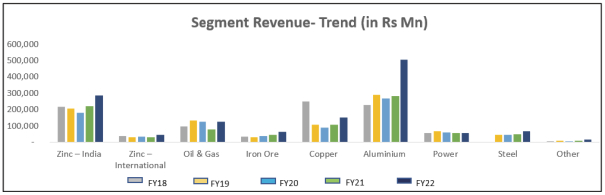
Production Volume and Mix
Production volume has a substantial effect on our results of operations. We are generally able to sell all of the products which we produce, so the revenue generally fluctuates as a result of changes in our production volumes. Production volumes depend on our production capacities, which have increased in recent years across all of our businesses. For our mining operations, production volumes also depend upon the quality and consistency of the ore. Per unit production costs are significantly affected by changes in production volumes in that higher volumes of production generally reduce the per unit production costs. Therefore, our production volumes are a key factor in determining our overall cost competitiveness. The following table summarizes our production volumes for our primary products for the last three fiscal years:
Segment | Product | For the Year Ended March 31, | ||||||||||||
2020 | 2021 | 2022 | ||||||||||||
(tons except where otherwise stated) | ||||||||||||||
Zinc India | Zinc | 688,286 | 715,446 | 775,808 | ||||||||||
| Lead | 181,370 | 214,399 | 191,185 | |||||||||||
| Silver (kilograms) | 609,808 | 705,676 | 647,014 | |||||||||||
Zinc International | ||||||||||||||
— Skorpion | Zinc | 66,967 | 659 | — | ||||||||||
— BMM | Copper (1) | 4,998 | 4,888 | 5,083 | ||||||||||
| Zinc (1) | 27,943 | 30,131 | 24,852 | |||||||||||
| Lead (1) | 37,628 | 27,471 | 27,393 | |||||||||||
— Gamsberg | Zinc (1) | 107,949 | 144,577 | 168,880 | ||||||||||
| Lead (1) | — | — | 1,599 | |||||||||||
Oil and gas (on net basis) ( 2 ) | Crude Oil (mmbbls) | 28.2 | 21.6 | 19 | ||||||||||
| Natural Gas (bcf) ( 3 ) | 18.7 | 18.4 | 20.8 | |||||||||||
Steel | Pig Iron | 167,305 | 188,979 | 185,855 | ||||||||||
| Billet | 27,456 | 165,273 | 91,344 | |||||||||||
| TMT | 468,396 | 337,583 | 398,579 | |||||||||||
| Wire rod | 412,948 | 360,874 | 420,509 | |||||||||||
| DI Pipe | 154,721 | 134,605 | 163,882 | |||||||||||
Iron ore | Saleable Ore Production (million dmt) | 4.4 | 5.0 | 5.4 | ||||||||||
Copper | Copper cathode ( 4 ) | 77,490 | 101,435 | 125,104 | ||||||||||
| Copper rods | 100,219 | 122,390 | 126,445 | |||||||||||
Aluminium | Ingots ( 5 ) | 1,175,007 | 1,295,541 | 1,436,890 | ||||||||||
| Value Added Products ( 6 ) | 698,261 | 651,408 | 818,011 | |||||||||||
| Hot Metal | 30,713 | 22,535 | 13,529 | |||||||||||
Power | Power (million units) | 11,162 | 11,261 | 11,872 | ||||||||||
| (1) | Refers to mined metal content in concentrate. |
| (2) | While computing EI production, Ravva royalty fees have not been netted off. |
| (3) | Natural gas production figures are the production volumes of natural gas available for sale, excluding flared and re-injected gas and gas consumed in operations. |
| (4) | Copper cathode is used as a starting material for copper rods. Approximately one ton of copper cathode is required for the production of one ton of copper rods. |
| (5) | Includes alloyed ingots volumes. |
| (6) | Value added products of aluminium include production of billets, rods, slabs and rolled products. |
Lisheen mine has closed in December 2015 and is under care and maintenance.
149
Periodically, our facilities are shut down for planned and unplanned repairs and maintenance which temporarily reduces our production volume. In addition, the mix of products we produce can have a substantial impact on our results of operations as we have different operating margins in each of our businesses, and within each business our operating margins vary between the lower margins of primary metals and the higher margins of value- added products such as copper rods and aluminium rolled products. For example, copper cathodes are converted in our copper rod plant into copper rods, a value-added product which has a higher margin than copper cathodes. As copper rods have higher margins, we endeavor to sell as large a percentage of copper rods as possible. As the production volume of our various products fluctuate primarily based on market demand and our production capacity for such products, the percentage of our revenue from those products will also fluctuate between higher and lower margin products, which will in turn cause our operating profit and operating margins to fluctuate.
Profit Petroleum
The GoI is the owner of the hydrocarbons wherein it has assigned the responsibility to the joint operation (Contractor) to explore, develop and produce the hydrocarbons. Contractor is entitled to recover out of Petroleum produced, all the costs incurred according to the PSCs in exploring, developing and producing the hydrocarbons, which is known as “Cost Petroleum”. Excess of revenue (value of hydrocarbons produced) over and above the cost incurred as above, is called “Profit Petroleum”, which is shared between the GoI and Contractor as per procedure laid down in PSCs.
Profit Petroleum sharing between the GoI and the Contractor is determined by Post- Tax Rate of Return method in case of Ravva andblocks as defined in their respective PSCs.
CB-OS/2
and on the Investment Multiple method in case of Rajasthan andKG-ONN-2003-1
The share of Profit Petroleum, in any year, is calculated for the Contract or Development Area on the basis of the
Post-Tax
Rate of Return or Investment Multiple actually achieved by the companies at the end of the preceding year for the Contract/Development Area.The following table summarizes the current Government’s share of Profit Petroleum for various blocks and development areas
Block/Development Area | Government share of profit petroleum As of March 31, | |||||||||||
2020 | 2021 | 2022 | ||||||||||
Ravva | 70.0 | % | 70.0 | % | 70.0 | % | ||||||
Cambay – Lakshmi | 45.0 | % | 45.0 | % | 45.0 | % | ||||||
Cambay – Gauri | 55.0 | % | 55.0 | % | 55.0 | % | ||||||
Cambay – CB-X | 60.0 | % | 60.0 | % | 60.0 | % | ||||||
Rajasthan – Development Area1 | 40.0 | % | 50.0 | %* | 60 | %* | ||||||
Rajasthan – Development Area2 | 40.0 | % | 50.0 | %* | 50 | %* | ||||||
Rajasthan – Development Area3 | 20.0 | % | 30.0 | %* | 30 | %* | ||||||
KG-ONN-2003-1 | 15.0 | % | 15.0 | % | 15.0 | % | ||||||
With the increase in the operations and revenue in each block, the abovementioned percentages are is subject to increase, leading to a higher Government’s share of Profit Petroleum. This will have an adverse impact on our result of operations as it will lead to an increase in our share of Profit Petroleum expense to be paid to the GoI.
| * | GoI share of Profit Petroleum for extended period of contract is calculated at 10% higher than the share as calculated using normal PSC provisions (This is in compliance to PSC extension policy No O-19025/07/2014-ONG-D-V |
150
Government Policy
India Customs Duties
We sell our products in India at a premium to the LME price, due in part to the customs duties payable on imported products. Our profitability is affected by the levels of customs duties as we price our products sold in India generally on an import-parity basis. We also pay a premium on certain raw materials that we import, or which are sourced locally but which are priced on an import-parity basis as a result of customs duties, with copper concentrate, petroleum products, alumina, carbon and caustic soda being the primary examples. The following table sets forth the customs duties that were applicable for the periods indicated:
Products | March 1, 2016 to July 5, 2019 | July 6, 2019 to March 27, 2021 | March 28, 2021 to present | |||||||||
Copper | 5.0% | 5.0% | 5.0% | |||||||||
Copper concentrate | 2.5% | 2.5% | 2.5% | |||||||||
Zinc | 5.0% | 5% | 5% | |||||||||
Lead | 5.0% | 5% | 5% | |||||||||
Silver | 10.0% | 12.5% | 7.5% | |||||||||
Aluminium | �� | 7.5% | 7.5% | 7.5% | ||||||||
Steel | 10.0% | 10% | 7.5% | |||||||||
In addition, social welfare surcharge as a duty of customs has been introduced through the Finance Bill 2018 on imported goods at a rate of 10.0% on basic custom duty (rate of social welfare surcharge on silver was 3.0%, however via budget 2021, the rate has been changed to 10% and Agriculture and Infrastructure Development Cess (AIDC) has been introduced @ 2.5%.). However, education cess and secondary education cess that was together levied at a rate of 3.0% on imported goods were abolished.
The GoI may reduce or abolish customs duties on copper and aluminium in the future, although the timing and extent of such reductions cannot be predicted. As we sell the majority of the commodities we produce in India, any further reduction in Indian tariffs on imports will decrease the premiums we receive in respect of those sales. Our profitability is dependent to a small extent on the continuation of import duties and any reduction would have an adverse effect on our results of operations and financial condition.
The import of coal attracts below duties as on date:
| • | Basic custom duty (BCD) at the rate of 2.5% which is non—creditable |
| • | Integrated Goods and Service Tax (IGST) at the rate of 5% which is a creditable duty |
| • | GSTC Cess @ 400/ MT cess- for which proportionate refund is available with respect to exported goods in ratio of export turnover /total turnover. |
Goods imported for the purposes of “petroleum operations” are exempt from customs duty under Notification No 50/2017 - Customs dated June 30, 2017; sr. no. - 404; condition number 48. Similar exemption was given in
pre-GST
regime vide Notification No 12/2012 - Customs dated March 17, 2012; sr. No. - 358 and 359; condition number 42 and 43 respectively (further amended by Notification No 12/2016- Customs dated March 1, 2016; sr. no. - 357A; condition no 40a.Goods which are imported for purposes other than petroleum operations such as software, IT related goods or any other material required for office purposes are liable to customs duty as per the applicable rates in force which vary from approximately 24.0% to 27.0% depending upon the classification of goods as mentioned in the revised customs tariff 2022.
Export Incentives
The GoI provides a variety of export incentives to Indian companies. Exports of copper, aluminium and zinc from India receive assistance premiums from the GoI. Export incentives do not outweigh the Indian market price premiums. Accordingly, notwithstanding the export incentives, we endeavor to sell large quantities of our products domestically.
In fiscal years 2020, 2021 and 2022 exports accounted for 20.0%, 26% and 24.9% respectively, of our zinc India business’ revenue. The following table sets forth the export assistance premiums (Duty Drawback), as a percentage of the F.O.B value of exports, on zinc concentrate, zinc ingots and lead concentrate and lead ingots for the periods indicated:
Products | April 1, 2015 to November 11, 2016 | November 11, 2016 to February 3, 2020 | February 4, 2020 to present | |||||||||
Zinc concentrate | 1.0% | Nil | Nil | |||||||||
Zinc ingots | 1.9% | 1.5% | 1.3% | |||||||||
Lead concentrate | 1.0% | Nil | Nil | |||||||||
Lead Ingots | — | — | 2.4 | % | ||||||||
151
In fiscal years 2021 and 2022 exports accounted for 7.58% and 10.76%, respectively, of our copper business revenue from India. With effect from April 1, 2015, the New Merchandise Exports from India Scheme was introduced in place of Marked Linked Focus Product Scheme. In this scheme, no export incentive was notified for copper products.
In fiscal years 2020, 2021 and 2022, exports accounted for 61.5%, 60% and 71.9% respectively, of our aluminium business’ revenue. Currently various export incentives are availed by the company for the exports made during the fiscal year under the provisions of Foreign Trade Policy 2015-2020. The said policy has been extended till Sep 30, 2022. Further, in order to boost exports and make Indian exports cost competitive and in compliance with WTO regulations, the Government has introduced a scheme for Remission of Duties and Taxes on Exported Products (“RoDTEP”). with effect from January 1, 2021, replacing the erstwhile MEIS scheme. Under the RoDTEP scheme, various taxes/duties/ levies, at the central, state and local levels, which are incurred during manufacturing and distribution of exported products, (applicable to those which are currently not being refunded under any other mechanism) are reimbursed to the exporters. The rates were notified during August 2021 through issuance of a notification wherein several exclusions were specifically carved out and accordingly, large amount of exports made on account of SEZ exports, exports against advance authorization, etc. are not entitled to the export benefits.
The following table sets forth the RoDTEP benefits that are applicable for the period indicated:
Products | August 2021 till date | |
Aluminium ingots/billets | 2.2% (with a cap in terms of quantity) | |
Aluminium wire | 1.8% (with a cap in terms of quantity) | |
Zinc ingots | 2% (with a cap of ₹ | |
Lead ingots | 1.4% |
Note:
1. | RoDTEP export benefits are not available for iron and steel sector |
2. | Copper products are also not entitled on account of exclusions specified. |
The GoI may further reduce export incentives in the future, which would adversely affect our results of operations.
In fiscal year 2015, export assistance premiums on aluminium rolled products were eliminated and duty exemption scheme of duty-free import authorization was introduced to enable duty free import of inputs required for export production pursuant to Chapter 4 of the Foreign Trade Policy whereby advance authorization for inputs and exports items was given under the Standard Input Output Norm (“SION”) policy scheme.
India export duties
The GoI levies duty on the export from India of certain products mentioned under the second schedule of the Customs Tariff Act 1975, including iron ore and concentrates, at a specified rate (ad valorem on the FOB value of exports). The GoI levied export duty on iron ore fines and lumps at a rate of 20.0% on FOB value and further increased to 30.0% with effect from December 31, 2011 to April 29, 2015. Effective from April 30, 2015, the export duty on iron ore fines with Fe content less than 58.0% is 10.0% and equal to or more than 58.0% Fe, duty rate is 30.0% and for iron ore lumps it is 30.0%. Effective from March 1, 2016 till date, the export duty on iron ore fines and lumps with Fe content less than 58.0% is nil and equal to or more than 58.0% Fe, duty rate is 30.0%.
Taxes, royalties and cess payments
Income tax on Indian companies during fiscal year 2022 was charged at a statutory rate of 30.0% plus a surcharge of 12.0% on the tax and has an additional charge of 4.0% on the tax including surcharge, which results in an effective statutory tax rate of 34.944%. The education and secondary higher education cess have been replaced in Finance Act 2018 with health and education cess at a rate of 4.0% effective from April 1, 2018.
Non-resident
companies were charged at a statutory rate of 40.0% plus a surcharge of 5.0% on the tax and has an additional charge of 4.0% on the tax including surcharge, the education and secondary higher education cess has been replaced in Finance Act 2018 with health and education cess at a rate of 4.0% effective from April 1, 2018. Hence, applicable effective corporate tax rate fornon-resident
companies for fiscal year 2022 is 43.68%. GoI vide Taxation Laws (Amendment) Act, 2019 provided an option to existing domestic companies to pay tax at a concessional rate of 22% plus surcharge of 10% on tax and 4% on tax plus surcharge which results into effective tax rate of 25.17%.The concessional tax rate is applicable subject to surrender of specified deductions/ incentives by the company exercising the option. These incentives, among others, include deductions relating to (i) newly established units in Special Economic Zones, (ii) expenditure on scientific research and skill development projects, (iii) investment in new machinery/ plant in notified backward areas, (iv) depreciation of new machinery/ plant, and (v) various other Chapter
VI-A
provisions.152
A corporate taxpayer is required to exercise its option of being governed under concessional tax regime before due date of filing of tax return. Option once exercised cannot be withdrawn and applicable to all subsequent tax years. This is effective from April 1, 2019.
Further, the Amendment Act 2019, provides an option for New Domestic Manufacturing Companies (“NDMC”) to pay effective tax rate @ 17.16% (i.e., statutory tax rate of 15% plus surcharge @ 10% on the tax and an additional cess of 4% on the corporate tax including surcharge). This rate is applicable to NDMC provided the new company is set up on or after September 30, 2019 and commences manufacturing before March 31,2023. The Finance Act 2022 has amended the Income Tax Act to extend the last date for commencement of manufacturing or production, under section 115BAB of the Act, from March 31,2023 to March 31, 2024. Further, incentives mentioned at point (i) above will also not be available to NDMC. New manufacturing companies will not include companies: (a) formed by splitting up or reconstruction of an existing business, (b) engaged in any business other than manufacturing or production, and (c) using any plant or machinery previously used in India (except under certain specified conditions).
Tax rate applicable under Minimum Alternate Tax (MAT) regime – Domestic Company
Profits of companies in India are subject to either regular income tax or MAT, whichever is greater. The effective MAT rate during fiscal year 2022 for Indian companies was 17.47%. For
non-resident
companies the MAT rate was 16.38% of the book profit as prepared under generally accepted accounting principles in India, or Indian GAAP. The excess of amounts paid as MAT over the regular income tax amount during the year may be carried forward and applied towards regular income taxes payable in any of the succeeding fifteen years subject to certain conditions.The Amendment Act 2019, reduced MAT base tax rate from 18.5% to 15% plus applicable surcharge and cess. The effective MAT rate for all Indian Companies for fiscal year 2020 2021 and 2022 was 17.47%, 17.47% and 17.47% respectively. Further, companies opting for concessional tax regime would not be required to pay MAT. For
non-resident
foreign company’s the effective MAT rate as per the Tax Amendment Act 2019 reduced from 20.01% to 16.38% of the book profit.Dividend Distribution Tax (“DDT”)
The tax rates imposed on us in respect of dividends paid in prior periods have varied. According to the Finance Act, 2014, DDT is to be levied on gross distributable surplus amount instead of amount paid net of taxes. This has resulted in an increase in the DDT to more than 20.0% from 16.995% in the earlier year. The Finance Act, 2018 increased the rate of cess from 3.0% to 4.0% which resulted in an effective DDT rate of 20.6% from April 1, 2018. This tax is payable by the company declaring distributing or paying the dividends. Dividends from our Indian subsidiaries to us are also subject to this tax, though we do not pay income tax upon the receipt of any such dividends. The Income Tax Act provides that if a company receives a dividend from any of its Indian subsidiaries during the year and such subsidiary has paid a tax on its dividends, then the dividend distributed by the parent company to the extent of dividend received from the Indian subsidiary shall not be subject to dividend tax.
The Finance Act 2020 has repealed the DDT. Companies are now required to pay/distribute dividend after deducting applicable taxes. The remittance of dividends outside India is governed by Indian law on foreign exchange and is also subject to withholding tax at applicable rates which is applicable from April 1, 2020.
Goods and Service tax
Goods and Service Tax: Effective from July 1, 2017, the present indirect tax regime envisages levy of multiple federal and state taxes with respect to the operations undertaken by businesses. The transition to goods and service tax (“GST”) regime is a tax reform, which is aimed at addressing the existing anomalies and strengthening the concept of unified market. GST is a supply driven concept and would therefore apply on supply of goods and services. On the whole, most central and state levies (such as excise duty, service tax, Countervailing Duty (“CVD”) and special additional duty (“SAD”), central sales tax and value added tax were subsumed into GST). Consequently, the Taxable events which existed before GST era were replaced by a single Taxable event of supply of goods and services under GST. Basic customs duty (BCD) and related customs cess continue to be applicable on import of goods.
Taxes under GST apply as follows:
| • | Central goods and service tax and state goods and services tax are simultaneously levied on intra-state supply of goods and services. |
| • | Integrated goods and service tax are levied on imports and inter-state supply of goods and services. |
| • | In addition, GST compensation cess also applies on certain specified goods and services. |
153
The general rate of GST on our output supplies is 18.0%. However, supply of silver attracts GST at 3.0%. Further, crude oil and natural gas will be subject to GST from the date to be notified by GST council and therefore, until the time GST council notifies inclusion of these products in GST, they would continue to attract existing indirect tax levies. Goods imported for the purposes of “petroleum operations” are subject to integrated goods and service tax at 5.0% as per Notification No. 50/2017-Customs, dated June 30, 2017, S. 400 per ton in addition to the GST rate of 5.0%. Effective July 1, 2017, CVD and SAD has been subsumed in integrated goods and service tax which is applicable at the rates as mentioned in below table:
No-
404 conditionno-48.
BCD continues to be exempt. Similar exemption notifications for domestic procurements have been issued to tax inter-state and intra-state supplies of goods for petroleum operations at an effective rate of 5.0%. Procurement of coal attracts GST compensation cess at₹
Percentage of F.O.B Value of exports | Integrated Goods and Service Tax rate from July 1, 2017 | |||
Copper | 18.0% | |||
Copper concentrate | 18.0% | |||
Zinc | 18.0% | |||
Lead | 18.0% | |||
Silver | 3.0% | |||
Aluminium | 18.0% | |||
Iron ore | 18.0% | |||
Steel | 18.0% | |||
We are also subject to government royalties. We pay royalties to the state governments of Chhattisgarh, Rajasthan, Goa and Karnataka in India based on extraction of bauxite, lead-zinc and iron ore. The most significant of these is the royalty that HZL is required to pay to the state government of Rajasthan, where all of HZL’s mines are located at a rate of 10.0% with effect from September 1, 2014, of the zinc LME price payable on the zinc metal contained in the concentrate produced, 14.5% (the rate was 12.7% from August 13, 2009 to August 31, 2014) of the lead LME price payable on the lead metal contained in the concentrate produced and at a rate of 7.0% of silver LME price chargeable on silver-metal produced. In addition, a further amount of royalty effective from January 12, 2015, for DMF at 30.0% of base royalty and NMET at 2.0% of base royalty, has been notified. The royalty payable for our iron ore business is at 15.0% of pit mouth value (PMV) declared by the Indian Bureau of Mines.
Royalty is also payable at Cairn to the State Government of Rajasthan and Andhra Pradesh for the extraction of crude oil and natural gas. Apart from the same, the Cess is also paid to the GoI. Generally, in respect of oil and gas operations, royalty and cess payments are made by the joint operation partners in proportion to their participating interest and are cost recoverable.
For the RJ Block, entire royalty payments are made by ONGC at the rate of 20.0% of well-head value for crude oil and 10% of well-head value for natural gas and are cost recoverable. Until February 2016, cess was paid at the rate of 4,500 per mt for crude oil; pursuant to amendments in the Finance Act 2016, cess is paid at the rate of 20.0% 50 per mt and Basic Excise Duty (“BED”) is paid at the rate of 1 per mt. Sales Tax payments are made at the rate of 2.0% (central sales Tax) on sale of crude oil and at the rate of 2.0% (central sales Tax) and 10% (value added Tax) on natural gas.
₹
ad-valorem
from March 2016 onwards. National Calamity Contingent Duty (“NCCD”) is paid at the rate of₹
₹
For blocks awarded under OALP, entire royalty payments are made by Contractor/Licensee at the rate of 12.5% of value of petroleum receivable by the Contractor/Licensee. National Calamity Contingent Duty (“NCCD”) is paid at the rate of 50 per mt and Basic Excise Duty (“BED”) is paid at the rate of 1 per mt. Sales Tax payments are made at the rate of 2.0% (central sales Tax against C Form) and at the rate of 5.0% (central sales Tax without C Form) on sale of crude oil.
₹
₹
For the Ravva block, until October 27, 2019, Royalty is paid at the rate of 481 per MT for crude oil and cess is fixed at the rate of 900 per MT; pursuant to extension of Ravva PSC from October 28, 2019, royalty is paid at 10% of well head value on crude oil and cess is paid at the rate of 20.0% ad-Valorem on crude oil. Royalty on natural gas is 10.0% of well-head value of gas. Sales Tax payments stand at 2.0% (central sales Tax) or 5.0% (value added Tax) on crude oil and 24.5% on natural gas.
₹
₹
For the Cambay block, the entire royalty and cess payments are made by ONGC and are not cost recoverable. We only participate in the payment of NCCD at the rate of 50 per mt and Basic Excise Duty (“BED”) is paid at the rate of 1 per mt. Sales Tax payments (central sales Tax) are made at a rate of 2.0% on crude oil and 15.0% (value added Tax) on natural gas.
₹
₹
154
Our royalties in Zinc International business are as follows:
| • | 3.0% of sale value of the products for Skorpion. |
| • | 7.0% of turnover for BMM. The royalty rate applied on the turnover is 0.5% if the adjusted earnings before interest and tax (“adjusted EBIT”) is negative, and in the event the adjusted EBIT is positive, the royalty rate applied on the turnover is 0.5% plus the rate computed at 100/9 times the adjusted EBIT upon turnover. In any event, the maximum royalty rate is capped at 7.0% |
Tax Incentives
Certain businesses of the Group within India are eligible for specified tax incentives. Most of such tax exemptions are relevant for the companies operating in India. These are briefly described as under:
| (i) | The location-based exemption |
In order to boost industrial and economic development in undeveloped regions, provided certain conditions are met, profits of newly established undertakings located in certain areas in India may benefit from a tax holiday. Such a tax holiday works to exempt 100.0% of the profits for the first five years from the commencement of the tax holiday, and 30.0% of profits for the subsequent five years. This deduction is available only for units established up to March 31, 2012. However, such undertaking would continue to be subject to the Minimum Alternative tax (“MAT”). The Group has such types of undertakings at Haridwar and Pantnagar, which are part of HZL. However, Financial Year 2021 was the last year of claim by Pantnagar tax holiday unit.
| (ii) | Sectoral Benefit—Power Plants and Port Operations |
To encourage the establishment of infrastructure certain power plants and ports have been offered income tax exemptions of upto 100.0% of profits and gains for any ten consecutive years within the
15-year
period following commencement of operations subject to certain conditions. The Group currently has total operational capacity of 8.25 GW of thermal based power generation facilities and wind power capacity of 274 MW and port facilities. However, such undertakings would continue to be subject to MAT provisions. The Group has power plants which benefit from such deductions, at various locations of HZL (where such benefits has been drawn), Talwandi Sabo Power Limited, Vedanta Limited and Bharat Aluminium Company Limited (where no benefit has been drawn) and port facilities at Vizag General Cargo Berth Limited (where no benefit has been drawn). The Group operates a zinc refinery in Export Processing Zone, Namibia which has been granted tax exempt status by the Namibian government| (iii) | Sectoral benefit – Oil and gas |
Provided certain conditions are met, profits of newly constructed industrial undertakings engaged in the oil and gas sector may benefit from a deduction of 100.0% of the profits of the undertaking for a period of seven consecutive years. This deduction is only available to blocks licensed prior to March 31, 2011. However, such businesses would continue to be subject to the MAT provisions. In the Group, Cairn India Limited (now Vedanta Limited - oil and gas business) and CEHL benefited from such deductions till March 31, 2016.
| (iv) | Special Economic Zone – SEZ |
Provided certain conditions are met, profits of newly established undertakings located in SEZ may benefit from a tax exemption. Such a tax exemptions works to 100.0% Income Tax exemption on export income for SEZ units under Section 10AA of the Income Tax Act for first 5 years, 50.0% for next 5 years thereafter and 50.0% of the ploughed back export profit for next 5 years.
In addition, the subsidiaries incorporated in Mauritius are eligible for tax credit to the extent of 80.0% of the applicable tax rate on foreign source income. From January 1, 2019, the Mauritius revenue authorities have phased out the regime of 80% deemed foreign credit and introduced the concept of 80% partial exemption regime on specified income. No actual foreign tax credit is allowed if the company has claimed the 80% exemption.
The Financial Services Act in Mauritius was amended in 2018 to replace GBL1 companies with Global Business Companies (‘GBC’). The Act also provides the following grandfathering provisions for existing GBL1 companies such that GBL1 companies that were incorporated on or before October 16, 2017 will be grandfathered, with all the existing benefits and obligations, until June 30, 2021. Post this date, GBL1 Companies will be deemed to be GBC, provided they qualify as such under the new GBC license requirements. Vedanta’s subsidiaries in Mauritius having GBL 1 licenses have been incorporated before October 16, 2017, hence they would be grandfathered up to June 30, 2021. Post which, they are deemed as GBC Company under the amended Financial Services Act, and are required to carry out their core income-generating activities in or from Mauritius
155
Exchange Rates
We sell commodities that are typically priced by reference to US dollar prices. However, a majority of our direct costs in our zinc, iron ore, aluminium and power businesses and our smelting and refining costs in our copper business are incurred in Indian Rupees and to a much lesser extent in Australian dollars, South African Rand and Namibian dollar. Also, all costs with respect to imported material for all our businesses are generally incurred in US dollars. As a result, an increase in the value of the US dollar compared to the Indian Rupee, and to a lesser extent the Australian dollar, South African Rand and Namibian dollar, is generally beneficial to our results of operations, except to the extent that the increase results in increased costs of copper concentrate, alumina and other imported materials for our businesses. A decrease in the value of the US dollar relative to the Indian Rupee, Australian dollar, South African Rand and Namibian dollar has the opposite effect on our results of operations.
Critical Accounting Estimates
The discussion and analysis of our financial condition and results of operations are based upon our consolidated financial statements, which have been prepared in accordance with IFRS as issued by the IASB. In the course of preparing these financial statements, our management has made judgments, estimates and assumptions, that affect the application of accounting policies and the reported amounts of assets, liabilities, income, expenses and disclosures of contingent assets and liabilities at the date of these consolidated financial statements and the reported amounts of revenues and expenses for the years presented. Actual results may differ from these estimates under different assumptions and conditions. For a discussion of our significant accounting policies, see “
Note 3 to the consolidated financial statements
”
included in this Annual Report. Estimates and underlying assumptions are reviewed on an ongoing basis. Revisions to accounting estimates are recognized in the period in which the estimate is revised and future periods affected.
We believe the critical accounting estimates are those that are both important to reflect our financial condition and results and require difficult, subjective or complex judgments, often as a result of the need to make estimates about the effect of matters that are inherently uncertain.
See “in the Notes to the Consolidated Financial Statements for a detailed discussion on the critical accounting estimates.
Note 3 (c): Significant accounting estimates and judgments”
Results of Operations
Consolidated Statement of Profit or Loss
The following table is derived from our selected consolidated financial data and sets forth our historical operating results as a percentage of revenue for the periods indicated:
For the year Ended March 31, | ||||||||||||
2020 | 2021 | 2022 | ||||||||||
(in percentages) | ||||||||||||
Consolidated Statement of Profit or Loss: | ||||||||||||
Revenue | 100.0 | % | 100.0 | % | 100.0 | % | ||||||
Cost of sales | (99.3 | %) | (73.1 | %) | (65.2 | %) | ||||||
Gross profit | 0.7 | % | 26.9 | % | 34.8 | % | ||||||
Other operating income | 1.2 | % | 1.4 | % | 1.3 | % | ||||||
Distribution expenses | (2.2 | %) | (2.3 | %) | (2.6 | %) | ||||||
Administration expenses | (4.5 | %) | (4.5 | %) | (3.8 | %) | ||||||
Operating profit | (4.8 | %) | 21.5 | % | 29.7 | % | ||||||
Investment and other income | 3.1 | % | 3.7 | % | 1.5 | % | ||||||
Finance and other costs | (6.5 | %) | (6.1 | %) | (3.8 | %) | ||||||
Profit/(loss) before taxes | (8.2 | %) | 19.1 | % | 27.4 | % | ||||||
Income tax expense | 3.2 | % | (2.2 | %) | (7.8 | %) | ||||||
Profit/(loss) for the year | (5.0 | %) | 16.9 | % | 19.6 | % | ||||||
Profit attributable to: | ||||||||||||
Equity holders of the parent | (7.3 | %) | 13.0 | % | 15.9 | % | ||||||
Non-controlling interest | 2.3 | % | 3.9 | % | 3.7 | % | ||||||
156
Net revenue by Geographic Location
The primary markets for our products are India and China. Other markets include number of countries mostly in the Asia, Middle East and Europe. We endeavour to sell as large a quantity of our products as possible in India due to the Indian market premium that we receive on sales in India. The following table sets forth our revenue from each of our primary markets and our revenue from each of our primary markets as a percentage of our total revenue for the periods indicated:
2020 | 2021 | 2022 | ||||||||||||||||||||||||||
Region | ( ₹ in million) | % of revenue | ( ₹ in million) | % of revenue | ( ₹ in million) | (US dollar in million) | % of revenue | |||||||||||||||||||||
India | 542,256 | 64.9 | 536,212 | 61.7 | 736,192 | 9,703 | 56.1 | |||||||||||||||||||||
Europe | 40,224 | 4.9 | 35,960 | 4.2 | 210,282 | 2,772 | 16 | |||||||||||||||||||||
China | 26,942 | 3.2 | 52,213 | 6 | 96,671 | 1,274 | 7.4 | |||||||||||||||||||||
USA | 17,068 | 2.0 | 11,634 | 1.3 | 34,871 | 460 | 2.7 | |||||||||||||||||||||
Mexico | 6,496 | 0.8 | 9,318 | 1.1 | 23,111 | 305 | 1.8 | |||||||||||||||||||||
Malaysia | 76,479 | 9.1 | 71,092 | 8.2 | 5,480 | 72 | 0.4 | |||||||||||||||||||||
Others (1) | 125,981 | 15.1 | 152,201 | 17.5 | 205,310 | 2,706 | 15.6 | |||||||||||||||||||||
Total | 835,446 | 100.0 | 868,630 | 100.0 | 1,311,917 | 17,292 | 100.0 | |||||||||||||||||||||
Notes:
| (1) | Other markets primarily include Indonesia, Italy, Netherlands, Norway, Oman, Qatar, South Korea, Spain, Singapore, Saudi Arabia, Switzerland, South Africa, Sweden, Taiwan, UK and UAE. |
Customer Concentration
The following table sets forth for the periods indicated:
| • | the percentage of our revenue accounted for by our 10 largest customers on a consolidated basis: and |
| • | for each of our segments, the percentage of the revenue of such business accounted for by the 10 largest customers of such business |
Particulars | Year Ended March 31, | |||||||||||
2020 | 2021 | 2022 | ||||||||||
(In percentage) | ||||||||||||
Consolidated | 35.3 | % | 36.5 | % | 32.8 | % | ||||||
Zinc – India | 39.3 | % | 40.4 | % | 35.0 | % | ||||||
Zinc – International | 96.0 | % | 99.1 | % | 99.9 | % | ||||||
Oil and Gas | 98.9 | % | 99.0 | % | 98.5 | % | ||||||
Iron Ore | 45.4 | % | 57.2 | % | 55.1 | % | ||||||
Copper | 40.6 | % | 47.7 | % | 43.2 | % | ||||||
Aluminium | 50.8 | % | 55.9 | % | 61.5 | % | ||||||
Power | 98.9 | % | 98.8 | % | 98.0 | % | ||||||
Steel | 34.5 | % | 33.6 | % | 27.7 | % | ||||||
No single customer contributed to more than 10% of revenue on a consolidated basis for fiscal year ended March 31, 2020, and March 31, 2022. For fiscal year ended March 31, 2021, one customer contributed more than 10% of revenue on consolidated basis amounting to 104,164 million arising from sales made in the aluminium, zinc and copper segment.
₹
Comparison of years ended March 31, 2021, and March 31, 2022
Revenue and Operating Profit
Consolidated
Revenue increased from 868,630 million in fiscal year 2021 to 1,311,917 ($ 17,292 million) in fiscal year 2022, an increase of 443,287 million or 51%. Revenue increased in fiscal year 2022, primarily driven by higher commodity prices, higher volumes at aluminium, copper, TSPL, iron ore business and FACOR, increased premium at aluminium and HZL, rupee depreciation, partially offset by lower power sales at VAL and BALCO.
₹
₹
₹
Operating profit increased from 186,852 million in fiscal year 2021 to 389,627 million ($ 5,135 million) in fiscal year 2022, an increase of 202,775 million.
₹
₹
₹
157
The increase in operating profit in fiscal year 2022, was primarily due to increase in revenue as stated above, higher commodity prices at aluminium, zinc, Cairn and iron and steel and higher sales realisation from iron ore and steel business, increased volumes at aluminium, Zinc International and iron ore business, partially offset by Head Wind in the input commodity prices.
Contributing factors to our consolidated operating profit/ (loss) were as follows:
| • | Depreciation charge during the fiscal year 2022 was at ₹ ₹ |
| • | Exceptional losses for fiscal year 2022 was at ₹ ₹ ₹ ₹ ₹ ₹ ₹ |
| • | Cost of sales increased from ₹ ₹ ₹ |
| • | Other operating income increased from ₹ ₹ ₹ |
| • | Distribution expenses increased from ₹ ₹ ₹ |
| • | Administration expenses increased from ₹ ₹ ₹ |
Zinc India
Revenue in the Zinc India segment increased from 219,316 million in fiscal year 2021 to 286,241 million ($ 3,773 million) in fiscal year 2022, increase of 66,925 million, or 30.5%. This increase was primarily driven by higher metal prices and higher volume of zinc metal. Metal production was up 4% to 967 kt in line with higher MIC availability and better plant availability. Rampura Agucha mine contributed 53.6%, Zawar mine 15.8%, RD Mine 4.7% and Sindesar Khurd 25.9% mined metal production in fiscal year 2022. Specifically:
₹
₹
₹
| • | Zinc ingot production increased from 715,446 tons in fiscal year 2021 to 775,808 tons in fiscal year 2022, an increase of 8.4% due to higher MIC availability. Zinc ingot sale also increased in line with the higher production from 723,952 tons in fiscal year 2021 to 776,814 tons in fiscal year 2022, an increase of 7.3%. |
| • | Zinc ingot sales in the domestic market increased from 436,943 tons in fiscal year 2021 to 505,926 tons in fiscal year 2022. Our domestic sales as a percentage of total sales increased from 60.36% in fiscal year 2021 to 65.13% in fiscal year 2022 primarily due to higher domestic demand. Our export sales decreased from 287,009 tons of zinc in fiscal year 2021 to 270,888 tons of zinc in fiscal year 2022, a decrease of 5.62%. |
| • | The daily average zinc cash settlement price on the LME increased from $ 2,422 per ton in fiscal year 2021 to $ 3,257 per ton in fiscal year 2022, an increase of 34.5%. |
| • | Lead ingot production decreased from 214,399 tons in fiscal year 2021 to 191,185 tons in fiscal year 2022, a decrease of 10.8% on account of changing mode of Pyro plant (at CLZS) operations from lead mode to zinc-lead mode. Lead ingot sales decreased from 216,439 tons in fiscal year 2021 to 191,726 tons in line with lower production in fiscal year 2022, a decrease of 11.4%, is in line of decrease in production. |
| • | The daily average lead cash settlement price on the LME increased from $ 1,868 per ton in fiscal year 2021 to $ 2,285 per ton in fiscal year 2022, a increase of 22.3% |
| • | Silver ingot production decreased from 705,676 kilograms in fiscal year 2021 to 647,014 kilograms in fiscal year 2022, a decrease of 8.3% on account of lower lead production, Sale of silver ingots decreased from 734,844 kilograms in fiscal year 2021 to 646,651 kilograms in fiscal year 2022, a decrease of 12.0%. |
| • | The daily average silver London Bullion Market Association prices increased from $ 22.9 per ounce in fiscal year 2021 to $ 24.6 per ounce in fiscal year 2022, an increase of 7.4%. |
158
Operating profit in the Zinc India segment increased from 91,583 million in fiscal year 2021 to 132,196 million ($ 1,742 million) in fiscal year 2022, increase of 40,613 million, or 44.3%, whereas operating margin also increased from 41.8% in fiscal year 2021 to 46.2% in fiscal year 2022. Operating profit was increased due to higher revenue partly offset by higher cost as explained above
₹
₹
₹
An increase in depreciation by 3,465 million in fiscal year 2022 as compared to fiscal year 2021 due to higher ore production during the current fiscal year and capitalization of mining equipment.
₹
Zinc International
Revenue from external customers in the Zinc International segment increased from 27,290 million in fiscal year 2021 to 44,841 million ($ 591 million) in fiscal year 2022, an increase of 17,551 million or 64.3%. The increase in revenue was primarily due to higher sales volume from Gamsberg and higher commodity prices of zinc, lead, and copper. Specifically:
₹
₹
₹
| • | Skorpion remained mine under care and maintenance since FY 2021, while studies continue to look feasible ways to make the pit safe for mining options which would allow for the extraction of the remainder of the accessible ore. Therefore, no production from the mine during FY2022. |
| • | Production of zinc metal in concentrate from the BMM mines decreased from 30,131 tons in fiscal year 2021 to 24,852 tons in fiscal year 2022, a decrease of 5,279 tons or 17.5%. Production of lead metal in concentrate decreased from 27,471 tons to 27,393 tons, a decrease of 78 tons or 0.3%. This overall decrease in mined metal production was primarily due to lower grades and recoveries from the mine. |
| • | Gamsberg operation continued to ramp up well in FY 2022. Production of zinc metal in concentrate from Gamsberg stood at 168,880 tons vs 144,577 tons produced in FY 2021. Production of lead metal in concentrate in FY 2022 was 1,599 tons up from nil in FY 2021. |
| • | The daily average zinc cash settlement price on the LME increased from $2,422 per ton in fiscal year 2021 to $3,257 per ton in fiscal year 2022, an increase of 34.5%. |
| • | The daily average lead cash settlement price on the LME increased from $1,868 per ton in fiscal year 2021 to $2,285 per ton in fiscal year 2022, an increase of 22.3%. |
Operating profit in the Zinc International segment increased from 4,849 million in fiscal year 2021 to 10,171 million ($134 million) in fiscal year 2022, an increase of 5,322 million or 109.8%, largely on account of higher metal prices and higher production volumes driving down the cost of production offset by local currency appreciation.
₹
₹
₹
Operating margin increased from 17.8% in fiscal year 2021 to 22.7% in fiscal year 2022.
Oil and Gas Business
Revenue from external customers in the oil and gas segment increased from 75,308 million in fiscal year 2021 to 124,301 million ($1638 million) in fiscal year 2022, an increase of 48,993 million or 65.1 %. The increase in revenue was primarily contributed by higher Brent price realization and decrease in Entitlement Interest (“EI”) sale. Specifically:
₹
₹
₹
| • | The daily average Brent oil price realization increased from $38.67 per boe, in fiscal year 2021 to $ 68.22 per boe, in fiscal year 2022, an increase of 76.40 %, |
| • | Entitlement interest sales decreased from 67,283 boepd in fiscal year 2021 to 61,126 boepd in fiscal year 2022 a decrease of 6,157 boepd or 9.15 % |
Operating profit in the oil and gas segment increased from profit of 10,892 million in fiscal year 2021 to operating profit of 73,501 million ($ 969 million) in fiscal year 2022, an increase of 62,609 million. The reason of increase in operating profit in current year as compared to previous year is as follows: Impairment reversal in March 2022 of 62,745 million and Production revenue has increased by 48,993 million due to Increase in Oil Price Realization. Exploration Wells have been written off to P&L as unsuccessful write off with an increase of 26,181 million due to non-presence of hydrocarbons. Production cost has increased by 19,981 million due to increase in cess charge and increase in price of Polymers.
₹
₹
₹
₹
₹
₹
₹
Iron Ore
Revenue from external customers increased from 44,875 million in fiscal year 2021 to 62,330 million ($ 822 million) in fiscal year 2022, an increase of 17,455 million, or 38.9%. The increase was mainly due to increase in sales volume at Karnataka and improved realization at Karnataka and VAB during the year specifically:
₹
₹
₹
| • | At Karnataka, production was 5.4 million tonnes, Sales in FY2022 were 5.7 million tonnes, 30% higher y-o-y |
159
| • | At Goa, mining was brought to a halt pursuant to the Hon’ble Supreme Court judgement dated February 7, 2018 directing all companies in Goa to stop mining operations with effect from March 16, 2018. We continue to engage with the Government for a resumption of mining operations |
| • | Production of pig iron was 789,976 tonnes in FY2022, up by 33% y-o-y |
Operating profit in the iron ore segment increased from 15,968 million in fiscal year 2021 to operating profit of 20,285 million in fiscal year 2022, an increase of 4,317 million. Or 27%. The increase was mainly due to increase in sales volume at Karnataka and improved margin at Karnataka and VAB during the year.
₹
₹
₹
Steel
Revenue from external customer in the steel segment increased from 46,676 million in fiscal year 2021 to 64,738 million ($ 853 million) in fiscal year 2022, an increase of 18,062 million or 38.7%.
₹
₹
₹
| • | Pig iron production decreased from 188,979 tons in fiscal year 2021 to 185,855 tons in fiscal year 2022, a decrease of 3,124 tons or 1.7%. The decrease was mainly due to lower pig iron demand. The sale of pig iron decreased from 192,142 tons in fiscal year 2021 to 188,531 tons in fiscal year 2022, a decrease of 3,611 tons or 1.9%. The decrease in sales was in line with production. |
| • | Saleable Billet production has decreased from 165,273 tons in fiscal year 2021 to 91,344 tons in fiscal year 2022, a decrease of 73,926 tons or 45%. This reduction was there since our focus is on production of value-added products i.e., TMT bar, Wire Rod and DI pipe. The sale of billet decreased from 157,673 tons in fiscal year 2021 to 95,564 tons in fiscal year 2022, a decrease of 62,109 tons or 39.4%. The decrease in sale was in line of production. |
| • | TMT production depicted an increase from 337,583 tons in fiscal year 2021 to 398,579 tons in fiscal year 2022, an increase of 60,997 tons or 18%. The increase was majorly due to lower pig iron and saleable billet production. The sale of TMT increased from 355,666 tons in fiscal year 2021 to 402,191 tons in fiscal year 2022, an increase of 46,525 tons or 13%. The increase was in line of improved production. |
| • | Wire rod production increased from 360,874 tons in fiscal year 2021 to 420,509 tons in fiscal year 2022, an increase of 59,635 tons or 16.5%. The increase was majorly due to lower pig iron and saleable billet production. Wire rod sale increased from 375,346 tons in fiscal year 2021 to 422,021 tons in fiscal year 2022, an increase of 46,675 tons or 12.4% in line with increased production. |
| • | The production of DI pipe increased from 134,605 ton in fiscal year 2021 to 163,882 ton in fiscal year 2022, an increase of 29,277 tons or 21.8%. The sale of DI pipe increased from 149,832 ton in fiscal year 2021 to 166,536 ton in fiscal year 2022, an increase of 16,704 tons or 11.1% driven by our focus on sale of value added products. |
Operating profit in steel segment increased from 3,180 million in fiscal year 2021 to 3,621 million ($ 48 million) in fiscal year 2022.
₹
₹
Average sales realisation increased 35%from US$488 per tonne in FY2021 to US$660 per tonne in FY2022. Prices of iron and steel are influenced by several macro-economic factors. These include global economic slowdown,
y-o-y
US-China
trade war, supply chain destocking, government expenditure on infrastructure, the emphasis on developmental projects, demand-supply dynamics, the Purchasing Managers’ Index (PMI) in India and production and inventory levels across the globe especially China. NSR has been raised post Covid due to booming market conditions and demand of steel in the market, still we were unable to increase our EBITDA due to high coking coal prices which surpassed improvement in NSR if compared proportionately.Copper
Revenue from external customers increased from 108,879 million in fiscal year 2021 to 151,511 million ($ 1,997 million) in fiscal year 2022, an increase of 42,632 million, or 39.2%. The increase was primarily on account of higher copper volume production and rising copper LME prices. Specifically:
₹
₹
₹
| • | Copper cathode production increased from 101,435 tons in fiscal year 2021 to 125,104 tons in fiscal year 2022, an increase by 24%. The production was higher due to better performance of refinery. Copper cathode sales decreased from 7,825 tons in fiscal year 2021 to 5,737 tons in fiscal year 2022, a decrease by 26.6%. The reduction in sale was due to change in sales mix. |
| • | Production of copper rods increased from 122,390 tons in fiscal year 2021 to 126,445 tons in fiscal year 2022, an increase of 3.3%. Copper rod sales increased from 121,643 tons in fiscal year 2021 to 128,450 tons in fiscal year 2022, an increase of 5.6% in line with the increase in production. |
| • | Sales of copper in the Indian market increased from 125,979 tons in fiscal year 2021 to 130,653 tons in fiscal year 2022, an increase of 3.7% and our exports increased from 3,490 tons in fiscal year 2021 to 5,533 tons in fiscal year 2022, an increase by 58.5%. Our domestic sales as a percentage of total sales decreased from 97.3% in fiscal year 2021 to 95.9% in fiscal year 2022. |
| • | Daily average copper cash settlement price on the LME increased from $ 6,897 per ton in fiscal year 2021 to $ 9,689 per ton in fiscal year 2022, an increase of 40.5%. |
160
Aluminium
Revenue from external customers in the aluminium segment increased from 285,756 million in fiscal year 2021 to 508,091 million ($ 6,697 million) in fiscal year 2022, an increase of 222,335 million, or 77.8%, driven primarily by rising LME aluminium prices and higher production volumes.
₹
₹
₹
| • | Aluminium production increased from 1,969,483 tons in fiscal year 2021 to 2,268,430 tons in fiscal year 2022, an increase of 15.2%. Production of value-added products increased from 33.1% in fiscal year 2021 to 36.1% in fiscal year 2022. |
| • | Aluminium sales increased from 1,992,467 tons in fiscal year 2021 to 2,269,527 tons in fiscal year 2022, an increase of 13.9% |
| • | Sales of aluminium ingots increased from 1,302,054 tons in fiscal year 2021 to 1,500,932 tons in fiscal year 2022, an increase of 15.3%. This includes Primary Foundry Alloys (PFA) and Alloy Ingot volumes. |
| • | Wire rod sales increased by 0.8% from to 328,360 tons in fiscal year 2021 to 330,834 tons in fiscal year 2022 |
| • | Billets sale increased by 45.9% from 268,219 tons in fiscal year 2021 to 391,373 tons in fiscal year 2022 |
| • | Slabs sales shrank from 39,989 tons in fiscal year 2021 to nil tons in fiscal year 2022, a decrease of 100% |
| • | Rolled product sales grew from 31,311 tons in fiscal year 2021 to 32,893 tons in fiscal year 2022, an increase by 5.1% |
| • | Hot metal sales during fiscal year 2022 were 13,495 tons, down by 40.1% from 22,535 tons in fiscal year 2021 |
| • | Aluminum sales in the domestic market reduced from 635,715 tons in fiscal year 2021 to 604,813 tons in fiscal year 2022, decreased by 4.9%. Our aluminum exports increased from 1,356,752 tons in fiscal year 2021 to 1,664,714 tons in fiscal year 2022, increased by 22.7%. The daily average aluminium cash settlement price on the LME increased from $ 1,805 per ton in fiscal year 2021 to $ 2,774 per ton in fiscal year 2022, increase by 53.7%. |
Operating profit in the aluminium segment increased from 59,736 million in fiscal year 2021 to 149,657 million ($ 1,973 million) in fiscal year 2022, an increase of 89,921 million. The increase in operating profit was primarily due rising LME aluminium prices and higher sales volume.
₹
₹
₹
Power
Revenue from external customers in the power segment increased from 53,752 million in fiscal year 2021 to 55,005 million ($ 725 million) in fiscal year 2022, an increase of 1,253 million or 2.3%. Power sales increased from 11,261 million units in fiscal year 2021 to 11,872 million units in fiscal year 2022, an increase of 5.4%. The PLF at JSG was 53%, BALCO was 63% and Talwandi Sabo (TSPL) power plant achieved plant availability of 76%. Malco power plant is under care and maintenance since May 26, 2017.
₹
₹
₹
| • | Talwandi Sabo power plant, operated at 76% plant availability in fiscal year 2022. It supplied 8,259 million units of power in fiscal year 2022 as compared to 6,479 million units of power in fiscal year 2021 to the Punjab State Power Corporation Ltd. (PSPCL). TSPL’s PPA with PSEB compensates it based on the availability of the plant. |
| • | The Jharsuguda 600 MW power plant operated at a lower PLF of 53.0% during fiscal year 2022, as compared to 58.0% in fiscal year 2021. |
| • | At BALCO, the 300 MW IPP unit of the 300MW power plant operated at PLF of 63.0% in fiscal year 2022, as compared to 66.0% in fiscal year 2021. |
| • | The average power realization remained same from ₹ ₹ |
| • | Cost of generation at the power business (excluding power from the TSPL 1980 MW power plant) remains flat at ₹ |
| • | The average power realization at Talwandi Sabo power plant increased from ₹ ₹ ₹ ₹ |
Operating profit in the power segment decreased from 8,321 million in fiscal year 2021 to 4,746 million ($ 63 million) in fiscal year 2021, a decrease of 3,575 million or 43.0%.
₹
₹
₹
Other
Operating loss in our other business segments improved from 2,471 million in fiscal year 2021 to operating profit of 513 million ($ 7 million) in fiscal year 2022, mainly due to inclusion of FACOR for the full fiscal year.
₹
₹
161
Investment and Other income
Investment and other income decreased from 32,177 million in fiscal year 2021 to 19,947 million ($ 263 million) in fiscal year 2022, a decrease of 12,230 million or 38.0%, as a result of change in investment mix and Mark to Market (MTM) movement.
₹
₹
₹
Finance and other costs
Finance and other costs decreased from 52,955 million in fiscal year 2021 to 49,427 million ($ 651 million) in fiscal year 2022, a decrease of 3,528 million or 6.7%.
₹
₹
₹
This decrease is mainly on account of lower blended cost of borrowings and decrease in average borrowings.
The proportion of Indian Rupee borrowings is 91.0% and USD borrowing are 9.0% in fiscal year 2022 in comparison to 89% and 11.0% respectively in fiscal year 2021.
Tax expense
Tax expense increased from 19,084 million in fiscal year 2021 to 103,068 million ($ 1,359 million) in fiscal year 2022. Our effective income tax rate, calculated as tax expense divided by our profit or loss before taxes, was 11.5% in fiscal year 2021 as compared to 28.6% in fiscal year 2022. The effective tax rate has increased by 17.1% which is driven by change in profit mix. The normalized ETR in fiscal year 2022 is 27% (excluding tax on exceptional items of 12,469 million and Deferred Tax Asset reversal on losses in ESL of 1,220 million) which is similar to 27% excluding tax on dividend from HZL of 8,690 million, new tax regime impact of (2,494) million, tax on exceptional items of 1,538 million and Deferred Tax Asset recognised on losses in ESL of 31,107 million in fiscal year 2021.
₹
₹
₹
₹
₹
₹
₹
₹
Non-controlling
interestOn account of above-mentioned factors, profit for the year increased from 146,990 million in fiscal year 2021 to 2,57,079 million ($ 3,388 million) in fiscal year 2022, an increase of 110,089 million.
₹
₹
₹
Profit attributable to 34,107 million in fiscal year 2021 to 49,126 million ($ 648 million) in fiscal year 2022, an increase of 15,019 million or 44.0%.
non-controlling
interest increased from₹
₹
₹
Comparison of years ended March 31, 2020 and March 31, 2021
Revenue and Operating Profit
Consolidated
Revenue increased from 835,446 million in fiscal year 2020 to 868,630 million ($ 11,876 million) in fiscal year 2021, an increase of 33,184 million or 4.0%. Revenue increased in fiscal year 2021, mainly due to higher commodity prices, higher volumes at Zinc India, copper, iron ore and aluminium business, inclusion of FACOR in FY 2021, rupee depreciation, partially offset by lower power sales at TSPL, lower volume at oil & gas, Skorpion mine being under care and maintenance, lower oil prices and lower cost recovery in FY 2021.
₹
₹
₹
Operating profit increased from loss of 39,934 million in fiscal year 2020 to operating profit of 186,852 million ($ 2,555 million) in fiscal year 2021, an increase of 226,786 million.
₹
₹
₹
The increase in operating profit in fiscal year 2021, was primarily due to increase in revenue as stated above, lower cost of production at zinc, aluminium and oil & gas business, partially offset by lower brent realisation and lower cost recovery in oil & gas business.
Contributing factors to our consolidated operating profit/ (loss) were as follows:
| • | Depreciation charge during the fiscal year 2021 was at ₹ ₹ |
| • | Exceptional losses for fiscal year 2021 was at ₹ ₹ ₹ ₹ ₹ ₹ |
| • | Cost of sales decreased from ₹ ₹ ₹ |
162
| • | Other operating income increased from ₹ ₹ ₹ |
| • | Distribution expenses increased from ₹ ₹ ₹ |
| • | Administration expenses increased from ₹ ₹ ₹ |
Zinc India
Revenue in the Zinc India segment increased from 181,590 million in fiscal year 2020 to 219,316 million ($ 2,999 million) in fiscal year 2021, increase of 37,726 million, or 20.8%. This increase was primarily driven by higher metal prices and higher volume of metal and silver. Metal production was up 7% to 930 kt in line with higher MIC availability, while silver production was up by 16% to a record 706 MT in line with higher lead production and slightly better grades at SK. These record numbers were delivered despite losing 18 equivalent of production days in the year due to COVID related lockdown and other disruptions resulting from rising infections. The share of mined metal production from underground mines increased to 100.0% in fiscal year 2019. Rampura Agucha mine achieved 53.2%, Zawar mine 15.5% and RD Mine 4.8% and Sindesar Khurd 26.5% mined metal production in fiscal year 2021. Specifically:
₹
₹
₹
| • | Zinc ingot production increased from 688,286 tons in fiscal year 2020 to 715,446 tons in fiscal year 2021, an increase of 3.95% due to higher MIC availability. Zinc ingot sale also increased in line with the higher production from 680,017 tons in fiscal year 2020 to 723,952 tons in fiscal year 2021, an increase of 6.46%. |
| • | Zinc ingot sales in the domestic market declined from 486,311 tons in fiscal year 2020 to 436,943 tons in fiscal year 2021. Our domestic sales as a percentage of total sales decreased from 72.0% in fiscal year 2020 to 60.4% in fiscal year 2021 primarily due to covid-19 related lockdown in March 2020. However, we always endeavor to sell large quantities of our products domestically, where we receive an Indian market premium. Our export sales increased from 193,706 tons of zinc in fiscal year 2020 to 287,009 tons of zinc in fiscal year 2021, an increase of 48.2%. |
| • | The daily average zinc cash settlement price on the LME increased from $ 2,402 per ton in fiscal year 2020 to $ 2,422 per ton in fiscal year 2021, an increase of 0.8%. |
| • | Lead ingot production increased from 181,370 tons in fiscal year 2020 to 214,399 tons in fiscal year 2021, an increase of 18.2% due to availability of MIC. Lead ingot sales increased from 179,663 tons in fiscal year 2020 to 216,439 tons in line with higher production in fiscal year 2021, an increase of 20.5%, is in line of increase in production. |
| • | The daily average lead cash settlement price on the LME decreased from $ 1,952 per ton in fiscal year 2020 to $ 1,868 per ton in fiscal year 2021, a decrease of 4.3%. |
| • | Silver ingot production decreased from 609,808 kilograms in fiscal year 2020 to 705,676 kilograms in fiscal year 2021, an increase of 15.7% on account of Higher lead production and SKM silver grade, In line with production, Sale of silver ingots increased from 586,387 kilograms in fiscal year 2020 to 734,844 kilograms in fiscal year 2021, an increase of 25.3%. |
| • | The daily average silver London Bullion Market Association prices increased from $ 16.5 per ounce in fiscal year 2020 to $ 22.9 per ounce in fiscal year 2021, an increase of 38.4%. |
Operating profit in the Zinc India segment increased from 64,530 million in fiscal year 2020 to 91,583 million ($ 1,252 million) in fiscal year 2021, increase of 27,053 million, or 41.9%, whereas operating margin also increased from 35.5% in fiscal year 2020 to 41.8% in fiscal year 2021. Operating profit increased due to higher revenue and lower costs of production majorly driven by higher production volume, lower power costs, lower
₹
₹
₹
met-coke
and cement costs partly offset by higher admin expense(Covid-19
relief donation) and higher diesel costs.An increase in depreciation by 2,007 million in fiscal year 2021 as compared to fiscal year 2020 due to higher ore production during the current fiscal year and capitalization of mining equipment.
₹
163
Zinc International
Revenue from external customers in the Zinc International segment decreased from 31,275 million in fiscal year 2020 to 27,290 million ($ 373 million) in fiscal year 2021, a decrease of 3,985 million or 12.7%. The decrease in revenue was primarily driven by lower volumes due to Skorpion Zinc going under care and maintenance, partially offset by higher price realisations. Specifically:
₹
₹
₹
| • | Skorpion produced 659 tons of refined zinc metal in FY 2021. The mine has been under Care and Maintenance since start of April 2020, following cessation of mining activities due to geotechnical instabilities in the open pit. The business is currently evaluating options to restart mining. Engagement with technical experts to explore opportunities of safely extracting the remaining ore is ongoing. The pit optimisation work is complete. |
| • | Production of zinc metal in concentrate from the BMM mines increased from 27,943 tons in fiscal year 2020 to 30,131 tons in fiscal year 2021, an increase of 2,188 tons or 7.8%. Production of lead metal in concentrate increased from 37,628 tons to 27,471 tons, decrease of 10,157 tons or 27%. This overall decrease in production was mainly due to lower grade of lead (2.3% vs 2.9%) and hence lead lower recoveries (84.1% vs 85.6%) and 6% lower throughput resulting from lower mining performance. |
| • | Gamsberg operation continued to ramp up well with improved performance every quarter in FY 2021. Production of zinc metal in concentrate from Gamsberg stood at 144,577 tons vs 107,949 tons produced in FY 2020, an increase of 36,628 tons or 34%. Healthy feedable stockpile of approximately 1.4 million tonnes has been created for consistent feed to the plant. Several best demonstrated performances on throughput, milled tonnes and improved recoveries were achieved in Q4 FY 2021. |
| • | The daily average zinc cash settlement price on the LME increased from $ 2,402 per ton in fiscal year 2020 to $ 2,422 per ton in fiscal year 2021, an increase of 0.8%. |
| • | The daily average lead cash settlement price on the LME decreased from $ 1,952 per ton in fiscal year 2020 to $ 1,868 per ton in fiscal year 2021, a decrease of 4.3%. Operating profit in the Zinc International segment increased from operating loss of ₹ ₹ ₹ |
Operating margin increased from negative 8.2% in fiscal year 2020 to 17.8% in fiscal year 2021.
Oil and Gas Business
Revenue from external customers in the oil and gas segment decreased from to 126,608 million in fiscal year 2020 to 75,308 million ($ 1,030 million) in fiscal year 2021, a decrease of 51,300 million or 40.5%. The decrease in revenue was primarily contributed by lower Brent price realisation and decrease in Entitlement Interest (“EI”) sale. Specifically:
₹
₹
₹
| • | The daily average Brent oil price realisation decreased from $ 59.4 per boe, in fiscal year 2020 to $ 38.67 per boe, in fiscal year 2021, a decrease of 34.9%, |
| • | Entitlement interest sales decreased from 85,700 boepd in fiscal year 2020 to 67,283 boepd in fiscal year 2021, a decrease of 18,417 boepd or 21.5%. |
Operating profit in the oil and gas segment increased from loss of 102,425 million in fiscal year 2020 to operating profit of 10,892 million ($ 149 million) in fiscal year 2021, an increase of 113,317 million. The increase in operating profit in current year was primarily due to impairment recognition of 135,031 million ($ 1,791 million) in fiscal year 2020 which includes a) impairment charge relating to Rajasthan Oil & Gas block triggered by the significant fall in the crude oil prices which includes impairment charge against oil and gas producing facilities and exploration intangible assets under development, b) impairment charge relating toblock mainly due to reduction in crude price forecast and c) impairment charge relating to exploration blockwhere the Group had represented to DGH to grant a 12 month excusable delay along with unfettered and unrestricted access to the block. Based on the said representation, the DGH granted an extension of upto December 4, 2020.
₹
₹
₹
₹
KG-ONN-2003/1
KG-OSN-2009/3
Iron Ore
Revenue from external customers increased from 34,500 million in fiscal year 2020 to 44,875 million ($ 614 million) in fiscal year 2021, an increase of 10,375 million, or 30.1%. The increase was mainly due to
₹
₹
₹
two-fold
increase in sales volume at Goa and improved margin at Goa, Karnataka and VAB during the year specifically:| • | At Karnataka, production was 5 million tonnes, Sales in FY 2021 were 4.4 million tonnes, 24% lower y-o-y Covid-19 impact in the current financial year. With the order of Central Empowered Committee (a Hon’ble Supreme Court appointed body) in March 2020, the annual mining capacity has been increased upto 5.89 MTPA. In line with this, the Government of Karnataka allocated the production quantity of 5.60 wet million tonnes for the current year FY 2021 onwards. |
| • | At Goa, mining was brought to a halt pursuant to the Hon’ble Supreme Court judgement dated February 7, 2018 directing all companies in Goa to stop mining operations with effect from March 16, 2018. We continue to engage with the Government for a resumption of mining operations. |
| • | Production of pig iron was 596,197 tonnes in FY 2021, down by 12% y-o-y Covid-19 impact and shut down of Plant for two months due to planned relining activity. The production of Metallurgical coke was 434,270 tons in fiscal year 2020 compared to 436,663 tons in fiscal year 2021 an increase by 1%. |
164
Operating profit in the iron ore segment increased from 4,698 million in fiscal year 2020 to operating profit of 15,968 million ($ 218 million) in fiscal year 2021, an increase of 11,270 million. The increase was mainly due to
₹
₹
₹
two-fold
increase in sales volume at Goa and improved margin at Goa, Karnataka and VAB during the year.Steel
Revenue from external customer in the steel segment increased from 42,827 million in fiscal year 2020 to 46,676 million ($ 638 million) in fiscal year 2021, an increase of 3,849 million or 9.0%.in fiscal year 2021. Fiscal year 2021 has been a healthy year for ESL despite pandemic.
₹
₹
₹
| • | Pig iron production increased from 167,305 tons in fiscal year 2020 to 188,979 tons in fiscal year 2021, an increase of 21,674 tons or 13.0%. The increase was mainly due to higher pig iron demand. The sale of pig iron increased from 157,596 tons in fiscal year 2020 to 192,142 tons in fiscal year 2021, an increase of 34,546 tons or 21.9%. The increase in sales was in line with production. |
| • | Saleable Billet production has increased from 27,456 tons in fiscal year 2020 to 165,273 tons in fiscal year 2021, an increase of 137,817 tons or 502.0%. This increase was due to our focus on production of value-added products i.e. TMT bar, Wire Rod and DI pipe. The sale of billet increased from 22,460 tons in fiscal year 2020 to 157,673 tons in fiscal year 2021, an increase of 135,213 tons or 602.0%. The increase in sale was in line of production. |
| • | TMT production decreased from 468,396 tons in fiscal year 2020 to 337,583 tons in fiscal year 2021, a decrease of 130,813 tons or 27.9%. The decrease was majorly due to higher pig iron and saleable billet production. The sale of TMT decreased from 453,806 tons in fiscal year 2020 to 355,666 tons in fiscal year 2021, a decrease of 98,140 tons or 21.6%. The decrease was in line of reduced production. |
| • | Wire rod production reduced from 412,948 tons in fiscal year 2020 to 360,874 tons in fiscal year 2021, a reduction of 52,074 tons or 12.6%. The decrease was majorly due to higher pig iron and saleable billet production. Wire rod sale reduced from 402,242 tons in fiscal year 2020 to 375,346 tons in fiscal year 2021, a reduction of 26,896 tons or 6.7% in line with reduced production. |
| • | The production of DI pipe reduced from 154,721 tons in fiscal year 2020 to 134,605 tons in fiscal year 2021, a reduction of 20,116 tons or 13.0%. The sale of DI pipe increased from 143,258 tons in fiscal year 2020 to 149,832 tons in fiscal year 2021, an increase of 6,574 tons or 4.6% driven by our focus on sale of value added products. |
Operating profit in steel segment decreased from 3,452 million in fiscal year 2020 to 3,180 million ($ 43 million) in fiscal year 2021.
₹
₹
Average sales realisation decreased 1%from $ 495 per tonne in FY 2020 to $ 488 per tonne in FY 2021. Prices of iron and steel are influenced by several macro-economic factors. These include global economic slowdown,
y-o-y
US-China
trade war, supply chain destocking, government expenditure on infrastructure, the emphasis on developmental projects, demand-supply dynamics, the Purchasing Managers’ Index (PMI) in India and production and inventory levels across the globe especially China.Copper
Revenue from external customers increased from 90,517 million in fiscal year 2020 to 108,879 million ($ 1,489 million) in fiscal year 2021, an increase of 18,362 million, or 20.3%. The increase was primarily on account of higher copper volume production and rising copper LME prices. Specifically:
₹
₹
₹
| • | Copper cathode production increased from 77,490 tons in fiscal year 2020 to 101,435 tons in fiscal year 2021, an increase by 30.9%. The production was higher due to better performance of refinery. Copper cathode sales increased from 2,461 tons in fiscal year 2020 to 7,825 tons in fiscal year 2021, an increase by 218.0%. The increase in sale was in line with production. |
| • | Production of copper rods increased from 100,219 tons in fiscal year 2020 to 122,390 tons in fiscal year 2021, an increase of 22.1%. Copper rod sales increased from 98,158 tons in fiscal year 2020 to 121,643 tons in fiscal year 2021, an increase of 23.9% in line with the increase in production. |
| • | Sales of copper in the Indian market increased from 98,555 tons in fiscal year 2020 to 125,979 tons in fiscal year 2021, an increase of 27.8% and our exports increased from 2,064 tons in fiscal year 2020 to 3,490 tons in fiscal year 2021, an increase by 69.1%. Our domestic sales as a percentage of total sales decreased from 97.9% in fiscal year 2020 to 97.3% in fiscal year 2021. |
| • | Daily average copper cash settlement price on the LME increased from $ 5,855 per ton in fiscal year 2020 to $ 6,897 per ton in fiscal year 2021, an increase of 17.8%. |
Operating loss in the copper segment decreased from loss of 13,085 million in fiscal year 2020 to operating loss of 5,372 million ($ 73 million) in fiscal year 2021, an increase of 7,713 million. The decrease in operating loss was mainly due to higher copper LME prices, higher volumes and reduced Tuticorin fixed overheads as compared to fiscal year 2020.
₹
₹
₹
165
Aluminium
Revenue from external customers in the aluminium segment increased from 265,445 million in fiscal year 2020 to 285,756 million ($ 3,907 million) in fiscal year 2021, an increase of 20,311 million, or 7.7%, driven primarily by rising LME aluminium prices and higher sales in line with higher production volumes.
₹
₹
₹
| • | Aluminium production increased from 1,903,981 tons in fiscal year 2020 to 1,969,483 tons in fiscal year 2021, an increase of 3.4%. Production of value-added products decreased from 36.7% in fiscal year 2020 to 33.1% in fiscal year 2021. |
| • | Aluminium sales increased from 1,922,430 tons in fiscal year 2020 to 1,992,467 tons in fiscal year 2021, an increase of 3.6%. |
| • | Sales of aluminium ingots increased from 1,166,639 tons in fiscal year 2020 to 1,302,054 tons in fiscal year 2021, an increase of 11.6%. This includes Primary Foundry Alloys (PFA) and Alloy Ingot volumes. |
| • | Wire rod sales increased by 0.8% from to 325,801 tons in fiscal year 2020 to 328,360 tons in fiscal year 2021. |
| • | Billets sale decreased by 22.6% from 346,324 tons in fiscal year 2020 to 268,219 tons in fiscal year 2021. |
| • | Slabs sales grew from 25,704 tons in fiscal year 2020 to 39,989 tons in fiscal year 2021, an increase of 55.6%. |
| • | Rolled product sales grew from 27,250 tons in fiscal year 2020 to 31,311 tons in fiscal year 2021, an increase by 14.9%. |
| • | Hot metal sales during fiscal year 2021 were 22,535 tons, down by 26.6% from 30,712 tons in fiscal year 2020. |
| • | Aluminium sales in the domestic market increased from 624,915 tons in fiscal year 2020 to 635,715 tons in fiscal year 2021, marginally increased by 1.7%. Our aluminium exports increased from 1,298,516 tons in fiscal year 2020 to 1,335,837 tons in fiscal year 2021, increased by 2.9%. |
| • | The daily average aluminium cash settlement price on the LME increased from $ 1,749 per ton in fiscal year 2020 to $ 1,805 per ton in fiscal year 2021, increase by 3%. |
Operating profit in the aluminium segment increased from 4,434 million in fiscal year 2020 to 59,736 million ($ 817 million) in fiscal year 2021, an increase of 55,302 million. The increase in operating profit was primarily due to a mix of factors across rising LME Aluminium prices, higher sales, improved hot metal cost of production, rupee depreciation and gain on account of
₹
₹
₹
true-up
of RPO (Renewable Power Obligations) liabilities.Power
Revenue from external customers in the power segment decreased from 58,599 million in fiscal year 2020 to 53,752 million ($ 735 million) in fiscal year 2021, a decrease of 4,847 million or 8.3%. Power sales increased from 11,162 million units in fiscal year 2020 to 11,261 million units in fiscal year 2021, an increase of 0.9%. The fiscal year 2021 was a significant year for the Jharsuguda power plant, where we achieved PLF of 58% against 11% in fiscal year 2020. The PLF at BALCO was 66% and Talwandi Sabo (TSPL) power plant achieved plant availability of 81%.
₹
₹
₹
Malco power plant is under care and maintenance since May 26, 2017 due to low demand in southern India.
| • | Talwandi Sabo power plant, operated at 81% plant availability in fiscal year 2021. It supplied 6,479 million units of power in fiscal year 2021 as compared to 8,223 million units of power in fiscal year 2020 to the PSPCL. TSPL’s PPA with PSEB compensates it based on the availability of the plant. |
| • | The Jharsuguda 600 MW power plant operated at a lower PLF of 58.0% during fiscal year 2021, as compared to 11% in fiscal year 2020. |
| • | At BALCO, the 300 MW IPP unit of the 300MW power plant operated at PLF of 66.0% in fiscal year 2021, as compared to 71.0% in fiscal year 2020. |
| • | The average power realization decreased from ₹ ₹ |
| • | Cost of generation at the power business (excluding power from the TSPL 1980 MW power plant) decreased from ₹ ₹ |
| • | The average power realization at Talwandi Sabo power plant decreased from ₹ ₹ ₹ ₹ |
Operating profit in the power segment decreased from 10,789 million in fiscal year 2020 to 8,321 million ($ 114 million) in fiscal year 2021, decrease of 2,468 million or 22.9%, lower sales realisation, partially offset by lower cost of production. During fiscal year 2021, Operating margin decreased from 18.4% in fiscal year 2020 to 15.5% in fiscal year 2021.
₹
₹
₹
TSPL realized 3,750 million ($ 51 million) from PSPCL I the fiscal year 2021 on account of GCV matter resolution basis the Hon’ble Supreme Court order.
₹
166
Other
Operating loss in our other business segments decreased from 8,618 million in fiscal year 2020 to 2,471 million ($ 34 million) in fiscal year 2021, mainly due to impairment charge on assets amounting 5,098 million ($ 68 million) recognised during the fiscal year 2020 at ASI which operate in glass substrate business.
₹
₹
₹
Investment and other income
Investment and other income increased from 25,714 million in fiscal year 2020 to 32,177 million ($ 440 million) in fiscal year 2021, an increase of 6,463 million or 25.1%, mainly due to interest income on the affiliate loan to VRL, partially offset by decrease in average investments and Mark to Market (MTM) movement at Zinc India.
₹
₹
₹
Finance and other costs
Finance costs decreased from 54,557 million in fiscal year 2020 to 52,955 million ($ 724 million) by 1,602 million or 2.9% in fiscal year 2021.
₹
₹
₹
This decrease is mainly on account of lower blended cost of borrowings, partially offset by lower capitalisation of interest cost at aluminium and oil & gas business and increase in average borrowings.
The proportion of Indian Rupee borrowings is 89.0% and USD borrowing are 11.0% in fiscal year 2021 in comparison to 87.0% and 13.0% respectively in fiscal year 2020.
Tax expense
Tax credit decreased from26,677 million in fiscal year 2020 to tax expense of19,084 million ($ 261 million) in fiscal year 2021. Our effective income tax rate, calculated as tax expense divided by our profit or loss before taxes, was 38.8% in fiscal year 2020 as compared to 11.5% in fiscal year 2021. The effective tax rate has decreased by 27.3% which is driven by change in profit mix. The normalized ETR is 27% (excluding tax on dividend from HZL of 8,690 million, new tax regime impact of (2,494) million, tax on exceptional items of 1,538 million and Deferred Tax Asset recognised on losses in ESL of31,107 million) compared to 33% due to increase in profit from the entities which are taxable at lower rate and adoption of new regime in one of the major subsidiary.
₹
₹
₹
₹
₹
₹
Non-controlling
interestOn account of above-mentioned factors, profit for the year increased from loss of 42,100 million in fiscal year 2020 to profit of 1,46,990 million ($ 2010 million) in fiscal year 2021, an increase of 189,090 million.
₹
₹
₹
Profit attributable to 19,148 million in fiscal year 2020 to 34,107 million ($ 466 million) in fiscal year 2021, an increase of 14,959 million or 78.1%.
non-controlling
interest increased from₹
₹
₹
B. Liquidity and Capital Resources
Liquidity
We expect that our existing cash resources and cash from operations will be sufficient to finance our foreseeable working capital requirements, in both the short term (i.e., the 12 months following the year ended March 31, 2022) and the long term (i.e., beyond such additional 12-month period). At March 31, 2022, we held cash and cash equivalents aggregating to 324,707 million ($ 4,280 million) which consists of cash and cash equivalents, short term investments and fixed deposits. Our financial liabilities consist of168,944 million ($ 2,227 million) of current borrowings (including current maturities of long term debt ) and362,023 million ($ 4,772 million) of non-current borrowings. The current borrowings consist of working capital loans from banks, financial institutions and commercial papers amounting to74,215 million ($ 978 million). Our non-current borrowings consist mainly of loans from banks and financial institutions of371,525 million ($ 4,897 million), non-convertible debentures, redeemable preference shares and bonds of79,701 million ($ 1,050 million) and other borrowings of5,526 million ($ 74 million). Non-current borrowings include current maturities of long term debt amounting to94,729 million ($ 1,249 million).
₹
₹
₹
₹
₹
₹
₹
₹
167
Capital Requirements
Our principal capital requirements include:
| • | capital expenditures, towards expansion of capacities in existing businesses including modernization of facilities, development of discovered oil fields and to sustain production or for enhanced recovery from reservoir and towards exploration and other ancillary business activities; |
| • | the establishment of our commercial power generation business; |
| • | consolidation of our ownership in our various subsidiaries; and |
| • | acquisitions of complementary businesses that we determine to be attractive opportunities. |
We continue to consider increasing capacities of our existing businesses through greenfield and brownfield projects and through acquisitions as one of our major growth strategies, though we are actively monitoring global market and economic conditions and the outlook for commodity prices, as well as our current and anticipated liquidity positions, as we constantly evaluate our desired rate of growth in pursuing this strategy.
Ministry of Environment, Forest and Climate Change revised emission norms for Coal based Thermal Power Plants (TPPs) in India vide its notification in December 2015. Most of the Company’s operations are complying with revised emission norms on the emission parameters like Particulate Matter (PM), Mercury, Nitrogen Oxide (“NOx”) etc. but compliance with sulphur dioxide emission norms is a challenge. Installation of FGD is required at all the Company’s Thermal Power Plants (TPP) to meet sulphur dioxide emission norms including captive Coal based Thermal Power Plants. The timelines for sulphur dioxide emission norms compliance has been extended to December 2024 for captive power plants at our Jharsuguda and Lanjigarh and December 2023 for captive power plants at our BALCO facilities. The Independent Power plants of BALCO and Jharsuguda are required to comply with the norms by December 2023 and December 2024 respectively. We have been working with the relevant government authorities at state and national level, in addition to potential suppliers and business partners to evaluate the best techno-commercial options over the past year. We have had multiple correspondences with regulatory agencies to update on the progress in this regard. We have issued the Letter of Intent for installation of FGD to competent bidders for our Jharsuguda, Lanjigarh and BALCO captive power facilities.
The timeline for FGD installation at TSPL was December 2019. TSPL had issued letter of intent on SEPCO before this deadline. MOP issued notification dated July 2, 2020 to restrict imports from China. Power China SEPCO1 has communicated their inability to execute the FGD project quoting aforementioned MOP notification and prevailing COVID situation in India. TSPL is proceeding with further steps for retendering the FGD project. The Government of Punjab has written to the concerned authorities for extending the timelines for Punjab power plants till December 2022 to implement FGD. The Punjab Pollution Control Board (“PPCB”) issued Show cause Notice (SCN) on November 21, 2019, following which TSPL made a representation to Chairman, PPCB on November 28, 2019. PPCB has since disposed the notice and has forwarded TSPL’s request letter for time extension to Central Pollution Control Board (“CPCB”) till December 2022 and for further direction. CPCB issued SCN on January 31, 2020 for which TSPL submitted their detailed response to CPCB and representation was made to Chairman, CPCB on February 5, 2020 along with IIT Kanpur study report carried out by TSPL showing negligible contribution of its operation on Delhi’s particulate air pollution. The CPCB response is awaited on the same. Meanwhile, CPCB has imposed a nominal fine of 1.8 million per month per unit for all the plants till they install FGD, which the entity has applied for refund, post MoEF&CC vide notification dated March 31, 2021 extended the FGD installation time limit upto December 2024 APTEL vide order dated August 28, 2020 has approved the said notification including installation and operation of FGD and associated system for Sulphur Dioxide (“SO2”) emissions as well as installation and operation of SNCR and/or any other appropriate technology for Nitrogen Oxied (“NOx”) emissions as a change in law event as per the PPA. It has further stated that TSPL is entitled for additional expenditure for installation and operation of FGD and associated systems including all allied cost like taxes, duties etc. as a part of Additional Capital Cost to be incurred by TSPL and has directed the Commission to devise a mechanism for payment of above mentioned costs and other expenses in relation to procurement, installation, commissioning, operation and maintenance of FGD for SO2 as approved by the concerned authority, after prudence check. PSPCL has appealed against the order in SC. The matter was listed on February 3, 2022, wherein respondents including TSPL have been directed to file counter affidavits in the matter. The next date of hearing is yet to be notified.
₹
Our business is heavily dependent on plant and machinery for the production of our copper, zinc, oil and gas, iron ore and aluminium products, as well as investments in our mining and exploration operations and our commercial power generation business. Investments to maintain and expand production facilities are, accordingly, an important priority and have a significant effect on our cash flows and future results of operations. Our capital expenditures in fiscal year 2020, 2021 and 2022 were 78,227 million, 68,833 million and 106,028 ($ 1,397) respectively, largely due to our capacity expansion and new projects across our oil and gas, copper, zinc, aluminium and power businesses.
₹
₹
₹
ESL has plans for an expansion project with an estimated investment of approximately 26,100 million ($348 million) for increasing the plant capacity from 1.5 MTPA to 3.0 MTPA in the existing premises. Project includes addition of major facilities like additional blast furnace of 1050 m
₹
3
supported by 0.5 MTPA coke plant, new 1.8 MTPA Pellet plant,800 TPD oxygen plant, new 1.2 MTPA blast furnace, 0.18 MTPA DI Pipe plant, railway siding infrastructure, Raw Material Handling System (“RMHS”) along with upgradation of existing plants through debottlenecking and digitalization. Project duration will be 14 months.168
HZL has expansion projects in the amount of approximately 122,100 million ($ 1,690 million) to be spent on the expansion of its existing underground mines together with the development of the underground mine at Rampura Agucha, expansion of Sindesar Khurd, Zawar, Rajpura Dariba and Kayad mines. As of March 31, 2022, 112,390 million ($ 1,509 million) has been spent on the expansion projects. Based on a long-term evaluation of assets and in consultation with global experts, the Company is evaluating plans to increase its mined metal capacity from 1.2 mtpa to 1.5 mtpa. The Board has approved the Phase I of this expansion which will increase mined metal and smelting capacity from 1.2 mtpa to 1.35 mtpa through brownfield expansion of existing mines at an estimated capital expenditure of around 45,000 million ($ 597 million).
₹
₹
₹
Zinc International - Gamsberg Phase II Expansion Project at cost of USD 466 million was approved by the Board in April 2022. This Project will have a construction period of 18 to 21 months and will double up Gamsberg capacity from 4Mtpa Ore to 8Mtpa to produce additional 200ktpa MiC zinc.
We commenced exploration campaigns in Rajasthan in our oil and gas business to test prospective reservesTo unlock the potential of the prospective reserves, we are carrying out exploration drilling, seismic activities construction activities and studies. The estimated cost of this project for joint operation partners is $ 827 million and the corresponding capital expenditure spent on the exploration campaign as of March 31, 2022, is $ 745 million.
.
We have ongoing projects set up on the existing producing fields at Mangala, Bhagyam and Aishwariya which approximately amounts to $ 6,035 million for joint operation partners. The plan involves ramping up or sustaining the production from all the fields for which additional wells and related surface facilities are being drilled and constructed. Further, we continue to focus on infrastructure creation and prudent reservoir management for water flood and enhanced oil recovery implementation. As of March 31, 2022, $ 4,454 million was spent on the ongoing projects at Mangala, Bhagyam and Aishwariya.
We planned to upgrade the existing Raageshwari gas terminal to provide increased capacity and also to unlock the opportunities in Mangala and Aishwariya Barmer hill development by investing $ 895 million by the joint operation partners. We are also looking at the options to construct a new gas pipeline to monetize the additional gas potential in the block. As of March 31, 2022, $ 703 million has been spent.
Also, we are also intending to start the production from the blocks acquired under Open Acerage Licensing policy (OALP). As of March 31, 2022, $ 170 million has been spent.
We have 44,240 million ($ 583 million) of ongoing expansion projects to set up a 400,000 tpa copper smelter plant. We have incurred 8,090 million ($ 105 million) on these ongoing expansions as of March 31, 2022. See
₹
₹
“Item 4 – Business Overview- Projects and developments for further details.”
BALCO has set up a 325,000 tpa aluminium smelter and 1,200 MW power facility at an estimated cost of 107,500 million ($ 1,416 million) which uses 3,480 million ($ 46 Million) which will improve the plant’s VAP capacity and overall premium. Further, on July 26, 2021, the Board has approved the BALCO smelter expansion by 414 KTPA, subject to requisite government approvals at a cost of ~ 66,110 million ($ 871 million) which will help to reach 92% VAP portfolio at BALCO. This includes investment made to build new township for improved safety and security.
₹
pre-baked
technology from the Guiyang Aluminium Magnesium Design & Research Institute, or GAMI, of China. The first metal tapping from the 325,000 tpa aluminium smelter started in fiscal year 2015, and commercial production started during fiscal year 2015. On May 13, 2021, the Board approved the expansion of Rolled Product Capacity from existing 50 KTPA to 130 KTPA at a cost of₹
₹
Initially in 2008, we planned to expand our alumina refining capacity at Lanjigarh to 6 mtpa and constructing an associated 210 MW captive power plant. The expansion of the alumina refinery and related mining operations in and around the Niyamgiri was put on hold in October 20, 2010, when the MoEF&CC directed us to hold from further expansion. See “” for details. As of March 31, 2022, we spent 51,903 million ($ 684 million) on the Lanjigarh expansion project (up to 6 mtpa) including other auxiliary assets. Total Project cost for refinery expansion upto 5 MTPA is estimated at 108,120 million ($ 1,425 million). On February 3, 2021, the expansion plan to increase the capacity of the Lanjigarh alumina refinery to 5 MTPA was approved by Vedanta Limited Board, subject to requisite Government approvals and further on May 13, 2021, the Board approved the estimated cost of 46,810 Million ($ 617 million). The completion of this expansion plan will place the Lanjigarh alumina refinery as one of the world’s largest single-location alumina refinery complex. We had estimated of investing 150,380 million ($ 1,982 million) to set up 1,250,000 tpa aluminium smelter at Jharsuguda. As of March 31, 2022, we have already spent 230,265 million ($ 3,035 million) on this project. Further, the Board has approved various projects at Jharsuguda to increase the VAP capacity.
Item 8. Financial Information—A. Consolidated Statements and Other Financial Information – Legal Proceedings
₹
₹
₹
₹
₹
The first 660 MW and second 660 MW unit of the Talwandi Sabo power plant were capitalized in fiscal year 2015 and 2016 respectively. The third 660 MW unit was capitalized on September 1, 2016, after successfully completing trial runs.
169
We have scheduled repayment of borrowings during fiscal year 2023, outstanding at the end of fiscal year 2022, denominated in a mix of Indian Rupees and US dollars of 150,146 million ($ 1,979 million) and 14,643 million ($ 193 million), respectively. We plan to finance our capital expenditures and our loan repayment obligations out of our cash flows from operations and financing activities. Our failure to make planned expenditures could adversely affect our ability to maintain or enhance our competitive position and develop higher margin products.
₹
₹
Consistent with our strategy to consolidate our ownership interests in our key subsidiaries, we had exercised the second call option to acquire the GoI’s remaining ownership interest in HZL. HZL had initiated an arbitration proceeding, which have now been withdrawn and the tribunal dissolved. See” for more information. The option value will be the fair market value determined by an independent appraiser and will entail significant capital requirements. Based solely on the market price of HZL’s shares on the NSE on July 15, 2022, of 285.35 ($ 3.76) per share, and not including the other factors that the independent appraiser may consider, one possible estimation of the exercise price to acquire all of the GoI’s 1,247,950,590 shares in HZL would be 356,103 million ($ 4,693.59 million). If the GoI sells its remaining ownership interest in HZL through a public offer, we may look into alternative means of increasing our ownership interest in HZL.
“Item 4. Information on the Company—B. Business Overview—Our Business—Call Options over Shares
₹
₹
In addition, we have exercised our option to acquire the GoI’s remaining 49.0% ownership interest in BALCO, although the exercise of this option has been contested by the GoI and the GoI retains the right and has expressed an intention to sell 5.0% of BALCO to BALCO employees. See “Item 4. Information on the Company—B. Business Overview—Our Business—Call Options over Shares” for more information.
We may in the future make acquisitions of mines, plants or minerals and metals businesses that complement or enhance our existing businesses.
We have consistently paid dividends including tax on dividend amounting to 14,441 million in fiscal year 2020, 91,216 million in fiscal year 2021 and 193,496 million ($ 2,551) in fiscal year 2022.
₹
₹
₹
Capital Resources
We plan to finance our capital requirements through a mix of cash flows from operating and financing activities. We do not depend on
off-balance
sheet financing arrangements. We believe that our working capital requirements can be sufficiently funded through our internal accruals and undrawn line of credit.Statement of cash flows
The following table is derived from our selected consolidated financial data and sets forth our cash flow for fiscal years 2018, 2019, 2020, 2021 and 2022:
For the Year Ended March 31, | ||||||||||||||||||||||||
Particulars | 2018 | 2019 | 2020 | 2021 | 2022 | 2022 | ||||||||||||||||||
( ₹ in millions) | ($ in millions) | |||||||||||||||||||||||
Net cash provided by (used in): | ||||||||||||||||||||||||
Operating activities | 348,407 | 208,420 | 182,393 | 295,952 | 282,819 | 3,727 | ||||||||||||||||||
Investing activities | (52,153 | ) | (133,147 | ) | (116,866 | ) | (167,358 | ) | (36,608 | ) | (482 | ) | ||||||||||||
Financing activities | (357,144 | ) | (45,643 | ) | (87,356 | ) | (131,371 | ) | (208,166 | ) | (2,744 | ) | ||||||||||||
Comparison of Years Ended March 31, 2021 and March 31, 2022
Net Cash from Operating Activities
Net cash from operating activities was 282,819 million ($ 3,727 million) in fiscal year 2022 compared to net cash from operating activities of 295,952 million in fiscal year 2021, a decrease of 13,133 million. The net decrease in cash from operating activities was primarily due to the following reasons:
₹
₹
₹
| • | net purchase of short-term investments was ₹ ₹ |
| • | the cash used from operating assets and liabilities (working capital) in fiscal year 2022 was ₹ ₹ |
| • | interest received was ₹ ₹ |
| • | dividend received was ₹ ₹ |
We believe our current working capital is sufficient for our present capital requirements.
Net Cash Used in Investing Activities
Net cash used in investing activities was 36,608 million ($ 482 million) in fiscal year 2022 as compared to net cash used of 167,358 million in fiscal year 2021. The net cash used in investing activities in fiscal year 2022 was lower primarily due to:
₹
₹
| • | cash used towards acquisition of property, plant and equipment of ₹ ₹ |
| • | net cash inflow on account of structured investments was nil million in fiscal year 2022 as compared to nil in fiscal year 2021. |
170
| • | net cash inflow on account of short-term deposits was ₹ ₹ |
| • | net cash inflow on account of loan repaid by related party ₹ ₹ |
| • | net cash outflow on account of acquisition of business was ₹ ₹ |
Net Cash used in Financing Activities
Net cash used in financing activities was 208,166 million ($ 2,744 million) in fiscal year 2022 as compared to net cash used of 131,371 million in fiscal year 2021, primarily on account of:
₹
₹
| • | net cash outflow from long-term and short-term debts (other than working capital and related party debt) was ₹ ₹ |
| • | net cash outflow for payment of dividend (including deemed dividend and payment of dividend by subsidiaries to non-controlling interests) of₹ ₹ |
| • | net cash inflow from working capital loans was ₹ ₹ |
Comparison of Years Endd March 31, 2020 and March 31, 2021
Net Cash from Operating Activities
Net cash from operating activities was 295,952 million ($ 4,046 million) in fiscal year 2021 compared to net cash from operating activities of 182,393 million in fiscal year 2020, an increase of 113,559 million. The net increase in cash from operating activities was primarily due to the following reasons:
₹
₹
₹
| • | net proceeds of short term investments was ₹ ₹ |
| • | the cash used from operating assets and liabilities (working capital) in fiscal year 2021 was ₹ ₹ |
| • | interest received was ₹ ₹ |
| • | dividend received was ₹ ₹ |
We believe our current working capital is sufficient for our present capital requirements.
Net Cash Used in Investing Activities
Net cash used in investing activities was 167,358 million ($ 2,288 million) in fiscal year 2021 as compared to net cash used of 116,866 million in fiscal year 2020. The net cash used in investing activities in fiscal year 2021 was higher primarily due to:
₹
₹
| • | lower cash used towards acquisition of property, plant and equipment of ₹ ₹ |
| • | net cash inflow on account of structured investments was ₹ |
| • | net cash outflow on account of short-term deposits was ₹ ₹ |
| • | net cash outflow on account of loans given to related party was ₹ |
| • | net cash outflow on account of acquisition of business was ₹ ₹ |
171
Net Cash used in Financing Activities
Net cash used in financing activities was 131,371 million ($ 1,796 million) in fiscal year 2021 and 87,356 million in fiscal year 2020, primarily on account of:
₹
₹
| • | net cash inflow from long-term and short-term debts (other than working capital and related party debt) was ₹ ₹ |
| • | net cash outflow for payment of dividend (including deemed dividend and payment of dividend by subsidiaries to non-controlling interests) of₹ ₹ |
| • | net cash outflow from working capital loans was ₹ ₹ |
Capital Expenditure and Commitments
Our principal financing requirements primarily include:
| • | capital expenditures, towards expansion of capacities in existing businesses including modernization of facilities; |
| • | the establishment of our planned commercial power generation business; |
| • | consolidation of our ownership in our various subsidiaries; and |
| • | acquisitions of complementary businesses that we determine to be attractive opportunities. |
The following table shows our capital expenditures in fiscal years 2020, 2021 and 2022:
Particulars | For Year Ended March 31, | |||||||||||||||
2020 | 2021 | 2022 | 2022 | |||||||||||||
(in millions) | (US dollars in millions) | |||||||||||||||
Capital Expenditure | 78,227 | 68,833 | 106,028 | 1,397 | ||||||||||||
Off balance sheet arrangements / Contractual obligations and other commercial commitments
We have various contractual obligations and other commercial commitments arising from our operations. Our contractual obligations and our other commercial commitments as of March 31, 2022, are shown in Notes 25, 27, and 33. to our consolidated financial statements included at Item 18. of this annual report.
VEDL contractual obligations and other commercial commitments are set forth in the table below
Contractual obligations | Total | Less than 1 Year | 1-3 Years | 3-5 Years | More than 5 years | |||||||||||||||||||||||||||||||||||
| ( ₹ | ($) | ( ₹ | ($) | ( ₹ | ($) | ( ₹ | ($) | ( ₹ | ($) | |||||||||||||||||||||||||||||||
Bank loans and borrowings (5) | 532,312 | 7,017 | 164,342 | 2,166 | 147,150 | 1,940 | 112,637 | 1,485 | 108,183 | 1,426 | ||||||||||||||||||||||||||||||
Interest commitments (1) | 88,357 | 1,164 | 26,855 | 354 | 34,755 | 458 | 18,389 | 242 | 8,358 | 110 | ||||||||||||||||||||||||||||||
Other liabilities (2) | 408,105 | 5,379 | 395,034 | 5,207 | 12,699 | 167 | 86 | 1 | 286 | 4 | ||||||||||||||||||||||||||||||
Capital and other commitments (6) | 244,718 | 3,225 | 101,788 | 1,341 | 104,921 | 1,383 | 38,009 | 501 | — | — | ||||||||||||||||||||||||||||||
Guarantees (3) (6) | 59,087 | 779 | 11,497 | 152 | 42,227 | 556 | 1,187 | 16 | 4,176 | 55 | ||||||||||||||||||||||||||||||
Export Obligations (4) (6) | 9,107 | 120 | 6,039 | 80 | 2,920 | 38 | 148 | 2 | — | — | ||||||||||||||||||||||||||||||
Purchase Obligations (7) | 406,121 | 5,353 | 265,128 | 3,494 | 78,953 | 1,041 | 61,569 | 812 | 471 | 6 | ||||||||||||||||||||||||||||||
Estimated benefit payments on unfunded defined benefit plans (8) | 2,590 | 34 | 179 | 2 | 378 | 5 | 321 | 4 | 1,712 | 23 | ||||||||||||||||||||||||||||||
Total | 1,750,397 | 23,071 | 970,862 | 12,796 | 424,003 | 5,588 | 232,346 | 3,063 | 123,186 | 1,624 | ||||||||||||||||||||||||||||||
| (1) | Interest payments for long-term fixed rate debts have been calculated based on applicable rates and payment dates. Interest payments on floating rate debt have been calculated based on the payment dates and rates as applicable on March 31, 2022, for each relevant debt instrument. See “Note 25: Financial instruments – A. Financial assets and liabilities - Financial Risk – (a) Liquidity” |
| (2) | Other liabilities consist of acceptances, derivatives, trade and other payables. See “Note 25: Financial instruments – A. Financial assets and liabilities - Financial Risk – (a) Liquidity” |
| (3) | Excludes guarantees issued as collateral in respect of certain litigations to various agencies and government authorities. |
172
| (4) | The Group has given bonds of ₹ ₹ ₹ ₹ ₹ |
| (5) | See “ Note 25: Financial instruments – A. Financial assets and liabilities - Financial Risk – (a) Liquidity |
| (6) | See “Note 33: Commitments, guarantees, contingencies and other disclosures” of Notes to the Consolidated Financial Statements. |
| (7) | These comprises irrevocable commitments to suppliers of goods and services. |
| (8) | Net defined benefit liability relating to post retirement benefit obligations recorded in accordance with IAS 19 - Employee Benefits is included in Note 27 in Item 18 in this Annual Report. Refer to “ Note 27 in Item 18 in this Annual Report ” for further details. |
Safe Harbor
See “”
Special note regarding forward-looking statements
Foreign exchange effects
See “” of Notes to the Consolidated Financial Statements.
Note 25: Financial instruments - Financial risk - Foreign exchange risk
Recently issued accounting pronouncements
See “” of Notes to the Consolidated Financial Statements.
Note 3 (b): Application of new and revised standards
173
ITEM 6. | DIRECTORS, SENIOR MANAGEMENT AND EMPLOYEES |
A. Directors and Senior Management
Our board of directors consists of eight directors.
The following table sets forth the name, age and position of each of our chairman, directors, other executive officers and significant employees as on July 15, 2022:
Name # | Age | Position | ||||
Directors | ||||||
Anil Agarwal (1) | 69 | Non-Executive Chairman | ||||
Navin Agarwal (2) | 61 | Executive Vice-Chairman and Whole Time Director* | ||||
Padmini Seksaria (3) | 46 | Non-Executive Independent Director | ||||
Dindayal Jalan (4) | 65 | Non-Executive Independent Director | ||||
Priya Agarwal (5) | 32 | Non-Executive Non-Independent Director | ||||
Upendra Kumar Sinha (6) | 70 | Non-Executive Independent Director | ||||
Akhilesh Joshi (7) | 68 | Non-Executive Independent Director | ||||
Sunil Duggal (8) | 59 | Whole Time Director* and Chief Executive Officer | ||||
Other Executive Officers | ||||||
Sharad Kumar Gargiya | 49 | Chief Commercial Officer | ||||
Madhu Srivastava | 48 | Chief Human Resources Officer | ||||
Ajay Goel | 46 | Acting Chief Financial Officer | ||||
Dilip Golani | 56 | President, Management Assurance Services | ||||
Sandep Agarwal | 44 | Head, Investor Relations | ||||
Rajinder Singh Ahuja | 48 | Head, Health, Safety, Environment and Sustainability | ||||
Ritu Jhingon | 53 | Director – Corporate Communications and CEO Nand Ghar | ||||
Dhiraj Nayyar | 46 | Director, Economics and Policy | ||||
Sanjeev Ghemawat | 52 | General Counsel | ||||
Leena Verenkar | 51 | Head - Corporate Social Responsibility | ||||
Vineet Jaiswal | 47 | Deputy Chief Executive Officer – Centre of Excellence | ||||
Philip Campbell | 62 | Head - Asset Optimization | ||||
Significant Employees | ||||||
Zinc India | ||||||
Arun Misra | 57 | Chief Executive Officer, Zinc Business | ||||
Sandeep Modi | 40 | Interim Chief Financial Officer, Hindustan Zinc Limited | ||||
Zinc International | ||||||
Pushpender Singla | 40 | Chief Financial Officer, Zinc International Division and CMT | ||||
Oil and Gas | ||||||
Prachur Sah | 46 | Deputy Chief Executive Officer, Cairn Oil & Gas | ||||
Hitesh Vaid | 49 | Chief Financial Officer, Cairn Oil and Gas | ||||
Iron Ore and Steel | ||||||
Sauvick Mazumdar | 51 | Chief Executive Officer, Iron and Steel Business | ||||
Navin Kumar Jaju | 40 | Chief Financial Officer, Iron and Steel Business | ||||
Navanath Vhatte | 59 | Chief Executive Officer, Electrosteel Steels Limited | ||||
Copper | ||||||
Puneet Khurana | 40 | Chief Executive Officer, Copper Operations at Tuticorin and Silvassa | ||||
Anand Soni | 42 | Chief Financial Officer, Copper Operations at Tuticorin and Silvassa | ||||
Power | ||||||
Vibhav Agarwal | 45 | CEO- Power | ||||
Swapnesh Bansal | 41 | Chief Financial Officer - TSPL | ||||
Aluminium | ||||||
Rahul Sharma | 49 | Deputy Chief Executive Officer, Aluminum Business | ||||
Abhijit Pati | 57 | Chief Executive Officer and Whole-time Director, BALCO | ||||
Sunil Gupta | 59 | Chief Executive Officer , Jharsuguda. | ||||
Gobinda Gopal Pal | 57 | Deputy Chief Executive Officer, Alumina | ||||
Anup Agarwal | 48 | Chief Financial Officer, Aluminum Business. | ||||
174
| * | A “Whole Time Director” is a director who is in whole-time employment of the Company. A Whole-Time Key Managerial Personnel cannot hold office in more than one company except in its subsidiary company. |
| # | Notes |
| a) | Krishnamurthi Venkataramanan ceased to be Non-Executive Independent Director of the Company from close of business hours on March 31, 2021, upon completion of his second and final term; |
| b) | GR Arun Kumar resigned from the post of Whole-Time Director and Chief Financial Officer of the Company and was relieved from his position effective from close of business hours on April 24, 2021; |
| (1) | Anil Agarwal was appointed as the Chairman Emeritus of our Company with effect from April 1, 2014 and ceased to be a member of the Board with effect from April 1, 2014. Subsequently, he has been appointed as an additional Non-Executive Director designated as Chairman of the Company with effect from April 1, 2020, which was approved by the shareholders in the Annual General Meeting of the Company held on September 30, 2020. He is member of Nomination and Remuneration Committee. |
| (2) | Navin Agarwal was appointed as an Executive Chairman with effect from April 1, 2014. Navin Agarwal was appointed as Whole Time Director with effect from August 17, 2013, to July 31, 2018, and further reappointed with effect from August 1, 2018, upto July 31, 2023. Subsequently, he has been re-designated as Executive Vice-Chairman of the Company with effect from April 1, 2020 and ceased to be a member of the Nomination and Remuneration Committee with effect from April 1, 2020. He is a permanent invitee of the Nomination and Remuneration Committee |
| (3) | Padmini Sekhsaria has been appointed as an Additional Director designated as Non-Executive Independent Director with effect from February 5, 2021 for a 1st term of two years effective from February 5, 2021 till February 4, 2023 which was approved by the shareholders in the Annual General Meeting of the Company held on August 10, 2021 She is also a member of the Corporate Social Responsibility Committee effective February 5, 2021 and appointed as a member of the Stakeholders Relationship Committee effective April 1, 2021. |
| (4) | Dindayal Jalan has been appointed as an Additional Director designated as Non-Executive Independent Director of the Company for a 1st term of two years effective from April 1, 2021, till March 31, 2023, which was approved by the shareholders in the Annual General Meeting of the company held on August 10, 2021. He has been appointed as a member of the Audit and Risk Management Committee, Nomination and Remuneration Committee effective April 1, 2021, and Chairperson of Stakeholders Relationship Committee effective October 21, 2021. He has been inducted as a member of Committee of Directors effective July 6, 2022. |
| (5) | Priya Agarwal was appointed as a Non-Executive Non-Independent Director with effect from May 17, 2017. She was appointed as aNon-Independent Director for a term of 3 years effective from May 17, 2017, to May 16, 2020, and further reappointed for a term of 3 years effective from May 17, 2020, till May 16, 2023, which was approved by the shareholders at the Annual General Meeting held on September 30, 2020. As on date, Priya Agarwal is a member of the Corporate Social Responsibility Committee and member of ESG Committee effective October 21, 2021. |
| (6) | Upendra Kumar Sinha was appointed as a Non-Executive Independent Director with effect from March 13, 2018, till August 10, 2021, which was approved by the shareholders at the Annual General Meeting held on August 24, 2018. In June 2021, the Board of Directors, on recommendation of Nomination and Remuneration Committee of the Company, have considered and approved there-appointment of Upendra Kumar Sinha asNon-Executive Independent Director on the Board of the Company for a 2nd and final term of 3 years effective from August 11, 2021, to August 10, 2024, which was approved by the shareholders in the Annual General Meeting of the Company held on August 10, 2021. Upendra Kumar Sinha is the member of the Stakeholders Relationship Committee and Chairperson of Nomination and Remuneration Committee and of the Audit and Risk Management Committee and member of Corporate Social Responsibility Committee. He has been designated as the Chairperson of the ESG Committee effective from April 1, 2021. |
| (7) | Akhilesh Joshi was appointed as an Additional Director designated as Non-Executive Independent Director on the Board of the Company for a 1st term of 1 year effective July 1, 2021 till June 30, 2022, which was approved by the shareholders in the Annual General Meeting of the company held on August 10, 2021. He has been appointed as a member of the Audit and Risk Management Committee and Chairperson of Corporate Social Responsibility Committee effective October 21, 2021, and member of ESG Committee effective July 1, 2021. The Board of Directors, on recommendation of Nomination and Remuneration Committee of the Company, on June 21, 2022, have considered and approved the re-appointment of Mr. Akhilesh Joshi as Non-Executive Independent Director on the Board of the Company for a 2nd and final term of 2 years effective from July 1, 2022, to June 30, 2024, subject to approval of the shareholders at the ensuing Annual General Meeting. |
| (8) | Sunil Duggal has been appointed as an Additional Director designated as Whole-Time Director and CEO and KMP of the Company effective from April 25, 2021 till July 31, 2023, which was approved by the shareholders in the Annual General Meeting of the company held on August 10, 2021. Sunil Duggal continued to be the member of ESG Committee and has been newly appointed as a member of the Stakeholders Relationship Committee effective from April 25, 2021. |
175
Non-Executive
Chairman| – | Anil Agarwal Start-ups. Mr. Anil Agarwal believes that businesses must give back to the society and help them prosper. He has pledged 75 per cent of his wealth for social good. He has signed The Giving Pledge, a movement of global philanthropists who have committed to give away majority of their wealth towards philanthropic and charitable causes. Mr Agarwal is committed to well-being of the communities with a focus on women and child development. His dream project, Nand Ghar is developing model anganwadis that are focused on eradicating child malnutrition, providing education, healthcare, and empowering women with skill development. The Anil Agarwal Foundation is committed towards empowering communities, transforming lives and facilitating nation building through sustainable and inclusive growth. The Foundation has teamed up with the Bill & Melinda Gates Foundation to improve the health and nutritional outcomes. Anil Agarwal is also the Executive Chairman of Vedanta and a director of Sterlite Technologies Limited, Conclave PTC Limited, Black Mountain Mining (Proprietary) Limited and Anil Agarwal Foundation. He is the son of Late Shri Dwarka Prasad Agarwal and is the brother of Navin Agarwal and father of Priya Agarwal. The business address of Mr. Anil Agarwal is 75 Nehru Road, Vile Parle (East), Mumbai, Maharashtra 400099, India. |
Directors
| – | Navin Agarwal re-designated as Executive Vice - Chairman. He serves as Executive Vice Chairman of Vedanta and aNon-Executive Director of HZL and Hare Krishna Packaging Private Limited. He has completed the Owner/President Management Program at Harvard University and holds a bachelor’s degree in commerce from Sydenham College, Mumbai, India. He is the son of Late Shri Dwarka Prasad Agarwal and is the brother of Anil Agarwal. The business address of Mr. Navin Agarwal is 75 Nehru Road, Vile Parle (East), Mumbai, Maharashtra 400099, India. |
| – | Padmini Sekhsaria |
176
| – | Dindayal Jalan D-807, Ashok Tower, 63/74, SS Rao Road, Parel, Mumbai - 400012, Maharashtra, India. |
| – | Priya Agarwal Non-Executive directors and was appointed to our Board with effect from May 17, 2017 and reappointed with effect from May 17, 2020. She is deeply passionate about environment and sustainability and has been playing a crucial role in strengthening Vedanta’s ESG practices. Under her leadership, Vedanta has put in place a comprehensive framework to be the ESG leader in the natural resources sector. The Company has committed to reducing carbon emissions to zero by 2050 or sooner and has pledged $5 billion over the next 10 years to accelerate the transition to net zero operations. Priya is passionate about child nutrition and gender neutrality and is leading a variety of CSR initiatives under Anil Agarwal Foundation which impacts the lives of more than 4.23 crore people at the grassroots level. The Foundation has pledged₹ |
| – | Upendra Kumar Sinha |
| – | Akhilesh Joshi |
177
| – | Sunil Duggal best-in-class state-of-the-art, Core-6, 3rd Floor, Scope Complex, 7, Lodhi Road, New Delhi – 110 003, India. |
Executive Officers
| – | Sharad Kumar best-in-class |
| – | Madhu Srivastava -oil and gas business for close to three years. During this time, she was also leading the Talent Acquisition and Diversity and Inclusion functions for Vedanta. Under her leadership, the Vedanta Group has put in place the right Human Resource policies, progressive and benchmarked people practices and frameworks for talent acquisition talent management, performance management, and rewards and recognition. She has 23 years of experience across human resource as well as sales, marketing and operations, spanning the Fast-Moving Consumer Goods (“FMCG”), telecom, Information Technology Enabled Service (“ITES”), Banking, financial services and insurance (“BFSI”) and natural resources industries. Madhu started her professional journey in 1999 with Godrej where she handled sales in Gujarat and Maharashtra and later moved to the Corporate Sales and Marketing role. Post working with companies like GE Capital and Reliance in operations and marketing profiles, she started her Human Resources journey in 2006 by joining Genpact as Assistant Vice President, Talent Acquisition where she led middle management hiring. She then went on to lead the recruitments for Citibank’s India operations as Vice President, Human Resource before joining Vedanta in 2012. Madhu has completed her Post Graduate Diploma in Management (“PGDM”) in marketing and sales, from the Indian Institute of Management, Ahmedabad. The business address of Madhu Srivastava is Core – 6, 3rd Floor, SCOPE Complex 7, Lodhi Road, New Delhi – 110003, India. |
| – | Ajay Goel |
| – | Dilip Golani |
178
| – | Sandep Agarwal |
| – | Rajinder Singh Ahuja CEO-TSPL. In this role, he is responsible for designing and driving the company’s HSE&S policies and initiatives with strong emphasis on ESG, advocacy, and governance, and in bringing onboard globally benchmarked bestin-class practices, through technology, automation, and digitization. He also works in partnership with our Business CEOs and IR/Communications teams to bring a strong Corporate HSE brand through communication with external and internal stakeholders. Rajinder has been associated with Vedanta since 2003 and has been instrumental in establishing benchmark level practices in HSE&S as HSE head of our zinc business. Rajinder holds a bachelor’s degree in electrical engineering from Maulana Azad College of Technology (NIT Bhopal). The business address of Rajinder Ahuja is Core – 6, 3rd Floor, SCOPE Complex 7, Lodhi Road, New Delhi – 110003, India. |
| – | Ritu Jhingon CEO-Nand Ghar. She was elevated to this position on December 9, 2021. Previous to this she held various leadership roles in the communications and Nand Ghar functions. In her current leadership role, Ritu is responsible for positioning the organization, and maintaining continuous engagement with key stakeholders, and in devising internal and external campaigns and communication for the organization, and in leadership messaging across multiple platforms. In her larger role, she works towards driving and cultivating a brand image, and establishing Vedanta as a prominent philanthropic group. Ritu has over 30 years of industry experience and has prior work experience with Hindustan Times and Ogilvy. Ritu holds a Master of Business Administration Degree in Marketing and Advertising from Delhi University. She has been associated with Vedanta since 2010. The business address of Ritu Jhingon is Core – 6, 3rd Floor, SCOPE Complex 7, Lodhi Road, New Delhi – 110003, India. |
| – | Dhiraj Nayyar editor-at-large |
– | Sanjeev Ghemawat |
| – | Leena Verenkar Goa- 403001, India |
179
| – | Vineet Jaiswal |
| – | Phillip Campbell |
Other Significant Employees
Zinc India Business
| – | Arun Misra |
| – | Sandeep Modi re-financing, cost control, tax planning as well as the implementation of various best practices across domains such as Commercial, Projects, Internal Audit, and Risk Management. Sandeep is qualified Rank holder Chartered Accountant from the Institute of Chartered Accountants of India (ICAI) and holds a Master of Commerce degree from Jai Narayan Vyas University, Jodhpur. The business address of Sandeep Modi is Hindustan Zinc Limited, Yashad Bhawan, Udaipur- 313 004, Rajasthan, India. |
Zinc International Business
| – | Pushpender Singla |
180
Oil and Gas Business
| – | Prachur Sah 362-363, Jwala Mill Road, Phase IV, Udyog Vihar, Gurugram, Haryana 122016, India. |
| – | Hitesh Vaid 362-363, Jwala Mill Road, Phase IV, Udyog Vihar, Gurugram, Haryana 122016, India. |
Iron Ore and Steel Business
| – | Sauvick Mazumdar |
| – | Navin Kumar Jaju Goa- 403001, India. |
| – | Navanath Vhatte CEO-ESL Steel Limited, he was heading the Value Addition Business (VAB) of VEDL. In this role, he was responsible for the growth of the VAB along with Plant Operations, Sales of Pig Iron, Met Coke and Power. His leadership and strategic approach have helped VAB to become the largest merchant pig iron producer in India at the lowest cost among peer groups. Mr. Vhatte championed the successful expansion of Pig Iron, Met Coke and Power Plant raising the unit capacity to 800 K Mt of Pig Iron. Previously, he has worked with Kalyani Steels, Pune for 8.5 years as a Project and Maintenance Engineer. He brings with him more than 37 years of experience in the Pig Iron, Metallurgical Coke, Waste Heat based Power Plant and Steel Industry. Mr. Vhatte holds Diploma in Electrical Engineering (DEE) from Government Polytechnic Maharashtra, and Graduation in Elect. Engineering (AMIE)from Institute of Engineers and MBA in Finance from IGNOU. The business address of Mr. Vhatte is ESL Steel Limited (Formerly known as Electrosteel Steels Limited) Vill. Siyaljori, Post - Jogidih, O.P. - Bangaria, P.S. - Chandankyari, Bokaro - 828303, Jharkhand. |
181
Copper Business
| – | Puneet Khurana zone-2 Fujairah, UAE. |
| – | Anand Soni |
Power Business
– | Vibhav Agarwal |
| – | Swapnesh Bansal |
Aluminum Business
| – | Rahul Sharma non-ferrous metal sector in the country in the most sustainable manner. Rahul is also the office bearer of various eminent industry associations, including the current President of Aluminum Association of India (AAI), Chairman of Indian Captive Power Producers Association (“ICPPA”), andCo-Chair of FICCI’s Mining Committee. For his exemplary leadership he has been conferred with various awards and accolades including People’s CEO of the year award 2020 and `Business Leader of the year award at International Conference onNon-Ferrous Metals-2017 for his contribution to India’s Metal and Mining industry. Rahul is an alumnus of IIM Ahmedabad Executive General Management program, has an MBA in Marketing and a B.E. in Electronics and Communication The business address of Rahul Sharma is Core – 6, 3rd Floor, SCOPE Complex, 7, Lodhi Road, New Delhi – 110003, India. |
182
| – | Abhijit Pati |
– | Sunil Gupta in-class practices for the organization. Sunil brings over 27 years of rich experience from the cement industry, and has worked extensively in operations, project implementation, strategic planning, and the execution of various critical projects at and ACC and KJS Cements. He holds a Bachelor of Technology (B. Tech) degree in electrical engineering from Government Engineering College, Ujjain, Madhya Pradesh. |
– | Gobinda Gopal Pal “BE-Metallurgy” from REC, Durgapur. The business address of Gobinda Gopal Pal is Vedanta Limited, Lanjigarh, Project Office, District -Kalahandi, Odisha- 766027, India. |
– | Anup Agarwal |
None of our directors, other executive officers and significant employees are elected or appointed under any arrangement or understanding with any major shareholder, customer, supplier or otherwise.
B. Compensation
Compensation of Executive Directors, Executive Officers and Significant Employees
The aggregate compensation we paid our executive directors, executive officers, and significant employees for fiscal year 2022 was 1,333.98 million ($17.55 million), which includes 1,144.27 million ($ 15.05 million) paid towards salary, bonuses, allowances, and other cash payments, 132.9 million ($ 1.75 million) paid and payable for the fair value of share options and cash-based units granted to our executive directors, executive officers, and significant employees and 56.81 million ($ 0.75 million) paid towards benefits such as contributions to the provident fund and superannuation fund. The total compensation paid to our most highly compensated executive director, executive officer, or significant employees during fiscal year 2022 was 194.88 million ($ 2.56 million) of which 188.71 million ($ 2.48 million) constituted salary, bonuses, allowances, and perquisites, and 6.17 million ($ 0.08 million) was contribution to provident and superannuation funds.
₹
₹
₹
₹
₹
₹
₹
183
The following table sets forth the compensation paid to our executive directors, executive officers, and significant employees in fiscal year 2022 where the disclosure of compensation is required on an individual basis in India or is otherwise publicly disclosed by us:
(
₹
and $ in millions)
Name | Salary, Bonuses, Allowances, and Perquisites | FV of Share Options Granted | Contribution to Provident Fund and Superannuation Fund | Total ( ₹ ) | Total ($) | |||||||||||||||
Navin Agarwal (1) | 188.71 | 0.00 | 6.17 | 194.88 | 2.56 | |||||||||||||||
Sunil Duggal | 106.43 | 17.51 | 2.82 | 126.76 | 1.69 | |||||||||||||||
GR. Arun Kumar (2) | 22.48 | 3.84 | 3.42 | 29.74 | 0.39 | |||||||||||||||
Madhu Srivastava | 30.73 | 4.78 | 1.06 | 36.57 | 0.48 | |||||||||||||||
Dilip Golani | 35.28 | 2.94 | 1.19 | 39.41 | 0.52 | |||||||||||||||
Anup Agarwal (3) | 10.91 | 2.08 | 0.39 | 13.38 | 0.18 | |||||||||||||||
Sharad Kumar Gargiya | 18.76 | 3.32 | 0.85 | 22.93 | 0.30 | |||||||||||||||
Dhiraj Nayyar | 11.83 | 2.20 | 0.41 | 14.44 | 0.19 | |||||||||||||||
Leena Verenkar | 7.75 | 1.32 | 1.11 | 10.18 | 0.13 | |||||||||||||||
Andrew Lewin (4) | 16.91 | 0.00 | 0.31 | 17.22 | 0.23 | |||||||||||||||
Arun Misra | 63.18 | 8.31 | 2.53 | 74.02 | 0.97 | |||||||||||||||
Swayam Saurabh (5) | 6.72 | 1.33 | 0.07 | 8.12 | 0.11 | |||||||||||||||
Navin Jaju | 13.22 | 2.53 | 2.05 | 17.8 | 0.23 | |||||||||||||||
Pushpender Singla | 34.35 | 3.35 | 0.00 | 37.7 | 0.50 | |||||||||||||||
Ajay Kapur (6) | 47.23 | 6.18 | 7.02 | 60.43 | 0.79 | |||||||||||||||
Abhijit Pati | 56.80 | 5.76 | 1.90 | 64.46 | 0.85 | |||||||||||||||
Vikas Sharma | 27.94 | 4.90 | 1.19 | 34.03 | 0.45 | |||||||||||||||
Rahul Sharma | 20.80 | 6.17 | 1.89 | 28.86 | 0.38 | |||||||||||||||
Mahesh Iyer | 8.02 | 1.28 | 0.94 | 10.24 | 0.13 | |||||||||||||||
Pankaj Kumar (7) | 8.40 | 2.67 | 0.66 | 11.73 | 0.15 | |||||||||||||||
Anand Soni | 13.07 | 2.20 | 0.37 | 15.64 | 0.21 | |||||||||||||||
Pankaj Malhan (8) | 1.22 | 0.78 | 0.00 | 2.00 | 0.03 | |||||||||||||||
Sauvick Mazumdar | 27.15 | 4.82 | 3.96 | 35.93 | 0.47 | |||||||||||||||
Laxman Shekhawat | 37.73 | 6.15 | 0.00 | 43.88 | 0.58 | |||||||||||||||
Prachur Sah | 34.31 | 7.11 | 0.75 | 42.17 | 0.55 | |||||||||||||||
Anand Laxshmivarahan R | 8.99 | 1.25 | 0.24 | 10.48 | 0.14 | |||||||||||||||
Ajay Goel | 24.89 | 2.06 | 2.85 | 29.8 | 0.39 | |||||||||||||||
Varun Kapoor | 10.36 | 1.24 | 0.81 | 12.41 | 0.16 | |||||||||||||||
Vikash Jain | 22.80 | 3.21 | 0.75 | 26.76 | 0.35 | |||||||||||||||
Hitesh Vaid | 14.62 | 2.62 | 0.75 | 17.99 | 0.24 | |||||||||||||||
Navanath Vhatte | 13.24 | 2.93 | 1.01 | 17.18 | 0.23 | |||||||||||||||
Sonam Donkar | 14.27 | 1.73 | 0.89 | 16.89 | 0.22 | |||||||||||||||
Puneet Khurana | 12.55 | 1.83 | 0.12 | 14.5 | 0.19 | |||||||||||||||
Vinaya Jain (9) | 9.82 | 0.00 | 0.48 | 10.3 | 0.14 | |||||||||||||||
Gobinda Gopal Pal | 23.06 | 4.19 | 1.02 | 28.27 | 0.37 | |||||||||||||||
Chhavi Nath Singh (10) | 13.10 | 1.36 | 0.00 | 14.46 | 0.19 | |||||||||||||||
Swapnesh Bansal | 12.25 | 1.80 | 0.57 | 14.62 | 0.19 | |||||||||||||||
Sandep Agarwal (11) | 1.10 | 0.00 | 0.20 | 1.3 | 0.02 | |||||||||||||||
Sunil Gupta (12) | 2.48 | 0.00 | 0.12 | 2.6 | 0.03 | |||||||||||||||
Vineet Jaiswal (13) | 9.33 | 0.44 | 0.52 | 10.29 | 0.14 | |||||||||||||||
Phil Campbell | 35.23 | 0.00 | 0.00 | 35.23 | 0.46 | |||||||||||||||
Rajinder Singh Ahuja (14) | 9.95 | 1.82 | 0.59 | 12.36 | 0.16 | |||||||||||||||
Ritu Jhingon (15) | 13.75 | 1.07 | 0.75 | 15.57 | 0.20 | |||||||||||||||
Sandeep Modi (16) | 16.11 | 2.83 | 0.83 | 19.77 | 0.26 | |||||||||||||||
Deepak Prasad (17) | 26.44 | 0.99 | 3.25 | 30.68 | 0.40 | |||||||||||||||
Total | 1,144.27 | 132.9 | 56.81 | 1,333.98 | 17.55 | |||||||||||||||
| 1. | During the fiscal year 2022, sitting fees and commission paid to Navin Agrawal from HZL was ₹ ₹ ₹ ₹ ₹ |
| 2. | Mr G.R. Arun Kumar left the services of the Company on April 24, 2021. |
| 3. | Mr Anup Agarwal re-joined the Company on September 20, 2021. |
| 4. | Mr Andrew Lewin left the services of the Company on July 15, 2021. |
| 5. | Mr Swayam Saurabh left the services of the Company on April 5, 2021. |
| 6. | Mr Ajay Kapur left the services of the Company on October 31, 2021. |
| 7. | Mr Pankaj Kumar left the services of the Company on August 27, 2021. |
184
| 8. | Mr Pankaj Malhan left the services of the Group on April 21, 2021. |
| 9. | Mr Vinaya Jain left the services of the Group on September 30, 2021. |
| 10. | Mr Chhavi Nath Singh left the services of the Company on July 31, 2021. |
| 11. | Mr Sandep Agarwal joined the Company on February 7, 2022. |
| 12. | Mr Sunil Gupta joined the Company on February 1, 2022. |
| 13. | Mr Vineet Jaiswal joined the Company on August 18, 2021. |
| 14. | Mr Rajinder Singh Ahuja was elevated to KMP status during FY 2022 on his elevation to Group Head HSE, in July 2021. |
| 15. | Ms Ritu Jhingon was elevated to KMP status during FY 2022 on her elevation to Group Head Corporate Communications and CEO Nand Ghar, in December 2021. |
| 16. | Mr Sandeep Modi was elevated to KMP status during FY 2022 on his elevation to interim CFO HZL, in October 2021. |
| 17. | Mr Deepak Prasad was elevated to Deputy CEO-VLJ in FY 2022, on Mr Chhavi Nath Singh’s super-annuation from the Group. |
The aggregate compensation paid or payable to our 54.61 million ($ 0.72 million), which comprised 12.70 million ($ 0.17 million) in sitting fees and 41.91 million ($ 0.55 million) in commissions.
non-executive
directors for the fiscal year 2022 was₹
₹
₹
In December 2016, our Company introduced an Employee Stock Option Scheme by awarding our Company options to our selected employees. Under this scheme, the vesting of options is based on our Company’s performance as against our industry competitors and based on total shareholder return, for which the vesting percentage is determined over a three-year performance period from the date of grant. The stock options awarded under this scheme in 2016 got vested upon approval from Nomination and Remuneration Committee on January 31, 2020, where the Relative Total Shareholder Return (“TSR”) based vesting has been NIL.
In September 2017, the Employee Stock Option Scheme was launched with an additional performance condition of sustained EBITDA for which the vesting percentage is determined over a three-year financial year performance period, and was launched again, with similar performance conditions in November 2018. The stock options awarded under this scheme in 2017 got vested upon approval from Nomination and Remuneration Committee on November 6, 2020, where the Relative Total Shareholder Return (“TSR”) based vesting has been NIL and business performance (EBIDTA) based vesting varied across businesses between 0% to 42.5%.
In November 2019, the plan was redesigned and launched with additional performance condition of sustained individual performance while the business performance parameter was revised with volume, cost, NSR (“Net Sales Realizable”), free cash flow (“FCF”) and EBITDA as applicable for businesses. The Vedanta Limited Conditional Cash Awards (Cash Plan) was introduced in November 2018 under the parent scheme “Employee Stock Option Scheme 2016” linked to Vedanta Limited’s share price for the selected employees who are not covered under the Vedanta Limited Employee Stock Option Scheme. The Vedanta Limited Conditional Cash Awards (Cash Plan) is based on the same performance conditions as the Vedanta Limited Employee Stock Option Scheme 2018 while Vedanta Limited Conditional Cash Awards (Cash Plan) 2019 is based on same performance conditions as Vedanta Limited Employee Stock Option Scheme 2019 and the employees covered under the plan receive cash as per vesting and performance conditions instead of shares for which the vesting percentage is determined over three-year performance period from the date of grant of such units.
In March 2021, a new employee stock option plan (ESOS 2020) was introduced. The Vedanta Limited ESOS 2020 shall vest in 31 months from the date of the grant based on business performance (Volume, Cost, NSR; EBITDA, FCF, ESG, Carbon Footprint, management discretion, and sustained individual performance over the three financial years falling within the performance period. As a global benchmark, we have introduced a 10% multiplier on account of zero fatalities and an additional multiplier on individual performance ratings to create differentiation at the time of vesting. These options will be awarded to employees under the Vedanta Limited ESOS with effect from March 31, 2021, for which the vesting condition will be the performance period of 31 months from March 31, 2021, to November 6, 2023.
| – | Outstanding Awards or Options |
As of March 31, 2022, our directors, executive officers and significant employees as a group held options under the Vedanta Limited Employee Stock Option Scheme to acquire an aggregate of 3,947,431 ordinary shares of Vedanta Limited representing approximately 0.11% of Vedanta Limited’s share capital. The awards are exercisable at the end of the three-year performance period commencing from the date of each grant at an exercise price of 1 per ordinary share. The awards expire six months after their date of vesting. For more information, see “.”
₹
Vedanta Limited Employee Stock Option Scheme
185
As of March 31, 2022, our executive officers and significant employees as a group held options under the Vedanta Conditional Cash Awards which is Vedanta’s Cash Based Plan to acquire an aggregate of 382,000 units converted to cash. The employees shall be eligible for the awards at the end of the three-year performance period commencing from the date of each grant. For more information, see “”.
Vedanta Limited Cash Based Plan
As of March 31, 2022, our executive officers and significant employees as a group held options under the VRL Conditional Cash Awards which is Vedanta Resources Long Term Incentive Plan to acquire an aggregate of 1,799,466 units converted to cash. The employees shall be eligible for the awards at the end of the three-year performance period commencing from the date of each grant. The payment upon vesting will be made by VRL, UK. For more information, see “”.
Vedanta Resources Limited Cash Based Plan/ Long Term Incentive Plan
| – | Employee Benefit Plans |
We maintain employee benefit plans in the formea of certain statutory and welfare schemes covering substantially all of our employees. As of March 31, 2021, and March 31, 2022, the total amount set aside by us to provide pension, retirement or similar benefits was 2,600 million and 2,590 million ($ 34 million), respectively.
₹
₹
| – | Provident Fund |
In accordance with Indian law, all of our employees in India are entitled to receive benefits under the provident fund, defined contribution plan and defined benefit plan (owned trust) to which both the Company and the employee contribute monthly at a 1,460 million and 1,582 million ($ 21 million) to all these schemes in fiscal years 2021 and 2022, respectively.
pre-determined
rate (currently 12.0% of the employee’s base salary). These contributions are made to the provident fund and we also participate in defined contribution schemes in Australia, Namibia, South Africa and Ireland. We have no further obligation under these schemes apart from our regular contributions, except in case of funds classified as defined benefit plan. We contributed an aggregate of₹
₹
| – | Gratuity |
In accordance with Indian law, we provide for gratuity pursuant to a defined benefit retirement plan covering all of our employees in India. The gratuity plan provides a lump sum payment to vested employees at retirement, disability or termination of employment, in an amount based on the employee’s last drawn salary and the number of years of employment with us. The assets of the plan, to the extent the plan is funded, are held in separate funds managed by the Life Insurance Corporation and a full actuarial valuation of the plan is performed on an annual basis. Our liability for the gratuity plan was 1,739 million and 1,593 million ($ 21 million) as at the end of fiscal years 2021 and 2022, respectively.
₹
₹
| – | Post-Retirement Medical Benefits |
The scheme is framed with a view to provide medical benefits to the regular employees of BALCO and BMM and their spouses subsequent to their retirement on completion of tenure including retirement on medical grounds and voluntary retirement on contributory basis. This scheme is unfunded. Our liability for the post-retirement medical benefits was 861 million and 997 million ($ 13 million) as at the end of fiscal years 2021 and 2022, respectively.
₹
₹
| – | Superannuation Fund and National Pension Scheme |
It is our current policy for all of our
non-unionized
employees in a managerial position and above to pay into a superannuation fund a sum equal to 15.0% of their annual base salary which is payable to the employee in a lump sum upon his retirement or termination of employment. National Pension Scheme is a retirement savings account for social security and welfare applicable for executives covered under the superannuation benefit of Vedanta Limited and each relevant Indian subsidiary, on a choice basis. It was introduced to enable employees to select the treatment of superannuation component of their fixed salaries and avail the benefits offered by National Pension Scheme launched by GoI. Vedanta Limited and each relevant entity holds a corporate account with one of the pension fund managers authorized by the GoI to which each of the entity contributes a fixed amount relating to superannuation and the pension annuity will be met by the fund manager as per rules of National Pension Scheme.We contributed an aggregate of 212 million and 275 million ($ 4 million) in both of schemes in fiscal years 2021 and 2022, respectively.
₹
₹
| – | Compensated Absence |
Our liability for compensated absences is determined on an undiscounted basis for short term liabilities and on an actuarial basis for long term liabilities, for the entire unused vacation balance standing to the credit of each employee at each calendar 1,661 million and 1,882 million ($ 25 million) as at the end of fiscal years 2021 and 2022, respectively.
year-end.
Contributions to such liability are charged to income in the year in which they accrue. Liability for the compensated absences was₹
₹
186
| – | Vedanta Limited Employee Stock Option Scheme (“Vedanta Limited ESOS”) |
The shareholders of the Company by way of postal ballot on March 30, 2015 approved the Vedanta Limited ESOS and issue of securities to the employees of the Company and its holding or subsidiary companies. No options were granted to the employees under such scheme. Thereafter, the shareholders of the Company by way of postal ballot on December 12, 2016 approved a revised scheme, Vedanta Limited ESOS 2016 and issue of securities to the employees of the Company and its holding or subsidiary companies. Awards under the plan may be granted to any employee of Vedanta Limited or any of its holding or subsidiary companies who is not within six months of such employee’s normal retirement date. The awards are indexed to and settled by Vedanta Limited shares. The awards provide for a fixed exercise price denominated in Vedanta Limited’s functional currency at 1 per share. The Vedanta Limited ESOS 2016 is consistent with the reward philosophy, which aims to provide superior rewards for outstanding performance, and to provide a high proportion of “at risk” remuneration for the employees. On January 1, 2020, Nomination and Remuneration Committee of Vedanta Limited approved the vesting of options awarded in the said scheme granted on December 16, 2016 upon completion of performance period on three years. The TSR based vesting was NIL while tenure-based vesting was executed basis sustained employment with the company and Vedanta good leaver policy. The total options which vested were 1,688,957.
₹
The Vedanta Limited ESOS 2017 vested three years from the date of the grant based on the Group’s relative total shareholder return (TSR) performance against the peer group of resource companies, sustained EBITDA over the three financial years falling within the performance period and continued employment with the Company. These options will be awarded to employees under the Vedanta Limited ESOS with effect from September 1, 2017, for which the vesting condition will be the performance period of 36 months from September 1, 2017, to August 31, 2020.
On November 6, 2020, Nomination and Remuneration Committee of Vedanta Limited approved the vesting of options awarded in the said scheme granted on September 1, 2017, upon completion of performance period of three years. The TSR based vesting was NIL, business performance (EBIDTA) based vesting varied across businesses between 0% to 42.5%, while tenure-based vesting was executed basis sustained employment with the company and Vedanta good leaver policy. The total options which vested were 1,513,755.
The Vedanta Limited ESOS 2018 vested three years from the date of the grant based on the Company’s relative TSR performance against the peer group of resource companies, sustained EBITDA over the three financial years falling within the performance period and continued employment with the Group. These options will be awarded to employees under the Vedanta Limited ESOS with effect from November 1, 2018, for which the vesting condition will be the performance period of 36 months from November 1, 2018 to October 31, 2021.
On October 29, 2021, the Nomination and Remuneration Committee of Vedanta Limited approved the vesting of options awarded in the said scheme granted on November 1, 2018, upon completion of performance period of three years. The TSR based vesting was 27%, business performance (EBIDTA) based vesting varied across businesses between 0% to 10%, while tenure-based vesting was executed basis sustained employment with the company and Vedanta good leaver policy. The total options which vested were 3,002,287.
The Vedanta Limited ESOS 2019 shall vest three years from the date of the grant based on the Company’s relative TSR performance against the peer group of resource companies, sustained business performance (volume, cost, NSR and EBITDA depending on respective entities) and sustained individual performance over the three financial years falling within the performance period and continued employment with the Company. These options will be awarded to employees under the Vedanta Limited ESOS with effect from November 29, 2019, for which the vesting condition will be the performance period of 36 months from November 29, 2019, to November 28, 2022.
The Vedanta Limited ESOS 2020 shall vest 31 months from the date of the grant based on business performance (Volume, Cost NSR; EBITDA, FCF, ESG, Carbon Footprint), the performance achievement for each business, which will be evaluated against internal business plan and respective peer comparison on Volume, Cost and NSR, management discretion, and sustained individual performance over the three financial years falling within the performance period subject to continued employment with the company. As a global benchmark, we have introduced a 10% multiplier on account of zero fatalities and an additional multiplier on individual performance ratings to create differentiation at the time of vesting. These options will be awarded to employees under the Vedanta Limited ESOS with effect from March 31, 2021, for which the vesting condition will be the performance period of 31 months from March 31, 2021, to November 6, 2023.
The Vedanta Limited ESOS 2021 shall vest 36 months from the date of the grant based on business performance (Volume, Cost NSR; EBITDA, FCF, ESG, Carbon Footprint), the performance achievement for each business, which will be evaluated against internal business plan and respective peer comparison on Volume, Cost and NSR, management discretion, and sustained individual performance over the three financial years falling within the performance period subject to continued employment with the company. As a global benchmark, we have introduced a 10% multiplier on account of zero fatalities and an additional multiplier on individual performance ratings to create differentiation at the time of vesting. These options will be awarded to employees under the Vedanta Limited ESOS with effect from November 1, 2021, for which the vesting condition will be the performance period of 36 months from November 1, 2021 to November 1, 2024.
187
| – | Vedanta Limited Cash Based Plan (“CBP”) |
In fiscal year 2019, we introduced conditional cash awards under Employee Stock Option Scheme 2016 (ESOS 2016). These are notional units granted to employees and no shares/options issued, the performance conditions will be same as that in stock options granted in fiscal year 2019 i.e., TSR, continued employment with the Group and business performance based on EBITDA set against business plan for the year. The employee will be paid cash in lieu of units vested once the performance conditions are achieved and once the performance period is completed. These units will be awarded to employees under the CBP with effect from November 1, 2018, for which the vesting condition will be the performance period of 36 months from November 1, 2018 to October 31, 2021.
On October 29, 2021, the Nomination and Remuneration Committee of Vedanta Limited approved the vesting of options awarded in the Vedanta Limited ESOS 2018 scheme granted on November 1, 2018, upon completion of performance period of three years. The TSR based vesting was 27%, business performance (EBIDTA) based vesting varied across businesses between 0% to 10%, while tenure-based vesting was executed basis sustained employment with the company and Vedanta good leaver policy. As the Cash Based Plan was linked to ESOS, the applicable cash units 132,918 also vested.
In fiscal year 2020, the cash-based plan has been redesigned in line with Vedanta Limited ESOS 2019. These are notional units granted to employees and no shares/ options are issued, the performance conditions will be same as that in stock options granted in fiscal year 2020 i.e. Group’s relative TSR performance against the peer group of resource companies, sustained business performance (volume, cost, NSR and EBITDA depending on respective entities) and sustained individual performance over the three financial years falling within the performance period and continued employment with the Group. The employee will be paid cash in lieu of units vested once the performance conditions are achieved and once the performance period is completed. These options will be awarded to employees under the CBP with effect from November 29, 2019, for which the vesting condition will be the performance period of 36 months from November 29, 2019, to November 28, 2022.
In fiscal year 2021, the cash-based plan has been redesigned in line with Vedanta Limited ESOS 2020. These are notional units granted to employees and no shares/ options are issued, the performance conditions will be same as that in stock options granted in fiscal year 2021 i.e. they shall vest 31 months from the date of the grant based on the business performance (Volume, Cost NSR; EBITDA, FCF, ESG, Carbon Footprint), the performance achievement for each business will be evaluated against internal business plan and respective peer comparison on Volume, Cost and NSR, management discretion, and sustained individual performance over the three financial years falling within the performance period subject to continued employment with the organization. As a global benchmark, we have introduced a 10% multiplier on account of zero fatalities and an additional multiplier on individual performance ratings to create differentiation at the time of vesting. These options will be awarded to employees under the CBP with effect from March 31, 2021, for which the vesting condition will be the performance period of 31 months from March 31, 2021, to November 6, 2023.
In fiscal year 2022, the cash-based plan has been based in line with Vedanta Limited ESOS 2021. These are notional units granted to employees and no shares/ options are issued, the performance conditions will be same as that in stock options granted in fiscal year 2021 i.e. they shall vest 36 months from the date of the grant based on the business performance (Volume, Cost NSR; EBITDA, FCF, ESG, Carbon Footprint), the performance achievement for each business will be evaluated against internal business plan and respective peer comparison on Volume, Cost and NSR, management discretion, and sustained individual performance over the three financial years falling within the performance period subject to continued employment with the organization. As a global benchmark, we have introduced a 10% multiplier on account of zero fatalities and an additional multiplier on individual performance ratings to create differentiation at the time of vesting. These options will be awarded to employees under the CBP with effect from November 1, 2021, for which the vesting condition will be the performance period of 36 months from November 1, 2021, to November 1, 2024.
| – | Vedanta Resources Limited Cash Based Plan/ Long Term Incentive Plan (“Vedanta CBP/ LTIP”) |
In fiscal year 2019, Vedanta Resources introduced Conditional Cash Awards linked to Vedanta Limited. This plan is also known as Long Term Incentive Plan. These are notional units granted to employees and no shares/options are issued. The performance conditions will be same as that in stock options granted in fiscal year 2019, i.e., TSR of Vedanta Limited, continued employment with the Group and business performance based on EBITDA of Vedanta Limited set against business plan for the year. The employee will be paid cash in lieu of units vested as per the achievement of performance conditions upon completion of performance period. These options will be awarded to employees under the Vedanta CBP/ LTIP with effect from November 1, 2018, for which the vesting condition will be the performance period of 36 months from November 1, 2018, to October 31, 2021.
The granted units were linked to Vedanta Limited ESOS 2018, and 82,396 units vested on 1 November 2021 upon achievement of performance conditions.
In fiscal year 2020, the cash-based plan has been redesigned in line with Vedanta Limited ESOS 2019. These are notional units granted to employees and no shares/options are issued, the performance conditions will be same as that in stock options granted in fiscal year 2020 i.e. Group’s relative TSR performance against the peer group of resource companies, sustained business performance (volume, cost, NSR and EBITDA depending on respective entities of Vedanta Limited) and sustained individual performance over the three financial years falling within the performance period and continued employment with the Group. The employee will be paid cash in lieu of units vested once the performance conditions are achieved and once the performance period is completed. These options will be awarded to employees under the Vedanta CBP/ LTIP with effect from November 29, 2019, for which the vesting condition will be the performance period of 36 months from November 29, 2019, to November 28, 2022.
In fiscal year 2021, the cash-based plan has been redesigned in line with Vedanta Limited ESOS 2020. These are notional units granted to employees and no shares/options are issued, the performance conditions will be same as that in stock options granted in fiscal year 2021 i.e. they shall vest 31 months from the date of the grant based on the business performance (Volume, Cost NSR; EBITDA, FCF, ESG, Carbon Footprint), the performance achievement for each business which will be evaluated against internal business plan and respective peer comparison on Volume, Cost and NSR, management discretion, and sustained individual performance over the three financial years falling within the performance period subject to continued employment with the company. As a global benchmark, we have introduced a 10% multiplier on account of zero fatalities and an additional multiplier on individual performance ratings to create differentiation at the time of vesting. These options will be awarded to employees under the Vedanta CBP/ LTIP with effect from March 31, 2021, for which the vesting condition will be the performance period of 31 months from March 31, 2021, to November 6, 2023.
188
In fiscal year 2022, the cash-based plan is based on Vedanta Limited ESOS 2021. These are notional units granted to employees and no shares/options are issued, the performance conditions will be same as that in stock options granted in fiscal year 2021 i.e. they shall vest 36 months from the date of the grant based on the business performance (Volume, Cost NSR; EBITDA, FCF, ESG, Carbon Footprint), the performance achievement for each business which will be evaluated against internal business plan and respective peer comparison on Volume, Cost and NSR, management discretion, and sustained individual performance over the three financial years falling within the performance period subject to continued employment with the company. As a global benchmark, we have introduced a 10% multiplier on account of zero fatalities and an additional multiplier on individual performance ratings to create differentiation at the time of vesting. These options will be awarded to employees under the Vedanta CBP/ LTIP with effect from November 4, 2021, for which the vesting condition will be the performance period of 36 months from November 1, 2021, to November 1, 2024.
The following table summarizes, as of March 31, 2022, the options granted to our directors, executive officers, and significant employees under the Vedanta Limited ESOS Scheme:
Name | Grant Date November 29, 2019 | Grant Date March 31, 2021 | Grant Date November 4, 2021 | Total | ||||||||||||
Sunil Duggal | 181,970 | 177,778 | 166,000 | 525,748 | ||||||||||||
Ajay Kapur | 273,860 | — | — | 273,860 | ||||||||||||
GR Arun Kumar | 170,440 | — | — | 170,440 | ||||||||||||
Sharad Gargiya | 31,090 | 36,060 | 30,000 | 97,150 | ||||||||||||
Dilip Golani | 90,910 | — | 33,000 | 123,910 | ||||||||||||
Abhijit Pati | 89,910 | 53,333 | 39,000 | 182,243 | ||||||||||||
Vikas Sharma | 55,630 | 53,333 | 36,000 | 144,963 | ||||||||||||
Anup Agarwal | 55,330 | — | 31,000 | 86,330 | ||||||||||||
Sauvick Mazumdar | 58,790 | 42,222 | 51,000 | 152,012 | ||||||||||||
Pankaj Kumar | 49,110 | 31,111 | — | 80,221 | ||||||||||||
Madhu Srivastava | 59,050 | 43,481 | 47,000 | 149,531 | ||||||||||||
Rahul Sharma | 52,310 | 66,667 | 61,000 | 179,977 | ||||||||||||
Arun Misra | 68,760 | 88,889 | 85,000 | 242,649 | ||||||||||||
Swayam Saurabh | 58,760 | — | — | 58,760 | ||||||||||||
Hitesh Vaid | 20,750 | 28,889 | 26,000 | 75,639 | ||||||||||||
Prachur Sah | 69,160 | 77,778 | 61,000 | 207,938 | ||||||||||||
Ajay Goel | — | 20,000 | 39,000 | 59,000 | ||||||||||||
Vikash Jain | 41,500 | 31,111 | 26,300 | 98,911 | ||||||||||||
Sonam Donkar | 17,290 | 26,667 | — | 43,957 | ||||||||||||
Anand Soni | 22,630 | 22,986 | 19,700 | 65,316 | ||||||||||||
Anand Laxshmivarahan R | 13,840 | 18,752 | — | 32,592 | ||||||||||||
Mahesh Iyer | 17,290 | 17,778 | — | 35,068 | ||||||||||||
Navin Jaju | 26,280 | 24,444 | 26,300 | 77,024 | ||||||||||||
Navanath Vhatte | 30,610 | 31,111 | 25,000 | 86,721 | ||||||||||||
Varun Kapoor | 15,220 | 12,444 | 9,900 | 37,564 | ||||||||||||
Gobinda Gopal Pal | 48,570 | 42,222 | 36,000 | 126,792 | ||||||||||||
Leena Verenkar | 15,220 | 13,617 | 10,880 | 39,717 | ||||||||||||
Dhiraj Nayyar | 20,750 | 22,222 | 22,730 | 65,702 | ||||||||||||
Laxman Shekhawat | 55,330 | — | — | 55,330 | ||||||||||||
Vineet Jaiswal | — | — | 16,400 | 16,400 | ||||||||||||
Sandeep Modi | 27,670 | 28,889 | 28,000 | 84,559 | ||||||||||||
Puneet Khurana | 15,220 | 18,222 | 21,380 | 54,822 | ||||||||||||
Rajinder Singh Ahuja | 19,370 | 17,778 | 18,100 | 55,248 | ||||||||||||
Swapnesh Bansal | 18,780 | 17,695 | 18,100 | 54,575 | ||||||||||||
Deepak Prasad | 44,060 | — | — | 44,060 | ||||||||||||
Pankaj Malhan | 34,580 | — | — | 34,580 | ||||||||||||
Ritu Jhingon | — | 13,333 | 14,800 | 28,133 | ||||||||||||
Total | 1,870,040 | 1,078,812 | 998,590 | 3,947,442 | ||||||||||||
| (1) | The underlying shares shall vest three years from the date of grant (November 29, 2022), based on the TSR ranking, sustained business performance (volume, cost, NSR and EBITDA depending on respective entities) and sustained individual performance subject to continued employment in the organization as per the scheme. The options shall expire after six months from the date of vesting. |
| (2) | The underlying shares shall vest 31 months from the date of the grant (November 6, 2023), based on the business (Volume, Cost NSR; EBITDA, FCF, ESG, Carbon Footprint), management discretion, and sustained individual performance subject to continued employment in the organization as per the scheme. The options shall expire after six months from the date of vesting. |
| (3) | The underlying shares shall vest 36 months from the date of the grant, (November 4, 2024), based on the business (Volume, Cost NSR; EBITDA, FCF, ESG, Carbon Footprint), management discretion, and sustained individual performance subject to continued employment in the organization as per the scheme. The options shall expire after six months from the date of vesting. |
189
| (4) | The following table summarizes, as of March 31, 2022, the options granted to our directors, executive officers, and significant employees under the Vedanta Limited Conditional Cash Awards (CBP) and Vedanta Resources Limited Cash Based Plan/ Long Term Incentive Plan: |
Name | Shares Underlying the CBP | |||||||||||
Grant date - November 29, 2019 (1) | Grant date - March 31, 2021 (2) | Grant date - November 4, 2021 (3) | ||||||||||
Navin Agarwal (4) | 513,260 | 412,444 | 351,000 | |||||||||
Pushpender Singla | 32,380 | 35,556 | 31,000 | |||||||||
Laxman Shekhawat | — | 55,556 | — | |||||||||
Total | 545,640 | 503,556 | 382,000 | |||||||||
| (1) | The underlying cash-based units shall vest three years from the date of grant (November 29, 2022), based on the TSR ranking, sustained business performance (volume, cost, NSR and EBITDA depending on respective entities) and sustained individual performance subject to continued employment in the organization as per the scheme. |
| (2) | The underlying cash-based units shall vest three years from the date of grant (November 6, 2023), based on the TSR ranking, sustained business performance (volume, cost, NSR and EBITDA depending on respective entities) and sustained individual performance subject to continued employment in the organization as per the scheme. |
| (3) | The underlying cash-based units shall vest three years from the date of grant (November 1, 2024), based on the business (Volume, Cost NSR; EBITDA, FCF, ESG, Carbon Footprint), management discretion, and sustained individual performance subject to continued employment in the organization as per the scheme. |
| (4) | Navin Agarwal has been awarded units under Vedanta Resources Limited Cash Based Plan/ Long Term Incentive Plan 2019, 2020 and 2021, the units will vest as per Vedanta Limited CBP 2019, 2020 and 2021. The payment upon vesting will be made from Vedanta Resources Limited, UK. |
Limitations on Liability and Indemnification Matters
The Companies Act, 2013 provides an enabling provision for providing indemnity to directors and officers. The terms of the service contract with the Whole Time Directors provides that the Company shall indemnify and keep the director indemnified from and against all claims, demands, actions, suits and proceedings, penalties and punitive damages, attorney’s fees and such reasonable expenses arising out of any claim / litigation whatsoever that may be brought or made against the Director in relation to performance of duties assigned or arising out of normal course of the business of the Company.
The Companies Act, 2013 also provides that where any insurance is taken by a company on behalf of its Managing Director, Whole Time Director, Manager, Chief Executive Officer, Chief Financial Officer or Company Secretary for indemnifying any of them against any liability in respect of any negligence, default, misfeasance, breach of duty or breach of trust for which they may be guilty in relation to the company, the premium paid on such insurance shall not be treated as part of the remuneration payable to any such personnel; provided that if such person is proved to be guilty, the premium paid on such insurance shall be treated as part of the remuneration.
190
C. Board Practices
Compensation of the Board
Under the Companies Act, 2013, our shareholders must approve the salary, bonus and benefits of all directors at an annual general meeting of the shareholders or through a postal ballot.
Navin Agarwal is entitled to be paid a fixed salary inclusive of base pay, commission and retirement benefits in addition to which he is eligible for performance incentives (based upon the scheme) to be determined by our Board and perquisites including a housing allowance, medical and insurance reimbursement, club membership fees reimbursement and leave travel concessions for himself and his family and also a commission based on our net profits for a particular fiscal year as determined by our Board, subject to maximum allowable under Indian Law.
GR Arun Kumar was entitled to be paid a basic salary, house rent allowance, personal allowance, and retirement benefits, in addition to which he was eligible for performance incentives (based upon the scheme) to be determined by our Board and perquisites including medical and insurance reimbursement, club membership fees reimbursement and leave travel concessions for himself and his family. GR Arun Kumar was entitled to receive a bonus equal to 20.0% of his basic salary. GR Arun Kumar resigned from the position of Whole-Time Director and CFO with effect from close of business hours on April 24, 2021.
Sunil Duggal is entitled to be paid a basic salary, personal allowance and retirement benefits, in addition to which he is eligible for performance incentives (based upon the scheme) to be determined by our Board and perquisites including vehicle maintenance reimbursement, car benefit and furnishing insurance reimbursement, club membership fees reimbursement and leave travel concessions for himself and his family.
Composition of the Board
Our Board currently consists of eight directors. Four of our eight directors, namely, Padmini Sekhsaria, Dindayal Jalan, Upendra Kumar Sinha and Akhilesh Joshi satisfy the “independence” requirements of the NYSE rules. The following table provides a snapshot of the composition of the Board as of the date hereof.
Name | Date of current term | Expiration /Renewal of current term | ||
Anil Agarwal (1) | April 01, 2020 | — | ||
Navin Agarwal (2) | August 01, 2018 | July 31, 2023 | ||
Padmini Sekhsaria (3) | February 05, 2021 | February 04, 2023 | ||
Dindayal Jalan (4) | April 01, 2021 | March 31, 2023 | ||
Priya Agarwal (5) | May 17, 2020 | May 16, 2023 | ||
Upendra Kumar Sinha (6) | August 11, 2021 | August 10, 2024 | ||
Akhilesh Joshi (7) | July 01, 2021 | June 30, 2024 | ||
Sunil Duggal (8) | April 25, 2021 | July 31, 2023 |
| (1) | Anil Agarwal was appointed as an Additional Non-Executive Director designated as Chairman with effect from April 01, 2020, which was approved by shareholders at the Annual General Meeting held on September 30, 2020. |
| (2) | Navin Agarwal was re-appointed as a Whole Time Director with effect from August 01, 2018, till July 31, 2023. He wasre-designated as Executive Vice Chairman with effect from April 01, 2020. |
| (3) | Padmini Sekhsaria was appointed as a Non-Executive Independent Director effective from February 05, 2021, to February 04, 2023, which was approved by the shareholders in the Annual General Meeting of the company held on August 10, 2021. |
| (4) | Dindayal Jalan was appointed as a Non-Executive Independent Director effective from April 01, 2021, to March 31, 2023, which was approved by the shareholders in the Annual General Meeting of the company held on August 10, 2021 |
| (5) | Priya Agarwal was appointed as Non-Executive Non – Independent Director with effect from May 17, 2017, for a period of 3 years till May 16, 2020. She was furtherre-appointed for another term of 3 years effective from May 17, 2020, till May 16, 2023, which was approved by the shareholders at the Annual General Meeting held on September 30, 2020. |
| (6) | Upendra Kumar Sinha was appointed as a Non-Executive Independent Director for a term effective from March 13, 2018, till August 10, 2021. In June 2021, the Board of Directors, on recommendation of Nomination and Remuneration Committee of the Company, have considered and approved there-appointment of Upendra Kumar Sinha asNon-Executive Independent Director on the Board of the Company for a 2nd and final term of 3 years effective from August 11, 2021, to August 10, 2024, which was approved by the shareholders in the Annual General Meeting of the company held on August 10, 2021. |
| (7) | Akhilesh Joshi has been appointed as an Additional Director designated as Non-Executive Independent Director on the Board of the Company for a 1st term of one year effective July 01, 2021 till June 30, 2022, which was approved by the shareholders in the Annual General Meeting of the company held on August 10, 2021. The Board of Directors, on recommendation of Nomination and Remuneration Committee of the Company, on June 21, 2022, have considered and approved the re-appointment of Akhilesh Joshi as Non-Executive Independent Director on the Board of the Company for a 2nd and final term of 2 years effective from July 01, 2022, to June 30, 2024, subject to approval of the shareholders at the ensuing Annual General Meeting. |
| (8) | Sunil Duggal has been appointed as an Additional Director designated as Whole-Time Director and CEO and KMP of the Company effective from April 25, 2021, till July 31, 2023, which was approved by the shareholders in the Annual General Meeting of the company held on August 10, 2021. |
191
Either we or the director may terminate the respective service contract upon 90 days’ notice to the other party or payment in lieu of the notice period. None of the service contracts provide for benefits upon termination of their employment.
The
Non-Executive
Directors serve as directors on our Board until their resignation or removal from office by a resolution of our shareholders, or upon cessation by virtue of the provision of law or upon incurring disqualification from being directors. Padmini Sekhsaria, Dindayal Jalan, Upendra Kumar Sinha, Akhilesh Joshi, Anil Agarwal and Priya Agarwal do not have any service contracts with the Company.Committees of the Board
Our equity shares are currently listed and traded on the NSE and the BSE. In addition to compliance with the NYSE corporate governance rules applicable to us as a foreign private issuer, we maintain our corporate governance arrangements in accordance with the Securities and Exchange Board of India (Listing Obligations and Disclosure Requirements) Regulations, 2015 (“SEBI LODR Regulations”) and the Indian regulations as per the requirements of Companies Act, 2013. In particular, we have established an Audit and Risk Management Committee, a Nomination and Remuneration Committee, a Corporate Social Responsibility Committee, a Stakeholders’ Relationship Committee, an ESG Committee, a Committee of Directors and a Share and Debenture Transfer Committee in accordance with the Indian corporate governance requirements.
The composition and general responsibilities of each of these committees are described below.
| Ø | Audit and Risk Management Committee |
During fiscal year 2022, the Audit and Risk Management Committee held 7 meetings.
As on March 31, 2022, the Audit and Risk Management Committee consisted of UK Sinha as the Chairperson, DD Jalan and Akhilesh Joshi as members.
Krishnamurthi Venkataramanan ceased to be the member of the Committee effective close of business hours of March 31, 2021, and accordingly, Dindayal Jalan was appointed as the member of the Committee effective April 1, 2021. Akhilesh Joshi was appointed as member of the Committee effective July 01, 2021.
Each of Upendra Kumar Sinha, Akhilesh Joshi and Dindayal Jalan satisfy the “independence” requirements of Rule
10A-3
of the Exchange Act and the NYSE rules. Dindayal Jalan is designated as our “audit committee financial expert”, within the requirements of the rules promulgated by the SEC relating to listed-company audit committees.The key responsibilities of the Audit and Risk Management Committee includes monitoring and providing effective supervision of the financial reporting; reviewing the efficacy of the risk management systems; and maintaining robustness of internal financial controls and risk management frameworks including cyber security. The Committee works to fortify the adequacy and effectiveness of the Company’s legal, regulatory, and ethical compliance and governance programs while monitoring the qualifications, expertise, resources, and independence of both the internal and external auditors; and assessing the auditors’ performance and effectiveness each year
The principal duties and responsibilities of our Audit and Risk Management Committee are as follows:
Oversight of financial reporting
| • | Oversight of Company’s financial reporting process and disclosure of its financial information to ensure that the financial statements are true, fair, sufficient and credible; |
| • | Discuss and review, with the management and auditors, the annual /quarterly financial statements before submission to the Board; |
| • | Discuss and review earnings press releases and the financial information and guidance provided to analysts and ratings agencies; |
| • | Review of key significant issues, tax and legal reports, and management’s report; |
| • | Review of management’s analysis of significant issues in financial reporting and judgments made in preparing the financial statements; |
| • | Discuss with the management regarding pending technical and regulatory matters that could affect the financial statements, and updates on management’s plans to implement new technical or regulatory guidelines; |
| • | Review of off-balance-sheet structures, if any; |
| • | Review of draft limited review/ audit reports and qualifications, if any, therein; |
| • | Discuss and Review the Form 20 F Filings. |
192
Auditors
| • | Appointment of statutory, internal, secretarial, cost and tax auditors, recommending their fees and reviewing their audit reports; |
| • | Review the independence of the statutory auditor and the provision of audit/non-audit services includingaudit/non-audit fees paid to the statutory auditor; |
| • | Independent meetings with statutory auditors. |
Internal audit and Internal financial controls
| • | Review of internal audit observations and monitoring the implementation of any corrective actions identified; |
| • | Reviewing the internal financial control framework; |
| • | Review of the performance of the internal audit function and internal audit plan; |
| • | Consideration of statutory audit findings and review of significant issues raised; |
| • | Reviewing related party transactions; |
| • | Management discussion and analysis of financial condition and results of operations. |
Risk Management and Cyber Security
| • | Review of the risk management framework, risk profile, significant risks, risk matrix and resulting action plans; |
| • | Review of the significant audit risks with the statutory auditor during interim review and year-end audit; |
| • | Oversight over the effective implementation of the risk management framework across various businesses; |
| • | Assurance of appropriate measures in the organisation to achieve prudent balance between risk and reward in both ongoing and new business activities; |
| • | Annual review of the risk appetite and risk management policy including cyber security procedures adopted in the Group; |
| • | Analytic validation and recommendation of necessary changes in the risk management policies and frameworks to the Audit Committee/Board, if any; |
| • | Evaluation of significant and critical risk exposures for assessing management’s action to mitigate or manage the exposures in a timely manner. |
Governance
| • | Reviewing minutes, summary reports of subsidiary company audit committees; |
| • | Reviewing intercorporate loans, advances, guarantees; |
| • | Reviewing ethics (whistle blower, sexual harassment, insider Trading) and statutory compliances; |
| • | Review of its own charter and processes; |
| • | Notices received from statutory authorities and the management’s response; |
| • | Regulatory updates; |
| • | Reviewing feedback from the Audit and Risk Management Committee’s performance evaluation. |
| Ø | Nomination and Remuneration Committee |
During fiscal year 2022, the Nomination and Remuneration Committee held 4 meetings.
As on March 31, 2022, the Committee comprised of Upendra Kumar Sinha as the Chairperson of the Committee and Dindayal Jalan and Anil Agarwal as members of the Committee. Navin Agarwal is a permanent invitee to this Committee.
Krishnamurthi Venkataramanan ceased to be the member of the Committee effective close of business hours of March 31, 2021 and accordingly, Dindayal Jalan was appointed as the member of the Committee effective April 01, 2021.
Mahendra Kumar Sharma ceased as the member of the Committee effective October 02, 2021.
Section 178 of the Companies Act, 2013 and SEBI LODR Regulations, requires a Nomination and Remuneration Committee to consist of three or more
non-executive
directors out of which not less than one half of the members shall be Independent Directors, provided the Chairperson of the Company may be appointed as a member of the Nomination and Remuneration Committee but shall not chair such Committee.Our Nomination and Remuneration Committee complies with this requirement which comprises of three members of which two members are Independent Directors and one is
Non-Executive
Director who is ourNon-Executive
Chairman of the Company. The chairperson of the Committee is aNon-Executive
Independent Director.The Nomination and Remuneration Committee is responsible for making recommendations to the Board on the structure, size, and composition of the Board, ensuring that the appropriate mix of skills, experience, diversity and independence is present on the Board for it to function effectively. The Nomination and Remuneration Committee also leads the process for new Board appointments, advises the Board on succession planning arrangements and oversees the development of management talent within the Group.
193
Another key objective of the Nomination and Remuneration Committee is to ensure that competitive and fair awards are linked to key deliverables and are also aligned with market practice and shareholders’ expectations. The Committee ensures that remuneration policies and practices are designed to attract, retain and motivate the Executive Directors and the senior management group, while focusing on the delivery of the Group’s strategic and business objectives. The Committee is also focused on aligning the interests of the Executive Directors and the senior management group with those of shareholders, to build a sustainable performance culture. When setting remuneration for the Executive Directors, the Committee takes into account the business performance, developments in the natural resources sector and, considering that the majority of the Group’s operations are based in India, similar information for high-performing Indian companies. The Committee also carries out the entire process of board evaluation.
The principal duties and responsibilities of the Nomination and Remuneration Committee are as follows
Board Composition and Nomination
| • | Review and recommend the structure, size and composition (including the skills, knowledge, experience and diversity) of the Board and its Committees; |
| • | Formulate the criteria/ policy for appointment of Directors, Key Managerial Personnel (KMPs) and Senior Management (as defined by Nomination and Remuneration Committee) in accordance with identified criteria; |
| • | Review and appoint shortlisted candidates as Directors, KMPs and Senior Management (including evaluation of incumbent directors for potential re-nomination) and make recommendations to the Board; |
| • | Evaluate the balance of skills, knowledge, experience and diversity on the Board for description of the role and capabilities, required for an appointment; |
| • | Formulate and recommend to the Board the criteria for determining qualifications, positive attributes and independence of a director. |
Compensation
| • | Recommend to the Board a policy relating to the remuneration of directors (both executive and non-executive Directors), KMP and Senior Management Personnel; |
| • | Ensuring that the level and composition of remuneration is reasonable and sufficient to attract, retain and motivate directors of the quality required to run the Company successfully; |
| • | Ensuring relationship of remuneration to performance is clear and meets the appropriate performance benchmarks; and; |
| • | Ensure remuneration to directors, KMP and senior management involves a balance between fixed and incentive pay reflecting short and long-term performance objectives appropriate to the working of the Company and its goals; |
| • | Determine remuneration based on the Company’s financial position, trends and practices on remuneration prevailing in the industry as considered appropriate by the Nomination and Remuneration Committee; |
| • | Review of the Company’s Share Based Employee Benefit Scheme(s), if any, including overseeing the administration of the Scheme(s), formulating the necessary terms and conditions for such Scheme(s) like quantum of options/rights to be granted, terms of vesting, grant options/rights to eligible employees, in consultation with management; and allotment of shares/other securities when options/rights are exercised etc. and recommend changes as may be necessary. |
Evaluation of the Board, its Committees and individual directors
| • | To develop, subject to approval by the Board, a process for an annual self-evaluation of the performance of the Board, its committees and the individual directors in the governance of the Company and to coordinate and oversee this annual self-evaluation. |
| • | To formulate a criteria for evaluation of independent Directors and the Board and carry out evaluation of every Director’s performance and present the results to the Board; |
| • | To review the performance of all the Executive Directors, on the basis of detailed performance parameters set for each of the executive Directors at the beginning of the year and present the results to the Board; |
| • | Action report on suggestions made on evaluation; |
| • | To maintain regular contact with the leadership of the Company. This should include interaction with the Company’s Leadership Institute, review of data from the employee survey and regular review of the results of the annual leadership evaluation process |
Succession Planning and Governance
| • | Review succession planning for Executive and Non-Executive Directors and other Senior Management; |
| • | Establishing policies and procedures to assess the requirements for induction of new members to the Board; |
| • | To maintain regular interaction and collaborate with the leadership including the Human Resource team to review the overall Human Resource vision and people development strategy of the Company; |
| • | To review and reassess the adequacy of the Nomination and Remuneration Committee’s charter as required and recommend changes to the Board; |
| • | To develop and recommend a policy on Board diversity. |
194
Under the NYSE listing standards, listed companies must have a remuneration committee composed entirely of independent board members as defined by the NYSE listing standards. However, foreign private issuers such as us, are permitted to follow their respective home country rules in this regard. As a foreign private issuer, we are permitted to follow home country corporate governance practices and since we comply with the Indian regulations in relation to the independence requirements of the remuneration committee, we are not required to follow the NYSE listing standards for an all independent remuneration committee. The broad terms of reference of the Nomination and Remuneration Committee are to appraise the performance of Managing and/or Executive Directors, determine and recommend to the Board the compensation payable to them. This committee is responsible for recommending the fixation and periodic revision of remunerations (including commissions and/or incentives, etc.) of whole-time directors and executive directors. This is done after taking into account our profits and performance, external competitive environment and our growth plans and the company policy on rewarding achievements and performance. Payment of remuneration to the Executive Chairman and Whole Time Director is governed by the respective agreements executed between them and the Company and are governed by the board and shareholder resolutions. The remuneration structure comprises of salary, commission linked to profits, perquisites and allowances, retirement benefits (pension, superannuation, and gratuity) and performance incentives (based upon the scheme) to be determined by our Board.
Ø
Corporate Social Responsibility Committee
During fiscal year 2022, the Corporate Social Responsibility Committee held 3 meetings.
Section 135 of the Companies Act, 2013 along with Companies (Corporate Social Responsibility Policy) Rules, 2014, including any amendments thereof, mandates companies with revenue, net worth, or profitability beyond a prescribed limit to form a Corporate Social Responsibility Committee. This Committee should comprise of three or more directors with at least one of them being an independent Director. We comply with this requirement as three of our four members of the committee (all of whom are directors on the Board) are independent directors. As on March 31, 2022, the Committee comprised Akhilesh Joshi as the Chairperson of the Committee and UK Sinha, Priya Agarwal and Padmini Sekhsaria as members of the Committee. Mahendra Kumar Sharma ceased as a Chairperson effective October 2, 2021.
The principal duties and responsibilities of our Corporate Social Responsibility (CSR) Committee are as follows:
CSR Policy
| • | Formulate and recommend to the Board the CSR policy indicating the activities to be undertaken; |
| • | Review the CSR policy and associated frameworks, processes and practices. |
CSR Activities
| • | Identify the areas of CSR activities and projects and to ensure that the Company is taking the appropriate measures to undertake and implement CSR projects successfully; |
| • | Assess the performance and impact of CSR activities of the Company; |
| • | Evaluate CSR communication plans; |
| • | Set path for implementation and monitoring mechanism and the progress stature to ensure achievement; |
| • | Ensure the value, ethics and principles are upheld in all its activities. |
CSR Budget
| • | Decide and recommend to the Board the amount of expenditure to be incurred on CSR activities; |
| • | Formulation of Annual Action Plan; |
| • | Evaluate and monitor expenditure towards CSR Activities in compliance with the Companies Act, 2013. |
| • | Evaluation of need and impact assessment for the projects undertaken by the Company. |
| Ø | Stakeholders’ Relationship Committee |
During fiscal year 2022, the Stakeholders’ Relationship Committee held 1 meeting.
As on March 31, 2022, the Stakeholders’ Relationship Committee comprised of Dindayal Jalan as the Chairperson of the Committee effecitve October 21, 2021, and Upendra Kumar Sinha, Padmini Sekhsaria and Sunil Duggal as the members.
Padmini Sekhsaria was inducted as a member effective April 1, 2021. Krishnamurthi Venkataramanan ceased to be the member of the Committee effective close of business hours of March 31, 2021, and accordingly, Dindayal Jalan was appointed as the member of the Committee effective April 1, 2021. GR Arun Kumar ceased to be the member of the Committee effective close of business hours of April 24, 2021, and accordingly, Sunil Duggal was appointed as the member of the Committee effective April 25, 2021.
All the three members of the Committee are Independent Directors, and one member is Whole TimeDirector.
The principal duties and responsibilities of the Stakeholders’ Relationship Committee follows:
195
Shareholder grievances
| • | Review and timely resolution of grievances of Security holders related to issue, allotment, transfer/transmission, dematerialization and rematerialization etc. of shares and /or other securities of the Company; |
| • | Review and timely redressal of all the Security holders grievance related to non- receipt of information demanded if any,non-receipt of annual report,non-receipt of declared dividend, issue of new/duplicate share certificates, general meeting etc; |
| • | Review from time to time the shares and dividend that are required to be transferred to the Investor Education and Protection Fund (IEPF) Authority; |
| • | Review and closure of all investor cases. |
Enhancing shareholder experience/services
| • | Review of measures taken for effective exercise of voting rights by shareholders. |
| • | Review of the various measures and initiatives taken by the listed entity for reducing the quantum of unclaimed dividends and ensuring timely receipt of dividend warrants/annual reports/statutory notices by the shareholders of the Company; |
| • | Initiatives for registration of email addresses, permanent account numbers and bank mandates and demat of shares. |
| • | Review reports on shareholder satisfaction surveys, if any; |
| • | Oversight of the performance and services standards of various services being rendered of/by Registrars and Transfer Agents of the Company. |
| • | To frame Investor Relations Strategy, IR, perceptions, actively engaging and communicating with major shareholders of the Company |
Shareholding Pattern
| • | Review shareholding distribution; |
| • | Review movement in shareholding pattern; |
| • | Comparative details on demat and physical holding. |
| Ø | ESG Committee (erstwhile Sustainability Committee) |
During fiscal year 2022, the Sustainability Committee held 2 meetings.
As a Group, we have been at the forefront of sustainable practices and is leveraging new technologies to safeguard the environment and communities. Guided by the philosophy of ‘Zero Harm, Zero Waste, Zero Discharge’, Environmental, Social and Governance (ESG) practices are at the heart of Group’s operations which are focused on delivering sustainable and responsible growth thereby creating value for all stakeholders. We are committed to delivering sustainable and responsible growth, which creates value for both our shareholders and all our stakeholders. We proactively engage to incorporate sustainability in all our practices. We are committed to sustainability in our mining practices, energy conservation, recycling, proper treatment, and disposal of the waste, health & safety practices, wellbeing of our employees and development of our local communities.
Krishnamurthi Venkataramanan ceased to be the Chairperson of the Committee effective close of business hours of March 31, 2021 and accordingly, the Committee was
re-constituted
with Upendra Kumar Sinha as the Chairperson of the Committee effective April 1, 2021. Dindayal Jalan was inducted as the member of the Committee effective April 1, 2021. Akhilesh Joshi was appointed as member of the Committee effective July 1, 2021.In order to ensure more effective Board oversight on Environmental, Social and Governance (ESG) aspects, the Board, in its meeting held on July 26, 2021, approved the enhancement of scope of the erstwhile Sustainability Committee and upgraded it to ESG Committee with immediate effect.
During the year, Dindayal Jalan ceased as a member and Priya Agarwal was appointed as member effective October 21, 2021 and Sunil Duggal continued to be the member and Upendra Kumar Sinha continued to be the Chairperson of the Committee.
The duties and responsibilities of the Committee are:
| • | Overseeing the Company’s ESG performance and ensuring adequacy of the Company’s sustainability framework in line with international standards and ESG rating parameters; |
| • | Advising the Board on sustainability/ESG policies and management systems, clearly setting out the commitments of the Company to manage matters of sustainable development effectively; |
| • | Ensuring effective implementation of governance, advocacy and public relation mechanisms and practices related to sustainability and ESG; |
| • | Outlining initiatives required to institutionalize a sustainability and ESG culture through involvement of the employees at all levels; |
| • | Evaluating emerging sustainability/ESG risks in terms of intensity and impact, in turn, guiding the management on reasonable avoidance of adversities likely to pose a threat to sustained growth; |
| • | Advising the Board to enable it to discharge its ESG responsibilities, having regard to the law and the expected international standards of sustainability and stakeholder governance. |
196
| Ø | Internal Committees |
The Board has constituted few internal committees, for ensuring smooth functioning of the Board. With the constitution of these committees, the Board ensures that prompt and timely decisions are taken on the matters important for the Company and are delegated to the respective committees. Minutes of each committee meeting are placed before the Board for its noting. The Board also formulates several project specific
sub-committees
from time to time which ensures speedy implementation and execution of the projects. The Board is updated on each of the meetings ofsub-committees
as well.As on March 31, 2022, there are two internal Board committees which are detailed below:
1) Committee of Directors
The Committee of Directors (“COD”) supports the Board by considering, reviewing, and approving all borrowings, investments, finance, banking and treasury related proposals, within the overall limits approved by the Board from time to time. The COD enables seamless flow of procedures and assists the Board by catering to various routine requirements. The Committee meets as and when deemed necessary.
The Committee during the fiscal year 2022 met seven (7) times and the Committee comprised of Navin Agarwal and Sunil Duggal.
GR Arun Kumar ceased to be the member of the Committee effective close of business hours of April 24, 2021, and accordingly, Sunil Duggal was appointed as the member of the Committee effective April 25, 2021. DD Jalan was inducted as a member of the Committee effective July 06, 2022.
2) Share and Debenture Transfer Committee
As on March 31, 2022, the Committee consisted of three members, Dindayal Jalan, Ajay Goel and Jagdeep Singh. During the fiscal year 2022, the Committee met one (1) time.
GR Arun Kumar and Anup Agarwal ceased to be the Chairperson and member of the Committee respectively effective close of business hours on April 24, 2021, and March 31, 2021, respectively.
Ajay Goel – Acting Chief Financial Officer and Dindayal Jalan,
Non-Executive
Independent Director have been appointed as the member and the Chairperson of the Committee effective April 1, 2021, and April 25, 2021, respectively.The role of Share and Debenture Transfer Committee primarily includes the following:
| • | Allotment of shares, debentures or any other securities; |
| • | Review and approval of transfer, transmission, deletion and transposition of shares, debentures or any other securities. |
D. Employees
See “.”
Item 4 - Information on the Company - B. Business Overview - Our Business - Employees
197
E. Share Ownership for Directors, Executive Officers and Significant Employees
The following table sets forth information with respect to the beneficial ownership of our equity shares as of July 15, 2022, by each of our directors, executive officers, and significant employees and all our directors, executive officers and significant employees as a group. As used in this table, beneficial ownership means the sole or shared power to vote or direct the voting or to dispose of or direct the sale of any security. A person is deemed to be the beneficial owner of securities that can be acquired within 60 days upon the exercise of any option, warrant or right. Equity shares subject to options, warrants or rights that are currently exercisable or exercisable within 60 days are deemed outstanding for computing the ownership percentage of the person holding the options, warrants or rights. The amounts and percentages as of July 15, 2022, are based on an aggregate of 3,717,504,871 equity shares outstanding as of that date.
Name of the Beneficial owner | As of July 15, 2022 | |||||||
Number | Percent | |||||||
Anil Agarwal (2) | 2,590,189,293 | (1) | 69.7 | % | ||||
Navin Agarwal | — | — | ||||||
Priya Agarwal | — | — | ||||||
Upendra Kumar Sinha | — | — | ||||||
Padmini Sekhsaria | — | — | ||||||
Dindayal Jalan | 11,000 | * | ||||||
Akhilesh Joshi | 200 | * | ||||||
Sunil Duggal | 20,233 | * | ||||||
Sharad Kumar Gargiya | 8,063 | * | ||||||
Madhu Srivastava | 8,719 | * | ||||||
Dilip Golani | 187 | * | ||||||
Ajay Goel | 1,250 | * | ||||||
Dhiraj Nayyar | — | — | ||||||
Leena Verenkar | 6,541 | * | ||||||
Philip Campbell | — | — | ||||||
Arun Misra | — | — | ||||||
Pushpender Singla | 900 | * | ||||||
Prachur Sah | — | — | ||||||
Hitesh Vaid | 10 | * | ||||||
Sauvick Mazumdar | — | — | ||||||
Navin Kumar Jaju | 7,763 | * | ||||||
Navanath Vhatte | 4,783 | * | ||||||
Anand Soni | 835 | * | ||||||
Abhijit Pati | 15,923 | * | ||||||
Rahul Sharma | 7,141 | * | ||||||
Gobinda Gopal Pal | 16,894 | * | ||||||
Sandep Agarwal | — | — | ||||||
Rajinder Singh Ahuja | 13,106 | * | ||||||
Vineet Jaiswal | — | — | ||||||
Ritu Jhingon | 6,791 | * | ||||||
Sandeep Modi | 7,666 | * | ||||||
Swapnesh Bansal | 7,224 | * | ||||||
Sunil Gupta | — | — | ||||||
Puneet Khurana | — | — | ||||||
Anup Agarwal | 1,575 | * | ||||||
All our directors, executive officers and significant employees as a group | 2,590,336,097 | 69.7 | ||||||
| * | Represents beneficial ownership of less than 1.0%. |
| (1) | Vedanta is the beneficial owner of 2,590,189,293 equity shares of the Company. See “ Item 7 – Major Shareholders and Related Party Transactions |
| (2) | Anil Agarwal is the protector and one of the beneficiaries of the Trust. Accordingly, Anil Agarwal is deemed to be a beneficial owner of securities that are beneficially owned by the Trust. |
ITEM 7. | Major Shareholders and Related Party Transactions |
A. Major Shareholders
The following table sets forth information regarding beneficial ownership of our equity shares as of July 15, 2022 held by each person who is known to us to have 5.0% or more beneficial share ownership based on an aggregate of 3,717,199,039 equity shares outstanding as of that date which excludes 305,832 pending allotment as they are under dispute.
198
Beneficial ownership is determined in accordance with the SEC rules and includes shares over which the indicated beneficial owner exercises voting and/or investment power or receives the economic benefit of ownership of such securities. Equity shares subject to options currently exercisable or exercisable within 60 days are deemed outstanding for the purposes of computing the percentage ownership of the person holding the options but are not deemed outstanding for the purposes of computing the percentage ownership of any other person.
Name of Beneficial Owner | Number of Shares Beneficially Owned | Percentage Beneficially Owned | ||||||
Vedanta (1) | 2,590,189,293 | 69.7 | % | |||||
Life Insurance Corporation of India | 321,088,865 | 8.64 | % | |||||
| 1 | Vedanta is the beneficial owner of 2,590,189,293 equity shares of the Company, consisting of: |
| • | 1,724,805,858 equity shares held by Twin Star. This includes 24,823,177 ADS converted into 99,292,708 equity shares of Re.1/- each on August 11, 2020; |
| • | 163,464,540 equity shares held by Finsider; |
| • | 38,241,056 equity shares held by Welter Trading; |
| • | 492,820,420 equity shares held by Vedanta Holdings Mauritius II Limited; |
| • | 107,342,705 equity shares held by Vedanta Holdings Mauritius Limited; and |
| • | 63,514,714 equity shares held by Vedanta Netherlands Investments B.V. |
Vedanta is the majority shareholder of the Company. Vedanta was delisted from the official list of the London Stock Exchange on October 1, 2018 and was subsequently
re-registered
as a private limited company as VRL.Volcan and its wholly owned subsidiary i.e. Volcan Investments Cyprus Limited are the sole shareholders of Vedanta, which in turn is the sole shareholder of VRHL, which in turn is the sole shareholder of each of Twin Star and VRFL. VRFL is the sole shareholder of VRCL, which in turn is the sole shareholder of each of Welter Trading and Richter. Richter is the sole shareholder of Westglobe and the majority shareholder of Finsider. Vedanta Holdings Mauritius Limited is wholly owned by Vedanta Holdings Jersey Limited. Vedanta Holdings Mauritius II Limited is wholly owned by Finsider. Vedanta Netherlands Investments B.V. is wholly owned by Vedanta UK Investments Limited. Volcan is 100.0% beneficially owned and controlled by the Trust. Conclave is the trustee of the Trust and the sole registered shareholder of Volcan.
Mr. Anil Agarwal, the Executive Chairman of Vedanta and protector of the Trust, may be deemed to have beneficial ownership of securities that are beneficially owned by the Trust and since October 16, 2014, Mr. Anil Agarwal is one of the beneficiaries of the Trust.
Vedanta, Volcan, the Trust, Conclave and Mr. Anil Agarwal were previously parties to a relationship agreement that was intended to ensure that Volcan, as Vedanta’s controlling shareholder, complies with the independence provisions of the UK Financial Conduct Authority’s listing rules. Subsequent to the Vedanta’s delisting from the Official List of the London Stock Exchange, the Relationship Agreement was automatically terminated.
Significant Changes in Percentage of Ownership
The following table sets forth the significant changes in the shareholding interests of our Company by our principal shareholders in our equity shares in the last three fiscal years. Except as disclosed below, there were no significant changes in the percentage of ownership in our Company in the last three fiscal years. Percentages set forth below are based on the number of equity shares outstanding as of the dates set forth below.
Type of Shares | As of March 31, 2020 | As of March 31, 2021 | As on March 31, 2022 | As of July 15, 2022 | ||||||||||||||||||||||||||||
Number | Percent (%) | Number | Percent (%) | Number | Percent (%) | Number | Percent (%) | |||||||||||||||||||||||||
Equity shares (1) | 1,863,458,132 | 50.13 | 1,863,458,132 | 50.13 | 2,590,189,293 | 69.7 | 2,590,189,293 | 69.7 | ||||||||||||||||||||||||
Equity Shares (2) | 236,693,725 | 6.37 | 236,693,725 | 6.37 | 321,087,865 | 8.64 | 321,088,865 | 8.64 | ||||||||||||||||||||||||
Equity Shares (3) | 186,896,030 | 5.03 | — | — | — | — | — | — | ||||||||||||||||||||||||
| (1) | Vedanta is the beneficial owner of equity shares. |
| (2) | Life Insurance Corporation Limited is the beneficial owner of equity shares. |
| (3) | As on March 31, 2020, ICICI Prudential Equity Arbitrage Fund is the beneficial owner of equity shares and held more than 5% however, as on March 31, 2021, it held less than 5%. |
As of July 15, 2022, there were approximately 1,033,954 holders of our equity shares of which 808 shareholders have registered addresses in the US. As of the same date, there are Nil equity shares representing our ADSs. The said ADS of the Company have been delisted from NYSE effective close of trading on NYSE on November 8, 2021. This follows the filing done by the Company of Form 25 with Securities and Exchange Commission on October 29, 2021. As a consequence of the delisting becoming effective, termination of the Deposit Agreement under which the ADS were issued has also become effective close of trading on NYSE on November 8, 2021. See “”.
Item No.4 Information on the Company – A History and Development of our Company
Each of our equity shares is entitled to one vote on all matters that require a vote of shareholders, and none of our shareholders has any contractual or other special voting rights.
B. Related Party Transactions
The following is a summary of the material transactions we have engaged with our controlling shareholder, Vedanta, and its subsidiaries and other related parties, including those where our management or we have a significant equity interest. In addition, the following contains a discussion of how we intend to handle conflicts of interest and allocations of business opportunities between us and our affiliates, directors and executive officers. For a further discussion of related party transactions, see “” included elsewhere in this Annual Report.
Note 35 to our consolidated financial statements
199
Related Parties
(i) Volcan and the Agarwal Family
As of July 15, 2022, Volcan and its wholly owned subsidiary hold 100.0% of the share capital and 100.0% of the voting rights of Vedanta. Volcan is 100.0% beneficially owned and controlled by the Trust. Conclave is the trustee of the Trust and sole registered shareholder of Volcan, and consequently controls all voting and investment decisions of the Trust. Mr. Anil Agarwal, our Chairman and
non-executive
director and the Executive Chairman of Vedanta, is the protector of the Trust and since October 16, 2014, is one of the beneficiaries of the Trust. While Vedanta was listed on the London Stock Exchange, Vedanta, Volcan, the Trust, Conclave and Mr. Anil Agarwal were previously parties to a relationship agreement which was intended to ensure that Volcan, as Vedanta’s controlling shareholder, complied with the independence provisions of the Financial Conduct Authority’s listing rules in the UK. This relationship agreement was automatically terminated on Vedanta’s delisting from the Official List of the London Stock Exchange.(ii) Key Management Personnel
See “of Notes to the Consolidated Financial Statements.
Note 35: Related Party Transactions”
Related Party Transactions
(i) Outsourcing Services Agreement with Vedanta
Vedanta Limited entered into a service agreement with Vedanta on April 1, 2010, under which we agreed to provide accounting, treasury and related services at the request of Vedanta from time to time. In consideration of above, Vedanta agreed to pay us service charges aggregating to an amount of $ 0.2 million per year.
Since the effectiveness of the
Re-organization
Transactions, we renewed this agreement with Vedanta on May 20, 2014 for a period of 5 years. This agreement was valid until March 2018 and Vedanta agreed to pay us service charges aggregating to an amount of $ 0.4 million per year with an annual increase of 10.0%. This agreement was further renewed for a period of 5 years from April 1, 2018 and is valid till March 2023. Further, Vedanta has agreed to pay us service charges aggregating to an amount of cost plus arm’s lengthmark-up
per year.(ii) Brand License Agreement with Vedanta
During fiscal year 2018, the Company entered into a brand license agreement with Vedanta under which Vedanta agreed to grant the Company a license to use the trademark “Vedanta” and its logo. In consideration of the grant of license by Vedanta, the Company has agreed to pay 0.75% of revenue of the Company. The agreement was valid until March 2020.
During the fiscal year 2021, the agreement was renewed between the parties and certain additional services were also agreed to be provided by VRL. In consideration of the services, the brand and strategic service fee was
re-negotiated
at 2% of turnover of the Company. The agreement will be reviewed every three years for revision on such terms and conditions as may be agreed between the parties.On January 27, 2022, Board of Directors passed a resolution to extend the Agreement with Vedanta for a further period of 15 years. However, it is also advised to review the rate under the agreement at the intervals of every three years.
For a further discussion of related party transactions, see “” of Notes to the Consolidated Financial Statements.
Note 35: Related Party Transactions
(iii)
₹
₹
₹
₹
₹
(iv) Twin Star Holding Limited and THL Zinc Limited
During fiscal year 2019, THL Zinc Limited entered into a loan agreement with Twin Star Holding Limited for $ 20 million at an interest rate of 2.25% per annum. The agreement was valid until February 2019. During the fiscal year 2020, the agreement was renewed with an increased rate of interest of 7.78% and was extended until October 2022. The loan is unsecured. During the year the entire outstanding amount of $ 40,000 along with interest accrued thereon was repaid. The outstanding balance as on March 31, 2022, was Nil.
(v) Structured investments purchased from Volcan Investments Limited
During the financial year ended March 31, 2019, as part of its cash management activities, CIHL purchased an economic interest in a structured investment for the equity shares of Anglo-American Plc (“AA Plc”), a company listed on the London Stock Exchange, from Volcan for a total consideration of 38,124 million (GBP 428 million, $ 541 million) determined based on an independent third-party valuation. In July 2019, the transaction was unwound, and the investments were redeemed for a total consideration of 44,847 million (GBP 519 million, $ 639 million), representing the actual price Volcan realised from selling the shares of AA Plc. CIHL was informed that the said realization was net of applicable transaction costs of 926 million (GBP 10 million, $ 12 million), which in January 2021, CIHL agreed to bear. Accordingly, this amount was recorded in the consolidated statements of profit and loss in the previous year ended March 31, 2021.
₹
₹
₹
200
(vi) Vedanta Limited - oil and gas business’s PSC and Open Acreage Licensing Policy (“OALP”) guarantee to Government
VRL as a parent company, has provided financial and performance guarantee to GoI for erstwhile Cairn India group’s (“Cairn”) obligations under the PSC provided for onshore blockfor making available financial resources equivalent to Cairn’s share for its obligations under the PSC, personnel and technical services in accordance with industry practices and any other resources in case Cairn is unable to fulfill its obligations under the PSC.
RJ-ON-90/1,
During the previous year ended March 31, 2021, the Board of Directors of the Company approved a consideration to be paid for this guarantee at an annual charge of 1.2% of net exploration and development spend, subject to a minimum annual fee of 379 million ($ 5 million), applicable from April 2020 onwards to be paid in ratio of participating interests held equally by the Company and its step-down subsidiary, CEHL.
₹
Similarly, VRL has also provided financial and performance guarantee to GoI for the Company’s obligations under the RSC in respect of 51 Blocks awarded under the OALP by the GoI. During the previous year ended March 31, 2021, the Board of Directors of the Company approved a consideration to be paid for this guarantee consisting of 1,897 million ($ 25 million), i.e., 2.5% of the total estimated cost of initial exploration phase of approx. 75,870 million ($ 1 billion) and an annual charge of 1% of spend, subject to a minimum fee of 759 million ($ 10 million) and maximum fee of 1,517 million ($ 20 million) per annum.
one-time
charge of₹
₹
₹
₹
Accordingly, the Company has recorded a guaranteed commission expense of 1,332 and 1,470 million ($ 19 million) for the year ended March 31, 2021 and 2022 respectively and 1,610 and 1,260 million ($ 17 million) is outstanding as a
₹
₹
₹
pre-payment
on March 31, 2021 and March 31, 2022 respectively.(vii) Loans to parent companies
In June 2020, as part of its cash management activities, the Company through its overseas subsidiaries extended certain loans and guarantee facilities, for a period upto 12 months, to VRL and its subsidiaries (collectively “the VRL group”). Further, certain terms of the loan facilities were modified which resulted in substantial modification of the instruments. The guarantee was also extinguished. The difference in the fair value of the loan was debited to equity as a transaction with the shareholder. The provisions of IFRS 9 – ‘Financial Instruments’ as applicable for assets which are credit impaired on initial recognition were applicable to loans aggregating to 8,923 million (US$ 122 million) to one of the subsidiaries of VRL.
₹
Thereafter, in March 2021, since the credit default swap rates had stabilised, the Group revised the interest rate to 9.6% using a level 2 valuation approach by applying the prevailing US Dollar treasury rates and the Company specific credit default swaps. The Group also benchmarked the said rate to the coupon rate on bonds issued to 5,361 million ($ 73 million) is reflected in the statements of changes in equity and cash flow as a transaction with the shareholder.
non-related
third parties by the VRL group during the same period. As per the accounting requirements of IFRS 9 – ‘Financial Instruments’ with respect to modification of loans, the net excess of loan amount over the present value of the modified contractual cash flows discounted at the original effective interest rate aggregating to₹
During the year ended March 31, 2022, the VRL group repaid 16,227 million (US$ 214 million) of the aforesaid loans, along with interest thereon. Furthermore, during the year, the overseas subsidiaries of the Company, executed agreements with Twin Star Holdings Limited, “TSH”, to novate 22,761 million (US$ 300 million) due for repayment in June 2022 to another subsidiary of VRL, which is guaranteed by VRL, at a higher interest rate of 10.1% mainly reflecting the impact of novation. This transaction did not have any material impact on the financial results for the current period.
₹
₹
As on March 31, 2021, and March 31, 2022, loans having contractual value of 70,653 million and 56,827 million (US$ 749 million) were outstanding respectively from the VRL group.
₹
₹
(viii) Power Delivery Agreement
During March 2022, the Company and its subsidiary BALCO have executed Power Delivery Agreement (‘PDA’) with Serentica Renewables India 3 Private Limited (“Serentica 3”) and Serentica Renewables India 1 Private Limited (‘Serentica 1’), which are fellow subsidiaries created by Volcan Investments Limited for building renewable energy power projects (“the Projects”) of approximately 180 MW and 200 MW respectively, on a group captive basis. Under the terms of the PDA, the Company and BALCO are expected to infuse equity of approximately 2,300 million ($ 30 million) and 2,500 million ($ 33 million) for 26% stake in Serentica 3 and Serentica 1, respectively, for procuring renewable power over twenty five years from date of commissioning of the Projects. Subsequent to balance sheet date 1,440 million ($ 19 million) has been paid. No significant project-related activities have been carried out subsequent to signing of the PDA.
₹
₹
₹
(ix) Conflicts of Interest and Allocations of Business Opportunities
From time to time, conflicts of interest have in the past and will in the future arise between us and our affiliates, including our controlling shareholder, Vedanta, and other companies controlled by Vedanta, our directors and our executive officers. See “” With respect to transactions between us and our affiliates, directors and executive officers that involve conflicts of interests, we have in the past undertaken and will continue to undertake such transactions in compliance with the rules for interested or related party transactions of the NYSE, NSE and BSE.
Item 3. Key Information - D. Risk Factors - Risks Relating to Our Relationship with Vedanta.
As part of our listing with the NYSE, we were required to confirm to the NYSE that we will appropriately review and oversee related party transactions on an ongoing basis. These related party transactions include transactions between us and our controlling shareholder, Vedanta, and its affiliates. The NYSE reviews the public filings of its listed companies as to related party transactions. Under the rules of the NYSE, we are required to have an independent audit committee comprised entirely of independent directors. We have had an independent audit committee comprised entirely of independent directors since our ADSs offering in June 2007. One of the functions of the independent audit committee is to review any related party transactions by us or any of our subsidiaries or affiliates. In addition, under the rules of the NYSE, we are required to obtain shareholder approval for any issuance of our equity shares, or securities convertible into or exercisable for our equity shares, to any related party, except that such approval would not be required for sales of our equity shares to our controlling shareholder or its affiliates in an amount not to exceed 5.0% of the number of our equity shares outstanding prior to such issuance and at a price equal to or greater than the higher of the book or market value of our equity shares. The ADS of the Company have been delisted from NYSE effective close of trading on NYSE on November 8, 2021. As a consequence of the delisting becoming effective, termination of the Deposit Agreement under which the ADS were issued has also become effective close of trading on NYSE on November 8, 2021. This follows the filing done by the Company of Form 25 with Securities and Exchange Commission on October 29, 2021See “”.
.
Item No.4 Information on the Company – A History and Development of our Company
201
Under the Listing Regulations we have entered into with the NSE and BSE, we are required to ensure that our disclosures in relation to material and significant related party transactions in our Annual Reports are in compliance with applicable accounting standards in India. Specifically, we are required to place before the audit committee and publish in our Annual Reports a statement in summary form of the related party transactions entered into by us during the previous fiscal year, providing details of whether such transactions were undertaken in the ordinary course of business and details of material individual transactions with related parties or others which were not on an arm’s length basis, together with our management’s justification for such transactions. Under the Listing Regulations, 2015, our audit committee is required to review and discuss with the management the disclosures of any related party transactions, as provided in our annual financial statements.
As per Companies Act, 2013, the related party transactions require approval of the Board of Directors in case the transaction is not at arm’s length or in the ordinary course of business. Further approval of the shareholders would be required whenever the prescribed threshold limits exceed. Further, the member of the company shall not vote on such resolution to approve any contract or arrangement which may be entered into by the company, if such member is a related party. However, the approval of the Board / Shareholders will not apply if the related party transactions are in the ordinary course of business and at arm’s length.
Refer Item No.10 Additional Information: “Related Party Transaction” with the amendments.
We also have used and will continue to use independent appraisers in appropriate circumstances to help determine the terms of related party transactions. We have had and will continue to have an audit committee comprised entirely of independent directors which is responsible for reviewing any related-party transaction by us or any of our subsidiaries or affiliates.
We are continually seeking to identify and pursue business opportunities. However, Vedanta, as our controlling shareholder, has the power to determine in its sole discretion what corporate opportunities we may pursue and whether to pursue a corporate opportunity itself or through one of its other subsidiaries, which may benefit such companies instead of us and which could be detrimental to our interests. See “” Vedanta has in the past allocated and expects in the future to allocate corporate opportunities among itself and its various subsidiaries based on a number of factors, including the nature of the opportunity, the availability of funds at the relevant subsidiary to pursue the opportunity and which subsidiary it believes can most successfully take advantage of the opportunity.
Item 3. Key Information—D. Risk Factors—Risks Relating to Our Relationship with Vedanta—Vedanta may decide to allocate business opportunities to other members of the Vedanta group instead of to us, which may have a material adverse effect on our business, results of operations, financial condition and prospects.
ITEM 8. | FINANCIAL INFORMATION |
A. Consolidated Statements and Other Financial Information
Please see “” for a list of the financial statements filed as part of this Annual Report.
Item
18 – Financial Statements
Legal Proceedings
Except as described below, there are no governmental, legal or arbitration proceedings (including any such proceedings, which are pending, or to our knowledge, threatened) which we believe could reasonably be expected to have a material adverse effect on our results of operations, cash flows or financial position. See – “” included elsewhere in this Annual Report for more information.
Note 33 to our consolidated financial statements
| – | Proceedings against the GoI which has disputed our exercise of the call option to purchase its remaining ownership interest in BALCO |
There are certain proceedings that are currently ongoing with respect to the exercise of a call option to acquire the remaining shares of BALCO held by the GoI, in accordance with the terms of the shareholders’ agreement between the GoI and us. The amount claimed under this proceeding is presently unquantifiable. The arbitral tribunal formed under the directions of the High Court of Delhi pronounced an award on January 22, 2011. The award held certain clauses of the shareholders’ agreement to be void, ineffective and inoperative as being in violation of sub section (2) of Section 111A of the erstwhile Companies Act, 1956. We filed an application before the High Court of Delhi to set aside this award under Section 34 of the Arbitration and Conciliation Act, 1996. See “.
Item 4 – Information on the Company - B. Business Overview - Our Business -
Call Options over
Shares
”
| – | Proceedings by the GoI which has disputed our exercise of the call option to purchase its remaining ownership interest in HZL |
Under the terms of the shareholders’ agreement between the GoI and Vedanta Limited, Vedanta Limited was granted two call options to acquire all the shares in HZL held by the GoI at the time of exercise. Vedanta Limited exercised the first call option on August 29, 2003. Arbitration is ongoing in relation to a dispute between the GoI and Vedanta Limited, with respect to Vedanta Limited’s exercise of its second call option to acquire the remaining shares in HZL held by the GoI, pursuant to the shareholders’ agreement between the parties. The GoI has refused to act upon the second call option, stating that Vedanta Limited’s second call option violates the provisions of the Indian Companies Act, 1956, by restricting the right of the GoI to transfer its shares. As on date, the next date of hearing by the arbitral tribunal has not been determined.
202
Separately, a writ petition was filed in March 2014 in the Hon’ble Supreme Court by the National Confederation of Officers Association questioning the decision of GoI to divest its 29.54% residual shareholding in HZL. The Hon’ble Supreme Court on January 19, 2016 ordered the status quo to be maintained with respect to the proposed disinvestment of the government’s interest in HZL until further orders are passed by the Hon’ble Supreme Court. On January 9, 2020, Vedanta Limited filed an early hearing application to the Hon’ble Supreme Court. On August 13, 2020, the Hon’ble Supreme Court passed an order partially removing the status quo order in place and has allowed the arbitration proceedings to continue.
The matter was heard before the Hon’ble Supreme Court in October 27, 2021, and the final order was passed on November 18, 2021. The Hon’ble Supreme Court allowed the GoI’s proposal to divest its entire stake in HZL in the open market in accordance with the rules and regulations of SEBI. The Hon’ble Supreme Court also directed the Central Bureau of India to register a regular case in relation to the process followed for the disinvestment of HZL in the year 2002 by the GoI.
Due to the abovementioned Hon’ble Supreme Court order, Vedanta Limited has filed an application for the withdrawal of its arbitration claim for the second call option.
Final order allowing for the withdrawal of arbitration matter has been passed. See “”.
Item
4:
Information
on
the
Company
-
B.
Business
Overview
-
Our
Business -
Call Options over Shares
| – | Legal proceedings related to mining operations in the State of Goa |
Pursuant to findings in the Justice M.B. Shah Commission Report dated March 15, 2012, on the allegations of illegal mining in the State of Goa, the state government banned iron ore mining operations in Goa on September 10, 2012, and the MoEF&CC suspended environmental clearances of all mining leases within the State of Goa. A writ petition was filed before the Hon’ble Supreme Court to initiate action based on the Justice M.B. Shah Commission Report and an interim order was passed by the Hon’ble Supreme Court on October 5, 2012 suspending mining operations within Goa.
The Hon’ble Supreme Court passed an interim order on November 11, 2013, directing that the Directorate of Mines and Geology verify the inventory of the excavated mineral ores and the Monitoring Committee be constituted to sell the materials through
e-auction
and proceeds from the auction to be deposited with the Goa state government. The auction of inventorized ore is yet to be completed.On April 21, 2014, the Hon’ble Supreme Court passed judgment in the matter lifting the ban with certain stipulations, including directions on mining by the lessees after November 22, 2007, as being illegal, and dumping outside the leased area as being impermissible. The Hon’ble Supreme Court also ordered that an interim buffer zone be fixed at one kilometer from the boundaries of National Parks and Sanctuaries, set an
ad-hoc
cap on annual excavation at 20 million tons other than from dumps until such time as the final report of Expert Committee on iron ore is submitted, and also ordered the appropriation of the sale value ofe-auctioned
inventorized ores by the Goa state government as per stipulated conditions, and the payment of 10.0% of the sale proceeds to the Goa Iron Ore Permanent Fund. The Hon’ble Supreme Court has held that all mining leases in the State of Goa, including those of the Company, had expired in 2007 and consequently, no mining operations can be carried out until renewal/execution of mining lease deeds by the Goa state government. The petition filed by us in May 2014 for the review of the aforesaid judgment in the Hon’ble Supreme Court on certain limited issues was subsequently withdrawn by us in September 2014.On August 13, 2014, the High Court of Bombay, Goa Bench passed a common order directing the State of Goa to renew the mining leases for which stamp duty was collected in accordance with the Goa Mineral Policy (2013) and to decide the other applications for which no stamp duty was collected within three months thereof.
During first half of January 2015 government of Goa renewed the mining leases and on January 15, 2015, the government of Goa revoked the order suspending mining operations in the State of Goa and MoEF&CC has revoked suspension of environmental clearances in March 2015. Subsequently, the renewed lease deeds for all working leases were registered as of August 2015. We obtained the CTO under the Air (Prevention of Pollution) Act and Water (Prevention of Pollution) Act from the Goa State Pollution Control Board and mining plan approval from the Indian Bureau of Mines for these leases, and the Company resumed operations of its mines on August 10, 2015.
On September 10, 2014, the Goa Foundation challenged the High Court of Bombay order directing the renewal of mining by way of a SLP before the Hon’ble Supreme Court, challenging the judgment of the High Court of Bombay dated August 13, 2014, directing renewal of mining leases. Another set of SLPs on an identical issue were filed by a local activist. Two writ petitions have also been filed before Hon’ble Supreme Court by Goa Foundation and Sudip Tamankar in September 2015 for setting aside the second renewal of iron ore mining leases in Goa made under section 8 (3) of Mines and Minerals (Development and Regulation) “(MMDR”) Act and challenging the revocation of suspension on mining in State of Goa. The Hon’ble Supreme Court passed its final order in the matter on February 7, 2018, wherein it set aside the second renewal of the mining leases granted by the State of Goa. The Hon’ble Supreme Court directed all lease holders operating under a second renewal to stop all mining operations with effect from March 16, 2018, until fresh mining leases (not fresh renewals or other renewals) and fresh environmental clearances are granted under the MMDR Act. The State Government of Goa and company have filed a review petition against the said judgment dated February 7, 2018. The review petition has been heard in chambers. The review petition was disposed off by order dated July 9, 2021
Subsequent to the aforesaid judgement, Vedanta Limited filed a representation before the state government of Goa seeking an extension on the validity of leases in consonance with provisions of MMDR Amendment Act which provided that all leases granted prior to the commencement of MMDR Amendment Act were deemed to be granted for a tenure of fifty (50) years. The state government of Goa did not consider the representation citing the Hon’ble Supreme Court judgment in place in respect of the issue. Vedanta Limited challenged state government’s stand before the High Court of Bombay at Goa by way of a writ petition which was also rejected basis the earlier Hon’ble Supreme Court judgement. Company then challenged the order of High Court of Bombay before the Hon’ble Supreme Court, in which notice was issued to parties and the State Government of Goa filed a supportive affidavit. The Hon’ble Supreme Court also allowed the impleadment of Goa Foundation and Sudip Tamankar and they have filed their replies. The matter was taken up for hearing and the same was disposed of by order dated September 7, 2021, upholding the Bombay High Court order. A review petition against the order of the Hon’ble Supreme Court was filed, and the review was dismissed by the Hon’ble Supreme Court by its order dated March 30, 2022. Separately, the Expert Committee on iron ore has filed their reports on dump handling and ceiling on annual extractions before the Hon’ble Supreme Court recommending the immediate enhancement of the annual extraction ceiling to 30 million MT, and subsequently to 37 million MT after the development of infrastructure. The Expert Committee on iron ore’s report is yet to be accepted and the matter is pending before the Hon’ble Supreme Court.
203
| – | Certain prosecution proceedings brought by SEBI against us, Mr. Anil Agarwal and Mr. Tarun Jain |
In April 2001, SEBI ordered that prosecution proceedings be brought against us, alleging that we have violated the regulations prohibiting fraudulent and unfair trading practices and it also passed an order prohibiting us from accessing the capital markets for a period of two years. This SEBI order was overruled by the SEBI Appellate Tribunal on October 22, 2001, on the basis of lack of sufficient material evidence to establish that we had, directly or indirectly, engaged in market manipulation and that SEBI had exercised its jurisdiction incorrectly in prohibiting us from accessing the capital markets. On November 9, 2001, SEBI appealed to the High Court of Bombay. The next date of hearing has not yet been fixed. In addition to the prosecution proceedings, SEBI also initiated criminal proceedings in 2001 before the Court of the Metropolitan Magistrate, Mumbai, against us, Mr. Anil Agarwal and Mr. Tarun Jain (who was the Chief Financial Officer of MALCO at the time of the alleged price manipulation). The matter is tentatively listed in due course. When SEBI’s order was overruled on October 22, 2001, we filed a petition before the High Court of Bombay to stay those criminal proceedings on the grounds that the SEBI Appellate Tribunal had overruled SEBI’s order on price manipulation. An order was passed by the High Court of Bombay in our favor on December 2, 2005, granting an interim stay of the criminal proceedings.
| – | Criminal proceedings against certain directors and employees of BALCO |
Criminal proceedings were initiated by Mr. Ajay Padia before the Court of the Judicial Magistrate First Class, Pune against Mr. Anil Agarwal, Mr. Navin Agarwal, Mr. Tarun Jain and certain of our other former directors and employees in 2002 alleging that an assurance that was given by the above-mentioned directors regarding payment of all amounts owed to him for the damaged material supplied by BALCO was not honored. An application under Section 482 of the Indian Criminal Procedure Code was filed in the High Court of Bombay for quashing the proceedings in the Judicial Magistrate First Class and to dispose the matter directing that alternative remedies were available before the Sessions Court, Pune, which was the appropriate Court. The High Court of Bombay stayed the criminal proceedings, and the application was listed for disposal. The matter is to be heard in due course.
| – | Penalties levied by the Enforcement Directorate on certain of our directors and us |
On August 3, 2004, the Enforcement Directorate levied penalties on certain of our directors and us aggregating to 347 million ($ 4 million). It was alleged that we transferred an amount of 2,080 million ($ 28.44 million) to Twin Star Holdings Limited and invested in Sterlite and MALCO through Twin Star Holdings Limited without the permission of the RBI. We have submitted that Twin Star Holdings Limited obtained the required approvals from the Foreign Investment Promotion Board (“FIPB”) for the investment. We appealed to the appellate tribunal against the Enforcement Directorate’s order for foreign exchange seeking a waiver of the
₹
₹
pre-deposit
amount, which was equal to 100.0% of the penalty levied, which appeal was allowed by the tribunal. The Enforcement Directorate appealed against this decision of the tribunal to the High Court of Delhi, which referred the matter back to the tribunal to consider the issue afresh. The Appellate Tribunal on August 6, 2019, passed a favorable order directing a stay on thepre-deposit
amount. The matter will be heard on merits in due course.| – | Criminal proceedings against former directors of Sesa Industries Limited |
Ms. Krishna Bajaj filed a complaint against the former directors of Sesa Industries Limited (which has since been amalgamated with Sesa Goa) before the Magistrate at Mumbai in 2000, in relation to shares issued on a preferential basis by Sesa Industries Limited in 1993 to Sesa Goa’s shareholders, alleging that the shares of Sesa Industries Limited were not listed within 12 to 18 months of the offer as stated in the offering document. The four directors appeared before the court on June 16, 2009 and pleaded not guilty to the charges. The four directors filed a criminal application in the High Court of Bombay challenging the Magistrate’s order of framing charges before the High Court of Bombay. The High Court of Bombay admitted the criminal application and stayed the proceedings pending before Magistrate at Mumbai.
| – | Writ petitions filed against us alleging violation of certain air, water and hazardous waste management regulations at our Tuticorin plant |
Various writ petitions were filed before the High Court of Madras alleging that sulphur dioxide emissions from our copper smelting operations at Tuticorin were causing air and water pollution and hazardous waste and sought a cancellation of our permits and environmental approval to operate our smelter.
A writ petition was filed in December 2009 before the High Court of Madras challenging the grant of environmental clearance for the expansion of our copper smelter at Tuticorin, however no order or direction for injunction was granted. By way of its order dated April 28, 2016, the High Court of Madras dismissed the petition and rejected the claims of the petitioner.
Separately, in March 2013, the TNPCB ordered the closure of the copper smelter at Tuticorin due to complaints regarding a noxious gas leak by local residents. On April 1, 2013, we filed a petition with the NGT challenging the order of the TNPCB on the basis that the plant’s emissions were within permissible limits. The NGT passed an interim order on May 31, 2013 allowing the smelter to recommence operations subject to certain conditions, and consequently we recommenced operations on June 16, 2013. The expert committee constituted by the NGT submitted a report on the operation of the plant on July 10, 2013 stating that the plant’s emissions were within the prescribed standards. Based on this report, the NGT ordered on July 15, 2013 that the smelter could recommence its operations. On August 8, 2013, the NGT confirmed its May 31, 2013 order and held that there was no health impact owing to the operations with directions to comply with the recommendations made by the committee to further improve the working of the plant within a time bound schedule. We implemented all the recommendations during fiscal year 2013. However, the TNPCB filed a Civil Appeals in 2013 against the NGT’s interim order dated May 31, 2013 and the final order dated August 8, 2013. V Gopalaswamy, the General Secretary of a political party, MDMK, also filed civil appeals in 2013.
204
These appeals have been allowed by the Hon’ble Supreme Court and the NGT judgment dated August 8, 2013, has been set aside on grounds of maintainability. However, the Hon’ble Supreme Court has given the Company, liberty to approach the High Court of Madras challenging the orders of TNPCB. We have now approached the High Court of Madras, Principal Bench challenging the impugned orders of TNPCB passed in 2013. The High Court of Madras vide its judgement dated August 18, 2020, dismissed the writ petition filed by the Company. The Company approached the Hon’ble Supreme Court and challenged the said High Court of Madras order by way of a SLP to Appeal. The SLP was admitted on August 31, 2020, wherein the court had directed the parties to file their counters and rejoinders if any. Subsequent to the same, the counter affidavits and the rejoinders were filed by the parties and the matter was listed on November 16, 2020, wherein Vedanta Limited had informed the court for a need to look at a workable approach and an option to resume the plant operations (at least on a trial basis so that allegations of pollution could be checked). Pursuant to the same an Interlocutory Application was filed by Vedanta Limited. The Matter was then listed on December 2, 2020, before Hon’ble Supreme Court. The Hon’ble Supreme Court after having heard both the sides concluded that at this stage the interim relief in terms of trial run could not be allowed. Further, considering the voluminous nature of documents and pleadings, the matter shall be finally heard on merits. The State of Tamil Nadu and TNPCB had filed a SLP as well, but on the limited point of expunging of certain paragraphs in the Madras High Court judgement, wherein adverse remarks were made against the State Government officials and TNPCB officials. The SLP of the State of Tamil Nadu and TNPCB has been clubbed with our main SLP matter. The SLP of the State of Tamil Nadu and TNPCB has been clubbed with our main SLP matter. The case was listed and heard on March 15, 2022, and was part heard. The matter was to be further listed on March 22, 2022, however, due the reconstitution of the bench, the case was not listed. Next date of hearing is yet to be intimated. The Hon’ble Supreme Court has indicated that the matter may be taken up along with an interlocutory application that was filed by Vedanta Limited before the Hon’ble Supreme Court for the maintenance of status quo as on March 15, 2022, consequent to an order passed by the Collector of Tuticorin requiring Vedanta Limited employees to vacate the plant premises.
| – | Proceedings related to the existing copper smelting operations and the proposed expansion project at the Tuticorin plant |
The CTO for our existing 400,000 TPA copper smelter plant at Tuticorin which was due to expire on March 31, 2018. We filed an application dated January 31, 2018, before the TNPCB for renewal of CTO, as per procedure established by law. The TNPCB rejected the said renewal application by its order dated April 9, 2018 (Rejection Order). The Company had filed an appeal before the TNPCB Appellate Authority challenging the Rejection Order, which the Company withdrew after the NGT Order dated December 15, 2018, on account of redundancy of proceedings before the TNPCB Appellate Authority.
During the pendency of the aforesaid appeal, TNPCB through its order dated May 23, 2018, ordered the disconnection of electricity supply and closure of the existing copper smelter plant with immediate effect. TNPCB passed the said closure order without any prior notice to us, which was due to be served as per the requirements under Section 21(4) of the Air (Prevention and Control of Pollution) Act, 1981 and Rule 34 of the Water (Prevention and Control of Pollution) Rules 1975. Thereafter, the Government of Tamil Nadu, proclaiming and endorsing TNPCB’s Rejection Order, issued orders dated May 28, 2018, with a direction to seal the existing copper smelter plant unit permanently (“TN Government Order”), without providing any prior notice to us. The Company filed an appeal before NGT, Principal Bench at New Delhi challenging the closure order passed by TNPCB as well as the TN Government Order for sealing of the existing plant and the appeal was allowed vide NGT’s judgement dated December 15, 2018. The NGT judgment was challenged before the Madurai Bench of the High Court of Madras (by a writ petition filed by an intervenor, Fathima Babu), which ordered to maintain status quo regarding the closure of the plant at Tuticorin until the State decided on filing of the appeal. The Company challenged the order of the Madras High Court before the Hon’ble Supreme Court. Meanwhile, the State also approached the Hon’ble Supreme Court against the final orders of the NGT ordering the reopening of the plant at Tuticorin.
The Hon’ble Supreme Court on February 18, 2019, set aside the NGT judgment dated December 15, 2018, on the grounds of maintainability, allowing Vedanta Limited the liberty to approach the High Court of Madras to challenge all the orders collectively, stating that no plea of alternative remedy shall be allowed.
Based on the said order, Vedanta Limited has filed a writ petition before the Principal Bench of the High Court of Madras and has additionally filed an application seeking interim relief for care and maintenance of the plant. The High Court of Madras vide its judgement dated August 18, 2020, dismissed the writ petition filed by the Company. The Company approached the Hon’ble Supreme Court and challenged the said High Court of Madras order by way of a SLP to Appeal. The SLP was admitted on August 31, 2020, wherein the court had directed the parties to file their counters and rejoinders if any. Subsequent to the same, the counter affidavits and the rejoinders were filed by the parties and the matter was listed on November 16, 2020, wherein Vedanta Limited had informed the court for a need to look at a workable approach and an option to resume the plant operations (at least on a trial basis so that allegations of pollution could be checked). Pursuant to the same an Interlocutory Application was filed by Vedanta Limited. The Matter was then listed on December 2, 2020 before Hon’ble Supreme Court. The Hon’ble Supreme Court after having heard both the sides concluded that at this stage the interim relief in terms of trial run could not be allowed. Further, considering the voluminous nature of documents and pleadings, the matter shall be finally heard on merits. The State of Tamil Nadu and TNPCB had filed a SLP as well, but on the limited point of expunging of certain paragraphs in the Madras High Court judgement, wherein adverse remarks were made against the State Government officials and TNPCB officials. The SLP of the State of Tamil Nadu and TNPCB has been clubbed with our main SLP matter. The case was listed and heard on March 15, 2022, and was part heard. The matter was to be further listed on March 22, 2022, however, due the reconstitution of the bench, the case was not listed. Next date of hearing is yet to be intimated The Hon’ble Supreme Court has indicated that the matter may be taken up along with an interlocutory application that was filed by Vedanta Limited before the Hon’ble Supreme Court for the maintenance of status quo as on March 15, 2022, consequent to an order passed by the Collector of Tuticorin requiring Vedanta Limited employees to vacate the plant premises.
205
Separately, our environmental clearance for the proposed copper smelter plant 2 (expansion project) expired on December 31, 2018. Our application for renewal of such environmental clearance was rejected by the MoEF&CC. Thereafter, we made a new application dated March 12, 2018, before the Expert Appraisal Committee of the MoEF&CC wherein a
sub-
committee was directed to visit the expansion project site prior to prescribing the terms of reference.In the meantime, the Madurai Bench of the High Court of Madras in a public interest litigation filed against us by the MoEF&CC and State Industries Promotion Corporation of Tamil Nadu (“SIPCOT”) held through its order dated May 23, 2018, that the application for renewal of the environmental clearance for the expansion project shall be processed after a mandatory public hearing and the said application shall be decided by the competent authority on or before September 23, 2018. In the interim, the High Court of Madras ordered us to cease construction and all other activities on site for the proposed expansion project with immediate effect. Separately, SIPCOT through its letter dated May 29, 2018, cancelled 342.22 acres of the land allotted to us for the proposed expansion project, which has been stayed by High Court of Madras. Further, the TNPCB issued orders on June 7, 2018, directing the withdrawal of the consent to establish for the expansion project, which is valid until March 31, 2023.
Hearing the case of expansion project, Madras High Court vide its order dated October 3, 2018, has granted an interim stay in favour of the Company against order of SIPCOT (State Industries Promotion Corporation of Tamil Nadu) dated May 29, 2018, cancelling 342.22 acres of the land allotted to us. The MoEF&CC has updated on its website that Vedanta Limited’s environmental clearance for expansion project will be considered for ToR either upon verdict of the NGT case or upon filing of a Report from the State Government/ District Collector, Thoothukudi. The Company has also filed Appeals before the TNPCB Appellate Authority challenging withdrawal of CTE by the TNPCB. The matter is pending for hearing and is listed on June 8, 2022, for Vedanta Limited to file a counter against an impleadment made by one Ms. Fatima Babu. The matter was last heard on June 8, 2022, wherein the TNPCB filed its counter in the matter. The mater was then listed for July 6, 2022. On July 6, 2022, Vedanta filed an abeyance petition requesting the TNPCB Appellate Authority to proceed with the matter only subsequent to the adjudication of the matter at the Hon’ble Supreme Court pertaining to the closure of existing operations. The matter is next listed for September 7, 2022.
| – | Challenge relating to the environmental clearance granted for our expansion plans of refinery in Lanjigarh |
On November 20, 2015, the MoEF&CC granted an environmental clearance in line with the Expert Appraisal Committee’s recommendation for the alumina refinery expansion up to 4 mtpa and environmental clearance of up to 6 mtpa, which will be received as an amendment to the existing environmental clearance after the completion of land acquisition of the balance area of 666.03 HA. Further, a Consent to establish for 4 mtpa and CTO for 2 mtpa has also been granted.
On February 18, 2016, an individual challenged the environmental clearance granted for the alumina refinery expansion at Lanjigarh before the NGT, Kolkata, wherein MoEF&CC, Odisha State Pollution Control Board and we have been made parties. Pleading in the matter is complete and pending for hearing of arguments, however, the same has not been posted owing to the paucity of judges in the Tribunal. It is pertinent to note that the NGT has not passed any interim order staying the project as prayed by the appellant. The matter was listed for hearing and disposal on January 4, 2022, wherein the NGT took the affidavit filed by Odisha State Pollution Control Board on record and posted the matter for hearing on January 20, 2022. The matter was then listed for final hearing and disposal on February 22, 2022, wherein the counsel for the Appellant sought an adjournment. Now the matter is listed for final hearing and disposal on April 1, 2022. On April 1, 2022, due to unavailability of our arguing counsel, we sought an adjournment. The matter has thereafter been posted for hearing on April 29, 2022. The matter was listed for final hearing before a special bench of the NGT on May 2, 2022, wherein the bench disposed off the appeal by directing the EC to remain intact for the expansion project. Certain additional directions were also passed with regards to payment of Environmental Compensation and a setting up of a Committee to formulate additional conditions on water drawl from Tel river, Fly Ash utilisation, Red Mud utilisation/disposal and approve restoration plan for utilising the compensation amount. A review application against the judgement of the NGT has been filed by Vedanta Limited on May 25, 2022, which will be heard in due course.
| – | Proceedings relating to levy of environmental compensation on account of fly-ash generation |
BALCO has three thermal power plants in Korba, Chhattisgarh with a total capacity of 2,010 MW out of which 1,740 MW is operational. The MoEF&CC has issued several notifications laying down the terms for disposal of ash produced from the thermal power plants. However, compliance with manner of disposal as specified in these notifications is not practically attainable on account of lack of demand from user agencies. Consequently, in accordance with the conditions of BALCO’s Environmental Clearance, left over ash generated from the power plants is disposed off in ash dykes after giving preference to supplying the same to user agencies.
The NGT took cognizance of the matter and vide its order dated February 12, 2020, ordered for levy of environmental compensation on companies failing to comply with the aforesaid notifications. BALCO filed a SLP before the Hon’ble Supreme Court by way of challenging the NGT order on the grounds that it is not in consonance with the Hon’ble Supreme Court’s previous orders dated December 12, 2018, and February 4, 2019, and the methodology for determination of compensation is not reasonable. The Hon’ble Supreme Court vide its order dated September 11, 2020, have stayed the impugned NGT order dated February 12, 2020.
No demand letter has been received from the State/ Central Pollution Control Board for environmental compensation by BALCO as on date. Vedanta Limited (Jharsuguda and Lanjigarh units) and TSPL have also challenged the aforesaid NGT order by way of separate Civil Appeals before the Hon’ble Supreme Court. The Civil appeals filed by Vedanta Limited are tagged along with the case of M/S Aravali Power Co. Private Limited V. Vedprakash and Anr and the matter was heard on May 10, 2022 and disposed off, however, final written order is awaited. Vedanta Limited Jharsuguda and TSPL have also not received any demand notices yet.
206
However, in a similar matter in a SLP filed by NTPC (where demand has been raised), Hon’ble Supreme Court granted stay of recovery of environmental compensation. In yet another matter, in a SLP filed by National Aluminium Company Limited (“NALCO”) (where no demand has been raised), the Hon’ble Supreme Court granted stay of recovery, if any, in pursuance of the impugned order of the NGT.
The Hon’ble Supreme Court Vide its order dated May 10, 2022, has set aside the impugned NGT order dated February 12, 2020. The Hon’ble Supreme court reiterated the following points: (1) That MoEF & CC is to revisit whether the parameters which have been prescribed by the notification dated December 31, 2021 (which had extended the time period for fly ash utilisation) must be modified taking into account the provision of the Hazardous and Other Wastes (Management and Transboundary Movement) Rules 2016 (“HW Rules”), to the extent to which the applicability of the HW Rules is attracted to utilization, transportation, and disposal of fly ash; (2) MoEF & CC shall ensure that the enforcement, audit, monitoring, and reporting mechanism which is envisaged in paragraphs E (3) and E (5) of the notification dated December 31, 2021 is duly put into place and enforced scrupulously; 3. MoEF&CC shall do it within a period of three months from the date of this judgment dated May 10, 2022.
In the views of the above and having regards to the notification dated December 31, 2021, the impugned orders of the NGT shall stand aside. However, the Hon’ble Supreme Court clarified that the judgment shall not be constructed as a decision on merits upholding the validity of notification dated December 31, 2021. Any party aggrieved by the terms of notification would be at liberty to pursue the remedies which are available in law before appropriate forum.
| – | Proceedings against us challenging environmental consents received for our expansion project of pig iron, metallurgical coke, sinter plants and power plant in Goa |
An application was filed by the village panchayat head of Navelim, Goa before the NGT against the Goa State Pollution Control Board (“GSPCB”), MoEF&CC, State of Goa, others and us alleging that (i) GSPCB had issued its approval in a piecemeal manner to us, even though the environmental clearance order issued by the MoEF&CC and the approval are for all four plants thereby violating the MoEF&CC order, (ii) the
no-objection
certificate issued in relation to this project in 2007 was forged and fabricated, and (iii) the CN5 bridge at Maina-Navelim junction falls outside the notified industrial area, and crosses a public road belonging to the village panchayat. The application sought cancellation of the approval and the order of the MoEF&CC. On March 1, 2013, the NGT gave directions to issue notices to all the parties. We responded on April 11, 2013, denying all contentions and submissions made by the village head and requested that the application be dismissed. Pleadings in the matter have been completed. Subsequently on February 10, 2014, the matter was transferred from the Principal Bench of the NGT at New Delhi to the Western Bench of the NGT at Pune.The application of Village Panchayat Navelim before NGT, Pune was kept in abeyance since an identical issue against us was pending before the Hon’ble Supreme Court. The said identical issue pertaining to Amona Expansion was later referred to NGT Principal Bench at Delhi by the Hon’ble Supreme Court. The Amona Expansion NGT, Delhi matter was disposed with the direction to MoEF&CC for passing any directions or conditions for the grant of EC to us. MoEF&CC accordingly added few conditions in the EC granted to us and the Amona expansion matter was accordingly disposed. The hearing of Village panchayat Navelim application before NGT, Pune will be taken up in due course.
| – | Shenzhen Shandong Nuclear Power Construction Co. Limited has commenced arbitration proceedings against us |
On February 19, 2012, Shenzhen Shandong Nuclear Power Construction Co. Limited (“SSNP”) filed a petition before the Bombay High Court under section 9 of the Arbitration and Conciliation Act, 1996, alleging 16,420 million ($ 225 million). This was subsequent to SSNP’s notice for termination of the contract dated February 25, 2011 and legal notice dated February 23, 2012 for recovery of its alleged dues. SSNP also made a request for interim relief. Under the petition, SSNP sought for a restraining order on encashment of the advance bank guarantee, injunction from disposing or creating third party right over plant and machinery at the project site and security for the amount due under the contract. On April 25, 2012, the High Court of Bombay dismissed SSNP’s petition. SSNP appealed against this order and the High Court of Bombay by its order dated December 12, 2012 ordered us to deposit a bank guarantee for an amount of 1,870 million ($ 25 million) until completion of the arbitration proceedings.
non-payment
of their dues towards construction of a 210 MWco-generation
power plant for a refinery expansion project at Lanjigarh, and filed a claim of₹
₹
On April 9, 2013, we filed a counterclaim for delays in operations caused for which we argued that SSNP was responsible. Subsequently, SSNP filed an application for an interim award of 2,020 million ($ 28 million) before the arbitral tribunal, which was not granted. The arbitral award was pronounced on November 9, 2017, wherein the Tribunal awarded an aggregate amount of 2,210 million ($ 30 million) to SSNP payable within a period of 120 days carrying an interest at the rate of nine per cent (9.0%) from the date of filing of the claim and along with a cost of 5 million ($ 0.07 million). The tribunal further directed that beyond the said period of 120 days, the award amount shall carry an interest at the rate of fifteen per cent (15.0%) till the realization of the award amount.
₹
₹
₹
Vedanta Limited challenged the award before the High Court of Delhi under section 34 of Arbitration Act. This was dismissed by the court, post which the Company filed an appeal under section 37 before the division bench of the High Court of Delhi. The court granted a stay subject to the deposit of the award amount. Accordingly, we deposited an amount of 1,522 million with the court, requesting the court to direct SSNP to return the bank guarantee post which the balance amount shall be deposited.
₹
The division bench, on August 30, 2018, dismissed our appeal u/s 37 of Act and vacated all interim orders passed by the court. We challenged the said order of Delhi High Court before Hon’ble Supreme Court by way of a SLP. In the meantime, SSNP also filed an execution application before the High Court of Delhi for appropriation of money, which was deposited with the court, against which we filed an appeal to get a stay of execution.
The Hon’ble Supreme Court disposed of the SLP passing its final order, on October 11, 2018, partially modifying the Arbitral Award on the interest aspect as under: (i) A uniform rate of 9.00% will be applicable for the INR component of the award amount in entirety till the date of realization (ii) The interest payable on the EUR component of the award amount will be as per LIBOR + 300 basis points on the date of Award, till the date of realization.
SSNP had filed a clarification application before the Hon’ble Supreme Court praying for the original award pronounced by the Tribunal on November 9, 2017 which was withdrawn by SSNP and now stands disposed of.
Vedanta Limited then filed a reply to the Execution Petition filed by SSNP in the Delhi High Court for giving effect to its earlier order and requesting SSNP to hand over the drawings, documents and the Bank Guarantee. The court, in its order dated August 8, 2019, accepted the Company’s argument that the Euro component can be paid in INR subject to the arguments of SSNP on the next date. With respect to our submission for return of drawings and documents as a precondition to the release of payments, SSNP submitted an affidavit on September 12, 2019. The matter was then listed on October 21, 2019, for hearing and as per the order 347 Million has been released out of the deposit made with the Registry in the first week of November 2019. In the meantime, SSNP also approached Vedanta Limited for a settlement which was rejected, stating that the same shall not be accepted unless the settlement offer is made by SSNP in writing.
₹
207
On January 6, 2020, the court recorded our submissions on refund of excess security deposited with the Registry by Vedanta Limited and on the issue of release of drawings and documents as sought by Vedanta Limited. The court directed SSNP to file an affidavit within two weeks’ to show that such drawings and documents have been supplied by them, thereafter two weeks’ time was given to Vedanta Limited to file a reply to the same. Vedanta Limited has filed a petition to recover the surplus deposit amount lying with the Registry. In the same order, accounts officers of the court was directed to examine the calculation filed by the parties and submit the report to the court. The matter to be heard on August 02, 2021. In the meantime, SSNP filed an Execution First Appeal before the Division Bench, Delhi High Court against the aforesaid order dated January 6, 2020, wherein SSNP has prayed for modification of the arbitral award. The execution first appeal has been part heard on November 26, 2020, and December 17, 2020. The Execution First Appeal was then listed for hearing on February 09, 2022, and has now been posted for final arguments on March 31, 2022. The arguments of both the parties in Execution First Appeal were heard at length on March 31, 2022, and the court has now reserved the final judgement. On April 27, 2022, the Delhi High Court dismissed the Execution First Appeal filed by SSNP. Pursuant to the dismissal of SSNP’s execution first appeal, Vedanta Limited has filed a supplementary affidavit in the original execution petition [OMP (ENF.) (COMM.) 225/2018] highlighting the excess security deposit amount lying with the Delhi High Court registry and has sought for its refund. The execution petition was listed on May 19, 2022, wherein SSNP has been given time to file its reply against the supplementary affidavit. Next date in the matter is August 02, 2022.
Vedanta Limited’s enforcement petition is to be heard in due course.
The aggregate award amount now stands revised at 3,026.03 million ($39.88 million) as on March 31, 2022.
₹
Proceedings against TSPL relating to its delay in commissioning various units of the power plant
TSPL entered into a long term power purchase agreement with the PSPCL for supply of power. TSPL has a contractual obligation to complete the commissioning of various units of the power plant according to the scheduled timelines agreed in terms of the agreement. According to the terms of the agreement, there are obligations and performances to be met by both PSPCL and TSPL. PSPCL was obligated to fulfill certain conditions including procuring interconnection and transmission facilities, arranging supply of adequate quantity of fuel for the project etc. However, due to the delay in fulfilment of certain obligations and other force majeure reasons, there were delays in implementing the project as compared to the scheduled timelines under the agreement. TSPL received letter from PSPCL, seeking payment of liquidated damages of 3,176 million ($ 41.86 million) for each delay in commissioning of Units I, II and III totaling 9,529 million ($ 125.60 million).
₹
₹
Subsequently, PSPCL invoked the bank guarantee of 1,500 million ($ 19.77 million) towards payment of the liquidated damages on account of delay in completion of the commissioning of Unit I. TSPL filed a petition with the Punjab State Electricity Regulatory Commission (“PSERC”) for quashing of the wrongful claim of liquidated damages and grant of extension of time to complete the commissioning of various units of the power plant. On October 22, 2014, PSERC ordered the matter to be settled through arbitration and allowed the stay on encashment of the bank guarantee until the matter is finally adjudged by the arbitrator. PSPCL submitted an appeal in Appellate Tribunal for Electricity (“APTEL”) against the PSERC order and on May 12, 2015, APTEL disposed the appeal by directing that the matter will be adjudicated by an arbitral tribunal. The arbitral proceedings have concluded on February 15, 2017, and the award was made in TSPL’s favor. Meanwhile, PSPCL has filed an application challenging the award under section 34 of the Arbitration and Conciliation Act, 1996. TSPL had filed an application on September 28, 2018, for dismissal of PSPCL’s application on maintainability stage. However, the application filed by TSPL has been dismissed by the court on January 12, 2021. TSPL has challenged the Order dated January 12, 2021, before Punjab and Haryana High Court. Matter was listed for arguments on April 27, 2022. On April 27, 2022, the matter was listed and TSPL sought adjournment. Matter is now listed on August 4, 2022, Further, the Section 34 matter before District Court, Patiala has been listed for arguments on March 16, 2022. On March 16, 2022, arguments were part heard and matter was adjourned to April 11, 2022. On April 11, 2022, both parties completed their arguments and matter was adjourned multiple times thereafter until May 27, 2022, where written submissions were submitted by PSPCL and the matter was adjourned to May 31, 2022. On May 31, 2022, the matter was not listed and is to be heard in due course.
₹
| – | Proceedings against TSPL relating to mega power project benefits |
TSPL submitted its bid for setting up a 1980 MW thermal power plant in the state of Punjab under a tariff based international competitive bidding process under a
Case-2
Model bidding mechanism in June 2008, which was ultimately awarded to Sterlite Energy Limited (now Vedanta Limited). A PPA was entered between TSPL and PSPCL on September 2008. According to the PPA, any increase or decrease in the capital cost of the project on the occurrence of any “Change in Law” (as defined therein) after thecut-off
date of June 16, 2008, had to be passed on to PSPCL, if it resulted in change in economic position of TSPL.At the time of bidding, TSPL was not eligible for the ‘mega power project’ status, however towards the end of 2009, the government policy on mega power projects was amended and various conditions were relaxed making TSPL eligible for the grant of mega power project benefits. TSPL was then granted the mega power project status in 2010 in terms of which TSPL has availed customs and excise duty exemption for import of capital goods during construction of the power plant. As TSPL had become entitled to the mega power project status after the
cut-off
date, according to PSPCL, the mega power project benefits received by TSPL had to be passed on to PSPCL pursuant to the PPA’s “Change in Law” clause. TSPL’s position was that as of thecut-off
date, similar benefits were available to it under India’s foreign trade policy as anon-mega
power project and accordingly, its economic position had not altered pursuant to the grant of mega power project status to warrant the passing on of such benefits to PSPCL. TSPL has also produced a number of approval letters issued by various Director General of Foreign Trade offices across India, which extended such benefits tonon-mega
power projects including government power projects or other public sector undertakings.208
PSERC passed a 2:1 majority judgement dated December 2, 2014, holding against TSPL. TSPL thereafter filed an appeal in January 2015 along with a stay application before the APTEL. The appeal was admitted; however, the stay application was rejected by APTEL. Against this rejection of stay application, TSPL filed an appeal in Hon’ble Supreme Court on July 28, 2015. The Hon’ble Supreme Court granted stay order against any recovery of mega power project benefits by PSPCL. The stay granted by the Hon’ble Supreme Court was vacated on February 6, 2017, which led to a deduction of 2,140 million ($ 29 million) from TSPL’s monthly billing by PSPCL. Upon appeal, Hon’ble Supreme Court directed PSPCL to refund 500 million ($ 7 million) from the amount deducted from TSPL’s bill subject to final outcome of appeal before APTEL. Following this order, APTEL also granted a stay against further deductions from the monthly billing against a bank guarantee furnished by TSPL.
₹
₹
APTEL dismissed the appeal filed by TSPL and disallowed TSPL’s contentions in its final judgement order dated July 4, 2017. TSPL filed an appeal before the Hon’ble Supreme Court against the adverse final judgement of APTEL. This appeal was admitted by Hon’ble Supreme Court on July 10, 2017 and a stay order was granted against PSPCL’s proposed deduction of 900 million ($ 11.86 million) from TSPL’s bills and against the encashment of bank guarantee amounting to 380 million ($ 5 million) which was furnished by TSPL to PSPCL under APTEL’s order. TSPL filed a clarification application before the Hon’ble Supreme Court, which was allowed and PSPCL was directed to refund 500 million ($ 7 million). However, the ongoing monthly deductions on account of mega benefit claim has not been stayed by the Hon’ble Supreme Court. On this account, PSPCL has already made deductions of approximately 9,177 million ($ 120.96 million) till March 31, 2022. The appeal is pending for further hearing and next date is yet to be notified.
₹
₹
₹
₹
| – | TSPL dispute related to Coal GCV measurement and coal washing |
Upon PSPCL’s refusal to pay energy charges to TSPL as per the provisions of a PPA between PSPCL and TSPL dated September 1, 2008, TSPL filed a petition on May 22, 2014, in PSERC against PSPCL claiming charges for washing, unloading, surface transportation, transit loss, finance charges and GCV loss related to the procurement of coal. PSPCL’s contention was that fuel charges should only include charges billed by the fuel supply company namely Mahanadi Coalfields Limited, whereas TSPL contended that all costs of fuel procurement are to be considered by PSPCL under the PPA, since the obligation to supply fuel for the project is that of PSPCL under Case II Scenario IV bidding procedure of Ministry of Power. PSPCL’s obligation of signing fuel supply agreement with Mahanadi Coalfields Limited and to supply fuel for project was later upheld by APTEL in another case between TSPL and PSPCL and that judgement is subsisting since its operation has not been disturbed in PSPCL’s appeal to Hon’ble Supreme Court.
PSERC issued the final order on November 23, 2015, denying all the claims made by TSPL. TSPL filed an appeal before APTEL challenging the order of PSERC. On July 3, 2017, APTEL partially allowed the appeal awarding unloading and shunting charges to TSPL although it ruled against TSPL on other claims. PSERC remand proceedings commenced pursuant to APTEL’s order dated July 3, 2017, for computation of unloading and shunting charges allowed to TSPL and PSERC passed its final order on May 6, 2019.
TSPL filed an appeal against the APTEL order dated July 3, 2017, before the Hon’ble Supreme Court. On March 7, 2018, the Hon’ble Supreme Court allowed TSPL’s appeal and directed PSPCL to pay charges for washing, surface transportation and to measure GCV of coal at TSPL site. The Hon’ble Supreme Court also dismissed the cross appeal filed by PSPCL, thereby affirming APTEL’s order allowing unloading and shunting charges to be paid by PSPCL.
However, PSPCL misinterpreting the Hon’ble Supreme Court order, paid only 160 million ($ 2 million) on September 17, 2018, on account of washing charges. TSPL has filed a Contempt Petition in the Hon’ble Supreme Court.
₹
The Hon’ble Supreme Court vide its order dated August 7, 2019, allowed the claims of TSPL and directed PSPCL to pay within six weeks. PSPCL paid 10,021 million to TSPL.
₹
However, PSPCL did not pay the complete amount and withheld balance amount due on account of yield loss and interest etc. TSPL had filed a second contempt petition for the remaining amounts. PSPCL has filed counter affidavit in reply to the second contempt petition. TSPL has filed rejoinder to the counter affidavit.
On March 7, 2020, PSPCL filed an application to submit an additional document (namely, expert opinion regarding coal washing). On August 14, 2020, PSPCL filed an affidavit seeking extension of time for reconciliation of amounts due towards energy charges. On October 14, 2020, PSPCL filed an application for permission to file additional documents/ additional facts. On February 4, 2021, PSPCL filed an affidavit stating that all the payments have been made in compliance of the Hon’ble Supreme Court Order and as per computations of PSPCL. On March 6, 2021, PSPCL also filed a note of arguments stating that they have paid only 83% of the claimed amount by TSPL.
Finally, on March 9, 2021, Hon’ble Supreme Court has disposed off the matter in favour of TSPL directing PSPCL to clear all the arrears as on date as understood by TSPL in two instalments i.e. on or before March 31, 2021 and May 31, 2021 including interest or any other component which is admissible as per the contract inter se the parties and as per the orders of the Hon’ble Supreme Court. Subsequently, PSPCL has paid 4,410 million ($58.13 million) till June 30, 2021. No further arrears are pending from PSPCL in this regard.
₹
| – | Petitions filed against BALCO in relation to the alleged encroachment of land on which our Korba smelter is located |
BALCO has 1,804.67 acres of government land out of which 1,751 acres is forest land which were given on lease by the Chhatisgarh state government. The lease deed has not been executed till date. The High Court of Chhattisgarh on February 2010 held that BALCO is in legal possession of 1,805 acres of government land based on which the cabinet of Chhattisgarh recommended the execution of lease deed in favor of BALCO but after approvals for forest land were sought.
209
With respect to the approvals for forest land, petitions have been filed in public interest before the Hon’ble Supreme Court by various individuals and Sarthak, a
non-governmental
organization alleging that BALCO is using forest land fornon-forest
activities. The Hon’ble Supreme Court referred the matter to the Central Empowered Committee (“CEC”), which recommended an ex post-facto diversion of forest land with payment of net present value of land for which forest compensation was not paid prior to the year 1980. Subsequently, it was alleged that BALCO had cut trees in violation of the Court order and the petitioner filed a contempt petition and the matter was again referred to the CEC. The CEC submitted its report on June 30, 2012, to the Court recommending that a detailed survey should be conducted through Forest Survey of India (MoEF&CC) using high quality remote sensing technique to find out whether any tree felling and/ornon-forest
use has taken place after February 29, 2008, in the revenue forest land and/or deemed forest in possession of BALCO. In order to expedite the proceedings, BALCO filed an application in the Court seeking direction to pay the net present value of forest land as per the recommendation of the CEC providing anex-post
facto diversion of the 1,751 acres forest land held by BALCO. The CEC has submitted its report dated February 22, 2019, on the ground trothing exercise conducted by the Forest Survey of India (FSI) jointly with BALCO between October 29, 2019, and October 31, 2019.Matter is currently pending before the Hon’ble Supreme Court and is to be listed in due course. In the meantime, BALCO had filed an application before the Tehsildar, Korba for eviction of illegal occupants on BALCO’s land. The application was rejected on the grounds of the land matter being
sub-judice
before the Hon’ble Supreme Court. BALCO has filed an interlocutory application before the Hon’ble Supreme Court against the order of the Tehsildar and the matter is yet to be listed for hearing.BALCO has also filed another IA in this matter against the directions issued by the Chhattisgarh Government under the Rajiv Gandhi Ashray Yojna for allotment of land to the illegal occupants of land. The matter is also pending before the Hon’ble Supreme Court and is to be listed in due course.
| – | Forest development tax levied by the Government of Karnataka |
In October 2008, we filed a writ petition in the High Court of Karnataka against the Government of Karnataka and others, challenging the imposition of a forest development tax (“FDT”) at a rate of 8.0% (a subsequent demand was made for the payment of tax at the rate of 12.0%) on the value of iron ore sold by us from the mining leases in the forest area, pursuant to the notification by the Government of Karnataka and the memorandum/common order issued by the Deputy Conservator of Forests. In August 2009, the High Court of Karnataka permitted the Government of Karnataka to levy the forest development tax and ordered that the demand be restricted to 50.0% of the forest development tax as an interim arrangement pending disposal of the writ petition.
We filed an application before the High Court of Karnataka, seeking modification of the order in August 2009. However, the application was not taken up for hearing. Subsequently, we filed a SLP before the Hon’ble Supreme Court against the Karnataka High Court’s order. In November 2009, the Hon’ble Supreme Court ordered the High Court of Karnataka to dispose the application for modification of the order given in August 2009 and ordered us to furnish a bank guarantee towards payment of the forest development tax. In April 2010, we were ordered by the High Court of Karnataka to pay 25.0% of the demand in cash and furnish a bank guarantee for the remaining 25.0%. On December 3, 2015, the High Court of Karnataka passed its final order quashing the forest development tax notification, holding that the rate of forest development tax levied to be 8.0% and directing a refund of the amounts collected from mining lessees other than state government owned companies. The state government of Karnataka appealed against the order before the Hon’ble Supreme Court, and another mining lessee also filed a counter appeal in the matter. The matter is pending before the Hon’ble Supreme Court and in the interim, the Hon’ble Supreme Court has stayed the refund of the forest development tax amount as ordered by the High Court of Karnataka.
Meanwhile, the Government of Karnataka legislated the Karnataka Forest Development (Amendment) Act, 2016 (the ‘Amendment Act’) to validate the earlier law making certain amendments with retroactive effect. The Amendment Act has also changed the nomenclature of Forest Development Tax (“FDT”) to Forest Development Fee (“FDF”) with retroactive effect, since the court had previously declared that FDT was a tax and not a fee, as claimed by Government of Karnataka. We challenged the validity of the Amendment Act by way of a writ petition before the High Court of Karnataka. The High Court of Karnataka, on October 4, 2017, struck down the Amendment Act directing refund of the amounts collected. On March 13, 2017, the Hon’ble Supreme Court, in the appeal filed by state of Karnataka against the order of the Karnataka High Court, has stayed the refund of the amount collected as FDF. On March 21, 2018, the Hon’ble Supreme Court directed that appeals against both the FDT and FDF matters will be heard together. The SLPs were listed on March 30, 2022, for final hearing before the Hon’ble Supreme Court. The Court had directed the State to file its written submission by April 5, 2022, and the matter was heard on April 7, 2022. The State Government of Karnataka has made the Statement to the Court that they are seriously considering settlement of the matter outside the Court. The Court has directed the parties to file their written submissions within one week and listed the matters on April 28, 2022. On April 28, 2022, the SC directed that the matter be listed immediately after two weeks on a
non-miscellaneous
day. The Hon’ble Supreme Court judge heading the bench has retired and now the matter will come up before a new bench in due course.| – | Demands against HZL by Department of Mines and Geology |
The DMG of the State of Rajasthan issued several show cause notices in August, September and October 2006, aggregating 3,339 million ($ 44 million) to HZL, claiming unlawful occupation and unauthorized mining of associated minerals other than zinc and lead at HZL’s Rampura Agucha, Rajpura Dariba and Zawar mines in Rajasthan, during the period from July 1968 to March 2006. In response, HZL filed a writ petition against these show cause notices. In October 2006, the High Court of Jodhpur issued an order granting a stay and restrained the DMG from undertaking any coercive measures to recover the penalty. In January 2007, the High Court of Jodhpur issued another order granting the DMG additional time to file their reply and also ordered the DMG not to issue any orders canceling the lease. The State Government filed for an early hearing application in the High Court. The High Court has passed an order rejecting the application stating that Central Government should file their replies. HZL believes it is unlikely that the claim will lead to a future obligation and thus no provision has been made in these financial statements. The State Government has filed a writ petition before the High Court of Jodhpur against the said RA order. Subsequently the State filed an early hearing application, but it was held that the State’s application cannot be admitted till the Central Government files its affidavit. The matter is to be listed in due course.
₹
210
| – | Demand against BALCO for electricity duty |
In February 2010, BALCO received a notice from the Chief Electrical Inspector, Government of Chhattisgarh demanding BALCO to pay 2,404 million ($ 32 million) from June 2005 to March 2009, towards electricity duty for the generation of power by BALCO’s 540 MW power plant. The notice alleged that BALCO did not submit the eligibility certificate required for exemption from payment of electricity duty. The said exemption was claimed pursuant to a memorandum of understanding entered with the state government and according to the industrial policy 2001-2006. The state level committee recommended that an eligibility certificate be issued to us that will exempt us from paying duty on electricity. BALCO filed an application before Directorate of Industries for the issuance of an eligibility certificate and granting an exemption from payment of electricity duty in year 2005 and also 2007 but the same was rejected by its letter dated February 28, 2019. Thereafter, BALCO submitted its representation dated April 18, 2019, before the Industries Department and the Energy Department for 37,255 million ($ 491 million) has been finally cancelled by the Chief Electrical Inspectorate, Raipur (“CEI”) on September 4, 2021.
₹
re-consideration
of BALCO’s application with subsequent reminders dated June 26, 2019, and September 06, 2019. For the 540 MW power plant, the demand of₹
The Group operates a 1,200 MW power plant (“the Plant”) which commenced production in July 2015. Based on the Memorandum of
Understanding signed between the Group and the Chhattisgarh State Government, the management believes that the Plant is covered
under the Chhattisgarh Industrial Policy 2004-09 which provides exemption of electricity duty for 15 years. In June, 2021, the CEI issued a demand notice for electricity duty and interest thereon of 8,880 million ($ 117 million) and 5,880 million ($ 78 million) respectively for the period March 2015 to March 2021.
₹
₹
The Group carries an accrual for electricity duty of 8,780 million and 8,170 million ($ 108 million) as on March 31, 2021 and March 31, 2022 respectively, net of Nil and 2,260 million ($ 30 million) as on March 31, 2021 and March 31, 2022 respectively paid under protest. BALCO has requested the CEI to allow payment of the principal amount over a period of 5 years along with a waiver of interest demand. BALCO has received a reply from CEI that the matter will be discussed with appropriate authorities. As on March 31, 2022, no confirmation has been received on this matter from the authorities and therefore an amount of 7,311 million ($ 99 million) relating to interest has been considered as a contingent liability.
₹
₹
₹
₹
₹
| – | Claims for contributions towards the District Mineral Foundation |
The District Mineral Foundation was introduced by the MMDR Amendment Act, whereby all mining lease holders are required to pay contributions towards the DMF. The contribution amounts were to be percentage of royalties as prescribed by the central government and were effective from January 12, 2015. In September 2015, a notification was issued by the Ministry of Mines prescribing the rate for the District Mineral Foundation contribution.
Subsequently, state rules were formulated for Rajasthan with effect from May 2016 and HZL received demand notices for the deposit of contributions to the District Mineral Foundation from January 12, 2015. In its order dated August 8, 2016, the High Court of Rajasthan stayed the demand retroactively for the period under challenge.
On December 16, 2015, the Federation of Indian Mineral Industries also filed a writ petition before the High Court of Delhi, obtaining an order for no coercive action. The writ petition was subsequently transferred to the Hon’ble Supreme Court.
In October 2015, another notification was issued by the Ministry of Coal whereby rates were prescribed for certain minerals such as coal and lignite, although an additional provision also required for the application of such rates from the earlier date of the notification or the respective state rules. Vedanta Limited and BALCO challenged the notifications for liability on account of fuel before the High Court of Delhi.
The Hon’ble Supreme Court through order dated October 13, 2017, held that contribution to DMF in case of minerals other than coal shall take effect from September 17, 2015 and in the case of coal from October 20, 2015 or from the date on which the DMF was established by the state, whichever is later. Pursuant to the Hon’ble Supreme Court order, HZL has challenged the demand for payment between the disputed periods, i.e. from the date when the State of Rajasthan established DMF until the date when the High Court of Rajasthan has granted a stay. In parallel, BALCO has filed a petition before the High Court of Delhi challenging the constitutionality of section 9B (5) and section 9B (6) of the MMDR Act. HZL has also filed an intervention application in the said petition.
HZL has also filed another writ petition before the High Court of Jodhpur challenging the discriminatory rates of contribution for major and minor minerals as well as mining leases granted post and prior to the date of amendment of the Act. Both the writ petitions have been clubbed by the court. The stay granted by the High Court of Jodhpur has been vacated vide order dated January 21, 2021. HZL filed an SLP before the Hon’ble Supreme Court against such stay vacation, which was later withdrawn with liberty to push for expeditious disposal of matter in the High Court of Jodhpur. Further, a second stay application had been filed in the second writ petition filed by HZL in the discriminatory rate matter. The matter is to be listed in due course.
HZL also filed a petition for waiver of interest on the DMF dues and the High Court of Rajasthan granted an interim order for immediate deposit of 1000 million towards DMF contribution for the period from September 19, 2015 to May 30, 2016, in compliance with the High Court of Rajasthan order dated September 21, 2021, without prejudice to the rights of HZL, and subject to the final outcome of the other matters under adjudication at the High Court of Rajasthan. HZL on October 1, 2021, in compliance with the High Court of Rajasthan Order dated September 21, 2021 has deposited 1000 Million towards DMF Contribution for the period from September 19, 2015 to May 30, 2016.
₹
₹
211
| – | Demands against HZL by Department of Mines and Geology - Demand for royalty |
The DMG of the State of Rajasthan issued a show cause notice to HZL vide an office order dated January 31, 2020, wherein HZL was called upon to present its case against the DMG’s demand for royalty for associated minerals i.e. silver and cadmium,
by-product
sulphur, waste tailing and demand for DMFT and NMET contributions.HZL challenged the computation mechanism in the royalty on the ground that the state has not complied with the previous orders of High Court of Rajasthan where a similar computation mechanism was challenged and court had directed the government to review the supporting documents, rules and judicial precedents. Pending compliance of its previous orders, the High Court of Rajasthan vide its order dated February 19, 2020, directed that HZL shall be afforded an opportunity of hearing by the Additional Chief Secretary, Department of Mines, Government of Rajasthan and no coercive action should be taken on account of the order passed by the Additional Chief Secretary until the same is placed for confirmation before the court. The DMG of the State of Rajasthan has filed an affidavit dated November 4, 2020 commenting on the representations submitted by HZL and has also issued a show cause notice on May 20, 2020 in connection with the removal of silver and cadmium without payment of royalty based on an investigation done by the State Directorate of Revenue Intelligence (“SDRI”), HZL is in the process of filing the response highlighting the errors on facts done by SDRI and will provide a statement to demonstrate full payment of royalty on silver and cadmium produced and sold by HZL. A no coercive action order has been passed vide order dated December 17, 2020. The matter is to be listed in due course.
| – | Proceedings relating to HZL’s transfer of mining leases |
On February 25, 2020, the State of Rajasthan issued orders to HZL alleging that the disinvestment of HZL and various other mergers amounts to transfer of HZL’s leases in favour of Vedanta Limited. HZL has been directed to regularise the lease under section 12A(6) of the MMDR Act read in conjunction with Mineral (Transfer of Mining lease Granted otherwise than through Auction for Captive Purpose) Rules, 2016 applicable to captive mines, failing which the leases would be terminated. HZL has since filed revision applications before the Central Government under Section 30 of the MMDR Act challenging the said order by State of Rajasthan. HZL also approached the High Court of Rajasthan for necessary protection orders until the matter is heard by the Revisionary Authority, Ministry of Mines which were so granted. The State of Rajasthan has been directed by the Revisionary Authority, Ministry of Mines not to take coercive action until final disposal of the matter HZL has also challenged the validity of Rule 24 of Mineral Concession (“MCR”) Rules, 1960 and has obtained a status quo order. The matter was listed on May 18, 2022 and is now expected to be posted 4 months later.
| – | Claim against BALCO for energy development cess |
BALCO challenged the imposition of Energy Development Cess levied on generators and distributors of electrical energy at the rate of 10 paise per unit on the electrical energy sold or supplied before the High Court of Chhattisgarh on the grounds that the cess is effectively on production and not on consumption or sale since the figures of consumption are not taken into account and the cess is discriminatory since captive power plants are required to pay at the rate of 10 paise while the State Electricity Board is required to pay at the rate of 5 paise. The High Court of Chhattisgarh by its order dated December 15, 2006, declared the provisions imposing ED Cess on CPPs as discriminatory and therefore ultra vires the Constitution. BALCO sought a refund of the cess amounting to 345 million ($ 5 million) it had already paid till March 2006 under protest.
₹
The State of Chhattisgarh filed a SLP before the Hon’ble Supreme Court and the SC whilst issuing notice has stayed the refund of the Cess already deposited and the Hon’ble Supreme Court has also directed the State of Chhattisgarh to raise the bills, but no coercive action be taken for recovery for the same. In case the Hon’ble Supreme Court overturns the decision of the High Court of Chattisgarh, Balco may be liable to pay an additional amount of 10,172 million ($ 135 million) as on March 31, 2022. Accordingly, the total exposure is10,517 million ($ 139 million) as on March 31, 2022.
₹
₹
– | Show cause notice from the Indian tax authorities for not withholding tax on payments made while acquiring a subsidiary |
In 2014, the income tax department issued a notice to erstwhile Cairn Limited (subsequently merged with Vedanta Limited) for 20,495 Crore (including interest of 10,247 Crore) holding the Company as ‘assessee in default’ as per Section 201 of
₹
₹
Income-tax
Act, 1961 pertaining to retrospective taxation for sale of shares in Cairn Limited by Cairn Energy Plc, UK and its affiliate Cairn UK Holdings Limited (“CUHL”). The Group has challenged this demand which wassub-judice
in various forums.Separately, CUHL, on whom the primary liability of income tax lies, received an order from the ITAT affirming a demand of 10,247 Crore but reducing the interest portion. Against this demand, the Tax authorities have recovered 5,858 Crore from the CUHL, reducing the liability to 4,389 Crore.
₹
₹
₹
In August 2021, the Indian Government has passed a law to scrap such retrospective taxes, subject to certain terms and conditions which the Group has fulfilled in December 2021. Accordingly, litigation has been closed with nil demand in January 2022.
212
| – | The Amalgamation and Re-organization Scheme has been challenged by the Indian tax authorities and others |
Subsequent to the effectiveness of the Amalgamation and
Re-organization
Scheme, SLPs challenging the orders of the High Court of Bombay at Goa were filed before the Hon’ble Supreme Court by the Commissioner of Income Tax, Goa and the MCA in July 2013 and in April 2014, respectively. Further, a creditor and a shareholder have challenged the Amalgamation andRe-organization
Scheme in the High Court of Madras in September 2013. Further, the Ministry of Mines, GoI have challenged the Amalgamation and Reorganisation Scheme before the High Court of Madras and the High Court of Bombay, Goa Bench, respectively. The Hon’ble Supreme Court has admitted the SLPs, and the matter was last listed on July 1, 2019, and the next date of hearing is yet to be notified.| – | Arbitration proceedings on issues related to the cost recovery of the Ravva block |
ONGC Carry
The Ravva PSC obliges the contractor parties to pay a proportionate share of ONGC’s exploration, development, production and contract costs in consideration for ONGC’s payment of costs related to the construction and other activities it conducted in Ravva prior to the effective date of the Ravva PSC (the ONGC Carry). The question as to how the ONGC Carry is to be recovered and calculated, along with other issues, was submitted to an International Arbitration Tribunal in August 2002 which rendered a decision on the ONGC Carry in favour of the contractor parties (including Vedanta Limited (Cairn India Limited which subsequently merged with Vedanta Limited, accordingly now referred to as Vedanta Limited)) whereas four other issues were decided in favour of GoI in October 2004 (Partial Award).
The GoI then proceeded to challenge the ONGC Carry decision before the Malaysian courts, as Kuala Lumpur was the seat of the arbitration. The Federal Court of Malaysia upheld the Partial Award. As the Partial Award did not quantify the sums, therefore, contractor parties approached the same Arbitration Tribunal to pass a Final Award in the subject matter since it had retained the jurisdiction to do so. The Arbitral Tribunal was reconstituted, and the Final Award was passed in October 2016 in the Company’s favour. GoI’s challenge of the Final Award has been dismissed by the Malaysian High Court and the next appellate court in Malaysia i.e., Malaysian Court of Appeal. GoI then filed an appeal at Federal Court of Malaysia. The matter was heard on February 28, 2019, and the Federal Court dismissed GoI’s leave to appeal.
The Company has also filed for the enforcement of the Partial Award and Final Award before the Delhi High Court. The matter is next listed for hearing on September 26, 2022.
In connection with the above matter, the Company has received an order dated October 22, 2018, from the GoI directing oil marketing companies (OMCs) who are the offtakers for Ravva to divert the sale proceeds to Government’s account. GoI alleges that the Ravva Joint Operations (consisting of four joint venture partners) has short paid profit petroleum of 15,890 million ($ 216 million) (the Company share approximately 4,691 million ($ 64 million). Against an interim application, filed by Vedanta Limited along with one its other joint venture partner, seeking stay of such action from GoI, before the Delhi High Court, where enforcement petitions for the matter is pending, the Court directed the OMCs to deposit above sums to the Court. However, Vedanta Limited (and other joint venture partner) has been given the liberty to seek withdrawal of the proportionate amounts (fallen due as of the date of Court order) from the Court upon furnishing a bank guarantee of commensurate value.
₹
₹
The Delhi High Court vide its order dated May 28, 2020, has directed that all future sale proceeds of Ravva Crude with effect from June 5, 2020, be paid directly to Vedanta Limited by the OMCs. In connection with the proceedings on the above matters, GoI has also filed an interim application seeking deposit by the said OMCs towards interest on the alleged short payment of profit petroleum by the petitioner (i.e. the Company and the other joint venture partner). The interim application filed by GoI and the matter in respect of the ONGC Carry has been listed for hearing on September 26, 2022.
While the Company does not believe the GoI will be successful in its challenge, if the Arbitral Awards in above matters are reversed and such reversals are binding, the Company would be liable for approximately 4,838 million ($ 64 million) plus interest as at March 31, 2022.
₹
| – | Proceedings, notices and enquires initiated by the Central Excise |
The Central Excise department of the GoI had issued in July 2010 an 3,150 million ($ 42 million) along with interest of 88 million ($ 1 million) for the
ex-parte
notice for reversal of Cenvat credit of₹
₹
non-compliance
of Rules 4(5a) and 4(6) of the Cenvat Credit Rules, in respect ofnon-return
of job work challans for the period March 1, 2009 to September 30, 2009 within a stipulated time. In addition, it also alleged that we violated the advance license conditions from 2005 to 2009. In 2010, we filed four writ petitions (“WP”) no. 8123, 8135, 9744 and 9755 in the High Court of Madras against the Central Excise department. An associated contempt petition was also filed by us. All the above petitions were heard on July 29, 2010 and the High Court of Madras in relation to WP No. 8123 remanded the matter to be heard and determined afresh by a new set of officers of the Central Excise department. The High Court of Madras granted a stay in relation to WP No. 8135 in so far as relates to job work challan matter and until a fresh enquiry was made. Further, the High Court of Madras dismissed WP No. 9744 and 9755 and the contempt petition.The Central Excise department deputed the Assistant Commissioner of Central Excise to conduct an enquiry for the alleged 2 million ($ 0.03 million) which we have challenged before Tribunal on April 7, 2015 and the case has yet to be listed for hearing.
non-compliance
of Rules 4 (5a) and 4(6) of the Cenvat Credit Rules in respect ofnon-return
of job work challans. The Assistant Commissioner of Central Excise served a show cause notice on September 9, 2011. We filed a response before the Assistant Commissioner of Central Excise. After conducting a personal hearing, the Assistant Commissioner passed a favorable order on January 1, 2012 and dropped the entire demand for duty and interest. The department went into appeal before the Commissioner (Appeals) against this order, but the appeal was restricted only to the demand of interest. The Commissioner (Appeals) allowed the appeal on February 25, 2013 on the condition that interest would become applicable only in those cases where goods have not been sent back or cleared from the premises within 180 days from the date of dispatch from the Tuticorin unit. The verification whether any interest is payable or not has been completed and department raised the interest liability of₹
213
We filed two writ appeals no. 704 and 705 of 2011 in the High Court of Madras challenging the orders passed with respect to the writ petitions no. 8135 and 9744 of 2010. The writ petitions were admitted on August 1, 2011 and the Court ordered other party to maintain the status quo. In the meanwhile, the Commissioner of Customs, Tuticorin issued a show cause notice in January 2015 based on alleged violation of advance license conditions from 2005 to 2009 expressly mentioning that this show cause notice shall be kept pending and not be adjudicated unless and until directions are obtained from the High Court of Madras enabling such adjudication. We filed writ petition no. 626 of 2015 against this show cause notice, which was tied up with writ appeals no. 704 and 705 of 2011 and heard together. Thereafter, regular hearings took place in the High Court of Madras, and on March 12, 2015, the High Court of Madras gave an interim order, allowing one of the prayers in writ in form of injunction to the Directorate General of Foreign Trade actions in pursuit of the show cause notice received from customs department. During the course of the hearings, writ appeal no. 704 was withdrawn as it has become infructuous as it relates to the job work challan matter which has already been concluded. Writ appeal no. 705 of 2011 and writ petition no. 626 of 2015 were heard on March 11, 2016, and both were dismissed by the final judgment of the High Court of Madras dated August 1, 2016, as the High Court of Madras held that it did not find any impediment to customs authorities issuing show cause notice on the basis of materials gathered and input received from excise authorities. The High Court of Madras also required the Company to respond to the show cause notice dated January 13, 2015, within two weeks from receipt of the order and directed the Commissioner of Customs to conduct proceedings as expeditiously as possible. We have filed a SLP against the Madras High Court’s order before the Hon’ble Supreme Court on August 24, 2016. The stay hearing before the Hon’ble Supreme Court on the SLP, took place on April 21, 2017, wherein the Hon’ble Supreme Court held that the commissioner of customs, Tuticorin may pass a final order against the notice but that it had to be kept in sealed cover. During hearing before Commissioner of Customs on September 5, 2017, we requested for cross-examination of witnesses and make available certain relevant documents, which was denied. Thereafter, we have filed an appeal before the Customs, Excise and Service Tax Appellate Tribunal (CESTAT) against such rejection. On January 10, 2018, CESTAT allowed cross-examination of witnesses; however, our request to make available relevant documents was rejected. We filed CMA 649 and 650 of 2018 in the High Court of Madras, Madurai Division Bench challenging the order passed by CESTAT. We requested High Court of Madras to order Excise authorities to share the communication issued to Customs basis which SCN was issued by Customs. Hearing concluded on June 13, 2019, before High Court of Madras and judgement is reserved. Further, we have written a letter to Commissioner on June 14, 2019, requesting to keep adjudication proceedings in abeyance till receipt of High Court of Madras Order.
The High Court of Madras has pronounced the order wherein our request to share the communication issued to Customs by excise authority has been turned down. Meanwhile, cross examination of the witnesses has also been completed by Customs Commissioner, Tuticorin and final order has been passed but kept in sealed cover as per the directions of the Hon’ble Supreme Court. Matter will be listed before Hon’ble Supreme Court in due course.
| – | Petitions have been filed in the Rajasthan High Court relating to sales tax |
We have filed two writ petitions before the High Court of Rajasthan, seeking to quash the two letters issued by Finance (Tax) department, Jaipur and to set aside the show cause notice issued by the Rajasthan Sales Tax Department, demanding Rajasthan VAT on sales of crude oil alleging that the sales are intra-state sale (as opposed to an inter-state sale). The matter was last heard on May 17, 2016 and the judgement dated July 13, 2016 allowed our petition and held that sale of crude oil should be regarded as interstate sale subject to central states tax and that Rajasthan VAT should not be applicable. Subsequently, the Rajasthan Sales Tax Department filed an appeal before the division bench of the High Court of Rajasthan on September 9, 2016, challenging the previous order. On April 4, 2018, division bench dismissed the petition filed by the Rajasthan Sales Tax Department. Thereafter, the Rajasthan Sales Tax department has filed an SLP before Hon’ble Supreme Court against the judgment of the Division Bench of the Rajasthan High Court, the said SLP of the department was dismissed due to failure of the department to cure the defects in filing despite specific order from the Hon’ble Supreme Court. However, on the request of Rajasthan Sales Tax Department, the SLP has been restored vide order dated July 5, 2019, and on February 13, 2020, all the defects have been removed. The matter was admitted on February 28, 2020. For hearing on merit, matter will be listed in due course.
| – | Proceedings related to the imposition of entry tax |
Vedanta Limited and other Group companies i.e. Bharat Aluminium Company Limited (BALCO) and Hindustan Zinc Limited (HZL) challenged the constitutional validity of the local statutes and related notifications in the states of Chhattisgarh, Odisha and Rajasthan pertaining to the levy of entry tax on the entry of goods brought into the respective states from outside.
Post some contradictory orders of High Courts across India adjudicating on similar challenges, the Hon’ble Supreme Court referred the matters to a nine-judge bench. Post a detailed hearing, although the bench rejected the compensatory nature of tax as a ground of challenge, it maintained status quo with respect to all other issues which have been left open for adjudication by regular benches hearing the matters.
Following the order of the nine-judge bench, the regular bench of the Hon’ble Supreme Court proceeded with hearing the matters. The regular bench remanded the entry tax matters relating to the issue of discrimination against domestic goods bought from other States to the respective High Courts for final determination but retained the issue of jurisdiction for levy on imported goods, for determination by the regular bench of the Hon’ble Supreme Court. Following the order of the Hon’ble Supreme Court, the Group filed writ petitions in respective High Courts.
214
On October 9, 2017, the Hon’ble Supreme Court has held that states have the jurisdiction to levy entry tax on imported goods. With this Hon’ble Supreme Court judgment, imported goods will rank pari passu with domestic goods for the purpose of levy of Entry tax. Vedanta Limited and its subsidiaries have amended their appeals (writ petitions) in Odisha and Chhattisgarh to include imported goods as well. With respect to Rajasthan, the State Government has filed a counter petition in the Rajasthan High Court, whereby it has admitted that it does not intend to levy the entry tax on imported goods.
The issue pertaining to the levy of entry tax on the movement of goods into a Special Economic Zone (SEZ) remains pending before the Odisha High Court. The Group has challenged the levy of entry tax on any movement of goods into SEZ based on the definition of ‘local area’ under the Odisha Entry Tax Act which is very clear and does not include a SEZ. In addition, the Government of Odisha further through its SEZ Policy 2015 and the operational guidelines for administration of this policy dated August 22, 2016, exempted the entry tax levy on SEZ operations.
Hindustan Zinc Limited has opted for RJ Amnesty Scheme and settled its demand by making a payment of 1,342 million ($ 18 million) against total claims of 2,000 million ($ 26 million).
₹
₹
The total claims against Vedanta Limited and its subsidiaries are 14,120 million ($ 193 million) and 13,592 million ($179 million) net of provisions made as of March 31, 2021, and March 31, 2022 respectively.
₹
₹
– | Writ petition filed in the Hon ’ ble Supreme Court by Cairn India Limited (now Vedanta Limited - oil and gas business) relating to extension of tenure of the PSC for the RJ block |
Vedanta Limited filed a writ petition before the High Court of Delhi against the MoPNG, the DGH and ONGC regarding the extension of the tenure for the RJ block PSC for the RJ block.
The RJ block PSC was valid until May 14, 2020. Consistent with the terms of the RJ block PSC, given that the RJ block is also producing natural gas, Vedanta Limited has been requesting an extension of the tenure of the RJ block PSC for a period of up to 10 years, i.e., until May 14, 2030.
In view of MoPNG’s delay, a writ petition was filed by Cairn India (now Vedanta Limited - oil and gas business) on December 11, 2015, seeking relief from the High Court of Delhi.
The High Court of Delhi on May 31, 2018, allowed the writ petition, directing GoI to extend the RJ block PSC for a period of ten years beyond the current contract term in accordance with Article 2.1 of the RJ block PSC on the same terms and conditions. The GoI appealed the decision of the Single Bench before the Division Bench High Court of Delhi.
On directions of the Division Bench in an application filed by Vedanta Limited, the GoI granted its approval for a
ten-year
extension of the RJ block PSC pursuant to its letter dated October 26, 2018, under thePre-NELP
Extension Policy, subject to certain conditions.The matter was decided vide order dated March 26, 2021, when the High Court of Delhi has allowed the appeal of GoI against the single judge order. While the Company has challenged the Judgement of the Division Bench of High Court of Delhi before the Hon’ble Supreme Court vide its SLP filed on June 30, 2021, the Company has paid additional 10% Profit Petroleum to the GoI w.e.f. May 15, 2020, in absence of any stay on the same. We have filed application for amendment of SLP to bring additional grounds and question of law on March 8, 2022. Also, we have filed application seeking interim relief on March 8, 2022. On May 18, 2022, Company had made an oral submission before the Hon’ble Supreme Court seeking urgent listing of the matter. The matter is to be heard in due course.
– | Writ petition filed in the High Court of Delhi by Cairn India Limited (now Vedanta Limited - oil and gas business) relating to export of crude oil from RJ Block |
Cairn India Limited (now Vedanta Limited - oil and gas business) has filed a writ petition before the High Court of Delhi against the Directorate General of Foreign Trade (“DGFT”), the MoPNG, and Indian Oil Corporation Limited (“IOCL”) for the export of crude oil from the RJ Block.
Due to its nature and composition, RJ Block crude has the potential to be valued higher by refineries in other markets, beyond the prices being received from the GoI nominated buyers, and other domestic, private refiners. Since 2009, Cairn India Limited (now Vedanta Limited - oil and gas business) has been receiving bids from international buyers and refiners offering prices that are an additional $
3-4
per bbl more than the domestic sale prices for RJ Block crude.In accordance with the provisions of the RJ Block PSC and the applicable GoI policies for crude oil export, Cairn India Limited (now Vedanta Limited - oil and gas business) repeatedly requested IOCL and MoPNG to allow it to export RJ Block crude oil, to which there has been no firm response. Cairn India Limited (now Vedanta Limited - oil and gas business) also made written requests to the DGFT to intervene in the matter, which again proved unsuccessful.
In view of the aforesaid, Cairn India Limited (now Vedanta Limited - oil and gas business) filed a writ petition in the High Court of Delhi on December 11, 2015, to obtain relief in the form of orders to the DGFT, MoPNG and IOCL for approvals and authorizations to permit and facilitate the export of RJ Block crude oil, to the extent GoI nominated buyers are unable to cover the entire production. Through its order dated December 14, 2015, the High Court of Delhi ordered the MoPNG, DGFT and IOCL to obtain necessary instructions on whether the GoI was willing to pick up the entire crude oil production from the RJ Block, or in the alternative was ready to grant permission to Cairn India Limited (now Vedanta Limited - oil and gas business) to directly export the crude oil not covered by the GoI nominees.
215
On October 18, 2016, the Delhi High Court set aside the writ petition. Cairn India Limited (now Vedanta Limited - oil and gas business) filed an appeal against the said order before the division bench of the High Court of Delhi which was also dismissed on November 28, 2018. Vedanta Limited has now filed a SLP before the Hon’ble Supreme Court against the dismissal of the writ petition by the Delhi High Court. The matter was heard on April 22, 2019, by the Hon’ble Supreme Court and the court directed that notice be issued to GoI and has given four weeks’ time to GoI to revert with its response, post which the matter will be listed for hearing to decide upon the admission of the SLP. No reply was filed by GoI. Vedanta Limited on December 21, 2021, filed a petition to withdraw the SLP. On February 16, 2022, Vedanta Limited filed an application for urgent listing of petition for withdrawal of SLP which will be heard in due course.
Cairn DGH arbitration issue
The GoI granted its approval for a
ten-year
extension of the RJ block PSC vide letter dated October 26, 2018, under thePre-NELP
Extension Policy, subject to certain conditions. The conditions relate to the completion of certain (i) technical activities in the RJ block before the expiry of the primary tenure of the RJ block PSC, (ii) prescribes mechanism and criteria for exploration cost recovery, (iii) submission of audited accounts/end of year statements and (iv) payment against any amounts due on account of audit observations. The GoI has subsequently on December 3, 2019, removed the condition of the submission of audited accounts as imposed under the letter of extension dated October 26, 2018.In connection with one of the conditions for the RJ block PSC extension, the DGH raised certain queries on May 12, 2020, relating to the notification of certain audit exceptions raised for fiscal year 2016 to 2017 relating to the share of Vedanta Limited and its subsidiary. Vedanta Limited has disputed these queries together with the other audit exceptions for fiscal years 2016 to 2018 on the basis that such audit findings and exceptions are not in accordance with the RJ block PSC nor are they sustainable and thereby do not prevail nor result in the creation of any liability on Vedanta Limited and its subsidiary. Vedanta Limited is of the belief that it has reasonable grounds to defend its proposition and which are further supported by independent legal opinions on the same. Vedanta Limited had proposed for the relevant issues pertaining to these audit findings and exceptions to be referred for expert determination in accordance with the provisions of the RJ block PSC. On May 14, 2020, Vedanta Limited invoked the dispute resolution process in accordance with the RJ block PSC process and issued notice for arbitration to which the GoI has responded on June 29, 2020. The arbitration tribunal stands constituted and Vedanta Limited also filed its application for interim relief. The interim relief application was heard by the Tribunal on December 15, 2020, wherein it was directed that GoI should not take any coercive action to recover the disputed amount of audit exceptions which is presently in arbitration and that during the arbitration period, GoI should continue to extend the tenure of the RJ block PSC on terms of current extension. The GoI has challenged the said order before the Delhi High Court and the matter is to be heard in due course. The GoI has also filed application before the Tribunal objecting to its jurisdiction to decide issues arising out of or relating to the PSC extension policy dated April 7, 2017, the Office Memorandum dated February 1, 2013, as amended and audit exceptions notified for FY
2016-18.
Vide its order dated September 23, 2021. the Tribunal dismissed the motion and ordered costs in favour of VL and CEHL. The costs are not payable until the end of the arbitration or further order in the meantime. Vedanta Limited has also filed an application seeking directions from the Delhi High Court to direct GoI to not link the PSC extension with the wrongful demand under the audit exceptions and to extend the PSC for 10 years without insisting upon a payment of disputed dues which have been already referred to arbitration. This application was heard briefly on April 12, 2022, and notice has been issued. GOI has filed its reply on May 13, 2022. Vedanta Limited has filed it’s Rejoinder to GoI’s Reply on May 20, 2022.Separately, on September 23, 2020, GoI filed an application for interim relief before Delhi High Court seeking payment of all disputed dues. The Delhi High Court has not passed any order against any of the parties and the matter is to be heard in due course
– | Proceedings related to the steel operations CTO revocation by MoEF &CC |
ESL’s CTO the greenfield integrated steel plant at Bokaro was not renewed by the JSPCB following its expiry in December 2017. A writ petition was filed by ESL before High Court of Jharkhand against the orders issued by the JSPCB of rejecting ESL’s application for the renewal of its CTO. The MoEF&CC issued an order on September 20, 2018, revoking the environmental clearance of ESL which was also challenged before the High Court of Jharkhand in a separate writ petition. The High Court of Jharkhand granted a stay against orders on MoEF&CC (in relation to the revocation of environmental clearance and JSPCB and allowed the plant operations to continue till the next date of hearing and also allowed ESL to apply for statutory clearance without prejudice to its rights and contentions. Pursuant to this order ESL has applied for forest diversion proposal on October 4, 2018, without prejudice to its rights and contentions. On September 16, 2020, the High Court of Jharkhand passed an order that the plant operations were to continue only until September 23, 2020. ESL filed a special leave petition before the Hon’ble Supreme Court and in an urgent hearing on September 22, 2020, the Hon’ble Supreme Court granted ESL a stay of the aforementioned order and granted ESL permission to continue operating the plant until further orders from the Hon’ble Supreme Court.
ESL filed a petition to the High Court of Jharkhand petition, challenging some alleged violations by ESL on the terms of reference. However, an application has been filed for withdrawal of the petition challenging the term of reference condition as the EAC was unable to proceed with recommendation of the EC due to pendency of the case.
216
ESL made an application for restoration/revision of environmental clearance, which is pending consideration of MoEF & CC. On December 17, 2019, ESL’s Forest Diversion Proposal received Stage I clearance from the Forest Advisory Committee. On August 25, 2020, ESL was granted a term of reference to complete the process of EC for 3 mtpa plant. In compliance with the terms of reference conditions, the regional pollution control board filed a complaint for violation of environment protection act, and the district court has taken cognisance of the offence. ESL is defending the cognisance and an appeal has been filed. Separately, the public hearing relating to the grant of environmental clearance was concluded in favour of ESL. Further, the EAC held a meeting on July 29, 2021, and recommended the grant to EC to ESL subject to certain conditions, including the forest clearance.
The MoEF&CC vide its letter dated August 25, 2021, rejected “as of now” the grant of EC to ESL due to stay on the standard operating procedure for identification and handling of violation cases under Environmental Impact Assessment, 2006 notification issued by MoEF&CC on July 7, 2021, for violation cases by Madras High Court (Madurai Bench). However, it was clarified that once the aforesaid standard operating procedure is upheld or stay is vacated, the recommendation will be considered without going to the EAC again. An interlocutory application was filed in the pending Hon’ble Supreme Court matter against the rejection of the environmental clearance on as of now basis due to the stay on the aforesaid standard operating procedure. The Hon’ble Supreme Court pronounced the judgment on December 9, 2021 (special leave petition along with the interlocutory application) and passed the following: (i) the special leave petition was granted, (ii) the impugned order passed by Madras High Court was set aside, and (iii) the MoEF&CC was directed to process the environmental clearance application of ESL according to the applicable law within a period of three months. MoEF&CC vide its letter dated February 2, 2022, has deferred the grant of EC till Forest Clearance
Stage-II
is granted to ESL. ESL has submitted its reply against MoEF&CC letter vide letter dated February 11, 2022, for reconsidering the decision and not linking EC with FC since as per the applicable law and available precedents, grant of FC Stage – II is not a condition precedent for grant of EC. Discussions are ongoing with MoEF&CC.– | Proceedings in respect of claim of Operational Creditors |
The resolution plan submitted by Vedanta Limited for the acquisition of ESL under the IBC was approved by NCLT, Kolkata with nil payment to Operational Creditors. The Operational Creditors unsuccessfully challenged NCLT’s approval of the plan before the NCLAT before approaching the Hon’ble Supreme Court in a further appeal.
The Hon’ble Supreme Court vide its order dated November 27, 2019, without staying the implementation of the resolution plan, remanded the matter back to NCLT, Kolkata for it to assess solely on the issue of whether the matter should be sent back to the Committee of Creditors to reconsider nil payment to all Operational Creditors. The Operational Creditors filed applications in this matter to which we have submitted our reply.
The NCLT, Kolkata has passed a final order whereby the matter has been disposed off and wherein it was observed that to balance the interests of all the stakeholders, the payments to the various classes of Operational Creditors who have been paid nil value, needs to be reassessed and re-considered by the Committee of Creditors.
– | Proceedings relating to the cost pass through for installation and operation costs of flue gas desulphurization (“FGD”) |
MoEF&CC issued Environment (Protection) Amendment Rules 2015 vide notification dated December 7, 2015, to implement new emission norms including regulation of sulphur and nitrogen oxide emissions in all thermal power plants in India. The timeline for TSPL to implement these norms as notified by CPCB was December 31, 2019. TSPL approached PSPCL since additional costs under change in law are payable by PSPCL as per the PPA, but no positive response was received from PSPCL. Thereafter, TSPL filed a petition before PSERC regarding approval and consequent tariff adjustment due to change in law event. PSERC passed an adverse order in the matter considering that the said notification is not a change in law event. TSPL thereafter filed an appeal before APTEL. The amounts involved for the capital cost of installation and operation of the FGD units are estimated at 10,000 million ($ 131.80 million) and a recurring 700 million ($ 9.22 million) per year.
₹
₹
APTEL vide order dated August 28, 2020, has approved the said notification including installation and operation of FGD and associated system for Sulphur Dioxide (“SO2”) emissions as well as installation and operation of SNCR and/or any other appropriate technology for NOx emissions as a change in law event as per the PPA. It has further stated that TSPL is entitled for additional expenditure for installation and operation of FGD and associated systems including all allied cost like taxes, duties etc. as a part of Additional Capital Cost to be incurred by TSPL and has directed the Commission to devise a mechanism for payment of above mentioned costs and other expenses in relation to procurement, installation, commissioning, operation and maintenance of FGD for SO2 as approved by the concerned authority, after prudence check. Further, TSPL has filed a caveat before Hon’ble Supreme Court. PSPCL has now filed an appeal from the order of the APTEL before the Hon’ble Supreme Court. The appeal was listed before the Hon’ble Supreme Court on February 3, 2022, wherein notice was issued, and parties were asked to file counter affidavits. The matter is yet to be listed.
In the meantime, TSPL has applied to the Central Pollution Control Board (“CPCB”), Ministry of Power and the Central Electricity Authority (“CEA”) to grant an extension of the deadline to implement new emission norms. Separately, the Punjab State Government has also written to the central government requesting for extension of deadline for power plants in Punjab including TSPL’s plant. Further, the Hon’ble Supreme Court in a related matter, has also recorded the submissions made by the central government as well as the affidavits filed by various power plants that a more feasible date for FGD installations would be December 2022.
The State Pollution Control Board (“SPCB”) had issued a show cause notice dated November 21, 2019, for
non-compliance
of directions issued by CPCB u/s 5 of the Environment (Protection) Act, 1986 and accorded a personal hearing to TSPL. Upon TSPL’s hearing submission the SPCB vide its letter dated November 27, 2019, disposed of the said show cause notice with recommendations to the CPCB to accept TSPL’s request for granting the extension for the installation of the FGD up to December 31, 2022.217
Later, on January 31, 2020, the CPCB issued a show cause notice for 1.8 million per unit per month ($ 0.02 million) for
non-compliance
with its directions u/s 5 of Environment (Protection) Act, 1986. TSPL has replied to the notice and submitted that the timelines issued were not feasible in nature as technical specifications were issued only in June 2018. TSPL, in its reply, has also requested for an extension of timeline for installation of FGD till December 31, 2022. CPCB vide its letter dated May 8, 2020 (received on June 3, 2020) has levied an Environmental Compensation of₹
non-compliance
to emission norms. On June 5, 2020, TSPL responded to the notice requesting CPCB to revoke the said notice and grant time extension. However, TSPL has deposited an environmental compensation of five months to the CPCB in protest.Further, pursuant to a notice dated October 16, 2020, and a corrigendum dated November 4, 2020, CPCB has extended the timeline for installing the FGD to February 28, 2021, for Unit 1 and December 31, 2020, for Unit 2 and October 31, 2020, for Unit 3. TSPL has also requested CPCB to refund the compensation paid by TSPL and grant timeline extension of 30 months from the date of commencement of work of the FGD project.
TSPL has also filed an application for impleadment in the case of M.C. Mehta v UOI & Ors. and an application for directions before the SC for providing ad interim stay on the compensation and grant timeline extension for installation of FGD which is yet to be listed.
TSPL is in the process of retendering for FGD Project. However, as per the notification issued by MoEF&CC dated March 31, 2021, the timeline for complying with the emission norms has been extended to December 31, 2024. TSPL has vide letter dated April 14, 2021, October 14, 2021, and December 31, 2021, requested CPCB to refund us the compensation paid by TSPL for the months of May 2020 to September 2020.
– | Arbitration proceedings related to ONGC’s obligation to share contract costs in respect of the Rajasthan Block PSC. |
The dispute pertains to inter-party issues between ONGC, Vedanta Limited (“Operator”) and Cairn Energy Hydrocarbons Limited (“CEHL”) (ONGC, Vedanta Limited and CEHL collectively referred to as “Contractor Parties”) in relation to key components of the parties’ contractual relationships, including their respective right to recover Contractor’s Contract Costs incurred as a result of Petroleum Operations and ONGC��s contractual obligation to contribute its Participating Interest (“PI”) share of such costs in the RJ Block and the subsequent finalization of accounts for the RJ Block. GoI has taken the position, among other things, that the Operator’s annual accounts and statements are not final. The same is due to the Contractor Parties’ divergent views on the RJ Block accounts and
non-adoption
of the accounts by the Management Committee (“MC”) of the RJ Block. The GoI has directed the Contractor Parties to “finalize Cost Oil”, in the absence of which disputed profit petroleum (“PP”) payments should be payable to GoI.These issues arise from the interpretation and application of the RJ Operating Agreement (“OA”), the RJ block PSC.
On March 1, 2019, Vedanta Limited served a notice of arbitration in accordance with the dispute resolution mechanism prescribed in the RJ block PSC and OA to ONGC and ONGC has responded to the same on April 12, 2019. The Arbitral Tribunal has been constituted in accordance with and pursuant to the RJ block PSC. The pleadings have been completed in the matter and evidential hearing concluded on January 28, 2022. Post hearing brief has been submitted by both the parties on April 4, 2022. Reply to post hearing briefs to be filed by both the parties by May 9, 2022.Final arguments concluded on May
30-31,
2022. Award is awaited.In parallel, on May 10, 2019, ONGC filed an interim application under Section 9 of the (Indian) Arbitration Act seeking interim relief before the High Court of Delhi claiming royalty from Vedanta Limited of approximately $ 394 million along with interest. The matter has been listed several times since May 2019 and no interim relief sought by ONGC had been granted. The matter is now listed on August 29, 2022.
– | Baker Arbitration |
Vedanta Limited had entered into two development contracts viz. Supply and Services, in 2018 with two Baker Hughes companies in the MBA fields in RJ block. On the notice of force majeure by Baker in respect of the services contract, Vedanta Limited as per its contractual right terminated the active call outs under the Services contract. There is a dispute between the parties relating to the amount payable towards outstanding dues as on the date of Termination and whether only active call outs under the Service Contract stand terminated or both contracts in entirety are terminated. Baker invoked arbitration under both the contracts in November 2020 and are claiming a total amount of $ 124 million from Vedanta Limited, which is disputed by Vedanta Limited. The Tribunal has been constituted. As per the Procedural Order, the Claimants have filed their Statement of Claim by March 25, 2022. Statement of Defence and Counterclaim has been filed by Vedanta Limited on July 12, 2022, which will be heard in due course.
– | GRIDCO Power purchase agreement amendment matter (Short supply issue) |
Vedanta Limited has set up a 4x600MW Thermal Power Plant (TPP) at Jharsuguda, Odisha. In the year 2012, Vedanta Limited executed a power purchase agreement (“PPA”) with GRIDCO vide Consolidated PPA dated December 19, 2012, whereby it was obligated to supply certain quantum of power from its TPP to GRIDCO. Thereafter, in 2015, Vedanta Limited had filed a petition before Orissa Electricity Regulatory Commission (“OERC”) seeking conversion of its 4 IPP units to Captive Generating Plants (“CGP’s”). The said prayer was partly allowed by OERC by its order dated January 27, 2016, and the parties were directed to make necessary changes to the PPA incorporating the directions thereof and submit the revised PPA for approval of the Commission.
Meanwhile, a meeting was held between the parties on November 1, 2016, whereby it was agreed inter alia that in case there is a shortfall in supply of power by Vedanta Limited to GRIDCO, then GRIDCO shall be entitled to levy penalty on Vedanta Limited at such rate as agreed in the minutes. In furtherance to the said MoM, GRIDCO started raising debit notes on Vedanta Limited for such shortfall in supply of power and has as such raised the debit notes on Vedanta Limited till the month of December 2019 amounting to a total value of 4,970 million ($ 65.51 million). Vedanta Limited has disputed these debit notes on various grounds.
₹
218
GRIDCO filed a petition in the year 2018 seeking amendment to the PPA in compliance with the OERC order dated January 27, 2016. However, GRIDCO further prayed for incorporation of a penalty clause in line with the minutes dated November 1, 2016. Vedanta Limited filed its preliminary reply inter alia submitting that there are certain issues which need to be resolved between the parties mutually and accordingly, the Commission may direct the parties to convene a meeting to sort out the issues and submit the revised PPA to the Commission for its approval.
The Commission was pleased to allow the aforementioned prayer and in furtherance to the same, a meeting was held between Vedanta Limited and GRIDCO in the presence of Director (RA), OERC on June 7, 2019. In the said meeting, certain modalities for payment of compensation by Vedanta Limited for short supply of power on the principle of no profit and no loss were agreed between the parties and minutes were signed. Therefore, the minutes dated November 1, 2016, stood superseded by the minutes dated June 7, 2019. However, subsequently GRIDCO disputed the said minutes as being
non-implementable
and raised additional issues as well.GRIDCO is not making payment of undisputed outstanding receivables of Vedanta Limited towards monthly energy bills on account of the fact that it has an alleged counter claim of 27,780 million ($ 368 million) towards debit notes being raised by it in accordance with the earlier minutes dated November 1, 2016. However, Vedanta Limited has disputed the said minutes and has also maintained that these minutes stand superseded by minutes dated June 7, 2019, which were signed between both the parties in presence of Director (RA), OERC. In fact, Vedanta Limited in its preliminary reply had also sought a direction from OERC seeking payment of 100% payment of undisputed invoices and at least 75% of disputed invoices as per the provisions of the PPA. Post signing of minutes dated June 7, 2019, we have also submitted before the Commission that we are committed to comply with the modalities agreed in the said minutes. The total receivables of Vedanta Limited as on March 31, 2022 stands at 12,926.88 million ($ 170.38 million).
₹
₹
The final hearings in the matter were concluded on October 15, 2019. The OERC passed its final order on June 22, 2020 wherein Vedanta Limited and GRIDCO have been directed to amend the PPA in line with the terms laid out by the OERC. Additionally, OERC has directed GRIDCO to reconcile the arrear amounts due to Vedanta Limited and settle the payments within two months from date of the judgement. The reconciliation is still going on with GRIDCO.
On August 25, 2020, Vedanta Limited also filed a limited appeal before the APTEL in respect of certain limited issues arising out of the June 22, 2020 OERC Order and the pleadings are completed. The matter was admitted on March 22, 2022 and next date of listing is awaited. GRIDCO has filed an appeal before APTEL against the order dated June 22, 2020 on April 7, 2022
Additionally, on September 18, 2020, GRIDCO filed an application for review of the June 2020 OERC Order before the OERC. Arguments in the matter had concluded on the review petition. Subsequently, OERC vide Order dated October 27, 2021 observed that issues raised by GRIDCO in review petition have been discussed in the impugned order and the present submissions made by GRIDCO in the review petition have already been considered by the Commission at different paragraphs of the impugned order and hence is dismissed.
– | Legal actions by Indian Income tax Authorities for additional income tax |
Income tax returns submitted by companies are subject to a comprehensive review and challenge by the tax authorities. There are appellate procedures available to both the tax authorities and taxpayers and it is not uncommon for significant or complex matters in dispute to remain outstanding for several years before they are finally resolved by the High Court or the Hon’ble Supreme Court. There are certain income tax legal proceedings which are pending against us. Potential liabilities, if any have been adequately provided for and interest and penalty, if any would be additional. The Company and certain of its operating subsidiaries have been issued demands by the income tax authorities, principally in respect of tax holidays and disallowances of expenditures relating to exempt income, amounting to 19,442 million and 13,589 million ($ 179 million) as of March 31, 2021 and March 31, 2022, respectively.
₹
₹
– | Legal actions by third parties, Indian sales tax, excise and related tax authorities for additional sales tax, excise and indirect duties |
The Group is subject to various claims and exposures which arise in the ordinary course of conducting and financing its business from the excise, indirect tax authorities and other authorities. These claims and exposures mostly relate to the assessable values of sales and purchases or to incomplete documentation supporting the companies’ returns or other claims. The approximate total value of claims against the Group is 47,820 million and 46,549 million ($ 614 million) as at March 31, 2021 and March 31, 2022 respectively.
₹
₹
– | NGT Matter |
Vedanta Limited (Div: Oil & Gas) was granted an EC by MoEF&CC dated April 19, 2019, for expansion of its capacity from 300,000 BOPD to 400,000 BOPD forBlock. The grant of the EC has been challenged by a local resident on the purported grounds that Vedanta Limited is causing pollution in the nearby areas in violation of the EC conditions and has made an application before the NGT (Central Zone) for the cancellation of the EC. Vedanta Limited has filed its reply against the Application along with documents refuting all allegations. The Applicant has filed rejoinder on April 18, 2022, and the matter was heard on May 23, 2022. On May 30, 2022, the matter was disposed off in favour of Vedanta Limited.
RJ-ON-90/1
219
– | Proceedings in relation to preliminary default notice issued by PSPCL |
PSPCL issued a Preliminary Default Notice dated September 15, 2021, to TSPL alleging Seller’s Event of Default under Article 14.1(iv) of the Power Purchase Agreement (“PPA”) on account of TSPL’s failure to achieve Average Availability of its Power Plant to the extent of 65% for the considered 12
non-consecutive
months within a continuous aggregate period of 36 months i.e., from September 2018 to August 2021.TSPL vide its interim reply dated September 17, 2021 read with detailed reply dated October 6, 2021 to the aforementioned notice communicated to PSPCL that there is no default by TSPL under Article 14.1(iv) of the PPA and the Preliminary default notice is based on incorrect interpretation of the PPA and wrongful consideration of the Availability declared by TSPL for the months of October 2020 and November 2020 among the 12
non-consecutive
months considered by PSPCL within the continuous aggregate period of 36 months i.e. from September 2018 to August 2021.TSPL submitted that during the months of October 2020 and November 2020, TSPL was technically fully available to generate power, however as a consequence of PSPCL’s failure in fulfilling its obligation under the PPA of arranging adequate quality and quantity of coal at TSPL’s project site for the generation of power, TSPL’s operational availability fell below 65% in the months of October 2020 and November 2020 and a complete shutdown of plant operation had to be forced upon by TSPL from October 20, 2020 till November 23, 2020 because of
non-availability
of coal at Project site.Also, TSPL relied on the judgements of APTEL dated April 7, 2016 passed in Appeals Nos. 56 and 84 of 2013 and dated July 19, 2021 passed in Appeal Nos. 317 and 220 of 2019, wherein it was held that the obligation to sign FSA and arrange adequate quality and quantity of coal for generation of power from TSPL’s Project is that of PSPCL.
Moreover, Punjab SLDC has been selective and discriminatory in its approach by not considering the actual declared capacity (DC) declared by TSPL for its Project during October and November 2020 and acted at the behest of PSPCL and issued the State Energy Account for October and November 2020 recording the DC of TSPL’s Power Plant based upon the quantum of power scheduled by PSPCL from the Power Plant of TSPL in the said months. By doing so Punjab SLDC has acted contrary to the terms of the PPA, Punjab Grid Code, IEGC 2010 and Tariff Regulations whereby it is recognized that it is Haha’s sole prerogative to declare DC and SLDC’s obligation to consider/accept the same.
TSPL has filed a petition along with applications for obtaining ad interim stay and urgency before PSERC seeking quashing and setting aside the Preliminary Default Notice dated September 15, 2021 issued by PSPCL alleging Seller’s Event of Default under Article 14.1(iv) of the PPA for the average availability of 12 months in non consecutive period of 36 months being below 65%.
The petition came up for hearing on February 9, 2022 wherein PSERC directed PSPCL to file reply to the petition and stay application within four weeks and directed TSPL to file its rejoinder within 2 weeks thereafter. Meanwhile the interim stay granted via order dated January 24, 2022 is extended till the next date of hearing.
The Petition was listed for hearing but adjourned on several occasions until July 13, 2022, when the matter was heard, and both the parties presented their arguments at length. Order has been reserved by the bench and the parties have been asked to file written submissions, if any.
– | Writ Petition against 12(1)(hh) notice received from Directorate of Mines and Geology |
On May 4, 2022, Vedanta Limited, Sesa Resources Limited, Sesa Mining Corporation Limited and Cosme Costa received notices from DMG under the provisions of Section 12(1)(hh) of the Mineral Concession Rules (Other than Atomic and other Hydrocarbon Energy Minerals) Concession Rules, 2016 directing the company to vacate the mining leases by June 6, 2022. The notice mentioned that vide order dated April 21, 2014 in Goa Foundation I, and order dated February 7, 2018 in Goa Foundation II, the mining leases of the notice receivers had expired. Further, it was also mentioned that the Hon’ble Supreme Court vide order dated January 30, 2020 in another matter granted a period of 6 months to the leaseholders to remove all the mineral ores lying on the mining leases as per clause 12(1)(gg) of MCR Rules, 2016. Vide order dated October 13, 2020 in Chowgule and Company Private Limited v. Goa Foundation, the Hon’ble Supreme Court granted time till January 2021 for the removal of mineral ore from the mining leases. A writ petition has been filed on behalf of Sesa Resources Limited on May 17, 2022 before the High Court of Bombay at Goa (WP 1115 of 2022), wherein, among other grounds, it was contended that the direction in Chowgule case was only for removal of mineral ore, and it cannot be extended to dispossession from the mining leases under Section 12(1)(hh). Further, the challenge to the constitutional validity of the Goa Daman and Diu Mining Concessions (Abolition and Declaration as Mining Leases) Act, 1987, which abolished the mining concessions and converted them to mining lease, is pending before the Hon’ble Supreme Court and until the constitutionality of the Abolition Act is upheld by the Supreme Court, no decision regarding the title of the mining leases can be taken as Sesa Resources Limited has been granted the concession in perpetuity by the Portuguese mining laws.
The first hearing in the WP 1115 of 2022 matter took place on May 18, 2022, wherein the High Court directed to list the matter on June 6, 2022. Respondents were directed to file their response by June 6, 2022. On June 6, 2022, one of the judges hearing the matter recused from the matter A new bench for hearing the matter was constituted. The captioned matters were taken up on June 17, 2022 by the new bench. Application for impleadment by Goa Foundation was allowed. High Court directed that the writ petition along with reply filed by the State Government of Goa be served on Goa Foundation. Goa Foundation was given two weeks of time to file their reply. The court directed the Petitioners to file Rejoinder before the next date of hearing. The matter was kept for further hearing on July 8, 2022. On July 8, 2022, the matter was part heard and is to be heard in due course.
Dividend Distribution Policy
Under Indian law, a company declares dividends (including interim dividends) upon a recommendation by its board of directors and approval by a majority of the shareholders at the annual general meeting of shareholders held within six months of the end of each fiscal year. However, while final dividends can be paid out by a company only after such dividends have been recommended by the board of directors and approved by shareholders, interim dividends can be paid out with only a recommendation by the board of directors, though such action is subject to subsequent sanction by the shareholders at the annual general meeting held within six months from the end of fiscal year. The shareholders have the right to decrease but not to increase the dividend amount recommended by the board of directors.
The Board of Directors may declare interim dividend during any financial year or at any time during the period from closure of financial year till holding of the annual general meeting out of the surplus in the profit and loss account or out of profits of the financial year for which such interim dividend is sought to be declared or out of profits generated in the financial year till the quarter preceding the date of declaration of the interim dividend.
220
Under the Companies Act, 2013, dividends in respect of a fiscal year may be paid out of the profits of a company in that fiscal year or out of the undistributed profits of previous fiscal years or both, after providing for depreciation in the manner provided for in the Companies Act, 2013. The Companies Act, 2013 and the Companies (Declaration and Payment of Dividend) Rules, 2014 provide that in the event of inadequacy or absence of profits in any year, a company may declare dividends out of its free reserves subject to the following conditions:
| • | The rate of dividend declared shall not exceed the average of the rates at which dividend was declared by it in the three years immediately preceding that year; |
| • | The total amount to be drawn from such accumulated profits shall not exceed one-tenth of the sum of itspaid-up share capital and free reserves as appearing in the latest audited financial statement; |
| • | The amount so drawn shall first be utilized to set off the losses incurred in the financial year in which dividend is declared before any dividend in respect of equity shares is declared; |
| • | The balance of reserves after such withdrawal shall not fall below 15.0% of its paid up share capital as appearing in the latest audited financial statement. |
The Company may, before the declaration of any dividend in any financial year, transfer such percentage of its profits for that financial year as it may consider appropriate to the reserves of the Company.
Dividends (including interim dividends) must be paid within 30 days from the date of the declaration and any dividend which remains unpaid or unclaimed after that period must be transferred within seven days from the date of expiry of the said period of thirty (30) days to a special unpaid dividend account held at a scheduled bank. We must transfer any money which remains unpaid or unclaimed for seven years from the date of such transfer to the Investor Education and Protection Fund established by the GoI.
As per Regulation 43A of the SEBI LODR Regulations, the top 500 listed companies shall formulate a dividend distribution policy. Accordingly, the policy was adopted to set out the parameters and circumstances that will be taken into account by the Board in determining the distribution of dividend to its shareholders and/or retaining profits earned by the Company. The dividend policy was revised and approved by the members of the Board on February 8, 2022. The policy is available on the website of the Company
www.vedantalimited.com.
Dividends paid to
non-resident
holders of ADSs are not subject to tax till March 31, 2020, in the hands of the recipient. However, the company that is distributing the dividend is liable to pay a “DDT” at the rate of 15.0% (on a gross basis) plus a surcharge of 10.0% and an education cess at the rate of 3.0%. According to the Finance (No. 2) Act, 2014, DDT is to be levied on gross distributable surplus amount instead of amount paid net of taxes. This resulted in an increase in the DDT to more than 20.0%, from 16.995% in the earlier years which was applicable to the dividends declared, distributed or paid on or after October 1, 2014. The Finance Act, 2018 increased the rate of cess from 3.0% to 4.0% which will result in an effective DDT rate of 20.6% from April 1, 2018. Under Section 115O(1A) of the Income Tax Act 1961, an Indian company, subject to certain conditions, can set off the dividend income received from its subsidiaries against the amount of dividend declared and distributed by it to its shareholders, therefore reducing the DDT to the extent of suchset-off.
Any distribution of additional ADSs or equity shares to resident or
non-resident
shareholders will not be subject to any Indian tax.Further the Finance Act 2016 has provided that any income earned by an individual, Hindu Undivided Family (“HUF”) or a firm, who is a resident in India, by way of dividend declared, distributed or paid by any domestic company in excess of 1 million in aggregate shall be chargeable to tax at the rate of 10.0% on gross basis on such amount exceeding 1,000,000. With the introduction of Finance Act 2017, this provision will be applicable only to specified assessees (specified assessee means a person other than domestic company, charitable trusts registered under section 12 A or 10 (23C) of the Finance Act 2017).
₹
₹
The Finance Act 2020 has repealed the DDT. Dividend received will be taxable in the hands of recipient. The remittance of dividends outside India is governed by Indian law on foreign exchange and is also subject to withholding tax at applicable rates effective from April 1, 2020.
Future dividends will depend on our revenue, cash flows, financial condition (including capital position) and other factors. ADSs holders will be entitled to receive dividends payable in respect of the equity shares represented by the ADSs. Cash dividends in respect of the equity shares represented by the ADSs will be paid to the depositary in Indian Rupees and, except as otherwise described under the deposit agreement governing the issuance of our ADSs, will be converted by the depositary into US Dollars. The depositary will distribute these proceeds to ADSs holders. The equity shares represented by the ADSs will rank equally with all other equity shares in respect of dividends. ADSs holders will bear all of the currency exchange rate risk of the conversion of any dividends from Indian Rupees to US Dollars, and a decline in the value of the Indian Rupees as compared to the US Dollar would reduce the US Dollar value of any dividends, we pay that are received by ADSs holders. During the year, the Company has remitted three separate dividend payouts of which there were No ADS holders during the 2
nd
and 3rd
interim dividend payout.1.
Dividend Payout
In every financial year, the Company aims to distribute to its equity shareholders:
| i. | The entire dividend income (net of taxes) it receives from its subsidiary, Hindustan Zinc Limited (this does not apply to any one-time special dividends received from Hindustan Zinc Limited which will be at the discretion of the Board); and |
| ii. | Minimum 30.0% (including taxes, cess, and levies, if any relating to the dividend) of attributable profit after tax (before exceptional items) of the Company excluding its share of profits in Hindustan Zinc Limited for the year. Such profits will be net of dividend payout to preference shareholders, if any. |
221
2.
While considering a dividend, the following financial parameters, and internal and external factors shall also be evaluated by the Board:
While considering dividend, the following financial parameters, and internal and external factors shall also be evaluated by the Board:
| • | Current financial year’s profits and retained earnings; |
| • | Availability of cash and liquid investments to pay dividends; |
| • | Deleveraging plans of the Company; |
| • | Capital expenditures and organic/ inorganic plans of the Company; |
| • | Contingency plans; |
| • | Company’s future prospects including its continued ability to sustain its profits; and |
| • | External factors such as uncertain or recessionary economic and business conditions, regulatory environment, prevailing and expected commodity prices in the market. |
3.
Circumstances under which the shareholders of the Company may or may not expect dividends:
Generally, it would be the Company’s policy to pay dividends in the manner specified above. However, the Board may not approve a dividend in certain situations such as:
| • | When the Company does not have any profits; |
| • | When there are prolonged strikes or lockouts, natural calamities, regulatory actions, major accidents or other events significantly impacting production volumes; |
| • | When prices of the Company’s products have fallen suddenly, impacting future profits in substantial manner, or |
| • | When the Company’s liquidity is jeopardized for any reason, impairing its ability to pay the dividend. |
4.
How retained earnings shall be utilized:
The retained earnings may be utilized either for business purposes mentioned in its Memorandum and Articles of Association or shall be distributed to the equity shareholders.
5.
Adoption of parameters for dividend payouts with respect to various classes of shares:
| • | Presently, the authorized share capital of the Company is divided into equity shares of ₹ ₹ |
| • | As and when the Company issues other kinds of shares, the Board may suitably amend this Policy. |
6.
Review of Policy
This policy will be reviewed periodically by the Board and if revised, the Company will announce such changes. This Policy is effective from fiscal year 2018.
The policy was reviewed and amended on February 8, 2022.
B. Significant Changes
Voluntary open offer
Vedanta Resources Limited (“the Acquirer”) together with Twin Star Holdings Limited (“PAC 1”), Vedanta Holdings Mauritius Limited (“PAC 2”) and Vedanta Holdings Mauritius II Limited (“PAC 3” together with PAC 1 and PAC 2 to be referred as “PACs”) in their capacity as the persons acting in concert with the Acquirer had:
| (i) | made a Public Announcement for the Voluntary Open Offer dated January 9, 2021 (“Public Announcement”) for acquisition of up to 371,750,500 Equity Shares representing 10% of the fully diluted voting share capital of Vedanta Limited (“Target Company”) from the Public Shareholders of Target Company; |
| (ii) | made a Corrigendum to the Public Announcement dated January 14, 2021; |
| (iii) | made a Detailed Public Statement for the Voluntary Open Offer dated January 14, 2021 (“DPS”), published on January 15, 2021; |
| (iv) | filed the Draft Letter of Offer dated January 19, 2021 (“DLOF”) with SEBI; and |
| (v) | made a Corrigendum to Detailed Public Statement and the Draft Letter of Offer dated February 17, 2021, published on February 18, 2021. |
222
The Acquirer and PACs had further made an Announcement cum Corrigendum to Public Announcement, Detailed Public Statement and the Draft Letter of Offer dated March 16, 2021, published on March 17, 2021, specifying the various developments/ amendments w.r.t the Offer including the upward revision of Offer price from160 per share to235 per share and upward revision of Offer size from 371,750,500 equity shares representing 10% of the Voting Share Capital to 651,000,000 equity shares representing 17.51% of the Voting Share Capital.
₹
₹
Further, the Acquirer and the PACs had made the Letter of Offer, along with the Form of Acceptance cum Acknowledgement (“LOF”) dated March 16, 2021, published on March 17, 2021 and the opening offer public advertisement dated March 20, 2021 (“Offer Opening Advertisement”) was published on March 22, 2021.
The above announcements were duly intimated to the Stock Exchanges, filed and submitted with SEBI and the Target Company within the prescribed timelines under Takeover Regulations.
Further, the recommendations of the Committee of Independent Directors (“IDC”) of Vedanta Limited pertaining to the said open offer was published on March 18, 2021 in accordance with the Takeover Regulations.
The tendering period for the said offer commenced from March 23, 2021 and closed on April 7, 2021.
The post offer advertisement dated April 20, 2021 was published on April 21, 2021 pursuant to and in compliance with the Takeover Regulations detailing the pre and post offer shareholding of the Acquirers, PACs and the Public.
Pursuant to the above offer, the Acquirer and PACs have acquired 374,231,161 equity shares of the Company representing 10.07% of fully diluted voting share capital, thereby increasing acquirer’s indirect shareholding in the Company from the current 55.1% to 65.2%.
Post the aforesaid voluntary open offer, the acquirer and PACs have acquired 167,500,000 equity shares of the Company representing 4.51% of fully diluted voting share capital, through a block deal on the stock exchanges thereby increasing acquirer’s indirect shareholding in the Company from 65.2% to 69.7%.
The Complete details in this regard can be accessed at
www.vedantalimited.com
.Acquisition of Athena Chhattisgarh Power Limited
Subsequent to the balance sheet date, the Company acquired controlling stake in Athena Chhattisgarh Power Limited (“ACPL”) under the liquidation proceeding of IBC for a consideration of5,647 million ($ 74 million). ACPL is building a 1200MW (2 Units*600MW) coal-based power plant located at Jhanjgir Champa district, Chhattisgarh. The plant is expected to fulfill the power requirement for the Company’s aluminum business.
₹
Levy of Special Additional Excise Duty
Subsequent to the balance sheet date, in oil and gas business, the GoI, vide its notification no. 05/2022 dated June 30, 2022 has levied Special Additional Excise Duty (SAED) of23,250 per tonne (approximately equivalent to $ 40 per barrel) on crude oil with effect from July 1, 2022, which has been revised to 17,000 per tonne (approximately equivalent to $ 30 per barrel) with effect from July 20, 2022. The SAED rate is expected to be revised every fortnight. This is in the nature of cess on windfall gain triggered by increase in crude oil prices over last few months. The Company is also engaging with the Government on this levy, within the framework of contractual agreements of PSC and RSC executed with the GoI.
₹
₹
The Company has performed sensitivity analysis to assess the impact of the above SAED on the fair value of assets in the oil and gas business which is determined basis the consensus of analyst recommendations of long term prices, discount rates, production quantity etc. Based on the results of such analysis, management believes that no adjustment to the carrying value of asset is required at this stage.
ITEM 9. | THE OFFER AND LISTING |
A. Offer and Listing Details
The ADSs of SIIL evidenced by American Depositary Receipts, or ADRs, commenced trading on the NYSE on June 20, 2007 at an initial offering price of $ 13.44 per ADS. The ADRs evidencing ADSs were issued by our Depositary, Citibank, N.A., pursuant to a deposit agreement. Our ADSs evidenced by ADRs, commenced trading on the NYSE, on September 9, 2013 at a price of $ 10.25 per ADS, after the
Re-organization
Transactions became effective on August 17, 2013.In July 2009, in connection with the offering of ADSs, each representing one equity share of par value 2, SIIL issued 131,906,011 new equity shares in the form of ADSs, at a price of $ 12.15 per ADS, aggregating approximately $ 1,603 million. Out of 131,906,011 equity shares, 41,152,263 equity shares were issued to Twin Star, which is a wholly owned subsidiary of Vedanta.
₹
As of July 15, 2022, our issued and paid up capital was 3,717,504,871 out of which 3,717,199,039 is listed with the exchanges. Out of our equity shares that were outstanding. after giving effect to the bonus issue and share split which includes 305,832 equity shares pending allotment as they are under dispute. All our equity shares are registered shares.
We have executed a Uniform Listing Agreement with the NSE and the BSE pursuant to the SEBI LODR Regulations. Subsequent to this, we are required to comply with certain regulations in addition to the requirements under the Companies Act, 2013. Our outstanding equity shares are currently listed and traded on the NSE and BSE in India. For information regarding conditions in the Indian securities markets, see
“Item 3. Key Information – D. Risk Factors – Risks Relating to Investments in Indian Companies, Global Economic Conditions and International Operations.”
223
The following table shows:
| • | the reported high and low trading prices for our ADSs in US dollars on the NYSE; and |
| • | the imputed high and low trading prices for our equity shares, translated into US dollars, based on the Indian Rupee prices for such equity shares as quoted in the official list of each of the NSE and BSE and the noon buying rate of the Federal Reserve Bank of New York on the last business day of each period presented: |
NYSE Price for ADS | Average NYSE daily ADSs share trading | NSE Price per Equity Shares | Average NSE daily Equity share trading | BSE Price per Equity Shares | Average BSE daily Equity share trading | |||||||||||||||||||||||||||||||
Fiscal year | High ($) | Low ($) | Volume | High ($) | Low ($) | Volume | High ($) | Low ($) | Volume | |||||||||||||||||||||||||||
2014 (1) | 13.59 | 4.76 | 537,824 | 3.56 | 1.17 | 6,757,850 | 3.55 | 1.17 | 947,611 | |||||||||||||||||||||||||||
2015 | 21.36 | 11.43 | 197,421 | 5.11 | 2.86 | 6,112,054 | 5.11 | 2.86 | 778,407 | |||||||||||||||||||||||||||
2016 | 14.43 | 3.52 | 226,508 | 3.52 | 0.88 | 12,085,613 | 3.52 | 0.88 | 1,483,779 | |||||||||||||||||||||||||||
2017 | 17.34 | 5.00 | 255,136 | 4.29 | 1.31 | 13,400,496 | 4.29 | 1.31 | 1,289,988 | |||||||||||||||||||||||||||
2018 | 21.99 | 13.78 | 481,231 | 5.46 | 3.34 | 10,521,105 | 5.46 | 3.35 | 882,330 | |||||||||||||||||||||||||||
2019 | 19.05 | 8.34 | 627,981 | 4.53 | 2.11 | 13,824,166 | 4.53 | 2.11 | 964,153 | |||||||||||||||||||||||||||
2020 | 11.18 | 3.24 | 675,972 | 2.59 | 0.80 | 13,907,340 | 2.59 | 0.80 | 806,054 | |||||||||||||||||||||||||||
2021 | 12.91 | 3.24 | 950,631 | 3.17 | 0.85 | 29,049,720 | 3.16 | 0.85 | 2,021,830 | |||||||||||||||||||||||||||
2022 | 20.14 | 11.23 | 1,286,279 | 5.51 | 2.76 | 16,362,221 | 5.51 | 2.76 | 1,214,113 | |||||||||||||||||||||||||||
2021 | ||||||||||||||||||||||||||||||||||||
1 st Quarter | 6.00 | 3.24 | 1,152,072 | 1.50 | 0.82 | 35,222,049 | 1.50 | 0.83 | 1,833,089 | |||||||||||||||||||||||||||
2 nd Quarter | 7.52 | 5.62 | 595,558 | 1.92 | 1.41 | 19,025,080 | 1.92 | 1.41 | 848,146 | |||||||||||||||||||||||||||
3 rd Quarter | 8.90 | 4.92 | 1,090,116 | 2.34 | 1.25 | 43,838,364 | 2.34 | 1.25 | 4,387,077 | |||||||||||||||||||||||||||
4 th Quarter | 12.91 | 8.65 | 968,775 | 3.17 | 2.19 | 18,652,576 | 3.16 | 2.19 | 1,028,380 | |||||||||||||||||||||||||||
2022 | ||||||||||||||||||||||||||||||||||||
1 st Quarter | 16.32 | 11.23 | 9,78,944 | 3.99 | 2.82 | 15,839,496 | 3.99 | 2.82 | 774,850 | |||||||||||||||||||||||||||
2 nd Quarter | 18.01 | 13.50 | 9,45,812 | 4.60 | 3.44 | 14,958,591 | 4.60 | 3.44 | 934,680 | |||||||||||||||||||||||||||
3 rd Quarter | 20.14 | 14.98 | 2,810,430 | 5.19 | 3.81 | 21,662,520 | 5.19 | 3.80 | 1,731,993 | |||||||||||||||||||||||||||
4 th Quarter | — | — | — | 5.51 | 4.05 | 12,860,518 | 5.51 | 4.05 | 1,407,111 | |||||||||||||||||||||||||||
2022 | ||||||||||||||||||||||||||||||||||||
January, 2022 | — | — | — | 4.79 | 4.12 | 12,080,639 | 4.79 | 4.11 | 2,874,098 | |||||||||||||||||||||||||||
February, 2022 | — | — | — | 5.11 | 4.27 | 11,620,737 | 5.11 | 4.27 | 606,589 | |||||||||||||||||||||||||||
March, 2022 | — | — | — | 5.51 | 4.66 | 14,784,003 | 5.51 | 4.67 | 772,382 | |||||||||||||||||||||||||||
April, 2022 | — | — | — | 5.76 | 5.19 | 7,521,108 | 5.76 | 5.19 | 543,887 | |||||||||||||||||||||||||||
May, 2022 | — | — | — | 5.31 | 3.60 | 15,752,343 | 5.31 | 3.61 | 1,052,462 | |||||||||||||||||||||||||||
June, 2022 | — | — | — | 4.12 | 2.73 | 16,096,317 | 4.14 | 2.72 | 894,962 | |||||||||||||||||||||||||||
July 15, 2022 | — | — | — | 2.99 | 2.60 | 16,875,661 | 2.99 | 2.60 | 941,603 | |||||||||||||||||||||||||||
| (1) | The first trading day on the NYSE was September 9, 2013, and, on the BSE and the NSE was August 27, 2013, since the Re-organization Transactions became effective. Since this date, the information relating to the high and low market prices and the average daily trading volumes of the ADSs, and the shares are of Vedanta Limited. |
B. Plan of Distribution
Not applicable
C. Markets
The American Depositary Shares (ADS) of the Company have been delisted from NYSE effective close of trading on NYSE on November 8, 2021. This follows the filing done by the Company of Form 25 with Securities and Exchange Commission on October 29, 2021. As a consequence of the delisting becoming effective, termination of the Deposit Agreement under which the ADS were issued has also become effective close of trading on NYSE on November 8, 2021. Refer Item no.4 History and Development of our Company. The said action has no impact on the current listing status or trading of the Company’s equity shares on BSE and NSE and our equity shares continue to be listed on the NSE with stock code VEDL and on the BSE with stock code 500295.
D. Selling Shareholders
Not applicable
E. Dilution
Not applicable
224
F. Expenses of the Issue
Not applicable
ITEM 10. | ADDITIONAL INFORMATION |
A. Share Capital
Not applicable
B. Memorandum and Articles of Association
General
Our Company Identification Number is L13209MH1965PLC291394. Our registered office is presently situated at 1st Floor, ‘C’ Wing, Unit 103, Corporate Avenue, Atul Projects, Chakala, Andheri (East), Mumbai—400093, Maharashtra, India. The register of members is maintained at the registered office of the Company, office of the Registrar and Share Transfer Agent i.e., KFin Technologies Limited (formerly known as KFin Technologies Private Limited) in Hyderabad.
The corporate legal framework governing companies in India has undergone a change with the enactment of the Companies Act, 2013 (including any statutory modifications/ amendments made thereto). The Companies Act, 2013 has replaced the Companies Act, 1956. Majority of the provisions of the Companies Act, 2013 have been notified.
Accordingly, the legal framework governing us is the Companies Act, 2013, and rules made thereunder and the SEBI Regulations including any statutory modifications/amendments. Various statutory authorities and departments of the GoI have also extended and granted several temporary relaxations on compliances requirements on account of the COVID – 19 pandemic. The summary below does not include details of such temporary relaxations.
Our activities are regulated by our Memorandum and Articles of Association. In addition to our Memorandum and Articles of Association, our activities are regulated by certain legislation, including the Companies Act, the Securities Contract Regulation Act and the Securities Contracts (Regulation) Rules, 1957, as amended.
Our Memorandum of Association permits us to engage in a wide variety of activities, including all of the activities that we are currently engaged in or intend to be engaged in, as well as other activities. Our objects are set out at clause 3 of our Memorandum of Association. Our Memorandum and Articles of Association were amended following the enactment of Companies Act, 2013.
Share Capital
Our authorized share capital is 74,120,100,000 divided into 44,020,100,000 Equity Shares of 1/- (Indian Rupees One only) each and 3,010,000,000 preference shares of 10/- (Indian Rupees Ten only) each.
₹
₹
₹
As of March 31, 2022, 3,717,504,871 equity shares, par value 1 per equity share, were issued and outstanding (including 305,832 equity shares which have been issued but pending allotment), of which Nil equity shares were held in the form of Nil ADSs.
₹
Changes in Capital or our Memorandum of Association and Articles of Association
Subject to the Companies Act, 2013, an ordinary resolution may be passed at any general meeting for which notice for the meeting is served within the required period. A special resolution requires that the votes cast in favour of the resolution, whether on a show of hands, or electronically or on a poll, as the case may be, by members who, being entitled so to do, vote in person or by proxy or by postal ballot, are required to be not less than three times the number of the votes, if any, cast against the resolution by members so entitled and voting. Some of the matters to be considered for special resolution includes alteration in articles of association, reduction in share capital, to approve variation of rights of special classes of shares, to issue further shares without
pre-emptive
rights tonon-members
or to convert loans or debentures into shares.The amendments in Companies Act 2013 provides that the items of business that were earlier required to be transacted by means of postal ballot, may be transacted at a general meeting by a company which is required to provide the facility to members to vote by electronic means under section 108, in the manner provided in that section.
The Company may at its discretion transact by means of a postal ballot in respect of any item of business, other than ordinary business and any business in respect of which directors or auditors have a right to be heard at any meeting.
Under our Articles of Association and pursuant to the applicable provisions of the Companies Act, 2013, the shares (including any shares forming part of any increased share capital of the company) shall be under the control of the Board of directors of the company, who may allot or otherwise dispose of the same to such persons in such proportion, on such terms and conditions and at such times as the directors think fit and subject to the sanctions of the shareholder in general meeting with full power, to give any person the option to call for or be allotted shares of any class of the company either (subject to the provisions of Section 52 and 53 of the Companies Act, 2013) at a premium or at a par such option being exercisable for such time and for such consideration as the directors thinks fit.
225
Directors
Under our Articles of Association, there is no provision for a director to hold any qualification shares. According to the Companies Act, 2013, the age limit for retirement of whole-time directors is 70 years, provided that appointment of a person who has attained the age of 70 years may be made by passing a special resolution in which case the explanatory statement annexed to the notice for such motion shall indicate the justification for appointing such person. In case where no such special resolution is passed but votes cast in favour of the motion exceed the votes, if any, cast against the motion and the Central Government is satisfied, on an application made by the Board, that such appointment is most beneficial to the company, the appointment of the person who has attained the age of seventy years may be made. In addition, under the Companies Act, 2013 every listed entity is required to appoint at least one woman director. Further, the amended SEBI LODR Regulations, requires that the Board of top 500 listed entities shall have at least one independent woman director by April 1, 2019, and top 1000 listed entities by April 1, 2020. Subsequent to the amendment in SEBI LODR Regulations, no listed entity shall appoint a person or continue the directorship of any person as a
non-executive
director who has attained the age of seventy five years unless a special resolution is passed to that effect and the explanatory to the notice to justify the appointment with effect from April 1, 2019.Any director who is directly or indirectly interested in a contract or arrangement or proposed contract or arrangement entered into or to be entered into by us or on our behalf is required to disclose the nature of his interest at a meeting of the Board and such interested director shall not participate in any discussion of, or vote on, any contract, arrangement, or proposal in which he is interested. In addition, the company may advance any loan directly or indirectly, or provide any guarantee or security, directly or indirectly, in connection with any loans made by a third party, to our directors or any other concern where directors are interested subject to compliance with the applicable provisions. A director is required to disclose his personal interest to the board of directors on an annual basis and at the first meeting of the board of directors after the interest arises.
Alteration of Shareholder Rights
Pursuant to Section 48 of the Companies Act, 2013, and subject to the provisions of the articles of association of a company and the relevant rules as issued by the MCA, where the share capital of a company is divided into different classes of shares, the rights of any class of shareholders can only be altered or varied with the consent in writing of the holders of not less than three-fourths of the issued shares of that class or by a special resolution passed at a separate meeting of the holders of the issued shares of that class, or pursuant to a judicial order sanctioning a compromise or arrangement between the company and such class of shareholders.
General Meetings of Shareholders
There are two types of general meetings of shareholders, annual general meeting and extraordinary general meeting. We must convene our annual general meeting within 9 months from the date of closing of the first financial year of the Company and in any other case within a period of 6 months from the date of closing of the financial year and must ensure that the intervening period between two annual general meetings does not exceed 15 months. The Registrar of Companies may extend this period in special circumstances at our request. As per the amendments in SEBI LODR Regulations, the top 100 listed entity as per market capitalization shall hold AGM within a period of 5 months from the date of closing of financial year. Further
one-way
live webcast of the proceedings of the AGM is also required to be provided with effect from April 1, 2019. Extraordinary general meetings may be convened at any time by our directors at their discretion or at the request of our shareholders holding in the aggregate not less than 10.0% of ourpaid-up
capital as on that date which carries voting rights. A notice in writing or through electronic mode to convene a general meeting must set out the date, time, place and agenda of the meeting and must be provided to shareholders at least 21 days prior to the date of the proposed meeting. The requirement of the 21 days’ notice in writing may be waived if consent to shorter notice in writing or electronic mode is received provided that a general meeting may be called after giving shorter notice than that specified in thissub-section
if consent, in writing or by electronic mode, is accorded thereto-| (i) | in the case of an annual general meeting, by not less than ninety-five per cent of the members entitled to vote there at; and |
| (ii) | in the case of any other general meeting, by members of the company |
(a) Holding, if the company has a share capital, majority in number of members entitled to vote and who represent not less than ninety-five percent of such part of the
paid-up
share capital of the company as gives a right to vote at the meeting; or (b) having, if the company has no share capital, not less than ninety-five percent of the total voting power exercisable at that meeting: Provided further that where any member of a company is entitled to vote only on some resolution or resolutions to be moved at a meeting and not on the others, those members shall be taken into account for the purposes of this sub section in respect of the former resolution or resolutions and not in respect of the latter.Under the Companies Act, 2013, general meetings are to be held either at the registered office or at another place within the city, town or village in which the registered office is situated. Business may be transacted at a general meeting only when a quorum of shareholders is present. Thirty members personally present, entitled to attend and to vote on the business to be transacted, will constitute a quorum, if the number of members as on the date of the meeting is exceeding five thousand.
The annual general meetings deal with and dispose of all matters prescribed by our Articles of Association and by the Companies Act, 2013, including the following ordinary business matters:
| • | The consideration of our annual financial statements and report of our directors and auditors; |
| • | Appointment of directors in place of those retiring; |
| • | The appointment of auditors and the fixing of their remuneration; and |
| • | The approval of dividends. |
226
Division of Shares
The Companies Act, 2013 provides that a company may
sub-divide
its share capital if its Articles of Association authorize the company to do so by adopting an ordinary resolution in its general meeting.Our Articles of Association allow us in a general meeting to alter our Memorandum of Association and subdivide all or any of our equity shares into a larger number of shares with a smaller par value than originally fixed by the Memorandum of Association.
Dividends
Under the Companies Act, 2013, unless the board of directors recommends the payment of a dividend, the shareholders at a general meeting have no power to declare any dividend. The Board of Directors of a company may declare interim dividend during any financial year or at any time during the period from closure of financial year till holding of the annual general meeting out of the surplus in the profit and loss account or out of profits of the financial year for which such interim dividend is sought to be declared or out of profits generated in the financial year till the quarter preceding the date of declaration of the interim dividend. Provided that in case the company has incurred loss during the current financial year up to the end of the quarter immediately preceding the date of declaration of interim dividend, such interim dividend shall not be declared at a rate higher than the average dividends declared by the company during the immediately preceding three financial years. A company pays dividends recommended by the board of directors and approved by a majority of the shareholders at the annual general meeting of shareholders for the financial year. The shareholders have the right to decrease but not increase the final dividend amount. Listed companies are required to declare and disclose the dividends paid on a per share basis only. Dividends are generally declared per equity share and are to be paid and distributed in cash in proportion of the
paid-up
value of their shares. The Companies Act provides that shares of a company of the same class must receive equal dividend treatment. Dividends can be paid in cash or by cheque or in any electronic mode to the registered shareholder at a record date or book closure fixed on or prior to the annual general meeting or to his order or his banker’s order. No shareholder is entitled to a dividend while any lien in respect of unpaid calls on any of such shareholder’s shares is outstanding.These distributions and payments are required to be paid to shareholders within 30 days of the annual general meeting where the resolution for declaration of dividends is approved. The dividend so declared is required to be deposited in a separate bank account within a period of 5 days from the date of declaration of such dividend. All dividends unpaid or unclaimed within a period of 30 days from the date of declaration of such dividend must be transferred within 7 days of the end of such period to a special unpaid dividend account held at a scheduled bank. The company shall, within a period of 90 days of making any transfer of an amount to the unpaid dividend account, prepare a statement containing the names, their last known addresses, and the unpaid dividend to be paid to each person and place it on the website of the company and also on any other website approved by the Central Government for this purpose. Any dividend which remains unpaid or unclaimed for a period of seven years from the date of the transfer to an unpaid dividend account must be transferred along with interest accrued to the Investor Education and Protection Fund along with a statement containing such details. Also, all shares in respect of which unpaid or unclaimed dividends have been transferred shall also be transferred by the company in the name of this fund along with a statement containing such details as may be prescribed.
Under the Companies Act, 2013, dividends in respect of a fiscal year may be paid out of the profits of a company in that fiscal year or out of the undistributed profits of previous fiscal years or both, after providing for depreciation in a manner provided for in the Companies Act, 2013.
No dividend shall be declared or paid by a company for any financial year except out of the profits of the company for that year arrived at after providing for depreciation in accordance with the provisions of
sub-section
(2), or out of the profits of the company for any previous financial year or years arrived at after providing for depreciation in accordance with the provisions of thatsub-section
and remaining undistributed, or out of both provided that in computing profits any amount representing unrealized gains, notional gains or revaluation of assets and any change in carrying amount of an asset or of a liability on measurement of the asset or the liability at fair value shall be excluded.The Companies Act, 2013 and the Companies (Declaration and Payment of Dividend) Rules, 2015 provide that in an event of adequacy or absence of profits in any year, a company may declare dividend out of its reserves subject to the fulfillment of the following conditions, such as:
| (i) | If profits for that year are insufficient to declare dividends (including interim dividends), the dividends for that year may be declared and paid out from reserves on the following conditions: |
| • | The rate of dividend declared shall not exceed the average of the rates at which dividend was declared by it in the three years immediately preceding that year; |
| • | The total amount to be drawn from free reserves shall not exceed one-tenth of the sum of itspaid-up share capital and free reserves as appearing in the latest audited financial statement; |
| • | The amount so drawn shall first be utilized to set off the losses incurred in the financial year in which dividend is declared before any dividend in respect of equity shares is declared; and |
| • | The balance of reserves after such withdrawal shall not fall below 15.0% of its paid up share capital as appearing in the latest audited financial statement. |
| (ii) | No company shall declare dividend unless carried over previous losses and depreciation not provided in previous year or years are set off against profit of the company for the current year. |
The Company may, before the declaration of any dividend in any financial year, transfer such percentage of its profits for that financial year as it may consider appropriate to the reserves of the Company.
227
Voting Rights
Subject to any special terms as to voting on which any shares may have been issued, on voting by show of hands, every shareholder entitled to vote who is present in person (including any corporation present by its duly authorized representative) shall have one vote and in case of voting through poll, every shareholder present in person or by proxy shall have one vote for each share of which he is the holder. In the case of joint holders, the vote of the senior of the joint holders who tenders a vote, whether in person or by proxy, shall be accepted to the exclusion of the votes of the other joint holders.
Seniority is determined by the order in which the names appear in the register of members.
According to the Companies Act, 2013 and the SEBI LODR Regulations, effective December 1, 2015, for listed companies, voting at general meetings has to be done by remote electronic voting. For those shareholders who are unable to vote through this facility, the facility of physical voting through ballot papers/ electronic voting is provided at the meeting. Upon a poll, the voting rights of each shareholder entitled to vote and present in person or by proxy shall be proportionate to the capital
paid-up
on each share against our totalpaid-up
capital. In the case of a tie vote, the chairman of the meeting, who is generally the chairman of our Board of directors, has the right to cast atie-breaking
vote.A shareholder may appoint any person (whether or not a shareholder) to act as his proxy to vote on polls conducted at any meeting of shareholders (or of any class of shareholders) in respect of all or a particular number of the shares held by him. A shareholder may appoint more than one person to act as his proxy and each such person shall act as proxy for the shareholder for the number of shares specified in the instrument appointing the person a proxy. Any person appointed as proxy shall act on behalf of a shareholder not exceeding fifty members and holding in the aggregate not more than 10.0% of the total share capital carrying voting rights. The shareholder holding more than 10.0% of the total share capital of the Company carrying voting rights may appoint a single person as proxy and in that case, the person appointed as proxy for such shareholder cannot act as proxy for any other person or shareholder. The instrument appointing a proxy must be delivered to our registered office at least 48 hours prior to the meeting or in case of a poll, not less than 24 hours before the time appointed for taking the poll. If a shareholder appoints more than one person to act as his proxy, each instrument appointing a proxy shall specify the number of shares held by the shareholder for which the relevant person is appointed as his proxy. A proxy does not have a right to speak at meetings and not entitled to vote except on poll. A corporate shareholder is also entitled to nominate a representative to attend and vote on its behalf at general meetings. Such a representative is not considered a proxy and he has the same rights as the shareholder by whom he was appointed to speak at a meeting and vote at a meeting in respect of the number of shares held by the shareholder, including on a show of hands and a poll.
Subject to compliance with provisions of the Articles of Association, the Companies (Share Capital and Debentures) Rules, 2014, and the Companies Act, 2013, the Company is allowed to issue equity shares with different rights.
Quorum
Our Articles of Association provide that a quorum for a general meeting is at least thirty shareholders personally present, if the number of members as on the date of the meeting is exceeding five thousand, in accordance with the Companies Act, 2013.
Shareholder Resolutions
An ordinary resolution requires the affirmative vote of a majority of our shareholders entitled to vote in person or electronically or by proxy or by a poll at a general meeting.
A resolution shall be a special resolution when, the intention to propose the resolution as a special resolution has been duly specified in the notice calling the general meeting or other intimation given to the members of the resolution. A special resolution requires the affirmative vote of not less than three times the number of the votes, if any cast against the resolution by members so entitled and voting in person or electronically or by proxy at a general meeting and casting a vote. The Companies Act, 2013 provides that to amend the Articles of Association, a special resolution approving such an amendment must be passed in a general meeting. Certain amendments, including a change in the name of the company, to approve reduction of share capital, to approve variation of rights of special classes of shares, to issue further shares without
pre-emptive
rights tonon-members
or to convert loans or debentures into shares, to commence any new line of business and dissolution of the company require a special resolution.The amendments in Companies Act, 2013 provides that the items of business that were earlier required to be transacted by means of postal ballot, may be transacted at a general meeting by a company which is required to provide the facility to members to vote by electronic means under section 108, in the manner provided in that section.
The Company may at its discretion transact by means of a postal ballot in respect of any item of business, other than ordinary business and any business in respect of which directors or auditors have a right to be heard at any meeting.
228
Distribution of Assets on a
Winding-up
In accordance with the Companies Act, 2013, all surplus assets remaining after payments are made to employees, statutory creditors, tax and revenue authorities, secured and unsecured creditors and the holders of any preference shares (though not in that order), shall be distributed among our equity shareholders in proportion to the amount paid up or credited as
paid-up
on such shares at the commencement of thewinding-up.
Transfer of Shares
Under the Companies Act, 2013, the shares of a public company are freely transferable, unless such a transfer contravenes applicable law. The transferor is deemed to remain the holder until the transferee’s name is entered in the register of members.
In respect of electronic transfers, the depositary transfers shares by entering the name of the purchaser in its register as the beneficial owner of the shares. The beneficial owner is entitled to all the rights and benefits and is subject to the liabilities attached to the shares held by the depositary on his or her or its behalf.
Equity shares held through depositaries are transferred in the form of book entries or in electronic form in accordance with the regulations laid down by SEBI. These regulations provide the regime for the functioning of the depositaries and the participants and set out the manner in which the records are to be kept and maintained and the safeguards to be followed in this system.
SEBI requires that trading and settlement of our equity shares to be in book-entry form for all investors, except for transactions that are not made on a stock exchange and transactions that are not required to be reported to the stock exchange. Transfers of equity shares in book-entry form require both the seller and the purchaser of the equity shares to establish accounts with depositary participants appointed by depositaries established under the Depositories Act, 1996. Charges for opening an account with a depositary participant, transaction charges for each trade and custodian charges for securities held in each account vary depending upon the practice of each depositary participant.
The depositary transfers equity shares by entering the name of the purchaser in its books as the beneficial owner of the equity shares. In turn, we will enter the name of the depositary in our records as the registered owner of the equity shares. The beneficial owner is entitled to all the rights and benefits as well as the liabilities with respect to the equity shares that are held by the depositary. The register and index of beneficial owners maintained by our depositary is deemed to be a register and index of our members and debenture holders under the Depositories Act, 1996. For this purpose, we have entered into an agreement for depository services with the National Securities Depository Limited and the Central Depository Services (India) Limited through which the electronic form of Register of Member is maintained. The Finance Act, 2019 enumerates certain amendments to the Indian Stamp Act, 1899 which was effective from January 9, 2020, later deferred the implementation to July 1, 2020 on levying stamp duty related to issue and transfer of securities.
The requirement to hold the equity shares in book-entry form will apply to the ADSs holders when the equity shares are withdrawn from the depository facility upon surrender of the ADSs. In order to trade the equity shares in the Indian market, the withdrawing ADSs holder will be required to comply with the procedures described above.
Our Articles of Association provide for certain restrictions on the transfer of equity shares, including granting power to the board in certain circumstances, to refuse to register or acknowledge a transfer of equity shares or other securities issued by us. Under the SEBI LODR Regulations, in the event we have not affected the transfer of shares within 15 days or where we have failed to communicate to the transferee any valid objection to the transfer within the stipulated time period of 15 days, we are required to compensate the aggrieved party for the opportunity loss caused during the period of delay.
Further as per the provisions of the Companies Act, 2013 if a company without sufficient cause refuses to register a transfer of equity shares within a period of 30 days from the date on which the instrument of transfer or the intimation of transmission, as the case may be, is delivered to the Company, the transferee may within a period of 60 days of such refusal or where no intimation has been received from the Company, within 90 days of the delivery of the instrument of transfer or intimation of transmission, may appeal to NCLT.
The NCLT may, in its discretion, issue an interim order suspending the voting rights attached to the relevant equity shares before completing its investigation of the alleged contravention. If a person contravenes the order of the NCLT under Section 58 of the Companies Act, 2013, he shall be punishable with imprisonment for a term which shall not be less than one year but which may extend to three years and with fine which shall not be less than 100,000 but which may extend to 500,000.
₹
₹
In addition, the Companies Act, 2013 provides that the NCLT may direct a rectification of the register of members for a transfer of equity shares which is in contravention of Securities and Exchange Board of India Act, 1992, the Securities Contracts (Regulation) Act, 1956, upon an application by the company, a participant, a depository incorporated in India, an investor or SEBI.
Further, with effect from April 1, 2019, SEBI Regulations mandate that except in case of transmission or transposition of securities, requests for effecting transfer of securities shall not be processed unless the securities are held in the dematerialized form with a depository
229
Disclosure of Ownership Interest
Section 89 of the Companies Act, 2013 (the Companies Act) requires that beneficial owners of shares of companies who are not registered as holders of those shares must make a declaration to the company specifying the nature of his or her or its interest, particulars of the registered holder of such shares and such other particulars as may be prescribed. Failure by a person to comply with Section 89 will not affect the company’s obligation to pay any dividends to the registered holder of any shares in respect of which the declaration has not been made. For the purpose of this section beneficial interest in a share includes, directly or indirectly, through any contract, arrangement or otherwise, the right or entitlement of a person alone or together with any other person to (i) exercise or cause to be exercised any or all of the rights attached to such share; or (ii) receive or participate in any dividend or other distribution in respect of such share.
Any person, who fails to make a declaration without any reasonable cause, shall be punishable with fine which may extend to 50,000 and where such failure continues, a further fine be extended up to 1,000 may be levied for each day after the first day during which the failure continues. While it is unclear whether Section 89 applies to holders of ADSs of the Company, investors who exchange ADSs for the underlying equity shares of the Company will be subject to the restrictions under Section 89. The ADSs holders in addition are required to comply with the notifications and disclosures as per the deposit agreement between ADSs holders, the Company and the depository.
₹
₹
A significant beneficial owner in relation to a reporting company means an individual who acting alone or together, or through one or more persons or trust, possesses one or more of the following rights or entitlements in such company, namely:-
| (i) | holds indirectly, or together with any direct holdings, not less than ten percent of the shares; |
| (ii) | holds indirectly, or together with any direct holdings, not less than ten percent of the voting rights in the shares; |
| (iii) | has right to receive or participate in not less than ten per cent. of the total distributable dividend, or any other distribution, in a financial year through indirect holdings alone, or together with any direct holdings; and |
| (iv) | has right to exercise, or actually exercises, significant influence or control, in any manner other than through direct-holdings alone. |
Every Company is required to take necessary steps to identify an individual who is a significant beneficial owner in relation to the Company and such individual is required to comply with the applicable provisions. Under the Companies (Significant Beneficial Owners) Rules 2018, amended time to time, requirements of declaring and filing the significant beneficial ownership details has been provided.
Share Register and Record Dates
We maintain our register of members in both electronic and physical modes at our registered office and all transfers of shares should be notified to us at such address. Our register of members is open for inspection during business hours by shareholders without charge and by other persons upon payment of a fee as prescribed under the applicable law.
The register and index of beneficial owners maintained by a depository under the Depositories Act, 1996 is deemed to be an index of members and register and index of debenture holders. We recognize as shareholders only those persons whose names appear on our register of members, and we do not recognize any person holding any equity share or part thereof on trust, whether express, implied or constructive.
To determine which shareholders are entitled to specified shareholder rights, we may close the register of members. For the purpose of determining our shareholders, our register of members may be closed for periods not exceeding in aggregate 45 days in each year but not exceeding 30 days at any one time and we are required to ensure that there is a gap of at least 30 days between the two record dates. In order to determine our shareholders’ entitlement to dividends, it is our general practice to close the register of members for approximately 10 to 20 days before the annual general meeting. The date on which this period begins is the record date. Under the SEBI LODR Regulations, pertaining to NSE and BSE on which our equity shares are listed, we are required to give at least 7 working days’ advance notice to the stock exchange, set a record date and/or close the register of members. The trading of our equity shares and the delivery of shares certificates may continue while the register of members is closed.
Annual Report
At least 21 clear days before an annual general meeting, we must circulate our annual report, which comprises of either a detailed or abridged version of our audited financial accounts, our directors’ report, our corporate governance report, and our auditor’s report, to the shareholders along with a notice convening the annual general meeting. In addition, we must furnish to the exchanges quarterly unaudited or audited results within 45 days after the end of each accounting quarter. We are required to furnish to the exchanges audited financial results for the entire financial year within 60 days of the end of the financial year and to publish our financial results in at least one English language daily newspaper circulating in the whole or substantially the whole of India and also in a daily newspaper published in the language of the region where our registered office is situated. Further as per the amendments in SEBI Regulations with respect to the annual reports for the financial year ended March 31, 2019, onwards, we are required to send the Annual Report to the stock exchanges along with the notice of AGM not later than the day of commencement of dispatch to the shareholders. We are also required under the Companies Act, 2013 to make available upon the request of any shareholder our complete balance sheet and statement of profit and loss along with all the subsidiaries.
Under the Companies Act, 2013, we must file with the Registrar of Companies our Annual report within 30 days of the date on which the balance sheet and statement of profit and loss were adopted at the annual general meeting and our annual return within 60 days of the conclusion of that meeting.
230
Related Party Transactions
As per the Companies Act, 2013 and SEBI LODR Regulations, all related party transactions shall require prior approval of the audit committee. The audit committee may grant omnibus approval for related party transactions proposed to be entered into by the Company subject to certain conditions. The audit committee shall review, at least on a quarterly basis, the details of related party transactions entered into by the Company pursuant to each of the omnibus approvals accorded by the audit committee. The audit committee shall lay down the criteria for granting omnibus approvals in line with the policy on materiality of related party transactions of the Company and such approval shall be applicable to transactions which are similar in nature. The SEBI LODR Regulations, provide that all material related party transactions shall require approval of the shareholders through resolution and no related party shall vote to approve such resolutions whether the entity is a related party to the particular transaction or not.
As per Companies Act, 2013, the related party transactions require approval of the Board of Directors in case the transaction is not at arm’s length or ordinary course of business. Further approval of the shareholders would be required whenever the transactions exceeds the prescribed threshold limits. The member of the company shall not vote on such resolution to approve any contract or arrangement which may be entered into by the company, if such member is a related party. However, the approval of the Board/Shareholders will not apply if the related party transactions are in the ordinary course of business and at arm’s length.
Further, as per Companies Act, 2013, all related party transactions shall require approval of the Audit Committee and the Audit Committee may make omnibus approval for related party transactions proposed to be entered into by the Company subject to such conditions as provided under Rule 6A of Companies (Meetings of Board and its Powers), Rules, 2014. Omnibus approval can be provided for the transactions of repetitive nature and where the need for related party transaction cannot be foreseen and details are not available, audit committee may make omnibus approval for such transactions subject to their value not exceeding rupees one crore (equivalent to 10 Million) per transaction. Such approval shall be valid for a period of one financial year. In case any transaction involving any amount not exceeding rupees one crore (equivalent to 10 Million) is entered into by a director or officer of the company without obtaining the approval of the Audit Committee and is not ratified by the Audit Committee within three months from the date of the transaction, such transaction shall be voidable at the option of the Audit Committee.
₹
₹
As per the provisions of the SEBI LODR Regulations, the listed entity shall formulate a policy on the materiality of related party transactions and dealing with a related party to any director or is authorized by any other director, the director concerned shall indemnify the company against any loss incurred due to such transactions. Further, such prior approvals do not apply to transactions between a holding company and its wholly owned subsidiary whose accounts are consolidated with related party transactions, including clear threshold limits duly approved by the Board of Directors, and that such holding company and placed before the shareholders at the general meeting. Policy shall be reviewed by the Board of Directors at least once every three years and amended accordingly.
Disclosure of materially significant related party transactions that may have potential conflict with interests of listed entity at large are required to be included in the annual report.
Further, as per the amendments in SEBI LODR Regulations, all listed entities shall submit within 30 days from the date of publication of its standalone and consolidated financial results for the half year, disclosures of related party transactions on a consolidated basis, in the format specified in the relevant accounting standards for annual results to the stock exchanges where the company is listed and publish the same on its website.
Further, The SEBI, vide its notification dated November 09, 2021, has notified SEBI (Listing Obligations and Disclosure Requirements) (Sixth Amendment) Regulations, 2021 (“Amendments”) introducing amendments to the provisions pertaining to the Related Party Transactions under the SEBI LODR Regulations. The aforesaid amendments inter-alia included replacing of current threshold i.e. 10% (ten per cent) of the listed entity’s consolidated turnover, for determination of material Related Party Transactions requiring prior Shareholders’ approval with the threshold of lower of ` 1,000 Crores (Rupees One thousand Crores) and 10% (ten per cent) of the annual consolidated turnover of the listed entity as per the last audited financial statements of the listed entity (“Revised Materiality Threshold”). Accordingly, the threshold for determination of material related party transactions under LODR Regulations and the time line for obtaining approval from the members have inter alia revised with effect from April 01, 2022.
SEBI vide its notification dated November 22, 2021, mandated listed entities to submit to stock exchanges on RTP in specific format, information to be placed before the audit committee and shareholders for RPTs.
A. | Information to be reviewed by the Audit Committee for approval of RPTs |
| a. | Type, material terms and particulars of the proposed transaction; |
| b. | Name of the related party and its relationship with the listed entity or its subsidiary, including nature of its concern or interest (financial or otherwise); |
| c. | Tenure of the proposed transaction (particular tenure shall be specified); |
| d. | Value of the proposed transaction; |
| e. | The percentage of the listed entity’s annual consolidated turnover, for the immediately preceding financial year, that is represented by the value of the proposed transaction (and for a RPT involving a subsidiary, such percentage calculated on the basis of the subsidiary’s annual turnover on a standalone basis shall be additionally provided); |
| f. | If the transaction relates to any loans, inter-corporate deposits, advances or investments made or given by the listed entity or its subsidiary: |
| i. | details of the source of funds in connection with the proposed transaction. |
| ii. | where any financial indebtedness is incurred to make or give loans, inter-corporate deposits, advances or investments |
| • | nature of indebtedness |
| • | cost of funds; and |
| • | tenure |
| iii. | applicable terms, including covenants, tenure, interest rate and repayment schedule, whether secured or unsecured; if secured, the nature of security; and |
| iv. | the purpose for which the funds will be utilized by the ultimate beneficiary of such funds pursuant to the RPT. |
231
| g. | Justification as to why the RPT is in the interest of the listed entity; |
| h. | A copy of the valuation or other external party report, if any such report has been relied upon; |
| i. | Percentage of the counter-party’s annual consolidated turnover that is represented by the value of the proposed RPT on a voluntary basis; and |
| j. | Any other information that may be relevant. |
The audit committee shall also review the status of long-term (more than one year) or recurring RPTs on an annual basis.
B. | Information to be provided to shareholders for consideration of RPTs |
The notice being sent to the shareholders seeking approval for any proposed RPT shall, in addition to the requirements under the Companies Act, 2013, include the following information as a part of the explanatory statement:
| a. | A summary of the information provided by the management of the listed entity to the audit committee as specified in point 4 above. |
| b. | Justification for why the proposed transaction is in the interest of the listed entity. |
| c. | Where the transaction relates to any loans, inter-corporate deposits, advances or investments made or given by the listed entity or its subsidiary, the details specified under point4(f) above; (The requirement of disclosing source of funds and cost of funds shall not be applicable to listed banks/NBFCs.) |
| d. | A statement that the valuation or other external report, if any, relied upon by the listed entity in relation to the proposed transaction will be made available through the registered email address of the shareholders. |
| e. | Percentage of the counter-party’s annual consolidated turnover that is represented by the value of the proposed RPT, on a voluntary basis. |
| f. | Any other information that may be relevant. |
SEBI vides its circular dated March 30, 2022, clarified that an RPT that has been approved by a listed entity’s audit committee prior to April 01, 2022, but continues beyond such date and becomes material as per the revised materiality threshold, is required to place before the shareholders at the first General Meeting held by the listed entity after April 01, 2022. Further vide its circular dated April 08, 2022, SEBI clarified that the shareholders approval of omnibus RPTs approved in an AGM shall be valid upto the date of the next AGM, for a period not exceeding 15 months. In case of omnibus approvals for material RPTs obtained from shareholders in general meetings other than AGMs, the validity of such omnibus approvals shall not exceed one year.
Borrowing Powers
Our directors may raise, borrow, or secure the payment of any sums of money for our purposes as they deem appropriate without the consent of shareholders in a general meeting by special resolution, provided that, the aggregate of the money to be borrowed and the principal amount outstanding in respect of money raised, borrowed, or secured by us does not exceed 100% of the aggregate of our paid up share capital plus free reserves and securities premium. Under the Companies Act, the payment and repayment of money borrowed may be secured in such manner and upon such terms and conditions in all respect as the Board may think fit, by resolution passed at a meeting of the Board and in particular, by the issue of bonds, debentures, debenture stock of the company either unsecured or secured by a mortgage or charge over all or any part of the property of the company (both present and future) including its uncalled capital for the time being, and debentures, debenture stock, bonds and other securities may be made assignable free from any equities between the company and the person to whom the same may be issued.
Corporate Social Responsibility
The Companies Act, 2013, read with the Rules made thereunder, requires companies which meet the requirements of certain thresholds of net worth, turnover or net profits during the immediately preceding financial year to constitute a Corporate Social Responsibility (“CSR”) Committee and to spend at least 2.0% of average net profits (“net profit” shall not include such sums as may be prescribed, and shall be calculated in accordance with the provisions of section 198) for the three immediately preceding fiscal years on areas of CSR. In the event we are unable to spend the required amount, we will be required to disclose details of amounts spent and, in case of any shortfall in such spending, also state the reasons for the shortfall.
A company’s board of directors is required to satisfy itself that the funds disbursed have been utilized for the purpose and in the manner as approved by the board of directors, and the company’s Chief Financial Officer, or the person responsible for financial management, shall be required to certify accordingly. An annual action plan in pursuance of its CSR policy, which shall include- a) the list of CSR projects or programs that are approved to be undertaken in areas or subjects specified in Schedule VII of the Companies Act, 2013, b) the manner of execution of such projects or programs, c) the modalities of utilization of funds and implementation schedules for the projects or programs, d) monitoring and reporting mechanism for the projects or programs, and e) details of impact assessment, if any, for the projects undertaken by the company. Every company having average CSR obligation of Rs. 100 million or more in the three immediately preceding financial years, shall undertake impact assessment, through an independent agency, of their CSR projects having outlays of Rs. 10 million or more, and which have been completed not less than one year before undertaking the impact study. Such impact assessment reports shall be placed before the Board and shall be annexed to the annual report on CSR. In case of excess CSR spend by a company in a fiscal year, such excess amount may be set off against the CSR spend requirement for up to immediate succeeding three financial years subject to fulfillment of certain conditions. Any amount remaining unspent pursuant to any ongoing project shall be transferred by the company within a period of 30 days from the end of the financial year to a special account in a scheduled bank, and such amount shall be spent within a period of three financial years from the date of such transfer, failing which, the company shall transfer the same to a Fund specified in Schedule VII of the Companies Act, 2013, within a period of 30 days from completion of the third financial year. Any amount remaining unspent, other than pursuant to an ongoing project, shall be transferred by the company to a fund specified in Schedule VII of the Companies Act, 2013 within a period of six months of the end of the financial year. In case of excess CSR spend by a company in a fiscal year, such excess amount may be set off against the CSR spend requirement for up to immediate succeeding three financial years subject to fulfillment of certain conditions.
MCA has recently mandated corporates to furnish a comprehensive report on its CSR funds spent and activities carried out.
232
Issue of equity shares and
Pre-emptive
RightsSubject to the provisions of the Companies Act, 2013 and the Articles of Association of the Company with respect to any special rights attaching to any of our equity shares, we may increase our share capital by the allotment or issue of new equity shares with preferred, deferred or other special rights or restrictions regarding dividends, voting, return of capital or other matters as we may from time to time determine by special resolution. We may issue preference shares that are redeemable or are liable to be redeemed at our option or the option of the holder in accordance with our Articles of Association.
Under the Companies Act, 2013, new equity shares shall first be offered to existing shareholders in proportion to the amount they have paid up on their equity shares on the date of the offer. The offer shall be made by written notice specifying:
| • | the right, exercisable by the shareholders of record, to renounce the equity shares offered in favor of any other person; |
| • | the number of equity shares offered; and |
| • | the period of the offer, which may not be less than 15 days and not exceeding 30 days from the date of the offer. |
If the offer is not accepted, it is deemed to be declined, and thereafter, the Board is permitted to distribute equity shares not accepted by existing shareholders in the manner it deems beneficial in accordance with the Articles of Association of the Company. Holders of ADSs may not be able to participate in any such offer.
However, under the provisions of the Companies Act, 2013, new equity shares may be offered to
non-shareholders,
if this has been approved by a special resolution and has complied with the applicable rules.Capitalization of Profits and Reserves
The Articles of Association of the Company allow the directors, with the approval of our shareholders by an ordinary resolution, to capitalize any part of the amount standing to the credit of our reserve accounts or to the credit of our statement of profit and loss or otherwise available for distribution. Any sum which is capitalized shall be appropriated among the shareholders in the same proportion as if such sum had been distributed by way of dividend. This sum shall not be paid out in cash and shall be applied in the following manner:
| • | paying up any amount remaining unpaid on the shares held by our shareholders; or |
| • | Issuing to our shareholders, fully paid bonus equity shares (issued either at par or a premium). |
Any issue of bonus equity shares would be subject to section 63 of the Companies Act, 2013, and the SEBI (Issue of Capital and Disclosure Requirements) Regulations, 2018 (“ICDR Regulations”), as amended from time to time, which provides that:
| • | The company is authorized by its articles of association for issue of bonus shares, capitalization of reserves, etc.; |
| • | The company has not defaulted in payment of interest or principal in respect of fixed deposits or debt securities issued by it; |
| • | The company has not defaulted in respect of the payment of statutory dues of the employees such as contribution to provident fund, gratuity and bonus; |
| • | The outstanding partly paid shares on the date of the allotment of the bonus shares, are made fully paid-up; |
| • | None of its promoters or directors is a fugitive economic offender; |
| • | No company shall, pending the conversion of convertible securities, issue any bonus equity shares unless a similar benefit is extended to the holders of such convertible securities through a reservation of equity shares in proportion to such conversion; |
| • | The bonus issue shall be made only out of free reserves, securities premium account or capital redemption reserve account and built out of the genuine profits or securities premium collected in cash and reserves created by revaluation of fixed assets shall not be capitalized for this purpose; |
| • | A declaration of bonus equity shares in lieu of dividend cannot be made; and |
| • | The bonus issue must be implemented within fifteen days from the date of approval of the issue by its board of directors, if shareholder’s approval for capitalization of profits or reserves for making the bonus issue is not required. In case shareholder’s approval for capitalization of profits or reserves for making the bonus issue is required, then the bonus issue must be implemented within two months from the date of the meeting of board of directors wherein the decision to announce the bonus issue was taken subject to shareholders’ approval. |
Purchase of own equity shares
A company may, in accordance with provisions of the Companies Act, 2013, the Rules made thereunder and the regulations issued by SEBI in relation to buyback of shares by listed companies SEBI
(Buy-Back
of Securities) Regulations, 2018 (referred to as ‘SEBI Buyback Regulations’)buy-back
its own shares out of its free reserves or securities premium account or the proceeds of any shares or other specified securities (other than proceeds of an earlier issue of the same kind of shares or same kind of other specified securities) subject to certain conditions, including:| • | The buy-back must be authorized by the company’s Articles of Association; |
| • | A special resolution authorizing the buy-back must be passed in a general meeting; |
| • | Each buy-back is limited to 25.0% or less of the company’s total paid up capital and free reserves; |
| • | The ratio of aggregate of secured and unsecured debts owed by the company after such buy-back is not more than twice the paid up capital and its free reserves; |
| • | All shares or other specified securities for buy-back are fullypaid-up; |
| • | The buy-back of shares or other specified securities listed on any recognized stock exchange is in accordance with the SEBI(Buy-Back) Regulations, 2018, |
| • | The buy-back in respect of shares or other specified securities other than listed shares or specified securities is in accordance with such rules as may be prescribed; and |
| • | No offer of buy-back shall be made within a period of one year from the date of the closure of the preceding offer to buy back, if any. |
233
The second condition mentioned above would not be applicable if the
buy-back
is ten per cent or less of the totalpaid-up
equity capital and free reserves of the company and if suchbuy-back
is authorized by the board of directors by means of resolution passed at its meeting.No company shall directly or indirectly purchase its own shares or other specified securities - (a) through any subsidiary company including its own subsidiary companies; (b) through any investment company or group of investment companies; or (c) if a default, is made by the company, in the repayment of deposits accepted either before or after the commencement of this Act, interest payment thereon, redemption of debentures or preference shares or payment of dividend to any shareholder, or repayment of any term loan or interest payable thereon to any financial institution or banking company. Provided that the
buy-back
is not prohibited, if the default is remedied and a period of three years has lapsed after such default ceased to subsist.Any equity shares which have been bought back by a company must be extinguished within 7 days of the last date of completion of buy back. Further, a Company cannot not make a further issue of the same kind of shares or other specified securities including an allotment of new shares within a period of 6 months except by way of a bonus issue or in discharge of our existing obligations such as conversion of warrants, stock option schemes, sweat equity or conversion of preference shares or debentures into equity. The SEBI Buyback Regulations provides additional restriction that a company is prohibited from purchasing its own shares or specified securities through any subsidiary company including its own subsidiary companies or through any investment company or group of investment companies or in the event of
non-compliance
with certain specified conditions.SEBI Buyback Regulations permit a company to
buy-back
through the following methods:| 1) | Tender offer: Tender offer means offer by a company to buy-back its shares or other specified securities through a letter of offer from the holders of the shares or other specified securities of the company. A company maybuy-back its shares or other specified securities from its existing security-holders on a proportionate basis in accordance with the provisions of Chapter III of the SEBI Buyback Regulations. However, 15.0% of the number of securities which the company proposes to buy back or number of securities entitled as per their shareholding, whichever is higher, shall be reserved for small shareholders. The promoter intending to offer their shares or other specified securities forbuy-back shall be required to make specific disclosures such as quantum of shares proposed to be tendered, details of specified transactions as provided in the regulations etc. Other conditions in relation to filing of the offer document, adhering to the offer procedure, maintaining an escrow account, etc. shall also have to be complied with as per Chapter III of the SEBI Buyback Regulations. |
| 2) | Open market: The buyback of shares or other specified securities from the open market may be in one of the following methods: |
| • | Through stock exchange or |
| • | Book building process. |
Specific conditions to be complied with, in relation to buyback through each of the above modes have been prescribed under the Chapter IV of the SEBI Buyback Regulations. The
buy-back
of the shares or other specified securities shall not be made from the promoters or persons in control of the company.Schedule V of the SEBI Buyback Regulations provides the fee structure and the mode of payment in the event of submitting the offer document or copy of public announcement to SEBI.
ADSs holders will be eligible to participate in a share”.
buy-back
in certain cases. An ADSs holder may acquire equity shares by withdrawing them from the depository facility and then selling those equity shares back to us in accordance with the provisions of applicable law as discussed above. ADSs holders should note that equity shares withdrawn from the depository facility may only bere-deposited
into the depository facility under certain limited circumstances as specified under the guidelines issued by the GoI and the RBI relating to a sponsored ADSs facility and fungibility of ADSs. See “Item 10: Additional Information – D. Exchange Controls
There can be no assurance that the equity shares offered by an ADSs investor in any
buy-back
of equity shares by us will be accepted by us. The position regarding regulatory approvals required for ADSs holders to participate in abuy-back
is not clear. ADSs investors are advised to consult their Indian legal advisers prior to participating in anybuy-back
by us, including in relation to any regulatory approvals and tax issues relating to the sharebuy-back.
Rights of Minority Shareholders
The Companies Act, 2013, provides mechanisms for the protection of the rights of the minority shareholder. Where the share capital of a company is divided into different classes of shares and there has been variation in the rights attached to the shares of any class, the holders of not less than 10% of the issued shares of that class, who did not vote in favor of a resolution for the variation, have the right to apply to the NCLT within 21 days after the date on which the consent was given or the resolution was passed, to have the variation cancelled and such variation shall not have any effect unless confirmed by the NCLT.
234
Further, under the Companies Act, 2013, shareholders representing not less than 10% of the total number of members or 100 members, whichever is less or shareholders holding not less than 10.0% of the issued share capital, subject to the condition that they have paid all calls and other sums due on their shares, have the right to apply to the NCLT for an order to bring an end to the matter complained of, on the following grounds of oppression or mismanagement:
| • | that the company’s affairs have been or are being conducted in a manner prejudicial to public interest or in a manner prejudicial or oppressive to any member or members or in a manner prejudicial to the interests of the company; or |
| • | that a material change, not being a change brought about by, or in the interests of, any creditors, including debenture holders or any class of shareholders of the company, has taken place in the management or control of the company, whether by an alteration in its board of directors or management or in the ownership of the company’s shares and by reason of such change, it is likely that the affairs of the company will be conducted in a manner prejudicial to public interest or in a manner prejudicial to its interests or its members or any class of members |
Provisions on Purchase of Minority Shareholding
Section 236 of the Companies Act, 2013 provide for mechanism for purchase of minority shareholding. In the event of an acquirer, or a person acting in concert with such acquirer, becoming registered holder of 90.0% or more of the issued equity share capital of a company, or in the event of any person or group of persons becoming 90.0% majority or holding 90.0% of the issued equity share capital of a company by virtue of an amalgamation, share exchange, conversion of securities or for any other reason, such acquirer, person or group of persons, as the case may be, shall notify the Company of their intention to buy the remaining equity shares.
The acquirer, person or group of persons as mentioned above shall offer to the minority shareholders of the company for buying the equity shares held by such shareholders at a price determined on the basis of valuation by a registered valuer in accordance with such rules as may be prescribed.
Without prejudice to the aforesaid provisions, the minority shareholders of the company may offer to the majority shareholders to purchase the minority equity shareholding of the company at the price determined in accordance with such rules as may be prescribed.
Book-Entry Shares and Liquidity
Our equity shares are compulsorily traded in book-entry form and are available for trading under both depository systems in India, namely, the National Securities Depository Limited and Central Depository Services (India) Limited. The International Securities Identification Number (“ISIN”) for our equity shares is INE205A01025.
Liquidation Rights
According to the Companies Act, 2013 and the IBC, certain payments have preference over payments to be made to equity shareholders. These payments having preference include payments to be made by the company to its employees, taxes, payments to secured and unsecured lenders and payments to holders of any shares entitled by their terms to preferential repayment over the equity shares. In the event of our
winding-up,
the holders of the equity shares are entitled to be repaid the amounts of paid up capital or credited as paid upon those equity shares after payments have been made by the company as set out above. Subject to such payments having been made by the company, any surplus assets are paid to holders of equity shares in proportion to their shareholdings.Takeover Code and SEBI Regulations
Under the SEBI (Substantial Acquisition of Shares and Takeovers) Regulations, 2011 (“Takeover Code”), the acquisition of shares or voting rights or control which entitles the acquirer to exercise 25.0% or more of the voting rights in or control over the target company triggers a requirement for the acquirer to make an open offer at an offer price determined as per the provisions of the Takeover Code. The acquirer is required to make a public announcement for an open offer on the date on which it is has agreed to acquire such shares or voting rights or control. Such open offer shall only be for such number of shares as is required to adhere to the maximum permitted
non-public
shareholding.Upon acquisition of shares or voting rights or control in the target company such that the aggregate share-holding of the acquirer (meaning a person who directly or indirectly, acquires or agrees to acquire shares or voting rights or control in a target company either by himself or together with persons acting in concert) is 5.0% or more of the shares or voting rights or control of the target company, the acquirer is required to, within 2 working days of such acquisition of shares or voting rights or receipt of intimation of allotment of shares, disclose their aggregate shareholding and voting rights in the target company to the target company and to the stock exchanges in which the shares of the target company are listed.
Further, an acquirer, who, together with persons acting in concert with him, holds shares or voting rights entitling them to 5.0% or more of the shares or voting rights in a target company must disclose every sale or acquisition of shares representing 2.0% or more of the shares or voting rights of the target company to the target company and to the stock exchanges in which the shares of the target company are listed within 2 working days of such acquisition or sale or receipt of intimation of allotment of such shares. This disclosure is required, in case of a sale, even if such sale results in the shareholding of the acquirer falling below 5.0%. Every person, who together with persons acting in concert with him, holds shares or voting rights entitling him to exercise 25.0% or more of the voting rights in a target company, has to disclose to the company and to stock exchanges, their aggregate shareholding, and voting rights as of March 31, in such target company within 7 working days from the end of the financial year of that target company.
235
Where the public shareholding in the target company is reduced to a level below the limit specified in rule 19(2)(b) and / or rule 19A of the Securities Contract (Regulation) Rules, 1957, the target company is required to adopt any of the methods prescribed in the SEBI circular CIR/CFD/CMD/14/2015 dated November 30, 2015 and SEBI/HO/CFD/CMD/CIR/P/43/2018 dated February 22, 2018, so as to comply with the minimum public shareholding requirements in the manner specified by SEBI.
Further, the Takeover Code also provides that an acquirer can make an offer for delisting the Company if such acquirer declares his intention to do so at the time of making the public announcement of an open offer. The acquirer whose shareholding exceeds the maximum permissible
non-public
shareholding, pursuant to an open offer under these regulations, shall not be eligible to make a voluntary delisting offer under the Securities and Exchange Board of India (Delisting of Equity Shares) Regulations, 2009, unless a period of twelve months has elapsed from the date of the completion of the offer period.Since the Company is in India, the provisions of the Takeover Code will apply to the Company and to any person acquiring equity shares or voting rights in the Company. The ADSs entitle ADSs holders to exercise voting rights in respect of the Deposited Equity Shares (as described in the section titled “Voting Rights of Deposited Equity Shares Represented by ADSs”). Accordingly, the requirement to make an open offer of at least 26.0% of the shares of a company to the existing shareholders of the company would be triggered by an ADSs holder where the shares that underlie the holder’s ADSs represent 25.0% or more of the shares or voting rights of the company. We entered into uniform listing agreements with BSE and NSE which were superseded by SEBI LODR Regulation, pursuant to which we must report to the stock exchanges any disclosures made to the company pursuant to the Takeover Code.
The Takeover Code contains the fee structure and the mode of payment in the event of filing the necessary disclosure by the acquirer under the Regulation 10
sub-regulation
7.SEBI has amended various regulations such as the SEBI LODR Regulations, the Takeover Code, the SEBI (Issue of Capital and Disclosure Requirements) Regulations, 2018 and the SEBI (Delisting of Equity Shares) Regulations, 2018 to grant relaxation or exemptions to listed companies whose resolution plan is approved under section 31 of the Insolvency and Bankruptcy Code, 2016.
Voting Rights of Deposited Equity Shares Represented by ADSs
Under Indian law, voting in relation to the equity shares is by show of hands unless a poll is demanded by a member or members present in person or by proxy holding at least 10.0% of the total shares entitled to vote on the resolution or by those holding shares with an aggregate paid up capital of at least 500,000. A proxy (other than a body corporate represented by an authorized representative) may not vote except on a poll. As soon as practicable after receipt of notice of any general meetings at which the holders of deposited securities are entitled to vote, or of solicitation of consents or proxies from of holders of deposited securities shares or other deposited securities, our Depositary shall fix a record date in respect of such meeting or solicitation of consent or proxy in accordance with Section 4.9 of Deposit Agreement dated September 6, 2013 for determining the holders entitled to give instructions for the exercise of voting rights. The Depositary shall, if requested by the Company in writing in a timely manner, at the Company’s expense and provided no U.S. legal prohibitions exist, distribute to holders as of the ADS Record Date: (a) such notice of meeting or solicitation of consent or proxy,
₹
(b) a statement that the holders at the close of business on the ADS Record Date will be entitled, subject to any applicable law, the provisions of the Deposit Agreement, the Articles of Association of the Company and the provisions of or governing the Deposited Securities (which provisions, if any, shall be summarized in pertinent part by the Company), to instruct the Depositary as to the exercise of the voting rights, if any, pertaining to the deposited securities represented by such holder’s ADSs, and (c) a brief statement as to the manner in which such voting instructions may be given.
On receipt of the aforesaid notice from the Depository, our ADSs holders may instruct the Depository on how to exercise the voting rights for the shares that underlie their ADSs. For such instructions to be valid, the Depository must receive them on or before a specified date. The Depository will try, as far as is practical, and subject to the provisions of Indian law and our Memorandum of Association and our Articles of Association, to vote or to have its agents vote in relation to the shares or other deposited securities as per our ADSs holders’ instructions. The Depository will only vote or attempt to vote as per an ADSs holder’s instructions. The Depository will not itself exercise any voting discretion. Neither the Depository nor its agents are responsible for any failure to carry out any voting instructions, for the manner in which any vote is cast, or for the effect of any vote. There is no guarantee that our shareholders will receive voting materials in time to instruct the Depository to vote and it is possible that ADSs holders, or persons who hold their ADSs through brokers, dealers or other third parties, will not have the opportunity to exercise a right to vote.
Insider Trading Regulations
SEBI through its notification dated December 31, 2018 has rationalized the Insider Trading Regulations. The amendment mainly focuses in providing mechanism for better implementation of the Insider Training Regulations. These changes, made to give effect to the accepted recommendations of the Committee on Fair Market Conduct, make broad- based changes to the regulations, on matters such as specifying the legitimate purposes for sharing unpublished price sensitive information, tracing the flow of such information, inclusive list of designated persons, establishing of process for how and when people are brought ‘inside’ on sensitive transactions etc. The changes in the Regulations were effective from April 1, 2019 which includes the Code of Conduct to Regulate, Monitor and Report Trading of Securities, Policy and Procedures for Inquiry in case of leak of Unpublished Price Sensitive Information and the Code of Practices and Procedures for fair disclosure of Unpublished Price Sensitive Information and Policy for Determination of Legitimate Purpose. The SEBI (Prohibition of Insider Trading) (3
rd
Amendment) Regulations, 2019 dated September 17, 2019, notified that the Code of Conduct of the Company shall provide for suitable protection against any discharge, termination, demotion, suspension, threats, harassment, directly or indirectly or discrimination against any employee who files a Voluntary Information Disclosure Form, irrespective of whether the information is considered or rejected by SEBI or he or she is eligible for a Reward under the regulations, by reasons as mentioned in the said regulations. Accordingly, we updated our Insider Trading Prohibition Policy which was approved by the members of the Board on November 14, 2019. We further updated our Insider Trading Prohibition Code to amend the definition of insider for effecting change in identification of Designated Employees/categories. The amended Code was effective from November 6, 2020 which was approved by the Board of Directors in its meeting held on November 6, 2020 and the same is available on the website of the Companywww.vedantalimited.com
.236
Further, SEBI (Prohibition of Insider Trading) (Amendment) Regulations, 2020 dated July 17, 2020, notified that the board of directors or heads of the Organization required to handle unpublished price sensitive information (“UPSI”) have to ensure that a structured digital database is maintained containing the nature of UPSI and the names of such persons who have shared the information and also the names of such persons with whom information is shared along with the PAN or any other identifier authorized by law where PAN is not available.
Pursuant to this amendment, read with the circular dated July 23, 2020, SEBI has introduced a substantial shift in the reporting structure and matrix for violations under the PIT Regulations. Going forward, reporting of violations, if any, shall be made to the stock exchange(s) where the concerned securities are traded, and not to SEBI, which was the earlier practice.
Adding to the same vide circular dated September 9, 2020, the scope has been widened by SEBI on the system-driven disclosure mechanisms which covers all disclosures related to trading in equity shares and equity derivative instruments by ‘designated persons’ and members of the promoter group, in addition to promoters and directors of a listed company.
Comparison of Shareholders’ Rights
We are incorporated under the laws of India. The following discussion summarizes certain material differences between the rights of holders of our equity shares and the rights of holders of the common stock of a typical corporation incorporated under the laws of the State of Delaware which result from differences in governing documents and the laws of India and Delaware. The rights of holders of our ADSs differ in certain respects from those of holders of our equity shares.
This discussion does not purport to be a complete statement of the rights of holders of our equity shares under applicable law in India and our amended and restated Memorandum and Articles of Association or the rights of holders of the common stock of a typical corporation under applicable Delaware law and a typical certificate of incorporation and bylaws.
Delaware Law | Indian Law | |
Annual and Special Meetings of Shareholders | ||
| Shareholders of a Delaware corporation generally do not have the right to call meetings of shareholders unless that right is granted in the certificate of incorporation or by-laws. However, if a corporation fails to hold its annual meeting within a period of 30 days after the date designated for the annual meeting, or if no date has been designated for the annual meeting, or if no date has been designated for a period of 13 months after its last annual meeting, the Delaware Court of Chancery may order a meeting to be held upon the application of a shareholder. | While shareholders of a company do not have any right to call for an annual general meeting, shareholders holding one-tenth of thepaid-up share capital of the company have a right to request an extraordinary general meeting. However, in the event the company defaults in holding an annual general meeting within 15 months from the date of its last annual general meeting or within 6 months from the end of financial year, whichever is higher, the GoI may order a meeting to be held upon the application of any shareholder. | |
Quorum Requirements for Meetings of Shareholders | ||
| A Delaware corporation’s certificate of incorporation or bylaws can specify the number of shares which constitute the quorum required to conduct business at a meeting, provided that in no event shall a quorum consist of less than one-third of the shares entitled to vote at a meeting, except that, where a separate vote by a class or series or classes or series is required, a quorum shall consist of no less thanone-third of the shares of such class or series or classes or series. | Our Articles of Association specify that the quorum for the general meeting shall be as provided in the Companies Act, 2013. According to the Companies Act, 2013, quorum for a general meeting is at least 30 shareholders personally present if number of members as on date of meeting is exceeding 5,000 to vote and, in such instances the Indian Companies Act, 2013 supersedes the Articles of Association. | |
Board of Directors | ||
| A typical certificate of incorporation and bylaws would provide that the number of directors on the board of directors will be fixed from time to time by a vote of the majority of the authorized directors. Under Delaware law, a board of directors can be divided into classes and cumulative voting in the election of directors is only permitted if expressly authorized in a corporation’s certificate of incorporation. | Our Articles of Association provide that unless otherwise determined by the shareholders at a general meeting, the number of directors shall not be less than three or more than 15. The Company may appoint more than 15 directors by seeking the approval of its members by way of a special resolution. Under Indian law, the appointment and removal of directors (other than additional directors) is required to be approved by the shareholders. There is no concept under Indian law as to division of the board of directors into different classes or cumulative voting. | |
237
Delaware Law | Indian Law | |
Removal of Directors | ||
| Under the Delaware General Corporation Law, a director of a corporation may be removed with the approval of a majority of the outstanding shares then entitled to vote at an election of directors, unless the certificate of incorporation provides otherwise. | Under Indian law, a director of a company, other than a director appointed by the GoI, may be removed by an approval of the members by way of an ordinary resolution, provided that a special notice of the resolution to remove the director is given in accordance with the provisions of the Indian Companies Act, 2013. Under our Articles of Association, any director who has been appointed by any persons pursuant to the provisions of an agreement with us may be removed at any time by such person. | |
Filling Vacancies on the Board of Directors | ||
| A typical certificate of incorporation and bylaws provide that, subject to the rights of the holders of any preferred stock, any vacancy, whether arising through death, resignation, retirement, disqualification, removal, an increase in the number of directors or any other reason, may be filled by a majority vote of the remaining directors, even if such directors remaining in office constitute less than a quorum, or by the sole remaining director. Any newly elected director usually holds office for the remainder of the full term expiring at the annual meeting of stockholders at which the term of the class of directors to which the newly elected director has been elected expires. | The board of directors has the power to fill a vacancy on the board and any director so appointed shall hold office only so long as the vacating director would have held such office if no vacancy had occurred. The board has also the power to appoint additional director, however, such appointment shall be subject to approval by the shareholders in the immediate next annual general meeting | |
Interested Director Transactions | ||
| Interested director transactions are not voidable if (i) the material facts as to the interested director’s relationship or interests are disclosed or are known to the board of directors and the board in good faith authorizes the transaction by the affirmative vote of a majority of the disinterested directors, (ii) the material facts are disclosed or are known to the shareholders entitled to vote on such transaction and the transaction is specifically approved in good faith by vote of the majority of shares entitled to vote on the matter or (iii) the transaction is fair as to the corporation as of the time it is authorized, approved or ratified by the board of directors, a committee or the shareholders. | Under Indian law, contracts or arrangements in which one or more directors of an Indian company has an interest are not void or voidable because of such interest, provided that certain conditions, such as obtaining the required approval of the board of directors and disclosing the nature of the interest to the board of directors, are satisfied. Subject to a few exceptions, for an interested director transaction not to be voided, (a) the interested director is required to disclose the nature of his concern or interest at a meeting of the board of directors, whether directly or indirectly, is concerned or interested including the Director who is a Promoter, Manager, Chief Executive Officer of anybody corporate; (b) the board of directors is required to grant its consent to the contract or arrangement; (c) the interested director is not permitted to take part in the discussion of, or vote on, the contract or arrangement; and (d) the approval of the members is required by way of resolution. An interested director is not to be counted for the purposes of quorum at the time of any such discussion or vote and if the interested director does vote, the vote shall be void. The contravention of relevant provisions is punishable with fine. Nothing in this section shall apply to any contract or arrangement entered into or to be entered into between two companies or between one or more companies and one or more bodies corporate where any of the directors of the one company or body corporate or two or more of them together holds or hold not more than two percent of the paid-up share capital in the other company or the body corporate. | |
Cumulative Voting | ||
| Delaware law does not require that a Delaware corporation provide for cumulative voting. However, the certificate of incorporation of a Delaware corporation may provide that shareholders of any class or classes or of any series may vote cumulatively either at all elections or at elections under specified circumstances. | There is no concept of cumulative voting under Indian law. | |
Shareholder Action Without a Meeting | ||
| Unless otherwise specified in a Delaware corporation’s certificate of incorporation, any action required or permitted to be taken by shareholders at an annual or special meeting may be taken by shareholders without a meeting, without prior notice and without a vote, if consents, in writing, setting forth the action, are signed by shareholders with not less than the minimum number of votes that would be necessary to authorize the action at a meeting. All consents must be dated. No consent is effective unless, within 60 days of the earliest dated consent delivered to the corporation, written consents signed by a sufficient number of holders to take the action are delivered to the corporation. | There is no concept of shareholder action without a meeting under Indian law. | |
238
Delaware Law | Indian Law | |
Business Combinations | ||
| With certain exceptions, a merger, consolidation or sale of all or substantially all the assets of a Delaware corporation must be approved by the board of directors and a majority of the outstanding shares entitled to vote thereon. | The sale, lease, or disposal of all or substantially all of the assets of an Indian company must be approved by the board of directors and shareholders holding a majority of the voting share capital of the company. Under the Indian Companies Act, 2013 the merger of two companies is required to be approved by a Court of competent jurisdiction or NCLT and by a three-fourths majority of each class of shareholders and creditors of the company present and voting at the meetings held to approve the merger. | |
Interested Stockholders | ||
| The Delaware General Corporation Law contains a business combination statute applicable to Delaware public corporations whereby, unless the corporation has specifically elected not to be governed by such statute by amendment to its certificate of incorporation, it is prohibited from engaging in certain business combinations with an “interested shareholder” for three years following the date on which such person becomes an interested shareholder. An interested shareholder generally is one which owns or owned 15.0% or more of the target’s outstanding voting shares within the past three years. This has the effect of limiting the ability of a potential acquirer to make a two-tiered bid for the target in which all shareholders would not be treated equally. The statute does not apply if, among other things, prior to the date on which such shareholder becomes an interested shareholder, the board of directors approves either the business combination or the transaction that resulted in the person becoming an interested shareholder. This encourages any potential acquirer of a Delaware public corporation to negotiate the terms of any acquisition transaction with the target’s board of directors. | Indian law does not prohibit corporate transactions but does require disclosure of related party transactions in the financial statements of the company. Under applicable accounting standards in India, during the time that a related party transaction exists, a company is required to disclose the name of the related parties, describe the relationship between the parties, nature of the transactions and volume of the transactions either as an amount or as an appropriate proportion, the amounts or appropriate proportions of outstanding items pertaining to related parties at the balance sheet date and provisions for doubtful debts due from such parties at that date and the amounts written off or written back in the period in respect of debts due from or to related parties. Transactions undertaken between a company and a person having a substantial interest in the company would qualify as a related party transaction and would be required to be disclosed under applicable accounting standards in India. Under such accounting standards, a party is considered to have a substantial interest in a company if that party owns, directly or indirectly, 20.0% or more of the voting power in the company. | |
Limitations on Personal Liability of Directors | ||
| A Delaware corporation may include in its certificate of incorporation provisions limiting the personal liability of its directors to the corporation or its shareholders for monetary damages for many types of breach of fiduciary duty. However, these provisions may not limit liability for any breach of the director’s duty of loyalty, acts or omissions not in good faith or that involve intentional misconduct or a knowing violation of law, the authorization of unlawful dividends, or unlawful share purchase or redemption, or any transaction from which a director derived an improper personal benefit. Moreover, these provisions would not be likely to bar claims arising under US federal securities laws. | Generally, Indian law provides that directors are not personally liable in respect of contracts of the company. However, where a director acts without the approval or ratification of the company, such director may be personally liable. Directors are also personally liable for breach of trust or misfeasance, both civilly and in some cases criminally. The Companies Act, 2013 of India, contains certain provisions making directors personally liable to discharge certain monetary obligations in their capacity as directors, such as the non-refund of share application monies or excess application monies within the time limit stipulated by the Companies Act, 2013. Similarly, the Companies Act, 2013 provides for civil liability of directors for misstatements in a prospectus issued by the company that has been signed by the directors, including the obligation to pay compensation to any persons subscribing to the shares of the company on the faith of statements made in the prospectus. Directors’ and officers’ liability insurance policies are available in India. However, the permissible coverage under such policies is subject to the same limitations as on the ability of the company to indemnify its directors as described under“- Indemnification of Directors and Officers.” | |
Indemnification of Directors and Officers | ||
| A Delaware corporation may indemnify a director or officer of the corporation against expenses (including attorneys’ fees), judgments, fines and amounts paid in settlement actually and reasonably incurred in defense of an action, suit or proceeding by reason of his or her position if (i) the director or officer acted in good faith and in a manner he or she reasonably believed to be in or not opposed to the best interests of the corporation and (ii) with respect to any criminal action or proceeding, the director or officer had no reasonable cause to believe his or her conduct was unlawful. | Under Indian law, subject to specified exceptions, any provision, whether contained in the Articles of Association of a company or in any agreement, exempting or indemnifying any director, officer or auditor of the company against any liability in respect of any negligence, default, breach of duty or breach of trust which would by law otherwise attach to such director, officer or auditor, shall be void. However, pursuant to the exceptions permitted under Indian law, our Articles of Association provide for indemnification of any officer or agent against any liability incurred by such person in successfully defending any proceeding, whether civil or criminal, in which such person is acquitted in whole or in part on the grounds that such person had acted honestly and reasonably, or in connection with an application made by an officer or agent to the High Court of the relevant state for relief for reason that he or she has a reason to apprehend that any proceeding may be brought against him in respect of any negligence, default, breach of duty, misfeasance or breach of trust in which relief has been granted by such High Court. | |
239
Delaware Law | Indian Law | |
Appraisal Rights | ||
A shareholder of a Delaware corporation participating in certain major corporate transactions may, under certain circumstances, be entitled to appraisal rights pursuant to which the shareholder may receive cash in the amount of the fair value of the shares held by that shareholder (as determined by a Court) in lieu of the consideration the shareholder would otherwise receive in the transaction. | There is no concept of appraisal rights under Indian law. | |
Shareholder Suits | ||
| Class actions and derivative actions generally are available to the shareholders of a Delaware corporation for, among other things, breach of fiduciary duty, corporate waste and actions not taken in accordance with applicable law. In such actions, the court has discretion to permit the winning party to recover attorneys’ fees incurred in connection with such action. | Under the Indian Companies Act, 2013, shareholders holding not less than one tenth of the issued share capital, shareholders representing not less than one tenth of the total number of members or one hundred members, provided that they have paid all calls and other sums due on their shares, have the right to request the NCLT, a statutory body, for an order or injunction as to the taking or not taking of an action by the company on the following grounds of oppression or mismanagement: (a) that the company’s affairs are being conducted in a manner prejudicial to public interest, in a manner oppressive to any member or members or in a manner prejudicial to the interests of the company; and (b) that a material change has taken place in the management or control of the company, whether by a change in the board of directors or management or in the ownership of the company’s shares, and by reason of such change it is likely that the affairs of the company will be conducted in a manner prejudicial to public interest or in a manner prejudicial to the interests of the company. | |
Inspection of Books and Records | ||
| All shareholders of a Delaware corporation have the right, upon written demand under oath stating the purpose thereof, to inspect or obtain copies of the corporation’s shares ledger and its other books and records for any proper purpose. | Pursuant to our Articles of Association, our Board of directors has the authority to determine whether and to what extent and at what times and places and under what conditions or regulations our books are open to the inspection of the shareholders. Further, no shareholder of the company has the right to inspect any record of the company except as conferred under law or authorized by the board of directors. The books containing the minutes of the proceedings of any general meetings of the shareholders are required to be kept at the registered office of the company and such materials are to be opened for inspection by any shareholder, without charge, subject to reasonable restrictions which may be imposed by a company’s articles or in its general meeting. If an inspection is refused, the company and every officer of the company in default will be punishable with a fine. Under Indian law, the audited financial statements for the relevant financial year, the directors’ report and the auditors’ report are required to be provided to the shareholders before the annual general meeting. | |
240
Delaware Law | Indian Law | |
Amendment to Charter | ||
| Amendments to the certificate of incorporation of a Delaware corporation require the affirmative vote of the holders of a majority of the outstanding shares entitled to vote thereon or such greater vote as is provided for in the certificate of incorporation; a provision in the certificate of incorporation requiring the vote of a greater number or proportion of the directors or of the holders of any class of shares than is required by Delaware corporate law may not be amended, altered or repealed except by such greater vote. | Under Indian Law, subject to certain specified amendments that require the additional approval of the central government, a company may make amendments to its articles with the approval of shareholders holding not less than 75.0% of the shares of the company. | |
Distributions and Dividends; Repurchases and Redemptions | ||
Delaware law permits a corporation to declare and pay dividends out of statutory surplus or, if there is no surplus, out of net profits for fiscal year in which the dividend is declared and/or for the preceding fiscal year as long as the amount of capital of the corporation following the declaration and payment of the dividend is not less than the aggregate amount of the capital represented by the issued and outstanding stock of all classes having a preference upon the distribution of assets. Under Delaware law, any corporation may purchase, redeem, receive, take or otherwise acquire, own and hold, sell, lend, exchange, transfer or otherwise dispose of, pledge, use and otherwise deal in and with its own shares, except that generally it may not purchase or redeem those shares if the capital of the corporation is impaired at the time or would become impaired as a result of the redemption. A corporation may, however, purchase or redeem capital shares that are entitled upon any distribution of its assets, whether by dividend or in liquidation, to a preference over another class or series of its shares if the shares will be retired upon their acquisition and the capital of the corporation is reduced. | Under Indian law no dividend shall be declared or paid by a company for any financial year except out of the profits of the company for that year arrived at after providing for depreciation in accordance with the provisions of sub-section (2), or out of the profits of the company for any previous financial year or years arrived at after providing for depreciation in accordance with the provisions of thatsub-section and remaining undistributed, or out of both provided that in computing profits any amount representing unrealized gains, notional gains or revaluation of assets and any change in carrying amount of an asset or of a liability on measurement of the asset or the liability at fair value shall be excluded. If the profits for a year are insufficient, the dividend for that year may be declared out of the accumulated profits earned in previous years and transferred to reserves, subject to the following conditions:(i) the rate of dividend declared shall not exceed the average of the rates at which dividend was declared by it in the 3 years immediately preceding that year. (ii) the total amount to be drawn from the accumulated profits from previous years and transferred to the reserves may not exceed an amount equivalent to one tenth of the paid-up capital and free reserves(iii) the amount so drawn shall first be utilized to set off the losses incurred in the financial year in which dividend is declared before any dividend in respect of the equity shares is declared. (iv) the balance of reserves after such withdrawal shall not fall below fifteen percent of its paid up share capital as appears in the latest audited financial statement. v) no company shall declare dividend unless previous losses and depreciation not provided in previous year or years are set off against profit of the company of the current year. Shareholders have a right to claim a dividend, after such dividend has been declared by the company at a general meeting. Shareholders also have a right to claim the interim dividends, which may be declared only pursuant to a resolution of the company’s board of directors provided that in the event the company has incurred loss during the current financial year up to the end of the quarter immediately preceding the date of declaration of an interim dividend, then such interim dividend shall not be declared at a rate higher than the average dividends declared by the company during the immediately preceding 3 financial years. Dividends may be paid in cash or by cheque or warrant or in any electronic mode to the shareholder. Where a dividend has been declared by a company but has not been paid within 30 days from the date of declaration to any shareholder entitled to the payment of such dividend, a penalty can be imposed on a director who is knowingly a party to such default. | |
241
Delaware Law | Indian Law | |
According to the Indian Companies Act, 2013, a company is empowered to purchase its own shares or other specified securities out of its free reserves, or the securities premium account or the proceeds of any shares or other specified securities (other than the kind of shares or other specified securities proposed to be bought back), subject to certain conditions including: (a) the buy-back must be authorized by the articles of association of the company; (b) a resolution must be passed by shareholders holding not less than 75.0% of the outstanding shares in the general meeting of the company authorizing thebuy-back; (c) thebuy-back is limited to 25.0% of the total paid up capital and free reserves; (d) the ratio of debt owed by the company must not be more than twice the capital and free reserves after suchbuy-back; and (e) thebuy-back must be in accordance with the SEBI(Buy-Back of Securities) Regulations, 1998.Conditions (a) and (b) mentioned above would not be applicable if the buy-back is for less than 10.0% of the totalpaid-up equity capital and free reserves of the company and suchbuy-back has been authorized by the Board of directors of the company. Further, a company buying back its securities is not permitted tobuy-back any additional securities for a period of 1 year after the buyback or to issue any securities of the same kind for a period of 6 months.A company is also prohibited from purchasing its own shares or specified securities directly or indirectly. | ||
Comparison of Corporate Governance Standards
The listing of our ADSs on the NYSE and our equity shares on the NSE and BSE cause us to be subject to NYSE listing standards and Indian corporate governance requirements set out in SEBI LODR Regulations.
The NYSE listing standards applicable to us, as a foreign private issuer, are considerably different from those applicable to companies incorporated in the United States. Under the NYSE rules, we need only (i) establish an independent audit committee that has specified responsibilities as described in the following table; (ii) provide prompt certification by our chief executive officer of any material
non-compliance
with any corporate governance rules of the NYSE; (iii) provide periodic (annual and interim) written affirmations to the NYSE with respect to our corporate governance practices; and (iv) provide a brief description of significant differences between our corporate governance practices and those followed by US companies.The corporate governance requirements which apply to us as a listed company on the NSE and BSE are contained in Regulation 17 to 27 and Regulation 46 of SEBI LODR Regulations, in accordance with the Listing Agreement that we have entered into with the NSE and BSE.
242
The following table summarizes certain material differences in the corporate governance standards applicable to us under the listing regulations in accordance with the listing agreements with the NSE and BSE as amended and the corporate governance standards for a NYSE-listed company, both to a typical US domestic issuer and the requirements that would be different for us as a foreign private issuer. SEBI, in its meeting held on March 28, 2018, have approved various recommendations of the Kotak Committee report on corporate governance. These recommendations have been notified by the SEBI from time to time for implementation through its various notifications.
Standard for NYSE-Listed Companies | SEBI LODR Regulations | |
Director Independence | ||
A majority of the board must consist of independent directors. Independence is defined by various criteria including the absence of a material relationship between the director and the listed company. For example, directors who are employees, are immediate family of an executive officer of the company or receive over $ 120,000 per year in direct compensation from the listed company are not independent. Directors who are employees of or otherwise affiliated through immediate family with the listed company’s independent auditor are also not independent. Determinations of independence were made by the board. The non-management directors must meet at regularly scheduled executive sessions without management.(The NYSE requirements for a board consisting of independent directors and non-management directors meeting at regularly scheduled executive sessions do not apply to us as a foreign private issuer.) | The board of directors have an optimum combination of executive and non-executive directors with at least one woman director and not less than fifty percent of the board of directors shall comprise ofnon-executive directors, provided top 500 listed entities shall have at least one independent woman director by April 1, 2019 and top 1,000 listed entities shall have at least one independent woman director by April 1, 2020 basis market capitalization at the end of immediate previous financial year. If the Chairman of the board of directors is an executive director, at least 50.0% of the board to comprise of independent directors and in case of anon-executive chairman, then at least one third of the board should comprise of independent directors, provided that where thenon-executive Chairman is a promoter of the company or is related to any promoter or person occupying a management position at the board of directors level or at one level below that, at least 50.0% of the board of directors should comprise of independent directors. Board must consist of a minimum of six directors for top 2000 listed entities based on market capitalisation at the end of previous financial year. Appoint a person or continue the directorship of any person as anon-executive director who has attained the age of 75 years unless a special resolution is passed to that effect indicating the justification for such appointment. With effect from April 1, 2022, the top 500 entities by market capitalization to have a Chairperson who is anon-executive director and not related to the Managing Director/CEO. Directors satisfy the criteria of being independent director as per the Companies Act, 2013 and the LODR other than nominee director and submits declaration confirming that they meet the criteria of independence. This has been subsequently amended from mandatory requirement to voluntary basis | |
Audit Committee | ||
| The audit committee must (i) be comprised entirely of independent directors; (ii) be directly responsible for the appointment, compensation, retention and oversight of any registered public accounting firm engaged (including resolution of disagreements between management and the auditor regarding financial reporting) for the purpose of preparing or issuing an audit report or performing other audit, review or attest services for the listed issuer, and each such registered public accounting firm must report directly to the audit committee; (iii) establish procedures for the receipt, retention and treatment of complaints with respect to accounting and auditing issues; (iv) establish procedures for the confidential, anonymous submission by employees of the listed issuer of concerns regarding questionable accounting or auditing matters; (v) be authorized to engage independent counsel and other advisers it deems necessary to perform its duties; and (vi) be given sufficient funding by the Board of directors to compensate the independent auditors and other advisors as well as for the payment of ordinary administrative expenses incurred by the committee that are necessary or appropriate in carrying out its duties. | The Audit Committee must comprise of minimum three directors as members of which two third member to be independent directors wherein all shall be financially literate and atleast one member must have accounting and related financial management expertise and the Chairperson to be an Independent Director. Their role include: Oversight of financial reporting, Auditors, Internal Audit, Internal financial controls, Risk Management and Governance. The pripncipal duties and responsibilities of the Audit Committee is mentioned under the head of Audit Committee above. Details on the scope may be referred. The committee shall meet atleast four times in a year and not more than 120 days shall elapse between two meetings. The quorum requirement is either two members or one-third, whichever is greater, with atleast two independent directors. | |
243
Standard for NYSE-Listed Companies | SEBI (LODR) Regulations, 2015 | |
The audit committee must consist of at least three members, and each member must be independent within the meaning established by the NYSE and Rule 10A-3 under the Exchange Act. The audit committee members must be financially literate or become financially literate within a reasonable period of their appointment to the audit committee.Each listed company must have disclosed whether its Board of directors has identified an audit committee financial expert (as defined under applicable rules of the SEC) and if not, the reasons why the Board has not done so. The audit committee must have a written charter that addresses the committee’s purpose and responsibilities. At a minimum, the committee’s purpose must be to assist the Board in the oversight of the integrity of the company’s financial statements, the company’s compliance with legal and regulatory requirements, the independent auditor’s qualifications and independence and the performance of the company’s internal audit function and independent auditors. The duties and responsibilities of the audit committee include conducting a review of the independent auditing firm’s annual report describing the firm’s internal quality control procedures, any material issues raised by the most recent internal quality control review or peer review of the firm and any steps taken to address such issues. The audit committee is also to assess the auditor’s independence by reviewing all relationships between the company and its auditor. It must establish the company’s hiring guidelines for employees and former employees of the independent auditor. The committee must also discuss the company’s annual audited financial statements and quarterly financial statements with management and the independent auditors, the company’s earnings press releases, as well as financial information and earnings guidance provided to analysts and rating agencies, and policies with respect to risk assessment and risk management. Each listed company must have an internal audit function The committee must also meet separately, periodically, with management, with internal auditors (or other personnel responsible for the internal audit function) and with independent auditors and review with the independent auditor any audit problems or difficulties and management’s response. The committee must report regularly to the Board. (The NYSE audit committee requirements apply to us as foreign private issuers and we are not exempt from this requirement.) | ||
244
Standard for NYSE-Listed Companies | SEBI (LODR) Regulations, 2015 | |
Compensation Committee | ||
| Listed companies must have a compensation committee composed entirely of independent board members as defined by the NYSE listing standards. | The listed entity shall set up a nomination and remuneration committee which shall comprise at least three directors, all of whom shall be non-executive directors and at least half shall be independent. Chairman of the committee shall be an independent director. | |
The committee must have a written charter that addresses its purpose and responsibilities. These responsibilities include (i) reviewing and approving corporate goals and objectives relevant to CEO compensation; (ii) evaluating CEO performance and compensation in light of such goals and objectives for the CEO; (iii) based on such evaluation, reviewing and approving CEO compensation levels; (iv) recommending to the board non-CEO compensation, incentive compensation plans and equity-based plans; and (v) producing a report on executive compensation as required by the SEC to be included in the company’s annual proxy statement or annual report. The committee must also conduct an annual performance self-evaluation.(The NYSE compensation committee requirements allow us, as a foreign private issuer, to follow our home country rules in this regard. We comply with our home country rules applicable to the Compensation Committee.) | The principal duties and responsibilities of the Nomination and Remuneration Committee is mentioned under the head of Nomination and Remuneration Committee above. Details on the scope may be referred The quorum for a meeting of the nomination and remuneration committee shall be either two members or one third of the members of the committee, whichever is greater, including at least one independent director in attendance. The nomination and remuneration committee shall meet at least once in a year | |
Nominating corporate governance | ||
Listed companies must have a nominating/corporate governance committee composed entirely of independent board members. The committee must have a written charter that addresses its purpose and responsibilities, which include (i) identifying individuals qualified to become board members; (ii) selecting, or recommending that the board select, the director nominees for the next annual meeting of shareholders; (iii) developing and recommending to the board a set of corporate governance principles applicable to the company; (iv) overseeing the evaluation of the board and management; and (v) conducting an annual performance evaluation of the committee. (The NYSE nominating/corporate governance committee requirements do not apply to us as a foreign private issuer.) | There is no requirement of a nomination corporate governance Committee. The scope and responsibilities of this committee is similar in line with the Nomination and Remuneration Committee. | |
Corporate Governance Guidelines | ||
Listed companies must adopt and disclose corporate governance guidelines. (The NYSE requirement that corporate governance guidelines be adopted does not apply to us as a foreign private issuer. However, we must disclose differences between the corporate governance standards to which we are subject and those of the NYSE.) | Corporate governance requirements for listed companies in India are included in Regulation 17 to 27 and 46 of SEBI LODR Regulations. | |
Code of business conduct and ethics | ||
All listed companies, United States and foreign, must adopt and disclose a code of business conduct and ethics for directors, officers and employees, and promptly disclose any waivers of the code for directors or executive officers. (The NYSE requirement for a code of business conduct and ethics does not apply to us as a foreign private issuer.) | The board of directors shall lay down a code of conduct for all board members and senior management of a listed company. This code of conduct is required to be posted on the website of the company. Further, all board members and senior management personnel are required to affirm compliance with the code on an annual basis and the company’s annual report must contain a declaration to this effect signed by its CEO. Regulation 17(5)(b) and Regulation 25(5) of SEBI LODR Regulations: • The Code of Conduct shall suitably incorporate the duties of independent directors as laid down in the Companies Act, 2013. An independent director shall be held liable, only in respect of such acts of omission or commission by a company which had occurred with his knowledge, attributable through board processes, and with his consent or connivance or where he had not acted diligently with respect of the provisions contained in the SEBI LODR Regulations. | |
245
C. Material Contracts
See “” for details.
Item 7: Major Shareholders and Related Party Transactions – B. Related Party Transactions – Related Party Transactions
Outstanding loans
See “” of Notes to the Consolidated Financial Statements for details.
Note
22: Borrowings
D. Exchange Controls
General
Ownership of Indian companies by
non-residents
is regulated by the GoI and RBI under the provisions of Foreign Exchange Management Act of 1999 (‘FEMA’), as amended, read with the rules, regulations and notifications issued under FEMA (‘Foreign Exchange Control Regulations’). Foreign investment in securities issued by Indian companies is generally regulated by the Foreign Exchange Control Regulations. A person resident outside India can transfer any security of an Indian company or any other security to any person only in accordance with the terms and conditions specified under Foreign Exchange Control Regulations made thereunder or as permitted by the RBI.Foreign Direct Investment
The GoI regulates ownership of Indian companies by foreigners. Foreign investment in Indian securities is generally regulated by the Foreign Exchange Management Act, 1999. The Foreign Exchange Management Act, 1999 (‘FEMA’), is read together with a series of rules and regulations issued thereunder by the RBI and GoI, which permits transactions involving the inflow or outflow of foreign exchange and empowers the RBI / GoI to prohibit or regulate such transactions.
FEMA permits most current account transactions involving foreign exchange except those prohibited or restricted by the RBI. FEMA has eased restrictions on current account transactions. However, the GoI and RBI continue to exercise control over capital account transactions (i.e., those that alter the assets or liabilities, including contingent liabilities, of persons). The GoI and RBI have issued rules under FEMA to regulate various kinds of capital account transactions, including certain aspects of the purchase and issuance of shares of Indian companies.
Investment in non - debt instruments (includes equity shares, convertible debentures, preference shares and share warrants, depository receipts (“DRs”) issued against equity instruments, etc.) of an Indian company by a person resident outside India shall be under Foreign Exchange Management
(Non-debt
Instruments) Rules, 2019, as amended from time to time.FDI in India can be either through the automatic route or through the government approval route. Over a period of time, the GoI / RBI has relaxed the restrictions on FDI. FDI policy provides details regarding the specified sectoral regulatory bodies whose approval is required for foreign investments. As per the FDI Policy, certain notified sectors/activities requiring government approval should now approach the concerned administrative ministry or department. For instance, FDI proposals relating to mining sector would require approval by Ministry of Mines. FDI proposals requiring government approval for other residuary sectors not covered under the specified sector list would require to be approved by Department of Industrial Policy and Promotion (‘DIPP’) the authority identified by Department for Promotion of Industry and Internal Trade (DPIIT).
An entity of a country, which shares land border with India or the beneficial owner of an investment into India is situated in or is citizen of any such country, can invest in an Indian Company, only with the prior approval of the concerned administrative ministry / department as identified by the DPIIT. Further, a citizen of Pakistan or an entity incorporated in Pakistan can invest, only under the government approval route, in sectors/activities other than defence, space and atomic energy and sectors/activities prohibited for foreign investment.
Subject to certain conditions, under current regulations, FDI in most industry sectors are under automatic route if the percentage of equity holding by all foreign investors does not exceed specified industry-specific thresholds. These conditions include certain minimum pricing requirements, compliance with the SEBI (Substantial Acquisition of Shares and Takeovers) Regulations, 2011, as amended, (‘the Takeover Code’), exit and ownership restrictions based on the nature of the foreign investor. FDI is prohibited in certain sectors such as the lottery business, gambling and betting, atomic energy, chit funds, Nidhi companies, trading in Transferable Development Rights, railways (other than permitted activities), real estate business or construction of farm houses [other than development of townships, construction of residential/commercial premises, roads or bridges and real estate investment trusts registered and regulated under the SEBI (REITs) Regulations 2014], and manufacturing of cigars, etc.
FDI policy lays down guidelines for calculation of direct and indirect foreign investment in an Indian company.
246
A person residing outside India (other than a citizen of countries mentioned above) or any entity incorporated outside India (other than an entity incorporated in countries mentioned above and an overseas corporate body as defined in FEMA) has general permission to purchase equity shares (including partly paid up shares), convertible debentures or convertible preference shares of an Indian company (mandatorily required to be fully and compulsorily convertible), subject to certain terms and conditions.
Currently, subject to certain exceptions, investment on
non-repatriation
basis by aNon-resident
Indian (NRI) or an Overseas Citizen of India (OCI), including a company, a trust and a partnership firm incorporated outside India and owned and controlled by NRIs or OCIs, in equity instrument issued by Indian companies do not require the prior approval of the RBI subject to prohibition of investment in a Nidhi company or investment in Indian companies engaged in agricultural/plantation activities or real estate business (other than development of townships, construction of residential and commercial premises, roads or bridges and real investment trusts registered and regulated under the SEBI (REITs) Regulations 2014) or construction of farm houses or dealing in Transfer of Development Rights. The GoI has indicated that in all cases where FDI is allowed on an automatic route, RBI would continue to be the primary agency for the purposes of monitoring and regulating foreign investment.As per the FDI Policy, downstream investment means indirect foreign investment (an investment by an Indian company/Limited Liability Partnership (‘LLP’) or an investment vehicle which in turn, has foreign investment), into another Indian company/LLP, by way of subscription or acquisition. Downstream investment by an Indian company/LLP, which is owned and/or controlled by
non-resident
entities, into another Indian company/LLP, must be in accordance with the relevant sectoral conditions and caps with regard to the sectors in which the latter Indian company/LLP is operating.Downstream investments by Indian companies/LLP will be subject to the following conditions:
| • | Such an Indian Company/LLP or an investment vehicle is to notify RBI and the Secretariat for Industrial Assistance, DPIIT of its downstream investment in Form DI within 30 days of such investment, even if equity instruments have not been allotted along with the modality of investment in new/existing ventures (with/without expansion program); |
| • | Downstream investment by way of induction of foreign investment in an existing Indian company/LLP to be duly supported by a resolution of the board of directors as also a shareholders agreement, if any; |
| • | Issue/transfer/pricing/valuation of shares shall be in accordance with applicable SEBI/RBI guidelines; |
| • | For the purpose of downstream investment, the Indian Companies/LLP making the downstream investments would have to bring in requisite funds from abroad and not leverage funds from the domestic market. This would, however, not preclude downstream companies/LLPs, with operations, from raising debt in the domestic market. Downstream investments through internal accruals are permissible by an Indian Company/LLP subject to certain conditions provided under FDI policy. For the purposes of foreign investment policy, internal accruals will mean profits transferred to reserve accounts after payment of taxes. |
We are majorly controlled by a
non-resident
entity and hence all downstream investments made by us are subject to the above conditions.Vedanta Limited is engaged in the following businesses:
| • | Mining and processing of aluminum, copper and zinc, iron ore FDI up to 100.0% is permitted under the automatic route, subject to the Mines and Minerals (Development and Regulation) Act, 1957. |
| • | Exploration of oil and natural gas – FDI up to 100.0% is permitted under the automatic route. |
| • | Power generation (majorly Thermal power and remaining from renewable energy sources) – 100% FDI is permitted under automatic route subject to the provisions of The Electricity Act, 2003 |
| • | For steel, FDI upto 100% is permitted under the automatic route. |
Investment by
Non-Resident
Indians or an Overseas Citizen of India (“OCI”)A variety of methods for investing in shares of Indian companies are available to NRIs. Each NRI or OCI can purchase on repatriation basis, on a recognized stock exchange in India, up to 5.0% of the total
paid-up
equity capital on a fully diluted basis or 5.0 % of thepaid-up
value of each series of debentures or preference shares or share warrants issued by an Indian company, subject to the condition that the total holdings of all NRIs and OCIs put together does not exceed 10.0% of thepaid-up
equity capital on a fully diluted basis or shall not exceed ten percent of thepaid-up
value of each series of debentures or preference shares or share warrants. The aggregate ceiling limit of 10.0% limit may be raised to 24.0% if a special resolution is passed in a general meeting of the shareholders of the Company. In addition to the above, NRIs may also make foreign direct investments in Indian companies under the FDI route discussed above. These methods allow NRIs to make portfolio investments in shares and other securities of Indian companies on a basis not generally available to other foreign investors.247
Investment by Foreign Portfolio Investors
The SEBI (Foreign Portfolio Investors) Regulations, 2019 (‘FPI Regulations’) guide the eligibility criteria to become a foreign portfolio investor, registrations requirements and investments restrictions applicable to investors known as the foreign portfolio investors (‘FPIs’). FPIs are required to be registered with the designated depositary participant on behalf of the SEBI subject to compliance, with ‘Know Your Customer’ norms. FPIs are permitted to invest only in certain securities, including but not limited to securities in the primary and secondary markets (including shares, debentures and warrants of companies, listed or to be listed on a recognized stock exchange in India), derivatives traded on a recognized stock exchange, treasury bills, dated government securities, and such other instruments specified by the SEBI from time to time.
A single FPI or an investor group is permitted to invest in equity capital of an Indian company listed or to be listed on a recognised stock exchange in India. The total holding by each FPI or an investor group, shall be less than 10.0% of the total
paid-up
equity capital on a fully diluted basis or less than 10 percent of thepaid-up
value of each series of debentures or preference shares or share warrants issued by an Indian company and the total holdings of all FPIs put together, including any other direct and indirect foreign investments in the Indian company by FPIs permitted under these rules, shall not exceed the sectoral caps applicable to the Indian company as laid out in Foreign Exchange Management(Non-debt
Instruments) Rules, 2019Subject to compliance with all applicable Indian laws, rules, regulations, guidelines and approvals in terms of the FPI Regulations, an FPI, registered as a Category I FPI, may issue or otherwise deal in offshore derivative instruments (as defined under the FPI Regulations) directly or indirectly, only in the event (i) such offshore derivative instruments are issued only to persons eligible for registration as Category I foreign portfolio investors; and (ii) such offshore derivative instruments are issued after compliance with ‘Know Your Client’ norms. An FPI shall ensure that any transfer of offshore derivative instruments issued by or on behalf of the FPI, is made subject to the following conditions: (a) such offshore derivative instruments are transferred to persons subject to fulfillment of regulation 21 (1) of FPI Regulations; and (b) prior consent of the FPI is obtained for such transfer, except when the persons to whom the offshore derivative instruments are to be transferred to are
pre-approved
by the FPI.The portfolio investor registered in accordance with the FPI Regulations may be called ‘Registered Foreign Portfolio Investor (“RFPI”).
Accordingly, any transaction involving dealing in securities by a RFPI shall be only through registered broker subject to certain exceptions including but not limited to (i) in an open offer in accordance with the Takeover Code or (ii) in an open offer in accordance with the SEBI (Delisting of Equity Shares) Regulations, 2009 [replaced by Securities and Exchange Board of India (Delisting of Equity Shares) Regulations, 2021]; or (iii) through buyback of shares by a listed Indian company in accordance with the Securities and Exchange Board of India
(Buy-back
of Securities) Regulations, 2018; (iv) in any bid for, or acquisition of securities in response to an offer for disinvestment of shares made by the Central Government or any state government; or (v) in any transaction in securities pursuant to an agreement entered into with merchant banker in the process of market making or subscribing to unsubscribed portion of the issue in accordance with Chapter IX of the Securities and Exchange Board of India (Issue of Capital and Disclosure Requirements) Regulations, 2018.An RFPI may invest in government securities and corporate debt subject to limits specified by the RBI and SEBI from time to time and to trade in all exchange traded derivative contracts on the stock exchanges in India subject to the position limits as specified by SEBI from time to time.
ADSs
Issue of ADSs
Issue of securities through the depository receipt mechanism by Indian companies is governed by the Companies Act, 2013 (Companies Act), the Companies (Issue of Global Depository Receipts) Rules, 2014 (“Depository Receipts Rules”) and the Depository Receipts Scheme, 2014 (the “DR Scheme”). The GoI approved the DR Scheme on October 21, 2014, which came into force on December 15, 2014. Consequently, the Issue of Foreign Currency Convertible Bonds and Ordinary Shares (Through Depository Receipt Mechanism) Scheme, 1993 (the “1993 Scheme”) has been repealed except to the extent relating to foreign currency convertible bonds. The RBI also issued a circular on January 22, 2015, highlighting the salient features of the DR Scheme.
SEBI vide circular dated October 10, 2019 (‘Current DR framework’) has provided a detailed framework for issue of depository receipts. The Current DR framework inter – alia provides that:
| • | Only ‘a company incorporated in India and listed on a recognized stock exchange in India’ may issue permissible securities or their holders may transfer permissible securities, for the purpose of issue of depository receipts (DRs), subject to compliance with the requirements specified therein. The Current DR framework provides permissible securities to mean equity shares and debt securities, which are in dematerialized form and rank pari passu with the securities issued and listed on a recognized stock exchange. |
248
| • | Listed company shall ensure that DRs are issued only with permissible securities as the underlying i.e., equity shares and debt securities, which are in dematerialized form and rank pari passu with the securities issued and listed on a recognized stock exchange. |
| • | Listed company shall be permitted to issue permissible securities or transfer permissible securities of existing holders, for the purpose of issue of DRs, only in permissible jurisdictions and said DRs shall be listed on any of the specified international exchange(s) of the permissible jurisdiction. Permissible jurisdiction shall mean jurisdictions as may be notified by the Central Government from time to time, pursuant to notification no. G.S.R. 669(E) dated September 18, 2019 in respect of sub-rule 1 of rule 9 of Prevention of Money-Laundering (Maintenance of Records) Rules, 2005. In this regard, SEBI vide circular dated November 18, 2019 has provided a list of permissible jurisdictions and international exchange(s) which inter alia, includes the International Financial Services Centre in India. |
| • | Previously, under the DR Scheme, companies were only required to comply with eligibility requirements pertaining to prohibition from accessing capital markets or dealing in securities. However, the current framework prescribes certain additional requirements, including not being declared as a willful defaulter or a fugitive economic offender. |
| • | Listed company shall ensure compliance with extant laws relating to issuance of DRs, including, requirements prescribed in this Circular, the Companies Act, 2013, FEMA, Prevention of Money-Laundering Act, 2002, and rules and regulations made thereunder. For this purpose, listed company may also enter into necessary arrangements with Custodian, Indian Depository and Foreign Depository. |
| • | Listed company shall ensure that the aggregate of permissible securities which may be issued or transferred for the purpose of issue of DRs, along with permissible securities already held by persons resident outside India, shall not exceed the limit on foreign holding of such permissible securities under the applicable regulations of FEMA. However, the listed company to ensure compliance with minimum public shareholding requirement after excluding the permissible securities held by the depository for the purpose of issue of DRs. |
| • | Listed company shall ensure that any public disclosures made by the listed company on International Exchange(s) in compliance with the requirements of the permissible jurisdiction where the DRs are listed or of the international exchange(s), are also filed with the recognized stock exchange as soon as reasonably possible but not later than twenty-four hours from the date of filing. |
| • | Where permissible securities are issued by a listed company or ‘transferred by the existing holders’, for the purpose of issue of DRs by the Foreign Depository, the same shall be issued at a price, not less than the price applicable to a corresponding mode of issue of such permissible securities to domestic investors under the applicable laws. |
| • | A permissible holder i.e., holder of DRs (including its beneficial owner) excludes an Indian and a non – resident Indian (‘NRI’), which is over and above the requirements of the DR Scheme. However, the SEBI through its circular dated December 18, 2020, has permitted the issuance of DRs to NRIs, pursuant to: (a) share based employee benefit schemes which are implemented by a company in terms of SEBI (Share Based Employee Benefits) Regulations 2014 [now replaced by Securities and Exchange Board of India (Share Based Employee Benefits and Sweat Equity) Regulations, 2021], (b) a bonus issue or (c) a rights issue. |
| • | In terms of the DR Scheme, while the exercise of voting rights on the shares underlying the DRs could be dealt with contractually under the deposit agreement, if such voting rights were not exercisable by the DR holders, the shares would not be counted towards minimum public shareholding requirements. However, as per the Current DR framework, listed company shall ensure that the agreement entered between the holder of DRs, the listed company and the Depository provides that the voting rights on permissible securities, if any, shall be exercised by the DR holder through the Foreign Depository pursuant to voting instruction only from such DR holder. |
The SEBI circular issued on October 1, 2020, requires listed companies to appoint one of the Indian Depository as the “Designated Depository” for the purpose of monitoring of limits in respect of DRs.
The summary provided above is based on laws applicable as on March 31, 2022 and is not intended to constitute a complete analysis of all laws applicable to the Company and its securities or a substitute for professional legal advice.
Delivery of underlying shares of ADs and Sale of the Equity Shares Underlying the ADSs
Pursuant to RBI directions in this regard, a
non-resident
holder of ADRs/GDRs issued by a company registered in India, on surrender of such ADRs/GDRs, can acquire the underlying shares when such shares are released by the Indian Custodian of the ADR/GDR issue. Further, the company whose shares are so released, or a Depository shall enter in the register or books, wherein such securities are registered or inscribed, an address outside India of thenon-resident
holder of shares.Foreign investors holding ADSs or equity shares equal to or more than 25.0% of the company’s total equity capital/voting rights may be required to make a public announcement of offer to the remaining shareholders of the company under the Takeover Code, on any further acquisition of equity capital/voting rights or ADSs equal to or more than 5.0% by the foreign investor.
249
Other than mutual funds that may purchase ADSs subject to terms and conditions specified by the RBI and employees in connection with stock options, a person resident in India is not permitted to hold ADSs of an Indian company. An ADSs holder is permitted to surrender the ADSs held by him in an Indian company and to receive the underlying equity shares under the terms of the deposit agreement.
Corporate Actions
The ADSs holders are entitled to receive the benefits of corporate actions such as bonus, split and dividend in proportion to the number of equity shares represented by the ADS. The benefits are subject to the terms and conditions of the FEMA regulations and the offer documents of ADSs issue.
Transfer of Shares
The RBI has now granted general permission to person’s resident outside India to transfer shares and convertible debentures held by them to an Indian resident, subject to compliance with certain terms and conditions (including pricing norms) and reporting requirements. A resident who wishes to purchase shares from a
non-resident
must, pursuant to the relevant notice requirements, file a declaration with an authorized dealer in the prescribed FormFC-TRS
within 60 days from the date of receipt of the amount of consideration, together with the relevant documents and file an acknowledgment thereof with the Indian company to effect transfer of the shares.A
non-resident
may also transfer any security to a person resident in India by way of gift. The transfer of shares from an Indian resident to anon-resident
does not require the prior approval of the GoI or the RBI if the activities of the investee company are under the automatic route pursuant to the FDI Policy and are not under the specified financial services sector, thenon-resident
shareholding is within sector limits under the FDI policy, and the pricing is in accordance with the guidelines prescribed by SEBI and the RBI.The RBI has granted general permission for the transfer of shares by a person resident outside India to a person resident in India, subject to compliance with certain pricing norms and reporting requirements.
E. Taxation
India Taxation
The following is a summary of the material Indian income tax, stamp duty and estate duty consequences of the purchase, ownership and disposal of the ADSs and the equity shares underlying the ADSs for
non-resident
investors of the ADSs. The summary only addresses the tax consequences for non- resident investors who hold the ADSs or the equity shares underlying the ADSs as capital assets and does not address the tax consequences which may be relvant to other classes ofnon-resident
investors, including dealers. The summary proceeds on the basis that the investor continues to remain a non- resident when the income by way of dividends and capital gains are earned. The summary is based on Indian tax laws and relevant interpretations thereof as are in force as of the date of this Annual Report, including the Income Tax Act and the special tax regimes under Sections 115AC of the Income Tax Act read with the Issue of Foreign Currency Convertible Bonds and Ordinary Shares (Through Depository Receipt Mechanism) Scheme, 1993, as amended, which provides for the taxation of persons resident in India on their global income and persons not resident in India on income received, accruing or arising in India or deemed to have been received, accrued or arisen in India, and is subject to change.The Finance Act 2013 had introduced General Anti Avoidance Rule (“GAAR”), wherein the tax authority may declare an arrangement as an impermissible avoidance arrangement if an arrangement is not entered at arm’s length, results in misuse/abuse of provisions of Income Tax Act, 1961, lacks commercial substance or the purpose of arrangement is obtaining a tax benefit. If any of our transactions are found to be ‘impermissible avoidance arrangements’ under GAAR, our business may be affected.
The GAAR was originally proposed to become effective from April 1, 2013. Thereafter, a panel was formed to study the proposed GAAR, and make suitable recommendations. In September 2013, the GoI notified rules regarding the applicability of GAAR provisions. In the Finance Act 2015 it was proposed that the implementation of GAAR be deferred by two years and GAAR provisions were made applicable to the income of fiscal year 2018 and subsequent years by an amendment of the Income Tax Act. Further, investments made up to March 31, 2017 are protected from the applicability of the GAAR amendment in the relevant rules in this regard.
This summary is not intended to constitute a complete analysis of all the tax consequences for a
non-resident
investor under Indian law in relation to the acquisition, ownership and disposal of the ADSs or the equity shares underlying the ADSs and does not deal with all possible tax consequences relating to an investment in the equity shares and ADSs, such as the tax consequences under state, local and other (for example,non-Indian)
tax laws.250
Residence
For the purpose of the Income Tax Act, an individual is considered to be a resident of India during fiscal year if he is in India for at least 182 days in a particular year or at least 60 days in a particular year and for a period or periods aggregating at least 365 days in the preceding 4 years. However, the 60 days period shall be read as 182 days in the case of (i) a citizen of India who leaves India in the previous year for employment outside India, or (ii) a citizen of India or a person of Indian origin living abroad who visits India. Previously, a company was considered to be resident in India if it was incorporated in India or the control and management of its affairs is situated wholly in India during the relevant fiscal year. However, the Finance Act 2015 changed the criteria for deciding the residential status of a company in India by stating that the place of effective management of a company would be the critical factor for such determination. Individuals and companies who are not residents of India based on the above mentioned criteria are treated as 500 million or less in a financial year.
non-residents.
In the Finance Act 2016, place of effective management compliance has been deferred by one year. The new requirements have been made applicable from assessment year2017-18.
The Indian Income Tax department has further clarified that guidelines regarding the place of effective management shall not be applicable to companies having turnover of₹
Taxation of Sale of the ADSs
It is unclear whether capital gains derived from the sale by a
non-resident
investor of rights in respect of ADSs will be subject to tax liability in India. This will depend on the view taken by Indian tax authorities on the position with respect to the situs of the rights being transferred in respect of the ADSs. The Finance Act, 2012 retrospectively amended the term “property” so as to include any rights in or in relation to an Indian company. Therefore, situs of right in respect of ADSs may be considered as situated in India. Nevertheless, under the ADRs Scheme and as per section 47(viia) of theIncome-tax
Act, the transfer of ADSs outside India by anon-resident
holder to anothernon-resident
does not give rise to any capital gain tax in India. Under the ADRs Scheme, conversion of ADSs into equity shares shall not give rise to any capital gain tax in India.ADSs are considered as long-term capital assets if they are held for a period of more than 36 months otherwise they are considered as short-term capital assets. Section 115AC of the Income Tax Act provides that income by way of long-term capital gains arising from the transfer of ADSs by the non- resident holder is taxed at the rate of 10.0% plus applicable surcharge and education cess; short term capital gains on such a transfer is taxed at the rate of 30.0% (40.0% in case of a foreign company) plus applicable surcharge and education cess. Because there are significant intricacies relating to application of rules on indirect transfers, it is not clear, whether or to what extent, a buyer of ADSs of the company should be held liable for not withholding tax on the acquisition of shares or be subject to Indian tax on gains realized on disposition of ADS. However, the
non-resident
investor may examine exemption, if any available to him, from such taxation under the relevant Double Taxation Agreement between India and country of his residence.Taxation of Dividends
The Finance Act 2020 has repealed the DDT. Dividend received will be taxable in the hands of recipient. The remittance of dividends outside India is governed by Indian law on foreign exchange and is also subject to withholding tax at applicable rates effective from April 1, 2020.
Dividends paid prior to April 1, 2020, to
non-resident
holders of ADSs are not presently subject to tax in the hands of the recipient. However, the company that is distributing the dividend was liable to pay a “DDT” at the rate of 15.0% (on a gross basis) plus a surcharge of 10.0% and an education cess at the rate of 3.0%. According to the Finance (No. 2) Act, 2014, DDT is to be levied on gross distributable surplus amount instead of amount paid net of taxes. This resulted in an increase in the DDT to more than 20.0%, from 16.995% in the earlier years which was applicable to the dividends declared, distributed or paid on or after October 1, 2014. According to the Finance Act 2015, the surcharge on dividend tax has increased from 10.0% to 12.0%, and the effective DDT rate is 20.35% with effect from April 1, 2016. The Finance Act, 2018 increased the rate of cess from 3.0% to 4.0% which will result in an effective DDT rate of 20.6% from April 1, 2018. Under Section 115O(1A) of the Income Tax Act 1961, an Indian company, subject to certain conditions, can set off the dividend income received from its subsidiaries against the amount of dividend declared and distributed by it to its shareholders, therefore reducing the DDT to the extent of suchset-off.
Any distribution of additional ADSs or equity shares to resident or
non-resident
shareholders will not be subject to any Indian tax.Further, the Finance Act 2016 has provided that any income earned by an individual, Hindu Undivided Family or a firm, who is a resident in India, by way of dividend declared, distributed or paid by any domestic company in excess of 1,000,000 in aggregate shall be chargeable to tax at the rate of 10.0% on gross basis on such amount exceeding 1,000,000. With the introduction of Finance Act 2017, this provision will be applicable only to specified assessees (specified assessee means a person other than domestic company, charitable trusts registered under section 12 A or 10 (23C) of the Finance Act 2017).
₹
₹
251
Taxation of Sale of the Equity Shares
Sale of equity shares by any holder may occasion certain incidence of tax in India, as discussed below. Under applicable law, the sale of equity shares may be subject to a transaction tax and/or tax on income by way of capital gains. Capital gains accruing to a
non-resident
investor on the sale of the equity shares, whether to an Indian resident or to a person resident outside India and whether in India or outside India, may be subject to Indian capital gains tax in certain instances as described below.Sale of the Equity Shares on a Recognized Stock Exchange
Shares listed on recognized stock exchange in India issued on conversion of the ADSs held by the
non-resident
investor for a period of more than 12 months is treated as long term capital assets, otherwise they are considered as short term capital asset. Unlisted shares are treated as long-term capital assets, if they are held for more than 24 months, otherwise they are treated as short-term capital assets.Subject to the following, long-term capital gains realized by a
non-resident
upon the sale of equity shares obtained on conversion of ADSs. are subject to tax at a rate of 10.0% along with the applicable surcharge and education cess; and short-term capital gains on such a transfer will be taxed at the rate of tax applicable to the seller.| • | Long-term capital gain realized by a non-resident upon the sale of equity shares obtained on conversion of ADSs is exempt from tax if the sale of such shares is made on a recognized stock exchange and Securities Transaction Tax, or STT (described below) is paid. However, the Finance Act 2018 effective from fiscal year2018-19, has removed this exemption and long-term capital gain on sale of listed shares, on which STT is paid, is also taxable at 10.0% |
| • | Any short-term capital gain is taxed at 15.0% along with the applicable surcharge and education cess, if the sale of such equity shares is settled on a recognized stock exchange and STT is paid on such sale. |
In accordance with applicable Indian tax laws, any income arising from a sale of the equity shares of an Indian company through a recognized stock exchange in India is subject to a securities transaction tax. Such tax is payable by a person irrespective of residential status and is collected by the recognized stock exchange in India on which the sale of the equity shares is affected.
Withholding tax on capital gains on sale of shares to
non-resident
is required to be deducted under Section 195 of the Income Tax Act at the prescribed rates.For the purpose of computing capital gains on the sale of equity shares, the sale consideration received or accruing on such sale shall be reduced by the cost of acquisition of such equity shares and any expenditure incurred wholly and exclusively in connection with such sale. Under the Issue of Foreign Currency Convertible Bonds and Ordinary Shares (Through Depository Receipt Mechanism) Scheme, 1993, or Scheme, the purchase price of equity shares in India listed company received in exchange for ADSs will be the market price of the underlying shares on the date that the depositary gives notice to the custodian of the delivery of equity shares in exchange for such corresponding ADSs. The market price is the price of the equity shares prevailing in the BSE or the NSE as applicable. There is no corresponding provision under the Income Tax Act providing for the use of market price as the basis for determination of the purchase price of the equity shares. In the event that the tax department denies the use of market price as the basis for determination of the purchase price of the equity shares, the original purchase price of the ADSs shall be considered as the purchase price of the equity shares for computing the capital gains tax
.
According to the Scheme, a
non-resident’s
holding period for the purpose of determining the applicable capital gains tax rate relating to equity shares received in exchange for ADSs commences on the date of notice of redemption by the depositary to the custodian.Securities Transaction Tax
Since October 1, 2004, with respect to a sale and purchase of equity shares entered into on a recognized stock exchange, (i) both the buyer and seller are required to pay a Securities Transaction Tax (STT) at the rate of 0.1% of the transaction value of the securities, if the transaction is a delivery based transaction, i.e. the transaction involves actual delivery or transfer of shares; the rate of 0.1% has been substituted for 0.125% by the Finance Act, 2012 with effect from July 1, 2012. (ii) the seller of the shares is required to pay a STT at the rate of 0.025% of the transaction value of the securities if the transaction is a
non-delivery
based transaction, i.e. a transaction settled without taking delivery of the shares. STT is levied with respect to a sale and purchase of a derivative and the rates of STT as amended by Finance Act, 2013 with effect from June 1, 2013 is as follows: (i) in case of sale of an option in securities, the seller is required to pay an STT at the rate of 0.017% of the option premium; (ii) in case of a sale of an option in securities, where the option is exercised, the buyer is required to pay a STT at the rate of 0.125% of the settlement price; and (iii) in case of sale of futures in securities, the seller is required to pay STT at 0.017% on transaction value. This rate of 0.017% changed to 0.01% under the Finance Act, 2013.252
Capital Losses
The losses arising from a transfer of a capital asset in India can only be set off against capital gains and not against any other income in accordance with the Income Tax Act. A long-term capital loss may be set off only against a long-term capital gain. To the extent the losses are not absorbed in the year of transfer, they may be carried forward for a period of eight years immediately succeeding the year for which the loss was first computed and may be set off against the long-term capital gains assessable for such subsequent years. In order to get the benefit of
set-off
of the capital losses in this manner, thenon-resident
investor must file appropriate and timely tax returns in India.Tax Treaties
The above mentioned tax rates and the consequent taxation are subject to any benefits available to a
non-resident
investor under the provisions of any agreement for the avoidance of double taxation entered into by the GoI with the country of tax residence of suchnon-resident
investor. The investors are advised to consult their tax advisors the residential status for the purpose of treaty benefits in the event the investments are made through special purpose vehicle in an overseas jurisdiction.Withholding Tax on Capital Gains
Any taxable gain realized by a
non-resident
from the sale of ADSs shall be subject to withholding tax of 10.0% at source and withheld by the buyer. However, no withholding tax is required to be withheld under Section 196D-(2) of the Income Tax Act from any income accruing to a FII as defined in Section 115AD of the Income Tax Act on the transfer of securities. The FII is required to pay the tax on its own behalf.Buy-Back
of SecuritiesIndian companies are not subject to tax on the
buy-back
of their equity shares which are listed on a stock exchange. However, such shareholders will be taxed on the resulting gains from the sharebuy-back.
We would be required to withhold tax at source in proportion to the capital gains tax liability of our shareholders.Stamp Duty
Upon the issuance of the equity shares underlying the ADSs, we are required to pay a stamp duty for each equity share equal to 0.1% of the issue price. Under Indian stamp law, no stamp duty is payable on the acquisition or transfer of equity shares in book-entry form. However, a sale of equity shares by a
non-resident
holder will be subject to Indian stamp duty at the rate of 0.25% on the market value of equity shares on the trade date, although such duty is customarily borne by the transferee. A transfer of ADSs is not subject to Indian stamp duty.Service Tax
Till June 30, 2017, brokerage or commission fees paid to stockbrokers in connection with the sale or purchase of equity shares were subject to Indian service tax at the effective tax rate of 15.0% (including Swachh Bharat Cess of 0.5% and Krishi Kalyan Cess of 0.5% of taxable value) collected by the stockbroker. Further, pursuant to Section 65(101) of the Finance Act (2 of the 2004) a
sub-broker
was also subject to this service tax. With effect from July 1, 2017, service tax was subsumed under GST.Goods and Service Tax (GST)
With effect from July 1, 2017, service tax was subsumed under GST. Swachh Bharat Cess and Krishi Kalyan Cess were abolished. Therefore, brokerage or commission fees paid to stockbrokers in connection with the sale or purchase of equity shares became subject to GST at the rate of 18.0% and
sub-
brokers also became subject to GST at the same rate.Minimum Alternate Tax
The Income Tax Act imposes a Minimum Alternate Tax on companies wherein the income tax payable on the total income is less than 18.5% of its book profit. The MAT is payable at the rate of 18.5% plus applicable surcharge and cess. The Finance Act 2013 increased the surcharge on income of domestic companies having taxable income above 100 million ($ 1 million) from 5.0% to 10.0% which resulted in the increase in the effective MAT rate for such companies from 20.01% to 20.96%. The Finance Act, 2015 has increased the surcharge to 12.0% which resulted in an increase in the effective MAT rate for such companies to 21.34% which has been increased to 21.5% from April 1, 2018. Amounts paid as MAT may be applied towards regular income taxes payable in any of the succeeding 15 years (as amended by the Finance Act 2017) subject to certain conditions. The manner of computing the MAT which can be claimed as a credit is specified in the Income Tax Act. The Finance Act, 2007, included income eligible for deductions under section 10A and 10B of the Act in the computation of book profits for the levy of MAT, and determined that MAT is payable on income which falls within the ambit of section 10A and 10B of the Act.
₹
253
The Amendment Act 2019 reduced MAT base tax rate from 18.5% to 15% plus applicable surcharge and cess. The effective MAT rate for all Indian Company for fiscal year 2020 2021 and 2022 would be 17.47%, 17.47% and 17.47% respectively. Further, companies opting for concessional tax regime (as explained above) would not be required to pay MAT. For
non-resident
foreign companies effective MAT rate as per the Tax Amendment Act 2019 was reduced from 20.01% to 16.38% of the book profit.Tax Credit
A
non-resident
investor may be entitled to a tax credit with respect to any withholding tax paid by us or any other person for suchnon-resident
investor’s account in accordance with the applicable laws of the applicable jurisdiction.United States Federal Income Taxation
The following discussion describes certain material United States federal income tax consequences to US Holders (defined below) under present law of an investment in the ADSs or equity shares. This summary applies only to investors that hold the ADSs or equity shares as capital assets (generally, property held for investment) and that have the US dollar as their functional currency. This discussion is based on the United States Internal Revenue Code of 1986, as amended, as in effect on the date of this Annual Report and on United States Treasury regulations in effect or, in some cases, proposed, as of the date of this Annual Report, as well as judicial and administrative interpretations thereof available on or before such date. All of the foregoing authorities are subject to change, which change could apply retroactively and could affect the tax consequences described below. The summary below does not discuss certain United States federal tax consequences that may be relevant to a particular US Holder’s particular circumstance, such as Medicare contribution tax on net investment income.
The following discussion neither deals with the tax consequences to any particular investor nor describes all of the tax consequences applicable to persons in special tax situations such as:
| • | banks; |
| • | certain financial institutions; |
| • | insurance companies; |
| • | regulated investment companies; |
| • | real estate investment trusts; |
| • | broker dealers; |
| • | United States expatriates; |
| • | traders that elect to use the mark-to-market |
| • | tax-exempt entities; |
| • | persons liable for the alternative minimum tax; |
| • | persons holding an ADSs or equity share as part of a straddle, hedging, conversion or integrated transaction; |
| • | persons that actually or constructively own 10.0% or more of our stock, by total combined voting power or by value; |
| • | persons subject to special tax accounting rules as a result of any item of gross income with respect to our ADSs or equity shares being taken into account in an applicable financial statement; |
| • | persons who acquired ADSs or equity shares pursuant to the exercise of any employee share option or otherwise as compensation; or |
| • | persons holding ADSs or equity shares through partnerships or other pass-through entities. |
INVESTORS SHOULD CONSULT THEIR TAX ADVISORS ABOUT THE APPLICATION OF THE UNITED STATES FEDERAL TAX RULES TO THEIR PARTICULAR CIRCUMSTANCES AS WELL AS THE STATE AND LOCAL, FOREIGN AND OTHER TAX CONSEQUENCES TO THEM OF THE OWNERSHIP AND DISPOSITION OF ADSs OR EQUITY SHARES.
The discussion below of the United States federal income tax consequences to “US Holders” will apply to you if you are a beneficial owner of ADSs or equity shares and you are, for United States federal income tax purposes;
| • | an individual who is a citizen or resident of the United States; |
254
| • | a corporation (or other entity taxable as a corporation for United states federal income tax purposes) created or organized in the United States or under the laws of the United States, any State thereof or the District of Columbia; |
| • | an estate, the income of which is subject to United States federal income taxation regardless of its source; or |
| • | a trust that (1) is subject to the primary supervision of a Court within the United States and the control of one or more United States persons for all substantial decisions of the trust or (2) was in existence on August 20, 1996, was treated as a domestic trust on the previous day and has a valid election in effect under the applicable United States Treasury regulations to be treated as a United States person. |
If an entity or arrangement treated as a partnership for United States federal income tax purposes holds ADSs or equity shares, the tax treatment of a partner will generally depend upon the status and the activities of the partnership. A US Holder that is a partner in a partnership holding ADSs or equity shares is urged to consult its tax advisor.
The discussion below assumes that the representations contained in the deposit agreement are true and that the obligations in the deposit agreement and any related agreement will be complied with in accordance with their terms. If you hold ADSs, you should be treated as the holder of the underlying equity shares represented by those ADSs for United States federal income tax purposes.
The United States Treasury has expressed concerns that parties to whom ADSs are
pre-released
may be taking actions that are inconsistent with the claiming, by US Holders of ADSs, of foreign tax credits for United States federal income tax purposes. Such actions would also be inconsistent with the claiming of the reduced rate of tax applicable to dividends received by certainnon-corporate
US Holders, as described below. Accordingly, the availability of foreign tax credits or the reduced tax rate for dividends received by certainnon-corporate
US Holders could be affected by future actions that may be taken by the United States Treasury or parties to whom ADSs arepre-released.
Taxation of Dividends and Other Distributions on the ADSs or Equity Shares
Subject to the PFIC rules discussed below, the gross amount of any distributions we make to you with respect to the ADSs or equity shares (including the amount of any Indian taxes withheld therefrom, if any) generally will be includible in your gross income as foreign source dividend income on the date of receipt by the depository, in the case of ADSs, or by you, in the case of equity shares, but only to the extent that the distribution is paid out of our current or accumulated earnings and profits (as determined under United States federal income tax principles). Any such dividends will not be eligible for the dividends received deduction allowed to corporations in respect of dividends received from other United States corporations. To the extent that the amount of the distribution exceeds our current and accumulated earnings and profits (as determined under United States federal income tax principles), such excess amount will be treated first as a
tax-free
return of your tax basis in your ADSs or equity shares, and then, to the extent such excess amount exceeds your tax basis in your ADSs or equity shares, as capital gain. However, we currently do not, and we do not intend to calculate our earnings and profits under United States federal income tax principles. Therefore, a US Holder should expect that any distribution will generally be reported as a dividend even if that distribution would otherwise be treated as anon-taxable
return of capital or as capital gain under the rules described above.With respect to certain
non-corporate
US Holders, including individual US Holders, dividends may be taxed at the lower applicable capital gains rate applicable to “qualified dividend income”, provided that (1) the ADSs or equity shares, as applicable, are readily tradable on an established securities market in the United States or we are eligible for the benefits of the United States-India income tax treaty (the “Treaty”), (2) we are neither a PFIC nor treated as such with respect to you (as discussed below) for the taxable year in which the dividend is paid or the preceding taxable year, and (3) the equity shares are held for a holding period of more than 60 days during the 121 – day period beginning 60 days before theex-dividend
date. Under US Internal Revenue Service authority, equity shares or ADSs representing such shares, are considered for the purpose of clause (1) above to be readily tradable on an established securities market in the United States if they are listed on the NYSE, as our ADSs currently are. You should consult your tax advisors regarding the availability of the lower capital gains rate applicable to qualified dividend income for any dividends paid with respect to our ADSs or equity shares.Any dividends will constitute foreign source income for foreign tax credit limitation purposes. Subject to certain complex conditions and limitations, India taxes withheld on any dividends may be eligible for credit against a U.S. Holder’s federal income tax liability. If a refund of the tax withheld is available under the laws of India or if the tax withheld exceeds the amount applicable under the Treaty, the amount of tax withheld that is refundable or that represents the excess portion will not be eligible for such credit against a U.S. Holder’s U.S. federal income tax liability (and will not be eligible for the deduction against U.S. federal taxable income). If the dividends are taxed as qualified dividend income (as discussed above), the amount of the dividend taken into account for purposes of calculating the foreign tax credit limitation will in general be limited to the gross amount of the dividend, multiplied by the reduced tax rate applicable to qualified dividend income and divided by the highest tax rate normally applicable to dividends. The limitation on foreign taxes eligible for credit is calculated separately with respect to specific classes of income. For this purpose, any dividends distributed by us with respect to ADSs or equity shares will generally constitute “passive category income”. The rules relating to the determination of the foreign tax credit are complex and US Holders should consult their tax advisors to determine whether and to what extent a credit would be available in their particular circumstances, including the effects of any applicable income tax treaties.
255
Taxation of a Disposition of ADSs or Equity Shares
Subject to the PFIC rules discussed below, upon a sale or other disposition of ADSs or equity shares, a US Holder will generally recognize a capital gain or loss for United States federal income tax purposes in an amount equal to the difference between the amount realized for the ADSs or equity share and such US Holder’s tax basis in such ADSs and equity shares. Any such gain or loss will be treated as long-term capital gain or loss if the US Holder’s holding period in the ADSs and equity shares at the time of the disposition exceeds one year. Long-term capital gain of individual US Holders generally will be subject to United States federal income tax at reduced tax rates. The deductibility of capital losses is subject to limitations. Any such gain or loss that you recognize generally will be treated as United States source income or loss for foreign tax credit limitation purposes.
Because gains generally will be treated as United States source gain, as a result of the United States foreign tax credit limitation, any Indian income tax imposed upon capital gains in respect of ADSs or equity shares (as discussed under “”, “,” “,” “” and “”) may not be currently creditable unless a US Holder has other foreign source income for the year in the appropriate United States foreign tax credit limitation basket. US Holders should consult their tax advisors regarding the application of Indian taxes to a disposition of an ADSs or equity share and their ability to credit an Indian tax against their United States federal income tax liability.
India Taxation - Taxation of Sale of the ADSs
India Taxation - Taxation of Sale of the Equity Shares
India Taxation - Sale of the Equity Shares on a Recognized Stock Exchange
India Taxation - Sale of the Equity Shares otherwise than on a Recognized Stock Exchange
India Taxation -
Buy-Back
of SecuritiesPassive Foreign Investment Company
Based on the market prices of our equity shares and ADSs and the composition of our income and assets, including goodwill, although not clear, we do not believe we were a PFIC for United States federal income tax purposes for our taxable year ended March 31, 2021. However, the application of the PFIC rules is subject to uncertainty in several respects and, therefore, the US Internal Revenue Service may assert that, contrary to our belief, we were a PFIC for such taxable year. Moreover, although the asset test (defined below) is required to be calculated based on the fair market value of our assets, we did not do a valuation of our assets and our belief that we were not a PFIC for our taxable year ended March 31, 2021 is, in part, based on the book value of our assets. In addition, we must make a separate determination each taxable year as to whether we are a PFIC (after the close of each taxable year). Accordingly, we cannot assure you we will not be a PFIC for the taxable year ending on March 31, 2022 or any future taxable year.
A
non-United
States corporation will be a PFIC for United States federal income tax purposes for any taxable year if, applying certain look-through rules either:| • | at least 75.0% of its gross income for such taxable year is passive income, or |
| • | at least 50.0% of the total value of its assets (based on an average of the quarterly values of the assets during such year) is attributable to assets, including cash, that produce passive income or are held for the production of passive income (the asset test). |
For this purpose, we will be treated as owning our proportionate share of the assets and earning our proportionate share of the income of any other corporation in which we own, directly or indirectly, 25.0% (by value) of the stock. A separate determination must be made after the close of each taxable year as to whether we were a PFIC for that year. Because the value of our assets for purposes of the PFIC test will generally be determined by reference to the market price of our equity shares and ADSs, which has historically been volatile, fluctuations in the market price of our equity shares and ADSs may cause us to become a PFIC. In addition, changes in the composition of our income or assets may cause us to become a PFIC. While we still believe we were not a PFIC for our taxable year ended March 31, 2021, there is no guarantee that the U.S. Internal Revenue service would agree such on position.
If we are a PFIC for any taxable year during which you hold ADSs or equity shares, we generally will continue to be treated as a PFIC with respect to you for all succeeding years during which you hold our equity shares or ADSs, unless we cease to be a PFIC and you make a “deemed sale” election with respect to the equity shares or ADSs. If such election is timely made, you will be deemed to have sold the ADSs and equity shares you hold at their fair market value on the last day of the last taxable year in which we qualified as a PFIC and any gain from such deemed sale would be subject to the consequences described in the following two paragraphs. In addition, a new holding period would be deemed to begin for the equity shares and ADSs for purposes of the PFIC rules. After the deemed sale election, your equity shares or ADSs with respect to which the deemed sale election was made will not be treated as shares in a PFIC unless we subsequently become a PFIC.
256
For each taxable year that we are treated as a PFIC with respect to you, you will be subject to special tax rules with respect to any “excess distribution” that you receive and any gain you recognize from a sale or other disposition (including a deemed sale discussed in the precedent paragraph and a pledge) of the ADSs or equity shares, unless you make aelection as discussed below. Distributions you receive in a taxable year that are greater than 125.0% of the average annual distributions you received during the shorter of the three preceding taxable years or your holding period for the ADSs or equity shares will be treated as an excess distribution. Under these special tax rules:
“mark-to-market”
| • | the excess distribution or gain will be allocated rateably over your holding period for the ADSs or equity shares; |
| • | the amount allocated to the current taxable year, and any taxable year in your holding period prior to the first taxable year in which we were a PFIC, will be treated as ordinary income; and |
| • | the amount allocated to each other year will be subject to the highest tax rate in effect for individuals or corporations, as applicable, for each such year and the interest charge generally applicable to underpayments of tax will be imposed on the resulting tax attributable to each such year. |
In addition,”) if we are a PFIC in the taxable year in which such dividends are paid or in the preceding taxable year.
non-corporate
US Holders will not be eligible for reduced rates of taxation on any dividends received from us (as described above under “Taxation of Dividends and Other Distributions on the ADSs or Equity Shares
The tax liability for amounts allocated to taxable years prior to the year of disposition or “excess distribution” cannot be offset by any net operating losses for such years, and gains (but not losses) realized on the sale or other disposition of the ADSs or equity shares cannot be treated as capital, even if you hold the ADSs or equity shares as capital assets.
If we are treated as PFIC with respect to you for any taxable year, to the extent any of our subsidiaries are also PFICs or we make direct or indirect equity investments in other entities that are PFICs, you may be deemed to own shares in such lower-tier PFICs that are directly or indirectly owned by us in that proportion which the value of the ADSs and equity shares you own bears to the value of all of the ADSs and equity shares, and you may be subject to the adverse tax consequences described in the preceding two paragraphs with respect to the shares of such lower-tier PFICs that you would be deemed to own. You should consult your tax advisor regarding the applicability of the PFIC rules to any of our PFIC subsidiaries.
A US Holder of “marketable stock” (as defined below) in a PFIC may make aelection for such stock to elect out of the PFIC rules described above regarding excess distributions and recognized gains. If you make a validelection for the ADSs or equity shares, you will include in income for each year that we are a PFIC an amount equal to the excess, if any, of the fair market value of the ADSs or equity shares as of the close of your taxable year over your adjusted basis in such ADSs or equity shares. You will be allowed a deduction for the excess, if any, of the adjusted basis of the ADSs or equity shares over their fair market value as of the close of the taxable year. However, deductions are allowable only to the extent of any netgains on the ADSs or equity shares included in your income for prior taxable years. Amounts included in your income under aelection, as well as gain on the actual sale or other disposition of the ADSs or equity shares will be treated as ordinary income. Ordinary loss treatment will also apply to the deductible portion of anyloss on the ADSs or equity shares, as well as to any loss realized on the actual sale or other disposition of the ADSs or equity shares, to the extent that the amount of such loss does not exceed the netgains previously included for such ADSs or equity shares. Your basis in the ADSs or equity shares will be adjusted to reflect any such income or loss amounts. If you make aelection, any distributions that we make would generally be subject to the tax rules discussed above under “”, except that the lower rate applicable to qualified dividend income (discussed above) would not apply.
mark-to-market
mark-to-market
mark-to-market
mark-to-market
mark-to-market
mark-to-market
mark-to-market
Taxation of Dividends and Other Distributions on the ADSs or Equity Shares
Theelection is available only for “marketable stock”, which is stock that is traded in other than de minimis quantities on at least 15 days during each calendar quarter (“regularly traded”) on a qualified exchange or other market, as defined in the applicable United States Treasury regulations. The NYSE is a qualified exchange. Our ADSs are listed on the NYSE and, consequently, if you are a holder of ADSs and the ADSs are regularly traded, theelection would be available to you if we become a PFIC. Because aelection cannot be made for equity interests in any lower-tier PFICs we own, a US Holder may continue to be subject to the PFIC rules with respect to its indirect interest in any investments held by us that are treated as an equity interest in a PFIC for United States federal income tax purposes. You should consult your tax advisors as to the availability and desirability of aelection, as well as the impact of such election on interests in any lower-tier PFICs.
mark-to-market
mark-to-market
mark-to-market
mark-to-market
Alternatively, if a
non-United
States corporation is a PFIC, a holder of shares in that corporation may avoid taxation under the PFIC rules described above regarding excess distributions and recognized gains by making a “qualified electing fund” election to include in income its share of the corporation’s income on a current basis. However, you may make a qualified electing fund election with respect to our ADSs or equity shares only if we agree to furnish you annually with certain tax information, and we currently do not intend to prepare or provide such information.Unless otherwise provided by the United States Treasury, each US Holder of a PFIC is required to file an annual report containing such information as the United States Treasury may require. If we are or become a PFIC, you should consult your tax advisor regarding any reporting requirements that may apply to you.
You should consult your tax advisor regarding the application of the PFIC rules to your investment in ADSs or equity shares.
257
Information Reporting and Backup Withholding
Any dividend payments with respect to ADSs or equity shares and proceeds from the sale, exchange, redemption or other disposition of ADSs or equity shares may be subject to information reporting to the US Internal Revenue Service and possible United States backup withholding. Backup withholding will not apply, however, to a US Holder who furnishes a correct taxpayer identification number and makes any other required certification or who is otherwise exempt from backup withholding. US Holders who are required to establish their exempt status generally must provide such certification on Internal Revenue Service Form
W-9.
US Holders should consult their tax advisors regarding the application of the United States information reporting and backup withholding rules.Backup withholding is not an additional tax. Amounts withheld as backup withholding may be credited against your United States federal income tax liability, and you may obtain a refund of any excess amounts withheld under the backup withholding rules by timely filing the appropriate claim for refund with the US Internal Revenue Service and furnishing any required information.
Additional Reporting Requirements
Certain US Holders who are individuals (and certain entities) are required to report information relating to an interest in our ADSs or equity shares, subject to certain exceptions (including an exception for ADSs and equity shares held in accounts maintained by certain financial institutions). US Holders should consult their tax advisors regarding the effect, if any, of these rules on the ownership and disposition of our ADSs or equity shares.
F. Dividends and Paying Agents
Not applicable
G. Statements by Experts
Not applicable
H. Documents on Display
Publicly filed documents concerning our Company which are referred to in this Annual Report may be inspected and copied at the public reference facilities maintained by the SEC at 100 F Street, N.E., Washington, D.C. 20549. Copies of these materials can also be obtained from the Public Reference Room at the SEC’s principal office, 100 F Street, N.E., Washington D.C. 20549, after payment of fees at prescribed rates.
The SEC maintains a website atthat contains reports, proxy and information statements and other information regarding registrants that make electronic filings through its Electronic Data Gathering, Analysis, and Retrieval (“EDGAR system”). We have made all our filings with SEC using the EDGAR system.
www.sec.gov
I. Subsidiary Information
Not applicable
ITEM 11. | QUANTITATIVE AND QUALITATIVE DISCLOSURES ABOUT MARKET RISK |
The Company’s businesses are subject to several risks and uncertainties including commodity price risk and financial risks such as liquidity, foreign currency, interest rate and credit risk. See “” of Notes to the Consolidated Financial Statements for disclosures on financial instruments and market risk.
Note 25: Financial Instruments
ITEM 12. | DESCRIPTION OF SECURITIES OTHER THAN EQUITY SECURITIES |
A. Debt Securities
Not applicable
B. Warrants and Rights
Not applicable
C. Other Securities
Not applicable
258
D. American Depositary Shares
Our ADRs facility was maintained with Citibank, N.A., or the Depositary, pursuant to a deposit agreement, dated as of September 6, 2013 as amended from time to time, among us, our Depositary and the holders and beneficial owners of our ADSs. We use the term “holder” in this discussion to refer to the person in whose name ADRs is registered in the books of the Depositary. The deposit agreement has expired now as ADRs have been delisted. In accordance with the deposit agreement, the Depositary may charge fees up to the amounts described below:
Sl. No. | Type of Service | Fees | Payer | |||
| 1 | Issuance of ADSs upon the deposit of ordinary shares (excluding issuances as a result of distributions described in paragraph 4 below) | Up to $ 5 per 100 ADSs (or any portion thereof) issued | Person depositing ordinary shares or person receiving ADSs | |||
| 2 | Delivery of Deposited Securities (as defined under the Deposit Agreement) against surrender of ADSs | Up to $ 5 per 100 ADSs (or any portion thereof) surrendered | Person surrendering ADSs for purpose of withdrawal of Deposited Securities or person to whom Deposited Securities are delivered | |||
| 3 | Distribution of cash dividends or other cash distributions (i.e. sale of rights and other entitlements) | Up to $ 2 per 100 ADSs (or any portion thereof) held | Person to whom distribution is made | |||
| 4 | Distribution of ADSs pursuant to (i) stock dividends or other free stock distributions, or (ii) exercise of rights to purchase additional ADSs | Up to $ 5 per 100 ADSs (or any portion thereof) held | Person to whom distribution is made | |||
| 5 | Distribution of securities other than ADSs or rights to purchase additional ADSs (i.e. spin-off shares) | Up to $ 5 per 100 ADSs (or any portion thereof) held | Person to whom distribution is made | |||
| 6 | Depositary services | Up to $ 2 per 100 ADSs (or any portion thereof) held | Person holding ADSs on applicable record date(s) established by the Depositary | |||
| 7 | Transfer of ADRs | Up to $ 1.5 per certificate presented for transfer | Person presenting certificate for transfer |
In addition, holders or beneficial owners of our ADSs, persons depositing ordinary shares for deposit and persons surrendering ADSs for cancellation and withdrawal of deposited securities will be required to pay the following charges:
| • | taxes (including applicable interest and penalties) and other governmental charges; |
| • | registration fees for the registration of ordinary shares or other deposited securities on the share register and applicable to transfers of ordinary shares or other deposited securities to or from the name of the custodian, the Depositary or any nominees upon the making of deposits and withdrawals; |
| • | certain cable, telex, facsimile and electronic transmission and delivery expenses; |
| • | expenses and charges incurred by the Depositary in the conversion of foreign currency; |
| • | fees and expenses incurred by the Depositary in connection with compliance with exchange control regulations and other regulatory requirements applicable to ordinary shares, deposited securities, ADSs and ADRs; |
| • | fees and expenses incurred by the Depositary in connection with the delivery of deposited securities; and |
| • | fees and expenses incurred by the Depositary, the custodian, or any nominee in connection with the servicing or delivery of deposited securities. |
In the case of cash distributions, the applicable fees, charges, expenses and taxes will be deducted from the cash being distributed. In the case of distributions other than cash, such as share dividends, the distribution generally will be subject to appropriate adjustments for the deduction of the applicable fees, charges, expenses and taxes.
In certain circumstances, the Depositary may dispose of all or a portion of such distribution and distribute the net proceeds of such sale to the holders of ADS, after deduction of applicable fees, charges, expenses and taxes. If the Depositary determines that any distribution in property is subject to any tax or other governmental charge which the Depositary is obligated to withhold, the Depositary may withhold the amount required to be withheld and may dispose of all or a portion of such property in such amounts and in such manner as the Depositary deems necessary and appropriate to pay such taxes or charges and the Depositary will distribute the net proceeds of any such sale after deduction of such taxes or charges to the holders of ADSs entitled to the distribution.
During fiscal year 2022, the Depositary has reimbursed to us an amount of $ 2,775,025.60 (after deduction of applicable withholding taxes amounting to $ 1,189,296.70) with respect to investor relations expenses.
259
PART II
ITEM 13. | DEFAULTS, DIVIDEND ARREARAGES AND DELINQUENCIES |
There has been no material default in the payment of principal or interest.
ITEM 14. | MATERIAL MODIFICATIONS TO THE RIGHTS OF SECURITY HOLDERS AND USE OF PROCEEDS |
ADSs offering in 2009
On July 16, 2009, we completed the ADSs offering on the NYSE. We sold an aggregate of 131,906,011 ADSs representing 131,906,011 equity shares. The price per ADSs was $ 12.15. The joint book runners of the ADSs offering were J.P. Morgan Securities Inc. and Morgan Stanley & Co. International plc. The joint book runners exercised their over-allotment option to acquire an additional 8,449,221 ADSs at $ 12.15 per ADSs. The aggregate price of the offering amount, including the over-allotment option, registered, and sold was $ 1,603 million.
The registration statement on Form
F-3
(FileNo. 333-160580)
filed by us in connection with the ADSs offering was automatically effective on July 15, 2009. The net proceeds from the offering to us, after deducting underwriting discounts and commissions and offering expenses ($ 14 million), amounted to $ 1,589 million. As of March 31, 2014, we have used the entire proceeds for the purpose mentioned in the offer document. Pursuant to theRe-
organization Transactions, each holder of the SIIL ADSs, received three Vedanta Limited ADSs for every five existing SIIL ADSs.The total outstanding Vedanta Limited ADSs as of March 31, 2022 were Nil.
ITEM 15. | CONTROLS AND PROCEDURES |
(a) Disclosure Controls and Procedures
As required by Rules
13a-15
and15d-15
under the Exchange Act, management, including our Chief Executive Officer and our Acting Chief Financial Officer, has evaluated the effectiveness of our disclosure controls and procedures as of the end of the period covered by this report. Disclosure controls and procedures refer to controls and other procedures designed to ensure that information required to be disclosed in the reports we file or submit under the Exchange Act is recorded, processed, summarized and reported, within the time periods specified in the rules and forms of the SEC. Disclosure controls and procedures include, without limitation, controls and procedures designed to ensure that information required to be disclosed by us in our reports that we file or submit under the Exchange Act is accumulated and communicated to management, including our principal executive and principal financial officers, or persons performing similar functions, as appropriate to allow timely decisions regarding our required disclosure.Our Chief Executive Officer and our Acting Chief Financial Officer have concluded that, as of March 31, 2022, our disclosure controls and procedures were effective.
(b) Management’s Annual Report on Internal Control over Financial Reporting
Our management is responsible for establishing and maintaining adequate internal controls over financial reporting, as such term is defined in Rule 13a15(f) of the Exchange Act.
Internal controls over financial reporting refers to a process designed by, or under the supervision of, our Chief Executive Officer and Acting Chief Financial Officer and effected by our board of directors, management and other personnel, to provide reasonable assurance regarding the reliability of financial reporting and the preparation of financial statements for external reporting purposes in accordance with IFRS as issued by the IASB.
Our internal control over financial reporting includes those policies and procedures that, (1) pertain to the maintenance of records that, in reasonable detail, accurately and fairly reflect the transactions and dispositions of our assets; (2) provide reasonable assurance that transactions are recorded as necessary to permit preparation of our financial statements in accordance with generally accepted accounting principles, and that our receipts and expenditures are being made only in accordance with authorizations of our management and directors; and (3) provide reasonable assurance regarding prevention or timely detection of unauthorized acquisition, use or disposition of our assets that could have a material effect on our consolidated financial statements.
Our management assessed the effectiveness of internal control over financial reporting as of March 31, 2022 based on the criteria established in Internal Control – Integrated Framework (2013) issued by the Committee of Sponsoring Organizations of the Treadway Commission. As a result of this assessment, management concluded that, as of March 31, 2022, our internal control over financial reporting was effective in providing reasonable assurance regarding the reliability of financial reporting and the preparation of financial statements and related disclosure controls for external purposes in accordance with generally accepted accounting principles. The scope of our management’s assessment of the effectiveness of internal control over financial reporting includes all of our company’s consolidated operations.
260
Remediation of Previously Reported Material Weakness
As disclosed in the Company’s 20-F for the fiscal year ended March 31, 2021, a material weakness was identified related to design and operation of our internal controls over financial reporting design and operation of controls (a) as a result of lack of board policies and procedures related to the authorization of significant related party transactions, that the subsidiaries of Vedanta Limited undertook. Consequentially, certain subsidiaries of Vedanta Limited granted loans and guarantees to our controlling shareholders and their affiliates, as described in Note 35(b) of the Consolidated Financial Statements, as per the prevailing internal policies and regulations, which did not mandate prior approval of the Board of Vedanta Limited; and (b) over determination of the fair values of financial instruments executed with related parties. As a result, the Company did not appropriately value and record the aforementioned loans and guarantees to its controlling shareholders on a timely basis. Consequently, there was a material error in our interim consolidated financial statements as at and for the six months ended September 30, 2020, which was subsequently rectified in the consolidated financial statements for the year ended March 31, 2021.
During the previous year, our management took significant measures to successfully remediate the previously identified material weakness. As part of remediation plan, we have updated our policies and procedures regarding authorizations for such related party transactions which now require that every related party transaction proposed to be undertaken by the subsidiaries outside our Group would need prior approval from the Board and/or the Audit Committee of Vedanta Limited. For further details please refer to Vedanta’s accounting policy on Related party transaction available on Vedanta website. Further in current year, we have implemented new controls over estimation of the fair values of financial instruments entered into with our related parties, whereby the rationale for every input used in determination of the fair value is documented and reviewed by the management. Management performed testing and concluded that, through this testing, the previously identified material weakness relating to certain control deficiencies in the design and operation of our internal control over financial reporting in connection with the preparation of our consolidated financial statements has been remediated as of March 31, 2022.
Our management recognizes that there are inherent limitations in the effectiveness of any system of internal control over financial reporting, including the possibility of human error and the circumvention or override of internal control. Accordingly, even effective internal control over financial reporting can provide only reasonable assurance with respect to financial statement preparation and may not prevent or detect all misstatements and can only provide reasonable assurance with respect to the preparation and presentation of our financial statements.
The effectiveness of our internal control over financial reporting as at March 31, 2022 has been audited by S.R. Batliboi & Co. LLP, India, our independent registered public accounting firm, as stated in their report which is reproduced in its entirety in Item 15(c) below:
(c) Attestation Report of the Registered Public Accounting Firm
Report of Independent Registered Public Accounting Firm
To the Shareholders and the Board of Directors of Vedanta Limited
Opinion on Internal Control over Financial Reporting
We have audited Vedanta Limited and its subsidiaries’ internal control over financial reporting as of March 31, 2022, based on criteria established in Internal Control—Integrated Framework issued by the Committee of Sponsoring Organizations of the Treadway Commission (2013 framework) (the COSO criteria). In our opinion, Vedanta Limited and its subsidiaries (the Group) maintained, in all material respects, effective internal control over financial reporting as of March 31, 2022, based on the COSO criteria.
We also have audited, in accordance with the standards of the Public Company Accounting Oversight Board (United States) (PCAOB), the consolidated statements of financial position of the Group as of March 31, 2022 and 2021, the related consolidated statements of profit and loss, comprehensive income, cash flows and changes in equity for each of the three years in the period ended March 31, 2022, and the related notes and our report dated August 1, 2022 expressed an unqualified opinion thereon.
Basis for Opinion
The Company’s management is responsible for maintaining effective internal control over financial reporting and for its assessment of the effectiveness of internal control over financial reporting included in the accompanying Management’s Annual Report on Internal Control over Financial Reporting. Our responsibility is to express an opinion on the Group’s internal control over financial reporting based on our audit. We are a public accounting firm registered with the PCAOB and are required to be independent with respect to the Group in accordance with the U.S. federal securities laws and the applicable rules and regulations of the Securities and Exchange Commission and the PCAOB.
We conducted our audit in accordance with the standards of the PCAOB. Those standards require that we plan and perform the audit to obtain reasonable assurance about whether effective internal control over financial reporting was maintained in all material respects.
Our audit included obtaining an understanding of internal control over financial reporting, assessing the risk that a material weakness exists, testing and evaluating the design and operating effectiveness of internal control based on the assessed risk, and performing such other procedures as we considered necessary in the circumstances. We believe that our audit provides a reasonable basis for our opinion.
261
Definition and Limitations of Internal Control Over Financial Reporting
A company’s internal control over financial reporting is a process designed to provide reasonable assurance regarding the reliability of financial reporting and the preparation of financial statements for external purposes in accordance with generally accepted accounting principles. A company’s internal control over financial reporting includes those policies and procedures that (1) pertain to the maintenance of records that, in reasonable detail, accurately and fairly reflect the transactions and dispositions of the assets of the company; (2) provide reasonable assurance that transactions are recorded as necessary to permit preparation of financial statements in accordance with generally accepted accounting principles, and that receipts and expenditures of the company are being made only in accordance with authorizations of management and directors of the company; and (3) provide reasonable assurance regarding prevention or timely detection of unauthorized acquisition, use, or disposition of the company’s assets that could have a material effect on the financial statements.
Because of its inherent limitations, internal control over financial reporting may not prevent or detect misstatements. Also, projections of any evaluation of effectiveness to future periods are subject to the risk that controls may become inadequate because of changes in conditions, or that the degree of compliance with the policies or procedures may deteriorate.
/s/ S. R. Batliboi & Co. LLP
Gurugram, India
August 1, 2022
(d) Changes in Internal Control over Financial Reporting
Management has evaluated, with the participation of our Chief Executive Officer and our Deputy Chief Financial Officer, whether any changes in our internal control over financial reporting that occurred during our last fiscal year have materially affected, or are reasonably likely to materially affect, our internal control over financial reporting. Based on the evaluation we conducted, except for the remediation efforts described above in respect of the material weaknesses identified in the previous year, management has concluded that no such changes have occurred in fiscal year 2022.
ITEM 16A. | AUDIT COMMITTEE FINANCIAL EXPERT |
Our Board has determined that Dindayal Jalan, an independent director and a member of our audit committee (now known as Audit and Risk Management Committee) qualifies as an “audit committee financial expert” within the requirements of the rules promulgated by the SEC relating to audit committee. Dindayal Jalan satisfies the “independence” requirements of Rulefor the experience and qualifications of the members of the Audit committee and also see “for the details of members of Audit committee.
10A-3
of the exchange act and the NYSE rules. See “Item 6: Directors, senior management and employees – A. Directors and Senior Management”
Item 6: Directors, senior management and employees – C. Board practices – Committees of board – Audit committee”
ITEM 16B. | CODE OF ETHICS |
We have adopted a written Code of Business Conduct and Ethics that is applicable to all our directors, senior management, executive officers, and employees. We amended our Code of Business Conduct and Ethics in October 2014. We added certain provisions including applicable provisions relating to the U.K Bribery Act, 2010, particularly on the meaning, scope and application of the terms bribery, corruption, fraud, gifts, entertainment and political contributions to the Company and our employees. As an issuer of securities in the United States, we are subject to the US Foreign Corrupt Practices Act (FCPA). Our businesses in other countries shall comply with their respective anti-corruption laws. Additionally, in accordance with the Companies Act, 2013 and the amendment in the listing agreement of stock exchanges in India, the Code of Business Conduct and Ethics was amended to incorporate the duties of the Independent Directors. The Code of Business Conduct and Ethics was amended in April 2015, elaborating on competition law and fair dealing. In addition to this amendment, the Code of Business Conduct and Ethics was further amended at the board meeting held in July 2015, to refresh the core purposes and values of the Company. During fiscal year 2017, the Health, Safety and Environment section in the Company’s Code of Business Conduct and Ethics was amended to reflect applicable provisions relating to the U.K. Modern Slavery Act, 2015, particularly by including a Slavery and Trafficking Statement including the steps taken that slavery and human trafficking is not taking place, either in our business or supply chains.
The Board in its meeting held on January 28, 2022, approved the revised Code of Business Conduct and Ethics of the Company ensuring all the relevant principle of business ethics and integrity were covered and each of these principles aligned in structured sequence.
We have posted the code on our website at –https://www.vedantalimited.com/CorporateGovernance/Code%20of%20Business%20Conduct%20and%20Ethics.pdf
Information contained in our website does not constitute a part of this Annual Report. We will also make available a copy of the Code of Business Conduct and Ethics to any person, without charge, if a written request is made to us at our registered office at 1st Floor, ‘C’ wing, Unit 103, Corporate Avenue, Atul Projects, Chakala, Andheri (East), Mumbai – 400 093, Maharashtra, India.
262
ITEM 16C. | PRINCIPAL ACCOUNTANT FEES AND SERVICES |
Our financial statements are prepared in accordance with IFRS as issued by the IASB and are audited by S.R. Batliboi & Co. LLP, Chartered Accountants (“SRB”), a firm registered with the Public Company Accounting Oversight Board in the United States and an Indian firm of Chartered Accountants registered with the Institute of Chartered Accountants of India.
The following table shows the aggregate fees for the professional services and other services rendered by SRB and the various member firms of SRB to us, including our subsidiaries, in fiscal years 2021 and 2022.
For the Year Ended March 31, | ||||||||
Particulars | 2021 | 2022 | ||||||
($ in thousands) | ||||||||
Audit fees (audit and review of financial statements) | 4,242 | 3,143 | ||||||
Audit-related fees (including other miscellaneous audit related certifications) | 47 | 77 | ||||||
Tax fees (tax audit, other certifications and tax advisory services) | 41 | 14 | ||||||
All other fees (certification on corporate governance and advisory services) | 19 | 179 | ||||||
Total | 4,349 | 3,413 | ||||||
Audit and Risk Management Committee
Pre-approval
ProcessOur Audit Committee reviews and
pre-approves
the scope and the cost of audit services related to us and permissiblenon-audit
services performed by the independent auditors, other than those for de minimis services, which are approved by the Audit Committee prior to the completion of the audit. All of the services related to our Company provided by SRB during the last fiscal year have been approved by the Audit Committee.In accordance with the Company’s Audit Committee Charter, prior approval of Audit Committee is obtained for any form of audit and
non-audit
services wherein the Statutory Auditors and its affiliates are engaged for the Company and its subsidiaries. The Audit Committee is briefed on the total approved services along with the actual services taken and additional approvals are also sought wherever required. The details on the category / nature of the services are also placed before the Audit Committee in detail. Further, the Audit Committee also recommends the appointment and remuneration payable to Tax Auditor, Secretarial Auditor, Internal Auditor and Cost Auditor.ITEM 16D. | EXEMPTIONS FROM THE LISTING STANDARDS FOR AUDIT COMMITTEES |
Not applicable
ITEM 16E. | PURCHASES OF EQUITY SECURITIES BY THE ISSUER AND AFFILIATED PURCHASERS |
Period | Total number of shares (or units) purchased | Average price paid per share (or units) (in ₹ ) | Total number of shares (or units) purchased as part of publically announced plans or programs (As of March 31, 2022) | Maximum number of shares (or units) that may yet be purchased under plans or programs | ||||||||||
April 1, 2021 to March 31, 2022 | NIL | NA | 16,826,630 | 5.0% within one financial year of the paid up capital 5.0% within the scheme tenure of the paid up capital |
During the fiscal year 2022, no shares were purchased by Vedanta Employee Stock Option Scheme trust (“ESOS Trust”). As of March 31, 2022, total number of shares (or units) purchased as part of publically announced plans or programs is 16,826,630.
On December 12, 2016, the shareholders authorized the Company for the acquisition of up to 148,250,244 Equity Shares (which represents five percent of the paid up equity capital as on March 31, 2016, in different tranches from the secondary market by Vedanta Employee Stock Option Scheme trust (“ESOS Trust”) for the purpose of allotment to the employees of the Company and its subsidiary, post vesting of the options allotted. The secondary acquisition in a fiscal year by the ESOS Trust shall not exceed five percent of the paid up equity capital of the Company or such other limit as may be prescribed under the SEBI (Share Based Employee Benefits) Regulations, 2014 from time to time as at the end of the previous fiscal year. See
“
Item 6: Directors, senior management and Employees – B. Compensation – Vedanta Limited Employee stock option scheme (
“
Vedanta Limited ESOS
”
)
”
.
263
ITEM 16F. | CHANGE IN REGISTRANT’S CERTIFYING ACCOUNTANT |
Not applicable
ITEM 16G. | CORPORATE GOVERNANCE |
As our ADSs were listed on the NYSE during the financial year till November 8, 2021. Accordingly, we were subject to the NYSE listing standards. The NYSE listing standards applicable to us, as a foreign private issuer, are considerably different from those applicable to US companies. Under the NYSE rules, we need to (i) establish an independent Audit Committee; (ii) provide prompt certification by our Chief Executive Officer of any material
non-compliance
with any corporate governance rules of the NYSE; (iii) provide periodic (annual and interim) written affirmations to the NYSE with respect to our corporate governance practices; and (iv) provide a brief description of significant differences between our corporate governance practices and those followed by US companies. Our Audit and Risk Management Committee consists of three directors: Upendra Kumar Sinha, who is our Chairperson, Akhilesh Joshi and Dindayal Jalan. Each of Upendra Kumar Sinha, Akhilesh Joshi and Dindayal Jalan satisfy the “independence” requirements of Rule10A-3
of the Exchange Act. A brief description of the significant differences between our corporate governance practices and those followed by US companies can be found in “Item 10. Additional Information—B. Memorandum and Articles of Association—Comparison of Corporate Governance Standards.”As a foreign private issuer, we were exempt from the NYSE rules applicable to a US company requiring (i) a board of directors consisting of a majority of independent directors, (ii) a compensation committee and a nominating/corporate governance committee, (iii) shareholder approval of equity- compensation plans, (iv) the adoption and disclosure of corporate governance guidelines, and (v) the adoption and disclosure of a code of business conduct and ethics for directors, officer and employees, and the prompt disclosure of any waivers thereof for directors or executive officers.
In addition, we were deemed to be a “controlled company” under the NYSE rules. As a result, we are exempt from the NYSE rules applicable to a US company that is not a “controlled company” requiring (i) a board of directors consisting of a majority of independent directors and (ii) a compensation committee and a nominating/corporate governance committee.
ITEM 16H. | MINE SAFETY DISCLOSURE |
Not applicable
ITEM 16I. | DISCLOSURE REGARDING FOREIGN JURISDICTIONS THAT PREVENT INSPECTIONS |
Not applicable
PART III
ITEM 17. FINANCIAL STATEMENTS
See – “” for a list of the financial statements filed as part of this Annual Report.
Item
18
ITEM 18. FINANCIAL STATEMENTS
The following financial statements are filed as part of this Annual Report, together with the report of the independent registered public accounting firms:
| • | Report of Independent Registered Public Accounting Firm |
| • | Consolidated Statements of Profit or Loss for the years ended March 31, 2020, 2021 and 2022 |
| • | Consolidated Statements of Comprehensive Income for the years ended March 31, 2020, 2021 and 2022 |
| • | Consolidated Statements of Cash Flow for the years ended March 31, 2020, 2021 and 2022 |
| • | Consolidated Statements of Financial Position as at March 31, 2021 and 2022 |
| • | Consolidated Statement of Changes in Equity for the years ended March 31, 2020, 2021 and 2022 |
| • | Notes to the consolidated financial statements |
264
ITEM 19. EXHIBITS
| 1.1 |
| 1.2 |
| 2.1 |
| 2.2 |
| 2.3 |
| 2.4 |
| 4.1 |
| 4.2 |
| 4.3** |
| 4.4 |
| 4.5 |
| 4.6 |
| 4.7 |
| 4.8** |
| 4.9 |
| 4.10 |
| 4.11 |
| 4.12 |
| 4.13 |
| 4.14 |
| 4.15 |
265
| 4.16 |
| 4.17 |
| 4.18 |
| 4.19 |
| 4.20 |
| 4.21 |
| 4.22 |
| 4.23 |
| 4.24 |
| 4.25 |
| 4.26 |
| 4.27 |
| 4.28 |
| 4.29 |
266
| 4.30 |
| 4.31 |
| 4.32 |
| 4.33 |
| 4.34 |
| 4.35 |
| 4.36 |
| 4.37 |
| 4.38 |
| 4.39 |
| 4.40 |
| 4.41 |
| 4.42 |
267
| 4.43 |
| 4.44 |
| 4.45 |
| 4.46 |
| 4.47 |
| 4.48 |
| 4.49 |
| 4.50 |
| 4.51 |
| 4.52 |
| 4.53 |
| 4.54 |
| 4.55 |
| 4.56 |
| 4.57 |
| 4.58 |
| 4.59 |
268
| 4.60 |
| 4.61 |
| 4.62 |
| 4.63 |
| 4.64 |
| 4.65 |
| 4.66 |
| 4.67 |
| 4.68 |
| 4.69 |
| 4.70 |
| 4.71 |
| 4.72 |
| 4.73 |
| 4.74 |
| 4.75 |
269
| 4.76 |
| 4.77 |
| 4.78 |
| 4.79 |
| 4.80 |
| 4.81 |
| 4.82 |
| 4.83 |
| 4.84 |
| 4.85 |
| 4.86 |
| 4.87 |
| 4.88 |
| 4.89 |
270
| 4.90 |
| 4.91 |
| 4.92 |
| 4.93 |
| 4.94 |
| 4.95 |
| 4.96 |
| 4.97 |
| 4.98 |
| 4.99 |
| 4.100 |
| 8.1** |
| 11.1 |
| 11.2 |
| 11.3 |
| 11.4 |
| 11.5 |
271
| 11.6 |
| 11.7** |
| 12.1** |
| 12.2** |
| 13.1** |
| 13.2** |
| 15.1 |
| 15.2 |
| 15.3 |
| 15.4 |
| 15.5 |
| 15.6 |
| 15.7 |
| 15.8 |
| 15.9 |
| 15.10 |
| 15.11 |
| 15.12 |
272
| 15.13** |
| 96.1** |
| 96.2** |
| 96.3** |
| 96.4** |
| 96.5** |
| 96.6** |
| 101.INS** | Inline XBRL Instance Document |
| 101.SCH** | Inline XBRL Taxonomy Extension Schema Document |
| 101.CAL** | Inline XBRL Taxonomy Extension Calculation Linkbase Document |
| 101.DEF** | Inline XBRL Taxonomy Extension Definition Linkbase Document |
| 101.LAB** | Inline XBRL Taxonomy Extension Label Linkbase Document |
| 101.PRE** | Inline XBRL Taxonomy Extension Presentation Linkbase Document |
| 104 | Cover Page Interactive Data File (embedded within the Inline XBRL document) |
** Filed herewith
Notes:
The Company has not included as exhibits certain instruments with respect to its long-term debt, the amount of debt authorized under each of which does not exceed 10% of its total assets, and it agrees to furnish a copy of any such instrument to the Securities and Exchange Commission upon request.
273
SIGNATURES
The registrant hereby certifies that it meets all of the requirements for filing on Form
20-F
and that it has duly caused and authorized the undersigned to sign this Annual Report on its behalf.VEDANTA LIMITED | ||
| By: | /s/ Ajay Goel | |
| Name: | Ajay Goel | |
| Title: | Acting Chief Financial Officer | |
Date: August 1, 2022
274
Index to Consolidated Financial Statements
| Page(s) | ||||
| F-2 | ||||
| F-6 | ||||
| F-7 | ||||
| F-8 | ||||
| F-9 | ||||
| F-10 | ||||
| F-13 | ||||
F-1
Report of Independent Registered Public Accounting Firm
To the Shareholders and the Board of Directors of Vedanta Limited
Opinion on the Financial Statements
We have audited the accompanying consolidated statements of financial position of Vedanta Limited and its consolidated subsidiaries (collectively the “Group”) as of March 31, 2022 and 2021, the related consolidated statements of profit and loss, comprehensive income, cash flows and changes in equity for each of the three years in the period ended March 31, 2022, and the related notes (collectively referred to as the “consolidated financial statements”). In our opinion, the consolidated financial statements present fairly, in all material respects, the financial position of the Group at March 31, 2022 and 2021, and the results of its operations and its cash flows for each of the three years in the period ended March 31, 2022, in conformity with International Financial Reporting Standards as issued by the International Accounting Standard Board.
We also have audited, in accordance with the standards of the Public Company Accounting Oversight Board (United States) (PCAOB), the Group’s internal control over financial reporting as of March 31, 2022, based on criteria established in Internal Control-Integrated Framework issued by the Committee of Sponsoring Organizations of the Treadway Commission (2013 framework), and our report dated August 1, 2022 expressed an unqualified opinion thereon.
Basis for Opinion
These financial statements are the responsibility of the Group’s management. Our responsibility is to express an opinion on the Group’s financial statements based on our audits. We are a public accounting firm registered with the PCAOB and are required to be independent with respect to the Group in accordance with the U.S. federal securities laws and the applicable rules and regulations of the Securities and Exchange Commission and the PCAOB.
We conducted our audits in accordance with the standards of the PCAOB. Those standards require that we plan and perform the audit to obtain reasonable assurance about whether the financial statements are free of material misstatement, whether due to error or fraud. Our audits included performing procedures to assess the risks of material misstatement of the financial statements, whether due to error or fraud, and performing procedures that respond to those risks. Such procedures included examining, on a test basis, evidence regarding the amounts and disclosures in the financial statements. Our audits also included evaluating the accounting principles used and significant estimates made by management, as well as evaluating the overall presentation of the financial statements. We believe that our audits provide a reasonable basis for our opinion.
Critical Audit Matters
The critical audit matters communicated below are matters arising from the current period audit of the financial statements that were communicated or required to be communicated to the audit committee and that: (1) relate to accounts or disclosures that are material to the financial statements and (2) involved our especially challenging, subjective or complex judgments. The communication of critical audit matters does not alter in any way our opinion on the consolidated financial statements, taken as a whole, and we are not, by communicating the critical audit matters below, providing separate opinions on the critical audit matters or on the accounts or disclosures to which they relate.
F-2
Impairment assessment of the Krishna Godavari Block, Rajasthan Block and Tuticorin Plant CGUs
Description of the Matter | As discussed in Notes 3(I) and 14 to the consolidated financial statements, the Group performs impairment assessments for assets where there are indicators of impairment or reversal of impairment. As part of that assessment, whenever such indicators exist, the Group determines the recoverable amount based on the higher of the Value in Use (VIU) or Fair Value Less Cost of Disposal (FVLCD) for each of the cash generating units (CGU), considering different internal and external factors in accordance with IAS 36 – Impairment of Assets. During the year, the Group determined that there were indicators of impairment at the Tuticorin Plant CGU, within the Copper segment (refer note 3(c)I(iii)); and indicators of impairment reversal for the Krishna Godavari Block CGU and Rajasthan Block CGU within the Oil and Gas segment (refer to notes 3(c)I(i) and 3(c)I(vii)). The Group recognised a reversal of impairment of ₹ Auditing the Group’s impairment assessments is complex due to the significant estimation and judgement required in determining the recoverable amounts. The Group’s methodologies for estimating the recoverable amounts involve significant assumptions, such as future commodity prices, estimates of oil reserves, future production volumes, discount rates and future capital and operating expenditures. These assumptions are forward-looking and could be affected by future economic and market conditions, as well as certain regulatory uncertainties, as described in notes 3(c)I(iii), 3(c)I(i) and 3(c)I(vii). |
F-3
How We Addressed the Matter in Our Audit | We obtained an understanding, evaluated the design and tested the operating effectiveness of certain internal controls over the Group’s impairment assessment process, including controls over the Group’s assessment of indicators of impairment and controls over the determination of significant assumptions such as future commodity prices, oil reserves and future production volumes, discount rates and future capital and operating expenditures. To test the significant assumptions used for the determination of the recoverable value of the CGUs, our audit procedures included, among others, comparison of future commodity prices with the published commodity price and research reports from external parties, comparison of future capital and operating expenditures and oil reserves to the Group’s latest approved long-term budgets and comparison of management’s estimates of future production volumes to estimates prepared by an external expert engaged by management We involved our valuation specialists to assist us in evaluating the valuation methodologies used, the discount rates and future commodity prices applied to calculate the recoverable amount. With the assistance of our valuation specialists, we performed sensitivity analyses to evaluate the significant assumptions used. With respect to the regulatory uncertainties, we assessed management’s assumptions regarding these through inspection of external legal opinions obtained by us and inquired of the Group’s inhouse legal counsel to evaluate the basis of their conclusions. We also assessed the adequacy of the Group’s disclosures in relation to these matters. |
Assessment of recoverability and recognition of deferred tax assets
Description of the Matter | As described in Note 3(c)I(ii) to the consolidated financial statements, the Group has recognised Minimum Alternate Tax (MAT) credits within deferred tax assets totaling ₹ ₹ As described in Note 9, ESL Steel Limited, a of the subsidiary of the Group, has recognized deferred tax assets of ₹ ₹ Auditing the Group’s assessment of recognition and recoverability of these deferred tax assets is complex and dependent on the generation of future taxable income. Significant judgment and estimation are required to assess the sufficiency of future taxable income and likelihood of the realization of these assets, in particular whether there will be taxable profits in future periods that support the recognition of these assets. Predicting future taxable income is dependent on assumptions and judgments regarding, among other things, future commodity prices, production volumes and capital and operating expenditures. | |
How We Addressed the Matter in Our Audit | We obtained an understanding, evaluated the design and tested the operating effectiveness of certain internal controls over the estimation of probable future taxable income relating to the recoverability of deferred taxes assets, including controls related to the determination of assumptions used in the preparation and review of the business plan, budget, and analysis of forecasted future taxable income prepared by the Group. To evaluate the future projections of taxable income estimated by management, our procedures included, amongst others, evaluating, with the assistance of valuation specialists, the future cash flow projections, including comparison of forecasts considered in the previous year with the actual performance of the current year and the consistency of those projections with the projections used in other areas of estimation such as those described above for the ‘Impairment assessment of the Krishna Godavari Block, Rajasthan Block and Tuticorin Plant CGUs’. We compared the budgeted forecasts included in the projections to the budget approved by the Board of Directors. We obtained management’s sensitivity analyses over the key assumptions to assess their impact on the forecasts of the future taxable income. We evaluated the adequacy of the disclosures made by the Group on the expected recoverability of the deferred tax assets. | |
F-4
Production Sharing Contract extension for Rajasthan Block and the related settlement demands
Description of the Matter | As described in Note 3(c)I(iv) to the consolidated financial statements, the Production Sharing Contract (PSC) for the Rajasthan Block (RJ), which was valid until May 14, 2020, was extended, initially for a period of three months and subsequently through a series of extensions up to August 14, 2022, subject to compliance with certain conditions, one of which relates to settlement of demands raised by the Government of India through the Directorate General of Hydrocarbons (DGH) with respect to the government’s share of profit petroleum for RJ. The Group recognizes a liability for those demands for which it is probable that a liability has been incurred as of March 31, 2022 and the amount is reasonably estimable. Matters where a liability is assessed as possible, or a reasonable estimate cannot be made are disclosed as contingencies in the financial statements in accordance with IAS 37 - Provisions, Contingent Liabilities and Contingent Assets. The Group, after considering the underlying facts and circumstances, including court rulings, have considered the PSC extension to be reasonably certain and disclosed the matter, including the related demands, as a contingency in the consolidated financial statements. Auditing management’s determination of whether a liability in respect of the aforesaid PSC extension matter is probable and reasonably estimable, possible or remote, is highly subjective and requires significant judgment considering the time period involved in the resolution of the matters, since these disputes include the government as the counterparty and the complexity of the matters involved with limited precedents. | |
How We Addressed the Matter in Our Audit | We obtained an understanding, evaluated the design of and tested certain internal controls of the Group for assessing the completeness, valuation, presentation and disclosure of the contingencies. We evaluated the Group’s analysis of the probability of a liability related to the demands arising on the PSC extension matter through inspection of relevant documentation and correspondence, including High Court rulings and responses sent to DGH. We obtained written legal assessments of the demands from the Group’s external legal counsel and made enquiries of the Group’s internal and external legal counsel to confirm our understanding of those assessments. We obtained written representations from executives of the Group regarding the accounting and disclosures made in the consolidated financial statements, relating to the demands. We also evaluated the adequacy of the Group’s disclosures in relation to these matters. | |
/s/ S. R. Batliboi & Co. LLP
We have served as the Group’s auditor since 2016
Gurugram, India
August 1, 2022
F-
5
VEDANTA LIMITED AND SUBSIDIARIES
CONSOLIDATED STATEMENTS OF PROFIT OR LOSS
(In millions except share or per share amounts unless otherwise stated)
For the year ended March 31, | 2020 | 2021 | 2022 | 2022 | ||||||||||||||||
Notes | ( ₹ in million) | ( ₹ in million) | ( ₹ in million) | (US dollars in million) (Note 2 (a)) | ||||||||||||||||
Revenue | 6 | 835,446 | 868,630 | 1,311,917 | 17,292 | |||||||||||||||
Cost of sales* | (829,461 | ) | (635,225 | ) | (855,880 | ) | (11,281 | ) | ||||||||||||
Gross profit | 5,985 | 233,405 | 456,037 | 6,011 | ||||||||||||||||
Other operating income | 9,863 | 13,094 | 17,981 | 237 | ||||||||||||||||
Distribution expenses | (18,205 | ) | (20,184 | ) | (34,187 | ) | (451 | ) | ||||||||||||
Administration expenses | (37,577 | ) | (39,463 | ) | (50,204 | ) | (662 | ) | ||||||||||||
Operating ( l oss)/profit | (39,934 | ) | 186,852 | 389,627 | 5,135 | |||||||||||||||
Investment and other income | 7 | 25,714 | 32,177 | 19,947 | 263 | |||||||||||||||
Finance and other costs | 8 | (54,557 | ) | (52,955 | ) | (49,427 | ) | (651 | ) | |||||||||||
(Loss)/Profit before tax | (68,777 | ) | 166,074 | 360,147 | 4,747 | |||||||||||||||
Income tax credit/(expense) | 9 | 26,677 | (19,084 | ) | (103,068 | ) | (1,359 | ) | ||||||||||||
(Loss)/Profit for the year | (42,100 | ) | 146,990 | 257,079 | 3,388 | |||||||||||||||
(Loss)/Profit attributable to: | ||||||||||||||||||||
Equity holders of the parent | (61,248 | ) | 112,883 | 207,953 | 2,740 | |||||||||||||||
Non-controlling interests | 19,148 | 34,107 | 49,126 | 648 | ||||||||||||||||
(Loss)/Profit for the year | (42,100 | ) | 146,990 | 257,079 | 3,388 | |||||||||||||||
(Loss)/Earnings per share (in ₹ and US $) | 12 | |||||||||||||||||||
Basic | (16.54 | ) | 30.47 | 56.11 | 0.74 | |||||||||||||||
Diluted | (16.54 | ) | 30.28 | 55.72 | 0.73 | |||||||||||||||
Weighted average number of equity shares used in computing earnings per share | ||||||||||||||||||||
Basic | 3,702,554,614 | 3,704,196,924 | 3,706,455,160 | 3,706,455,160 | ||||||||||||||||
Diluted | 3,702,554,614 | 3,727,544,981 | 3,732,148,735 | 3,732,148,735 | ||||||||||||||||
The accompanying notes are an integral part of these consolidated financial statements.
| * | Cost of sales for the year ended (i) March 31, 2020 includes net impairment charge of ₹ asset under construction written off of₹ asset under construction written off of₹ million $ 9 million)( , impairment reversalof ₹ 62,745 million ($ 827 million) and exploration cost written off of ₹ Note 14). |
The Group’s (Refer Note
1-
Group overview) consolidated statements of profit or loss are presented disclosing expenses by function. The consolidated statements of profit or loss disclosing expenses presented by nature are in Note 10.F-
6
VEDANTA LIMITED AND SUBSIDIARIES
CONSOLIDATED STATEMENTS OF COMPREHENSIVE INCOME / (LOSS)
(In millions except share or per share amounts unless otherwise stated)
For the year ended March 31, | 2020 | 2021 | 2022 | 2022 | ||||||||||||
( ₹ in million) | ( ₹ in million) | ( ₹ in million) | (US dollars in million) (Note 2 (a)) | |||||||||||||
(Loss)/Profit for the year | (42,100 | ) | 146,990 | 257,079 | 3,388 | |||||||||||
Other comprehensive income/(loss), net of income tax: | ||||||||||||||||
Items that will not be reclassified subsequently to profit or loss | ||||||||||||||||
Re-measurement (loss)/gain on defined benefit obligation | (2,118 | ) | (5 | ) | (181 | ) | (2 | ) | ||||||||
Tax credit/(expense) | 714 | (104 | ) | 12 | 0 | |||||||||||
(Loss)/Gain on fair value of financial asset investment | (738 | ) | 621 | 145 | 2 | |||||||||||
Items that will be reclassified subsequently to profit or loss | ||||||||||||||||
Exchange differences on translation of foreign operations | 8,217 | 2,558 | 8,135 | 107 | ||||||||||||
Tax credit /( expense) | 340 | (610 | ) | 137 | 2 | |||||||||||
Gain/(loss) on cash flow hedges recognised during the year | 1,254 | (2,533 | ) | (2,717 | ) | (36 | ) | |||||||||
Tax (expense)/ credit | (438 | ) | 862 | 896 | 12 | |||||||||||
(Gain)/loss on cash flow hedges recycled to profit or loss | (327 | ) | 1,879 | 3,721 | 49 | |||||||||||
Tax credit/ (expense) | 114 | (606 | ) | (1,311 | ) | (17 | ) | |||||||||
Total other comprehensive income for the year, net of income tax | 7,018 | 2,062 | 8,837 | 117 | ||||||||||||
Total Comprehensive (Loss)/Income for the year | (35,082 | ) | 149,052 | 265,916 | 3,505 | |||||||||||
Total Comprehensive (Loss)/Income attributable to: | ||||||||||||||||
Equity holders of the paren t | (52,950 | ) | 114,005 | 216,362 | 2,852 | |||||||||||
Non-controlling interests | 17,868 | 35,047 | 49,554 | 653 | ||||||||||||
(35,082 | ) | 149,052 | 265,916 | 3,505 | ||||||||||||
The accompanying notes are an integral part of these consolidated financial statements.
F-
7
VEDANTA LIMITED AND SUBSIDIARIES
CONSOLIDATED STATEMENTS OF FINANCIAL POSITION
As at | March 31, 2021 | March 31, 2022 | March 31, 2022 | |||||||||||||
Notes | ( ₹ in million) | ( ₹ in million) | (US dollars in million) (Note 2 (a)) | |||||||||||||
ASSETS | ||||||||||||||||
Non-current assets | ||||||||||||||||
Property, plant and equipment | 14 | 946,181 | 1,016,551 | 13,399 | ||||||||||||
Exploration and evaluation assets | 14 | 24,542 | 16,642 | 219 | ||||||||||||
Intangible assets | 15 | 7,481 | 6,966 | 92 | ||||||||||||
Deferred tax assets | 9 | 73,958 | 64,537 | 851 | ||||||||||||
Financial assets investments | 16 | 1,532 | 1,472 | 19 | ||||||||||||
Income tax assets | 9 | 27,481 | 27,625 | 364 | ||||||||||||
Other non-current assets | 17 | 127,727 | 109,810 | 1,447 | ||||||||||||
Total non-current assets | 1,208,902 | 1,243,603 | 16,391 | |||||||||||||
Current assets | ||||||||||||||||
Inventories | 18 | 99,509 | 143,253 | 1,888 | ||||||||||||
Income tax assets | 69 | 252 | 3 | |||||||||||||
Trade and other receivables | 17 | 130,729 | 212,504 | 2,801 | ||||||||||||
Short-term investments | 19 | 281,775 | 235,932 | 3,110 | ||||||||||||
Derivative financial assets | 25 | 701 | 2,580 | 34 | ||||||||||||
Restricted cash and cash equivalents | 20 | 1,025 | 4,674 | 62 | ||||||||||||
Cash and cash equivalents | 21 | 48,537 | 86,709 | 1,143 | ||||||||||||
Total current assets | 562,345 | 685,904 | 9,041 | |||||||||||||
Total assets | 1,771,247 | 1,929,507 | 25,432 | |||||||||||||
LIABILITIES | ||||||||||||||||
Current liabilities | ||||||||||||||||
Borrowings | 22 | 189,600 | 168,944 | 2,227 | ||||||||||||
Acceptances | 23 | 83,711 | 110,936 | 1,462 | ||||||||||||
Trade and other payables | 24 | 306,747 | 356,169 | 4,695 | ||||||||||||
Derivative financial liabilities | 25 | 2,786 | 5,308 | 70 | ||||||||||||
Retirement benefits | 27 | 1,135 | 1,021 | 13 | ||||||||||||
Provisions | 26 | 2,378 | 3,150 | 42 | ||||||||||||
Current tax liabilities | 2,792 | 9,192 | 121 | |||||||||||||
Total current liabilities | 589,149 | 654,720 | 8,630 | |||||||||||||
Net current (liabilities)/assets | (26,804 | ) | 31,184 | 411 | ||||||||||||
Non-current liabilities | ||||||||||||||||
Borrowings | 22 | 379,622 | 362,023 | 4,772 | ||||||||||||
Deferred tax liabilities | 9 | 21,894 | 52,988 | 698 | ||||||||||||
Retirement benefits | 27 | 1,465 | 1,569 | 21 | ||||||||||||
Provisions | 26 | 29,854 | 32,282 | 425 | ||||||||||||
Derivative financial liabilities | 25 | 764 | 57 | 1 | ||||||||||||
Other non-current liabilities | 24 | 14,450 | 18,746 | 248 | ||||||||||||
Total non-current liabilities | 448,049 | 467,665 | 6,165 | |||||||||||||
Total liabilities | 1,037,198 | 1,122,385 | 14,795 | |||||||||||||
Net assets | 734,049 | 807,122 | 10,637 | |||||||||||||
EQUITY | ||||||||||||||||
Share capital | 30 | 3,718 | 3,718 | 49 | ||||||||||||
Securities premium | 190,452 | 190,452 | 2,510 | |||||||||||||
Treasury shares | (3,223 | ) | (2,290 | ) | (30 | ) | ||||||||||
Share based payment reserve | 1,707 | 1,363 | 18 | |||||||||||||
Other components of equity | 117,712 | 126,294 | 1,665 | |||||||||||||
Retained earnings | 274,231 | 316,229 | 4,168 | |||||||||||||
Equity attributable to equity holders of the parent | 584,597 | 635,766 | 8,380 | |||||||||||||
Non-controlling interests | 149,452 | 171,356 | 2,257 | |||||||||||||
Total Equity | 734,049 | 807,122 | 10,637 | |||||||||||||
The accompanying notes are an integral part of these consolidated financial statements.
F-
8
VEDANTA LIMITED AND SUBSIDIARIES
CONSOLIDATED STATEMENTS OF CASH FLOWS
For the year ended March 31, | 2020 | 2021 | 2022 | 2022 | ||||||||||||
( ₹ in million) | ( ₹ in million) | ( ₹ in million) | (US dollars in million) (Note 2 (a)) | |||||||||||||
Cash flows from operating activities | ||||||||||||||||
| (Loss)/Profit before tax | (68,777 | ) | 166,074 | 360,147 | 4,747 | |||||||||||
| Adjustments to reconcile profit/(loss) to net cash provided by operating activities: | ||||||||||||||||
| Depreciation and amortisation | 100,490 | 81,178 | 91,148 | 1,201 | ||||||||||||
| Impairment charge/(reversal) of property, plant and equipment/ exploration and evaluation assets (Refer Note 14) | 148,022 | — | (62,745 | ) | (827 | ) | ||||||||||
| Assets under construction/capital advances written off (Refer Note 14) | — | 2,440 | 1,951 | 26 | ||||||||||||
| Provision for doubtful debts/advances | 3,281 | 5,126 | 4,612 | 61 | ||||||||||||
| Exploration costs written off (Refer Note 14) | 27 | 71 | 26,181 | 345 | ||||||||||||
| Fair value gain on financial assets held for trading/fair value through profit or loss | (5,574 | ) | (9,340 | ) | (2,087 | ) | (28 | ) | ||||||||
| Share based payment expense | 716 | 575 | 785 | 10 | ||||||||||||
| Loss/(Gain) on sale of property, plant and equipment, net | 562 | (743 | ) | (1,265 | ) | (17 | ) | |||||||||
| Exchange loss/(gain), net | 3,436 | (1025 | ) | 2,741 | 36 | |||||||||||
| Inventory written off | 1,176 | — | — | — | ||||||||||||
| Interest, dividend income and bargain gain | (17,651 | ) | (22,306 | ) | (18,861 | ) | (249 | ) | ||||||||
| Finance and other cost | 49,768 | 53,135 | 47,972 | 632 | ||||||||||||
| Provision for cost of environmental clearance | — | 2,135 | 69 | 1 | ||||||||||||
| Provision for legal disputes (including change in law) | — | — | 4,219 | 56 | ||||||||||||
| Liabilities written back no longer required | (1,681 | ) | (950 | ) | (647 | ) | (9 | ) | ||||||||
Changes in assets and liabilities: | ||||||||||||||||
| (Increase)/Decrease in receivables | 11,479 | (29,250 | ) | (85,445 | ) | (1,126 | ) | |||||||||
| (Increase)/Decrease in inventories | 19,447 | 13,833 | (43,574 | ) | (574 | ) | ||||||||||
| Increase/(Decrease) in payables | (54,748 | ) | 7,515 | 51,461 | 679 | |||||||||||
| Proceeds from short-term investments | 1,033,449 | 833,293 | 868,481 | 11,447 | ||||||||||||
| Purchases of short-term investments | (983,579 | ) | (751,598 | ) | (871,350 | ) | (11,485 | ) | ||||||||
Cash generated from operations | 239,843 | 350,163 | 373,793 | 4,926 | ||||||||||||
| Interest paid | (55,682 | ) | (53,499 | ) | (52,217 | ) | (688 | ) | ||||||||
| Interest received | 9,401 | 20,351 | 18,682 | 246 | ||||||||||||
| Dividends received | 181 | 18 | 15 | 0 | ||||||||||||
| Income tax paid | (11,350 | ) | (21,081 | ) | (57,454 | ) | (757 | ) | ||||||||
Net cash from operating activities | 182,393 | 295,952 | 282,819 | 3,727 | ||||||||||||
Cash flows from investing activities | ||||||||||||||||
| Consideration paid for business acquisition (net of cash and cash equivalents acquired) | (335 | ) | (448 | ) | — | — | ||||||||||
| Purchases of property, plant and equipment (including intangibles) | (78,227 | ) | (68,833 | ) | (106,028 | ) | (1,397 | ) | ||||||||
| Proceeds from sale of property, plant and equipment | 1,455 | 1,678 | 3,249 | 43 | ||||||||||||
| Loans repaid by related parties (Refer Note 35) | — | 11,116 | 16,227 | 214 | ||||||||||||
| Loans to related parties (Refer Note 35) | — | (76,600 | ) | — | — | |||||||||||
| Proceeds from short-term deposits | 45,634 | 145,633 | 169,601 | 2,235 | ||||||||||||
| Purchases of short-term deposits | (111,899 | ) | (179,839 | ) | (119,656 | ) | (1,577 | ) | ||||||||
| Proceeds on liquidation of structured investments | 30,774 | — | — | — | ||||||||||||
| Payment towards structured investments | (4,354 | ) | — | — | — | |||||||||||
| Net changes in restricted cash and cash equivalents | 86 | (65 | ) | (1 | ) | (0 | ) | |||||||||
Net cash used in investing activities | (116,866 | ) | (167,358 | ) | (36,608 | ) | (482 | ) | ||||||||
Cash flows from financing activities | ||||||||||||||||
| (Repayment)/Proceeds of working capital loan, net | (113,658 | ) | (95,925 | ) | 8,750 | 115 | ||||||||||
| Proceeds from acceptances | 170,398 | 190,993 | 276,131 | 3,639 | ||||||||||||
| Repayment of acceptances | (149,221 | ) | (211,398 | ) | (248,931 | ) | (3,280 | ) | ||||||||
| Proceeds from other short-term borrowings | 22,344 | 104,895 | 132,428 | 1,745 | ||||||||||||
| Repayment of other short-term borrowings | (26,837 | ) | (91,279 | ) | (102,309 | ) | (1,348 | ) | ||||||||
| Proceeds from long-term borrowings | 118,256 | 167,070 | 209,156 | 2,757 | ||||||||||||
| Repayment of long-term borrowings | (89,959 | ) | (95,770 | ) | (287,577 | ) | (3,790 | ) | ||||||||
| Payment of dividends to equity holders of the parent | (14,441 | ) | (35,187 | ) | (166,814 | ) | (2,199 | ) | ||||||||
Payment of dividends to non-controlling interests | — | (56,029 | ) | (26,682 | ) | (352 | ) | |||||||||
Loan given to parent and its affiliates in excess of fair value (Refer Note 35) | — | (5,361 | ) | — | — | |||||||||||
Payment for acquiring non-controlling interest | (1,074 | ) | — | — | — | |||||||||||
Payment of lease liability | (3,164 | ) | (3,380 | ) | (2,318 | ) | (31 | ) | ||||||||
Net cash used in financing activities | (87,356 | ) | (131,371 | ) | (208,166 | ) | (2,744 | ) | ||||||||
Effect of exchange rate changes on cash and cash equivalents | 136 | 716 | 127 | 2 | ||||||||||||
Net (decrease)/increase in cash and cash equivalents | (21,693 | ) | (2,061 | ) | 38,172 | 503 | ||||||||||
Cash and cash equivalents at the beginning of the year | 72,291 | 50,598 | 48,537 | 640 | ||||||||||||
Cash and cash equivalents at the end of the year 1 | 50,598 | 48,537 | 86,709 | 1,143 | ||||||||||||
The accompanying notes are an integral part of these consolidated financial statements.
| 1. | For composition Refer Note 21 |
F-
9
VEDANTA LIMITED AND SUBSIDIARIES
CONSOLIDATED STATEMENTS OF CHANGES IN EQUITY
( in million)
₹
Attributable to equity holders of the parent | ||||||||||||||||||||||||||||||||||||||||||||
Share capital | Securities premium | Treasury shares# | Share based payment reserve | Translation of foreign operations | Equity Instruments through OCI | Cash flow hedges | Retained earnings* | Total | Non- controlling interests | Total | ||||||||||||||||||||||||||||||||||
Balance as at April 1, 2019 | 3,718 | 190,452 | (3,971 | ) | 2,493 | 106,950 | 1,086 | (734 | ) | 281,344 | 581,338 | 150,608 | 731,946 | |||||||||||||||||||||||||||||||
| Profit / (Loss) for the year | — | — | — | — | — | — | — | (61,248 | ) | (61,248 | ) | 19,148 | (42,100 | ) | ||||||||||||||||||||||||||||||
| Other comprehensive income/ (loss) for the year, net of tax | — | — | — | — | 9,498 | (738 | ) | 464 | (926 | ) | 8,298 | (1,280 | ) | 7,018 | ||||||||||||||||||||||||||||||
Total comprehensive income /(loss) for the year | — | — | — | — | 9,498 | (738 | ) | 464 | (62,174 | ) | (52,950 | ) | 17,868 | (35,082 | ) | |||||||||||||||||||||||||||||
| Stock options cancelled during the year | — | — | — | (519 | ) | — | — | — | 519 | — | — | — | ||||||||||||||||||||||||||||||||
| Recognition of share based payment | — | — | — | 754 | — | — | — | — | 754 | — | 754 | |||||||||||||||||||||||||||||||||
| Exercise of stock options | — | — | 165 | (232 | ) | — | — | — | 67 | 0 | 0 | 0 | ||||||||||||||||||||||||||||||||
| Dividend | — | — | — | — | — | — | — | (14,441 | ) | (14,441 | ) | — | (14,441 | ) | ||||||||||||||||||||||||||||||
| Change in fair value of put option liability/ conversion option asset/ derecognition of non-controlling interest | — | — | — | — | — | — | — | (3,448 | ) | (3,448 | ) | 3,240 | (208 | ) | ||||||||||||||||||||||||||||||
| Acquisition of Non-controlling interest in Electrosteel Steels Limited | — | — | — | — | — | — | — | 1,268 | 1,268 | (2,342 | ) | (1,074 | ) | |||||||||||||||||||||||||||||||
Balance as at March 31, 2020 | 3,718 | 190,452 | (3,806 | ) | 2,496 | 116,448 | 348 | (270 | ) | 203,135 | 512,521 | 169,374 | 681,895 | |||||||||||||||||||||||||||||||
| * | Retained earnings mainly includes general reserve, debenture redemption reserve, preference share redemption reserve and capital reserve (Refer Note 30) |
| # | Treasury share represents 14,378,261 equity shares (face value of ₹ |
F-1
0
( in million)
₹
Attributable to equity holders of the parent | ||||||||||||||||||||||||||||||||||||||||||||
Share capital | Securities premium | Treasury shares# | Share based payment reserve | Translation of foreign operations | Equity Instruments through OCI | Cash flow hedges | Retained earnings* | Total | Non- controlling interests | Total | ||||||||||||||||||||||||||||||||||
Balance as at April 1, 2020 | 3,718 | 190,452 | (3,806 | ) | 2,496 | 116,448 | 348 | (270 | ) | 203,135 | 512,521 | 169,374 | 681,895 | |||||||||||||||||||||||||||||||
| Profit for the year | — | — | — | — | — | — | — | 112,883 | 112,883 | 34,107 | 146,990 | |||||||||||||||||||||||||||||||||
| Other comprehensive income / (loss) for the year, net of tax | — | — | — | — | 777 | 621 | (212 | ) | (64 | ) | 1,122 | 940 | 2,062 | |||||||||||||||||||||||||||||||
Total comprehensive income / (loss) for the year | — | — | — | — | 777 | 621 | (212 | ) | 112,819 | 114,005 | 35,047 | 149,052 | ||||||||||||||||||||||||||||||||
| Stock options cancelled during the year | — | — | — | (920 | ) | — | — | — | 595 | (325 | ) | — | (325 | ) | ||||||||||||||||||||||||||||||
| Recognition of share based payment | — | — | — | 575 | — | — | — | — | 575 | — | 575 | |||||||||||||||||||||||||||||||||
| Exercise of stock options | — | — | 583 | (444 | ) | — | — | — | (139 | ) | — | — | — | |||||||||||||||||||||||||||||||
| Dividend | — | — | — | — | — | — | — | (35,187 | ) | (35,187 | ) | (56,029 | ) | (91,216 | ) | |||||||||||||||||||||||||||||
| Acquisition of FACOR (Refer Note 4(a)) | — | — | — | — | — | — | — | — | — | (309 | ) | (309 | ) | |||||||||||||||||||||||||||||||
| Change in fair value of put option liability/ conversion option asset/ derecognition of non-controlling interest | — | — | — | — | — | — | — | (1,631 | ) | (1,631 | ) | 1,369 | (262 | ) | ||||||||||||||||||||||||||||||
| Effect of fair valuation of inter-company loan** | — | — | — | — | — | — | — | (5,361 | ) | (5,361 | ) | — | (5,361 | ) | ||||||||||||||||||||||||||||||
Balance as at March 31, 2021 | 3,718 | 190,452 | (3,223 | ) | 1,707 | 117,225 | 969 | (482 | ) | 274,231 | 584,597 | 149,452 | 734,049 | |||||||||||||||||||||||||||||||
| * | Retained earnings mainly includes general reserve, debenture redemption reserve, preference share redemption reserve and capital reserve (Refer Note 30) |
| ** | An amount of ₹ ₹ ₹ |
| # | Treasury share represents 12,193,159 equity shares (face value of ₹ |
F-1
1
( in million)
₹
Attributable to equity holders of the parent | ||||||||||||||||||||||||||||||||||||||||||||
Share capital | Securities premium | Treasury shares# | Share based payment reserve | Translation of foreign operations | Equity Instruments through OCI | Cash flow hedges | Retained earnings* | Total | Non- controlling interests | Total | ||||||||||||||||||||||||||||||||||
Balance as at April 1, 2021 | 3,718 | 190,452 | (3,223 | ) | 1,707 | 117,225 | 969 | (482 | ) | 274,231 | 584,597 | 149,452 | 734,049 | |||||||||||||||||||||||||||||||
| Profit for the year | — | — | — | — | — | — | — | 207,953 | 207,953 | 49,126 | 257,079 | |||||||||||||||||||||||||||||||||
| Other comprehensive income / (loss) for the year, net of tax | 7,523 | 145 | 914 | (173 | ) | 8,409 | 428 | 8,837 | ||||||||||||||||||||||||||||||||||||
Total comprehensive income / (loss) for the year | — | — | — | — | 7,523 | 145 | 914 | 207,780 | 216,362 | 49,554 | 265,916 | |||||||||||||||||||||||||||||||||
| Stock options cancelled during the year | — | — | — | (342 | ) | — | — | — | 241 | (101 | ) | — | (101 | ) | ||||||||||||||||||||||||||||||
| Recognition of share based payment | — | — | — | 432 | — | — | — | — | 432 | — | 432 | |||||||||||||||||||||||||||||||||
| Exercise of stock options | — | — | 933 | (434 | ) | — | — | — | (192 | ) | 307 | — | 307 | |||||||||||||||||||||||||||||||
| Dividend | — | — | — | — | — | — | — | (166,814 | ) | (166,814 | ) | (26,682 | ) | (193,496 | ) | |||||||||||||||||||||||||||||
| Change in fair value of put option liability/ conversion option asset/ derecognition of non-controlling interest | — | — | — | — | — | — | — | 983 | 983 | (968 | ) | 15 | ||||||||||||||||||||||||||||||||
Balance as at March 31, 2022 | 3,718 | 190,452 | (2,290 | ) | 1,363 | 124,748 | 1,114 | 432 | 316,229 | 635,766 | 171,356 | 807,122 | ||||||||||||||||||||||||||||||||
Balance as at March 31, 2022 (US dollars in million) | 49 | 2,510 | (30 | ) | 18 | 1,644 | 15 | 6 | 4,168 | 8,380 | 2,257 | 10,637 | ||||||||||||||||||||||||||||||||
| * | Retained earnings mainly includes general reserve, debenture redemption reserve, preference share redemption reserve and capital reserve (Refer Note 30) |
| # | Treasury share represents 8,693,406 equity shares (face value of ₹ |
F-1
2
VEDANTA LIMITED AND SUBSIDIARIES
NOTES TO THE CONSOLIDATED FINANCIAL STATEMENTS
1. Group overview
Vedanta Limited (“the Company” or “the parent”) and its consolidated subsidiaries (collectively, the “Group”) is a diversified natural resource group engaged in exploring, extracting and processing minerals and oil and gas. The Group engages in the exploration, production and sale of zinc, lead, silver, copper, aluminum, iron ore and oil and gas and has a presence across India, South Africa, Namibia, Ireland, Australia, Liberia and the UAE. The Group is also in the business of commercial power generation, steel manufacturing and port operations in India and manufacturing of glass substrate in South Korea and Taiwan.
The Company was incorporated on September 8,1975 under the laws of the Republic of India. The registered office of the Company is situated at 1st Floor, ‘C’ wing, Unit 103, Corporate Avenue, Atul Projects, Chakala, Andheri (East), Mumbai-400092, Maharashtra. The Company’s shares are listed on National Stock Exchange (‘NSE’) and Bombay Stock Exchange (‘BSE’) in India. In June 2007, the Company completed its initial public offering of American Depositary Shares, or ADS, each representing four equity shares, and listed its ADSs on the New York Stock Exchange (‘NYSE’). In July 2009, the Company completed its follow-on offering of an
additional 131,906,011 ADS, each representing 4equity shares, which are listed on the New York Stock Exchange.The American Depositary Shares (ADS) of the Company have been delisted from the NYSE effective close of trading on the NYSE on November 8, 2021. This follows the filing by the Company of Form 25 with the Securities and Exchange Commission on October 29, 2021. As a consequence of the delisting becoming effective, termination of the Deposit Agreement under which the ADS were issued (the “Deposit Agreement”) has also become effective close of trading on the NYSE on November 8, 2021. The said action has no impact on the current listing status or trading of the Company’s equity shares on BSE and NSE. The Company will continue to be subject to reporting obligations under the U.S. Securities Exchange Act of 1934 until such time as it can terminate its registration under the said Act.
The Company is majority owned by Twin Star Holdings Limited (“Twin Star”), Finsider International Company Limited (“Finsider”), Vedanta Holdings Mauritius II Limited (“VHM2L”), Vedanta Holdings Mauritius Limited (“VHML”), Welter Trading Limited (“Welter”) and Vedanta Netherlands Investments BV (“VNIBV”), which are in turn wholly-owned subsidiaries of Vedanta Resources Limited (“VRL”), a company incorporated in the United Kingdom. VRL, through its subsidiaries,
held 55.1% and 69.68%of the Company’s equity as at March 31, 2021 and March 31, 2022, respectively.
VRL, through its wholly owned subsidiaries, acquired 541,731,161 equity shares of the Company during the current year, thereby increasing their shareholding in the Company from
55.1% to 69.68%Details of the Group’s various businesses are as follows:
| • | Zinc India business is owned and operated by Hindustan Zinc Limited (“HZL”). |
| • | Zinc international business comprises Skorpion mine and refinery in Namibia operated through THL Zinc Namibia Holdings (Proprietary) Limited (“Skorpion”), Lisheen mine in Ireland operated through Vedanta Lisheen Holdings Limited (“Lisheen”) (Lisheen mine ceased operations in December 2015) and Black Mountain Mining (Proprietary) Limited (“BMM”), whose assets include the operational Black Mountain mine and the Gamsberg mine project located in South Africa. |
| • | The Group’s oil and gas business is owned and operated by the Company and its subsidiary, Cairn Energy Hydrocarbons Limited and consists of exploration, development and production of oil and gas. |
| • | The Group’s iron ore business is owned by the Company, and its wholly owned subsidiary, i.e., Sesa Resources Limited. It consists of exploration, mining and processing of iron ore, pig iron and metallurgical coke and generation of power for captive use. Pursuant to Honorable Supreme Court of India order, mining operations in the state of Goa are currently suspended. The Group’s iron ore business includes Western Cluster Limited (“WCL”) in Liberia which has iron ore assets and is wholly owned by the Group. WCL’s assets include development rights to Western Cluster and a network of iron ore deposits in West Africa. WCL’s assets have been fully impaired. |
Subsequent to the Balance Sheet date, WCL has signed a Memorandum of Understanding with Government of Liberia to start its Iron ore mining operations in Liberia, which could not be started earlier due to the outbreak of Ebola epidemic in 2014. Activities to begin the operations are commenced in June 2022.
| • | The Group’s copper business is owned and operated by the Company, Copper Mines of Tasmania Pty Ltd (“CMT”) and Fujairah Gold FZC and is principally one of custom smelting and includes captive power plants at Tuticorin in Southern India. |
The
Group’s copper business in Tamil Nadu, India has received an order from the Tamil Nadu Pollution Control Board (“TNPCB”) on April 9, 2018, rejecting the Company’s application for renewal of consent to operate under the Air and Water Acts for
the
400,000TPA copper smelter plant in Tuticorin for want of further clarification and consequently the operations were suspended. The Company has filed an appeal with TNPCB Appellate authority against the said order. During the pendency of the appeal, TNPCB through its order dated May 23, 2018 ordered for disconnection of electricity supply and closure of copper smelter plant. Post such order, the state government on May 28, 2018 ordered the permanent closure of the plant. We continue to engage with the Government of India and relevant authorities to enable the restart of operations at Copper India. (Refer Note 3(c)(I)(iii)).
F-1
3
Further, the Company’s copper business includes refinery and rod plant at Silvassa consisting of a 133,000 MT of blister/ secondary material processing plant, a 216,000 TPA copper refinery plant and a copper rod mill with an installed capacity of 258,000 TPA. The plant continues to operate
,
catering primarily to the domestic market.In addition, the Group owns and operates the Mt. Lyell copper mine in Tasmania, Australia through its subsidiary CMT and a precious metal refinery and copper rod plant in Fujairah, UAE through its subsidiary Fujairah Gold FZC. The operations of Mt Lyell copper mine were suspended in January 2014 following a mud slide incident and were put into care and maintenance since July 9, 2014 following a rock fall incident in June 2014. In November 2020, the Group executed an arrangement with a third party for further exploration with an option to fully divest its shareholding in return for royalties on successful mining and production.
| • | The Group’s Aluminium business is owned and operated by the Company and by Bharat Aluminium Company Limited (“BALCO”). The aluminium operations include a refinery and captive power plant at Lanjigarh and a smelter and captive power plants at Jharsuguda both situated in the State of Odisha in Eastern India. BALCO’s partially integrated aluminium operations comprise two bauxite mines, captive power plants, smelting and fabrication facilities in the State of Chhattisgarh in central India. |
| • | The Group’s power business is owned and operated by the Company, BALCO and Talwandi Sabo Power Limited (“TSPL”), a wholly owned subsidiary of the Company, which are engaged in the power generation business in India. The Company’s power operations include a thermal coal- based commercial power facility of 600 MW at Jharsuguda in the State of Odisha in Eastern India. BALCO power operations include 600 MW (2 Units of 300 MW each) thermal coal based power plant at Korba, of which a unit of 300 MW was converted to be used for captive consumption vide order from the Central Electricity Regulatory Commission (CERC) dated January 01, 2019. TSPL’s power operations include 1,980 MW (three units of 660 MW each) thermal coal- based commercial power facilities. Power business also includes the wind power plants commissioned by HZL and a power plant at MALCO Energy Limited (“MEL”) (under care and maintenance) situated at Mettur Dam in the State of Tamil Nadu in southern India. |
| • | The Group’s other businesses include: |
| (i) | ESL Steel Limited (“ESL”). ESL is engaged in the manufacturing and supply of billets, TMT bars, wire rods and ductile iron pipes in Eastern India. |
| (ii) | Vizag General Cargo Berth Private Limited (“VGCB”) and Maritime Ventures Private Limited (“MVPL”). Vizag port project includes mechanization of coal handling facilities and upgradation of general cargo berth for handling coal at the outer harbour of Visakhapatnam Port on the east coast of India. MVPL is engaged in the business of rendering logistics inter alia rendering stevedoring, and other allied services in ports and other allied sectors. |
| (iii) | AvanStrate Inc. (“ASI”), Ferro Alloys Corporation Limited (“FACOR”) and Desai Cement Company Private Limited (“DCCPL”). ASI, headquartered in Japan is involved in the manufacturing of glass substrate in South Korea and Taiwan. FACOR is involved in business of producing Ferro Alloys and owns a Ferro Chrome plant with capacity of 72,000 TPA, 2operational chrome mines and 100 MW of captive power plant through its subsidiary, FACOR Power Limited (“FPL”). DCCPL is involved in business of producing slag cements and owns three ball mills with capacity of 218,000 TPA., |
2. Basis of preparation and basis of measurement of financial statements
a) Basis of preparation
These consolidated financial statements have been prepared in accordance with International Financial Reporting Standards (“IFRS”), as issued by the International Accounting Standards Board (“IASB”).
These consolidated financial statements have been prepared in accordance with the accounting policies set out below and were consistently applied to all periods presented unless otherwise stated.
These financial statements are approved for issue by the Board of Directors on August 1, 2022.
Certain comparative figures appearing in these consolidated financial statements have been regrouped and/or reclassified to better reflect the nature of those items.
The consolidated financial statements are presented in Indian Rupee (), the presentation currency of the Company. Solely for the convenience of readers, the consolidated financial statements as at and for the year ended March 31, 2022 have been translated into US dollars (“$”) at the noon buying rate of $ 1.00 = 75.87 in the City of New York for cable transfers of Indian Rupee as certified for custom purpose by the Federal Reserve Bank of New York on March 31, 2022. No representation is made that the Indian Rupee amounts represent US dollar amounts or have been, could have been or could be converted into US dollars at such a rate or any other rate.
₹
₹
b) Basis of Measurement
The consolidated financial statements have been prepared on a going concern basis using historical cost convention and on an accrual method of accounting, except for certain financial assets and liabilities which are measured at fair value as explained in the accounting policies below.
c) Restatement/Reclassification
In the comparative period ended March 31, 2021, some of the acceptances which were previously included under trade and other receivables and trade and other payables amounting to (136) million and 2,684
₹
₹
million, respectively, have been reclassified to acceptances on the face of the balance sheet.
F-1
4
3(a) Significant accounting policies
A. Basis of consolidation
Subsidiaries:
The consolidated financial statements incorporate the results of the Company and all its subsidiaries (the “Group”), being the entities that it controls. Control is evidenced where the Group has power over the investee, is exposed, or has rights, to variable returns from its involvement with the investee and has the ability to affect those returns through its power over the investee. Power is demonstrated through existing rights that give the ability to direct relevant activities, which significantly affect the entity’s returns.
The financial statements of subsidiaries are prepared for the same reporting year as the parent company. Where necessary, adjustments are made to the financial statements of subsidiaries to align the accounting policies in line with accounting policies of the Group.
For
non-wholly
owned subsidiaries, a share of the profit/(loss) for the financial year and net assets is attributed to thenon-controlling
interests as shown in the consolidated financial statements.Liability for put option issued to
non-controlling
interests which do not grant present access to ownership interest to the Group is recognised at present value of the redemption amount and is reclassified from equity. At the end of each reporting period, thenon-controlling
interests subject to put option is derecognised and the difference between the amount derecognised and present value of the redemption amount, which is recorded as a financial liability, is accounted for as an equity transaction.For acquisitions of additional interests in subsidiaries, where there is no change in control, the Group recognises a reduction to the
non-controlling
interest of the respective subsidiary with the difference between this figure and the cash paid, inclusive of transaction fees, being recognised in equity. Similarly, upon dilution of controlling interests the difference between the cash received from sale or listing of the subsidiary shares and the increase tonon-controlling
interest is also recognised in equity. The results of subsidiaries acquired or disposed off during the year are included in the consolidated statements of profit or loss from the effective date of acquisition or up to the effective date of disposal, as appropriate.Intra-Group balances and transactions, and any unrealised profits arising from intra-Group transactions are eliminated. Unrealised losses are eliminated unless costs cannot be recovered.
Joint arrangements
A Joint arrangement is an arrangement of which two or more parties have joint control. Joint control is considered when there is contractually agreed sharing of control of an arrangement, which exists only when decisions about the relevant activities require the unanimous consent of the parties sharing control. Investments in joint arrangements are classified as either joint operations or joint venture. The classification depends on the contractual rights and obligations of each investor, rather than the legal structure of the joint arrangement. A joint operation is a joint arrangement whereby the parties that have joint control of the arrangement, have rights to the assets, and obligations for the liabilities relating to the arrangement. A joint venture is a joint arrangement whereby the parties that have joint control of the arrangement have rights to the net assets of the arrangement.
The Group has both joint operations and joint ventures.
Joint operations
The Group has joint operations within its oil and gas segment. It participates in several unincorporated joint operations which involve the joint control of assets used in oil and gas exploration and producing activities. The Group accounts for its share of assets, liabilities, income and expenditure of joint operations in which the Group holds an interest. Liabilities in unincorporated joint operations where the Group is the operator are accounted for at gross values (including share of other partners) with a corresponding receivable from the venture partner. These have been included in the consolidated financial statements under the appropriate headings.
Details of joint operations are set out in Note 34(b).
Joint venture
The Group accounts for its interest in joint venture using the equity method (see Note B below), after initially being recognised at cost in the consolidated statements of financial position. Goodwill arising on the acquisition of joint venture is included in the carrying value of investments in joint venture.
B. Investments in associates:
An associate is an entity over which the Group has significant influence. Significant influence is the power to participate in the financial and operating policy decisions of the investee but, is not control or joint control over those policies. Investments in associates are accounted for using the equity method. Goodwill arising on the acquisition of associates is included in the carrying value of investments in associate.
F-1
5
Equity method of accounting
Under the equity method of accounting applicable for investments in associates and joint ventures, investments are initially recorded at the cost to the Group and then, in subsequent periods, the carrying value is adjusted to reflect the Group’s share of the post-acquisition profits or losses of the investee, the Group’s share of other comprehensive income of the investee, other changes to the investees net assets and is further adjusted for impairment losses, if any. Dividend received or receivable from associate and joint ventures are recognised as a reduction in carrying amount of the investment.
The consolidated statements of profit or loss and consolidated statements of comprehensive income include the Group’s share of investee’s results, except where the investee is generating losses share of such losses in excess of the Group’s interest in that investee are not recognised. Losses recognised under the equity method in excess of the Group’s investment in ordinary shares are applied to the other components of the Group’s interest that forms part of Group’s net investment in the investee in the reverse order of their seniority (i.e., priority in liquidation).
If the Group’s share of losses in an associate or joint venture equals or exceeds its interests in the associate or joint venture, the Group discontinues the recognition of further losses. Additional losses are provided for only to the extent that the Group has incurred legal or constructive obligations or made payments on behalf of the associate/ joint venture.
Unrealised gains arising from transactions with associates and joint venture are eliminated against the investment to the extent of the Group’s interest in these entities. Unrealised losses are eliminated in the same way as unrealized gains, but only to the extent that there is no evidence of impairment of the asset transferred. Accounting policies of equity accounted investees are changed where necessary to ensure consistency with the policies adopted by the Group.
The carrying amount of equity accounted investments are tested for impairment in accordance with the policy described in Note 3 (a)(I) below.
C. Business combinations
Business combinations except those under common control are accounted for under the acquisition method. The acquiree’s identifiable assets, liabilities and contingent liabilities that meet the conditions for recognition under IFRS 3are recognised at their fair value at the acquisition date, except certain assets and liabilities required to be measured as per the applicable standards.
(Business Combinations)
Excess of fair value of purchase consideration and the acquisition date
non-controlling
interest over the acquisition date fair value of identifiable assets acquired and liabilities assumed is recognised as goodwill. Goodwill arising on acquisitions is reviewed for impairment annually. Where the fair values of the identifiable assets and liabilities exceed the purchase consideration, the Groupre-assesses
whether it has correctly identified all of the assets acquired and all of the liabilities assumed and reviews the procedures used to measure the amounts to be recognised at the acquisition date. If the reassessment still results in an excess of the fair value of net assets acquired over the aggregate consideration transferred, then the surplus is credited to the consolidated statements of profit or loss in the period of acquisition. Where it is not possible to complete the determination of fair values by the date on which the first post-acquisition financial statements are approved, a provisional assessment of fair value is made and any adjustments required to those provisional fair values are finalised within 12 months of the acquisition date.Those provisional amounts are adjusted through goodwill during the measurement period, or additional assets or liabilities are recognised, or the amounts at which existing assets or liabilities were recorded are remeasured to reflect new information obtained about facts and circumstances that existed as of the acquisition date that, if known, would have affected the amounts recognised at that date. These adjustments are called as measurement period adjustments. The measurement period does not exceed twelve months from the acquisition date.
Any
non-controlling
interest in an acquiree is measured at fair value or as thenon-controlling
interest’s proportionate share of the acquiree’s net identifiable assets. This accounting choice is made on a transaction by transaction basis.Acquisition expenses are charged to the consolidated statements of profit or loss.
If the Group acquires a group of assets in a company that does not constitute a business combination in accordance with IFRS 3, the cost of the acquired group of assets is allocated to the individual identifiable assets acquired based on their relative fair value.
Common control transactions
A business combination involving entities or businesses under common control is a business combination in which all of the combining entities or businesses are ultimately controlled by the same party or parties both before and after the business combination and the control is not transitory. The transactions between entities under common control are scoped out of IFRS 3 and there is no authoritative literature for these transactions under IFRS. As a result, the Group adopted accounting principles similar to themethod based on the predecessor values. The assets and liabilities of the acquired entity are recognised at the book values recorded in the ultimate parent entity’s consolidated financial statements. The components of equity of the acquired companies are added to the same components within Group equity except that any share capital and investments in the books of the acquiring entity are cancelled and the differences, if any, are adjusted in the opening retained earnings/ capital reserve. The Company’s shares issued in consideration for the acquired companies are recognised from the moment the acquired companies are included in these financial statements and the financial statements of the commonly controlled entities would be combined, retrospectively, as if the transaction had occurred at the beginning of the earliest reporting period presented. However, the prior years’ comparative information is only adjusted for periods during which the entities were under common control.
pooling-of-interest
F-1
6
D. Revenue recognition
Sale of products/ rendering of services (including revenue from contracts with customers)
The Group’s revenue from contracts with customers is mainly from the sale of copper, aluminium, iron ore, zinc, oil and gas, power, steel, glass substrate and port operations. Revenue from contracts with customers is recognised when control of the goods or services is transferred to the customer which usually is on delivery of the goods to the shipping agent at an amount that reflects the consideration to which the Group expects to be entitled in exchange for those goods or services. Revenue is recognised net of discounts, volume rebates, outgoing sales taxes/ goods and service tax and other indirect taxes. Revenues from sale of
by-products
are included in revenue.Certain of the Group’s sales contracts provide for provisional pricing based on the price on the London Metal Exchange (LME) and crude index, as specified in the contract. Revenue in respect of such contracts is recognised when control passes to the customer and is measured at the amount the entity expects to be entitled – being the estimate of the price expected to be received at the end of the measurement period. Post transfer of control of goods, provisional pricing features are accounted in accordance with IFRS 9 (rather than IFRS 15and therefore the IFRS 15 rules on variable consideration do not apply. These ‘provisional pricing’ adjustments, i.e., the consideration received post transfer of control are included in revenue and disclosed by way of note to the financial statements. Final settlement of the price is based on the applicable price for a specified future period. The Group’s provisionally priced sales are marked to market using the relevant forward prices for the future period specified in the contract and is adjusted in revenue.
Financial Instruments)
(Revenue from Contracts with Customers)
Revenue from oil, gas and condensate sales represent the Group’s share in the revenue from sale of such products, by the joint operations, and is recognised as and when control in these products gets transferred to the customers. In computing its share of revenue, the Group excludes government’s share of profit which gets accounted for when the obligation in respect of the same arises.
Revenue from sale of power is recognised when delivered and measured based on rates as per bilateral contractual agreements with buyers and at a rate arrived at based on the principles laid down under the relevant Tariff Regulations as notified by the regulatory bodies, as applicable.
Where the Group acts as a port operator, revenues relating to operating and maintenance phase of the port contract are measured at the amount that Group expects to be entitled to for the services provided.
A contract asset is the right to consideration in exchange for goods or services transferred to the customer. If the Group performs part of its obligation by transferring goods or services to a customer before the customer pays consideration or before payment is due, a contract asset is recognised for the earned consideration when that right is conditional on the Group’s future performance.
A contract liability is the obligation to transfer goods or services to a customer for which the Group has received consideration from the customer. If a customer pays consideration before the Group transfers goods or services to the customer, a contract liability is recognised when the payment is received. The advance payments received, plus a specified rate of return/ discount at the prevailing market rates, are settled by supplying respective goods over a period of up to twenty four months under an agreed delivery schedule as per the terms of the respective agreements. As these are contracts that the Group expects and has the ability to fulfil through delivery of a
non-financial
item, these are presented as advance from customers and are recognised as revenue as and when control of respective commodities is transferred to customers under the agreements. The fixed rate of return/discount is treated as finance cost. The portion of the advance where either the Group does not have a unilateral right to defer settlement beyond 12 months or expects settlement within 12 months from the balance sheet date is classified as current liability.Interest income
Interest income from debt instruments is recognised using the effective interest rate method. The effective interest rate is the rate that discounts estimated future cash receipts through the expected life of the financial asset to the gross carrying amount of a financial asset. When calculating the effective interest rate, the Group estimates the expected cash flows by considering all the contractual terms of the financial instrument (for example, prepayment, extension, call and similar options) but does not consider the expected credit losses.
Dividends
Dividend income is recognised in the consolidated statements of profit or loss only when the right to receive payment is established, provided it is probable that the economic benefits associated with the dividend will flow to the Group, and the amount of the dividend can be measured reliably.
E (a) Property, plant and equipment
(i) Mining properties
When a decision is taken that a mining properties is viable for commercial production (i.e., when the Group determines that the mining properties will provide sufficient and sustainable return relative to the risks and the Group decided to proceed with the mine development), all further
pre-production
primary development expenditure other than that on land, buildings, plant, equipment and capital work in progress is capitalized as property, plant and equipment under the heading “Mining properties” together with any amount transferred from “Exploration and evaluation” assets. The costs of mining properties include the costs of acquiring and developing mining properties.F-1
7
The stripping cost incurred during the production phase of a surface mine is
deferred
to the extent the current period stripping cost exceeds the average period stripping cost over the life of mine and recognised as an asset if such cost provides a benefit in terms of improved access to ore in future periods and certain criteria are met. When the benefit from the stripping costs is realized in the current period, the stripping costs are accounted for as the cost of inventory. If the costs of inventory produced and the stripping activity asset are not separately identifiable, a relevant production measure is used to allocate the production stripping costs between the inventory produced and the stripping activity asset. The Group uses the expected volume of waste compared with the actual volume of waste extracted for a given value of ore/mineral production for the purpose of determining the cost of the stripping activity asset.Deferred stripping costs are included in mining properties After initial recognition, the stripping activity asset is depreciated on a unit of production method over the expected useful life of the identified component of the ore body.
In circumstances where a mining property is abandoned, the cumulative capitalised costs relating to the property are written off in the period in which it occurs, i.e., when the Group determines that the mining property will not provide sufficient and sustainable returns relative to the risks and the Group decides not to proceed with the mine development.
Commercial reserves are proved and probable reserves as defined by the ‘JORC’ Code, ‘MORC’ code or ‘SAMREC’ Code. Changes in the commercial reserves affecting unit of production calculations are dealt with prospectively over the revised remaining reserves.
(ii) Oil and gas assets- (developing/producing assets)
For oil and gas assets a successful efforts based accounting policy is followed. Costs incurred prior to obtaining the legal rights to explore an area are expensed immediately to the consolidated statements of profit or loss.
All costs incurred after the technical feasibility and commercial viability of producing hydrocarbons has been demonstrated are capitalised within property, plant and equipment—development/producing assets on abasis. Subsequent expenditure is capitalised only where it either enhances the economic benefits of the development/producing asset or replaces part of the existing development/producing asset. Any remaining costs associated with the part replaced are expensed.
field-by-field
Net proceeds from any disposal of development/producing assets are credited against the previously capitalised cost. A gain or loss on disposal of a development/producing asset is recognised in the consolidated statements of profit or loss to the extent that the net proceeds exceed or are less than the appropriate portion of the net capitalised costs of the asset.
(iii) Other property, plant and equipment
The initial cost of property, plant and equipment comprises its purchase price, including import duties and
non-refundable
purchase taxes, and any directly attributable costs of bringing an asset to working condition and location for its intended use. It also includes the initial estimate of the costs of dismantling and removing the item and restoring the site on which it is located.If significant parts of an item of property, plant and equipment have different useful lives, then they are accounted for as separate items (major components) of property, plant and equipment. All other expenses on existing property, plant and equipment, includingrepair and maintenance expenditure and cost of replacing parts, are charged to the consolidated statements of profit or loss in the period during which such expenses are incurred.
day-to-day
Gains and losses on disposal of an item of property, plant and equipment, computed as the difference between the net disposal proceeds and the carrying amount of the asset, are included in the consolidated statements of profit or loss when the asset is derecognised. Major inspection and overhaul expenditure is capitalised, if the recognition criteria are met.
(iv) Assets under construction
Assets under construction are capitalised in the assets under construction account. At the point when an asset is capable of operating in the manner intended by management, the cost of construction is transferred to the appropriate category of property, plant and equipment. Costs associated with the commissioning of an asset and any obligatory decommissioning costs are capitalised until the period of commissioning has been completed and the asset is ready for its intended use. Asset under construction are presented at cost, net of accumulated impairment losses, if any.
(v) Depreciation, depletion and amortisation expense
Mining properties and other assets in the course of development or construction, freehold land and goodwill are not depreciated or amortised.
F-1
8
Mining properties
The capitalised mining properties are amortised on abasis over the total estimated remaining commercial proved and probable reserves of each property or Group of properties and are subject to impairment review. Costs used in the unit of production calculation comprise of the net book value of capitalised costs plus the estimated future capital expenditure required to access the commercial reserves. Changes in the estimates of commercial reserves or future capital expenditure are recorded prospectively.
unit-of-production
Oil and gas producing facilities
All expenditures carried within each field are amortised from the commencement of production on a unit of production basis, which is the ratio of oil and gas production in the period to the estimated quantities of commercial reserves at the end of the period plus the production in the period, generally on abasis or group of fields which are reliant on common infrastructure.
field-by-field
Commercial reserves are proven and probable oil and gas reserves, which are defined as the estimated quantities of crude oil, natural gas and natural gas liquids which geological, geophysical and engineering data demonstrate with a specified degree of certainty to be recoverable in future years from known reservoirs and which are considered commercially producible.
Costs used in the unit of production calculation comprise the net book value of capitalised costs plus the estimated future field development costs required to access the commercial reserves. Changes in the estimates of commercial reserves or future field development costs are recorded prospectively.
The estimates of hydrocarbon reserves and resources have been derived in accordance with the Society of Petroleum Engineers “Petroleum Resources Management System (2018)”.
Other assets
Depreciation on property, plant and equipment is calculated using the straight-line method (SLM) to allocate their cost, net of their residual values, over their estimated useful lives (determined by the management) as given below. Management’s assessment takes into account, inter alia, the nature of the assets, the estimated usage of the assets, the operating conditions of the assets, past history of replacement and maintenance support.
Estimated useful life of assets are as follows:
ASSET | Useful life (in years) | |||
| Buildings (residential; factory etc.) | 3 - 60 | |||
Plant and equipment | 15 - 40 | |||
| Railway sidings | 15 | |||
Office equipment | 3 - 6 | |||
Furniture and fixtures | 8 - 10 | |||
Vehicles | 8 - 10 | |||
Major inspection and overhaul costs are depreciated over the estimated life of the economic benefit to be derived from such costs. The carrying amount of the remaining previous overhaul cost is charged to the consolidated statements of profit or loss if the next overhaul is undertaken earlier than the previously estimated life of the economic benefit.
The Group reviews the residual value and useful life of an asset at least at each financial year end
,
and if expectations differ from previous estimates the change is accounted for as a change in accounting estimate.(b) Exploration and evaluation assets
Exploration and evaluation expenditure incurred prior to obtaining the mining right or the legal right to explore are expensed as incurred.
Exploration and evaluation expenditure incurred after obtaining the mining right or the legal right to explore are capitalised as exploration and evaluation assets (intangible assets) and stated at cost less impairment, if any. Exploration and evaluation assets are transferred to the appropriate category of property, plant and equipment when the technical feasibility and commercial viability has been determined. Exploration and evaluation assets are assessed for impairment and impairment loss, if any, is recognised prior to reclassification.
Exploration expenditure includes all direct and allocated indirect expenditure associated with finding specific mineral resources which includes depreciation and applicable operating costs of related support equipment and facilities and other costs of exploration activities:
| • | Acquisition costs—costs associated with acquisition of licenses and rights to explore, including related professional fees. |
| • | General exploration costs—costs of surveys and studies, rights of access to properties to conduct those studies (e.g., costs incurred for environment clearance, defence clearance, etc.), and salaries and other expenses of geologists, geophysical crews and other personnel conducting those studies. |
| • | Costs of exploration drilling and equipping exploration and appraisal wells. |
F-
19
Exploration expenditure incurred in the process of determining oil and gasbasis until the success or otherwise of the well has been established. The success or failure of each exploration effort is judged on abasis. Drilling costs are written off on completion of a well unless the results indicate that hydrocarbon reserves exist and there is a reasonable prospect that these reserves are commercial.
exploration
targets is capitalised within “exploration and evaluation assets “and subsequently allocated to drilling activities. Exploration drilling costs are initially capitalised on awell-by-well
well-by-well
Following appraisal of successful exploration wells, if commercial reserves are established and technical feasibility for extraction demonstrated, then the related capitalised exploration costs are transferred into a single field cost centre within property, plant and equipment—development/ producing assets (oil and gas properties) after testing for impairment. Where results of exploration drilling indicate the presence of hydrocarbons which are ultimately not considered commercially viable, all related costs are written off to the consolidated statements of profit or loss.
Expenditure incurred on the acquisition of a licence interest is initially capitalised on abasis. Costs are held undepleted within exploration and evaluation assets until such time as the exploration phase on the licence area is complete or commercial reserves have been discovered.
licence-by-licence
Net proceeds from any disposal of an exploration asset are initially credited against the previously capitalised costs. Any surplus/ deficit is recognised in the consolidated statements of profit or loss.
(c) Other Intangible assets
Intangible assets acquired separately are measured on initial recognition at cost. Subsequently, intangibles assets are measured at cost less accumulated amortisation and accumulated impairment losses, if any.
The Group recognises port concession rights as “Intangible Assets” arising from a service concession arrangement in which the grantor controls or regulates the services provided and the prices charged and also controls any significant residual interest in the infrastructure such as property, plant and equipment, irrespective whether the infrastructure is existing infrastructure of the grantor or the infrastructure is constructed or purchased by the Group as part of the service concession arrangement. Such an intangible asset is recognised by the Group initially at cost determined as the fair value of the consideration received or receivable for the construction service delivered and is capitalised when the project is complete in all respects. Port concession rights are amortised on straight line basis over the balance of license period. The concession period
is 30 years from the date of the award.Any addition to the port concession rights are measured at fair value on recognition. Port concession rights also include certain property, plant and equipment in accordance with IFRIC 12.
(Service Concession Arrangements)
Intangible assets are amortised over their estimated useful life on a straight line basis. Software is amortised over the estimated useful life ranging from
2-5
years. Amounts paid for securing mining rights are amortised over the period of the mining lease ranging from16-25
years. Technologicalknow-how
and acquired brand are amortised over the estimated useful life of ten years.Gains or losses arising from derecognition of an intangible asset are measured as the difference between the net disposal proceeds and the carrying amount of the asset and are recognised in the consolidated statements of profit or loss when the asset is derecognised.
The amortisation period and the amortisation method are reviewed at least at each financial year end. If the expected useful life of the asset is different from previous estimates, the change is accounted for prospectively as a change in accounting estimate.
F.
Non-current
assets held for saleNon-current
assets and disposal groups are classified as held for sale if their carrying amount will be recovered through a sale transaction rather than through continuing use. This condition is regarded as met only when the sale is highly probable and the asset (or disposal group) is available for immediate sale in its present condition. Management must be committed to the sale which should be expected to qualify for recognition as a completed sale within one year from the date of classification.Non-current
assets and disposal groups classified as held for sale are not depreciated and are measured at the lower of carrying amount and fair value less costs to sell. Such assets and disposal groups are presented separately on the face of the consolidated statements of financial position.G. Financial instruments
A financial instrument is any contract that gives rise to a financial asset of one entity and a financial liability or equity instrument of another entity.
(a) Financial Assets – Recognition and subsequent measurement
All financial assets are recognised initially at fair value plus, in the case of financial assets not recorded at fair value through profit or loss, transaction costs that are attributable to the acquisition of the financial asset. Purchases or sales of financial assets that require delivery of assets within a time frame established by regulation or convention in the marketplace (regular way trades) are recognised on the trade date, i.e., the date that the Group commits to purchase or sell the asset.
F-2
0
For purposes of subsequent measurement, financial assets are classified in four categories:
Debt instruments at amortised cost
A ‘debt instrument’ is measured at amortised cost if both the following conditions are met:
| a) | The asset is held within a business model whose objective is to hold assets for collecting contractual cash flows, and |
| b) | Contractual terms of the asset give rise on specified dates to cash flows that are solely payments of principal and interest (SPPI) on the principal amount outstanding. |
After initial measurement, such financial assets are subsequently measured at amortised cost using the Effective Interest Rate (EIR) method. Amortised cost is calculated by taking into account any discount or premium on acquisition and fees or costs that are an integral part of the EIR. The EIR amortisation is included in interest income in consolidated statements of profit or loss. The losses arising from impairment are recognised in consolidated statements of profit or loss.
Debt instruments at fair value through other comprehensive income (FVOCI)
A ‘debt instrument’ is classified as at FVOCI if both of the following criteria are met:
| a) | The objective of the business model is achieved both by collecting contractual cash flows and selling the financial assets, and |
| b) | The asset’s contractual cash flows represent SPPI. |
Debt instruments included within the FVOCI category are measured initially, as well as at each reporting date, at fair value. Fair value movements are recognised in other comprehensive income (OCI). However, interest income, impairment losses and reversals and foreign exchange gain or loss are recognized in the consolidated statements of profit or loss. On derecognition of the asset, cumulative gain or loss previously recognised in other comprehensive income is reclassified from the equity to consolidated statements of profit or loss. Interest earned whilst holding fair value through other comprehensive income debt instrument is reported as interest income using the EIR method.
Debt instruments at fair value through profit or loss (FVTPL)
FVTPL is a residual category for debt instruments. Any debt instrument which does not meet the criteria for categorization as at amortised cost or as FVOCI is classified as FVTPL.
In addition, the Group may elect to designate a debt instrument which otherwise meets amortised cost or FVOCI criteria as FVTPL. However, such election is allowed only if doing so reduces or eliminates a measurement or recognition inconsistency (referred to as ‘accounting mismatch’).
Debt instruments included within the FVTPL category are measured at fair value with all changes being recognised in consolidated statement of profit or loss. The Group has not designated any debt instrument as FVTPL.
Equity Instruments
All equity investments in the scope of IFRS 9 are measured at fair value. Equity instruments which are held for trading and contingent consideration recognised by an acquirer in a business combination to which IFRS 3 applies are classified as at FVTPL. For all other equity instruments, the Group may make an irrevocable election to present in other comprehensive income any subsequent changes in the fair value. The Group makes such election on anbasis. The classification is made on initial recognition and is irrevocable.
instrument-by-instrument
If the Group decides to classify an equity instrument as at FVOCI, then all fair value changes on the instrument, excluding dividends, are recognised in the OCI. There is no recycling of the amounts from OCI to profit or loss, even on sale of investment. However, the Group may transfer the cumulative gain or loss within equity. For equity instruments which are classified as FVTPL, all subsequent fair value changes are recognised in the consolidated statements of profit or loss.
(b) Financial Assets—Derecognition
The Group derecognizes a financial asset when the contractual rights to the cash flows from the asset expire, or it transfers the rights to receive the contractual cash flows on the financial asset in a transaction in which substantially all the risks and rewards of ownership of the financial asset are transferred.
(c) Impairment of Financial Assets
In accordance with IFRS 9, the Group applies expected credit loss (“ECL”) model for measurement and recognition of impairment loss on the following financial assets:
| i) | Financial assets that are debt instruments, and are measured at amortized cost, e.g., loans, debt securities and deposits; |
F-
21
| ii) | Financial assets that are debt instruments and are measured as at FVOCI; |
| iii) | Trade receivables or any contractual right to receive cash or another financial asset that result from transactions that are within the scope of IFRS 15. |
The Group follows the ‘simplified approach’ for recognition of impairment loss allowance on trade receivables, contract assets and lease receivables. The application of simplified approach does not require the Group to track changes in credit risk. Rather, it recognizes impairment loss allowance based on lifetime ECLs at each reporting date right from its initial recognition.
At each reporting date, for recognition of impairment loss on other financial assets and risk exposure, the Group determines whether there has been a significant increase in the credit risk since initial recognition. If credit risk has not increased significantly,
12-month
ECL is used to provide for impairment loss. However, if credit risk has increased significantly, lifetime ECL is used. If, in a subsequent period, credit quality of the instrument improves such that there is no longer a significant increase in credit risk since initial recognition, then the Group reverts to recognising impairment loss allowance based on12-month
ECL.Lifetime ECL is the expected credit loss resulting from all possible default events over the expected life of a financial instrument. The
12-month
ECL is a portion of the lifetime ECL which results from default events that are possible within 12 months after the reporting date.ECL is the difference between all contractual cash flows that are due to the Group in accordance with the contract and all the cash flows that the entity expects to receive, discounted at the original EIR.
ECL impairment (loss allowance)/reversal during the year is recognised as (expense)/income in the consolidated statements of profit or loss. The consolidated statements of financial position presentation for various financial instruments is described below:
| i) | Financial assets measured at amortised cost: ECL is presented as an allowance, i.e., as an integral part of the measurement of those assets. The Group does not reduce impairment allowance from the gross carrying amount. |
| ii) | Debt instruments measured at FVOCI: Since financial assets are already reflected at fair value, impairment allowance is not further reduced from its value. Rather, ECL amount is presented as ‘accumulated impairment amount’ in OCI. |
For assessing increase in credit risk and impairment loss, the Group combines financial instruments on the basis of shared credit risk characteristics with the objective of facilitating an analysis that is designed to enable significant increases in credit risk to be identified on a timely basis.
The Group does not have any purchased or originated credit-impaired (POCI) financial assets, i.e., financial assets which are credit impaired on purchase/origination.
(d) Financial Liabilities – Recognition and Subsequent measurement
Financial liabilities are classified, at initial recognition, at fair value through profit or loss, or as loans and borrowings, payables, or as derivatives designated as hedging instruments in an effective hedge, as appropriate.
All financial liabilities are recognised initially at fair value, and in the case of financial liabilities at amortised cost, net of directly attributable transaction costs.
The Group’s financial liabilities include trade and other payables, loans and borrowings including bank overdrafts, financial guarantee contracts and derivative financial instruments.
The measurement of financial liabilities depends on their classification, as described below:
Financial liabilities at fair value through profit or loss
Financial liabilities at fair value through profit or loss include financial liabilities held for trading and financial liabilities designated upon initial recognition as at fair value through profit or loss. Financial liabilities are classified as held for trading if they are incurred for the purpose of repurchasing in the near term. This category also includes derivative financial instruments entered into by the Group that are not designated as hedging instruments in hedge relationships as defined by IFRS 9. Separated embedded derivatives are also classified as held for trading unless they are designated as effective hedging instruments.
Gains or losses on liabilities held for trading are recognised in the consolidated statements of profit or loss.
Financial liabilities designated upon initial recognition at fair value through profit or loss are designated as such at the initial date of recognition, and only if the criteria in IFRS 9 are satisfied. For liabilities designated as FVTPL, fair value gains/ losses attributable to changes in own credit risk are recognised in OCI. These gains/ losses are not subsequently transferred to consolidated statements of profit or loss. However, the Group may transfer the cumulative gain or loss within equity. All other changes in fair value of such liability are recognised in the consolidated statements of profit or loss. The Group has not designated any financial liability at fair value through profit or loss.
Financial liabilities at amortised cost (Loans, Borrowings and Trade and Other payables)
After initial recognition, interest-bearing loans and borrowings and trade and other payables are subsequently measured at amortised cost using the EIR method. Gains and losses are recognised in consolidated statements of profit or loss when the liabilities are derecognised as well as through the EIR amortisation process.
Amortised cost is calculated by taking into account any discount or premium on acquisition and fees or costs that are an integral part of the EIR. The EIR amortisation is included as finance and other costs in the consolidated statements of profit or loss.
F-2
2
(e) Financial Liabilities – Derecognition
A financial liability is derecognised when the obligation under the liability is discharged or cancelled or expires. When an existing financial liability is replaced by another from the same lender on substantially different terms, or the terms of an existing liability are substantially modified, such an exchange or modification is treated as the derecognition of the original liability and the recognition of a new liability. The difference in the respective carrying amounts is recognised in the consolidated statements of profit or loss.
(f) Embedded Derivatives
An embedded derivative is a component of a hybrid (combined) instrument that also includes a
non-derivative
host contract – with the effect that some of the cash flows of the combined instrument vary in a way similar to a stand-alone derivative. An embedded derivative causes some or all of the cash flows that otherwise would be required by the contract to be modified according to a specified interest rate, financial instrument price, commodity price, foreign exchange rate, index of prices or rates, credit rating or credit index, or other variable, provided in the case of anon-financial
variable that the variable is not specific to a party to the contract. Reassessment only occurs if there is either a change in the terms of the contract that significantly modifies the cash flows that would otherwise be required or a reclassification of a financial asset out of the fair value through profit or loss.If the hybrid contract contains a host that is a financial asset within the scope of IFRS 9, the Group does not separate embedded derivatives. Rather, it applies the classification requirements contained in IFRS 9 to the entire hybrid contract. Derivatives embedded in all other host contracts are accounted for as separate derivatives and recorded at fair value if their economic characteristics and risks are not closely related to those of the host contracts and the host contracts are not held for trading or designated at fair value through profit or loss. These embedded derivatives are measured at fair value with changes in fair value recognised in the consolidated statements of profit or loss, unless designated as effective hedging instruments.
(g) Equity Instruments
An equity instrument is any contract that evidences a residual interest in the assets of an entity after deducting all of its liabilities. Equity instruments issued by the Group are recognised at the proceeds received, net of direct issue costs.
(h) Offsetting of Financial Instruments
Financial assets and financial liabilities are offset and the net amount is reported in the consolidated statements of financial position if there is a currently enforceable legal right to offset the recognised amounts and there is an intention to settle on a net basis or to realise the asset and settle the liability simultaneously.
(i) Derivative Financial Instruments and Hedge Accounting
Initial recognition and subsequent measurement
In order to hedge its exposure to foreign exchange, interest rate, and commodity price risks, the Group enters into forward, option, swap contracts and other derivative financial instruments. The Group does not hold derivative financial instruments for speculative purposes.
Such derivative financial instruments are initially recognised at fair value on the date on which a derivative contract is entered into and are subsequently
re-measured
at fair value. Derivatives are carried as financial assets when the fair value is positive and as financial liabilities when the fair value is negative.Any gains or losses arising from changes in the fair value of derivatives are taken directly to the consolidated statements of profit or loss, except for the effective portion of cash flow hedges, which is recognised in OCI and later reclassified to the consolidated statements of profit or loss when the hedge item affects profit or loss or treated as basis adjustment if a hedged forecast transaction subsequently results in the recognition of a
non-financial
asset ornon-financial
liability.For the purpose of hedge accounting, hedges are classified as:
| • | Fair value hedges when hedging the exposure to changes in the fair value of a recognised asset or liability or an unrecognised firm commitment; |
| • | Cash flow hedges when hedging the exposure to variability in cash flows that is either attributable to a particular risk associated with a recognised asset or liability or a highly probable forecast transaction or the foreign currency risk in an unrecognised firm commitment; or |
| • | Hedges of a net investment in a foreign operation. |
At the inception of a hedge relationship, the Group formally designates and documents the hedge relationship to which the Group wishes to apply hedge accounting. The documentation includes the Group’s risk management objective and strategy for undertaking hedge, the hedging/economic relationship, the hedged item or transaction, the nature of the risk being hedged, hedge ratio and how the Group will assess the effectiveness of changes in the hedging instrument’s fair value in offsetting the exposure to changes in the hedged item’s fair value or cash flows attributable to the hedged risk. Such hedges are expected to be highly effective in achieving offsetting changes in fair value or cash flows and are assessed on an ongoing basis to determine that they actually have been highly effective throughout the financial reporting periods for which they were designated.
F-2
3
Hedges that meet the strict criteria for hedge accounting are accounted for, as
described
below:(1) Fair value hedges
Changes in the fair value of derivatives that are designated and qualify as fair value hedges are recognised in the consolidated statements of profit or loss immediately, together with any changes in the fair value of the hedged asset or liability that are attributable to the hedged risk.
When an unrecognised firm commitment is designated as a hedged item, the subsequent cumulative change in the fair value of the firm commitment attributable to the hedged risk is recognised as an asset or liability with a corresponding gain or loss recognised in the consolidated statements of profit or loss. Hedge accounting is discontinued when the Group revokes the hedge relationship, the hedging instrument or hedged item expires or is sold, terminated, or exercised or no longer meets the criteria for hedge accounting and the unamortised fair value is recognised immediately in statement of profit or loss.
(2) Cash flow hedges
The effective portion of the gain or loss on the hedging instrument is recognised in OCI in the cash flow hedge reserve, while any ineffective portion is recognised immediately in the consolidated statements of profit or loss.
Amounts recognised in OCI are transferred to the consolidated statements of profit or loss when the hedged transaction affects profit or loss, such as when the hedged financial income or financial expense is recognised or when a forecast sale occurs. When the hedged item is the cost of a
non-financial
asset ornon-financial
liability, the amounts recognised in OCI are transferred to the initial carrying amount of thenon-financial
asset or liabilityIf the hedging instrument expires or is sold, terminated or exercised without replacement or rollover (as part of the hedging strategy), or if its designation as a hedge is revoked, or when the hedge no longer meets the criteria for hedge accounting, any cumulative gain or loss previously recognised in OCI remains separately in equity until the forecast transaction occurs or the foreign currency firm commitment is met.
(3) Hedges of a net investment
Hedges of a net investment in a foreign operation, including a hedge of a monetary item that is accounted for as part of the net investment, are accounted for in a way similar to cash flow hedges. Gains or losses on the hedging instrument relating to the effective portion of the hedge are recognised in OCI while any gains or losses relating to the ineffective portion are recognised in the consolidated statements of profit or loss. On disposal of the foreign operation, the cumulative value of any such gains or losses recorded in equity is reclassified to the consolidated statements of profit or loss.
H. Borrowing costs
Borrowing cost includes interest expense as per EIR and exchange differences arising from foreign currency borrowings to the extent they are regarded as an adjustment to the interest cost.
Borrowing costs directly relating to the acquisition, construction or production of a qualifying capital project under construction are capitalised and added to the project cost during construction until such time that the assets are substantially ready for their intended use, i.e., when they are capable of commercial production. Borrowing costs relating to the construction phase of a service concession arrangement is capitalised as part of the cost of the intangible asset. Where funds are borrowed specifically to finance a qualifying capital project, the amount capitalised represents the actual borrowing costs incurred. Where surplus funds are available out of money borrowed specifically to finance a qualifying capital project, the income generated from such short-term investments is deducted from the total capitalised borrowing cost. If any specific borrowing remains outstanding after the related asset is ready for its intended use or sale, that borrowing then becomes part of general borrowing. Where the funds used to finance a project form part of general borrowings, the amount capitalised is calculated using a weighted average of rates applicable to relevant general borrowings of the Group during the year.
All other borrowing costs are recognised in the consolidated statements of profit or loss in the year in which they are incurred.
Capitalisation of interest on borrowings related to construction or development projects is ceased when substantially all the activities that are necessary to make the assets ready for their intended use are complete or when delays occur outside of the normal course of business.
EIR is the rate that discounts the estimated future cash payments or receipts over the expected life of the financial liability or a shorter period, where appropriate, to the amortised cost of a financial liability. When calculating the effective interest rate, the Group estimates the expected cash flows by considering all the contractual terms of the financial instrument (for example, prepayment, extension, call and similar options).
I. Impairment
Non-financial
assetsImpairment charges and reversals are assessed at the level of cash-generating units. A cash-generating unit (CGU) is the smallest identifiable group of assets that generate cash inflows that are largely independent of the cash inflows from other assets or group of assets.
F-2
4
The Group assesses at each reporting date, whether there is an indication that an asset may be impaired. The Group conducts an internal review of asset values annually, which is used as a source of information to assess for any indications of impairment or reversal of previously recognised impairment losses. Internal and external factors, such as worse economic performance than expected, changes in expected future prices, costs and other market factors are also monitored to assess for indications of impairment or reversal of previously recognised impairment losses.
If any such indication exists or in case of goodwill where annual testing of impairment is required, then an impairment review is undertaken and the recoverable amount is calculated as the higher of fair value less costs of disposal and the asset’s value in use.
Fair value less costs of disposal is the price that would be received to sell the asset in an orderly transaction between market participants and does not reflect the effects of factors that may be specific to the Group and not applicable to entities in general. Fair value for mineral and oil and gas assets is generally determined as the present value of the estimated future cash flows expected to arise from the continued use of the asset, including any expansion prospects and its eventual disposal, using assumptions that an independent market participant may take into account. These cash flows are discounted at an appropriate
post-tax
discount rate to arrive at the net present value.Value in use is determined as the present value of the estimated future cash flows expected to arise from the continued use of the asset in its present form and its eventual disposal. The cash flows are discounted using a
pre-tax
discount rate that reflects current market assessments of the time value of money and the risks specific to the asset for which estimates of future cash flows have not been adjusted. Value in use is determined by applying assumptions specific to the Group’s continued use and do not take into account future development. These assumptions are different to those used in calculating fair value and consequently the value in use calculation is likely to give a different result to a fair value calculation.The carrying amount of the CGU is determined on a basis consistent with the way the recoverable amount of the CGU is determined. The carrying value is net of deferred tax liability recognised in the fair value of assets acquired in the business combination.
If the recoverable amount of an asset or CGU is estimated to be less than its carrying amount, the carrying amount of the asset or CGU is reduced to its recoverable amount and impairment loss is recognised in the consolidated statements of profit or loss.
Any reversal of the previously recognised impairment loss is limited to the extent that the asset’s carrying amount does not exceed the carrying amount that would have been determined if no impairment loss had previously been recognised except if initially attributed to goodwill.
Exploration and evaluation assets:
In assessing whether there is any indication that an exploration and evaluation asset may be impaired, the Group considers, as a minimum, the following indicators:
| • | the period for which the Group has the right to explore in the specific area has expired during the period or will expire in the near future, and is not expected to be renewed; |
| • | substantive expenditure on further exploration for and evaluation of mineral resources in the specific area is neither budgeted nor planned; |
| • | exploration for and evaluation of mineral resources in the specific area have not led to the discovery of commercially viable quantities of mineral resources and the Group has decided to discontinue such activities in the specific area; |
| • | sufficient data exist to indicate that, although a development in the specific area is likely to proceed, the carrying amount of the exploration and evaluation asset is unlikely to be recovered in full from successful development or by sale; |
| • | reserve information prepared annually by external experts. |
When a potential impairment is identified, an assessment is performed for each area of interest in conjunction with the group of operating assets (representing a cash-generating unit) to which the exploration and evaluation assets is attributed. Exploration areas in which reserves have been discovered but require major capital expenditure before production can begin, are continually evaluated to ensure that commercial quantities of reserves exist or to ensure that additional exploration work is under way or planned. To the extent that capitalised expenditure is no longer expected to be recovered, it is charged to the consolidated statements of profit or loss.
J. Leases
The Group assesses at contract inception, all arrangements to determine whether they are, or contain, a lease i.e., if the contract conveys the right to control the use of an identified asset for a period of time in exchange for consideration.
(a) Group as a lessor
Leases in which the Group does not transfer substantially all the risks and rewards of ownership of an asset are classified as operating leases. Rental income from operating lease is recognised on a straight-line basis over the term of the relevant lease. Initial direct costs incurred in negotiating and arranging an operating lease are added to the carrying amount of the leased asset and recognised over the lease term on the same basis as rental income. Contingent rents are recognised as revenue in the period in which they are earned.
F-2
5
Leases are classified as finance leases when substantially all of the risks and rewards of ownership
transfer
from the Group to the lessee. Amounts due from lessees under finance leases are recorded as receivables at the Group’s net investment in the leases. Finance lease income is allocated to accounting periods so as to reflect a constant periodic rate of return on the net investment outstanding in respect of the lease.(b) Group as a lessee
The Group applies a single recognition and measurement approach for all leases, except for short-term leases and leases ofassets representing the right to use the underlying assets.
low-value
assets. The Group recognises lease liabilities towards future lease payments andright-of-use
(i)assets
Right-of-use
The Group recognisesassets at the commencement date of the lease (i.e., the date when the underlying asset is available for use).assets are measured at cost, less any accumulated depreciation and impairment losses, and adjusted for any remeasurement of lease liabilities. The cost ofassets includes the amount of lease liabilities recognised, initial direct costs incurred, and lease payments made at or before the commencement date less any lease incentives received. Theassets are also subject to impairment assessment.
right-of-use
Right-of-use
right-of-use
right-of-use
Right-of-use
(ii) Lease liabilities
At the commencement date of the lease, the Group recognises lease liabilities measured at the present value of lease payments to be made over the lease term. The lease payments include fixed payments (in some instances,
in-substance
fixed payments) less any lease incentives receivable, variable lease payments that depend on an index or a rate, and amounts expected to be paid under residual value guarantees. The lease payments also include the exercise price of a purchase option reasonably certain to be exercised by the Group and payments of penalties for terminating the lease, if the lease term reflects the Group exercising the option to terminate. Variable lease payments that do not depend on an index or a rate are recognised as expenses (unless they are incurred to produce inventories) in the period in which the event or condition that triggers the payment occurs.In calculating the present value of lease payments, the Group uses its incremental borrowing rate at the lease commencement date because the interest rate implicit in the lease is generally not readily determinable. After the commencement date, the amount of lease liabilities is increased to reflect the accretion of interest and reduced for the lease payments made. In addition, the carrying amount of lease liabilities is remeasured if there is a modification, a change in the lease term, a change in the lease payments (e.g., changes to future payments resulting from a change in an index or rate used to determine such lease payments) or a change in the assessment of an option to purchase the underlying asset.
The Group’s lease liabilities are included in trade and other payables.
(iii) Short-term leases and leases of
low-value
assetsThe Group applies the short-term lease recognition exemption to its short-term leases of equipment (i.e., those leases that have a lease term of 12 months or less from the commencement date and do not contain a purchase option). It also applies the lease of
low-value
assets recognition exemption to leases of office equipment that are considered to be low value. Lease payments on short-term leases and leases oflow-value
assets are recognised as expense on a straight-line basis over the lease term.K. Government grants
Grants and subsidies from the government are recognised when there is reasonable assurance that (i) the Group will comply with the conditions attached to them, and (ii) the grant/subsidy will be received.
When the grant or subsidy relates to revenue, it is recognised as income on a systematic basis in the consolidated statements of profit or loss over the periods necessary to match them with the related costs which they are intended to compensate.
Government grants relating to tangible fixed assets are deducted in calculating the carrying amount of the assets and recognised in the consolidated statements of profit or loss over the expected useful lives of the respective assets as reduced depreciation expense.
When loans or similar assistance are provided by governments or related institutions, with an interest rate below the current applicable market rate, the effect of this favourable interest is regarded as a government grant. The loan or assistance is initially recognised and measured at fair value and the government grant is measured as the difference between the initial carrying value of the loan and the proceeds received. The loan is subsequently measured as per the accounting policy applicable to financial liabilities.
F-2
6
L. Inventories
Inventories andare stated at the lower of cost and net realisable value.
work-in-progress
Cost is determined on the following basis:
| • | Purchased copper concentrate is recorded at cost on a first-in, first-out (“FIFO”) basis; all other materials including stores and spares are valued on weighted average basis; except in oil and gas business where stores and spares are valued on FIFO basis; |
| • | Finished products are valued at raw material cost plus costs of conversion, comprising labour costs and an attributable proportion of manufacturing overheads based on normal levels of activity and are moved out of inventory on a weighted average basis (except in copper business where FIFO basis is followed); and |
| • | By-products and scrap are valued at net realisable value. |
Net realisable value is determined based on estimated selling price, less further costs expected to be incurred for completion and disposal.
M. Taxation
Tax expense represents the sum of current tax and deferred tax.
Current tax is provided at amounts expected to be paid (or recovered) using the tax rates and laws that have been enacted or substantively enacted by the reporting date and includes any adjustment to tax payable in respect of previous years.
Subject to the exceptions below, deferred tax is provided using the balance sheet method on all temporary differences at the reporting date between the tax bases of assets and liabilities and their carrying amounts for financial reporting purposes and on carry forward of unused tax credits and unused tax losses:
| • | tax payable on the future remittance of the past earnings of subsidiaries where the timing of the reversal of the temporary differences can be controlled and it is probable that the temporary differences will not reverse in the foreseeable future; |
| • | deferred income tax is not recognised on initial recognition as well as on the impairment of goodwill which is not deductible for tax purposes or on the initial recognition of an asset or liability in a transaction that is not a business combination and at the time of the transaction, affects neither the accounting profit nor taxable profit (tax loss); and |
| • | deferred tax assets (including MAT credit entitlement) are recognised only to the extent that it is more likely than not that they will be recovered. |
Deferred tax assets and liabilities are measured at the tax rates that are expected to apply to the year when the asset is realised or the liability is settled, based on tax rates (and tax laws) that have been enacted or substantively enacted at the reporting date. Tax relating to items recognised outside the consolidated statements of profit or loss is recognised either in other comprehensive income or equity.
The carrying amount of deferred tax assets (including MAT credit entitlement) is reviewed at each reporting date and is adjusted to the extent that it is no longer probable that sufficient taxable profit will be available to allow all or part of the asset to be recovered. Unrecognised deferred tax assets are
re-assessed
at each reporting date and are recognised to the extent that it has become probable that future taxable profits will allow the deferred tax asset to be recovered.Deferred tax assets and deferred tax liabilities are offset if a legally enforceable right exists to set off current income tax assets against current income tax liabilities and the deferred taxes relate to the same taxable entity and the same taxation authority.
Deferred tax is provided on temporary differences arising on acquisitions that are categorised as Business Combinations. Deferred tax is recognised at acquisition as part of the assessment of the fair value of assets and liabilities acquired. Subsequently deferred tax is charged or credited in the consolidated statements of profit or loss/other comprehensive income as the underlying temporary difference is reversed.
Further, management periodically evaluates positions taken in the tax returns with respect to situations in which applicable tax regulations are subject to interpretation and considers whether it is probable that a taxation authority will accept an uncertain tax treatment. The Group reflects the effect of uncertainty for each uncertain tax treatment by using either most likely method or expected value method, depending on which method predicts better resolution of the treatment.
N. Retirement benefit schemes
The Group operates or participates in a number of defined benefit and defined contribution schemes, the assets of which (where funded) are held in separately administered funds.
For defined benefit schemes, the cost of providing benefits under the plans is determined by actuarial valuation each year, separately for each plan, using the projected unit credit method by third party qualified actuaries.
F-2
7
Remeasurements
,
including effects of asset ceiling and return on plan assets (excluding amountsincluded
in interest on the net defined benefit liability) and actuarial gains and losses arising in the year, are recognised in full in other comprehensive income and are not recycled to the consolidated statements of profit or loss.Past service costs are recognised in the consolidated statements of profit or loss on the earlier of:
| • | the date of the plan amendment or curtailment, and |
| • | the date that the Group recognises related restructuring costs. |
Net interest is calculated by applying a discount rate to the net defined benefit liability or asset at the beginning of the period. Defined benefit costs are split into current service cost, past service cost, net interest expense or income and remeasurement, and gains and losses on curtailments and settlements.
Current service cost and past service costs are recognised within cost of sales and administrative expenses and distribution expenses. Net interest expense or income is recognised within finance and other costs.
For defined contribution schemes, the amount charged to the consolidated statements of profit or loss in respect of pension costs and other post-retirement benefits is the contributions payable in the year, recognised as and when the employee renders related services.
O. Share-based payments
Certain employees (including executive directors) of the Group receive part of their remuneration in the form of share-based payment transactions, whereby employees render services in exchange for shares or rights over shares (‘equity-settled transactions’).
The cost of equity-settled transactions with employees is measured at fair value of share awards at the date at which they are granted. The fair value of share awards is determined with the assistance of an external valuer and the fair value at the grant date is expensed on a proportionate basis over the vesting period based on the Group’s estimate of shares that will eventually vest. The estimate of the number of awards likely to vest is reviewed at each reporting date up to the vesting date at which point the estimate is adjusted to reflect the current expectations.
The resultant increase in equity is recorded in share-based payment reserve.
In case of cash-settled transactions, a liability is recognised for the fair value of cash-settled transactions. The fair value is measured initially and at each reporting date up to and including the settlement date, with changes in fair value recognised in employee benefits expense. The fair value is expensed over the period until the vesting date with recognition of a corresponding liability. The fair value is determined with the assistance of an external valuer.
P. Provisions, contingent liabilities and contingent assets
The assessments undertaken in recognising provisions and contingencies have been made in accordance with the applicable IFRS.
Provisions represent liabilities for which the amount or timing is uncertain. Provisions are recognised when the Group has a present obligation (legal or constructive), as a result of past events, and it is probable that an outflow of resources, that can be reliably estimated, will be required to settle such an obligation. If the effect of the time value of money is material, provisions are determined by discounting the expected future cash flows to net present value using an appropriate
pre-tax
discount rate that reflects current market assessments of the time value of money and, where appropriate, the risks specific to the liability. Unwinding of the discount is recognised in the consolidated statements of profit or loss as finance and other costs. Provisions are reviewed at each reporting date and are adjusted to reflect the current best estimate.A contingent liability is a possible obligation that arises from past events whose existence will be confirmed by the occurrence or
non-occurrence
of one or more uncertain future events beyond the control of the Group or a present obligation that is not recognised because it is not probable that an outflow of resources will be required to settle the obligation. A contingent liability also arises in extremely rare cases where there is a liability that cannot be recognised because it cannot be measured reliably. In certain situations, the Group does not recognise a contingent liability but discloses its existence in the consolidated financial statements.Contingent assets are not recognised but disclosed in the financial statements when an inflow of economic benefit is probable.
The Group has significant capital commitments in relation to various capital projects which are not recognised in the consolidated statements of financial position.
Q. Restoration, rehabilitation and environmental costs
An obligation to incur restoration, rehabilitation and environmental costs arises when environmental disturbance is caused by the development or ongoing production of a mine or oil fields. Such costs, discounted to net present value, are provided for and a corresponding amount is capitalised at the start of each project as soon as the obligation to incur such costs arises. These costs are charged to the consolidated statements of profit or loss over the life of the operation through the depreciation of the asset and the unwinding of the discount on the provision. The cost estimates are reviewed periodically and are adjusted to reflect known developments which may have an impact on the cost estimates or life of operations. The cost of the related asset is adjusted for changes in the provision due to factors such as updated cost estimates, changes to lives of operations, new disturbance and revisions to discount rates. The adjusted cost of the asset is depreciated prospectively over the lives of the assets to which they relate. The unwinding of the discount is shown as finance and other costs in the consolidated statements of profit or loss. Costs for the restoration of subsequent site damage which is caused on an ongoing basis during production are provided for at their net present value and charged to the consolidated statements of profit or loss as extraction progresses. Where the costs of site restoration are not anticipated to be material, they are expensed as incurred.
F-2
8
R. Accounting for foreign currency transactions and translations
The functional currency for each entity in the Group is determined as the
currency
of the primary economic environment in which it operates. For all principal operating subsidiaries, the functional currency is normally the local currency of the country in which it operates with the exception of oil and gas business operations which have US dollar functional currency as that is the currency of the primary economic environment in which it operates.In the financial statements of individual group companies, transactions in currencies other than the respective functional currencies are translated into their functional currencies at the exchange rates ruling at the date of the transaction. Monetary assets and liabilities denominated in other currencies are translated into functional currencies at exchange rates prevailing on the reporting date.
Non-monetary
assets and liabilities denominated in other currencies and measured at historical cost or fair value are translated at the exchange rates prevailing on the dates on which such values were determined.All exchange differences are included in the consolidated statements of profit or loss except those where the monetary item is designated as an effective hedging instrument of the currency risk of designated forecasted sales or purchases, which are recognised in the other comprehensive income.
Exchange differences which are regarded as an adjustment to interest costs on foreign currency borrowings are capitalised as part of borrowing costs in qualifying assets.
For the purposes of the consolidation of financial statements, items in the consolidated statements of profit or loss of those businesses for which the Indian Rupees is not the functional currency are translated into Indian Rupees at the average rates of exchange during the year/ exchange rates as on the date of transaction. The related consolidated statements of financial position is translated into Indian rupees at the rates as at the reporting date. Exchange differences arising on translation are recognised in the consolidated statements of other comprehensive income. On disposal of such entities the deferred cumulative exchange differences recognised in equity relating to that particular foreign operation are recognised in the consolidated statements of profit or loss.
S. Earnings per share
The Group presents basic and diluted earnings per share (“EPS”) data for its equity shares. Basic EPS is calculated by dividing the profit or loss attributable to equity shareholders of the Company by the weighted average number of equity shares outstanding during the period. Diluted EPS is determined by adjusting the profit or loss attributable to equity shareholders and the weighted average number of equity shares outstanding for the effects of all potentially dilutive equity shares.
T. Treasury shares
The Group has created an Employee Benefit Trust (EBT) for providing share-based payment to its employees. The Group uses EBT as a vehicle for distributing shares to employees under the employee remuneration schemes. The EBT buys shares of the Company from the market for giving shares to employees. The shares held by EBT are treated as treasury shares.
Own equity instruments that are reacquired (treasury shares) are recognised at cost and deducted from equity. No gain or loss is recognised in profit or loss on the purchase, sale, issue or cancellation of the Group’s own equity instruments. Any difference between the carrying amount and the consideration, if reissued, is recognised in equity. Share options, whenever exercised, are satisfied with treasury shares.
U. Current and
non-current
classificationThe Group presents assets and liabilities in the consolidated statements of financial position based on current /
non-current
classification. An asset is classified as current when it satisfies any of the following criteria:| • | it is expected to be realized in, or is intended for sale or consumption in, the Group’s normal operating cycle; |
| • | it is held primarily for the purpose of being traded; |
| • | it is expected to be realized within 12 months after the reporting date; or |
| • | it is cash or cash equivalent unless it is restricted from being exchanged or used to settle a liability for at least 12 months after the reporting date. |
All other assets are classified as
non-current.
A liability is classified as current when it satisfies any of the following criteria:
| • | it is expected to be settled in the Group’s normal operating cycle; |
| • | it is held primarily for the purpose of being traded; |
| • | it is due to be settled within 12 months after the reporting date; or |
| • | the Group does not have an unconditional right to defer settlement of the liability for at least 12 months after the reporting date. Terms of a liability that could, at the option of the counterparty, result in its settlement by the issue of equity instruments do not affect its classification. |
All other liabilities are classified as
non-current.
F-
29
Deferred tax assets and liabilities are classified as
non-current
only.V. Acceptances
The Group enters into arrangements whereby banks and financial institutions make direct payments to suppliers for raw materials and project materials. The banks and financial institutions are subsequently repaid by the Group at a later date providing working capital timing benefits. These are normally settled between twelve months (for raw materials) to (for project and materials). Where these arrangements are with a maturity of up to twelve months, the economic substance of the transaction is determined to be operating in nature and these are recognised as Acceptances. Where these arrangements are with a maturity beyond twelve months and up to
thirty-six
monthsthirty-six
months, the economic substance of the transaction is determined to be financing in nature, and these are presented within borrowings in the consolidated statements of financial position. Interest expense on these are recognised as finance and other costs. Payments made by banks and financial institutions to the operating vendors are treated as an operational cash outflow and financing inflow and settlement of such acceptances by the Group is treated as a financing cash outflow.W. Cash and cash equivalents and restricted cash and cash equivalents
Cash and cash equivalents comprise cash at bank and in hand, and short-term money market deposits which have a maturity of three months or less from the date of acquisition that are readily convertible to known amounts of cash and which are subject to an insignificant risk of changes in value and are unrestricted as to withdrawal and usage.
For the purpose of the consolidated statement of cash flows, cash and cash equivalents consist of cash and short-term deposits, as defined above, and additionally includes unpaid dividend account.
Restricted cash and cash equivalents in the consolidated statements of financial position comprise cash at bank and in hand, and short-term deposits which have a maturity of three months or less from the date of acquisition and are restricted as to withdrawal and usage.
3(b) Application of new and revised standards
The Group has adopted, with effect from April 1, 2021, the following new and revised standards and interpretations. Their adoption did not had any material impact on the amounts reported in the consolidated financial statements.
| 1. | Amendments to IFRS 3 regarding recognition under acquisition method; |
| 2. | Amendments to IFRS 7 ( Financial Instruments Disclosure ) ( Financial Instruments: Recognition and Measurement ) ( Insurance Contracts ) ( Leases: IFRS Foundation ) |
| 3. | Conceptual framework for financial reporting under IFRS issued by IASB; |
| 4. | Amendments to IFRS 16 regarding COVID-19 related rent concessions. |
Standards issued but not yet effective
The new and amended standards that are issued, but not yet effective, up to the date of issuance of the Group’s financial statements are noted below:
New pronouncement | Fiscal year beginning | |
Reference to the Conceptual Framework – Amendments to IFRS 3 | January 1, 2022 | |
Property, Plant and Equipment: Proceeds before Intended Use – Amendments to IAS 16 ( Property, Plant and Equipment: IFRS Foundation ) | January 1, 2022 | |
Onerous Contracts – Costs of Fulfilling a Contract – Amendments to IAS 37 ( Provisions, Contingent Liabilities and Contingent Assets ) | January 1, 2022 | |
AIP IFRS 9 ( Financial Instruments ) – Fees in the ‘10 per cent’ test for derecognition of financial liabilities | January 1, 2022 | |
Classification of Liabilities as Current or Non-current - Amendments to IAS 1 ( Presentation of Financial Statements ) | January 1, 2023 | |
Definition of Accounting Estimates - Amendments to IAS 8 ( Accounting Policies, Changes in Accounting Estimates and Errors ) | January 1, 2023 | |
Disclosure of Accounting Policies - Amendments to IAS 1 and IFRS Practice Statement 2 ( Making materiality judgements ) | January 1, 2023 |
The amendments are not expected to have a material impact on the Group. The Group has not early adopted any amendments which has been notified but is not yet effective.
F-3
0
3(c) Significant accounting estimates and judgements
The preparation of consolidated financial statements in conformity with IFRS requires management to make judgements, estimates and assumptions, that affect the application of accounting policies and the reported amounts of assets, liabilities, income, expenses and disclosures of contingent assets and liabilities at the date of these consolidated financial statements and the reported amounts of revenues and expenses for the years presented. These judgments and estimates are based on management’s best knowledge of the relevant facts and circumstances, having regard to previous experience, but actual results may differ materially from the amounts included in the financial statements.
Estimates and underlying assumptions are reviewed on an ongoing basis. Revisions to accounting estimates are recognised in the period in which the estimate is revised and future periods affected.
The information about significant areas of estimation uncertainty and critical judgements in applying accounting policies that have the most significant effect on the amounts recognised in the financial statements are as given below:
I. Significant Estimates:
(i) | Carrying value of exploration and evaluation assets |
Exploration assets are assessed by comparing the carrying value to higher of fair value less cost of disposal or value in use if there are impairment indicators as contained in IFRS 6 (). Change to the valuation of exploration assets is an area of judgement. Further details on the Group’s accounting policies on this are set out in accounting policies above. The amounts for exploration and evaluation assets represent active exploration projects. These amounts will be written off to the consolidated statements of profit or loss as exploration costs unless commercial reserves are established, or the determination process is not completed and there are no indications of impairment. The outcome of ongoing exploration, and therefore whether the carrying value of exploration and evaluation assets will ultimately be recovered, is inherently uncertain.
Exploration for any Evaluation of Mineral resources
Details of carrying values and impairment charge/ reversal and the assumptions used are disclosed in Note 14.
(ii) | Recoverability of deferred tax and other income tax assets |
The Group has carried forward tax losses, unabsorbed depreciation and MAT credit that are available for offset against future taxable profit. Deferred tax assets are recognised only to the extent that it is probable that taxable profit will be available against which the unused tax losses or tax credits can be utilized. This involves an assessment of when those assets are likely to reverse, and a judgement as to whether or not there will be sufficient taxable profits available to offset the assets. This requires assumptions regarding future profitability, which is inherently uncertain. To the extent assumptions regarding future profitability change, there can be an increase or decrease in the amounts recognised in respect of deferred tax assets and consequential impact in the consolidated statements of profit or loss.
Details of total deferred tax assets recognised in these financial statements including MAT credit entitlements are disclosed in Note 9.
(iii) | Copper operations in Tamil Nadu, India |
TNPCB had issued a closure order of the Tuticorin Copper smelter, against which the Group had filed an appeal with the National Green Tribunal (“NGT”). NGT had, on August 8, 2013, ruled that the Copper smelter could continue its operations subject to implementation of recommendations of the Expert Committee appointed by the NGT. The TNPCB has filed an appeal against the order of the NGT before the Hon’ble Supreme Court of India.
In the meanwhile, the application for renewal of Consent to Operate (“CTO”) for existing copper smelter was rejected by the TNPCB in April 2018. The Group has filed an appeal before the TNPCB Appellate Authority challenging the Rejection Order. During the pendency of the appeal, the TNPCB vide its order dated May 23, 2018 ordered closure of existing copper smelter plant with immediate effect. Further, the Government of Tamil Nadu issued orders on the same date with a direction to seal the existing copper smelter plant permanently. The Group believes these actions were not taken in accordance with the procedure prescribed under applicable laws. Subsequently, the Directorate of Industrial Safety and Health passed orders dated May 30, 2018 directing the immediate suspension and revocation of the Factory License and the Registration Certificate for the existing smelter plant.
The Group appealed this before the NGT. NGT vide its order on December 15, 2018 has set aside the impugned orders and directed the TNPCB to pass fresh orders for renewal of consent and authorization to handle hazardous substances, subject to appropriate conditions for protection of environment in accordance with law.
The State of Tamil Nadu and TNPCB approached the Hon’ble Supreme Court in Civil Appeals on January 2, 2019 challenging the judgement of the NGT dated December 15, 2018 and the previously passed judgement of NGT dated August 8, 2013. The Supreme Court vide its judgement dated February 18, 2019 set aside the judgements of NGT dated December 15, 2018 and August 8, 2013 solely on the basis of maintainability and directed the Group to file an appeal in High court.
The Group had filed a writ petition before Madras High Court challenging the various orders passed against the Group in 2018 and 2013. On August 18, 2020, the Madras High Court delivered the judgement wherein it dismissed all the Writ Petitions filed by the Group. The Group has approached the Supreme Court and challenged the said High Court order by way of a Special Leave Petition (“SLP”) to Appeal and filed an interim relief for care & maintenance of the plant or trial run for certain period.
The Matter was then listed on December 2, 2020 before the Supreme Court, which after having heard both sides concluded that at this stage the interim relief in terms of trial run could not be allowed. The hearing on care & maintenance could not be listed at the Supreme Court. Further, considering the voluminous nature of documents and pleadings, the matter shall be finally heard on merits.
F-3
1
As per the Group’s assessment, it is in compliance with the applicable
regulations
and expects to get the necessary approvals in relation to the existing operations and hence the Group does not expect any material adjustments to these financial statements as a consequence of above actions.The Group has carried out an impairment analysis for existing plant assets during the year ended March 31, 2022 considering the key variables and concluded that there exists no impairment. The Group has done an additional sensitivity analysis with commencement of operations of the existing plant w.e.f. April 1, 2025 and noted that the recoverable amount of the assets would still be in excess of their carrying values.
The carrying value of the assets as at March 31,
₹
₹
Expansion Project:
Separately, the Group filed a fresh application for renewal of the Environmental Clearance (EC) for the proposed Copper Smelter Plant 2 (Expansion Project) on March 12, 2018 before the Expert Appraisal Committee of the Ministry of Environment and Forests and Climate Change (“MoEFCC”) wherein a
sub-committee
was directed to visit the Expansion Project site prior to prescribing the Terms of Reference.In the meantime, the Madurai Bench of the High Court of Madras, in a Public Interest Litigation, held vide its order dated May 23, 2018 that the application for renewal of the EC for the Expansion Project shall be processed after a mandatory public hearing, and in the interim, ordered the Group to cease construction and all other activities on site for the proposed Expansion Project with immediate effect. The MoEFCC has delisted the expansion project since the matter is
cancelled 342.22sub-judice.
Separately, State Industries Promotion Corporation of Tamil Nadu Ltd (“SIPCOT”) vide its letter dated May 29, 2018acres of the land allotted for the proposed Expansion Project. Further, the TNPCB issued orders on June 7, 2018 directing the withdrawal of the Consent to Establish (“CTE”) which was valid till March 31, 2023.
The Group has approached the Madras High Court by way of writ petition challenging the cancellation of lease deeds by SIPCOT pursuant to which an interim stay has been granted. The Group has also filed Appeals before the TNPCB Appellate Authority challenging withdrawal of CTE by the TNPCB, the matter is pending for adjudication. Considering the delay in existing plant matter and delay in getting the required approval for expansion project, management has recorded a provision for impairment of 6,692 million for expansion project basis fair value less cost of disposal in the fiscal year ended March 31, 2020. The net carrying value o
₹
f
₹
₹
million)
in fiscal years ending March 31, 2021 and as at March 31, 2022, respectively, approximating its recoverable value.
Property, plant and equipment of 12,129 million ($ 160 million) and inventories of 3,007 million ($ 40 million) pertaining to existing and expansion plant, could not be physically verified, anytime during the year, as the access to the plant is presently restricted. However, since operations are suspended and access to the plant restricted, any difference between book and physical quantities is unlikely to be
₹
₹
material.
On June 17, 2022, Board of Directors of the Company adopted a resolution to explore various options to potentially sell, in whole or in part, its Copper plant and associated facilities at Tuticorin. Accordingly, an Expression of Interest in this regard has been released on June 20, 2022. However, these evaluations are only exploratory in nature and no firm commitments have been executed at this stage.
iv) | PSC Extension |
Rajasthan Block
The Group operates an oil and gas production facility in Rajasthan under a Production Sharing Contract (“PSC”). The management is of the opinion that the Group is eligible for an automatic extension of the PSC for Rajasthan (“RJ”) block on the same terms w.e.f. May 15, 2020 while Government of India (“GOI”), in October 2018, accorded its approval for extension of the PSC under the
of 10Pre-NELP
Extension policy as per notification dated April 7, 2017(“Pre-NELP
Policy”) by a periodyears. As per the said policy and extension letter, the Group is required to comply with certain conditions and pay an
% Profit Petroleum (“PP”) to GOI. The Group had challenged the applicability of the Pre NELP-Policy to the RJ block. The Division Bench of the Delhi High Court in March 2021 set aside the single judge order of May 2018 which allowed automatic extension of PSC.
Nevertheless, GOI in their submissions to the Delhi High Court has not objected to Vedanta obtaining
10-year
extension of RJ PSC. The legal dispute only relates to
additional 10% PP rather than Vedanta’s right to obtain
additional 1010-year
extension. In the interim, without prejudice to the Group’s right, the Group has commenced paying the% PP claimed from May 15, 2020 to GoI. The Group has also filed an SLP in the Hon’ble Supreme Court against above Delhi High Court order and revised date for SLP listing is awaited.
In parallel, the Group is in discussion with the ministry of petroleum and natural gas (“MoPNG”) on execution of a PSC addendum.
One of the conditions for extension of PSC relates to notification of certain audit exceptions raised for FY 2016
-17
as per PSC provisions and provides for payment of amounts, if such audit exceptions result into any creation of liability. The Group had also clarified that the same should bede-linked
as a condition for the extension which had been granted in October 2018. Discussions are ongoing to agree on the position that this issue will be dealt with as per ongoing arbitration with GOI as per PSC mechanism.
The Directorate General of Hydrocarbons (“DGH”), in May 2018, has raised a demand on the Group and its subsidiary for the period up to March 31, 2017 for Government’s additional share of PP based on its computation of disallowance of cost incurred in excess of the initially approved Field Development Plan (“FDP”) of pipeline project for
₹
re-allocation
of certain common costs between Development Areas (“DAs”) of RJ aggregating to₹
re-allocation
of certain common costs between DAs of RJ block of₹
up to
March 31, 2017. This amount was subsequently revised to₹
F-3
2
On April 28, 2022, DGH
has notified audit exceptions for the periodup to
May 14, 2020 and included an additional amount ofUS $ 259 million
for above mentioned matters. Demand of
US $ 202
million previously raised in May 2018 in respect of disallowance of costs incurred in excess of initially approved FDP of pipeline project has been removed as the revised pipeline project cost over the initial approved FDP was approved in September 2021.
The Group believes that it has sufficient, as well as reasonable, basis pursuant to the PSC provisions and related approvals, supported by legal advice, for having claimed such costs and for allocating common costs between different DAs. In the Group’s opinion, these computations of the aforesaid demand / audit exceptions are not appropriate, and the accounting adjustments sought for issues pertaining to Year 2007 and onwards are based on assumptions that are not in consonance with the approvals already in place. The Group’s view is also supported by independent legal opinion and the Group has been following the process set out in PSC to resolve these aforesaid matters. The Group has also invoked the PSC process for resolution of disputed exceptions and has issued notice for arbitration and an arbitration tribunal (“Tribunal”) stands constituted. Further, on September 23, 2020, the GOI had filed an application for interim relief before Delhi High Court seeking payment of all disputed dues. The matter was heard on September 25, 2020 wherein the Delhi High Court has not passed any ex parte orders. The matter is now listed for hearing on August 29, 2022.
Also, on Vedanta’s application under section 17 of the Arbitration and Conciliation Act, 1996, the Tribunal in December 2020 ordered that GOI should not take any action to enforce any of the amounts at issue in this arbitration against the Claimants (the Company and CIHL) during the arbitral period. The GOI has challenged the said order before the Delhi High Court under the said Act. This matter is also scheduled for hearing.
The Group has also filed application under Sec 151 of Code of Civil Procedure (CPC) read with Section 9 of the Arbitration & Conciliation Act 1996 requesting Delhi High Court to direct GOI to extend the PSC for 10 years without insisting upon a payment of disputed dues under audit exceptions which have been already referred to arbitration. On April 12, 2022, basis the application, Delhi High Court has issued notice to GOI intimating application filed by the Group. The matter is yet to be heard.
In management’s view, the above-mentioned condition on demand raised by the DGH for additional petroleum linked to PSC extension is untenable and has not resulted in creation of any liability and cannot be a ground for
non-extension.
In addition, all necessary procedures prescribed in the PSC including invocation of arbitration, in respect of the stated audit observation have also been fulfilled. Accordingly, the PSC extension approval granted vide DGH letter dated October 26, 2018 upholds with all conditions addressed and no material liability would devolve upon the Group.Simultaneously, the Group is also pursuing with the GOI for executing the RJ PSC addendum at the earliest. In view of extenuating circumstances surrounding
COVID-19
and pending signing of the PSC addendum for extension after complying with all stipulated conditions, the GOI has been granting interim permission to the Group to continue Petroleum operations in the RJ block. The latest permission is valid up to August 14, 2022 or signing of the PSC addendum, whichever is earlier.| (v) | ESL had filed application for renewal of Consent to Operate (CTO) on August 24, 2017 for the period of five years which was denied by Jharkhand State Pollution Control Board (‘JSPCB’) on August 23, 2018, as JSPCB awaited response from MoEFCC over a 2012 show-cause notice. After a personal hearing towards the show cause notice, the MoEFCC also revoked the EC on September 20, 2018. The Hon’ble High Court of Jharkhand granted stay against both the above orders and allowed the continuous running of the plant operations under regulatory supervision of the JSPCB. The Jharkhand High Court on September 16, 2020 passed an order vacating the interim stay in place beyond September 23, 2020 while listing the matter for final hearing. ESL urgently filed a petition in the Supreme Court, and on September 22, 2020, ESL was granted permission to run the plant till further orders. |
The Forest Advisory Committee (FAC) of MoEFCC granted the Stage 1 clearance and the MoEFCC approved the related Terms of Reference (“TOR”) on August 25, 2020. ESL presented its proposal before the Expert Appraisal Committee (“EAC”) after completing the public consultation process and the same has been recommended for grant of EC subject to Forest Clearance (“FC”) by the EAC in its 41st meeting dated July 29 and 30, 2021. Vide letter dated August 25, 2021, the MoEFCC rejected the EC “as of now” due to stay granted by Madras High Court vide order dated July 15, 2021 in a Public Interest Litigation filed against the Standard Operating Procedure which was issued by the MoEFCC for regularization of violation case on July 7, 2021. The Hon’ble Supreme Court of India vide order dated December 9, 2021 decided the matter by directing MoEFCC to process the EC application of ESL as per the applicable law within a period of three months. The MoEFCC vide its letter dated February 2, 2022 has deferred the grant of EC till FC Stage-II is granted to ESL. ESL has submitted its reply against the MoEFCC letter vide letter dated February 11, 2022 for reconsidering the decision of linking EC with FC as the grant of FC Stage-II is not a condition precedent for grant of EC. As per Stage 1 clearance, the Group is required to provide
fnon-forest
land in addition to the afforestation cost. The Group, based on the report of an Environment Impact Assessment consultant, had recognised a provision o₹
million as part of cost of sales in the financial statements for the year ended March 31, 2021 with respect to the costs to be incurred by it for obtaining EC and additional
₹
) has been provided against final order relating to wildlife conservation plan received during the current year.
(vi) | Oil and Gas reserves |
Significant technical and commercial judgements are required to determine the Group’s estimated oil and natural gas reserves. Reserves considered for computing depletion are proved reserves for acquisition costs and proved and developed reserves for successful exploratory wells, development wells, processing facilities, distribution assets, estimated future abandonment cost and other related costs. Reserves for this purpose are considered on working interest basis which are reassessed at least annually. Changes in reserves as a result of change in management assumptions
(see vii below)
could impact the depreciation rates and the carrying value of assets (refer Note 14).(vii) | Carrying value of developing/producing oil and gas assets |
Management performs impairment tests on the Group’s developing/producing oil and gas assets where indicators of impairment are identified in accordance with IAS 36.
The impairment assessments are based on a range of estimates and assumptions, including:
Estimates/ assumptions | Basis | |
Future production | proved and probable reserves, production facilities, resource estimates and expansion projects | |
Commodity prices | management’s best estimate benchmarked with external sources of information, to ensure they are within the range of available analyst forecast | |
Discount to price | management’s best estimate based on historical prevailing discount and updated sales contracts | |
Extension of PSC | granted till 2030 on the expected commercial terms (Refer Note 3(c)(I)(iv) | |
Discount rates | cost of capital risk-adjusted for the risk specific to the asset/ CGU |
F-3
3
Any subsequent changes to cash flows due to changes in the above-mentioned factors could impact the carrying value of the assets.
Details of carrying values and impairment charge and the assumptions used are disclosed in Note 14.
| (viii) | Impact of Taxation Laws (Amendment) Act, 2019 Pursuant to the introduction of Section 115BAA of the Income Tax Act, 1961 which is effective April 1, 2019, companies in India have the option to pay corporate income tax at the rate of 22% plus applicable surcharge and cess as against the earlier rate of 30% plus applicable surcharge and cess, subject to certain conditions like, the Company has to forego all benefits like tax holidays, brought forward losses generated through tax incentives/additional depreciation and outstanding MAT credit. Considering all the provisions under Section 115BAA and based on the expected timing of exercising of the option under Section 115BAA, the Group has remeasured its deferred tax balances as at March 31, 2022. This computation required assessment of assumptions regarding future profitability, which is inherently uncertain. To the extent assumptions regarding future profitability change, there can be increase or decrease in the amounts recognised. Refer Note 9 for details. |
II. Significant Judgements:
| (i) | Determining whether an arrangement contains a lease: |
The Group has ascertained that the Power Purchase Agreement (PPA) executed between one of the subsidiaries and a state grid qualifies to be an operating lease under IFRS 16. Accordingly, the consideration receivable under the PPA relating to recovery of capacity charges towards capital cost have been recognised as operating lease rentals and in respect of variable cost that includes fuel costs, operations and maintenance, etc. is considered as revenue from sale of products/services.
Significant judgement is required in segregating the capacity charges due from the State grid between fixed and contingent payments. The Group has determined that since the capacity charges under the PPA are based on the number of units of electricity made available, which would be subject to variation on account of various factors like availability of coal and water for the plant, there are no fixed minimum payments under the PPA, which requires it to be accounted for on a straight line basis. The contingent rents recognised are disclosed in Note 6.
| (ii) | Contingencies |
In the normal course of business, contingent liabilities may arise from litigation, taxation and other claims against the Group. A provision is recognised when the Group has a present obligation as a result of past events, and it is probable that the Group will be required to settle that obligation.
Where it is management’s assessment that the outcome cannot be reliably quantified or is uncertain, the claims are disclosed as contingent liabilities unless the likelihood of an adverse outcome is remote. Such liabilities are disclosed in the notes but are not provided for in the consolidated financial statements.
When considering the classification of legal or tax cases as probable, possible or remote, there is judgement involved. This pertains to the application of the legislation, which in certain cases is based upon management’s interpretation of country specific applicable law, in particular India, and the likelihood of settlement. Management uses
in-house
and external legal professionals to make informed decision.Although there can be no assurance regarding the final outcome of the legal proceedings, the Group does not expect them to have a materially adverse impact on the Group’s financial position, profitability or cash flows. These are set out in Note 33.
| (iii) | Revenue recognition and receivable recovery in relation to the power division |
In certain cases, the Group’s power customers are disputing various contractual provisions of PPA’s. Significant judgement is required in both assessing the tariff to be charged under the PPA in accordance with IFRS 15 and to assess the recoverability of withheld revenue currently accounted for as receivables.
In assessing this critical judgment management, considered favourable external legal opinions the Group has obtained in relation to the claims and favourable court judgements in the related matter. In addition, the fact that the contracts are with government owned companies implies the credit risk is low. Refer Note 17.
4. Business Combination and Others
Ferro Alloys Corporation Limited—Business Combination
During the previous year ended March 31, 2021, the Company acquired control over FACOR under Corporate insolvency resolution process in terms of the Insolvency and Bankruptcy Code, 2016 of India. Based on completion of the closing conditions, the Company concluded the acquisition on September 21, 2020. The Company
holds 100% in FACOR, while FACOR holds 90% equity in its subsidiary, Facor Power Limited (FPL).
FACOR is in the business of producing Ferro Alloys and owns a Ferro Chrome plant with capacity of 72,000 TPA, 2 operational Chrome mines and 100 MW of Captive Power Plant through FPL. The acquisition complements the Group’s existing steel business as the vertical integration of ferro manufacturing capabilities has the potential to generate significant efficiencies. FACOR has been included in “Others” for segment reporting purposes. The Company had finalised acquisition accounting during th
e
year ended March 31, 2021 and consequently recorded bargain gain (net of acquisition cost) as disclosed in Note 7.If FACOR had been acquired at the beginning of year ended March 31, 2021, the Group revenue would have been
₹
₹
F-3
4
5. Segment information
Description of segment and principal activities
The Group is a diversified natural resource group engaged in exploring, extracting and processing minerals and oil and gas. The Group produces zinc, lead, silver, copper, aluminium, iron ore, oil and gas and commercial power and has a presence across India, South Africa, Namibia, the UAE, Ireland, Australia, Japan, South Korea, Taiwan and Liberia. The Group is also in the business of port operations and manufacturing of glass substrate and steel. The Group
has 7
Segment Revenue, Profit, Assets and Liabilities include the respective amounts identifiable to each of the segments and amount allocated on a reasonable basis. Unallocated expenditure consists of common expenditure incurred for all the segments and expenses incurred at corporate level. The assets and liabilities that cannot be allocated between the segments are shown as unallocated assets and unallocated liabilities, respectively.
The accounting policies of the reportable segments are the same as the Group’s accounting policies described in Note 3. The reportable segments are the segments of the Group for which separate financial information is available. Earnings Before Interest, Taxes, Depreciation and Amortization, Impairment and other items (“Segment profit or EBITDA”) are evaluated regularly by the CODM in deciding how to allocate resources and in assessing performance and is a
non-IFRS
measure. The Group’s financing (including finance and other costs and investment and other income) and income taxes are reviewed on an overall basis and are not allocated to reportable segments.Transfer prices between operating segments are on arm length basis in a manner similar to transactions with third parties.
The following table presents revenue and profit information and certain assets and liabilities information regarding the Group’s reportable segments for the years ended March 31, 2020, March 31, 2021 and March 31, 2022 and as at March 31, 2021 and March 31, 2022:
F-3
5
a. Year ended March 31, 2020
Copper | Zinc India | Zinc International | Aluminium | Power | Iron Ore | Oil and Gas | Others | Elimination | Total | |||||||||||||||||||||||||||||||
( ₹ in million) | ( ₹ in million) | ( ₹ in million) | ( ₹ in million) | ( ₹ in million) | ( ₹ in million) | ( ₹ in million) | ( ₹ in million) | ( ₹ in million) | ( ₹ in million) | |||||||||||||||||||||||||||||||
Revenue | ||||||||||||||||||||||||||||||||||||||||
| Sales | 90,517 | 181,590 | 31,275 | 265,445 | 58,599 | 34,500 | 126,608 | 46,912 | — | 835,446 | ||||||||||||||||||||||||||||||
| Inter-segment sales | 9 | — | — | 328 | — | 130 | — | 913 | (1,380 | ) | — | |||||||||||||||||||||||||||||
Segment revenue | 90,526 | 181,590 | 31,275 | 265,773 | 58,599 | 34,630 | 126,608 | 47,825 | (1,380 | ) | 835,446 | |||||||||||||||||||||||||||||
| Cost of sales and expenses (1) | (93,420 | ) | (94,450 | ) | (27,477 | ) | (245,837 | ) | (42,109 | ) | (26,318 | ) | (53,925 | ) | (43,187 | ) | 1,380 | (625,343 | ) | |||||||||||||||||||||
Segment profit / (loss) | (2,894 | ) | 87,140 | 3,798 | 19,936 | 16,490 | 8,312 | 72,683 | 4,638 | — | 210,103 | |||||||||||||||||||||||||||||
| Depreciation and amortisation | (1,471 | ) | (22,610 | ) | (6,329 | ) | (17,183 | ) | (5,701 | ) | (2,413 | ) | (40,077 | ) | (4,706 | ) | — | (100,490 | ) | |||||||||||||||||||||
| Impairment (Refer Note14) | (6,692 | ) | — | — | — | — | (1,201 | ) | (135,031 | ) | (5,098 | ) | — | (148,022 | ) | |||||||||||||||||||||||||
| Other items* | (2,028 | ) | — | (42 | ) | 1,681 | — | — | — | — | — | (1,525 | ) | |||||||||||||||||||||||||||
Operating profit / (loss) | (13,085 | ) | 64,530 | (2,573 | ) | 4,434 | 10,789 | 4,698 | (102,425 | ) | (5,166 | ) | — | (39,934 | ) | |||||||||||||||||||||||||
| Investment and other income | 25,714 | |||||||||||||||||||||||||||||||||||||||
| Finance and other costs | (54,557 | ) | ||||||||||||||||||||||||||||||||||||||
Loss before tax | (68,777 | ) | ||||||||||||||||||||||||||||||||||||||
| Additions to property, plant and equipments, exploration and evaluation assets and intangible assets** | 2,192 | 46,088 | 7,552 | 14,187 | 671 | 1,081 | 45,490 | 2,373 | 119,668 | |||||||||||||||||||||||||||||||
(1) | Expenses includes Distribution and administrative expenses excluding non cash items disclosed separately. |
| * | Other items represent provision for receivables from KCM of ₹ ₹ ₹ |
| ** | The total of additions includes ₹ |
F-3
6
b. Year ended March 31, 2021
Copper | Zinc India | Zinc International | Aluminium | Power | Iron Ore | Oil and Gas | Others | Elimination | Total | |||||||||||||||||||||||||||||||
( ₹ in million) | ( ₹ in million) | ( ₹ in million) | ( ₹ in million) | ( ₹ in million) | ( ₹ in million) | ( ₹ in million) | ( ₹ in million) | ( ₹ in million) | ( ₹ in million) | |||||||||||||||||||||||||||||||
Revenue | ||||||||||||||||||||||||||||||||||||||||
| Sales | 108,879 | 219,316 | 27,290 | 285,756 | 53,752 | 44,875 | 75,308 | 53,454 | — | 868,630 | ||||||||||||||||||||||||||||||
| Inter-segment sales | 18 | — | — | 686 | — | 409 | — | 313 | (1,426 | ) | — | |||||||||||||||||||||||||||||
Segment revenue | 108,897 | 219,316 | 27,290 | 286,442 | 53,752 | 45,284 | 75,308 | 53,767 | (1,426 | ) | 868,630 | |||||||||||||||||||||||||||||
| Cost of sales and expenses (1) | (110,650 | ) | (103,116 | ) | (19,190 | ) | (208,919 | ) | (39,682 | ) | (27,108 | ) | (43,142 | ) | (44,634 | ) | 1,426 | (595,015 | ) | |||||||||||||||||||||
Segment profit / (loss) | (1,753 | ) | 116,200 | 8,100 | 77,523 | 14,070 | 18,176 | 32,166 | 9,133 | — | 273,615 | |||||||||||||||||||||||||||||
| Depreciation and amortisation | (1,533 | ) | (24,617 | ) | (3,211 | ) | (16,926 | ) | (5,749 | ) | (2,208 | ) | (21,274 | ) | (5,660 | ) | — | (81,178 | ) | |||||||||||||||||||||
| Asset u nderconstruction written off (Refer Note 14) | — | — | — | (1,811 | ) | — | — | — | (629 | ) | — | (2,440 | ) | |||||||||||||||||||||||||||
| Other items* | (2,086 | ) | — | (40 | ) | 950 | — | — | — | (2,135 | ) | — | (3,145 | ) | ||||||||||||||||||||||||||
Operating profit / (loss) | (5,372 | ) | 91,583 | 4,849 | 59,736 | 8,321 | 15,968 | 10,892 | 709 | — | 186,852 | |||||||||||||||||||||||||||||
| Investment and other income | 32,177 | |||||||||||||||||||||||||||||||||||||||
| Finance and other costs | (52,955 | ) | ||||||||||||||||||||||||||||||||||||||
Profit before tax | 166,074 | |||||||||||||||||||||||||||||||||||||||
Assets and liabilities | ||||||||||||||||||||||||||||||||||||||||
Assets | ||||||||||||||||||||||||||||||||||||||||
| Segment assets# | 59,570 | 200,072 | 60,740 | 477,070 | 163,620 | 33,039 | 181,108 | 78,160 | — | 1,253,379 | ||||||||||||||||||||||||||||||
| Financial assets investments | 1,532 | |||||||||||||||||||||||||||||||||||||||
| Deferred tax asset | 73,958 | |||||||||||||||||||||||||||||||||||||||
| Short-term investments | 281,775 | |||||||||||||||||||||||||||||||||||||||
| Cash and cash equivalents (including restricted cash and cash equivalents) | 49,563 | |||||||||||||||||||||||||||||||||||||||
| Income tax assets | 27,549 | |||||||||||||||||||||||||||||||||||||||
| Loans to related party | 70,712 | |||||||||||||||||||||||||||||||||||||||
| Others | 12,779 | |||||||||||||||||||||||||||||||||||||||
Total assets | 1,771,247 | |||||||||||||||||||||||||||||||||||||||
Liabilities | ||||||||||||||||||||||||||||||||||||||||
| Segment liabilities# | 43,277 | 47,217 | 10,672 | 156,994 | 18,405 | 12,269 | 111,776 | 21,126 | 421,736 | |||||||||||||||||||||||||||||||
| Borrowings | 569,222 | |||||||||||||||||||||||||||||||||||||||
| Current tax liabilities | 2,792 | |||||||||||||||||||||||||||||||||||||||
| Deferred tax liabilities | 21,894 | |||||||||||||||||||||||||||||||||||||||
| Others | 21,554 | |||||||||||||||||||||||||||||||||||||||
Total liabilities | 1,037,198 | |||||||||||||||||||||||||||||||||||||||
| Additions to property, plant and equipments, exploration and evaluation assets and intangible assets** | 622 | 25,163 | 3,754 | 17,135 | 267 | 985 | 15,192 | 6,019 | 69,155 | |||||||||||||||||||||||||||||||
(1) | Expenses includes Distribution and administrative expenses excluding non cash items disclosed separately. |
| * | Other items represent provision for receivables from KCM of ₹ ₹ ₹ ₹ |
| ** | The total of additions includes ₹ ₹ |
| # | Restated. Refer Note 2(c) |
F-3
7
c. Year ended March 31, 2022
Copper | Zinc India | Zinc International | Aluminium | Power | Iron Ore | Oil and Gas | Others | Elimination | Total | Total | ||||||||||||||||||||||||||||||||||
( ₹ in million) | ( ₹ in million) | ( ₹ in million) | ( ₹ in million) | ( ₹ in million) | ( ₹ in million) | ( ₹ in million) | ( ₹ in million) | ( ₹ in million) | ( ₹ in million) | (US dollars in million) | ||||||||||||||||||||||||||||||||||
Revenue | ||||||||||||||||||||||||||||||||||||||||||||
| Sales | 151,511 | 286,241 | 44,841 | 508,091 | 55,005 | 62,330 | 124,301 | 79,597 | — | 1,311,917 | 17,292 | |||||||||||||||||||||||||||||||||
| Inter-segment sales | — | — | 3 | 718 | 3,250 | 1,170 | — | 118 | (5,259 | ) | — | — | ||||||||||||||||||||||||||||||||
Segment revenue | 151,511 | 286,241 | 44,844 | 508,809 | 58,255 | 63,500 | 124,301 | 79,715 | (5,259 | ) | 1,311,917 | 17,292 | ||||||||||||||||||||||||||||||||
| Cost of sales and expenses (1) | (152,642 | ) | (124,621 | ) | (29,501 | ) | (335,435 | ) | (47,439 | ) | (40,830 | ) | (64,415 | ) | (69,332 | ) | 5,259 | (858,956 | ) | (11,321 | ) | |||||||||||||||||||||||
Segment profit/(loss) | (1,131 | ) | 161,620 | 15,343 | 173,374 | 10,816 | 22,670 | 59,886 | 10,383 | — | 452,961 | 5,971 | ||||||||||||||||||||||||||||||||
| Depreciation and amortisation | (1,467 | ) | (28,082 | ) | (5,126 | ) | (19,960 | ) | (5,700 | ) | (2,385 | ) | (22,949 | ) | (5,479 | ) | — | (91,148 | ) | (1,201 | ) | |||||||||||||||||||||||
Impairment reversal/(charge)** | — | — | — | — | — | — | 62,745 | — | — | 62,745 | 827 | |||||||||||||||||||||||||||||||||
| Exploration cost written off** | — | — | — | — | — | — | (26,181 | ) | — | — | (26,181 | ) | (345 | ) | ||||||||||||||||||||||||||||||
| Asset under construction written off** | — | — | — | — | — | — | — | (701 | ) | — | (701 | ) | (9 | ) | ||||||||||||||||||||||||||||||
| Other Items* | (2,126 | ) | (1,342 | ) | (46 | ) | (3,757 | ) | (370 | ) | — | — | (69 | ) | — | (8,049 | ) | (108 | ) | |||||||||||||||||||||||||
Operating profit/(loss) | (4,724 | ) | 132,196 | 10,171 | 149,657 | 4,746 | 20,285 | 73,501 | 4,134 | — | 389,627 | 5,135 | ||||||||||||||||||||||||||||||||
| Investment and other income | 19,947 | 263 | ||||||||||||||||||||||||||||||||||||||||||
| Finance and other costs | (49,427 | ) | (651 | ) | ||||||||||||||||||||||||||||||||||||||||
Profit before tax | 360,147 | 4,747 | ||||||||||||||||||||||||||||||||||||||||||
Assets and liabilities | ||||||||||||||||||||||||||||||||||||||||||||
Assets | ||||||||||||||||||||||||||||||||||||||||||||
| Segment assets | 56,569 | 2,15,297 | 69,938 | 535,182 | 160,665 | 46,027 | 262,757 | 91,395 | — | 1,437,830 | 18,951 | |||||||||||||||||||||||||||||||||
| Financial assets investments | 1,472 | 19 | ||||||||||||||||||||||||||||||||||||||||||
| Deferred tax asset | 64,537 | 851 | ||||||||||||||||||||||||||||||||||||||||||
| Short-term investments | 235,932 | 3,110 | ||||||||||||||||||||||||||||||||||||||||||
| Cash and cash equivalents (including restricted cash and cash equivalents) | 91,383 | 1,205 | ||||||||||||||||||||||||||||||||||||||||||
| Income tax assets | 27,877 | 367 | ||||||||||||||||||||||||||||||||||||||||||
| Others | 70,476 | 929 | ||||||||||||||||||||||||||||||||||||||||||
Total assets | 1,929,507 | 25,432 | ||||||||||||||||||||||||||||||||||||||||||
Liabilities | ||||||||||||||||||||||||||||||||||||||||||||
| Segment liabilities | 49,703 | 50,191 | 11,594 | 173,784 | 17,152 | 25,171 | 161,376 | 26,679 | 515,650 | 6,796 | ||||||||||||||||||||||||||||||||||
| Borrowings | 530,967 | 6,999 | ||||||||||||||||||||||||||||||||||||||||||
| Current tax liabilities | 9,192 | 121 | ||||||||||||||||||||||||||||||||||||||||||
| Deferred tax liabilities | 52,988 | 698 | ||||||||||||||||||||||||||||||||||||||||||
| Others | 13,588 | 181 | ||||||||||||||||||||||||||||||||||||||||||
Total liabilities | 1,122,385 | 14,795 | ||||||||||||||||||||||||||||||||||||||||||
| Additions to property, plant and equipments, exploration and evaluation assets and intangible assets*** | 395 | 38,284 | 11,037 | 35,835 | 1,067 | 2,965 | 17,875 | 12,812 | — | 120,469 | 1,588 | |||||||||||||||||||||||||||||||||
(1) | Expenses includes Distribution and administrative expenses excluding non cash items disclosed separately. |
| * | Other items represent provision for receivables from KCM of ₹ ₹ N ote 37(f)), charge for settlement of entry tax dispute under Amnesty Scheme₹ ₹ ₹ ₹ |
| ** | Refer Note 14B(1) and 14B(2). |
| *** | The total of additions includes ₹ |
F-3
8
Geographical Segment Analysis
The Group’s operations are located in India, Namibia, South Africa, UAE, Liberia, Ireland, Australia, South Korea and Taiwan. The following table provides an analysis of the Group’s sales by geographical market irrespective of the origin of the goods:
Year ended March 31, | ||||||||||||||||
2020 | 2021 | 2022 | 2022 | |||||||||||||
( ₹ in million) | ( ₹ in million) | ( ₹ in million) | (US dollars in million) | |||||||||||||
India | 542,256 | 536,212 | 736,192 | 9,703 | ||||||||||||
Europe | 40,224 | 35,960 | 210,282 | 2,772 | ||||||||||||
China | 26,942 | 52,213 | 96,671 | 1,274 | ||||||||||||
The United States of America | 17,068 | 11,634 | 34,871 | 460 | ||||||||||||
Mexico | 6,496 | 9,318 | 23,111 | 305 | ||||||||||||
Malaysia | 76,479 | 71,092 | 5,480 | 72 | ||||||||||||
Oth e rs | 125,981 | 152,201 | 205,310 | 2,706 | ||||||||||||
835,446 | 868,630 | 1,311,917 | 17,292 | |||||||||||||
The following is an analysis of the carrying amount of
non-current
assets, excluding deferred tax assets, derivative financial assets, financial asset investments and othernon-current
financial assets analysed by the geographical area inwhich
the assets are located: —As at March 31 | ||||||||||||
2021 | 2022 | 2022 | ||||||||||
Carrying amount | Carrying Amount | Carrying Amount | ||||||||||
( ₹ in million) | ( ₹ in million) | (US dollars in million) | ||||||||||
| India | 954,629 | 1,008,838 | 13,297 | |||||||||
| South Africa | 44,486 | 51,048 | 673 | |||||||||
| Namibia | 8,870 | 9,904 | 131 | |||||||||
| Taiwan | 10,029 | 8,928 | 118 | |||||||||
| Others | 7,883 | 6,456 | 85 | |||||||||
1,025,897 | 1,085,174 | 14,304 | ||||||||||
Information about major customer
No single customer has accounted for more than 10% of the Group’s revenue for the year ended March 31, 2022. (March 31, 2020: No Customer and March 31, 2021: Revenue from one customer amounted to 104,164 million arising from sales made in the Aluminium, zinc and copper
₹
segment.)
F-
39
Disaggregation of Revenue
Below table summarises the disaggregated revenue from contracts with customers: —
Year ended March 31, | ||||||||||||||||
2020 | 2021 | 2022 | 2022 | |||||||||||||
( ₹ in million) | ( ₹ in million) | ( ₹ in million) | (US dollars in million) | |||||||||||||
Oil | 109,062 | 64,798 | 102,751 | 1,354 | ||||||||||||
Gas | 7,945 | 6,837 | 17,119 | 226 | ||||||||||||
Zinc Metal | 157,559 | 166,343 | 247,092 | 3,257 | ||||||||||||
Lead Metal | 34,702 | 38,803 | 42,400 | 559 | ||||||||||||
Silver Metal & Bars | 24,756 | 43,949 | 42,151 | 556 | ||||||||||||
Iron Ore | 14,820 | 21,734 | 23,538 | 310 | ||||||||||||
Metallurgical Coke | 553 | 2,565 | 4,065 | 54 | ||||||||||||
Pig Iron | 22,394 | 24,249 | 41,231 | 543 | ||||||||||||
Copper Products | 73,489 | 102,049 | 142,812 | 1,882 | ||||||||||||
Aluminium Products | 254,293 | 283,944 | 512,535 | 6,755 | ||||||||||||
Power | 44,064 | 36,509 | 38,861 | 512 | ||||||||||||
Steel Products | 37,850 | 39,663 | 56,977 | 751 | ||||||||||||
Ferro Alloys | — | 2,740 | 8,300 | 109 | ||||||||||||
Others | 37,465 | 21,261 | 31,173 | 412 | ||||||||||||
Revenue from contracts with customers* | 818,952 | 855,444 | 1,311,005 | 17,280 | ||||||||||||
Revenue from contingent rents | 16,729 | 15,147 | 13,812 | 182 | ||||||||||||
Loss on provisionally priced contracts under IFRS 9 (Refer Note 6(a)) | (12,995 | ) | (1,961 | ) | (12,900 | ) | (170 | ) | ||||||||
| JV partner’s share of the exploration costs approved under the OM (Refer Note 6(b)) | 12,760 | — | — | — | ||||||||||||
Total Revenue | 835,446 | 868,630 | 1,311,917 | 17,292 | ||||||||||||
| * | Includes revenues from sale of services aggregating to₹ ₹ ₹ , respectively which is recorded over a period of time and the balance revenue is recognised at a point in time. |
F-4
0
6. Revenue
For the year ended March 31, | 2020 | 2021 | 2022 | 2022 | ||||||||||||
( ₹ in million) | ( ₹ in million) | ( ₹ in million) | (US dollars in million) | |||||||||||||
Sale of products | 816,558 | 851,244 | 1,295,098 | 17,070 | ||||||||||||
Sale of services | 2,159 | 2,239 | 3,007 | 40 | ||||||||||||
Revenue from contingent rents | 16,729 | 15,147 | 13,812 | 182 | ||||||||||||
835,446 | 868,630 | 1,311,917 | 17,292 | |||||||||||||
| a) | Revenue from sale of products and from sale of services comprises of revenue from contracts with customers of ₹ ₹ ₹ million) for the years ended March 31, 2020, March 31, 2021 and March 31, 2022, respectively, and a net loss on mark-to-market of ₹ ₹ ₹ million) on account of gains/losses relating to sales of product that were provisionally priced as at the beginning of the respective year with the final price settled during the subsequent year s ended March 31, 2020, March 31, 2021 and March 31, 2022, respectively, gains / losses relating to sales of product fully priced during the respective year, and marked to market gains/ losses relating to sales of product that were provisionally priced as at the end of the respective year. |
| b) | Government of India (GoI) vide Office Memorandum (“OM”) No. O-19025/10/2005-ONG-DV ₹ the OM is not applicable to its Joint operation partner, view which is also supported by an independent legal opinion. However, the Joint operation partner carries a different understanding and the matter is pending resolution. |
| c) | Majority of the Group’s sales are against advances or are against letters of credit/cash against documents/guarantees of banks of national standing. Where sales are made on credit, the amount of consideration does not contain any significant financing component as payment terms are within three months. |
As per the terms of the contract with its customers, either all performance obligations are to be completed within one year from the date of such contracts or the Group has a right to receive consideration from its customers for all completed performance obligations. Accordingly, the Group has availed the practical expedient available under paragraph 121 of IFRS 15 and dispensed with the additional disclosures with respect to performance obligations that remained unsatisfied (or partially unsatisfied) at the reporting date. Further, since the terms of the contracts directly identify the transaction price for each of the completed performance obligations, in all material respects, there are no elements of transaction price which have not been included in the revenue recognised in the financial statements.
Further, there is no material difference between the contract price and the revenue from contract with customers.
F-4
1
7. Investment and other income
For the year ended March 31, | 2020 | 2021 | 2022 | 2022 | ||||||||||||
( ₹ in million) | ( ₹ in million) | ( ₹ in million) | (US dollars in million) | |||||||||||||
| Fair value gain on financial assets held for trading / fair value through profit or loss (FVTPL) (1) | 5,574 | 9,340 | 2,087 | 28 | ||||||||||||
Interest and dividend Income: | ||||||||||||||||
Interest income on financial assets held for trading/FVTPL | 10,169 | 4,779 | 3,925 | 52 | ||||||||||||
Interest income on bank deposits at amortized cost | 2,183 | 5,649 | 5,371 | 70 | ||||||||||||
Interest income on loans and receivables at amortized cost (Refer Note 35(b)) | 4,518 | 9,806 | 9,538 | 126 | ||||||||||||
Other interest income | 287 | 810 | 21 | 0 | ||||||||||||
Dividend income on available for sale investments held at FVOCI | 17 | 17 | 16 | 0 | ||||||||||||
Dividend income – financial assets held for trading/FVTPL | 477 | 13 | 2 | 0 | ||||||||||||
Bargain gain net of acquisition cost | — | 1,232 | — | — | ||||||||||||
Foreign exchange gain/ (loss) net | 2,489 | 531 | (1,013 | ) | (13 | ) | ||||||||||
25,714 | 32,177 | 19,947 | 263 | |||||||||||||
Notes:
| (1) | Income for the year ended March 31, 2020 includes mark to market loss of ₹ million relating to structured investments purchased from Volcan Investments Limited (Refer Note 35(f)). |
8. Finance and other costs
For the year ended March 31, |
2020 | 2021 | 2022 | 2022 | |||||||||||||
( ₹ in million) | ( ₹ in million) | ( ₹ in million) | (US dollars in million) | |||||||||||||
Interest expense on financial liabilities at amortised cost (1) | 56,175 | 51,844 | 47,124 | 621 | ||||||||||||
Unwinding of discount on provisions | 962 | 721 | 777 | 10 | ||||||||||||
Net foreign exchange loss/(gain) on borrowings and creditors for capital expenditure | 4,789 | (180 | ) | 1,455 | 19 | |||||||||||
Transaction costs paid to the ultimate parent company (Refer Note 35(f)) | — | 1,032 | — | — | ||||||||||||
Other finance costs | 2,588 | 2,502 | 2,985 | 39 | ||||||||||||
Net interest on defined benefit arrangements | 212 | 194 | 212 | 3 | ||||||||||||
Capitalisation of finance costs (2) | (10,169 | ) | (3,158 | ) | (3,126 | ) | (41 | ) | ||||||||
54,557 | 52,955 | 49,427 | 651 | |||||||||||||
Notes:
| (1) | Includes interest expense on lease liabilities for the year ended March 31, 2020, March 31, 2021 and March 31, 2022 of ₹ ₹ ₹ |
| ( 2 ) | Interest rate of 7.49%, 6.91% and 7.87% was used to determine the amount of general borrowing costs eligible for capitalization in respect of qualifying asset for the year ended March 31, 2020, March 31, 2021 and March 31, 2022 respectively. |
F-4
2
9. Income tax expense
Overview of the Indian direct tax regime
Indian companies are subject to Indian income tax on a standalone basis. Each entity is assessed for tax on taxable profits determined for each financial year beginning on April 1 and ending on March 31. For each financial year, the respective entities’ profit or loss is subject to the higher of the regular income tax payable or the minimum alternative tax (“MAT”).
Statutory income taxes are assessed based on book profits prepared under generally accepted accounting principles in India (“Indian GAAP”) adjusted in accordance with the provisions of the (Indian) Income tax Act, 1961. Such adjustments generally relate to depreciation of fixed assets, disallowances of certain provisions and accruals, deduction for tax holidays and similar exemptions, the use of tax losses carried forward and retirement benefit costs. Statutory income tax is charged at 30
% plus a surcharge and education cess. The combined Indian statutory tax rate for the financial years
34.94% and 25.17%2019-20,
2020-21 and 2021-22 wasfor the subsidiaries who have opted new tax regime (refer Note 3(c)
(I)(
viii
).
MAT is assessed on book profits adjusted for certain limited items as compared to the adjustments allowed for assessing regular income tax under normal provisions. MAT for financial years
at 152019-20,
2020-21
and2021-22
% plus surcharge and education cess. The combined Indian statutory tax rate of MAT for the financial years
is 17.47%. MAT paid in excess of regular income tax during a year can be set off against regular income taxes within a period of fifteen years succeeding the assessment year in which MAT credit arises subject to the limits prescribed.2019-20,
2020-21
and2021-22
Business losses in India can be carried forward for a maximum period of eight assessment years immediately succeeding the assessment year to which the loss pertains. Unabsorbed depreciation can be carried forward for an indefinite period.
Losses arising out of transfer of capital assets in India can be carried forward for a maximum period of eight assessment years immediately succeeding the assessment year to which the loss pertains. The carried forward long term capital losses can be
set-off
only against long term capital gains. Short term capital losses can be set off only against capital gains (which can be either long term or short-term capital gain).Income tax returns submitted by companies are regularly subjected to a comprehensive review and
challenge
by the tax authorities. There are appellate procedures available to both the tax authorities and taxpayers and it is not uncommon for significant or complex matters in dispute to remain outstanding for several years before they are finally resolved by the High Court or the Supreme Court.(a) Tax charge/ (credit) recognised in the consolidated statement of profit or loss
For the year ended March 31, | 2020 | 2021 | 2022 | 2022 | ||||||||||||
( ₹ in million) | ( ₹ in million) | ( ₹ in million) | (US dollars in million) | |||||||||||||
Current tax: | ||||||||||||||||
Current tax on profit for the year | 17,911 | 20,671 | 63,119 | 832 | ||||||||||||
Credit in respect of current tax for earlier years | (33 | ) | (14 | ) | (25 | ) | (0 | ) | ||||||||
Total current tax (a) | 17,878 | 20,657 | 63,094 | 832 | ||||||||||||
Deferred tax: | ||||||||||||||||
Reversal and origination of temporary differences | (44,562 | ) | (1,546 | ) | 40,807 | 538 | ||||||||||
Charge/(Credit) in respect of Deferred tax for earlier years | 7 | (27 | ) | (833 | ) | (11 | ) | |||||||||
Total Deferred Tax (b) | (44,555 | ) | (1,573 | ) | 39,974 | 527 | ||||||||||
Total income tax (credit)/expense for the year (a+b) | (26,677 | ) | 19,084 | 103,068 | 1,359 | |||||||||||
(Loss)/Profit before tax | (68,777 | ) | 166,074 | 360,147 | 4,747 | |||||||||||
Effective income tax rate (%) | 38.8 | % | 11.5% | 28.6% | 28.6% | |||||||||||
F-4
3
(b)
For the year ended March 31, | 2020 | 2021 | 2022 | 2022 | ||||||||||||
( ₹ in million) | ( ₹ in million) | ( ₹ in million) | (US dollars in million) | |||||||||||||
(Loss)/Profit before tax | (68,777 | ) | 166,074 | 360,147 | 4,747 | |||||||||||
Indian statutory income tax rate | 34.94 | % | 34.94 | % | 34.94 | % | 34.94 | % | ||||||||
Tax at Indian statutory income tax rate | (24,033 | ) | 58,034 | 125,850 | 1,659 | |||||||||||
Non-taxable income | (1,406 | ) | (1,227 | ) | (1,366 | ) | (18 | ) | ||||||||
Tax holidays and similar exemptions (Refer Notes below) | (4,934 | ) | (7,710 | ) | (19,559 | ) | (258 | ) | ||||||||
Effect of tax rates differences of subsidiaries operating at other rates | (581 | ) | (3,625 | ) | 2,750 | 36 | ||||||||||
Tax on distributable reserve of/ dividend from subsidiary # | 19,532 | 8,690 | — | — | ||||||||||||
Unrecognized tax assets (Net)* | (713 | ) | (31,932 | ) | 98 | 1 | ||||||||||
Change in deferred tax balances due to change in tax law** | (17,760 | ) | (3,125 | ) | (2,715 | ) | (36 | ) | ||||||||
Capital gains/Other income subject to lower tax rate | (2,733 | ) | (1,756 | ) | (3,435 | ) | (45 | ) | ||||||||
Credit in respect of earlier years | (26 | ) | (41 | ) | (858 | ) | (11 | ) | ||||||||
Other permanent differences | 5,977 | 1,776 | 2,303 | 31 | ||||||||||||
Total income tax expense/(credit) | (26,677 | ) | 19,084 | 103,068 | 1,359 | |||||||||||
# | Consequent to the declaration of dividend (including from accumulated profits) by the subsidiaries, the unabsorbed depreciation as per tax laws have been utilized by Vedanta Limited leading to a deferred tax charge of ₹ 19,532 million and₹ 8,690 million for the year ended March 31, 2020 and March 31, 2021, respectively. |
| * | In June 2018, the Company acquired majority stake in ESL Steel Limited (“ESL”), which has since been focusing on operational turnaround. Based on management’s estimate of future outlook, financial projections and requirements of IAS 12 (Income taxes), ESL has recognized deferred tax assets of ₹ 31,823 million during the year ended March 31, 2021. During the year ended March 31, 2022, ESL derecognized deferred tax assets on losses expired in the current year amounting to ₹ 1,220 million ($ 16 million). B ased on revised financial forecasts, management is confident of realising the remaining deferred tax assets fully. |
| ** | Deferred tax charge for the year ended March 31, 2020 includes deferred tax credit of ₹ million on remeasurement of deferred tax balance as at March 31, 2019. Also, refer Note 3(c)(I)(viii). |
Certain businesses of the Group within India are eligible for specified tax incentives which are included in the table above as tax holidays and similar exemptions. Most of such tax exemptions are relevant for the companies operating in India. These are briefly described as under:
The location based exemption
In order to boost industrial and economic development in undeveloped regions, provided certain conditions are met, profits of newly established undertakings located in certain areas in India may benefit from tax holiday under section 80IC of the Income Tax Act, 1961. Such tax holiday works to exempt 100% of the profits for the first five years from the commencement of the tax holiday, and 30
% of profits for the subsequent five years. This deduction is available only for units established up to March 31, 2012. However, such undertaking would continue to be subject to MAT provisions.
F-4
4
In the fiscal year ended March 31, 2021, undertaking at Pantnagar, which is part of HZL, was the only unit eligible for deduction
at 30% of taxable profit.
The location based exemption: SEZ Operations
In order to boost industrial development and exports, provided certain conditions are met, profits of undertaking located in Special Economic Zone (‘SEZ’) may benefit from tax holiday. Such tax holiday works to exempt 100% of the profits for the first five years from the commencement of the tax holiday, 50% of profits for five years thereafter and 50
% of the profits for further five years provided the amount allowable in respect of deduction is credited to Special Economic Zone
Re-Investment
Reserve account. However, such undertaking would continue to be subject to MAT provisions.The Group has setup SEZ Operations in its aluminum division of Vedanta Limited where such benefit has been drawn.
Sectoral Benefit—Power Plants and Port Operations
To encourage the establishment of infrastructure, certain power plants
and ports have been offered income tax exemptions of upto 100% of profits and gains for any ten consecutive years within the 15 year period following commencement of operations subject to certain conditions under section 80IA of the Income Tax Act, 1961. The Group currently has total operational capacity of 8.25 Giga Watts (GW) of thermal based power generation facilities and wind power capacity of 274 Mega Watts (MW) and port facilities. However, such undertakings would continue to be subject to MAT provisions.
The Group has power plants which benefit from such deductions, at various locations of HZL, Vedanta Limited (where such benefits has been drawn), TSPL and BALCO (where no benefit has been drawn).
Further tax incentives exist for certain other infrastructure facilities to exempt 100% of profits and gains for any ten consecutive years within the
20-year
period following commencement of these facilities’ operation, provided certain conditions are met. HZL currently has certain eligible facilities. However, such facilities would continue to be subject to the MAT provisions.The Group operates a zinc refinery in Export Processing Zone, Namibia which has been granted tax exempt status by the Namibian government.
In addition, the subsidiaries incorporated in Mauritius are eligible for tax credit to the extent of 80% of the applicable tax rate on foreign source income.
The total effect of such tax holidays and exemptions was 4,934 million, 7,710 million and 19,559 million ($258
₹
₹
₹
million) for the years ended March 31, 2020, March 31, 2021 and March 31, 2022, respectively.
(c) Deferred tax assets/liabilities
The Group has recorded significant amounts of deferred tax. The majority of the deferred tax liabilities represents accelerated tax relief for the depreciation of property plant and equipment, the depreciation of mining reserves and the fair value uplifts created on acquisitions, net of losses carried forward by the Group and unused tax credits in the form of MAT credits carried forward in the Group. Significant components of Deferred tax (assets) and liabilities recognized in the consolidated statement of financial position are as follows:
F-4
5
For the year ended March 31, 2020: | ||||||||||||||||||||
Opening balance as at April 1, 2019 | Charged/ (credited) to Statement of profit or loss | Charged/ (credited) to other comprehensive income | Exchange difference arising on translation of foreign operation | Closing balance as at March 31, 2020 | ||||||||||||||||
Significant components of deferred tax (assets)/liabilities | ( ₹ in million) | ( ₹ in million) | ( ₹ in million) | ( ₹ in million) | ( ₹ in million) | |||||||||||||||
Property, plant and equipment, exploration and evaluation and other intangible assets | 139,548 | (61,429 | ) | — | (93 | ) | 78,026 | |||||||||||||
| Voluntary retirement scheme | (395 | ) | 111 | — | — | (284 | ) | |||||||||||||
| Employee benefits | (1,098 | ) | 6 | (714 | ) | 49 | (1,757 | ) | ||||||||||||
| Fair value of derivative asset/ liability | (357 | ) | (69 | ) | 324 | — | (102 | ) | ||||||||||||
| Fair valuation of other asset/liability | 8,471 | 911 | (1 | ) | 593 | 9,974 | ||||||||||||||
| MAT credit entitlement | (103,243 | ) | 11,605 | 251 | 129 | (91,258 | ) | |||||||||||||
| Unabsorbed depreciation and business losses | (45,655 | ) | (9,223 | ) | — | — | (54,878 | ) | ||||||||||||
| Other temporary differences | (5,947 | ) | 13,533 | (590 | ) | 289 | 7,285 | |||||||||||||
Total | (8,676 | ) | (44,555 | ) | (730 | ) | 967 | (52,994 | ) | |||||||||||
For the year ended March 31, 2021 : |
Opening balance as at April 1, 2020 | Charged/ (credited) to Statement of profit or loss | Charged/ (credited) to other comprehensive income | Charged to Equity | Deferred tax on acquisition through business combination | Exchange difference arising on translation of foreign operation | Closing balance as at March 31, 2021 | ||||||||||||||||||||||
Significant components of deferred tax (assets)/liabilities | ( ₹ in million) | ( ₹ in million) | ( ₹ in million) | ( ₹ in million) | ( ₹ in million) | ( ₹ in million) | ( ₹ in million) | |||||||||||||||||||||
| Property, plant and equipment, e xploration ande valuation and other intangible assets | 78,026 | (145 | ) | — | — | 498 | 1,647 | 80,026 | ||||||||||||||||||||
| Voluntary retirement scheme | (284 | ) | (246 | ) | — | — | — | — | (530 | ) | ||||||||||||||||||
| Employee benefits | (1,757 | ) | (222 | ) | 104 | 319 | — | (94 | ) | (1,650 | ) | |||||||||||||||||
| Fair value of derivative asset/ liability | (102 | ) | 93 | (256 | ) | — | — | — | (265 | ) | ||||||||||||||||||
| Fair valuation of other asset/liability | 9,974 | (2,422 | ) | 9 | — | — | (277 | ) | 7,284 | |||||||||||||||||||
| MAT credit entitlement* | (91,258 | ) | 8,621 | 249 | — | — | 30 | (82,358 | ) | |||||||||||||||||||
| Unabsorbed depreciation and business losses | (54,878 | ) | 7,837 | — | — | — | — | (47,041 | ) | |||||||||||||||||||
| Other temporary differences | 7,285 | (15,089 | ) | 352 | — | 104 | (182 | ) | (7,530 | ) | ||||||||||||||||||
Total | (52,994 | ) | (1,573 | ) | 458 | 319 | 602 | 1,124 | (52,064 | ) | ||||||||||||||||||
For the year ended March 31, 202 2 : | ||||||||||||||||||||||||||||
Opening balance as at April 1, 2021 | Charged/ (credited) to Statement of profit or loss | Charged/ (credited) to other comprehensive income | Charged to Equity | Exchange difference arising on translation of foreign operation | Closing balance as at March 31, 2022 | Closing balance as at March 31, 2022 | ||||||||||||||||||||||
Significant components of deferred tax (assets)/liabilities | ( ₹ in million) | ( ₹ in million) | ( ₹ in million) | ( ₹ in million) | ( ₹ in million) | ( ₹ in million) | (US dollars in million) | |||||||||||||||||||||
| Property, plant and equipment, Exploration and e valuation and other intangible assets | 80,026 | 27,793 | — | — | 924 | 108,743 | 1,433 | |||||||||||||||||||||
| Voluntary retirement scheme | (530 | ) | 151 | — | — | — | (379 | ) | (5 | ) | ||||||||||||||||||
| Employee benefits | (1,650 | ) | (2,008 | ) | (13 | ) | 102 | (114 | ) | (3,683 | ) | (49 | ) | |||||||||||||||
| Fair value of derivative asset/ liability | (265 | ) | (207 | ) | (387 | ) | — | — | (859 | ) | (11 | ) | ||||||||||||||||
| Fair valuation of other asset/liability | 7,284 | (314 | ) | — | — | (418 | ) | 6,552 | 86 | |||||||||||||||||||
| MAT credit entitlement* | (82,358 | ) | 15,047 | (75 | ) | (157 | ) | (42 | ) | (67,585 | ) | (891 | ) | |||||||||||||||
| Unabsorbed depreciation and business losses | (47,041 | ) | 2,077 | — | — | — | (44,964 | ) | (593 | ) | ||||||||||||||||||
| Other temporary differences | (7,530 | ) | (2,565 | ) | 741 | — | (20 | ) | (9,374 | ) | (123 | ) | ||||||||||||||||
Total | (52,064 | ) | 39,974 | 266 | (55 | ) | 330 | (11,549 | ) | (153 | ) | |||||||||||||||||
F-4
6
Deferred tax assets and liabilities have been offset where they arise in the same taxing jurisdiction with a legal right to offset income tax assets against income tax liabilities but not otherwise. Accordingly, the net deferred tax (assets)/liability has been disclosed in the consolidated statement of financial position as follows:
As at March 31, | 2021 | 2022 | 2022 | ||||||||||
Particulars | ( ₹ in million) | ( ₹ in million) | (US dollars in million) | ||||||||||
Deferred tax assets | (73,958 | ) | (64,537 | ) | (851 | ) | |||||||
Deferred tax liabilities | 21,894 | 52,988 | 698 | ||||||||||
Net deferred tax (asset)/ liability | (52,064 | ) | (11,549 | ) | (153 | ) | |||||||
| * | Recognition of deferred tax assets on MAT credits entitlement is based on the respective legal entity’s present estimates and business plans as per which the same is expected to be utilized within the stipulated fifteen-year period from the date of origination. MAT credit entitlements of ₹ 82,358 million and ₹ 67,585 million ($ 891 million) as at March 31, 2021 and March 31, 2022, respectively, of which ₹ 3,400 million as at March 31, 2021 and ₹ 2,080 million ($ 28 million) as at March 31, 2022 is expected to be utilised in the fourteenth year, fifteen years being the maximum permissible time period to utilise the MAT credits. |
Deferred tax assets in the Group have been recognized to the extent there are sufficient taxable temporary differences relating to the same taxation authority and the same taxable entity which are expected to reverse. For certain components of the Group, deferred tax assets on carry forward unused tax losses have been recognised to the extent of deferred tax liabilities on taxable temporary differences available. It is expected that any reversals of the deferred tax liability would be offset against the reversal of the deferred tax asset at respective entities.
Unused tax losses/ unused tax credit for which no deferred tax asset has been recognised amount to 101,541 million and 98,197 million ($ 1,294 million) as at March 31, 2021 and March 31, 2022
,
₹
₹
,
respectively.As at March 31, 2021
Unused tax losses/ unused tax credit | Within one year ( ₹ in million) | Greater than one year, less than five years ( ₹ in million) | Greater than five years ( ₹ in million) | No expiry date ( ₹ in million) | Total ( ₹ in million) | |||||||||||||||
Unutilized business losses | 1,966 | 22,220 | 30,753 | 18,870 | 73,809 | |||||||||||||||
Unabsorbed depreciation | 105 | 1,014 | 2,979 | 23,533 | 27,631 | |||||||||||||||
Unused capital losses | — | 4 | — | — | 4 | |||||||||||||||
Unutilised R&D t axc redit | — | — | — | 97 | 97 | |||||||||||||||
Total | 2,071 | 23,238 | 33,732 | 42,500 | 101,541 | |||||||||||||||
No deferred tax assets have been recognised on these unused tax losses/ unused tax credit as there is no evidence that sufficient taxable profit will be available in future against which these can be utilised by the respective entities.
As at March 31, 2022
Unused tax losses/ unused tax credit | Within one year ( ₹ in million) | Greater than one year, less than five years ( ₹ in million) | Greater than five years ( ₹ in million) | No expiry date ( ₹ in million) | Total ( ₹ in million) | Total (US dollars in million) | ||||||||||||||||||
Unutilized business losses | 311 | 32,170 | 31,163 | 20,052 | 83,696 | 1,103 | ||||||||||||||||||
Unabsorbed depreciation | — | 0 | 0 | 14,398 | 14,398 | 190 | ||||||||||||||||||
Unused capital losses | — | 4 | — | — | 4 | 0 | ||||||||||||||||||
Unutilised R&D t axc redit | — | — | — | 99 | 99 | 1 | ||||||||||||||||||
Total | 311 | 32,174 | 31,163 | 34,549 | 98,197 | 1,294 | ||||||||||||||||||
F-
4
7
No deferred tax assets have been recognised on these unused tax losses/ unused tax credit as there is no evidence that sufficient taxable profit will be available in future against which these can be utilised by the respective entities.
The Group has not recognised any deferred tax liabilities for taxes that would be payable on the Group’s share in unremitted earnings of certain of its subsidiaries because the Group controls when the liability will be incurred and it is probable that the liability will not be incurred in the foreseeable future. The amount of unremitted earnings is 322,395 million and 369,475 million ($ 4,870 million) as at March 31, 2021 and March 31, 2022
₹
₹
,
respectively.(d)
Non-current
tax assetsNon-current
tax assets of₹
₹
,
respectively,
mainly represents income tax receivable from Indian tax authorities by Vedanta Limited relating to the refund arising consequent to the Scheme of Amalgamation & Arrangement made effective in August 2013 pursuant to approval by the jurisdiction High Court and receivables relating to matters in tax disputes in Group companies including tax holiday claim.(e)
09-10
to Assessment Year12-13,
the Commissioner of Income Tax (Appeals) has allowed these claims for Assessment Year14-15
to Assessment Year15-16,
which were earlier disallowed and has granted refund of amounts deposited under protest. Against the Tribunal order, department had filed an appeal in Hon’ble Rajasthan High Court in financial year17-18
which is yet to be admitted. As per the view of external legal counsel, tax department’s appeal seeksre-examination
of facts rather than raising any substantial question of law and hence it is unlikely that appeal will be admitted by the High Court. Due to this, there is a high probability that the case will go in favor of the company. The amount involved in this dispute as of March 31, 2022 is₹
(
$ 1,498 million) (March 31, 2021:₹
F-
4
8
10.
CONSOLIDATED STATEMENTS OF PROFIT OR LOSS
For the year ended March 31, | Notes | 2020 | 2021 | 2022 | 2022 | |||||||||||||||
( ₹ in million) | ( ₹ in million) | ( ₹ in million) | (US dollars in million) | |||||||||||||||||
Revenue | 6 | 835,446 | 868,630 | 1,311,917 | 17,292 | |||||||||||||||
Other operating income** | 9,863 | 13,094 | 17,981 | 237 | ||||||||||||||||
Investment and other income | 7 | 25,714 | 32,177 | 19,947 | 263 | |||||||||||||||
Total Income | 871,023 | 913,901 | 1,349,845 | 17,792 | ||||||||||||||||
(Decrease)/increase in inventories of finished goods and work-in-progress | (13,690 | ) | (7,662 | ) | 20,340 | 268 | ||||||||||||||
Raw materials and other consumables used* | (549,936 | ) | (524,019 | ) | (801,046 | ) | (10,559 | ) | ||||||||||||
Employee costs | (26,920 | ) | (28,632 | ) | (28,119 | ) | (371 | ) | ||||||||||||
Other costs*** | (46,185 | ) | (50,941 | ) | (76,161 | ) | (1,004 | ) | ||||||||||||
Depreciation and amortisation | (100,490 | ) | (81,178 | ) | (91,148 | ) | (1,201 | ) | ||||||||||||
| Impairment reversal/(charge) | (148,022 | ) | — | 62,745 | 827 | |||||||||||||||
| Exploration Cost written off | — | — | (26,181 | ) | (345 | ) | ||||||||||||||
Asset under construction written off | — | (2,440 | ) | (701 | ) | (9 | ) | |||||||||||||
Finance and other costs | 8 | (54,557 | ) | (52,955 | ) | (49,427 | ) | (651 | ) | |||||||||||
(Loss)/profit before tax | (68,777 | ) | 166,074 | 360,147 | 4,747 | |||||||||||||||
| Income tax credit/(expense) | 9 | 26,677 | (19,084 | ) | (103,068 | ) | (1,359 | ) | ||||||||||||
(Loss)/profit for the year | (42,100 | ) | 146,990 | 257,079 | 3,388 | |||||||||||||||
| * | includes power and fuel charges, repairs, royalty, cess, mining and other operating expenses. |
| ** | includes export incentive and duty drawback amounting to ₹ ₹ ₹ the years ended March 31, 2020, March 31, 2021 and March 31, 2022, respectively. |
| *** | includes rent amounting to ₹ ₹ ₹ |
11. Exchange gain/ (loss) recognised in the consolidated statements of profit or loss:
For the year ended March 31, | 2020 | 2021 | 2022 | 2022 | ||||||||||||
( ₹ in million) | ( ₹ in million) | ( ₹ in million) | (US dollars in million) | |||||||||||||
Cost of sales | (4,268 | ) | (1,937 | ) | 799 | 11 | ||||||||||
Administration cost (Forex on MAT credit entitlements) | (1,136 | ) | 166 | (339 | ) | (4 | ) | |||||||||
Investment and other income/(loss) | 2,489 | 531 | (1,013 | ) | (13 | ) | ||||||||||
Finance and other costs | (4,789 | ) | 180 | (1,455 | ) | (19 | ) | |||||||||
Total | (7,704 | ) | (1,060 | ) | (2,008 | ) | (25 | ) | ||||||||
F-
49
12. Earnings/(Loss) per share (“EPS”)
The following reflects the income and share data used in the basic and diluted earnings/(loss) per share computations:
Computation of weighted average number of shares
For the year ended March 31, | 2020 | 2021 | 2022 | |||||||||
| Weighted average number of ordinary shares for basic earnings per share* | 3,702,554,614 | 3,704,196,924 | 3,706,455,160 | |||||||||
| Effect of dilution: | ||||||||||||
| Potential ordinary shares relating to share option awards | 21,220,860 | # | 23,348,057 | 25,693,575 | ||||||||
| Adjusted weighted average number of ordinary shares for diluted earnings per share | 3,702,554,614 | # | 3,727,544,981 | 3,732,148,735 | ||||||||
Computation of basic and diluted earnings per share
Basic earnings/(loss) per share:
For the year ended March 31, | 2020 | 2021 | 2022 | 2022 | ||||||||||||
( ₹ in million except EPS data) | ( ₹ in million except EPS data) | ( ₹ in million except EPS data) | (US dollars in million except EPS data) | |||||||||||||
| (Loss)/Profit for the year attributable to equity holders of the parent | (61,248 | ) | 112,883 | 207,953 | 2,740 | |||||||||||
| Weighted average number of ordinary shares for basic earnings per share* | 3,702,554,614 | 3,704,196,924 | 3,706,455,160 | 3,706,455,160 | ||||||||||||
(Loss)/Earnings per share(INR / USD) | (16.54 | ) | 30.47 | 56.11 | 0.74 | |||||||||||
Diluted earnings/(loss) per share:
For the year ended March 31, | 2020 | 2021 | 2022 | 2022 | ||||||||||||
( ₹ in million except EPS data) | ( ₹ in million except EPS data) | ( ₹ in million except EPS data) | (US dollars in million except EPS data) | |||||||||||||
| (Loss)/Profit for the year attributable to equity holders of the parent | (61,248 | ) | 112,883 | 207,953 | 2,740 | |||||||||||
| Adjusted weighted average number of ordinary shares for diluted earnings per share* | 3,702,554,614 | # | 3,727,544,981 | 3,732,148,735 | 3,732,148,735 | |||||||||||
(Loss)/Earnings per share # (INR / USD) | (16.54 | ) | 30.28 | 55.72 | 0.73 | |||||||||||
| * | After excluding the impact of treasury shares |
| # | Potential dilutive shares have been considered as anti dilutive for year ended March 31, 2020. |
Nominal value per share is 1 for the year ended March 31, 2020, March 31, 2021 and March 31, 2022.
₹
F-5
0
13. Dividends
Each equity share holder is entitled to dividends as and when Vedanta Limited declares and pays dividends after obtaining shareholder approval for final dividend and board approval in case of an interim dividend. Dividends are paid in Indian Rupees. Remittance of dividends outside India is governed by Indian law on foreign exchange and is subject to applicable taxes.
Distributions made and proposed
For the year ended March 31, | 2020 | 2021 | 2022 | 2022 | ||||||||||||
( ₹ in million) | ( ₹ in million) | ( ₹ in million) | (US dollars in million) | |||||||||||||
Amounts recognised as distributions to equity share holders: | ||||||||||||||||
Equity dividend on ordinary shares: | ||||||||||||||||
| Interim dividend for the year: (March 31, 2020: ₹ ₹ ₹ ₹ ₹ 13/- per share) a,b,c | 14,441 | 35,187 | 166,814 | 2,199 | ||||||||||||
Total | 14,441 | 35,187 | 166,814 | 2,199 | ||||||||||||
| a) | Three interim dividends of ₹ ₹ ₹ |
| b) | An interim dividend of ₹ /- per share was declared during the year ended March 31, 2021. |
| c) | An interim dividend of ₹ /- per share was declared during the year ended March 31, 2020. The right to interim dividend of₹ /- per share was waived by ESOS Trust. |
Subsequent to the balance sheet date, the Board of Directors of the Company in their meeting held on April31.50per equity share, i.e., 3,150% on face value of1/- per share for FY 2022-23 amounting to 116,838 million
28
2022 have approved first interim dividend of,
₹
/-
₹
₹
which has been paid subsequently.
Further the Board of Directors of the Company in their meeting held on July 19, 2022 have approved second interim dividend of 19.50/- per equity share, i.e., 1,950% on face value of 1/- per share for
₹
₹
FY 2022-23.
If profits for a year are insufficient to declare dividends, dividends for that year may be declared and paid out from accumulated profits on the following conditions:
| • | The rate of dividend declared shall not exceed the average of the rates at which dividend was declared by the company in the three years immediately preceding that year; |
| • | The total amount to be drawn from such accumulated profits shall not exceed one-tenth of the sum of the company’spaid-up share capital and free reserves as appearing in the latest audited financial statement; |
| • | The amount so drawn shall first be utilised to set off the losses incurred in the financial year in which dividend is declared before any dividend in respect of equity shares is declared; and |
| • | The balance of reserves after such withdrawal shall not fall below fifteen per cent of the company’s paid up share capital as appearing in the latest audited financial statement. |
F-5
1
14. Property, plant and equipment and Exploration and evaluation assets
Mining properties | Land and buildings | Plant and equipment | Oil and gas properties | Others | ROU assets (A) | Assets under construction | Total | Exploration and evaluation assets | Total | Total | ||||||||||||||||||||||||||||||||||
₹ in million | ₹ in million | ₹ in million | ₹ in million | ₹ in million | ₹ in million | ₹ in million | ₹ in million | ₹ in million | ₹ in million | US dollars in million | ||||||||||||||||||||||||||||||||||
Gross Block | ||||||||||||||||||||||||||||||||||||||||||||
As at April 1, 2020 | 233,353 | 139,044 | 864,247 | 1,449,286 | 15,733 | 14,150 | 133,011 | 2,848,824 | 136,066 | 2,984,890 | ||||||||||||||||||||||||||||||||||
| Additions | 13,011 | 1,601 | 15,121 | 8,813 | 1,318 | 1,082 | 17,248 | 58,194 | 7,003 | 65,197 | ||||||||||||||||||||||||||||||||||
| Transfers/ Reclassification* | 4,569 | (1,485 | ) | 27,130 | (81 | ) | (137 | ) | 2,529 | (32,634 | ) | (109 | ) | 81 | (28 | ) | ||||||||||||||||||||||||||||
| Disposals/ Adjustments | (47 | ) | (327 | ) | (5,438 | ) | (69 | ) | (391 | ) | (25 | ) | (2,919 | ) | (9,216 | ) | — | (9,216 | ) | |||||||||||||||||||||||||
| Acquisition through business combination (Refer Note 4(a)) | 2,202 | 1,321 | — | — | — | — | 20 | 3,543 | — | 3,543 | ||||||||||||||||||||||||||||||||||
| Exploration cost s written off | — | — | — | — | — | — | — | — | (70 | ) | (70 | ) | ||||||||||||||||||||||||||||||||
| Foreign exchange | 7,316 | 1,151 | 6,932 | (29,417 | ) | 341 | (160 | ) | 722 | (13,115 | ) | (2,611 | ) | (15,726 | ) | |||||||||||||||||||||||||||||
As at March 31, 2021 | 260,404 | 141,305 | 907,992 | 1,428,532 | 16,864 | 17,576 | 115,448 | 2,888,121 | 140,469 | 3,028,590 | 39,918 | |||||||||||||||||||||||||||||||||
| Additions | 11,765 | 2,046 | 12,754 | 8,373 | 1,263 | 1,155 | 73,309 | 110,665 | 9,641 | 120,306 | 1,586 | |||||||||||||||||||||||||||||||||
| Transfers/ Reclassification* | 20,574 | 876 | 29,524 | 6,915 | 116 | (6,963 | ) | (49,596 | ) | 1,446 | (1,559 | ) | (113 | ) | (1 | ) | ||||||||||||||||||||||||||||
| Disposals/ Adjustments | (330 | ) | (933 | ) | (12,191 | ) | (116 | ) | (210 | ) | (433 | ) | (2,906 | ) | (17,119 | ) | — | (17,119 | ) | (227 | ) | |||||||||||||||||||||||
| Exploration costs written off B | — | — | — | — | — | — | — | — | (26,181 | ) | (26,181 | ) | (345 | ) | ||||||||||||||||||||||||||||||
| Foreign exchange | 2,663 | 80 | 1,862 | 44,863 | 76 | 63 | 195 | 49,802 | 3,807 | 53,609 | 707 | |||||||||||||||||||||||||||||||||
As at March 31, 2022 | 295,076 | 143,374 | 939,941 | 1,488,567 | 18,109 | 11,398 | 136,450 | 3,032,915 | 126,177 | 3,159,092 | 41,638 | |||||||||||||||||||||||||||||||||
Accumulated depreciation, depletion, amortisation and impairment | ||||||||||||||||||||||||||||||||||||||||||||
As at April 1, 2020 | 166,478 | 34,869 | 291,880 | 1,356,795 | 8,949 | 1,056 | 21,926 | 1,881,953 | 118,144 | 2,000,097 | ||||||||||||||||||||||||||||||||||
| Charge for the year | 16,745 | 5,197 | 35,627 | 20,516 | 1,734 | 1,413 | — | 81,232 | — | 81,232 | ||||||||||||||||||||||||||||||||||
| Disposals/Adjustments | — | (236 | ) | (4,144 | ) | (69 | ) | (305 | ) | — | — | (4,754 | ) | — | (4,754 | ) | ||||||||||||||||||||||||||||
| Transfers/Reclassification* | 3 | — | 352 | — | (71 | ) | (2 | ) | (285 | ) | (3 | ) | — | (3 | ) | |||||||||||||||||||||||||||||
| Asset under construction written off c | — | — | — | — | — | — | 2,440 | 2,440 | — | 2,440 | ||||||||||||||||||||||||||||||||||
| Foreign exchange | 3,376 | 755 | 4,377 | (27,675 | ) | 254 | (15 | ) | — | (18,928 | ) | (2,217 | ) | (21,145 | ) | |||||||||||||||||||||||||||||
As at March 31, 2021 | 186,602 | 40,585 | 328,092 | 1,349,567 | 10,561 | 2,452 | 24,081 | 1,941,940 | 115,927 | 2,057,867 | 27,124 | |||||||||||||||||||||||||||||||||
| Charge for the year | 21,104 | 4,529 | 39,942 | 22,887 | 1,650 | 612 | — | 90,724 | — | 90,724 | 1,195 | |||||||||||||||||||||||||||||||||
| Disposals/Adjustments | — | (294 | ) | (8,610 | ) | (116 | ) | (149 | ) | (430 | ) | — | (9,599 | ) | — | (9,599 | ) | (127 | ) | |||||||||||||||||||||||||
| Transfers/Reclassification* | (2 | ) | 4 | 559 | 892 | (2 | ) | (892 | ) | (570 | ) | (11 | ) | — | (11 | ) | (0 | ) | ||||||||||||||||||||||||||
| Impairment Charge/ (reversal) B | — | — | — | (53,143 | ) | — | — | — | (53,143 | ) | (9,602 | ) | (62,745 | ) | (827 | ) | ||||||||||||||||||||||||||||
| Assets under construction/capital advances written off B | — | — | — | — | — | — | 1,951 | 1,951 | — | 1,951 | 26 | |||||||||||||||||||||||||||||||||
| Foreign exchange | 1,195 | 54 | 1,434 | 41,720 | 101 | (2 | ) | — | 44,502 | 3,210 | 47,712 | 629 | ||||||||||||||||||||||||||||||||
As at March 31, 2022 | 208,899 | 44,878 | 361,417 | 1,361,807 | 12,161 | 1,740 | 25,462 | 2,016,364 | 109,535 | 2,125,899 | 28,020 | |||||||||||||||||||||||||||||||||
Net book value / Carrying amount | ||||||||||||||||||||||||||||||||||||||||||||
| As at April 1, 2020 | 66,875 | 104,175 | 572,367 | 92,491 | 6,784 | 13,094 | 111,085 | 966,871 | 17,922 | 984,793 | ||||||||||||||||||||||||||||||||||
As at March 31, 2021 | 73,802 | 100,720 | 579,900 | 78,965 | 6,303 | 15,124 | 91,367 | 946,181 | 24,542 | 970,723 | ||||||||||||||||||||||||||||||||||
As at March 31, 2022 | 86,177 | 98,496 | 578,524 | 126,760 | 5,948 | 9,658 | 110,988 | 1,016,551 | 16,642 | 1,033,193 | 13,618 | |||||||||||||||||||||||||||||||||
| * | Transfers/reclassification majorly includes capitalisation of CWIP to respective class of assets. |
F-5
2
A) | Disclosure of Right of Use (ROU) Assets as per IFRS 16 “Leases” |
Land & Building | Plant and Equipment | Total | Total | |||||||||||||
₹ in million | ₹ in million | ₹ in million | US dollars in million | |||||||||||||
Gross Block | ||||||||||||||||
As at April 1, 2020 | 6,811 | 7,339 | 14,150 | |||||||||||||
Additions | 922 | 160 | 1,082 | |||||||||||||
Transfers/Reclassification | 2,533 | (4 | ) | 2,529 | ||||||||||||
Deductions | (16 | ) | (9 | ) | (25 | ) | ||||||||||
Foreign exchange | (47 | ) | (113 | ) | (160 | ) | ||||||||||
As at March 31, 2021 | 10,203 | 7,373 | 17,576 | 232 | ||||||||||||
Additions | 968 | 187 | 1,155 | 15 | ||||||||||||
Transfers/Reclassification ** | (48 | ) | (6,915 | ) | (6,963 | ) | (92 | ) | ||||||||
Deductions | (432 | ) | (1 | ) | (433 | ) | (6 | ) | ||||||||
Foreign exchange | (56 | ) | 119 | 63 | 1 | |||||||||||
As at March 31, 2022 | 10,635 | 763 | 11,398 | 150 | ||||||||||||
Accumulated depreciation and impairment | ||||||||||||||||
As at April 1, 2020 | 833 | 223 | 1,056 | |||||||||||||
Charge for the year | 622 | 791 | 1,413 | |||||||||||||
Transfers/Reclassification | — | (2 | ) | (2 | ) | |||||||||||
Disposals/Adjustments | — | — | — | |||||||||||||
Foreign exchange | (12 | ) | (3 | ) | (15 | ) | ||||||||||
As at March 31, 2021 | 1,443 | 1,009 | 2,452 | 32 | ||||||||||||
Charge for the year | 523 | 89 | 612 | 8 | ||||||||||||
Transfers/Reclassification ** | — | (892 | ) | (892 | ) | (12 | ) | |||||||||
Disposals/Adjustments | (430 | ) | — | (430 | ) | (6 | ) | |||||||||
Foreign exchange | (21 | ) | 19 | (2 | ) | 0 | ||||||||||
As at March 31, 2022 | 1,515 | 225 | 1,740 | 22 | ||||||||||||
Net book value / Carrying amount | ||||||||||||||||
As at April 1, 2020 | 5,978 | 7,116 | 13,094 | |||||||||||||
As at March 31, 2021 | 8,760 | 6,364 | 15,124 | |||||||||||||
As at March 31, 2022 | 9,120 | 538 | 9,658 | 128 | ||||||||||||
| ** | During the current year, Company has bought back its ROU RDG Gas Bridge assets in Oil & Gas business which are consequently reclassified to Oil & Gas properties as per the contractual terms. |
F-5
3
B) |
| 1) | During the year ended March 31, 2022, the Group has recognized an impairment reversal of ₹ |
i) Impairment reversal of 61,598 million ($ 812 million) relating to Rajasthan oil and gas 52,121 million 9,477 million ($ 125 million) impairment
₹
block “RJ CGU” mainly
due to increase in crude price forecast. Of this,₹
(
$ 687 million) impairment reversal has been recorded against oil and gas producing facilities and₹
reversal has been recorded against exploration and evaluation assets.
The recoverable amount of the Group’s share in Rajasthan Oil and Gas cash generating unit “RJ CGU” was determined
to be₹
)
as at March 31, 2022.The recoverable amount of the RJ CGU was determined based on the fair value less costs of disposal approach, atest. Discounted cash flow analysis used to calculate fair value less costs of disposal uses assumption for short-term oil price of US $ 86 per barrel for the next one year and tapers down to long-term nominal price of US$ 68 per barrel three years thereafter derived from a consensus of various analyst recommendations. Thereafter, these have been escalated at a rate of 2% per annum. The cash flows are discounted using the 2,042 million ($ 27 million) and 3,111 million ($ 41 million)
level-3
valuation technique in the fair value hierarchy, as it more accurately reflects the recoverable amount based on theGroup’s
view of the assumptions that would be used by a market participant. This is based on the cash flows expected to be generated by the projected oil and natural gas production profiles up to the expected dates of cessation of production sharing contract (PSC)/cessation of production from each producing field based on the current estimates of reserves and risked resources. Reserves assumptions for fair value less costs of disposal tests consider all reserves that a market participant would consider when valuing the asset, which are usually broader in scope than the reserves used in avalue-in-use
post-tax
nominal discount rate of 9.88% derived from thepost-tax
weighted average cost of capital after factoring in the risks ascribed to PSC extension including successful implementation of key growth projects. Based on the sensitivities carried out by theGroup,
change in crude price assumptions by US$ 1/bbl and changes to discount rate by 1% would lead to a change in recoverable value by₹
₹
,
respectively.ii) Impairment reversal of 1,022 million ($ 13 million) relating toCGU mainly due to the 2,048 million ($ 27 million) based on fair value less cost of disposal approach as described in above paragraph. Discounted cash flow analysis used to calculate fair value less costs of disposal uses assumption for short-term oil price of US $ 86 per barrel for the next one year and tapers down to long-term nominal price of US $ 68 per barrel three years thereafter derived from a consensus of various analyst recommendations. Thereafter, these have been escalated at a rate of 2% per annum. The cash flows are discounted using the
₹
KG-ONN-2003/1
increase
in crude oil price forecast. The recoverable amount of theGroup’s
share in this CGU was determined to be₹
post-tax
nominal discount rate of 10.63%. The sensitivities around change in crude oil price and discount rate are not material to theconsolidated financial statements.
| 2) | During the year, the Group has continued with exploration and appraisal work program in its PSC block RJON-90/1 block and RSC blocks awarded under OALP (Open Acreage Licensing Policy). Based on the outcome of such appraisal activities, an amount of₹ statements of profit and loss during the year, since the test results of these exploration wells did not indicate presence of hydrocarbons. |
| 3) | During the year ended March 31, 2021, ESL Steel Limited conducted a detailed physical verification and evaluation of project equipment and material being carried forward as capital work-in-progress ₹ ₹ during the year ended March 21, 2021, relating to certain items of capitalwork-in-progress, ₹ |
| 4) | In relation to a mine in Aluminium business , the Group had deposited₹ MoEFCC and the Hon. Supreme Court declared the mining project inoperable on environmental grounds. Later, in 2017, the mining license lapsed. Thereafter, theGroup has sent several communications to the authorities requesting a refund of the amount paid. Although several positive deliberations happened, theGroup is yet to receive the amount. Accordingly, the deposit has been fully provided for during the current year. |
| 5) | During the year ended March 31, 2022, the Group has recognised a loss of₹ work-in-progress |
| 6) | During the year ended March 31, 2022, ₹ |
C ) | During the year ended March 31, 2020 and March 31, 2021 the Group had recognized impairment charge of ₹ assets under construction written off of₹ , respectively, comprising: |
| Ø | During the year ended March 31, 2021, the Group has recognized a loss of₹ |
| Ø | For the year ended March 31, 2020:- |
| 1) | Impairment charge of ₹ ₹ ₹ |
F-5
4
For oil & gas assets, CGU’s identified are on the basis of a production sharing contract (PSC) level, as it is the smallest group of assets that generates cash inflows that are largely independent of the cash inflows from other assets or group of assets.
The recoverable amount of the RJ CGU, 105,109 million was determined based on the fair value less costs of disposal approach, as it more accurately reflects the recoverable amount based on our view of the assumptions that would be used by a market participant. The same was computed using atest. Discounted cash flow analysis used to calculate fair value less costs of disposal use assumption for short-term oil price of $ 38 per barrel for the next one year and scales up to long-term nominal price of $ 57 per barrel three years thereafter derived from a consensus of various analyst recommendations. Thereafter, these have been escalated at a rate of 2% per annum. The cash flows are discounted using the 3,370 million and 4,940 million, respectively.
₹
level-3
valuation technique based on the cash flows expected to be generated by the projected oil and natural gas production profiles up to the expected dates of cessation of production sharing contract (PSC)/cessation of production from each producing field based on the current estimates of reserves and risked resources. Reserves assumptions for fair value less costs of disposal tests consider all reserves that a market participant would consider when valuing the asset, which are usually broader in scope than the reserves used in avalue-in-use
post-tax
nominal discount rate of 10.35% derived from thepost-tax
weighted average cost of capital after factoring the risks ascribed to the successful implementation of key growth projects. Additionally, in computing the recoverable value, the effects of market participant’s response on production sharing contract matters have also been appropriately considered. Based on the sensitivities carried out by the Group, change in crude price assumptions by $ 1/bbl and changes to discount rate by 1% would lead to a change in recoverable value by₹
₹
| 2) | Impairment charge of ₹ million relating to KG-ONN-2003/1 CGU mainly due to the reduction in crude oil price forecast and increase in recoverable reserves. The recoverable amount of CGU,the ₹ level-3 valuation technique in the fair value hierarchy as described in above paragraph. Discounted cash flow analysis used to calculate fair value less costs of disposal use assumption for oil price as described in above paragraph. The cash flows are discounted using thepost-tax nominal discount rate of 11.1% derived from thepost-tax weighted average cost of capital. The sensitivities around change in crude price and discount rate are not material to the financial statements. |
| 3) | Impairment charge of ₹ KG-OSN-2009/3, |
D ) | During the year ended March 31, 2020, the Group has recognized impairment charge of ₹ |
The net recoverable value of assets and liabilities was assessed at 15,360 million based on the value in use approach. Based on the sensitivities carried out by the Group, decrease in volume assumptions by 1% would lead to decrease in recoverable value by 170 million and increase in discount rate by 1% would lead to a decrease in recoverable value by 480 million.
₹
₹
₹
E ) | Refer N ote 3(c)(I)(iii) relating to assets at copper plant where operations are suspended. |
F ) | Footnotes: |
| 1. | Plant and equipment include refineries, smelters, power plants, aircrafts, ships, river fleets, railway sidings and related facilities. |
| 2. | Others includes furniture and fixtures, office equipments and vehicles. |
| 3. | During the year ended March 31, 2020, 2021 and 2022, interest capitalized was ₹ ₹ ₹ , respectively. |
| 4. | Certain property, plant and equipment are pledged as collateral against borrowings, the details related to which have been described in Note 22 on “Borrowings”. |
| 5. | Freehold land under includes 40 quarters at Bidhan Bagh Unit which have been occupied without authorization for whichLand and buildings the Group is evaluating evacuation options and the Group has filed the civil suits for the same. |
| 6. | The 206.18 acres land transferred to BALCO by National Thermal Power Corporation Ltd. (NTPC) in June 20 0 2 non-availability of title deeds from NTPC. In the matter, arbitration was held where the Arbitrator passed the award in favour of BALCO but directed that transfer of title deeds of land will be effected by the Central Government with the assistance of State Government. The matter issub-judice before the Delhi High Court. |
| 7. | The Division Bench of the Hon’ble High Court of Chhattisgarh has vide its order dated February 25, 2010, upheld that BALCO is in legal possession of 1,804.67 acres of Government land. Subsequent to the said order, the State Government has decided to issue the lease deed in favour of BALCO after the issue of forest land is decided by the Hon’ble Supreme Court. In the proceedings before the Hon’ble Supreme Court, pursuant to public interest litigations filed, it has been alleged that the land in possession of BALCO is being used in contravention of the Forest Conservation Act, 1980 even though the said land has been in its possession prior to the promulgation of the Forest Conservation Act, 1980 on which its Aluminium complex, allied facilities and township were constructed between 1971-76. The Central Empowered Committee of the Supreme Court has already recommended ex-post facto diversion of the forest land in possession of BALCO. BALCO has also filed two IAs (Interlocutory Application) before the Supreme Court, first challenging the order of the Tehsildar Korba whereby he rejected BALCO’S applications for eviction of illegal encroachers on BALCO’S land on the ground that land matter is subjudice before the Supreme Court and the second application whereby BALCO has challenged the state government’s action for allotment of land to illegal encroachers under the Rajiv Ashray Yojna. The matter is to be listed for hearing in due course. |
F-5
5
| 8. | Freehold land under Land and Buildings includes gross block as at March 31, 2021 ₹ ₹ ₹ ₹ respectively which is available for use during the lifetime of the Production Sharing Contract of the respective Oil and Gas blocks and title deed for the same is in the name of the licensee of the block. |
| 9. | Property, plant and equipment and exploration and evaluation assets net block includes share of jointly owned assets with the joint venture partners of ₹ ₹ , respectively. |
| 10. | Oil and Gas Properties includes development assets under construction of carrying value of ₹ ₹ |
| 11. | TSPL’s assets consisting of land (including ROU land), building and plant and equipment having net carrying values as at March 31, 2021 and 2022 of₹ ₹ ₹ ₹ ₹ ₹ , respectively, have been given on operating lease (referN ote 3(c)(II)(i)). |
| 12. | Reconciliation of depreciation, depletion and amorti s ation expense: |
Year ended March 31, | ||||||||||||||||
2020 | 2021 | 2022 | 2022 | |||||||||||||
₹ in million | ₹ in million | ₹ in million | US dollars in million | |||||||||||||
Depreciation, depletion and amorti s ation expense on | ||||||||||||||||
Property, plant and equipment | 100,255 | 81,232 | 90,724 | 1,196 | ||||||||||||
Intangible assets | 821 | 682 | 703 | 9 | ||||||||||||
As per property, plant and equipment and intangibles schedule | 101,076 | 81,914 | 91,427 | 1,205 | ||||||||||||
Less: Depreciation capitalized | — | (498 | ) | (39 | ) | (1 | ) | |||||||||
Less: Cost allocated to joint ventures | (586 | ) | (238 | ) | (240 | ) | (3 | ) | ||||||||
Charged to consolidated statement of profit or loss | 100,490 | 81,178 | 91,148 | 1,201 | ||||||||||||
15. Intangible assets
Port Concession Rights 1 | Software License | Others | Total | Total | ||||||||||||||||
₹ in million | ₹ in million | ₹ in million | ₹ in million | US dollars in million | ||||||||||||||||
Gross Block | ||||||||||||||||||||
As at April 1, 2020 | 6,013 | 3,579 | 3,617 | 13,209 | ||||||||||||||||
Additions | 15 | 78 | 322 | 415 | ||||||||||||||||
Transfers from Property, Plant and Equipment | — | 28 | — | 28 | ||||||||||||||||
Disposals/Adjustments | — | (64 | ) | — | (64 | ) | ||||||||||||||
Foreign exchange difference | — | (28 | ) | (107 | ) | (135 | ) | |||||||||||||
As at March 31, 2021 | 6,028 | 3,593 | 3,832 | 13,453 | 178 | |||||||||||||||
Additions | 6 | 157 | — | 163 | 2 | |||||||||||||||
Transfers from Property, Plant and Equipment | 1 | 112 | — | 113 | 1 | |||||||||||||||
Disposals/Adjustments | — | (2 | ) | — | (2 | ) | 0 | |||||||||||||
Foreign exchange difference | — | 70 | (149 | ) | (79 | ) | (1 | ) | ||||||||||||
As at March 31, 2022 | 6,035 | 3,930 | 3,683 | 13,648 | 180 | |||||||||||||||
Accumulated depreciation, depletion, amortization and impairment | ||||||||||||||||||||
As at April 1, 2020 | 1,578 | 3,096 | 745 | 5,419 | ||||||||||||||||
Charge for the year | 230 | 147 | 305 | 682 | ||||||||||||||||
Transfers from Property, Plant and Equipment | — | 3 | — | 3 | ||||||||||||||||
Disposals/Adjustments | — | (64 | ) | — | (64 | ) | ||||||||||||||
Foreign exchange difference | — | (31 | ) | (37 | ) | (68 | ) | |||||||||||||
As at March 31, 2021 | 1,808 | 3,151 | 1,013 | 5,972 | 79 | |||||||||||||||
Charge for the year | 230 | 175 | 298 | 703 | 9 | |||||||||||||||
Transfers from Property, Plant and Equipment | — | 11 | — | 11 | 0 | |||||||||||||||
Disposals/Adjustments | — | (2 | ) | — | (2 | ) | 0 | |||||||||||||
Foreign exchange difference | — | 62 | (64 | ) | (2 | ) | 0 | |||||||||||||
As at March 31, 2022 | 2,038 | 3,397 | 1,247 | 6,682 | 88 | |||||||||||||||
Net book value / Carrying amount | ||||||||||||||||||||
As at April 1, 2020 | 4,435 | 483 | 2,872 | 7,790 | ||||||||||||||||
As at March 31, 2021 | 4,220 | 442 | 2,819 | 7,481 | ||||||||||||||||
As at March 31, 2022 | 3,997 | 533 | 2,436 | 6,966 | 92 | |||||||||||||||
F-5
6
| (1) | Vizag General Cargo Berth Private Limited (VGCB), a special purpose vehicle and wholly owned by the Company, was incorporated for the coal berth mechanization and upgradation at Visakhapatnam port. |
The project was to be carried out on a design, build, finance, operate, transfer basis and the concession agreement between Visakhapatnam Port Trust (‘VPT’) and VGCB was signed in June 2010. In October 2010, VGCB was awarded with the concession after fulfilling conditions stipulated as a precedent to the concession agreement. VPT has provided, in lieu of license fee, an exclusive license to VGCB for designing, engineering, financing, constructing, equipping, operating, maintaining, and replacing the project/project facilities and services. The concession period
isfor
30years from the date of the award. The upgraded capacity is
10.18mmtpa and the VPT would be entitled to receive
38.10%share of the gross revenue as royalty. VGCB is entitled to recover a tariff from the user(s) of the project facilities and services as per its Tariff Authority for Major Ports (TAMP) notification. The tariff rates are linked to the Wholesale Price Index (WPI) and would accordingly be adjusted as specified in the concession agreement every year. The ownership of all infrastructure assets, buildings, structures, berths, wharfs, equipment and other immovable and movable assets constructed, installed, located, created or provided by VGCB at the project site and/or in the port’s assets pursuant to concession agreement would be with VGCB until expiry of this concession agreement. The cost of any repair, replacement or restoration of the project facilities and services shall be borne by VGCB during the concession period. VGCB has to transfer all its rights, titles and interest in the project facilities and services free of cost to VPT at the end of the concession period. Intangible asset of port concession rights represents consideration for construction services. No revenue from construction contract of service concession arrangements on exchanging construction services for the port concession rights was recognized for the year
s
ended March 31, 2020, March 31, 2021 and March 31, 2022. 16. Financial asset investments
Financial asset investments represent investments classified and accounted for at fair value through profit or loss or through other comprehensive income (Refer Note 25)
Movements for the year ended March 31, | 2021 | 2022 | 2022 | |||||||||
( ₹ in million) | ( ₹ in million) | (US dollars in million) | ||||||||||
As at April 1, | 911 | 1,532 | 20 | |||||||||
| Changes in fair value | 621 | (47 | ) | (1 | ) | |||||||
Exchange difference | — | (13 | ) | (0 | ) | |||||||
As at March 31, | 1,532 | 1,472 | 19 | |||||||||
Financial asset investment represents quoted investments in equity shares and other investments that present the Group with an opportunity for returns through dividend income and gains in value. These securities are held at fair value. These are classified as
non-current
assets.F-
5
7
17. Trade and other receivables and Other
non-current
assetsAs at March 31, | ||||||||||||||||||||||||||||||||||||
2021 Non- current | 2021 Current | 2021 Total | 2022 Non- current | 2022 Current | 2022 Total | 2022 Non- current | 2022 Current | 2022 Total | ||||||||||||||||||||||||||||
( ₹ in million) | ( ₹ in million) | ( ₹ in million) | ( ₹ in million) | ( ₹ in million) | ( ₹ in million) | (US dollars in million) | (US dollars in million) | (US dollars in million) | ||||||||||||||||||||||||||||
Financial | ||||||||||||||||||||||||||||||||||||
Bank Deposits 1 | 1,153 | — | 1,153 | 2,066 | — | 2,066 | 27 | — | 27 | |||||||||||||||||||||||||||
Site restoration assets 2 | 8,220 | — | 8,220 | 10,232 | — | 10,232 | 135 | — | 135 | |||||||||||||||||||||||||||
Trade receivables 3,7 | 31,582 | 34,459 | 66,041 | 32,187 | 49,375 | 81,562 | 424 | 651 | 1,075 | |||||||||||||||||||||||||||
Others 5 | 15,998 | 2,395 | 18,393 | 16,291 | 4,152 | 20,443 | 215 | 54 | 269 | |||||||||||||||||||||||||||
Loans to related parties (Refer Note 35) | 50,562 | 20,150 | 70,712 | 31,644 | 22,980 | 54,624 | 417 | 303 | 720 | |||||||||||||||||||||||||||
Receivables from related parties | — | 1,476 | 1,476 | — | 1,510 | 1,510 | — | 20 | 20 | |||||||||||||||||||||||||||
| Advance recoverable | — | 39,083 | 39,083 | — | 81,754 | 81,754 | — | 1,078 | 1,078 | |||||||||||||||||||||||||||
Total—Financial (A) | 107,515 | 97,563 | 205,078 | 92,420 | 159,771 | 252,191 | 1,218 | 2,106 | 3,324 | |||||||||||||||||||||||||||
Non Financial | ||||||||||||||||||||||||||||||||||||
| Balance with Government Authorities | 6,098 | 7,294 | 13,392 | 7,607 | 10,841 | 18,448 | 100 | 143 | 243 | |||||||||||||||||||||||||||
Advance for supplies | — | 12,345 | 12,345 | — | 27,062 | 27,062 | — | 357 | 357 | |||||||||||||||||||||||||||
| Advance to related party | 944 | 2,271 | 3,215 | 610 | 840 | 1,450 | — | 19 | 19 | |||||||||||||||||||||||||||
Others 4,6 | 13,170 | 11,256 | 24,426 | 9,173 | 13,990 | 23,163 | 129 | 176 | 305 | |||||||||||||||||||||||||||
Total—Non Financial (B) | 20,212 | 33,166 | 53,378 | 17,390 | 52,733 | 70,123 | 229 | 695 | 924 | |||||||||||||||||||||||||||
Total (A+B)* | 127,727 | 130,729 | 258,456 | 109,810 | 212,504 | 322,314 | 1,447 | 2,801 | 4,248 | |||||||||||||||||||||||||||
| * | Net of allowances of ₹ ₹ |
| 1. | Includes ₹ ₹ ₹ ₹ ₹ ₹ ₹ million a nd₹ ₹ ₹ mi ($ 8 million)llion held as margin money against bank guarantee as at March 31, 2021 and March 31, 2022 , ��respectively. |
| 2. | Includes deposit in Site Restoration Fund of ₹ ₹ , respectively. |
| 3. | In a matter between TSPL and Punjab State Power Corporation Limited (PSPCL) relating to assessment of whether there has been a change in law following the execution of the Power Purchase Agreement, the Appellate Tribunal (APTEL) for Electricity has dismissed the appeal in July 2017 filed by TSPL. TSPL later filed an appeal before the Honorable Supreme Court to seek relief, which is yet to be listed. |
The outstanding trade receivables in relation to this dispute and other matters is ₹ ₹ , respectively. The Group, based on external legal opinion and its own assessment of the merits of the case, remains confident that it is highly probable that the Supreme court will uphold TSPL’s appeal and has thus continued to treat these balances as recoverable. |
Additionally, trade receivables include 13,230 million and 12,927 million ($ 171 million) as at 5,137 million ($68 Million) 2,180 Million ($29
₹
₹
March 31, 2021 and March 31, 2022, respectively, withheld by GRIDCO (‘GRIDCO’ or ‘the customer’) on account of certain disputes relating to computation of power tariffs pending adjudication by APTEL. Additionally, GRIDCO had raised
claims of₹
on the Company in respect of short supply of power, against which a provision
of
₹
million) had been made in previous years. Various minutes of meetings were signed with the customer for computing the short supply claims, which were subject to approval of Odisha State Electricity Regulatory Commission (OERC). Hearing on the subject matter (PPA Amendment Case) was completed in October 2019 and OERC had pronounced the order on June 22, 2020. Further, in August 2020, the Company filed an appeal before APTEL against the said OERC order which was finally admitted on March 22, 2022 for hearing to be scheduled in the future. GRIDCO has also sought review of the said OERC order. The matter has been posted for order by OERC in due course. In the meanwhile, power supply to GRIDCO has resumed and GRIDCO has been making regular payments against monthly energy invoices.
F-
5
8
| 4. | Includes claim receivables, advance recoverable (oil and gas business), prepaid expenses, export incentive receivables and receivables from KCM. |
| 5. | Includes claims receivables, advance recoverable (oil and gas business) and others. It also includes advance profit petroleum of ₹ ₹ , respectively. |
| 6. | Includes receivable from KCM (net of provision) ₹ ₹ |
A provisional liquidator (‘PL’) was appointed to manage the affairs of Konkola Copper Mines plc (KCM) on May 21, 2019, after ZCCM Investments Holdings Plc (ZCCM-IH), an entity majority owned by the Government of Zambia and a 20.6% shareholder in KCM, filed a winding up petition against KCM. KCM’s majority shareholder, Vedanta Resources Holdings Limited (VRHL), and its parent company, VRL, are contesting the winding up petition in the Zambian courts and have also commenced arbitration against ZCCM-IH, consistent with their position that arbitration is the agreed dispute resolution process, together with an application to the South African courts to stay the winding up proceedings consistent with the agreement to arbitrate.
Meanwhile
, KCM has not been supplying goods to the Company and/ or its subsidiaries, which it was supposed to as per the terms of the
advance. The Group has recognised provision for expected credit loss
of₹
million and
₹
million ($
29million) during the years ended March 31, 2021 and March 31, 2022, respectively. The Group carries provision
of₹
million and
₹
million ($
85million) as at March 31, 2021 and March 31, 2022, respectively.
| 7. | The total trade receivables as at April 1, 2020 were ₹ |
18. Inventories
Inventories consist of the following:
As at March 31, | ||||||||||||
2021 | 2022 | 2022 | ||||||||||
( ₹ in million) | ( ₹ in million) | (US dollars in million) | ||||||||||
Raw materials and consumables | 60,555 | 84,449 | 1,113 | |||||||||
Work-in-progress | 30,202 | 50,469 | 665 | |||||||||
Finished goods | 8,752 | 8,335 | 110 | |||||||||
99,509 | 143,253 | 1,888 | ||||||||||
Inventory held at net realizable value amounted to 23,985 million and 27,069 million ($ 357 million) as at March 31, 2021 and March 31, 2022, respectively. The write down on this inventory amounted to 1,594 million and 1,723 million ($ 23
₹
₹
₹
₹
million) for the year
s
ended March 31, 2021 and March 31, 2022, respectively and this has been charged to cost of sales in the consolidated statements of profit or loss. F-
59
19. Short-term investments
Short-term investments consist of the following:
As at March 31, | ||||||||||||
2021 | 2022 | 2022 | ||||||||||
( ₹ in million) | ( ₹ in million) | (US dollars in million) | ||||||||||
Bank deposits 1 | 116,730 | 64,534 | 851 | |||||||||
Other investments | 165,045 | 171,398 | 2,259 | |||||||||
281,775 | 235,932 | 3,110 | ||||||||||
Bank deposits are made for periods of between three months and one year depending on the cash requirements of the companies within the Group and earn interest at the respective fixed deposit rates.
Other investments include mutual fund investments and investments in bonds which are recorded at fair value with changes in fair value reported through the consolidated statements of profit or loss. These investments do not qualify for recognition as cash and cash equivalents due to their maturity period and risk of change in value of the investments. Refer Note 25 for further details.
| 1. | Includes ₹ ₹ ₹ ₹ ₹ ₹ ₹ ₹ margin money, ₹ 0Nil and ₹ 807 million ($ 11 million) held as reserve created against principal portion on loan from banks, ₹ 4,603 million and ₹ ₹ ₹ million) held as margin money against bank guarantee as at March 31, 2021 and March 31, 2022, respectively. |
F-6
0
20. Restricted cash and cash equivalents
Restricted cash and cash equivalents consist of the following:
As at March 31, | ||||||||||||
2021 | 2022 | 2022 | ||||||||||
( ₹ in million) | ( ₹ in million) | (US dollars in million) | ||||||||||
Cash at banks 1 | 1,025 | 4,674 | 62 | |||||||||
1,025 | 4,674 | 6 2 | ||||||||||
| 1. | Cash at banks is restricted in use as it relates to unclaimed dividends of ₹ ₹ , respectively. It also includes earmarked escrow amount of₹ ₹ , respectively. |
21. Cash and cash equivalents
Cash and cash equivalents consist of the following:
As at March 31, | ||||||||||||
2021 | 2022 | 2022 | ||||||||||
( ₹ in million) | ( ₹ in million) | (US dollars in million) | ||||||||||
Cash at banks and in hand | 26,604 | 54,084 | 713 | |||||||||
Short-term deposits* | 21,933 | 32,625 | 430 | |||||||||
48,537 | 86,709 | 1,143 | ||||||||||
| * | Short-term deposits are made for periods of between one day and three months, depending on the immediate cash requirements of the respective companies, and earn interest at the respective short-term deposit rates. |
F-6
1
22. Borrowings
Current borrowings consist of:
As at March 31, | ||||||||||||
2021 | 2022 | 2022 | ||||||||||
( ₹ in million) | ( ₹ in million) | (US dollars in million) | ||||||||||
Banks and financial institutions | 36,086 | 74,215 | 978 | |||||||||
Current maturities of long-term borrowings | 153,514 | 94,729 | 1,249 | |||||||||
Current borrowings (A) | 189,600 | 168,944 | 2,227 | |||||||||
Non-current
borrowings consist of:As at March 31, | ||||||||||||
2021 | 2022 | 2022 | ||||||||||
( ₹ in million) | ( ₹ in million) | (US dollars in million) | ||||||||||
Banks and financial institutions | 359,164 | 371,525 | 4,897 | |||||||||
Non-convertible debentures | 165,923 | 79,368 | 1,046 | |||||||||
Redeemable preference shares | 19 | 19 | 0 | |||||||||
Non-convertible bonds | 1,565 | 314 | 4 | |||||||||
Others | 6,465 | 5,526 | 74 | |||||||||
Non-current borrowings | 533,136 | 456,752 | 6,021 | |||||||||
Less: Current maturities of long-term borrowings | (153,514 | ) | (94,729 | ) | (1,249 | ) | ||||||
Non-current borrowings, net of current maturities (B) | 379,622 | 362,023 | 4,772 | |||||||||
In the event VRL (together with its subsidiaries) ceases to be the Company’s majority shareholder, the Group will be required to immediately repay some of its outstanding long-term debt.
The Group’s facilities are subject to certain financial and non- financial covenants. The primary covenants which must be complied with include interest service coverage ratio, current ratio, debt service coverage ratio, total outside liabilities to total net worth, fixed assets coverage ratio, ratio of total term liabilities to net worth and debt/EBITDA, all as defined in the respective loan agreements. The Group has complied with the covenants as per the terms of the loan agreements.
Details of
Non-convertible
debentures issued by the Group have been provided below (carrying value)As at March 31, | ||||||||||||
2021 | 2022 | 2022 | ||||||||||
( ₹ in million) | ( ₹ in million) | (US dollars in million) | ||||||||||
9.20% due February-2030 | 20,000 | 20,000 | 264 | |||||||||
7.68% due December-2024 | — | 9,972 | 131 | |||||||||
9.20% due December-2022 | 7,487 | 7,494 | 99 | |||||||||
5.35% due September 2022 - ₹ ₹ | 35,163 | 28,140 | 371 | |||||||||
0.00% due September 2022 - ₹ ₹ | 1,666 | 1,064 | 14 | |||||||||
8.75% due June-2022 | 12,690 | 12,698 | 167 | |||||||||
7.50% due March-2022 | 4,927 | — | — | |||||||||
8.90% due December-2021 | 8,991 | — | — | |||||||||
8.75% due September-2021 | 2,500 | — | — | |||||||||
8.50% due April-2021 | 23,500 | — | — | |||||||||
9.18% due July-2021 | 10,000 | — | — | |||||||||
9.27% due July-2021 | 9,999 | — | — | |||||||||
8.50% due June-2021 | 16,500 | — | — | |||||||||
8.75% due April-2021 | 2,500 | — | — | |||||||||
8.55% due April-2021 | 10,000 | — | — | |||||||||
Total | 165,923 | 79,368 | 1,046 | |||||||||
F-6
2
Security Details
The Group has taken borrowings in various countries towards funding of its acquisitions, capital expenditure and working capital requirements. The borrowings comprise funding arrangements from various banks and financial institutions taken by the parent and
its
subsidiaries.As at March 31, | ||||||||||||
2021 | 2022 | 2022 | ||||||||||
( ₹ in million) | ( ₹ in million) | (US dollars in million) | ||||||||||
Secured borrowings | 487,027 | 427,902 | 5,640 | |||||||||
Unsecured borrowings | 82,195 | 103,065 | 1,359 | |||||||||
Total borrowings | 569,222 | 530,967 | 6,999 | |||||||||
The details of security provided by the Group in various countries, to various banks on the assets of the parent and its subsidiaries are as follows:
As at March 31, | ||||||||||||||
2021 | 2022 | 2022 | ||||||||||||
( ₹ in million) | ( ₹ in million) | (US dollars in million) | ||||||||||||
| Working capital loans (grouped under banks and financial institutions) | Secured by first pari passu charge on current assets of Vedanta Limited | 6,500 | — | — | ||||||||||
Secured by second pari passu charge on fixed assets of TSPL and first pari passu charge on current assets of, both present and future | 490 | 5,150 | 68 | |||||||||||
Secured by hypothecation of stock of raw materials, work-in-progress, | — | 500 | 7 | |||||||||||
| External commercial borrowings (grouped under banks and financial institutions) | The facility is secured by first pari passu charge on all movable property, plant and equipments related to power plants and aluminium smelters of BALCO located at Korba both present and future along with secured lenders | 2,188 | 756 | 10 | ||||||||||
First Pari-passu charge by way of hypothecation on the specified movable fixed assets of the Company pertaining to its manufacturing facilities comprising (i) Alumina Refinery having output of 6 MTPA along with co-generation captive power plant with an aggregate capacity of 90 MW at Lanjigarh, Odisha; (ii) Aluminium Smelter having output of 1.6 MTPA along with a 1215 (9*135) MW CPP at Jharsuguda, Odisha. | — | 11,195 | 148 | |||||||||||
The facility is secured by first pari passu charge on all movable property, plant and equipments related to power plant and aluminium smelter located at Korba both present and future along with secured lenders at BALCO | 1,686 | 377 | 5 | |||||||||||
F-6
3
As at March 31, | ||||||||||||||
2021 | 2022 | 2022 | ||||||||||||
( ₹ in million) | ( ₹ in million) | (US dollars in million) | ||||||||||||
Non-convertible debentures | Secured by the whole of the movable fixed assets of (i) Alumina Refinery having output of 1 MTPA along with co-generation captive power plant with an aggregate capacity of 90 MW at Lanjigarh, Odisha and (ii) Aluminium Smelter having output of 1.6 MTPA along with a 1,215 (9*135) MW CPP at Jharsuguda, Odisha. Additionally, secured by way of mortgage on the freehold land comprising of 18.9 acres situated at Jharsuguda, Odisha | 54,095 | 20,000 | 264 | ||||||||||
Secured by way of charge against all existing assets of FACOR | 1,670 | 1,063 | 14 | |||||||||||
Secured by way of first pari passu charge on whole of the movable fixed assets of (i) Alumina Refinery having output of 1 MTPA along with co-generation captive power plant with an aggregate capacity of 90 MW at Lanjigarh, Odisha and (ii) Aluminum Smelter having output of 1.6 MTPA along with a 1,215 (9*135) MW CPP at Jharsuguda, Odisha. Additionally, secured by way of mortgage on the freehold land comprising 85 cents situated at Tuticorin District, Tamil Nadu | — | 20,192 | 266 | |||||||||||
Secured by way of first pari-passu charge on the specific movable fixed assets. The whole of the movable fixed assets both present and future, of the Borrower in relation to the Aluminium division, comprising the following facilities: (i) 1 MTPA alumina refinery alongwith 90 MW co-generation captive power plant in Lanjigarh, Odisha; and(ii) 1.6 MTPA aluminium smelter plant along with 1215 MW (9*135 MW) power plant in Jharsuguda, Odisha. including its movable plant and machinery, capital work in progress, machinery spares, tools and accessories, and other movable fixed assets | — | 9,972 | 131 | |||||||||||
Other secured non-convertible debentures | 75,000 | — | — | |||||||||||
Term Loans (grouped under banks and financial institutions) | Secured by first pari passu charge on fixed assets of TSPL and second pari passu charge on current assets of TSPL, both present and future | 51,400 | 64,981 | 856 | ||||||||||
First pari passu charge by way of hypothecation/ equitable mortgage on the movable/ immovable assets of the Aluminium Division of Vedanta Limited comprising alumina refinery having output of 1 MTPA along with co-generation captive power plant with an aggregate capacity of 90 MW at Lanjigarh, Orissa; aluminium smelter having output of 1.6 MTPA along with a 1215 (9x135) MW CPP at Jharsuguda, Orissa, both present and future | 18,834 | 6,248 | 82 | |||||||||||
Secured by a pari passu charge by way of hypothecation of all the movable fixed assets of Vedanta Limited pertaining to its Aluminium Division project consisting of (i) Alumina Refinery having output of 1 MTPA (Refinery) along with co-generation captive power plant with an aggregate capacity of 90 MW at Lanjigarh, Orissa (Power Plant); and (ii) Aluminium Smelter having output of 1.6 MTPA along with a 1215 (9x135) MW CPP at Jharsuguda, Orissa (Smelter) (the Refinery, Power Plant and Smelter). Also, a first pari passu charge by way of equitable mortgage on the land pertaining to the mentioned project of aluminium division | 21,935 | 17,764 | 234 | |||||||||||
F-6
4
As at March 31, | ||||||||||||||
2021 | 2022 | 2022 | ||||||||||||
( ₹ in million) | ( ₹ in million) | (US dollars in million) | ||||||||||||
| Secured by a pari passu charge by way of hypothecation on the movable fixed assets of the Lanjigarh Refinery Expansion Project including 210 MW Power Project. Lanjigarh Refinery Expansion Project shall specifically exclude the 1 MTPA Alumina Refinery of Vedanta Limited along with 90 MW power plant in Lanjigarh and all its related expansions | 4,357 | 4,018 | 52 | |||||||||||
| Secured by a pari passu charge by way of hypothecation on the movable fixed assets of Vedanta Limited pertaining to its Aluminium division comprising 1 MTPA Alumina Refinery plant with 90 MW captive power plant at Lanjigarh, Odisha and 1.6 MTPA Aluminium Smelter plant with 1215 MW captive power plant at Jharsuguda, Odisha | 12,270 | 40,193 | 530 | |||||||||||
First pari passu charge by way of hypothecation/ equitable mortgage on the movable/ immovable assets of the Aluminium division of Vedanta Limited comprising Alumina Refinery having output of 1 MTPA along with co-generation captive power plant with an aggregate capacity of 90 MW at Lanjigarh, Orissa; Aluminium Smelter having output of 1.6 MTPA along with a 1215 (9x135) MW CPP at Jharsuguda, Orissa and additional charge on Lanjigarh Expansion project, both present and future | 10,922 | 9,985 | 132 | |||||||||||
| Secured by a pari passu charge by way of hypothecation/ equitable mortgage of the movable/ immovable fixed assets of Vedanta Limited pertaining to its Aluminium division comprising 1 MTPA Alumina Refinery plant with 90 MW captive power plant at Lanjigarh, Odisha and 1.6 MTPA Aluminium Smelter plant with 1215 MW captive power plant at Jharsuguda, Odisha | 28,015 | 69,184 | 912 | |||||||||||
| Secured by (i) floating charge on borrower collection account and associated permitted investments and (ii) corporate guarantee from Cairn Energy Hydrocarbons Ltd (“ CEHL”) and floating charge on collection account and current assets of CEHL | 28,100 | 16,022 | 211 | |||||||||||
| Pledge of 49% of shares and other securities and rights to any claims held by THL Zinc Limited in and against BMM | 2,198 | 453 | 6 | |||||||||||
| The facility is secured by first pari passu charge on all movable property, plant and equipments related to power plants and Aluminium Smelters of BALCO located at Korba both present and future along with secured lenders | 1,471 | 756 | 10 | |||||||||||
| Secured by first pari passu charge on all present and future movable fixed assets including but not limited to plant and machinery, spares, tools and accessories of BALCO (excluding of coal block assets) by way of a deed of hypothecation | 24,996 | 8,898 | 117 | |||||||||||
F-6
5
As at March 31, | ||||||||||||||
2021 | 2022 | 2022 | ||||||||||||
( ₹ in million) | ( ₹ in million) | (US dollars in million) | ||||||||||||
| First ranking pari passu charge by way of hypothecation/mortgage on all fixed/ immovable assets of ESL Steel Limited but excluding any current assets or pledge over any shares. | 31,341 | 27,048 | 357 | |||||||||||
| Secured by first pari passu charge by way of hypothecation of whole of the movable fixed assets of (i) Alumina Refinery having output of 1.7 to 6 MTPA along with co-generation captive power plant with an aggregate capacity of 90MW at Lanjigarh, Odisha and (ii) Aluminium Smelter having output of 1.6 MTPA along with a 1,215 (9*135) MW CPP at Jharsuguda, Odisha | 11,478 | 6,200 | 82 | |||||||||||
| First pari-passu charge on the movable fixed and current assets (except for the Concession assets) of VGCB at Visakhapatnam, Andhra Pradesh | — | 3,750 | 49 | |||||||||||
| Secured by a first pari passu charge on the identified fixed assets of the Vedanta Limited both present and future, pertaining to its Aluminium business (Jharsuguda Plant, Lanjigarh Plant), 2400 MW power plant assets at Jharsuguda, Copper Plant assets at Silvasa, Iron ore business in the states of Karnataka and Goa, dividends receivable from HZL, a subsidiary of the Vedanta Limited, and the debt service reserve account to be opened for the Facility along with the amount lying to the credit thereof # | 85,380 | 78,212 | 1,031 | |||||||||||
Other secured term loans | 6,860 | — | — | |||||||||||
Others | Secured by Fixed asset (platinum) of AvanStrate | 5,361 | 4,985 | 66 | ||||||||||
Other secured borrowings | 480 | — | — | |||||||||||
Total | 487,027 | 427,902 | 5,640 | |||||||||||
| # | During the current year, the Company executed ₹ ₹ ₹ ₹ ₹ |
F-
6
6
Movement in borrowings during the year is provided below:
Short term borrowings | Long term borrowings* | Total | Total | |||||||||||||
( ₹ in million) | ( ₹ in million) | ( ₹ in million) | (US dollars in million) | |||||||||||||
As at April 1, 2020 | 112,710 | 466,765 | 579,475 | |||||||||||||
Cash flow | (82,309 | ) | 71,300 | (11,009 | ) | |||||||||||
Other non-cash changes** | 5,768 | (4,444 | ) | 1,324 | ||||||||||||
Debt on acquisition through business combination | 80 | — | 80 | |||||||||||||
Foreign currency translation differences | (163 | ) | (485 | ) | (648 | ) | ||||||||||
As at March 31, 2021 | 36,086 | 533,136 | 569,222 | 7,503 | ||||||||||||
Cash flow | 38,869 | (78,421 | ) | (39,552 | ) | (521 | ) | |||||||||
Other non-cash changes** | (787 | ) | 1,373 | 586 | 8 | |||||||||||
Foreign currency translation differences | 47 | 664 | 711 | 9 | ||||||||||||
As at March 31, 2022 | 74,215 | 456,752 | 530,967 | 6,999 | ||||||||||||
| * | including current maturities of long-term borrowings |
| ** | Other non-cash changes comprise amortisation of borrowing costs and foreign exchange difference on borrowings. |
23. Acceptances
Acceptances consist of:
As at March 31, | ||||||||||||
2021 | 2022 | 2022 | ||||||||||
( ₹ in million) | ( ₹ in million) | (US dollars in million) | ||||||||||
Payable under trade financing arrangements | 83,711 | 110,936 | 1,462 | |||||||||
83,711 | 110,936 | 1,462 | ||||||||||
Acceptances are interest-bearing liabilities and are normally settled within a period of twelve months. These represent arrangements whereby operational suppliers are paid by financial institutions, with the Group recognising the liability for settlement with the institutions at a later date. These acceptances carry an interest ranging from 0.28% - 3.16% p.a. for facilities availed in foreign currency from offshore branches of Indian banks or foreign banks and 4.00% - 8.00% p.a. for facilities availed in rupee from domestic banks. Acceptances availed in foreign currency
a
backed by Standby Letter of Credit issued under working capital facilities sanctioned by domestic banks and part of these facilities are secured by a first pari-passu charge over the present and future current assets of the Group.re
F-
6
7
24. Trade and other payables and Other
non-current
liabilitiesAs at March 31, | ||||||||||||||||||||||||||||||||||||
2021 Non-Current | 2021 Current | 2021 Total | 2022 Non-current | 2022 Current | 2022 Total | 2022 Non-Current | 2022 Current | 2022 Total | ||||||||||||||||||||||||||||
( ₹ in million) | ( ₹ in million) | ( ₹ in million) | ( ₹ in million) | ( ₹ in million) | ( ₹ in million) | (US dollars in million) | (US dollars in million) | (US dollars in million) | ||||||||||||||||||||||||||||
Financial | ||||||||||||||||||||||||||||||||||||
Unclaimed/unpaid dividend | — | 1,014 | 1,014 | — | 1,229 | 1,229 | — | 16 | 16 | |||||||||||||||||||||||||||
Trade payables | — | 75,047 | 75,047 | — | 104,521 | 104,521 | — | 1,378 | 1,378 | |||||||||||||||||||||||||||
Amount due to related party | — | 4,130 | 4,130 | — | 1,655 | 1,655 | — | 22 | 22 | |||||||||||||||||||||||||||
Liabilities for capital expenditure | 9,365 | 70,088 | 79,453 | 9,621 | 109,981 | 119,602 | 127 | 1,450 | 1,577 | |||||||||||||||||||||||||||
Profit petroleum payable | — | 14,677 | 14,677 | — | 21,798 | 21,798 | — | 287 | 287 | |||||||||||||||||||||||||||
Security deposit and retentions | 2 | 2,223 | 2,225 | 2 | 2,374 | 2,376 | 0 | 31 | 31 | |||||||||||||||||||||||||||
Other liabilities | 847 | 38,808 | 39,655 | 1,196 | 36,103 | 37,299 | 16 | 476 | 492 | |||||||||||||||||||||||||||
| Put option liability with non-controlling interests1 | 2,633 | — | 2,633 | 2,397 | — | 2,397 | 32 | — | 32 | |||||||||||||||||||||||||||
Lease liability 3 | 1,603 | 4,808 | 6,411 | 1,504 | 3,236 | 4,740 | 20 | 43 | 63 | |||||||||||||||||||||||||||
Total – Financial | 14,450 | 210,795 | 225,245 | 14,720 | 280,897 | 295,617 | 195 | 3,703 | 3,898 | |||||||||||||||||||||||||||
Non Financial | ||||||||||||||||||||||||||||||||||||
Statutory l iabilities | — | 31,461 | 31,461 | — | 31,573 | 31,573 | — | 416 | 416 | |||||||||||||||||||||||||||
| Amount payable to owned post employment benefit trust | — | 321 | 321 | — | 334 | 334 | — | 4 | 4 | |||||||||||||||||||||||||||
Advances from customers 2 | — | 62,330 | 62,330 | 4,026 | 41,296 | 45,322 | 53 | 544 | 597 | |||||||||||||||||||||||||||
Advance from related party | — | — | — | — | 20 | 20 | — | 0 | 0 | |||||||||||||||||||||||||||
Other payables | — | 1,840 | 1,840 | — | 2,049 | 2,049 | — | 28 | 28 | |||||||||||||||||||||||||||
Total – Non Financial | — | 95,952 | 95,952 | 4,026 | 75,272 | 79,298 | 53 | 992 | 1,045 | |||||||||||||||||||||||||||
14,450 | 306,747 | 321,197 | 18,746 | 356,169 | 374,915 | 248 | 4,695 | 4,943 | ||||||||||||||||||||||||||||
Trade payables are majorly to 180 days terms.
non-interest
bearing and are normally settled upThe fair value of trade and other payables is not materially different from the carrying value presented.
| 1 | The non-controlling shareholders of ASI have an option tosell their shareholding to the Group. The option is exercisable at any time within the period of three years following the fifth anniversary of the date of shareholders’ agreement (December 22, 2017) at a price higher of₹ 52 ($ 0.757) per share and the fair market value of the share. Therefore, the liability is carried at higher of the two. Subsequent changes to the put option liability are treated asan |
| 2 | Advance from customers are contract liabilities to be settled through delivery of goods. The amount of such balances was ₹ ₹ ₹ , respectively. The Group has refunded₹ ₹ ₹ z ed revenue of₹ ₹ ₹ s ended March 31, 2020, March 31, 2021 and March 31, 2022, respectively. All other changes are either due to receipt of new advances or exchange differences. |
| 3. | Movement in lease liabilities is as follows: |
As at March 31, | ||||||||||||
2021 | 2022 | 2022 | ||||||||||
( ₹ in million) | ( ₹ in million) | (US dollars in million) | ||||||||||
As at April 1 | 6,599 | 6,411 | 84 | |||||||||
Additions during the year | 3,611 | 1,155 | 15 | |||||||||
Interest on lease liabilities | 278 | 136 | 2 | |||||||||
Payments made | (3,380 | ) | (2,318 | ) | (31 | ) | ||||||
| Disposal/adjustments | (697 | ) | (644 | ) | (7 | ) | ||||||
As at March 31 | 6,411 | 4,740 | 63 | |||||||||
F-68
25. Financial instruments
A. Financial assets and liabilities:
The following tables present the carrying value and fair value of each category of financial assets and liabilities as at March 31, 2021 and March 31, 2022.
As at March 31, 2021: | ||||||||||||||||||||||||
( ₹ in million) | ||||||||||||||||||||||||
Financial assets | Fair value through profit or loss | Fair value through other comprehensive income | Derivatives designated as hedging instruments | Amortised cost | Total carrying value | Total fair value | ||||||||||||||||||
Financial assets investments | ||||||||||||||||||||||||
—at fair value | 500 | 1,032 | — | — | 1,532 | 1,532 | ||||||||||||||||||
Other non—current assets | — | — | — | 107,515 | 107,515 | 112,534 | ||||||||||||||||||
Trade and other receivable | 1,633 | * | — | — | 95,930 | 97,563 | 97,711 | |||||||||||||||||
Short term investments | ||||||||||||||||||||||||
—Bank deposits | — | — | — | 116,730 | 116,730 | 116,730 | ||||||||||||||||||
—Other investments | 165,044 | — | — | — | 165,044 | 165,044 | ||||||||||||||||||
Financial instruments (derivatives) | 129 | — | 572 | — | 701 | 701 | ||||||||||||||||||
Cash and cash equivalents | — | — | — | 48,537 | 48,537 | 48,537 | ||||||||||||||||||
Restricted cash and cash equivalents | — | — | — | 1,025 | 1,025 | 1,025 | ||||||||||||||||||
Total | 167,306 | 1,032 | 572 | 369,737 | 538,647 | 543,814 | ||||||||||||||||||
* | Under IFRS 9, provisionally priced receivables are fair valued at each reporting date. |
As at March 31, 2021: | ||||||||||||||||||||||||
( ₹ in million) | ||||||||||||||||||||||||
Financial liabilities | Fair value through profit or loss | Derivatives designated as hedging instrument | Amortised cost | Others* | Total carrying value | Total fair value | ||||||||||||||||||
Borrowings | — | — | 569,222 | — | 569,222 | 565,941 | ||||||||||||||||||
Acceptances | — | — | 83,711 | — | 83,711 | 83,711 | ||||||||||||||||||
Trade and other payables*** | 7,066 | ** | — | 215,546 | 2,633 | 225,245 | 225,245 | |||||||||||||||||
Financial instruments (derivatives) | 933 | 2,618 | — | — | 3,551 | 3,551 | ||||||||||||||||||
Total | 7,999 | 2,618 | 868,479 | 2,633 | 881,729 | 878,448 | ||||||||||||||||||
* | Includes put option liability accounted for at fair value (Refer Note 24) |
** | Under IFRS 9, provisionally priced payables are fair valued at each reporting date. |
*** | Includes lease liability of ₹ 6,411 million. |
F-
69
As at March 31, 2022: | ||||||||||||||||||||||||||||||||
( ₹ in million) | (US dollars in million) | |||||||||||||||||||||||||||||||
Financial assets | Fair value through profit or loss | Fair value through other comprehensive income | Derivatives designated as hedging instruments | Amortised cost | Total carrying value | Total fair value | Total carrying value | Total fair value | ||||||||||||||||||||||||
Financial assets investments | ||||||||||||||||||||||||||||||||
—at fair value | 295 | 1,177 | — | — | 1,472 | 1,472 | 19 | 19 | ||||||||||||||||||||||||
| Other non-current assets | — | — | — | 92,420 | 92,420 | 94,084 | 1,218 | 1,240 | ||||||||||||||||||||||||
| Trade and other receivables | 5,206 | * | — | — | 154,565 | 159,771 | 160,771 | 2,106 | 2,119 | |||||||||||||||||||||||
Short term investments | ||||||||||||||||||||||||||||||||
—Bank deposits | — | — | — | 64,534 | 64,534 | 64,534 | 851 | 851 | ||||||||||||||||||||||||
—Other investments | 171,398 | — | — | — | 171,398 | 171,398 | 2,259 | 2,259 | ||||||||||||||||||||||||
Financial instruments (derivatives) | 101 | — | 2,479 | — | 2,580 | 2,580 | 34 | 34 | ||||||||||||||||||||||||
Cash and cash equivalents | — | — | — | 86,709 | 86,709 | 86,709 | 1,143 | 1,143 | ||||||||||||||||||||||||
Restricted cash and cash equivalents | — | — | — | 4,674 | 4,674 | 4,674 | 62 | 62 | ||||||||||||||||||||||||
Total | 177,000 | 1,177 | 2,479 | 402,902 | 583,558 | 586,222 | 7,692 | 7,727 | ||||||||||||||||||||||||
* | Under IFRS 9, provisionally priced receivables are fair valued at each reporting date. |
As at March 31, 2022: | ||||||||||||||||||||||||||||||||
( ₹ in million) | (US dollars in million) | |||||||||||||||||||||||||||||||
Financial liabilities | Fair value through profit or loss | Derivatives designated as hedging instrument | Amortised cost | Others* | Total carrying value | Total fair value | Total carrying value | Total fair value | ||||||||||||||||||||||||
Borrowings | — | — | 530,967 | — | 530,967 | 531,898 | 6,999 | 7,011 | ||||||||||||||||||||||||
Acceptances | — | — | 110,936 | — | 110,936 | 110,936 | 1,462 | 1,462 | ||||||||||||||||||||||||
| Trade and other payables*** | 10,335 | ** | 282,885 | 2,397 | 295,617 | 295,617 | 3,897 | 3,897 | ||||||||||||||||||||||||
Financial instruments (derivatives) | 1,354 | 4,011 | — | — | 5,365 | 5,365 | 71 | 71 | ||||||||||||||||||||||||
Total | 11,689 | 4,011 | 924,788 | 2,397 | 942,885 | 943,816 | 12,429 | 12,441 | ||||||||||||||||||||||||
* | Includes put option liability accounted for at fair value (Refer Note 24) |
** | Under IFRS 9, provisionally priced payables are fair valued at each reporting date. |
*** | Includes lease liability of ₹ 4,740 million ($ 63 million). |
Fair value hierarchy
The Group uses the following hierarchy for determining and disclosing the fair value of financial instruments by valuation technique:
| • | Level 1: quoted prices (unadjusted) in active markets for identical assets or liabilities |
| • | Level 2: inputs other than quoted prices included within Level 1 that are observable for the asset or liability, either directly (i.e., as prices) or indirectly (i.e., derived from prices) |
| • | Level 3: inputs for the asset or liability that are not based on observable market data (unobservable inputs) |
F-7
0
The table below summarizes the categories of financial assets and liabilities as at March 31, 2021 and March 31, 2022 measured at fair value:
As at March 31, 2021 | (Level 1) | (Level 2) | (Level 3) | |||||||||
( ₹ in million) | ||||||||||||
Financial assets | ||||||||||||
At fair value through profit or loss | ||||||||||||
— Investments | 63,183 | 101,861 | 500 | |||||||||
— Derivatives financial assets | — | 129 | — | |||||||||
— Trade and other receivables | — | 1,633 | — | |||||||||
At fair value through other comprehensive income | ||||||||||||
— Financial asset investments held at fair value | 925 | — | 107 | |||||||||
Derivatives designated as hedging instruments | ||||||||||||
— Derivatives financial assets | — | 572 | — | |||||||||
64,108 | 104,195 | 607 | ||||||||||
Financial liabilities | ||||||||||||
At fair value through profit or loss | ||||||||||||
—Derivatives financial liabilities | — | 933 | — | |||||||||
Trade payable | — | 7,066 | — | |||||||||
Derivatives designated as hedging instruments | ||||||||||||
—Derivatives financial liabilities | — | 2,618 | — | |||||||||
Trade and other payables- Put option liability with non controlling interest (Refer Note 24) | — | — | 2,633 | |||||||||
— | 10,617 | 2,633 | ||||||||||
As at March 31, 2022 | (Level 1) | (Level 2) | (Level 3) | (Level 1) | (Level 2) | (Level 3) | ||||||||||||||||||
( ₹ in million) | (US dollars in million) | |||||||||||||||||||||||
Financial assets | ||||||||||||||||||||||||
At fair value through profit or loss | ||||||||||||||||||||||||
— Investments | 72,072 | 99,326 | 295 | 950 | 1,309 | 4 | ||||||||||||||||||
— Derivatives financial assets | — | 101 | — | — | 1 | — | ||||||||||||||||||
— Trade and other receivables | — | 5,206 | — | — | 69 | — | ||||||||||||||||||
At fair value through other comprehensive income | ||||||||||||||||||||||||
— Financial asset investments held at fair value | 1,070 | — | 107 | 14 | — | 1 | ||||||||||||||||||
Derivatives designated as hedging instruments | ||||||||||||||||||||||||
— Derivatives financial assets | — | 2,479 | — | — | 33 | — | ||||||||||||||||||
73,142 | 107,112 | 402 | 964 | 1,412 | 5 | |||||||||||||||||||
Financial liabilities | ||||||||||||||||||||||||
At fair value through profit or loss | ||||||||||||||||||||||||
—Derivatives financial liabilities | — | 1,354 | — | — | 18 | — | ||||||||||||||||||
Trade payable | — | 10,335 | — | — | 136 | — | ||||||||||||||||||
Derivatives designated as hedging instruments | ||||||||||||||||||||||||
—Derivatives financial liabilities | — | 4,011 | — | — | 53 | — | ||||||||||||||||||
| Trade and other payables- Put option liability with non controlling interest (Refer Note 24) | — | — | 2,397 | — | — | 32 | ||||||||||||||||||
— | 15,700 | 2,397 | — | 207 | 32 | |||||||||||||||||||
F-7
1
The table below summarizes the fair value of trade receivables, other
non-current
assets and borrowings which are carried at amortised cost as at March 31, 2020 and March 31, 2021:As at March 31, 2021 | (Level 2) | |||
( ₹ in million) | ||||
Financial Assets | ||||
-Other non-current assets* | 112,534 | |||
| -Trade and other receivables* | 97,711 | |||
210,245 | ||||
Financial Liabilities | ||||
- Borrowings | 565,941 | |||
565,941 | ||||
As at March 31, 2022 | ||||||||
(Level 2) | (Level 2) | |||||||
( ₹ in million) | (US dollars in million) | |||||||
Financial Assets | ||||||||
-Other non-current assets* | 94,084 | 1,240 | ||||||
| -Trade and other receivables* | 160,771 | 2,119 | ||||||
254,855 | 3,359 | |||||||
Financial Liabilities | ||||||||
-Borrowings | 531,898 | 7,011 | ||||||
531,898 | 7,011 | |||||||
| * | Refer N ote 35(b) |
The fair value of the financial assets and liabilities are at the amount that would be received to sell an asset and paid to transfer a liability in an orderly transaction between market participants at the measurement date. The following methods and assumptions were used to estimate the fair values:
| • | Investments traded in active markets are determined by reference to quotes from the financial institutions; for example: Net asset value (NAV) for investments in mutual funds declared by mutual fund house. For other listed securities traded in markets which are not active, the quoted price is used wherever the pricing mechanism is same as for other marketable securities traded in active markets. Other current investments are valued by referring to market inputs including quotes, trades, poll, primary issuances for securities and /or underlying securities issued by the same or similar issuer for similar maturities and movement in benchmark security, etc. |
| • | Financial assets forming part of cash and cash equivalents (including restricted cash and cash equivalents), bank deposits, financial liabilities forming part of trade and other payables, acceptances and short-term borrowings being carried at amortised cost. The fair value approximate their carrying amounts largely due to the short-term maturities of these instruments. |
| • | Non-current fixed-rate and variable-rate borrowings: Fair value has been determined by the Group based on parameters such as interest rates, specific country risk factors, and the risk characteristics of the financed project. |
| • | Quoted financial asset investments: Fair value is derived from quoted market prices in active markets. |
| • | Unquoted financial asset investments: Fair value of unquoted securities are determined by reference to discounted cash flows model. |
| • | Derivative financial assets/liabilities: The Group executes derivative financial instruments with various counterparties. Interest rate swaps, foreign exchange forward contracts and commodity forward contracts are valued using valuation techniques, which employ the use of market observable inputs. The most frequently applied valuation techniques by the Group include forward pricing and swap models using present value calculations. The models incorporate various inputs including the foreign exchange spot and forward rates, yield curves of the respective currencies, currency basis spreads between the respective currencies, interest rate curves and forward rate curves of the underlying commodity. Commodity contracts are valued using the forward LME rates of commodities actively traded on the listed metal exchange, i.e., London Metal Exchange, United Kingdom (UK). |
| • | Other non-current financial liabilities: Fair value is calculated using a discounted cash flow model with market assumptions, unless the carrying value is considered to approximate to fair value. |
For all other financial instruments, the carrying amount is either the fair value or approximates the fair value.
The changes in counterparty credit risk had no material effect on the hedge effectiveness assessment for derivatives designated in hedge relationship and the value of other financial instruments recognised at fair value.
The estimated fair value amounts as at March 31, 2021 and March 31, 2022 have been measured as at that date. As such, the fair values of these financial instruments subsequent to reporting date may be different than the amounts reported at each
year-end.
F-7
2
There were 0 significant transfers between level 1, level 2 and level 3 during the current year.
Risk management framework
The Group’s businesses are subject to several risks and uncertainties including financial risks.
The Group’s documented risk management polices act as an effective tool in mitigating the various financial risks to which the businesses are exposed to in the course of their daily operations. The risk management policies cover areas such as liquidity risk, commodity price risk, foreign exchange risk, interest rate risk, counterparty credit risk and capital management.
Risks are identified at both the corporate and individual subsidiary level with active involvement of senior management. Each operating subsidiary in the Group has in place risk management processes which are in line with the Group’s policy. Each significant risk has a designated ‘owner’ within the Group at an appropriate senior level. The potential financial impact of the risk and its likelihood of a negative outcome are regularly updated.
The risk management process is coordinated by the Management Assurance function and is regularly reviewed by the Group’s Audit Committee. The Audit Committee is aided by the other committees of the Board including the Risk Management Committee, which meets regularly to review risks as well as the progress against the planned actions. Key business decisions are discussed at the periodic meetings of the Executive Committee. The overall internal control environment and risk management programme including financial risk management is reviewed by the Audit Committee on behalf of the Board.
The risk management framework aims to:
| • | improve financial risk awareness and risk transparency |
| • | identify, control and monitor key risks |
| • | identify risk accumulations |
| • | provide management with reliable information on the Group’s risk situation |
| • | improve financial returns |
Treasury management
Treasury management focuses on liability management, capital protection, liquidity maintenance and yield maximization. The treasury policies are approved by the Board. Daily treasury operations of the subsidiary companies are managed by their respective finance teams within the framework of the overall Group treasury policies. Long-term fund raising, including strategic treasury initiatives, are managed jointly by the business treasury team and the central team at corporate treasury while short-term funding for routine working capital requirements is delegated to subsidiary companies. A monthly reporting system exists to inform senior management of investments and debt position, exposure to currency, commodity and interest rate risk and their mitigants including the derivative position. The Group has adequate system of internal control which enables effective monitoring of adherence to Group’s policies. The internal control measures are effectively supplemented by regular internal audits.
The Group uses derivative instruments to manage the exposure in foreign currency exchange rates, interest rates and commodity prices. The Group does not acquire or issue derivative financial instruments for trading or speculative purposes. The Group does not enter into complex derivative transactions to manage the treasury and commodity risks. Both treasury and commodities derivative transactions are normally in the form of forward contracts, interest rate and currency swaps and these are in line with the Group’s policies.
Commodity price risk
The Group is exposed to the movement of base metal commodity prices on the London Metal Exchange. Any decline in the prices of the base metals that the Group produces and sells will have an immediate and direct impact on the profitability of the businesses. As a general policy, the Group aims to sell the products at prevailing market prices. The commodity price risk in import of input commodity such as Copper Concentrate & Alumina, for our copper and aluminium business, is hedged on
back-to
back basis ensuring no price risk for the business. Hedging is used primarily as a risk management tool and, in some cases, to secure future cash flows in cases of high volatility by entering into forward contracts or similar instruments. The hedging activities are subject to strict limits set out by the Board and to a strictly defined internal control and monitoring mechanism. Decisions relating to hedging of commodities are taken at the Executive Committee level, basis clearly laid down guidelines.Whilst the Group aims to achieve average LME prices for a month or a year, average realised prices may not necessarily reflect the LME price movements because of a variety of reasons such as uneven sales during the year and timing of shipments.
The Group is also exposed to the movement of international crude oil price and the discount in the price of Rajasthan crude oil to Brent price.
F-7
3
Financial instruments with commodity price risk are entered into in relation to following activities:
| • | economic hedging of prices realised on commodity contracts |
| • | cash flow hedging of revenues, forecasted highly probable transactions |
Aluminum
The requirement of the primary raw material, alumina, is partly met from own sources and the rest is purchased primarily on negotiated price terms. Sales prices are linked to the LME prices. At present, the Group, on selective basis hedges the aluminium content in outsourced alumina to protect its margins.
The Group also executes hedging arrangements for its aluminium sales to realise average month of sale LME prices.
Copper
The Group’s custom smelting copper operations at Tuticorin is benefitted by a natural hedge except to the extent of a possible mismatch in quotational periods between the purchase of concentrate and the sale of finished copper. The Group’s policy on custom smelting is to generate margins from Treatment charges/Refining charges or “Tc/Rc”, improving operational efficiencies, minimising conversion cost, generating a premium over LME on sale of finished copper, sale of
by-products
and from achieving import parity on domestic sales. Hence, mismatches in quotational periods are managed to ensure that the gains or losses are minimised. The Group hedges this variability of LME prices through forward contracts and tries to make the LME price a pass-through cost between purchases of copper concentrate and sales of finished products, both of which are linked to the LME price.Tc/Rcs are a major source of income for the Indian copper smelting operations. Fluctuations in Tc/Rcs are influenced by factors including demand and supply conditions prevailing in the market for mine output. The Group’s copper business has a strategy of securing a majority of its concentrate feed requirement under long-term contracts with mines.
Zinc, Lead and Silver
The sales prices are linked to the LME prices. The Group also executes hedging arrangements for its Zinc, Lead and Silver sales to realise average month of sale LME prices. In exceptional circumstances, the Group may enter into strategic hedging with prior approval of the Board.
Zinc International
Raw material for zinc and lead is mined in South Africa with sales prices linked to the LME prices.
Iron ore
The Group sells its Iron Ore production from Goa on the prevailing market prices and from Karnataka through
e-auction
route as mandated by the State Government of Karnataka in India.Oil and gas
The prices of various crude oils are based upon the price of the key physical benchmark crude oil such as Dated Brent, West Texas Intermediate, and Dubai/Oman, etc. The crude oil prices move based upon market factors like supply and demand. The regional producers price their crude basis these benchmavrk crude with a premium or discount over the benchmark based upon quality differential and competitiveness of various grades. The Group has started hedging variability of crude price for part of the volume through forward contracts.
Natural gas markets are evolving differently in important geographical markets. There is no single global market for natural gas. This could be owing to difficulties in large-scale transportation over long distances as compared to crude oil. Globally, there are three main regional hubs for pricing of natural gas, which are USA (Henry Hub Prices), UK (NBP Price) and Japan (imported gas price, mostly linked to crude oil).
Provisionally priced financial instruments
The value of net financial liabilities linked to commodities (excluding derivatives) accounted for on provisional prices was 5,440 million and 5,129 million ($ 70 million) as at March 31, 2021 and March 31, 2022
₹
₹
,
respectively. These instruments are subject to price movements at the time of final settlement and the final price of these instruments will be determined in the financial year beginning April 1, 2022.F-
7
4
Set out below is the impact of 10% increase in LME prices on
pre-tax
profit/(loss) for the year andpre-tax
equity as a result of changes in the value of the Group’s commodity financial instruments:For the year ended March 31, 2021 | ( ₹ in million) | |||||||||||
Total exposure | Effect on pre-tax profit/(loss) of a 10% increase in the LME | Effect on pre-tax equity of a 10% increase in the LME | ||||||||||
Copper | (10,016 | ) | (1,002 | ) | — | |||||||
For the year ended March 31, 2022 | ( ₹ in million) | |||||||||||
Total exposure | Effect on pre-tax profit/(loss) of a 10% increase in the LME | Effect on pre-tax equity of a10% increase in the LME | ||||||||||
Copper | (8,304 | ) | (830 | ) | — | |||||||
For the year ended March 31, 2022 | (US dollars in million) | |||||||||||
Total exposure | Effect on pre-tax profit/(loss) of a 10% increase in the LME | Effect on pre-tax equity of a10% increase in the LME | ||||||||||
Copper | (109 | ) | (11 | ) | — | |||||||
The above sensitivities are based on volumes, costs, exchange rates and other variables and provide the estimated impact of a change in LME prices on profit and equity assuming that all other variables remain constant. A 10% decrease in LME prices would have an equal and opposite effect on the Group’s financial statements.
The impact on 874 million loss and 1,295 million loss ($ 17 million loss) for the year
pre-tax
profit/(loss) mentioned above includes the impact of a 10% increase in closing copper LME for provisionally priced copper concentrate purchased at Copper division custom smelting operations in India of₹
₹
s
ended March 31, 2021 and March 31, 2022,
respectively, which isa
pass through in nature and as such will not have any impact on the profitability.Financial risk
The Group’s Board approve
s
financial risk policies include monitoring, measuring and mitigating the liquidity, currency, interest rate and counterparty risk. The Group does not engage in speculative treasury activity but seeks to manage risk and optimize interest and commodity pricing through proven financial instruments.(a) Liquidity
The Group requires funds both for short-term operational needs as well as for long-term investment programmes mainly in growth projects. The Group generates sufficient cash flows from the current operations which together with the available cash and cash equivalents short-term investments and structured investment net of deferred consideration payable for such investments provide liquidity both in the short-term as well as in the long-term.
Anticipated future cash flows, together with undrawn fund based committed facilities of 141,020 million ($ 1,859 million), and cash and short-term investments of 327,315 million ($ 4,315 million) as at March 31, 2022, are expected to be sufficient to meet the liquidity requirement of the Group in the near future.
₹
₹
The Group has been rated by CRISIL Limited (CRISIL) and India Ratings and Research Private Limited (India Rating) for its capital market issuance in the form of CPs and NCDs and for its banking facilities in line with Basel II norms.
CRISIL after revising the outlook to ‘Positive’ from ‘Stable’ in October 2021, upgraded its rating on the long-term bank facilities and debt instruments of Vedanta Limited to ‘CRISIL AA’ from ‘CRISIL
AA-’
in February 2022. The outlook on ratings was also revised to ‘Stable’ from ‘Positive’. The short-term rating on bank facilities and commercial paper has been reaffirmed at ‘CRISIL A1+’. The upward rating action factors in stronger-than-expected operating profitability, driven by elevated commodity prices during fiscal year 2022, volume growth across businesses, and sustained cost efficiency, especially in the Aluminium business.India Rating also upgraded Vedanta Limited’s long term issuer ratings to “IND AA” from “IND
AA-“with
stable outlook on March 29, 2022. The rating upgrade reflects the Group’s continuous deleveraging and India ratings’ expectation of an improvement in the consolidated operational cash flow in financial year 2021-22 and financial year 2022-23, following a significant increase in the operating profitability, led by high metal prices partly offset by raw material input inflation.The Group remains committed to maintaining a healthy liquidity, a low gearing ratio and deleveraging and strengthening Group’s balance sheet
.
F-
7
5
The maturity profile of the Group’s financial liabilities based on the remaining period from the balance sheet date to the contractual maturity date is given in the table below. The figures reflect the contractual undiscounted cash obligation of the Group:
As at March 31, 2021 Payment due by year | <1 year | 1 - 3 years | 3 - 5 years | >5 years | Total | |||||||||||||||
( ₹ in million) | ||||||||||||||||||||
Acceptances* | 84,201 | — | — | — | 84,201 | |||||||||||||||
Lease Liability* | 4,808 | 601 | 220 | 782 | 6,411 | |||||||||||||||
Trade and other payables** | 195,508 | 11,153 | 0 | — | 206,661 | |||||||||||||||
Bank and other borrowings*** | 234,645 | 220,879 | 116,726 | 155,035 | 727,285 | |||||||||||||||
Derivative financial liabilities | 2,786 | 764 | — | — | 3,550 | |||||||||||||||
521,948 | 233,397 | 116,946 | 155,817 | 1,028,108 | ||||||||||||||||
| * | Includes committed interest payments |
| ** | Includes both Non-current and current financial liabilities and committed interest payment, as applicable. Excludes interest accrued on borrowings. |
| *** | Includes Non-current borrowings, current borrowings, committed interest payments on borrowings and interest accrued on borrowings. |
As at March 31, 2022 Payment due by year | <1 year | 1 - 3 years | 3 - 5 years | >5 years | Total | |||||||||||||||
( ₹ in million) | ||||||||||||||||||||
Acceptances* | 111,654 | — | — | — | 111,654 | |||||||||||||||
Lease Liability* | 3,236 | 1,131 | 86 | 287 | 4,740 | |||||||||||||||
Trade and other payables** | 275,553 | 11,511 | 0 | — | 287,064 | |||||||||||||||
Bank and other borrowings*** | 190,479 | 181,905 | 131,026 | 116,541 | 619,951 | |||||||||||||||
Derivative financial liabilities | 5,308 | 57 | — | — | 5,365 | |||||||||||||||
586,230 | 194,604 | 131,112 | 116,828 | 1,028,774 | ||||||||||||||||
US dollars in million | 7,727 | 2,565 | 1,728 | 1,540 | 13,560 | |||||||||||||||
| * | Includes committed interest payments |
| ** | Includes both Non-current and current financial liabilities and committed interest payment, as applicable. Excludes interest accrued on borrowings. |
| *** | Includes Non-current borrowings, current borrowings, committed interest payments on borrowings and interest accrued on borrowings. |
The Group had access to following funding facilities:
As at March 31, 2021 | ||||||||||||
Funding facility | Total facility | Drawn | Un drawn | |||||||||
( ₹ in million) | ( ₹ in million) | ( ₹ in million) | ||||||||||
Fund/ Non-fund based | 727,522 | 562,322 | 165,200 | |||||||||
As at March 31, 2022 | ||||||||||||
Funding facility | Total facility | Drawn | Un drawn | |||||||||
( ₹ in million) | ( ₹ in million) | ( ₹ in million) | ||||||||||
Fund/ Non-fund based | 811,810 | 642,266 | 169,545 | |||||||||
As at March 31, 2022 | ||||||||||||
Funding facility | Total facility | Drawn | Un draw | |||||||||
(US dollars in million) | (US dollars in million) | (US dollars in million) | ||||||||||
Fund/ Non-fund based | 10,700 | 8,465 | 2,235 | |||||||||
F-
7
6
Collateral
The Group has pledged financial instruments with carrying amount of 219,900 million and 271,943 million ($ 3,584 million) as at March 31, 2021 and March 31, 2022 76,541 million and 114,663 million ($ 1,511 million) as at March 31, 2021 and March 31, 2022
₹
₹
,
respectively,
and inventories with carrying amount of₹
₹
,
respectively,
as per the requirements specified in various financial facilities in place. The counterparties have an obligation to release the securities to the Group when financial facilities are surrendered.(b) Foreign currency risk
Fluctuations in foreign currency exchange rates may have an impact on the consolidated statements of profit or loss, the consolidated statements of change in equity and consolidated statements of cash flows where any transaction references more than one currency or where assets/liabilities are denominated in a currency other than the functional currency of the respective consolidated entities.
Considering the countries and economic environment in which the Group operates, its operations are subject to risks arising from the fluctuations primarily in the US dollar, Australian dollar, Namibian dollar, AED, ZAR, GBP, INR, JPY and Euro against the functional currencies of its Group.
Exposures on foreign currency loans are managed through the Group wide hedging policy, which is reviewed periodically to ensure that the results from fluctuating currency exchange rates are appropriately managed. The Group strives to achieve asset, liability offset of foreign currency exposures and only the net position is hedged.
The Group’s presentation currency is Indian Rupee. The majority of the assets are located in India and the Indian Rupee is the functional currency for the Indian operating subsidiaries except for Oil and Gas business. Natural hedges available in the business are identified at each entity level and hedges are placed only for the net exposure. Short-term net exposures are hedged progressively based on their maturity. A more conservative approach has been adopted for project expenditures to avoid budget overruns, where cost of the project is calculated taking into account the hedge cost. The hedge mechanisms are reviewed periodically to ensure that the risk from fluctuating currency exchange rates is appropriately managed.
The following analysis is based on the gross exposure as at the reporting date which could affect the consolidated statements of profit or loss. The exposure summarised below is mitigated by some of the derivative contracts entered into by the Group as disclosed under the section on “Derivative financial instruments”
The carrying amount of the Group’s financial assets and liabilities in different currencies are as follows:
As at March 31, 2021 | As at March 31, 2022 | As at March 31, 2022 | ||||||||||||||||||||||
Financial assets | Financial liabilities | Financial assets | Financial liabilities | Financial assets | Financial liabilities | |||||||||||||||||||
( ₹ in million) | ( ₹ in million) | ( ₹ in million) | ( ₹ in million) | (US dollars in million) | (US dollars in million) | |||||||||||||||||||
INR | 402,393 | 636,589 | 391,701 | 646,234 | 5,163 | 8,518 | ||||||||||||||||||
USD | 128,023 | 219,817 | 178,857 | 264,636 | 2,357 | 3,488 | ||||||||||||||||||
Others | 8,231 | 25,187 | 13,000 | 32,015 | 172 | 422 | ||||||||||||||||||
Total | 538,647 | 881,593 | 583,558 | 942,885 | 7,692 | 12,428 | ||||||||||||||||||
The Group’s exposure to foreign currency arises where a Group company holds monetary assets and liabilities denominated in a currency different to the functional currency of that entity, with USD (US Dollar) being the major
non-functional
currency of the Group’s main operating subsidiaries.The foreign exchange rate sensitivity is calculated by the aggregation of the net foreign exchange rate exposure with a simultaneous parallel foreign exchange rates shift in the currencies by 10 % against the functional currencies of the respective entities.
F-
7
7
Set out below is the impact of a 10% strengthening in the functional currencies of the respective entities on
pre-tax
profit/(loss) andpre-tax
equity arising as a result of the revaluation of the Group’s foreign currency monetary financial assets/liabilities:For the year ended March 31, 2021 | Effect of 10% strengthening of functional currency on pre-tax profit/(loss) | Effect of 10% strengthening of foreign currency on equity (pre-tax) | ||||||
( ₹ in million) | ( ₹ in million) | |||||||
USD | 11,325 | — | ||||||
INR | (3,072 | ) | — | |||||
For the year ended March 31, 2022 | Effect of 10% strengthening of functional currency on pre-tax profit/(loss) | Effect of 10% strengthening of foreign currency on equity (pre-tax) | Effect of 10% strengthening of functional currency on pre-tax profit/(loss) | Effect of 10% strengthening of foreign currency on equity (pre-tax) | ||||||||||||
( ₹ in million) | ( ₹ in million) | (US dollars in million) | (US dollars in million) | |||||||||||||
USD | 9,116 | — | 120 | — | ||||||||||||
INR | (4,522 | ) | — | (60 | ) | — | ||||||||||
A 10% weakening of the functional currencies of respective businesses would have an equal and opposite effect on the Group’s financial statements.
(c) Interest rate risk
The Group’s net debt of 243,084 million and 208,486 million ($ 2,748 million) as at March 31, 2021 and March 31, 2022 569,222 million and 530,967 million ($ 6,999 million) as at March 31, 2021 and March 31, 2022 326,138 million (net of deferred consideration payable for such investments) and 322,481 million ($ 4,250 million) as at March 31, 2021 and March 31, 2022
₹
₹
,
respectively, comprises debt of₹
₹
,
respectively, offset by cash, cash equivalents, short term investments of₹
₹
,
respectively.The Group is exposed to interest rate risk on short-term and long-term floating rate instruments and on the refinancing of fixed rate debt. The Group’s policy is to maintain a balance of fixed and floating interest rate borrowings and the proportion of fixed and floating rate debt is determined by current market interest rates.
The borrowings of the Group are principally denominated in Indian Rupees and US dollars with mix of fixed and floating rates of interest. The USD floating rate debt is linked to US dollar LIBOR and INR floating rate debt to Bank’s base rate. The Group has a policy of selectively using interest rate swaps, option contracts and other derivative instruments to manage its exposure to interest rate movements. These exposures are reviewed by appropriate levels of management on a monthly basis.
The Group invests cash and liquid investments in short-term deposits and debt mutual funds, some of which generate a
tax-free
return, to achieve the Group’s goal of maintaining liquidity, carrying manageable risk and achieving satisfactory returns.Floating rate financial assets are largely mutual fund investments which have debt securities as underlying assets. The returns from these financial assets are linked to market interest rate movements; however, the counterparty invests in the agreed securities with known maturity tenure and return and hence has manageable risk.
The exposure of the Group’s financial assets as at March 31, 2021 to interest rate risk is as follows:
Floating rate financial assets | Fixed rate financial assets | Non-interest bearing financial assets | Total financial assets | |||||||||||||
( ₹ in million) | ( ₹ in million) | ( ₹ in million) | ( ₹ in million) | |||||||||||||
Financial assets | 312,971 | 374,148 | 208,705 | 895,824 | ||||||||||||
312,971 | 374,148 | 208,705 | 895,824 | |||||||||||||
The exposure of the Group’s financial liabilities as at March 31, 2021 to interest rate risk is as follows:
Floating rate financial liabilities | Fixed rate financial liabilities | Non-interest bearing financial liabilities | Total financial liabilities | |||||||||||||
( ₹ in million) | ( ₹ in million) | ( ₹ in million) | ( ₹ in million) | |||||||||||||
Financial liabilities | 322,843 | 329,629 | 229,121 | 881,593 | ||||||||||||
322,843 | 329,629 | 229,121 | 881,593 | |||||||||||||
F-
7
8
The exposure of the Group’s financial assets as at March 31, 2022 to interest rate risk is as follows:
Floating rate financial assets | Fixed rate financial assets | Non-interest bearing financial assets | Total financial assets | |||||||||||||
( ₹ in million) | ( ₹ in million) | ( ₹ in million) | ( ₹ in million) | |||||||||||||
Financial assets | 91,124 | 245,756 | 246,679 | 583,558 | ||||||||||||
91,124 | 245,756 | 246,679 | 583,558 | |||||||||||||
(US dollars in million) | 1,201 | 3,239 | 3,252 | 7,692 | ||||||||||||
The exposure of the Group’s financial liabilities as at March 31, 2022 to interest rate risk is as follows:
Floating rate financial liabilities | Fixed rate financial liabilities | Non-interest bearing financial liabilities | Total financial liabilities | |||||||||||||
( ₹ in million) | ( ₹ in million) | ( ₹ in million) | ( ₹ in million) | |||||||||||||
Financial liabilities | 355,778 | 299,870 | 287,237 | 942,885 | ||||||||||||
355,778 | 299,870 | 287,237 | 942,885 | |||||||||||||
(US dollars in million) | 4,689 | 3,952 | 3,787 | 12,428 | ||||||||||||
Considering the net debt position as at March 31, 2022 and the investment in bank deposits, corporate bonds and debt mutual funds, any increase in interest rates would result in a net loss and any decrease in interest rates would result in a net gain. The sensitivity analysis below has been determined based on the exposure to interest rates for financial instruments at the balance sheet date.
The table below illustrates the impact of a 0.5% to 2.0% movement in interest rates on floating rate financial assets/ liabilities (net) on profit/(loss) and equity assuming that the changes occur at the reporting date and has been calculated based on risk exposure outstanding as of date. The year end balances are not necessarily representative of the average debt outstanding during the year. This analysis also assumes that all other variables, in particular foreign currency rates, remain constant.
Increase in interest rates Year ended March 31 , | ||||||||||||
2021 | 2022 | 2022 | ||||||||||
( ₹ in million) | ( ₹ in million) | (US dollars in million) | ||||||||||
0.50% | (1,048) | (1,323) | (17) | |||||||||
1.00% | (2,095) | (2,647) | (35) | |||||||||
2.00% | (4,191) | (5,293) | (70) | |||||||||
An equivalent reduction in interest rates would have an equal and opposite effect on the Group’s financial statements.
(d) Credit risk
Credit risk refers to the risk that counterparty will default on its contractual obligations resulting in financial loss to the Group. The Group has adopted a policy of only dealing with creditworthy counterparties and obtaining sufficient collateral, where appropriate, as a means of mitigating the risk of financial loss from defaults.
The Group is exposed to credit risk from trade receivables, contract assets, cash and cash equivalents, short term investments and other financial instruments.
Credit risk on receivables is limited as almost all credit sales are against letters of credit and guarantees of banks of national standing. Moreover, given the diverse nature of the Group’s businesses
,
trade receivables are spread over a number of customers with no significant concentration of credit risk. The history of trade receivables shows a negligible provision for bad and doubtful debts. Therefore, the Group does not expect any material risk on account ofnon-performance
by any of the Group’s counterparties. With respect to loans to related parties, as described inN
ote 35(b), credit risk is adequately considered and no deterioration has happened or is expected to happen in the credit profile of the borrowers since the grant of the loans. Accordingly, the Group does not foresee any significant credit risk with respect to such loans.F-
79
The
Group has clearly defined policies to mitigate counterparty risks. For short-term investments, counterparty limits are in place to limit the amount of credit exposure to any one counterparty. This, therefore, results in diversification of credit risk for
the Group’s
mutual fund and bond investments. For derivative and financial instruments, the Group attempts to limit the credit risk by only dealing with reputable banks and financial institutions.The carrying value of the financial assets represents the maximum credit exposure. The Group’s maximum exposure to credit risk as at March 31, 2021 and March 31, 2022 is 538,647 million and 583,558 million ($ 7,692 million)
₹
₹
,
respectively.The maximum credit exposure on financial guarantees given by the Group for various financial facilities is described in Note 33 on “Commitments, contingencies, and guarantees”.
None of the Group’s cash equivalents, including time deposits with banks, are past due or impaired. Regarding trade and other receivables, and other
non-current
assets, there were no indications as at the year end that defaults in payment obligations will occur except as described in movement in allowance for impairment for financial assets given below.Of the year end trade and other receivables, the following are expected to be realised in the normal course of business and hence not considered impaired:
As at March 31 | 2021 | 2022 | 2022 | |||||||||
( ₹ in million) | ( ₹ in million) | (US dollars in million) | ||||||||||
| Neither impaired nor past due | 134,386 | 158,314 | 2,087 | |||||||||
Past due but not impaired | ||||||||||||
| Due Less than 1 month | 6,116 | 21,085 | 278 | |||||||||
| Due Between 1 - 3 months | 2,763 | 3,694 | 49 | |||||||||
| Due Between 3 - 12 months | 8,419 | 3,904 | 51 | |||||||||
| Due Greater than 12 months | 44,016 | 52,894 | 697 | |||||||||
195,700 | 239,891 | 3,162 | ||||||||||
Receivables are deemed to be past due or impaired with reference to the Group’s normal terms and conditions of business. These terms and conditions are determined on a case to case basis with reference to the customer’s credit quality and prevailing market conditions. Receivables that are classified as ‘past due’ in the above table are those that have not been settled within the terms and conditions that have been agreed with that customer.
The credit quality of the Group’s customers is monitored on an ongoing basis. Where receivables have been impaired, the Group actively seeks to recover the amounts in question and enforce compliance with credit terms.
Movement in allowances for Financial Assets (trade and other receivables and other
non-current
assets)Movements for the year ended March 31, | 2021 | 2022 | 2022 | |||||||||
( ₹ in million) | ( ₹ in million) | (US dollars in million) | ||||||||||
As at April 1, | 13,050 | 15,333 | 202 | |||||||||
| Allowance made during the year | 2,969 | 2101 | 28 | |||||||||
| Reversals during the year | (592 | ) | (1 | ) | (0 | ) | ||||||
| Exploration cost written off | 22 | — | — | |||||||||
| Foreign Exchange difference | (116 | ) | 140 | 2 | ||||||||
As at March 31, | 15,333 | 17,573 | 232 | |||||||||
Derivative financial instruments
The Group uses derivative instruments as part of its management of exposure to fluctuations in foreign currency exchange rates, interest rates and commodity prices. The Group does not acquire or issue derivative financial instruments for trading or speculative purposes. The Group does not enter into complex derivative transactions to manage the treasury and commodity risks. Both treasury and commodities derivative transactions are normally in the form of forward contracts and these are subject to the Group guidelines and policies.
The fair values of all derivatives are separately recorded in the consolidated statements of financial position within current and
non-current
assets and liabilities. Derivatives that are designated as hedges are classified as current ornon-current
depending on the maturity of the derivative.F-8
0
The use of derivatives can give rise to credit and market risk. The Group tries to control credit risk as far as possible by only entering into contracts with reputable banks and financial institutions. The use of derivative instruments is subject to limits, authorities and regular monitoring by appropriate levels of management. The limits, authorities and monitoring systems are periodically reviewed by management and the Board. The market risk on derivatives is mitigated by changes in the valuation of the underlying assets, liabilities or transactions, as derivatives are used only for risk management purposes.
Cash flow hedges
The Group enters into forward exchange and commodity price contracts for hedging highly probable forecast transaction and accounts for them as cash flow hedges and states them at fair value. Subsequent changes in fair value are recognized in the consolidated statements of comprehensive income until the hedged transaction occurs, at which time, the respective gain or losses are reclassified to the consolidated statements of profit or loss. These hedges have been effective for the year ended March 31, 2021 and March 31, 2022.
The Group uses foreign exchange contracts from time to time to optimize currency risk exposure on its foreign currency transactions. The Group hedged part of its foreign currency exposure on capital commitments during the year ended 2022. Fair value changes on such forward contracts are recognized in the consolidated statements of comprehensive income.
The majority of cash flow hedges taken out by the Group during the year comprise
non-derivative
hedging instruments for hedging the foreign exchange rate of highly probable forecast transactions and commodity price contracts for hedging the commodity price risk of highly probable forecast transactions.The cash flows related to these hedges are expected to occur during the year ended March 31, 2023 and consequently may impact the consolidated statements of profit or loss for that year depending upon the change in the commodity prices and foreign exchange rates movements. For cash flow hedges regarded as basis adjustments to initial carrying value of the property, plant and equipment, the depreciation on the basis adjustments made is expected to affect the consolidated statements of profit or loss over the expected useful life of the property, plant and equipment.
Fair value hedges
The fair value hedges relate to forward covers taken to hedge currency exposure and commodity price risks.
The Group’s sales are on a quotational period basis, generally one month to three months after the date of delivery at a customer’s facility. The Group enters into forward contracts for the respective quotational period to hedge its commodity price risk based on average LME prices. Gains and losses on these hedge transactions are substantially offset by the amount of gains or losses on the underlying sales. Net gains and losses are recognized in the consolidated statements of profit or loss.
The Group uses foreign exchange contracts from time to time to optimize currency risk exposure on its foreign currency transactions. Fair value changes on such forward contracts are recognized in the consolidated statements of profit or loss.
Non-designated
economic hedgesThe Group enters into derivative contracts which are not designated as hedges for accounting purposes, but provide an economic hedge of a particular transaction risk or a risk component of a transaction. Hedging instruments include copper, aluminium future contracts on the LME and certain other derivative instruments. Fair value changes on such derivative instruments are recognized in the consolidated statements of profit or loss.
F-
8
1
The fair value of the Group’s derivative positions recorded under derivative financial assets and derivative financial liabilities are as follows:
As at March 31, 2021 | As at March 31, 2022 | |||||||||||||||||||||||
Assets | Liabilities | Assets | Liabilities | Assets | Liabilities | |||||||||||||||||||
( ₹ in million) | (US dollars in million) | |||||||||||||||||||||||
Current | ||||||||||||||||||||||||
Cash flow hedges* | ||||||||||||||||||||||||
— Commodity contracts | 27 | 550 | 2,320 | 2,064 | 31 | 27 | ||||||||||||||||||
— Interest rate swap | — | 50 | 10 | — | 0 | — | ||||||||||||||||||
Fair value hedges | ||||||||||||||||||||||||
— Commodity contracts | 406 | 91 | 112 | 650 | 1 | 9 | ||||||||||||||||||
— Forward foreign currency contracts | 139 | 1,163 | 37 | 1,240 | 0 | 16 | ||||||||||||||||||
Non — qualifying hedges | ||||||||||||||||||||||||
— Commodity contracts | 5 | 22 | 18 | 102 | 1 | 1 | ||||||||||||||||||
— Forward foreign currency contracts | 124 | 911 | 83 | 1,252 | 1 | 17 | ||||||||||||||||||
Non Current | ||||||||||||||||||||||||
Cash flow hedge* | ||||||||||||||||||||||||
— Interest rate swap | — | 51 | — | — | — | — | ||||||||||||||||||
Fair value hedges | — | |||||||||||||||||||||||
— Forward foreign currency contracts | — | 713 | — | 57 | — | 1 | ||||||||||||||||||
Total | 701 | 3,551 | 2,580 | 5,365 | 34 | 71 | ||||||||||||||||||
| * | Refer consolidated statement s of comprehensiveincome/(loss) and consolidated statements of change in equity for the change in the fair value of cash flow hedges. |
26. Provisions
As at March 31, | ||||||||||||||||||||||||||||||||||||
2021 Non-Current | 2021 Current | 2021 Total | 2022 Non-Current | 2022 Current | 2022 Total | 2022 Non-Current | 2022 Current | 2022 Total | ||||||||||||||||||||||||||||
( ₹ in million) | ( ₹ in million) | ( ₹ in million) | ( ₹ in million) | ( ₹ in million) | ( ₹ in million) | (US dollars in million) | (US dollars in million) | (US dollars in million) | ||||||||||||||||||||||||||||
| Provision for employee benefits | 117 | 1,545 | 1,662 | 104 | 1774 | 1,878 | 1 | 24 | 25 | |||||||||||||||||||||||||||
| Provision for restoration, rehabilitation and environmental costs | 29,737 | 275 | 30,012 | 32,178 | 278 | 32,456 | 424 | 4 | 428 | |||||||||||||||||||||||||||
| Other provisions | — | 558 | 558 | — | 1,098 | 1,098 | — | 14 | 14 | |||||||||||||||||||||||||||
Total | 29,854 | 2,378 | 32,232 | 32,282 | 3,150 | 35,432 | 425 | 42 | 467 | |||||||||||||||||||||||||||
F-
8
2
Restoration, rehabilitation and environmental costs (a) | Others (b) | |||||||
( ₹ in million) | ( ₹ in million) | |||||||
As at April 1, 2020 | 26,760 | 541 | ||||||
Additions | 2,701 | 17 | ||||||
Utilised | (24 | ) | — | |||||
Unused amounts reversed | (243 | ) | — | |||||
Unwinding of discount | 721 | — | ||||||
Revision in estimates | (122 | ) | — | |||||
Exchange differences | 219 | — | ||||||
As at March 31, 2021 | 30,012 | 558 | ||||||
Restoration, rehabilitation and environmental costs (a) | Others (b) | Restoration, rehabilitation and environmental costs | Others | |||||||||||||
( ₹ in million) | ( ₹ in million) | US dollars in million) | (US dollars in million) | |||||||||||||
As at April 1, 2021 | 30,012 | 558 | 396 | 7 | ||||||||||||
Additions | 350 | 540 | 5 | 7 | ||||||||||||
Utilised | (45 | ) | — | (1 | ) | — | ||||||||||
Unwinding of discount | 777 | — | 10 | — | ||||||||||||
Revision in estimates | 539 | — | 7 | — | ||||||||||||
Exchange differences | 823 | — | 11 | — | ||||||||||||
As at March 31, 2022 | 32,456 | 1,098 | 428 | 14 | ||||||||||||
(a) Restoration, rehabilitation and environmental costs
An obligation to incur restoration, rehabilitation and environmental costs arises when environmental disturbance is caused by the development or ongoing production from a producing field.
The provisions for restoration, rehabilitation and environmental liabilities represent the management’s best estimate of the costs which will be incurred in the future to meet the Group’s obligations under existing Indian, Australian, Namibian, South African and Irish law and the terms of the Group’s exploration and other licences and contractual arrangements.
Within India, the principal restoration and rehabilitation provisions are recorded within Oil and Gas division where a legal obligation exists relating to the oil and gas fields and where costs are expected to be incurred in restoring the site of production facilities at the end of the producing life of an oil field. The Group recognises the full cost of site restoration as a liability when the obligation to rectify environmental damage arises.
These amounts are calculated by considering discount rates within the range of 2% to 10% and become payable on closure of mines and are expected to be incurred over a period of one to thirty years.
The lower range of discount rate is at Oil and Gas and Zinc international operations in Ireland and higher range is at Zinc International operations in African
c
ountries.(b) Other provisions
Other provisions include provision for disputed cases and claims.
F-
8
3
27. Retirement benefits
The Group participates in defined contribution and benefit plans, the assets of which are held (where funded) in separately administered funds.
For defined contribution plans
,
the amount charged to the consolidated statements of profit or loss is the total amount of contributions payable in the year.For defined benefit plans, the cost of providing benefits under the plans is determined by actuarial valuation separately each year for each plan using the projected unit credit method by independent qualified actuaries as at the year end. Remeasurement gains and losses arising in the year are recognised in full in consolidated statement of comprehensive income for the year.
(i) | Defined contribution plans |
The Group contributed a total of 840 million, 1,190 million and 1,386 million ($ 19 million) for the years ended March 31, 2020, 2021 and 2022
₹
₹
₹
,
respectively, to the following defined contribution plans.Year ended March 31, 2020 ( ₹ Million) | Year ended March 31, 2021 ( ₹ Million) | Year ended March 31, 2022 ( ₹ Million) | Year ended March 31, 2022 (US dollars in million) | |||||||||||||
| Employer’s contribution to recognised provident fund and family pension fund | 630 | 978 | 1,111 | 15 | ||||||||||||
Employer’s contribution to superannuation | 210 | 208 | 230 | 3 | ||||||||||||
| Employer’s contribution to National Pension Scheme | — | 4 | 45 | 1 | ||||||||||||
840 | 1,190 | 1,386 | 19 | |||||||||||||
Indian pension plans
Central recognised provident fund
In accordance with the ‘The Employees’ Provident Funds and Miscellaneous Provisions Act,1952’, employees are entitled to receive benefits under the Provident Fund. Both the employee and the employer make monthly contributions to the plan at a predetermined rate (12% for the year ended March 31, 2021 and March 31, 2022) of an employee’s basic salary and includes contribution made to Family Pension Fund as explained below. All employees have an option to make additional voluntary contributions. These contributions are made to the fund administered and managed by the Government of India (GOI) or to independently managed and approved funds. The Group has no further obligations under the fund managed by the GOI beyond its monthly contributions which are charged to the consolidated statements of profit or loss in the year they are incurred.
Family Pension Fund
The
Family
Pension Fund was established in 1995 and is managed by theG
. The employee makes no contribution to this fund, but the employer makes a contribution of 8.33% of salary each month subject to a specified ceiling per employee (included in the 12% rate specified above). This is provided for every permanent employee on the payroll.OI
At the age of superannuation, contributions cease and the individual receives a monthly payment based on the level of contributions through the years, and on their salary scale at the time they retire, subject to a maximum ceiling of salary level. The
GOI
funds these payments, thus the Group has no additional liability beyond the contributions that it makes, regardless of whether the central fund is in surplus or deficit.Superannuation
Superannuation, another pension scheme applicable in India, is applicable only to executives above certain grade. However, in case of oil and gas (applicable from the second year of employment) and Iron Ore segment, the benefit is applicable to all executives. Vedanta Limited and each relevant Indian subsidiary holds policy with the Life Insurance Corporation of India (“LIC”), to which each of these entities contributes a fixed amount relating to superannuation and the pension annuity is met by the LIC as required, taking into consideration the contributions made. The Group has no further obligations under the scheme beyond its monthly contributions which are charged to the consolidated statements of profit or loss in the year they are incurred.
F-
8
4
National Pension Scheme
National Pension Scheme is a retirement savings account for social security and welfare applicable for executives covered under the superannuation benefit of Vedanta Limited and each relevant Indian subsidiary, on a choice basis. It was introduced to enable employees to select the treatment of superannuation component of their fixed salaries and avail the benefits offered by the National Pension Scheme launched by GOI. Vedanta Limited and each relevant Indian subsidiary holds a corporate account with one of the pension fund managers authorized by the GOI to which each entity contributes a fixed amount relating to superannuation and the pension annuity will be met by the fund manager as per rules of National Pension Scheme. The Group has no further obligations under the scheme beyond its monthly contributions which are charged to the consolidated statement of profit and loss in the year they are incurred.
Australian pension scheme
The Group also participates in defined contribution superannuation schemes in Australia. The contribution of a proportion of an employee’s salary into a superannuation fund is a compulsory legal requirement in Australia. The employer contributes, into the employee’s fund of choice
,
10.0% (March 31, 2021: 9.5%) of the employee’s gross remuneration where the employee is covered by the industrial agreement and 13.0% (March 31, 2021: 12.5%) of the basic remuneration for all other employees. All employees have an option to make additional voluntary contributions. The Group has no further obligations under the scheme beyond its monthly contributions which are charged to the consolidated statements of profit or loss in the year they are incurred.Skorpion Zinc Provident Fund, Namibia
The Skorpion Zinc Provident Fund is a defined contribution fund and is compulsory to all full time employees under the age of 60. The contribution to the fund is a fixed percentage of 9% per month of pensionable salary,
as defined,
whilst the employee contributes 7% with the option of making additional contributions, over and above the normal contribution, up to a maximum of 12%.Normal retirement age is 60 years and benefit payable is the member’s fund credit which is equal to all employer and employee contributions plus interest. The same applies when an employee resigns from Skorpion. The Fund provides disability cover which is equal to the member’s fund credit and a death cover of 2 times annual salary in the event of death before retirement.
The Group has no additional liability beyond the contributions that it makes. Accordingly, this scheme has been accounted for on a defined contribution
plan
and contributions are charged directly to the consolidated statements of profit or loss in the year they are incurred.Black Mountain (Pty) Limited, South Africa Pension and Provident Funds
Black Mountain Mining (Pty) Ltd has 2 retirement funds, both administered by Alexander Forbes, a registered financial service provider. The purpose of the funds is to provide retirement and death benefits to all eligible employees.
Group contributes at a fixed percentage of 10.5% for up to supervisor grade and 15% for others. Membership of both funds is compulsory for all permanent employees under the age of 60 years.
The Group has no additional liability beyond the contributions that it makes. Accordingly, this scheme has been accounted for on a defined contribution basis and contributions are charged directly to the consolidated statements of profit or loss in the year they are incurred.
(ii) | Defined benefit plans |
(a) | Contribution to provident fund trust (the “trusts”) of Iron ore division, BALCO, HZL, Sesa Resources Limited (SRL) and Sesa Mining Corporation Limited (SMCL) |
The provident funds of Iron ore division, BALCO, HZL, SRL and SMCL are exempted under section 17 of the Employees’ Provident Funds and Miscellaneous Provisions Act, 1952. Conditions for grant of exemption stipulates that the employer shall make good deficiency, if any, between the return guaranteed by the statute and actual earning of the Fund. Based on actuarial valuation in accordance with IAS 19and Guidance Note issued by Institute of Actuaries of India for interest rate guarantee of exempted provident fund liability of employees, there is no interest shortfall that is required to be met by Iron ore division, BALCO, HZL, SRL and SMCL as at March 31, 2021 and March 31, 2022. Having regard to the assets of the fund and the return on the investments, the Group does not expect any deficiency in the foreseeable future.
(Employee Benefits)
The Group contributed a total of 471 million, 482 million,471 million ($ 6 million) for the years ended March 31, 2020,
₹
₹
₹
March
31, 2021 and March 31, 2022, respectively in relation to the independently managed and approved funds and has recognised the same as expense in the consolidated
statement of profit or loss. The present value of obligation and the fair value of plan assets of the trust are summarized
below.
F-
8
5
As at March 31, 2020 ( ₹ Million) | As at March 31, 2021 ( ₹ Million) | As at March 31, 2022 ( ₹ Million) | As at March 31, 2022 (US dollars in million) | |||||||||||||
Fair value of plan assets of trusts | 23,437 | 24,213 | 25,317 | 334 | ||||||||||||
Present value of defined benefit obligations | (22,990 | ) | (23,751 | ) | (25,102 | ) | (331 | ) | ||||||||
Net liability arising from defined benefit obligation | 0Nil | 0Nil | 0Nil | 0Nil | ||||||||||||
Percentage allocation of Plan assets of the trust
As at March 31, 2020 | As at March 31, 2021 | As at March 31, 2022 | ||||||||||
Assets by category | ||||||||||||
Government Securities | 61.68 | 63.19 | 58.62 | |||||||||
Debentures/Bonds | 36.67 | 34.36 | 35.54 | |||||||||
Equity | 1.65 | 1.63 | 4.64 | |||||||||
Money Market Instruments | — | 0.82 | 1.20 | |||||||||
The remeasurement loss of 1,524 million, 55 million and0Nil ($ 0Nil) has been charged to other comprehensive income (OCI) for the year
₹
₹
₹
s
ended March 31, 2020, March 31, 2021 and March 31, 2022,
respectively.(b) | Post-Retirement Medical Benefits: |
The Group has a scheme of medical benefits for employees at BMM and BALCO subsequent to their retirement on completion of tenure including retirement on medical grounds and voluntary retirement on contributory basis. The scheme includes employee’s spouses as well. Based on an actuarial valuation conducted as at 861 million and997 million ($ 13 million) 13 million, 10 million and12 million ($ 0 million) for the years ended March 31, 2020, March 31, 2021 and March 31, 2022 150 million, (23) million,67 million ($ 1 million) for the years ended March 31, 2020, March 31, 2021 and March 31, 2022 61 million, 64 million and87 million ($ 1 million) for the years ended March 31, 2020, March 31, 2021 and March 31, 2022
year-end,
a provision is recognised in full for the benefit obligation. The obligation relating to post-retirement medical benefits as at March 31, 2021 and March 31, 2022 was₹
₹
,
respectively. The obligation under this plan is unfunded. The Group considers these amounts as not material and accordingly has not provided further disclosures as required by IAS 19. The current service cost of₹
₹
₹
,
respectively,
has been recognised in consolidated statement of profit or loss. The remeasurement loss/
(gain) on the obligation of post-retirement medical benefits of₹
₹
₹
,
respectively,
have been recognised in other comprehensive income. Net interest cost on the obligation of post-retirement medical benefits of₹
₹
₹
,
respectively,
have been recognized in finance costs.Other Post employment Benefits:
India - Gratuity plan
In accordance with the Payment of Gratuity Act of 1972, Vedanta Limited and its Indian subsidiaries contribute to a defined benefit plan (the “Gratuity Plan”) covering certain categories of employees. The Gratuity Plan provides a lump sum payment to vested employees at retirement, disability or termination of employment being an amount based on the respective employee’s last drawn salary and the number of years of employment with the Group.
Based on actuarial valuations conducted as at year end using the projected unit credit method, a provision is recognised in full for the benefit obligation over and above the funds held in the Gratuity Plan. For entities where the plan is unfunded, full provision is recognised in the consolidated statements of financial position.
The Iron ore and oil and gas division of the Company, SRL, SMCL, HZL and FACOR have constituted a trust recognised by Indian Income Tax Authorities for gratuity to employees, contributions to the trust are funded with LIC, ICICI Prudential Life Insurance Company Limited (ICICI) and HDFC Life Insurance Company Limited (HDFC).
F-
8
6
Principal actuarial assumptions
Principal actuarial assumptions used to determine the present value of the Other post-employment benefit plan obligation are as follows:
Year ended March 31, 2020 | Year ended March 31, 2021 | Year ended March 31, 2022 | ||||||||||
| Discount rate | 6.8 | % | 6.9 | % | 7.2 | % | ||||||
Expected rate of increase in compensation level of covered employees | 2% to 15 | % | 2% to 15 | % | 2% to 15% | |||||||
| Mortality table | IALM (2012-14) | IALM (2012-14) | IALM (2012-14) | |||||||||
Amount recognised in the consolidated statements of financial position consists of:
As at March 31, 2020 ( ₹ Million) | As at March 31, 2021 ( ₹ Million) | As at March 31, 2022 ( ₹ Million) | As at March 31, 2022 (US dollars in million) | |||||||||||||
| Fair value of plan assets | 4,418 | 4,009 | 4,411 | 58 | ||||||||||||
| Present value of defined benefit obligations | (6,310 | ) | (5,748 | ) | (6,004 | ) | (79 | ) | ||||||||
Net liability arising from defined benefit obligations | (1,892 | ) | (1,739 | ) | (1,593 | ) | (21 | ) | ||||||||
Amounts recognised in consolidated statements of profit or loss in respect of Other post-employment benefit plan are as follows:
Year ended March 31, 2020 ( ₹ Million) | Year ended March 31, 2021 ( ₹ Million) | Year ended March 31, 2022 ( ₹ Million) | Year ended March 31, 2022 (US dollars in million) | |||||||||||||
| Current service cost | 411 | 395 | 390 | 5 | ||||||||||||
| Net Interest cost | 151 | 130 | 124 | 2 | ||||||||||||
Total charge to consolidated statements of profit or loss | 562 | 525 | 514 | 7 | ||||||||||||
Amounts recognised in the consolidated statements of comprehensive income in respect of Other post-employment benefit plan are as follows:
Year ended March 31, 2020 ( ₹ Million) | Year ended March 31, 2021 ( ₹ Million) | Year ended March 31, 2022 ( ₹ Million) | Year ended March 31, 2022 (US dollars in million) | |||||||||||||
Remeasurements of the net defined benefit obligation | ||||||||||||||||
| Actuarial losses /(gains) arising from changes in financial assumptions | 283 | 11 | 172 | 2 | ||||||||||||
| Actuarial losses/(gains) arising from experience adjustments | 163 | (104 | ) | (47 | ) | (1 | ) | |||||||||
| Actuarial (gains)/losses arising from changes in demographic assumptions | (14 | ) | (2 | ) | (29 | ) | (0 | ) | ||||||||
| Actuarial losses on Plan assets (excluding amounts included in net interest cost) | 12 | 58 | 18 | 0 | ||||||||||||
Remeasurement of the net defined benefit liability | 444 | (37 | ) | 114 | 1 | |||||||||||
The movement of the present value of Other post-employment benefit plan obligation is as follows:
Year ended March 31, 2020 ( ₹ in Million) | Year ended March 31, 2021 ( ₹ in Million) | Year ended March 31, 2022 ( ₹ in Million) | Year ended March 31, 2022 (US dollars in million) | |||||||||||||
| At April 1 | (5,890 | ) | (6,310 | ) | (5,748 | ) | (76 | ) | ||||||||
| Acquired in business combination | — | (177 | ) | — | — | |||||||||||
| Current service cost | (411 | ) | (395 | ) | (390 | ) | (5 | ) | ||||||||
| Benefits paid | 875 | 1,475 | 623 | 8 | ||||||||||||
| Interest cost of scheme liabilities | (452 | ) | (436 | ) | (393 | ) | (5 | ) | ||||||||
| Actuarial (losses)/gains arising from change in assumptions | (432 | ) | 95 | (96 | ) | (1 | ) | |||||||||
At March 31, | (6,310 | ) | (5,748 | ) | (6,004 | ) | (79 | ) | ||||||||
F-
8
7
The movement in the fair value of Other post-employment benefit plan assets is as follows:
Year ended March 31, 2020 ( ₹ in Million) | Year ended March 31, 2021 ( ₹ in Million) | Year ended March 31, 2022 ( ₹ in Million) | Year ended March 31, 2022 (US dollars in million) | |||||||||||||
| At April 1 | 3,868 | 4,418 | 4,009 | 53 | ||||||||||||
| Acquired in business combination | — | 160 | — | — | ||||||||||||
| Contributions received | 859 | 184 | 693 | 9 | ||||||||||||
| Benefits paid | (598 | ) | (1,001 | ) | (542 | ) | (7 | ) | ||||||||
| Remeasurement loss arising from return on plan assets | (12 | ) | (58 | ) | (18 | ) | (0 | ) | ||||||||
| Interest income | 301 | 306 | 269 | 3 | ||||||||||||
At March 31, | 4,418 | 4,009 | 4,411 | 58 | ||||||||||||
All the above plan assets of the Group have been invested in the qualified insurance policies.
The actual return on plan assets was 289 million, 248 million and 251 million, ($ 3 million) for the years ended March 31, 2020, March 31, 2021 and March 31, 2022
₹
₹
₹
,
respectively.The weighted average duration of the defined benefit obligation is 14.3 years, 14.0 years and 13.3 years as at March 31, 2020, March 31, 2021 and March 31, 2022
,
respectively.The Group expects to contribute 540 million ($ 7 million) to the funded Gratuity
₹
P
lan during the year ending March 31, 2023.Sensitivity analysis for defined benefit plans
Below is the sensitivity analysis determined for significant actuarial assumptions for the determination of defined benefit obligations and based on reasonably possible changes of the respective assumptions occurring at the end of the reporting period while holding all other assumptions constant.
Increase / (Decrease) in defined benefit obligation | Increase / (Decrease) in defined benefit obligation | |||||||||||
Year ended March 31, 2021 ( ₹ in million) | Year ended March 31, 2022 ( ₹ in million) | Year ended March 31, 2022 (US dollars in million) | ||||||||||
Discount rate | ||||||||||||
Increase by 0.50% | (213 | ) | (229 | ) | (3 | ) | ||||||
Decrease by 0.50% | 231 | 248 | 3 | |||||||||
Expected rate of increase in compensation level of covered employees | ||||||||||||
Increase by 0.50% | 208 | 217 | 3 | |||||||||
Decrease by 0.50% | (199 | ) | (209 | ) | (3 | ) | ||||||
The above sensitivity analysis may not be representative of the actual benefit obligation as it is unlikely that the change in assumptions would occur in isolation of one another as some of the assumptions may be correlated.
In presenting the above sensitivity analysis, the present value of defined benefit obligation has been calculated using the projected unit credit method at the end of reporting period, which is the same as that applied in calculating the defined obligation liability recognised in the consolidated statements of financial position.
F-
8
8
Risk analysis
Group is exposed to a number of risks in the defined benefit plans. Most significant risks pertaining to defined benefits plans and management estimation of the impact of these risks are as follows:
Investment risk
Most of the Indian defined benefit plans are funded with LIC, ICICI and HDFC. The Group does not have any liberty to manage the funds provided to LIC, ICICI and HDFC.
The present value of the defined benefit plan obligation is calculated using a discount rate determined by reference to GOI bonds for the Group’s Indian operations. If the return on plan asset is below this rate, it will create a plan deficit.
Interest risk
A decrease in the interest rate on plan assets will increase the net plan obligation.
Longevity risk/ Life expectancy
The present value of the defined benefit plan obligation is calculated by reference to the best estimate of the mortality of plan participants both during and at the end of the employment. An increase in the life expectancy of the plan participants will increase the plan obligation.
Salary growth risk
The present value of the defined benefit plan obligation is calculated by reference to the future salaries of plan participants. An increase in the salary of the plan participants will increase the plan obligation.
Code on Social Security, 2020
The Code on Social Security, 2020 (‘Code’) relating to employee benefits during employment and post-employment benefits received Presidential assent in September 2020. The Code has been published in the Gazette of India. However, the date on which the Code will come into effect has not been notified and the final rules/interpretation have not yet been issued. The Group will assess the impact of the Code when it comes into effect and will record any related impact in the period the Code becomes effective.
28. Employee costs
For the year ended March 31, | 2020 | 2021 | 2022 | 2022 | ||||||||||||
( ₹ in million) | ( ₹ in million) | ( ₹ in million) | (US dollars in million) | |||||||||||||
Salaries and wages | 30,217 | 31,260 | 30,632 | 404 | ||||||||||||
Contributions to provident and other funds | 1,735 | 2,077 | 2,259 | 30 | ||||||||||||
Share based payments | 727 | 597 | 785 | 10 | ||||||||||||
JV Employee cost allocation | (5,759 | ) | (5,302 | ) | (5,557 | ) | (73 | ) | ||||||||
26,920 | 28,632 | 28,119 | 371 | |||||||||||||
F-
89
29. Share-Based Compensation Plans
The Company offers equity based and cash based option plans to its employees, officers and directors through the Company’s stock option plan introduced in 2016 and Cairn India’s stock option plan now administered by the Company pursuant to its merger with the Company.
The Vedanta Limited Employee Stock Option Scheme (ESOS) 2016
The Company introduced an Employee Stock Option Scheme 2016 (“ESOS”), which was approved by the Vedanta Limited shareholders to provide equity settled incentive to all employees of the Company including subsidiary companies. The ESOS scheme includes tenure based, business performance based, sustained individual performance based and market performance based stock options. The maximum value of options that can be awarded to members of the wider management group is calculated by reference to the grade average(“CTC”) and individual grade of the employee. The performance conditions attached to the option is measured by comparing the Company’s performance in terms of Total Shareholder Return (“TSR”) over the performance period with the performance of two group of comparator companies (i.e., Indian and global comparator companies) defined in the scheme. The extent to which an option vests will depend on the Company’s TSR rank against a group or groups of peer companies at the end of the performance period and as moderated by the Remuneration Committee. The ESOS schemes are administered through Vedanta Limited ESOS trust and have underlying Vedanta Limited equity shares.
cost-to-company
Options granted during the year ended March 31, 2022 and year ended March 31, 2021 include business performance based, sustained individual performance based, management discretion and fatality multiplier based stock options. Business performances are measured using Volume, Cost, Net Sales Realization, EBITDA, ESG and Carbon footprint or a combination of these for the respective business/ SBU entities.
The exercise price of the options is 1 per share and the performance period is three years, with no
₹
re-testing
being allowed.F-9
0
The details of share options for the year ended March 31, 2021 is presented below:
Financial Year of Grant | Exercise Period | Options outstanding April 1, 2020 | Options granted during the year | Options forfeited during the year | Options exercised during the year | Options outstanding March 31, 2021 | Options exercisable March 31, 2021 | |||||||||||||||||||
| 2016-17 | December 15, 2019-June 14, 2020 | 1,068,516 | — | 8,648 | 1,059,868 | — | — | |||||||||||||||||||
| 2017-18 | September 1, 2020-February 28, 2021 | 7,027,925 | — | 5,514,169 | 1,136,816 | 376,940 | 376,940 | |||||||||||||||||||
| 2017-18 | October 16, 2020-April 15, 2021 | 11,126 | — | 11,126 | — | — | — | |||||||||||||||||||
| 2018-19 | November 1, 2020-April 30, 2021 | 11,420,046 | — | 1,507,806 | — | 9,912,240 | — | |||||||||||||||||||
| 2018-19 | Cash settled | 1,069,156 | — | 340,300 | — | 728,856 | — | |||||||||||||||||||
| 2019-20 | November 29, 2022-May 28, 2023 | 15,881,330 | — | 2,309,052 | — | 13,572,278 | — | |||||||||||||||||||
| 2019-20 | Cash settled | 1,896,700 | — | 1,019,249 | 877,451 | — | ||||||||||||||||||||
| 2020-21 | November 06, 2023-May 5, 2024 | — | 12,711,112 | — | — | 12,711,112 | — | |||||||||||||||||||
| 2020-21 | Cash settled | — | 1,020,889 | — | — | 1,020,889 | — | |||||||||||||||||||
38,374,799 | 13,732,001 | 10,710,350 | 2,196,684 | 39,199,766 | 376,940 | |||||||||||||||||||||
The details of share options for the year ended March 31, 2022 is presented below:
Financial Year of Grant | Exercise Period | Options outstanding April 1, 2021 | Options granted during the year | Options forfeited during the year | Options exercised during the year | Options outstanding March 31, 2022 | Options exercisable March 31, 2022 | |||||||||||||||||||
| 2017-18 | September 1, 2020-February 28, 2021 | 376,940 | — | 23,457 | 353,483 | — | — | |||||||||||||||||||
| 2018-19 | November 1, 2021-April 30, 2022 | 9,912,240 | — | 6,906,444 | 2,682,781 | 323,015 | 323,015 | |||||||||||||||||||
| 2018-19 | Cash settled | 728,856 | — | 489,731 | 239,125 | — | — | |||||||||||||||||||
| 2019-20 | November 29, 2022-May 28, 2023 | 13,572,278 | — | 2,090,560 | — | 11,481,718 | — | |||||||||||||||||||
| 2019-20 | Cash settled | 877,451 | — | 197,050 | — | 680,401 | — | |||||||||||||||||||
| 2020-21 | November 6, 2023-May 5, 2024 | 12,711,112 | — | 1,903,591 | — | 10,807,521 | — | |||||||||||||||||||
| 2020-21 | Cash settled | 1,020,889 | — | 295,966 | — | 724,923 | — | |||||||||||||||||||
| 2021-22 | November 1, 2024 - April 30, 2025 | — | 12,083,636 | 779,037 | — | 11,304,599 | — | |||||||||||||||||||
| 2021-22 | Cash settled | — | 864,537 | 22,770 | — | 841,767 | — | |||||||||||||||||||
39,199,766 | 12,948,173 | 12,708,606 | 3,275,389 | 36,163,944 | 323,015 | |||||||||||||||||||||
The fair value of all equity settled options has been determined at the date of grant of the option allowing for the effect of any market-based performance conditions. This fair value, adjusted by the Group’s estimate of the number of options that will eventually vest as a result of
non-market
conditions, is expensed over the vesting period.The fair value of cash settled options is measured initially and at each reporting date up to and including the settlement date, with changes in fair value recognised in employee benefits expense.
Business Performance-Based and Sustained Individual Performance-Based Options:
The fair value of stock options following these types of vesting conditions have been estimated using the Black-Scholes-Merton Option Pricing model. The value arrived at under this model has been then multiplied by the expected % vesting based on business performance conditions (only for business performance-based options) and the expected multiplier on account of sustained individual performance (for both type of options). The inputs used in the Black-Scholes-Merton Option Pricing model include the share price considered as of the valuation date, exercise price as per the scheme/ plan of the options, expected dividend yield (estimated based on actual/ expected dividend trend of the company), expected tenure (estimated as the remaining vesting period of the options), the risk-free rate (considered as the zero coupon yield as of the valuation date for a term commensurate with the expected tenure of the options) and expected volatility (estimated based on the historical volatility of the return in
C
ompany’s share prices for a term commensurate with the expected tenure of the options). The exercise period of 6 months post vesting period has not been considered as the options are expected to be exercised immediately post the completion of the vesting period.Total Shareholder Returns-Based Options:
The fair value of stock options following this type of vesting condition has been estimated using the Monte Carlo Simulation method. This method has been used to simulate the expected share prices for Vedanta Limited and the companies of the comparator group over the vesting period of the options. Based on the simulated prices, the expectedthe Indian and Global Group of the Comparator Group. This rank has been used to estimate expected % vesting of the options under this type of vesting condition. The inputs to the monte carlo simulation method include expected tenure (estimated as the remaining vesting period of the options), the risk-free rate (considered as the zero coupon yield as of the valuation date for a term commensurate with the expected tenure of the options), expected dividend yield (estimated based on the actual dividend trend of the companies), expected volatility (estimated based on the historical volatility of the return in the
pay-off
at the end of the vesting period has been estimated and present valued to the valuation date. Further, based on the simulated share prices and expected dividends,
the relative rank of Vedanta Limited’s share price return has been estimatedvis-à-vis
C
ompany’s share prices for a term commensurate with the expected tenure of the options). The exercise period of 6 months post the vesting period has not been considered as the options are expected to be exercised immediately post the completion of the vesting period.F-
9
1
The assumptions used in the calculations of the charge in respect of the ESOS options granted during the year ended March 31, 2021 and March 31, 2022 are set out below:
Particulars | Year ended March 31, 2021 | Year ended March 31, 2022 | ||||||
ESOS 2020 | ESOS 2021 | |||||||
| Number of o ptions | 1,020,889 (cash settled)/ 12,711,112 (equity settled) | | 864,537 (cash settled)/ 12,083,636 (equity settled) | | ||||
| Exercise p rice | ₹ | ₹ | ||||||
| Share p rice at the date of grant | ₹ | ₹ | ||||||
| Contractual l ife | 2 years and 7 months | 3 years | ||||||
| Expected volatility | 49.28% | 49.67% | ||||||
| Expected option life | 2 years and 7 months | 3 years | ||||||
| Expected dividends | 6.80% | 6.80% | ||||||
| Risk free interest rate | 4.84% | 5.02% | ||||||
| Expected annual forfeitures | 10%p.a. | 10%p.a. | ||||||
| Fair value per option granted ( performance based)n on-market | ₹ | ₹ | ||||||
Weighted average share price at the date of exercise of stock options was 131.08 and 339.32 for the year ended March 31, 2021 and March 31, 2022
₹
₹
,
respectively.The weighted average remaining contractual life for the share options outstanding was 2.03 years and 1.62 years for the year
s
ended March 31, 2021 and March 31, 2022,
respectively.The Company recognized total expense of 754 million, 575 million and 432 million ($ 6 million) related to equity settled share-based payment transactions for the year 5 million, 63 million and 138 million ($ 2 million) for the year 72 million and as at March 31, 2022 was 192 million ($ 3 million).
₹
₹
₹
s
ended March 31, 2020, March 31, 2021 and March 31, 2022,
respectively. The total expense recognised on account of cash settled share based plan was₹
₹
s
ended March 31, 2020, March 31, 2021 and March 31, 2022,
respectively. The carrying value of cash settled share based compensation liability as at March 31, 2021 was₹
₹
Employee stock option plans of erstwhile Cairn India Limited (CIESOP):
The Company has provided CIESOP share based payment scheme to its employees.
CIESOP Plan
There are 0 specific vesting conditions under CIESOP plan other than completion of the minimum service period of 3 years from the date of grant. Phantom options are exercisable proportionate to the period of service rendered by the employee subject to completion of one year. The exercise period is 7 years from the vesting date.
Details of employees stock option plans is presented below
CIESOP Plan | Year ended March 31, 2021 | Year ended March 31, 2022 | ||||||||||||||
Number of options | Weighted average exercise price in ₹ | Number of options | Weighted average exercise price in ₹ | |||||||||||||
| Outstanding at the beginning of the year | 5,341,740 | 288.2 | 3,315,174 | 287.30 | ||||||||||||
| Granted during the year | 0Nil | NA | 0Nil | NA | ||||||||||||
| Expired during the year | (1,082,229) | 291.3 | Nil | NA | ||||||||||||
| Exercised during the year | Nil | NA | (483,085) | 286.85 | ||||||||||||
| Forfeited / cancelled during the year | (944,337) | 288.0 | (1,794,448) | 287.70 | ||||||||||||
Outstanding at the end of the year | 3,315,174 | 287.3 | 1,037,641 | 286.85 | ||||||||||||
| Exercisable at the end of the year | 3,315,174 | 287.3 | 1,037,641 | 286.85 | ||||||||||||
Weighted average share price at the date of exercise of stock options was 375.89 for the year ended March 31, 2022.
₹
F-
9
2
Scheme | Range of exercise price in ₹ | Weighted average remaining contractual life of options (in years) | Weighted average exercise price in ₹ | |||||||||
The details of exercise price for stock options outstanding as at March 31, 2021 are: | ||||||||||||
CIESOP Plan | 286.85-287.75 | 0.80 | 287.30 | |||||||||
The details of exercise price for stock options outstanding as at March 31, 2022 are: | ||||||||||||
CIESOP Plan | 286.85 | 0.31 | 286.85 | |||||||||
Employee share option plan of Vedanta Resources Limited
In respect of one of the Company’s subsidiary, BMM, the Group has awarded certain cash settled share based options indexed to the valuation of BMM.
The total expense recognised on account of cash settled share based plan during the year
s
ended March 31, 2020, March 31, 2021 and March 31, 2022 is
₹
million,
₹
million and
₹
million ($
3million)
,
respectively
,
and the carrying value of cash settled share based compensation liability as at March 31, 2021 and March 31, 2022 is₹
million and
₹
million ($
15million)
,
respectively
Out of the total expense of 859 million and 805 million ($ 11 million) pertaining to equity settled options and cash settled options for the year 262 million and 20 million ($ 0 million)
₹
₹
s
ended March 31, 2021 and March 31, 2022,
respectively, the Group has capitalised₹
₹
in
the years
ended March 31, 2021 and March 31, 2022,
respectively.F-
9
3
30. Shareholders’ equity
As at March 31, 2021 (in Million) | As at March 31, 2021 ( ₹ Million) | As at March 31, 2022 (in Million) | As at March 31, 2022 ( ₹ Million) | As at March 31, 2022 (US dollars in million) | ||||||||||||||||
Authorised Share Capital: | ||||||||||||||||||||
| Opening and closing balance (equity shares of ₹ | 44,020 | 44,020 | 44,020 | 44,020 | 580 | |||||||||||||||
Authorised preference share capital: | ||||||||||||||||||||
| Opening and closing balance (preference shares of ₹ | 3,010 | 30,100 | 3,010 | 30,100 | 397 | |||||||||||||||
Issued, subscribed and paid up | ||||||||||||||||||||
| Equity shares of ₹ a,b,c,d | 3,718 | 3,718 | 3,718 | 3,718 | 49 | |||||||||||||||
| a) | The Company has one class of equity shares having a par value of ₹ |
| b) | This includes 160,903,244 equity shares in the form of 40,225,811 American Depository Shares (ADS) as at March 31, 2021. The American Depository Shares (ADS) of the Company have been delisted from NYSE effective close of trading on NYSE on November 8, 2021. Refer Group overview section for detailed note. |
| c) | Includes 308,232 equity shares as at March 31, 2021 and 305,832 equity shares as at March 31, 2022 kept in abeyance. These shares are not part of listed equity capital and pending allotment as they are sub-judice. |
| d) | Includes 12,193,159 equity shares as at March 31, 2021 and 8,693,406 equity shares as at March 31, 2022 held by Vedanta Limited ESOS Trust. |
Securities premium
Securities premium is created to record amounts received in excess of the par value of shares in separate account as required by the Indian Companies Act. The securities premium account may be applied by the Company towards the issue of unissued shares of the Company to the members of the Company as fully paid bonus shares, writing off the preliminary expenses of the Company, writing off the expenses of, or the commission paid or discount allowed on any issue of shares or debentures of the Company, providing for the premium payable on the redemption of any redeemable preference shares or of any debentures of the Company; or for the purchase of its own shares or other securities.
Retained earnings includes amongst others, general reserve, debenture redemption reserve, preference share redemption reserve and capital reserve.
General reserve
Under the erstwhile Indian Companies Act, 1956, a general reserve was created through an annual transfer of net income at a specified percentage in accordance with applicable regulations. The purpose of these transfers was to ensure that if a dividend distribution in a given year is more than 10.0% of the 160,950 million ($ 2,121
paid-up
capital of the Company for that year, then the total dividend distribution is less than the total distributable results for that year. Consequent to introduction ofthe
Companies Act,
2013, the requirement to mandatory transfer a specified percentage of the net profit to general reserve has been withdrawn. The balance in general reserves, as determined in accordance with applicable regulations, was₹
million) as at March 31, 2021 and March 31, 2022.
The Board of Directors of the Company, basis the recommendations of the Audit & Risk Management Committee and Committee of Independent Directors of the Company, at its meeting held on October 29, 2021 approved the Scheme of Arrangement (“Scheme”) between the Company and its shareholders under Section 230 and other applicable provisions of the Companies Act, 2013. The Scheme inter alia provides for capital reorganization of the Company, whereby it is proposed to transfer amounts standing to the credit of the General Reserves to the Retained Earnings of the Company with effect from the Appointed Date. The Scheme is subject to receipt of regulatory approvals/ clearances from the Hon’ble National Company Law Tribunal, Mumbai Bench, Securities and Exchange Board of India (through BSE Limited and National Stock Exchange of India Limited), BSE Limited and National Stock Exchange of India Limited (collectively referred to as “Stock Exchanges”) and such other approvals/ clearances as may be applicable.
Pursuant to the Scheme, the Company will possess greater flexibility to undertake capital related decisions and reflect a more efficient balance sheet.
F-
9
4
Debenture redemption reserve
As per the earlier provision under the Indian Companies Act 5,835 million and NaN ($ NaN)
2013
, companies that issue debentures were required to create debenture redemption reserve from annual profits until such debentures are redeemed. Companieswere
required to maintain 25%as a reserve of outstanding redeemable debentures. The amounts credited to the debenture redemption reserve may not be utilized except to redeem debentures. The MCA, vide its Notification dated August 16, 2019, had amended the Companies (Share Capital and Debenture) Rules, 2014, wherein the requirement of creation of Debenture Redemption Reserve has been exempted for certain class of companies, hence, in view of the same, the Company is not required to create Debenture Redemption Reserve. Retained earnings
include₹
₹
of debenture redemption reserve as at March 31, 2021 and March 31, 2022 respectively.
Preference share redemption reserve
The Indian Companies Act
2013
provides that companies that issue preference shares may redeem those shares from profits of the Company which otherwise would be available for dividends, or from proceeds of a new issue of shares made for the purpose of redemption of the preference shares. If there is a premium payable on redemption, the premium must be provided, either by reducing the additional paid in capital (securities premium account) or out of profits, before the shares are redeemed.If profits are used to redeem preference shares, the value of the nominal amount of shares redeemed should be transferred from profits (retained earnings) to the preference share redemption reserve account. This amount should then be utilised for the purpose of redemption of redeemable preference shares. This reserve can be used to issue fully paid-up bonus shares to the shareholders of the Company. Retained earnings
includes
₹
Capital reserve
The balance in capital reserve as at March 31, 2021 and March 31, 2022 is 182,697 million and 183,680 million ($ 2,421 million)
₹
₹
,
respectively. The balance in capital reserve has mainly arisen pursuant to extinguishment ofnon-controlling
interests of erstwhile Cairn India Limited and acquisition of ASI. Further, changes in capital reserve are due to recognition/derecognition of put option liability andnon-controlling
interests pertaining to ASI.31.
Non-controlling
Interests (‘NCI’)Details of subsidiaries that have material
non-controlling
interestsThe Group consists of a parent company, Vedanta Limited, incorporated in India and a number of subsidiaries held directly and indirectly by the Group which operate and are incorporated around the world. Note 34 to the financial statements lists the details of shareholdings in the subsidiaries.
The
Non-controlling
interests that are material to the Group relate to HZL and BALCO as at March 31, 2021 and March 31, 2022.As at March 31, 2021 and March 31, 2022, these holdings are 35.08%, 49.00%, 26.00%, 48.37%, 4.51% and 10.00%
in
HZL, BALCO, BMM, ASI, ESL and FPL, respectively.
The principal place of business of HZL, BALCO, ESL and FPL is in India, BMM is in South Africa and ASI is in Japan, South Korea and Taiwan.
F-
9
5
The table below shows summarized financial information of subsidiaries of the Group that have material
non-controlling
interests. The amounts are presented before inter-company eliminations.As at March 31, 2021 | ||||||||||||||||
( ₹ in million) | ||||||||||||||||
HZL | BALCO | Others | Total | |||||||||||||
Current assets | 245,694 | 28,748 | 41,604 | 316,046 | ||||||||||||
Non-current assets | 203,262 | 110,396 | 134,990 | 448,648 | ||||||||||||
Current liabilities | 77,512 | 53,990 | 37,575 | 169,077 | ||||||||||||
Non-current liabilities | 45,043 | 28,874 | 77,778 | 151,695 | ||||||||||||
Equity attributable to equity holders of the Parent | 211,900 | 28,703 | 59,236 | 299,839 | ||||||||||||
Non-controlling interests* | 114,501 | 27,577 | 7,374 | 149,452 | ||||||||||||
| * | ₹ million (loss) attributable to NCI of ASI transferred to put option liability as at March 31, 2021. |
As at March 31, 2022 | ||||||||||||||||
( ₹ in million) | ||||||||||||||||
HZL | BALCO | Others | Total | |||||||||||||
Current assets | 239,851 | 30,910 | 40,911 | 311,672 | ||||||||||||
Non-current assets | 199,444 | 110,602 | 151,829 | 461,875 | ||||||||||||
Current liabilities | 59,544 | 42,091 | 42,333 | 143,968 | ||||||||||||
Non-current liabilities | 34,002 | 16,728 | 81,169 | 131,899 | ||||||||||||
Equity attributable to equity holders of the Parent | 224,460 | 42,173 | 64,092 | 330,725 | ||||||||||||
Non-controlling interests* | 121,289 | 40,520 | 9,547 | 171,356 | ||||||||||||
| * | ₹ |
As at March 31, 2022 | ||||||||||||||||
(US dollars In Million) | ||||||||||||||||
HZL | BALCO | Others | Total | |||||||||||||
Current assets | 3,161 | 407 | 539 | 4,107 | ||||||||||||
Non-current assets | 2,629 | 1,458 | 2,001 | 6,088 | ||||||||||||
Current liabilities | 785 | 555 | 558 | 1,898 | ||||||||||||
Non-current liabilities | 448 | 220 | 1,070 | 1,738 | ||||||||||||
Equity attributable to equity holders of the Parent | 2,958 | 556 | 846 | 4,360 | ||||||||||||
Non-controlling interests | 1,599 | 534 | 124 | 2,257 | ||||||||||||
F-
9
6
For the Year Ended March 31, 2020 | ||||||||||||||||
( ₹ In Million) | ||||||||||||||||
HZL | BALCO | Others | Total | |||||||||||||
Revenue | 183,321 | 87,465 | 65,667 | 336,453 | ||||||||||||
Expenses | (115,651 | ) | (89,262 | ) | (74,126 | ) | (279,039 | ) | ||||||||
| Profit/(Loss) for the year | 67,670 | (1,797 | ) | (8,459 | ) | 57,414 | ||||||||||
Profit/( L oss) attributable to equity holders of thep arent | 43,933 | (916 | ) | (4,751 | ) | 38,266 | ||||||||||
Profit/( L oss) attributable tonon-controlling interests | 23,737 | (881 | ) | (3,708 | ) | 19,148 | ||||||||||
| Profit/(Loss) for the year | 67,670 | (1,797 | ) | (8,459 | ) | 57,414 | ||||||||||
Other comprehensive (loss) /income attributable to the equity holders of thep arent | (649 | ) | 19 | (2,102 | ) | (2,732 | ) | |||||||||
Other comprehensive (loss) /income attributable tonon-controlling interests | (351 | ) | 18 | (947 | ) | (1,280 | ) | |||||||||
| Other comprehensive (loss)/income during the year | (1,000 | ) | 37 | (3,049 | ) | (4,012 | ) | |||||||||
Total comprehensive income/(loss) attributable to the equity holders of the p arent | 43,284 | (897 | ) | (6,853 | ) | 35,534 | ||||||||||
Total comprehensive income/(loss) attributable to non-controlling interests | 23,386 | (863 | ) | (4,655 | ) | 17,868 | ||||||||||
| Total comprehensive income/(loss) during the year | 66,670 | (1,760 | ) | (11,508 | ) | 53,402 | ||||||||||
| Net cash inflow from operating activities | 74,282 | 1,069 | 7,017 | 82,368 | ||||||||||||
| Net cash outflow from investing activities | (36,247 | ) | (1,904 | ) | (6,204 | ) | (44,355 | ) | ||||||||
| Net cash outflow from financing activities | (19,276 | ) | (886 | ) | (4,186 | ) | (24,348 | ) | ||||||||
| Net cash inflow/(outflow) | 18,759 | (1,721 | ) | (3,373 | ) | 13,665 | ||||||||||
F-
9
7
For the Year Ended March 31, 2021 | ||||||||||||||||
( ₹ In Million) | ||||||||||||||||
HZL | BALCO | Others | Total | |||||||||||||
Revenue | 220,704 | 96,879 | 77,202 | 394,785 | ||||||||||||
Expenses | (141,492 | ) | (86,221 | ) | (43,423 | ) | (271,136 | ) | ||||||||
| Profit for the year | 79,212 | 10,658 | 33,779 | 123,649 | ||||||||||||
Profit attributable to equity holders of the p arent | 51,424 | 5,436 | 32,682 | 89,542 | ||||||||||||
Profit attributable to non-controlling interests | 27,788 | 5,222 | 1,097 | 34,107 | ||||||||||||
| Profit for the year | 79,212 | 10,658 | 33,779 | 123,649 | ||||||||||||
Other comprehensive (loss) /income attributable to the equity holders of thep arent | (28 | ) | (235 | ) | 2,866 | 2,603 | ||||||||||
Other comprehensive (loss) /income attributable tonon-controlling interests | (15 | ) | (225 | ) | 1,180 | 940 | ||||||||||
| Other comprehensive (loss)/income during the year | (43 | ) | (460 | ) | 4,046 | 3,543 | ||||||||||
Total comprehensive income attributable to the equity holders of thep arent | 51,396 | 5,201 | 35,548 | 92,145 | ||||||||||||
Total comprehensive income attributable tonon-controlling interests | 27,773 | 4,997 | 2,277 | 35,047 | ||||||||||||
| Total comprehensive income during the year | 79,169 | 10,198 | 37,825 | 127,192 | ||||||||||||
Dividends paid/payable to non-controlling interests, including dividend tax | (56,029 | ) | — | — | (56,029 | ) | ||||||||||
| Net cash inflow from operating activities | 191,094 | 13,996 | 12,708 | 217,798 | ||||||||||||
| Net cash outflow from investing activities | (111,459 | ) | (3,083 | ) | (5,337 | ) | (119,879 | ) | ||||||||
| Net cash outflow from financing activities | (95,286 | ) | (11,463 | ) | (6,763 | ) | (113,512 | ) | ||||||||
| Net cash (outflow)/inflow | (15,651 | ) | (550 | ) | 608 | (15,593 | ) | |||||||||
For the Year Ended March 31, 2022 | ||||||||||||||||
( ₹ In Million) | ||||||||||||||||
HZL | BALCO | Others | Total | |||||||||||||
Revenue | 287,896 | 136,070 | 115,584 | 539,550 | ||||||||||||
Expenses | (191,929 | ) | (109,491 | ) | (108,056 | ) | (409,476 | ) | ||||||||
| Profit for the year | 95,967 | 26,579 | 7,528 | 130,074 | ||||||||||||
| Profit attributable to equity holders of the parent | 62,302 | 13,555 | 5,091 | 80,948 | ||||||||||||
Profit non-controlling interests | 33,665 | 13,024 | 2,437 | 49,126 | ||||||||||||
| Profit for the year | 95,967 | 26,579 | 7,528 | 130,074 | ||||||||||||
| Other comprehensive (loss)/income attributable to the equity holders of the parent | (366 | ) | (85 | ) | 1,373 | 922 | ||||||||||
Other comprehensive (loss) /income attributable tonon-controlling interests | (198 | ) | (81 | ) | 707 | 428 | ||||||||||
| Other comprehensive (loss)/income during the year | (564 | ) | (166 | ) | 2,080 | 1,350 | ||||||||||
Total comprehensive income attributable to the equity holders of thep arent | 61,936 | 13,470 | 6,464 | 81,870 | ||||||||||||
Total comprehensive income attributable tonon-controlling interests | 33,467 | 12,943 | 3,144 | 49,554 | ||||||||||||
| Total comprehensive income during the year | 95,403 | 26,413 | 9,608 | 131,424 | ||||||||||||
Dividends paid/payable to non-controlling interests, including dividend tax | (26,682 | ) | — | — | (26,682 | ) | ||||||||||
| Net cash inflow from operating activities | 130,116 | 36,602 | 26,683 | 193,401 | ||||||||||||
| Net cash outflow from investing activities | (874 | ) | (1,610 | ) | (21,947 | ) | (24,431 | ) | ||||||||
| Net cash outflow from financing activities | (116,452 | ) | (31,714 | ) | (2,511 | ) | (150,677 | ) | ||||||||
| Net cash inflow | 12,790 | 3,278 | 2,225 | 18,293 | ||||||||||||
F-
9
8
For the Year Ended March 31, 2022 | ||||||||||||||||
(US dollars in million) | ||||||||||||||||
HZL | BALCO | Others | Total | |||||||||||||
Revenue | 3,795 | 1,793 | 1,523 | 7,111 | ||||||||||||
Expenses | (2,530 | ) | (1,443 | ) | (1,423 | ) | (5,396 | ) | ||||||||
| Profit for the year | 1,265 | 350 | 100 | 1,715 | ||||||||||||
| Profit attributable to equity holders of the Parent | 821 | 179 | 67 | 1,067 | ||||||||||||
Profit attributable to non-controlling interests | 444 | 171 | 33 | 648 | ||||||||||||
| Profit for the year | 1,265 | 350 | 100 | 1,715 | ||||||||||||
| Other comprehensive (loss)/income attributable to the equity holders of the Parent | (5 | ) | (1 | ) | 18 | 12 | ||||||||||
Other comprehensive (loss) /income attributable tonon-controlling interests | (3 | ) | (1 | ) | 10 | 6 | ||||||||||
| Other comprehensive (loss)/income during the year | (8 | ) | (2 | ) | 28 | 18 | ||||||||||
| Total comprehensive income attributable to the equity holders of the Parent | 816 | 178 | 85 | 1,079 | ||||||||||||
Total comprehensive income attributable to non-controlling interests | 441 | 171 | 41 | 653 | ||||||||||||
| Total comprehensive income during the year | 1,257 | 349 | 126 | 1,732 | ||||||||||||
Dividends paid/payable to non-controlling interests, including dividend tax | (352 | ) | — | — | (352 | ) | ||||||||||
| Net cash inflow from operating activities | 1,715 | 482 | 352 | 2,549 | ||||||||||||
| Net cash outflow from investing activities | (12 | ) | (21 | ) | (289 | ) | (322 | ) | ||||||||
| Net cash outflow from financing activities | (1,535 | ) | (418 | ) | (33 | ) | (1,986 | ) | ||||||||
Net cash inflow | 168 | 43 | 30 | 241 | ||||||||||||
The effect of changes in ownership interests in subsidiaries that did not result in a loss of control is as follows:
For the Year Ended March 31, 2020 | ||||||||||||||||
( ₹ In Million) | ||||||||||||||||
HZL | BALCO | Others | Total | |||||||||||||
Changes in NCI | — | — | (2,342 | ) | (2,342 | ) | ||||||||||
For the Year Ended March 31, 2021 | ||||||||||||||||
( ₹ In Million) | ||||||||||||||||
HZL | BALCO | Others | Total | |||||||||||||
Changes in NCI | — | — | — | — | ||||||||||||
For the Year Ended March 31, 2022 | ||||||||||||||||
( ₹ In Million) | ||||||||||||||||
HZL | BALCO | Others | Total | |||||||||||||
Changes in NCI | — | — | — | — | ||||||||||||
For the Year Ended March 31, 2022 | ||||||||||||||||
(US Dollars In Million) | ||||||||||||||||
HZL | BALCO | Others | Total | |||||||||||||
Changes in NCI | — | — | — | — | ||||||||||||
F-
99
32. Capital management
The Group’s objectives when managing capital is to safeguard continuity, maintain a strong credit rating and healthy capital ratios in order to support its business and provide adequate return to shareholders through continuing growth. The Group’s overall strategy remains unchanged from previous year.
the
The Group sets the amount of capital required on the basis of annual business and long-term operating plans which include capital and other strategic investments. The funding requirements are met through a mixture of equity, internal fund generation and other borrowings. The Group’s policy is to use current and
non-current
borrowings to meet anticipated funding requirements.The Group monitors capital on the basis of the net gearing ratio which is Net debt / Total Capital (equity + net debt). The Group is not subject to any externally imposed capital requirements.
Net debt
is
non-current
and current debt as reduced by cash and cash equivalents, other bank balances and current investments. Equity comprises all components including other comprehensive income.The following table summarizes the capital of the Group:
As at March 31, | 2021 | 2022 | 2022 | |||||||||
( ₹ in million) | ( ₹ in million) | (US dollars in million) | ||||||||||
Equity | 734,049 | 807,122 | 10,637 | |||||||||
Cash and cash equivalentsa | 48,537 | 86,709 | 1,143 | |||||||||
Short term investmentsa | 276,494 | 233,755 | 3,081 | |||||||||
Non-current bank depositsb | 1,107 | 2,017 | 27 | |||||||||
Total cash (a) | 326,138 | 322,481 | 4,251 | |||||||||
Current borrowings (Note 22) | 189,600 | 168,944 | 2,227 | |||||||||
Non-current borrowings (Note 22) | 379,622 | 362,023 | 4,772 | |||||||||
Total debt (b) | 569,222 | 530,967 | 6,999 | |||||||||
Net debt (c=(b-a)) | 243,084 | 208,486 | 2,748 | |||||||||
Total capital (equity+net debt) (d) | 977,133 | 1,015,608 | 13,385 | |||||||||
Gearing ratio (c/d) | 0.2 | 0.2 | 0.2 | |||||||||
| a) | The constituents of ‘total cash’ for the purpose of capital management disclosure includes only those amounts of restricted funds that are corresponding to liabilities (e.g., margin money deposits). Consequently , restricted funds of₹ ₹ 6,900 million ($ 91 million) as at March 31, 2021 and March 31, 2022 respectively have been excluded from ‘total cash’ in the capital management disclosures. (ReferN otes 17, 19 and20 ). |
| b) | Additionally, Non-current bank deposits of₹ ₹ , have been included to form part of ‘total cash’ in the capital management disclosures. |
F-10
0
33. Commitments, guarantees, contingencies and other disclosures
In the normal course of business, the Group enters into certain capital commitments and also gives certain financial guarantees.
A. Capital commitments
The Group has a number of continuing operational and financial commitments in the normal course of business including:
| • | Exploratory mining commitments; |
| • | Oil & gas commitments; |
| • | Mining commitments arising under production sharing agreements; and |
| • | Completion of the construction of certain assets. |
Estimated amount of contracts remaining to be executed on capital accounts and not provided for:
As at, | ||||||||||||
March 31, 2021 | March 31, 2022 | March 31, 2022 | ||||||||||
( ₹ in million) | ( ₹ in million) | (US dollars in million) | ||||||||||
Oil & Gas sector | ||||||||||||
Cairn Oil & Gas | 15,547 | 21,690 | 286 | |||||||||
Aluminium sector | ||||||||||||
Lanjigarh Refinery (Phase II) | 11,877 | 28,605 | 377 | |||||||||
Jharsuguda 1.25 MTPA smelter | 4,630 | 15,770 | 208 | |||||||||
BALCO smelter expansion from 0.57 MTPA to 1 MTPA | — | 46,427 | 612 | |||||||||
Zinc sector | ||||||||||||
Zinc India (mines expansion, solar and smelter) | 3,625 | 5,070 | 67 | |||||||||
Gamsberg mining & milling project | 938 | 2,064 | 27 | |||||||||
Copper sector | ||||||||||||
Tuticorin Smelter 400 KTPA* | 29,951 | 30,514 | 402 | |||||||||
Others | 18,722 | 38,429 | 506 | |||||||||
Total | 85,290 | 188,569 | 2,485 | |||||||||
* | currently contracts are under suspension under the force majeure clause as per the contract |
Committed work programme (Other than capital commitment):
As at, | ||||||||||||
March 31, 2021 | March 31, 2022 | March 31, 2022 | ||||||||||
( ₹ in million) | ( ₹ in million) | (US dollars in million) | ||||||||||
Oil & Gas sector | ||||||||||||
| Cairn Oil and Gas (OALP - Oil and Gas blocks) | 56,254 | 56,149 | 740 | |||||||||
F-1
0
1
Other Commitments
| (i) | The Power Division of the Group has signed a long term power purchase agreement (PPA) with GRIDCO Limited for supply of 25% of power generated from the power station with additional right to purchase power at (5%/7%) at variable cost as per the conditions referred to in PPA. The PPA has a tenure of twenty five years, expiring in FY 2037. The Group received favorable order from OERC dated October 5, 2021 for conversion of this power station from Independent Power Plant (“IPP”) to Captive Power Plant (“CPP”) w.e.f from January 1, 2022 subject to certain terms and conditions. However, OERC vide order dated February 19, 2022 directed the Company to supply power to GRIDCO from February 19, 2022 onwards. Thereafter, the Company has resumed supplying power to GRIDCO as per their requisition of power. |
| (ii) | TSPL has signed a long term power purchase agreement (PPA) with Punjab State Power Corporation Limited (PSPCL) for supply of power generated from the power plant. The PPA has tenure of twenty five years, expiring in FY 2042. |
B. Guarantees
The aggregate amount of indemnities and other guarantees on which the Group does not expect any material losses, was 62,810 million and 64,490 million ($ 850 million) as at March 31, 2021 and March 31, 2022
₹
₹
,
respectively.The Group has given guarantees in the normal course of business as stated below:
| • | Guarantees and bonds advanced to the customs authorities in India of ₹ ₹ million) as at March 31, 2021 and March 31, 2022, respectively, relating to the export and payment of import duties on purchases of raw material and capital goods. |
| • | Guarantees issued for Group’s share of minimum work programme commitments of ₹ ₹ , respectively. |
| • | Guarantees of ₹ ₹ |
| • | Bank guarantees of ₹ million ($ 15million) outstanding as at March 31, 2021 and March 31, 2022 has been provided by the Group on behalf of Volcan Investments Limited to Income tax department, India as a collateral in respect of certain tax disputes. |
| • | Other guarantees of ₹ ₹ million) as at March 31, 2021 and March 31, 2022, respectively, issued for securing supplies of materials and services, in lieu of advances received from customers, litigation, for provisional valuation of custom duty and also to various agencies, suppliers and government authorities for various purposes. The Group does not anticipate any liability on these guarantees. |
C. Export Obligations
The Indian entities of the Group have export obligations of 21,653 million and 9,500 million ($ 125
₹
₹
million) as at March 31, 2021 and March 31, 2022, respectively, on account of concessional rates of import duty paid on capital goods under the Export Promotion Capital Goods Scheme and under the Advance License Scheme for the import of raw material laid down by the Government of India.
In the event of the Group’s inability to meet its obligations, the Group’s liability would be 3,534 million and 2,069 million ($ 27
₹
₹
million) as at March 31, 2021 and March 31, 2022, respectively, plus applicable interest.
The Group has given bonds of 17,750 million and 19,154 million ($ 252 million) as at March 31, 2021 and March 31, 2022 respectively to custom authorities against these export obligations.
₹
₹
F-1
0
2
D. Contingencies
The Group discloses the following legal and tax cases as liabilities.
Hindustan Zinc Limited: Department of Mines and Geology
The Department of Mines and Geology of the State of Rajasthan issued several show cause notices to HZL in August, September and October 2006, aggregating to 3,339 million and 3,339 million ($ 44 million) as at March 31, 2021 and March 31, 2022 claiming unlawful occupation and unauthorised mining of associated minerals other than zinc and lead at HZL’s Rampura Agucha, Rajpura Dariba and Zawar mines in Rajasthan during the period from July 1968 to March 2006. In response, HZL filed a writ petition against these show cause notices before the High Court of Rajasthan in Jodhpur. In October 2006, the High Court issued an order granting a stay and restrained the Department of Mines and Geology from undertaking any coercive measures to recover the penalty. In January 2007, the High Court issued another order granting the Department of Mines and Geology additional time to file their reply and also ordered the Department of Mines and Geology not to issue any orders cancelling the lease. The State Government filed for an early hearing application in the High Court. The High Court has passed an order rejecting the application stating that Central Government should file their replies. HZL believes it is unlikely that the claim will lead to a future obligation and thus no provision has been made in these financial statements.
₹
₹
Ravva Joint Operations arbitration proceedings
The Ravva Production Sharing Contract (PSC) obliges the contractor parties to pay a proportionate share of ONGC’s exploration, development, production and contract costs in consideration for ONGC’s payment of costs related to the construction and other activities it conducted in Ravva prior to the effective date of the Ravva PSC (the ONGC Carry). The question as to how the ONGC Carry is to be recovered and calculated, along with other issues, was submitted to an International Arbitration Tribunal in August 2002 which rendered a decision on the ONGC Carry in favour of the contractor parties (including Vedanta Limited (Cairn India Limited which subsequently merged with Vedanta Limited, accordingly now referred to as Vedanta Limited)) whereas four other issues were decided in favour of Government of India (GOI) in October 2004 (Partial Award).
The GOI then proceeded to challenge the ONGC Carry decision before the Malaysian courts, as Kuala Lumpur was the seat of the arbitration. The Federal Court of Malaysia upheld the Partial Award. As the Partial Award did not quantify the sums, therefore, contractor parties approached the same Arbitration Tribunal to pass a Final Award in the subject matter since it had retained the jurisdiction to do so. The Arbitral Tribunal was reconstituted and the Final Award was passed in October 2016 in Vedanta Limited’s favour. GOI’s challenge of the Final Award has been dismissed by the Malaysian High Court and the next appellate court in Malaysia, i.e., Malaysian Court of Appeal. GOI then filed an appeal at Federal Court of Malaysia. The matter was heard on February 28, 2019 and the Federal Court dismissed GOI’s leave to appeal. The Company has also filed for the enforcement of the Partial Award and Final Award before the Hon’ble Delhi High Court. Currently, the matter is being heard.
While the Group does not believe the GOI will be successful in its challenge, if the Arbitral Awards in above matters are reversed and such reversals are binding, the Company would be liable for approximately 4,691 million plus interest and 4,838 million ($ 64 million) plus interest as at March 31, 2021 and March 31, 2022 respectively.
₹
₹
Proceedings related to the Imposition of Entry Tax
Vedanta Limited and other Group companies, i.e., Bharat Aluminium Company Limited (BALCO) and Hindustan Zinc Limited (HZL) challenged the constitutional validity of the local statutes and related notifications in the states of Chhattisgarh, Odisha and Rajasthan pertaining to the levy of entry tax on the entry of goods brought into the respective states from outside.
Post some contradictory orders of High Courts across India adjudicating on similar challenges, the Supreme Court referred the matters to a nine judge bench. Post a detailed hearing, although the bench rejected the compensatory nature of tax as a ground of challenge, it maintained status quo with respect to all other issues which have been left open for adjudication by regular benches hearing the matters.
Following the order of the nine judge bench, the regular bench of the Supreme Court heard the matters. The regular bench remanded the entry tax matters relating to the issue of discrimination against domestic goods bought from other States to the respective High Courts for final determination but retained the issue of jurisdiction for levy on imported goods, for determination by the regular bench of the Supreme Court. Following the order of the Supreme Court, the Group filed writ petitions in respective High Courts.
On October 9, 2017, the Supreme Court has held that states have the jurisdiction to levy entry tax on imported goods. With this Supreme Court judgement, imported goods will rank pari passu with domestic goods for the purpose of levy of Entry tax. Vedanta Limited and its subsidiaries have amended their appeals (writ petitions) in Odisha and Chhattisgarh to include imported goods as well.
The issue pertaining to the levy of entry tax on the movement of goods into a Special Economic Zone (SEZ) remains pending before the Odisha High Court. The Group has challenged the levy of entry tax on any movement of goods into SEZ based on the definition of ‘local area’ under the Odisha Entry Tax Act which is very clear and does not include a SEZ. In addition, the Government of Odisha further through its SEZ Policy 2015 and the operational guidelines for administration of this policy dated August 22, 2016, exempted the entry tax levy on SEZ operations.
F-1
0
3
During the current period, HZL has, under an Amnesty Scheme, settled the entry tax matter by making a payment of 1,342 million ($ 18 million) against total claims of 2,000 million ($ 26 million).
₹
₹
The total claims including 9,110 8,2515,0105,341
interest and
penalty against Vedanta Limited and its subsidiaries (net of provisions made) are
₹
million and
₹
million ($
109 million) as at March 31, 2021 and March 31, 2022 respectively. Consequential interest after the date of order amounts to
₹
million and
₹
million ($
70million) as at March 31, 2021 and March 31, 2022 respectively.
BALCO: Challenge against imposition of Energy Development Cess
BALCO challenged the imposition of Energy Development Cess levied on generators and distributors of electrical energy at 10 paise per unit on the electrical energy sold or supplied before the High Court on the grounds that the Cess is effectively on production and not on consumption or sale since the figures of consumption are not taken into account and the Cess is discriminatory since captive power plants are required to pay at the rate of 10 paise while the State Electricity Board is required to pay at 5 paise. The High Court of Chhattisgarh by order dated December 15, 2006 declared the provisions imposing ED Cess on CPPs as discriminatory and therefore ultra vires the Constitution. BALCO has sought refund of Cess paid till March 2006 amounting to 345 million ($ 5 million).
₹
The State of Chhattisgarh moved a Special Leave Petition in the Honorable Supreme Court (the SC) and the SC whilst issuing notice has stayed the refund of the Cess already deposited and the Supreme Court has also directed the State of Chhattisgarh to raise the bills but no coercive action be taken for recovery of the same. Final argument in this matter started before the Supreme Court. In case the Supreme Court overturns the decision of the High Court, the Group would be liable to pay an additional amount of 9,304 million and 10,172 million ($ 135 million) as at March 31, 2021 and March 31, 2022 respectively. Accordingly, the total exposure on the Group 9,650 million and 10,517 million ($ 139 million) as at March 31, 2021 and March 31, 2022 respectively.
₹
₹
was
₹
₹
BALCO: Electricity Duty
The Group operates a 1,200 MW power plant (“the Plant”) which commenced production in July 2015. Based on the Memorandum of Understanding signed between the Group and the Chhattisgarh State Government, the management believes that the Plant is covered under the Chhattisgarh Industrial policy 8,880 million ($ 117 million) and 5,880 million ($ 78 million) respectively for the period March 2015 to March 2021.
2004-09
which provides exemption of electricity duty for 15 years. In June, 2021, the Chief Electrical Inspectorate, Raipur (“CIE”) issued a demand notice for electricity duty and interest thereon of₹
₹
The Group carries an accrual for electricity duty of 8,780 million and 8,170 million ($ 108 million) as at March 31, 2021 and March 31, 2022 respectively, net ofNaN and2,260 million ($ 30 million) as at March 31, 2021 and March 31, 2022 respectively paid under protest. BALCO has requested the CIE to allow payment of the principal amount over a period of 5 years along with a waiver of interest demand. BALCO has received a reply from CIE that the matter will be discussed with appropriate authorities. As at March 31, 2022, no confirmation has been received on this matter and therefore an amount of 7,311 million ($ 99 million) relating to interest has been considered as a contingent liability.
₹
₹
₹
₹
₹
Miscellaneous disputes- Income tax
The Group is involved in various tax disputes amounting to 19,442 million and 13,589 million ($ 179
₹
₹
million) as at March 31, 2021 and March 31, 2022, respectively, relating to income tax. It also includes similar matters where initial assessment is pending for subsequent periods and where the Group has made claims and assessments are in progress. These mainly relate to the disallowances of tax holidays and depreciation under the Income-tax Act, 1961 and interest thereon which are pending at various appellate levels. Penalties, if any, may be additional.
Based on detailed evaluations and supported by external legal advice, where necessary, the Group believes that it has strong merits and no material adverse impact on the results of operations, cash flows or the financial position of the Group is expected.
Miscellaneous disputes- Others
The Group is subject to various claims and exposures which arise in the ordinary course of its operations, from indirect tax authorities and others, pertaining to the assessable values of sales and purchases or incomplete documentation supporting the Company’s returns or other claims.
The approximate value of claims (excluding the items as set out separately above) against the Group companies
total₹
₹
million) as at March 31, 2021 and March 31, 2022, respectively.
Based on evaluations of the matters and legal advice obtained, the Group believes that it has strong merits and no material adverse impact on the results of operations, cash flows or financial position of the Group is expected. Accordingly, no provision is considered at this stage.
Except as described above, there are no pending litigations which the Group believes could reasonably be expected to have a material adverse effect on the results of operations, cash flows or the financial position of the Group.
F-1
0
4
34. Interest in Other entities
a) | Subsidiarie s |
The Group’s subsidiaries as at March 31, 2022
are
as follows:Subsidiaries | Principal activities | Country of Incorporation | Immediate holding company | The Company’s / Immediate holding Company’s percentage holding (in %) as at March 31, 2021 | The Company’s / Immediate holding Company’s percentage holding (in %) as at March 31, 2022 | |||||||||
| Cairn Energy India Pty Limited 1 | Exploration for and development and production of oil & gas | Australia | Cairn India Holdings Limited | — | — | |||||||||
| Copper Mines of Tasmania Pty Limited (“CMT”) | Copper Mining | Australia | Monte Cello BV | 100 | 100 | |||||||||
| Thalanga Copper Mines Pty Limited (“TCM”) | Copper Mining | Australia | Monte Cello BV | 100 | 100 | |||||||||
| Bharat Aluminium Company Limited (“BALCO”) | Aluminium mining and smelting | India | Vedanta Limited | 51 | 51 | |||||||||
Desai Cement Company Private Limited a | Cement | India | Sesa Mining Corporation Limited | — | 100 | |||||||||
| ESL Steel Limited | Manufacturing of Steel & DI Pipe | India | Vedanta Limited | 95.49 | 95.49 | |||||||||
Facor Reality and Infrastructure Limited b | Real estate | India | FACOR | 100 | 100 | |||||||||
FACOR Power Ltd 3 | Power Generation | India | FACOR | 90 | 90 | |||||||||
Ferro Alloy Corporation Limited (FACOR) 3 | Manufacturing of Ferro Alloys and Mining | India | Vedanta Limited | 100 | 100 | |||||||||
| Goa Sea Port Private Limited 4 | Infrastructure | India | Sterlite Ports Limited | 100 | 100 | |||||||||
| Hindustan Zinc Alloys Private Limited c | Zinc Mining & Smelting | India | Hindustan Zinc Limited | — | 64.92 | |||||||||
Hindustan Zinc Limited (“HZL”) | Zinc Mining & Smelting | India | Vedanta Limited | 64.92 | 64.92 | |||||||||
| MALCO Energy Limited (“MEL”) | Power Generation | India | Vedanta Limited | 100 | 100 | |||||||||
| Maritime Ventures Private Limited 4 | Infrastructure | India | Sterlite Ports Limited | 100 | 100 | |||||||||
| Paradip Multi Cargo Berth Private Limited 4 | Infrastructure | India | Vedanta Limited | 100 | 100 | |||||||||
| Sesa Mining Corporation Limited 4 | Iron ore mining | India | Sesa Resources Limited | 100 | 100 | |||||||||
| Sesa Resources Limited (“SRL”) | Iron ore mining | India | Vedanta Limited | 100 | 100 | |||||||||
| Sterlite Ports Limited 4 | Infrastructure | India | Vedanta Limited | 100 | 100 | |||||||||
| Talwandi Sabo Power Limited (“TSPL”) | Power Generation | India | Vedanta Limited | 100 | 100 | |||||||||
Vedanta Zinc Football & Sports Foundation j | Sports Foundation | India | Hindustan Zinc Limited | — | 64.92 | |||||||||
| Vizag General Cargo Berth Private Limited | Infrastructure | India | Vedanta Limited | 100 | 100 | |||||||||
AvanStrate Inc. (‘ASI’) | Manufacturing of LCD Glass Substrate | Japan | Cairn India Holdings Limited | 51.63 | 51.63 | |||||||||
Cairn India Holdings Limited | Investment company | Jersey | Vedanta Limited | 100 | 100 | |||||||||
AvanStrate Korea Inc | Manufacturing of LCD Glass Substrate | Korea | Avanstrate (Japan) Inc. | 100 | 100 | |||||||||
Western Cluster Limited | Iron ore mining | Liberia | Bloom Fountain Limited | 100 | 100 | |||||||||
Bloom Fountain Limited | Investment Company | Mauritius | Vedanta Limited | 100 | 100 | |||||||||
CIG Mauritius Holdings Private Limited d | Investment Company | Mauritius | Cairn Energy Hydrocarbons Ltd. | 100 | 100 | |||||||||
F-1
0
5
Subsidiaries | Principal activities | Country of Incorporation | Immediate holding company | The Company’s / Immediate holding Company’s percentage holding (in %) as at March 31, 2021 | The Company’s / Immediate holding Company’s percentage holding (in %) as at March 31, 2022 | |||||||||
CIG Mauritius Private Limite d d | Investment Holding Company and to provide services and resources relevant to oil & gas exploration, production and development | Mauritius | CIG Mauritius Holding Private Ltd. | 100 | 100 | |||||||||
THL Zinc Ltd | Investment Company | Mauritius | THL Zinc Ventures Limited | 100 | 100 | |||||||||
THL Zinc Ventures Limited | Investment Company | Mauritius | Vedanta Limited | 100 | 100 | |||||||||
Amica Guesthouse (Proprietary) Limited | Accomodation and catering services | Nambia | Skorpion Zinc (Proprietary) Limited | 100 | 100 | |||||||||
Namzinc (Proprietary) Limited | Owns and operates a zinc refinery | Nambia | Skorpion Zinc (Proprietary) Limited | 100 | 100 | |||||||||
Skorpion Mining Company (Proprietary) Limited (‘NZ’) | Exploration, development,treatment, production and sale of zinc ore | Nambia | Skorpion Zinc (Proprietary) Limited | 100 | 100 | |||||||||
Skorpion Zinc (Proprietary) Limited (‘SZPL’) | Operating (zinc) and investing company | Nambia | THL Zinc Namibia Holdings (Proprietary) Ltd | 100 | 100 | |||||||||
THL Zinc Namibia Holdings (Proprietary) Limited (“VNHL”) | Mining and Exploration and Investment company | Nambia | THL Zinc Ltd | 100 | 100 | |||||||||
| Killoran Lisheen Finance Limited e | Investment company | Republic of Ireland | Vedanta Lisheen Holdings Limited | 100 | 100 | |||||||||
| Killoran Lisheen Mining Limited | Development of a zinc/lead mine | Republic of Ireland | Vedanta Lisheen Holdings Limited | 100 | 100 | |||||||||
| Lisheen Milling Limited | Manufacturingh | Republic of Ireland | Vedanta Lisheen Holdings Limited | 100 | 100 | |||||||||
| Lisheen Mine Partnership | Development and operation of a zinc/lead mine | Republic of Ireland | 50% each held by Killoran Lisheen Mining Limited & Vedanta Lisheen Mining Limited | 100 | 100 | |||||||||
| Vedanta Exploration Ireland Limited e | Exploration activities | Republic of Ireland | Vedanta Lisheen Holdings Limited | 100 | 100 | |||||||||
| Vedanta Lisheen Mining Limited | Zinc and lead mining | Republic of Ireland | Vedanta Lisheen Holdings Limited | 100 | 100 | |||||||||
| Cairn Energy Discovery Limited 1 | Oil and gas exploration, development and production | Scotland | Cairn India Holdings Limited | — | — | |||||||||
| Cairn Energy Gujarat Block 1 Limited | Oil and gas exploration, development and production | Scotland | Cairn India Holdings Limited | 100 | 100 | |||||||||
| Cairn Energy Hydrocarbons Limited | Oil and gas exploration, development and production | Scotlandf | Cairn India Holdings Limited | 100 | 100 | |||||||||
| Cairn Exploration (No. 2) Limited 1 | Oil and gas exploration, development and production | Scotland | Cairn India Holdings Limited | — | — | |||||||||
| Black Mountain Mining (Proprietary) Limited | Exploration, development, production and sale of zinc, lead, copper and associated mineral concentrates | South Africa | THL Zinc Ltd | 74 | 74 | |||||||||
F-1
0
6
Subsidiaries | Principal activities | Country of Incorporation | Immediate holding company | The Company’s / Immediate holding Company’s percentage holding (in %) as at March 31, 2021 | The Company’s / Immediate holding Company’s percentage holding (in %) as at March 31, 2022 | |||||||||
| Cairn South Africa Pty Limited g | Oil and gas exploration, development and production | South Africa | Cairn Energy Hydrocarbons Ltd. | 100 | — | |||||||||
| Cairn Lanka Private Limited | Oil and gas exploration, development and production | Sri Lanka | CIG Mauritius Private Ltd. | 100 | 100 | |||||||||
| AvanStrate Taiwan Inc | Manufacturing of LCD Glass Substrate | Taiwan | Avanstrate (Japan) Inc. | 100 | 100 | |||||||||
| Lakomasko BV | Investment company | The Netherlands | THL Zinc Holding BV | 100 | 100 | |||||||||
| Monte Cello BV (“MCBV”) | Holding company | The Netherlands | Vedanta Limited | 100 | 100 | |||||||||
| THL Zinc Holding BV | Investment company | The Netherlands | Vedanta Limited | 100 | 100 | |||||||||
| Vedanta Lisheen Holdings Limited | Investment company | The Netherlands | THL Zinc Holding BV | 100 | 100 | |||||||||
| Fujairah Gold FZC | Manufacturing of Copper Rod and Refining of Precious Metals (Gold & Silver) | United Arab Emirates | Malco Energy Limited | 100 | 100 | |||||||||
| Sterlite (USA) Inc. i | Investment company | United States of America | Vedanta Limited | 100 | — | |||||||||
(a) | Acquired on November 15, 2021 |
| (b) | Passed a resolution for dissolving on March 8, 2022 |
(c) | Incorporated on November 17, 2021 |
(d) | Under Liquidation |
(e) | Dissolved on June 9 , 2021 |
(f) | Principal place of business is in India |
(g) | Cairn South Africa Pty Limited has been deregistered w.e.f. April 6, 2021 . |
(h) | Activity of the company ceased in February 2016 |
(i) | Liquidated on December 20, 2021 |
(j) | Incorporated on December 21, 2021 |
| 1. | Cairn Exploration (No. 2) Limited and Cairn Energy Discovery Limited have been dissolved w.e.f. September 22, 2020. Cairn Energy India (Pty) Ltd. was deregistered on August 26, 2020. |
| 2. | The Group also has interest in certain trusts which are neither significant nor material to the Group. |
| 3. | The Group has filed an application at NCLT Cuttack on September 16, 2021 for the merger of Ferro Alloy Corporation Limited (“FACOR”) and FACOR Power Limited. |
| 4. | The Group has filed an application at Mumbai NCLT on September 25, 2021 and at Chennai NCLT on September 29, 2021 for the merger of Maritime Ventures Private Limited, Sterlite Ports Limited, Paradip Multi Cargo Berth Private Limited, Goa Sea Port Private Limited with Sesa Mining Corporation Limited. |
F-1
0
7
b) Joint Operations
The Group participates in several unincorporated joint operations which involve the joint control of assets used in oil and gas exploration and producing activities which are as follows:
| Participating Interest (%) | ||||||||||||
Operating Blocks | Area | As at March 31, 2021 | As at March 31, 2022 | |||||||||
| India: | ||||||||||||
| Ravva block – Exploration and production | Krishna Godavari | 22.50 | 22.50 | |||||||||
CB-OS/2 – Exploration | Cambay Offshore | 60 | 60 | |||||||||
CB-OS/2 – Development & production | Cambay Offshore | 40 | 40 | |||||||||
RJ-ON-90/1 | Rajasthan Onshore | 100 | 100 | |||||||||
RJ-ON-90/1 | Rajasthan Onshore | 70 | 70 | |||||||||
KG-OSN-2009/3 | Krishna Godavari Offshore | 100 | 100 | |||||||||
Non-Operating Blocks | ||||||||||||
| India: | ||||||||||||
KG-ONN-2003/1 | Krishna Godavari Onshore | 49 | 49 | |||||||||
F-108
35. Related party transactions
List of related parties and relationships –
A) | Entities Controlling the Company (Holding Companies) |
| • | Volcan Investments Limited (‘Volcan’) |
| • | Volcan Investments Cyprus Limited |
Intermediate Holding Companies
| • | Vedanta Resources Limited (VRL) |
| • | Vedanta Resources Holdings Limited (a) |
| • | Twin Star Holdings Limited (a) |
| • | Finsider International Company Limited (a) |
| • | Westglobe Limited (a) |
| • | Welter Trading Limited (a) |
| • | Richter Holdings Limited (a) |
| • | Vedanta Resources Finance Limited (a) |
| • | Vedanta Resources Cyprus Limited (a) |
| • | Vedanta Holdings Mauritius II Limited ( a ) |
| • | Vedanta Holdings Jersey Limited (a) |
| • | Vedanta Holdings Mauritius Limited (a) |
| • | Vedanta UK Investments Limited (a) |
| • | Vedanta Netherlands Investments BV (a) |
B) | Fellow subsidiaries (with whom transactions have taken place) |
| • | Sterlite Technologies Limited |
| • | Sterlite Power Transmission Limited |
| • | Sterlite Iron and Steel Company Limited |
| • | Sterlite Power Grid Ventures Limited |
| • | Twin Star Technologies Limited |
C) | Post Retirement Benefit Plan |
| • | Balco Employees Provident Fund Trust |
| • | Hindustan Zinc Ltd Employees Contributory Provident Fund Trust |
| • | Sesa Group Employees Provident Fund |
| • | Sesa Mining Corporation Limited Employees Provident Fund Trust |
| • | Sesa Resources Limited Employees Provident Fund Trust |
| • | HZL Employee Group Gratuity Trust |
| • | Sesa Group Employees Gratuity Fund and Sesa Group Executives Gratuity Fund |
| • | Sesa Resources Limited Employees Gratuity Fund |
| • | Sesa Mining Corporation Limited Employees Gratuity Fund |
| • | HZL Superannuation Trust |
| • | Sesa Group Executives Superannuation scheme Fund |
| • | Sesa Resources Limited and Sesa Mining Corporation Limited Employees Superannuation Fund |
| • | FACOR Superannuation Trust (b) |
| • | FACOR Employees Gratuity Scheme (b) |
F-1
0
9
D) | Associates and Joint Ventures (with whom transactions have taken place) |
| • | RoshSkor Township (Pty) Ltd |
| • | Goa Maritime Private Limited |
| • | Gaurav Overseas Private Limited |
E) | Other Related Parties (with whom transactions have taken place) |
Enterprises over which key management personnel/their relatives have control or significant influence
| • | Vedanta Medical Research Foundation |
| • | Vedanta Foundation |
| • | Cairn Foundation |
| • | Sesa Community Development Foundation |
| • | Janhit Electoral Trust |
| • | Fujairah Gold Ghana |
| • | Runaya Refining LLP |
| • | Minova Runaya Private Limited |
| • | Fujairah Metals LLC |
| • | Caitlyn India Private Limited |
(a) | These entities are subsidiary companies of VRL and VRL through its subsidiaries holds 69.68% in Vedanta Limited. |
(b) | Acquired during the year ended March 31, 2021. |
Ultimate controlling party
Vedanta Limited is a majority-owned and controlled subsidiary of Vedanta Resources Limited (‘VRL’). Volcan Investments Limited (‘Volcan’) and its wholly owned subsidiary together hold 100 % of the share capital and 100 % of the voting rights of VRL. Volcan is 100 % beneficially owned and controlled by the Anil Agarwal Discretionary Trust (‘Trust’). Volcan Investments Limited, Volcan Investments Cyprus Limited and other intermediate holding companies (except VRL) do not produce Group financial statements.
F-11
0
A summary of significant related party transactions for the year ended March 31, 2020, March 31, 2021 and March 31, 2022 are noted below:
For the Year ended March 31, 2020 | ||||||||||||||||||
Entities controlling the company/ Fellow Subsidiaries | Associates/ Joint Ventures | Others | Total | |||||||||||||||
( ₹ in million) | ( ₹ in million) | ( ₹ in million) | ( ₹ in million) | |||||||||||||||
Income: | ||||||||||||||||||
(i) | Sales | 8,554 | — | 22 | 8,576 | |||||||||||||
(ii) | Other Income | |||||||||||||||||
a) | Interest income /guarantee commission (Refer Note 35(c)) | 423 | — | — | 423 | |||||||||||||
b) | Outsourcing Service Income | 30 | — | — | 30 | |||||||||||||
c) | Dividend Income | 17 | — | 39 | 56 | |||||||||||||
Expenditure and other transactions: | ||||||||||||||||||
(i) | Purchases of goods/services | 581 | — | 67 | 648 | |||||||||||||
(ii) | Long Term Incentive Plan (Recovery) | (4 | ) | — | (2 | ) | (6 | ) | ||||||||||
(iii) | Management and brand fees expenses | 5,257 | — | — | 5,257 | |||||||||||||
(iv) | Reimbursement of other expenses (net of recovery) | 479 | — | 1 | 480 | |||||||||||||
(v) | Corporate Social Responsibility Expenditure / donation | — | — | 1,110 | 1,110 | |||||||||||||
(vi) | Contribution to Post retirement employee benefit trust | — | — | 1,117 | 1,117 | |||||||||||||
(vii) | Remuneration to relative of Key Management Personnel (“KMP”) | — | — | 169 | 169 | |||||||||||||
(viii) | Commission/Sitting Fees | |||||||||||||||||
| -To Independent directors | — | — | 42 | 42 | ||||||||||||||
| -To KMP | — | — | 40 | 40 | ||||||||||||||
| -To relatives of KMP | — | — | 3 | 3 | ||||||||||||||
(ix) | Dividend paid. | |||||||||||||||||
| -To Holding companies | 7,267 | — | — | 7,267 | ||||||||||||||
| -To KMP | — | — | 0 | 0 | ||||||||||||||
| -To relatives of KMP | — | — | 1 | 1 | ||||||||||||||
Transactions during the year: | ||||||||||||||||||
(i) | Loans given / (repaid) | 0 | (3 | ) | — | (3 | ) | |||||||||||
(ii) | Financial guarantee given | 0— | — | 2 | 2 | |||||||||||||
(iii) | Financial guarantee relinquished | 0— | — | 255 | 255 | |||||||||||||
(iv) | Investment made/(redeemed) (Refer Note 35 (f)) | (44,847 | ) | — | — | (44,847 | ) | |||||||||||
For the Year ended March 31, 2021 | ||||||||||||||||||
Entities controlling the company/ Fellow Subsidiaries | Associates/ Joint Ventures | Others | Total | |||||||||||||||
( ₹ in million) | ( ₹ in million) | ( ₹ in million) | ( ₹ in million) | |||||||||||||||
Income: | ||||||||||||||||||
(i) | Sales | 7,357 | — | 37 | 7,394 | |||||||||||||
(ii) | Other Income | |||||||||||||||||
a) | Interest income /guarantee commission (Refer Note 35 (b)) | 6,697 | — | — | 6,697 | |||||||||||||
b) | Outsourcing Service Income | 36 | — | — | 36 | |||||||||||||
c) | Dividend Income | 17 | — | — | 17 | |||||||||||||
Expenditure and other transactions: | ||||||||||||||||||
(i) | Purchases of goods/services | 760 | — | 546 | 1,306 | |||||||||||||
(ii) | Long Term Incentive Plan (Recovery) | — | — | — | — | |||||||||||||
(iii) | Management and brand fees expenses (Refer Note 35 (e)) | 9,855 | — | — | 9,855 | |||||||||||||
(iv) | Reimbursement of other expenses (net of recovery) | 904 | — | (1 | ) | 903 | ||||||||||||
(v) | Corporate Social Responsibility Expenditure / donation | — | — | 629 | 629 | |||||||||||||
(vi) | Contribution to Post retirement employee benefit trust | — | — | 585 | 585 | |||||||||||||
(vii) | Remuneration to relative of KMP | — | — | 127 | 127 | |||||||||||||
(viii) | Commission/Sitting Fees | |||||||||||||||||
| -To Independent directors | — | — | 35 | 35 | ||||||||||||||
| -To KMP | — | — | 15 | 15 | ||||||||||||||
| -To relatives of KMP | — | — | 3 | 3 | ||||||||||||||
(ix) | Dividend paid. | |||||||||||||||||
| -To Holding companies | 17,703 | — | — | 17,703 | ||||||||||||||
| -To KMP | — | — | 0 | 0 | ||||||||||||||
| -To relatives of KMP | — | — | 2 | 2 | ||||||||||||||
(x) | Guarantee Commission Expense. (Refer Note 35 (a)) | 1,332 | — | — | 1,332 | |||||||||||||
Transactions during the year: | ||||||||||||||||||
(i) | Loans given (Net of repayment of ₹ | 71,654 | — | — | 71,654 | |||||||||||||
(ii) | Financial guarantee given | 31,468 | — | — | 31,468 | |||||||||||||
(iii) | Financial guarantee relinquished | 31,458 | — | 115 | 31,573 | |||||||||||||
F-1
1
1
As at March 31, 2021 | ||||||||||||||||||
Entities controlling the company/ Fellow Subsidiaries | Associates/ Joint Ventures | Others | Total | |||||||||||||||
( ₹ in million) | ( ₹ in million) | ( ₹ in million) | ( ₹ in million) | |||||||||||||||
Balances as at year end: | ||||||||||||||||||
(i) | Trade Receivables | 466 | — | — | 466 | |||||||||||||
(ii) | Loans (Refer Note 35 (b), 35(g)) | 70,663 | 49 | — | 70,712 | |||||||||||||
(iii) | Receivable from (Including brand fee prepaid) (Refer Note 35 (a, | 9,271 | 10 | 23 | 9,304 | |||||||||||||
(iv) | Trade Payables | 973 | — | 215 | 1,188 | |||||||||||||
(v) | Payable to (Including brand fee payable) (Refer N ote 35(e)) | 2,078 | — | 866 | 2,943 | |||||||||||||
(vi) | Guarantees outstanding given | 10 | — | 47 | 57 | |||||||||||||
(vii) | Banking Limits assigned/utilised/renewed to/for group companies (Refer Note 35 (d)) | 1,150 | — | — | 1,150 | |||||||||||||
(viii) | Remuneration, Commission and consultancy fees payable to KMP and their relatives | — | — | 61 | 61 | |||||||||||||
For the Year ended March 31, 2022 | ||||||||||||||||||||||
Entities controlling the company/ Fellow Subsidiaries | Associates/ Joint Ventures | Others | Total | Total | ||||||||||||||||||
( ₹ in million) | ( ₹ in million) | ( ₹ in million) | ( ₹ in million) | (US dollars in million) | ||||||||||||||||||
Income: | ||||||||||||||||||||||
(i) | Sales | 13,947 | — | 590 | 14,537 | 192 | ||||||||||||||||
(ii) | Other Income | |||||||||||||||||||||
a) | Interest income /guarantee commission (Refer Note 35 (b)) | 7,210 | — | — | 7,210 | 95 | ||||||||||||||||
b) | Outsourcing Service Income | 36 | �� | — | — | 36 | 0 | |||||||||||||||
c) | Dividend income | 15 | — | — | 15 | 0 | ||||||||||||||||
d) | Miscellaneous income | — | — | 11 | 11 | 0 | ||||||||||||||||
Expenditure and other transactions: | ||||||||||||||||||||||
(i) | Purchases of goods/services | 746 | — | 1,647 | 2,393 | 32 | ||||||||||||||||
(ii) | Long Term Incentive Plan (Recovery) | — | — | — | — | — | ||||||||||||||||
(iii) | Management and brand fees expenses (Refer Note 35 (e)) | 16,168 | — | — | 16,168 | 213 | ||||||||||||||||
(iv) | Reimbursement of other expenses (net of recovery) | 133 | — | 1 | 134 | 2 | ||||||||||||||||
(v) | Corporate Social Responsibility Expenditure / donation | — | — | 451 | 451 | 6 | ||||||||||||||||
(vi) | Contribution to post retirement employee benefit trust | — | — | 1,135 | 1,135 | 15 | ||||||||||||||||
(vii) | Remuneration to relative of KMP | — | — | 228 | 228 | 3 | ||||||||||||||||
(viii) | Commission/Sitting Fees | |||||||||||||||||||||
| -To Independent directors | — | — | 44 | 44 | 1 | |||||||||||||||||
| -To KMP | — | — | 16 | 16 | 0 | |||||||||||||||||
| -To relatives of KMP | — | — | 3 | 3 | 0 | |||||||||||||||||
(ix) | Dividend paid. | |||||||||||||||||||||
| -To Holding companies | 113,460 | — | — | 113,460 | 1,495 | |||||||||||||||||
| -To KMP | 0— | 0— | 1 | 1 | 0 | |||||||||||||||||
| -To relatives of KMP | 0— | 0— | 9 | 9 | 0 | |||||||||||||||||
(x) | Interest and guarantee commission expense. (Refer Note 35 (a)) | 1,470 | — | — | 1,470 | 19 | ||||||||||||||||
Transactions during the year: | ||||||||||||||||||||||
(i) | Loans given / (repayment thereof) (Refer Note 35 (b)) | (16,227 | ) | — | — | (16,227 | ) | (214 | ) | |||||||||||||
(ii) | Financial guarantee relinquished | 10 | 0— | 43 | 53 | 1 | ||||||||||||||||
(iii) | Investment purchased/(redeemed) during the year | — | 1 | — | 1 | 0 | ||||||||||||||||
(iv) | Loan taken / (repayment thereof) | (3 | ) | — | — | (3 | ) | (0 | ) | |||||||||||||
F-11
2
As at March 31, 2022 | ||||||||||||||||||||||
Entities controlling the company/ Fellow Subsidiaries | Associates/ Joint Ventures | Others | Total | Total | ||||||||||||||||||
( ₹ in million) | ( ₹ in million) | ( ₹ in million) | ( ₹ in million) | (US dollars in million) | ||||||||||||||||||
Balances as at year end: | ||||||||||||||||||||||
(i) | Trade Receivables | 128 | — | 47 | 175 | 2 | ||||||||||||||||
(ii) | Loans (Refer Note 35 (b), 35(g)) | 54,571 | 52 | — | 54,623 | 720 | ||||||||||||||||
(iii) | Receivable from (Including brand fee prepaid) (Refer Note 35 (a, | 2,943 | 99 | 23 | 3,065 | 40 | ||||||||||||||||
(iv) | Trade Payables | 670 | — | 307 | 977 | 13 | ||||||||||||||||
(v) | Payable to (Including brand fee payable) (Refer N ote 35(e)) | 1,678 | — | 381 | 2,059 | 27 | ||||||||||||||||
(vi) | Guarantees outstanding given | — | — | 4 | 4 | 0 | ||||||||||||||||
(vii) | Banking Limits assigned/utilised/renewed to/for group companies (Refer Note 35 (d)) | 1,150 | — | — | 1,150 | 15 | ||||||||||||||||
(viii) | Sitting fee, Remuneration, Commission and consultancy fees payable to KMP and their relatives- | — | — | 81 | 81 | 1 | ||||||||||||||||
Remuneration of key management personnel
The remuneration of the key management personnel of the Group are set out below in aggregate for each of the categories specified in IAS 24.
(Related party disclosures)
Year ended March 31, | ||||||||||||||||
2020 | 2021 | 2022 | 2022 | |||||||||||||
( ₹ in million) | ( ₹ in million) | ( ₹ in million) | (US dollars in million) | |||||||||||||
Short term employee benefits | 396 | * | 277 | 340 | 5 | |||||||||||
Post-employment benefits** | 79 | 10 | 10 | 0 | ||||||||||||
Share based payments | 12 | 2 | 10 | 0 | ||||||||||||
Total | 487 | 289 | 360 | 5 | ||||||||||||
| * | This includes reimbursement to the parent company for remuneration paid to the then CEO and Whole Time Director of the Company aggregating to ₹ ($ 2 million) for the year ended March 31, 2020. |
| ** | Does not include the provision made for gratuity and leave benefits, as they are determined on an actuarial basis for all the employees together. |
a)
RJ-ON-90/1,
During the year ended March 31, 2021, the Board of Directors of the Company approved a consideration to be paid for this guarantee at an annual charge of 1.2% of net exploration and development spend, subject to a minimum annual fee of 379 million ($ 5 million), applicable from April 2020 onwards to be paid in ratio of participating interests held equally by the Company and its step-down subsidiary,
₹
CEHL.
Similarly, VRL has also provided financial and performance guarantee to the Government of India for the Company’s obligations under the Revenue Sharing Contract (‘RSC’) in respect of 51 Blocks awarded under the Open Acreage Licensing Policy (“OALP”) by the Government of India. During the year ended March 31, 2021, the Board of Directors of the Company approved a consideration to be paid for this guarantee consisting of 1,897 million ($ 25 million), i.e., 2.5% of the total estimated cost of initial exploration phase of 75,870 million ($ 1 billion) and an annual charge of 1% of spend, subject to a minimum fee of 759 million ($ 10 million) and maximum fee of 1,517 million ($ 20 million) per annum.
one-time
charge of₹
approximately
₹
₹
₹
Accordingly, the Group has recorded a guarantee commission expense of NaN, 1,332 million and 1,470 million ($ 19 million) for the year ended March 31, 2020, March 31, 2021 and March 31, 2022 respectively and 1,610 million and 1,260 million ($ 17 million) is outstanding as a
₹
₹
₹
₹
₹
pre-payment
at March 31, 2021 and March 31, 2022 respectively.F-11
3
b)
Thereafter, in March 2021, since the credit default swap rates had stabilized, the Group revised the interest rate to 9.6% using a level 2 valuation approach by applying the prevailing US Dollar treasury rates and the company specific credit default swaps. The Group also benchmarked the said rate to the coupon rate on bonds issued to 5,361 million ($ 73 million) is reflected in the statements of changes in equity and cash flow as a transaction with the shareholder.
non-related
third parties by the VRL group during the same period. As per the accounting requirements of IFRS 9 with respect to modification of loans, the net excess of loan amount over the present value of the modified contractual cash flows discounted at the original effective interest rate aggregating to₹
During the year ended March 31, 2022, the VRL group has repaid 16,227 million ($ 214 million) of the aforesaid loans along with interest thereon. Furthermore during the period, the overseas subsidiaries of the Company, entered into a novation agreements with Twin Star Holdings Limited (“TSH”) to novate 22,761 million ($ 300 million) due for repayment in June 2022 to another subsidiary of VRL which is guaranteed by VRL, at a higher interest rate of 10.1% mainly reflecting the impact of novation. The transaction did not have any material impact on the financial results for the current period.
₹
₹
As of March 31, 2021 and March 31, 2022, loans having contractual value of 70,653 million and 56,827 million ($ 749 million) were outstanding
₹
₹
,
respectively.c)
1,
2020 was₹
($
million), which have maturities ranging from
June 2021to
May 2023at coupon ranging from
7.13% to
8.25% p.a. During the previous year, investments have been disposed off in open market for a consideration of
₹
million ($
29 million).
d)
e)
re-negotiated
at 2% of the turnover, while for the remaining subsidiaries the previous rates remain unchanged. Accordingly, the Group has recorded an expense of₹
₹
₹
million) for the years ended March 31, 2020, March 31, 2021 and March 31, 2022, respectively. During the current year, the agreement was renewed to extend for further period of fifteen years. The Group pays such fee in advance, at the start of the year based on estimated annual turnover.
f)
₹
₹
₹
g)
of
₹
million and
₹
million and Twin Star Holding Limited
of
₹
million and
₹
730 million as at March 31, 2020 and March 31, 2021
,
respectively, including accrued interest of
₹
million has been provided for during the year ended March 31, 2021.
h)
₹
($
₹
million) for 26% stake in Serentica 3 and Serentica 1, respectively, for procuring renewable power over
twenty five years from date of commissioning of theProjects. Subsequent to balance sheet date 1,440 million ($ 19 million) has been paid. No significant project-related activities have been carried out subsequent to signing of the PDA.
₹
F-1
1
4
36. Subsequent Events
| a) | Subsequent to the balance sheet date, the Company acquired controlling stake in Athena Chhattisgarh Power Limited (“ACPL”) under the liquidation proceeding of the Insolvency and Bankruptcy Code 2016 for a consideration of ₹ ACPL is building a 1200MW (2 Units*600MW) coal-based power plant located at Jhanjgir Champa district, Chhattisgarh. The plant is expected to fulfill the power requirement for the Company’s aluminum business. |
| b) | Subsequent to the balance sheet date, in oil and gas business, the GoI, vide its notification no. 05/2022 dated June 30, 2022 has levied Special Additional Excise Duty (SAED) of ₹ per barrel) on crude oil with effect from July 1, 2022, which has been revised to ₹ per barrel) with effect from July 20, 2022. The SAED rate is expected to be revised every fortnight. This is in the nature of cess on windfall gain triggered by increase in crude oil prices over last few months. The Company is also engaging with the Government on this levy, within the framework of contractual agreements of PSC and RSC executed with the GoI. |
The Company has performed sensitivity analysis to assess the impact of the above SAED on the fair value of assets in the oil and gas business which is determined basis the consensus of analyst recommendations of long term prices, discount rates, production quantity etc. Based on the results of such analysis, management believes that no adjustment to the carrying value of asset is required at this stage.
There are no other material adjusting or
non-adjusting
subsequent events, except as already disclosed in these financial statements.37. Other matters
(a) i. Call option — HZL
Pursuant to the Government of India’s policy of disinvestment, the Group in April 2002 acquired 26% equity interest in HZL from the Government of India. Under the terms of the Shareholder’s Agreement (‘SHA’), the Group had two call options to purchase all of the Government of India’s shares in HZL at fair market value. The Group exercised the first call option on August 29, 2003 and acquired an additional 18.9% of HZL’s issued share capital. The Group also acquired an additional 20% of the equity capital in HZL through an open offer, increasing its shareholding to 64.9%. The second call option provides the Group the right to acquire the Government of India’s remaining 29.5% share in HZL. This call option was subject to the right of the Government of India to sell 3.5%
of HZL shares to HZL employees. The Group exercised the second call option on July 21, 2009. The Government of India disputed the validity of the call option and refused to act upon the second call option. Consequently, the Group invoked arbitration which is in the early stages. The next date of hearing is to be notified. The Government of India without prejudice to the position on the Put / Call option issue has received approval from the Cabinet for divestment and the Government is looking to divest through the auction route. Meanwhile, the Supreme Court had, in January 2016, directed status quo pertaining to disinvestment of Government of India’s residual shareholding in a public interest petition filed. On August 13, 2020, the Supreme Court passed an order partially removing the status quo order in place and has allowed the arbitration proceedings to continue via its order passed on November 18, 2021. The Supreme Court of India allowed the GoI’s proposal to divest its entire stake in HZL in the open market in accordance with the rules and regulations of SEBI and also directed the Central Bureau of Investigation to register a regular case in relation to the process followed for the disinvestment of HZL in the year 2002 by the GoI. A review petition has been filed by the GoI against this direction by the Supreme Court. In line with said order, the Group has withdrawn its arbitration proceedings.
ii. Call option — BALCO
Pursuant to the Government of India’s policy of divestment, the Group in March 2001 acquired 51% equity interest in
BALCO from the Government of India. Under the terms of the Shareholder’s Agreement (‘SHA’), the Group had a call option to purchase the Government of India’s remaining ownership interest in BALCO at any point from March 2, 2004. The Group exercised this option on March 19, 2004. However, the Government of India contested the valuation and validity of the option and contended that the clauses of the SHA violate the erstwhile Companies Act, 1956 by restricting the rights of the Government of India to transfer its shares and that as a result such provisions of the SHA were null and void. In the arbitration filed by the Group, the arbitral tribunal by a majority award rejected the claims of the Group on the ground that the clauses relating to the call option, the right of first refusal, the “tag along” rights and the restriction on the transfer of shares violate the erstwhile Companies Act, 1956 and are not enforceable.
The Group has challenged the validity of the majority award before the Hon’ble High Court at Delhi and sought for setting aside the arbitration award to the extent that it holds these clauses ineffective and inoperative. The Government of India also filed an application before the High Court to partially set aside the arbitral award in respect of certain matters involving valuation. The matter is to be heard by the Delhi High Court in due course. Meanwhile, the Government of India without prejudice to its position on the Put / Call option issue has received approval from the Cabinet for divestment and the Government is looking to divest through the auction route.
On January 9, 2012, the Group offered to acquire the Government of India’s interests in HZL and BALCO for $ 2,071 and $ 238 respectively. This offer was separate from the contested exercise of the call options, and Group proposed to withdraw the ongoing litigations in relation to the contested exercise of the options should the offer be accepted. To date, the offer has not been accepted by the Government of India and therefore, there is no certainty that the acquisition will proceed.
F-1
1
5
In view of the lack of resolution on the options, the
non-response
to the exercise and valuation request from the Government of India, the resultant uncertainty surrounding the potential transaction and the valuation of the consideration payable, the Group considers the strike price of the options to be at the fair value, which is effectively nil, and hence the call options have not been recognised in the financial statements.(b) The Scheme of Amalgamation and Arrangement amongst Sterlite Energy Limited (‘SEL’), Sterlite Industries (India) Limited (‘Sterlite’), Vedanta Aluminium Limited (‘VAL’), Ekaterina Limited (‘Ekaterina’), Madras Aluminium Company Limited (‘Malco’) and the Group (the “Scheme”) had been sanctioned by the Honorable High Court of Madras and the Honorable High Court of Judicature of Bombay at Goa and was given effect to in the year ended March 31, 2014.
Subsequently the above orders of the Honorable High Court of Bombay and Madras have been challenged by Commissioner of Income Tax, Goa and Ministry of Corporate Affairs through a Special Leave Petition before the Honorable Supreme Court and also by a creditor and a shareholder of the Group. The said petitions are currently pending for hearing.
(c) The Group purchases bauxite under long term linkage arrangement with Orissa Mining Corporation Ltd (hereafter referred as OMC) at provisional prices of 1,000/MT from October 2020 onwards (based on interim order dated October 8, 2020 and on April 6, 2022 of the Hon’ble high court of Odisha), which is subject to final outcome of the writ petition filed by the Group.
₹
The last successful 673/MT and supplied bauxite at this rate from 1,707/MT determined on the basis of Rule 45 of Minerals (Other than Atomic and Hydro Carbons Energy Minerals) Concession Rules, 2016 (hereafter referred as the Rules), no bidder at that floor price participated and hence, the auction was not successful. However, OMC raised demand of 2,810 million ($ 37 million) on the Group towards differential pricing and interest for bauxite supplied till September 2020 considering the auction base price of
e-auction
based price discovery was done by OMC in April 2019 at₹
September
2019 toSeptember
2020 against an undertaking furnished by the Group to compensate any differential price discovered through future successful nationale-auctions.
Though the OMC conducted the nexte-auction
on August 31, 2020 with floor price of₹
₹
₹
1,707/MT. The Group had then filed a writ petition before Hon’ble High Court of Odisha in September 2020, which issued an interim 1,000/MT and furnishing an undertaking for the differential amount, subject to final outcome of the writ petition.
o
rder dated October 8, 2020 directing that the petitioner shall be permitted to lift the quantity of bauxite mutually agreed on payment of₹
OMC 2,011/MT, which was again not successful. On March 18, 2021, Cuttack High Court issued an order disposing off the writ petition, directing that the current arrangement of bauxite price atdirected that the current arrangement will
re-conducted
the
e-auction
on March 9, 2021 with floor price of₹
₹
1000/M
T will continue for the FY2021-22.
Further, on April 6, 2022, the honorable CuttackHigh Court
also
continue for the FY 2022-23.Supported by legal opinions obtained, management believes that the provisions of Rule 45 are not applicable to commercial sale of bauxite ore and hence, it is not probable that the Group will have any financial obligation towards the aforesaid commitments over and above the price of 673/MT discovered vide last successful
₹
e-auction.
However, as an abundant precaution, the Group has recognized purchase of Bauxite from September 2019 onwards at the aforesaid rate of 1,000/MT.
₹
(d) The Department of Mines and Geology (DMG) of the State of Rajasthan initiated the royalty assessment process from Jan 19,250 million 3,110 million ($ 42
uar
2008 to 2019 and issued a show cause notice vide an office order dated January 31, 2020 amounting toy
₹
. Further
an additional demand was issued vide an office order dated December 14, 2020 for₹
million). The Group has challenged the show cause notice and computation mechanism of the royalty itself, and the High Court has granted a stay on the notice and directed DMG not to take any coercive action. State Government has also been directed to not take any coercive action in order to recover such miscomputed dues. The Group has filed a revision application for these demands and the Revenue Authority has granted stay on any recovery related to demand of19,250 million.
₹
F-1
1
6
(e)
Flue-gas
desulfurization (FGD) implementation:Ministry of Environment, Forest and Climate Change (MoEFCC) has revised emission norms for coal-based power plants in India. Accordingly, both captive and independent coal-based power plants in India are required to comply with these revised norms for reduction of sulphur oxide (SOx) emissions for which the current plant infrastructure is to be modified or new equipment have to be installed. Timelines for compliance to the revised norm for various plants in the Group range from December 2023 to December 2024. Different power plants are at different stages of the implementation process.
Ministry of Power issued notification dated July 2, 2020 to restrict imports from China. A chinese vendor has communicated their inability to execute the FGD project quoting aforementioned notification and prevailing COVID situation in India. TSPL is proceeding with further steps for retendering the FGD project.
TSPL filed a petition before the Punjab State Electricity Regulatory Commission (PSERC) for approval of MoEFCC notification as change in law in terms of Article 13 of PPA on June 30, 2017 enabling it to recover certain costs. PSERC vide its order dated December 21, 2018 has held that MoEFCC notification is not a change in law as it does not impose any new requirements. TSPL had filed an appeal before Hon’ble Appellate Tribunal for Electricity (APTEL) challenging the said order of PSERC. APTEL has pronounced the order August 28, 2020 in favour of TSPL allowing the cost pass through.
PSPCL has filed an appeal against this order in Supreme Court. The matter was listed on February 03, 2022 wherein the SC issued notice and directed the respondents to file their respective counter affidavits in the matters. The matter is yet to be heard.
(f) In December 2021, 1, 2022, the notification has introduced a three-year cycle to achieve average ash utilisation of 100 per cent. The first three-year cycle is extendable by another one year or two years where ash utilisation percentage is in the range of 60-80 per cent or less than 60 per cent, respectively. Further, unutilised accumulated ash, i.e., legacy fly ash stored with such power plants prior to the date of this notification is required to be utilized fully over a ten year period with minimum twenty percent, thirty percent and fifty percent utilisation of annual ash generation in year 1, year 2 and years 3-10 respectively. Such provisions are not applicable where ash pond or dyke has stabilised and the reclamation has taken place with greenbelt or plantation. The Group has performed detailed evaluations for its obligations under this notification and has recorded 2,877 million ($ 38
MoEFCC
has notified guidelines for thermal power plants for disposal of fly ash and bottom ash produced during power generation process. Effective April₹
million) as provision for the year ended March 31, 2022, towards estimated costs of legacy fly ash utilization including reclamation costs.
F-1
1
7
Supplementary Information on Oil and Gas Exploration and Production (Unaudited)
In accordance with Codification Topic 932 - Extractive Activities - Oil and gas, this section provides supplemental information on oil and gas exploration and producing activities of the Company for the years ended March 31, 2020, 2021 and 2022. The information included in items (i) through (iii)provides historical cost information pertaining to costs incurred in exploration, property acquisition and development, capitalized costs and results of operations. The information included in items (iv) and (v) present information on our estimated net proved reserve quantities, standardized measure of estimated discounted future net cash flows related to proved reserves, and changes in estimated discounted future net cash flows. Activities not directly associated with oil and gas producing activities are excluded from all aspects of this supplemental information.
Method of accounting for costs incurred in oil and gas producing activities and manner of disposing of capitalized costs relating to those activities
We follow a successful efforts based accounting policy for oil and gas assets.
Costs incurred prior to obtaining the legal rights to explore an area are expensed immediately to the Consolidated statements of profit or loss.
Expenditure incurred on the acquisition of a license interest is initially capitalised on a license by license basis. Costs are held,
un-depleted,
within intangible exploration/appraisal assets until such time as the exploration phase on the license area is complete or commercial reserves have been discovered.
Exploration expenditure incurred in the process of determining oil and gas exploration targets is capitalised initially within intangible exploration/appraisal assets and subsequently allocated to drilling activities. Exploration/appraisal drilling costs are initially capitalised on
well-by-well
basis until the success or otherwise of the well has been established. The success or failure of each exploration/appraisal effort is judged on a
well-by-well
basis. Drilling costs are written off on completion of a well unless the results indicate that hydrocarbon reserves exist and there is a reasonable prospect that these reserves are commercial.
Following appraisal of successful exploration wells, if commercial reserves are established and technical feasibility for extraction demonstrated, then the related capitalised intangible exploration/appraisal costs are transferred into a single field cost center within property, plant and equipment - development/producing assets after testing for impairment. Where results of exploration drilling indicate the presence of hydrocarbons which are ultimately not considered commercially viable, all related costs are written off to the Consolidated statements of profit or loss.
All costs incurred after the technical feasibility and commercial viability of producing hydrocarbons has been demonstrated are capitalised within property, plant and equipment - development/producing assets on a
field-by-field
basis. Subsequent expenditure is capitalised only where it either enhances the economic benefits of the development/producing asset or replaces part of the existing development/producing asset. Any remaining costs associated with the part replaced are expensed.
Net proceeds from any disposal of an intangible exploration/appraisal asset are initially credited against the previously capitalised costs. Any surplus proceeds are credited to the Consolidated statements of profit or loss. Net proceeds from any disposal of development/producing assets are credited against the previously capitalised cost. A gain or loss on disposal of a development/producing asset is recognised in the Consolidated statements of profit or loss to the extent that the net proceeds exceed or are less than the appropriate portion of the net capitalised costs of the asset.
F-1
1
8
Supplementary Information on Oil and Gas Exploration and Production (Unaudited)
Capitalized costs relating to oil and gas producing activities
The following table summarizes capitalized costs for oil and gas exploration and production activities with the related accumulated depreciation, depletion and amortization, and asset retirement obligation assets:
India | Sri Lanka | South Africa | ||||||||||
( ₹ in millions) | ( ₹ in millions) | ( ₹ in millions) | ||||||||||
March 31, 2022 | ||||||||||||
Unproved oil and gas properties | 43,705 | 59,571 | 2,751 | |||||||||
Proved oil and gas properties | 1,554,729 | — | — | |||||||||
Support equipment | 6,740 | — | 5 | |||||||||
Gross Capitalized costs | 1,605,174 | 59,571 | 2,756 | |||||||||
| Accumulated depreciation, depletion, and amortization, and valuation allowances (including impairment loss) | (1,461,830 | ) | (59,571 | ) | (2,756 | ) | ||||||
Net Capitalized costs | 143,344 | — | — | |||||||||
March 31, 2021 | ||||||||||||
Unproved oil and gas properties | 37,333 | 57,766 | 2,668 | |||||||||
Proved oil and gas properties | 1,521,179 | — | — | |||||||||
Support equipment | 6,657 | |||||||||||
Gross Capitalized costs | 1,565,169 | 57,766 | 2,668 | |||||||||
| Accumulated depreciation, depletion, and amortization, and valuation allowances (including impairment loss) | (1,456,963 | ) | (57,766 | ) | (2,673 | ) | ||||||
Net Capitalized costs | 108,206 | — | (5 | ) | ||||||||
March 31, 2020 | ||||||||||||
Unproved oil and gas properties | 33,033 | 58,959 | 2,728 | |||||||||
Proved oil and gas properties | 1,542,710 | — | — | |||||||||
Support equipment | 6,553 | — | — | |||||||||
Gross Capitalized costs | 1,582,296 | 58,959 | 2,728 | |||||||||
| Accumulated depreciation, depletion, and amortization, and valuation allowances (including impairment loss) | (1,465,495 | ) | (58,959 | ) | (2,728 | ) | ||||||
Net Capitalized costs | 116,801 | — | — | |||||||||
F-1
19
Supplementary Information on Oil and Gas Exploration and Production (Unaudited)
(i) | Costs incurred in oil and gas property acquisition, exploration and development activities |
Costs incurred are summarized below and include both amounts expensed and capitalized:
India | Sri Lanka | South Africa | |||||||||||
( ₹ in millions) | ( ₹ in millions) | ( ₹ in millions) | |||||||||||
March 31, 2022 | |||||||||||||
Acquisition of properties | |||||||||||||
Proved | |||||||||||||
Unproved | |||||||||||||
Exploration costs | (13,600 | ) | 6 | — | |||||||||
Development costs | 8,195 | — | — | ||||||||||
Total | (5,405 | ) | 6 | — | |||||||||
March 31, 2021 | |||||||||||||
Acquisition of properties | |||||||||||||
Proved | |||||||||||||
Unproved | |||||||||||||
Exploration costs | 6,168 | 4 | 1 | ||||||||||
Development costs | 8,640 | — | — | ||||||||||
Total | 14,808 | 4 | 1 | ||||||||||
March 31, 2020 | |||||||||||||
Acquisition of properties | |||||||||||||
Proved | |||||||||||||
Unproved | |||||||||||||
Exploration costs | 3,061 | 5 | 9 | ||||||||||
Development costs | 41,677 | — | — | ||||||||||
Total | 44,738 | 5 | 9 | ||||||||||
* Figures in brackets ( ) represents reversal/ transfers between exploration and development costs.
(ii) | Results of operations for oil and gas producing activities |
The Company’s results of operations from oil and gas producing activities for the years ended March 31, 2022, 2021 and 2020 are shown in the following table.
Production costs are lifting costs incurred to operate and maintain productive wells and related equipment and facilities, including operating employees’ compensation, materials, supplies, fuel consumed in operations and operating costs related to natural gas processing plants.
Exploration expenses include the costs of geological and geophysical activities and
non-productive
exploratory wells. Depreciation and amortization expenses relate to assets employed in exploration and development activities. In accordance with Codification Topic 932 – Extractive Activities – Oil and gas, income taxes are based on statutory tax rates, reflecting allowable deductions. Till March 31, 2016, the Company had an effective tax rate lower than the statutory rate, benefiting from tax holiday in RJ Block undersection 80-IB
(9) of the Income Tax Act, 1961. Interest income and expense are excluded from the results reported in this table.F-1
2
0
Supplementary Information on Oil and Gas Exploration and Production (Unaudited)
India | Sri Lanka | South Africa | ||||||||||
( ₹ in millions) | ( ₹ in millions) | ( ₹ in millions) | ||||||||||
Year ended March 31, 2022 | ||||||||||||
Revenues | ||||||||||||
Sales | 124,301 | — | — | |||||||||
Transfers | — | — | — | |||||||||
Operating Income | 233 | — | — | |||||||||
Total | 124,534 | — | — | |||||||||
Production costs | (59,565 | ) | — | — | ||||||||
Exploration (expenses)/ reversal | (26,180 | ) | (1 | ) | — | |||||||
| Depreciation, depletion and amortization and valuation provisions | 39,858 | — | — | |||||||||
(including impairment loss/reversal) | — | |||||||||||
Results before income tax expenses | 78,647 | (1 | ) | — | ||||||||
Income tax expenses | (34,741 | ) | — | — | ||||||||
| Results of operations from producing activities (excluding corporate overhead and interest costs) | 43,906 | (1 | ) | — | ||||||||
Year ended March 31, 2021 | ||||||||||||
Revenues | ||||||||||||
Sales | 75,308 | — | — | |||||||||
Transfers | — | — | — | |||||||||
Operating Income | 342 | — | — | |||||||||
Total | 75,650 | — | — | |||||||||
Production costs | (39,582 | ) | — | — | ||||||||
Exploration (expenses)/ reversal | (69 | ) | (1 | ) | — | |||||||
| Depreciation, depletion and amortization and valuation provisions | — | |||||||||||
(including impairment loss/reversal) | (21,235 | ) | — | — | ||||||||
Results before income tax expenses | 14,764 | (1 | ) | — | ||||||||
Income tax expenses | (3,031 | ) | — | — | ||||||||
| Results of operations from producing activities (excluding corporate overhead and interest costs) | 11,733 | (1 | ) | — | ||||||||
| — | ||||||||||||
Year ended March 31, 2020 | ||||||||||||
Revenues | ||||||||||||
Sales | 126,608 | — | — | |||||||||
Transfers | — | — | — | |||||||||
Operating Income | 188 | — | — | |||||||||
Total | 126,796 | — | — | |||||||||
Production costs | (50,251 | ) | — | — | ||||||||
Exploration expenses | (22 | ) | (4 | ) | (1 | ) | ||||||
Depreciation, depletion and amortization and valuation provisions | ||||||||||||
(including impairment loss) | (175,086 | ) | — | — | ||||||||
Results before income tax expenses | (98,563 | ) | (4 | ) | (1 | ) | ||||||
Income tax expenses | 33,868 | — | — | |||||||||
| Results of operations from producing activities (excluding corporate overhead and interest costs) | (64,695 | ) | (4 | ) | (1 | ) | ||||||
(iii) | Reserve quantities information |
The following tables represent estimates for oil and gas reserves by geographic area as of March 31, 2022, 2021, and 2020. Quantities mentioned below represent proved developed and proved undeveloped reserves together with changes in quantities for the fiscal years 2022, 2021, and 2020.
The definitions used for proved, proved developed and proved undeveloped oil and gas reserves are in accordance with United States Securities and Exchange Commission (SEC) Rule
4-10
of RegulationS-X.
Proved oil and natural gas reserves are those estimated quantities of crude oil, natural gas and natural gas liquids that geological and engineering data demonstrate with reasonable certainty to be economically producible in future years from known reservoirs, under existing economic and operating conditions including a12-month
average price prior to the end of the reporting period, unless prices are defined by contract, and cost at the date of estimation.All the proved reserves presented herein are based on PSCs with the GoI. As such, all net reserves are based on an entitlement calculation which converts our share of cost recovery and profit petroleum under each contract to a volume equivalent of net reserves in accordance with SEC guidance on calculating net reserves subject to these agreements
F-1
2
1
Supplementary Information on Oil and Gas Exploration and Production (Unaudited)
A summary of the annual changes in the proved reserves of oil is as follows (in mmbbls):
Proved developed and undeveloped reserves | India | Sri Lanka | South Africa | Total | ||||||||||||
Reserves at March 31, 2019 | 126.83 | — | — | 126.83 | ||||||||||||
Revisions of previous estimates | 5.40 | — | — | 5.40 | ||||||||||||
Extensions and discoveries | 0.04 | — | — | 0.04 | ||||||||||||
Improved Recovery | — | — | — | — | ||||||||||||
Sales of reserves | — | — | — | — | ||||||||||||
Purchases of reserves | — | — | — | — | ||||||||||||
Production for the year | (28.23 | ) | — | — | (28.23 | ) | ||||||||||
Reserves at March 31, 2020 | 104.04 | — | — | 104.04 | ||||||||||||
Revisions of previous estimates | 21.47 | — | — | 21.47 | ||||||||||||
Extensions and discoveries | 0.67 | — | — | 0.67 | ||||||||||||
Improved Recovery | — | — | — | — | ||||||||||||
Sales of reserves | — | — | — | — | ||||||||||||
Purchases of reserves | — | — | — | — | ||||||||||||
Production for the year | (21.88 | ) | — | — | (21.88 | ) | ||||||||||
Reserves at March 31, 2021 | 104.30 | — | — | 104.30 | ||||||||||||
Revisions of previous estimates | (10.23 | ) | — | — | (10.23 | ) | ||||||||||
Extensions and discoveries | — | — | — | — | ||||||||||||
Improved Recovery | — | — | — | — | ||||||||||||
Sales of reserves | — | — | — | — | ||||||||||||
Purchases of reserves | — | — | — | — | ||||||||||||
Production for the year | (19.00 | ) | — | — | (19.00 | ) | ||||||||||
Reserves at March 31, 2022 | 75.07 | — | — | 75.07 | ||||||||||||
A summary of the annual changes in the proved reserves of natural gas is as follows (in bcf):
Proved developed and undeveloped reserves | India | Sri Lanka | South Africa | Total | ||||||||||||
Reserves at March 31, 2019 | 95.37 | — | — | 95.37 | ||||||||||||
Revisions of previous estimates | 42.37 | — | — | 42.37 | ||||||||||||
Extensions and discoveries | — | — | — | — | ||||||||||||
Improved Recovery | — | — | — | — | ||||||||||||
Sales of reserves | — | — | — | — | ||||||||||||
Purchases of reserves | — | — | — | — | ||||||||||||
Production for the year | (18.71 | ) | — | — | (18.71 | ) | ||||||||||
Reserves at March 31, 2020 | 119.03 | — | — | 119.03 | ||||||||||||
Revisions of previous estimates | 9.21 | — | — | 9.21 | ||||||||||||
Extensions and discoveries | — | — | — | — | ||||||||||||
Improved Recovery | — | — | — | — | ||||||||||||
Sales of reserves | — | — | — | — | ||||||||||||
Purchases of reserves | — | — | — | — | ||||||||||||
Production for the year | (18.46 | ) | — | — | (18.46 | ) | ||||||||||
Reserves at March 31, 2021 | 109.78 | — | — | 109.78 | ||||||||||||
Revisions of previous estimates | (14.57 | ) | — | — | (14.57 | ) | ||||||||||
Extensions and discoveries | 1.12 | — | — | 1.12 | ||||||||||||
Improved Recovery | — | — | — | — | ||||||||||||
Sales of reserves | — | — | — | — | ||||||||||||
Purchases of reserves | — | — | — | — | ||||||||||||
Production for the year | (20.8 | ) | — | — | (20.8 | ) | ||||||||||
Reserves at March 31, 2022 | 75.53 | — | — | 75.53 | ||||||||||||
F-1
2
2
Supplementary Information on Oil and Gas Exploration and Production (Unaudited)
Year ending March 31, 2020
Total proved reserves as of March 31, 2019 were 142.72 mmboe. For the year ending March 31, 2020, total revisions of 12.47 mmboe were comprised of an increase of 8.94 mmboe based on technical revisions due to improved production performance and an increase of 3.53 mmboe due to revisions based on commodity prices. These total revisions comprised an increase of 0.06 mmboe for the Cambay blockan increase of 12.23 mmboe for the RJ Blockand an increase of 0.34 mmboe for the Ravva block
(CB/OS-2),
a decrease of 0.16 mmboe for the Nagayalanka block(KG-ONN-2003/1),
(RJ-ON-90/1),
(PKGM-1).
In fiscal year 2020, no revisions were made due to improved recovery. Extensions and discoveries of 0.04 mmboe were on account of inclusion of theSaraswati-4
Basement field which was approved for development in the RJ Block. After adjusting for the production of 31.35 mmboe, the total proved reserves as at March 31, 2020 were 123.88 mmboe.Year ending March 31, 2021
Total proved reserves as of March 31, 2020 were 123.88 mmboe. For the year ending March 31, 2021 total revisions of 23.01 mmboe comprised an increase of 9.66 mmboe based on technical revisions due to improved production performance and an increase of 13.35 mmboe due to revisions based on commodity prices. These total revisions comprised an increase of 0.51 mmboe for the Cambay blockan increase of 21.41 mmboe for the Rajasthan blockand an increase of 1.09 mmboe for the Ravva block
(CB/OS-2),
0 change for the Nagayalanka block(KG-ONN-2003/1),
(RJ-ON-90/1),
(PKGM-1).
No revisions were made due to improved recovery. Extensions and discoveries of 0.67 mmboe were on account of inclusion of the NL and RaageshwariSouth-1
fields which were approved for development in the Rajasthan block. After adjusting for production of 24.96 mmboe, the total proved reserves as of March 31, 2021, were 122.60 mmboe.Year ending March 31, 2022
Total proved reserves as of March 31, 2021 were 122.60 mmboe. For the year ending March 31, 2022, total revisions of 12.66 mmboe were comprised of an increase of 7.33 mmboe based on technical revisions due to changes in production performance and a decrease of 19.99 mmboe due to revisions based on commodity prices. These total revisions were comprised of an increase of 0.55 mmboe for the Cambay blocka decrease of 13.90 mmboe for the Rajasthan blockand an increase of 0.68 mmboe for the Ravva block
(CB/OS-2),
an increase of 0.01 mmboe for the Nagayalanka block(KG-ONN-2003/1),
(RJ-ON-90/1),
(PKGM-1).
No revisions were made due to improved recovery. Extensions and discoveries of 0.19 mmboe were on account of inclusion of the Hazarigaon field which was approved for development in the Hazarigaon block(AA-ONHP-2018/01).
After adjusting for production of 22.46 mmboe, the total proved reserves as of March 31, 2022 were 87.66 mmboe.(v) | Reserve quantities information (Continued) |
2022 | 2021 | 2020 | ||||||||||||||||||||||
| Crude Oil | Natural gas | Crude Oil | Natural gas | Crude Oil | Natural gas | |||||||||||||||||||
| (mmbbls) | (bcf) | (mmbbls) | (bcf) | (mmbbls) | (bcf) | |||||||||||||||||||
Net proved developed reserves: | ||||||||||||||||||||||||
India | 64.91 | 67.77 | 98.96 | 98.75 | 91.49 | 100.45 | ||||||||||||||||||
Sri Lanka | — | — | — | — | — | — | ||||||||||||||||||
South Africa | — | — | — | — | — | — | ||||||||||||||||||
Total net proved developed reserves | 64.91 | 67.77 | 98.96 | 98.75 | 91.49 | 100.45 | ||||||||||||||||||
Net proved undeveloped reserves: | ||||||||||||||||||||||||
India | 10.17 | 7.75 | 5.34 | 11.02 | 12.55 | 18.57 | ||||||||||||||||||
Sri Lanka | — | — | — | — | — | — | ||||||||||||||||||
South Africa | — | — | — | — | — | — | ||||||||||||||||||
Total net proved undeveloped reserves | 10.17 | 7.75 | 5.34 | 11.02 | 12.55 | 18.57 | ||||||||||||||||||
(v) | Standardized measure of discounted future net cash flows relating to proved oil and gas quantities and changes therein |
The table below shows the standardized measure of future net cash flows relating to proved reserves. The analysis is computed in accordance with Topic 932 – Extractive Activities – Oil and gas, by applying average prices during theprice for each month within such period, unless prices are defined by contractual arrangements, excluding escalations based upon future conditions, as defined by the SEC, fiscal
12-month
period prior to the ending date of the period covered by the report, determined as anun-weighted
arithmetic average of thefirst-day-of-the-month
year-end
costs, fiscalyear-end
statutory tax rates and a discount factor of 10% to fiscalyear-end
quantities of net proved reserves. The standardized measure of discounted future net cash flows is a forward-looking statement.F-1
2
3
Supplementary Information on Oil and Gas Exploration and Production (Unaudited)
Future price changes are limited to those provided by existing contractual arrangements at the end of each reporting year. Future development and production costs are those estimated future expenditures necessary to develop and produce fiscalestimate of when future expenditures will be incurred and when reserves will be produced. The standardized measure of discounted future net cash flows prescribed under Topic 932 requires assumptions as to the timing and amount of future development and production costs and income from the production of proved reserves. The information does not represent management’s estimate or our expected future cash flows or the value of its proved reserves and therefore should not be relied upon as an indication of our future cash flow or value of its proved reserves.
year-end
estimated proved reserves based on fiscalyear-end
costs, assuming continuation of fiscalyear-end
economic conditions.Pre-tax
future net cash flow is net of decommissioning and removal costs. Estimated future income taxes are calculated by applying the appropriateyear-end
statutory tax rates. These rates reflect allowable deductions and tax credits and are applied to estimated future pretax net cash flows, less the tax basis of related assets. We have an effective tax rate lower than the statutory rate, benefiting from tax holiday in RJ Block under section80-IB
(9) of the Income Tax Act, 1961. Discounted future net cash flows are calculated using a discount rate of 10% per year. Discounting requires ayear-by-year
(v) | Standardized measure of discounted future net cash flows relating to proved oil and gas quantities and changes therein (continued) |
India ( ₹ | Sri Lanka ( ₹ | South Africa ( ₹ | Total ( ₹ | |||||||||||||
At March 31, 2022 | ||||||||||||||||
Future cash inflows | 489,013 | — | — | 489,013 | ||||||||||||
Future production costs | (258,748 | ) | — | — | (258,748 | ) | ||||||||||
Future development costs | (46,791 | ) | — | — | (46,791 | ) | ||||||||||
Future income tax expenses | (55,714 | ) | — | — | (55,714 | ) | ||||||||||
Undiscounted future net cash flows | 127,760 | — | — | 127,760 | ||||||||||||
| 10 percent midyear annual discount for timing of estimated cash Flows | (33,306 | ) | — | — | (33,306 | ) | ||||||||||
Standardized measure of discounted future net cash flows | 94,454 | — | — | 94,454 | ||||||||||||
At March 31, 2021 | ||||||||||||||||
Future cash inflows | 333,722 | — | — | 333,722 | ||||||||||||
Future production costs | (232,675 | ) | — | — | (232,675 | ) | ||||||||||
Future development costs | (31,722 | ) | — | — | (31,722 | ) | ||||||||||
Future income tax expenses | (10,603 | ) | — | — | (10,603 | ) | ||||||||||
Undiscounted future net cash flows | 58,722 | — | — | 58,722 | ||||||||||||
| 10 percent midyear annual discount for timing of estimated cash Flows | (19,577 | ) | — | — | (19,577 | ) | ||||||||||
| Standardized measure of discounted future net cash flows | 39,145 | — | — | 39,145 | ||||||||||||
At March 31, 2020 | ||||||||||||||||
Future cash inflows | 493,984 | — | — | 493,984 | ||||||||||||
Future production costs | (301,972 | ) | — | — | (301,972 | ) | ||||||||||
Future development costs | (28,465 | ) | — | — | (28,465 | ) | ||||||||||
Future income tax expenses | (43,544 | ) | — | — | (43,544 | ) | ||||||||||
Undiscounted future net cash flows | 120,003 | — | — | 120,003 | ||||||||||||
| 10 percent midyear annual discount for timing of estimated cash Flows | (33,298 | ) | — | — | (33,298 | ) | ||||||||||
| Standardized measure of discounted future net cash flows | 86,705 | — | — | 86,705 | ||||||||||||
F-1
2
4
Supplementary Information on Oil and Gas Exploration and Production (Unaudited)
(v) | Standardized measure of discounted future net cash flows relating to proved oil and gas quantities and changes therein (continued) |
India ( ₹ | Sri Lanka ( ₹ | South Africa ( ₹ | Total ( ₹ | |||||||||||||
Balance at April 1, 2021 | 39,145 | — | — | 39,145 | ||||||||||||
| Sales and transfers of oil and gas, net of production cost | (65,680 | ) | — | — | (65,680 | ) | ||||||||||
| Development cost incurred | 10,590 | — | — | 10,590 | ||||||||||||
| Net change due to purchases and sales of minerals in place | — | — | — | — | ||||||||||||
| Net change due to extensions, discoveries and improved recovery less related costs | 8 | — | — | 8 | ||||||||||||
| Net change due to revisions in quantity estimates | (22,829 | ) | — | — | (22,829 | ) | ||||||||||
| Net change in prices, transfer prices and in production cost | 116,478 | — | — | 116,478 | ||||||||||||
| Changes in estimated future development costs | 45,813 | — | — | 45,813 | ||||||||||||
| Accretion of discount | 4,974 | — | — | 4,974 | ||||||||||||
| Net change in income taxes | (34,045 | ) | — | (34,045 | ) | |||||||||||
| Timing | — | — | — | — | ||||||||||||
Balance at March 31, 2022 | 94,454 | — | — | 94,454 | ||||||||||||
Balance at April 1, 2020 | 86,705 | — | — | 86,705 | ||||||||||||
| Sales and transfers of oil and gas, net of production cost | (35,349 | ) | — | — | (35,349 | ) | ||||||||||
| Development cost incurred | 8,720 | — | — | 8,720 | ||||||||||||
| Net change due to purchases and sales of minerals in place | — | — | — | — | ||||||||||||
| Net change due to extensions, discoveries and improved recovery less related costs | 354 | 354 | ||||||||||||||
| Net change due to revisions in quantity estimates | 12,944 | — | — | 12,944 | ||||||||||||
| Net change in prices, transfer prices and in production cost | (58,612 | ) | — | — | (58,612 | ) | ||||||||||
| Changes in estimated future development costs | (13,021 | ) | — | — | (13,021 | ) | ||||||||||
| Accretion of discount | 13,026 | — | — | 13,026 | ||||||||||||
| Net change in income taxes | 24,378 | — | — | 24,378 | ||||||||||||
| Timing | — | — | — | — | ||||||||||||
Balance at March 31, 2021 | 39,145 | — | — | 39,145 | ||||||||||||
Balance at April 1, 2019 | 114,044 | — | — | 114,044 | ||||||||||||
| Sales and transfers of oil and gas, net of production cost | (80,409 | ) | — | — | (80,409 | ) | ||||||||||
| Development cost incurred | 39,114 | — | — | 39,114 | ||||||||||||
| Net change due to purchases and sales of minerals in place | — | — | — | — | ||||||||||||
| Net change due to extensions, discoveries and improved recovery less related costs | 43 | — | — | 43 | ||||||||||||
| Net change due to revisions in quantity estimates | 13,595 | — | — | 13,595 | ||||||||||||
| Net change in prices, transfer prices and in production cost | (35,288 | ) | — | — | (35,288 | ) | ||||||||||
| Changes in estimated future development costs | (436 | ) | — | — | (436 | ) | ||||||||||
| Accretion of discount | 18,193 | — | — | 18,193 | ||||||||||||
| Net change in income taxes | 17,849 | — | — | 17,849 | ||||||||||||
| Timing | — | — | — | — | ||||||||||||
Balance at March 31, 2020 | 86,705 | — | — | 86,705 | ||||||||||||
F-1
2
5