UNITED STATES
SECURITIES AND EXCHANGE COMMISSION
Washington, D.C. 20549
FORM 10-K/A
Amendment No. 2
(MARK ONE)
x ANNUAL REPORT PURSUANT TO SECTION 13, 15(d), OR 37 OF THE
SECURITIES EXCHANGE ACT OF 1934
For the fiscal year ended September 30, 2007
OR
o TRANSITION REPORT PURSUANT TO SECTION 13 OR 15(d) OF
THE SECURITIES EXCHANGE ACT OF 1934
For the transition period from _____ to _____
Commission file number 000-52313
TENNESSEE VALLEY AUTHORITY
(Exact name of registrant as specified in its charter)
| | | |
A corporate agency of the United States created by an act of Congress (State or other jurisdiction of incorporation or organization) | | 62-0474417 (IRS Employer Identification No.) |
400 W. Summit Hill Drive Knoxville, Tennessee (Address of principal executive offices) | | 37902 (Zip Code) |
(865) 632-2101
Registrant’s telephone number, including area code
Securities registered pursuant to Section 12(b) of the Act: None
Securities registered pursuant to Section 12(g) of the Act: None
Indicate by check mark if the registrant is a well-known seasoned issuer, as defined in Rule 405 of the Securities Act.
Yes o No x
Indicate by check mark if the registrant is not required to file reports pursuant to Section 13, Section 15(d), or Section 37 of the Securities Exchange Act. Yes o No x
Indicate by check mark whether the registrant (1) has filed all reports required to be filed by Section 13, 15(d), or 37 of the Securities Exchange Act of 1934 during the preceding 12 months (or for such shorter period that the registrant was required to file such reports), and (2) has been subject to such filing requirements for the past 90 days.
Yes x No o
Indicate by check mark if disclosure of delinquent filers pursuant to Item 405 of Regulation S-K is not contained herein and will not be contained, to the best of registrant’s knowledge, in definitive proxy or information statements incorporated by reference in Part III of this Form 10-K or any amendment to this Form 10-K. x
Indicate by check mark whether the registrant is a large accelerated filer, an accelerated filer, a non-accelerated filer, or a smaller reporting company. See the definitions of “large accelerated filer,” “accelerated filer,” and “smaller reporting company” in Rule 12b-2 of the Securities Exchange Act. (Check one):
Large accelerated filer o Accelerated filer o
Non-accelerated filer x Smaller reporting company o
(Do not check if a smaller reporting company)
Indicate by check mark whether the registrant is a shell company (as defined in Rule 12b-2 of the Securities Exchange Act). Yes o No x
Explanatory Note
In this Amendment No. 2 to the Annual Report on Form 10-K/A for the fiscal year ended September 30, 2007 (“Form 10-K/A No. 2”), the Tennessee Valley Authority (“TVA”) is restating the financial statements for the years ended September 30, 2007 and 2006, primarily to restate revenue associated with an accounting error in the financial statements included in the original Annual Report on Form 10-K (the “Original 10-K”). The error was discovered during TVA’s review of its unbilled revenue estimation process.
TVA is primarily a wholesale provider of power to distributor customers (“distributors”) that resell the power to end users at retail rates. Under TVA’s end-use billing arrangements with distributors, TVA relies on distributors to report their end-use sales. Because of the delay between the wholesale delivery of power to the distributor and the report of end-use sales to TVA, TVA must estimate the unbilled revenue at the end of each financial reporting period. In September 2006, TVA implemented a change in methodology for estimating unbilled revenue for electricity sales which resulted in an increase of $232 million in unbilled revenue (2.6 percent of operating revenue) for 2006.
The estimation process implemented in September 2006 utilized the distributors’ average rates and an estimate of the number of days of revenue outstanding to reflect the delay in reporting the end-use sales to TVA (“days outstanding”). The number of days outstanding was derived using a procedure similar to a cross-correlation calculation that compared the monthly retail load to the monthly wholesale load. The intent was to reflect in the unbilled estimate the end-use sales that would be reported that month by distributors plus any remaining sales that would not be reported until the following month due to the delay between wholesale delivery and end-use reporting.
TVA has determined that the process implemented in September 2006 overestimated the days outstanding and that this overestimation resulted in an error in recording unbilled revenue and unbilled receivables. The previous unbilled process also failed to consider the annual true-up of each distributor’s reported distribution losses. The annual true-up reconciles total end-use kilowatt-hour (“kWh”) sales and revenue reported by each distributor with the kWh sales recorded for each distributor at wholesale.
TVA has used a new process for estimating unbilled revenue for 2006 and 2007 in this Form 10-K/A No. 2. This process carries over only the portion of sales from the distributor’s meter read date to the month-end. Those sales, along with the current month sales, are then priced at rates based on each distributor’s customer and product mix. Additionally, the true-up component has been added to the unbilled calculation to reflect any timing differences that occur between the retail and wholesale billing cycles. Due to the new process, an adjustment was made to increase revenue in 2007 by $73 million (less than one percent of operating revenues) and to decrease revenue by $200 million (approximately 2.2 percent of operating revenues) in 2006.
The restatement of unbilled revenue also affected TVA’s fuel cost adjustment (“FCA”) calculation. The FCA is a mechanism by which TVA collects the direct cost of fuel used in its generating facilities and also the energy costs of purchased power used to serve power demand. Implementation of the FCA occurred in October 2006 as a joint effort between TVA and its customers. The goal of the FCA is timely recovery of fuel-related expenses to reduce the volatility driven by fuel and purchased power markets. Under TVA’s FCA methodology, adjustments to rates are based primarily on the difference between forecasted and actual expenses for the upcoming quarter as well as the difference between forecasted and actual revenues for the upcoming quarter. Because the FCA adjustments are forward-looking, there is typically a difference between what is collected in rates and what actual expense is realized over the course of the quarter. This difference is added to or subtracted from a deferred account on TVA’s balance sheet.
The restatement of unbilled revenue changed TVA’s forecasted revenues, and since forecasted revenues are a major component of the FCA calculation, the change in forecasted revenues required a restatement of the amounts in TVA’s deferred FCA account. In the Original 10-K, TVA reported a FCA deferred balance of $197 million at September 30, 2007, which was restated to a deferred balance of $150 million. Of the $150 million, $18 million is a deferred asset and $132 million is a current receivable.
The unbilled revenue error also affected the application of distributor prepayments. The balance in the distributors’ unbilled accounts receivable is offset by a reduction in the advance collections of those distributors who make prepayments for their power. As a result of the change in unbilled revenue, the balances in the unbilled receivable and advance collections accounts were also adjusted. The adjustment related to distributor prepayments had no effect on the account balances as of September 30, 2007 and increased the balance in the receivable and advance collections accounts by $1 million as of September 30, 2006.
In light of the need for this restatement, TVA has identified a material weakness in its internal control over financial reporting related to its unbilled revenue calculation, and has concluded that its disclosure controls and procedures were not effective as of September 30, 2007, solely because of this material weakness. To rectify the material weakness, the new method of calculating the unbilled revenue estimate described above was used for periods presented in this Form 10-K/A No. 2. See Item 9A, Controls and Procedures, for additional information regarding controls and procedures related to this material weakness.
TVA has also included in the appropriate periods in its restated consolidated financial statements other miscellaneous adjustments that were deemed to be not material by management, either individually or in the aggregate, and therefore were corrected in the period in which they were identified. These adjustments primarily include accounting for closed capital projects and related depreciation, reserves for legal proceedings, and timing of payable recognition and are described in more detail in Note 2.
The effects of these restatements and miscellaneous adjustments on TVA's consolidated financial statements as of and for the years ended September 30, 2007, and 2006, including quarterly data, are described in Note 2 and Note 17. The restatements had no impact on TVA’s cash or cash equivalents.
For the convenience of the reader, TVA is refiling its entire Annual Report on Form 10-K/A for the fiscal year ended September 30, 2007, by means of this Form 10-K/A No. 2. However, except for the information affected by the restatement, TVA has not materially updated the information contained herein for events or transactions occurring subsequent to the dates the Original 10-K and Amendment No. 1 to the Original 10-K (“10-K/A No. 1”) were filed with the SEC. TVA recommends that this Form 10- K/A No. 2 be read in conjunction with the reports and any amendments thereto TVA has filed with the SEC subsequent to the filing date of the Original 10-K and 10-K/A No. 1.
The following items have been amended principally as a result of, and to reflect, the restatement, and no other information in the Original 10-K and 10-K/A No. 1 is amended hereby as a result of the restatement:
Part I – Item 1 – Business
Part I – Item IA – Risk Factors
Part I – Item 3 – Legal Proceedings
Part II – Item 6 – Selected Financial Data
Part II – Item 7 – Management's Discussion and Analysis of Financial Condition and Results of Operations
Part II – Item 8 – Financial Statements and Supplementary Data
Part II – Item 9A – Controls and Procedures
Part III – Item 11 – Executive Compensation
Part IV – Item 15 – Exhibits and Financial Statements
TVA is also filing updated certifications by the Chief Executive Officer and Chief Financial Officer as exhibits to this Form 10-K/A No. 2.
This Form 10-K/A No. 2 is not superseding or restating financial statements contained in TVA’s quarterly reports on Form 10-Q for the quarters ended March 31, 2008, or December 31, 2007, or any current report on Form 8-K filed subsequent to September 30, 2007. However, the financial statements for the quarters ended March 31, 2008 and December 31, 2007, which are contained in the quarterly reports on Form 10-Q for the quarters then ended, have also been restated in amended quarterly reports on Form 10-Q/A, which TVA plans to file as soon as practicable after the filing of this Form 10-K/A No. 2. See Note 17. Accordingly, the information in the quarterly reports on Form 10-Q for the quarters ended March 31, 2008, and December 31, 2007, should be considered in light of the information in this Form 10-K/A No. 2.
The financial statements for the quarters ended March 31, 2008, and December 31, 2007, which are contained in the quarterly reports on Form 10-Q for the quarters then ended, are being restated in amended quarterly reports on Form 10-Q/A, which TVA plans to file as soon as practicable after the filing of this Form 10-K/A No. 2.
TVA has not separately amended its Annual Report on Form 10-K for the fiscal year ended September 30, 2006, or its Quarterly Reports on Form 10-Q for the quarterly periods for the fiscal years ended September 30, 2007 and 2006. Consequently, the financial and other information contained in such reports should be read in conjunction with the restated financial data for these fiscal periods, which is set forth in this Form 10-K/A No.2. See Note 17.
This Form 10-K/A No. 2 contains forward-looking statements relating to future events and future performance. All statements other than those that are purely historical may be forward-looking statements.
In certain cases, forward-looking statements can be identified by the use of words such as “may,” “will,” “should,” “expect,” “anticipate,” “believe,” “intend,” “project,” “plan,” “predict,” “assume,” “forecast,” “estimate,” “objective,” “possible,” “probably,” “likely,” “potential,” or other similar expressions.
Examples of forward-looking statements include, but are not limited to:
| • | Statements regarding strategic objectives; |
| • | Projections regarding potential rate actions; |
| • | Estimates of costs of certain asset retirement obligations; |
| • | Estimates regarding power and energy forecasts; |
| • | Expectations about the adequacy of TVA’s pension plans, nuclear decommissioning trust, and asset retirement trust; |
| • | Estimates regarding the reduction of bonds, notes, and other evidences of indebtedness, lease/leaseback commitments, and power prepayment obligations; |
| • | Estimates of amounts to be reclassified from other comprehensive income to earnings over the next year; |
| • | TVA’s plans to continue using short-term debt to meet current obligations; and |
| • | The anticipated cost and timetable for placing Watts Bar Unit 2 in service. |
Although the Tennessee Valley Authority (“TVA”) believes that the assumptions underlying the forward-looking statements are reasonable, TVA does not guarantee the accuracy of these statements. Numerous factors could cause actual results to differ materially from those in the forward-looking statements. These factors include, among other things:
| • | New laws, regulations, and administrative orders, especially those related to: |
| – | TVA’s protected service area, |
| – | The sole authority of the TVA Board to set power rates, |
| – | Various environmental and nuclear matters, |
| – | TVA’s management of the Tennessee River system, |
| – | TVA’s credit rating, and |
| • | Performance of TVA’s generation and transmission assets; |
| • | Availability of fuel supplies; |
| • | Purchased power price volatility; |
| • | Events at facilities not owned by TVA that affect the supply of water to TVA’s generation facilities; |
| • | Compliance with existing environmental laws and regulations; |
| • | Significant delays or cost overruns in construction of generation and transmission assets; |
| • | Significant changes in demand for electricity; |
| • | Legal and administrative proceedings; |
| • | Weather conditions including drought; |
| • | Failure of transmission facilities; |
| • | Events at any nuclear facility, even one that is not owned by or licensed to TVA; |
| • | Catastrophic events such as fires, earthquakes, floods, tornadoes, pandemics, wars, terrorist activities, and other similar events, especially if these events occur in or near TVA’s service area; |
| • | Reliability of purchased power providers, fuel suppliers, and other counterparties; |
| • | Changes in the market price of commodities such as coal, uranium, natural gas, fuel oil, electricity, and emission allowances; |
| • | Changes in the prices of equity securities, debt securities, and other investments; |
| • | Changes in interest rates; |
| • | Creditworthiness of TVA, its counterparties, or its customers; |
| • | Rising pension costs and health care expenses; |
| • | Increases in TVA’s financial liability for decommissioning its nuclear facilities and retiring other assets; |
| • | Limitations on TVA’s ability to borrow money; |
| • | Changes in the economy; |
| • | Ineffectiveness of TVA’s disclosure controls and procedures, and its internal control over financial reporting; |
| • | Changes in accounting standards; |
| • | The loss of TVA’s ability to use regulatory accounting; |
| • | Problems attracting and retaining skilled workers; |
| • | Changes in the market for TVA securities; and |
Additionally, other risks that may cause actual results to differ from the predicted results are set forth in Item 1A, Risk Factors. New factors emerge from time to time, and it is not possible for management to predict all such factors or to assess the extent to which any factor or combination of factors may impact TVA’s business or cause results to differ materially from those contained in any forward-looking statement.
TVA undertakes no obligation to update any forward-looking statement to reflect developments that occur after the statement is made.
Fiscal Year
Unless otherwise indicated, years (2007, 2006, etc.) in this Annual Report refer to TVA’s fiscal years ended September 30. References to years in the biographical information about directors and executive officers in Item 10, Directors, Executive Officers and Corporate Governance are to calendar years.
Notes
References to “Notes” are to the Notes to Financial Statements contained in Item 8, Financial Statements and Supplementary Data.
Available Information
TVA's Annual Report on Form 10-K, Quarterly Reports on Form 10-Q, Current Reports on Form 8-K, and all amendments to those reports are made available on TVA's website, free of charge, as soon as reasonably practicable after such material is electronically filed with or furnished to the Securities and Exchange Commission ("SEC"). TVA's website is www.tva.gov. Information contained on TVA’s website shall not be deemed incorporated into, or to be a part of, this Annual Report. In addition, the public may read and copy any reports or other information that TVA files with the SEC at the SEC’s Public Reference Room at 100 F Street, N.E., Washington, D.C. 20549. The public may obtain information on the operation of the Public Reference Room by calling the SEC at 1-800-SEC-0330. TVA's SEC reports are also available to the public without charge from the website maintained by the SEC at www.sec.gov.
The Tennessee Valley Authority (“TVA”) is a wholly-owned corporate agency and instrumentality of the United States. TVA was created by the U.S. Congress in 1933 by virtue of the Tennessee Valley Authority Act of 1933, as amended, 16 U.S.C. §§ 831-831ee (as amended, the “TVA Act”). TVA was created to improve navigation on the Tennessee River, reduce flood damage, provide agricultural and industrial development, and provide electric power to the Tennessee Valley region. TVA manages the Tennessee River and its tributaries for multiple river-system purposes, such as navigation; flood damage reduction; power generation; environmental stewardship; shoreline use; and water supply for power plant operations, consumer use, recreation, and industry. TVA’s power system operations, however, constitute the majority of its activities and provide virtually all of its revenues.
Although TVA is similar to other power companies in many ways, there are many features that make it different. Some of these include:
| • | TVA was created by an act of the U.S. Congress and is a wholly-owned corporate agency of the United States. |
| • | Each member of TVA’s board of directors (the “TVA Board”) is appointed by the President of the United States with the advice and consent of the U.S. Senate. |
| • | TVA does not own real property; it holds real property as an agent for the United States. (Any reference in this Annual Report on Form 10-K (“Annual Report”) to TVA facilities or the ownership by TVA of facilities or real property refers to property held by TVA but owned by the United States.) |
| • | TVA is required to make payments to the U.S. Treasury as a repayment of and a return on the appropriation investment that the United States provided TVA for its power facilities (the “Power Facilities Appropriation Investment”). |
| • | TVA is not authorized to issue equity securities such as common or preferred stock. Accordingly, TVA finances its operations primarily with cash flows from operations and proceeds from issuing debt securities. |
| • | The TVA Board sets the rates TVA charges for power. In setting rates, the TVA Board must have due regard for the objective that power be sold at rates as low as are feasible. These rates are not subject to judicial review or review by any regulatory body. |
| • | TVA is exempt from paying federal income taxes and state and local taxes, but it must pay certain states and counties an amount in lieu of taxes equal to five percent of TVA’s gross revenues from the sale of power during the preceding year, excluding sales or deliveries to other federal agencies and off-system sales with other utilities, with a provision for minimum payments under certain circumstances. |
| • | TVA performs stewardship activities in connection with the Tennessee River and its tributaries and is required by federal law to fund these activities primarily with revenues from the power system and to a lesser extent with revenues from other sources. |
For a discussion of the more significant of these features, see Item 7, Management’s Discussion and Analysis of Financial Condition and Results of Operations — Business Overview.
TVA is governed by the TVA Board. The Consolidated Appropriations Act, 2005, amended the TVA Act by restructuring the TVA Board from three full-time members to nine part-time members, at least seven of whom must be legal residents of the TVA service area. TVA Board members are appointed by the President of the United States with the advice and consent of the U.S. Senate. After an initial phase-in period, TVA Board members serve five-year terms, and at least one member’s term ends each year. The TVA Board, among other things, establishes broad goals, objectives, and policies for TVA; establishes long-range plans to carry out these goals, objectives, and policies; approves annual budgets; and establishes a compensation plan for employees. Information about members of the TVA Board and TVA’s executive officers is discussed in Item 10, Directors, Executive Officers and Corporate Governance.
Strategy
On May 31, 2007, the TVA Board approved the 2007 Strategic Plan (“Strategic Plan”). The Strategic Plan focuses on TVA’s performance in the following five broad areas and establishes general guidelines for each area:
| • | CUSTOMERS: Maintain power reliability, provide competitive rates, and build trust with TVA’s customers; |
| • | PEOPLE: Build pride in TVA’s performance and reputation; |
| • | FINANCIAL: Adhere to a set of sound financial guiding principles to improve TVA’s fiscal performance; |
| • | ASSETS: Use TVA’s assets to meet market demand and deliver public value; and |
| • | OPERATIONS: Improve performance to be recognized as an industry leader. |
Performance Indicators
On September 27, 2007, the TVA Board adopted performance indicators for 2008 that are aligned with TVA’s Strategic Plan. These performance indicators are as follows:
2008 TVA Scorecard
TVA operates the nation’s largest public power system. TVA supplies power in most of Tennessee, northern Alabama, northeastern Mississippi, and southwestern Kentucky and in portions of northern Georgia, western North Carolina, and southwestern Virginia to a population of approximately 8.7 million people.
Subject to certain minor exceptions, TVA may not, without specific authorization from the U.S. Congress, enter into contracts which would have the effect of making it, or the distributor customers of its power, a source of power supply outside the area for which TVA or its distributor customers were the primary source of power supply on July 1, 1957. This statutory provision is referred to as the “fence” because it bounds TVA’s sales activities, essentially limiting TVA to power sales within a defined service area.
Correspondingly, the Federal Power Act (“FPA”), primarily through its anti-cherrypicking provision, prevents the Federal Energy Regulatory Commission (“FERC”) from ordering TVA to provide access to its transmission lines to others for the purpose of delivering power to customers within substantially all of its defined service area. The anti-cherrypicking provision reduces TVA’s exposure to loss of revenue.
Sales of electricity accounted for substantially all of TVA’s operating revenues in 2007, 2006, and 2005, amounting to $9.2 billion (restated), $8.8 billion (restated), and $7.7 billion, respectively. TVA’s revenues by state for the last three years are detailed in the table below.
Electricity Sales Revenues by State
For the years ended September 30
(in millions)
| | | | | | | | |
| | | 2007 | | | 2006* | | | 2005* | |
| | | As Restated | | As Restated | | | | |
| Alabama | | $ | 1,264 | | $ | 1,239 | | $ | 1,051 | |
| Georgia | | | 206 | | | 226 | | | 186 | |
| Kentucky | | | 1,084 | | | 902 | | | 830 | |
| Mississippi | | | 804 | | | 798 | | | 671 | |
| North Carolina | | | 58 | | | 36 | | | 38 | |
| Tennessee | | | 5,740 | | | 5,621 | | | 4,806 | |
| Virginia | | | 7 | | | 5 | | | 4 | |
| Subtotal | | | 9,163 | | | 8,827 | | | 7,586 | |
| Sale for resale | | | 17 | | | 13 | | | 95 | |
| Subtotal | | | 9,180 | | | 8,840 | | | 7,681 | |
| Other revenues | | | 146 | | | 143 | | | 111 | |
| Operating revenues | | $ | 9,326 | | $ | 8,983 | | $ | 7,792 | |
* See Note 1 — Reclassifications.
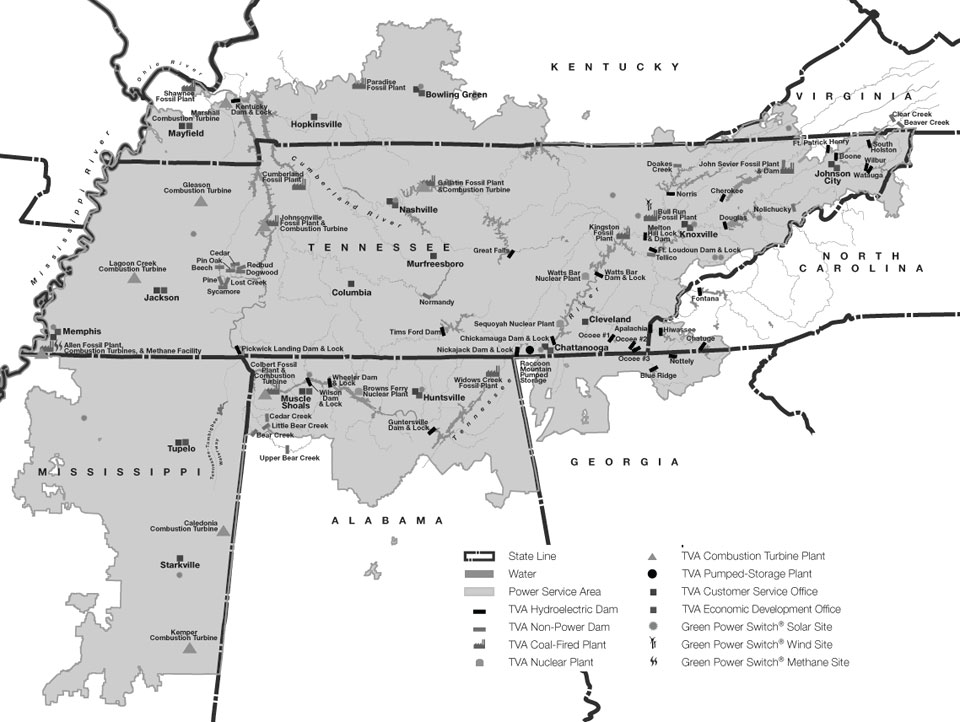
TVA SERVICE AREA
TVA is primarily a wholesaler of power. TVA sells power at wholesale to distributor customers, consisting of municipalities and cooperatives that resell the power to their customers at a retail rate. TVA also sells power to (1) directly served customers, consisting primarily of federal agencies and customers with large or unusual loads, and (2) exchange power customers (electric systems that border TVA’s service area) with which TVA has entered into exchange power arrangements.
Operating revenues by customer type for each of the last three years are set forth in the table below. In this table, sales to industries directly served are included in Industries directly served, and sales to federal agencies directly served and to exchange power customers are included in Federal agencies and other.
Operating Revenues by Customer Type For the years ended September 30 | |
| (in millions) | |
| | | | | | | | |
| | | 2007 | | | 2006* | | | 2005* | |
| | | As Restated | | As Restated | | | | |
| Municipalities and cooperatives | | $ | 7,847 | | $ | 7,659 | | $ | 6,539 | |
| Industries directly served | | | 1,221 | | | 1,065 | | | 961 | |
| Federal agencies and other | | | | | | | | | | |
| Federal agencies directly served | | | 95 | | | 103 | | | 86 | |
| Off-system sales | | | 17 | | | 13 | | | 95 | |
| Subtotal | | | 9,180 | | | 8,840 | | | 7,681 | |
| Other revenues | | | 146 | | | 143 | | | 111 | |
| Operating revenues | | $ | 9,326 | | $ | 8,983 | | $ | 7,792 | |
* See Note 1 — Reclassifications.
Municipalities and Cooperatives
Revenues from distributor customers accounted for 84.1 percent of TVA’s total operating revenues in 2007. At September 30, 2007, TVA had wholesale power contracts with 158 municipalities and cooperatives. All of these contracts require distributor customers to purchase all of their electric power and energy requirements from TVA.
All distributor customers purchase power under one of three basic termination notice arrangements:
| • | Contracts that require five years’ notice to terminate; |
| • | Contracts that require 10 years’ notice to terminate; and |
| • | Contracts that require 15 years’ notice to terminate. |
The number of distributor customers with the contract arrangements described above, the revenues derived from such arrangements in 2007, and the percentage of TVA’s 2007 total operating revenues represented by these revenues are summarized in the table below.
TVA Distributor Customer Contracts As of September 30, 2007 | |
Contract Arrangement | | Number of Distributor Customers | | | Sales to Distributor Customers in 2007 | | | Percentage of Total Operating Revenues in 2007 | |
| | | | | | (in millions) | | | | |
| | | | | | As Restated | | | As Restated | |
| 15-Year termination notice | | | 5 | | | $ | 87 | | | | 0.9 | % |
| 10-Year termination notice | | | 48 | | | | 2,597 | | | | 27.8 | % |
| 5-Year termination notice * | | | 102 | | | | 5,112 | | | | 54.8 | % |
| Notice given - less than 5 years remaining * | | | 3 | | | | 51 | | | | 0.6 | % |
| Total | | | 158 | | | $ | 7,847 | | | | 84.1 | % |
| * | Ordinarily the distributor customer and TVA have the same termination notice period; however, in contracts with six of the distributor customers with five-year termination notices, TVA has a 10-year termination notice (which becomes a five-year termination notice if TVA loses its discretionary wholesale rate-setting authority). |
TVA’s two largest distributor customers — Memphis Light, Gas and Water Division (“MLGW”) and Nashville Electric Service (“NES”) — have contracts with five-year and 10-year termination notice periods, respectively. Although no single customer accounted for 10 percent or more of TVA’s total operating revenues in 2007, sales to MLGW and NES accounted for 8.6 percent and 7.9 percent, respectively. In 2004, TVA and MLGW entered into a prepayment agreement under which MLGW prepaid TVA $1.5 billion for the future costs for a portion of the electricity to be delivered by TVA to MLGW over a period of 180 months. See Note 1 — Energy Prepayment Obligations for more information about this prepayment arrangement.
On September 26, 2006, the city of Bristol, Virginia, announced that it had selected TVA as the new power provider for its municipal electric system, Bristol Virginia Utilities (“BVU”), beginning in January 2008. TVA had provided wholesale power to BVU from 1945 to 1997. The contract has a minimum 15-year term, and a five-year termination notice may not be given until January 2018. The rates under this contract are intended to recover the cost of reintegrating BVU into TVA’s power-supply plan and serving its customer load.
All of the power contracts between TVA and the distributor customers provide for purchase of power by the distributor customers at the rates established by the TVA Board, which, beginning with 2007, are adjusted quarterly to reflect changing fuel and purchased power costs. See Item 1, Business — Rate Actions. In addition, most of the power contracts between TVA and the distributor customers specify the resale rates that distributor customers charge their power customers. These resale rates are divided into the classifications of residential, general power, and manufacturing. The general power and manufacturing classifications are further divided into subclassifications according to their load size. These rates are revised from time to time to reflect changes in costs, including changes in the wholesale cost of power, and are designed to conform to the TVA Act’s objective of providing an adequate supply of power at the lowest feasible rates.
Termination Notices
At September 30, 2006, six of TVA’s distributor customers had notices in effect terminating their power contracts with TVA. In November 2006, TVA made an offer, which ended January 10, 2007, to allow these six power distributors a grace period to return to TVA without being subject to reintegration fees. Any distributor choosing to rescind its contract termination notice after January 10, 2007, would be required to pay the additional costs to resume planning for its future power supply needs.
Subsequently, Warren Rural Electric Cooperative Corporation (“Warren”), Duck River Electric Membership Corporation, and Glasgow Electric Plant Board rescinded their termination notices in response to this offer. Monticello Electric Plant Board, Princeton Electric Plant Board, and Paducah Power System did not accept the offer to rescind. The contracts of the remaining three distributors will all terminate by January 2010. Sales in 2007 to the three remaining distributor customers amounted to $51 million, or 0.6 percent of TVA’s operating revenues in 2007.
The table below lists the names and locations of the three distributor customers whose termination notices were still in effect as of September 30, 2007, their contract termination dates, the amount of revenues that TVA generated by selling power to these distributor customers in 2007, and the percentage of TVA’s total 2007 operating revenues represented by these revenues.
Distributor Customers with Termination Notices in Effect
As of September 30, 2007
(in millions)
Distributor Customer | Location | Date of Termination of Power Contract | | TVA Sales to Distributor Customer in 2007 | | | Percentage of TVA Operating Revenues in 2007 | |
| | | | | As Restated | | | As Restated | |
| Monticello Electric Plant Board | Kentucky | November 2008 | | $ | 6 | | | | 0.1 | % |
| Paducah Power System | Kentucky | December 2009 | | | 39 | | | | 0.4 | % |
| Princeton Electric Plant Board | Kentucky | January 2010 | | | 6 | | | | 0.1 | % |
| Total | | | | $ | 51 | | | | 0.6 | % |
Other Customers
Revenues from industrial customers directly served accounted for 13.1 percent of TVA’s total operating revenues in 2007. In 2007, contracts for customers directly served were generally for terms from five to 10 years. These contracts are subject to termination by TVA or the customer upon a minimum notice period that varies according to the customer’s contract demand and the period of time service has been provided.
The United States Enrichment Corporation (“USEC”) is TVA’s largest industrial customer directly served. Sales to USEC for its Paducah, Kentucky, facility represented 5.5 percent of TVA’s total operating revenues in 2007. TVA’s current contract with USEC expires on May 31, 2012. USEC is currently rated 'CCC' by Standard & Poor's and 'Caa2' by Moody's Investors Service. As a result of USEC’s credit ratings, it has provided credit assurance to TVA, per the terms of its power contract. In January 2004, USEC announced its decision to construct a new commercial centrifuge facility in Piketon, Ohio, which is outside TVA’s service area. Once this new facility is opened, it is unclear how much electricity USEC will acquire from TVA for its Paducah, Kentucky, facility. However, the electric power requirements of USEC, or of its successor at that site, are expected to be substantially less than their current level.
TVA is self-regulated with respect to rates and the TVA Act gives the TVA Board sole responsibility for establishing the rates TVA charges for power. These rates are not subject to judicial review or to review or approval by any state or federal regulatory body.
According to the TVA Act, TVA is required to charge rates for power which will produce gross revenues sufficient to provide funds for:
| • | Operation, maintenance, and administration of its power system; |
| • | Payments to states and counties in lieu of taxes; |
| • | Debt service on outstanding indebtedness; |
| • | Payments to the U.S. Treasury in repayment of and as a return on the Power Facilities Appropriation Investment; and |
| • | Such additional margin as the TVA Board may consider desirable for investment in power system assets, retirement of outstanding bonds, notes, or other evidences of indebtedness (“Bonds”) in advance of maturity, additional reduction of the Power Facilities Appropriation Investment, and other purposes connected with TVA’s power business. |
In setting TVA’s rates, the TVA Board is charged by the TVA Act to have due regard for the primary objectives of the TVA Act, including the objective that power shall be sold at rates as low as are feasible. See Note 1 — General.
Revenue Requirements
In setting rates to cover the costs set out in the TVA Act, TVA uses a debt-service coverage (“DSC”) methodology to derive annual revenue requirements in a manner similar to that used by other public power entities that also use the DSC rate methodology. The DSC method is essentially a measure of an organization’s ability to cover its operating costs and to satisfy its obligations to pay principal and interest on debt. TVA believes this method is appropriate because of TVA’s debt-intensive capital structure. This ratemaking approach is particularly suitable for use by highly leveraged enterprises (i.e., financed primarily, if not entirely, by debt capital).
The revenue requirements (or projected costs) are calculated under the DSC method as the sum of the following components:
| • | Fuel and purchased power costs; |
| • | Operating and maintenance costs; |
Once the revenue requirements (or projected costs) are determined, this amount is compared to the projected revenues for the year in question, at existing rates, to arrive at the shortfall or surplus of revenues as compared to the projected costs. Subject to TVA Board approval, power rates would be adjusted to a level sufficient to produce revenues approximately equal to projected costs. This methodology reflects the cause-and-effect relationship between a regulated entity’s costs and the corresponding rates the entity charges for its regulated products and services.
Fuel Cost Adjustment
On July 28, 2006, the TVA Board implemented a fuel cost adjustment (“FCA”) to be used quarterly to adjust TVA’s rates to reflect changing fuel and purchased power costs beginning in 2007. The FCA was initially set to zero and had its first impact on rates effective January 1, 2007. The FCA rate adjustment on January 1, 2007, was 0.01 cents per kilowatt-hour, the rate adjustment on April 1, 2007, was 0.084 cents per kilowatt-hour, and the rate adjustment on July 1, 2007, was 0.087 cents per kilowatt-hour. These 2007 rate adjustments produced an estimated $82 million in revenue. As of September 30, 2007, TVA had recognized a regulatory asset of $150 million representing deferred power costs to be recovered through the FCA adjustments in future periods. The FCA rate adjustment on October 1, 2007, was 0.432 cents per kilowatt-hour. Based upon the FCA calculation methodology in use as of October 1, 2007, the FCA was expected to produce an estimated $159 million in revenue during the first quarter of 2008.
Under TVA’s FCA methodology, adjustments to rates are based on the difference between forecasted and baseline (budgeted) costs for the upcoming quarter. Because the FCA adjustments are forward-looking, there is typically a difference between what is collected in rates and what actual expense is realized over the course of the quarter. This difference is added to or deducted from a deferred account on TVA’s balance sheet. Each quarterly adjustment includes a core FCA adjustment plus one half of the deferred balance. The higher or lower costs added to or taken away from the deferred balance sheet account are then amortized to expense in the periods in which they are to be collected in revenues. This allows better matching of the revenues with associated expenses.
TVA’s cash flow can be negatively impacted by the FCA process, however. Under the methodology, some of the FCA portion of higher fuel and purchased power expense realized during the quarter is placed in the deferred account to be collected in rates in later periods. The timing of the collection of revenues related to the FCA does not coincide with the cash expended for fuel and purchased power consumed. See Item 7, Management’s Discussion and Analysis of Financial Condition and Results of Operations — Executive Summary — Challenges During 2007.
Reserve for Future Generation
Also included in the 2007 rate base was a reserve for future generation to fund additional generating capacity. The reserve for generation was calculated as 1.05 percent of TVA’s billed firm power sales since it was based on firm demand and energy. Firm sales are those that TVA has no contractual right to interrupt. TVA collected $76 million during 2007 which it applied to the purchase of two combustion turbine facilities. See Note 1 — Reserve for Future Generation. The reserve for generation was not extended beyond 2007.
Environmental Rate Adjustment
In 2003, the TVA Board approved a wholesale rate increase of 6.1 percent designed to cover TVA investment in equipment associated with its clean air program. This rate adjustment is scheduled to terminate in 2013.
TVA produces forecasts of future load and energy requirements using multiple models driven by historical TVA loads and regional economic forecasts of employment, population, and electricity and gas prices. The best models are then chosen with the result being a range of load forecasts. Numerous factors, such as weather conditions and the health of the regional economy, could cause actual results to differ materially from TVA’s forecasts. See Forward-Looking Information. As outlined in the Strategic Plan, TVA believes that new generation sources will be needed to meet load growth under most likely scenarios. See Item 1, Business — Governance — Strategy.
General
TVA’s power generating facilities in operation at September 30, 2007, included 29 conventional hydroelectric sites, one pumped storage hydroelectric site, 11 coal-fired sites, three nuclear sites, eight combustion turbine sites, two diesel generator sites, one wind energy site, one digester gas site, and 16 solar energy sites. In addition, TVA acquires power under power purchase agreements of varying duration as well as short-term contracts of less than 24-hour duration (spot market).
TVA-Owned Generation Facilities
The following table summarizes TVA’s net generation in millions of kilowatt-hours by generating source and the percentage of all electric power generated by TVA for the years indicated:
Power Supply from TVA-Owned Generation Facilities
For the years ended September 30
(millions of kWh)
| | | 2007 | | | 2006 | | | 2005 | | | 2004 | | | 2003 | |
| | | | | | | | | | | | | | | | |
| Coal-fired | | | 100,169 | | | 64 | % | | | 99,598 | | | 64 | % | | | 98,361 | | | 62 | % | | | 94,618 | | | 61 | % | | | 90,958 | | | 60 | % |
| Nuclear | | | 46,441 | | | 30 | % | | | 45,313 | | | 29 | % | | | 45,156 | | | 28 | % | | | 46,003 | | | 30 | % | | | 43,167 | | | 29 | % |
| Hydroelectric | | | 9,047 | | | 6 | % | | | 9,961 | | | 6 | % | | | 15,723 | | | 10 | % | | | 13,916 | | | 9 | % | | | 16,103 | | | 11 | % |
| CCombustion turbine and diesel generators | | | 705 | | <1 | % | | | 613 | | <1 | % | | | 595 | | <1 | % | | | 278 | | <1 | % | | | 817 | | <1 | % |
| Renewable resources * | | | 27 | | <1 | % | | | 36 | | <1 | % | | | 47 | | <1 | % | | | 35 | | <1 | % | | | 21 | | <1 | % |
| Total | | | 156,389 | | | 100 | % | | | 155,521 | | | 100 | % | | | 159,882 | | | 100 | % | | | 154,850 | | | 100 | % | | | 151,066 | | | 100 | % |
Note:
| | * | Renewable resources for years 2003 through 2006 have been adjusted to remove renewable resources amounts that were acquired under purchased power agreements and included in this table in TVA’s 2006 Annual Reports on Forms 10-K and 10-K/A. These adjustments resulted in reductions in the amount of renewable resources by 11 million kWh for 2003, 13 million kWh for 2004, 14 million kWh for 2005, and 15 million kWh for 2006. Also, for years 2003 through 2006 the following amounts related to TVA’s digester gas cofiring site have been reclassified from Coal-fired to Renewable resources: 17 million kWh for 2003, 30 million kWh for 2004, 43 million kWh for 2005, and 32 million kWh for 2006. Renewable resource facilities include a digester gas cofiring site, a wind energy site, and solar energy sites. |
The following table indicates TVA’s average fuel expense by generation-type for the years indicated:
Fuel Expense Per kWh
For the years ended September 30
(cents/kWh)
| | | 2007 | | | 2006 | | | 2005 | | | 2004 | | | 2003 | |
| | | | | | | | | | | | | | | | |
| Coal | | | 2.13 | | | | 2.02 | | | | 1.65 | | | | 1.48 | | | | 1.43 | |
| Natural gas and fuel oil | | | 7.00 | | | | 10.65 | | | | 11.44 | | | | 9.01 | | | | 7.61 | |
| Nuclear | | | 0.41 | | | | 0.38 | | | | 0.39 | | | | 0.39 | | | | 0.39 | |
| Average fuel cost per kWh net thermal generation from all sources | | | 1.61 | | | | 1.54 | | | | 1.30 | | | | 1.14 | | | | 1.14 | |
Coal-Fired. TVA has 11 coal-fired power sites consisting of 59 units. At September 30, 2007, these facilities accounted for 15,052 megawatts of winter net dependable capacity. Net dependable capacity is defined as the ability of an electric system, generating unit, or other system component to carry or generate power for a specified time period excluding any fluctuations in capacity that may occur due to planned outages, unplanned outages, and deratings. TVA’s coal-fired units were placed in service between 1951 and 1973. See Item 7, Management’s Discussion and Analysis of Financial Condition and Results of Operations — Executive Summary — Challenges During 2007.
Nuclear. TVA has three nuclear sites consisting of six units in operation. At September 30, 2007, these facilities accounted for 6,898 megawatts of winter net dependable capacity. For a detailed discussion of TVA’s nuclear power program, see Item 1, Business — Nuclear. For a discussion of challenges faced by TVA’s nuclear power program during 2007, see Item 7, Management’s Discussion and Analysis of Financial Condition and Results of Operations — Executive Summary — Challenges During 2007.
Hydroelectric. TVA has 29 conventional hydroelectric sites consisting of 109 units. In addition, TVA has one pumped storage facility consisting of four units. At September 30, 2007, these facilities accounted for 5,186 megawatts of winter net dependable capacity. The amount of electricity that TVA is able to generate from its hydroelectric plants depends on a number of factors outside TVA’s control, including the amount of precipitation, runoff, initial water levels, the need for water for competing water management objectives, and the availability of its hydroelectric generation plants. When these factors are unfavorable, TVA must increase its reliance on more expensive generation plants and purchased power. See Item 7, Management’s Discussion and Analysis of Financial Condition and Results of Operations — Executive Summary — Challenges During 2007 — Weather Conditions.
Combustion Turbines and Future Combined Cycle Facility. As of September 30, 2007, TVA had eight combustion turbine generating facilities consisting of 83 combustion turbine units providing a maximum of 6,258 megawatts of winter net dependable capacity. All of the units are quick-start peaking facilities used during periods of high demand, and all but three of the units are fueled by both natural gas and fuel oil. As of September 30, 2007, 24 of the combustion turbine units were leased to private entities and leased back to TVA under long-term leases. See Note 13 — Other Financing Obligations.
In 2007, TVA acquired and re-commissioned combustion turbine facilities in Marshall County, Kentucky, and Gleason, Tennessee. Together, these facilities include 11 units and provide 1,296 megawatts of winter net dependable capacity (included in the total above). In addition, in September 2007, the TVA Board approved the acquisition and the construction of a combined cycle facility at a former combustion turbine site of approximately 80 acres located in southwest Tennessee. Now known as Lagoon Creek 3, the unfinished site contains turbine foundations and substantial ancillary equipment. With an anticipated commercial operation date of June 2010, the facility is expected to have a planned winter net dependable capacity of approximately 600 megawatts. TVA completed acquisition of the site in October 2007.
Diesel Generators. TVA has two diesel generator plants consisting of nine units. At September 30, 2007, these facilities provided 13 megawatts of winter net dependable capacity.
Renewable Resources. TVA has one wind energy site with three wind turbines, one digester gas cofiring site, and 16 solar energy sites. At September 30, 2007, the digester gas cofiring site provided TVA with about three megawatts of renewable capacity. In addition, the wind energy site and the solar energy sites provided two megawatts of capacity, but because of the nature of this capacity, it is not considered to be winter net dependable capacity.
Purchased Power and Other Agreements
TVA acquires power from a variety of power producers through long-term and short-term power purchase agreements as well as through spot market purchases. During 2007, TVA acquired 32 percent of the power that it purchased on the spot market, 41 percent through short-term power purchase agreements, and 27 percent through long-term power purchase agreements that expire more than one year after September 30, 2007.
At September 30, 2007, TVA’s long-term power purchase agreements provided TVA with 3,504 megawatts of winter net dependable capacity. Counterparties to contracts for 1,308 megawatts of this capacity were in bankruptcy, but the counterparties have continued to perform under their power purchase agreements with TVA throughout their bankruptcy proceedings. See Item 7, Management’s Discussion and Analysis of Financial Condition and Results of Operations — Risk Management Activities — Credit Risk.
A portion of TVA’s capacity provided by power purchase agreements is provided under long-term contracts that expire between 2010 and 2032, and the most significant of these contracts are discussed below.
| • | Caledonia Combined Cycle Facility. During the third quarter of 2007, TVA entered into an operating lease agreement and various related contracts for the Caledonia combined cycle facility located near Columbus, Mississippi, with a commencement date of July 1, 2007. The lease agreement has a 15-year term expiring on February 28, 2022. The Caledonia facility consists of three combined cycle units with a winter net dependable capacity of 892 megawatts. A conversion services agreement providing for power purchases from the Caledonia facility was terminated as of July 1, 2007, the lease commencement date, and dispatch control was shifted to TVA on July 3, 2007. Under the lease, TVA will assume plant operations no later than January 1, 2008. The lease agreement further provides for an end-of-term purchase option. |
| • | Choctaw Generation, L.P. TVA has contracted with Choctaw Generation L.P. (“Choctaw”) for 440 megawatts of winter net dependable capacity from a lignite-fired generating plant in Chester, Mississippi. TVA’s contract with Choctaw expires on March 31, 2032. On October 9, 2007, Moody's Investors Service downgraded Choctaw to 'Ba1.' Choctaw has continued to perform under the contract and has provided credit assurance to TVA, per the terms of the contract. |
| • | Alcoa Power Generating, Inc. Four hydroelectric plants owned by Alcoa Power Generating, Inc. (“APGI”), formerly known as Tapoco, Inc, are operated in coordination with the TVA system. Under contractual arrangements with APGI which terminate on June 20, 2010, TVA dispatches the electric power generated at these facilities and uses it to partially supply Alcoa’s energy needs. TVA’s arrangement with APGI provides 348 megawatts of winter net dependable capacity. |
| • | Invenergy TN LLC. TVA has contracted with Invenergy TN LLC for 27 megawatts of wind energy generation from 15 wind turbine generators located on Buffalo Mountain near Oak Ridge, Tennessee. Because of the nature of wind conditions in the TVA service area, these generators provide energy benefits but are not included in TVA’s net dependable capacity total. TVA's contract with Invenergy TN LLC expires on December 31, 2024. |
| | • | Southeastern Power Administration. TVA, along with others, contracted with the Southeastern Power Administration (“SEPA”) to obtain power from eight U.S. Army Corps of Engineers hydroelectric facilities on the Cumberland River system. The agreement with SEPA can be terminated upon three years’ notice, but this notice of termination may not become effective prior to June 30, 2017. The contract originally required SEPA to provide TVA an annual minimum of 1,500 hours of power for each megawatt of TVA’s 405 megawatt allocation, and all surplus power from the Cumberland River system. Because hydroelectric production has been reduced at two of the hydroelectric facilities on the Cumberland River system (Wolf Creek and Center Hill Dams) and because of reductions in the summer stream flow on the Cumberland River, SEPA declared “force majeure” on February 25, 2007. SEPA then instituted an emergency operating plan that: |
| | – | Eliminates its obligation to provide any affected customer (including TVA) with a minimum amount of power; |
| | – | Provides for all affected customers (except TVA) to receive a pro rata share of a portion of the gross hourly generation from the eight Cumberland River hydroelectric facilities; |
| | – | Provides for TVA to receive all of the remaining hourly generation (minus station service for those facilities); |
| | – | Eliminates the payment of demand charges by customers (including TVA) since there is significantly reduced dependable capacity on the Cumberland River system; and |
| | – | Increases the rate charged per kilowatt-hour of energy received by SEPA’s customers (including TVA), because SEPA is legally required to charge rates that cover its costs. |
It is unclear how long the emergency operating plan will remain in effect.
Under the Public Utility Regulatory Policies Act of 1978, as amended by the Energy Policy Act of 1992 and the Energy Policy Act of 2005, TVA is required to purchase energy from qualifying facilities, cogenerators and small power producers at TVA's avoided cost of self-generating or purchasing this energy from another source.
During the past five years, TVA supplemented its power generation through power purchases as follows:
Purchased Power *
For the years ended September 30
| | | 2007 | | | 2006 | | | 2005 | | | 2004 | | | 2003 | |
| Millions of kWh | | | 22,141 | | | | 19,019 | | | | 14,892 | | | | 14,025 | | | | 15,181 | |
| Percent of TVA’s Total Power Supply | | | 12.4 | | | | 10.9 | | | | 8.5 | | | | 8.3 | | | | 9.1 | |
Note
| | * | Purchased power amounts for years 2004, 2005, and 2006 have been adjusted to remove APGI purchases and include them as a credit to Industries directly served. |
For more information regarding TVA’s power purchase obligations, see Note 15 — Commitments — Power Purchase Obligations.
Purchasing power from others will likely remain a part of how TVA meets the power needs of its service area. The Strategic Plan establishes a goal of balancing production capabilities with power supply requirements within five percent. Achieving this goal will require TVA to reduce its reliance on purchased power. In 2007, TVA took several actions which will help reduce its dependence on purchased power.
| | • | TVA purchased two additional combustion turbine facilities in December 2006 that together provide approximately 1,296 megawatts of winter net dependable capacity. See Item 1, Business — Power Supply — Combustion Turbines and Future Combined Cycle Facility. |
| | • | Browns Ferry Nuclear Plant Unit 1 (“Browns Ferry Unit 1”) began commercial operation on August 1, 2007. Browns Ferry Unit 1 is initially providing additional generating capacity of approximately 1,150 megawatts and is expected eventually to provide approximately 1,280 megawatts of capacity. See Item 1, Business — Nuclear. |
| | • | On August 1, 2007, the TVA Board approved the completion of Watts Bar Nuclear Plant Unit 2 (“Watts Bar Unit 2”) upon which construction was halted in 1985. Completing Watts Bar Unit 2 is expected to take 60 months and cost approximately $2.5 billion, excluding allowance for funds used during construction and initial nuclear fuel core costs. When completed, the nuclear unit is expected to provide 1,180 megawatts of capacity. See Item 1, Business — Nuclear. |
| | • | In September 2007, the TVA Board approved proceeding with the construction of a combined cycle facility at a former combustion turbine site of approximately 80 acres located in southwest Tennessee. See Item 1, Business — Power Supply — Combustion Turbines and Future Combined Cycle Facility. |
Net Dependable Capacity
The following table summarizes the winter and summer net dependable capacity in megawatts TVA had available as of September 30, 2007:
NET DEPENDABLE CAPACITY
As of September 30, 2007
Source of Capacity | Location | | Number of Units | | | Winter Net Dependable Capacity 1 (MW) | | | Summer Net Dependable Capacity 1 (MW) | | Date First Unit Placed in Service | Date Last Unit Placed in Service |
| | | | | | | | | | | | | |
| TVA-OWNED GENERATING FACILITIES | | | | | | | | | | | |
| Coal-Fired | | | | | | | | | | | | |
| Allen | Tennessee | | | 3 | | | | 744 | | | | 735 | | 1959 | 1959 |
| Bull Run | Tennessee | | | 1 | | | | 889 | | | | 889 | | 1967 | 1967 |
| Colbert | Alabama | | | 5 | | | | 1,197 | | | | 1,180 | | 1955 | 1965 |
| Cumberland | Tennessee | | | 2 | | | | 2,532 | | | | 2,478 | | 1973 | 1973 |
| Gallatin | Tennessee | | | 4 | | | | 976 | | | | 964 | | 1956 | 1959 |
| John Sevier | Tennessee | | | 4 | | | | 712 | | | | 704 | | 1955 | 1957 |
| Johnsonville | Tennessee | | | 10 | | | | 1,248 | | | | 1,200 | | 1951 | 1959 |
| Kingston | Tennessee | | | 9 | | | | 1,433 | | | | 1,411 | | 1954 | 1955 |
| Paradise | Kentucky | | | 3 | | | | 2,324 | | | | 2,201 | | 1963 | 1970 |
| Shawnee | Kentucky | | | 10 | | | | 1,369 | | | | 1,329 | | 1953 | 1956 |
| Widows Creek | Alabama | | | 8 | | | | 1,628 | | | | 1,604 | | 1952 | 1965 |
| Total Coal-Fired | | | | 59 | | | | 15,052 | | | | 14,695 | | | |
| | | | | | | | | | | | | | | | |
| | | | | | | | | | | | | | | | |
| Nuclear | | | | | | | | | | | | | | | |
| Browns Ferry | Alabama | | | 3 | | | | 3,383 | | | | 3,280 | | 1974 | 1977 |
| Sequoyah | Tennessee | | | 2 | | | | 2,333 | | | | 2,282 | | 1981 | 1982 |
| Watts Bar | Tennessee | | | 1 | | | | 1,182 | | | | 1,109 | | 1996 | 1996 |
| Total Nuclear | | | | 6 | | | | 6,898 | | | | 6,671 | | | |
| | | | | | | | | | | | | | | | |
| Hydroelectric | | | | | | | | | | | | | | | |
| Conventional Plants | Alabama | | | 36 | | | | 1,146 | | | | 1,188 | | 1925 | 1962 |
| | Georgia | | | 2 | | | | 32 | | | | 35 | | 1931 | 1956 |
| | Kentucky | | | 5 | | | | 165 | | | | 218 | | 1944 | 1948 |
| | North Carolina | | | 6 | | | | 455 | | | | 489 | | 1940 | 1956 |
| | Tennessee | | | 60 | | | | 1,735 | | | | 1,918 | | 1912 | 1972 |
| Pumped Storage | Tennessee | | | 4 | | | | 1,653 | | | | 1,653 | | 1978 | 1979 |
| Total Hydroelectric | | | | 113 | | | | 5,186 | | | | 5,501 | | | |
| | | | | | | | | | | | | | | | |
Combustion Turbine 2 | | | | | | | | | | | | | | | |
| Allen | Tennessee | | | 20 | | | | 597 | | | | 478 | | 1971 | 1972 |
| Colbert | Alabama | | | 8 | | | | 480 | | | | 384 | | 1972 | 1972 |
| Gallatin | Tennessee | | | 8 | | | | 790 | | | | 636 | | 1975 | 2000 |
Gleason 3 | Tennessee | | | 3 | | | | 540 | | | | 519 | | 2007 | 2007 |
| Johnsonville | Tennessee | | | 20 | | | | 1,509 | | | | 1,218 | | 1975 | 2000 |
| Kemper | Mississippi | | | 4 | | | | 390 | | | | 329 | | 2001 | 2001 |
| Lagoon Creek | Tennessee | | | 12 | | | | 1,196 | | | | 1,009 | | 2002 | 2002 |
| Marshall County | Kentucky | | | 8 | | | | 756 | | | | 659 | | 2007 | 2007 |
| Total Combustion Turbine | | | | 83 | | | | 6,258 | | | | 5,232 | | | |
| | | | | | | | | | | | | | | | |
| | | | | | | | | | | | | | | | |
| Diesel Generator | | | | | | | | | | | | | | | |
| Meridian | Mississippi | | | 5 | | | | 9 | | | | 9 | | 1998 | 1998 |
| Albertville | Alabama | | | 4 | | | | 4 | | | | 4 | | 2000 | 2000 |
| Total Diesel Generators | | | | 9 | | | | 13 | | | | 13 | | | |
| | | | | | | | | | | | | | | | |
| Renewable Resources | | | | | | | | 3 | | | | 3 | | | |
| | | | | | | | | | | | | | | | |
| Total TVA-Owned Generation Facilities | | | | | | | | 33,410 | | | | 32,115 | | | |
| | | | | | | | | | | | | | | | |
| POWER PURCHASE AND OTHER AGREEMENTS | | | | | | | | | | | | | | |
| APGI | | | | | | | | 348 | | | | 347 | | | |
| Caledonia | | | | | | | | 892 | | | | 768 | | | |
| Choctaw | | | | | | | | 440 | | | | 440 | | | |
| Other Power Purchase Agreements | | | | | | | | 1,824 | | | | 1,872 | | | |
| Total Power Purchase Agreements | | | | | | | | 3,504 | | | | 3,427 | | | |
| Total Net Dependable Capacity | | | | | | | | 36,914 | | | | 35,542 | | | |
| | (1) | Net dependable capacity is defined as the ability of an electric system, generating unit, or other system component to carry or generate power for a specified time period excluding any fluctuations in capacity that may occur due to planned outages, unplanned outages, and deratings. |
| | (2) | As of September 30, 2007, 24 of TVA’s combustion turbine units were leased to private entities and leased back to TVA under long-term leases. |
| | (3) | Plant does not have firm gas transportation or the ability to burn oil as a back-up fuel; however, TVA forecasts available gas supply for Gleason throughout the fiscal year. |
Overview
TVA has six operating nuclear units and has resumed construction of one nuclear unit that is scheduled to be placed in service in 2013. Selected statistics of each of these units are included in the table below.
TVA Nuclear Power
As of September 30, 2007
Nuclear Unit | Status | | Installed Capacity (MW) | | | Net Capacity Factor for 2007 | | | Date of Expiration of Operating License | | | Date of Expiration of Construction License | |
| | | | | | | | | | | | | | |
| Sequoyah Unit 1 | Operating | | | 1,221 | | | | 98.5 | | | 2020 | | | – | |
| Sequoyah Unit 2 | Operating | | | 1,221 | | | | 89.5 | | | 2021 | | | – | |
| Browns Ferry Unit 1 | Operating | | | 1,150 | | | | 85.6 | (1) | | 2033 | | | – | |
| Browns Ferry Unit 2 | Operating | | | 1,190 | | | | 74.0 | | | 2034 | | | – | |
| Browns Ferry Unit 3 | Operating | | | 1,190 | | | | 94.1 | | | 2036 | | | – | |
| Watts Bar Unit 1 | Operating | | | 1,230 | | | | 82.3 | | | 2035 | | | – | |
Watts Bar Unit 2 (2) | Construction to resume in December 2007 | | | – | | | | – | | | – | | | 2010 | |
| | | | | | | | | | | | | | | | |
(1) Browns Ferry Unit 1 capacity factor is derived for a period of commercial operation from August 1, 2007, through September 30, 2007.
(2) Completion of construction of Watts Bar Unit 2 was approved by the TVA Board on August 1, 2007.
TVA began a significant nuclear plant construction program in 1966 to meet projected system load growth. At the height of its construction program, TVA had 17 units either under construction or in commercial operation at seven plant sites. In 1982, TVA canceled construction of four units because of lower than expected load growth, and TVA canceled four more units in 1984 for similar reasons.
By August 1985, TVA had delayed construction of two units each at Watts Bar and Bellefonte Nuclear Plants and had shut down its three-unit Browns Ferry Nuclear Plant and two-unit Sequoyah Nuclear Plant because of an increasing number of technical and operational problems. The Nuclear Regulatory Commission (“NRC”) required TVA to address program and management deficiencies and to provide its corrective actions to the NRC before restarting any of its licensed nuclear units or requesting a license for Watts Bar Unit 1. After implementing a comprehensive recovery plan, TVA restarted Sequoyah Unit 2 in May 1988 and Sequoyah Unit 1 in November 1988. TVA restarted Browns Ferry Unit 2 in May 1991 and Browns Ferry Unit 3 in November 1995. Construction of Watts Bar Unit 1 was successfully completed, and the unit commenced full power commercial operation in May 1996.
In May 2002, the TVA Board initiated activities to return Browns Ferry Unit 1 to service, and on August 1, 2007, Browns Ferry Unit 1 returned to commercial operation. The total amount invested in the Unit 1 restart project through the commercial operation date was $1.84 billion excluding allowance for funds used during construction (“AFUDC”) of $269 million. TVA completed Browns Ferry Unit 1 during 2007 with a total project cost overrun of $90 million or five percent of the original projected cost. The cost overruns were due in part to the scope of work associated with extended power uprate being greater than planned. Browns Ferry Unit 1 provides additional generating capacity of approximately 1,150 megawatts and is expected to eventually provide 1,280 megawatts of capacity.
In November 2005, TVA canceled the construction of Units 1 and 2 at Bellefonte Nuclear Plant. Two months prior to the cancellation of these units, the Bellefonte site was selected by NuStart Development LLC (“NuStart”) as one of two sites for the development of a combined license application for two new reactors using the Westinghouse Advanced Passive 1000 (“AP1000”) reactor design. NuStart is an industry consortium composed of 10 utilities and two reactor vendors whose purpose is to satisfactorily demonstrate the new NRC licensing process for advanced design nuclear plants. TVA submitted its combined license application to the NRC for Bellefonte Units 3 and 4 in October 2007. If approved, the license to build and operate the plant would be issued to TVA. Obtaining the necessary license will give TVA more certainty about the cost and schedule of a nuclear option for future decisions. The TVA Board has not made a decision to construct a new plant at the Bellefonte site.
On August 1, 2007, the TVA Board approved completing the construction of Watts Bar Unit 2. Prior to the approval, TVA conducted a detailed scoping, estimating, and planning study to estimate the project’s cost, schedule, and risks. Separately, TVA prepared a report evaluating potential environmental impacts as required by the National Environmental Policy Act. TVA has an NRC construction permit for Watts Bar Unit 2 that expires in 2010 and will need to seek an extension of the permit in order to complete construction activities. TVA will seek an operating license under NRC regulations, and this process will include an opportunity for a public hearing. Completing Watts Bar Unit 2 is expected to take approximately 60 months and cost approximately $2.5 billion, excluding AFUDC. Preliminary project activities began in October 2007. In accordance with NRC policy, TVA notified the NRC that it may resume unrestricted construction activities as early as December 3, 2007. Current plans are to begin construction related activities by the end of December 2007. When completed, Watts Bar Unit 2 is expected to provide 1,180 megawatts of capacity.
Spent Nuclear Fuel
Under the Nuclear Waste Policy Act of 1982, TVA (and other domestic nuclear utility licensees) entered into a contract with the U.S. Department of Energy (“DOE”) for the disposal of spent nuclear fuel. Payments to DOE are based upon TVA’s nuclear generation and charged to nuclear fuel expense. Although the contracts called for DOE to begin accepting spent nuclear fuel from the utilities by January 31, 1998, DOE announced that it would not begin receiving spent nuclear fuel from any domestic nuclear utility until 2010 at the earliest. TVA, like other nuclear utilities, stores spent nuclear fuel in pools of borated water at its nuclear sites. TVA would have had sufficient space to continue to store spent nuclear fuel in those storage pools at its Sequoyah and Browns Ferry Nuclear Plants indefinitely had DOE begun accepting spent nuclear fuel. DOE’s failure to do so in a timely manner required TVA to construct dry cask storage facilities at its Sequoyah and Browns Ferry Nuclear Plants and to purchase special storage containers for the spent nuclear fuel. The Sequoyah and Browns Ferry dry cask storage facilities have been constructed and approved by the NRC and have been in use since 2004 and 2005, respectively, providing storage capacity through 2030 at Sequoyah and 2019 at Browns Ferry. Watts Bar has sufficient storage capacity in its spent fuel pool to last until approximately 2015.
To recover the cost of providing long-term, on-site storage for spent nuclear fuel, TVA filed a breach of contract suit against the United States in the Court of Federal Claims in 2001. In August 2006, the United States paid TVA almost $35 million in damages awarded by the Court of Federal Claims, which partially offset the construction costs of the dry cask storage facilities that TVA incurred through 2004. TVA is pursuing additional claims against DOE to recover costs that TVA has incurred after 2004.
Low-Level Radioactive Waste
Low-level radioactive waste (“radwaste”) results from the normal operation of nuclear units and includes such materials as disposable protective clothing, mops, and filters. TVA has contracted to dispose of radwaste at a Barnwell, South Carolina, disposal facility through June 2008. As allowed by the Low-Level Radioactive Waste Policy Act, on July 1, 2008, the Barnwell, South Carolina, facility will close to radwaste generators located in states that are not members of the Atlantic Interstate Low-Level Radioactive Waste Management Compact ("Atlantic Compact"). Connecticut, New Jersey, and South Carolina are members of the Atlantic Compact. Accordingly, after June 2008, TVA will no longer be able to use this disposal facility and will have to consider other options, which may include storing some radwaste at its own facilities. TVA is capable of doing so for an extended period of time, and has done so in the past.
Nuclear Decommissioning Trust
TVA maintains a nuclear decommissioning trust to provide funding for the ultimate decommissioning of its nuclear power plants. The trust is invested in securities generally designed to achieve a return in line with overall equity market performance. The assets of the trust as of September 30, 2007, totaled $1.1 billion, which is greater than the present value of TVA’s estimated future nuclear decommissioning costs as computed under the NRC funding requirements but less than the present value of these costs as computed under Statement of Financial Accounting Standards No. 143, “Accounting for Asset Retirement Obligations.” See Note 15 — Contingencies — Decommissioning Costs.
Nuclear Insurance
The Price-Anderson Act provides a layered framework of protection to compensate for losses arising from a nuclear event. For the first layer, all NRC nuclear plant licensees, including TVA, purchase $300 million of nuclear liability insurance from American Nuclear Insurers for each plant with an operating license. Funds for the second layer, the Secondary Financial Program, would come from an assessment of up to $101 million from the licensees of each of the 104 NRC licensed reactors in the United States. The assessment for any nuclear accident would be limited to $15 million per year per unit. American Nuclear Insurers, under a contract with the NRC, administers the Secondary Financial Program. With its six licensed units, TVA could be required to pay a maximum of $604 million per nuclear incident, but it would have to pay no more than $90 million per incident in any one year. When the contributions of the nuclear plant licensees are added to the insurance proceeds of $300 million, over $10.7 billion would be available. Under the Price-Anderson Act, if the first two layers are exhausted, Congress is required to take action to provide additional funds to cover the additional losses.
TVA carries property, decommissioning, and decontamination insurance of $4.6 billion for its licensed nuclear plants, with up to $2.1 billion available for a loss at any one site, to cover the cost of stabilizing or shutting down a reactor after an accident. Some of this insurance, which is purchased from Nuclear Electric Insurance Limited (“NEIL”), may require the payment of retrospective premiums up to a maximum of approximately $66 million. On October 1, 2007, TVA endorsed the existing property policies for the Watts Bar Nuclear Plant site to add Builders Risk coverage for the construction of Unit 2. The addition of this coverage places the new maximum retrospective assessment at $70.5 million.
TVA purchases accidental outage (business interruption) insurance for TVA’s nuclear sites from NEIL. In the event that an accident covered by this policy takes a nuclear unit offline or keeps a nuclear unit offline, NEIL will pay TVA, after a waiting period, an indemnity (a set dollar amount per week) up to a maximum indemnity of $490 million per unit. This insurance policy may require the payment of retrospective premiums up to a maximum of approximately $24 million. See Note 15 — Contingencies — Nuclear Insurance.
Tritium-Related Services
TVA and DOE are engaged in a long-term interagency agreement under which TVA will, at DOE’s request, irradiate tritium producing burnable absorber rods to assist DOE in producing tritium. Tritium is used in nuclear weapons. This agreement, which ends in 2035, requires DOE to reimburse TVA for the costs that TVA incurs in connection with providing irradiation services and to pay TVA an irradiation services fee at a specified rate per tritium-producing rod over the entire operating cycle in which the tritium-producing rods are irradiated.
In September 2002, the NRC issued amendments to the operating licenses for the Watts Bar and Sequoyah Nuclear Plants, allowing TVA to provide irradiation services for DOE at these plants. The Watts Bar license amendment currently permits TVA to install up to 240 tritium-producing rods in Watts Bar Unit 1. Planned future license amendments would allow TVA to irradiate up to approximately 2,000 tritium-producing rods in the Watts Bar and Sequoyah reactors.
In general, tritium-producing rods are irradiated for a full cycle, which lasts about 18 months. At the end of the cycle, TVA removes the irradiated rods and loads them into a shipping cask. DOE then ships them to its tritium-extraction facility. TVA loads a fresh set of tritium-producing rods into the reactor during each refueling outage. Irradiating the tritium-producing rods does not affect TVA’s ability to operate the reactors to produce electricity.
TVA began irradiating tritium-producing rods at Watts Bar Unit 1 in the fall of 2003. TVA removed these rods from the reactor in the spring of 2005. DOE subsequently successfully shipped them to its tritium-extraction facility. At this time, no tritium-related services are being performed at the Sequoyah Nuclear Plant.
General
TVA’s consumption of various types of fuel depends largely on the demand for electricity by TVA’s customers, the availability of various generating units, and the availability and cost of fuel. The following table indicates TVA’s costs for various fuels for the years indicated:
Fuel Purchases for TVA-Owned Facilities
For the years ended September 30
(in millions)
| | | 2007 | | | 2006 | | | 2005 | | | 2004 | | | 2003 | |
| | | | | | | | | | | | | | | | |
| Coal | | $ | 1,922 | | | $ | 1,835 | | | $ | 1,495 | | | $ | 1,254 | | | $ | 1,242 | |
| Natural gas | | | 62 | | | | 60 | | | | 63 | | | | 22 | | | | 42 | |
| Fuel oil | | | 22 | | | | 46 | | | | 28 | | | | 17 | | | | 40 | |
| Uranium | | | 121 | | | | 71 | | | | 44 | | | | 16 | | | | 42 | |
| Total | | $ | 2,127 | | | $ | 2,012 | | | $ | 1,630 | | | $ | 1,309 | | | $ | 1,366 | |
TVA also has tolling agreements under which it buys power production from outside suppliers. Under these tolling agreements, TVA supplies the fuel to the outside supplier, and the outsider supplier converts the fuel into electricity. The following table indicates the cost of fuel supplied by TVA under these agreements and also the average fuel expense per kilowatt-hour for the years indicated:
Natural Gas Purchases and Average Fuel Expense for Tolling Plants
For the years ended September 30
| | | 2007 | | 2006 | | 2005 | | 2004 | | 2003 | |
| | | | | | | | | | | | |
| Cost of Fuel (in millions) | | $ | 430 | | $ | 288 | | $ | 159 | | $ | 10 | | $ | <1 | |
| Average Fuel Expense (cents/kWh) | | | 5.51 | | | 6.07 | | | 6.21 | | | 4.71 | | | 0.00 | |
Beginning with the implementation of the FCA mechanism on October 1, 2006, TVA’s rates are adjusted on a quarterly basis to reflect changing fuel and purchased power costs. See Item 1, Business — Rate Actions.
Coal
Coal consumption at TVA’s coal-fired generating facilities during 2007 was 46.5 million tons. As of September 30, 2007 and 2006, TVA had 23 days and 20 days of system-wide coal supply at full burn, respectively, with a net book value of coal inventory of $264 million and $214 million, respectively.
TVA utilizes both short-term and long-term coal contracts. Long-term coal contracts generally last longer than one year, while short-term contracts are usually for one year or less. During 2007, long-term contracts made up 89 percent of coal purchases and short-term contracts accounted for the remaining 11 percent. TVA plans to continue signing contracts of various lengths, terms, and coal quality to meet its expected burn and inventory requirements. During 2007, TVA purchased coal by basin as follows:
| • | 37 percent from the Illinois Basin; |
| • | 24 percent from the Powder River Basin in Wyoming; |
| • | 23 percent from the Uinta Basin of Utah and Colorado; and |
| • | 16 percent from the Appalachian Basin of Kentucky, Pennsylvania, Tennessee, Virginia, and West Virginia. |
Total system coal inventories were at or above target levels for all of 2007. During 2007, 42 percent of TVA’s coal supply was delivered by rail, 19 percent was delivered by barge, and 33 percent was delivered by a combination of barge and rail. The remainder was delivered by truck.
Natural Gas and Fuel Oil
During 2007, TVA purchased substantially all of its natural gas requirements from a variety of suppliers under contracts with terms of one year or less. TVA purchases substantially all of its natural gas to operate combustion turbine peaking units and to supply fuel under power purchase agreements in which TVA is the fuel supplier. At September 30, 2007, all but one of TVA’s combustion turbine plants were dual fuel capable, and TVA has fuel oil stored on each site for its dual-fuel combustion turbines as a backup to natural gas.
During 2007, TVA purchased substantially all of its fuel oil on the spot market. At September 30, 2007 and 2006, the net book value of TVA’s natural gas in inventory was $3 million and $2 million, respectively, and the net book value of TVA’s fuel oil in inventory was $50 million and $54 million, respectively.
Nuclear Fuel
Converting uranium to nuclear fuel generally involves four stages: the mining and milling of uranium ore to produce uranium concentrates; the conversion of uranium concentrates to uranium hexafluoride gas; enrichment of uranium hexafluoride; and the fabrication of the enriched uranium hexafluoride into usable fuel assemblies. TVA currently has 100 percent of its forward four-year (2008 through 2011) uranium mining and milling requirements either in inventory or under contract for its boiling water reactor units at Browns Ferry Nuclear Plant and has 100 percent of its forward four-year (2008 through 2011) uranium requirements under contract for its pressurized water reactor units at Sequoyah and Watts Bar Nuclear Plants. In addition, TVA has 100 percent of its conversion, enrichment, and fabrication needs under contract through 2011.
TVA, DOE, and some nuclear fuel contractors have entered into agreements that provide for the blending down of surplus DOE highly enriched uranium (uranium that is too highly enriched for use in a nuclear power plant) with other uranium. Under these agreements, the enriched uranium that results from this blending process, which is called blended low enriched uranium (“BLEU”), is fabricated into fuel that can be used in a nuclear power plant. This blended nuclear fuel was first loaded in a Browns Ferry reactor in 2005 and is expected to continue to be used to reload the Browns Ferry reactors through 2013. Plans are underway to begin using BLEU fuel in Sequoyah Unit 2 beginning in 2008.
Under the terms of an interagency agreement between DOE and TVA, in exchange for supplying highly enriched uranium materials for processing into usable BLEU fuel for TVA, DOE will participate to a degree in the savings generated by TVA’s use of this blended nuclear fuel. TVA anticipates these future payments could begin in 2009 and last until 2013. See Note 1 — Blended Low Enriched Uranium Program for a more detailed discussion of the BLEU project.
TVA owns all nuclear fuel held for its nuclear plants. As of September 30, 2007 and 2006, the net book value of this nuclear fuel was $602 million and $491 million, respectively.
For a discussion of TVA’s plans with respect to spent nuclear fuel storage, see Item 1, Business — Nuclear — Spent Nuclear Fuel.
The TVA transmission system is one of the largest in North America. The system delivered nearly 175 billion kilowatt-hours of electricity in 2007, and has operated with 99.999 percent reliability over the last eight years in delivering electricity to customers.
To the extent federal law allows access to the TVA transmission system, the TVA transmission organization offers transmission services to others to transmit power at wholesale in a manner that is comparable to TVA's own use of the transmission system. TVA has also adopted and operates in accordance with a published Standards of Conduct for Transmission Providers and appropriately separates its transmission functions from its marketing functions.
Also, TVA is cooperating with other transmission systems to improve regional coordination in the operation of the bulk transmission system. The initial step of this coordination effort was to establish a joint transmission reliability area with other public power systems. In 2002, TVA entered into reliability coordination agreements with Associated Electric Cooperative Inc., Big Rivers Electric Corporation, and East Kentucky Power Cooperative, Inc. In 2004, Electric Energy, Inc., joined this effort, and in 2006, TVA began providing reliability coordination services for E.ON U.S. subsidiaries Kentucky Utilities Company and Louisville Gas and Electric Company.
Consistent with these arrangements, TVA has been designated by the North American Electric Reliability Corporation (“NERC”) to serve as the reliability coordinator for parts of 11 states covering 199,000 square miles with a population of nearly 11 million people. As the reliability coordinator for this region, TVA is responsible for monitoring and helping to ensure the reliable operation of the bulk transmission system in a region that includes portions of Alabama, Georgia, Illinois, Iowa, Kentucky, Mississippi, Missouri, North Carolina, Oklahoma, Tennessee, and Virginia. TVA is one of 17 reliability coordinators in NERC.
Additionally, TVA, in its capacity as reliability coordinator, has executed a joint reliability coordination agreement with the Midwest Independent Transmission System Operator and PJM Interconnection, LLC to improve the reliability of the regional grid. This effort includes a coordinated approach to transmission capacity availability, system outage approval, congestion management, and transmission planning. Similar agreements to coordinate analysis and operational processes in support of regional transmission reliability have been executed with Entergy Services, Inc., Southwest Power Pool, Inc., Southern Company Services, Inc., and VACAR South RC (a Virginia Carolina reliability group).
Reliability Coordinator Map
A new interconnection, the Five Points - - Homewood project, was completed to address several contingency issues in the southern extreme of TVA's Mississippi service area. This interconnection with South Mississippi Electric Power Association is the first with a neighboring utility since 1993. TVA now has interconnections with 13 neighboring electric systems.
Mandatory compliance with certain reliability standards began on June 18, 2007. FERC issued its final rule on the Electric Reliability Organization (“ERO”) Reliability Standards, approving 83 of 107 proposed standards submitted by the North American Electric Reliability Corporation. The mandatory reliability standards apply to all users, owners, and operators of the bulk power system, including TVA, and both monetary and non-monetary penalties may be imposed for violations of the standards. The most serious violations can be subject to penalties of up to $1 million per day per violation. The rule directs the ERO to focus on the most serious violations during an initial period through December 31, 2007. To the best of its knowledge, TVA is operating in conformity with these reliability standards.
TVA is responsible for managing the Tennessee River and its tributaries – the United States’ fifth largest river system – to provide, among other things, year-round navigation, flood damage reduction, affordable and reliable electricity, and, consistent with these primary purposes, recreational opportunities, adequate water supply, improved water quality, and economic development. TVA operates 49 dams, which comprise its integrated reservoir system. Twenty-nine of these dams produce conventional hydroelectric power, and one additional project is solely a pumped storage hydroelectric project. The reservoir system provides 800 miles of commercially navigable waterway, and also provides significant flood reduction benefits both within the Tennessee River system and downstream on the lower Ohio and Mississippi Rivers. The reservoir system also provides a water supply for residential and industrial customers, as well as cooling water for some of TVA’s coal-fired and nuclear power plants.
TVA reservoirs and public lands provide outdoor recreation opportunities for millions of visitors each year. TVA has stewardship responsibility for approximately 293,000 acres of reservoir land, 11,000 miles of shoreline, and 650,000 acres of reservoir water surface available for recreation and other purposes. TVA furnishes over 100 recreation facilities such as campgrounds, boat ramps, fishing piers, and picnic areas.
Weather affects both the demand for and the market prices of electricity. TVA’s power system generally peaks in the summer, with a slightly lower peak in the winter. After meeting a peak demand of over 32,000 megawatts for the first time in 2006, TVA met peak demands that exceeded 33,000 megawatts six times in August 2007. TVA met its highest winter peak demand of 30,320 megawatts on January 31, 2007, and met its highest peak power demand ever, at 33,482 megawatts, late in the afternoon on August 16, 2007, when the average temperature across the Tennessee Valley was 102 degrees Fahrenheit. See Item 1A, Risk Factors, for a discussion of the potential impact of weather on TVA.
TVA uses weather degree days to measure the impact of weather on TVA’s power operations. Weather degree days measure the extent to which average temperatures in the five largest cities in TVA's service area vary from 65 degrees Fahrenheit. TVA calculates weather degree days for Memphis, Nashville, Knoxville, and Chattanooga, Tennessee, and Huntsville, Alabama, the five largest cities in TVA’s service area.
During 2007, TVA had five more heating degree days and 253 more cooling degree days than in 2006. The graph below shows the number of heating and cooling degree days for 2007, 2006, and 2005 as compared to the normal number of heating and cooling degree days. See Item 7, Management’s Discussion and Analysis of Financial Condition and Results of Operations — Executive Summary — Challenges During 2007 — Weather Conditions.
2007 was the driest year in the eastern Tennessee Valley in 118 years of record-keeping with rainfall 66 percent of normal for the year and runoff 54 percent of normal. Largely as a result of this low rainfall and runoff, TVA’s hydroelectric production for 2007 was slightly more than nine billion kilowatt-hours, which was nine percent, 42 percent, and 35 percent lower than 2006, 2005, and 2004, respectively.
The hot weather and low rainfall were also significant factors in causing TVA to reduce output at several generating plants during the period of mid-June through mid-September. During this period, temperatures on the Tennessee and Cumberland Rivers reached levels at which discharging cooling water from some of TVA’s plants into the rivers could have caused the permitted thermal limits for the rivers to be exceeded. While every effort was made to lower electrical output during low load periods (derates) to reduce financial and operational impacts, some derates were required during higher load daytime hours to meet the permitted temperature limits. These conditions caused TVA to rely heavily on purchased power and more expensive generation sources such as combustion turbines during 2007. See Item 7, Management’s Discussion and Analysis of Financial Condition and Results of Operations — Executive Summary —Challenges During 2007 — Weather Conditions.
TVA sells electricity in a service area that is largely free of competition from other electric power providers. This service area is defined primarily by two provisions of law: one called the “fence” and one called the “anti-cherrypicking” provision. The fence limits the region in which TVA or distributors of TVA power may provide power. The anti-cherrypicking provision limits the ability of others to use the TVA transmission system for the purpose of serving customers within TVA’s service area. Bristol, Virginia, was exempted from the anti-cherrypicking provision.
Recently there have been efforts to erode the protection of the anti-cherrypicking provision. FERC issued an order that would have required TVA to interconnect its transmission system with the transmission system of East Kentucky Power Cooperative, Inc. (“East Kentucky”) in what TVA believed was a violation of the anti-cherrypicking provision. See Item 3, Legal Proceedings. Additionally, Senators Jim Bunning and Mitch McConnell introduced the Access to Competitive Power Act of 2007 in the Senate that would, among other things, provide that the anti-cherrypicking provision would not apply with respect to any distributor which provided a termination notice to TVA before December 31, 2006, regardless of whether the notice was later withdrawn or rescinded. See Item 7, Management’s Discussion and Analysis of Financial Condition and Results of Operations — Legislative and Regulatory Matters. While the FERC action involving East Kentucky now appears to be moot and the proposed legislation has not made it to the Senate floor, the events illustrate how the protection to TVA’s service area provided by the anti-cherrypicking provision could be called into question and perhaps eliminated at some time in the future.
Congress
TVA exists pursuant to legislation enacted by Congress and carries on its operations in accordance with this legislation. Congress has the authority to change this legislation and thereby expand, reduce, or eliminate TVA’s activities, significantly change TVA’s structure, require TVA to sell all or a portion of its assets, or reduce the U.S. government's ownership interest in TVA. To allow TVA to operate more flexibly than a traditional government agency, Congress exempted TVA from some general federal laws that govern other agencies, such as laws related to the hiring of employees, the procurement of supplies and services, and the acquisition of land. Other federal laws enacted since the creation of TVA have been made applicable to TVA including those related to the protection of the environment, cultural resources, and civil rights laws.
Securities and Exchange Commission
Section 37 was added to the Securities Exchange Act of 1934, as amended (the “Exchange Act”), as part of the Consolidated Appropriations Act, 2005. Section 37 requires TVA to file with the Securities and Exchange Commission such periodic, current, and supplementary information, documents, and reports as would be required pursuant to section 13 of the Exchange Act if TVA were an issuer of a security registered pursuant to section 12 of the Exchange Act. TVA is also exempted by section 37 of the Exchange Act from complying with section 10A(m)(3) of the Exchange Act, which requires each member of a listed issuer’s audit committee to be an independent member of the board of directors of the issuer. Since TVA is an agency and instrumentality of the United States, securities issued or guaranteed by TVA are “exempted securities” under the Securities Act of 1933, as amended (the “Securities Act”), and may be offered and sold without registration under the Securities Act. In addition, securities issued or guaranteed by TVA are “exempted securities” and “government securities” under the Exchange Act. TVA is also exempt from sections 14(a)-(d) and 14(f)-(h) of the
Exchange Act (which address proxy solicitations) insofar as those sections relate to securities issued by TVA, and transactions in TVA securities are exempt from rules governing tender offers under Regulation 14E of the Exchange Act. In addition, since TVA securities are exempted securities under the Securities Act, TVA is exempt from the Trust Indenture Act of 1939 insofar as it relates to securities issued by TVA, and no independent trustee is required for these securities.
Federal Energy Regulatory Commission
TVA is not a “public utility” as defined in the Federal Power Act (“FPA”), a term which generally includes investor-owned utilities. Therefore, TVA is not subject to the full jurisdiction that FERC exercises over public utilities under the FPA. TVA is, however, an “electric utility” as defined in the FPA and, thus, is directly subject to certain aspects of FERC’s jurisdiction.
| • | Under section 210 of the FPA, TVA can be ordered to interconnect its transmission facilities with the electrical facilities of qualified generators and other electric utilities that meet certain requirements. It must be found that the requested interconnection is in the public interest and would either encourage conservation of energy or capital, optimize efficiency of facilities or resources, or improve reliability. The requirements of section 212 concerning the terms and conditions of interconnection, including reimbursement of costs, must also be met. |
| • | Under section 211 of the FPA, TVA can be ordered to transmit power at wholesale provided that the order does not impair the reliability of the TVA or surrounding systems and likewise meets the applicable requirements of section 212 concerning terms, conditions, and rates for service. Under section 211A of the FPA, TVA is subject to FERC review of the transmission rates and the terms and conditions of service that TVA provides others to ensure comparability of treatment of such service with TVA’s own use of its transmission system. With the exception of wheeling power to Bristol, Virginia, the anti-cherrypicking provision of the FPA precludes TVA from being ordered to wheel another supplier’s power to a customer if the power would be consumed within TVA’s defined service territory. |
| • | Sections 221 and 222 of the FPA, applicable to all market participants, including TVA, prohibit (i) using manipulative or deceptive devices or contrivances in connection with the purchase or sale of power or transmission services subject to FERC’s jurisdiction and (ii) reporting false information on the price of electricity sold at wholesale or the availability of transmission capacity to a federal agency with intent to fraudulently affect the data being compiled by the agency. |
| • | Section 206(e) of the FPA provides FERC with authority to order refunds of excessive prices on short-term sales (transactions lasting 31 days or less) by all market participants, including TVA, in market manipulation and price gouging situations if such sales are under a FERC-approved tariff. |
| • | Section 220 of the FPA provides FERC with authority to issue regulations requiring the reporting, on a timely basis, of information about the availability and prices of wholesale power and transmission service by all market participants, including TVA. |
| • | Under sections 306 and 307 of the FPA, FERC may investigate electric industry practices, including TVA’s operations previously mentioned that are subject to FERC’s jurisdiction. |
| • | Under sections 316 and 316A of the FPA, FERC has authority to impose criminal penalties and civil penalties of up to $1 million a day for each violation on entities subject to the provisions of Part II of the FPA, which includes the above provisions applicable to TVA. |
Finally, while not required to do so, TVA has elected to implement various FERC orders and regulations pertaining to public utilities on a voluntary basis to the extent that these are consistent with TVA’s obligations under the TVA Act.
For a discussion of legislation that could change FERC’s ability to regulate TVA, see Item 7, Management’s Discussion and Analysis of Financial Condition and Results of Operations — Legislative and Regulatory Matters.
Nuclear Regulatory Commission
TVA, like other utilities, operates its nuclear facilities in a highly regulated environment and is subject to the oversight of the NRC, an independent agency which sets the rules that users of radioactive materials must follow. The NRC has broad authority to impose requirements relating to the licensing, operation, and decommissioning of nuclear generating facilities. In addition, if TVA fails to comply with requirements promulgated by the NRC, the NRC has the authority to impose fines, shut down units, or modify, suspend, or revoke TVA’s operating licenses.
Environmental Protection Agency
TVA is subject to regulation by the Environmental Protection Agency (“EPA”) in a variety of areas, including air quality control, water quality control, and management and disposal of hazardous wastes. See Item 1, Business — Environmental Matters.
States
The Supremacy Clause of the U.S. Constitution prohibits states, without congressional consent, from regulating the manner in which the federal government conducts its activities. As a federal agency, TVA is exempt from regulation, control, and taxation by states except in certain areas such as air and water quality where Congress has given the states limited powers to regulate federal activities.
Other Federal Entities
TVA’s activities and records are also subject to review by various entities including TVA’s Office of Inspector General and the following agencies: the Government Accountability Office, the Congressional Budget Office, and the Office of Management and Budget.
TVA is not subject to federal income taxes, and neither TVA nor its property, franchises, or income are subject to taxation by states or their subdivisions. However, the TVA Act requires TVA to make payments in lieu of taxes to states and counties in which TVA conducts power operations and in which TVA has acquired properties previously subject to state and local taxation. The total amount of these payments is five percent of gross revenues from the sale of power during the preceding year excluding sales or deliveries to other federal agencies and off-system sales with other utilities, with a provision for minimum payments under certain circumstances. Distribution of in lieu of tax payments within a state is determined by individual state legislation.
TVA’s power generation activities, like those across the utility industry and in other industrial sectors, are subject to federal, state, and local environmental statutes and regulations. Major areas of regulation affecting TVA’s activities include air quality control, water quality control, and management and disposal of solid and hazardous wastes.
TVA has incurred, and expects to continue to incur, substantial capital and operating and maintenance costs to comply with evolving environmental requirements primarily associated with the operation of TVA’s 59 coal-fired generating units. While these evolving requirements will impact the operation of existing and new coal-fired and other fossil-fuel generating units, it is virtually certain that environmental requirements placed on the operation of these generating units will continue to become more restrictive. Litigation over emissions from coal-fired generating units is also occurring, including litigation against TVA. See Item 3, Legal Proceedings.
Several existing regulatory programs that apply to fossil-fuel units are becoming more stringent, and additional regulatory programs affecting fossil-fuel units were promulgated in 2005. These new regulatory programs include the Clean Air Interstate Rule (“CAIR”) and the Clean Air Mercury Rule (“CAMR”). CAIR requires significant additional utility reductions of emissions of sulfur dioxide (“SO2”) and nitrogen oxides (“NOx”) in the eastern half of the United States (including all of TVA’s operating area), and CAMR establishes caps for overall mercury emissions in two phases with the first phase becoming effective in 2010 and the second in 2018. TVA had previously estimated its total capital cost for reducing emissions from its power plants from 1977 through 2010 would reach $5.8 billion, $4.8 billion of which had already been spent as of September 30, 2007. TVA estimates that compliance with CAIR and CAMR could lead to additional costs of $3.0 billion to $3.6 billion in the decade beginning in 2011. As discussed in more detail below, there could be additional material costs if reductions of carbon dioxide (“CO2”) are mandated or if future legislative, regulatory, or judicial actions lead to more stringent emission reduction requirements. These costs cannot reasonably be predicted at this time.
In addition, an existing federal water regulation covering cooling water intake structures and temperatures may also become more stringent. In January 2007, the United States Court of Appeals for the Second Circuit Court (“Second Circuit”) remanded EPA’s rule on this subject. In response, EPA has suspended the rule, and several parties are seeking United States Supreme Court review of the Second Circuit decision. If the Second Circuit’s decision becomes law after all appeal processes and the issuance of a new rule, compliance is expected to be more costly for the power industry. TVA is unable at this time to estimate these costs.
Clean Air Developments
Air quality in the United States has significantly improved since the enactment of the modern Clean Air Act (“CAA”) in 1970. These air quality improvements are expected to continue as the CAA continues to be implemented and as programs evolve as a result of legislative and regulatory changes. Three substances emitted from coal-fired units have been the focus of emission reduction regulatory programs: SO2, NOx, and particulates. Expenditures related to clean air projects during 2007 and 2006 were approximately $239 million and $182 million, respectively. These figures include expenditures in 2007 of $7 million to continue to reduce NOx emissions through the installation of selective catalytic reduction (“SCR”) and selective non-catalytic reduction (“SNCR”) systems and $207 million for the installation of flue gas desulfurization systems (“scrubbers”) to continue to reduce SO2 emissions, each of which is explained in more detail below. The aforementioned estimate of $5.8 billion does not include additional capital costs of $3.0 billion to $3.6 billion that TVA expects to incur over the decade beginning in 2011 to comply with CAIR and CAMR. Increasingly stringent regulation of some or all of these substances, as well as mercury and possibly CO2, will continue to result in significant capital and operating costs for TVA’s coal-fired generating units.
Sulfur Dioxide. Coal-fired utilities have historically emitted large amounts of SO2 compared to today’s emissions. Utility SO2 emissions are currently regulated under the Federal Acid Rain Program and state programs designed to meet the National Ambient Air Quality Standards (“NAAQS”) for SO2 and fine particulate matter. Looking forward, additional regulation of SO2 emissions will result from implementation of the Regional Haze Program and CAIR. In May 2005, EPA finalized CAIR to reduce the interstate transport of fine particulate matter and ozone by requiring additional large reductions in utility emissions of NOX and SO2 from 28 eastern states. All seven states in TVA’s service area are submitting plans to EPA to implement CAIR through state rules and have only proposed a few minor modifications to the federal model rule which establishes an emission allowance driven program, capping regional emissions of SO2 and NOx among the targeted states. SO2 caps are reduced in two phases, 2010 and 2015.
Since 1977, TVA has reduced its SO2 emissions by approximately 80 percent by switching to lower-sulfur coals, re-powering a unit at its Shawnee Fossil Plant with Atmospheric Fluidized Bed Combustion (“AFBC”) technology, and installing scrubbers on seven of its larger units. TVA began construction in 2005 on its eighth scrubber at its Bull Run Fossil Plant and in 2006 began construction on two more scrubbers at its Kingston Fossil Plant as part of its previously announced plans to achieve a total SO2 emission reduction of 80 to 85 percent compared to the 1977 level. Additionally, TVA has switched, or plans to switch, to lower-sulfur coal at several additional units in the next few years. It is likely that additional emission reduction measures will have to be undertaken after these planned actions are completed to achieve compliance with CAIR and any future tightening of applicable requirements.
Nitrogen Oxides. Utility NOx emissions continue to be regulated under state programs to achieve and maintain EPA’s NAAQS for ozone, the Federal Acid Rain Program, the Regional Haze Program, and CAIR. Since 1995, TVA has reduced its NOx emissions during the summer (when ozone levels increase) by 81 percent by installing various controls including low-NOx burners and/or combustion controls on 58 of its 59 coal-fired units and installing SCRs on 21 of the largest units. (The AFBC unit at Shawnee Fossil Plant is inherently low NOx emitting.)
In 2005, TVA installed SNCR systems on two units to demonstrate long-term technology capability, and continued to operate the SNCR at Johnsonville Unit 1 through the 2007 ozone season. SNCRs generally have lower NOx removal capabilities than SCRs. Early in 2006, TVA began testing a High Energy Reagent Technology (“HERT”) on three units for potential future application. HERT is similar to SNCR but has higher removal capabilities than SNCRs. The initial HERT testing program was successful, and in 2007, TVA installed this technology on two coal-fired units (Johnsonville Unit 4 and John Sevier Unit 1) to demonstrate the HERT technology on a potentially permanent basis. Similar equipment is planned for installation on the other three John Sevier units and Johnsonville Units 2 and 3 by 2009.
TVA’s NOx emission reduction program is expected to continue to depend primarily on SCRs, but will also incorporate some mix of SNCRs and/or HERTs as TVA gains more experience with these technologies. These plans may change depending on the timing and severity of future regulatory developments affecting power plant emissions.
On June 21, 2007, EPA proposed lowering the eight-hour ozone NAAQS. This proposal began a process that is expected to lead to a final decision in March 2008 on revising the ozone standard. Meeting the more stringent EPA standards for ozone contained in the proposal will challenge states and communities in the Tennessee Valley and across the country.
The current primary standard, set in 1997, is 0.08 parts per million (“ppm”). EPA is proposing to lower the primary standard to between 0.075 ppm and 0.070 ppm, and is also proposing to add a new secondary ozone standard to address impacts on vegetation. If EPA adopts the proposed standards, many urban areas and surrounding counties in the Tennessee Valley and throughout the eastern United States are likely to be designated as “non-attainment” areas (defined as geographic areas where air quality does not meet standards). Non-attainment designations can have adverse economic implications for areas that are so designated. Existing emission sources in non-attainment areas can be required to install additional controls, and new sources planning to locate in such areas are required to meet more stringent emission control requirements and obtain offsets for their emissions from other sources in the non-attainment area. In addition, transportation projects, such as roadway expansions or repairs, must demonstrate conformity with state plans to achieve attainment status or risk the loss of federal highway funds. An increase in the number of counties in the Tennessee Valley designated as non-attainment areas is also likely to focus additional regulatory attention on all NOx emission sources including TVA sources.
Particulates/Opacity. Coarse particulates (defined as particles of 10 micrometers or larger), which include fly ash, have long been regulated by states to meet EPA’s NAAQS for particulate matter. All of TVA’s coal-fired units have been equipped with mechanical collectors, electrostatic precipitators, scrubbers, or baghouses, which have reduced particulate emissions from the TVA system by more than 99 percent compared to uncontrolled units. In 1997, EPA issued separate NAAQS for even smaller particles with a size of up to 2.5 micrometers (“fine particles”). In December 2004 and April 2005, EPA issued final determinations regarding the areas of the country which are not in attainment with the 1997 fine particles standard. Those non-attainment areas include counties and parts of counties in the Knoxville and Chattanooga, Tennessee, metropolitan areas. In September 2006, EPA revised the 1997 standards. The 2006 revisions tighten the 24-hour fine particle standard and retain the 1997 annual fine particle standard. EPA also decided to retain the existing 24-hour standard for coarse particles, but revoked the related annual standard. The last three years of monitoring data (2004 to 2006) for the Nashville, Chattanooga, Memphis, and Clarksville/Hopkinsville areas show that these areas will be close to meeting the more stringent 2006 24-hour and annual fine particle standards. Attainment designations are scheduled to be made by EPA in December 2008. CAIR is intended to help states attain the fine particle standards, and actions taken to reduce emissions under CAIR, including those planned by TVA, are expected to continue to reduce fine particle levels.
Issues regarding utility compliance with state opacity requirements are also increasing. Opacity measures the denseness (or color) of power plant plumes and has traditionally been used by states as a means of monitoring good maintenance and operation of particulate control equipment. Under some conditions, retrofitting a unit with additional equipment to better control SO2 and NOx emissions can adversely affect opacity performance, and TVA and other utilities are now addressing this issue. There are also disputes and lawsuits with special interest groups over the role of continuous opacity monitors in determining compliance with opacity limitations, and TVA has received an adverse decision in one such lawsuit. See Item 3, Legal Proceedings.
Mercury. In March 2005, the EPA issued CAMR, which establishes caps for overall mercury emissions in two phases, with the first phase becoming effective in 2010 and the second in 2018. It allows the states to regulate mercury emissions through a market-based cap-and-trade program. All of the states in which TVA operates potentially affected sources have adopted CAMR without significant change. In response to a request for reconsideration, the EPA confirmed its approach in May 2006. In June 2006, 16 states and several environmental groups filed lawsuits challenging CAMR. This lawsuit is currently pending. TVA cannot predict the outcome of the pending challenge of CAMR, or what effects any decision may have that would require the EPA to regulate mercury as a hazardous air pollutant. If the EPA’s decisions are upheld and CAMR is implemented, TVA expects to achieve the required mercury reductions for at least Phase I of CAMR from co-benefits of the installation of additional emission control technology in connection with the implementation of CAIR.
CAMR does, however, require the installation of new mercury emission monitoring equipment prior to January 1, 2009. TVA is planning to comply with this requirement by procuring, installing, and certifying approximately 23 monitoring systems by the end of calendar year 2008. The costs associated with the monitoring systems have been incorporated into TVA's capital budget.
Carbon Dioxide. Legislation has been introduced in Congress to require reductions of CO2 and, if enacted, could result in significant additional costs for TVA and other utilities with coal-fired generation. The current Administration has implemented a voluntary initiative with the goal of reducing the greenhouse gas intensity of the U.S. economy by 18 percent and has asked the electric utility sector and other industry sectors to support this initiative. TVA is supporting this effort in cooperation with electric utility industry trade associations and the DOE. TVA has taken and is continuing to take significant voluntary steps to reduce the carbon intensity of its electric generation, including the recovery of Browns Ferry Unit 1, planned power uprates of Browns Ferry Units 2 and 3, the planned completion of Watts Bar Unit 2, and the completion of the hydroelectric modernization program. TVA has also applied to the NRC for a Combined License for two advanced nuclear reactors at the Bellefonte Nuclear Plant near Hollywood, Alabama, although no decision has been made to build the reactors. Looking ahead, TVA intends to make decisions that give strong consideration to fuel mix and
generating assets that are low or zero carbon emitting resources. In addition to these activities, TVA is a member of the Southeast Regional Carbon Sequestration Partnership and is working with the Electric Power Research Institute and other electric utilities on projects investigating technologies for CO2 capture and geologic storage, as well as carbon sequestration via reforestation. The previous Administration asked utilities to voluntarily participate in an effort to reduce, sequester, or avoid greenhouse gases. Under that program, TVA reduced or avoided more than 305 million tons of CO2 from 1994 through 2005, as reported under Section 1605b of the Energy Policy Act. TVA is incorporating the possibility of mandatory carbon reductions and a renewable portfolio standard into its long range planning, and will continue to monitor legislative and regulatory developments related to CO2 and a renewable portfolio standard to assess any potential financial impacts as information becomes available.
In addition to legislative activity, climate change issues are the subject of a number of lawsuits, including lawsuits against TVA. See Item 3, Legal Proceedings. On November 29, 2006, the U.S. Supreme Court heard the case of Massachusetts v. EPA, concerning whether EPA has the authority and duty to regulate CO2 emissions under the CAA. The District of Columbia Circuit Court of Appeals earlier affirmed EPA’s decision not to regulate CO2. On April 2, 2007, the Supreme Court found that greenhouse gases, including CO2, are pollutants under the CAA and thus EPA does have the authority to regulate these gases. The Supreme Court also concluded that EPA's refusal to regulate these pollutants was based on impermissible reasons, and remanded the case to EPA to "ground its reasons for action or inaction in the statute." While this case focused on CO2 emissions from motor vehicles, it sets a precedent for regulation in other industrial sectors, such as the electric utility industry.
States are also becoming more active in the regulation of emissions that are believed to be contributing to global climate change. Several northeastern states have formed the Regional Greenhouse Gas Initiative which is in the process of being implemented, and California recently passed a bill capping greenhouse gas emissions in the state. Other states are considering a variety of actions. North Carolina is studying initiatives aimed at climate change under the provisions of the state’s Clean Smokestacks Act of 2002. This act required the State Division of Air Quality to study potential control of CO2 emissions from coal-fired utility plants and other stationary sources. This effort has also prompted actions to develop a climate action plan for North Carolina.
Clean Water Developments
One of the results of the major reductions in atmospheric emissions resulting from the clean air expenditures discussed above is that wastewaters at TVA coal-fired facilities and across the utility industry may be changing because of waste streams from air quality control technologies. Varying amounts of ammonia or similar compounds used as a necessary component of SCR and SNCR operations may end up in facility wastewater ponds that may discharge through outfalls regulated under the Clean Water Act (“CWA”). Operation of scrubbers for SO2 control also results in additional amounts of pollutants introduced into facility wastewater treatment ponds. EPA is currently collecting information to determine if the Steam Electric Point Source Effluent Guidelines (“Effluent Guidelines”) under the CWA need to be revised. If the Effluent Guidelines are revised, potentially more restrictive discharge limitations for existing parameters or the addition of new parameters could result in additional wastewater treatment expense to meet requirements of the CWA. These costs cannot be accurately predicted at this time, but TVA is involved in and closely monitoring EPA’s data collection activities and the progress of the Effluent Guidelines review process. On the state level, new numeric nutrient criteria development and implementation (an EPA requirement) may require additional treatment costs to reduce nitrogen concentrations being added to the waste treatment ponds as a result of the operation of air pollution control equipment. TVA is closely monitoring the development and implementation of numeric nutrient criteria by the states in TVA’s service area.
In the second phase of a three-part rulemaking to minimize the adverse impacts from cooling water intake structures on fish and shellfish, as required under Section 316(b) of the CWA, the EPA promulgated a final rule for existing power producing facilities (the “Phase II Rule”) that became effective on September 7, 2004. The Phase II Rule required existing facilities to select among several different compliance options for reducing the number of organisms pinned against and/or drawn into the cooling systems. These options included development of a site-specific compliance option based on application of cost-cost or cost-benefit tests. The site specific tests were designed to ensure that a facility’s costs are not significantly greater than cost projections in the rule or the benefits derived from taking mitigation actions. Actions taken to compensate for any impacts by restoring habitat, or pursuing other options such as building hatcheries for fish/shellfish production, would have counted towards compliance. Some northeastern states and environmental groups challenged the new regulation, especially the compliance flexibility it offered, in federal court.
On January 25, 2007, the Second Circuit issued its decision in the proceeding challenging the EPA's Phase II Rule. The Second Circuit held that costs cannot be compared to benefits in picking the best technology available (“BTA”) to minimize the adverse environmental impacts of intake structures. Instead, the court held that the EPA is allowed to consider costs in two ways: (1) to determine what technology can reasonably be borne by industry; and (2) to engage in cost-effectiveness analysis in determining BTA. Finding the rulemaking record to be unclear on whether the EPA had relied
on a cost-benefit analysis or a cost-effectiveness analysis, the Second Circuit remanded the EPA's BTA determination, giving the EPA the option to provide a reasonable explanation of its determination or make a new determination based on the permissible cost considerations set out in the Second Circuit opinion. The Second Circuit also remanded provisions of the EPA rule that allowed the use of a site-specific cost-benefit test and restoration measures (such as building hatcheries) to demonstrate compliance, holding that these rule provisions were based on an impermissible construction of the statute. Several other provisions of the Phase II Rule such as the one that sets the performance standards as a range rather than one national standard were also remanded.
On July 9, 2007, EPA suspended all but one provision of the Phase II Rule until the agency has resolved the issues raised by the Second Circuit's remand. The provision that was retained requires permitting authorities to apply, in the interim, Best Professional Judgment (“BPJ”) controls for existing facilities. BPJ controls are those that reflect the best technology available for minimizing the adverse environmental impacts of intake structures. The use of BPJ controls reflects a reversion to the regulatory process that was used by permitting authorities to regulate the impact of intake structures prior to the promulgation of the Phase II Rule.
All of the intakes at TVA's existing coal and nuclear generating facilities were subject to the Phase II Rule. TVA had been in the process of determining what was needed to comply with the Phase II Rule, and had believed that some expenditures might have been required. These earlier assessments are now being re-evaluated in light of the Second Circuit's decision, and EPA's subsequent decision to suspend the Phase II Rule and revert to BPJ controls. Given the uncertainty over the ultimate outcome of the appellate process and what the changes in the final rule as ultimately issued by EPA will be, TVA cannot assess the potential consequences at this time.
As a part of the 2006 triennial review of State Water Quality Standards in Tennessee, the Tennessee Department of Environment and Conservation (“TDEC”) lowered its threshold for issuing a Precautionary Fish Consumption Advisory (“Precautionary Advisory”) due to mercury to 0.3 ppm because of new research and the EPA’s new water quality criterion for methylmercury. The previous thresholds were 0.5 ppm for a Precautionary Advisory and 1.0 ppm for a “Do Not Consume Advisory.” In Tennessee a Precautionary Advisory recommends that sensitive populations such as children and women of child-bearing age should not consume the fish species named, and that all other persons should limit consumption of the named species to one meal per month. A “Do Not Consume Advisory” recommends that certain fish species should not be consumed by anyone in any amount. As a result of lowering the threshold, Precautionary Advisories were issued for several additional stream and reservoir segments within the State of Tennessee, including seven streams and reservoir segments in the Tennessee River Watershed. TDEC’s announcement of additional Precautionary Advisories for several Tennessee water bodies does not mean that mercury levels in fish are increasing. TVA has been monitoring mercury levels in fish and sediments in TVA reservoirs for the last 35 years, and TVA’s data was provided to TDEC as a part of its review process. TVA’s data show significant reductions in mercury concentrations in fish from the reservoirs with known industrial discharges that have now ceased operation. Other than those areas historically impacted by industrial discharges, mercury concentrations in fish have tended to fluctuate through time with no discernible trend in fish from most reservoirs. Despite increased burning of coal for electricity generation, current and historic data records indicate that mercury concentrations in reservoir sediments have remained stable or declined.
As is the case across the utility industry and in other industrial sectors, TVA is also facing more stringent requirements related to protection of wetlands, reductions in storm water impacts from construction activities, water quality degradation, new water quality criteria, and laboratory analytical methods. TVA is also following litigation related to the use of herbicides, water transfers, and releases from dams. TVA is not facing any substantive requirements related to non-compliance with existing CWA regulations.
Hazardous Substances
Liability for releases and cleanup of hazardous substances is regulated under the federal Comprehensive Environmental Response, Compensation, and Liability Act, among other statutes, and similar state statutes. In a manner similar to many other industries and power systems, TVA has generated or used hazardous substances over the years. TVA operations at some TVA facilities have resulted in releases of hazardous substances and/or oil which require cleanup and/or remediation. TVA also is aware of alleged hazardous-substance releases at 10 non-TVA areas for which it may have some liability. TVA has reached agreements with EPA to settle its liability at two of the non-TVA areas for a total of less than $23,000. There have been no recent assertions of TVA liability for six of the non-TVA areas, and (depending on the site) there is little or no known evidence that TVA contributed any significant quantity of hazardous substances to these six sites. There is evidence that TVA sent materials to the remaining two non-TVA areas: the David Witherspoon site in Knoxville, Tennessee, and the Ward Transformer site in Raleigh, North Carolina. As discussed below, TVA is not able to estimate its liability related to these sites at this time.
The Witherspoon site is contaminated with radionuclides, polychlorinated biphenyls (“PCBs”), and metals. DOE has admitted to being the main contributor of materials to the Witherspoon site and is currently performing clean-up activities. DOE claims that TVA sent equipment to be recycled at this facility, and there is some supporting evidence for the claim. However, TVA believes it sent only a relatively small amount of equipment and that none of it was radioactive. DOE has asked TVA to “cooperate” in completing the cleanup, but it has not provided to TVA any evidence of TVA’s percentage share of the contamination.
At the Ward Transformer site, EPA and a working group of potentially responsible parties ("PRPs") have provided documentation showing that TVA sent electrical equipment containing PCBs to this site in 1974. The working group is cleaning up on-site contamination in accordance with an agreement with EPA and plans to sue non-participating PRPs for contribution. The estimated cost of the cleanup is $20 million. In addition, EPA likely has incurred several million dollars in response costs, and the working group has reimbursed EPA approximately $725,000 of those costs. EPA has also proposed a cleanup plan for off-site contamination. The present worth cost estimate for performing the proposed plan is about $5 million. In addition, there may be natural resource damages liability related to this site, but TVA is not aware of any estimated amount for any such damages.
As of September 30, 2007, TVA’s estimated liability for environmental cleanup for those sites for which sufficient information is available to develop a cost estimate (primarily the TVA sites) is approximately $20 million on a non-discounted basis and is included in Other liabilities on the Balance Sheet.
Coal-Combustion Wastes
In accordance with a regulatory determination by EPA in May 2000, coal-combustion and certain related wastes disposed of in landfills and surface impoundments continue to be regulated as non-hazardous. In conjunction with this determination, EPA committed to developing non-hazardous management standards for these wastes. These standards are likely to include increased groundwater monitoring, more stringent siting requirements, and closure of existing waste-management facilities not meeting minimum standards. On August 29, 2007, EPA issued a Notice of Data Availability in which it requested public comment on whether the additional information mentioned in the notice should affect the EPA’s decisions as it continues to follow up on its commitment to develop management standards for coal-combustion wastes. TVA is currently reviewing this information to evaluate its potential impact on TVA operations.
On September 30, 2007, TVA had 12,013 employees, of whom 5,167 were trades and labor employees. Under the TVA Act, TVA is required to pay trades and labor workers hired by TVA or its contractors the prevailing rate of wages. This rate is the rate of wages for work of a similar nature prevailing in the vicinity where the work is being performed. Neither the federal labor relations laws covering most private sector employers nor those covering most federal agencies apply to TVA. However, the TVA Board has a long-standing policy of acknowledging and dealing with recognized representatives of its employees, and that policy is reflected in long-term agreements to recognize the unions (or their successors) that represent TVA employees. Federal law prohibits TVA employees from engaging in strikes against TVA.
The risk factors described below, as well as the other information included in this Annual Report, should be carefully considered. Risks and uncertainties described in these risk factors could cause future results to differ materially from historical results as well as from the results predicted in forward-looking statements. Although the risk factors described below are the ones that TVA management considers significant, additional risk factors that are not presently known to TVA management or that TVA management presently considers insignificant may also impair TVA’s business operations. Although TVA has the authority to set its own rates and thus mitigate some risks by increasing rates, it is possible that partially or completely eliminating one or more of these risks through rate increases might adversely affect TVA commercially or politically. Accordingly, the occurrence of any of the following could have a material adverse effect on TVA’s cash flows, results of operations, and financial condition.
For ease of reference, the risk factors are presented in four categories: strategic risks, operational risks, financial risks, and risks related to TVA securities.
New laws, regulations, and administrative orders may negatively affect TVA’s cash flows, results of operations, and financial condition, as well as the way TVA conducts its business.
Although it is difficult to predict exactly how any new laws, regulations, and administrative orders would impact TVA, some of the possible effects are described below.
| • | TVA could lose its protected service territory. |
TVA’s service area is primarily defined by two provisions of law.
| – | The TVA Act provides that, subject to certain minor exceptions, neither TVA nor its distributor customers may be a source of power supply outside of TVA’s defined service area. This provision is often called the “fence” since it limits TVA’s sales activities to a specified service area. |
| – | The Federal Power Act prevents FERC from ordering TVA to provide access to others to its transmission lines for the purpose of delivering power to customers within TVA’s defined service area, except to those customers residing in Bristol, Virginia. This provision is often called the “anti-cherrypicking provision” since it prevents competitors from “cherrypicking” TVA’s customers. |
If Congress were to eliminate or reduce the coverage of the anti-cherrypicking provision, TVA could more easily lose customers, and the loss of these customers could adversely affect TVA’s cash flows, results of operations, and financial condition. See Item 7, Management’s Discussion and Analysis of Financial Condition and Results of Operations — Legislative and Regulatory Matters — Proposed Legislation.
| • | The TVA Board could lose its sole authority to set rates for electricity. |
Under the TVA Act, the TVA Board has the sole authority to set the rates that TVA charges for electricity, and these rates are not subject to review. The loss of this authority could have material adverse effects on TVA including, but not limited to, the following:
| – | TVA might be unable to set rates at a level sufficient to generate adequate revenues to service its financial obligations, properly operate and maintain its power assets, and provide for reinvestment in its power program; and |
| – | TVA might become subject to additional regulatory oversight that could impede TVA’s ability to manage its business. |
| • | TVA could become subject to increased environmental regulation. |
There is a risk that new environmental laws and regulations could become applicable to TVA or its facilities and that existing environmental regulations could be revised or reinterpreted in a way that adversely affects TVA. For example, proposals in Congress that would regulate CO2 and other greenhouse gases could require TVA and other electric utilities to incur significantly increased costs. Any such developments could require TVA to make significant capital expenditures, increase TVA’s operating and maintenance costs, or even lead to TVA’s closing certain facilities. See Item 1, Business — Environmental Matters.
| • | The NRC could impose significant restrictions or requirements on TVA. |
The NRC has broad authority to impose requirements relating to the licensing, operation, and decommissioning of nuclear generation facilities. If the NRC modifies existing requirements or imposes new requirements, TVA could be required to make substantial capital expenditures at its nuclear plants or make substantial contributions to its nuclear decommissioning trust. In addition, if TVA fails to comply with requirements promulgated by the NRC, the NRC has the authority to impose fines, shut down units, or modify, suspend, or revoke TVA’s operating licenses. See Item 1, Business — Nuclear.
| • | TVA could lose responsibility for managing the Tennessee River system. |
TVA’s management of the Tennessee River system is important to effective operation of the power system. TVA’s ability to integrate management of the Tennessee River system with power system operations increases power system reliability and reduces costs. Restrictions on how TVA manages the Tennessee River system could negatively affect TVA’s operations.
| • | Congress could take actions that lead to a downgrade of TVA’s credit rating. |
TVA’s rated securities are currently rated “Aaa” by Moody’s Investors Service and “AAA” by Standard and Poor’s and Fitch Ratings, which are the highest ratings assigned by these rating agencies. TVA’s credit ratings are not based solely on its underlying business or financial condition, which by themselves may not be commensurate with a triple-A rating. TVA’s current ratings are based to a large extent on the body of legislation that defines TVA’s business structure. Key characteristics of TVA’s business defined by legislation include (1) the TVA Board’s ratemaking authority, (2) the current competitive environment, which is defined by the fence and the anti-cherrypicking provision, and (3) TVA’s status as a corporate agency and instrumentality of the United States. Accordingly, if Congress takes any action that effectively alters any of these characteristics, TVA’s credit ratings could be downgraded.
| • | TVA’s debt ceiling could become more restrictive. |
The TVA Act provides that TVA can issue bonds, notes, and other evidences of indebtedness (“Bonds”) in an amount not to exceed $30 billion outstanding at any time. If Congress either lowers the debt ceiling or broadens the types of financial instruments that are covered by the debt ceiling, TVA might not be able to raise enough capital to, among other things, service its financial obligations, properly operate and maintain its power assets, and provide for reinvestment in its power program. See Item 7, Management’s Discussion and Analysis of Financial Condition and Results of Operations — Legislative and Regulatory Matters — President’s Budget.
TVA may lose some of its customers.
As of September 30, 2007, three distributor customers had notices in effect terminating their power contracts with TVA. Although sales to these three distributor customers generated only 0.6 percent of TVA’s total operating revenues in 2007, the loss of additional customers could have a material adverse effect on TVA’s cash flows, results of operations, and financial condition. See Item 1, Business —Customers — Termination Notices and Other Customers.
TVA’s generation and transmission assets may not operate as planned.
Many of TVA’s generation and transmission assets have been operating since the 1950s or earlier and have been in near constant service since they were completed. If these assets fail to operate as planned, TVA, among other things:
| • | Might have to invest a significant amount of resources to repair or replace the assets; |
| • | Might be unable to operate the assets for a significant period of time; |
| • | Might have to purchase replacement power on the open market; |
| • | Might not be able to meet its contractual obligations to deliver power; and |
| • | Might have to remediate collateral damage caused by a failure of the assets. |
In addition, the failure of TVA’s assets to perform as planned could cause health, safety, and environmental problems and even result in such events as the failure of a dam or a nuclear accident. Any of these potential outcomes could negatively affect TVA’s cash flows, results of operations, and financial condition. See Item 7, Management’s Discussion and Analysis of Financial Condition and Results of Operations — Executive Summary — Challenges During 2007.
TVA’s fuel supply might be disrupted.
TVA purchases coal, uranium, fuel oil, and natural gas from a number of suppliers. Disruption in the acquisition or delivery of fuel may result from a variety of factors, including, but not limited to, weather, production or transportation difficulties, labor challenges, or environmental regulations affecting TVA’s fuel suppliers. These disruptions could adversely affect TVA’s ability to operate its facilities and could require TVA to acquire power at higher prices on the spot market, purchase more expensive alternative fuels, or operate higher cost plants, thereby adversely affecting TVA’s cash flows, results of operations, and financial condition.
Compliance with existing environmental laws and regulations may affect TVA’s operations in unexpected ways.
TVA is subject to risks from existing federal, state, and local environmental laws and regulations including, but not limited to, the following:
| • | Compliance with existing environmental laws and regulations may cost TVA more than it anticipates. |
| • | At some of TVA’s older facilities, it may be uneconomical for TVA to install the necessary equipment to comply with future environmental laws, which may cause TVA to shut down those facilities. |
| • | TVA may be responsible for on-site liabilities associated with the environmental condition of facilities that it has acquired or developed, regardless of when the liabilities arose and whether they are known or unknown. |
| • | TVA may be unable to obtain or maintain all required environmental regulatory approvals. If there is a delay in obtaining any required environmental regulatory approvals or if TVA fails to obtain, maintain, or comply with any such approval, TVA may be unable to operate its facilities or may have to pay fines or penalties. |
See Item 1, Business — Environmental Matters.
TVA is the sole power provider for customers within its service area, and if demand for power in TVA’s service area increases, TVA is contractually obligated to take steps to meet this increased demand.
If demand for power in TVA’s service area increases, TVA may need to meet this increased demand by purchasing power from other sources, building new generation and transmission facilities, or purchasing existing generation and transmission facilities. Purchasing power from external sources, as well as acquiring or building new generation and transmission facilities, could negatively affect TVA’s cash flows, results of operations, and financial condition. See Item 7, Management’s Discussion and Analysis of Financial Condition and Results of Operations — Executive Summary — Challenges During 2007 — Timing of Cash Flows.
Purchased power prices may be highly volatile, and providers of purchased power may fail to perform under their contracts with TVA.
TVA acquires a portion of its electricity needs through purchased power arrangements. The price for purchased power has been volatile in recent years, and the price that TVA pays for purchased power may increase significantly in the future. In addition, if one of TVA’s purchased power suppliers fails to perform under the terms of its contract with TVA, TVA might have to purchase replacement power on the spot market, perhaps at a significantly higher price than TVA was entitled to pay under the contract. In some circumstances, TVA may not be able to recover this difference from the supplier. Moreover, if TVA is unable to acquire enough purchased power or enough replacement power on the spot market and does not have enough reserve generation capacity available to offset the loss of power from the purchased power supplier, TVA might not be able to supply enough power to meet the demand resulting in power curtailments or even blackouts. See Item 7, Management’s Discussion and Analysis of Financial Condition and Results of Operations — Risk Management Activities — Credit Risk — Credit of Other Counterparties.
TVA’s ability to supply power and its customers’ demands for power are influenced by weather conditions.
Extreme temperatures may increase the demand for power and require TVA to purchase power at high prices in order to meet the demand from customers, while unusually mild weather may result in decreased demand for power and lead to reduced electricity sales. In addition, in periods of low rainfall or drought, TVA’s low-cost hydroelectric generation may be reduced, requiring TVA to purchase power or use more costly means of producing power. Furthermore, high temperatures in the summer may limit TVA’s ability to use water from the Tennessee or Cumberland River system for cooling at its generating facilities, thereby limiting TVA’s ability to operate its generating facilities. See Item 1, Business – Weather and Seasonality and Item 7, Management’s Discussion and Analysis of Financial Condition and Results of Operations — Executive Summary — Challenges During 2007.
TVA may incur delays and additional costs in power plant construction and may be unable to obtain necessary regulatory approval.
TVA has begun the process of completing the construction of Watts Bar Nuclear Unit 2 and may need to construct more generating facilities in the future. The completion of such facilities involves substantial risks of delays and overruns in the cost of labor and materials. In addition, completion may require regulatory approval, as in the case of Watts Bar Nuclear Unit 2. If TVA does not obtain the necessary regulatory approval, is otherwise unable to complete the development or construction of a facility, decides to cancel construction of a facility, or incurs delays or cost overruns in connection with constructing a facility, TVA’s cash flows, financial condition, and results of operations could be negatively affected. In addition, if construction projects are not completed according to specifications, TVA may suffer, among other things, reduced plant efficiency and higher operating costs. See Item 1, Business — Nuclear.
TVA may face problems attracting and retaining skilled workers.
As TVA employees retire and TVA faces competition for skilled workers, TVA may face problems attracting and retaining skilled workers to, among other things, operate and maintain TVA’s generation and transmission facilities and complete large construction projects such as Watts Bar Nuclear Unit 2.
TVA is involved in various legal and administrative proceedings whose outcomes may affect TVA’s finances and operations.
TVA is involved in various legal and administrative proceedings and is likely to become involved in other legal proceedings in the future in the ordinary course of business. Although TVA cannot predict the outcome of the individual matters in which TVA is involved or will become involved, the resolution of these matters could require TVA to make expenditures in excess of established reserves and in amounts that could have a material adverse effect on TVA’s cash flows, results of operations, and financial condition. Similarly, resolution could require TVA to change its business practices or procedures, which could also have a material adverse effect on TVA’s cash flows, results of operations, and financial condition. See Item 3, Legal Proceedings.
TVA’s transmission reliability could be affected by problems at other utilities or TVA facilities.
TVA’s transmission facilities are directly interconnected with the transmission facilities of neighboring utilities and are thus part of an interstate power transmission grid. Accordingly, problems at other utilities, or at TVA’s own facilities, may cause interruptions in TVA’s transmission service. If TVA were to suffer a transmission service interruption, TVA’s cash flows, results of operations, and financial condition could be negatively affected.
Events at non-TVA facilities which affect the supply of water to TVA’s generation facilities may interfere with TVA’s ability to generate power.
TVA’s coal-fired and nuclear generation facilities depend on water from the river systems near which they are located for cooling water and for water to convert into steam to drive turbines. While TVA manages the Tennessee River and large portions of its tributary system in order to provide much of this necessary water, the U.S. Army Corps of Engineers operates and manages other bodies of water upon which some TVA facilities rely. Events at these non-TVA managed bodies of water or their associated hydroelectric facilities may interfere with the flow of water and may result in TVA having insufficient water to meet the needs of its plants. In such scenarios, TVA may be required to reduce generation at its affected facilities to levels compatible with the available supply of water. See Item 1, Business — Power Supply and Item 7, Management’s Discussion and Analysis of Financial Condition and Results of Operations — Executive Summary — Challenges During 2007.
An incident at any nuclear facility, even one that is not owned by or licensed to TVA, could result in increased expenses and oversight.
A nuclear incident at a TVA facility could have significant consequences including loss of life, damage to the environment, damage to or loss of the facility, and damage to non-TVA property. Any nuclear incident, even at a facility that is not owned by or licensed to TVA, has the potential to impact TVA adversely by obligating TVA to pay up to $90 million per year and a total of $604 million per nuclear incident under the Price-Anderson Act. In addition, a nuclear incident could negatively affect TVA by, among other things, obligating TVA to pay retrospective premiums, reducing the availability of insurance, increasing the costs of operating nuclear units, or leading to increased regulation or restriction on the construction, operation, and decommissioning of nuclear facilities.
Catastrophic events could affect TVA’s ability to supply electricity or reduce demand for electricity.
TVA could be adversely affected by catastrophic events such as fires, earthquakes, floods, tornadoes, wars, terrorist activities, pandemics, and other similar events. These events, the frequency and severity of which are unpredictable, could negatively affect TVA’s cash flows, results of operations, and financial condition by, among other things, limiting TVA’s ability to generate and transmit power, reducing the demand for power, disrupting fuel or other supplies, leading to an economic downturn, or creating instability in the financial markets.
Demand for electricity supplied by TVA could be reduced by changes in technology.
Research and development activities are ongoing to improve existing and alternative technologies to produce electricity, including gas turbines, fuel cells, microturbines, and solar cells. It is possible that advances in these or other alternative technologies could reduce the costs of electricity production from alternative technologies to a level that will enable these technologies to compete effectively with traditional power plants like TVA’s. To the extent these technologies become a more cost-effective option for certain customers, TVA’s sales to these customers could be reduced, thereby negatively affecting TVA’s cash flows, results of operations, and financial condition.
TVA is subject to a variety of market risks that could negatively affect TVA’s cash flows, results of operations, and financial position.
TVA is subject to a variety of market risks, including, but not limited to, commodity price risk, investment price risk, interest rate risk, and credit risk.
| • | Commodity Price Risk. Prices of commodities critical to TVA’s operations, including coal, uranium, natural gas, fuel oil, emission allowances, and electricity, have been extremely volatile in recent years. If TVA fails to effectively manage its commodity price risk, TVA’s rates could increase and thereby cause customers to look for alternative power suppliers. |
| • | Investment Price Risk. TVA is exposed to investment price risk in its nuclear decommissioning trust, its asset retirement trust, and its pension fund. If the value of the investments held in the nuclear decommissioning trust or the pension fund decreases significantly, TVA could be required to make substantial unplanned contributions to these funds, which would negatively affect TVA’s cash flows, results of operations, and financial condition. |
| • | Interest Rate Risk. Changes in interest rates could negatively affect TVA’s cash flows, results of operations, and financial condition by increasing the amount of interest that TVA pays on new bonds that it issues, decreasing the return that TVA receives on its short-term investments, decreasing the value of the investments in TVA’s pension fund and trusts, and increasing the losses on the mark-to-market valuation of certain derivative transactions into which TVA has entered. |
| • | Credit Risk. TVA is exposed to the risk that its counterparties will not be able to perform their contractual obligations. If TVA’s counterparties fail to perform their obligations, TVA’s cash flows, results of operations, and financial condition could be adversely affected. In addition, the failure of a counterparty to perform could make it difficult for TVA to perform its obligations, particularly if the counterparty is a supplier of electricity or fuel to TVA. |
See Item 7, Management’s Discussion and Analysis of Financial Condition and Results of Operations — Risk Management Activities for more information regarding market risks.
TVA and owners of TVA securities could be impacted by a downgrade of TVA’s credit rating.
A downgrade in TVA’s credit rating could have material adverse effects on TVA’s cash flows, results of operations, and financial condition as well as on investors in TVA securities. Among other things, a downgrade could have the following effects:
| • | A downgrade would increase TVA’s interest expense by increasing the interest rates that TVA pays on new Bonds that it issues. An increase in TVA’s interest expense would reduce the amount of cash available for other purposes, which could result in the need to increase borrowings, to reduce other expenses or capital investments, or to increase power rates. |
| • | A significant downgrade could result in TVA’s having to post collateral under certain physical and financial contracts that contain rating triggers. |
| • | A downgrade below a contractual threshold could prevent TVA from borrowing under two credit facilities totaling $2.5 billion. |
| • | A downgrade could lower the price of TVA securities in the secondary market. |
See Item 7, Management’s Discussion and Analysis of Financial Condition and Results of Operations — Liquidity and Capital Resources.
TVA may have to make significant unplanned contributions to fund its pension and other postretirement benefit plans.
TVA’s costs of providing pension benefits and other postretirement benefits depend upon a number of factors, including, but not limited to:
| • | Provisions of the pension and postretirement benefit plans; |
| • | Changing employee demographics; |
| • | Rates of increase in compensation levels; |
| • | Rates of return on plan assets; |
| • | Discount rates used in determining future benefit obligations; |
| • | Rates of increase in health care costs; |
| • | Levels of interest rates used to measure the required minimum funding levels of the plans; |
| • | Future government regulation; and |
| • | Contributions made to the plans. |
Any number of these factors could increase TVA’s costs of providing pension and other postretirement benefits and require TVA to make significant unplanned contributions to the plans. Such contributions would negatively affect TVA’s cash flows, results of operations, and financial condition.
TVA may have to make significant unplanned contributions to its nuclear decommissioning trust.
TVA maintains a nuclear decommissioning trust for the purpose of providing funds to decommission TVA’s nuclear facilities. The decommissioning trust is invested in securities generally designed to achieve a return in line with overall equity market performance. TVA might have to make significant unplanned contributions to the trust if, among other things:
| • | The value of the investments in the trust declines significantly; |
| • | The laws or regulations regarding nuclear decommissioning change the decommissioning funding requirements; |
| • | The assumed real rate of return on plan assets, which is currently five percent, is lowered by the TVA Board; |
| • | Changes in technology and experience related to decommissioning cause decommissioning cost estimates to increase significantly; or |
| • | TVA is required to decommission a nuclear plant sooner than TVA anticipates. |
If TVA makes unplanned contributions to the trust, the contributions would negatively affect TVA’s cash flows, results of operations, and financial condition.
TVA may be unable to meet its current cash requirements if its access to the debt markets is limited.
TVA’s cash management policy is to use cash provided by operations together with proceeds from power program borrowings and a $150 million note with the U.S. Treasury to fund TVA’s current cash requirements. In addition, TVA has access to $2.5 billion of credit facilities with a national bank. In light of TVA’s cash management policy, it is critical that TVA continue to have access to the debt markets in order to meet its cash requirements. The importance of having access to the debt markets is underscored by the fact that TVA, unlike many utilities, relies almost entirely on the debt markets to raise capital since it is not authorized to issue equity securities. See Item 7, Management’s Discussion and Analysis of Financial Condition and Results of Operations — Liquidity and Capital Resources.
Approaching or reaching its debt ceiling could limit TVA’s ability to carry out its business.
At September 30, 2007, TVA had approximately $22.5 billion of Bonds outstanding (not including noncash items of foreign currency valuation loss of $299 million and net discount on sale of bonds of $189 million). TVA has a statutorily imposed ceiling of $30 billion on outstanding Bonds. Approaching or reaching this debt ceiling could adversely affect TVA’s business by limiting TVA’s ability to borrow money and increasing the cost of servicing TVA’s debt. In addition, approaching or reaching this debt ceiling could lead to increased legislative or regulatory oversight of TVA’s activities. See Item 7, Management’s Discussion and Analysis of Financial Condition and Results of Operations — Legislative and Regulatory Matters — Proposed Legislation.
TVA’s cash flows, results of operations, and financial condition could be negatively affected by economic downturns.
Sustained downturns or weakness in the economy in TVA’s service area or other parts of the United States could reduce overall demand for power and thus reduce TVA’s power sales and cash flows, especially as TVA’s industrial customers reduce their operations and thus their consumption of power.
TVA’s financial control system cannot guarantee that all control issues and instances of fraud will be detected.
No financial control system, no matter how well designed and operated, can provide absolute assurance that the objectives of the control system are met, and no evaluation of financial controls can provide absolute assurance that all control issues and instances of fraud can be detected. The design of any system of financial controls is based in part upon certain assumptions about the likelihood of future events, and there can be no assurance that any design will succeed in achieving its stated goals under all potential future conditions, regardless of how remote. See Item 9A, Controls and Procedures for TVA’s assessment of its internal controls as of September 30, 2007.
TVA’s financial control system cannot guarantee that all control issues and instances of errors will be detected.
TVA’s controls and procedures are designed to provide reasonable, but not absolute, assurance that the objectives will be met. It should be noted that the design of any system of controls is based in part upon certain assumptions about the likelihood of future events, and there can be no assurance that any design will succeed in achieving its stated goals under all potential future conditions, regardless of how remote. No evaluation of financial controls can provide absolute assurance that all control issues and instances of errors can be detected.
Subsequent to the periods covered by this report, TVA management identified a material weakness in internal controls related to TVA's unbilled revenue calculation. These errors resulted in the restatement of TVA's statement of net income, balance sheet, cash flow statement, and proprietary capital statements for the fiscal years ending September 30, 2007 (as described in Note 2). The new method of calculating unbilled revenue estimate was used for periods presented in this Form 10-K/A No. 2
TVA could lose the ability to use regulatory accounting and be required to write off a significant amount of regulatory assets.
TVA is able to use regulatory accounting because it satisfies the requirements set forth in Statement of Financial Accounting Standards (“SFAS”) No. 71, “Accounting for the Effects of Certain Types of Regulation.” Accordingly, TVA records as assets certain costs that would not be recorded as assets under generally accepted accounting principles for non-regulated entities. As of September 30, 2007, TVA had $4.9 billion of regulatory assets. If TVA loses its ability to use regulatory accounting, TVA could be required to write-off its regulatory assets. Any asset write-offs would be required to be recognized in earnings in the period in which regulatory accounting under SFAS No. 71 ceased to apply to TVA.
Payment of principal and interest on TVA securities is not guaranteed by the United States.
Although TVA is a corporate agency and instrumentality of the United States government, TVA securities are not backed by the full faith and credit of the United States. Principal and interest on TVA securities are payable solely from TVA’s net power proceeds. Net power proceeds are defined as the remainder of TVA’s gross power revenues after deducting the costs of operating, maintaining, and administering its power properties and payments to states and counties in lieu of taxes, but before deducting depreciation accruals or other charges representing the amortization of capital expenditures, plus the net proceeds from the sale or other disposition of any power facility or interest therein.
The trading market for TVA securities might be limited.
All of TVA’s Bonds are listed on the New York Stock Exchange except for TVA’s discount notes, which have maturities of less than one year, and the power bonds issued under TVA’s electronotes® program, which is TVA’s medium-term note program. In addition, some of TVA’s Bonds are listed on foreign stock exchanges. Although many of TVA’s Bonds are listed on stock exchanges, there can be no assurances that any market will develop or continue to exist for any Bonds. Additionally, no assurances can be made as to the ability of the holders of Bonds to sell their Bonds or the price at which holders will be able to sell their Bonds. Future trading prices of Bonds will depend on many factors, including prevailing interest rates, the then-current ratings assigned to the Bonds, the amount of Bonds outstanding, the time remaining until the maturity of the Bonds, the redemption features of the Bonds, the market for similar securities, and the level, direction, and volatility of interest rates generally.
If a particular series of Bonds is offered through underwriters, those underwriters may attempt to make a market in the Bonds. The underwriters would not be obligated to do so, however, and could terminate any market-making activity at any time without notice.
In addition, legal limitations may affect the ability of banks and others to invest in Bonds. For example, national banks may purchase TVA Bonds for their own accounts in an amount not to exceed 10 percent of unimpaired capital and surplus. Also, TVA Bonds are “obligations of a corporation which is an instrumentality of the United States” within the meaning of section 7701(a)(19)(C)(ii) of the Internal Revenue Code for purposes of the 60 percent of assets limitation applicable to U.S. building and loan associations.
Not applicable.
TVA holds personal property in its own name but holds real property as agent for the United States of America. TVA may acquire real property by negotiated purchase or by eminent domain.
At September 30, 2007, TVA’s generating assets consisted of 59 coal-fired units, six nuclear units, 109 conventional hydroelectric units, four pumped storage units, 83 combustion turbine units, nine diesel generator units, one digester gas site, one wind energy site, and 16 solar energy sites. See Item 1, Business — Power Supply for a chart that indicates the location, capacity, and in-service dates for each of these properties. Browns Ferry Unit 1 went online on May 22, 2007, and began commercial operation on August 1, 2007. Also, on August 1, 2007, the TVA Board approved the completion of Watts Bar Unit 2 construction, which was halted in 1985. Completing Watts Bar Unit 2 is expected to take 60 months. In addition, TVA added 11 combustion turbine units in 2007.
Twenty-four of TVA’s combustion turbines are subject to lease-leaseback arrangements. For more information regarding these arrangements, see Note 13 — Other Financing Obligations.
TVA’s transmission system interconnects with systems of surrounding utilities and consists primarily of the following assets:
| • | Approximately 15,800 circuit miles of transmission lines (primarily 500 kilovolt and 161 kilovolt lines); |
| • | 495 transmission substations, power switchyards, and switching stations; and |
| • | 68 individual interchange and 985 customer connection points. |
In 2007, TVA continued to retire and remove from TVA’s books de-energized transmission lines, while retaining contiguous rights-of-way for future use. These activities have served to lower TVA’s operational line miles.
In 2003, TVA entered into a lease-leaseback of certain qualified technological equipment and other software related to TVA’s transmission system. For more information regarding this transaction, see Note 13 — Other Financing Obligations.
TVA’s hydroelectric assets consist of 49 dams, and TVA manages the following natural resource stewardship properties:
| • | 11,000 miles of reservoir shoreline; |
| • | 293,000 acres of reservoir land; |
| • | 650,000 surface acres of water; and |
| • | Over 100 public recreation facilities. |
TVA has a variety of buildings throughout its service area in addition to the buildings located at its generation and transmission facilities, including office buildings, customer service centers, power service centers, warehouses, visitor centers, and crew quarters. The most significant of these buildings is the Knoxville Office Complex. TVA also leases buildings when it deems appropriate, including its Chattanooga Office Complex. The initial term of TVA's lease of the Chattanooga Office Complex expires on January 1, 2011, but the lease contains six automatic renewal terms of five years each that provide TVA with the right to extend its Chattanooga Office Complex lease for a maximum of 30 years after the end of the initial term. A study of TVA's long-term options for Chattanooga office space is currently underway, and a recommendation is expected to be made to the TVA Board in the second quarter of 2008. TVA also owns or leases a significant number of buildings in Muscle Shoals, Alabama, and is currently evaluating strategies for long-term solutions to further reduce its Muscle Shoals portfolio.
Under the TVA Act, TVA has broad authority to dispose of personal property but only limited authority to dispose of real property. TVA’s primary sources of authority to dispose of real property are briefly described below:
| • | Under Section 31 of the TVA Act, TVA has authority to dispose of surplus real property at a public auction. |
| • | Under Section 4(k) of the TVA Act, TVA can dispose of real property for certain specified purposes, including providing replacement lands for certain entities whose lands were flooded or destroyed by dam or reservoir construction and to grant easements and rights-of-way upon which are located transmission or distribution lines. |
| • | Under Section 15d(g) of the TVA Act, TVA can dispose of real property in connection with the construction of generating plants or other facilities under certain circumstances. |
| • | Under 40 U.S.C. § 1314, TVA has authority to grant easements for rights-of-way or other purposes. |
In addition, the Basic Tennessee Valley Authority Power Bond Resolution adopted by the TVA Board on October 6, 1960, as amended on September 28, 1976, October 17, 1989, and March 25, 1992, prohibits TVA from mortgaging any part of its power properties and from disposing of all or any substantial portion of these properties unless TVA provides for a continuance of the interest, principal, and sinking fund payments due and to become due on all outstanding Bonds, or for the retirement of such Bonds.
TVA is subject to various legal proceedings and claims that have arisen in the ordinary course of business. These proceedings and claims include the matters discussed below. In accordance with SFAS No. 5, “Accounting for Contingencies,” TVA had accrued approximately $2.5 million with respect to the proceedings described below as of September 30, 2007, as well as approximately $4.2 million with respect to other proceedings that have arisen in the normal course of TVA’s business. No assurance can be given that TVA will not be subject to significant additional claims and liabilities. If actual liabilities significantly exceed the estimates made, TVA’s results of operations, liquidity, and financial condition could be materially adversely affected.
Economy Surplus Power Case. On August 31, 1999, suit was filed against TVA in the United States District Court for the Northern District of Alabama by Birmingham Steel Corporation, on behalf of itself and a class of TVA industrial customers that contracted for economy surplus power. While Birmingham Steel Corporation was the original class representative, it filed for bankruptcy and was excluded from the class. Johns Manville Corporation was substituted as the class representative. The lawsuit alleged that TVA overcharged for economy surplus power during the summer of 1998 by improperly including some incremental costs when calculating the price of economy surplus power, and the class members sought over $100 million in damages. The parties engaged in mediation in December 2006 and reached a settlement agreement under which TVA agreed to pay approximately $18 million to resolve the case. Because the settlement was required to be approved by the court to be effective, the settlement was submitted to the court on May 21, 2007. The court preliminarily approved it on June 6, 2007. On August 20, 2007, the court conducted a hearing on the fairness of the settlement, after which it approved the settlement in the amount of $18 million. In accordance with the terms of the agreement, TVA paid the settlement amount to an escrow agent on August 20, 2007. On October 22, 2007, after the period for appealing the judge's approval of the settlement had expired, TVA authorized the agent to disburse the funds to the plaintiffs.
Case Against TVA and 22 Electric Cooperatives. On December 2, 2004, the United States District Court for the Middle District of Tennessee dismissed a lawsuit filed by John McCarthy, Stan Cooper, Joe Sliger, Mike Bell, Don Rackley, Terry Motley, Billy Borchert, Jim Foster, and Ryan Hargis on behalf of themselves and all others similarly situated against TVA and the Middle Tennessee Electric Membership Corporation, Appalachian Electric Cooperative, Caney Fork Electric Cooperative, Inc., Chickasaw Electric Cooperative, Cumberland Electric Membership Corporation, Duck River Electric Membership Corporation, Fayetteville Public Utilities, Forked Deer Electric Cooperative, Inc., Fort Loudoun Electric Cooperative, Gibson Electric Membership Corporation, Holston Electric Cooperative, Inc., Meriwether Lewis Electric Cooperative, Mountain Electric Cooperative, Inc., Pickwick Electric Cooperative, Plateau Electric Cooperative, Powell Valley Electric Cooperative, Sequachee Valley Electric Cooperative, Southwest Tennessee Electric Membership Corporation, Tennessee Valley Electric Cooperative, Tri-County Electric Membership Corporation, Tri-State Electric Membership Corporation, Upper Cumberland Electric Membership Corporation, and Volunteer Energy Cooperative. The lawsuit in part challenged TVA’s practice of setting rates for electric power charged by distributor customers through TVA’s contracts with distributor customers. The court held that the federal law claims against TVA failed as a matter of law because Congress had specifically authorized TVA to set the rates charged by distributor customers through TVA’s contracts with distributor customers. The court dismissed the state law claims against the other defendants because the plaintiffs had not taken the required steps to bring those claims in court. The plaintiffs appealed to the United States Court of Appeals for the Sixth Circuit (“Sixth Circuit”), which affirmed the district court’s decision on October 17, 2006, holding, among other things, that TVA’s rates were not subject to judicial review and that TVA is not subject to antitrust liability when doing so would interfere with TVA’s purposes. The plaintiffs did not appeal, and the deadline for doing so has expired.
Global Warming Cases. On July 21, 2004, two lawsuits were filed against TVA in the United States District Court for the Southern District of New York alleging that global warming is a public nuisance and that CO2 emissions from fossil-fuel electric generating facilities should be ordered abated because they contribute to causing the nuisance. The first case was filed by various states (California, Connecticut, Iowa, New Jersey, New York, Rhode Island, Vermont, and Wisconsin) and the City of New York against TVA and other power companies. The second case, which alleges both public and private nuisance, was filed against the same defendants by Open Space Institute, Inc., Open Space Conservancy, Inc., and the Audubon Society of New Hampshire. The plaintiffs do not seek monetary damages, but instead seek a court order requiring each defendant to cap its CO2 emissions and then reduce these emissions by an unspecified percentage each year for at least a decade. In September 2005, the district court dismissed both lawsuits because they raised political questions that should not be decided by the courts. The plaintiffs appealed to the United States Court of Appeals for the Second Circuit (“Second Circuit”). Oral argument was held before the Second Circuit on June 7, 2006. On June 21, 2007, the Second Circuit directed the parties to submit letter briefs by July 6, 2007, addressing the impact of the Supreme Court’s decision in Massachusetts v. EPA, 127 S.Ct. 1438 (2007), on the issues raised by the parties. On July 6, 2007, the defendants jointly submitted their letter brief.
Case Involving Alleged Modifications to the Colbert Fossil Plant. The National Parks Conservation Association, Inc. (“NPCA”), and Sierra Club, Inc. (“Sierra Club”), filed suit on February 13, 2001, in the United States District Court for the Northern District of Alabama, alleging that TVA violated the Clean Air Act (“CAA”) and implementing regulations at TVA’s Colbert Fossil Plant (“Colbert”), a coal-fired electric generating facility located in Tuscumbia, Alabama. The plaintiffs allege that TVA made major modifications to Colbert Unit 5 without obtaining preconstruction permits (in alleged violation of the Prevention of Significant Deterioration (“PSD”) program and the Nonattainment New Source Review (“NNSR”) program) and without complying with emission standards (in alleged violation of the New Source Performance Standards (“NSPS”) program). The plaintiffs seek injunctive relief; civil penalties of $25,000 per day for each violation on or before January 30, 1997, and $27,500 per day for each violation after that date; an order that TVA pay up to $100,000 for beneficial mitigation projects; and costs of litigation, including attorney and expert witness fees. On November 29, 2005, the district court held that sovereign immunity precluded the plaintiffs from recovering civil penalties against TVA. On January 17, 2006, the district court dismissed the action, on the basis that the plaintiffs failed to provide adequate notice of NSPS claims and that the statute of limitations curtailed the PSD and NNSR claims. The plaintiffs appealed to the United States Court of Appeals for the Eleventh Circuit (“Eleventh Circuit”) on January 25, 2006. In an October 4, 2007 decision, the Eleventh Circuit affirmed dismissal of the lawsuit.
Case Involving Alleged Modifications to Bull Run Fossil Plant. The NPCA and the Sierra Club filed suit against TVA on February 13, 2001, in the United States District Court for the Eastern District of Tennessee, alleging that TVA did not comply with the new source review (“NSR”) requirements of the CAA when TVA repaired its Bull Run Fossil Plant (“Bull Run”), a coal-fired electric generating facility located in Anderson County, Tennessee. In March 2005, the district court granted TVA’s motion to dismiss the lawsuit on statute of limitation grounds. The plaintiffs’ motion for reconsideration was denied, and they appealed to the Sixth Circuit. Friend of the court briefs supporting the plaintiffs’ appeal have been filed by New York, Connecticut, Illinois, Iowa, Maryland, New Hampshire, New Jersey, New Mexico, Rhode Island, Kentucky, Massachusetts, and Pennsylvania. Several Ohio utilities filed a friend of the court brief supporting TVA. Briefing of the appeal to the Sixth Circuit was completed in May 2006. Oral argument was held on September 18, 2006, and a panel of three judges issued a decision reversing the dismissal on March 2, 2007. TVA requested that the full Sixth Circuit rehear the appeal, but the Sixth Circuit denied this request. A scheduling order has now been entered by the district court on remand, setting the case for trial on August 11, 2008. TVA is already installing or has installed the control equipment that the plaintiffs seek to require TVA to install in this case, and it is unlikely that an adverse decision will result in substantial additional costs to TVA. An adverse decision, however, could lead to additional litigation and could cause TVA to install additional emission control systems such as scrubbers and selective catalytic reduction systems on units where they are not currently installed, under construction, or planned to be installed. It is uncertain whether there would be significant increased costs to TVA.
Case Involving Opacity at Colbert. On September 16, 2002, the Sierra Club and the Alabama Environmental Council filed a lawsuit in the United States District Court for the Northern District of Alabama alleging that TVA violated CAA opacity limits applicable to Colbert between July 1, 1997, and June 30, 2002. The plaintiffs seek a court order that could require TVA to incur substantial additional costs for environmental controls and pay civil penalties of up to approximately $250 million. After the court dismissed the complaint (finding that the challenged emissions were within Alabama’s two percent de minimis rule, which provided a safe harbor if nonexempt opacity monitor readings over 20 percent did not occur more than two percent of the time each quarter), the plaintiffs appealed the district court’s decision to the Eleventh Circuit. On November 22, 2005, the Eleventh Circuit affirmed the district court’s dismissal of the claims for civil penalties but held that the Alabama de minimis rule was not applicable because Alabama had not yet obtained Environmental Protection Agency (“EPA”) approval of that rule. The case was remanded to the district court for further proceedings. On April 5, 2007, the plaintiffs moved for summary judgment. TVA opposed the motion and moved to stay the proceedings. On April 12, 2007, EPA proposed to approve Alabama’s de minimis rule subject to certain changes. This rulemaking proceeding is ongoing. On July 16, 2007, the district court denied TVA’s motion to stay the proceedings pending approval of Alabama’s de minimis rule. Oral argument on the motion for summary judgment was held on August 16, 2007. On August 27, 2007, the district court granted the plaintiffs’ motion for summary judgment, finding that TVA had violated the CAA at Colbert. The district court held that, while TVA had achieved 99 percent compliance on Colbert Units 1-4 and 99.5 percent compliance at Colbert Unit 5, TVA had exceeded the 20 percent opacity limit (measured in six-minute intervals) more than 3,350 times between January 3, 2000, and September 30, 2002. The district court ordered TVA to submit a proposed remediation plan, which TVA did on October 26, 2007. The plaintiffs have an opportunity to respond. TVA is reviewing its options for regulatory and compliance approaches to address this decision. If EPA approves Alabama’s de minimis rule, then the lawsuit will become moot.
In addition to Colbert, TVA has another coal-fired power plant in Alabama, Widows Creek Fossil Plant (“Widows Creek”), which has a winter net dependable generating capacity of 1,628 megawatts. Since the operation of Widows Creek must meet the same opacity requirements, this plant may be affected by the decision in this case. The proposed de minimis rule change would help reduce or eliminate the chances of an adverse effect on Widows Creek from the district court decision.
Case Brought by North Carolina Alleging Public Nuisance. On January 30, 2006, North Carolina filed suit against TVA in the United States District Court for the Western District of North Carolina alleging that TVA’s operation of its coal-fired power plants in Tennessee, Alabama, and Kentucky constitute public nuisances. North Carolina is asking the court to impose caps on emissions of certain pollutants from TVA’s coal-fired plants that North Carolina considers to be equivalent to caps on emissions imposed by North Carolina law on North Carolina’s two largest electric utilities. The imposition of such caps could require TVA to install more pollution controls on a faster schedule than required by federal law. On April 3, 2006, TVA moved to dismiss the suit on grounds that the case is not suitable for judicial resolution because of separation of powers principles, including the fact that these matters are based on policy decisions left to TVA’s discretion in its capacity as a government agency and thus are not subject to tort liability (the “discretionary function doctrine”), as well as the Supremacy Clause. In July 2006, the court denied TVA’s motion and set the trial for the term of court beginning October 2007. On August 4, 2006, TVA filed a motion requesting permission to file an interlocutory appeal with the United States Court of Appeals for the Fourth Circuit (the “Fourth Circuit”), which the district court granted on September 7, 2006. On September 21, 2006, TVA petitioned the Fourth Circuit to allow the interlocutory appeal. The Fourth Circuit granted the petition, but the district court did not stay the case during the appeal. Briefing of the interlocutory appeal to the Fourth Circuit was completed in January 2007, and oral argument was held on October 31, 2007. On July 2, 2007, North Carolina filed with the district court a motion for partial summary judgment addressing certain of TVA’s defenses. On July 31, 2007, and August 20, 2007, TVA filed two separate motions for summary judgment, seeking dismissal of the lawsuit. The trial before the district court previously scheduled for the term of court beginning October 2007 has been canceled and may be rescheduled for the term of court beginning after January 2008.
Case Involving North Carolina’s Petition to the EPA. In 2005, the State of North Carolina petitioned the EPA under Section 126 of the CAA to impose additional emission reduction requirements for SO2 and NOX emitted by coal-fired power plants in 13 states, including states where TVA’s coal-fired power plants are located. In March 2006, the EPA denied the North Carolina petition primarily on the basis that the Clean Air Interstate Rule remedies the problem. In June 2006, North Carolina filed a petition for review of EPA’s decision with the United States Court of Appeals for the District of Columbia Circuit. Briefing on the appeal is underway, and on October 1, 2007, TVA filed a friend of the court brief in support of EPA’s decision to deny North Carolina’s Section 126 petition.
Case Arising out of Hurricane Katrina. In April 2006, TVA was added as a defendant to a class action lawsuit brought in the United States District Court for the Southern District of Mississippi by 14 residents of Mississippi allegedly injured by Hurricane Katrina. The plaintiffs sued seven large oil companies and an oil company trade association, three large chemical companies and a chemical trade association, and 31 large companies involved in the mining and/or burning of coal, including TVA and other utilities. The plaintiffs allege that the defendants’ greenhouse gas emissions contributed to global warming and were a proximate and direct cause of Hurricane Katrina’s increased destructive force. The plaintiffs are seeking monetary damages among other relief. TVA has moved to dismiss the complaint on grounds that TVA’s operation of its coal-fired plants is not subject to tort liability due to the discretionary function doctrine. On August 30, 2007, the district court heard oral arguments on whether the issue of greenhouse gas emissions is a political matter which should not be decided by the court. The district court then dismissed the case on the grounds that the plaintiffs lacked standing. The dismissal has been appealed to the United States Court of Appeals for the Fifth Circuit.
East Kentucky Power Cooperative Transmission Case. In April 2003, Warren notified TVA that it was terminating its TVA power contract. Warren then entered into an arrangement with East Kentucky under which Warren would become a member of East Kentucky, and East Kentucky would supply power to Warren after its power contract with TVA expires in 2009. East Kentucky then asked TVA to provide transmission service to East Kentucky for its service to Warren. TVA denied the request on the basis that, under the anti-cherrypicking provision, it was not required to provide the requested transmission service. East Kentucky then asked to interconnect its transmission system with the TVA transmission system in three places that are currently delivery points through which TVA supplies power to Warren. TVA did not agree and East Kentucky asked the FERC to order TVA to provide the interconnections. In January 2006, FERC issued a final order directing TVA to interconnect its transmission facilities with East Kentucky’s system at three locations on the TVA transmission system. On August 11, 2006, TVA filed an appeal in the U.S. Court of Appeals for the District of Columbia Circuit seeking review of this order on the grounds that this order violated the anti-cherrypicking provision. On January 10, 2007, TVA and Warren executed an agreement under which Warren rescinded its notice of termination. On May 3, 2007, East Kentucky filed a motion with FERC to terminate the FERC proceeding on grounds of mootness. TVA has also filed a motion with FERC to vacate all orders issued in the proceeding. Whether or not FERC grants TVA’s motion to vacate, it is likely that the FERC proceeding and the resulting litigation will eventually be dismissed and not proceed to a conclusion.
Case Involving Areva Fuel Fabrication. On November 9, 2005, TVA received two invoices totaling $76 million from Framatome ANP Inc., which subsequently changed its name to AREVA NP Inc. (“AREVA”). AREVA asserted that it was the successor to the contract between TVA and Babcock and Wilcox Company (“B&W”) under which B&W would provide fuel fabrication services for TVA’s Bellefonte Nuclear Plant. AREVA’s invoices were based upon the premise that the contract required TVA to buy more fuel fabrication services from B&W than TVA actually purchased. In September 2006, TVA received a formal claim from AREVA which requested a Contracting Officer’s decision pursuant to the Contract Disputes Act of 1978 and reduced the amount sought to approximately $25.8 million. On April 13, 2007, the Contracting Officer issued a final decision denying the claim. On April 19, 2007, AREVA filed suit in the United States District Court for the Eastern District of Tennessee, reasserting the $25.8 million claim and alleging that the contract required TVA to purchase certain amounts of fuel and/or to pay a cancellation fee. TVA filed its answer to the complaint on June 15, 2007. AREVA subsequently raised its claim to $47.9 million. Trial is scheduled to begin September 29, 2008.
Notification of Potential Liability for Ward Transformer Site. EPA and a working group of potentially responsible parties (“PRPs”) have provided documentation showing that TVA sent electrical equipment containing polychlorinated biphenyls (“PCBs”) to the Ward Transformer site in Raleigh, North Carolina. Under the Comprehensive Environmental Response, Compensation, and Liability Act (“CERCLA”), any entity which arranges for disposal of a CERCLA hazardous substance at a site may bear liability for the cost of cleaning up the site. The working group is cleaning up on-site contamination in accordance with an agreement with EPA and plans to sue non-participating PRPs for contribution. The estimated cost of the cleanup is $20 million. In addition, EPA likely has incurred several million dollars in response costs, and the working group has reimbursed EPA approximately $725,000 of those costs. EPA has also proposed a cleanup plan for off-site contamination. The present worth cost estimate for performing the proposed plan is about $5 million. In addition, there may be natural resource damages liability related to this site, but TVA is not aware of any estimated amount for any such damages. See Item 1, Business — Environmental Matters — Hazardous Substances.
Employment Proceedings. TVA is engaged in various administrative and legal proceedings arising from employment disputes. These matters are governed by federal law and involve issues typical of those encountered in the ordinary course of business of a utility. They may include allegations of discrimination or retaliation (including retaliation for raising nuclear safety or environmental concerns), wrongful termination, and failure to pay overtime under the Fair Labor Standards Act. Adverse outcomes in these proceedings would not normally be material to TVA’s results of operations, liquidity, and financial condition, although it is possible that some outcomes could require TVA to change how it handles certain personnel matters or operates its plants.
Notice of Violation at Widows Creek Unit 7. On July 16, 2007, TVA received a Notice of Violation (“NOV”) from EPA as a result of TVA’s failure to properly maintain ductwork at Widows Creek Unit 7. From 2002 to 2005, the unit’s ducts allowed SO2 to escape into the air. TVA repaired the ductwork in 2005, and the problem has been resolved. TVA is reviewing the NOV. While the NOV does not set out an administrative penalty, it is likely that TVA will face a monetary sanction through giving up emission allowances, paying an administrative penalty, or both. Based on the current discussions with EPA, TVA's estimate of potential monetary sanctions is de minimis at this time.
Significant Litigation to Which TVA Is Not a Party. On April 2, 2007, the Supreme Court issued an opinion in the case of United States v. Duke Energy, vacating the ruling of the Fourth Circuit in favor of Duke Energy and against EPA in EPA’s NSR enforcement case against Duke Energy. The NSR regulations apply primarily to the construction of new plants but can apply to existing plants if a maintenance project (1) is “non-routine” and (2) increases emissions. The Supreme Court held that under EPA’s PSD regulations, increases in annual emissions should be used for the test, not hourly emissions as utilities, including TVA, have argued should be the standard. Annual emissions can increase when a project improves the reliability of plant operations and, depending on the time period over which emission changes are calculated, it is possible to argue that almost all reliability projects increase annual emissions. Neither the Supreme Court nor the Fourth Circuit addressed what the “routine” project test should be. The United States District Court for the Middle District of North Carolina had ruled for Duke on this issue, holding that “routine” must take into account what is routine in the industry and not just what is routine at a particular plant or unit as EPA has argued. EPA did not appeal this ruling. On October 5, 2007, EPA filed a motion with the United States District Court for the Middle District of North Carolina asking that court to vacate its entire prior ruling, including the portion relating to the test for “routine” projects.
TVA is currently involved in two NSR cases (one involving Bull Run, the dismissal of which was recently reversed on appeal) and another at Colbert (the dismissal of which was recently affirmed on appeal). These cases are discussed in more detail above. The Supreme Court’s rejection of the hourly standard for emissions testing could undermine one of TVA’s defenses in these cases, although TVA has other available defenses. Environmental groups and North Carolina have given TVA notice in the past that they may sue TVA for alleged NSR violations at a number of TVA units. The Supreme Court’s decision could encourage such suits, which are likely to involve units where emission control systems such as scrubbers and selective catalytic reduction systems are not installed, under construction, or planned to be installed in the relatively near term.
Not applicable.
Not applicable.
The following selected financial data for the years 2003 through 2007 should be read in conjunction with the audited financial statements and notes thereto (collectively, the “Financial Statements”) presented in Item 8, Financial Statements and Supplementary Data. In 2003, TVA changed its method for recording interdivisional sales (electricity used by TVA-owned facilities such as power service buildings, shops, bridge lights, and dams), displacement sales (transactions that have been offset by electricity purchased by TVA due to a change in system needs resulting from a change in operating or economic conditions), and limestone used for the production of electricity. Certain reclassifications have been made to the 2003, 2004, 2005, and 2006 financial statement presentation to conform to the 2007 presentation.
As previously disclosed in this Form 10-K/A No. 2, the information with respect to fiscal years 2007 and 2006 has been restated primarily to correct errors in the method TVA used to estimate unbilled revenue to distributor customers. See Explanatory Note and Note 2 for additional information.
For the years ended September 30
(in millions)
| | | 2007 | | | 2006 | | | 2005 | | | 2004 | | | 2003 | |
| | | As restated | | | As restated | | | | | | | | | | |
Operating revenues1, 8 | | $ | 9,326 | | | $ | 8,983 | | | $ | 7,792 | | | $ | 7,525 | | | $ | 6,954 | |
Revenue capitalized during pre-commercial plant operations | | | (57 | ) | | | – | | | | – | | | | – | | | | – | |
Operating expenses 7, 9 | | | (7,726 | ) 2 | | | (7,560 | ) 2 | | | (6,455 | ) 2 | | | (5,833 | ) 3 | | | (5,379 | ) |
| Operating income | | | 1,543 | | | | 1,423 | | | | 1,337 | | | | 1,692 | | | | 1,575 | |
Other income, net 1, 4, 7, 8 | | | 71 | | | | 78 | | | | 57 | | | | 64 | | | | 46 | |
Unrealized gain (loss) on derivative contracts, net | | | 41 | | | | (15 | ) | | | 3 | | | | (7 | ) | | | (7 | ) |
Net interest expense 4, 9 | | | (1,232 | ) | | | (1,264 | ) | | | (1,312 | ) | | | (1,363 | ) | | | (1,387 | ) |
| Cumulative effect of accounting changes | | | – | | | | (109 | ) 5 | | | – | | | | – | | | | 217 | 6 |
| Net income | | $ | 423 | | | $ | 113 | | | $ | 85 | | | $ | 386 | | | $ | 444 | |
| | (1) | Prior to 2007, TVA reported certain revenue not directly associated with revenue derived from electric operations as Other revenue. This income of $10 million, $12 million, $8 million, and $7 million for 2006, 2005, 2004, and 2003, respectively, has been reclassified from Other revenue to Other income. Additionally, certain items not directly associated with the sale of electricity were previously reported as Sales of electricity. This revenue of $22 million, $23 million, $22 million, and $22 million for 2006, 2005, 2004, and 2003, respectively, has been reclassified from Sales of electricity to Other revenue. See Note 1 —Reclassifications. |
| | (2) | During 2007, 2006 and 2005, TVA recognized a total of $21 million, $14 million, and $24 million, respectively, in impairment losses related to its Property, plant, and equipment. The 2007 Loss on asset impairment included a $17 million write-down of a scrubber project at TVA’s Colbert Fossil Plant (“Colbert”) and write-downs of $4 million related to other Construction in progress assets. The 2006 Loss on asset impairment included write-downs of $12 million on certain Construction in progress assets related to new pollution-control and other technologies that had not been proven effective and a re-evaluation of other projects due to funding limitations and a $2 million write-down on one of two buildings in TVA’s Knoxville Office Complex based on TVA’s plans to sell or lease the East Tower of the Knoxville Office Complex. The 2005 Loss on asset impairment included a $16 million write-down on certain Construction in progress assets related to new pollution-control and other technologies that had not been proven effective and a re-evaluation of other projects due to funding limitations and an $8 million write-down on one of two buildings in TVA’s Knoxville Office Complex based on TVA’s plans to sell or lease the East Tower of the Knoxville Office Complex. |
| | (3) | During 2004, TVA was notified by a supplier that it would not proceed with manufacturing of fuel cells to be installed in the partially completed Regenesys energy storage plant in Columbus, Mississippi. Accordingly, TVA recognized a net $20 million loss on the cancellation of the Regenesys project. |
| | (4) | Prior to 2006, TVA reported short-term investment interest income with interest expense. Interest income of $19 million, $6 million, and $3 million for 2005, 2004, and 2003, respectively, has been reclassified from Interest expense, net to Other income, net. |
| | (5) | During 2006, TVA adopted FIN No. 47, “Accounting for Conditional Asset Retirement Obligations – an interpretation of FASB Statement No. 143,” which resulted in a cumulative effect charge to income of $109 million and an increase in accumulated depreciation of $20 million. See Note 5. |
| | (6) | The cumulative effects of $217 million are due to two accounting changes. Effective October 1, 2002, the TVA Board approved a change in the methodology for estimating unbilled revenue from electricity sales. The impact of this change resulted in an increase in accounts receivable of $412 million with a cumulative effect gain for the change in accounting for unbilled revenue. In addition, TVA adopted SFAS No. 143, “Accounting for Asset Retirement Obligations,” which resulted in a cumulative effect charge to income of $195 million and an increase in accumulated depreciation of $206 million. |
| | (7) | TVA has certain service organizations which provide maintenance and testing services to customers both inside and outside of TVA. For 2005, the excess of cost recovery over actual cost and services provided to TVA organizations of $12 million has been reclassified from Other income to Operating expense. See Note 1 — Reclassifications. |
| | (8) | Certain items previously reported as revenue under Other revenue were reclassified as Other income. These items were not directly associated with revenue derived from electric operations but are associated with the operation of service organizations which provide environmental and maintenance and testing services. Previously reported revenue from these items of approximately $5 million, $13 million, and $7 million for 2005, 2004, and 2003, respectively, are now included in Other income. Additionally, certain Other revenue related to income derived from electric operations was recorded net of related expenses. Expenses of $15 million, $13 million and $15 million for 2005, 2004, and 2003, respectively, have been reclassified from Other revenue to operating expenses. See Note 1 — Reclassifications. |
| | (9) | Subsequent to 2005, certain financing charges related to leaseback obligations were recorded as Operating and maintenance expense. Beginning with 2006, these financing charges are classified as interest expense. Previously reported financing charges of approximately $51 million, $53 million, and $34 million for 2005, 2004, and 2003, respectively, are now included in Interest on debt and leaseback obligations. See Note 1 — Reclassifications. |
At September 30
(in millions)
| | | 2007 | | | 2006 | | | 2005 | | | 2004 | | | | 2003 1 | |
| | | As restated | | | As restated | | | | | | | | | | | |
| Assets | | | | | | | | | | | | | | | | |
Current assets 2 | | $ | 2,436 | | | $ | 2,513 | | | $ | 2,176 | | | $ | 2,295 | | | $ | 2,238 | |
| Property, plant, and equipment, net | | | 24,832 | | | | 24,421 | | | | 23,888 | | | | 23,699 | | | | 23,125 | |
| Investment funds | | | 1,169 | | | | 972 | | | | 858 | | | | 744 | | | | 638 | |
| Regulatory and other long-term assets | | | 5,295 | | | | 6,402 | | | | 7,551 | | | | 7,451 | | | | 7,027 | |
| Total assets | | $ | 33,732 | | | $ | 34,308 | | | $ | 34,473 | | | $ | 34,189 | | | $ | 33,028 | |
| | | | | | | | | | | | | | | | | | | | | |
| | | | | | | | | | | | | | | | | | | | | |
| Liabilities and proprietary capital | | | | | | | | | | | | | | | | | | | | |
Current liabilities 2 | | $ | 3,429 | | | $ | 5,229 | | | $ | 6,724 | | | $ | 5,420 | | | $ | 5,819 | 3 |
| Regulatory and other liabilities | | | 6,400 | | | | 7,052 | | | | 7,606 | | | | 7,168 | | | | 5,114 | |
| Long-term debt, net | | | 21,099 | | | | 19,544 | | | | 17,751 | | | | 19,337 | | | | 20,201 | |
| Total liabilities | | | 30,928 | | | | 31,825 | | | | 32,081 | | | | 31,925 | | | | 31,134 | |
| | | | | | | | | | | | | | | | | | | | | |
| Retained earnings | | | 1,763 | | | | 1,349 | | | | 1,244 | | | | 1,162 | | | | 783 | |
| Other proprietary capital | | | 1,041 | | | | 1,134 | | | | 1,148 | | | | 1,102 | | | | 1,111 | |
| Total proprietary capital | | | 2,804 | | | | 2,483 | | | | 2,392 | | | | 2,264 | | | | 1,894 | |
| Total liabilities and proprietary capital | | $ | 33,732 | | | $ | 34,308 | | | $ | 34,473 | | | $ | 34,189 | | | $ | 33,028 | |
Notes
| | (1) | Prior to 2004, TVA presented two balance sheets – one for its power program and one for all programs. The 2003 Balance Sheet presented above is for all programs which is consistent with the presentation for 2004, 2005, 2006, and 2007. |
| | (2) | In 2006, TVA began to apply certain customer advances previously reported as Current liabilities as a reduction to Accounts receivable. The advances were $93 million in 2005, $91 million in 2004, and $83 million in 2003 and reduced both Current assets and Current liabilities by the same amount. |
| | (3) | TVA reclassified $5 million related to discounted energy units from a long-term liability to a short-term liability in 2003. |
As of September 30
(in millions)
| | | 2007 | | | 2006 | | | 2005 | | | 2004 | | | 2003 | |
| Net long-term debt, excluding current maturities | | $ | 21,099 | | | $ | 19,544 | | | $ | 17,751 | | | $ | 19,337 | | | $ | 20,201 | |
| | | | | | | | | | | | | | | | | | | | | |
| Other long-term obligations | | | | | | | | | | | | | | | | | | | | |
| Capital leases * | | | 104 | | | | 128 | | | | 150 | | | | 138 | | | | 151 | |
| Leaseback commitments | | | 1,072 | | | | 1,108 | | | | 1,143 | | | | 1,178 | | | | 1,238 | |
| Energy prepayment obligations | | | 1,138 | | | | 1,244 | | | | 1,350 | | | | 1,455 | | | | 47 | |
| Total other long-term obligations | | | 2,314 | | | | 2,480 | | | | 2,643 | | | | 2,771 | | | | 1,436 | |
| Total long-term obligations | | | 23,413 | | | | 22,024 | | | | 20,394 | | | | 22,108 | | | | 21,637 | |
| | | | | | | | | | | | | | | | | | | | | |
| Discount notes | | | 1,422 | | | | 2,376 | | | | 2,469 | | | | 1,924 | | | | 2,080 | |
| Current maturities of long-term debt, net | | | 90 | | | | 985 | | | | 2,693 | | | | 2,000 | | | | 2,336 | |
| Total short-term obligations | | | 1,512 | | | | 3,361 | | | | 5,162 | | | | 3,924 | | | | 4,416 | |
| | | | | | | | | | | | | | | | | | | | �� | |
| Total financial obligations | | $ | 24,925 | | | $ | 25,385 | | | $ | 25,556 | | | $ | 26,032 | | | $ | 26,053 | |
| | | | | | | | | | | | | | | | | | | | | |
Note
* Included in Accrued liabilities and Other liabilities on the Balance Sheets.
(Dollars in millions except where noted)
In this Form 10-K/A No. 2, TVA is restating the financial statements for the years ended September 30, 2007, and 2006, primarily to restate revenue associated with an accounting error determined as a result of TVA’s review of its unbilled revenue estimation process. The information below reflects these restatements. Overall, this Form 10-K/A No. 2 has not modified or updated other disclosures presented in the Original Form 10-K, except as required to reflect the items amended in the Form 10-K/A No. 2 as described more fully in Note 2. This Form 10-K/A No. 2 is not superseding or restating financial statements contained in TVA’s quarterly reports on Form 10-Q for the quarters ended March 31, 2008, or December 31, 2007, or any current report on Form 8-K filed subsequent to September 30, 2007. However, the financial statements for the quarters ended March 31, 2008, and December 31, 2007, which are contained in the quarterly reports on Form 10-Q for the quarters then ended, have also been restated in amended quarterly reports on Form 10-Q/A, which TVA plans to file as soon as practicable after the filing of this Form 10-K/A No. 2 (see Note 17). Accordingly, the information in the Form 10-Q for the quarters ended March 31, 2008, and December 31, 2007, should be considered in light of the information in this Form 10-K/A No. 2.
Distinguishing Features of TVA’s Business
TVA operates the nation’s largest public power system. In 2007, TVA provided electricity to large industries and federal agencies and to 158 distributor customers that serve approximately 8.7 million people in seven southeastern states. TVA generates almost all of its revenues from the sale of electricity, and in 2007 revenues from the sale of electricity totaled $9.2 billion. As a wholly-owned agency and instrumentality of the United States, however, TVA is different from other electric utilities in a number of ways. A few of the more distinguishing features are discussed below.
Defined Service Area. TVA has a defined service area established by federal law. Subject to certain minor exceptions, TVA may not, without an act of Congress, enter into contracts which would have the effect of making it or the distributor customers of its power a source of power supply outside the area for which TVA or its distributor customers were the primary source of power supply on July 1, 1957. This provision is referred to as the “fence” because it confines TVA’s sales activities, essentially limiting TVA to power sales within a defined service area. Correspondingly, however, the possibility of sales by others into TVA’s service area is significantly limited. The Federal Power Act, primarily through its anti-cherrypicking provision, prevents FERC from ordering TVA to provide access to its transmission lines to others for the purpose of delivering power to customers within its service area except for customers in Bristol, Virginia.
Rate Authority. Typically, a utility is regulated by a public utility commission, which approves the rates the utility may charge. TVA, however, is self-regulated with respect to rates. The TVA Act gives the TVA Board sole responsibility for establishing the rates TVA charges for power. These rates are not subject to judicial review or review or approval by any state or federal regulatory body. In setting TVA’s rates, however, the TVA Board is charged by the TVA Act to have due regard for the objective that power be sold at rates as low as are feasible.
Funding. TVA’s operations were originally funded primarily with appropriations from Congress. In 1959, however, Congress passed legislation that required TVA’s power program to be self-financing from power revenues and proceeds from power program financings. Until 1999, TVA continued to receive some appropriations for certain multipurpose activities and for its stewardship activities. Since 1999, however, TVA has not received any appropriations from Congress for any activities and has funded essential stewardship activities primarily with power revenues in accordance with a statutory directive from Congress.
TVA, unlike investor-owned power companies, is not authorized to raise capital by issuing equity securities. TVA relies primarily on cash from operations and proceeds from power program borrowings to fund its operations. The TVA Act authorizes TVA to issue bonds, notes, and other evidences of indebtedness (collectively, “Bonds”) in an amount not to exceed $30 billion at any time. From time to time, draft legislation is introduced in Congress that would expand the types of financial obligations that count towards TVA’s $30 billion debt ceiling. Under this draft legislation, long-term obligations that finance capital assets would also count toward the debt ceiling, including lease-leaseback arrangements and power prepayment agreements with original terms exceeding one year. If Congress decides to broaden the type of financial instruments that are covered by the debt ceiling or to lower the debt ceiling, TVA might not be able to raise enough capital to, among other things, service its then-existing financial obligations, properly operate and maintain its power assets, and provide for reinvestment in its power program. At September 30, 2007, TVA had approximately $22.5 billion of Bonds outstanding (not including noncash items of foreign currency valuation loss of $299 million and net discount on sale of bonds of $189 million).
For additional information regarding TVA’s sources of funding, see Item 7, Management’s Discussion and Analysis of Financial Condition and Results of Operations — Liquidity and Capital Resources — Sources of Liquidity.
Stewardship Activities. TVA’s mission includes managing the United States’ fifth largest river system — the Tennessee River and its tributaries — to provide, among other things, year-round navigation, flood damage reduction, affordable and reliable electricity, and, consistent with these primary purposes, recreational opportunities, adequate water supply, improved water quality, and economic development. There are 49 dams that comprise TVA’s integrated reservoir system. The reservoir system provides 800 miles of commercially navigable waterway and also provides significant flood reduction benefits both within the Tennessee River system and downstream on the lower Ohio and Mississippi Rivers. The reservoir system also provides a water supply for residential and industrial customers, including cooling water for some of TVA’s coal-fired and nuclear power plants. TVA also manages 293,000 acres of reservoir lands for natural resource protection, recreation, and other purposes.
Challenges During 2007
TVA faced several challenges during 2007 that impacted its cash flows, results of operations, and financial condition. The most significant of these challenges were adverse weather conditions, performance challenges at one of TVA’s generating plants, project overruns at Browns Ferry Nuclear Plant Unit 1, the impact on TVA’s system from issues at two dams operated by the U.S. Army Corps of Engineers, and the timing of cash flows related to the fuel cost adjustment mechanism.
Weather Conditions. 2007 was the driest year in the eastern Tennessee Valley in 118 years of record-keeping. Rainfall in the eastern Tennessee Valley was 66 percent of normal for the year, and runoff was 54 percent of normal. Largely as a result of this low rainfall and runoff, TVA’s hydroelectric production for 2007 was slightly more than nine billion kilowatt-hours, which was nine percent, 42 percent, and 35 percent lower than in 2006, 2005, and 2004, respectively. Because of the lower hydroelectric production, TVA had to rely heavily on purchased power and more expensive generation sources such as combustion turbines during 2007.
2007 was also distinguished by warmer temperatures across the eastern Tennessee Valley. August was the hottest month on record in TVA’s service area. Between August 2 and 28, TVA met 13 all-time system peak demands for electricity, including an all-time record peak of 33,482 megawatts set on August 16. To meet these peaks, TVA had to purchase a significant amount of power. During the hour of TVA’s peak supply, purchased power constituted 21 percent of TVA’s load.
The hot weather and low rainfall were also significant factors in causing TVA to reduce power output at several generating plants during the period of mid-June through mid-September. During this period, temperatures on the Tennessee and Cumberland Rivers reached levels at which discharging cooling water from some of TVA’s plants into the rivers could have caused the permitted thermal limits for the rivers to be exceeded. Accordingly, TVA temporarily took one unit at Browns Ferry Nuclear Plant offline and reduced the output of the other two units at Browns Ferry to 75 percent of capacity.
TVA also temporarily reduced the power output at two coal-fired plants on the Cumberland River. During the period of early July through early September, output from the Gallatin Fossil Plant was reduced by five percent and output from the Cumberland Fossil Plant was reduced by 16 percent to avoid exceeding thermal limits. TVA was able to meet its customers’ power needs but estimates that the net cost of replacement power resulting from the curtailment of nuclear and coal-fired generation was approximately $25 million. While every effort was made to take derates (lower electrical output) during low load periods to reduce financial and operational impacts, some derates were required during higher load daytime hours to meet the permitted temperature limits.
Performance of TVA Assets. Although TVA’s generation and transmission assets performed extremely well in meeting the peak demands during the summer, TVA was adversely affected in 2007 when the planned outage at Unit 3 of Paradise Fossil Plant to correct an issue with a turbine rotor took longer than expected. The unit was scheduled to be back on line on April 29, 2007, but did not return to service until June 7, 2007, due to more extensive repairs identified during the outage. During this outage, the site’s generation was reduced by 1,026 megawatts. Because of the additional repairs and extended outage, TVA incurred approximately $7 million in unplanned repair costs and an additional $25 million in net replacement power purchase costs.
Project Overruns. TVA completed Browns Ferry Unit 1 during 2007 with a total project cost overrun of $90 million or five percent of the original projected cost. The cost overruns were due in part to the scope of work associated with extended power uprate being greater than planned.
Issues at Two U.S. Army Corps of Engineers Dams. Because of issues at the U.S. Army Corps of Engineers’ Wolf Creek Dam and Center Hill Dam, the hydroelectric production and summer stream flow on the Cumberland River were reduced. Because of these issues, on February 25, 2007, the Southeastern Power Administration (“SEPA”) asserted “force majeure” on its contract with TVA. SEPA then instituted an emergency operating plan that:
| | • | Eliminates its obligation to provide any affected customer (including TVA) with a minimum amount of power; |
| | • | Provides for all affected customers (except TVA) to receive a pro rata share of a portion of the gross hourly generation from the eight Cumberland River hydroelectric facilities; |
| | • | Provides for TVA to receive all of the remaining hourly generation (minus station service for those facilities); |
| | • | Eliminates the payment of demand charges by customers (including TVA) since there is significantly reduced dependable capacity on the Cumberland River system; and |
| | • | Increases the rate charged per kilowatt-hour of energy received by SEPA’s customers (including TVA), because SEPA is legally required to charge rates that cover its costs. |
It is unclear how long the emergency operating plan will remain in effect.
In addition to reducing the amount of hydroelectric power that TVA is entitled to receive from SEPA, the issues at the U.S. Army Corps of Engineers’ dams reduced the summer stream flow on the Cumberland River. This reduction in stream flow, together with the hot temperatures and low rainfall discussed previously, was a significant factor in causing TVA to curtail generation at two coal-fired plants during the summer of 2007 and replace curtailed generation with higher-priced purchased power. The issues at these dams could affect reservoir and hydroelectric operations in the Cumberland River system for five to seven years. Accordingly, even if the drought that the eastern Tennessee Valley experienced in 2007 does not continue, TVA may have to curtail generation at its two coal-fired plants located on the Cumberland River from time to time over the next five to seven years.
Timing of Cash Flows. On July 28, 2006, the TVA Board implemented a fuel cost adjustment (“FCA”) to be applied quarterly as a mechanism to adjust TVA’s rates to reflect changing fuel and purchased power costs beginning in 2007. The FCA was initially set to zero and had its first impact on rates effective January 1, 2007. The FCA rate adjustment on January 1, 2007, was 0.01 cents per kilowatt-hour, the rate adjustment on April 1, 2007, was 0.084 cents per kilowatt-hour, and the rate adjustment on July 1, 2007, was 0.087 cents per kilowatt-hour. These 2007 rate adjustments produced an estimated $82 million in revenue. As of September 30, 2007, TVA had recognized a regulatory asset of $150 million representing deferred power costs to be recovered through the FCA adjustments in future periods. The timing of the collection of the FCA adjustments has contributed to a decrease in cash of $371 million from September 30, 2006, to September 30, 2007. The FCA rate adjustment on October 1, 2007, was 0.432 cents per kilowatt-hour. Based upon the FCA calculation methodology in use as of October 1, 2007, the FCA was expected to produce an estimated $159 million in revenue during the first quarter of 2008.
Under TVA’s FCA methodology, adjustments to rates are based on the difference between forecasted and baseline (budgeted) costs for the upcoming quarter. Because the FCA adjustments are forward-looking, there is typically a difference between what is collected in rates and what actual expense is realized over the course of the quarter. This difference is added to or deducted from a deferred account on TVA’s balance sheet. Each quarterly adjustment includes a core FCA adjustment plus one half of the deferred balance. The higher or lower costs added to or taken away from the deferred balance sheet account are then amortized to expense in the periods in which they are to be collected in revenues. This allows better matching of the revenues with associated expenses.
Although TVA’s cost increases for fuel and purchased power are mitigated by the FCA, TVA’s cash flow can be negatively impacted by the FCA cash collection process. Under the methodology, some of the FCA portion of higher fuel and purchased power expense realized during the quarter is placed in the deferred account to be collected in rates in later periods. The timing of the collection of revenues related to the FCA does not coincide with the cash expended for fuel and purchased power consumed.
Future Challenges
TVA faces several challenges that may impact its cash flows, results of operations, and financial condition. The most significant of these challenges are discussed below.
Meeting the Power Needs in TVA’s Service Area. Demand for power in TVA’s service area has been growing at an average of two percent per year and TVA anticipates the demand will continue to grow. TVA plans to meet the need for additional power through a variety of means:
| | • | New Generation. TVA intends to add new generation assets. This intention was reflected in TVA’s decision to complete the construction of Watts Bar Nuclear Unit 2. The completion of Watts Bar Nuclear Unit 2 is expected to occur in 2013 and cost approximately $2.5 billion. TVA plans to consider other opportunities to add new generation from time to time. Market conditions, like the volatility of the price of construction materials and the potential shortage of skilled craft labor, may add uncertainties to the cost and schedule of new construction. |
| | • | Purchased Power. Purchasing power from others will likely remain a part of how TVA meets the power needs of its service area. The Strategic Plan establishes a goal of balancing production capabilities with power supply requirements within five percent. Achieving this goal will require TVA to reduce its reliance on purchased power, which constituted 12.4 percent of the power that TVA sold in 2007. |
| | • | Distributor-Owned Generation. TVA is also discussing with the distributors of TVA power ways in which distributors can own generating facilities while TVA remains the supplier of all of their power requirements. These discussions, while still in the early stages, may provide the framework for the distributors of TVA power to provide some of the future generating facilities. |
Non-Fuel Operating and Maintenance Costs. TVA has established two significant goals relating to non-fuel operating and maintenance costs.
| • | TVA intends to reduce these costs over the next three years. |
| • | After that time, TVA intends to keep the rate of increase in these costs lower than the rate of growth of TVA’s electricity sales. |
Meeting these goals will significantly affect TVA’s ability to achieve certain objectives identified in the Strategic Plan, including the objective of adding new generation assets.
Performance of Generation Assets. Although TVA’s generation and transmission assets performed extremely well overall in meeting the peak demands during the summer of 2007, TVA was adversely affected by the failure of some assets to operate as planned during times of high summer demand. As a result, TVA had to purchase more power than expected when purchased power prices were high. (See Item 1, Business — Power Supply.) TVA is likely to face similar problems in the future since many of TVA’s generation assets have been operating since the 1950s or earlier and have been in near constant service since they were completed.
Bonds and Other Financial Obligations. As of September 30, 2007, TVA had $22.5 billion of Bonds outstanding (not including noncash items of foreign currency valuation loss of $299 million and net discount on sale of bonds of $189 million). The amount of TVA’s Bonds outstanding has been reduced by more than $5 billion since September 30, 1996, when the end of year balance of outstanding Bonds peaked. Since that time, however, TVA has entered into energy prepayment transactions that resulted in $1.6 billion in prepayment obligations and certain lease/leaseback transactions that resulted in $1.3 billion in obligations. The amount of prepayment and lease/leaseback obligations outstanding at September 30, 2007, was $2.2 billion. Payments on these Bonds and obligations do not change with the amount of power sold, and if competition increases, TVA’s obligations to make these payments could limit its ability to adjust to market pressures. While prudent management of Bonds and other financial obligations will remain an important strategic consideration in the future, increased capital commitments may make it difficult for TVA to continue its trend of reducing these obligations.
2008 Budget. The 2008 budget approved by the TVA Board on September 27, 2007, is based on TVA’s obtaining $300 million more in operating cash flows than is currently anticipated. When the TVA Board approved the budget, it recognized that TVA would need a rate increase to balance the budget. The amount of the rate increase needed to balance the budget is expected to be less than 10 percent. TVA and its customers are working to determine the amount of the rate increase to be effective during the second half of 2008.
Environmental Regulation. TVA expects to see increased environmental regulation in the future, including but not limited to, the regulation of mercury and the emission of greenhouse gases such as CO2. TVA has considered, and intends to continue considering, fuel mix in making decisions about additional generation. The restart of Browns Ferry Unit 1, the decision to complete the construction of Watts Bar Unit 2, and TVA’s filing of a combined operating license application for two new units at the Bellefonte Nuclear Plant (although no decision to construct these units has been made) are examples of TVA’s decisions to pursue or consider generation sources that do not emit greenhouse gases. The nature or level of future regulation of greenhouse gases is unclear at this time. Accordingly, the costs associated with such regulation are currently unknown but could be substantial. TVA would have to recover such costs in rates or pursue some other action such as removing some coal-fired units from service.
Renewable Portfolio. Renewable power generation resources include solar, wind, incremental hydroelectric, biomass, and landfill gas. Generating power with renewable sources instead of coal-fired plants could help reduce the carbon intensity of TVA’s generation. Generating power with renewable resources, however, may not be economical using current technology. If TVA is required to increase its use of renewable resources and the cost of doing so is greater than the costs of other sources of generation, TVA’s costs may increase, and, as a result, TVA may be forced to raise rates.
TVA’s Power Service Area. TVA’s service area is set by two pieces of legislation: the fence and the anti-cherrypicking provision. See Item 1, Business — Service Area. Recently there have been efforts to erode the protection of the anti-cherrypicking provision. FERC issued an order that would have required TVA to interconnect its transmission system with the transmission system of East Kentucky Power Cooperative, Inc. (“East Kentucky”) in what TVA believed was a violation of the anti-cherrypicking provision. See Item 3, Legal Proceedings. Additionally, Senators Jim Bunning and Mitch McConnell introduced the Access to Competitive Power Act of 2007 in the Senate that would, among other things, provide that the anti-cherrypicking provision would not apply with respect to any distributor which provided a termination notice to TVA before December 31, 2006, regardless of whether the notice was later withdrawn or rescinded. See Item 7, Management’s Discussion and Analysis of Financial Condition and Result of Operations — Legislative and Regulatory Matters. While the FERC action involving East Kentucky now appears to be moot and the proposed legislation has not made it to the Senate floor, the events illustrate how the protection to TVA’s service area provided by the anti-cherrypicking provision could be called into question and perhaps eliminated at some time in the future.
Legislation. TVA exists pursuant to legislation enacted by Congress and carries on its operations in accordance with this legislation. Since Congress has the authority to change this legislation, TVA is subject to more legislative risks than most utilities. Given the nature of the legislative process, it is possible that new legislation or a change to existing legislation that would have a profound, detrimental impact on TVA’s activities could become law with little or no advance notice. For a discussion of the potential impact of legislation on TVA, see Item 1A, Risk Factors.
Sources of Liquidity
To meet short-term cash needs and contingencies, TVA depends on various sources of liquidity. TVA’s primary sources of liquidity are cash on hand and cash from operations, proceeds from the issuance of short-term and long-term debt, and proceeds from borrowings under TVA’s $150 million note with the U.S. Treasury. TVA’s current liabilities exceed current assets because of the continued use of short-term debt as a funding source to meet cash needs as well as to meet scheduled maturities of long-term debt.
The majority of TVA’s balance of cash on hand is typically invested in short-term investments. During 2007, TVA’s average daily balance of cash and cash equivalents on hand was $389 million. The daily balance of cash and cash equivalents maintained is based on near-term expectations for cash expenditures and funding needs.
Other sources of liquidity include two $1.25 billion credit facilities with a national bank as well as occasional proceeds from other financing arrangements including call monetization transactions and sales of receivables and loans. Each of these sources of liquidity is discussed below.
Summary Cash Flows. A major source of TVA’s liquidity is operating cash flows resulting from the generation and sales of electricity. A summary of cash flow components for the years ended September 30 follows:
Summary Cash Flows For the years ended September 30 | |
| | | 2007 | | | 2006 | | | 2005 | |
| Cash provided by (used in): | | As Restated | | | As Restated | | | | |
| Operating activities | | $ | 1,788 | | | $ | 1,985 | | | $ | 1,462 | |
| Investing activities | | | (1,686 | ) | | | (1,698 | ) | | | (1,188 | ) |
| Financing activities | | | (473 | ) | | | (289 | ) | | | (255 | ) |
| Net (decrease) increase in cash and cash equivalents | | $ | (371 | ) | | $ | (2 | ) | | $ | 19 | |
Issuance of Debt. The TVA Act authorizes TVA to issue Bonds in an amount not to exceed $30 billion outstanding at any time. At September 30, 2007, TVA had only two types of Bonds outstanding: power bonds and discount notes. Power bonds have maturities of between one and 50 years, and discount notes have maturities of less than one year. Power bonds and discount notes rank on parity and have first priority of payment out of net power proceeds. Net power proceeds are defined as the remainder of TVA’s gross power revenues after deducting the costs of operating, maintaining, and administering its power properties and payments to states and counties in lieu of taxes, but before deducting depreciation accruals or other charges representing the amortization of capital expenditures, plus the net proceeds from the sale or other disposition of any power facility or interest therein. See Note 11 — General.
Power bonds and discount notes are both issued pursuant to section 15d of the TVA Act and pursuant to the Basic Tennessee Valley Authority Power Bond Resolution adopted by the TVA Board on October 6, 1960, as amended on September 28, 1976, October 17, 1989, and March 25, 1992 (the “Basic Resolution”). The TVA Act and the Basic Resolution each contain two bond tests: the rate test and the bondholder protection test.
Under the rate test, TVA must charge rates for power which will produce gross revenues sufficient to provide funds for:
| • | Operation, maintenance, and administration of its power system; |
| • | Payments to states and counties in lieu of taxes; |
| • | Debt service on outstanding Bonds; |
| • | Payments to the U.S. Treasury as a repayment of and a return on the Power Facilities Appropriation Investment; and |
| • | Such additional margin as the TVA Board may consider desirable for investment in power system assets, retirement of outstanding Bonds in advance of maturity, additional reduction of the Power Facilities Appropriation Investment, and other purposes connected with TVA’s power business, having due regard for the primary objectives of the TVA Act, including the objective that power shall be sold at rates as low as are feasible. |
Under the bondholder protection test, TVA must, in successive five-year periods, use an amount of net power proceeds at least equal to the sum of:
| • | The depreciation accruals and other charges representing the amortization of capital expenditures, and |
| • | The net proceeds from any disposition of power facilities, |
for either
| • | The reduction of its capital obligations (including Bonds and the Power Facilities Appropriation Investment), or |
| • | Investment in power assets. |
TVA must next meet the bondholder protection test for the five-year period ending September 30, 2010.
As discussed above, TVA uses proceeds from the issuance of discount notes, in addition to other sources of liquidity, to fund working capital requirements. During 2007, 2006, and 2005, the average outstanding balance of discount notes was $2.3 billion, $2.0 billion, and $2.1 billion, respectively, and the weighted average interest rate on discount notes was 5.17 percent, 4.47 percent, and 2.70 percent, respectively. At September 30, 2007, $1.4 billion of discount notes were outstanding with a weighted average interest rate of 4.74 percent. The discount notes are not listed on any stock exchange.
TVA issues power bonds primarily to refinance previously-issued power bonds as they mature. During 2007 and 2006, TVA issued $1.0 and $1.1 billion of power bonds, respectively, and redeemed $470 million, and $1.2 billion of power bonds, respectively. At September 30, 2007, outstanding power bonds (including current maturities of long-term debt) consisted of the following:
Outstanding Power Bonds
As of September 30, 2007
| CUSIP or Other Identifier | | Maturity | | Coupon Rate | | Principal Amount 1 | | Stock Exchange Listings |
| | | | | | | | | | | | | |
| electronotes® | | 01/15/2008 - 10/15/2026 | | | 2.450% - 6.125% 2 | | $ | 1,117 | | None |
| 880591DB5 | | 11/13/2008 | | | 5.375% | | | 2,000 | | New York, Hong Kong, Luxembourg, Singapore |
| 880591DN9 | | 01/18/2011 | | | 5.625% | | | 1,000 | | New York, Luxembourg |
| 880591DL3 | | 05/23/2012 | | | 7.140% | | | 29 | | New York |
| 880591DT6 | | 05/23/2012 | | | 6.790% | | | 1,486 | | New York |
| 880591CW0 | | 03/15/2013 | | | 6.000% | | | 1,359 | | New York, Hong Kong, Luxembourg, Singapore |
| 880591DW9 | | 08/01/2013 | | | 4.750% | | | 990 | | New York, Luxembourg |
| 880591DY5 | | 06/15/2015 | | | 4.375% | | | 1,000 | | New York, Luxembourg |
| 880591DS8 | | 12/15/2016 | | | 4.875% | | | 524 | | New York |
| 880591EA6 | | 07/18/2017 | | | 5.500% | | | 1,000 | | New York, Luxembourg |
| 880591CU4 | | 12/15/2017 | | | 6.250% | | | 750 | | New York |
| 880591DC3 | | 06/07/2021 | | | 5.805%3 | | | 409 | | New York, Luxembourg |
| 880591CJ9 | | 11/01/2025 | | | 6.750% | | | 1,350 | | New York, Hong Kong, Luxembourg, Singapore |
| 880591300 | | 06/01/2028 | | | 5.490% | | | 466 | | New York |
| 880591409 | | 05/01/2029 | | | 5.618% | | | 410 | | New York |
| 880591DM1 | | 05/01/2030 | | | 7.125% | | | 1,000 | | New York, Luxembourg |
| 880591DP4 | | 06/07/2032 | | | 6.587% | | | 512 | | New York, Luxembourg |
| 880591DV1 | | 07/15/2033 | | | 4.700% | | | 472 | | New York, Luxembourg |
| 880591DX7 | | 06/15/2035 | | | 4.650% | | | 436 | | New York |
| 880591CK6 | | 04/01/2036 | | | 5.980% | | | 121 | | New York |
| 880591CS9 | | 04/01/2036 | | | 5.880% | | | 1,500 | | New York |
| 880591CP5 | | 01/15/2038 | | | 6.150% | | | 1,000 | | New York |
| 880591BL5 | | 04/15/2042 | | | 8.250% | | | 1,000 | | New York |
| 880591DU3 | | 06/07/2043 | | | 4.962% 3 | �� | | 307 | | New York, Luxembourg |
| 880591CF7 | | 07/15/2045 | | | 6.235% | | | 140 | | New York |
| 880591DZ2 | | 04/01/2056 | | | 5.375% | | | 1,000 | | New York |
| Subtotal | | | | | | | | | | 21,378 | | |
| Unamortized discounts, premiums, and other | | | | | (189 | ) | |
| Total outstanding power bonds, net | | | | $ | 21,189 | | |
Notes
(1) The above table includes net exchange losses from currency transactions of $299 million at September 30, 2007.
(2) The weighted average interest rate of TVA’s outstanding electronotes® was 4.76 percent at September 30, 2007.
(3) The coupon rate represents TVA’s effective interest rate.
As of September 30, 2007, all of TVA’s Bonds were rated by at least one rating agency except for two issues of power bonds and TVA’s discount notes. TVA’s rated Bonds are currently rated “Aaa” by Moody’s Investors Service and/or “AAA” by Standard & Poor’s and/or Fitch Ratings, which are the highest ratings assigned by these agencies. The ratings are not recommendations to buy, sell, or hold any TVA securities and may be subject to revision or withdrawal at any time by the rating agencies. Ratings are assigned independently, and each should be evaluated as such.
For additional information about TVA debt issuance activity and debt instruments issued and outstanding as of September 30, 2007 and 2006, including identifiers, rates, maturities, outstanding principal amounts, and redemption features, see Note 11.
$150 Million Note with U.S. Treasury. TVA has access to financing arrangements with the U.S. Treasury, whereby the U.S. Treasury is authorized to accept a short-term note with maturity of one year or less in an amount not to exceed $150 million. TVA may draw any portion of the authorized $150 million. Interest accrues daily and is paid quarterly at a rate determined by the U.S. Secretary of the Treasury each month based on the average of outstanding obligations of the United States with maturities of one year or less. During 2007, 2006, and 2005, the daily average amounts outstanding were approximately $132 million, $131 million, and $103 million, respectively. The outstanding balances were repaid quarterly. See Note 9 and Note 11 — Short-Term Debt.
Credit Facilities. In the event of shortfalls in cash resources, TVA has short-term funding available in the form of two $1.25 billion short-term revolving credit facilities, one of which matures on May 14, 2008, and the other of which matures on November 10, 2008. See Note 18 — Revolving Credit Facility Agreement. The interest rate on any borrowing under either of these facilities is variable and based on market factors and the rating of TVA’s senior unsecured long-term non-credit enhanced debt. TVA is required to pay an unused facility fee on the portion of the total $2.5 billion against which TVA has not borrowed. The fee may fluctuate depending on the non-enhanced credit ratings on TVA’s senior unsecured long-term debt. There were no outstanding borrowings under the facilities at September 30, 2007. TVA anticipates renewing each credit facility from time to time.
Call Monetization Transactions. From time to time TVA has entered into swaption transactions to monetize the value of call provisions on certain of its Bond issues. A swaption essentially grants a third party the right to enter into a swap agreement with TVA under which TVA receives a floating rate of interest and pays the third party a fixed rate of interest equal to the interest rate on the Bond issue whose call provision TVA monetized. Through September 30, 2007, TVA has entered into four swaption transactions that generated proceeds of $261 million.
| • | In 2003, TVA monetized the call provisions on a $1 billion Bond issue and a $476 million Bond issue by entering into swaption agreements with a third party in exchange for $175 million and $81 million, respectively. |
| • | In 2005, TVA monetized the call provisions on two Bond issues ($42 million total par value) by entering into swaption agreements with a third party in exchange for $5 million. |
For more information regarding TVA’s call monetization transactions, see Note 10 — Swaptions and Related Interest Rate Swap.
Sales of Receivables/Loans. From time to time TVA obtains proceeds from selling receivables and loans. During 2007, TVA sold $2 million of receivables at par such that TVA did not recognize a gain or loss on the sale. These were receivables from a power customer related to the construction of a substation. The proceeds from the sale of these receivables are included within the Cash Flow Statement under the caption Cash flows from investing activities.
During 2006, TVA sold $22 million of receivables at par such that TVA did not recognize a gain or loss on the sale. Of this amount, $11 million represented receivables from power customers related to the construction of a substation and other energy conservation projects, and the proceeds from the sale of these receivables are included within the Cash Flow Statement under the caption Cash flows from investing activities.
During 2005, TVA sold $60 million of receivables at par such that TVA did not recognize a gain or loss on the sale. Of this amount, $1 million represented receivables from power customers related to the construction of a substation and other energy conservation projects, and the proceeds from the sale of these receivables are included within the Cash Flow Statement under the caption Cash flows from investing activities. Additionally, TVA sold a portfolio of 51 power distributor customer loans receivable. The portfolio was sold for $55 million, without recourse to TVA, and contained loans with maturities ranging from less than one year to over 34 years. The principal amount due on the loans at the time of the sale was $57 million. The $2 million loss is reported in Other income, net on the Income Statement for the year ended September 30, 2005.
TVA did not retain any claim on these loans and receivables sold, and they are no longer reported on TVA’s Balance Sheets. For more information regarding TVA’s sales of receivables and loans, see Note 1 — Sales of Receivables/Loans.
2007 Compared to 2006
Net cash provided by operating activities decreased from $1,985 million in 2006 to $1,788 million in 2007. This $197 million decrease primarily resulted from:
| | • | An increase in cash paid for fuel and purchased power of $249 million due to higher volume of fuel and purchased power needed to replace hydroelectric generation as well as increased market prices for fuel; |
| | • | An increase in cash outlays for routine and recurring operating costs of $108 million; |
| | • | An increase in tax equivalent payments of $76 million; and |
| | • | An increase in expenditures for nuclear refueling outages of $24 million due to three planned outages in 2007 compared to two planned outages in the prior year. |
| | These items were partially offset by: |
| | • | A decrease of $154 million in cash used by changes in working capital resulting primarily from a smaller increase in the accounts receivable balance of $142 million and a larger increase in accounts payable and accrued liabilities of $9 million; |
| | • | Cash provided by deferred items of $61 million in 2007 compared to a $35 million net use of cash in 2006. This change is primarily due to funds collected in rates during 2007 that were used to fund future generation. See Note 1— Reserve for Future Generation; and |
| | • | A decrease in cash paid for interest of $33 million in 2007. |
Cash used in investing activities decreased from $1,698 million in 2006 to $1,686 million in 2007. This $12 million decrease resulted primarily from:
| | • | A source of cash from collateral deposits in 2007 of $48 million as compared to a net use of cash of $91 million in 2006. See Note 1 — Restricted Cash and Investments; and |
| | • | A decrease in expenditures for the enrichment and fabrication of nuclear fuel of $74 million related to the restart of Browns Ferry Unit 1 in 2007. |
These items were partially offset by:
| | • | An increase in expenditures of $111 million to acquire the Gleason and Marshall County combustion turbine facilities in 2007; |
| | • | A $40 million contribution to the Asset Retirement Trust. See Note 1 — Investment Funds; |
| | • | A damage award of $35 million that TVA received in 2006 in its breach of contract suit against the DOE not present in 2007; and |
| | • | An increase in expenditures for capital projects of $9 million. |
Net cash used in financing activities increased from $289 million in 2006 to $473 million in 2007. This $184 million increase resulted primarily from:
| | • | A decrease of $92 million in long-term debt issues; and |
| | • | An increase in net redemptions of short-term debt of $862 million. |
These items were partially offset by a decrease in redemptions of long-term debt of $771 million in 2007 compared to 2006.
2006 Compared to 2005
Net cash provided by operating activities increased $523 million from 2005 to 2006. This increase resulted from:
| • | An increase in cash provided by operating revenues of $1.4 billion primarily from higher average rates from rate actions effective in October 2005 and April 2006 and, to a lesser extent, from increased demand in 2006; |
| • | Less cash paid for interest of $46 million in 2006; and |
| • | A decrease in expenditures for nuclear refueling outages of $50 million due to the number and timing of outages during 2006. |
| | These items were partially offset by: |
| • | An increase in cash paid for fuel and purchased power of $734 million due to higher volume and increased market prices; |
| • | An increase in payments in lieu of taxes of $11 million; |
| • | An increase in cash outlays for routine and recurring operating costs of $44 million; |
| • | An increase in other deferred items of $33 million primarily due to $15 million related to customer advances for construction; and |
| • | An increase in contributions to the TVA Retirement System of $22 million. |
Net cash used by changes in components of working capital decreased $146 million from 2005 to 2006 primarily from:
| | • | A larger increase in accounts receivable of $195 million due to increased sales of the prior year and higher rates in 2006; and |
| | • | A larger increase in inventories of $108 million due to higher priced coal and natural gas in ending inventory in 2006 and a higher volume of coal on hand at the end of 2006. |
| | These items were partially offset by: |
| • | A $96 million increase in accounts payable and accrued liabilities in 2006 compared to a $16 million decrease in 2005 primarily due to changes of $88 million in the amount of collateral held by TVA under terms of a swap agreement and higher costs for fuel and purchased power; and |
| | • | A $23 million increase in accrued interest in 2006 compared to a $22 million decrease in 2005 due to timing of interest payments on Bonds issued relative to Bonds retired during 2006. |
Cash used in investing activities increased $510 million from 2005 to 2006. The increase is primarily due to:
| • | Sales of short-term investments of $335 million in 2005 with no comparable sales in 2006; |
| • | An increase in expenditures for the enrichment and fabrication of nuclear fuel of $136 million for the Sequoyah Unit 2 and Watts Bar Unit 1 reloads scheduled to be completed in the first quarter of 2007, and expenditures related to uranium conversion and enrichment for Browns Ferry Unit 1; |
| • | An increase in expenditures for capital projects of $31 million primarily due to increases in transmission construction projects related to reliability and load growth on the TVA system, including a substation and a 500-kv transmission line on the bulk transmission system, an increase in expenditures for nuclear projects of $17 million primarily for the Browns Ferry Unit 1 restart, and a corresponding increase in allowance for funds used during construction of $35 million; partially offset by decreases in clean air expenditures of $20 million related to project completions and a decrease in hydroelectric expenditures of $26 million; and |
| • | A decrease in proceeds received from the sale of certain receivables/loans of $45 million compared to the same period of 2005. |
These items were partially offset by:
| • | A damage award in 2006 of $35 million in TVA’s breach of contract suit against the DOE; and |
| • | A smaller increase in collateral deposits in 2006 of $16 million as compared to 2005. See Note 1 — Restricted Cash and Investments. |
Net cash used in financing activities was $34 million greater in 2006 than 2005 primarily due to:
| • | A decrease in issuance of long-term debt of $518 million; |
| • | Net issuances of short-term debt of $546 million in 2005 compared to net redemptions of short-term debt of $93 million in 2006; and |
| • | An increase in payments to the U.S. Treasury of $2 million due to changes in interest rates. |
These items were partially offset by:
| • | A decrease in redemptions of long-term debt of $1.1 billion in 2006 compared to 2005. |
Cash Requirements and Contractual Obligations
Due to the nature of the power industry, which requires large multi-year capital investments, using trends and multi-year forecasts is important in assessing the effectiveness of management’s decisions related to capital expenditures, pricing, and accessing capital markets.
The future planned construction expenditures for property, plant, and equipment additions, including clean air projects and new generation, are estimated to be as follows:
Future Planned Construction Expenditures 1
As of September 30
| | | Actual | | | Estimated Construction Expenditures | |
| | | 2007 | | | 2008 | | | 2009 | | | 2010 | | | 2011 | | | 2012 | |
| Watts Bar Unit 2 | | $ | – | | | $ | 317 | | | $ | 670 | | | $ | 684 | | | $ | 547 | | | $ | 276 | |
| Other Capacity Expansion Expenditures | | | 520 | | | | 691 | | | | 789 | | | | 1,026 | | | | 961 | | | | 512 | |
| Clean Air Expenditures | | | 240 | | | | 386 | | | | 313 | | | | 276 | | | | 260 | | | | 433 | |
Transmission Expenditures 2 | | | 44 | | | | 73 | | | | 74 | | | | 56 | | | | 63 | | | | 60 | |
Other Capital Expenditures 3 | | | 448 | | | | 506 | | | | 550 | | | | 430 | | | | 500 | | | | 513 | |
| Total Capital Projects Requirements | | $ | 1,252 | 4 | | $ | 1,973 | | | $ | 2,396 | | | $ | 2,472 | | | $ | 2,331 | | | $ | 1,794 | |
Notes
| (1) | TVA plans to fund these expenditures with power revenues and proceeds from power program financings. This table shows only expenditures that are currently planned. Additional expenditures may be required for TVA to meet the growing demand for power in its service area. |
| | (2) | Transmission Expenditures include reimbursable projects. |
| | (3) | Other Capital Expenditures are primarily associated with short lead time construction projects aimed at the continued safe and reliable operation of generating assets. |
| | (4) | The numbers above exclude allowance for funds used during construction of $165 million in 2007. |
TVA conducts a continuing review of its construction expenditures and financing programs. The amounts shown in the table above are forward-looking amounts based on a number of assumptions and are subject to various uncertainties. Actual amounts may differ materially based upon a number of factors, including changes in assumptions about system load growth, environmental regulation, rates of inflation, total cost of major projects, and availability and cost of external sources of capital, as well as the outcome of the ongoing restructuring of the electric industry. See Forward-Looking Information.
TVA does not anticipate receiving a financial return on its clean air expenditures because these expenditures neither generate revenues nor reduce costs. In fact, clean air equipment will reduce the operating efficiency and increase the operating costs of TVA’s coal-fired units. In the near term, TVA may be negatively impacted by investments in new generation (i.e., Watts Bar Unit 2) that are not expected to provide a cash return until put into service.
TVA also has certain obligations and commitments to make future payments under contracts. The following table sets forth TVA’s estimates of future payments as of September 30, 2007. See Notes 9, 11, and 15 for a further description of these obligations and commitments.
Commitments and Contingencies Payments due in the year ending September 30 |
| | | Total | | | 2008 | | | 2009 | | | 2010 | | | 2011 | | | 2012 | | | Thereafter | |
| | | | | | | | | | | | | | | | | | | | | | |
| Debt | | $ | 22,501 | 1 | | $ | 1,512 | | | $ | 2,030 | | | $ | 62 | | | $ | 1,015 | | | $ | 1,525 | | | $ | 16,357 | |
| Interest payments relating to debt | | | 21,061 | | | | 1,235 | | | | 1,173 | | | | 1,118 | | | | 1,088 | | | | 1,059 | | | | 15,388 | |
| Lease obligations | | | | | | | | | | | | | | | | | | | | | | | | | | | | |
| Capital | | | 209 | | | | 59 | | | | 58 | | | | 57 | | | | 29 | | | | 3 | | | | 3 | |
| Non-cancelable operating | | | 421 | | | | 63 | | | | 47 | | | | 37 | | | | 28 | | | | 27 | | | | 219 | |
| Purchase obligations | | | | | | | | | | | | | | | | | | | | | | | | | | | | |
| Power | | | 4,760 | | | | 186 | | | | 183 | | | | 194 | | | | 195 | | | | 196 | | | | 3,806 | |
| Fuel | | | 3,149 | | | | 1,220 | | | | 527 | | | | 504 | | | | 232 | | | | 223 | | | | 443 | |
| Other | | | 561 | | | | 310 | | | | 157 | | | | 24 | | | | 16 | | | | 15 | | | | 39 | |
| Payments on other financings | | | 1,473 | | | | 89 | | | | 85 | | | | 89 | | | | 95 | | | | 97 | | | | 1,018 | |
Payment to U.S. Treasury 2 | | | | | | | | | | | | | | | | | | | | | | | | | | | | |
Return of Power Facilities Appropriation Investment | | | 130 | | | | 20 | | | | 20 | | | | 20 | | | | 20 | | | | 20 | | | | 30 | |
Return on Power Facilities Appropriation Investment | | | 258 | | | | 19 | | | | 22 | | | | 21 | | | | 20 | | | | 18 | | | | 158 | |
| Retirement plans | | | 81 | | | | 81 | | | | – | | | | – | | | | – | | | | – | | | | – | |
| Total | | $ | 54,604 | | | $ | 4,794 | | | $ | 4,302 | | | $ | 2,126 | | | $ | 2,738 | | | $ | 3,183 | | | $ | 37,461 | |
Notes
| | (1) | Does not include noncash items of foreign currency valuation loss of $299 million and net discount on sale of Bonds of $189 million. |
| | (2) | TVA has access to financing arrangements with the U.S. Treasury whereby the U.S. Treasury is authorized to accept from TVA a short-term note with the maturity of one year or less in an amount not to exceed $150 million. TVA may draw any portion of the authorized $150 million during the year. TVA’s practice is to repay on a quarterly basis the outstanding balance of the note and related interest. Because of this practice, there was no outstanding balance on the note as of September 30, 2007. Accordingly, the Commitments and Contingencies table does not include any outstanding payment obligations to the U.S. Treasury for this note at September 30, 2007. See Note 11 — Short-Term Debt. |
In addition to the cash requirements above, TVA has contractual obligations in the form of revenue discounts related to energy prepayments. See Note 1 — Energy Prepayment Obligations.
Energy Prepayment Obligations
Payments due in the year ending September 30
| | | Total | | | 2008 | | | 2009 | | | 2010 | | | 2011 | | | 2012 | | | Thereafter | |
| | | | | | | | | | | | | | | | | | | | | | |
| Energy Prepayment Obligations | | $ | 1,138 | | | $ | 106 | | | $ | 105 | | | $ | 105 | | | $ | 105 | | | $ | 105 | | | $ | 612 | |
Financial Results
The following table compares operating results and selected statistics for 2007, 2006, and 2005:
Summary Statements of Income
For the years ended September 30
| | | 2007 | | | 2006 | | | 2005 | |
| | | As Restated | | | As Restated | | | | |
| Operating revenues | | $ | 9,326 | | | $ | 8,983 | | | $ | 7,792 | |
| Revenue capitalized during pre-commercial plant operations | | | (57 | ) | | | – | | | | – | |
| Operating expenses | | | (7,726 | ) | | | (7,560 | ) | | | (6,455 | ) |
| Operating income | | | 1,543 | | | | 1,423 | | | | 1,337 | |
| Other income | | | 73 | | | | 80 | | | | 61 | |
| Other expense | | | (2 | ) | | | (2 | ) | | | (4 | ) |
| Unrealized gain/(loss) on derivative contracts, net | | | 41 | | | | (15 | ) | | | 3 | |
| Interest expense, net | | | (1,232 | ) | | | (1,264 | ) | | | (1,312 | ) |
| Income before cumulative effects of accounting changes | | | 423 | | | | 222 | | | | 85 | |
| Cumulative effect of change in accounting for conditional asset retirement obligations | | | – | | | | (109 | ) | | | – | |
| Net income | | $ | 423 | | | $ | 113 | | | $ | 85 | |
| | | | | | | | | | | | | |
| Sales (millions of kWh) | | | 175,529 | | | | 171,651 | | | | 171,498 | |
2007 Compared to 2006
Net income for 2007 was $423 million compared with net income of $113 million for 2006. The $310 million increase in net income was mainly attributable to:
| • | A $109 million cumulative expense charge in 2006 for adoption of a new accounting standard related to conditional asset retirement obligations that did not occur in 2007; |
| • | A $343 million increase in operating revenues; |
| • | A change of $56 million in net unrealized gain/(loss) on derivative contracts; and |
| • | Lower net interest expense of $32 million. |
These items were partially offset by:
| • | A $166 million increase in operating expenses; |
| • | Revenue of $57 million capitalized during pre-commercial plant operations; and |
| • | A $7 million decrease in other income. |
Operating Revenues. Operating revenues and electricity sales during 2007 and 2006 consisted of the following:
Operating Revenues and Electricity Sales For the years ended September 30 | |
| | | Operating Revenues | | | Sales of Electricity | |
| | | (millions of dollars) | | | (millions of kWh) | |
| | | 2007 | | | 2006 | | | Percent Change | | | 2007 | | | 2006 | | | Percent Change | |
| | | As Restated | | | As Restated | | | | | | As Restated | | | As Restated | | | | |
| Operating revenues and sales of electricity | | | | | | | | | | | | | | | | | | |
| Municipalities and cooperatives | | $ | 7,847 | | | $ | 7,659 | | | | 2.5 | % | | | 142,461 | | | | 138,624 | | | | 2.8 | % |
| Industries directly served | | | 1,221 | | | | 1,065 | | | | 14.6 | % | | | 30,993 | | | | 30,987 | | | | 0.0 | % |
| Federal agencies and other | | | 112 | | | | 116 | | | | (3.4 | %) | | | 2,075 | | | | 2,040 | | | | 1.7 | % |
| Other revenue | | | 146 | | | | 143 | | | | 2.1 | % | | | – | | | | – | | | | – | |
| | | | | | | | | | | | | | | | | | | | | | | | | |
| Total operating revenues and sales of electricity | | $ | 9,326 | | | $ | 8,983 | | | | 3.8 | % | | | 175,529 | | | | 171,651 | | | | 2.3 | % |
Significant items contributing to the $343 million increase in operating revenues included:
| • | A $188 million increase in revenue from municipalities and cooperatives primarily due to increased sales of 2.8 percent and increased FCA revenue of $76 million, partially offset by a decrease in average rates of 1.3 percent; |
| • | A $156 million increase in revenue from industries directly served attributable to an increase in average rates of 15.1 percent and a slight increase in sales; and |
| • | A $3 million increase in other revenue primarily due to increased revenue from salvage sales partially offset by decreased transmission revenues from wheeling activity. |
These items were partially offset by:
| | • | A $4 million decrease in revenue from Federal agencies and other. |
| | o | This decrease was the result of an $8 million decrease in revenues from federal agencies directly served due to decreased sales of 3.0 percent, and a decrease in average rates of 4.4 percent. |
| | o | This item was partially offset by a $4 million increase in off-system sales reflecting increased sales of 40.7 percent partially offset by a decrease in average rates of 6.5 percent. |
During 2007 there was also a $57 million revenue offset related to the Browns Ferry Unit 1 pre-commercial plant operations. See Note 1 — Capitalized Revenue During Pre-Commercial Plant Operations.
Significant items contributing to the 3.9 billion kilowatt-hour increase in electricity sales included a 3.8 billion kilowatt-hour increase in sales to municipalities and cooperatives resulting from increased sales to residential, commercial, and industrial customers. The increase in residential power demand (which is more weather sensitive) is primarily a result of an increase in combined degree days of 258 days, or 4.9 percent, during 2007.
Other items contributing to the increase include:
| • | A 35 million kilowatt-hour increase in sales to Federal agencies and other. |
| | o | This increase was attributable to an 89 million kilowatt-hour increase in off-system sales mainly reflecting increased generation available for sale. |
| | o | This item was partially offset by a 54 million kilowatt-hour decrease in sales to federal agencies directly served primarily due to a decrease in demand by one of TVA’s largest federal agencies directly served as a result of a change in the nature and scope of its load. |
| • | A 6 million kilowatt-hour increase in sales to industries directly served largely attributable to customer growth. |
Operating Expenses. A table of operating expenses for 2007 and 2006 follows:
TVA Operating Expenses For the years ended September 30 | |
| | | 2007 | | | 2006 | | | Percent Change | |
| | | As Restated | | | As Restated | | | | |
| Operating expenses | | | | | | | | | |
| Fuel and purchased power | | $ | 3,449 | | | $ | 3,342 | | | | 3.2 | % |
| Operating and maintenance | | | 2,332 | | | | 2,328 | | | | 0.2 | % |
| Depreciation, amortization, and accretion | | | 1,473 | | | | 1,500 | | | | (1.8 | %) |
| Tax equivalents | | | 451 | | | | 376 | | | | 19.9 | % |
| Loss on asset impairment | | | 21 | | | | 14 | | | | 50.0 | % |
| Total operating expenses | | $ | 7,726 | | | $ | 7,560 | | | | 2.2 | % |
Significant drivers contributing to the $166 million increase in total operating expenses included:
| | • | A $75 million increase in Tax equivalent payments reflecting increased gross revenues from the sale of power (excluding sales or deliveries to other federal agencies and off-system sales with other utilities) during 2006 as compared to 2005. |
| | • | A $107 million increase in Fuel and purchased power expense. |
| | o | This increase was mainly due a $114 million increase in purchased power expense. |
| – | The increase in purchased power expense was primarily a result of a 16.4 percent increase in the volume of purchased power to accommodate decreased hydroelectric generation of 9.2 percent and the extended outage of Unit 3 at TVA’s Paradise Fossil Plant during the third quarter of 2007. |
| – | The increase in volume was partially offset by the following: |
| ▪ | A decrease in the average purchase price of 0.8 percent; and |
| ▪ | An FCA net deferral and amortization for purchased power expense of $54 million. In accordance with the FCA methodology, TVA has deferred the amount of purchased power costs that were higher than the amount included in power rates during 2007. This $54 million deferred amount will be charged to customers in future FCA adjustments. |
| | o | The increase in purchased power expense was partially offset by a $7 million decrease in fuel expense. |
| – | The decrease in fuel expense resulted primarily from an FCA net deferral and amortization for fuel expense of $95 million. In accordance with the FCA methodology, TVA has deferred the amount of fuel costs that were higher than the amount included in power rates during 2007. This $95 million deferred amount will be charged to the customers in future FCA adjustments. |
| – | The decrease was partially offset by the following: |
| ▪ | Higher aggregate fuel cost per kilowatt-hour net thermal generation of 2.7 percent; and |
| ▪ | Increased generation of 0.6 percent, 14.9 percent, and 2.5 percent at the coal-fired, combustion turbine, and nuclear plants, respectively, in part because of the lower hydroelectric generation. |
| | • | A $7 million increase in Loss on asset impairment from $14 million in 2006 to $21 million in 2007. |
| o | The $21 million Loss on asset impairment in 2007 resulted from: |
| – | A $17 million write-down of a scrubber project at Colbert during 2007; and |
| – | Write-downs of $4 million related to other Construction in progress assets during 2007. |
| o | The $14 million Loss on asset impairment in 2006 resulted from: |
| – | Write-downs of $12 million on certain Construction in progress assets related to new pollution-control and other technologies that had not been proven effective and a re-evaluation of other projects due to funding limitations; and |
| – | A $2 million write-down on one of two buildings in TVA’s Knoxville Office Complex based on TVA’s plans to sell or lease the East Tower of the Knoxville Office Complex during 2006. |
| | • | A $4 million increase in Operating and maintenance expense. |
| | o | This increase was mainly a result of: |
| – | Increased outage and routine operating and maintenance costs at coal-fired plants of $55 million due to: |
| • | An increase in outage days of 78 days as a result of four more planned outages during 2007, |
| • | Significant repair work on Unit 3 at Paradise Fossil Plant, and |
| • | Acquisition of new combustion turbine units during 2007; |
| – | A $17 million increase in expense primarily related to Watts Bar Unit 2 studies during 2007; |
| – | A $10 million increase in severance expense during 2007; |
| – | A $5 million increase in workers’ compensation expense primarily as a result of a 0.05 percent lower discount rate utilized during 2007 and increased costs to administer the program; and |
| – | An increase in operating and maintenance expenses at nuclear plants of $13 million primarily as a result of the restart of Browns Ferry Unit 1, which returned to commercial operation on August 1, 2007. |
| | o | These items were partially offset by decreased pension financing costs of $91 million as a result of a 0.52 percent higher discount rate and a 0.50 percent higher than expected long-term rate of return on pension plan assets. |
The increases in Tax equivalent payments, Fuel and purchased power expense, Loss on asset impairment, and Operating and maintenance expense were partially offset by:
| • | A $27 million decrease in Depreciation, amortization, and accretion expense. |
| | o | This decrease was mainly a result of a $41 million decrease in depreciation expense primarily attributable to the depreciation rate reduction for Browns Ferry Nuclear Plant reflecting the 20-year license extension approved by the Nuclear Regulatory Commission (“NRC”) on May 4, 2006. |
| | o | This item was partially offset by a $14 million increase in accretion expense reflecting the adoption of FIN No. 47, the updated incremental accretion for SFAS No. 143, and an increase in ARO liability during 2007. |
Other Income. The $7 million decrease in other income was largely attributable to decreased interest income from short-term investments and increased interest earnings on the collateral deposit funds held by TVA.
Unrealized Gain/(Loss) on Derivative Contracts, Net. Significant items contributing to the $56 million change in net unrealized gain/(loss) on derivative contracts included:
| • | A $58 million smaller loss related to the mark-to-market valuation adjustment of an embedded call option, from a $61 million loss during 2006 to a $3 million loss during 2007; and |
| • | A $9 million larger gain related to the mark-to-market valuation of swaption contracts, from a $19 million gain during 2006 to a $28 million gain during 2007. |
These items were partially offset by an $11 million smaller gain related to the mark-to-market valuation adjustment of an interest rate swap contract, from a $27 million gain during 2006 to a $16 million gain during 2007.
Interest Expense. Interest expense, outstanding debt, and interest rates during 2007 and 2006 were as follows:
Interest Expense For the years ended September 30 | |
| | | 2007 | | | 2006 | | | Percent Change | |
| Interest expense | | | | | | | | | |
| Interest on debt and leaseback obligations | | $ | 1,390 | | | $ | 1,406 | | | | (1.1 | %) |
| Amortization of debt discount, issue, and reacquisition costs, net | | | 19 | | | | 21 | | | | (9.5 | %) |
| Allowance for funds used during construction and nuclear fuel expenditures | | | (177 | ) | | | (163 | ) | | | 8.6 | % |
| Net interest expense | | $ | 1,232 | | | $ | 1,264 | | | | (2.5 | %) |
| | | | | | | | | | | | | |
| | | (percent) | |
| | | 2007 | | | 2006 | | | Percent Change | |
| Interest rates (average) | | | | | | | | | | | | |
| Long-term | | | 6.02 | | | | 6.17 | | | | (2.4 | %) |
| Discount notes | | | 5.21 | | | | 4.47 | | | | 16.6 | % |
| Blended | | | 5.94 | | | | 6.02 | | | | (1.3 | %) |
Significant items contributing to the $32 million decrease in net interest expense included:
| • | A decrease in the average long-term interest rate from 6.17 percent in 2006 to 6.02 percent in 2007; |
| • | A decrease of $283 million in the average balance of long-term outstanding debt in 2007; and |
| • | A $14 million increase in AFUDC due to a 4.0 percent increase in the construction work in progress base in 2007. |
These items were partially offset by:
| • | An increase in the average discount notes interest rate from 4.47 percent in 2006 to 5.21 percent in 2007; and |
| • | An increase of $260 million in the average balance of discount notes outstanding in 2007. |
2006 Compared to 2005
Net income for 2006 was $113 million compared with net income of $85 million for 2005. The $28 million increase in net income was mainly attributable to:
| • | A $1,191 million increase in operating revenues; |
| • | Lower net interest expense of $48 million; |
| • | A $19 million increase in other income; and |
| • | Lower other expense of $2 million. |
These items were partially offset by:
| • | A $1,105 million increase in operating expenses; |
| • | A $109 million cumulative expense charge in 2006 for adoption of a new accounting standard related to conditional asset retirement obligations; and |
| • | A change of $18 million in net unrealized gain/(loss) on derivative contracts. |
Operating Revenues. Operating revenues and electricity sales during 2006 and 2005 consisted of the following:
Operating Revenues and Electricity Sales For the years ended September 30 | |
| | | Operating Revenues | | | Sales of Electricity | |
| | | (millions of dollars) | | | (millions of kWh) | |
| | | 2006 | | | 2005 | | | Percent Change | | | 2006 | | | 2005 | | | Percent Change | |
| | | As Restated | | | | | | | | | As Restated | | | | | | | |
| Operating revenues and sales of electricity | | | | | | | | | | | | | | | | | | |
| Municipalities and cooperatives | | $ | 7,659 | | | $ | 6,539 | | | | 17.1 | % | | | 138,624 | | | | 136,640 | | | | 1.5 | % |
| Industries directly served | | | 1,065 | | | | 961 | | | | 10.8 | % | | | 30,987 | | | | 30,872 | | | | 0.4 | % |
| Federal agencies and other | | | 116 | | | | 181 | | | | (35.9 | %) | | | 2,040 | | | | 3,986 | | | | (48.8 | %) |
| Other revenue | | | 143 | | | | 111 | | | | 28.8 | % | | | – | | | | – | | | | – | |
| | | | | | | | | | | | | | | | | | | | | | | | | |
| Total operating revenues and sales of electricity | | $ | 8,983 | | | $ | 7,792 | | | | 15.3 | % | | | 171,651 | | | | 171,498 | | | | 0.1 | % |
Significant items contributing to the $1,191 million increase in operating revenues included:
| • | A $1,120 million increase in revenue from municipalities and cooperatives reflecting increased sales of 1.5 percent and an increase in average rates of 15.4 percent. Of this $1,120 million increase, $918 million relates to the rate adjustments effective October 1, 2005, and April 1, 2006. |
| • | A $104 million increase in revenue from industries directly served attributable to an increase in sales of 0.4 percent and an increase in average rates of 10.3 percent. Of this $104 million increase, $41 million relates to the rate adjustments effective October 1, 2005, and April 1, 2006. |
| • | A $32 million increase in other revenue primarily due to increased transmission revenues from wheeling activity. |
The rate adjustments, effective the first quarter and third quarter of 2006, contributed about $873 million to the increase in revenues on firm-based products during 2006 as compared to 2005. Firm-based products carry higher rates since they offer the most reliable power supply. As a result, customers purchasing these products are the last to have their supply interrupted during a system emergency. An additional $237 million of the increase in revenues was due to higher average rates related to a shift in product and customer mix and higher rates for variable priced products.
These items were partially offset by:
| • | A $65 million decrease in revenues from Federal agencies and other. |
| | o | This decrease was due to an $82 million decrease in off-system sales reflecting decreased sales of 90.3 percent and reduced generation of 2.7 percent, which includes a 36.6 percent decrease in hydroelectric generation resulting from dry conditions in 2006. |
| | o | This item was partially offset by a $17 million increase in revenues from federal agencies directly served due to increased sales of 4.9 percent and an increase in average rates of 14.3 percent. Of this $17 million increase, $10 million relates to the rate adjustments effective October 1, 2005, and April 1, 2006. |
Significant items contributing to the 153 million kilowatt-hour increase in electricity sales included:
| • | A 1,984 million kilowatt-hour increase in sales to municipalities and cooperatives. |
| • | A 115 million kilowatt-hour increase in sales to industries directly served as a result of increased demand by one of TVA’s largest directly served industrial customers to accommodate higher production levels at its facility, partially offset by decreased sales to other large directly served industrial customers reflecting reduced demand due to more unplanned outages and lower production levels at those facilities compared to the prior year. |
These items were partially offset by:
| • | A 1,946 million kilowatt-hour decrease in sales to Federal agencies and other. |
| | o | This decrease was due to a 2,031 million kilowatt-hour decrease in off-system sales mainly reflecting decreased generation available for sale. |
| | o | This item was partially offset by an 85 million kilowatt-hour increase in sales to federal agencies directly served primarily due to increased demand of 34.5 percent for other miscellaneous products. |
Operating Expenses. A table of operating expenses for 2006 and 2005 follows:
TVA Operating Expenses For the years ended September 30 | |
| | | 2006 | | | 2005 | | | Percent Change | |
| Operating expenses | | As Restated | | | | | | | |
| Fuel and purchased power | | $ | 3,342 | | | $ | 2,609 | | | | 28.1 | % |
| Operating and maintenance | | | 2,328 | | | | 2,303 | | | | 1.1 | % |
| Depreciation, amortization, and accretion | | | 1,500 | | | | 1,154 | | | | 30.0 | % |
| Tax equivalents | | | 376 | | | | 365 | | | | 3.0 | % |
| Loss on asset impairment | | | 14 | | | | 24 | | | | (41.7 | %) |
| Total operating expenses | | $ | 7,560 | | | $ | 6,455 | | | | 17.1 | % |
Significant drivers contributing to the $1,105 million increase in total operating expenses included:
| | • | A $733 million increase in Fuel and purchased power expense. |
| | o | This increase was a result of a $378 million increase in fuel expense and a $355 million increase in purchased power expense. |
| | – | The increased fuel costs were largely attributable to: |
| ▪ | Higher aggregate fuel cost per kilowatt-hour net thermal generation of 19.0 percent; and |
| ▪ | Increased generation of 1.2 percent, 3.0 percent, and 0.3 percent at the coal-fired, combustion turbine, and nuclear plants, respectively, in part because of lower hydroelectric generation. |
– The increased purchased power expense was mainly a result of:
| ▪ | Increased average purchase price of 16.3 percent; and |
| ▪ | Higher volume acquired of 27.7 percent to accommodate for decreased hydroelectric generation and for slightly lower asset availability in 2006 than in 2005. |
| • | A $346 million increase in Depreciation, amortization, and accretion expense. |
| | o | This increase was primarily a result of: |
| – | Increased amortization expense of $388 million largely as a result of the amortization of the deferred cost of nuclear generating units at Bellefonte Nuclear Plant; and |
| – | A $1 million increase in accretion expense mainly reflecting an increase in ARO liability during 2006. |
| | o | These items were partially offset by a $43 million decrease in depreciation expense primarily attributable to the depreciation rate reduction for Browns Ferry Nuclear Plant reflecting the 20-year license extensions approved by the NRC on May 4, 2006. |
| | • | A $25 million increase in Operating and maintenance expense. |
| | o | This increase was primarily due to: |
| – | Increased routine operating and maintenance costs at nuclear plants of $21 million as a result of increased labor costs, more forced outages, and the timing of contracts and billings during 2006; and |
| – | Increased benefits expense of $19 million attributable to increased pension related retirement costs and increased health care and dental costs during 2006. |
| | o | These items were partially offset by decreased workers’ compensation expense of $29 million largely due to a 0.30 percent higher discount rate utilized in 2006. |
| • | An $11 million increase in Tax equivalent payments due to increased gross revenues from the sale of power of 3.1 percent during 2005 as compared to 2004. |
The increases in Fuel and purchased power expense, Depreciation, amortization, and accretion expense, Operating and maintenance expense, and Tax equivalent payments were partially offset by:
| • | A $10 million decrease in Loss on asset impairment from $24 million in 2005 to $14 million in 2006. |
| | o | The $14 million Loss on asset impairment during 2006 resulted from: |
| – | Write-downs of $12 million on certain Construction in progress assets related to new pollution-control and other technologies that had not been proven effective and a re-evaluation of other projects due to funding limitations; and |
| – | A $2 million write-down on one of two buildings in TVA’s Knoxville Office Complex based on TVA’s plans to sell or lease the East Tower of the Complex. |
| o | The $24 million Loss on asset impairment during 2005 resulted from: |
| – | Write-downs of $16 million on certain Construction in progress assets related to new pollution-control and other technologies that had not been proven effective and a re-evaluation of other projects due to funding limitations; and |
| – | An $8 million write-down on one of two buildings in TVA’s Knoxville Office Complex based on TVA’s plans to sell or lease the East Tower of the Complex. |
Other Income. The $19 million increase in other income was largely attributable to increased interest earnings on the collateral deposit funds held by TVA, increased interest income from short-term investments, and an increase in external business activities not directly related to TVA’s power program.
Other Expense. The $2 million decrease in other expense was due to the loss of $2 million on the sale of distributor customer loan program receivables in 2005 not present in 2006.
Unrealized Gain/(Loss) on Derivative Contracts, Net. The significant item contributing to the $18 million change in net unrealized gain/(loss) on derivative contracts was a $177 million net change related to the mark-to-market valuation adjustment of an embedded call option, from a $116 million gain during 2005 to a $61 million loss during 2006.
This item was partially offset by:
| • | A $108 million net change related to the mark-to-market valuation adjustment of swaption contracts, from an $89 million loss during 2005 to a $19 million gain during 2006; |
| • | A $45 million net change related to the mark-to-market valuation adjustment of an interest rate swap contract, from an $18 million loss during 2005 to a $27 million gain during 2006; and |
| • | A $6 million unrealized net loss related to the mark-to-market valuation of sulfur dioxide emissions allowance call options during the first quarter of 2005 not present in 2006. |
Interest Expense. Interest expense, outstanding debt, and interest rates during 2006 and 2005 were as follows:
Interest Expense For the years ended September 30 | |
| | | 2006 | | | 2005 | | | Percent Change | |
| Interest expense | | | | | | | | | |
| Interest on debt and leaseback obligations | | $ | 1,406 | | | $ | 1,407 | | | | (0.1 | %) |
| Amortization of debt discount, issue, and reacquisition costs, net | | | 21 | | | | 21 | | | | 0.0 | % |
| Allowance for funds used during construction and nuclear fuel expenditures | | | (163 | ) | | | (116 | ) | | | 40.5 | % |
| Net interest expense | | $ | 1,264 | | | $ | 1,312 | | | | (3.7 | %) |
| | | | | | | | | | | | | |
| | | (percent) | |
| | | 2006 | | | 2005 | | | Percent Change | |
| Interest rates (average) | | | | | | | | | | | | |
| Long-term | | | 6.17 | | | | 6.25 | | | | (1.3 | %) |
| Discount notes | | | 4.47 | | | | 2.70 | | | | 65.6 | % |
| Blended | | | 6.02 | | | | 5.93 | | | | 1.5 | % |
Significant items contributing to the $48 million decrease in net interest expense included:
| • | A decrease in the average long-term interest rate from 6.25 percent in 2005 to 6.17 percent in 2006; |
| • | A decrease of $407 million in the average balance of long-term outstanding debt in 2006; |
| • | A decrease of $75 million in the average balance of discount notes outstanding in 2006; and |
| • | A $47 million increase in AFUDC due to a 31.4 percent increase in the construction work in progress base in 2006. |
These items were partially offset by an increase in the average discount notes interest rate from 2.70 percent to 4.47 percent between 2005 and 2006.
TVA has entered into one transaction that could constitute an off-balance sheet arrangement. In February 1997, TVA entered into a purchase power agreement with Choctaw Generation, Inc. (subsequently assigned to Choctaw Generation Limited Partnership) to purchase all the power generated from its facility located in Choctaw County, Mississippi. The facility had a committed capacity of 440 megawatts and the term of the agreement was 30 years. Under the accounting guidance provided by Financial Accounting Standards Board (“FASB”) Interpretation No. 46, “Consolidation of Variable Interest Entities,” as amended by FASB Interpretation No. 46R (as amended, “FIN 46R”), TVA may be deemed to be the primary beneficiary under the contract; however, TVA does not have access to the financial records of Choctaw Generation Limited Partnership. As a result, TVA was unable to determine whether FIN 46R would require TVA to consolidate Choctaw Generation Limited Partnership’s balance sheet, results of operations, and cash flows for the year ended September 30, 2007. Power purchases for 2007 under the agreement amounted to $122 million, and the remaining financial commitment under this agreement is $4.4 billion. TVA has no additional financial commitments beyond the purchase power agreement with respect to the facility. See the discussion of variable interest entities in Note 8.
In September 2007, the TVA Board approved the establishment of an asset retirement trust (“ART”) to more effectively segregate, manage, and invest funds to help meet future asset retirement obligations. The purpose of the trust is to hold funds for the contemplated future retirement of TVA’s long-lived assets and to comply with any order relating to the retirement of long-lived assets. TVA made a $40 million initial contribution to the trust on September 28, 2007. While similar in concept, the ART is separate from TVA’s nuclear decommissioning trust fund. TVA is not legally obligated to establish or maintain a trust for non-nuclear related obligations nor obligated to make any future contributions, regardless of funded status. Future contributions may be made at the discretion of the TVA Board.
The preparation of financial statements requires TVA to estimate the effects of various matters that are inherently uncertain as of the date of the financial statements. Although the financial statements are prepared in conformity with generally accepted accounting principles (“GAAP”), management is required to make estimates and assumptions that affect the reported amounts of assets and liabilities, the disclosure of contingent assets and liabilities, and the amounts of revenues and expenses reported during the reporting period. Each of these estimates varies in regard to the level of judgment involved and its potential impact on TVA’s financial results. Estimates are deemed critical either when a different estimate could have reasonably been used, or where changes in the estimate are reasonably likely to occur from period to period, and such use or change would materially impact TVA’s financial condition, changes in financial position, or results of operations. TVA’s critical accounting policies are also discussed in Note 1.
Regulatory Accounting
TVA’s power rates are not subject to regulation through a public service commission or other similar entity. TVA’s Board is authorized by the TVA Act to set rates for power sold to its customers. This rate-setting authority meets the “self-regulated” provisions of SFAS No. 71, “Accounting for the Effects of Certain Types of Regulation,” and TVA meets the remaining criteria of SFAS No. 71 because (1) TVA’s regulated rates are designed to recover its costs of providing electricity and (2) in view of demand for electricity and the level of competition it is reasonable to assume that the rates, set at levels that will recover TVA’s costs, can be charged and collected. Accordingly, TVA records certain assets and liabilities that result from the regulated ratemaking process that would not be recorded under GAAP for non-regulated entities. Regulatory assets generally represent incurred costs that have been deferred because such costs are probable of future recovery in customer rates. Regulatory liabilities generally represent obligations to make refunds to customers for previous collections for costs that are not likely to be incurred. Management assesses whether the regulatory assets are probable of future recovery by considering factors such as applicable regulatory changes, potential legislation, and changes in technology. Based on these assessments, management believes the existing regulatory assets are probable of recovery. This determination reflects the current regulatory and political environment and is subject to change in the future. If future recovery of regulatory assets ceases to be probable, TVA would be required to write-off these costs under the provisions of SFAS No. 101, “Regulated Enterprises–Accounting for the Discontinuation of Application of FASB Statement No. 71.” Any asset write-offs would be required to be recognized in earnings in the period in which future recoveries cease to be probable. See Note 6.
Long-Lived Assets
TVA capitalizes long-lived assets such as property, plant, and equipment at historical cost, which includes direct and indirect costs and AFUDC. TVA recovers the costs of these long-lived assets through depreciation of the physical assets as they are consumed in the process of providing products or services. Depreciation is generally computed on a straight-line basis over the estimated productive lives of the various classes of assets. When TVA retires its regulated long-lived assets, it charges the original asset cost plus removal costs, less salvage value, to accumulated depreciation in accordance with utility industry practice.
Long-Lived Asset Impairments
TVA evaluates the carrying value of long-lived assets when circumstances indicate the carrying value of those assets may not be recoverable. Under the provisions of SFAS No. 144, “Accounting for the Impairment or Disposal of Long-Lived Assets,” an asset impairment exists for a long-lived asset to be held and used when the carrying value exceeds the sum of estimates of the undiscounted cash flows expected to result from the use and eventual disposition of the asset. If the asset is impaired, the asset’s carrying value is adjusted downward to its estimated fair value with a corresponding impairment loss recognized in earnings.
Revenue Recognition
Revenues from power sales are recorded as power is delivered to customers. TVA accrues estimated unbilled revenues for power sales provided to customers for the period of time from the end of the billing cycle to the end of the month. The methodology for estimating unbilled revenue from electricity sales uses meter readings for each customer for the current billing period. See Note 1 — Revenues.
Asset Retirement Obligations
In accordance with the provisions of SFAS No. 143, “Accounting for Asset Retirement Obligations,” and FIN No. 47, “Accounting for Conditional Asset Retirement Obligations — an Interpretation of FASB Statement No. 143,” TVA recognizes legal obligations associated with the future retirement of certain tangible long-lived assets. These obligations relate to fossil-fired generating plants, nuclear generating plants, hydroelectric generating plants/dams, transmission structures, and other property-related assets. These other property-related assets include, but are not limited to, easements, leases, and coal rights. Activities involved with retiring these assets could include decontamination and demolition of structures, removal and disposal of wastes, and site reclamation. Revisions to the amount and timing of certain cash flow estimates of asset retirement obligations may be made based on engineering studies. For nuclear assets, the studies are performed annually in accordance with NRC requirements. For non-nuclear assets, revisions are made annually in accordance with guidance provided by SFAS No. 143 and FIN No. 47. See Note 5.
Nuclear Decommissioning
Utilities that own and operate nuclear plants are required to use different procedures in estimating nuclear decommissioning costs under SFAS No. 143 than those that are used in estimating nuclear decommissioning costs that are reported to the NRC. The difference in the discount rates used to calculate the present value of decommissioning costs under SFAS No. 143 versus the NRC has the greatest impact. Accordingly, the two sets of procedures produce different estimates for the costs of decommissioning. At September 30, 2007, the present value of the estimated future nuclear decommissioning cost under SFAS No. 143 was $1.6 billion and was included in Asset retirement obligations, and the unamortized regulatory asset of $419 million was included in Other regulatory assets. Under the NRC’s regulations, the present value of the estimated future nuclear decommissioning cost was $699 million at September 30, 2007. This decommissioning cost estimate is based on NRC’s requirements for removing a plant from service, releasing the property for unrestricted use, and terminating the operating license. The actual decommissioning costs may vary from the derived estimates because of changes in current assumptions, such as the assumed dates of decommissioning, changes in regulatory requirements, changes in technology, and changes in the cost of labor, materials, and equipment.
TVA maintains a nuclear decommissioning trust to provide funding for the ultimate decommissioning of its nuclear power plants. The trust’s funds are invested in securities generally designed to achieve a return in line with overall equity market performance. The assets of the fund are invested in debt and equity securities and certain derivative instruments. The derivative instruments are used across various asset classes to achieve a desired investment structure. The balance in the trust as of September 30, 2007, is greater than the present value of the estimated future nuclear decommissioning costs under the NRC methodology but is less than the present value of the estimated future nuclear decommissioning costs under SFAS No. 143.
The following key assumptions can have a significant effect on estimates related to the nuclear decommissioning costs:
| • | Timing – In projecting decommissioning costs, two assumptions must be made to estimate the timing of plant decommissioning. First, the date of the plant’s retirement must be estimated. At a multiple unit site, the expiration of the unit with the latest to expire operating license is typically used for this purpose, or an assumption could be made that the plant will be relicensed and operate for some time beyond the original license term. Second, an assumption must be made whether decommissioning will begin immediately upon plant retirement, or whether the plant will be held in SAFSTOR status — a status authorized by applicable regulations which allows for a nuclear facility to be maintained and monitored in a condition that allows the radioactivity to decay, after which the facility is decommissioned and dismantled. While the impact of these assumptions cannot be determined with precision, assuming either license extension or use of SAFSTOR status can significantly decrease the present value of these obligations. |
| • | Technology and Regulation – There is limited experience with actual decommissioning of large nuclear facilities. Changes in technology and experience as well as changes in regulations regarding nuclear decommissioning could cause cost estimates to change significantly. The impact of these potential changes is not presently determinable. TVA’s cost studies assume current technology and regulations. |
| • | Discount Rate – TVA uses a blended rate of 5.32 percent to calculate the present value of the weighted estimated cash flows required to satisfy TVA’s decommissioning obligation. |
| • | Investment Rate of Return – TVA assumes that its decommissioning fund will achieve a rate of return that is five percent greater than the rate of inflation. |
| • | Cost Escalation Factors – TVA’s decommissioning estimates include an assumption that decommissioning costs will escalate over present cost levels by four percent annually. |
Pension and Other Postretirement Benefits
TVA sponsors a defined benefit pension plan with two structures which cover substantially all employees. The TVA Retirement System (“TVARS”), a separate legal entity governed by its own board of directors, administers TVA-sponsored retirement plans. Additionally, TVA provides postretirement health care benefits for substantially all employees who reach retirement age while still working for TVA. TVA’s costs of providing these benefits are impacted by numerous factors including the provisions of the plans, changing employee demographics, and various actuarial calculations, assumptions, and accounting mechanisms. The most significant of these factors are discussed below.
Expected Return on Plan Assets. The expected return on pension plan assets used to develop net pension cost was 8.75 percent, 8.25 percent, and 8.25 percent during 2007, 2006, and 2005, respectively, and is determined at the beginning of the period. Changes in the rate were generally due to higher expected future returns based on studies performed by TVA’s external investment advisors. A higher expected rate of return decreases net periodic pension cost which in turn increases profitability. TVA plans to continue to utilize an expected rate of return of 8.75 percent for 2008. The 2008 expected rate of return reflects a change in the allocation policy of TVARS assets. The change in the allocation policy of TVARS assets was based on a recommendation by TVARS’ investment consultant. The changes in the expected return on plan assets discussed above do not affect TVA’s postretirement benefits plan because TVA does not separately set aside assets to fund such benefits. TVA funds its postretirement plan benefits on an as-paid basis.
Discount Rate. In the case of selecting an assumed discount rate, TVA reviews market yields on high-quality corporate debt and long-term obligations of the U.S. Treasury and endeavors to match, through the use of a proprietary bond portfolio, instrument maturities with the maturities of its pension obligations in accordance with the prevailing accounting standards. The discount rate used to determine pension expense was 5.90 percent, 5.38 percent, and 5.81 percent during 2007, 2006, and 2005, respectively. The discount rate is determined at the beginning of the period. TVA plans to use a discount rate of 6.25 percent in the determination of 2008 net periodic pension cost as well as to value plan obligations at the end of 2007. Changes in the discount rate were due to increased long-term interest rates. The discount rate is somewhat volatile because it is determined based upon the prevailing rate as of the measurement date. Similar adjustments were made to the discount rate used to determine postretirement benefit cost. The discount rate used to determine the postretirement benefits cost is the same rate used to determine pension benefits cost due to a similar expected duration of the postretirement and pension benefit obligations. A higher discount rate decreases the plan obligations and correspondingly decreases the net periodic pension and postretirement benefits costs for those plans where actuarial losses are being amortized. On the other hand, a lower discount rate increases net periodic pension and postretirement benefits costs and thus reduces profitability.
The expected rate of return on pension plan assets and the discount rate as well as the amortization of actuarial gains and losses were determined in accordance with consistent methodologies, as described in Note 14.
Mortality. Mortality assumptions are based on the results obtained from an actual company experience study performed during the most recent six years for retirees as well as other plan participants. The study supports the use of mortality rates as depicted within the 1983 Group Annuity Mortality tables. For the pension plan, the actuarial loss due to mortality experience in 2007, 2006, and 2005 was $20 million, $10 million, and $30 million, respectively. Such losses represent less than one half of one percent of the plan’s projected benefit obligation at the respective measurement dates.
Sensitivity of Costs to Changes in Assumptions. The following chart reflects the sensitivity of pension costs to changes in certain actuarial assumptions:
Sensitivity of Pension Costs to Changes in Assumptions
Actuarial Assumption | | Change in Assumption | | | Impact on 2008 Pension Cost | | | Impact on 2007 Projected Benefit Obligation | |
| | | (Increase in millions) | |
| Discount rate | | | (0.25%) | | $ | 17 | | | $ | 236 | |
| Rate of return on plan assets | | | (0.25%) | | $ | 17 | | | NA | |
| Rate of compensation | | | 0.25% | | $ | 4 | | | $ | 22 | |
| | | | | | | | | | | | | |
Each fluctuation above assumes that the other components of the calculation are held constant and excludes any impact for unamortized actuarial gains or losses.
Health Care Cost Trends. TVA reviews actual recent cost trends and projected future trends in establishing health care cost trend rates. Based on this review process, TVA did not reset its health care cost trend rate assumption used in calculating the 2007 and 2006 accumulated postretirement benefit obligations. The assumed health care trend rate used for 2007 was 8.0 percent which represents a one-half percent reduction from the 8.5 percent trend rate used during 2006. Prior to 2006, TVA used a health care cost trend rate of 9.0 percent during each of the four preceding years. The 2007 health care cost trend rate of 8.0 percent is assumed to gradually decrease each successive year until it reaches a five percent annual increase in health care costs in the year beginning October 1, 2013, and beyond.
The following chart reflects the sensitivity of postretirement benefit costs to changes in certain actuarial assumptions:
Sensitivity of Postretirement Benefit Costs to Changes in Assumptions
Actuarial Assumption | | Change in Assumption | | | Impact on 2008 Postretirement Benefit Cost | | | Impact on 2007 Projected Postretirement Benefit Obligation | |
| | | (Increase in millions) | |
| | | | | | | | | | |
| Health care cost trend | | | 0.25 | % | | $ | 1 | | | $ | 15 | |
| Discount rate | | | (0.25 | %) | | $ | 1 | | | $ | 14 | |
| | | | | | | | | | | | | |
Each fluctuation above assumes that the other components of the calculation are held constant and excludes any impact for unamortized actuarial gains or losses.
Accounting Mechanisms. In accordance with current accounting methodologies, TVA utilizes a number of accounting mechanisms that reduce the volatility of reported pension costs. Differences between actuarial assumptions and actual plan results are deferred and are amortized into cost only when the accumulated differences exceed 10 percent of the greater of the projected benefit obligation or the market-related value of plan assets. In this case, the excess is amortized over the average remaining service period of active employees.
Additionally, TVA smoothes the impact of asset performance on pension expense over a three-year phase-in period through a “market-related” value of assets calculation. Since the market-related value of assets recognizes investment gains and losses over a three year period, the future value of assets will be impacted as previously deferred gains or losses are recognized. As a result, the losses that the pension plan assets experienced in 2002 and 2001 may have an adverse impact on pension cost in future years depending on whether the actuarial losses at each measurement date exceed the 10 percent corridor in accordance with current accounting methodologies.
Due to negative pension plan asset returns in 2002 and 2001, in conjunction with other related market conditions, TVA’s accumulated benefit obligation at September 30, 2007 and 2006 exceeded plan assets. As a result, TVA was required to recognize an additional minimum pension liability as prescribed in SFAS No. 87. The charge to establish the additional minimum liability and the subsequent changes thereto were recorded in Other comprehensive income, again in accordance with the requirements of SFAS No. 87. However, TVA reclassified all such minimum pension liability changes to a regulatory asset in accordance with SFAS No. 71. The regulatory treatment of the original changes was deemed necessary because it would be improper to presume a level of future earnings on pension assets sufficient to fully recover, within a period of one year, all such costs included in Other comprehensive income. Prior to adopting SFAS No. 158, the additional minimum liability was reduced $653 million through direct corresponding entries to the established regulatory asset. Subsequent to TVA’s adoption of SFAS No. 158, the regulatory asset and pension benefit obligation was increased $323 million to recognize the total unfunded pension obligation of $621 million, and $239 million of unamortized prior service cost carried as an intangible asset was reclassified to Accumulated other comprehensive income as required by the accounting standard.
Medicare Provisions. There have been several recent developments related to retiree health care benefits, including cost sharing and legislation, such as Medicare Part D of the Medicare Prescription Drug, Improvement and Modernization Act of 2003. Under the Medicare Prescription Drug, Improvement and Modernization Act of 2003, employers may receive retiree drug subsidies for Medicare-eligible retirees who enroll in the employer’s retiree prescription drug plan, provided that the plan is determined to be “actuarially equivalent” to standard coverage provided under Medicare Part D. TVA determined that its retiree prescription drug coverage did not qualify for retiree drug subsidies. As a result, through its prescription benefit manager, TVA maintained for 2007 an employer-sponsored prescription drug plan (“PDP”). By providing an employer-sponsored PDP, TVA’s prescription benefit manager receives subsidies from Medicare which are passed through to Medicare-eligible retirees in the form of lower premiums. See Note 14 for further description.
At its September 27, 2007, meeting, the TVA Board approved the following changes in ratemaking, which result in changes in accounting for these types of transactions.
Allowance for Funds Used During Construction. Capitalization of interest and other financing costs has been a generally accepted practice in the utility industry. The concept of permitting the capitalization of interest on major plant construction projects results from a regulatory philosophy that today’s customers should not pay for the costs of financing construction that will benefit only future customers. As a result, major plant construction costs are not included in rates until the plant is placed in service. To provide a return on investment during a period of construction, utilities typically recover the cost of construction funds from future users by capitalizing a portion of current interest costs associated with funds invested in the construction projects. This capitalized interest is referred to as AFUDC.
In accordance with the accounting policy that was in effect on September 30, 2007, TVA capitalized a portion of current interest costs associated with funds invested in most construction projects and most nuclear fuel inventories. Beginning in 2008, TVA will continue to capitalize a portion of current interest costs associated with funds invested in most nuclear fuel inventories, but interest on funds invested in construction projects will be capitalized only if (1) the expected total cost of a project is $1 billion or more and (2) the estimated construction period is at least three years. Capitalized interest will continue to be a component of the asset cost and will be recovered in future periods through depreciation expense. In addition, AFUDC will continue to be a reduction to interest expense as costs are incurred. The interest costs associated with funds invested in construction projects that do not satisfy the $1 billion and three-year criteria will not be capitalized as AFUDC, will remain in the Statement of Income, and will be recovered in current year rates as a component of interest expense. TVA recorded a total of $177 million in AFUDC in 2007, of which $165 million was related to construction work in progress. TVA anticipates that it will record lower AFUDC related to construction projects in future years, particularly in 2008, as a result of the new policy.
Call Monetizations. From time to time TVA has entered into swaption transactions to monetize the value of call provisions on certain of its Bond issues. A swaption essentially grants a third party an option to enter into a swap agreement with TVA under which TVA receives a floating rate of interest and pays the third party a fixed rate of interest equal to the interest rate on the Bond issue whose call provision TVA monetized. Selling such an option creates a liability for TVA until such time as TVA buys back the option or until the option matures.
These call monetization transactions result in long-term liabilities which are marked to market each quarter. In accordance with the accounting policy that was in effect on September 30, 2007, the changes in the value of these liabilities were reported as unrealized gains or losses through TVA’s income statement in accordance with SFAS No. 133. The volatility of the valuations resulted in the recognition of sizable amounts of non-cash expense or income, which affects net income.
Beginning in 2008, the TVA Board approved the utilization of regulatory accounting treatment for swaps and swaptions related to call monetization transactions in order to better match the income statement recognition of gain and loss with the economic reality of when these transactions actually settle. This treatment removes the non-cash impacts to TVA’s earnings that result from marking the value of these instruments to market each quarter. The value of the swaps and swaptions will still be recorded on TVA’s balance sheet, and any interest expense impacts will continue to be reflected in TVA’s income statement. If this new accounting treatment were effective during 2007, TVA’s net income for 2007 would have been reduced by less than $50 million.
Accounting Changes and Error Corrections. In May 2005, FASB issued SFAS No. 154, “Accounting Changes and Error Corrections — a replacement of APB Opinion No. 20 and FASB Statement No. 3,” which replaces Accounting Principles Board (“APB”) Opinion No. 20, “Accounting Changes,” and SFAS No. 3, “Reporting Accounting Changes in Interim Financial Statements.” This statement applies to all voluntary changes in accounting principles and also applies to changes required by an accounting pronouncement in the unusual instance that the pronouncement does not include specific transition provisions. This statement requires, unless impracticable, retrospective application to prior periods’ financial statements of changes in accounting principles. If it is impracticable to determine the period-specific effects of an accounting change on one or more individual prior periods presented, this statement requires that the new accounting principle be applied to the balances of assets and liabilities as of the beginning of the earliest period for which retrospective application is practicable and that a corresponding adjustment be made to the opening balance of retained earnings for that period rather than being reported in an income statement. When it is impracticable to determine the cumulative effect of applying a change in accounting principle to all prior periods, this statement requires that the new accounting principle be applied as if it were adopted prospectively from the earliest date practicable. This statement also requires that a change in depreciation, amortization, or depletion method for long-lived, nonfinancial assets be accounted for as a change in accounting estimate effected by a change in accounting principle. This statement became effective for TVA beginning in 2007 and did not have an impact on TVA’s financial statements for 2007.
Accounting for Planned Major Maintenance Activities. On September 8, 2006, FASB released FASB Staff Position (“FSP”) AUG AIR-1, “Accounting for Planned Major Maintenance Activities.” The FSP addresses the accounting for planned major maintenance activities and amends certain provisions in the American Institute of Certified Public Accountants Industry Audit Guide, “Audits of Airline” and Accounting Principles Board Opinion No. 28, “Interim Financial Reporting.” The guidance in this FSP states that entities should adopt an accounting method that recognizes overhaul expenses in the appropriate period. The following accounting methods are most often employed/permitted: direct expensing method; built-in overhaul method; or deferral method. The guidance in this FSP is applicable to entities in all industries and must be applied to the first fiscal year beginning after December 15, 2006. TVA will adopt this guidance for 2008. Because TVA’s policy is to expense maintenance costs as incurred (direct expensing method), the adoption of this FSP is not expected to have a material impact on TVA’s results of operations or financial position.
Fair Value Measurements. In September 2006, FASB issued SFAS No. 157, “Fair Value Measurements.” This standard provides guidance for using fair value to measure assets and liabilities that currently require fair value measurement. The standard also responds to investors’ requests for expanded information about the extent to which companies measure assets and liabilities at fair value, the information used to measure fair value, and the effect of fair value measurements on earnings. SFAS No. 157 applies whenever other standards require (or permit) assets or liabilities to be measured at fair value but does not expand the use of fair value in any new circumstances. SFAS No. 157 establishes a fair value hierarchy that prioritizes the information used to develop measurement assumptions. The provisions of SFAS No. 157 are effective for financial statements issued for fiscal years beginning after November 15, 2007, and interim periods within those fiscal years. At this time, TVA is evaluating the requirements of this statement and has not yet determined the impact of its implementation, which may or may not be material to TVA’s results of operations or financial position.
Fair Value Option. In February 2007, FASB issued SFAS No. 159, “The Fair Value Option for Financial Assets and Financial Liabilities — Including an amendment of FASB Statement No. 115.” This standard permits an entity to choose to measure many financial instruments and certain other items at fair value. The fair value option established by SFAS No.159 permits all entities to choose to measure eligible items at fair value at specified election dates. A business entity will report unrealized gains and losses on items for which the fair value option has been elected in earnings at each subsequent reporting date. Most of the provisions in this statement are elective. The provisions of SFAS No. 159 are effective as of the beginning of an entity’s first fiscal year that begins after November 15, 2007. Early adoption is permitted as of the beginning of the previous fiscal year provided that the entity makes that choice in the first 120 days of that fiscal year and also elects to apply the provisions of SFAS No. 157, “Fair Value Measurements.” At this time, TVA is evaluating the requirements of this statement and has not yet determined the potential impact of its implementation, which may or may not be material to TVA’s results of operations or financial position.
Offsetting Amounts. On April 30, 2007, FASB issued FASB Staff Position (“FSP”) FIN No. 39-1, “Amendment of FASB Interpretation No. 39,” which addresses certain modifications to FASB Interpretation No. 39, “Offsetting of Amounts Related to Certain Contracts.” This FSP replaces the terms conditional contracts and exchange contracts with the term derivative instruments as defined in SFAS No. 133, “Accounting for Derivative Instruments and Hedging Activities.” The FSP also permits a reporting entity to offset fair value amounts recognized for the right to reclaim cash collateral (a receivable) or the obligation to return cash collateral (a payable) against fair value amounts recognized for derivative instruments executed with the same counterparty under the same master netting arrangement. The guidance in the FSP is effective for fiscal years beginning after November 15, 2007, with early application permitted. At this time, TVA is evaluating the requirements of this guidance and has not yet determined the potential impact of its implementation, which may or may not be material to TVA’s financial position.
Employers’ Accounting for Defined Accounting for Defined Benefit Pension and Other Postretirement Plans. On September 30, 2007, TVA adopted SFAS No. 158, “Employers’ Accounting for Defined Benefit Pension and Other Postretirement Plans — an amendment of FASB Statements No. 87, 88, 106, and 132(R).” This standard requires employers to fully recognize the obligations associated with single-employer defined benefit pension, retiree healthcare and other postretirement plans in their financial statements. The standard requires an employer to: recognize in its statement of financial position an asset for a plan’s overfunded status or a liability for a plan’s underfunded status; measure a plan’s assets and its obligations that determine its funded status as of the end of the employer’s fiscal year (with limited exceptions); and recognize changes in the funded status of a defined benefit postretirement plan in the year in which the changes occur.
Upon adoption of SFAS No. 158, TVA recorded a net benefit liability equal to the underfunded status of certain pension and other postretirement benefit plans at September 30, 2007 in the amounts of $664 million and $464 million, respectively. On September 30, 2007, the unrecognized prior service costs and unrecognized gains and losses were recognized as components of accumulated other comprehensive income which were then reclassified to and recorded as components of a regulatory asset related to TVA's unfunded benefit plans. TVA did not have any unrecognized transition obligation losses. At September 30, 2007, TVA's unfunded benefit plans' regulatory asset included unamortized prior service costs and unamortized net actuarial losses of approximately $830 million and $143 million, respectively, related to pensions and other postretirement benefits.
Rate-regulated entities may recognize regulatory assets or liabilities as a result of timing differences between the recognition of costs, as recorded with SFAS No. 87 and SFAS No.106, and costs recovered through the ratemaking process. As a result of the adoption of SFAS No. 158, TVA increased the existing unfunded benefit plans' regulatory asset by approximately $721 million related to the defined benefit pension and postretirement plans for amounts that would otherwise be charged to accumulated other comprehensive income under SFAS No. 158. See Note 14.
President’s Budget
On February 5, 2007, the Office of Management and Budget (“OMB”) transmitted the President’s proposed 2008 federal budget to Congress. In the portions specifically relating to TVA, the proposed budget recommends:
| • | Expanding the types of financial arrangements that count toward TVA’s $30 billion debt ceiling; |
| • | Requiring TVA to register its debt securities with the Securities and Exchange Commission; and |
| • | Allowing Congress to establish the amount of TVA’s Office of Inspector General’s budget and directing TVA to fund the amount with power revenues beginning in 2008. Funding for TVA’s Office of the Inspector General is currently established by TVA. |
The first recommendation has been included in a draft bill prepared by OMB, but it has not been introduced in Congress. The other recommendations have not been introduced in any legislation.
Proposed Legislation
On March 13, 2007, Senators Jim Bunning and Mitch McConnell, from Kentucky, introduced the Access to Competitive Power Act of 2007 in the Senate. Under this bill, TVA and federal power marketing agencies would be subject to greater FERC jurisdiction with respect to transmission, including rates, terms, and conditions of service. With regard to TVA, the bill would generally provide, among other things, that:
| | (1) | The anti-cherrypicking provision would not apply with respect to any distributor which provided a termination notice to TVA before December 31, 2006, regardless of whether the notice was later withdrawn or rescinded; |
| | (2) | Distributors that have given termination notices to TVA on or before December 31, 2006, would have express authority under federal law to receive partial requirements from TVA and elect, not later than 180 days after enactment, to rescind the termination notice “without the imposition of a reintegration fee or any similar fee; |
| | (3) | Distributors that have not given termination notices to TVA on or before December 31, 2006, would have express authority under federal law to receive partial requirements from TVA within a ratable limit, which cumulatively stays within a three percent compounded annual growth rate on the TVA system; and |
| | (4) | Any distributor that terminates its power supply contract with TVA in whole or in part would have the federal statutory right to directly receive its share of SEPA power that is otherwise being delivered to TVA for the benefit of all distributors. |
On August 4, 2007, the House of Representatives passed H.R. 3221, which, among other things, calls for annual reductions in greenhouse gas emissions produced by the federal government or resulting from federal activities, with a goal of having zero emissions by fiscal year 2050. Each agency (including TVA) would be required to report greenhouse gas emissions resulting from commercial air travel of federal employees or contractors, or electricity used by the agency or its contractors. Because the bill does not exclude power plants, TVA would most likely have to report any greenhouse gas emissions in the generation of electricity resulting from TVA’s power production activities, as well as any greenhouse gas emissions produced by non-federal entities from which TVA buys power.
No later than 18 months after enactment, the EPA would be required to promulgate annual reduction targets for the quantity of greenhouse gas emissions, expressed as CO2 equivalents, of agencies, taken collectively, for each of fiscal years 2010 through 2050. The President may exempt an agency from complying with the emissions target (if based on a Presidential determination that the exemption is in the paramount interest of the United States), but only for one year at a time.
The Senate passed a different energy bill that did not include a greenhouse gas reduction provision applicable to federal agencies. For an energy bill to become law, the U.S. House of Representatives and U.S. Senate will have to reach mutual agreement on a bill. A conference committee would decide on the provisions of a joint energy bill. It is unclear at this time whether a provision addressing the greenhouse gas emissions of federal agencies would be included in any energy bill, whether the two current versions are conferenced, or in any subsequent energy legislation which might be introduced and considered.
If enacted in its current form, the House bill would adversely affect TVA by forcing it to change or curtail some power generation operations, and/or by requiring the installation of mechanisms for compliance. Additionally, because the bill applies to TVA but not to power generators outside the federal government, TVA would be subject to emission reduction requirements and expenses which other utilities would not have to bear. The bill also provides a right for any “aggrieved person” to bring suit against TVA or any agency that has not met its emission reduction requirement for any particular year.
For a discussion of environmental legislation and regulation, see Item 1, Business — Environmental Matters.
TVA can control neither what legislation becomes law nor what regulations are promulgated. Even legislation or regulations of which TVA has been made aware may be changed in ways which are difficult to predict or which have unforeseen consequences. TVA cannot therefore predict with certainty or with any accuracy whether the initiatives discussed above will become law in the future and in what form, and what their impact would be on TVA. Moreover, given the nature of the legislative process, it is possible that new legislation or a change to existing legislation that has a significant impact on TVA’s activities could become law with little or no advance notice. As a federal entity, the very nature of TVA can be changed by legislation. For a discussion of the potential impact of legislation and regulation on TVA, see Item 1A, Risk Factors.
TVA’s power generation activities, like those across the utility industry and in other industrial sectors, are subject to federal, state, and local environmental statutes and regulations. Major areas of regulation affecting TVA’s activities include air quality control, water quality control, and management and disposal of solid and hazardous wastes.
TVA has incurred, and expects to continue to incur, substantial capital and operating and maintenance costs to comply with evolving environmental requirements primarily associated with the operation of TVA’s 59 coal-fired generating units. While these evolving requirements will impact the operation of existing and new coal-fired and other fossil-fuel generating units, it is virtually certain that environmental requirements placed on the operation of these generating units will continue to become more restrictive. Litigation over emissions from coal-fired generating units is also occurring, including litigation against TVA. See Item 3, Legal Proceedings.
Several existing regulatory programs that apply to fossil-fuel units are becoming more stringent, and additional regulatory programs affecting fossil-fuel units were promulgated in 2005. These new regulatory programs include the Clean Air Interstate Rule (“CAIR”) and the Clean Air Mercury Rule (“CAMR”). CAIR requires significant additional utility reductions of emissions of sulfur dioxide (“SO2”) and nitrogen oxides (“NOx”) in the eastern half of the United States (including all of TVA’s operating area), and CAMR establishes caps for overall mercury emissions in two phases with the first phase becoming effective in 2010 and the second in 2018. TVA had previously estimated its total capital cost for reducing emissions from its power plants from 1977 through 2010 would reach $5.8 billion, $4.8 billion of which had already been spent as of September 30, 2007. TVA estimates that compliance with CAIR and CAMR could lead to additional costs of $3.0 billion to $3.6 billion in the decade beginning in 2011. As discussed in more detail below, there could be additional material costs if reductions of carbon dioxide (“CO2”) are mandated or if future legislative, regulatory, or judicial actions lead to more stringent emission reduction requirements. These costs cannot reasonably be predicted at this time.
In addition, an existing federal water regulation covering cooling water intake structures and temperatures may also become more stringent. In January 2007, the United States Court of Appeals for the Second Circuit Court (“Second Circuit”) remanded EPA’s rule on this subject. In response, EPA has suspended the rule, and several parties are seeking United States Supreme Court review of the Second Circuit decision. If the Second Circuit’s decision becomes law after all appeal processes and the issuance of a new rule, compliance is expected to be more costly for the power industry. TVA is unable at this time to estimate these costs.
Clean Air Developments
Air quality in the United States has significantly improved since the enactment of the modern Clean Air Act (“CAA”) in 1970. These air quality improvements are expected to continue as the CAA continues to be implemented and as programs evolve as a result of legislative and regulatory changes. Three substances emitted from coal-fired units have been the focus of emission reduction regulatory programs: SO2, NOx, and particulates. Expenditures related to clean air projects during 2007 and 2006 were approximately $239 million and $182 million, respectively. These figures include expenditures in 2007 of $7 million to continue to reduce NOx emissions through the installation of selective catalytic reduction (“SCR”) and selective non-catalytic reduction (“SNCR”) systems and $207 million for the installation of flue gas desulfurization systems (“scrubbers”) to continue to reduce SO2 emissions, each of which is explained in more detail below. The aforementioned estimate of $5.8 billion does not include additional capital costs of $3.0 billion to $3.6 billion that TVA expects to incur over the decade beginning in 2011 to comply with CAIR and CAMR. Increasingly stringent regulation of some or all of these substances, as well as mercury and possibly CO2, will continue to result in significant capital and operating costs for TVA’s coal-fired generating units.
Sulfur Dioxide. Coal-fired utilities have historically emitted large amounts of SO2 compared to today’s emissions. Utility SO2 emissions are currently regulated under the Federal Acid Rain Program and state programs designed to meet the National Ambient Air Quality Standards (“NAAQS”) for SO2 and fine particulate matter. Looking forward, additional regulation of SO2 emissions will result from implementation of the Regional Haze Program and CAIR. In May 2005, EPA finalized CAIR to reduce the interstate transport of fine particulate matter and ozone by requiring additional large reductions in utility emissions of NOX and SO2 from 28 eastern states. All seven states in TVA’s service area are submitting plans to EPA to implement CAIR through state rules and have only proposed a few minor modifications to the federal model rule which establishes an emission allowance driven program, capping regional emissions of SO2 and NOx among the targeted states. SO2 caps are reduced in two phases, 2010 and 2015.
Since 1977, TVA has reduced its SO2 emissions by approximately 80 percent by switching to lower-sulfur coals, re-powering a unit at its Shawnee Fossil Plant with Atmospheric Fluidized Bed Combustion (“AFBC”) technology, and installing scrubbers on seven of its larger units. TVA began construction in 2005 on its eighth scrubber at its Bull Run Fossil Plant and in 2006 began construction on two more scrubbers at its Kingston Fossil Plant as part of its previously announced plans to achieve a total SO2 emission reduction of 80 to 85 percent compared to the 1977 level. Additionally, TVA has switched, or plans to switch, to lower-sulfur coal at several additional units in the next few years. It is likely that additional emission reduction measures will have to be undertaken after these planned actions are completed to achieve compliance with CAIR and any future tightening of applicable requirements.
Nitrogen Oxides. Utility NOx emissions continue to be regulated under state programs to achieve and maintain EPA’s NAAQS for ozone, the Federal Acid Rain Program, the Regional Haze Program, and CAIR. Since 1995, TVA has reduced its NOx emissions during the summer (when ozone levels increase) by 81 percent by installing various controls including low-NOx burners and/or combustion controls on 58 of its 59 coal-fired units and installing SCRs on 21 of the largest units. (The AFBC unit at Shawnee Fossil Plant is inherently low NOx emitting.)
In 2005, TVA installed SNCR systems on two units to demonstrate long-term technology capability, and continued to operate the SNCR at Johnsonville Unit 1 through the 2007 ozone season. SNCRs generally have lower NOx removal capabilities than SCRs. Early in 2006, TVA began testing a High Energy Reagent Technology (“HERT”) on three units for potential future application. HERT is similar to SNCR but has higher removal capabilities than SNCRs. The initial HERT testing program was successful, and in 2007, TVA installed this technology on two coal-fired units (Johnsonville Unit 4 and John Sevier Unit 1) to demonstrate the HERT technology on a potentially permanent basis. Similar equipment is planned for installation on the other three John Sevier units and Johnsonville Units 2 and 3 by 2009.
TVA’s NOx emission reduction program is expected to continue to depend primarily on SCRs, but will also incorporate some mix of SNCRs and/or HERTs as TVA gains more experience with these technologies. These plans may change depending on the timing and severity of future regulatory developments affecting power plant emissions.
On June 21, 2007, EPA proposed lowering the eight-hour ozone NAAQS. This proposal began a process that is expected to lead to a final decision in March 2008 on revising the ozone standard. Meeting the more stringent EPA standards for ozone contained in the proposal will challenge states and communities in the Tennessee Valley and across the country.
The current primary standard, set in 1997, is 0.08 parts per million (“ppm”). EPA is proposing to lower the primary standard to between 0.075 ppm and 0.070 ppm, and is also proposing to add a new secondary ozone standard to address impacts on vegetation. If EPA adopts the proposed standards, many urban areas and surrounding counties in the Tennessee Valley and throughout the eastern United States are likely to be designated as “non-attainment” areas (defined as geographic areas where air quality does not meet standards). Non-attainment designations can have adverse economic implications for areas that are so designated. Existing emission sources in non-attainment areas can be required to install additional controls, and new sources planning to locate in such areas are required to meet more stringent emission control requirements and obtain offsets for their emissions from other sources in the non-attainment area. In addition, transportation projects, such as roadway expansions or repairs, must demonstrate conformity with state plans to achieve attainment status or risk the loss of federal highway funds. An increase in the number of counties in the Tennessee Valley designated as non-attainment areas is also likely to focus additional regulatory attention on all NOx emission sources including TVA sources.
Particulates/Opacity. Coarse particulates (defined as particles of 10 micrometers or larger), which include fly ash, have long been regulated by states to meet EPA’s NAAQS for particulate matter. All of TVA’s coal-fired units have been equipped with mechanical collectors, electrostatic precipitators, scrubbers, or baghouses, which have reduced particulate emissions from the TVA system by more than 99 percent compared to uncontrolled units. In 1997, EPA issued separate NAAQS for even smaller particles with a size of up to 2.5 micrometers (“fine particles”). In December 2004 and April 2005, EPA issued final determinations regarding the areas of the country which are not in attainment with the 1997 fine particles standard. Those non-attainment areas include counties and parts of counties in the Knoxville and Chattanooga, Tennessee, metropolitan areas. In September 2006, EPA revised the 1997 standards. The 2006 revisions tighten the 24-hour fine particle standard and retain the 1997 annual fine particle standard. EPA also decided to retain the existing 24-hour standard for coarse particles, but revoked the related annual standard. The last three years of monitoring data (2004 to 2006) for the Nashville, Chattanooga, Memphis, and Clarksville/Hopkinsville areas show that these areas will be close to meeting the more stringent 2006 24-hour and annual fine particle standards. Attainment designations are scheduled to be made by EPA in December 2008. CAIR is intended to help states attain the fine particle standards, and actions taken to reduce emissions under CAIR, including those planned by TVA, are expected to continue to reduce fine particle levels.
Issues regarding utility compliance with state opacity requirements are also increasing. Opacity measures the denseness (or color) of power plant plumes and has traditionally been used by states as a means of monitoring good maintenance and operation of particulate control equipment. Under some conditions, retrofitting a unit with additional equipment to better control SO2 and NOx emissions can adversely affect opacity performance, and TVA and other utilities are now addressing this issue. There are also disputes and lawsuits with special interest groups over the role of continuous opacity monitors in determining compliance with opacity limitations, and TVA has received an adverse decision in one such lawsuit. See Item 3, Legal Proceedings.
Mercury. In March 2005, the EPA issued CAMR, which establishes caps for overall mercury emissions in two phases, with the first phase becoming effective in 2010 and the second in 2018. It allows the states to regulate mercury emissions through a market-based cap-and-trade program. All of the states in which TVA operates potentially affected sources have adopted CAMR without significant change. In response to a request for reconsideration, the EPA confirmed its approach in May 2006. In June 2006, 16 states and several environmental groups filed lawsuits challenging CAMR. This lawsuit is currently pending. TVA cannot predict the outcome of the pending challenge of CAMR, or what effects any decision may have that would require the EPA to regulate mercury as a hazardous air pollutant. If the EPA’s decisions are upheld and CAMR is implemented, TVA expects to achieve the required mercury reductions for at least Phase I of CAMR from co-benefits of the installation of additional emission control technology in connection with the implementation of CAIR.
CAMR does, however, require the installation of new mercury emission monitoring equipment prior to January 1, 2009. TVA is planning to comply with this requirement by procuring, installing, and certifying approximately 23 monitoring systems by the end of calendar year 2008. The costs associated with the monitoring systems have been incorporated into TVA's capital budget.
Carbon Dioxide. Legislation has been introduced in Congress to require reductions of CO2 and, if enacted, could result in significant additional costs for TVA and other coal-fired utilities. The current Administration has implemented a voluntary initiative with the goal of reducing the greenhouse gas intensity of the U.S. economy by 18 percent and has asked the electric utility sector and other industry sectors to support this initiative. TVA is supporting this effort in cooperation with electric utility industry trade associations and the DOE. TVA has taken and is continuing to take significant voluntary steps to reduce the carbon intensity of its electric generation, including the recovery of Browns Ferry Unit 1, planned power uprates of Browns Ferry Units 2 and 3, the planned completion of Watts Bar Unit 2, and the completion of the hydroelectric modernization program. TVA has also applied to the NRC for a Combined License for two advanced nuclear reactors at the Bellefonte Nuclear Plant near Hollywood, Alabama, although no decision has been made to build the reactors. Looking ahead, TVA intends to make decisions that give strong consideration to fuel mix and generating assets that are low or zero carbon emitting resources. In addition to these activities, TVA is a member of the Southeast Regional Carbon Sequestration Partnership and is working with the Electric Power Research Institute and other electric utilities on projects investigating technologies for CO2 capture and geologic storage, as well as carbon sequestration via reforestation. The previous Administration asked utilities to voluntarily participate in an effort to reduce, sequester, or avoid greenhouse gases. Under that program, TVA reduced or avoided more than 305 million tons of CO2 from 1994 through 2005, as reported under Section 1605b of the Energy Policy Act. TVA is incorporating the possibility of mandatory carbon reductions and a renewable portfolio standard into its long range planning, and will continue to monitor legislative and regulatory developments related to CO2 and a renewable portfolio standard to assess any potential financial impacts as information becomes available.
In addition to legislative activity, climate change issues are the subject to a number of lawsuits, including lawsuits against TVA. See Item 3, Legal Proceedings. On November 29, 2006, the U.S. Supreme Court heard the case of Massachusetts v. EPA, concerning whether EPA has the authority and duty to regulate CO2 emissions under the CAA. The District of Columbia Circuit Court of Appeals earlier affirmed EPA’s decision not to regulate CO2. On April 2, 2007, the Supreme Court found that greenhouse gases, including CO2, are pollutants under the CAA and thus EPA does have the authority to regulate these gases. The Supreme Court also concluded that EPA's refusal to regulate these pollutants was based on impermissible reasons, and remanded the case to EPA to "ground its reasons for action or inaction in the statute." While this case focused on CO2 emissions from motor vehicles, it sets a precedent for regulation in other industrial sectors, such as the electric utility industry.
States are also becoming more active in the regulation of emissions that are believed to be contributing to global climate change. Several northeastern states have formed the Regional Greenhouse Gas Initiative which is in the process of being implemented, and California recently passed a bill capping greenhouse gas emissions in the state. Other states are considering a variety of actions. North Carolina is studying initiatives aimed at climate change under the provisions of the state’s Clean Smokestacks Act of 2002. This act required the State Division of Air Quality to study potential control of CO2 emissions from coal-fired utility plants and other stationary sources. This effort has also prompted actions to develop a climate action plan for North Carolina.
Clean Water Developments
One of the results of the major reductions in atmospheric emissions resulting from the clean air expenditures discussed above is that wastewaters at TVA coal-fired facilities and across the utility industry may be changing because of waste streams from air quality control technologies. Varying amounts of ammonia or similar compounds used as a necessary component of SCR and SNCR operations may end up in facility wastewater ponds that may discharge through outfalls regulated under the Clean Water Act (“CWA”). Operation of scrubbers for SO2 control also results in additional amounts of pollutants introduced into facility wastewater treatment ponds. EPA is currently collecting information to determine if the Steam Electric Point Source Effluent Guidelines (“Effluent Guidelines”) under the CWA need to be revised. If the Effluent Guidelines are revised, potentially more restrictive discharge limitations for existing parameters or the addition of new parameters could result in additional wastewater treatment expense to meet requirements of the CWA. These costs cannot be accurately predicted at this time, but TVA is involved in and closely monitoring EPA’s data collection activities and the progress of the Effluent Guidelines review process. On the state level, new numeric nutrient criteria development and implementation (an EPA requirement) may require additional treatment costs to reduce nitrogen concentrations being added to the waste treatment ponds as a result of the operation of air pollution control equipment. TVA is closely monitoring the development and implementation of numeric nutrient criteria by the states in TVA’s service area.
In the second phase of a three-part rulemaking to minimize the adverse impacts from cooling water intake structures on fish and shellfish, as required under Section 316(b) of the CWA, the EPA promulgated a final rule for existing power producing facilities (the “Phase II Rule”) that became effective on September 7, 2004. The Phase II Rule required existing facilities to select among several different compliance options for reducing the number of organisms pinned against and/or drawn into the cooling systems. These options included development of a site-specific compliance option based on application of cost-cost or cost-benefit tests. The site specific tests were designed to ensure that a facility’s costs are not significantly greater than cost projections in the rule or the benefits derived from taking mitigation actions. Actions taken to compensate for any impacts by restoring habitat, or pursuing other options such as building hatcheries for fish/shellfish production, would have counted towards compliance. Some northeastern states and environmental groups challenged the new regulation, especially the compliance flexibility it offered, in federal court.
On January 25, 2007, the Second Circuit issued its decision in the proceeding challenging the EPA's Phase II Rule. The Second Circuit held that costs cannot be compared to benefits in picking the best technology available (“BTA”) to minimize the adverse environmental impacts of intake structures. Instead, the court held that the EPA is allowed to consider costs in two ways: (1) to determine what technology can reasonably be borne by industry; and (2) to engage in cost-effectiveness analysis in determining BTA. Finding the rulemaking record to be unclear on whether the EPA had relied on a cost-benefit analysis or a cost-effectiveness analysis, the Second Circuit remanded the EPA's BTA determination, giving the EPA the option to provide a reasonable explanation of its determination or make a new determination based on the permissible cost considerations set out in the Second Circuit opinion. The Second Circuit also remanded provisions of the EPA rule that allowed the use of a site-specific cost-benefit test and restoration measures (such as building hatcheries) to demonstrate compliance, holding that these rule provisions were based on an impermissible construction of the statute. Several other provisions of the Phase II Rule such as the one that sets the performance standards as a range rather than one national standard were also remanded.
On July 9, 2007, EPA suspended all but one provision of the Phase II Rule until the agency has resolved the issues raised by the Second Circuit's remand. The provision that was retained requires permitting authorities to apply, in the interim, Best Professional Judgment (“BPJ”) controls for existing facilities. BPJ controls are those that reflect the best technology available for minimizing the adverse environmental impacts of intake structures. The use of BPJ controls reflects a reversion to the regulatory process that was used by permitting authorities to regulate the impact of intake structures prior to the promulgation of the Phase II Rule.
All of the intakes at TVA's existing coal and nuclear generating facilities were subject to the Phase II Rule. TVA had been in the process of determining what was needed to comply with the Phase II Rule, and had believed that some expenditures might have been required. These earlier assessments are now being re-evaluated in light of the Second Circuit's decision, and EPA's subsequent decision to suspend the Phase II Rule and revert to BPJ controls. Given the uncertainty over the ultimate outcome of the appellate process and what the changes in the final rule as ultimately issued by EPA will be, TVA cannot assess the potential consequences at this time.
As a part of the 2006 triennial review of State Water Quality Standards in Tennessee, the Tennessee Department of Environment and Conservation (“TDEC”) lowered its threshold for issuing a Precautionary Fish Consumption Advisory (“Precautionary Advisory”) due to mercury to 0.3 ppm because of new research and the EPA’s new water quality criterion for methylmercury. The previous thresholds were 0.5 ppm for a Precautionary Advisory and 1.0 ppm for a “Do Not Consume Advisory.” In Tennessee a Precautionary Advisory recommends that sensitive populations such as children and women of child-bearing age should not consume the fish species named, and that all other persons should limit consumption of the named species to one meal per month. A “Do Not Consume Advisory” recommends that certain fish species should not be consumed by anyone in any amount. As a result of lowering the threshold, Precautionary Advisories were issued for several additional stream and reservoir segments within the State of Tennessee, including seven streams and reservoir segments in the Tennessee River Watershed. TDEC’s announcement of additional Precautionary Advisories for several Tennessee water bodies does not mean that mercury levels in fish are increasing. TVA has been monitoring mercury levels in fish and sediments in TVA reservoirs for the last 35 years, and TVA’s data was provided to TDEC as a part of its review process. TVA’s data show significant reductions in mercury concentrations in fish from the reservoirs with known industrial discharges that have now ceased operation. Other than those areas historically impacted by industrial discharges, mercury concentrations in fish have tended to fluctuate through time with no discernible trend in fish from most reservoirs. Despite increased burning of coal for electricity generation, current and historic data records indicate that mercury concentrations in reservoir sediments have remained stable or declined.
As is the case across the utility industry and in other industrial sectors, TVA is also facing more stringent requirements related to protection of wetlands, reductions in storm water impacts from construction activities, water quality degradation, new water quality criteria, and laboratory analytical methods. TVA is also following litigation related to the use of herbicides, water transfers, and releases from dams. TVA is not facing any substantive requirements related to non-compliance with existing CWA regulations.
Hazardous Substances
Liability for releases and cleanup of hazardous substances is regulated under the federal Comprehensive Environmental Response, Compensation, and Liability Act, among other statutes, and similar state statutes. In a manner similar to many other industries and power systems, TVA has generated or used hazardous substances over the years. TVA operations at some TVA facilities have resulted in releases of hazardous substances and/or oil which require cleanup and/or remediation. TVA also is aware of alleged hazardous-substance releases at 10 non-TVA areas for which it may have some liability. TVA has reached agreements with EPA to settle its liability at two of the non-TVA areas for a total of less than $23,000. There have been no recent assertions of TVA liability for six of the non-TVA areas, and (depending on the site) there is little or no known evidence that TVA contributed any significant quantity of hazardous substances to these six sites. There is evidence that TVA sent materials to the remaining two non-TVA areas: the David Witherspoon site in Knoxville, Tennessee, and the Ward Transformer site in Raleigh, North Carolina. As discussed below, TVA is not able to estimate its liability related to these sites at this time.
The Witherspoon site is contaminated with radionuclides, polychlorinated biphenyls (“PCBs”), and metals. DOE has admitted to being the main contributor of materials to the Witherspoon site and is currently performing clean-up activities. DOE claims that TVA sent equipment to be recycled at this facility, and there is some supporting evidence for the claim. However, TVA believes it sent only a relatively small amount of equipment and that none of it was radioactive. DOE has asked TVA to “cooperate” in completing the cleanup, but it has not provided to TVA any evidence of TVA’s percentage share of the contamination.
At the Ward Transformer site, EPA and a working group of potentially responsible parties ("PRPs") have provided documentation showing that TVA sent electrical equipment containing PCBs to this site in 1974. The working group is cleaning up on-site contamination in accordance with an agreement with EPA and plans to sue non-participating PRPs for contribution. The estimated cost of the cleanup is $20 million. In addition, EPA likely has incurred several million dollars in response costs, and the working group has reimbursed EPA approximately $725,000 of those costs. EPA has also proposed a cleanup plan for off-site contamination. The present worth cost estimate for performing the proposed plan is about $5 million. In addition, there may be natural resource damages liability related to this site, but TVA is not aware of any estimated amount for any such damages.
As of September 30, 2007, TVA’s estimated liability for environmental cleanup for those sites for which sufficient information is available to develop a cost estimate (primarily the TVA sites) is approximately $20 million on a non-discounted basis and is included in Other liabilities on the Balance Sheet.
Coal-Combustion Wastes
In accordance with a regulatory determination by EPA in May 2000, coal-combustion and certain related wastes disposed of in landfills and surface impoundments continue to be regulated as non-hazardous. In conjunction with this determination, EPA committed to developing non-hazardous management standards for these wastes. These standards are likely to include increased groundwater monitoring, more stringent siting requirements, and closure of existing waste-management facilities not meeting minimum standards. On August 29, 2007, EPA issued a Notice of Data Availability in which it requested public comment on whether the additional information mentioned in the notice should affect the EPA’s decisions as it continues to follow up on its commitment to develop management standards for coal-combustion wastes. TVA is currently reviewing this information to evaluate its potential impact on TVA operations.
For a discussion of TVA’s current legal proceedings and anticipated outcomes, see Item 3, Legal Proceedings.
Risk Governance
The Enterprise Risk Council (“ERC”) was created in August 2005 to strengthen and formalize TVA’s enterprise-wide risk management efforts. The ERC is responsible for the highest level of risk oversight at TVA and is also responsible for communicating enterprise-wide risks with policy implications to the TVA Board or a designated TVA Board committee. The ERC’s current members are the President and Chief Executive Officer (chair), the Chief Financial Officer, the Executive Vice President and General Counsel, the Chief Risk Officer (“CRO”), and a designated representative from the Office of the Inspector General (“OIG”) (advisory).
In addition to the ERC, TVA has established three subordinate risk committees, Financial, Operational, and Strategic, to manage risks based on natural groupings. Each of the subordinate committees reports directly to the ERC. Membership in the subordinate committees includes senior management from organizations that manage the applicable risks, the CRO, and advisory representatives from the OIG and from the Office of the General Counsel. The ERC and the risk committees meet at least quarterly.
The ERC and risk committees have cataloged the major enterprise level risks for TVA into three main categories: strategic risks, operational risks and financial risks. A discussion of significant risk factors under each of these categories, as well as risk factors related to TVA securities, is presented in Item 1A, Risk Factors. In addition, a discussion of derivative instruments that TVA uses to hedge certain of these risks is contained in Note 10.
Commodity Price Risk
TVA measures price risk associated with the commodities that are critical to its operations using either a Value at Risk (“VaR”) methodology or sensitivity analysis. Following is an explanation of these methods along with their calculated measures of TVA’s commodity price risk.
Value at Risk
TVA uses a VaR methodology common to many energy companies to measure the amount of price risk that exists within certain of its commodity portfolios. Price risk is quantified using what is referred to as the variance-covariance technique of measuring VaR, which provides a consistent measure of risk across diverse energy markets and products. This technique requires the use of a number of assumptions including a confidence level for losses, market liquidity, and a specified holding period. This methodology uses standard statistical techniques to predict market movements in light of current prices, historical volatilities, and current specific commodity correlations.
The VaR calculation gives TVA a dollar amount which reflects the maximum potential loss in the fair value of its portfolios due to adverse market movements over a 10-day period within a specified confidence level. TVA’s VaR calculations are based on a 95 percent confidence level (two-tailed test), which means that there is a 2.5 percent probability that TVA’s portfolios will incur a loss in value in 10 days at least as large as the reported VaR. For example, if the VaR is calculated at $5 million, there is a 97.5 percent probability that if prices move against current positions, the reduction in the value of the portfolio resulting from such 10-day price movements would be less than $5 million.
The following table illustrates the potential unfavorable price impact on TVA’s electricity, natural gas, SO2 emission allowance, and NOx emission allowance portfolios as measured by the VaR model based on a 10-day holding period and a 95 percent confidence level. The high and low valuations represent the highest and lowest VaR values during 2007, and the average calculation represents the average of the VaR values during 2007.
Value at Risk
| | | September 30, 2007 | | | Average | | | High | | | Low | |
| | | | | | | | | | | | | |
Electricity 1 | | $ | 69 | | | $ | 48 | | | $ | 86 | | | $ | 18 | |
Natural Gas 2 | | | 5 | | | | 15 | | | | 35 | | | | 1 | |
SO2 Emission Allowances 3 | | | 20 | | | | 21 | | | | 34 | | | | 16 | |
NOx Emission Allowances 4 | | | 1 | | | | 1 | | | | 3 | | | | 0 | |
Notes
| | (1) | TVA’s VaR calculations for electricity are based on its on-peak electricity portfolio, which includes electricity forwards and option contracts. |
| | (2) | TVA’s VaR calculations for natural gas are based on TVA’s natural gas portfolio, which includes natural gas forwards, futures, and options on futures contracts. |
| �� | (3) | TVA’s VaR calculations for SO2 emission allowances are based on TVA’s portfolio of SO2 emission allowances. |
| | (4) | TVA’s VaR calculations for NOx emission allowances are based on TVA’s portfolio of NOx emission allowances. |
VaR has several limitations as a measure of portfolio risk, including, but not limited to, its inability to adequately reflect (1) the risk of a portfolio with significant option exposure, (2) the risk of extreme price movements, and (3) the significant regulatory and legislative risks facing TVA.
Electricity. TVA enters into electricity forward contracts in order to hedge its economic risks directly associated with meeting its power supply obligations. During 2007, TVA supplied approximately 6.7 percent of system energy requirements with power purchased under electricity forward contracts.
TVA’s average electricity market risk exposure has increased annually since 2003. The increases have resulted primarily from TVA’s increased purchases of power to meet growing demand and, to a lesser extent, from increased volatility in the electricity markets.
As shown in the Value at Risk table above, at a 95 percent confidence level, the average VaR for TVA’s electricity portfolio for 2007 for a 10-day holding period was $48 million.
Natural Gas. TVA uses natural gas to operate combustion turbine peaking units and to supply fuel under power purchase agreements in which TVA is the fuel supplier. TVA hedges a portion of its natural gas needs by entering into futures contracts, options on futures contracts, swaps, and options on swaps under a financial hedging program. At September 30, 2007, TVA had derivative positions outstanding under the program equivalent to about 2,971 contracts, made up of 1,623 futures contracts, 560 options contracts, and 788 swap futures contracts, with an approximate net market value of $136 million.
As shown on the Value at Risk table above, at a 95 percent confidence level, the average VaR for TVA’s natural gas portfolio for 2007 for a 10-day holding period was $15 million.
Emission Allowances. TVA acquires both SO2 emission allowances and NOx emission allowances to help TVA comply with the emission requirements of the CAA and its implementing regulations. In addition to meeting TVA’s emissions requirements, TVA also manages the emission positions utilizing the market to optimize the value of its emission allowance portfolio. As shown in the VaR table above, at a 95 percent confidence level, the average VaR for 2007 for a 10-day holding period for TVA’s SO2 emission allowance portfolio and NOx emission allowance portfolio was $21 million and $1 million, respectively.
Fuel Oil. TVA purchases fuel oil as a substitute fuel source for TVA’s combustion turbines. Thus, TVA’s hedge against market risk for fuel oil is the use of natural gas and is captured in the natural gas VaR.
Sensitivity Analysis
TVA uses sensitivity analysis to measure the potential impact that selected hypothetical changes in certain commodity prices would have on TVA over a selected period of time. The selected hypothetical changes in commodity prices are intended to reflect reasonably possible near-term changes.
Coal. During 2007, TVA purchased 89 percent of its coal requirements under long-term coal contracts and 11 percent of its coal requirements under short-term contracts. If the rates that TVA paid for coal under short-term contracts during 2007 were 10 percent higher than the rates TVA actually paid, TVA’s coal expense would have increased by $20 million in 2007.
Uranium. During 2007, TVA did not have to purchase any uranium on the spot market, and as of September 30, 2007, TVA had all of its uranium requirements through 2011 either in inventory or under contract. Accordingly, a hypothetical 10 percent change in uranium prices during 2008 would have no material effect on TVA’s financial position, results of operations, or cash flows. See Item 1, Business — Fuel Supply — Nuclear Fuel.
Cash Flow at Risk
Cash Flow at Risk (“CFaR”) is a modeled portfolio risk metric that measures the amount of potential variability around forecasted cash flows that could be caused by changes in market conditions, hydroelectric generation and availability, and load. Although the FCA serves to limit the amount of cash flow variability to which TVA is exposed, TVA continues to manage CFaR for the mutual benefit of TVA and its customers.
TVA forecasts CFaR using a computer model. The rolling 12 month forecast is used to pinpoint months with greater amounts of CFaR that need to be hedged to limit price exposure. At September 30, 2007, TVA estimated its 2008 CFaR at $293 million based on a 90 percent confidence level.
Investment Price Risk
TVA’s investment price risk relates primarily to investments in TVA’s nuclear decommissioning trust, asset retirement trust, and pension plan.
Nuclear Decommissioning Trust
The nuclear decommissioning trust is generally designed to achieve a return in line with overall equity market performance. The assets of the trust are invested in debt and equity securities and certain derivative instruments including futures, options, and swaps, and through these investments the trust has exposure to U.S. equities, international equities, real estate investment trusts, high-yield debt, U.S. Treasury inflation-protected securities, commodities, and currencies. As of September 30, 2007, the value of the investments in the trust was $1.1 billion, and an immediate 10 percent decrease in the price of the investments in the trust would have reduced the value of the trust by $109 million. See Item 7, Management’s Discussion and Analysis of Financial Condition and Results of Operations — Critical Accounting Policies and Estimates — Nuclear Decommissioning for more information regarding TVA’s nuclear decommissioning trust.
Asset Retirement Trust
The asset retirement trust is presently invested to achieve a return in line with fixed income market performance. The assets of the trust are invested in fixed income commingled funds. As of September 30, 2007, the value of the investments in the trust was $40 million, and an immediate 10 percent decrease in the price of the investments in the trust would reduce the value of the trust by $4 million.
Pension Fund
The assets in TVA’s pension plan are primarily stocks and bonds. The Tennessee Valley Authority Retirement System (“TVARS”) targets an asset allocation policy for its pension plan assets which, in prior years, approximated 60 percent equity securities and 40 percent fixed income securities. TVARS is transitioning to a new asset allocation policy adopted March 1, 2007, which targets an asset allocation policy of 65 percent equity securities and 35 percent fixed income securities. The pension fund is invested in equity securities, debt securities, and derivative instruments such as futures, options, and swaps, and through these investments the fund has exposure to U.S. equities, international equities, real estate investment trusts, investment-grade debt, high-yield debt, U.S. Treasury inflation-protected securities, commodities, and currencies. As of September 30, 2007, the value of the investments in the pension fund was $8 billion, and an immediate 10 percent decrease in the value of the investments in the fund would have reduced the value of the fund by approximately $800 million. See Item 7, Management’s Discussion and Analysis of Financial Condition and Results of Operations — Critical Accounting Policies and Estimates — Pension and Other Postretirement Benefits and Note 14 for additional information regarding TVA’s pension fund.
Interest Rate Risk
TVA’s interest rate risk is related primarily to its short-term investments, its Bonds, TVA’s swaption transactions, and an interest rate swap related to one of TVA’s swaption transactions.
Short-Term Investments
At September 30, 2007, TVA had $165 million of cash and cash equivalents, and the average balance of cash and cash equivalents for 2007 was $389 million. If the rates of interest that TVA received on its short-term investments during 2007 were one percentage point lower than the rates of interest that TVA actually received on these investments, TVA would have received approximately $4 million less in interest from its short-term investments during 2007. In addition, changes in interest rates could affect the value of TVA’s investments in its pension fund, asset retirement trust, and nuclear decommissioning fund. See Item 7, Management’s Discussion and Analysis of Financial Condition and Results of Operations — Risk Management Activities — Investment Price Risk.
Debt Portfolio
Short-Term Debt. At September 30, 2007, TVA’s short-term borrowings were $1.4 billion, and the current maturities of long-term debt were $90 million. Based on TVA’s interest rate exposure at September 30, 2007, an immediate one percentage point increase in interest rates would have resulted in an increase of $16 million in TVA’s short-term interest expense during 2008. This calculation assumes that the balance of short-term debt during 2008 equals the short-term debt balance at September 30, 2007, plus an amount representing the refinancing of current maturities of long-term debt.
Long-Term Debt. At September 30, 2007, the interest rates on all of TVA’s outstanding long-term debt were fixed. Accordingly, an immediate one percentage point increase in interest rates would not have affected TVA’s interest expense associated with its long-term debt. When TVA’s long-term debt matures or is redeemed, however, TVA typically refinances this debt by issuing additional long-term debt. Accordingly, if interest rates are high when TVA issues this additional long-term debt, TVA’s cash flows, results of operations, and financial condition may be adversely affected. This risk is somewhat mitigated by the fact that TVA’s debt portfolio is diversified in terms of maturities and has a long average life. As of September 30, 2007, the average life of TVA’s debt portfolio was 16 years. A schedule of TVA’s debt maturities is contained in Note 11.
Swaption Agreements and Related Interest Rate Swap
Changes in interest rates also affect the amount of gains and losses on the mark-to-market valuation of TVA’s three swaption agreements and the related interest rate swap. Gains and losses on these transactions are recorded in earnings as Unrealized gain/(loss) on derivative contracts, net and are non-cash in nature. Based on TVA’s interest rate exposure at September 30, 2007, an immediate one percentage point decrease in interest rates would have created a non-cash charge to earnings of $283 million and a corresponding increase in Other liabilities. Due to changes in the ratemaking process, starting October 1, 2007, any charges will be recorded to a regulatory asset account until settled.
Currency Exchange Rate Risk
As of September 30, 2007, TVA had three issues of Bonds outstanding whose principal and interest payments are denominated in British pounds sterling. TVA issued these Bonds in amounts of £200 million, £250 million, and £150 million in 1999, 2001, and 2003, respectively. When TVA issued these Bonds, it hedged its currency exchange rate risk by entering into currency swap agreements. Accordingly, as of September 30, 2007, a 10 percent change in the British pound sterling-U.S. dollar exchange rate would not have had a material impact on TVA’s cash flows, results of operations, or financial position.
Credit Risk
Credit risk is the exposure to economic loss that would occur as a result of a counterparty’s nonperformance of its contractual obligations. Where exposed to credit risk, TVA analyzes the counterparty’s financial condition prior to entering into an agreement, establishes credit limits, monitors the appropriateness of those limits, as well as any changes in the creditworthiness of the counterparty on an ongoing basis, and employs credit mitigation measures, such as collateral or prepayment arrangements and master purchase and sale agreements, to mitigate credit risk.
Credit of Customers
The majority of TVA’s credit risk is limited to trade accounts receivable from delivered power sales to municipal and cooperative distributor customers, all located in the Tennessee Valley region. To a lesser extent, TVA is exposed to credit risk from industries and federal agencies directly served and from exchange power arrangements with a small number of investor-owned regional utilities related to either delivered power or the replacement of open positions of longer-term purchased power or fuel agreements.
TVA had concentrations of accounts receivable from seven customers that represented 40 percent of total accounts receivable as of September 30, 2007.
The table below summarizes TVA’s customer credit risk from trade accounts receivable as of September 30, 2007:
Customer Credit Risk As of September 30 | |
Trade Accounts Receivable 1 | | As Restated | |
| Municipalities and Cooperative Distributor Customers | | | |
| Investment Grade | | $ | 900 | |
| Internally Rated — Investment Grade | | | 462 | |
| Industries and Federal Agencies Directly Served | | | | |
| Investment Grade | | | 37 | |
| Non-investment Grade | | | 17 | |
| Internally Rated — Investment Grade | | | 4 | |
| Internally Rated — Non-investment Grade | | | 4 | |
| Exchange Power Arrangements | | | | |
| Investment Grade | | | 6 | |
| Non-investment Grade | | | – | |
| Internally Rated — Investment Grade | | | 3 | |
| Internally Rated — Non-investment Grade | | | 1 | |
| Subtotal | | | 1,434 | |
| Other Accounts Receivable | | | | |
| Miscellaneous Accounts | | | 26 | |
| Provision for Uncollectible Accounts | | | (2 | ) |
| Subtotal | | | 24 | |
| Total | | $ | 1,458 | |
Note
(1) Includes unbilled power receivables of $986 million and unbilled FCA of $132 million.
Credit of Other Counterparties
In addition to being exposed to economic loss due to the nonperformance of TVA’s customers, TVA is exposed to economic loss because of the nonperformance of its other counterparties, including suppliers and counterparties to its derivative contracts.
Credit of Suppliers. If one of TVA’s fuel or purchased power suppliers fails to perform under the terms of its contract with TVA, TVA might lose the money that it paid to the supplier under the contract and have to purchase replacement fuel or power on the spot market, perhaps at a significantly higher price than TVA was entitled to pay under the contract. In addition, TVA might not be able to acquire replacement fuel or power in a timely manner and thus might be unable to satisfy its own obligations to deliver power. As of September 30, 2007, counterparties with which TVA had power purchase agreements for 1,308 megawatts of capacity were in bankruptcy. Each of these parties has continued to perform under its power purchase agreement with TVA throughout the bankruptcy proceedings, and all of these agreements are secured with either cash or letters of credit. Accordingly, TVA has not experienced any economic or cash losses as a result of the counterparties’ bankruptcy proceedings.
Credit of Derivative Counterparties. TVA has entered into derivative contracts for hedging purposes, and TVA’s nuclear decommissioning trust and pension fund have entered into derivative contracts for investment purposes. If a counterparty to one of TVA’s hedging transactions defaults, TVA might incur substantial costs in connection with entering into a replacement hedging transaction. If a counterparty to the derivative contracts into which the nuclear decommissioning trust and the pension fund have entered for investment purposes defaults, the value of the investment could decline significantly, or perhaps become worthless.
Credit of TVA
A downgrade in TVA’s credit rating could have material adverse effects on TVA’s cash flows, results of operations, and financial condition and would harm investors in TVA securities. Among other things, a downgrade could have the following effects:
| • | A downgrade would increase TVA’s interest expense by increasing the interest rates that TVA pays on debt securities that it issues. An increase in TVA’s interest expense would reduce the amount of cash available for other purposes, which could result in the need to increase borrowings, to reduce other expenses or capital investments, or to increase electricity rates. |
| • | A significant downgrade could result in TVA having to post collateral under certain physical and financial contracts that contain rating triggers. |
| • | A downgrade below a contractual threshold could prevent TVA from borrowing under two credit facilities totaling $2.5 billion. |
| • | A downgrade could lower the price of TVA securities in the secondary market, thereby hurting investors who sell TVA securities after the downgrade and diminishing the attractiveness and marketability of TVA Bonds. |
For a discussion of factors that could lead to a downgrade in TVA’s credit rating, see Item 1A, Risk Factors.
See Note 18.
Quantitative and qualitative disclosures about market risk are reported in Item 7, Management’s Discussion and Analysis of Financial Condition and Results of Operations — Risk Management Activities.
TENNESSEE VALLEY AUTHORITY
For the years ended September 30
(in millions)
| | | 2007 | | | 2006 | | | 2005 | |
| | | Restated | | | Restated | | | | |
| Operating revenues | | | | | | | | | |
| Sales of electricity | | | | | | | | | |
| Municipalities and cooperatives | | $ | 7,847 | | | $ | 7,659 | | | $ | 6,539 | |
| Industries directly served | | | 1,221 | | | | 1,065 | | | | 961 | |
| Federal agencies and other | | | 112 | | | | 116 | | | | 181 | |
| Other revenue | | | 146 | | | | 143 | | | | 111 | |
| Operating revenues | | | 9,326 | | | | 8,983 | | | | 7,792 | |
| Revenue capitalized during pre-commercial plant operations | | | (57 | ) | | | – | | | | – | |
| Net operating revenues | | | 9,269 | | | | 8,983 | | | | 7,792 | |
| | | | | | | | | | | | | |
| Operating expenses | | | | | | | | | | | | |
| Fuel and purchased power | | | 3,449 | | | | 3,342 | | | | 2,609 | |
| Operating and maintenance | | | 2,332 | | | | 2,328 | | | | 2,303 | |
| Depreciation, amortization, and accretion | | | 1,473 | | | | 1,500 | | | | 1,154 | |
| Tax equivalents | | | 451 | | | | 376 | | | | 365 | |
| Loss on asset impairment | | | 21 | | | | 14 | | | | 24 | |
| Total operating expenses | | | 7,726 | | | | 7,560 | | | | 6,455 | |
| | | | | | | | | | | | | |
| Operating income | | | 1,543 | | | | 1,423 | | | | 1,337 | |
| | | | | | | | | | | | | |
| Other income | | | 73 | | | | 80 | | | | 61 | |
| | | | | | | | | | | | | |
| Other expense | | | (2 | ) | | | (2 | ) | | | (4 | ) |
| | | | | | | | | | | | | |
| Unrealized gain (loss) on derivative contracts, net | | | 41 | | | | (15 | ) | | | 3 | |
| | | | | | | | | | | | | |
| Interest expense | | | | | | | | | | | | |
| Interest on debt and leaseback obligations | | | 1,390 | | | | 1,406 | | | | 1,407 | |
| Amortization of debt discount, issue, and reacquisition costs, net | | | 19 | | | | 21 | | | | 21 | |
Allowance for funds used during construction and nuclear fuel expenditures | | | (177 | ) | | | (163 | ) | | | (116 | ) |
| Net interest expense | | | 1,232 | | | | 1,264 | | | | 1,312 | |
| | | | | | | | | | | | | |
| Income before cumulative effects of accounting changes | | | 423 | | | | 222 | | | | 85 | |
| | | | | | | | | | | | | |
Cumulative effect of change in accounting for conditional asset retirement obligations | | | – | | | | (109 | ) | | | – | |
| | | | | | | | | | | | | |
| Net income | | $ | 423 | | | $ | 113 | | | $ | 85 | |
The accompanying notes are an integral part of these financial statements.
TENNESSEE VALLEY AUTHORITY
At September 30
(in millions)
| ASSETS | |
| | | 2007 | | | 2006 | |
| | | Restated | | | Restated | |
| Current assets | | | | | | |
| Cash and cash equivalents | | $ | 165 | | | $ | 536 | |
| Restricted cash and investments | | | 150 | | | | 198 | |
| Accounts receivable, net | | | 1,458 | | | | 1,181 | |
| Inventories and other | | | 663 | | | | 598 | |
| Total current assets | | | 2,436 | | | | 2,513 | |
| | | | | | | | | |
Property, plant, and equipment (Note 4) | | | | | | | | |
| Completed plant | | | 38,811 | | | | 35,652 | |
| Less accumulated depreciation | | | (15,937 | ) | | | (15,339 | ) |
| Net completed plant | | | 22,874 | | | | 20,313 | |
| Construction in progress | | | 1,286 | | | | 3,534 | |
| Nuclear fuel and capital leases | | | 672 | | | | 574 | |
| Total property, plant, and equipment, net | | | 24,832 | | | | 24,421 | |
| | | | | | | | | |
| Investment funds | | | 1,169 | | | | 972 | |
| | | | | | | | | |
| Regulatory and other long-term assets | | | | | | | | |
| Deferred nuclear generating units | | | 3,130 | | | | 3,521 | |
| Other regulatory assets (Note 6) | | | 1,790 | | | | 1,787 | |
| Subtotal | | | 4,920 | | | | 5,308 | |
| Other long-term assets | | | 375 | | | | 1,094 | |
| Total regulatory and other long-term assets | | | 5,295 | | | | 6,402 | |
| | | | | | | | | |
| Total assets | | $ | 33,732 | | | $ | 34,308 | |
| | | | | | | | | |
| LIABILITIES AND PROPRIETARY CAPITAL | |
| Current liabilities | | | | | | | | |
| Accounts payable | | $ | 1,000 | | | $ | 890 | |
| Accrued liabilities | | | 205 | | | | 237 | |
| Collateral funds held | | | 157 | | | | 195 | |
| Accrued interest | | | 406 | | | | 403 | |
| Current portion of leaseback obligations | | | 43 | | | | 37 | |
| Current portion of energy prepayment obligations | | | 106 | | | | 106 | |
| Short-term debt, net | | | 1,422 | | | | 2,376 | |
| Current maturities of long-term debt (Note 11) | | | 90 | | | | 985 | |
| Total current liabilities | | | 3,429 | | | | 5,229 | |
| | | | | | | | | |
| Other liabilities | | | | | | | | |
| Other liabilities | | | 2,067 | | | | 2,283 | |
| Regulatory liabilities (Note 6) | | | 83 | | | | 575 | |
| Asset retirement obligations | | | 2,189 | | | | 1,985 | |
| Leaseback obligations | | | 1,029 | | | | 1,071 | |
| Energy prepayment obligations | | | 1,032 | | | | 1,138 | |
| Total other liabilities | | | 6,400 | | | | 7,052 | |
| | | | | | | | | |
Long-term debt, net (Note 11) | | | 21,099 | | | | 19,544 | |
| | | | | | | | | |
| Total liabilities | | | 30,928 | | | | 31,825 | |
| | | | | | | | | |
Commitments and contingencies (Note 15) | | | | | | | | |
| | | | | | | | | |
| Proprietary capital | | | | | | | | |
| Appropriation investment | | | 4,743 | | | | 4,763 | |
| Retained earnings | | | 1,763 | | | | 1,349 | |
| Accumulated other comprehensive (loss) income | | | (19 | ) | | | 43 | |
| Accumulated net expense of stewardship programs | | | (3,683 | ) | | | (3,672 | ) |
| Total proprietary capital | | | 2,804 | | | | 2,483 | |
| | | | | | | | | |
| Total liabilities and proprietary capital | | $ | 33,732 | | | $ | 34,308 | |
The accompanying notes are an integral part of these financial statements.
TENNESSEE VALLEY AUTHORITY
For the years ended September 30
(in millions)
| | | 2007 | | | 2006 | | | 2005 | |
| Cash flows from operating activities | | Restated | | | Restated | | | | |
| Net income | | $ | 423 | | | $ | 113 | | | $ | 85 | |
| Adjustments to reconcile net income to net cash provided by operating activities | | | | | | | | | | | | |
| Depreciation, amortization, and accretion | | | 1,492 | | | | 1,521 | | | | 1,175 | |
| Nuclear refueling outage amortization | | | 86 | | | | 89 | | | | 105 | |
| Loss on asset impairment | | | 21 | | | | 14 | | | | 24 | |
| Cumulative effect of change in accounting principle | | | – | | | | 109 | | | | - | |
| Amortization of nuclear fuel | | | 137 | | | | 128 | | | | 131 | |
| Non-cash retirement benefit expense | | | 201 | | | | 302 | | | | 289 | |
| Net unrealized gain on derivative contracts | | | (41 | ) | | | 15 | | | | (3 | ) |
| Prepayment credits applied to revenue | | | (105 | ) | | | (105 | ) | | | (105 | ) |
| Fuel cost adjustment deferral | | | (150 | ) | | | – | | | | – | |
| Other, net | | | (31 | ) | | | (3 | ) | | | 7 | |
| Changes in current assets and liabilities | | | | | | | | | | | | |
| Accounts receivable, net | | | (144 | ) | | | (15 | ) | | | (19 | ) |
| Inventories and other | | | (98 | ) | | | (120 | ) | | | (12 | ) |
| Accounts payable and accrued liabilities | | | 103 | | | | 96 | | | | (16 | ) |
| Accrued interest | | | 4 | | | | 23 | | | | (22 | ) |
| Pension contributions | | | (75 | ) | | | (75 | ) | | | (53 | ) |
| Refueling outage costs | | | (96 | ) | | | (72 | ) | | | (122 | ) |
| Other, net | | | 61 | | | | (35 | ) | | | (2 | ) |
| Net cash provided by operating activities | | | 1,788 | | | | 1,985 | | | | 1,462 | |
| | | | | | | | | | | | | |
| Cash flows from investing activities | | | | | | | | | | | | |
| Construction expenditures | | | (1,379 | ) | | | (1,370 | ) | | | (1,339 | ) |
| Combustion turbine asset acquisitions | | | (111 | ) | | | – | | | | – | |
| Nuclear fuel expenditures | | | (203 | ) | | | (277 | ) | | | (141 | ) |
| Change in restricted cash and investments | | | 48 | | | | (91 | ) | | | (107 | ) |
| (Purchases) proceeds of investments | | | (44 | ) | | | – | | | | 335 | |
| Loans and other receivables | | | | | | | | | | | | |
| Advances | | | (16 | ) | | | (17 | ) | | | (12 | ) |
| Repayments | | | 16 | | | | 13 | | | | 18 | |
| Proceeds from sale of receivables/loans (Note 1) | | | 2 | | | | 11 | | | | 56 | |
| Proceeds from settlement of litigation | | | – | | | | 35 | | | | – | |
| Other, net | | | 1 | | | | (2 | ) | | | 2 | |
| Net cash used in investing activities | | | (1,686 | ) | | | (1,698 | ) | | | (1,188 | ) |
| | | | | | | | | | | | | |
| Cash flows from financing activities | | | | | | | | | | | | |
| Long-term debt | | | | | | | | | | | | |
| Issues | | | 1,040 | | | | 1,132 | | | | 1,650 | |
| Redemptions and repurchases (Note 11) | | | (470 | ) | | | (1,241 | ) | | | (2,368 | ) |
| Short-term (redemptions)/borrowings, net | | | (955 | ) | | | (93 | ) | | | 546 | |
| Proceeds from call monetizations | | | – | | | | – | | | | 5 | |
| Payments on leaseback financing | | | (30 | ) | | | (28 | ) | | | (29 | ) |
| Payments on equipment financing | | | (7 | ) | | | (6 | ) | | | (6 | ) |
| Financing costs, net | | | (11 | ) | | | (14 | ) | | | (17 | ) |
| Payments to U.S. Treasury | | | (40 | ) | | | (38 | ) | | | (36 | ) |
| Other | | | – | | | | (1 | ) | | | – | |
| Net cash used in financing activities | | | (473 | ) | | | (289 | ) | | | (255 | ) |
| | | | | | | | | | | | | |
| Net change in cash and cash equivalents | | | (371 | ) | | | (2 | ) | | | 19 | |
| Cash and cash equivalents at beginning of period | | | 536 | | | | 538 | | | | 519 | |
| | | | | | | | | | | | | |
| Cash and cash equivalents at end of period | | $ | 165 | | | $ | 536 | | | $ | 538 | |
See Note 12 for supplemental cash flow information.
The accompanying notes are an integral part of these financial statements.
TENNESSEE VALLEY AUTHORITY
For the years ended September 30
(in millions)
| | | Appropriation Investment | | | Retained Earnings | | | Accumulated Other Comprehensive (Loss) Income | | | Accumulated Net Expense of Stewardship Programs | | | Total | | | Comprehensive Income | |
| | | | | | | | | | | | | | | | | | | |
| Balance at September 30, 2004 | | $ | 4,803 | | | $ | 1,162 | | | $ | (52 | ) | | $ | (3,649 | ) | | $ | 2,264 | | | | | |
| Net income (loss) | | | – | | | | 98 | | | | – | | | | (13 | ) | | | 85 | | | $ | 85 | |
| Return on Power Facility Appropriation Investment | | | – | | | | (16 | ) | | | – | | | | – | | | | (16 | ) | | | – | |
| Accumulated other comprehensive income (Note 9) | | | – | | | | – | | | | 79 | | | | – | | | | 79 | | | | 79 | |
| Return of Power Facility Appropriation Investment | | | (20 | ) | | | – | | | | – | | | | – | | | | (20 | ) | | | – | |
| | | | | | | | | | | | | | | | | | | | | | | | | |
| Balance at September 30, 2005 | | | 4,783 | | | | 1,244 | | | | 27 | | | | (3,662 | ) | | | 2,392 | | | $ | 164 | |
| Net income (loss) (as restated) | | | – | | | | 123 | | | | – | | | | (10 | ) | | | 113 | | | $ | 113 | |
| Return on Power Facility Appropriation Investment | | | – | | | | (18 | ) | | | – | | | | – | | | | (18 | ) | | | – | |
| Accumulated other comprehensive income (Note 9) | | | – | | | | – | | | | 16 | | | | – | | | | 16 | | | | 16 | |
| Return of Power Facility Appropriation Investment | | | (20 | ) | | | – | | | | – | | | | – | | | | (20 | ) | | | – | |
| | | | | | | | | | | | | | | | | | | | | | | | | |
| Balance at September 30, 2006 (as restated) | | | 4,763 | | | | 1,349 | | | | 43 | | | | (3,672 | ) | | | 2,483 | | | $ | 129 | |
| Net income (loss) (as restated) | | | – | | | | 434 | | | | – | | | | (11 | ) | | | 423 | | | $ | 423 | |
| Return on Power Facility Appropriation Investment | | | – | | | | (20 | ) | | | – | | | | – | | | | (20 | ) | | | – | |
| Accumulated other comprehensive (loss) (Notes 9 and 14) | | | – | | | | – | | | | (62 | ) | | | – | | | | (62 | ) | | | (62 | ) |
| Return of Power Facility Appropriation Investment | | | (20 | ) | | | – | | | | – | | | | – | | | | (20 | ) | | | – | |
| | | | | | | | | | | | | | | | | | | | | | | | | |
| Balance at September 30, 2007 (as restated) | | $ | 4,743 | | | $ | 1,763 | | | $ | (19 | ) | | $ | (3,683 | ) | | $ | 2,804 | | | $ | 361 | |
The accompanying notes are an integral part of these financial statements.
(Dollars in millions except where noted)
1. Summary of Significant Accounting Policies
General
The Tennessee Valley Authority (“TVA”) is a wholly-owned corporate agency and instrumentality of the United States. TVA was created by the U.S. Congress in 1933 by virtue of the Tennessee Valley Authority Act of 1933, as amended, 16 U.S.C. §§ 831-831ee (as amended, the “TVA Act”). TVA was created to improve navigation on the Tennessee River, reduce flood damage, provide agricultural and industrial development, and provide electric power to the Tennessee Valley region. TVA manages the Tennessee River and its tributaries for multiple river-system purposes, such as navigation; flood damage reduction; power generation; environmental stewardship; shoreline use; and water supply for power plant operations, consumer use, recreation, and industry.
Substantially all TVA revenues and assets are attributable to the power program. TVA provides power in most of Tennessee, northern Alabama, northeastern Mississippi, and southwestern Kentucky, and in portions of northern Georgia, western North Carolina, and southwestern Virginia to a population of approximately 8.7 million people. The power program has historically been separate and distinct from the stewardship programs. It is required to be self-supporting from power revenues and proceeds from power financings, such as proceeds from the issuance of bonds, notes, and other evidences of indebtedness (“Bonds”). Although TVA does not currently receive congressional appropriations, it is required to make annual payments to the U.S. Treasury in repayment of, and as a return on, the government’s appropriation investment in TVA power facilities (the “Power Facility Appropriation Investment”). Until 2000, most of the funding for TVA’s stewardship programs was provided by congressional appropriations. These programs are now funded with power revenues, except for certain stewardship activities that generate various revenues and user fees. These activities related to stewardship properties do not meet the criteria of an operating segment pursuant to Statement of Financial Accounting Standard (“SFAS”) No. 131, “Disclosures About Segments of an Enterprise and Related Information.” Accordingly, these assets and properties are included as part of the power program, TVA’s only operating segment.
Power rates are established by the TVA board of directors (“TVA Board”) as authorized by the TVA Act. The TVA Act requires TVA to charge rates for power that will produce gross revenues sufficient to provide funds for operation, maintenance, and administration of its power system; payments to states and counties in lieu of taxes; debt service on outstanding indebtedness; payments to the U.S. Treasury in repayment of and as a return on the Power Facility Appropriation Investment; and such additional margin as the TVA Board may consider desirable for investment in power system assets, retirement of outstanding Bonds in advance of maturity, additional reduction of the Power Facility Appropriation Investment, and other purposes connected with TVA’s power business. In setting TVA’s rates, the TVA Board is charged by the TVA Act to have due regard for the primary objectives of the TVA Act, including the objective that power shall be sold at rates as low as are feasible. Rates set by the TVA Board are not subject to review or approval by any state or federal regulatory body.
Fiscal Year
Unless otherwise indicated, years (2007, 2006, etc.) refer to TVA’s fiscal years ended September 30.
Cost-Based Regulation
The rate-setting authority vested in the TVA Board by the TVA Act meets the “self-regulated” provisions of SFAS No. 71, “Accounting for the Effects of Certain Types of Regulation.” In addition, TVA meets the remaining criteria for the application of SFAS No. 71 because (1) TVA’s regulated rates are designed to recover its costs of providing electricity and (2) in view of the demand for electricity and the level of competition it is reasonable to assume that the rates, set at levels that will recover TVA’s costs, can be charged and collected. Accordingly, TVA records certain assets and liabilities that result from the regulated ratemaking process that would not be recorded under generally accepted accounting principles (“GAAP”) for non-regulated entities. Regulatory assets generally represent incurred costs that have been deferred because such costs are probable of future recovery in customer rates. Regulatory liabilities generally represent obligations to make refunds to customers for previous collections for costs that are not likely to be incurred or deferral of gains that will be credited to customers in future periods. Management assesses whether the regulatory assets are probable of future recovery by considering factors such as applicable regulatory changes, potential legislation, and changes in technology. Based on these assessments, management believes the existing regulatory assets are probable of recovery. This determination reflects the current regulatory and political environment and is subject to change in the future.
If future recovery of regulatory assets ceases to be probable, TVA would be required to write-off these costs. Any asset write-offs would be required to be recognized in earnings in the period in which future recovery ceases to be probable.
Management Estimates
TVA prepares its financial statements in conformity with GAAP in the United States applied on a consistent basis. In some cases, management may make estimates and assumptions that affect the reported amounts of assets and liabilities and disclosure of contingent assets and liabilities as of the date of the financial statements and the related amounts of revenues and expenses during the reporting period. Actual results could differ from these estimates.
Reclassifications
Certain reclassifications have been made to the 2005 financial statements to conform to the 2007 and 2006 presentation.
Beginning with October 2006, certain items previously considered revenue from Sales of electricity were reclassified as Other revenue. These items are not directly associated with the sale of electricity and include delivery point charges, administrative charges, and customer charges. Previously reported sales of electricity of approximately $22 million and $23 million for 2006 and 2005, respectively, are now included in Other revenue. Additionally, certain items previously considered revenue from Other revenue were reclassified as Other income. These items are not directly associated with revenue derived from electric operations but are associated with the operation of service organizations which provide environmental and maintenance and testing services. Previously reported revenue from these items of approximately $10 million and $12 million for 2006 and 2005, respectively, is now included in Other income. Additionally, certain Other revenue related to income derived from electric operations was recorded net of related expenses. Expenses of $15 million for 2005 have been reclassified from Other revenue to Operating expenses.
TVA has certain service organizations which provide maintenance and testing services to customers both inside and outside of TVA. For 2005, the excess of cost recovery over actual cost and services provided to TVA organizations of $12 million has been reclassified from Other income to Operating expense.
Subsequent to 2005, certain financing charges related to leaseback obligations were recorded as Operating and maintenance expense. Beginning with 2006, these financing charges are classified as interest expense. Previously reported financing charges of approximately $51 million for 2005 are now included in Interest on debt and leaseback obligations.
Cash and Cash Equivalents
Cash and cash equivalents include the cash available in TVA’s commercial bank accounts and U.S. Treasury accounts, as well as short-term securities held for the primary purpose of general liquidity. Such securities mature within three months from the original date of issuance.
Restricted Cash and Investments
As of September 30, 2007 and 2006, TVA had $150 million and $198 million, respectively, in Restricted cash and investments on its Balance Sheets primarily related to collateral posted with TVA by a swap counterparty in accordance with certain credit terms included in the swap agreement, which resulted in the funds being reported in Restricted cash and investments.
Accounts Receivable
Accounts Receivable. Accounts receivable primarily consist of amounts due from customers for power sales. The table below summarizes the types and amounts of receivables (see Note 2):
Accounts Receivable As of September 30 | |
| | | 2007 | | | 2006 | |
| | | As Restated | | | As Restated | |
| Power receivables billed | | $ | 316 | | | $ | 303 | |
| Power receivables unbilled | | | 986 | | | | 832 | |
| Fuel cost adjustments unbilled | | | 132 | | | | - | |
| Total power receivables | | | 1,434 | | | | 1,135 | |
| | | | | | | | | |
| Other receivables | | | 26 | | | | 56 | |
| Allowance for uncollectible accounts | | | (2 | ) | | | (10 | ) |
| Net accounts receivable | | $ | 1,458 | | | $ | 1,181 | |
Allowance for Uncollectible Accounts
The allowance for uncollectible accounts reflects TVA’s estimate of probable losses inherent in the accounts receivable, unbilled revenue, and loans receivable balances. TVA determines the allowance based on known accounts, historical experience, and other currently available information including events such as customer bankruptcy and/or a customer failing to fulfill payment arrangements after 90 days. TVA’s corporate credit department is consulted to assess the financial condition of customers and the credit quality of the accounts. The allowance for uncollectible accounts was $2 million and $10 million at September 30, 2007 and 2006, respectively, for accounts receivable and $15 million at both September 30, 2007 and 2006, for loans receivable.
Revenues
Revenues from power sales are recorded as power is delivered to customers. In addition to power sales invoiced and recorded during the month, TVA accrues estimated unbilled revenues for power sales provided to customers for the period of time from the end of the customer's billing cycle to the end of TVA's accounting period. Components of the unbilled revenue include estimated wholesale meter readings at the applicable rates and sales of excess generation at market rates. These components can fluctuate as a result of a number of factors including weather, generation patterns, and other operational constraints. These factors can be unpredictable and can vary from historical trends. Exchange power sales are presented in the accompanying Statements of Income as a component of Sales of electricity-federal agencies and other. Exchange power sales are sales of excess power after meeting TVA native load and direct served requirements. (Native load refers to the customers on whose behalf a company, by statute, franchise, regulatory requirement, or contract, has undertaken an obligation to serve.)
Reserve for Future Generation
During the first quarter of 2007, TVA began collecting in rates amounts intended to fund future generation based on the need for additional generating capacity that would be required to meet future power demand in its service area. Because these amounts were intended to fund future costs, they were originally deferred as a regulatory liability. The funds were based on a predetermined rate applied to electricity sales approved as part of TVA’s 2007 budget. Collections for 2007 amounted to $76 million. Following the purchase of two combustion turbine facilities, these funds were applied as credits to Completed plant and are reflected on the September 30, 2007, Balance Sheet. These funds collected for future generation were amortized to revenue in order to match revenue with the corresponding depreciation expense of the purchased assets on the Statement of Income. This revenue recognition process began when the assets were placed into service. The reserve for future generation was not extended beyond 2007.
Inventories
Certain Fuel, Materials, and Supplies. Coal, oil, limestone, tire-based fuel inventories, and materials and supplies inventories are valued using an average unit cost method. A new average cost is computed after each transaction and inventory issuances are priced at the latest moving weighted average unit cost. At September 30, 2007 and 2006, TVA had $316 million and $270 million, respectively, in fuel inventories and $317 million and $288 million, respectively, in materials and supplies inventory.
Allowance for Inventory Obsolescence. TVA reviews supply and material inventories by category and usage on a periodic basis. Each category is assigned a probability of becoming obsolete based on the type of material and historical usage data. Based on the estimated value of the inventory, TVA adjusts its allowance for inventory obsolescence. The allowance for surplus and obsolete inventory was $43 million and $38 million at September 30, 2007 and 2006, respectively.
Emission Allowances. TVA has emission allowances for sulfur dioxide (“SO2”) and nitrogen oxides (“NOx”) which are accounted for as inventory. The average cost of allowances used each month is charged to operating expense based on tons of SO2 and NOx emitted. NOx emission allowances are used only during the ozone season, which occurs from May through September. Allowances granted to TVA by the Environmental Protection Agency (“EPA”) are recorded at zero cost.
Property, Plant, and Equipment, and Depreciation
Additions to plant are recorded at cost, which includes direct and indirect costs and an allowance for funds used during construction (“AFUDC”). Beginning in 2008, TVA will continue to capitalize a portion of current interest costs associated with funds invested in most nuclear fuel inventories, but interest on funds invested in construction projects will be capitalized only if (1) the expected total cost of a project is $1 billion or more and (2) the estimated construction period is at least three years. The cost of current repairs and minor replacements is charged to operating expense. Nuclear fuel inventories, which are included in Property, plant, and equipment, are valued using the average cost method for raw materials and the specific identification method for nuclear fuel in a reactor. Amortization of nuclear fuel is calculated on a units-of-production basis and is included in fuel expense.
TVA accounts for its properties using the composite convention of accounting. Accordingly, the original cost of property retired, together with removal costs less salvage value, is charged to accumulated depreciation. Depreciation is generally computed on a straight-line basis over the estimated service lives of the various classes of assets. Depreciation expense expressed as a percentage of the average annual depreciable completed plant was 2.90 percent for 2007, 3.17 percent for 2006, and 3.33 percent for 2005. Depreciation rates by asset class are as follows:
TVA Property, Plant, and Equipment Depreciation Rates As of September 30 | |
| | | 2007 | | | 2006 | | | 2005 | |
| | | As Restated | | | As Restated | | | | |
| Asset Class: | | (percent) | |
| Nuclear | | | 2.29 | | | | 3.00 | | | | 3.40 | |
| Coal-Fired | | | 3.59 | | | | 3.53 | | | | 3.53 | |
| Hydroelectric | | | 1.82 | | | | 1.79 | | | | 1.78 | |
| Combustion turbine/diesel generators | | | 4.70 | | | | 4.54 | | | | 4.55 | |
| Transmission | | | 2.53 | | | | 2.57 | | | | 2.52 | |
| Other | | | 7.05 | | | | 6.26 | | | | 5.60 | |
Depreciation expense for the years ended September 30, 2007, 2006, and 2005, was $1,048 million, $1,090 million, and $1,132 million, respectively. The single major reason for the reduction in depreciation expense for 2007 and 2006 was the rate change for Browns Ferry Nuclear Plant. The rate change was the result of the Nuclear Regulatory Commission (“NRC”) granting TVA a 20-year operating license extension. The change in the depreciation rate for the Other asset class category was due to the addition of communication-type equipment in 2007 having a depreciable life of five years.
Property, plant, and equipment also includes assets recorded under capital lease agreements which primarily consist of office facilities of $30 million and $39 million as of September 30, 2007 and 2006, respectively, and fuel fabrication and blending facilities of $39 million and $45 million as of September 30, 2007 and 2006, respectively.
Blended Low Enriched Uranium Program
Under the blended low enriched uranium (“BLEU”) program, TVA, the Department of Energy (“DOE”), and nuclear fuel contractors have entered into agreements providing for surplus highly enriched uranium to be blended with other uranium down to a level that allows the blended uranium to be fabricated into fuel that can be used in nuclear power plants. This blended nuclear fuel was first loaded in a Browns Ferry reactor in 2005, which initiated the amortization of the costs of the BLEU fuel assemblies to nuclear fuel expense.
Under the terms of an interagency agreement between TVA and DOE, DOE supplies off-specification, highly enriched uranium materials to the appropriate third party fuel processors for processing into usable fuel for TVA. In exchange, DOE will participate to a degree in the savings generated by TVA’s use of this blended nuclear fuel. Over the life of the program, TVA projects that DOE’s share of savings generated by TVA’s use of this blended nuclear fuel could result in future payments to DOE of as much as $257 million. TVA anticipates these future payments could begin in 2009 and last until 2013. At September 30, 2006, TVA had accrued an obligation of $2 million related to the portion of the ultimate future payments estimated to be attributable to the BLEU fuel currently in use. At September 30, 2007, this obligation was $6 million.
The third party fuel processors own the conversion and processing facilities and will retain title to all land, property, plant, and equipment used in the BLEU fuel program. In accordance with the requirements of EITF No. 01-08, “Determining Whether an Arrangement Contains a Lease,” and SFAS No. 13, “Accounting for Leases,” however, TVA recognized a capital lease asset and corresponding lease obligation related to amounts paid or payable to a third party fuel processor. Accounting recognition of the capital lease asset and obligation recharacterization resulted from contract modifications to the pre-existing fuel fabrication contract.
During the quarter ended March 31, 2005, TVA recorded a capital lease asset of $60 million comprised of $23 million of contract payments made before the lease was recharacterized as a capital lease and $37 million in contract payments either paid or payable after the lease was recharacterized as a capital lease. Also during the quarter, TVA recorded an initial capital lease obligation of $37 million. This obligation has subsequently been reduced by principal payments, leaving an unpaid capital lease obligation of $7 million and $13 million at September 30, 2007 and 2006, respectively. Additionally, TVA has recognized asset amortization expense of $6 million and $6 million and interest expense of $0.4 million and $1 million related to the capital lease obligation through September 30, 2007 and 2006, respectively.
Investment Funds
Investment funds consist primarily of trust funds designated to fund nuclear decommissioning requirements (see Note 15 — Contingencies — Decommissioning Costs), asset retirement obligations (see Note 5 — Asset Retirement Trust), and the supplemental executive retirement plan (“SERP”). See Note 14 — Supplemental Executive Retirement Plan. Decommissioning funds and SERP funds, which are classified as trading, are invested in portfolios of securities generally designed to earn returns in line with overall equity market performance. Asset retirement funds, which are classified as trading, are invested in commingled funds designed to earn returns in line with fixed income market performance.
Other Long-Term Assets
The year-end balances of TVA’s Other long-term assets are as follows:
Other Long-Term Assets
As of September 30
| | | 2007 | | | 2006 | |
| Loans and long-term receivables, net | | $ | 79 | | | $ | 80 | |
| Intangible asset related to pension prior service cost | | | – | | | | 280 | |
| Valuation of currency swaps | | | 280 | | | | 246 | |
| Valuation of commodity contracts | | | 16 | | | | 487 | |
| | | $ | 375 | | | $ | 1,093 | |
For additional information on the components of Other long-term assets, see Note 1 — Allowance for Uncollectible Accounts, Note 10 — Overview of Accounting Treatment, Commodity Contracts, and Swaps, Note 13 — Loans and Other Long-term Receivables, and Note 14 — Defined Benefit Pension Plan — Components of Plan, Other Postretirement Benefits — Components of Other Postretirement Benefits, and Supplemental Executive Retirement Plan.
Energy Prepayment Obligations
During 2002, TVA introduced an energy prepayment program, the discounted energy units (“DEU”) program. Under this program, TVA customers could purchase DEUs generally in $1 million increments, and each DEU entitles the purchaser to a $0.025/kilowatt-hour discount on a specified quantity of firm power over a period of years (five, 10, 15, or 20) for each kilowatt-hour in the prepaid block. The remainder of the price of the kilowatt-hours delivered to the customer is due upon billing.
TVA did not offer the DEU program in 2007, 2006, or 2005. Sales for the 2004 program included 5.5 DEUs totaling $5.5 million over a 10-year period and 1.75 DEUs totaling $1.75 million over a five-year period. Total sales for the program since inception have been $54.5 million. TVA is accounting for the prepayment proceeds as unearned revenue and is reporting the obligations to deliver power as Energy prepayment obligations and Current portion of energy prepayment obligations on the September 30, 2007 and 2006, Balance Sheets. TVA recognizes revenue as electricity is delivered to customers, based on the ratio of units of kilowatt-hours delivered to total units of kilowatt-hours under contract. As of September 30, 2007, $25.9 million has been applied against power billings on a cumulative basis during the life of the program, of which over $5.6 million was recognized as noncash revenue during 2007, 2006, and 2005.
In 2004, TVA and its largest customer, Memphis Light, Gas, and Water Division (“MLGW”), entered into an energy prepayment agreement under which MLGW prepaid TVA $1.5 billion for the future costs of electricity to be delivered by TVA to MLGW over a period of 180 months. TVA accounted for the prepayment as unearned revenue and is reporting the obligation to deliver power under this arrangement as Energy prepayment obligations and Current portion of energy prepayment obligations on the September 30, 2007 and 2006, Balance Sheets. TVA expects to recognize approximately $100 million of noncash revenue in each year of the arrangement as electricity is delivered to MLGW based on the ratio of units of kilowatt-hours delivered to total units of kilowatt-hours under contract. As of September 30, 2007, $390.4 million had been recognized as noncash revenue on a cumulative basis during the life of the agreement, $100 million of which was recognized as noncash revenue during 2007, 2006, and 2005.
Insurance
Although TVA uses private companies to administer its health-care plans for eligible active and retired employees not covered by Medicare, TVA does not purchase health insurance. Consulting actuaries assist TVA in determining certain liabilities for self-assumed claims. TVA recovers the costs of losses through power rates and through adjustments to the participants’ contributions to their benefit plans. These liabilities are included in Other liabilities on the Balance Sheets.
TVA purchases nuclear liability insurance, nuclear property, decommissioning, and decontamination insurance, and nuclear accidental outage insurance. See Note 15 — Contingencies — Nuclear Insurance.
TVA does not currently purchase commercial general liability, auto liability, or workers’ compensation insurance. TVA recovers the costs of losses through power rates. The Federal Employees’ Compensation Act governs liability to employees for service-connected injuries.
TVA purchases property insurance for certain conventional (non-nuclear) assets as well as outage insurance (business interruption) for selected conventional generating assets. TVA also purchases liability insurance which provides coverage for its directors and officers subject to the terms and conditions of the policy.
Sale of Receivables/Loans
During 2007, TVA sold $2 million of receivables at par such that TVA did not recognize a gain or loss on the sale. These receivables were from a power customer and were related to the construction of a substation. The proceeds from the sale of these receivables are included in the Cash Flow Statement under the caption Cash flows from investing activities.
During 2006, TVA sold $22 million of receivables at par such that TVA did not recognize a gain or loss on the sale. Of this amount, $11 million represented receivables from power customers related to the construction of a substation and other energy conservation projects. The proceeds from the sale of these receivables are included in the Cash Flow Statement under the caption Cash flows from investing activities.
TVA did not retain any claim on these receivables sold, and they are no longer reported on TVA’s Balance Sheets.
Asset Retirement Obligations
In accordance with the provisions of SFAS No. 143, “Accounting for Asset Retirement Obligations," TVA recognizes legal obligations associated with the future retirement of certain tangible long-lived assets. TVA records estimates of such disposal costs only at the time the legal obligation arises. See Note 5.
Based on updating assumptions in the engineering studies annually in accordance with NRC requirements, revisions to the amount and timing of certain cash flow estimates of nuclear asset retirement obligations may be made. TVA recognizes as incurred all obligations related to closure and removal of its nuclear units. TVA measures the liability for closure at the present value of the weighted estimated cash flows required to satisfy the related obligation, discounted at the credit adjusted rate of interest in effect at the time the liability was actually incurred or originally accrued, and subsequently modified to comply with SFAS No. 143. Earnings from decommissioning fund investments, amortization of the decommissioning regulatory asset, and interest expense on the decommissioning liability are deferred as a regulatory asset. See Note 15 — Contingencies — Decommissioning Costs. Beginning in 2003, TVA evaluated the nature and scope of its decommissioning policy as it relates to all electric plants. The evaluation was used to determine the need for recognition of additional asset retirement obligations as described in SFAS No. 143, “Accounting for Asset Retirement Obligations.” SFAS No. 143 became effective for TVA at the beginning of 2003. See Note 5. On September 30, 2006, TVA began applying the guidance of Financial Accounting Standards Board (“FASB”) Interpretation (“FIN”) No. 47, “Accounting for Conditional Asset Retirement Obligations—an Interpretation of FASB Statement No. 143.” See Note 5 for the effects of applying this interpretation.
Capitalized Revenue During Pre-Commercial Plant Operations
As part of the process of restarting Browns Ferry Unit 1, TVA commenced pre-commercial plant operations on June 2, 2007. The pre-commercial plant operations period ended July 31, 2007, and commercial operations began on August 1, 2007. The electricity produced during the pre-commercial plant operations period was used to serve the demands of the system; therefore, TVA calculated estimates of revenue realized from such pre-commercial generation based on the guidance provided by FERC regulations. The calculated revenue of $57 million was capitalized to offset project costs and is reported as a contra-revenue account on the income statement. During this same period, TVA capitalized operating costs, including fuel, of over $9 million.
Discounts on Sales
TVA’s DEU program (see Note 1 — Energy Prepayment Obligations) allows customers to use cash on hand to prepay TVA for some of their power needs, providing funding to TVA and a savings to customers in the form of a discount on future purchases. The distributor customer receives a discount on a specified volume of firm energy purchased. The supplement to the power contract specifies the discount rate (2.5 cents per kilowatt-hour), the monthly block of kilowatt-hours to which the discount applies, the number of years (term), and contingencies upon contract termination.
TVA’s largest customer, MLGW, also has a power prepayment agreement (see Note 1 — Energy Prepayment Obligations) under which it has prepaid $1.5 billion for a fixed amount of power. TVA repays MLGW in the form of a monthly credit sufficient for MLGW to pay debt service on its prepayment bonds plus a return on investment.
Discounts for these programs amounted to $47 million for each of the years ended September 30, 2007, 2006, and 2005.
Allowance for Funds Used During Construction
TVA capitalizes AFUDC based on the average interest rate of TVA’s outstanding debt. The allowance is applicable to construction in progress and nuclear fuel fabrication. Beginning in 2008, TVA will continue to capitalize a portion of current interest costs associated with funds invested in most nuclear fuel inventories, but interest on funds invested in construction projects will be capitalized only if (1) the expected total cost of a project is $1 billion or more and (2) the estimated construction period is at least three years.
Software Costs
TVA capitalizes certain costs incurred in connection with developing or obtaining internal-use software. Capitalized software costs are included in Property, plant, and equipment on the Balance Sheet and are primarily amortized over five years. TVA capitalized costs of $22 million in 2007 and $2 million in 2006 related to an enterprise management project. Software costs that do not meet capitalization criteria are expensed as incurred.
Research and Development Costs
Research and development costs are expensed when incurred. TVA’s research programs include those related to transmission technologies, emerging technologies (clean coal, renewables, distributed resources, and energy efficiency), technologies related to generation (fossil, nuclear, and hydro), and environmental technologies. During 2007, 2006, and 2005 research and development costs of $20 million, $20 million, and $21 million, respectively, were expensed and included in the Statements of Income caption Operating and maintenance.
Payments In Lieu of Taxes
The TVA Act requires TVA to make payments to states and counties in which TVA conducts its power operations and in which TVA has acquired power properties previously subject to state and local taxation. The amount of these payments is five percent of gross revenues from sale of power during the preceding year, excluding sales or deliveries to other federal agencies and off-system sales with other utilities, with a provision for minimum payments under certain circumstances.
Impairment of Assets
TVA evaluates long-lived assets for impairment in accordance with the provisions of SFAS No. 144, “Accounting for the Impairment or Disposal of Long-Lived Assets,” when events or changes in circumstances indicate that the carrying value of such assets may not be recoverable. For long-lived assets, TVA bases its evaluation on impairment indicators such as the nature of the assets, the future economic benefit of the assets, any historical or future profitability measurements, and other external market conditions or factors that may be present. If such impairment indicators are present or other factors exist that indicate that the carrying amount of an asset may not be recoverable, TVA determines whether an impairment has occurred based on an estimate of undiscounted cash flows attributable to the asset as compared with the carrying value of the asset. If an impairment has occurred, the amount of the impairment recognized is measured as the excess of the asset’s carrying value over its fair value. See Note 7.
Impact of New Accounting Standards and Interpretations
Accounting Changes and Error Corrections. In May 2005, FASB issued SFAS No. 154, “Accounting Changes and Error Corrections — a replacement of APB Opinion No. 20 and FASB Statement No. 3,” which replaces Accounting Principles Board (“APB”) Opinion No. 20, “Accounting Changes,” and SFAS No. 3, “Reporting Accounting Changes in Interim Financial Statements.” This statement applies to all voluntary changes in accounting principles and also applies to changes required by an accounting pronouncement in the unusual instance that the pronouncement does not include specific transition provisions. This statement requires, unless impracticable, retrospective application to prior periods’ financial statements of changes in accounting principles. If it is impracticable to determine the period-specific effects of an accounting change on one or more individual prior periods presented, this statement requires that the new accounting principle be applied to the balances of assets and liabilities as of the beginning of the earliest period for which retrospective application is practicable and that a corresponding adjustment be made to the opening balance of retained earnings for that period rather than being reported in an income statement. When it is impracticable to determine the cumulative effect of applying a change in accounting principle to all prior periods, this statement requires that the new accounting principle be applied as if it were adopted prospectively from the earliest date practicable. This statement also requires that a change in depreciation, amortization, or depletion method for long-lived, nonfinancial assets be accounted for as a change in accounting estimate effected by a change in accounting principle. This statement became effective for TVA beginning in 2007 and did not have an impact on TVA’s financial statements for 2007.
Accounting for Planned Major Maintenance Activities. On September 8, 2006, FASB released FASB Staff Position (“FSP”) AUG AIR-1, “Accounting for Planned Major Maintenance Activities.” The FSP addresses the accounting for planned major maintenance activities and amends certain provisions in the American Institute of Certified Public Accountants Industry Audit Guide, “Audits of Airline” and Accounting Principles Board Opinion No. 28, “Interim Financial Reporting.” The guidance in this FSP states that entities should adopt an accounting method that recognizes overhaul expenses in the appropriate period. The following accounting methods are most often employed/permitted: direct expensing method; built-in overhaul method; or deferral method. The guidance in this FSP is applicable to entities in all industries and must be applied to the first fiscal year beginning after December 15, 2006. TVA will adopt this guidance for 2008. Because TVA’s policy is to expense maintenance costs as incurred (direct expensing method), the adoption of this FSP is not expected to have a material impact on TVA’s results of operations or financial position.
Fair Value Measurements. In September 2006, FASB issued SFAS No. 157, “Fair Value Measurements.” This standard provides guidance for using fair value to measure assets and liabilities that currently require fair value measurement. The standard also responds to investors’ requests for expanded information about the extent to which companies measure assets and liabilities at fair value, the information used to measure fair value, and the effect of fair value measurements on earnings. SFAS No. 157 applies whenever other standards require (or permit) assets or liabilities to be measured at fair value but does not expand the use of fair value in any new circumstances. SFAS No. 157 establishes a fair value hierarchy that prioritizes the information used to develop measurement assumptions. The provisions of SFAS No. 157 are effective for financial statements issued for fiscal years beginning after November 15, 2007, and interim periods within those fiscal years. At this time, TVA is evaluating the requirements of this statement and has not yet determined the impact of its implementation, which may or may not be material to TVA’s results of operations or financial position.
Fair Value Option. In February 2007, FASB issued SFAS No. 159, “The Fair Value Option for Financial Assets and Financial Liabilities — Including an amendment of FASB Statement No. 115.” This standard permits an entity to choose to measure many financial instruments and certain other items at fair value. The fair value option established by SFAS No.159 permits all entities to choose to measure eligible items at fair value at specified election dates. A business entity will report unrealized gains and losses on items for which the fair value option has been elected in earnings at each subsequent reporting date. Most of the provisions in this statement are elective. The provisions of SFAS No. 159 are effective as of the beginning of an entity’s first fiscal year that begins after November 15, 2007. Early adoption is permitted as of the beginning of the previous fiscal year provided that the entity makes that choice in the first 120 days of that fiscal year and also elects to apply the provisions of SFAS No. 157, “Fair Value Measurements.” At this time, TVA is evaluating the requirements of this statement and has not yet determined the potential impact of its implementation, which may or may not be material to TVA’s results of operations or financial position.
Offsetting Amounts. On April 30, 2007, FASB issued FASB Staff Position (“FSP”) FIN No. 39-1, “Amendment of FASB Interpretation No. 39,” which addresses certain modifications to FASB Interpretation No. 39, “Offsetting of Amounts Related to Certain Contracts.” This FSP replaces the terms “conditional contracts” and “exchange contracts” with the term “derivative instruments” as defined in SFAS No. 133, “Accounting for Derivative Instruments and Hedging Activities.” The FSP also permits a reporting entity to offset fair value amounts recognized for the right to reclaim cash collateral (a receivable) or the obligation to return cash collateral (a payable) against fair value amounts recognized for derivative instruments executed with the same counterparty under the same master netting arrangement. The guidance in the FSP is effective for fiscal years beginning after November 15, 2007, with early application permitted. At this time, TVA is evaluating the requirements of this guidance and has not yet determined the potential impact of its implementation, which may or may not be material to TVA’s financial position.
Employers’ Accounting for Defined Accounting for Defined Benefit Pension and Other Postretirement Plans. On September 30, 2007, TVA adopted SFAS No. 158, “Employers’ Accounting for Defined Benefit Pension and Other Postretirement Plans — an amendment of FASB Statements No. 87, 88, 106, and 132(R).” This standard requires employers to fully recognize the obligations associated with single-employer defined benefit pension, retiree healthcare and other postretirement plans in their financial statements. The standard requires an employer to: recognize in its statement of financial position an asset for a plan’s overfunded status or a liability for a plan’s underfunded status; measure a plan’s assets and its obligations that determine its funded status as of the end of the employer’s fiscal year (with limited exceptions); and recognize changes in the funded status of a defined benefit postretirement plan in the year in which the changes occur.
Upon adoption of SFAS No. 158, TVA recorded a net benefit liability equal to the underfunded status of certain pension and other postretirement benefit plans at September 30, 2007 in the amounts of $664 million and $464 million, respectively. On September 30, 2007, the unrecognized prior service costs and unrecognized gains and losses were recognized as components of accumulated other comprehensive income which were then reclassified to and recorded as components of a regulatory asset related to TVA's unfunded benefit plans. TVA did not have any unrecognized transition obligation losses. At September 30, 2007, TVA's unfunded benefit plans' regulatory asset included unamortized prior service costs and unamortized net actuarial losses of approximately $830 million and $143 million, respectively, related to pensions and other postretirement benefits.
Rate-regulated entities may recognize regulatory assets or liabilities as a result of timing differences between the recognition of costs, as recorded with SFAS No. 87 and SFAS No.106, and costs recovered through the ratemaking process. As a result of the adoption of SFAS No. 158, TVA increased the existing unfunded benefit plans' regulatory asset by approximately $721 million related to the defined benefit pension and postretirement plans for amounts that would otherwise be charged to accumulated other comprehensive income under SFAS No. 158. See Note 14.
2. Restatement
The accompanying financial statements as of September 30, 2007 and 2006, and for each of the two years then ended have been restated. TVA determined that the method implemented to estimate unbilled revenues in September 2006 had resulted in errors in unbilled revenue presented in TVA’s financial statements for the fiscal years ended September 30, 2006, and 2007, and the quarterly periods ended December 31, 2006, March 31, 2007, June 30, 2007, December 31, 2007, and March 31, 2008. There was no effect on periods prior to the three months ended September 30, 2006.
Under TVA’s end-use billing arrangements with its distributor customers (“distributors”), TVA relies on the distributors to report their end-use sales. Because of the delay between the wholesale delivery of power to the distributor and the report of end-use sales to TVA, TVA must estimate the unbilled revenue at the end of each financial reporting period. In September 2006, TVA implemented a change in methodology for estimating unbilled revenue for electricity sales which resulted in an increase of $232 million in unbilled revenue (2.6 percent of operating revenue) for 2006.
The estimation process implemented in September 2006 utilized the distributors’ average rates and an estimate of the number of days of revenue outstanding to reflect the delay in reporting the end-use sales to TVA (“days outstanding”). The number of days outstanding was derived using a procedure similar to a cross-correlation calculation that compared the monthly retail load to the monthly wholesale load. The intent was to reflect in the unbilled estimate the end-use sales that would be reported that month by distributors plus any remaining sales that would not be reported until the following month due to the delay between wholesale delivery and end-use reporting.
TVA has determined that the process implemented in September 2006 overestimated the days outstanding and that this overestimation resulted in an error in recording unbilled revenue and unbilled receivable. The previous unbilled process also failed to consider the annual true-up of each distributor’s reported distribution losses. The annual true-up reconciles total end-use kilowatt-hour (“kWh”) sales and revenue reported by each distributor with the kWh sales recorded for each distributor at wholesale.
TVA has used a new process for estimating unbilled revenue for 2006 and 2007. This process carries over only the portion of sales from the distributor’s meter read date to the month-end. Those sales along with the current month sales are then priced at rates based on each distributor’s customer and product mix. Additionally, the true-up component has been added to the unbilled calculation to reflect any timing differences that occur between the retail and wholesale billing cycles. Due to the new process, an adjustment was made to increase revenue in 2007 by $73 million and to decrease revenue by $200 million in 2006.
The restatement of unbilled revenue also affected TVA’s fuel cost adjustment (“FCA”) calculation. The FCA is a mechanism by which TVA collects the direct cost of fuel used in its generating facilities and also the energy costs of purchased power used to serve customer power demand. Implementation of the FCA occurred in October 2006 as a joint effort between TVA and its customers. The goal of the FCA is timely recovery of fuel-related expenses to reduce the volatility driven by fuel and purchased power markets. Under TVA’s FCA methodology, adjustments to rates are based primarily on the difference between forecasted and actual expenses for the upcoming quarter as well as the difference between forecasted and actual revenues for the upcoming quarter. Because the FCA adjustments are forward-looking, there is typically a difference between what is collected in rates and what actual expense is realized over the course of the quarter. This difference is added to or subtracted from a deferred account on TVA’s balance sheet.
The restatement of unbilled revenue changed TVA’s forecasted revenues, and since forecasted revenues are a major component of the FCA calculation, the change in forecasted revenues required a restatement of the amounts in TVA’s deferred FCA account. In the Original 10-K, TVA reported a FCA deferred balance of $197 million at September 30, 2007, which was restated to a deferred balance of $150 million. Of the $150 million, $18 million is a deferred asset and $132 million is a current receivable.
The unbilled revenue error also affected the application of distributor prepayments. The balance in the distributors’ unbilled accounts receivable is offset by a reduction in the advance collections of those distributors who make prepayments for their power. As a result of the change in unbilled revenue, the balances in the unbilled receivable and advance collections accounts were also adjusted. The adjustment related to distributor prepayments had no effect on the account balances as of September 30, 2007, and increased the balance in the receivable and advance collections accounts by $1 million as of September 30, 2006.
TVA has evaluated these errors and determined that the impact was an overstatement of net income for the fiscal year ended September 30, 2006, and an understatement of net income for the fiscal year ended September 30, 2007. The changes to the financial statements as of or for the respective years primarily involves accounts receivable and retained earnings on the balance sheets, and operating revenues and net income on the statements of income. The errors and restatements have no impact on cash and cash equivalents.
In addition to the unbilled revenue and FCA adjustments, there were certain miscellaneous items that were previously deemed to be immaterial by management which have been corrected in the period in which they were identified. Summary restatements tables are presented below. References in the “Note” column correspond to lines on the Statements of Income and Balance Sheets following these tables. Accordingly, previously reported amounts are being restated to properly reflect the accounting for these items as follows:
Statements of Income
Summary of Restatements
| | Description of Adjustment | | 2007 | | Note | | 2006 | | | Note |
| | | | | | | | | | | |
| Operating revenues | Unbilled revenue adjustments | | $ | 73 | | | | $ | (200 | ) | | |
| | Reclassification of expenses previously netted with revenue | | | 9 | | | | | 8 | | | |
| | | | | 82 | | I07-1 | | | (192 | ) | | I06-1 |
| | | | | | | | | | | | | |
| Operating expenses | Fuel cost adjustment | | | 46 | | | | | – | | | |
| | Write off of construction projects | | | (5 | ) | | | | 5 | | | |
| | Capitalization of construction projects | | | (8 | ) | | | | 8 | | | |
| | Financing cost interest reclassification | | | (48 | ) | | | | (49 | ) | | |
| | Reclassification of expenses previously netted with revenue | | | 15 | | | | | 26 | | | |
| | Additional legal expense | | | 3 | | | | | – | | | |
| | Intracompany charges reclassification | | | – | | | | | (12 | ) | | |
| | | | | 3 | | I07-2 | | | (22 | ) | | I06-2 |
| | | | | | | | | | | | | |
| Operating income | | | | 79 | | | | | (170 | ) | | |
| | | | | | | | | | | | | |
| Other income | Additional legal reserve | | | 3 | | | | | (3 | ) | | |
| | Reclassification of other income previously reported as revenue | | | 6 | | | | | 18 | | | |
| | Intrarcompany charges reclassification | | | – | | | | | (12 | ) | | |
| | | | | 9 | | I07-3 | | | 3 | | | I06-3 |
| | | | | | | | | | | | | |
| Interest expense | Financing cost interest reclassification | | | 48 | | I07-4 | | | 49 | | | I06-4 |
| | | | | | | | | | | | | |
| Net income | | | $ | 40 | | | | $ | (216 | ) | | |
| | | | | | | | | | | | | |
Balance Sheets
Summary of Restatements
| | Description of Adjustment | | 2007 | | | Note | | 2006 | | | Note |
| Current assets | | | | | | | | | | | |
| Accounts receivable | Unbilled revenue adjustments | | $ | (127 | ) | | | | $ | (199 | ) | | |
| Accounts receivable | Swap asset reclassification | | | – | | | | | | 21 | | | |
| Accounts receivable | Fuel cost adjustments | | | 132 | | | | | | – | | | |
| Inventories and other | Derivative reclassification | | | – | | | | | | 22 | | | |
| | | | | 5 | | | B07-1 | | | (156 | ) | | B06-1 |
| Property, plant, and equipment | | | | | | | | | | | | | |
| Accumulated depreciation | Capitalization of construction projects | | | – | | | | | | (8 | ) | | |
| Construction in progress | Write off of construction projects | | | – | | | | | | (5 | ) | | |
| Construction in progress | Unrecorded software liability | | | 4 | | | | | | – | | | |
| | | | | 4 | | | B07-2 | | | (13 | ) | | B06-2 |
| Regulatory and other long-term assets | | | | | | | | | | | | | |
| Regulatory assets | Fuel cost adjustments | | | (179 | ) | | | | | – | | | |
| Regulatory assets | Derivative reclassification | | | – | | | | | | (22 | ) | | |
| Other long-term assets | Swap asset reclassification | | | – | | | | | | (21 | ) | | |
| | | | | (179 | ) | | B07-3 | | | (43 | ) | | B06-3 |
| | | | | | | | | | | | | | |
| Total restatement of assets | | | $ | (170 | ) | | | | $ | (212 | ) | | |
| | | | | | | | | | | | | | |
| Current liabilities | | | | | | | | | | | | | |
| Accrued liabilities | Derivative reclassification | | $ | – | | | | | $ | 22 | | | |
| Accrued liabilities | Legal reserve adjustment | | | – | | | | | | 3 | | | |
| Accrued liabilities | Unbilled revenue adjustments | | | – | | | | | | 1 | | | |
| Accrued liabilities | Fuel cost adjustments | | | (1 | ) | | | | | – | | | |
| Accrued liabilities | Unrecorded software liability | | | 4 | | | | | | – | | | |
| Accrued liabilities | Legal expense adjustment | | | 3 | | | | | | – | | | |
| | | | | 6 | | | B07-4 | | | 26 | | | B06-4 |
| Other liabiliites | | | | | | | | | | | | | |
| Other liabilities | Derivative reclassification | | | – | | | | | | (22 | ) | | B06-5 |
| | | | | | | | | | | | | | |
| Total restatement of liabilities | | | | 6 | | | | | | 4 | | | |
| | | | | | | | | | | | | | |
| Proprietary capital | | | | | | | | | | | | | |
| Retained earnings | Write off of construction projects | | | 4 | | | | | | (4 | ) | | |
| Retained earnings | Legal reserve adjustment | | | 4 | | | | | | (4 | ) | | |
| Retained earnings | Derivative reclassification | | | 8 | | | | | | (8 | ) | | |
| Retained earnings | Unbilled revenue adjustments | | | 73 | | | | | | (200 | ) | | |
| Retained earnings | Fuel cost adjustments | | | (46 | ) | | | | | – | | | |
| Retained earnings | Legal expense adjustment | | | (3 | ) | | | | | – | | | |
| Retained earnings | Beginning retained earnings adjustment | | | (216 | ) | | | | | – | | | |
| | | | | (176 | ) | | B07-5 | | | (216 | ) | | B06-6 |
| Total restatement of liabilities and proprietary capital | | | $ | (170 | ) | | | | $ | (212 | ) | | |
| | | | | | | | | | | | | | |
Accordingly, previously reported amounts are being restated to properly reflect the accounting for these items as follows:
The following table summarizes the statements of income for the periods indicated, giving effect to the restatement adjustments described above and showing previously reported amounts and restated amounts for the years ended September 30, 2007, and 2006.
| | | 2007 | | | 2006 | |
| | | As Previously Reported | | | Increase (Decrease) | | Note | | As Restated | | | As Previously Reported | | | Increase (Decrease) | | Note | | As Restated | |
| Operating revenues | | | | | | | | | | | | | | | | | | | | |
| Sales of electricity | | | | | | | | | | | | | | | | | | | | |
| Municipalities and cooperatives | | $ | 7,774 | | | | 73 | | | | $ | 7,847 | | | $ | 7,859 | | | | (200 | ) | | | $ | 7,659 | |
| Industries directly served | | | 1,221 | | | | – | | | | | 1,221 | | | | 1,065 | | | | – | | | | | 1,065 | |
| Federal agencies and other | | | 112 | | | | – | | | | | 112 | | | | 116 | | | | – | | | | | 116 | |
| Other revenue | | | 137 | | | | 9 | | | | | 146 | | | | 135 | | | | 8 | | | | | 143 | |
| Operating revenues | | | 9,244 | | | | 82 | | | | | 9,326 | | | | 9,175 | | | | (192 | ) | | | | 8,983 | |
| Revenue capitalized during pre-commercial plant operations | | | (57 | ) | | | – | | | | | (57 | ) | | | – | | | | – | | | | | – | |
| Net operating revenues | | | 9,187 | | | | 82 | | 107-1 | | | 9,269 | | | | 9,175 | | | | (192 | ) | 106-1 | | | 8,983 | |
| | | | | | | | | | | | | | | | | | | | | | | | | | | |
| Operating expenses | | | | | | | | | | | | | | | | | | | | | | | | | | |
| Fuel and purchased power | | | 3,382 | | | | 67 | | | | | 3,449 | | | | 3,333 | | | | 9 | | | | | 3,342 | |
| Operating and maintenance | | | 2,382 | | | | (50 | ) | | | | 2,332 | | | | 2,372 | | | | (44 | ) | | | | 2,328 | |
| Depreciation, amortization, and accretion | | | 1,481 | | | | (8 | ) | | | | 1,473 | | | | 1,492 | | | | 8 | | | | | 1,500 | |
| Tax equivalents | | | 452 | | | | (1 | ) | | | | 451 | | | | 376 | | | | – | | | | | 376 | |
| Loss on asset impairment | | | 26 | | | | (5 | ) | | | | 21 | | | | 9 | | | | 5 | | | | | 14 | |
| Total operating expenses | | | 7,723 | | | | 3 | | 107-2 | | | 7,726 | | | | 7,582 | | | | (22 | ) | 106-2 | | | 7,560 | |
| | | | | | | | | | | | | | | | | | | | | | | | | | | |
| Operating income | | | 1,464 | | | | 79 | | | | | 1,543 | | | | 1,593 | | | | (170 | ) | | | | 1,423 | |
| | | | | | | | | | | | | | | | | | | | | | | | | | | |
| Other income | | | 64 | | | | 9 | | 107-3 | | | 73 | | | | 77 | | | | 3 | | 106-3 | | | 80 | |
| | | | | | | | | | | | | | | | | | | | | | | | | | | |
| Other expense | | | (2 | ) | | | – | | | | | (2 | ) | | | (2 | ) | | | – | | | | | (2 | ) |
| | | | | | | | | | | | | | | | | | | | | | | | | | | |
| Unrealized gain/(loss) on derivative contracts, net | | | 41 | | | | – | | | | | 41 | | | | (15 | ) | | | – | | | | | (15 | ) |
| | | | | | | | | | | | | | | | | | | | | | | | | | | |
| Interest expense | | | | | | | | | | | | | | | | | | | | | | | | | | |
| Interest on debt and leaseback obligations | | | 1,342 | | | | 48 | | | | | 1,390 | | | | 1,357 | | | | 49 | | | | | 1,406 | |
| Amortization of debt discount, issue, and reacquisition costs, net | | | 19 | | | | – | | | | | 19 | | | | 21 | | | | – | | | | | 21 | |
| Allowance for funds used during construction and nuclear fuel expenditures | | | (177 | ) | | | – | | | | | (177 | ) | | | (163 | ) | | | – | | | | | (163 | ) |
| Net interest expense | | | 1,184 | | | | 48 | | 107-4 | | | 1,232 | | | | 1,215 | | | | 49 | | 106-3 | | | 1,264 | |
| | | | | | | | | | | | | | | | | | | | | | | | | | | |
| Income before cumulative effects of accounting changes | | | 383 | | | | 40 | | | | | 423 | | | | 438 | | | | (216 | ) | | | | 222 | |
| | | | | | | | | | | | | | | | | | | | | | | | | | | |
Cumulative effect of change in accounting for conditional asset retirement obligations | | | – | | | | – | | | | | – | | | | (109 | ) | | | – | | | | | (109 | ) |
| | | | | | | | | | | | | | | | | | | | | | | | | | | |
| Net income | | $ | 383 | | | $ | 40 | | | | $ | 423 | | | $ | 329 | | | | (216 | ) | | | $ | 113 | |
The following table sets forth the balance sheets giving effect to the restatement and other adjustments described above and showing previously reported amounts and restated amounts as of September 30, 2007, and 2006.