UNITED STATES
SECURITIES AND EXCHANGE COMMISSION
Washington, D.C. 20549
FORM N-CSR
CERTIFIED SHAREHOLDER REPORT OF REGISTERED MANAGEMENT
INVESTMENT COMPANIES
Investment Company Act file number 811-22110
AdvisorShares Trust
(Exact name of registrant as specified in charter)
4800 Montgomery Lane, Suite 150
Bethesda, Maryland 20814
(Address of principal executive offices) (Zip code)
Dan Ahrens
4800 Montgomery Lane, Suite 150
Bethesda, Maryland 20814
(Name and address of agent for service)
Registrant’s telephone number, including area code: 1-877-843-3831
Date of fiscal year end: June 30
Date of reporting period: June 30, 2022
Form N-CSR is to be used by management investment companies to file reports with the Commission not later than 10 days after the transmission to stockholders of any report that is required to be transmitted to stockholders under Rule 30e-1 under the Investment Company Act of 1940 (17 CFR 270.30e-1). The Commission may use the information provided on Form N-CSR in its regulatory, disclosure review, inspection, and policymaking roles.
A registrant is required to disclose the information specified by Form N-CSR, and the Commission will make this information public. A registrant is not required to respond to the collection of information contained in Form N-CSR unless the Form displays a currently valid Office of Management and Budget (“OMB”) control number. Please direct comments concerning the accuracy of the information collection burden estimate and any suggestions for reducing the burden to Secretary, Securities and Exchange Commission, 450 Fifth Street, NW, Washington, DC 20549-0609. The OMB has reviewed this collection of information under the clearance requirements of 44 U.S.C. § 3507.
Item 1. Reports to Stockholders.
| (a) | The Report to Shareholders is attached herewith. |

- - - - - - - - - - - - - - - - - - - - - - - - - - - - - - - - - - - - - - - - - - - - - - - - - - - - - - - - - - - - - - - - - - - -
ADVISORSHARES TRUST
4800 Montgomery Lane
Suite 150
Bethesda, Maryland 20814
www.advisorshares.com
1.877.843.3831
Annual Report
June 30, 2022
TABLE OF CONTENTS
ADVISORSHARES TRUST
Letter from the CEO of AdvisorShares Investments, LLC
It has been a volatile fiscal year. The first of half of our fiscal year occurred during the last six months of 2021 when the S&P 500 Index was moving upwards. The second half of our fiscal year, which covered the first six months of 2022, was a different story with markets declining into bear market territory. The market’s decline seemed to be driven by a choppy pandemic recovery, where COVID-related restrictions continued to hamper growth as a new variant of the coronavirus emerged. Factory lockdowns impacted the global supply change, resulting in scarcity of all types of goods and demand for those fewer goods driving prices higher. That coupled with the Russian war in Ukraine, which impacted energy prices and grain-based commodities, caused inflation numbers to begin skyrocketing.
The Federal Reserve’s plan for tackling inflations was to aggressively increase interest rates and reduce their balance sheet. These actions seemed to drive the markets lower. We are not as concerned with rising interest rates, however an increase in the cost of borrowing can negatively affect sectors or industries that have low to negative cash flows. Our biggest concern is the reduction of the Fed’s balance sheet. While necessary, the trillions of dollars added to the Fed balance sheet during the pandemic drove the U.S. markets higher while the world was shut down. We anticipate the opposite effect occurring when or if the Fed begins to remove most of the assets they had purchased during the pandemic.
As we would expect in the first calendar half of 2022 based on struggling market conditions, we saw assets under management increase for our two short equity ETFs, the AdvisorShares Ranger Equity Bear ETF (ticker: HDGE) and the AdvisorShares Dorsey Wright Short ETF (ticker: DWSH). While our largest ETF, the AdvisorShares Pure US Cannabis ETF (ticker: MSOS) suffered the worst performance declines in our ETF fund family, surprisingly, only a few shares were redeemed, demonstrating that many of MSOS’ investors appear to be buying and holding the ETF.
The following are a list of highlights of this fiscal year:
| ● | The addition of Julio Lugo, a former BNY Mellon executive, to the AdvisorShares operations team; |
| ● | Launch of the AdvisorShares Psychedelics ETF (ticker: PSIL), the first ETF with pure exposure to the psychedelics industry; |
| ● | The AdvisorShares FolioBeyond Core Bond ETF’s (ticker: FWDB) investment strategy changed to an ESG focused bond ETF which also included changing the name and ticker to the AdvisorShares North Square McKee ESG Core Bond ETF (ticker: MENV); |
| ● | CSM Advisors, LLC taking over as subadvisor to the North Square McKee Core Reserves ETF (ticker: HOLD) and the North Square McKee ESG Core Bond ETF (ticker: MENV); |
| ● | Launch of the AdvisorShares Poseidon Dynamic Cannabis ETF (ticker: PSDN); |
| ● | Launch of the AdvisorShares Drone Technology ETF (ticker: UAV); and |
| ● | Launch of the AdvisorShares Managed Bitcoin Strategy ETF (ticker: CRYP) – the first tactically managed bitcoin ETF available, sub-advised by Morgan Creek Capital. |
While it seems the last few years have only brought new and challenging environments to the markets, we remain optimistic that “normalcy” will return. We are incredibly thankful to our shareholders and appreciate the trust and confidence you have in us. We wish you nothing but health, happiness, and prosperity.
Sincerest regards,
Noah Hamman
CEO, AdvisorShares Investments
ADVISORSHARES TRUST
Letter from the CEO of AdvisorShares Investments, LLC (Continued)
For more information on AdvisorShares ETFs, including performance and holdings, please visit www.advisorshares.com.
Investing involves risk including possible loss of principal. The Advisor’s judgment about the markets, the economy, or companies may not anticipate actual market movements, economic conditions or company performance, and these factors may affect the return on your investment. The prices of equity securities rise and fall daily. Foreign investing involves special risks, such as risk of loss from currency fluctuation or political or economic uncertainty. Investments in emerging or offshore markets are generally less liquid and less efficient than investments in developed markets and are subject to additional risks, such as risks of adverse governmental regulation and intervention or political developments.
There is no guarantee the Advisor’s investment strategy will be successful. When models and data prove to be incorrect or incomplete, any decisions made in reliance thereon expose the Fund to potential risks. In addition, the use of predictive models has inherent risk. Because predictive models are usually constructed based on historical data supplied by third parties, the success of relying on such models may depend heavily on the accuracy and reliability of the supplied historical data. The Fund’s particular allocations may have a significant effect on the Fund’s performance. Allocation risk is the risk that the selection of ETFs and the allocation of assets among such ETFs will cause the Fund to underperform other funds with a similar investment objective that do not allocate their assets in the same manner or the market as a whole. For a list of the asset class specific risks please see the prospectus.
The views in this report were those of the Fund’s CEO as of June 30, 2022 and may not reflect his views on the date that this report is first published or anytime thereafter. These views are intended to assist shareholders in understanding their investments and do not constitute investment advice.
ADVISORSHARES TRUST
AdvisorShares Alpha DNA Equity Sentiment ETF (SENT)
The AdvisorShares Alpha DNA Equity Sentiment ETF’s (ticker: SENT) performance for the 12-month period ended June 30, 2022, while negative, was consistent with a growth-oriented U.S. equity portfolio with material exposure to mid- and small-cap equities. Mid- and small-cap growth were the laggards in U.S. equity index performance in both the last six months of 2021 and the first six months of 2022. In addition, U.S. equity large cap growth also began under-performing in the first half of 2022. Our equity exposures performed in line with their growth cohorts in each market cap over this window. Our option hedges produced profits in the down market during the first half of 2022. SENT’s hedging strategy is built to deliver more profits in fast downward moving markets. The first half of 2022 saw a slow downward trend with three different months producing -8% returns born worse in small caps (Jan, April, June).
SENT’s portfolio is designed to out-perform in upward markets that are rewarding the fastest growing companies. In other words, when growth is in favor, our portfolio will also typically be rewarded. In addition, higher uncertainty about forward earnings and demand tend to create more arbitrage opportunity for our digital signal analytics. In fact, the more that analysts struggle to assess demand in any market, the better positioned our portfolio is to outperform.
Going forward, the ambiguity of a potential recession has created an elevated level of uncertainty among the analysts generating forward looking earnings per share and revenue estimates. That provides a strong scenario to uncover hidden demand and produce more surprise earnings outcomes. As a result, we like the backdrop that this provides. However, a rising interest rate environment tends to put greater price stress on growth stocks that have higher multiples. Since growth stocks with higher multiples tend to produce higher earnings beat potential, SENT will be influenced by whether interest rate pressures continue to influence stocks prices going forward.
HYPOTHETICAL GROWTH OF $10,000 INVESTMENT
For the period February 2, 2021 to June 30, 2022
HISTORICAL PERFORMANCE
Total Return as of June 30, 2022
| | | 1 Year | | | Since
Inception
2/2/2021* | |
| AdvisorShares Alpha DNA Equity Sentiment ETF NAV | | | -24.53 | % | | | -13.09 | % |
| AdvisorShares Alpha DNA Equity Sentiment ETF Market Price** | | | -24.84 | % | | | -13.34 | % |
| Russell 3000 Index | | | -13.87 | % | | | -2.49 | % |
Performance data quoted represents past performance and is no guarantee of future results. Current performance may be lower or higher than the performance data quoted. Investment return and principal value will fluctuate so that an investor’s shares, when redeemed, may be worth more or less than original cost. Fund NAV returns are calculated using the Fund’s daily 4:00 p.m. NAV. Returns shown include the reinvestment of all dividends and other distributions. Index returns do not include expenses. As stated in the current prospectus, the Fund’s annual operating expense ratio (gross) is 1.08% and the net expense ratio is 1.08%. (Actual expenses can be referenced in the Financial Highlights section later in this report.) The Fund’s advisor has agreed to waive a portion of its fees and/or reimburse expenses to the extent necessary to keep the Fund’s expenses from exceeding 1.35%. Returns less than one year are not annualized. The performance table and graph do not reflect the deduction of taxes that a shareholder would pay on Fund distributions or the redemption of Fund shares. For the Fund’s most recent month end performance, please call 1-877-843-3831.
| * | Commencement of operations. |
| ** | The price used to calculate market return (“Market Price’’) is determined by using the closing price listed on the NYSE Arca and does not represent returns an investor would receive if shares were traded at other times. Total returns are calculated using the daily 4:00pm midpoint between the bid and offer. Shares are bought and sold at market price, not NAV and are not individually redeemed from the Fund. |
The Russell 3000 Index measures the performance of the largest 3,000 US companies representing approximately 98% of the investable US equity market.
ADVISORSHARES TRUST
AdvisorShares Dorsey Wright ADR ETF (AADR)
The AdvisorShares Dorsey Wright ADR ETF (AADR) finished the fiscal year ended June 30th, 2022 behind its benchmark, the MSCI EAFE Index. The last year has been a tale of two markets with the end of a bull market taking us through 2021 and a bear market to start off the first half of 2022. Unsurprisingly, this caused issues for the portfolio as momentum strategies tend to struggle when market leadership changes.
The latter half of 2021 saw the portfolio perform roughly in line with the benchmark as international markets mostly treaded water despite the roaring bull market in US equities. The first half of 2022, though, saw almost all world markets decline. To make matters worse, the Russian invasion of Ukraine introduced substantial risk to some of the typically safer areas of the international universe (Europe). Some of the worst hit areas (such as the Netherlands) were areas where we were overweighted relative to the benchmark. Nevertheless, once markets begin to stabilize, we feel confident that relative strength will guide us into the new leadership, wherever that may be.
Despite the underperformance of cap-weighted international indexes versus domestic indexes, we are still looking for opportunities in high momentum names. As new market leaders emerge, the fund will continue to position itself to take advantage of its strength. The fund is well-positioned, and a shift back to international outperformance would provide a welcome tailwind.
HYPOTHETICAL GROWTH OF $10,000 INVESTMENT
For the period June 30, 2012 to June 30, 2022
HISTORICAL PERFORMANCE
Total Return as of June 30, 2022
| | | 1 Year | | | 3 Year | | | 5 Year | | | 10 Year | |
| AdvisorShares Dorsey Wright ADR ETF NAV | | | -25.51 | % | | | 0.00 | % | | | 1.61 | % | | | 6.13 | % |
| AdvisorShares Dorsey Wright ADR ETF Market Price* | | | -25.45 | % | | | 0.04 | % | | | 1.59 | % | | | 6.13 | % |
| MSCI EAFE Index (Net) | | | -17.77 | % | | | 1.07 | % | | | 2.20 | % | | | 5.40 | % |
Performance data quoted represents past performance and is no guarantee of future results. Current performance may be lower or higher than the performance data quoted. Investment return and principal value will fluctuate so that an investor’s shares, when redeemed, may be worth more or less than original cost. Fund NAV returns are calculated using the Fund’s daily 4:00 p.m. NAV. Returns shown include the reinvestment of all dividends and other distributions. Index returns do not include expenses. As stated in the current prospectus, the Fund’s annual operating expense ratio (gross) is 1.10% and the net expense ratio is 1.10%. (Actual expenses can be referenced in the Financial Highlights section later in this report.) The Fund’s advisor has agreed to waive a portion of its fees and/or reimburse expenses to the extent necessary to keep the Fund’s expenses from exceeding 1.10%. Returns less than one year are not annualized. The performance table and graph do not reflect the deduction of taxes that a shareholder would pay on Fund distributions or the redemption of Fund shares. For the Fund’s most recent month end performance, please call 1-877-843-3831.
| * | The price used to calculate market return (“Market Price’’) is determined by using the closing price listed on the Nasdaq and does not represent returns an investor would receive if shares were traded at other times. Total returns are calculated using the daily 4:00pm midpoint between the bid and offer. Shares are bought and sold at market price, not NAV and are not individually redeemed from the Fund. |
The MSCI EAFE Index is an unmanaged free float-adjusted market capitalization index that is designed to measure the equity market performance of developed markets, excluding the U.S. & Canada. One cannot invest directly in an index.
ADVISORSHARES TRUST
AdvisorShares Dorsey Wright Alpha Equal Weight ETF (DWEQ)
The AdvisorShares Dorsey Wright Alpha Equal Weight ETF (DWEQ) finished the fiscal year ended June 30th, 2022 behind its benchmark, the S&P 500 Total Return Index. Momentum strategies tend to underperform during periods when market leadership changes and change has been the theme of the last year with the second half of 2021 continuing a dramatic post-pandemic rally and the first half of 2022 ushering in a bear market.
In the second half of 2021 the US equity markets rallied but cracks were beginning to emerge. Former leaders such as Technology and Consumer Discretionary were starting to selloff underneath the surface and our exposure to Consumer Discretionary dragged the portfolio down. The first half of 2022, of course, started the bear market we’re currently in and the fund has struggled through this period with the rotation into new leadership. Exposure to Technology was the main performance detractor as it was one of the hardest hit areas during the decline.
Should the bear market continue, we feel the portfolio is positioned well as it has rotated into sectors that held up relatively well during the decline. It’s possible though that we’ve seen the worst of what the market will give us with consumer sentiment more negative than it has been in 50+ years (usually a bullish sign). Should we begin to recover though, it’s very possible that the more value oriented sectors we currently hold continue to outperform as many of the former leaders still have historically high valuations.
HYPOTHETICAL GROWTH OF $10,000 INVESTMENT
For the period December 26, 2019* to June 30, 2022
HISTORICAL PERFORMANCE
Total Return as of June 30, 2022
| | | 1 Year | | | Since
Inception
12/26/2019* | |
| AdvisorShares Dorsey Wright Alpha Equal Weight ETF NAV | | | -24.56 | % | | | -6.81 | % |
| AdvisorShares Dorsey Wright Alpha Equal Weight ETF Market Price** | | | -24.85 | % | | | -6.89 | % |
| S&P 500 Index | | | -10.62 | % | | | 8.11 | % |
Performance data quoted represents past performance and is no guarantee of future results. Current performance may be lower or higher than the performance data quoted. Investment return and principal value will fluctuate so that an investor’s shares, when redeemed, may be worth more or less than original cost. Fund NAV returns are calculated using the Fund’s daily 4:00 p.m. NAV. Returns shown include the reinvestment of all dividends and other distributions. Index returns do not include expenses. As stated in the current prospectus, the Fund’s annual operating expense ratio (gross) is 0.96% and the net expense ratio is 0.96%. (Actual expenses can be referenced in the Financial Highlights section later in this report.) The Fund’s advisor has agreed to waive a portion of its fees and/or reimburse expenses to the extent necessary to keep the Fund’s expenses from exceeding 0.99%. Returns less than one year are not annualized. The performance table and graph do not reflect the deduction of taxes that a shareholder would pay on Fund distributions or the redemption of Fund shares. For the Fund’s most recent month end performance, please call 1-877-843-3831.
| * | Commencement of operations. |
| ** | The price used to calculate market return (“Market Price’’) is determined by using the closing price listed on the Nasdaq and does not represent returns an investor would receive if shares were traded at other times. Total returns are calculated using the daily 4:00pm midpoint between the bid and offer. Shares are bought and sold at market price, not NAV and are not individually redeemed from the Fund. |
The S&P 500 Index is a broad-based, unmanaged measurement of changes in stock market conditions based on the average of 500 widely held common stocks. One cannot invest directly in an index.
ADVISORSHARES TRUST
AdvisorShares Dorsey Wright FSM All Cap World ETF (DWAW)
The AdvisorShares Dorsey Wright FSM All Cap World ETF (ticker: DWAW) saw a market return of -17.47% for the 12-month period ended June 30, 2022, amid continued weakness in global equity markets. DWAW’s strategy looks to rotate among a broad inventory of U.S. and international equity representatives, seeking to hold the strongest two areas following each evaluation. The first strategy evaluation for this year came in early February, which saw the strategy rotate away from a growth-heavy allocation into equal weight positions of core large-cap and large-cap value. The next evaluation in May led the strategy to sell the core large-cap exposure in favor of large-cap low volatility, which helped buoy the portfolio during the turbulent market environment over the next several weeks. The value representative has continued to maintain positive relative strength against most other equity market representatives and is the highest scoring member of the strategy’s inventory.
HYPOTHETICAL GROWTH OF $10,000 INVESTMENT
For the period December 26, 2019* to June 30, 2022
HISTORICAL PERFORMANCE
Total Return as of June 30, 2022
| | | 1 Year | | | Since
Inception
12/26/2019* | |
| AdvisorShares Dorsey Wright FSM All Cap World ETF NAV | | | -15.98 | % | | | 8.49 | % |
| AdvisorShares Dorsey Wright FSM All Cap World ETF Market Price** | | | -16.06 | % | | | 8.49 | % |
| MSCI All Country World Index (ACWI) | | | -15.75 | % | | | 3.87 | % |
Performance data quoted represents past performance and is no guarantee of future results. Current performance may be lower or higher than the performance data quoted. Investment return and principal value will fluctuate so that an investor’s shares, when redeemed, may be worth more or less than original cost. Fund NAV returns are calculated using the Fund’s daily 4:00 p.m. NAV. Returns shown include the reinvestment of all dividends and other distributions. Index returns do not include expenses. As stated in the current prospectus, the Fund’s annual operating expense ratio (gross) is 1.14% and the net expense ratio is 1.12%. (Actual expenses can be referenced in the Financial Highlights section later in this report.) The Fund’s advisor has agreed to waive a portion of its fees and/or reimburse expenses to the extent necessary to keep the Fund’s expenses from exceeding 0.99%. Returns less than one year are not annualized. The performance table and graph do not reflect the deduction of taxes that a shareholder would pay on Fund distributions or the redemption of Fund shares. For the Fund’s most recent month end performance, please call 1-877-843-3831.
| * | Commencement of operations. |
| ** | The price used to calculate market return (“Market Price’’) is determined by using the closing price listed on the Nasdaq and does not represent returns an investor would receive if shares were traded at other times. Total returns are calculated using the daily 4:00pm midpoint between the bid and offer. Shares are bought and sold at market price, not NAV and are not individually redeemed from the Fund. |
The MSCI All Country World Index (Net) is an unmanaged free float-adjusted market capitalization weighted index that is designed to measure the equity market performance of developed and emerging markets. One cannot invest directly in an index.
ADVISORSHARES TRUST
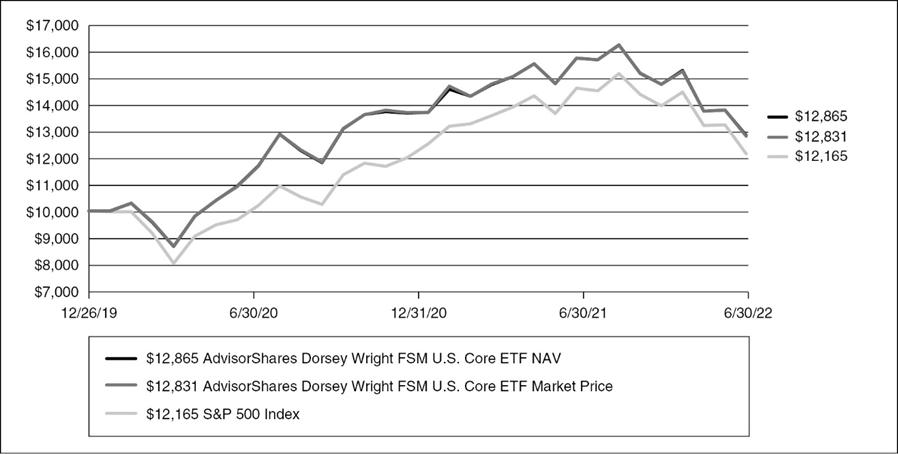
AdvisorShares Dorsey Wright FSM US Core ETF (DWUS)
The AdvisorShares Dorsey Wright FSM All Cap World ETF (ticker: DWUS) saw a market return of -13.79% for the 12-month period ended June 30, 2022. The underlying strategy behind DWUS looks to rotate among an inventory of core U.S. equity fund representatives, targeting exposure toward the strongest two areas after each model evaluation. The portfolio entered the year with high exposure toward growth equities with an overweight position in technology. The only change for DWUS’s strategy this year came in May, when the portfolio sold out of the growth-centric representative in favor of low volatility representation, which joins the core equity position as the two portfolio members. This portfolio is overweight large-cap blend and has high exposure toward utilities, industrials, and consumer staples.
HYPOTHETICAL GROWTH OF $10,000 INVESTMENT
For the period December 26, 2019* to June 30, 2022
HISTORICAL PERFORMANCE
Total Return as of June 30, 2022
| | | 1 Year | | | Since
Inception
12/26/2019* | |
| AdvisorShares Dorsey Wright FSM US Core ETF NAV | | | -12.97 | % | | | 10.55 | % |
| AdvisorShares Dorsey Wright FSM US Core ETF Market Price** | | | -13.36 | % | | | 10.43 | % |
| S&P 500 Index | | | -10.62 | % | | | 8.11 | % |
Performance data quoted represents past performance and is no guarantee of future results. Current performance may be lower or higher than the performance data quoted. Investment return and principal value will fluctuate so that an investor’s shares, when redeemed, may be worth more or less than original cost. Fund NAV returns are calculated using the Fund’s daily 4:00 p.m. NAV. Returns shown include the reinvestment of all dividends and other distributions. Index returns do not include expenses. As stated in the current prospectus, the Fund’s annual operating expense ratio (gross) is 1.10% and the net expense ratio is 1.07%. (Actual expenses can be referenced in the Financial Highlights section later in this report.) The Fund’s advisor has agreed to waive a portion of its fees and/or reimburse expenses to the extent necessary to keep the Fund’s expenses from exceeding 0.99%. Returns less than one year are not annualized. The performance table and graph do not reflect the deduction of taxes that a shareholder would pay on Fund distributions or the redemption of Fund shares. For the Fund’s most recent month end performance, please call 1-877-843-3831.
| * | Commencement of operations. |
| ** | The price used to calculate market return (“Market Price’’) is determined by using the closing price listed on the Nasdaq and does not represent returns an investor would receive if shares were traded at other times. Total returns are calculated using the daily 4:00pm midpoint between the bid and offer. Shares are bought and sold at market price, not NAV and are not individually redeemed from the Fund. |
The S&P 500 Index is a broad-based, unmanaged measurement of changes in stock market conditions based on the average of 500 widely held common stocks. One cannot invest directly in an index.
ADVISORSHARES TRUST
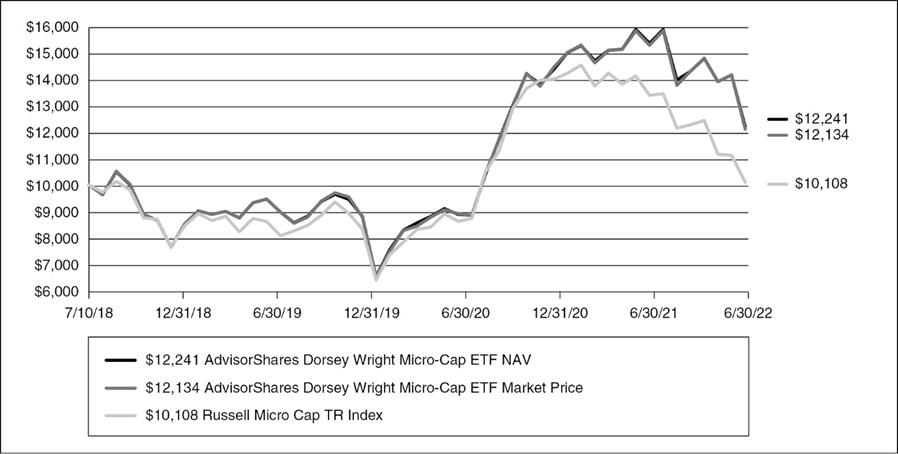
AdvisorShares Dorsey Wright Micro-Cap ETF (DWMC)
The AdvisorShares Dorsey Wright Micro-Cap ETF (DWMC) finished the fiscal year ended June 30th, 2022 ahead of its benchmark, the Russell Microcap Index. It was a rough year for the microcap space as US equities entered a bear market. Small/Micro cap stocks were some of the worst hit areas during the decline, but relative strength was able to guide us toward names that outperformed.
The second half of 2021 was great for US equities as a whole, but cracks were emerging in the Small/Micro cap space as the Russell Microcap index was down -7.5%. The fund performed well in this environment though, posting a 3.5% gain. Once the bear market began in 2022 though, almost no market/sector (aside from Energy) was left unscathed. Nevertheless, the fund was still able to outperform.
DWMC’s strategy is designed to unemotionally follow trends, which we think will benefit the portfolio in the coming months that are expected to be filled with uncertainty. Given stretched consumer sentiment, we feel the prospects for micro-cap stocks continue to be strong despite the bear market. Valuations for smaller stocks continue to be attractive relative to large caps, with a large valuation gap between the smallest and largest companies. This can persist for long periods but doesn’t last forever. We believe the fund is well-positioned to capitalize on a narrowing valuation gap when it comes.
HYPOTHETICAL GROWTH OF $10,000 INVESTMENT
For the period July 10, 2018* to June 30, 2022
HISTORICAL PERFORMANCE
Total Return as of June 30, 2022
| | | 1 Year | | | 3 Year | | | Since
Inception
7/10/2018* | |
| AdvisorShares Dorsey Wright Micro-Cap ETF NAV | | | -20.17 | % | | | 9.51 | % | | | 5.22 | % |
| AdvisorShares Dorsey Wright Micro-Cap ETF Market Price** | | | -20.99 | % | | | 9.21 | % | | | 4.99 | % |
| Russell Micro-Cap Index | | | -30.73 | % | | | 5.05 | % | | | 0.27 | % |
Performance data quoted represents past performance and is no guarantee of future results. Current performance may be lower or higher than the performance data quoted. Investment return and principal value will fluctuate so that an investor’s shares, when redeemed, may be worth more or less than original cost. Fund NAV returns are calculated using the Fund’s daily 4:00 p.m. NAV. Returns shown include the reinvestment of all dividends and other distributions. Index returns do not include expenses. As stated in the current prospectus, the Fund’s annual operating expense ratio (gross) is 3.19% and the net expense ratio is 1.27%. (Actual expenses can be referenced in the Financial Highlights section later in this report.) The Fund’s advisor has agreed to waive a portion of its fees and/or reimburse expenses to the extent necessary to keep the Fund’s expenses from exceeding 1.25%. Returns less than one year are not annualized. The performance table and graph do not reflect the deduction of taxes that a shareholder would pay on Fund distributions or the redemption of Fund shares. For the Fund’s most recent month end performance, please call 1-877-843-3831.
| * | Commencement of operations. |
| ** | The price used to calculate market return (“Market Price’’) is determined by using the closing price listed on the Nasdaq and does not represent returns an investor would receive if shares were traded at other times. Total returns are calculated using the daily 4:00pm midpoint between the bid and offer. Shares are bought and sold at market price, not NAV and are not individually redeemed from the Fund. |
The Russell Micro-Cap Index measures the performance of the micro cap segment of the U.S. equity market. It includes 1,000 of the smallest securities in the Russell 2000 Index based on a combination of their market cap and current index membership and it also includes up to the next 1,000 stocks.
ADVISORSHARES TRUST
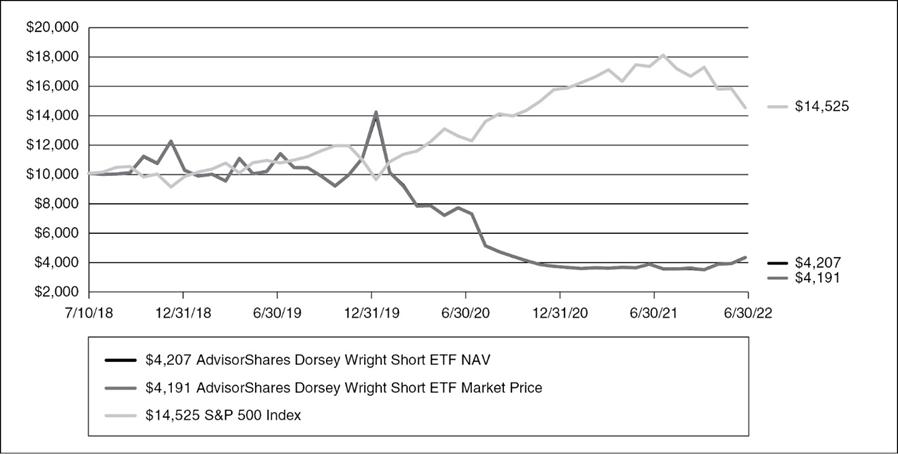
AdvisorShares Dorsey Wright Short ETF (DWSH)
The AdvisorShares Dorsey Wright Short ETF (DWSH) finished the fiscal year ended June 30, 2022 ahead of its benchmark, the inverse of the S&P 500 Total Return Index. The bear market that unfolded in the first half of 2022 undeniably helped the portfolio, but on a relative basis more ground was gained in the second half of 2021 as areas of the market began to diverge from each other.
In the second half of 2021, the US Equity markets performed very well, but cracks were beginning to emerge with many technology stocks producing notable selloffs. The fund was able to capitalize on this environment as it shorted pockets of the market showing relative weakness while the S&P 500 index barreled upward and it’s inverse barreled downward. The first half of 2022, of course, produced the bear market we’re currently in, and the fund produced a positive return in this environment as well as one would expect.
With recession risks mounting, we feel that using the fund as a hedge continues to remain attractive. The fund’s strategy of rotating into the weakest sectors should bode well for any further legs down in the market.
HYPOTHETICAL GROWTH OF $10,000 INVESTMENT
For the period July 10, 2018* to June 30, 2022
HISTORICAL PERFORMANCE
Total Return as of June 30, 2022
| | | 1 Year | | | 3 Year | | | Since
Inception
7/10/2018* | |
| AdvisorShares Dorsey Wright Short ETF NAV | | | 22.15 | % | | | -25.00 | % | | | -19.58 | % |
| AdvisorShares Dorsey Wright Short ETF Market Price** | | | 22.08 | % | | | -25.13 | % | | | -19.66 | % |
| S&P 500 Index | | | -10.62 | % | | | 10.60 | % | | | 9.85 | % |
Performance data quoted represents past performance and is no guarantee of future results. Current performance may be lower or higher than the performance data quoted. Investment return and principal value will fluctuate so that an investor’s shares, when redeemed, may be worth more or less than original cost. Fund NAV returns are calculated using the Fund’s daily 4:00 p.m. NAV. Returns shown include the reinvestment of all dividends and other distributions. Index returns do not include expenses. As stated in the current prospectus, the Fund’s annual operating expense ratio (gross) is 3.75% and the net expense ratio is 3.68%. (Actual expenses can be referenced in the Financial Highlights section later in this report.) The Fund’s advisor has agreed to waive a portion of its fees and/or reimburse expenses to the extent necessary to keep the Fund’s expenses from exceeding 1.25%. Returns less than one year are not annualized. The performance table and graph do not reflect the deduction of taxes that a shareholder would pay on Fund distributions or the redemption of Fund shares. For the Fund’s most recent month end performance, please call 1-877-843-3831.
| * | Commencement of operations. |
| ** | The price used to calculate market return (“Market Price’’) is determined by using the closing price listed on the Nasdaq and does not represent returns an investor would receive if shares were traded at other times. Total returns are calculated using the daily 4:00pm midpoint between the bid and offer. Shares are bought and sold at market price, not NAV and are not individually redeemed from the Fund. |
The S&P 500 Index is a broad-based, unmanaged measurement of changes in stock market conditions based on the average of 500 widely held common stocks. One cannot invest directly in an index.
ADVISORSHARES TRUST
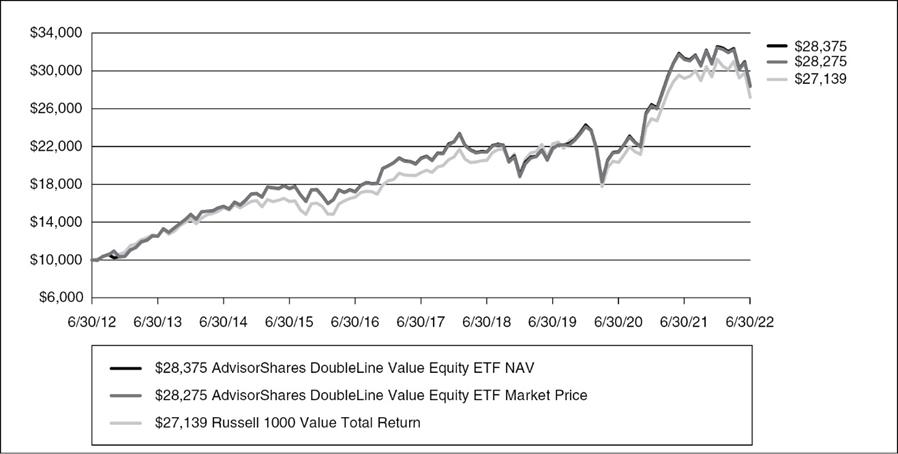
AdvisorShares DoubleLine Value Equity ETF (DBLV)
For the fiscal year ended June 30, 2022, the AdvisorShares Doubleline Value Equity ETF (ticker: DBLV) returned -9.12%, based on NAV, while the Russell 1000 Value Index benchmark posted a return of -6.82%. Unfavorable sector weights drove most of the underperformance. Our overweight in communication services, consumer discretionary and financials and our underweight in utilities hurt performance, while our underweight in technology helped. The fund benefitted from positive stock selection in consumer discretionary, industrials, and technology, which was offset by negative stock selection in communication services, materials, financials, healthcare, and real estate.
U.S. equities struggled in 2022 amid worsening inflationary pressures, protracted supply chain disruptions, sharply rising interest rates, hawkish central bankers, growing recessionary fears and continued geopolitical concerns around the war in Ukraine, as well as continual COVID lockdowns in China and elsewhere. The rapid rise in stagflationary fears led to relative outperformance of the energy sector, driven by higher commodity prices, as well as highly defensive sectors like consumer staples, utilities, and health care. Meanwhile, less defensive sectors with high valuation multiples, such as technology and consumer discretionary underperformed, as did cyclically sensitive value-priced names in areas like financials and industrials.
Even with the meaningful outperformance of value stocks relative to growth stocks during the year, we continue to see attractive opportunities in value names. Value continues to trade at valuation discount to growth more than the historical average, providing a runway of opportunity for further normalization of that discount. In terms of positioning, we increasingly prefer high-quality, late-cycle value stocks that are better poised to benefit even amidst the moderating economic growth and rising input costs, alongside those names with more defensive characteristics. We seek to balance investments offering attractive long-term expected risk-adjusted returns with those that should serve as more defensive ballasts in uncertain times. Note that the differentiated fundamental value strategy behind DBLV is well suited to allowing one to navigate through these evolving risks and opportunities.
HYPOTHETICAL GROWTH OF $10,000 INVESTMENT
For the period June 30, 2012 to June 30, 2022
HISTORICAL PERFORMANCE
Total Return as of June 30, 2022
| | | 1 Year | | | 3 Year | | | 5 Year | | | 10 Year | |
| AdvisorShares DoubleLine Value Equity ETF NAV | | | -9.12 | % | | | 9.23 | % | | | 6.46 | % | | | 10.99 | % |
| AdvisorShares DoubleLine Value Equity ETF Market Price* | | | -9.12 | % | | | 9.22 | % | | | 6.46 | % | | | 10.95 | % |
| Russell 1000 Value Total Return | | | -6.82 | % | | | 6.87 | % | | | 7.17 | % | | | 10.50 | % |
Performance data quoted represents past performance and is no guarantee of future results. Current performance may be lower or higher than the performance data quoted. Investment return and principal value will fluctuate so that an investor’s shares, when redeemed, may be worth more or less than original cost. Fund NAV returns are calculated using the Fund’s daily 4:00 p.m. NAV. Returns shown include the reinvestment of all dividends and other distributions. Index returns do not include expenses. As stated in the current prospectus, the Fund’s annual operating expense ratio (gross) is 1.06% and net expense ratio is 0.91%. (Actual expenses can be referenced in the Financial Highlights section later in this report.) The Fund’s advisor has agreed to waive a portion of its fees and/or reimburse expenses to the extent necessary to keep the Fund’s expenses from exceeding 0.90%. Returns less than one year are not annualized. The performance table and graph do not reflect the deduction of taxes that a shareholder would pay on Fund distributions or the redemption of Fund shares. For the Fund’s most recent month end performance, please call 1-877-843-3831.
| * | The price used to calculate market return (“Market Price’’) is determined by using the closing price listed on the NYSE Arca and does not represent returns an investor would receive if shares were traded at other times. Total returns are calculated using the daily 4:00pm midpoint between the bid and offer. Shares are bought and sold at market price, not NAV and are not individually redeemed from the Fund. |
The Russell 1000 Value Total Return Index measures the performance of the large-cap value segment of the U.S. equity market. It includes those Russell 1000 companies with lower price-to-book ratios and lower expected and historical growth rates.
ADVISORSHARES TRUST
AdvisorShares Drone Technology ETF (UAV)
The AdvisorShares Drone Technology ETF (ticker: UAV) was just launched with an inception date of April 27, 2022 and has less than 3 months of performance. As the Drone Technology ETF invests in a limited universe of companies, the Fund can be volatile as compared to the overall market. We believe that drone technology presents great investment opportunities for long term investors as autonomous vehicle development, adoption and use increases worldwide.
HYPOTHETICAL GROWTH OF $10,000 INVESTMENT
For the period April 27, 2022* to June 30, 2022
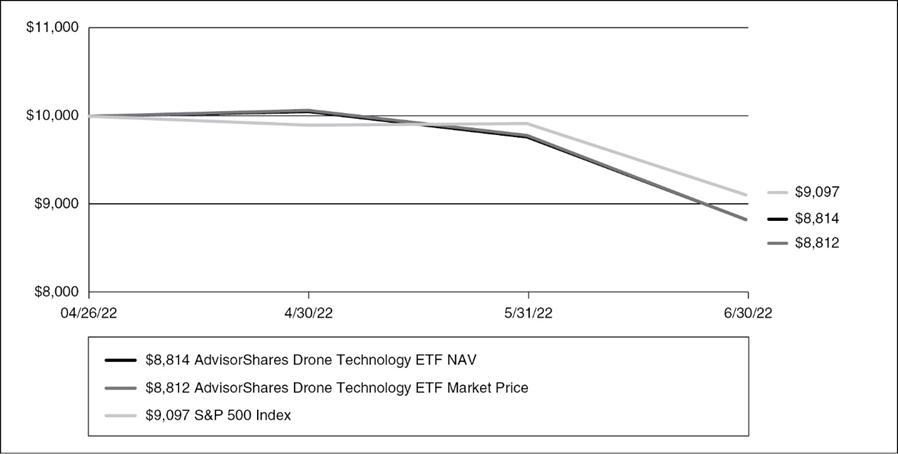
HISTORICAL PERFORMANCE
Total Return as of June 30, 2022
| | | Since
Inception
4/27/2022* | |
| AdvisorShares Drone Technology ETF NAV | | | -11.86 | % |
| AdvisorShares Drone Technology ETF Market Price** | | | -11.88 | % |
| S&P 500 Index | | | -9.03 | % |
Performance data quoted represents past performance and is no guarantee of future results. Current performance may be lower or higher than the performance data quoted. Investment return and principal value will fluctuate so that an investor’s shares, when redeemed, may be worth more or less than original cost. Fund NAV returns are calculated using the Fund’s daily 4:00 p.m. NAV. Returns shown include the reinvestment of all dividends and other distributions. Index returns do not include expenses. As stated in the current prospectus, the Fund’s annual operating expense ratio (gross) is 1.22% and the net expense ratio is 0.99%. (Actual expenses can be referenced in the Financial Highlights section later in this report.) The Fund’s advisor has agreed to waive a portion of its fees and/or reimburse expenses to the extent necessary to keep the Fund’s expenses from exceeding 0.99%. Returns less than one year are not annualized. The performance table and graph do not reflect the deduction of taxes that a shareholder would pay on Fund distributions or the redemption of Fund shares. For the Fund’s most recent month end performance, please call 1-877-843-3831.
| * | Commencement of operations. |
| ** | The price used to calculate market return (“Market Price’’) is determined by using the closing price listed on the NYSE Arca and does not represent returns an investor would receive if shares were traded at other times. Total returns are calculated using the daily 4:00pm midpoint between the bid and offer. Shares are bought and sold at market price, not NAV and are not individually redeemed from the Fund. |
The S&P 500 Index is a broad-based, unmanaged measurement of changes in stock market conditions based on the average of 500 widely held common stocks. One cannot invest directly in an index.
ADVISORSHARES TRUST
AdvisorShares Focused Equity ETF (CWS)
For the 12 months ended June 30, 2022, the NAV of the AdvisorShares Focused Equity ETF (ticker: CWS) lost 9.28%, and the traded shares lost 9.44%. Despite the loss, CWS performed well versus the overall market. For example, the S&P 500 Total Return Index lost over 10.6% over the same time span, and the small-cap Russell 2000 Total Return Index lost over 25%.
This was an unusually challenging period for investors. The economy faced the highest inflation in over 40 years. Companies were impacted by supply-chain issues and the Federal Reserve raised interest rates, including its first 0.75% rate hikes in over 25 years.
Due to CWS’s conservative nature and long-term focus, the anxious mood worked to our benefit. When the market started to fall in January, shares of CWS didn’t fall as much as the rest of the market. Meanwhile, many of the stocks that had rallied so strongly in 2021 were punished severely. The stocks in CWS tend to be of a higher quality than the rest of the market. Additionally, since we make portfolio changes only once a year, we aren’t subject to the perils of poor market-timing. In fact, our set-and-forget strategy can be ideal for turbulent markets such as we had in early 2022.
We continue to expect CWS’s performance to lead the overall stock market. The economy and financial markets still face significant challenges including a slowing economy, rising inflation, more interest-rate hikes plus several troubling geo-political risks. During uncertain times, investors gravitate towards high-quality stocks. In our opinion, this makes for an excellent environment for the AdvisorShares Focused Equity ETF.
HYPOTHETICAL GROWTH OF $10,000 INVESTMENT
For the period September 20, 2016* to June 30, 2022
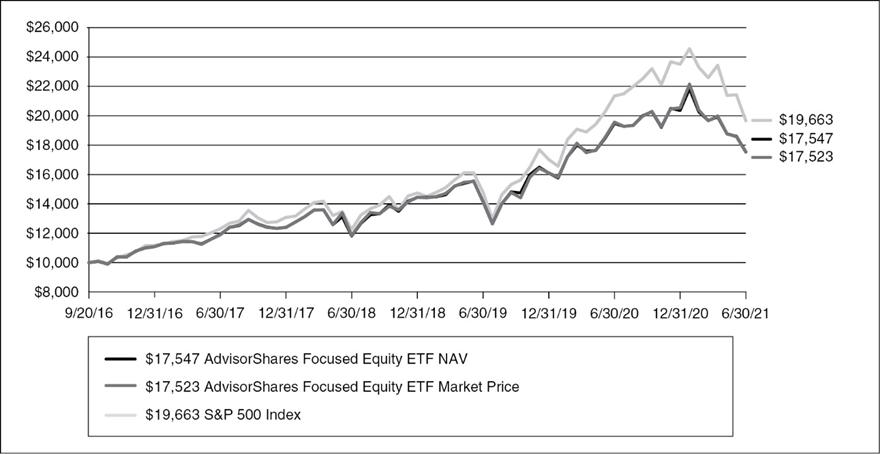
HISTORICAL PERFORMANCE
Total Return as of June 30, 2022
| | | 1 Year | | | 3 Year | | | 5 Year | | | Since
Inception
9/20/2016* | |
| AdvisorShares Focused Equity ETF NAV | | | -9.28 | % | | | 7.37 | % | | | 8.93 | % | | | 10.23 | % |
| AdvisorShares Focused Equity ETF Market Price** | | | -9.44 | % | | | 7.44 | % | | | 8.90 | % | | | 10.20 | % |
| S&P 500 Index | | | -10.62 | % | | | 10.60 | % | | | 11.31 | % | | | 12.42 | % |
Performance data quoted represents past performance and is no guarantee of future results. Current performance may be lower or higher than the performance data quoted. Investment return and principal value will fluctuate so that an investor’s shares, when redeemed, may be worth more or less than original cost. Fund NAV returns are calculated using the Fund’s daily 4:00 p.m. NAV. Returns shown include the reinvestment of all dividends and other distributions. Index returns do not include expenses. As stated in the current prospectus, the Fund’s annual operating expense ratio (gross) is 1.19% and the net expense ratio is 0.66%. (Actual expenses can be referenced in the Financial Highlights section later in this report.) The Fund’s advisor has agreed to waive a portion of its fees and/or reimburse expenses to the extent necessary to keep the Fund’s expenses from exceeding the range from 0.65% to 0.85%. Returns less than one year are not annualized. The performance table and graph do not reflect the deduction of taxes that a shareholder would pay on Fund distributions or the redemption of Fund shares. For the Fund’s most recent month end performance, please call 1-877-843-3831.
| * | Commencement of operations. |
| ** | The price used to calculate market return (“Market Price’’) is determined by using the closing price listed on the NYSE Arca and does not represent returns an investor would receive if shares were traded at other times. Total returns are calculated using the daily 4:00pm midpoint between the bid and offer. Shares are bought and sold at market price, not NAV and are not individually redeemed from the Fund. |
The S&P 500 Index is a broad-based, unmanaged measurement of changes in stock market conditions based on the average of 500 widely held common stocks. One cannot invest directly in an index.
ADVISORSHARES TRUST
AdvisorShares Gerber Kawasaki (GK)
The AdvisorShares Gerber Kawasaki ETF (ticker: GK) launched one year ago during the end of the bull market of 2021. The fund had a stellar first five months beating the benchmarks and providing positive total return. In December 2021, the market began to turn with the next six months turning out to be the most difficult time for stocks in the last 50 years. Unfortunately, this was a very difficult period for the fund as well. The bear market lasted from mid-November 2021 to mid-June 2022. Due to the fact we are a concentrated fund, focused on technology, consumer discretionary, clean energy and transportation areas, we were hit particularly hard relative to the indexes. High inflation and supply chain issues caused many of our investments to temporarily decline in value. For the twelve months ended June 30, 2022, GK’s performance was negative, underperforming the S&P 500 Index.
The factors that most affected GK’s performance during the fiscal year was exposure to the areas of the market that was dramatically affected by inflation and the subsequent rapid rise in interest rates. Unfortunately, the technology sector tends to perform poorly during a rising interest rate environment and that held true. Also, the fund’s thematic investment strategy led to GK being heavily invested in consumer discretionary stocks. These positions were also hit particularly hard as high gas prices, caused by the war in Ukraine, took away some of consumers’ spending power. This combination of factors along with a concentrated portfolio caused the fund to underperform for the year. Also, GK’s heavy investments in electric vehicles and clean energy were negatively affected by the Biden Administration’s inability to get the Climate Bill approved earlier in the year. While it was a difficult year for GK, it has not changed our belief in the fund’s strategy and the future of its investments.
As we enter the new fiscal year, we’ve seen the end of the recent bear market, what appears to be the peak in inflation as the Federal Reserve’s actions appear to be working, and the passage of a U.S. Climate Bill placing greater focus on alternative energy. These factors are favorable for the fund, and we believe GK should begin to outperform. As the world struggles with an over-dependence on oil and gas in the wake of the Ukraine-Russia war, we are quite bullish on the future of renewable energy. Although we expect some additional bumps as the Fed finishes its rate hiking cycle, once the Fed is done, we anticipate markets will react well and GK will be in a prime position to benefit from the transformative trends that will continue in out thematic investment approach.
HYPOTHETICAL GROWTH OF $10,000 INVESTMENT
For the period July 2, 2021* to June 30, 2022
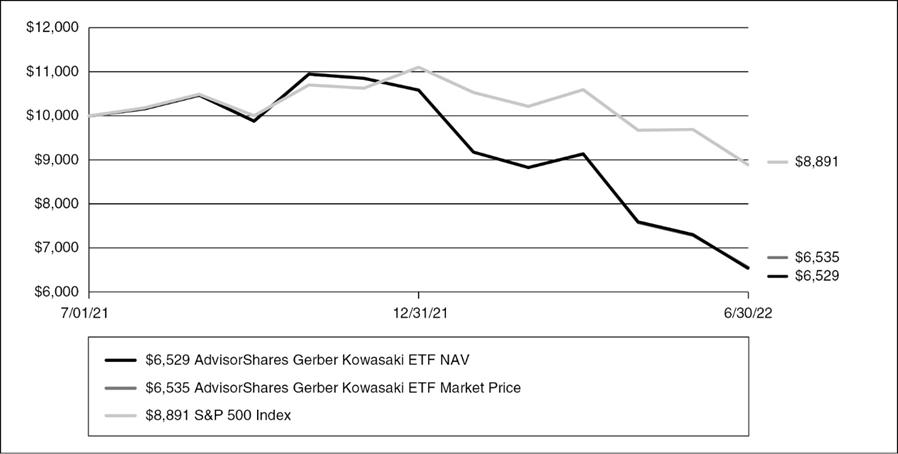
HISTORICAL PERFORMANCE
Total Return as of June 30, 2022
| | | Since
Inception
7/2/2021* | |
| AdvisorShares Gerber Kawasaki ETF NAV | | | -34.71 | % |
| AdvisorShares Gerber Kawasaki ETF Market Price** | | | -34.65 | % |
| S&P 500 Index | | | -11.09 | % |
Performance data quoted represents past performance and is no guarantee of future results. Current performance may be lower or higher than the performance data quoted. Investment return and principal value will fluctuate so that an investor’s shares, when redeemed, may be worth more or less than original cost. Fund NAV returns are calculated using the Fund’s daily 4:00 p.m. NAV. Returns shown include the reinvestment of all dividends and other distributions. Index returns do not include expenses. As stated in the current prospectus, the Fund’s annual operating expense ratio (gross) is 0.87% and the net expense ratio is 0.81%. (Actual expenses can be referenced in the Financial Highlights section later in this report.) The Fund’s advisor has agreed to waive a portion of its fees and/or reimburse expenses to the extent necessary to keep the Fund’s expenses from exceeding 0.75%. Returns less than one year are not annualized. The performance table and graph do not reflect the deduction of taxes that a shareholder would pay on Fund distributions or the redemption of Fund shares. For the Fund’s most recent month end performance, please call 1-877-843-3831.
| * | Commencement of operations. |
| ** | The price used to calculate market return (“Market Price’’) is determined by using the closing price listed on the NYSE Arca and does not represent returns an investor would receive if shares were traded at other times. Total returns are calculated using the daily 4:00pm midpoint between the bid and offer. Shares are bought and sold at market price, not NAV and are not individually redeemed from the Fund. |
The S&P 500 Index is a broad-based, unmanaged measurement of changes in stock market conditions based on the average of 500 widely held common stocks. One cannot invest directly in an index.
ADVISORSHARES TRUST
AdvisorShares Hotel ETF (BEDZ)
The AdvisorShares Hotel ETF (ticker: BEDZ) launched in the Spring of 2021 and just completed its first full fiscal year. The Fund somewhat underperformed the overall market as measured by the S&P 500 Index. The Fund’s overall performance is very much aligned with the success of the hotel industry. While much of the travel industry has bounced back from COVID-19, hotels have faced employment shortages, supply chain limitations, and an overall negative impact of inflation.
Investors in a focused, industry-related fund should have a very long-term focus. We remain bullish about future hotel and travel growth as the world continues to slowly return to a more normal business travel environment. While we are bullish on the overall hotel industry, the Fund attempts relative outperformance with individual security selection among hotels and related areas plus good trading techniques.
HYPOTHETICAL GROWTH OF $10,000 INVESTMENT
For the period April 20, 2021* to June 30, 2022
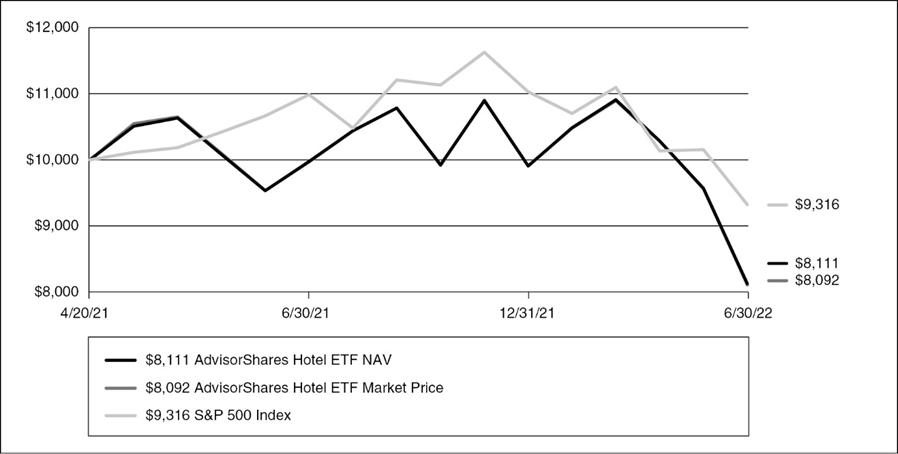
HISTORICAL PERFORMANCE
Total Return as of June 30, 2022
| | | 1 Year | | | Since
Inception
4/20/2021* | |
| AdvisorShares Hotel ETF NAV | | | -19.54 | % | | | -16.08 | % |
| AdvisorShares Hotel ETF Market Price** | | | -19.87 | % | | | -16.24 | % |
| S&P 500 Index | | | -10.62 | % | | | -5.76 | % |
Performance data quoted represents past performance and is no guarantee of future results. Current performance may be lower or higher than the performance data quoted. Investment return and principal value will fluctuate so that an investor’s shares, when redeemed, may be worth more or less than original cost. Fund NAV returns are calculated using the Fund’s daily 4:00 p.m. NAV. Returns shown include the reinvestment of all dividends and other distributions. Index returns do not include expenses. As stated in the current prospectus, the Fund’s annual operating expense ratio (gross) is 0.99% and the net expense ratio is 0.99%. (Actual expenses can be referenced in the Financial Highlights section later in this report.) The Fund’s advisor has agreed to waive a portion of its fees and/or reimburse expenses to the extent necessary to keep the Fund’s expenses from exceeding 0.99%. Returns less than one year are not annualized. The performance table and graph do not reflect the deduction of taxes that a shareholder would pay on Fund distributions or the redemption of Fund shares. For the Fund’s most recent month end performance, please call 1-877-843-3831.
| * | Commencement of operations. |
| ** | The price used to calculate market return (“Market Price’’) is determined by using the closing price listed on the NYSE Arca and does not represent returns an investor would receive if shares were traded at other times. Total returns are calculated using the daily 4:00pm midpoint between the bid and offer. Shares are bought and sold at market price, not NAV and are not individually redeemed from the Fund. |
The S&P 500 Index is a broad-based, unmanaged measurement of changes in stock market conditions based on the average of 500 widely held common stocks. One cannot invest directly in an index.
ADVISORSHARES TRUST
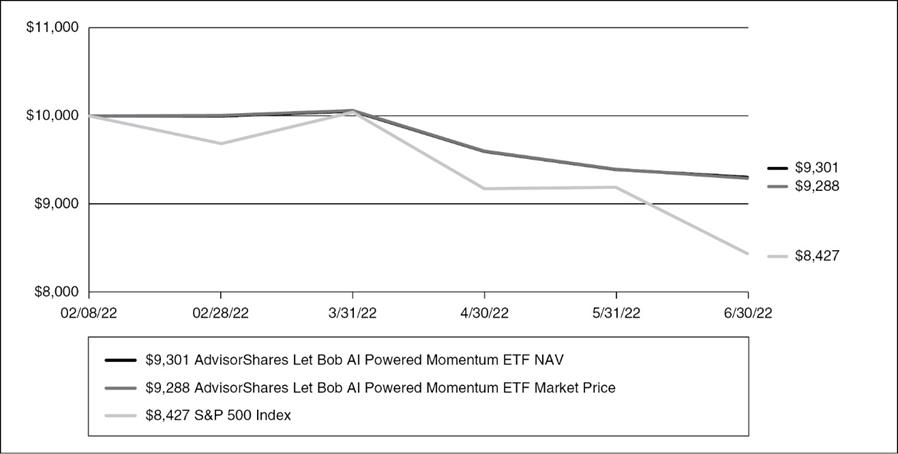
AdvisorShares Let Bob AI Powered Momentum ETF (LETB)
The AdvisorShares Let Bob AI Powered Momentum ETF (ticker: LETB) launched with an inception date of February 8, 2022. Through fiscal year ended June 30, 2022, the Fund has less than 5 months of investment performance. During 2022’s volatile and negative markets, LETB’s artificial intelligence-powered investment strategy has caused the Fund to hold comparatively large percentages of its assets in a defensive cash investment position. While the Fund has lost value since its inception, it has lost much less than the overall market as measured by the S&P 500 Index. As the overall market returns to more a normal situation, the Fund is expected to be more fully invested per its investment strategy and security selection process.
HYPOTHETICAL GROWTH OF $10,000 INVESTMENT
For the period February 9, 2022* to June 30, 2022
HISTORICAL PERFORMANCE
Total Return as of June 30, 2022
| | | Since
Inception
2/9/2022* | |
| AdvisorShares Let Bob AI Powered Momentum ETF NAV | | | -6.99 | % |
| AdvisorShares Let Bob AI Powered Momentum ETF Market Price** | | | -7.12 | % |
| S&P 500 Index | | | -15.73 | % |
Performance data quoted represents past performance and is no guarantee of future results. Current performance may be lower or higher than the performance data quoted. Investment return and principal value will fluctuate so that an investor’s shares, when redeemed, may be worth more or less than original cost. Fund NAV returns are calculated using the Fund’s daily 4:00 p.m. NAV. Returns shown include the reinvestment of all dividends and other distributions. Index returns do not include expenses. As stated in the current prospectus, the Fund’s annual operating expense ratio (gross) is 0.87% and the net expense ratio is 0.87%. (Actual expenses can be referenced in the Financial Highlights section later in this report.) The Fund’s advisor has agreed to waive a portion of its fees and/or reimburse expenses to the extent necessary to keep the Fund’s expenses from exceeding 0.99%. Returns less than one year are not annualized. The performance table and graph do not reflect the deduction of taxes that a shareholder would pay on Fund distributions or the redemption of Fund shares. For the Fund’s most recent month end performance, please call 1-877-843-3831.
| * | Commencement of operations. |
| ** | The price used to calculate market return (“Market Price’’) is determined by using the closing price listed on the NYSE Arca and does not represent returns an investor would receive if shares were traded at other times. Total returns are calculated using the daily 4:00pm midpoint between the bid and offer. Shares are bought and sold at market price, not NAV and are not individually redeemed from the Fund. |
The S&P 500 Index is a broad-based, unmanaged measurement of changes in stock market conditions based on the average of 500 widely held common stocks. One cannot invest directly in an index.
ADVISORSHARES TRUST
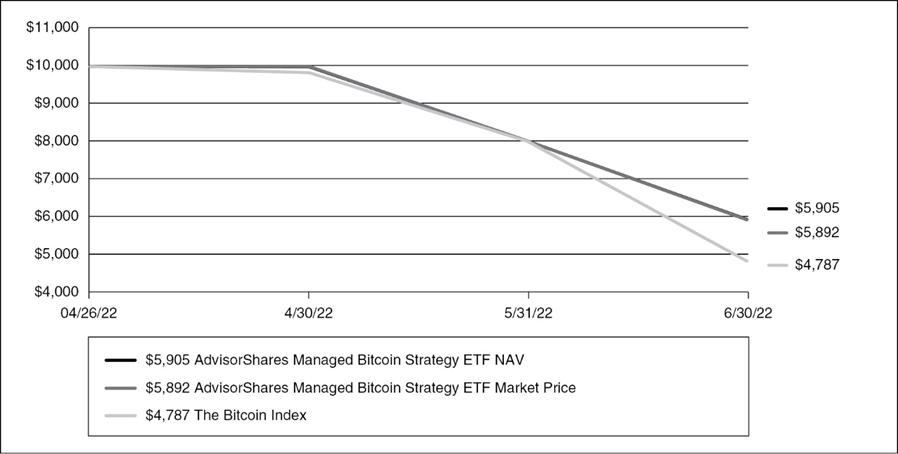
AdvisorShares Managed Bitcoin Strategy ETF (CRYP)
The AdvisorShares Managed Bitcoin Strategy ETF (CRYP) was launched during the second half of the fiscal year ended June 30, 2022 and finished the fiscal year ahead of its benchmark – the price of Bitcoin in USD (BTCUSD). The outperformance during the period was driven primarily by the active management of the strategy which enabled the Fund to mitigate losses in a very challenging investment environment.
Toward the end of 2021, global capital markets shifted dramatically toward a risk-off posture as global central banks began to withdraw liquidity from the global financial system by raising interest rates. A rising interest environment is challenging for all assets as rising discount rates compress equity market valuations (Price to Earnings ratios) and directly reduce the value of fixed income investments. In the first half of 2022, global capital markets experienced very significant losses across the board, and sectors with the highest growth rates and those that had performed very well in 2020 and 2021, dramatically decreased in value. The withdrawal of liquidity by the Fed and other central banks triggered a wave of deleveraging that prompted rapid outflows from capital markets for the first time in many years. Digital assets such as Bitcoin experienced significant price pressure, and investors reacted by reducing exposures, which put further downward pressure on the asset class.
The design of the AdvisorShares Managed Bitcoin Strategy ETF is well suited to this type of market volatility and enabled the Fund to achieve the goal of mitigating downside risk during significant drawdowns. We believe that the Fund is well positioned to continue to provide investors with an alternative to direct ownership of Bitcoin by mitigating many of the risks associated with owning and managing digital assets and helping advisors integrate this important, but highly volatile, asset into client portfolios. Markowitz portfolio theory has shown that including volatile assets with low correlation to traditional assets into a portfolio can increase the efficiency and return profile of the portfolio, and we believe CRYP can play an important role in diversified portfolios.
HYPOTHETICAL GROWTH OF $10,000 INVESTMENT
For the period April 27, 2022* to June 30, 2022
HISTORICAL PERFORMANCE
Total Return as of June 30, 2022
| | | Since
Inception
4/27/2022* | |
| AdvisorShares Managed Bitcoin Strategy ETF NAV | | | -40.95 | % |
| AdvisorShares Managed Bitcoin Strategy ETF Market Price** | | | -41.08 | % |
| The Bitcoin Index | | | -52.13 | % |
Performance data quoted represents past performance and is no guarantee of future results. Current performance may be lower or higher than the performance data quoted. Investment return and principal value will fluctuate so that an investor’s shares, when redeemed, may be worth more or less than original cost. Fund NAV returns are calculated using the Fund’s daily 4:00 p.m. NAV. Returns shown include the reinvestment of all dividends and other distributions. Index returns do not include expenses. As stated in the current prospectus, the Fund’s annual operating expense ratio (gross) is 1.61% and the net expense ratio is 0.61%. (Actual expenses can be referenced in the Financial Highlights section later in this report.) The Fund’s advisor has agreed to waive a portion of its fees and/or reimburse expenses to the extent necessary to keep the Fund’s expenses from exceeding 1.49%. Returns less than one year are not annualized. The performance table and graph do not reflect the deduction of taxes that a shareholder would pay on Fund distributions or the redemption of Fund shares. For the Fund’s most recent month end performance, please call 1-877-843-3831.
| * | Commencement of operations. |
| ** | The price used to calculate market return (“Market Price’’) is determined by using the closing price listed on the NYSE Arca and does not represent returns an investor would receive if shares were traded at other times. Total returns are calculated using the daily 4:00pm midpoint between the bid and offer. Shares are bought and sold at market price, not NAV and are not individually redeemed from the Fund. |
The NYSE Bitcoin Index aims to represent the value of (1) bitcoin in U.S. Dollars (USD) as of 4 PM U.K. time each weekday. The Index is calculated sourcing data from qualified exchanges, currently GDAX and itBit. Only bitcoin transactions conducted in USD are eligible to be input into the Index. One cannot invest directly in an index.
ADVISORSHARES TRUST
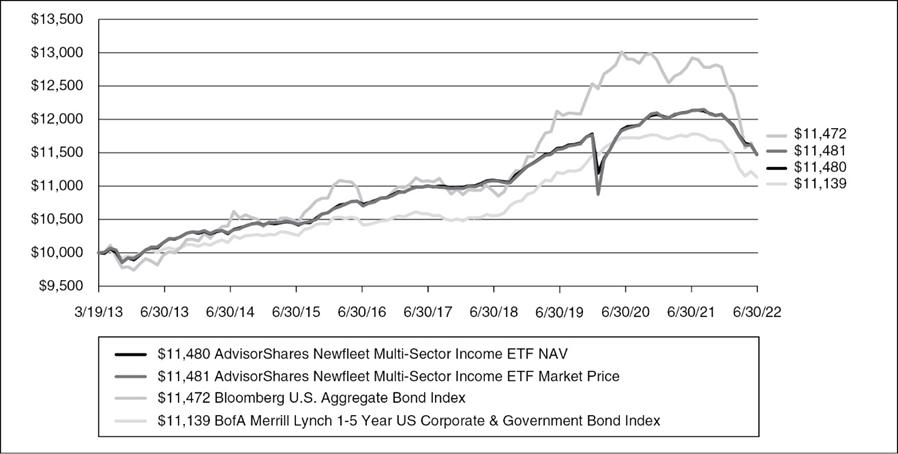
AdvisorShares Newfleet Multi-Sector Income ETF (MINC)
The AdvisorShares Newfleet Multi-Sector Income ETF (ticker: MINC) posted a return of -5.24%, based on NAV and -5.19%, based on Market Price as compared to -10.29% for the Bloomberg U.S. Aggregate Bond Index or -5.19% for the BofA Merrill lynch 1-5 Year U.S. Corporate & Government Bond Index for the 1-year period ended June 30, 2022.
Global central banks intensified their fight with inflation during the period, signaling they will remain vigilant until inflation objectives are met. This backdrop clouded the outlook for global and regional economic growth, resulting in negative total returns for most assets. The pandemic remains a global issue, with China’s zero-COVID policy continuing to delay the normalization of supply chains. Meanwhile, the war between Russia and Ukraine is an ongoing economic shock to food and energy prices. These unresolved issues make economic forecasting and modeling a challenge and will likely contribute to a volatile investing environment for the next several quarters.
During the most recent one-year period, MINC’s allocation to asset backed securities and non-agency residential mortgage-backed securities had a positive impact on the Fund. We are still constructive on both short duration credit backed by the U.S. consumer, and mortgage credit. The underweight to investment grade corporates also positively contributed to performance. The focus on higher quality loans in the Fund benefited performance as BB risk continued to outperform lower-quality cohorts. The Fund’s underweight to U.S. Treasuries was the primary detractor from performance. Allocation to the corporate high yield sector also had a negative impact on performance. Factors that have plagued the high yield market for the last few months persist: the war in Ukraine rages on, supply chain disruptions continue, and U.S. Treasury yields rose as the market tried to handicap the levers the FOMC will pull to quell inflation.
We believe some of the best total return and yield opportunities can be found in spread sectors. However, given the increased risk of a recession, we have reduced some exposure to spread sectors that would typically be more negatively impacted, such as corporate high yield and bank loans. Credit selection and positioning remain key. Specific sectors that demonstrate the best relative value for us include out-of-index/off-the-run ABS, non-agency RMBS, and BBB-rated corporate investment grade.
HYPOTHETICAL GROWTH OF $10,000 INVESTMENT
For the period March 19, 2013* to June 30, 2022
HISTORICAL PERFORMANCE
Total Return as of June 30, 2022
| | | 1 Year | | | 3 Year | | | 5 Year | | | Since
Inception
3/19/2013* | |
| AdvisorShares Newfleet Multi-Sector Income ETF NAV | | | -5.24 | % | | | 0.00 | % | | | 1.02 | % | | | 1.50 | % |
| AdvisorShares Newfleet Multi-Sector Income ETF Market Price** | | | -5.19 | % | | | 0.05 | % | | | 1.02 | % | | | 1.50 | % |
| Bloomberg U.S. Aggregate Bond Index | | | -10.29 | % | | | -0.93 | % | | | 0.88 | % | | | 1.49 | % |
| BofA Merrill Lynch 1-5 Year U.S. Corporate & Government Bond Index | | | -5.19 | % | | | 0.14 | % | | | 1.11 | % | | | 1.17 | % |
Performance data quoted represents past performance and is no guarantee of future results. Current performance may be lower or higher than the performance data quoted. Investment return and principal value will fluctuate so that an investor’s shares, when redeemed, may be worth more or less than original cost. Fund NAV returns are calculated using the Fund’s daily 4:00 p.m. NAV. Returns shown include the reinvestment of all dividends and other distributions. Index returns do not include expenses. As stated in the current prospectus, the Fund’s annual operating expense ratio (gross) is 0.79% and net expense ratio is 0.76%. (Actual expenses can be referenced in the Financial Highlights section later in this report.) The Fund’s advisor has agreed to waive a portion of its fees and/or reimburse expenses to the extent necessary to keep the Fund’s expenses from exceeding 0.75%. Returns less than one year are not annualized. The performance table and graph do not reflect the deduction of taxes that a shareholder would pay on Fund distributions or the redemption of Fund shares. For the Fund’s most recent month end performance, please call 1-877-843-3831.
| * | Commencement of operations. |
| ** | The price used to calculate market return (“Market Price’’) is determined by using the closing price listed on the NYSE Arca and does not represent returns an investor would receive if shares were traded at other times. Total returns are calculated using the daily 4:00pm midpoint between the bid and offer. Shares are bought and sold at market price, not NAV and are not individually redeemed from the Fund. |
The Bloomberg U.S. Aggregate Bond Index measures the performance of the U.S. investment grade bond market. One cannot invest directly in an index.
The BofA Merrill Lynch 1-5 Year U.S. Corporate & Government Bond Index tracks the performance of US dollar denominated investment grade debt publicly issued in the US domestic market, including US Treasury, US agency, foreign government, supranational and corporate securities, with a remaining term to final maturity less than 5 years, calculated on a total return basis. One cannot invest directly in an index.
ADVISORSHARES TRUST
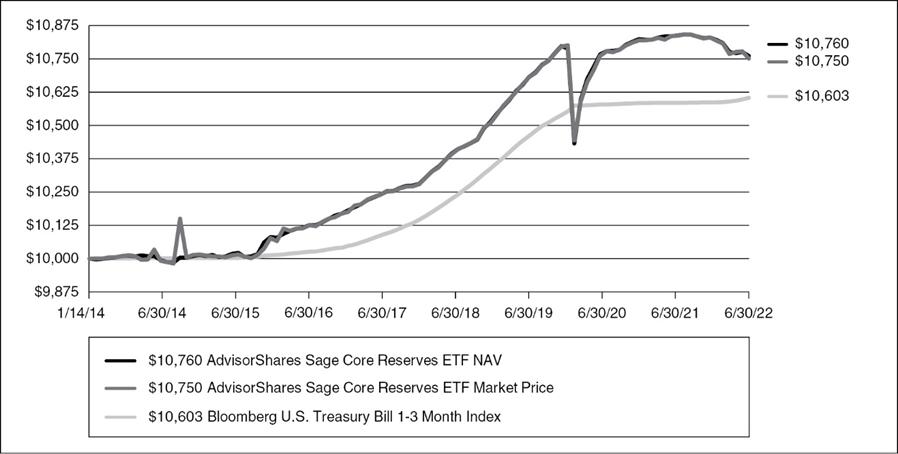
AdvisorShares North Square McKee Core Reserves ETF (HOLD)
C.S. McKee assumed the role of subadvisor for the AdvisorShares North Square McKee Core Reserves ETF (ticker: HOLD) November 1, 2021, continuing to manage it as a short-term maturity, investment grade fixed income portfolio. With market interest rates rising quickly in response to the Federal Reserve’s belated response to rising inflation and balancing the need for income with principal preservation, portfolio duration was managed to the low end of the fund’s stated 0.50 years to 1.25 years target range. Performance for the eight-month period ended June 30, 2022 was -0.76%.
Fund holdings include securitized (asset backed and commercial mortgage backed), corporate, agency, and Treasury bonds. Growing concerns for a mild recession lead us to maintain average quality of AA-, on par with the Fund’s long-term target. Asset backed securities, a consistent and significant allocation in the Fund, underperformed Treasuries in the first half of 2022, but have stabilized in third quarter.
We expect to see a further tightening in financial conditions in the second half of 2022 as the battle to contain inflation continues. We believe the Fed Funds rate should peak in the 3.75% to 4% range by early next year, an environment in which portfolio duration will likely be increased to approximately one year with a corresponding increase in yield.
HYPOTHETICAL GROWTH OF $10,000 INVESTMENT
For the period January 14, 2014* to June 30, 2022
HISTORICAL PERFORMANCE
Total Return as of June 30, 2022
| | | 1 Year | | | 3 Year | | | 5 Year | | | Since
Inception
1/14/2014* | |
| AdvisorShares North Square McKee Core Reserves ETF NAV | | | -0.68 | % | | | 0.41 | % | | | 1.06 | % | | | 0.87 | % |
| AdvisorShares North Square McKee Core Reserves ETF Market Price** | | | -0.76 | % | | | 0.39 | % | | | 1.04 | % | | | 0.86 | % |
| Bloomberg U.S. Treasury Bill 1-3 Month Index | | | 0.18 | % | | | 0.57 | % | | | 1.05 | % | | | 0.69 | % |
Performance data quoted represents past performance and is no guarantee of future results. Current performance may be lower or higher than the performance data quoted. Investment return and principal value will fluctuate so that an investor’s shares, when redeemed, may be worth more or less than original cost. Fund NAV returns are calculated using the Fund’s daily 4:00 p.m. NAV. Returns shown include the reinvestment of all dividends and other distributions. Index returns do not include expenses. As stated in the current prospectus, the Fund’s annual operating expense ratio (gross) is 0.57% and the net expense ratio is 0.35%. (Actual expenses can be referenced in the Financial Highlights section later in this report.) The Fund’s advisor has agreed to waive a portion of its fees and/or reimburse expenses to the extent necessary to keep the Fund’s expenses from exceeding 0.35%. Returns less than one year are not annualized. The performance table and graph do not reflect the deduction of taxes that a shareholder would pay on Fund distributions or the redemption of Fund shares. For the Fund’s most recent month end performance, please call 1-877-843-3831.
| * | Commencement of operations. |
| ** | The price used to calculate market return (“Market Price’’) is determined by using the closing price listed on the NYSE Arca and does not represent returns an investor would receive if shares were traded at other times. Total returns are calculated using the daily 4:00pm midpoint between the bid and offer. Shares are bought and sold at market price, not NAV and are not individually redeemed from the Fund. |
The Bloomberg U.S. Treasury Bill 1-3 Month Index includes all publicly issued zero-coupon U.S. Treasury Bills that have a remaining maturity of less than 3 months and more than 1 month, are rated investment grade, and have $250 million or more of outstanding face value. The Bloomberg U.S. 1-3 Month Treasury Bill Index is an unmanaged index considered representative of the performance of the U.S. Treasury Bill issued by the U.S. Government. One cannot invest directly in an index.
ADVISORSHARES TRUST
AdvisorShares North Square McKee ESG Core Bond ETF (MENV)
C.S. McKee assumed the role of subadvisor for AdvisorShares North Square McKee ESG Core Bond ETF (ticker: MENV) November 1, 2021, converting it to a core fixed income ESG* managed product employing our proprietary model. Fund performance for the period ended June 30, 2022 was largely driven by the significant rise in market interest rates and the corresponding increase in measured volatility. As inflation proved itself to be anything but transitory, the Federal Reserve belatedly took action to slow economic growth. The Fed Funds rate is expected to rise more than 3% from the previous low, tightening financial conditions.
The Fund’s overweight to the corporate and agency sectors adversely impacted returns as yield spreads versus Treasuries widened over this period. Investors generally reduced their allocation to fixed income or took less risk in the space, pressuring prices lower. The market began to find some balance in mid-June, with market interest rates peaking and investor demand for all areas of the bond market improving.
We expect to see a further tightening in financial conditions in the second half of 2022 as the battle to contain inflation continues. We believe the Fed Funds rate should peak in the 3.75% to 4% range by early next year, an environment in which market volatility should also top out. The portfolio’s significant overweight to callable securities (mortgage passthroughs and agency debentures) are expected to perform well in this scenario, boosting performance without assuming added credit risk.
| * | Environmental, social, and governance (ESG) criteria are a set of standards for a company’s operations that socially conscious investors use to screen potential investments. Environmental criteria consider how a company performs as a steward of nature. Social criteria examine how it manages relationships with employees, suppliers, customers, and the communities where it operates. Governance deals with a company’s leadership, executive pay, audits, internal controls, and shareholder rights. |
HYPOTHETICAL GROWTH OF $10,000 INVESTMENT
For the period June 30, 2012 to June 30, 2022
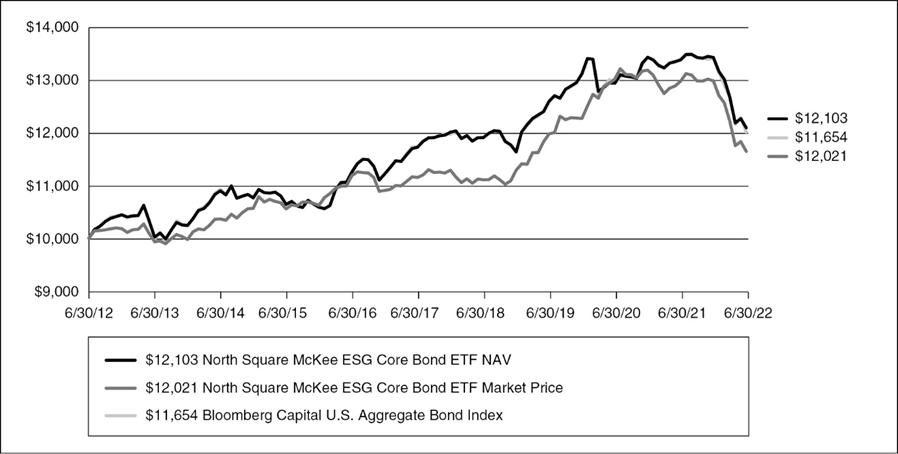
HISTORICAL PERFORMANCE
Total Return as of June 30, 2022
| | | 1 Year | | | 3 Year | | | 5 Year | | | 10 Year | |
| AdvisorShares North Square McKee ESG Core Bond ETF NAV | | | -9.67 | % | | | -1.36 | % | | | 0.62 | % | | | 1.93 | % |
| AdvisorShares North Square McKee ESG Core Bond ETF Market Price** | | | -10.29 | % | | | -1.57 | % | | | 0.47 | % | | | 1.86 | % |
| Bloomberg U.S. Aggregate Bond Index | | | -10.29 | % | | | -0.93 | % | | | 0.88 | % | | | 1.54 | % |
Performance data quoted represents past performance and is no guarantee of future results. Current performance may be lower or higher than the performance data quoted. Investment return and principal value will fluctuate so that an investor’s shares, when redeemed, may be worth more or less than original cost. Fund NAV returns are calculated using the Fund’s daily 4:00 p.m. NAV. Returns shown include the reinvestment of all dividends and other distributions. Index returns do not include expenses. As stated in the current prospectus, the Fund’s annual operating expense ratio (gross) is 1.89% and the net expense ratio is 0.47%. (Actual expenses can be referenced in the Financial Highlights section later in this report.) The Fund’s advisor has agreed to waive a portion of its fees and/or reimburse expenses to the extent necessary to keep the Fund’s expenses from exceeding 0.47%. Returns less than one year are not annualized. The performance table and graph do not reflect the deduction of taxes that a shareholder would pay on Fund distributions or the redemption of Fund shares. For the Fund’s most recent month end performance, please call 1-877-843-3831.
| * | The price used to calculate market return (“Market Price’’) is determined by using the closing price listed on the NYSE Arca and does not represent returns an investor would receive if shares were traded at other times. Total returns are calculated using the daily 4:00pm midpoint between the bid and offer. Shares are bought and sold at market price, not NAV and are not individually redeemed from the Fund. |
Bloomberg U.S. Aggregate Bond Index measures the performance of the U.S. investment grade bond market. One cannot invest directly in an index.
ADVISORSHARES TRUST
AdvisorShares Poseidon Dynamic Cannabis ETF (PSDN)
The AdvisorShares Poseidon Dynamic Cannabis ETF (ticker: PSDN) launched in November of 2021. Since its launch through the end of the second quarter of 2022, while its performance has been negative, PSDN has experienced new share creations totaling approximately $13.3 million of inflows. These inflows were despite incredibly challenging times in cannabis and broader markets. PSDN can actively use moderate levels of leverage, at portfolio management’s discretion, and had an average leverage position of 122% from its inception.
The cannabis sector largely peaked in February 2021 and has been negative for 18 consecutive months through the end of the second quarter of 2022. It is our belief that most of the decline is attributable to what now is proving to be previously overly optimistic expectations from the industry and the analysts. Predicting state-level or international regulatory progress on cannabis has been an extremely challenging exercise, as well as a big contributor to missed expectations and lowering guidance in 2021 through 2023.
As we enter the second half of 2022, growth in the cannabis sector is starting to reaccelerate with decelerating to stabilizing pricing trends in key markets along with new adult use access opening in many new markets, including New Jersey. Growth with low valuations creates a very compelling backdrop for the cannabis sector’s equity performance to potentially perform positively on an absolute basis and a relative basis compared to other equity sectors over the subsequent quarters and years ahead.
HYPOTHETICAL GROWTH OF $10,000 INVESTMENT
For the period November 17, 2021* to June 30, 2022
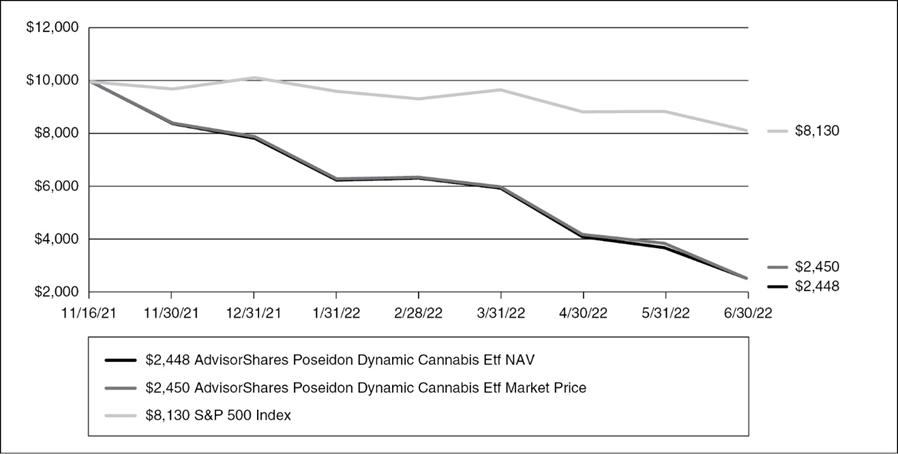
HISTORICAL PERFORMANCE
Total Return as of June 30, 2022
| | | Since
Inception
11/17/2021* | |
| AdvisorShares Poseidon Dynamic Cannabis ETF NAV | | | -75.52 | % |
| AdvisorShares Poseidon Dynamic Cannabis ETF Market Price** | | | -75.50 | % |
| S&P 500 Index | | | -18.70 | % |
Performance data quoted represents past performance and is no guarantee of future results. Current performance may be lower or higher than the performance data quoted. Investment return and principal value will fluctuate so that an investor’s shares, when redeemed, may be worth more or less than original cost. Fund NAV returns are calculated using the Fund’s daily 4:00 p.m. NAV. Returns shown include the reinvestment of all dividends and other distributions. Index returns do not include expenses. As stated in the current prospectus, the Fund’s annual operating expense ratio (gross) is 0.92% and the net expense ratio is 0.92%. (Actual expenses can be referenced in the Financial Highlights section later in this report.) The Fund’s advisor has agreed to waive a portion of its fees and/or reimburse expenses to the extent necessary to keep the Fund’s expenses from exceeding 0.99%. Returns less than one year are not annualized. The performance table and graph do not reflect the deduction of taxes that a shareholder would pay on Fund distributions or the redemption of Fund shares. For the Fund’s most recent month end performance, please call 1-877-843-3831.
| * | Commencement of operations. |
| ** | The price used to calculate market return (“Market Price’’) is determined by using the closing price listed on the NYSE Arca and does not represent returns an investor would receive if shares were traded at other times. Total returns are calculated using the daily 4:00pm midpoint between the bid and offer. Shares are bought and sold at market price, not NAV and are not individually redeemed from the Fund. |
The S&P 500 Index is a broad-based, unmanaged measurement of changes in stock market conditions based on the average of 500 widely held common stocks. One cannot invest directly in an index.
ADVISORSHARES TRUST
AdvisorShares Psychedelics ETF (PSIL)
The AdvisorShares Psychedelics ETF (ticker: PSIL) launched with an inception date of September 15, 2021. Through June 30, 2022, it has just over 9 months of performance. Since the Fund’s launch, its performance has been quite volatile and overall negative. The psychedelics market is a very new and concentrated area made up of only a small universe of mostly micro-cap securities.
The psychedelic industry should be expected to be extremely volatile. Psychedelic companies are primarily mental health-related biotech and pharmaceutical companies. The value of such corporations is primarily based of intellectual property and drug or treatment pipelines. After negative performance in the past year, we feel psychedelics offer great potential for long term investors who understand the risk of a new and very nascent industry.
HYPOTHETICAL GROWTH OF $10,000 INVESTMENT
For the period September 16, 2021* to June 30, 2022
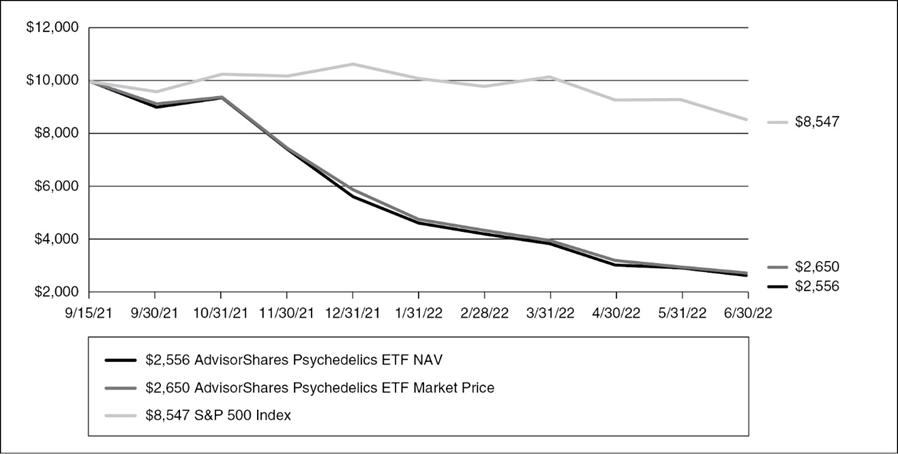
HISTORICAL PERFORMANCE
Total Return as of June 30, 2022
| | | Since
Inception
9/16/2021* | |
| AdvisorShares Psychedelics ETF NAV | | | -74.44 | % |
| AdvisorShares Psychedelics ETF Market Price** | | | -73.50 | % |
| S&P 500 Index | | | -14.53 | % |
Performance data quoted represents past performance and is no guarantee of future results. Current performance may be lower or higher than the performance data quoted. Investment return and principal value will fluctuate so that an investor’s shares, when redeemed, may be worth more or less than original cost. Fund NAV returns are calculated using the Fund’s daily 4:00 p.m. NAV. Returns shown include the reinvestment of all dividends and other distributions. Index returns do not include expenses. As stated in the current prospectus, the Fund’s annual operating expense ratio (gross) is 0.68% and the net expense ratio is 0.68%. (Actual expenses can be referenced in the Financial Highlights section later in this report.) The Fund’s advisor has agreed to waive a portion of its fees and/or reimburse expenses to the extent necessary to keep the Fund’s expenses from exceeding 0.99%. Returns less than one year are not annualized. The performance table and graph do not reflect the deduction of taxes that a shareholder would pay on Fund distributions or the redemption of Fund shares. For the Fund’s most recent month end performance, please call 1-877-843-3831.
| * | Commencement of operations. |
| ** | The price used to calculate market return (“Market Price’’) is determined by using the closing price listed on the NYSE Arca and does not represent returns an investor would receive if shares were traded at other times. Total returns are calculated using the daily 4:00pm midpoint between the bid and offer. Shares are bought and sold at market price, not NAV and are not individually redeemed from the Fund. |
The S&P 500 Index is a broad-based, unmanaged measurement of changes in stock market conditions based on the average of 500 widely held common stocks. One cannot invest directly in an index.
ADVISORSHARES TRUST
AdvisorShares Pure Cannabis ETF (YOLO)
The AdvisorShares Pure Cannabis ETF (ticker: YOLO) was negative over the past fiscal year as was all the cannabis sector. In the prior fiscal year ending in June of 2021, the Fund positively outperformed the S&P 500 Index. An investment in the cannabis industry should be expected to be very volatile.
Over the past year, cannabis stocks have pulled back after reaching a high point in February 2021 following U.S. elections that caused expectations of some form of cannabis legalization. Actual Federal cannabis reform has been slow to develop. For the period July 1, 2021 through fiscal year ended June 30, 2022, YOLO lost more than 73% on its market price and net asset value.
As a specialty area of investing, cannabis stocks as a group can perform with low correlation to the overall broader market. Many investors feel that the cannabis industry’s success lies with Federal law reform in the U.S. Following a rather constant sell-off and underperformance over the past year (and longer), we are very bullish long-term for the cannabis market’s growth prospects from current under-valued prices and anticipate major legislative reform and market development in the cannabis industry.
HYPOTHETICAL GROWTH OF $10,000 INVESTMENT
For the period April 17, 2019* to June 30, 2022
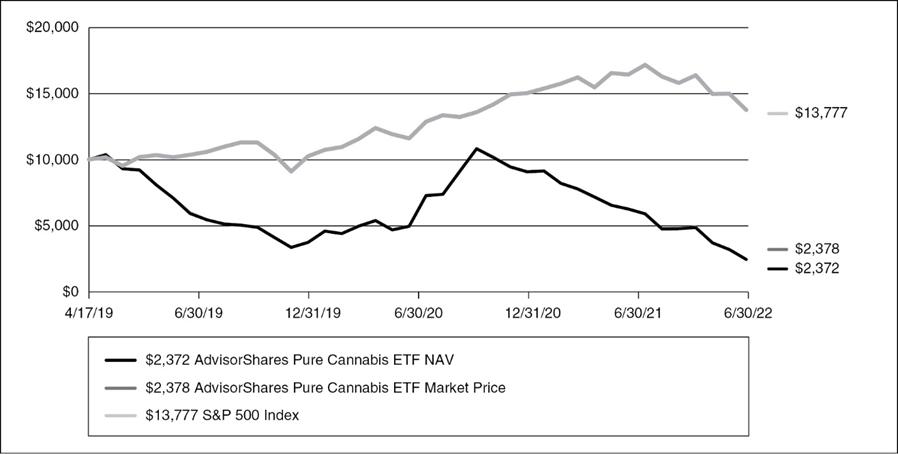
HISTORICAL PERFORMANCE
Total Return as of June 30, 2022
| | | 1 Year | | | 3 Year | | | Since
Inception
4/17/2019* | |
| AdvisorShares Pure Cannabis ETF NAV | | | -73.99 | % | | | -36.34 | % | | | -36.19 | % |
| AdvisorShares Pure Cannabis ETF Market Price** | | | -73.93 | % | | | -36.32 | % | | | -36.14 | % |
| S&P 500 Index | | | -10.62 | % | | | 10.60 | % | | | 10.52 | % |
Performance data quoted represents past performance and is no guarantee of future results. Current performance may be lower or higher than the performance data quoted. Investment return and principal value will fluctuate so that an investor’s shares, when redeemed, may be worth more or less than original cost. Fund NAV returns are calculated using the Fund’s daily 4:00 p.m. NAV. Returns shown include the reinvestment of all dividends and other distributions. Index returns do not include expenses. As stated in the current prospectus, the Fund’s annual operating expense ratio (gross) is 0.76% and net expense ratio is 0.71%. (Actual expenses can be referenced in the Financial Highlights section later in this report.) The Fund’s advisor has agreed to waive a portion of its fees and/or reimburse expenses to the extent necessary to keep the Fund’s expenses from exceeding 0.74%. Returns less than one year are not annualized. The performance table and graph do not reflect the deduction of taxes that a shareholder would pay on Fund distributions or the redemption of Fund shares. For the Fund’s most recent month end performance, please call 1-877-843-3831.
| * | Commencement of operations. |
| ** | The price used to calculate market return (“Market Price’’) is determined by using the closing price listed on the NYSE Arca and does not represent returns an investor would receive if shares were traded at other times. Total returns are calculated using the daily 4:00pm midpoint between the bid and offer. Shares are bought and sold at market price, not NAV and are not individually redeemed from the Fund. |
The S&P 500 Index is a broad-based, unmanaged measurement of changes in stock market conditions based on the average of 500 widely held common stocks. One cannot invest directly in an index.
ADVISORSHARES TRUST
AdvisorShares Pure US Cannabis ETF (MSOS)
After launching in the Fall of 2020, the AdvisorShares Pure US Cannabis ETF (ticker: MSOS) has completed its first full fiscal year of performance. As should be expected for a focused U.S.-only cannabis fund, performance has been extremely volatile since its inception. In the past year, the Fund’s performance has been negative. After reaching a high point in February of 2021, cannabis stocks, as a group, have been beaten down as U.S. cannabis law reforms were slower to develop than investors expected. The lack of Federal cannabis reform impacts U.S. cannabis stock prices in many ways as they trade on secondary exchanges in Canada and OTC (over the counter) in the U.S. and face trading availability limitations in U.S. bank and brokerage firms. As the Fund is 100% U.S.-focused, it is more susceptible to volatility based on U.S. cannabis laws and potential changes to those laws.
The Fund’s future performance is expected to be affected by continued growth in state-by-state U.S. cannabis sales and could be greatly impacted by anticipated Federal reforms in cannabis laws. From the current price levels, we are very bullish on U.S. cannabis market and the eventuality of cannabis-positive changes in U.S. Federal laws.
HYPOTHETICAL GROWTH OF $10,000 INVESTMENT
For the period September 1, 2020* to June 30, 2022
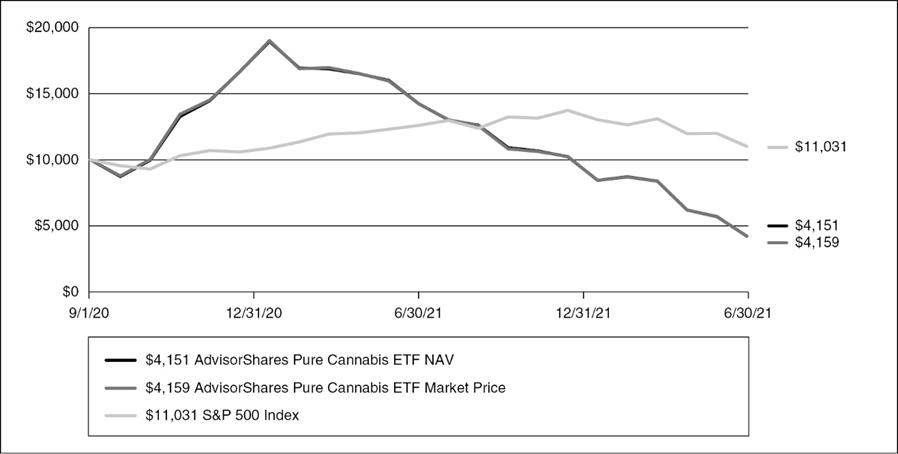
HISTORICAL PERFORMANCE
Total Return as of June 30, 2022
| | | 1 Year | | | Since
Inception
9/1/2020* | |
| AdvisorShares Pure US Cannabis ETF NAV | | | -74.20 | % | | | -38.19 | % |
| AdvisorShares Pure US Cannabis ETF Market Price** | | | -74.06 | % | | | -38.12 | % |
| S&P 500 Index | | | -10.62 | % | | | 5.52 | % |
Performance data quoted represents past performance and is no guarantee of future results. Current performance may be lower or higher than the performance data quoted. Investment return and principal value will fluctuate so that an investor’s shares, when redeemed, may be worth more or less than original cost. Fund NAV returns are calculated using the Fund’s daily 4:00 p.m. NAV. Returns shown include the reinvestment of all dividends and other distributions. Index returns do not include expenses. As stated in the current prospectus, the Fund’s annual operating expense ratio (gross) is 0.73% and net expense ratio is 0.73%. (Actual expenses can be referenced in the Financial Highlights section later in this report.) The Fund’s advisor has agreed to waive a portion of its fees and/or reimburse expenses to the extent necessary to keep the Fund’s expenses from exceeding 0.74%. Returns less than one year are not annualized. The performance table and graph do not reflect the deduction of taxes that a shareholder would pay on Fund distributions or the redemption of Fund shares. For the Fund’s most recent month end performance, please call 1-877-843-3831.
| * | Commencement of operations. |
| ** | The price used to calculate market return (“Market Price’’) is determined by using the closing price listed on the NYSE Arca and does not represent returns an investor would receive if shares were traded at other times. Total returns are calculated using the daily 4:00pm midpoint between the bid and offer. Shares are bought and sold at market price, not NAV and are not individually redeemed from the Fund. |
The S&P 500 Index is a broad-based, unmanaged measurement of changes in stock market conditions based on the average of 500 widely held common stocks. One cannot invest directly in an index.
ADVISORSHARES TRUST
AdvisorShares Q Dynamic Growth ETF (QPX)
During the past fiscal year (July 1, 2021 – June 30, 2022), the AdvisorShares Q Dynamic Growth ETF’s (ticker: QPX) assets under management (AUM) started at $68.7M, grew to $120M (+74%) at its peak, and finished at a value of $40.2M (-67%). Corresponding prices (NAV) were from $28.12 to a high of $31.02 (+11%), down to $22.01 (-29%). While there is a correlation between price and AUM, the change in AUM appears to have been driven by other factors (potentially, clients not wanting to be long equities during the first half of the year). Over the past twelve months, QPX finished behind its benchmark, the S&P 500 Index.
QPX’s investment model stayed heavily weighted in large cap stocks and the technology sector throughout the period. This exposure has a much higher risk/reward characteristics than other segments of the market (per our model). Many contributing factors were at play, most importantly, the breakdown in performance of portfolio holding Invesco NASDAQ Internet ETF (ticker: PNQI) during the 4th quarter of 2021. It was replaced by iShares U.S. Technology ETF (ticker: IYW) according to QPX’s quantitative process. Other factors were the sudden rise in interest rates and inflation worries.
There were no risk-off rebalancing trades triggered by the model’s QIX index, which saw its value fluctuate from 12.93% to 31.7%, approaching but never passing the key 37.5% rebalancing level. The lion’s share of the portfolio exposure remains in large cap growth and the technology sector.
HYPOTHETICAL GROWTH OF $10,000 INVESTMENT
For the period December 28, 2020* to June 30, 2022
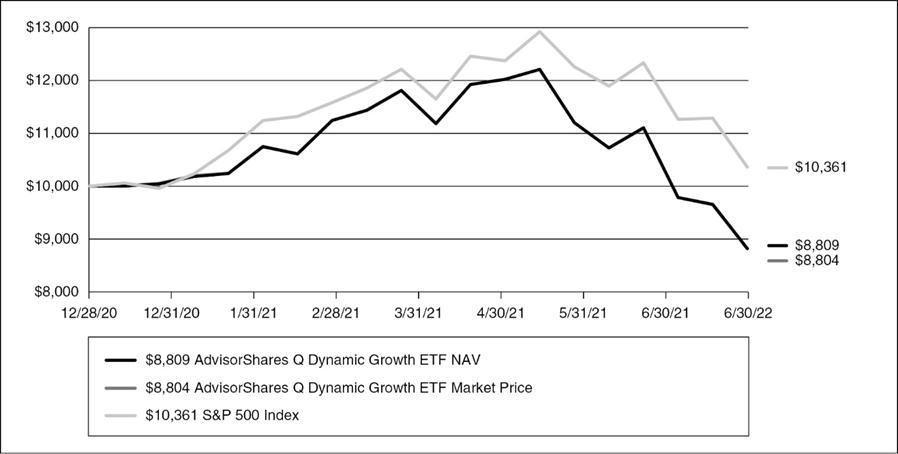
HISTORICAL PERFORMANCE
Total Return as of June 30, 2022
| | | 1 Year | | | Since
Inception
12/28/2020* | |
| AdvisorShares Q Dynamic Growth ETF NAV | | | -21.70 | % | | | -8.09 | % |
| AdvisorShares Q Dynamic Growth ETF Market Price** | | | -21.76 | % | | | -8.12 | % |
| S&P 500 Index | | | -10.62 | % | | | 2.38 | % |
Performance data quoted represents past performance and is no guarantee of future results. Current performance may be lower or higher than the performance data quoted. Investment return and principal value will fluctuate so that an investor’s shares, when redeemed, may be worth more or less than original cost. Fund NAV returns are calculated using the Fund’s daily 4:00 p.m. NAV. Returns shown include the reinvestment of all dividends and other distributions. Index returns do not include expenses. As stated in the current prospectus, the Fund’s annual operating expense ratio (gross) is 1.72% and net expense ratio is 1.68%. (Actual expenses can be referenced in the Financial Highlights section later in this report.) The Fund’s advisor has agreed to waive a portion of its fees and/or reimburse expenses to the extent necessary to keep the Fund’s expenses from exceeding 1.45%. Returns less than one year are not annualized. The performance table and graph do not reflect the deduction of taxes that a shareholder would pay on Fund distributions or the redemption of Fund shares. For the Fund’s most recent month end performance, please call 1-877-843-3831.
| * | Commencement of operations. |
| ** | The price used to calculate market return (“Market Price’’) is determined by using the closing price listed on the NYSE Arca and does not represent returns an investor would receive if shares were traded at other times. Total returns are calculated using the daily 4:00pm midpoint between the bid and offer. Shares are bought and sold at market price, not NAV and are not individually redeemed from the Fund. |
The S&P 500 Index is a broad-based, unmanaged measurement of changes in stock market conditions based on the average of 500 widely held common stocks. One cannot invest directly in an index.
ADVISORSHARES TRUST
AdvisorShares Q Portfolio Blended Allocation ETF (QPT)
During the past fiscal year (July1, 2021 – June 30, 2022), the AdvisorShares Q Portfolio Balanced Allocation ETF’s (ticker: QPT) assets under management (AUM) started at $3.48M and finished at a value of $2.68M (-23%). Corresponding prices (NAV) were from $25.76 and down to $22.60 (-12%), respectively. While there is a correlation between price and AUM, the change in AUM appears to have been driven by other factors. Over the last twelve months, QPT finished behind its blended benchmark – 60% S&P 500 Index / 40% Bloomberg Aggregate Bond Index.
The sudden rise in interest rates and inflation worries were contributing factors to QPT’s negative performance. There were no risk-off rebalancing trades triggered by the model’s QIX index, which saw its value fluctuate from 12.93% to 31.7%, approaching but never passing the key 37.5% rebalancing level. QPT has maintained exposure to a diversified group of asset classes such as gold, long-term bonds and stocks in the amounts that the model identifies as optimum in terms of expected reward for the risk taken.
HYPOTHETICAL GROWTH OF $10,000 INVESTMENT
For the period December 28, 2020* to June 30, 2022
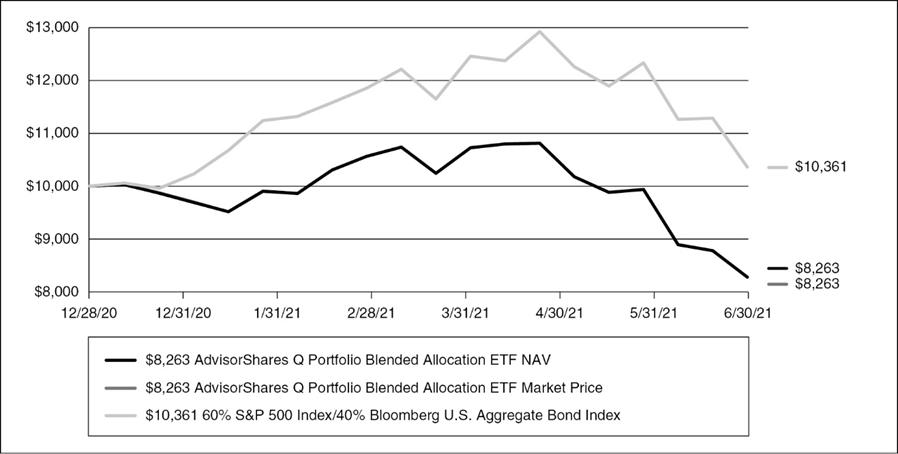
HISTORICAL PERFORMANCE
Total Return as of June 30, 2022
| | | 1 Year | | | Since
Inception
12/28/2020* | |
| AdvisorShares Q Portfolio Blended Allocation ETF NAV | | | -19.83 | % | | | -11.91 | % |
| AdvisorShares Q Portfolio Blended Allocation ETF Market Price** | | | -19.81 | % | | | -11.91 | % |
| 60% S&P 500 Index/40% Bloomberg U.S. Aggregate Bond Index | | | -10.24 | % | | | -1.61 | % |
Performance data quoted represents past performance and is no guarantee of future results. Current performance may be lower or higher than the performance data quoted. Investment return and principal value will fluctuate so that an investor’s shares, when redeemed, may be worth more or less than original cost. Fund NAV returns are calculated using the Fund’s daily 4:00 p.m. NAV. Returns shown include the reinvestment of all dividends and other distributions. Index returns do not include expenses. As stated in the current prospectus, the Fund’s annual operating expense ratio (gross) and net expense ratio is 1.19%. (Actual expenses can be referenced in the Financial Highlights section later in this report.) The Fund’s advisor has agreed to waive a portion of its fees and/or reimburse expenses to the extent necessary to keep the Fund’s expenses from exceeding 0.99%. Returns less than one year are not annualized. The performance table and graph do not reflect the deduction of taxes that a shareholder would pay on Fund distributions or the redemption of Fund shares. For the Fund’s most recent month end performance, please call 1-877-843-3831.
| * | Commencement of operations. |
| ** | The price used to calculate market return (“Market Price’’) is determined by using the closing price listed on the NYSE Arca and does not represent returns an investor would receive if shares were traded at other times. Total returns are calculated using the daily 4:00pm midpoint between the bid and offer. Shares are bought and sold at market price, not NAV and are not individually redeemed from the Fund. |
The S&P 500 Index is a broad-based, unmanaged measurement of changes in stock market conditions based on the average of 500 widely held common stocks. The Bloomberg U.S. Aggregate Bond TR USD Index is an unmanaged index considered representative of the performance of the U.S. investment grade bond market. One cannot invest directly in an index.
ADVISORSHARES TRUST
AdvisorShares Ranger Equity Bear ETF (HDGE)
For the year ended June 30, 2022, the AdvisorShares Ranger Equity Bear ETF (ticker: HDGE) performed 38.48% (NAV) versus the S&P 500’s total return of -10.62%.
After an historic influx of liquidity to negate the economic impacts of COVID, the market has begun reverting course. The liquidity situation is now unfavorable. Historic inflation levels have led to tightening by the Federal Reserve. Liquidity has been withdrawn from its balance sheet. Corporations have begun to pare back stock buyback activity. The IPO market has softened. Hyped areas such as SPACs have seen the air deflate out of the sector. As a result, the market has started to differentiate “good” companies from “bad” ones and there is less of a sentiment that “a rising tide lifts all boats.” This situation is largely the first break from when the bull market started in 2009.
The differentiation in quality has benefited HDGE. The Fund focuses on the lowest quality companies with respect to earnings quality, cash flow generation, and strength of balance sheet. In our opinion, this current situation may persist for some time.
Typically, rallies when the market is under pressure are very powerful. Low quality stocks can bounce hard compared with the indexes. However, as long as the liquidity situation remains unfavorable, these stocks tend to trend down over time. This situation benefits the fund’s strategy. We expect continued volatility above norms and higher than average trading activity going forward.
HYPOTHETICAL GROWTH OF $10,000 INVESTMENT
For the period June 30, 2012 to June 30, 2022
HISTORICAL PERFORMANCE
Total Return as of June 30, 2022
| | | 1 Year | | | 3 Year | | | 5 Year | | | 10 Year | |
| AdvisorShares Ranger Equity Bear ETF NAV | | | 38.48 | % | | | -20.63 | % | | | -17.91 | % | | | -18.04 | % |
| AdvisorShares Ranger Equity Bear ETF Market Price* | | | 38.96 | % | | | -20.56 | % | | | -17.83 | % | | | -18.01 | % |
| S&P 500 Index | | | -10.62 | % | | | 10.60 | % | | | 11.31 | % | | | 12.96 | % |
Performance data quoted represents past performance and is no guarantee of future results. Current performance may be lower or higher than the performance data quoted. Investment return and principal value will fluctuate so that an investor’s shares, when redeemed, may be worth more or less than original cost. Fund NAV returns are calculated using the Fund’s daily 4:00 p.m. NAV. Returns shown include the reinvestment of all dividends and other distributions. Index returns do not include expenses. As stated in the current prospectus, the Fund’s annual operating expense ratio (gross) and net expense ratio is 5.20%. (Actual expenses can be referenced in the Financial Highlights section later in this report.) The Fund’s advisor has agreed to waive a portion of its fees and/or reimburse expenses to the extent necessary to keep the Fund’s expenses from exceeding 1.85%. Returns less than one year are not annualized. The performance table and graph do not reflect the deduction of taxes that a shareholder would pay on Fund distributions or the redemption of Fund shares. For the Fund’s most recent month end performance, please call 1-877-843-3831.
| * | The price used to calculate market return (“Market Price’’) is determined by using the closing price listed on the NYSE Arca and does not represent returns an investor would receive if shares were traded at other times. Total returns are calculated using the daily 4:00pm midpoint between the bid and offer. Shares are bought and sold at market price, not NAV and are not individually redeemed from the Fund. |
The S&P 500 Index is a broad-based, unmanaged measurement of changes in stock market conditions based on the average of 500 widely held common stocks. One cannot invest directly in an index.
ADVISORSHARES TRUST
AdvisorShares Restaurant ETF (EATZ)
The AdvisorShares Restaurant ETF (ticker: EATZ) launched in April of 2021 and has just completed its first full fiscal year of performance. Over the past year, the Fund has lost value and underperformed the overall market as restaurants overall have faced numerous challenges. The industry suffered greatly in recent years from COVID-19, but in the past 12 months, labor shortages and increased employee turnover have impacted restaurants more than most areas. Supply chain issues and overall inflation costs added pressure to restaurant businesses.
Even while the Fund’s overall performance is tied to the success of the restaurant industry, we aim for relative outperformance through individual security selection within the restaurant area. The Fund is meant for investors with a long-term focus. We are bullish about the future growth prospects of the restaurant industry as world economic conditions improve and employment and supply chain issues stabilize.
HYPOTHETICAL GROWTH OF $10,000 INVESTMENT
For the period April 20, 2021* to June 30, 2022
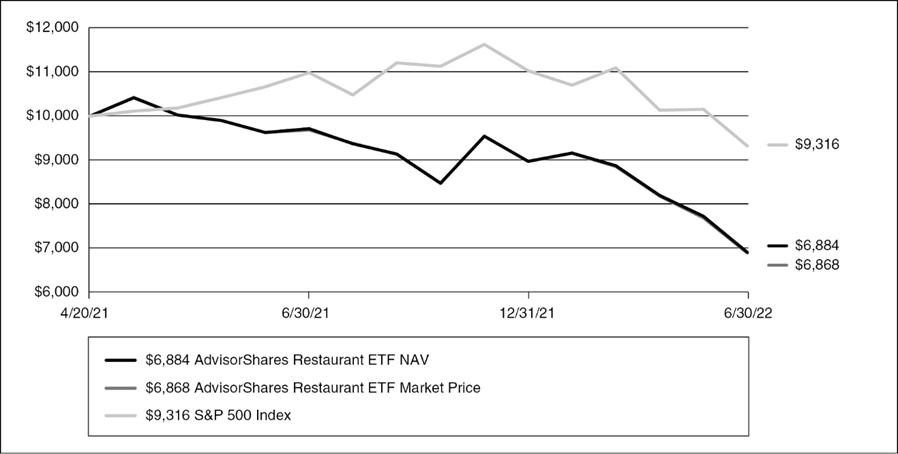
HISTORICAL PERFORMANCE
Total Return as of June 30, 2022
| | | 1 Year | | | Since
Inception
4/20/2021* | |
| AdvisorShares Restaurant NAV | | | -30.46 | % | | | -26.84 | % |
| AdvisorShares Restaurant ETF Market Price** | | | -30.62 | % | | | -26.99 | % |
| S&P 500 Index | | | -10.62 | % | | | -5.76 | % |
Performance data quoted represents past performance and is no guarantee of future results. Current performance may be lower or higher than the performance data quoted. Investment return and principal value will fluctuate so that an investor’s shares, when redeemed, may be worth more or less than original cost. Fund NAV returns are calculated using the Fund’s daily 4:00 p.m. NAV. Returns shown include the reinvestment of all dividends and other distributions. Index returns do not include expenses. As stated in the current prospectus, the Fund’s annual operating expense ratio (gross) is 0.99% and the net expense ratio is 0.99%. (Actual expenses can be referenced in the Financial Highlights section later in this report.) The Fund’s advisor has agreed to waive a portion of its fees and/or reimburse expenses to the extent necessary to keep the Fund’s expenses from exceeding 0.99%. Returns less than one year are not annualized. The performance table and graph do not reflect the deduction of taxes that a shareholder would pay on Fund distributions or the redemption of Fund shares. For the Fund’s most recent month end performance, please call 1-877-843-3831.
| * | Commencement of operations. |
| ** | The price used to calculate market return (“Market Price’’) is determined by using the closing price listed on the NYSE Arca and does not represent returns an investor would receive if shares were traded at other times. Total returns are calculated using the daily 4:00pm midpoint between the bid and offer. Shares are bought and sold at market price, not NAV and are not individually redeemed from the Fund. |
The S&P 500 Index is a broad-based, unmanaged measurement of changes in stock market conditions based on the average of 500 widely held common stocks. One cannot invest directly in an index.
ADVISORSHARES TRUST
AdvisorShares STAR Global Buy-Write ETF (VEGA)
The AdvisorShares STAR Global Buy-Write ETF (ticker: VEGA) finished the fiscal year ended June 30, 2022, with a return of -12.64% (NAV). The first part of this year was the worst first half of a year for U.S. equity markets since 1970 and the worst start ever for broad fixed income markets. Most of the loss (-12.06%) came during the last quarter of the period as the markets struggled due to the war in Ukraine, inflation, and recession fears. While there was no place to hide, the use of options helped to reduce the overall loss. VEGA’s U.S. Equity exposure at the end of the period was approximately 48%. In addition to U.S. Equity, VEGA had exposure to Fixed Income and Emerging and Developed Foreign Markets.
During the previous 12 months, VEGA completed quite a few tactical shifts. In Q3 2021 both Global Technology and Short-Term High Yield were eliminated from the portfolio in favor of U.S. Energy and U.S. Inflation Protected Treasuries. In the middle of the Fourth Quarter of 2021, we reduced or eliminated our exposure to EAFE, Small-Caps, US Energy and Technology and increased our exposure to the Mid-Caps, U.S. Treasuries and Core Bonds. VEGA continues to sell Covered Calls* and hold Protective Puts when deemed inexpensive to do so. ** As the markets declined, we increased our coverage exposure to 85% of the S&P and during Q2 2022 we were able to roll out of our Covered Calls and resell them multiple times to capture increased premium. In addition, we rolled out of our Protective puts; however, due to increased volatility and high cost we did not repurchase them. The increase in call coverage and our cash position helped to manage the risk of the portfolio.
While the last few months have been challenging for the Equity and Fixed Income Markets and the possibility of a recession is being raised, we remain focused on managing VEGA’s portfolio for long-term investors. We believe the outlook for future returns may have improved. Bear markets don’t last forever and tend to be only half the length of bull markets. Historically, while the average bear market has delivered a 41% decline, the average bull market has delivered a 162% increase. Recessions are also temporary. Unless you are an expert recession-timer, it makes sense over the long run to stay positioned for the good times. Further, markets tend to move before recessions, both on the way in and the way out. You certainly don’t want to miss markets on the way back up. Remember that markets have yet to fail to make it back to their prior peak and timing the market as to when to get back in is difficult at best. We continue to believe there is value in a globally diversified balanced equity portfolio. While Equity Markets had been on an uninterrupted bull run since November of 2020, the S&P 500 Index has historically experienced an average intra-year drop of 14.3% each year since 1980. We were due for a correction. Lastly, our use of Options and Fixed Income can provide alternative sources of income and help manage risk.
HYPOTHETICAL GROWTH OF $10,000 INVESTMENT
For the period September 17, 2012* to June 30, 2022
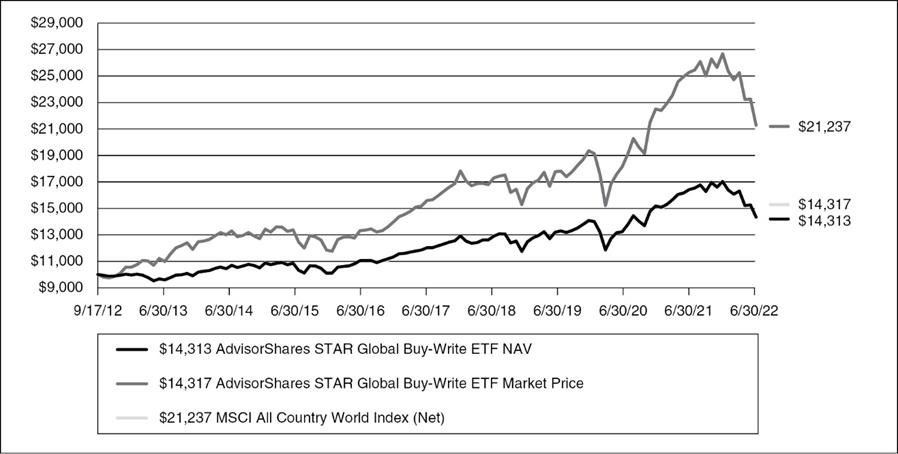
HISTORICAL PERFORMANCE
Total Return as of June 30, 2022
| | | 1 Year | | | 3 Year | | | 5 Year | | | Since
Inception
9/17/2012* | |
| AdvisorShares STAR Global Buy-Write ETF NAV | | | -12.64 | % | | | 2.78 | % | | | 3.87 | % | | | 3.73 | % |
| AdvisorShares STAR Global Buy-Write ETF Market Price** | | | -12.60 | % | | | 2.89 | % | | | 3.87 | % | | | 3.74 | % |
| MSCI All Country World Index (Net) | | | -15.75 | % | | | 6.21 | % | | | 7.00 | % | | | 8.00 | % |
Performance data quoted represents past performance and is no guarantee of future results. Current performance may be lower or higher than the performance data quoted. Investment return and principal value will fluctuate so that an investor’s shares, when redeemed, may be worth more or less than original cost. Fund NAV returns are calculated using the Fund’s daily 4:00 p.m. NAV. Returns shown include the einvestment of all dividends and other distributions. Index returns do not include expenses. As stated in the current prospectus, the Fund’s annual operating expense ratio (gross) is 2.65% and the net expense ratio is 2.02%. (Actual expenses can be referenced in the Financial Highlights section later in this report.) The Fund’s advisor has agreed to waive a portion of its fees and/or reimburse expenses to the extent necessary to keep the Fund’s expenses from exceeding 1.85%. Returns less than one year are not annualized. The performance table and graph do not reflect the deduction of taxes that a shareholder would pay on Fund distributions or the redemption of Fund shares. For the Fund’s most recent month end performance, please call 1-877-843-3831.
| * | Commencement of operations. |
| ** | The price used to calculate market return (“Market Price’’) is determined by using the closing price listed on the NYSE Arca and does not represent returns an investor would receive if shares were traded at other times. Total returns are calculated using the daily 4:00pm midpoint between the bid and offer. Shares are bought and sold at market price, not NAV and are not individually redeemed from the Fund. |
The MSCI All Country World Index (Net) is an unmanaged free float-adjusted market capitalization weighted index that is designed to measure the equity market performance of developed and emerging markets. One cannot invest directly in an index.
ADVISORSHARES TRUST
AdvisorShares Vice ETF (VICE)
The AdvisorShares Vice ETF (ticker: VICE) somewhat underperformed the overall market as measured by the S&P 500 Index for the 12-month timeframe of July 1, 2021, through June 30, 2022. The opposite had been true in the previous fiscal year with VICE outperforming the S&P 500 Index for the 12 months ended June 30, 2021.
The Vice ETF’s investments in casinos, video gaming, hospitality and entertainment weighed negatively on performance along with the overall market being negative in 2022. Over a longer period of time, we often expect investments areas such as alcohol and tobacco to be less volatile and to hold up better in negative markets.
As the overall market remains unpredictable in mid-2022 with inflation, supply chain and employment issues weighing on the economy, we believe that alcohol, gaming, entertainment, and other vice-oriented stocks continue to be attractive and show “market-resistant” qualities. We expect the Vice ETF to perform with less volatility than the overall market and certain vice-oriented stocks to offer positive growth regardless of overall market conditions.
While the Fund’s overall performance is largely tied to the areas of alcohol, gambling, online gaming, and food, we seek relative outperformance through good individual security selection and successful trading techniques.
HYPOTHETICAL GROWTH OF $10,000 INVESTMENT
For the period December 12, 2017* to June 30, 2022
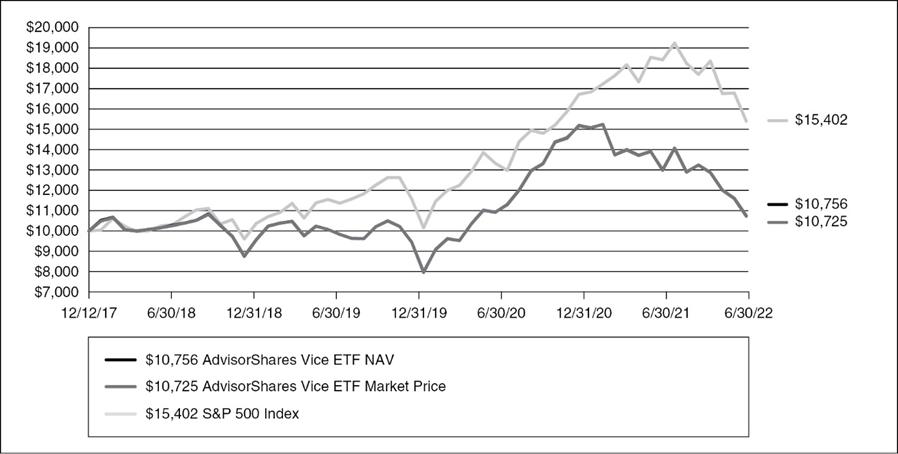
HISTORICAL PERFORMANCE
Total Return as of June 30, 2022
| | | 1 Year | | | 3 Year | | | Since
Inception
12/12/2017* | |
| AdvisorShares VICE ETF NAV | | | -29.45 | % | | | 1.67 | % | | | 1.61 | % |
| AdvisorShares VICE ETF Market Price** | | | -29.62 | % | | | 1.56 | % | | | 1.55 | % |
| S&P 500 Index | | | -10.62 | % | | | 10.60 | % | | | 9.96 | % |
Performance data quoted represents past performance and is no guarantee of future results. Current performance may be lower or higher than the performance data quoted. Investment return and principal value will fluctuate so that an investor’s shares, when redeemed, may be worth more or less than original cost. Fund NAV returns are calculated using the Fund’s daily 4:00 p.m. NAV. Returns shown include the reinvestment of all dividends and other distributions. Index returns do not include expenses. As stated in the current prospectus, the Fund’s annual operating expense ratio (gross) is 1.71% and the net expense ratio is 0.99%. (Actual expenses can be referenced in the Financial Highlights section later in this report.) The Fund’s advisor has agreed to waive a portion of its fees and/or reimburse expenses to the extent necessary to keep the Fund’s expenses from exceeding 0.99%. Returns less than one year are not annualized. The performance table and graph do not reflect the deduction of taxes that a shareholder would pay on Fund distributions or the redemption of Fund shares. For the Fund’s most recent month end performance, please call 1-877-843-3831.
| * | Commencement of operations. |
| ** | The price used to calculate market return (“Market Price’’) is determined by using the closing price listed on the NYSE Arca and does not represent returns an investor would receive if shares were traded at other times. Total returns are calculated using the daily 4:00pm midpoint between the bid and offer. Shares are bought and sold at market price, not NAV and are not individually redeemed from the Fund. |
The S&P 500 Index is a broad-based, unmanaged measurement of changes in stock market conditions based on the average of 500 widely held common stocks. One cannot invest directly in an index.
ADVISORSHARES TRUST
Shareholder Expense Examples (unaudited)
As a shareholder of a Fund, you incur transaction costs and ongoing costs, including management fees and other Fund expenses. The following example is intended to help you understand your ongoing costs (in dollars and cents) of investing in a Fund and to compare these costs with the ongoing costs of investing in other funds. The examples are based on an initial investment of $1,000 invested at January 1, 2022 and held for the period ended June 30, 2022, unless noted below for Funds not in operations for the full six month period.
Actual Expenses
The first line under each Fund in the table below provides information about actual account values and actual expenses. You may use the information, together with the amount you invested, to estimate the expenses that you incurred over the period. Simply divide your account value by $1,000 (for example, an $8,600 account value divided by $1,000 = 8.6), then multiply the result by the number under the heading entitled “Expenses Paid” to estimate the expenses attributable to your account during this period.
Hypothetical Example for Comparison Purposes
The second line under each Fund in the table provides information about hypothetical account values and hypothetical expenses based on the Fund’s actual expense ratio and an assumed rate of return of 5% per year before expenses, which is not the Fund’s actual return. The hypothetical account values and expenses may not be used to estimate the actual ending account balance or expenses for the period. You may use this information to compare the ongoing costs of investing in the Funds and other ETF funds. To do so, compare this 5% hypothetical example with the 5% hypothetical examples that appear in the shareholder reports of other funds.
Please note that the expenses shown in the table are meant to highlight your ongoing costs only and do not reflect any transactional costs. Therefore, the hypothetical example is useful in comparing ongoing costs only, and will not help you determine the relative total costs of owning different funds.
In addition, if these transactional costs were included, your costs would have been higher.
| Fund Name | | Beginning
Account
Value
1/1/2022 | | | Ending
Account
Value
6/30/2022 | | | Annualized
Expense
Ratio for the
Period | | | Expenses
Paid | |
| AdvisorShares Alpha DNA Equity Sentiment ETF | | | | | | | | | | | | | | | | |
| Actual | | $ | 1,000.00 | | | $ | 753.80 | | | | 1.02 | % | | $ | 4.44 | (1) |
| Hypothetical (assuming a 5% return before expenses) | | $ | 1,000.00 | | | $ | 1,019.74 | | | | 1.02 | % | | $ | 5.11 | |
| AdvisorShares Dorsey Wright ADR ETF | | | | | | | | | | | | | | | | |
| Actual | | $ | 1,000.00 | | | $ | 765.30 | | | | 1.05 | % | | $ | 4.60 | (1) |
| Hypothetical (assuming a 5% return before expenses) | | $ | 1,000.00 | | | $ | 1,019.59 | | | | 1.05 | % | | $ | 5.26 | |
| AdvisorShares Dorsey Wright Alpha Equal Weight ETF | | | | | | | | | | | | | | | | |
| Actual | | $ | 1,000.00 | | | $ | 737.30 | | | | 0.97 | % | | $ | 4.18 | (1) |
| Hypothetical (assuming a 5% return before expenses) | | $ | 1,000.00 | | | $ | 1,019.98 | | | | 0.97 | % | | $ | 4.86 | |
| AdvisorShares Dorsey Wright FSM All Cap World ETF(7) | | | | | | | | | | | | | | | | |
| Actual | | $ | 1,000.00 | | | $ | 801.70 | | | | 0.96 | % | | $ | 4.29 | (1) |
| Hypothetical (assuming a 5% return before expenses) | | $ | 1,000.00 | | | $ | 1,020.03 | | | | 0.96 | % | | $ | 4.81 | |
ADVISORSHARES TRUST
Shareholder Expense Examples (unaudited) (continued)
| Fund Name | | Beginning
Account
Value
1/1/2022 | | | Ending
Account
Value
6/30/2022 | | | Annualized
Expense
Ratio for the
Period | | | Expenses
Paid | |
| AdvisorShares Dorsey Wright FSM US Core ETF(7) | | | | | | | | | | | | | | | | |
| Actual | | $ | 1,000.00 | | | $ | 790.00 | | | | 0.97 | % | | $ | 4.31 | (1) |
| Hypothetical (assuming a 5% return before expenses) | | $ | 1,000.00 | | | $ | 1,019.98 | | | | 0.97 | % | | $ | 4.86 | |
| AdvisorShares Dorsey Wright Micro Cap ETF | | | | | | | | | | | | | | | | |
| Actual | | $ | 1,000.00 | | | $ | 767.20 | | | | 1.25 | % | | $ | 5.48 | (1) |
| Hypothetical (assuming a 5% return before expenses) | | $ | 1,000.00 | | | $ | 1,018.60 | | | | 1.25 | % | | $ | 6.26 | |
| AdvisorShares Dorsey Wright Short ETF | | | | | | | | | | | | | | | | |
| Actual | | $ | 1,000.00 | | | $ | 1,228.80 | | | | 1.25 | % | | $ | 6.91 | (1) |
| Hypothetical (assuming a 5% return before expenses) | | $ | 1,000.00 | | | $ | 1,018.60 | | | | 1.25 | % | | $ | 6.26 | |
| AdvisorShares DoubleLine Value ETF | | | | | | | | | | | | | | | | |
| Actual | | $ | 1,000.00 | | | $ | 873.50 | | | | 0.90 | % | | $ | 4.18 | (1) |
| Hypothetical (assuming a 5% return before expenses) | | $ | 1,000.00 | | | $ | 1,020.33 | | | | 0.90 | % | | $ | 4.51 | |
| AdvisorShares Drone Technology ETF | | | | | | | | | | | | | | | | |
| Actual | | $ | 1,000.00 | | | $ | 881.40 | | | | 0.99 | % | | $ | 1.63 | (2) |
| Hypothetical (assuming a 5% return before expenses) | | $ | 1,000.00 | | | $ | 1,007.03 | | | | 0.99 | % | | $ | 1.74 | |
| AdvisorShares Focused Equity ETF | | | | | | | | | | | | | | | | |
| Actual | | $ | 1,000.00 | | | $ | 803.30 | | | | 0.65 | % | | $ | 2.91 | (1) |
| Hypothetical (assuming a 5% return before expenses) | | $ | 1,000.00 | | | $ | 1,021.57 | | | | 0.65 | % | | $ | 3.26 | |
| AdvisorShares Gerber Kawasaki ETF | | | | | | | | | | | | | | | | |
| Actual | | $ | 1,000.00 | | | $ | 616.70 | | | | 0.75 | % | | $ | 3.01 | (1) |
| Hypothetical (assuming a 5% return before expenses) | | $ | 1,000.00 | | | $ | 1,021.08 | | | | 0.75 | % | | $ | 3.76 | |
| AdvisorShares Hotel ETF | | | | | | | | | | | | | | | | |
| Actual | | $ | 1,000.00 | | | $ | 744.10 | | | | 0.99 | % | | $ | 4.28 | (1) |
| Hypothetical (assuming a 5% return before expenses) | | $ | 1,000.00 | | | $ | 1,019.89 | | | | 0.99 | % | | $ | 4.96 | |
| AdvisorShares Let Bob AI Powered Momentum ETF | | | | | | | | | | | | | | | | |
| Actual | | $ | 1,000.00 | | | $ | 930.10 | | | | 0.99 | % | | $ | 3.72 | (3) |
| Hypothetical (assuming a 5% return before expenses) | | $ | 1,000.00 | | | $ | 1,015.60 | | | | 0.99 | % | | $ | 3.88 | |
| AdvisorShares Managed Bitcoin Strategy ETF(7) | | | | | | | | | | | | | | | | |
| Actual | | $ | 1,000.00 | | | $ | 590.50 | | | | 1.49 | % | | $ | 2.08 | (4) |
| Hypothetical (assuming a 5% return before expenses) | | $ | 1,000.00 | | | $ | 1,006.15 | | | | 1.49 | % | | $ | 2.62 | |
| AdvisorShares Newfleet Multi-Sector Income ETF | | | | | | | | | | | | | | | | |
| Actual | | $ | 1,000.00 | | | $ | 950.00 | | | | 0.75 | % | | $ | 3.63 | (1) |
| Hypothetical (assuming a 5% return before expenses) | | $ | 1,000.00 | | | $ | 1,021.08 | | | | 0.75 | % | | $ | 3.76 | |
ADVISORSHARES TRUST
Shareholder Expense Examples (unaudited) (continued)
| Fund Name | | Beginning
Account
Value
1/1/2022 | | | Ending
Account
Value
6/30/2022 | | | Annualized
Expense
Ratio for the
Period | | | Expenses
Paid | |
| AdvisorShares North Square McKee Core Reserves ETF(5) | | | | | | | | | | | | | | | | |
| Actual | | $ | 1,000.00 | | | $ | 993.60 | | | | 0.35 | % | | $ | 1.73 | (1) |
| Hypothetical (assuming a 5% return before expenses) | | $ | 1,000.00 | | | $ | 1,023.06 | | | | 0.35 | % | | $ | 1.76 | |
| AdvisorShares North Square McKee ESG Core Bond ETF(6) | | | | | | | | | | | | | | | | |
| Actual | | $ | 1,000.00 | | | $ | 900.10 | | | | 0.47 | % | | $ | 2.21 | (1) |
| Hypothetical (assuming a 5% return before expenses) | | $ | 1,000.00 | | | $ | 1,022.46 | | | | 0.47 | % | | $ | 2.36 | |
| AdvisorShares Poseidon Dynamic Cannabis ETF | | | | | | | | | | | | | | | | |
| Actual | | $ | 1,000.00 | | | $ | 312.80 | | | | 0.99 | % | | $ | 3.22 | (1) |
| Hypothetical (assuming a 5% return before expenses) | | $ | 1,000.00 | | | $ | 1,019.89 | | | | 0.99 | % | | $ | 4.96 | |
| AdvisorShares Psychedelics ETF | | | | | | | | | | | | | | | | |
| Actual | | $ | 1,000.00 | | | $ | 458.00 | | | | 0.99 | % | | $ | 3.58 | (1) |
| Hypothetical (assuming a 5% return before expenses) | | $ | 1,000.00 | | | $ | 1,019.89 | | | | 0.99 | % | | $ | 4.96 | |
| AdvisorShares Pure Cannabis ETF | | | | | | | | | | | | | | | | |
| Actual | | $ | 1,000.00 | | | $ | 405.10 | | | | 0.53 | % | | $ | 1.85 | (1) |
| Hypothetical (assuming a 5% return before expenses) | | $ | 1,000.00 | | | $ | 1,022.17 | | | | 0.53 | % | | $ | 2.66 | |
| AdvisorShares Pure US Cannabis ETF | | | | | | | | | | | | | | | | |
| Actual | | $ | 1,000.00 | | | $ | 405.50 | | | | 0.74 | % | | $ | 2.58 | (1) |
| Hypothetical (assuming a 5% return before expenses) | | $ | 1,000.00 | | | $ | 1,021.12 | | | | 0.74 | % | | $ | 3.71 | |
| AdvisorShares Q Dynamic Growth ETF(7) | | | | | | | | | | | | | | | | |
| Actual | | $ | 1,000.00 | | | $ | 720.60 | | | | 1.13 | % | | $ | 4.82 | (1) |
| Hypothetical (assuming a 5% return before expenses) | | $ | 1,000.00 | | | $ | 1,019.19 | | | | 1.13 | % | | $ | 5.66 | |
| AdvisorShares Q Portfolio Blended Allocation ETF(7) | | | | | | | | | | | | | | | | |
| Actual | | $ | 1,000.00 | | | $ | 763.90 | | | | 0.98 | % | | $ | 4.29 | (1) |
| Hypothetical (assuming a 5% return before expenses) | | $ | 1,000.00 | | | $ | 1,019.93 | | | | 0.98 | % | | $ | 4.91 | |
| AdvisorShares Ranger Equity Bear ETF | | | | | | | | | | | | | | | | |
| Actual | | $ | 1,000.00 | | | $ | 1,290.10 | | | | 1.67 | % | | $ | 9.48 | (1) |
| Hypothetical (assuming a 5% return before expenses) | | $ | 1,000.00 | | | $ | 1,016.51 | | | | 1.67 | % | | $ | 8.35 | |
| AdvisorShares Restaurant ETF | | | | | | | | | | | | | | | | |
| Actual | | $ | 1,000.00 | | | $ | 721.70 | | | | 0.99 | % | | $ | 4.23 | (1) |
| Hypothetical (assuming a 5% return before expenses) | | $ | 1,000.00 | | | $ | 1,019.89 | | | | 0.99 | % | | $ | 4.96 | |
| AdvisorShares STAR Global Buy-Write ETF(7) | | | | | | | | | | | | | | | | |
| Actual | | $ | 1,000.00 | | | $ | 842.20 | | | | 1.85 | % | | $ | 8.45 | (1) |
| Hypothetical (assuming a 5% return before expenses) | | $ | 1,000.00 | | | $ | 1,015.62 | | | | 1.85 | % | | $ | 9.25 | |
ADVISORSHARES TRUST
Shareholder Expense Examples (unaudited) (continued)
| Fund Name | | Beginning
Account
Value
1/1/2022 | | | Ending
Account
Value
6/30/2022 | | | Annualized
Expense
Ratio for the
Period | | | Expenses
Paid | |
| AdvisorShares Vice ETF | | | | | | | | | | | | | | | | |
| Actual | | $ | 1,000.00 | | | $ | 764.70 | | | | 0.99 | % | | $ | 4.33 | (1) |
| Hypothetical (assuming a 5% return before expenses) | | $ | 1,000.00 | | | $ | 1,019.89 | | | | 0.99 | % | | $ | 4.96 | |
| (1) | Expenses are calculated using each Fund’s annualized expense ratio, multiplied by the average account value for the period, multiplied by 181/365 (to reflect the six-month period). |
| (2) | Actual Expenses Paid are equal to the Fund’s annualized expense ratio, multiplied by the average account value for the period, multiplied by 65/365 (to reflect commencement of operations of April 27, 2022). |
| (3) | Actual Expenses Paid are equal to the Fund’s annualized expense ratio, multiplied by the average account value for the period, multiplied by 142/365 (to reflect commencement of operations of February 9, 2022). |
| (4) | Actual Expenses Paid are equal to the Fund’s annualized expense ratio, multiplied by the average account value for the period, multiplied by 65/365 (to reflect commencement of operations of April 27, 2022). |
| (5) | Formerly know as AdvisorShares Sage Core Reserves ETF. |
| (6) | Formerly known as AdvisorShares FolioBeyond Smart Core Bond ETF. |
| (7) | The Fund invests in other funds and indirectly bears its proportionate shares of fees and expenses incurred by the funds in which the Fund is invested in. These ratios do not include these indirect fees and expenses. |
ADVISORSHARES ALPHA DNA EQUITY SENTIMENT ETF
Schedule of Investments
June 30, 2022
| Investments | | Shares | | | Value | |
| COMMON STOCKS — 95.0% | |
| | | | | | | | | |
| Airlines — 1.8% | |
| Allegiant Travel Co.* | | | 4,150 | | | $ | 469,323 | |
| American Airlines Group, Inc.* | | | 35,998 | | | | 456,455 | |
| Total Airlines | | | | | | | 925,778 | |
| | | | | | | | | |
| Apparel — 0.9% | |
| Oxford Industries, Inc. | | | 5,133 | | | | 455,502 | |
| | | | | | | | | |
| Auto Parts & Equipment — 0.9% | |
| Titan International, Inc.* | | | 29,686 | | | | 448,259 | |
| | | | | | | | | |
| Banks — 4.7% | |
| Cullen/Frost Bankers, Inc. | | | 4,111 | | | | 478,726 | |
| Seacoast Banking Corp. of Florida | | | 14,475 | | | | 478,254 | |
| Synovus Financial Corp. | | | 13,300 | | | | 479,465 | |
| WesBanco, Inc. | | | 15,172 | | | | 481,104 | |
| Zions Bancorp NA | | | 9,312 | | | | 473,981 | |
| Total Banks | | | | | | | 2,391,530 | |
| | | | | | | | | |
| Building Materials — 1.9% | |
| Mohawk Industries, Inc.* | | | 3,749 | | | | 465,213 | |
| Owens Corning | | | 6,393 | | | | 475,064 | |
| Total Building Materials | | | | | | | 940,277 | |
| | | | | | | | | |
| Chemicals — 5.6% | |
| Albemarle Corp. | | | 2,162 | | | | 451,815 | |
| Celanese Corp. | | | 3,911 | | | | 459,973 | |
| Dow, Inc. | | | 9,398 | | | | 485,031 | |
| Huntsman Corp. | | | 17,113 | | | | 485,153 | |
| LyondellBasell Industries NV, Class A | | | 5,558 | | | | 486,103 | |
| Westlake Corp. | | | 4,965 | | | | 486,669 | |
| Total Chemicals | | | | | | | 2,854,744 | |
| | | | | | | | | |
| Commercial Services — 3.8% | |
| AMN Healthcare Services, Inc.* | | | 4,333 | | | | 475,373 | |
| Cross Country Healthcare, Inc.* | | | 24,162 | | | | 503,294 | |
| I3 Verticals, Inc., Class A* | | | 19,138 | | | | 478,833 | |
| United Rentals, Inc.* | | | 1,957 | | | | 475,375 | |
| Total Commercial Services | | | | | | | 1,932,875 | |
| | | | | | | | | |
| Computers — 2.7% | |
| Crowdstrike Holdings, Inc., Class A* | | | 2,693 | | | | 453,932 | |
| Pure Storage, Inc., Class A* | | | 18,163 | | | | 466,971 | |
| Zscaler, Inc.*(a) | | | 2,968 | | | | 443,745 | |
| Total Computers | | | | | | | 1,364,648 | |
| Investments | | Shares | | | Value | |
| COMMON STOCKS (continued) | |
| | | | | | | | | |
| Cosmetics/Personal Care — 2.0% | |
| elf Beauty, Inc.* | | | 17,045 | | | $ | 522,940 | |
| Inter Parfums, Inc. | | | 6,715 | | | | 490,598 | |
| Total Cosmetics/Personal Care | | | | | | | 1,013,538 | |
| | | | | | | | | |
| Distribution/Wholesale — 3.8% | |
| Core & Main, Inc., Class A* | | | 22,072 | | | | 492,206 | |
| Fastenal Co. | | | 9,488 | | | | 473,641 | |
| Watsco, Inc. | | | 2,015 | | | | 481,222 | |
| WW Grainger, Inc. | | | 1,054 | | | | 478,969 | |
| Total Distribution/Wholesale | | | | | | | 1,926,038 | |
| | | | | | | | | |
| Diversified Financial Services — 1.9% | |
| Discover Financial Services | | | 4,946 | | | | 467,793 | |
| Enova International, Inc.* | | | 16,461 | | | | 474,406 | |
| Total Diversified Financial Services | | | | | | | 942,199 | |
| | | | | | | | | |
| Electronics — 1.9% | |
| Avnet, Inc. | | | 11,237 | | | | 481,843 | |
| Hubbell, Inc. | | | 2,616 | | | | 467,165 | |
| Total Electronics | | | | | | | 949,008 | |
| | | | | | | | | |
| Energy — Alternate Sources — 0.9% | |
| Enphase Energy, Inc.* | | | 2,375 | | | | 463,695 | |
| | | | | | | | | |
| Food — 1.8% | |
| Albertsons Cos., Inc., Class A | | | 16,753 | | | | 447,640 | |
| Chefs’ Warehouse, Inc. (The)* | | | 11,988 | | | | 466,213 | |
| Total Food | | | | | | | 913,853 | |
| | | | | | | | | |
| Healthcare — Products — 1.0% | |
| PerkinElmer, Inc. | | | 3,376 | | | | 480,135 | |
| | | | | | | | | |
| Healthcare — Services — 1.0% | |
| Centene Corp.* | | | 5,789 | | | | 489,807 | |
| | | | | | | | | |
| Home Builders — 1.8% | |
| Skyline Champion Corp.* | | | 9,847 | | | | 466,945 | |
| Winnebago Industries, Inc. | | | 9,383 | | | | 455,638 | |
| Total Home Builders | | | | | | | 922,583 | |
| | | | | | | | | |
| Internet — 1.8% | |
| Airbnb, Inc., Class A* | | | 4,863 | | | | 433,196 | |
| Palo Alto Networks, Inc.* | | | 975 | | | | 481,592 | |
| Total Internet | | | | | | | 914,788 | |
See accompanying Notes to Financial Statements.
ADVISORSHARES ALPHA DNA EQUITY SENTIMENT ETF
Schedule of Investments (continued)
June 30, 2022
| Investments | | Shares | | | Value | |
| COMMON STOCKS (continued) | |
| | | | | | | | | |
| Investment Companies — 1.0% | |
| Oaktree Specialty Lending Corp. | | | 75,345 | | | $ | 493,510 | |
| | | | | | | | | |
| Iron/Steel — 0.9% | |
| Allegheny Technologies, Inc.* | | | 20,843 | | | | 473,345 | |
| | | | | | | | | |
| Leisure Time — 0.9% | |
| Malibu Boats, Inc., Class A* | | | 9,054 | | | | 477,236 | |
| | | | | | | | | |
| Oil & Gas — 13.9% | |
| Berry Corp. | | | 60,846 | | | | 463,647 | |
| Brigham Minerals, Inc., Class A | | | 19,089 | | | | 470,162 | |
| Callon Petroleum Co.* | | | 11,410 | | | | 447,272 | |
| Chevron Corp. | | | 3,327 | | | | 481,683 | |
| Delek US Holdings, Inc.* | | | 17,937 | | | | 463,492 | |
| Devon Energy Corp. | | | 8,510 | | | | 468,986 | |
| Diamondback Energy, Inc. | | | 3,946 | | | | 478,058 | |
| Earthstone Energy, Inc., Class A* | | | 33,604 | | | | 458,695 | |
| Helmerich & Payne, Inc. | | | 11,120 | | | | 478,827 | |
| Magnolia Oil & Gas Corp., Class A(a) | | | 22,670 | | | | 475,843 | |
| Marathon Oil Corp. | | | 21,286 | | | | 478,509 | |
| Matador Resources Co. | | | 9,909 | | | | 461,660 | |
| Occidental Petroleum Corp. | | | 8,356 | | | | 492,001 | |
| PDC Energy, Inc. | | | 7,680 | | | | 473,165 | |
| Whiting Petroleum Corp. | | | 6,566 | | | | 446,685 | |
| Total Oil & Gas | | | | | | | 7,038,685 | |
| | | | | | | | | |
| Oil & Gas Services — 2.9% | |
| Halliburton Co. | | | 15,352 | | | | 481,439 | |
| MRC Global, Inc.* | | | 49,582 | | | | 493,837 | |
| NexTier Oilfield Solutions, Inc.* | | | 51,564 | | | | 490,373 | |
| Total Oil & Gas Services | | | | | | | 1,465,649 | |
| | | | | | | | | |
| Packaging & Containers — 0.9% | |
| Packaging Corp. of America | | | 3,449 | | | | 474,237 | |
| | | | | | | | | |
| Pharmaceuticals — 1.0% | |
| McKesson Corp. | | | 1,499 | | | | 488,989 | |
| | | | | | | | | |
| REITS — 0.9% | |
| Weyerhaeuser Co. | | | 14,447 | | | | 478,485 | |
| | | | | | | | | |
| Retail — 4.6% | |
| Beacon Roofing Supply, Inc.* | | | 9,475 | | | | 486,636 | |
| BlueLinx Holdings, Inc.* | | | 7,049 | | | | 470,944 | |
| Texas Roadhouse, Inc. | | | 6,351 | | | | 464,893 | |
| Ulta Beauty, Inc.* | | | 1,213 | | | | 467,587 | |
| Williams-Sonoma, Inc. | | | 3,974 | | | | 440,915 | |
| Total Retail | | | | | | | 2,330,975 | |
| Investments | | Shares | | | Value | |
| COMMON STOCKS (continued) | |
| | | | | | | | | |
| Savings & Loans — 1.0% | |
| Provident Financial Services, Inc. | | | 21,895 | | | $ | 487,383 | |
| | | | | | | | | |
| Semiconductors — 11.9% | |
| Advanced Micro Devices, Inc.* | | | 5,647 | | | | 431,826 | |
| Analog Devices, Inc. | | | 3,239 | | | | 473,185 | |
| Broadcom, Inc. | | | 965 | | | | 468,807 | |
| Cirrus Logic, Inc.* | | | 6,628 | | | | 480,795 | |
| Lattice Semiconductor Corp.* | | | 9,280 | | | | 450,080 | |
| Marvell Technology, Inc. | | | 10,184 | | | | 443,310 | |
| MaxLinear, Inc.* | | | 13,831 | | | | 469,977 | |
| Microchip Technology, Inc. | | | 8,032 | | | | 466,499 | |
| Monolithic Power Systems, Inc. | | | 1,169 | | | | 448,943 | |
| NXP Semiconductors NV (China) | | | 3,079 | | | | 455,784 | |
| ON Semiconductor Corp.* | | | 8,976 | | | | 451,583 | |
| QUALCOMM, Inc. | | | 3,837 | | | | 490,138 | |
| Silicon Laboratories, Inc.* | | | 3,363 | | | | 471,560 | |
| Total Semiconductors | | | | | | | 6,002,487 | |
| | | | | | | | | |
| Software — 2.7% | |
| Braze, Inc., Class A* | | | 12,032 | | | | 435,919 | |
| HashiCorp, Inc., Class A* | | | 15,290 | | | | 450,138 | |
| Intuit, Inc. | | | 1,207 | | | | 465,226 | |
| Total Software | | | | | | | 1,351,283 | |
| | | | | | | | | |
| Transportation — 12.2% | |
| ArcBest Corp. | | | 6,764 | | | | 475,982 | |
| CH Robinson Worldwide, Inc. | | | 4,664 | | | | 472,790 | |
| Eagle Bulk Shipping, Inc.(a) | | | 9,217 | | | | 478,178 | |
| Frontline Ltd. (Norway)* | | | 51,892 | | | | 459,763 | |
| Genco Shipping & Trading Ltd. | | | 24,716 | | | | 477,513 | |
| Hub Group, Inc., Class A* | | | 6,799 | | | | 482,321 | |
| JB Hunt Transport Services, Inc. | | | 3,006 | | | | 473,355 | |
| Landstar System, Inc. | | | 3,283 | | | | 477,414 | |
| Marten Transport Ltd. | | | 28,168 | | | | 473,786 | |
| Saia, Inc.* | | | 2,538 | | | | 477,144 | |
| Schneider National, Inc., Class B | | | 21,365 | | | | 478,149 | |
| Scorpio Tankers, Inc. (Monaco) | | | 13,355 | | | | 460,881 | |
| Star Bulk Carriers Corp. (Greece) | | | 19,119 | | | | 477,784 | |
| Total Transportation | | | | | | | 6,165,060 | |
Total Common Stocks
(Cost $54,562,576) | | | | | | | 48,056,581 | |
| | | | | | | | | |
| MONEY MARKET FUND — 0.7% | |
Fidelity Investments Money Market Government
Portfolio — Class I, 1.21%(b)
(Cost $349,010) | | | 349,010 | | | | 349,010 | |
See accompanying Notes to Financial Statements.
ADVISORSHARES ALPHA DNA EQUITY SENTIMENT ETF
Schedule of Investments (continued)
June 30, 2022
| | | Notional
Amount | | | Contracts | | | | |
| PURCHASED PUT OPTIONS — 4.4% | |
| Shares Russell 2000 ETF, expiring 10/21/22, Strike Price $163.00 | | | 32,600,000 | | | | 2,000 | | | $ | 1,741,000 | |
| SPDR S&P 500 ETF Trust, expiring 08/19/22, Strike Price $370.00 | | | 14,837,000 | | | | 401 | | | | 463,356 | |
Total Purchased Put Options
(Cost $1,761,945) | | | | | | | | | | | 2,204,356 | |
| | | | | | | | | | | | | |
| REPURCHASE AGREEMENT — 0.4%(c) | |
RBC Dominion Securities, Inc., dated 06/30/22, due 07/01/22, 1.55%, total to be received $199,499, (collateralized by various U.S. Government Agency Obligations, 0.00%-6.88%, 8/16/22-5/20/52, totaling $203,480)
(Cost $199,490) | | | | | | $ | 199,490 | | | $ | 199,490 | |
| | | | | | | | | | | | | |
Total Investments — 100.5%
(Cost $56,873,021) | | | | | | | | | | | 50,809,437 | |
| Liabilities in Excess of Other Assets — (0.5%) | | | | | | | | | | | (236,105 | ) |
| Net Assets — 100.0% | | | | | | | | | | $ | 50,573,332 | |
ETF — Exchange Traded Fund
REITS — Real Estate Investment Trusts
| * | Non-income producing security. |
| (a) | All or a portion of security is on loan. The aggregate market value of the securities on loan is $1,038,480; the aggregate market value of the collateral held by the fund is $1,109,717. The aggregate market value of the collateral includes non-cash U.S. Treasury securities collateral having a value of $910,227. |
| (b) | Rate shown reflects the 7-day yield as of June 30, 2022. |
| (c) | Collateral received from brokers for securities lending was invested in these short-term investments. |
See accompanying Notes to Financial Statements.
ADVISORSHARES ALPHA DNA EQUITY SENTIMENT ETF
Schedule of Investments (continued)
June 30, 2022
Fair Value Measurements
The following is a summary of the inputs used, as of June 30, 2022, in valuing the Fund’s assets and liabilities carried at fair value. These inputs are summarized in three broad levels. Level 1 includes quoted prices in active markets for identical securities. Level 2 includes other significant observable inputs (including quoted prices for similar securities, interest rates, prepayment speeds and credit risk). Level 3 includes significant unobservable inputs (including the Fund’s own assumptions in determining the fair value of investments). The level assigned to the securities valuations may not be an indication of the risk or liquidity associated with investing in those securities.
| Assets | | Level 1 | | | Level 2 | | | Level 3 | | | Total | |
| Common Stocks | | $ | 48,056,581 | | | $ | — | | | $ | — | | | $ | 48,056,581 | |
| Money Market Fund | | | 349,010 | | | | — | | | | — | | | | 349,010 | |
| Purchased Put Options | | | 2,204,356 | | | | — | | | | — | | | | 2,204,356 | |
| Repurchase Agreement | | | — | | | | 199,490 | | | | — | | | | 199,490 | |
| Total | | $ | 50,609,947 | | | $ | 199,490 | | | $ | — | | | $ | 50,809,437 | |
SUMMARY OF SCHEDULE OF INVESTMENTS
| | | % of
Net Assets | |
| Airlines | | | 1.8 | % |
| Apparel | | | 0.9 | |
| Auto Parts & Equipment | | | 0.9 | |
| Banks | | | 4.7 | |
| Building Materials | | | 1.9 | |
| Chemicals | | | 5.6 | |
| Commercial Services | | | 3.8 | |
| Computers | | | 2.7 | |
| Cosmetics/Personal Care | | | 2.0 | |
| Distribution/Wholesale | | | 3.8 | |
| Diversified Financial Services | | | 1.9 | |
| Electronics | | | 1.9 | |
| Energy — Alternate Sources | | | 0.9 | |
| Food | | | 1.8 | |
| Healthcare — Products | | | 1.0 | |
| Healthcare — Services | | | 1.0 | |
| Home Builders | | | 1.8 | |
| Internet | | | 1.8 | |
| Investment Companies | | | 1.0 | |
| Iron/Steel | | | 0.9 | |
| Leisure Time | | | 0.9 | |
| Oil & Gas | | | 13.9 | |
| Oil & Gas Services | | | 2.9 | |
| Packaging & Containers | | | 0.9 | |
| Pharmaceuticals | | | 1.0 | |
| Purchased Put Options | | | 4.4 | |
| REITS | | | 0.9 | |
SUMMARY OF SCHEDULE OF INVESTMENTS (continued)
| | | % of
Net Assets | |
| Retail | | | 4.6 | % |
| Savings & Loans | | | 1.0 | |
| Semiconductors | | | 11.9 | |
| Software | | | 2.7 | |
| Transportation | | | 12.2 | |
| Money Market Fund | | | 0.7 | |
| Repurchase Agreement | | | 0.4 | |
| Total Investments | | | 100.5 | |
| Liabilities in Excess of Other Assets | | | (0.5 | ) |
| Net Assets | | | 100.0 | % |
See accompanying Notes to Financial Statements.
ADVISORSHARES DORSEY WRIGHT ADR ETF
Schedule of Investments
June 30, 2022
| Investments | | Shares | | | Value | |
| COMMON STOCKS — 99.6% | |
| | | | | | | | | |
| Agriculture — 2.8% | |
| British American Tobacco PLC (United Kingdom)(a) | | | 27,594 | | | $ | 1,184,058 | |
| | | | | | | | | |
| Airlines — 1.3% | |
| Controladora Vuela Cia de Aviacion SAB de CV (Mexico)*(a) | | | 53,122 | | | | 545,563 | |
| | | | | | | | | |
| Apparel — 4.4% | |
| LVMH Moet Hennessy Louis Vuitton SE (France)(a) | | | 15,061 | | | | 1,840,755 | |
| | | | | | | | | |
| Auto Manufacturers — 4.0% | |
| Tata Motors Ltd. (India)*(a)(b) | | | 65,800 | | | | 1,702,246 | |
| | | | | | | | | |
| Banks — 20.3% | |
| Banco Bilbao Vizcaya Argentaria SA (Spain)(a) | | | 225,935 | | | | 1,021,226 | |
| Credicorp Ltd. (Peru) | | | 8,106 | | | | 971,991 | |
| Deutsche Bank AG (Germany) | | | 95,089 | | | | 831,078 | |
| HSBC Holdings PLC (United Kingdom)(a)(b) | | | 35,500 | | | | 1,159,785 | |
| ICICI Bank Ltd. (India)(a) | | | 83,215 | | | | 1,476,234 | |
| Itau Unibanco Holding SA (Brazil)(a) | | | 223,390 | | | | 956,109 | |
| Mitsubishi UFJ Financial Group, Inc. (Japan)(a) | | | 188,790 | | | | 1,008,139 | |
| UBS Group AG (Switzerland)(b) | | | 66,651 | | | | 1,081,079 | |
| Total Banks | | | | | | | 8,505,641 | |
| | | | | | | | | |
| Beverages — 3.0% | |
| Diageo PLC (United Kingdom)(a) | | | 7,340 | | | | 1,278,041 | |
| | | | | | | | | |
| Chemicals — 6.6% | |
| ICL Group Ltd. (Israel)(b) | | | 95,300 | | | | 865,324 | |
| Sasol Ltd. (South Africa)*(a)(b) | | | 81,920 | | | | 1,889,075 | |
| Total Chemicals | | | | | | | 2,754,399 | |
| | | | | | | | | |
| Commercial Services — 2.5% | |
| RELX PLC (United Kingdom)(a) | | | 38,690 | | | | 1,042,309 | |
| | | | | | | | | |
| Electric — 4.2% | |
| Cia Paranaense de Energia (Brazil)(a)(b) | | | 128,306 | | | | 816,026 | |
| National Grid PLC (United Kingdom)(a) | | | 14,810 | | | | 958,059 | |
| Total Electric | | | | | | | 1,774,085 | |
| Investments | | Shares | | | Value | |
| COMMON STOCKS (continued) | |
| | | | | | | | | |
| Electrical Components & Equipment — 2.7% | |
| ABB Ltd. (Switzerland)(a)(b) | | | 42,016 | | | $ | 1,123,088 | |
| | | | | | | | | |
| Healthcare — Products — 2.4% | |
| Alcon, Inc. (Switzerland)(b) | | | 14,204 | | | | 992,717 | |
| | | | | | | | | |
| Healthcare — Services — 2.2% | |
| ICON PLC (Ireland)* | | | 4,228 | | | | 916,208 | |
| | | | | | | | | |
| Insurance — 2.3% | |
| Aegon NV (Netherlands)(c) | | | 220,767 | | | | 966,959 | |
| | | | | | | | | |
| Iron/Steel — 6.0% | |
| ArcelorMittal SA (Luxembourg) | | | 47,788 | | | | 1,080,009 | |
| Ternium SA (Mexico)(a) | | | 39,967 | | | | 1,442,409 | |
| Total Iron/Steel | | | | | | | 2,522,418 | |
| | | | | | | | | |
| Metal Fabricate/Hardware — 3.6% | |
| Tenaris SA(a)(b) | | | 58,812 | | | | 1,510,880 | |
| | | | | | | | | |
| Mining — 1.8% | |
| Gold Fields Ltd. (South Africa)(a) | | | 81,400 | | | | 742,368 | |
| | | | | | | | | |
| Oil & Gas — 8.0% | |
| Eni SpA (Italy)(a) | | | 45,334 | | | | 1,079,402 | |
| Equinor ASA (Norway)(a)(b) | | | 42,626 | | | | 1,481,680 | |
| Petroleo Brasileiro SA (Brazil)(a) | | | 67,132 | | | | 784,102 | |
| Total Oil & Gas | | | | | | | 3,345,184 | |
| | | | | | | | | |
| Pharmaceuticals — 3.9% | |
| Novo Nordisk A/S (Denmark)(a) | | | 14,680 | | | | 1,635,792 | |
| | | | | | | | | |
| Semiconductors — 2.7% | |
| NXP Semiconductors NV (China) | | | 7,561 | | | | 1,119,255 | |
| | | | | | | | | |
| Telecommunications — 8.2% | |
| America Movil SAB de CV, Class L (Mexico)(a) | | | 62,120 | | | | 1,269,112 | |
| KT Corp. (South Korea)(a) | | | 82,500 | | | | 1,151,700 | |
| Telkom Indonesia Persero Tbk PT (Indonesia)(a)(b) | | | 38,351 | | | | 1,037,011 | |
| Total Telecommunications | | | | | | | 3,457,823 | |
| | | | | | | | | |
| Transportation — 6.7% | |
| Danaos Corp. (Greece) | | | 29,427 | | | | 1,856,844 | |
| Diana Shipping, Inc. (Greece) | | | 198,062 | | | | 948,717 | |
| Total Transportation | | | | | | | 2,805,561 | |
Total Common Stocks
(Cost $43,249,466) | | | | | | | 41,765,350 | |
See accompanying Notes to Financial Statements.
ADVISORSHARES DORSEY WRIGHT ADR ETF
Schedule of Investments (continued)
June 30, 2022
| Investments | | Shares/
Principal | | | Value | |
| MONEY MARKET FUNDS — 2.7% | |
| BlackRock Liquidity Funds FedFund Portfolio, Institutional Class, 1.03%(d)(e) | | | 96,000 | | | $ | 96,000 | |
| Goldman Sachs Financial Square Government Fund — Institutional Shares, Institutional Class, 1.36%(d)(e) | | | 150,000 | | | | 150,000 | |
| Invesco Government & Agency Portfolio, Institutional Class, 1.39%(d)(e) | | | 158,000 | | | | 158,000 | |
| Morgan Stanley Institutional Liquidity Funds — Government Portfolio, Institutional Class, 1.38%(d)(e) | | | 723,000 | | | | 723,000 | |
Total Money Market Funds
(Cost $1,127,000) | | | | | | | 1,127,000 | |
| | | | | | | | | |
| REPURCHASE AGREEMENTS — 19.6%(e) | |
| BofA Securities, Inc., dated 06/30/22, due 07/01/22, 1.55%, total to be received $2,179,067, (collateralized by various U.S. Government Agency Obligations, 1.00%-8.50%, 1/20/24-6/20/52, totaling $2,222,552) | | $ | 2,178,973 | | | | 2,178,973 | |
| Daiwa Capital Markets America, dated 06/30/22, due 07/01/22, 1.55%, total to be received $2,179,067, (collateralized by various U.S. Government Agency Obligations, 0.00%-6.50%,7/31/22-7/1/52, totaling $2,222,552) | | | 2,178,973 | | | | 2,178,973 | |
| Nomura Securities International, Inc., dated 06/30/22, due 07/01/22, 1.54%, total to be received $1,697,731, (collateralized by various U.S. Government Agency Obligations, 1.50%-6.50%, 7/1/27-6/1/52, totaling $1,731,612) | | | 1,697,658 | | | | 1,697,658 | |
| Investments | | Shares/
Principal | | | Value | |
| REPURCHASE AGREEMENTS (continued) | |
| RBC Dominion Securities, Inc., dated 06/30/22, due 07/01/22, 1.55%, total to be received $2,179,067, (collateralized by various U.S. Government Agency Obligations, 0.00%-6.88%, 8/16/22-5/20/52, totaling $2,222,552) | | $ | 2,178,973 | | | $ | 2,178,973 | |
Total Repurchase Agreements
(Cost $8,234,577) | | | | | | | 8,234,577 | |
| | | | | | | | | |
Total Investments — 121.9%
(Cost $52,611,043) | | | | | | | 51,126,927 | |
| Liabilities in Excess of Other Assets — (21.9%) | | | | | | | (9,189,107 | ) |
| Net Assets — 100.0% | | | | | | $ | 41,937,820 | |
PLC — Public Limited Company
| * | Non-income producing security. |
| (a) | American Depositary Receipt. |
| (b) | All or a portion of security is on loan. The aggregate market value of the securities on loan is $9,038,711; the aggregate market value of the collateral held by the fund is $9,361,577. |
| (d) | Rate shown reflects the 7-day yield as of June 30, 2022. |
| (e) | Collateral received from brokers for securities lending was invested in these short-term investments. |
See accompanying Notes to Financial Statements.
ADVISORSHARES DORSEY WRIGHT ADR ETF
Schedule of Investments (continued)
June 30, 2022
Fair Value Measurements
The following is a summary of the inputs used, as of June 30, 2022, in valuing the Fund’s assets and liabilities carried at fair value. These inputs are summarized in three broad levels. Level 1 includes quoted prices in active markets for identical securities. Level 2 includes other significant observable inputs (including quoted prices for similar securities, interest rates, prepayment speeds and credit risk). Level 3 includes significant unobservable inputs (including the Fund’s own assumptions in determining the fair value of investments). The level assigned to the securities valuations may not be an indication of the risk or liquidity associated with investing in those securities.
| Assets | | Level 1 | | | Level 2 | | | Level 3 | | | Total | |
| Common Stocks | | $ | 41,765,350 | | | $ | — | | | $ | — | | | $ | 41,765,350 | |
| Money Market Funds | | | 1,127,000 | | | | — | | | | — | | | | 1,127,000 | |
| Repurchase Agreements | | | — | | | | 8,234,577 | | | | — | | | | 8,234,577 | |
| Total | | $ | 42,892,350 | | | $ | 8,234,577 | | | $ | — | | | $ | 51,126,927 | |
SUMMARY OF SCHEDULE OF INVESTMENTS
| | | % of
Net Assets | |
| Agriculture | | | 2.8 | % |
| Airlines | | | 1.3 | |
| Apparel | | | 4.4 | |
| Auto Manufacturers | | | 4.0 | |
| Banks | | | 20.3 | |
| Beverages | | | 3.0 | |
| Chemicals | | | 6.6 | |
| Commercial Services | | | 2.5 | |
| Electric | | | 4.2 | |
| Electrical Components & Equipment | | | 2.7 | |
| Healthcare — Products | | | 2.4 | |
| Healthcare — Services | | | 2.2 | |
| Insurance | | | 2.3 | |
| Iron/Steel | | | 6.0 | |
| Metal Fabricate/Hardware | | | 3.6 | |
| Mining | | | 1.8 | |
| Oil & Gas | | | 8.0 | |
| Pharmaceuticals | | | 3.9 | |
| Semiconductors | | | 2.7 | |
| Telecommunications | | | 8.2 | |
| Transportation | | | 6.7 | |
| Money Market Funds | | | 2.7 | |
| Repurchase Agreements | | | 19.6 | |
| Total Investments | | | 121.9 | |
| Liabilities in Excess of Other Assets | | | (21.9 | ) |
| Net Assets | | | 100.0 | % |
See accompanying Notes to Financial Statements.
ADVISORSHARES DORSEY WRIGHT ALPHA EQUAL WEIGHT ETF
Schedule of Investments
June 30, 2022
| Investments | | Shares | | | Value | |
| COMMON STOCKS — 67.5% | |
| | | | | | | | | |
| Biotechnology — 3.7% | |
| Halozyme Therapeutics, Inc.* | | | 19,472 | | | $ | 856,768 | |
| United Therapeutics Corp.* | | | 3,054 | | | | 719,645 | |
| Total Biotechnology | | | | | | | 1,576,413 | |
| | | | | | | | | |
| Electronics — 1.7% | |
| Mettler-Toledo International, Inc.* | | | 624 | | | | 716,832 | |
| | | | | | | | | |
| Healthcare — Products — 6.8% | |
| Edwards Lifesciences Corp.* | | | 7,536 | | | | 716,598 | |
| Envista Holdings Corp.* | | | 17,141 | | | | 660,614 | |
| STERIS PLC | | | 3,549 | | | | 731,627 | |
| Thermo Fisher Scientific, Inc. | | | 1,454 | | | | 789,929 | |
| Total Healthcare — Products | | | | | | | 2,898,768 | |
| | | | | | | | | |
| Healthcare — Services — 7.0% | |
| Chemed Corp. | | | 1,607 | | | | 754,310 | |
| IQVIA Holdings, Inc.* | | | 3,340 | | | | 724,746 | |
| Molina Healthcare, Inc.* | | | 2,554 | | | | 714,124 | |
| UnitedHealth Group, Inc. | | | 1,563 | | | | 802,804 | |
| Total Healthcare — Services | | | | | | | 2,995,984 | |
| | | | | | | | | |
| Oil & Gas — 19.1% | |
| Antero Resources Corp.* | | | 22,287 | | | | 683,097 | |
| APA Corp. | | | 19,538 | | | | 681,876 | |
| ConocoPhillips | | | 8,406 | | | | 754,943 | |
| Devon Energy Corp. | | | 13,714 | | | | 755,779 | |
| Diamondback Energy, Inc. | | | 6,307 | | | | 764,093 | |
| EOG Resources, Inc. | | | 6,892 | | | | 761,152 | |
| Hess Corp. | | | 7,753 | | | | 821,353 | |
| Marathon Oil Corp. | | | 31,983 | | | | 718,978 | |
| Marathon Petroleum Corp. | | | 8,967 | | | | 737,177 | |
| PDC Energy, Inc. | | | 11,461 | | | | 706,112 | |
| Pioneer Natural Resources Co. | | | 3,414 | | | | 761,595 | |
| Total Oil & Gas | | | | | | | 8,146,155 | |
| | | | | | | | | |
| Pharmaceuticals — 4.0% | |
| Eli Lilly & Co. | | | 2,743 | | | | 889,363 | |
| McKesson Corp. | | | 2,564 | | | | 836,402 | |
| Total Pharmaceuticals | | | | | | | 1,725,765 | |
| Investments | | Shares | | | Value | |
| COMMON STOCKS (continued) | |
| | | | | | | | | |
| Pipelines — 4.9% | |
| Cheniere Energy, Inc. | | | 5,802 | | | $ | 771,840 | |
| ONEOK, Inc. | | | 12,542 | | | | 696,081 | |
| Targa Resources Corp. | | | 10,754 | | | | 641,691 | |
| Total Pipelines | | | | | | | 2,109,612 | |
| | | | | | | | | |
| REITS — 20.3% | |
| American Tower Corp. | | | 2,775 | | | | 709,262 | |
| Brixmor Property Group, Inc. | | | 31,396 | | | | 634,513 | |
| Crown Castle International Corp. | | | 4,303 | | | | 724,539 | |
| First Industrial Realty Trust, Inc. | | | 13,947 | | | | 662,204 | |
| Host Hotels & Resorts, Inc. | | | 39,328 | | | | 616,663 | |
| Iron Mountain, Inc. | | | 15,210 | | | | 740,575 | |
| Kimco Realty Corp. | | | 31,797 | | | | 628,627 | |
| Lamar Advertising Co., Class A | | | 7,228 | | | | 635,847 | |
| Mid-America Apartment Communities, Inc. | | | 4,123 | | | | 720,164 | |
| National Storage Affiliates Trust | | | 14,128 | | | | 707,389 | |
| Rexford Industrial Realty, Inc. | | | 10,291 | | | | 592,659 | |
| Ryman Hospitality Properties, Inc.* | | | 8,599 | | | | 653,782 | |
| Weyerhaeuser Co. | | | 19,495 | | | | 645,674 | |
| Total REITS | | | | | | | 8,671,898 | |
Total Common Stocks
(Cost $30,604,347) | | | | | | | 28,841,427 | |
| | | | | | | | | |
| MONEY MARKET FUND — 32.5% | |
BlackRock Liquidity Funds Treasury Trust Fund Portfolio, Institutional Class, 1.03%(a)
(Cost $13,876,002) | | | 13,876,002 | | | | 13,876,002 | |
| | | | | | | | | |
Total Investments — 100.0%
(Cost $44,480,349) | | | | | | | 42,717,429 | |
| Liabilities in Excess of Other Assets — (0.0%)** | | | | | | | (20,521 | ) |
| Net Assets — 100.0% | | | | | | $ | 42,696,908 | |
PLC — Public Limited Company
REITS — Real Estate Investment Trusts
| * | Non-income producing security. |
| (a) | Rate shown reflects the 7-day yield as of June 30, 2022. |
See accompanying Notes to Financial Statements.
ADVISORSHARES DORSEY WRIGHT ALPHA EQUAL WEIGHT ETF
Schedule of Investments (continued)
June 30, 2022
Fair Value Measurements
The following is a summary of the inputs used, as of June 30, 2022, in valuing the Fund’s assets and liabilities carried at fair value. These inputs are summarized in three broad levels. Level 1 includes quoted prices in active markets for identical securities. Level 2 includes other significant observable inputs (including quoted prices for similar securities, interest rates, prepayment speeds and credit risk). Level 3 includes significant unobservable inputs (including the Fund’s own assumptions in determining the fair value of investments). The level assigned to the securities valuations may not be an indication of the risk or liquidity associated with investing in those securities.
| Assets | | Level 1 | | | Level 2 | | | Level 3 | | | Total | |
| Common Stocks | | $ | 28,841,427 | | | $ | — | | | $ | — | | | $ | 28,841,427 | |
| Money Market Fund | | | 13,876,002 | | | | — | | | | — | | | | 13,876,002 | |
| Total | | $ | 42,717,429 | | | $ | — | | | $ | — | | | $ | 42,717,429 | |
SUMMARY OF SCHEDULE OF INVESTMENTS
| | | % of
Net Assets | |
| Biotechnology | | | 3.7 | % |
| Electronics | | | 1.7 | |
| Healthcare — Products | | | 6.8 | |
| Healthcare — Services | | | 7.0 | |
| Oil & Gas | | | 19.1 | |
| Pharmaceuticals | | | 4.0 | |
| Pipelines | | | 4.9 | |
| REITS | | | 20.3 | |
| Money Market Fund | | | 32.5 | |
| Total Investments | | | 100.0 | |
| Liabilities in Excess of Other Assets | | | (0.0 | )** |
| Net Assets | | | 100.0 | % |
See accompanying Notes to Financial Statements.
ADVISORSHARES DORSEY WRIGHT FSM ALL CAP WORLD ETF
Schedule of Investments
June 30, 2022
| Investments | | Shares | | | Value | |
| EXCHANGE TRADED FUNDS — 99.1% | |
| | | | | | | | | |
| Equity Fund — 99.1% | | | | | | | | |
| Invesco S&P 500 Low Volatility ETF | | | 689,643 | | | $ | 42,757,866 | |
| Invesco S&P 500 Pure Value ETF | | | 542,110 | | | | 40,707,040 | |
Total Exchange Traded Funds
(Cost $90,147,136) | | | | | | | 83,464,906 | |
| | | | | | | | | |
| MONEY MARKET FUND — 1.0% | |
BlackRock Liquidity Funds Treasury Trust Fund Portfolio, Institutional Class, 1.03%(a)
(Cost $815,811) | | | 815,811 | | | | 815,811 | |
| | | | | | | | | |
Total Investments — 100.1%
(Cost $90,962,947) | | | | | | | 84,280,717 | |
| Liabilities in Excess of Other Assets — (0.1%) | | | | | | | (104,041 | ) |
| Net Assets — 100.0% | | | | | | $ | 84,176,676 | |
ETF — Exchange Traded Fund
| (a) | Rate shown reflects the 7-day yield as of June 30, 2022. |
See accompanying Notes to Financial Statements.
ADVISORSHARES DORSEY WRIGHT FSM ALL CAP WORLD ETF
Schedule of Investments (continued)
June 30, 2022
Fair Value Measurements
The following is a summary of the inputs used, as of June 30, 2022, in valuing the Fund’s assets and liabilities carried at fair value. These inputs are summarized in three broad levels. Level 1 includes quoted prices in active markets for identical securities. Level 2 includes other significant observable inputs (including quoted prices for similar securities, interest rates, prepayment speeds and credit risk). Level 3 includes significant unobservable inputs (including the Fund’s own assumptions in determining the fair value of investments). The level assigned to the securities valuations may not be an indication of the risk or liquidity associated with investing in those securities.
| Assets | | Level 1 | | | Level 2 | | | Level 3 | | | Total | |
| Exchange Traded Funds | | $ | 83,464,906 | | | $ | — | | | $ | — | | | $ | 83,464,906 | |
| Money Market Fund | | | 815,811 | | | | — | | | | — | | | | 815,811 | |
| Total | | $ | 84,280,717 | | | $ | — | | | $ | — | | | $ | 84,280,717 | |
SUMMARY OF SCHEDULE OF INVESTMENTS
| | | % of
Net Assets | |
| Equity Fund | | | 99.1 | % |
| Money Market Fund | | | 1.0 | |
| Total Investments | | | 100.1 | |
| Liabilities in Excess of Other Assets | | | (0.1 | ) |
| Net Assets | | | 100.0 | % |
See accompanying Notes to Financial Statements.
ADVISORSHARES DORSEY WRIGHT FSM US CORE ETF
Schedule of Investments
June 30, 2022
| Investments | | Shares/
Principal | | | Value | |
| EXCHANGE TRADED FUNDS — 99.7% | |
| | | | | | | | | |
| Equity Fund — 99.7% | |
| Invesco S&P 500 Equal Weight ETF(a) | | | 288,667 | | | $ | 38,747,772 | |
| Invesco S&P 500 Low Volatility ETF | | | 657,150 | | | | 40,743,300 | |
Total Exchange Traded Funds
(Cost $86,548,432) | | | | | | | 79,491,072 | |
| | | | | | | | | |
| MONEY MARKET FUNDS — 4.0% | |
| BlackRock Liquidity Funds FedFund Portfolio, Institutional Class, Institutional Class, 1.32%(b)(c) | | | 399,000 | | | | 399,000 | |
| BlackRock Liquidity Funds Treasury Trust Fund Portfolio, Institutional Class, 1.03%(b) | | | 354,719 | | | | 354,719 | |
| Goldman Sachs Financial Square Government Fund — Institutional Shares, Institutional Class, 1.36%(b)(c) | | | 399,000 | | | | 399,000 | |
| Invesco Government & Agency Portfolio, Institutional Class, Institutional Class, 1.39%(b)(c) | | | 399,000 | | | | 399,000 | |
| Morgan Stanley Institutional Liquidity Funds — Government Portfolio, Institutional Class, 1.38%(b)(c) | | | 1,600,000 | | | | 1,600,000 | |
Total Money Market Funds
(Cost $3,151,719) | | | | | | | 3,151,719 | |
| | | | | | | | | |
| REPURCHASE AGREEMENTS — 34.4%(c) | |
| BofA Securities, Inc., dated 06/30/22, due 07/01/22, 1.55%, total to be received $7,043,355, (collateralized by various U.S. Government Agency Obligations, 1.00%-8.50%, 1/20/24-6/20/52, totaling $7,183,913) | | $ | 7,043,052 | | | | 7,043,052 | |
| Daiwa Capital Markets America, dated 06/30/22, due 07/01/22, 1.55%, total to be received $7,043,355, (collateralized by various U.S. Government Agency Obligations, 0.00%-6.50%,7/31/22-7/1/52, totaling $7,183,913) | | | 7,043,052 | | | | 7,043,052 | |
| Investments | | Shares/
Principal | | | Value | |
| REPURCHASE AGREEMENTS (continued) | |
| Nomura Securities International, Inc., dated 06/30/22, due 07/01/22, 1.54%, total to be received $6,333,003, (collateralized by various U.S. Government Agency Obligations, 1.50%-6.50%, 7/1/27-6/1/52, totaling $6,459,389) | | $ | 6,332,732 | | | $ | 6,332,732 | |
| RBC Dominion Securities, Inc., dated 06/30/22, due 07/01/22, 1.55%, total to be received $7,043,355, (collateralized by various U.S. Government Agency Obligations, 0.00%-6.88%, 8/16/22-5/20/52, totaling $7,183,913) | | | 7,043,052 | | | | 7,043,052 | |
Total Repurchase Agreements
(Cost $27,461,888) | | | | | | | 27,461,888 | |
| | | | | | | | | |
Total Investments — 138.1%
(Cost $117,162,039) | | | | | | | 110,104,679 | |
| Liabilities in Excess of Other Assets — (38.1%) | | | | | | | (30,341,151 | ) |
| Net Assets — 100.0% | | | | | | $ | 79,763,528 | |
ETF — Exchange Traded Fund
| (a) | All or a portion of security is on loan. The aggregate market value of the securities on loan is $29,423,216; the aggregate market value of the collateral held by the fund is $30,258,888. |
| (b) | Rate shown reflects the 7-day yield as of June 30, 2022. |
| (c) | Collateral received from brokers for securities lending was invested in these short-term investments. |
See accompanying Notes to Financial Statements.
ADVISORSHARES DORSEY WRIGHT FSM US CORE ETF
Schedule of Investments (continued)
June 30, 2022
Fair Value Measurements
The following is a summary of the inputs used, as of June 30, 2022, in valuing the Fund’s assets and liabilities carried at fair value. These inputs are summarized in three broad levels. Level 1 includes quoted prices in active markets for identical securities. Level 2 includes other significant observable inputs (including quoted prices for similar securities, interest rates, prepayment speeds and credit risk). Level 3 includes significant unobservable inputs (including the Fund’s own assumptions in determining the fair value of investments). The level assigned to the securities valuations may not be an indication of the risk or liquidity associated with investing in those securities.
| Assets | | Level 1 | | | Level 2 | | | Level 3 | | | Total | |
| Exchange Traded Funds | | $ | 79,491,072 | | | $ | — | | | $ | — | | | $ | 79,491,072 | |
| Money Market Funds | | | 3,151,719 | | | | — | | | | — | | | | 3,151,719 | |
| Repurchase Agreements | | | — | | | | 27,461,888 | | | | — | | | | 27,461,888 | |
| Total | | $ | 82,642,791 | | | $ | 27,461,888 | | | $ | — | | | $ | 110,104,679 | |
SUMMARY OF SCHEDULE OF INVESTMENTS
| | | % of
Net Assets | |
| Equity Fund | | | 99.7 | % |
| Money Market Funds | | | 4.0 | |
| Repurchase Agreements | | | 34.4 | |
| Total Investments | | | 138.1 | |
| Liabilities in Excess of Other Assets | | | (38.1 | ) |
| Net Assets | | | 100.0 | % |
See accompanying Notes to Financial Statements.
ADVISORSHARES DORSEY WRIGHT MICRO-CAP ETF
Schedule of Investments
June 30, 2022
| Investments | | Shares | | | Value | |
| COMMON STOCKS — 99.8% | |
| | | | | | | | | |
| Advertising — 1.3% | |
| Entravision Communications Corp., Class A | | | 10,692 | | | $ | 48,756 | |
| Stagwell, Inc.*(a) | | | 8,686 | | | | 47,165 | |
| Total Advertising | | | | | | | 95,921 | |
| | | | | | | | | |
| Banks — 17.5% | |
| Amalgamated Financial Corp. | | | 1,800 | | | | 35,604 | |
| BayCom Corp. | | | 2,034 | | | | 42,063 | |
| BCB Bancorp, Inc. | | | 2,000 | | | | 34,060 | |
| Business First Bancshares, Inc. | | | 1,604 | | | | 34,181 | |
| Byline Bancorp, Inc. | | | 1,892 | | | | 45,029 | |
| Capstar Financial Holdings, Inc. | | | 2,294 | | | | 45,008 | |
| Carter Bankshares, Inc.* | | | 2,615 | | | | 34,518 | |
| Coastal Financial Corp.* | | | 1,522 | | | | 58,019 | |
| Esquire Financial Holdings, Inc. | | | 1,420 | | | | 47,286 | |
| Farmers & Merchants Bancorp, Inc. | | | 1,077 | | | | 35,746 | |
| First Bank | | | 3,297 | | | | 46,092 | |
| First Business Financial Services, Inc. | | | 1,288 | | | | 40,173 | |
| First Foundation, Inc. | | | 1,725 | | | | 35,328 | |
| First Internet Bancorp | | | 990 | | | | 36,452 | |
| Five Star Bancorp | | | 1,404 | | | | 37,094 | |
| Hanmi Financial Corp. | | | 2,166 | | | | 48,605 | |
| John Marshall Bancorp, Inc. | | | 1,400 | | | | 31,556 | |
| Mercantile Bank Corp. | | | 1,164 | | | | 37,190 | |
| Metrocity Bankshares, Inc. | | | 1,528 | | | | 31,034 | |
| Metropolitan Bank Holding Corp.* | | | 723 | | | | 50,191 | |
| Midland States Bancorp, Inc. | | | 1,468 | | | | 35,291 | |
| MVB Financial Corp. | | | 1,277 | | | | 39,727 | |
| Northeast Bank | | | 1,366 | | | | 49,900 | |
| Old Second Bancorp, Inc. | | | 3,100 | | | | 41,478 | |
| OP Bancorp | | | 3,000 | | | | 31,470 | |
| PCB Bancorp | | | 2,299 | | | | 42,945 | |
| Peapack-Gladstone Financial Corp. | | | 1,084 | | | | 32,195 | |
| Permianville Royalty Trust | | | 9,657 | | | | 32,158 | |
| Provident Bancorp, Inc. | | | 2,779 | | | | 43,630 | |
| Republic First Bancorp, Inc.* | | | 8,008 | | | | 30,510 | |
| Shore Bancshares, Inc. | | | 2,072 | | | | 38,332 | |
| South Plains Financial, Inc. | | | 1,188 | | | | 28,678 | |
| Unity Bancorp, Inc. | | | 1,350 | | | | 35,748 | |
| Total Banks | | | | | | | 1,287,291 | |
| Investments | | Shares | | | Value | |
| COMMON STOCKS (continued) | |
| | | | | | | | | |
| Biotechnology — 1.2% | |
| Bioceres Crop Solutions Corp. (Argentina)*(a) | | | 3,151 | | | $ | 43,200 | |
| CTI BioPharma Corp.*(a) | | | 8,100 | | | | 48,357 | |
| Total Biotechnology | | | | | | | 91,557 | |
| | | | | | | | | |
| Chemicals — 2.4% | |
| AdvanSix, Inc. | | | 1,504 | | | | 50,294 | |
| CVR Partners LP | | | 941 | | | | 93,959 | |
| Hawkins, Inc. | | | 866 | | | | 31,202 | |
| Total Chemicals | | | | | | | 175,455 | |
| | | | | | | | | |
| Coal — 5.6% | |
| Alpha Metallurgical Resources, Inc. | | | 1,846 | | | | 238,374 | |
| Hallador Energy Co.* | | | 9,100 | | | | 49,231 | |
| NACCO Industries, Inc., Class A | | | 1,000 | | | | 37,900 | |
| Natural Resource Partners LP | | | 1,432 | | | | 53,313 | |
| SunCoke Energy, Inc. | | | 5,066 | | | | 34,500 | |
| Total Coal | | | | | | | 413,318 | |
| | | | | | | | | |
| Commercial Services — 10.7% | |
| Alta Equipment Group, Inc.* | | | 3,031 | | | | 27,188 | |
| Barrett Business Services, Inc. | | | 500 | | | | 36,435 | |
| Carriage Services, Inc. | | | 970 | | | | 38,460 | |
| Civeo Corp.* | | | 1,990 | | | | 51,481 | |
| CRA International, Inc. | | | 527 | | | | 47,072 | |
| Cross Country Healthcare, Inc.* | | | 2,824 | | | | 58,824 | |
| DLH Holdings Corp.* | | | 2,405 | | | | 36,652 | |
| Franklin Covey Co.* | | | 1,110 | | | | 51,260 | |
| Hackett Group, Inc. (The) | | | 2,140 | | | | 40,596 | |
| HireQuest, Inc.(a) | | | 2,208 | | | | 31,111 | |
| Hudson Global, Inc.* | | | 1,084 | | | | 34,038 | |
| Information Services Group, Inc. | | | 8,086 | | | | 54,661 | |
| PFSweb, Inc.* | | | 3,441 | | | | 40,466 | |
| RCM Technologies, Inc.* | | | 5,544 | | | | 112,210 | |
| SEACOR Marine Holdings, Inc.* | | | 4,639 | | | | 26,721 | |
| Textainer Group Holdings Ltd. (China) | | | 1,918 | | | | 52,572 | |
| Transcat, Inc.* | | | 897 | | | | 50,959 | |
| Total Commercial Services | | | | | | | 790,706 | |
| | | | | | | | | |
| Distribution/Wholesale — 4.1% | |
| A-Mark Precious Metals, Inc. | | | 1,200 | | | | 38,700 | |
| Hudson Technologies, Inc.* | | | 11,308 | | | | 84,923 | |
| Titan Machinery, Inc.* | | | 1,617 | | | | 36,237 | |
| Veritiv Corp.* | | | 996 | | | | 108,116 | |
See accompanying Notes to Financial Statements.
ADVISORSHARES DORSEY WRIGHT MICRO-CAP ETF
Schedule of Investments (continued)
June 30, 2022
| Investments | | Shares | | | Value | |
| COMMON STOCKS (continued) | |
| | | | | | | | | |
| Distribution/Wholesale (continued) | |
| VSE Corp. | | | 816 | | | $ | 30,665 | |
| Total Distribution/Wholesale | | | | | | | 298,641 | |
| | | | | | | | | |
| Diversified Financial Services — 3.7% | |
| Diamond Hill Investment Group, Inc. | | | 210 | | | | 36,464 | |
| EZCORP, Inc., Class A* | | | 6,088 | | | | 45,721 | |
| GAMCO Investors, Inc., Class A | | | 1,772 | | | | 37,035 | |
| Oppenheimer Holdings, Inc., Class A | | | 938 | | | | 30,991 | |
| Regional Management Corp. | | | 1,280 | | | | 47,834 | |
| Silvercrest Asset Management Group, Inc., Class A | | | 2,073 | | | | 34,018 | |
| Velocity Financial, Inc.* | | | 3,607 | | | | 39,641 | |
| Total Diversified Financial Services | | | | | | | 271,704 | |
| | | | | | | | | |
| Electrical Components & Equipment — 0.5% | |
| Insteel Industries, Inc. | | | 1,142 | | | | 38,451 | |
| | | | | | | | | |
| Electronics — 1.6% | |
| Bel Fuse, Inc., Class B | | | 2,616 | | | | 40,705 | |
| CyberOptics Corp.* | | | 1,026 | | | | 35,848 | |
| Kimball Electronics, Inc.* | | | 1,926 | | | | 38,713 | |
| Total Electronics | | | | | | | 115,266 | |
| | | | | | | | | |
| Energy — Alternate Sources — 0.4% | |
| REX American Resources Corp.* | | | 349 | | | | 29,595 | |
| | | | | | | | | |
| Engineering & Construction — 1.3% | |
| MYR Group, Inc.* | | | 652 | | | | 57,461 | |
| Sterling Infrastructure, Inc.* | | | 1,698 | | | | 37,220 | |
| Total Engineering & Construction | | | | | | | 94,681 | |
| | | | | | | | | |
| Entertainment — 0.9% | |
| Golden Entertainment, Inc.* | | | 1,715 | | | | 67,828 | |
| | | | | | | | | |
| Environmental Control — 0.5% | |
| Heritage-Crystal Clean, Inc.* | | | 1,402 | | | | 37,798 | |
| | | | | | | | | |
| Food — 1.1% | |
| Natural Grocers by Vitamin Cottage, Inc. | | | 2,480 | | | | 39,556 | |
| Seneca Foods Corp., Class A* | | | 735 | | | | 40,822 | |
| Total Food | | | | | | | 80,378 | |
| | | | | | | | | |
| Gas — 0.5% | |
| Global Partners LP | | | 1,696 | | | | 39,856 | |
| Investments | | Shares | | | Value | |
| COMMON STOCKS (continued) | |
| | | | | | | | | |
| Holding Companies – Diversified — 0.5% | |
| Professional Holding Corp., Class A* | | | 1,969 | | | $ | 39,478 | |
| | | | | | | | | |
| Home Furnishings — 0.4% | |
| Ethan Allen Interiors, Inc. | | | 1,512 | | | | 30,558 | |
| | | | | | | | | |
| Insurance — 1.7% | |
| Investors Title Co. | | | 227 | | | | 35,614 | |
| MBIA, Inc.* | | | 3,625 | | | | 44,769 | |
| Tiptree, Inc. | | | 4,399 | | | | 46,717 | |
| Total Insurance | | | | | | | 127,100 | |
| | | | | | | | | |
| Internet — 1.2% | |
| DHI Group, Inc.* | | | 9,894 | | | | 49,173 | |
| Focus Universal, Inc.*(a) | | | 3,712 | | | | 42,391 | |
| Total Internet | | | | | | | 91,564 | |
| | | | | | | | | |
| Leisure Time — 0.9% | |
| Vista Outdoor, Inc.* | | | 2,303 | | | | 64,254 | |
| | | | | | | | | |
| Lodging — 0.6% | |
| Bluegreen Vacations Holding Corp. | | | 1,828 | | | | 45,627 | |
| | | | | | | | | |
| Media — 1.7% | |
| Thryv Holdings, Inc.* | | | 1,800 | | | | 40,302 | |
| Townsquare Media, Inc., Class A* | | | 3,900 | | | | 31,941 | |
| Value Line, Inc. | | | 846 | | | | 55,878 | |
| Total Media | | | | | | | 128,121 | |
| | | | | | | | | |
| Metal Fabricate/Hardware — 3.3% | |
| Northwest Pipe Co.* | | | 1,200 | | | | 35,928 | |
| Steel Partners Holdings LP* | | | 3,240 | | | | 135,999 | |
| TimkenSteel Corp.* | | | 3,858 | | | | 72,183 | |
| Total Metal Fabricate/Hardware | | | | | | | 244,110 | |
| | | | | | | | | |
| Miscellaneous Manufacturing — 0.5% | |
| Haynes International, Inc. | | | 1,094 | | | | 35,850 | |
| | | | | | | | | |
| Oil & Gas — 12.7% | |
| Amplify Energy Corp.* | | | 8,854 | | | | 57,905 | |
| Berry Corp. | | | 5,109 | | | | 38,931 | |
| BP Prudhoe Bay Royalty Trust | | | 2,703 | | | | 55,330 | |
| Calumet Specialty Products Partners LP* | | | 7,484 | | | | 77,759 | |
| Cross Timbers Royalty Trust | | | 2,202 | | | | 33,426 | |
| Epsilon Energy Ltd. | | | 5,972 | | | | 35,175 | |
See accompanying Notes to Financial Statements.
ADVISORSHARES DORSEY WRIGHT MICRO-CAP ETF
Schedule of Investments (continued)
June 30, 2022
| Investments | | Shares | | | Value | |
| COMMON STOCKS (continued) | |
| | | | | | | | | |
| Oil & Gas (continued) | |
| Kimbell Royalty Partners LP | | | 3,200 | | | $ | 50,176 | |
| North European Oil Royalty Trust | | | 2,440 | | | | 29,939 | |
| Permian Basin Royalty Trust | | | 6,221 | | | | 102,958 | |
| Ranger Oil Corp., Class A* | | | 1,500 | | | | 49,305 | |
| Sabine Royalty Trust | | | 698 | | | | 42,494 | |
| San Juan Basin Royalty Trust | | | 8,421 | | | | 73,094 | |
| SandRidge Energy, Inc.* | | | 7,993 | | | | 125,250 | |
| SilverBow Resources, Inc.*(a) | | | 1,866 | | | | 52,920 | |
| VAALCO Energy, Inc. | | | 10,843 | | | | 75,250 | |
| Voc Energy Trust | | | 5,685 | | | | 36,896 | |
| Total Oil & Gas | | | | | | | 936,808 | |
| | | | | | | | | |
| Oil & Gas Services — 2.4% | |
| Forum Energy Technologies, Inc.* | | | 1,900 | | | | 37,278 | |
| Newpark Resources, Inc.* | | | 10,309 | | | | 31,855 | |
| Select Energy Services, Inc., Class A* | | | 4,333 | | | | 29,551 | |
| Solaris Oilfield Infrastructure, Inc., Class A | | | 3,650 | | | | 39,712 | |
| Tidewater, Inc.* | | | 1,836 | | | | 38,721 | |
| Total Oil & Gas Services | | | | | | | 177,117 | |
| | | | | | | | | |
| Packaging & Containers — 0.6% | |
| UFP Technologies, Inc.* | | | 547 | | | | 43,525 | |
| | | | | | | | | |
| Pharmaceuticals — 0.5% | |
| Tricida, Inc.*(a) | | | 3,440 | | | | 33,299 | |
| | | | | | | | | |
| Pipelines — 0.5% | |
| Green Plains Partners LP | | | 3,144 | | | | 38,294 | |
| | | | | | | | | |
| Real Estate — 0.5% | |
| Stratus Properties, Inc.* | | | 1,048 | | | | 33,772 | |
| | | | | | | | | |
| REITS — 4.1% | |
| BRT Apartments Corp. | | | 2,044 | | | | 43,926 | |
| City Office REIT, Inc. | | | 2,544 | | | | 32,945 | |
| CTO Realty Growth, Inc.(a) | | | 713 | | | | 43,579 | |
| Farmland Partners, Inc. | | | 3,477 | | | | 47,983 | |
| Granite Point Mortgage Trust, Inc. | | | 3,122 | | | | 29,877 | |
| Nexpoint Real Estate Finance, Inc. | | | 1,750 | | | | 35,472 | |
| Plymouth Industrial REIT, Inc. | | | 1,779 | | | | 31,204 | |
| Whitestone REIT | | | 3,355 | | | | 36,066 | |
| Total REITS | | | | | | | 301,052 | |
| Investments | | Shares | | | Value | |
| COMMON STOCKS (continued) | |
| | | | | | | | | |
| Retail — 5.0% | |
| Biglari Holdings, Inc., Class B* | | | 276 | | | $ | 33,865 | |
| Build-A-Bear Workshop, Inc. | | | 2,808 | | | | 46,107 | |
| Caleres, Inc. | | | 1,926 | | | | 50,538 | |
| Cato Corp. (The), Class A | | | 2,831 | | | | 32,868 | |
| Genesco, Inc.* | | | 934 | | | | 46,616 | |
| Good Times Restaurants, Inc.* | | | 1,224 | | | | 3,684 | |
| J Jill, Inc.* | | | 2,099 | | | | 38,391 | |
| Movado Group, Inc. | | | 1,374 | | | | 42,498 | |
| ONE Group Hospitality, Inc. (The)* | | | 5,223 | | | | 38,494 | |
| TravelCenters of America, Inc.* | | | 1,037 | | | | 35,745 | |
| Total Retail | | | | | | | 368,806 | |
| | | | | | | | | |
| Savings & Loans — 1.4% | |
| Greene County Bancorp, Inc. | | | 802 | | | | 36,323 | |
| Hingham Institution For Savings The | | | 111 | | | | 31,498 | |
| HomeTrust Bancshares, Inc. | | | 1,354 | | | | 33,850 | |
| Total Savings & Loans | | | | | | | 101,671 | |
| | | | | | | | | |
| Semiconductors — 1.2% | |
| Richardson Electronics Ltd. | | | 4,375 | | | | 64,138 | |
| SMART Global Holdings, Inc.* | | | 1,473 | | | | 24,113 | |
| Total Semiconductors | | | | | | | 88,251 | |
| | | | | | | | | |
| Software — 1.9% | |
| Computer Programs and Systems, Inc.* | | | 1,100 | | | | 35,167 | |
| Digi International, Inc.* | | | 1,871 | | | | 45,316 | |
| Donnelley Financial Solutions, Inc.* | | | 2,098 | | | | 61,450 | |
| Total Software | | | | | | | 141,933 | |
| | | | | | | | | |
| Transportation — 4.9% | |
| Ardmore Shipping Corp. (Ireland)* | | | 6,400 | | | | 44,608 | |
| Capital Product Partners LP (Greece) | | | 3,489 | | | | 52,858 | |
| Covenant Logistics Group, Inc. | | | 1,570 | | | | 39,391 | |
| Danaos Corp. (Greece) | | | 1,715 | | | | 108,217 | |
| Dorian LPG Ltd. | | | 2,800 | | | | 42,560 | |
| GasLog Partners LP (Greece) | | | 6,600 | | | | 36,630 | |
| OceanPal, Inc. (Greece) | | | 1,026 | | | | 488 | |
| USD Partners LP | | | 6,558 | | | | 34,102 | |
| Total Transportation | | | | | | | 358,854 | |
Total Common Stocks
(Cost $7,679,267) | | | | | | | 7,358,490 | |
See accompanying Notes to Financial Statements.
ADVISORSHARES DORSEY WRIGHT MICRO-CAP ETF
Schedule of Investments (continued)
June 30, 2022
| Investments | | Shares/
Principal | | | Value | |
| MONEY MARKET FUND — 0.5% | |
STIT — Government & Agency Portfolio, Institutional Class, 1.39%(b)
(Cost $38,515) | | | 38,515 | | | $ | 38,515 | |
| | | | | | | | | |
| REPURCHASE AGREEMENTS — 3.9%(c) | |
| Daiwa Capital Markets America, dated 06/30/22, due 07/01/22, 1.49%, total to be received $38,975, (collateralized by various U.S. Government Agency Obligations, 0.00%-7.63%, 7/26/22-2/15/50, totaling $39,752) | | $ | 38,973 | | | | 38,973 | |
| RBC Dominion Securities, Inc., dated 06/30/22, due 07/01/22, 1.55%, total to be received $249,011, (collateralized by various U.S. Government Agency Obligations, 0.00%-6.88%, 8/16/22-5/20/52, totaling $253,980) | | | 249,000 | | | | 249,000 | |
Total Repurchase Agreements
(Cost $287,973) | | | | | | | 287,973 | |
| | | | | | | | | |
Total Investments — 104.2%
(Cost $8,005,755) | | | | | | | 7,684,978 | |
| Liabilities in Excess of Other Assets — (4.2%) | | | | | | | (309,434 | ) |
| Net Assets — 100.0% | | | | | | $ | 7,375,544 | |
LP — Limited Partnership
REITS — Real Estate Investment Trusts
| * | Non-income producing security. |
| (a) | All or a portion of security is on loan. The aggregate market value of the securities on loan is $280,489; the aggregate market value of the collateral held by the fund is $287,973. |
| (b) | Rate shown reflects the 7-day yield as of June 30, 2022. |
| (c) | Collateral received from brokers for securities lending was invested in these short-term investments. |
See accompanying Notes to Financial Statements.
ADVISORSHARES DORSEY WRIGHT MICRO-CAP ETF
Schedule of Investments (continued)
June 30, 2022
Fair Value Measurements
The following is a summary of the inputs used, as of June 30, 2022, in valuing the Fund’s assets and liabilities carried at fair value. These inputs are summarized in three broad levels. Level 1 includes quoted prices in active markets for identical securities. Level 2 includes other significant observable inputs (including quoted prices for similar securities, interest rates, prepayment speeds and credit risk). Level 3 includes significant unobservable inputs (including the Fund’s own assumptions in determining the fair value of investments). The level assigned to the securities valuations may not be an indication of the risk or liquidity associated with investing in those securities.
| Assets | | Level 1 | | | Level 2 | | | Level 3 | | | Total | |
| Common Stocks | | $ | 7,358,490 | | | $ | — | | | $ | — | | | $ | 7,358,490 | |
| Money Market Fund | | | 38,515 | | | | — | | | | — | | | | 38,515 | |
| Repurchase Agreements | | | — | | | | 287,973 | | | | — | | | | 287,973 | |
| Total | | $ | 7,397,005 | | | $ | 287,973 | | | $ | — | | | $ | 7,684,978 | |
SUMMARY OF SCHEDULE OF INVESTMENTS
| | | % of
Net Assets | |
| Advertising | | | 1.3 | % |
| Banks | | | 17.5 | |
| Biotechnology | | | 1.2 | |
| Chemicals | | | 2.4 | |
| Coal | | | 5.6 | |
| Commercial Services | | | 10.7 | |
| Distribution/Wholesale | | | 4.1 | |
| Diversified Financial Services | | | 3.7 | |
| Electrical Components & Equipment | | | 0.5 | |
| Electronics | | | 1.6 | |
| Energy — Alternate Sources | | | 0.4 | |
| Engineering & Construction | | | 1.3 | |
| Entertainment | | | 0.9 | |
| Environmental Control | | | 0.5 | |
| Food | | | 1.1 | |
| Gas | | | 0.5 | |
| Holding Companies — Diversified | | | 0.5 | |
| Home Furnishings | | | 0.4 | |
| Insurance | | | 1.7 | |
| Internet | | | 1.2 | |
| Leisure Time | | | 0.9 | |
SUMMARY OF SCHEDULE OF INVESTMENTS (continued)
| | | % of
Net Assets | |
| Lodging | | | 0.6 | % |
| Media | | | 1.7 | |
| Metal Fabricate/Hardware | | | 3.3 | |
| Miscellaneous Manufacturing | | | 0.5 | |
| Oil & Gas | | | 12.7 | |
| Oil & Gas Services | | | 2.4 | |
| Packaging & Containers | | | 0.6 | |
| Pharmaceuticals | | | 0.5 | |
| Pipelines | | | 0.5 | |
| Real Estate | | | 0.5 | |
| REITS | | | 4.1 | |
| Retail | | | 5.0 | |
| Savings & Loans | | | 1.4 | |
| Semiconductors | | | 1.2 | |
| Software | | | 1.9 | |
| Transportation | | | 4.9 | |
| Money Market Fund | | | 0.5 | |
| Repurchase Agreements | | | 3.9 | |
| Total Investments | | | 104.2 | |
| Liabilities in Excess of Other Assets | | | (4.2 | ) |
| Net Assets | | | 100.0 | % |
See accompanying Notes to Financial Statements.
ADVISORSHARES DORSEY WRIGHT SHORT ETF
Schedule of Investments
June 30, 2022
| Investments | | Shares | | | Value | |
| EXCHANGE TRADED FUND — 20.8% | |
| | | | | | | | | |
| Debt Fund — 20.8% | |
AdvisorShares North Square McKee Core Reserves ETF†
(Cost $9,862,980) | | | 100,000 | | | $ | 9,738,000 | |
| | | | | | | | | |
| MONEY MARKET FUND — 80.5% | |
STIT — Government & Agency Portfolio, Institutional Class, 1.39%(a)(b)
(Cost $37,855,278) | | | 37,855,278 | | | | 37,855,278 | |
Total Investments Before Securities Sold, Not Yet Purchased
(Cost $47,718,258) | | | | | | | 47,593,278 | |
| | | | | | | | | |
| Securities Sold, Not Yet Purchased — (97.0)%(c) | |
| | | | | | | | | |
| WARRANT — (0.7)% | |
| | | | | | | | | |
| Oil & Gas — (0.7)% | |
| Occidental Petroleum Corp., 08/03/27* | | | (8,342 | ) | | | (308,404 | ) |
| | | | | | | | | |
| COMMON STOCKS — (96.3)% | |
| | |
| Aerospace/Defense — (1.0)% | |
| Boeing Co. (The)* | | | (3,610 | ) | | | (493,559 | ) |
| | | | | | | | | |
| Airlines — (1.0)% | |
| JetBlue Airways Corp.* | | | (54,918 | ) | | | (459,664 | ) |
| | | | | | | | | |
| Apparel — (2.5)% | |
| PVH Corp. | | | (7,459 | ) | | | (424,417 | ) |
| Under Armour, Inc., Class C* | | | (38,569 | ) | | | (292,353 | ) |
| VF Corp. | | | (10,574 | ) | | | (467,054 | ) |
| Total Apparel | | | | | | | (1,183,824 | ) |
| | | | | | | | | |
| Auto Manufacturers — (1.0)% | |
| General Motors Co.* | | | (14,092 | ) | | | (447,562 | ) |
| | | | | | | | | |
| Auto Parts & Equipment — (2.0)% | |
| Dana, Inc. | | | (35,158 | ) | | | (494,673 | ) |
| Goodyear Tire & Rubber Co. (The)* | | | (43,281 | ) | | | (463,540 | ) |
| Total Auto Parts & Equipment | | | | | | | (958,213 | ) |
| | | | | | | | | |
| Banks — (3.0)% | |
| Citigroup, Inc. | | | (10,810 | ) | | | (497,152 | ) |
| PacWest Bancorp | | | (17,361 | ) | | | (462,844 | ) |
| Signature Bank | | | (2,586 | ) | | | (463,437 | ) |
| Total Banks | | | | | | | (1,423,433 | ) |
| Investments | | Shares | | | Value | |
| COMMON STOCKS (continued) | |
| | | | | | | | | |
| Biotechnology — (7.9)% | |
| Biogen, Inc.* | | | (2,337 | ) | | $ | (476,608 | ) |
| Bio-Rad Laboratories, Inc., Class A* | | | (1,019 | ) | | | (504,405 | ) |
| Bluebird Bio, Inc.* | | | (152,130 | ) | | | (629,818 | ) |
| FibroGen, Inc.* | | | (58,338 | ) | | | (616,049 | ) |
| Illumina, Inc.* | | | (2,431 | ) | | | (448,179 | ) |
| Nektar Therapeutics* | | | (123,283 | ) | | | (468,476 | ) |
| Sage Therapeutics, Inc.* | | | (17,409 | ) | | | (562,311 | ) |
| Total Biotechnology | | | | | | | (3,705,846 | ) |
| | | | | | | | | |
| Building Materials — (2.8)% | |
| Fortune Brands Home & Security, Inc. | | | (7,280 | ) | | | (435,926 | ) |
| JELD-WEN Holding, Inc.* | | | (24,872 | ) | | | (362,883 | ) |
| Lennox International, Inc. | | | (2,439 | ) | | | (503,873 | ) |
| Total Building Materials | | | | | | | (1,302,682 | ) |
| | | | | | | | | |
| Chemicals — (1.1)% | |
| Ecolab, Inc. | | | (3,338 | ) | | | (513,251 | ) |
| | | | | | | | | |
| Commercial Services — (8.0)% | |
| 2U, Inc.* | | | (61,913 | ) | | | (648,229 | ) |
| Block, Inc.* | | | (8,018 | ) | | | (492,786 | ) |
| Cimpress PLC (Ireland)* | | | (9,039 | ) | | | (351,617 | ) |
| CoStar Group, Inc.* | | | (8,430 | ) | | | (509,256 | ) |
| Global Payments, Inc. | | | (4,623 | ) | | | (511,489 | ) |
| MarketAxess Holdings, Inc. | | | (1,693 | ) | | | (433,425 | ) |
| PayPal Holdings, Inc.* | | | (5,518 | ) | | | (385,377 | ) |
| WW International, Inc.* | | | (68,597 | ) | | | (438,335 | ) |
| Total Commercial Services | | | | | | | (3,770,514 | ) |
| | | | | | | | | |
| Computers — (1.2)% | |
| EPAM Systems, Inc.* | | | (1,946 | ) | | | (573,642 | ) |
| | | | | | | | | |
| Diversified Financial Services — (2.4)% | |
| Bread Financial Holdings, Inc. | | | (9,337 | ) | | | (346,029 | ) |
| LendingTree, Inc.* | | | (7,540 | ) | | | (330,403 | ) |
| T. Rowe Price Group, Inc. | | | (3,980 | ) | | | (452,168 | ) |
| Total Diversified Financial Services | | | | | | | (1,128,600 | ) |
| | | | | | | | | |
| Electrical Components & Equipment — (0.8)% | |
| Universal Display Corp. | | | (3,851 | ) | | | (389,490 | ) |
| | | | | | | | | |
| Electronics — (1.1)% | |
| Garmin Ltd. | | | (5,096 | ) | | | (500,682 | ) |
See accompanying Notes to Financial Statements.
ADVISORSHARES DORSEY WRIGHT SHORT ETF
Schedule of Investments (continued)
June 30, 2022
| Investments | | Shares | | | Value | |
| COMMON STOCKS (continued) | |
| | | | | | | | | |
| Energy — Alternate Sources — (1.2)% | |
| First Solar, Inc.* | | | (8,294 | ) | | $ | (565,070 | ) |
| | | | | | | | | |
| Environmental Control — (0.9)% | |
| Stericycle, Inc.* | | | (9,351 | ) | | | (410,041 | ) |
| | | | | | | | | |
| Food — (1.0)% | |
| Hain Celestial Group, Inc. (The)* | | | (19,065 | ) | | | (452,603 | ) |
| | | | | | | | | |
| Food Service — (1.1)% | |
| Healthcare Services Group, Inc. | | | (29,667 | ) | | | (516,503 | ) |
| | | | | | | | | |
| Hand/Machine Tools — (1.8)% | |
| Kennametal, Inc. | | | (19,921 | ) | | | (462,765 | ) |
| Stanley Black & Decker, Inc. | | | (3,817 | ) | | | (400,250 | ) |
| Total Hand/Machine Tools | | | | | | | (863,015 | ) |
| | | | | | | | | |
| Healthcare — Products — (5.1)% | |
| Align Technology, Inc.* | | | (1,814 | ) | | | (429,319 | ) |
| DENTSPLY SIRONA, Inc. | | | (12,876 | ) | | | (460,060 | ) |
| Exact Sciences Corp.* | | | (12,454 | ) | | | (490,563 | ) |
| IDEXX Laboratories, Inc.* | | | (1,407 | ) | | | (493,477 | ) |
| Masimo Corp.* | | | (3,941 | ) | | | (514,970 | ) |
| Zimvie, Inc.* | | | (288 | ) | | | (4,611 | ) |
| Total Healthcare — Products | | | | | | | (2,393,000 | ) |
| | | | | | | | | |
| Healthcare — Services — (2.1)% | |
| Charles River Laboratories International, Inc.* | | | (2,095 | ) | | | (448,267 | ) |
| MEDNAX, Inc.* | | | (26,052 | ) | | | (547,353 | ) |
| Total Healthcare — Services | | | | | | | (995,620 | ) |
| | | | | | | | | |
| Home Builders — (1.0)% | |
| Thor Industries, Inc. | | | (6,167 | ) | | | (460,860 | ) |
| | | | | | | | | |
| Housewares — (0.7)% | |
| Scotts Miracle-Gro Co. (The) | | | (4,356 | ) | | | (344,080 | ) |
| | | | | | | | | |
| Internet — (6.5)% | |
| eBay, Inc. | | | (10,579 | ) | | | (440,827 | ) |
| Meta Platforms, Inc., Class A* | | | (2,534 | ) | | | (408,608 | ) |
| Netflix, Inc.* | | | (2,591 | ) | | | (453,088 | ) |
| Snap, Inc., Class A* | | | (36,590 | ) | | | (480,427 | ) |
| TripAdvisor, Inc.* | | | (20,678 | ) | | | (368,068 | ) |
| Wayfair, Inc., Class A* | | | (10,184 | ) | | | (443,615 | ) |
| Zillow Group, Inc., Class A* | | | (14,388 | ) | | | (457,682 | ) |
| Total Internet | | | | | | | (3,052,315 | ) |
| Investments | | Shares | | | Value | |
| COMMON STOCKS (continued) | |
| | | | | | | | | |
| Leisure Time — (1.2)% | |
| Carnival Corp.* | | | (31,710 | ) | | $ | (274,292 | ) |
| Norwegian Cruise Line Holdings Ltd.* | | | (27,902 | ) | | | (310,270 | ) |
| Total Leisure Time | | | | | | | (584,562 | ) |
| | | | | | | | | |
| Lodging — (2.1)% | |
| Las Vegas Sands Corp.* | | | (15,436 | ) | | | (518,495 | ) |
| Wynn Resorts Ltd.* | | | (7,885 | ) | | | (449,288 | ) |
| Total Lodging | | | | | | | (967,783 | ) |
| | | | | | | | | |
| Machinery — Diversified — (2.1)% | |
| Cognex Corp. | | | (10,822 | ) | | | (460,151 | ) |
| Xylem, Inc. | | | (6,610 | ) | | | (516,770 | ) |
| Total Machinery — Diversified | | | | | | | (976,921 | ) |
| | | | | | | | | |
| Media — (5.3)% | |
| Altice USA, Inc., Class A* | | | (50,208 | ) | | | (464,424 | ) |
| Cable One, Inc. | | | (382 | ) | | | (492,520 | ) |
| Charter Communications, Inc., Class A* | | | (975 | ) | | | (456,817 | ) |
| DISH Network Corp., Class A* | | | (19,077 | ) | | | (342,051 | ) |
| Walt Disney Co. (The)* | | | (3,878 | ) | | | (366,083 | ) |
| Warner Bros Discovery, Inc.* | | | (26,025 | ) | | | (349,255 | ) |
| Total Media | | | | | | | (2,471,150 | ) |
| | | | | | | | | |
| Office/Business Equipment — (0.9)% | |
| Zebra Technologies Corp., Class A* | | | (1,385 | ) | | | (407,121 | ) |
| | | | | | | | | |
| Pharmaceuticals — (1.8)% | |
| Agios Pharmaceuticals, Inc.* | | | (18,612 | ) | | | (412,628 | ) |
| Herbalife Nutrition Ltd.* | | | (20,742 | ) | | | (424,174 | ) |
| Organon & Co. | | | (250 | ) | | | (8,437 | ) |
| Total Pharmaceuticals | | | | | | | (845,239 | ) |
| | | | | | | | | |
| REITS — (1.7)% | |
| Diversified Healthcare Trust | | | (205,905 | ) | | | (374,747 | ) |
| Service Properties Trust | | | (82,644 | ) | | | (432,228 | ) |
| Total REITS | | | | | | | (806,975 | ) |
| | | | | | | | | |
| Retail — (8.0)% | |
| Best Buy Co., Inc. | | | (6,077 | ) | | | (396,160 | ) |
| Burlington Stores, Inc.* | | | (2,497 | ) | | | (340,166 | ) |
| CarMax, Inc.* | | | (5,705 | ) | | | (516,188 | ) |
| Cracker Barrel Old Country Store, Inc. | | | (3,900 | ) | | | (325,611 | ) |
| Floor & Decor Holdings, Inc., Class A* | | | (6,923 | ) | | | (435,872 | ) |
| Foot Locker, Inc. | | | (19,399 | ) | | | (489,825 | ) |
See accompanying Notes to Financial Statements.
ADVISORSHARES DORSEY WRIGHT SHORT ETF
Schedule of Investments (continued)
June 30, 2022
| Investments | | Shares | | | Value | |
| COMMON STOCKS (continued) | |
| | | | | | | | | |
| Retail (continued) | |
| Gap, Inc. (The) | | | (51,557 | ) | | $ | (424,830 | ) |
| Qurate Retail, Inc., Series A | | | (121,447 | ) | | | (348,553 | ) |
| Starbucks Corp. | | | (6,569 | ) | | | (501,806 | ) |
| Total Retail | | | | | | | (3,779,011 | ) |
| | | | | | | | | |
| Semiconductors — (3.7)% | |
| IPG Photonics Corp.* | | | (4,883 | ) | | | (459,637 | ) |
| MKS Instruments, Inc. | | | (4,421 | ) | | | (453,727 | ) |
| Qorvo, Inc.* | | | (4,472 | ) | | | (421,799 | ) |
| Skyworks Solutions, Inc. | | | (4,295 | ) | | | (397,889 | ) |
| Total Semiconductors | | | | | | | (1,733,052 | ) |
| | | | | | | | | |
| Software — (10.2)% | |
| Adobe, Inc.* | | | (1,265 | ) | | | (463,066 | ) |
| ANSYS, Inc.* | | | (1,973 | ) | | | (472,119 | ) |
| Autodesk, Inc.* | | | (2,719 | ) | | | (467,559 | ) |
| Guidewire Software, Inc.* | | | (6,488 | ) | | | (460,583 | ) |
| Paycom Software, Inc.* | | | (1,798 | ) | | | (503,656 | ) |
| Pegasystems, Inc. | | | (10,492 | ) | | | (501,937 | ) |
| Salesforce, Inc.* | | | (2,872 | ) | | | (473,995 | ) |
| Take-Two Interactive Software, Inc.* | | | (4,083 | ) | | | (500,290 | ) |
| Veeva Systems, Inc., Class A* | | | (2,532 | ) | | | (501,437 | ) |
| Workday, Inc., Class A* | | | (3,282 | ) | | | (458,102 | ) |
| Total Software | | | | | | | (4,802,744 | ) |
| Investments | | Shares | | | Value | |
| COMMON STOCKS (continued) | |
| | | | | | | | | |
| Telecommunications — (1.1)% | |
| CommScope Holding Co., Inc.* | | | (87,678 | ) | | $ | (536,589 | ) |
| | | | | | | | | |
| Transportation — (1.0)% | |
| XPO Logistics, Inc.* | | | (9,782 | ) | | | (471,101 | ) |
| Total Securities Sold, Not Yet Purchased [Proceeds Received $(57,291,239)] | | | | | | $ | (45,594,721 | ) |
| | | | | | | | | |
Total Investments — 4.3%
(Cost $(9,572,981)) | | | | | | | 1,998,557 | |
| Other Assets in Excess of Liabilities — 95.7% | | | | | | | 45,000,702 | |
| Net Assets — 100.0% | | | | | | $ | 46,999,259 | |
ETF — Exchange Traded Fund
PLC — Public Limited Company
REITS — Real Estate Investment Trusts
| * | Non-income producing security. |
| (a) | Rate shown reflects the 7-day yield as of June 30, 2022. |
| (b) | A portion of this security has been pledged as collateral for securities sold, not yet purchased. |
| (c) | As of June 30, 2022 cash in the amount of $38,725,679 has been segregated as collateral from the broker for securities sold short. |
See accompanying Notes to Financial Statements.
ADVISORSHARES DORSEY WRIGHT SHORT ETF
Schedule of Investments (continued)
June 30, 2022
Fair Value Measurements
The following is a summary of the inputs used, as of June 30, 2022, in valuing the Fund’s assets and liabilities carried at fair value. These inputs are summarized in three broad levels. Level 1 includes quoted prices in active markets for identical securities. Level 2 includes other significant observable inputs (including quoted prices for similar securities, interest rates, prepayment speeds and credit risk). Level 3 includes significant unobservable inputs (including the Fund’s own assumptions in determining the fair value of investments). The level assigned to the securities valuations may not be an indication of the risk or liquidity associated with investing in those securities.
| Assets | | Level 1 | | | Level 2 | | | Level 3 | | | Total | |
| Exchange Traded Fund | | $ | 9,738,000 | | | $ | — | | | $ | — | | | $ | 9,738,000 | |
| Money Market Fund | | | 37,855,278 | | | | — | | | | — | | | | 37,855,278 | |
| Total | | $ | 47,593,278 | | | $ | — | | | $ | — | | | $ | 47,593,278 | |
| Liabilities | | Level 1 | | | Level 2 | | | Level 3 | | | Total | |
| Warrant | | $ | (308,404 | ) | | $ | — | | | $ | — | | | $ | (308,404 | ) |
| Common Stocks | | | (45,286,317 | ) | | | — | | | | — | | | | (45,286,317 | ) |
| Total | | $ | (45,594,721 | ) | | $ | — | | | $ | — | | | $ | (45,594,721 | ) |
Affiliated holdings are funds which are managed by the Trust or an affiliate of the Trust. Transactions with affiliated companies during the year ended June 30, 2022 were as follows:
| Affiliated Holding Name | | Value at 6/30/2021 | | | Purchases/ Additions | | | Sales/ Reductions | | | Realized Gain (Loss) | | | Change in Unrealized Gain (Loss) | | | Number of Shares at 6/30/2022 | | | Value at 6/30/2022 | | | Dividend Income | |
| AdvisorShares North Square McKee Core Reserves ETF | | $ | 9,868,000 | | | $ | — | | | $ | — | | | $ | — | | | $ | (130,000 | ) | | | 100,000 | | | $ | 9,738,000 | | | $ | 53,835 | |
See accompanying Notes to Financial Statements.
ADVISORSHARES DORSEY WRIGHT SHORT ETF
Schedule of Investments (continued)
June 30, 2022
SUMMARY OF SCHEDULE OF INVESTMENTS
| | | % of
Net Assets | |
| Aerospace/Defense | | | (1.0 | )% |
| Airlines | | | (1.0 | ) |
| Apparel | | | (2.5 | ) |
| Auto Manufacturers | | | (1.0 | ) |
| Auto Parts & Equipment | | | (2.0 | ) |
| Banks | | | (3.0 | ) |
| Biotechnology | | | (7.9 | ) |
| Building Materials | | | (2.8 | ) |
| Chemicals | | | (1.1 | ) |
| Commercial Services | | | (8.0 | ) |
| Computers | | | (1.2 | ) |
| Debt Fund | | | 20.8 | |
| Diversified Financial Services | | | (2.4 | ) |
| Electrical Components & Equipment | | | (0.8 | ) |
| Electronics | | | (1.1 | ) |
| Energy – Alternate Sources | | | (1.2 | ) |
| Environmental Control | | | (0.9 | ) |
| Food | | | (1.0 | ) |
| Food Service | | | (1.1 | ) |
| Hand/Machine Tools | | | (1.8 | ) |
| Healthcare – Products | | | (5.1 | ) |
SUMMARY OF SCHEDULE OF INVESTMENTS (continued)
| | | % of
Net Assets | |
| Healthcare – Services | | | (2.1 | )% |
| Home Builders | | | (1.0 | ) |
| Housewares | | | (0.7 | ) |
| Internet | | | (6.5 | ) |
| Leisure Time | | | (1.2 | ) |
| Lodging | | | (2.1 | ) |
| Machinery – Diversified | | | (2.1 | ) |
| Media | | | (5.3 | ) |
| Office/Business Equipment | | | (0.9 | ) |
| Oil & Gas | | | (0.7 | ) |
| Pharmaceuticals | | | (1.8 | ) |
| REITS | | | (1.7 | ) |
| Retail | | | (8.0 | ) |
| Semiconductors | | | (3.7 | ) |
| Software | | | (10.2 | ) |
| Telecommunications | | | (1.1 | ) |
| Transportation | | | (1.0 | ) |
| Money Market Fund | | | 80.5 | |
| Total Investments | | | 4.3 | |
| Other Assets in Excess of Liabilities | | | 95.7 | |
| Net Assets | | | 100.0 | % |
See accompanying Notes to Financial Statements.
ADVISORSHARES DOUBLELINE VALUE EQUITY ETF
Schedule of Investments
June 30, 2022
| Investments | | Shares | | | Value | |
| COMMON STOCKS — 95.3% | |
| | | | | | | | | |
| Aerospace/Defense — 4.4% | |
| Boeing Co. (The)* | | | 7,567 | | | $ | 1,034,560 | |
| Raytheon Technologies Corp. | | | 10,340 | | | | 993,778 | |
| Total Aerospace/Defense | | | | | | | 2,028,338 | |
| | | | | | | | | |
| Agriculture — 2.5% | |
| Philip Morris International, Inc. | | | 11,813 | | | | 1,166,416 | |
| | | | | | | | | |
| Banks — 9.4% | |
| Citigroup, Inc. | | | 25,245 | | | | 1,161,017 | |
| Citizens Financial Group, Inc. | | | 22,774 | | | | 812,804 | |
| State Street Corp. | | | 14,506 | | | | 894,295 | |
| Wells Fargo & Co. | | | 37,793 | | | | 1,480,352 | |
| Total Banks | | | | | | | 4,348,468 | |
| | | | | | | | | |
| Beverages — 2.0% | |
| PepsiCo, Inc. | | | 5,492 | | | | 915,297 | |
| | | | | | | | | |
| Biotechnology — 1.3% | |
| BioMarin Pharmaceutical, Inc.* | | | 7,096 | | | | 588,045 | |
| | | | | | | | | |
| Chemicals — 3.2% | |
| DuPont de Nemours, Inc. | | | 13,821 | | | | 768,171 | |
| International Flavors & Fragrances, Inc. | | | 6,093 | | | | 725,798 | |
| Total Chemicals | | | | | | | 1,493,969 | |
| | | | | | | | | |
| Commercial Services — 1.2% | |
| Herc Holdings, Inc. | | | 6,066 | | | | 546,850 | |
| | | | | | | | | |
| Computers — 2.2% | |
| KBR, Inc. | | | 21,057 | | | | 1,018,948 | |
| | | | | | | | | |
| Diversified Financial Services — 3.1% | |
| Capital One Financial Corp. | | | 3,947 | | | | 411,238 | |
| Intercontinental Exchange, Inc. | | | 11,203 | | | | 1,053,530 | |
| Total Diversified Financial Services | | | | | | | 1,464,768 | |
| | | | | | | | | |
| Electronics — 4.4% | |
| Flex Ltd.* | | | 34,702 | | | | 502,138 | |
| nVent Electric PLC | | | 25,365 | | | | 794,685 | |
| Vontier Corp. | | | 33,130 | | | | 761,659 | |
| Total Electronics | | | | | | | 2,058,482 | |
| | | | | | | | | |
| Food — 3.8% | |
| Mondelez International, Inc., Class A | | | 17,758 | | | | 1,102,594 | |
| US Foods Holding Corp.* | | | 22,023 | | | | 675,666 | |
| Total Food | | | | | | | 1,778,260 | |
| Investments | | Shares | | | Value | |
| COMMON STOCKS (continued) | |
| | | | | | | | | |
| Healthcare – Products — 3.8% | |
| Alcon, Inc. (Switzerland) | | | 10,428 | | | $ | 728,813 | |
| Medtronic PLC | | | 11,816 | | | | 1,060,486 | |
| Total Healthcare — Products | | | | | | | 1,789,299 | |
| | | | | | | | | |
| Healthcare – Services — 2.3% | |
| Elevance Health, Inc. | | | 2,201 | | | | 1,062,159 | |
| | | | | | | | | |
| Insurance — 6.6% | |
| Chubb Ltd. | | | 6,515 | | | | 1,280,719 | |
| Markel Corp.* | | | 552 | | | | 713,874 | |
| Prudential Financial, Inc. | | | 11,003 | | | | 1,052,767 | |
| Total Insurance | | | | | | | 3,047,360 | |
| | | | | | | | | |
| Internet — 4.4% | |
| Alphabet, Inc., Class A* | | | 619 | | | | 1,348,962 | |
| Amazon.com, Inc.* | | | 2,640 | | | | 280,394 | |
| Meta Platforms, Inc., Class A* | | | 2,560 | | | | 412,800 | |
| Total Internet | | | | | | | 2,042,156 | |
| | | | | | | | | |
| Media — 3.2% | |
| Comcast Corp., Class A | | | 25,873 | | | | 1,015,257 | |
| Warner Bros Discovery, Inc.* | | | 34,236 | | | | 459,447 | |
| Total Media | | | | | | | 1,474,704 | |
| | | | | | | | | |
| Mining — 1.7% | |
| Arconic Corp.* | | | 27,613 | | | | 774,545 | |
| | | | | | | | | |
| Oil & Gas — 7.7% | |
| Chevron Corp. | | | 10,328 | | | | 1,495,288 | |
| EOG Resources, Inc. | | | 10,976 | | | | 1,212,189 | |
| Valero Energy Corp. | | | 8,229 | | | | 874,578 | |
| Total Oil & Gas | | | | | | | 3,582,055 | |
| | | | | | | | | |
| Pharmaceuticals — 10.9% | |
| AstraZeneca PLC (United Kingdom)(a) | | | 22,047 | | | | 1,456,645 | |
| Cigna Corp. | | | 3,830 | | | | 1,009,282 | |
| CVS Health Corp. | | | 12,218 | | | | 1,132,120 | |
| Roche Holding AG(a) | | | 2,787 | | | | 116,246 | |
| Sanofi (France)(a) | | | 26,601 | | | | 1,330,848 | |
| Total Pharmaceuticals | | | | | | | 5,045,141 | |
| | | | | | | | | |
| REITS — 2.5% | |
| American Tower Corp. | | | 2,724 | | | | 696,227 | |
| Boston Properties, Inc. | | | 5,188 | | | | 461,628 | |
| Total REITS | | | | | | | 1,157,855 | |
See accompanying Notes to Financial Statements.
ADVISORSHARES DOUBLELINE VALUE EQUITY ETF
Schedule of Investments (continued)
June 30, 2022
| Investments | | Shares | | | Value | |
| COMMON STOCKS (continued) | |
| | | | | | | | | |
| Retail — 5.2% | |
| Advance Auto Parts, Inc. | | | 4,107 | | | $ | 710,881 | |
| Dollar General Corp. | | | 3,367 | | | | 826,396 | |
| TJX Cos., Inc. (The) | | | 15,596 | | | | 871,037 | |
| Total Retail | | | | | | | 2,408,314 | |
| | | | | | | | | |
| Semiconductors — 0.8% | |
| Microchip Technology, Inc. | | | 6,568 | | | | 381,469 | |
| | | | | | | | | |
| Software — 4.0% | |
| Fidelity National Information Services, Inc. | | | 6,468 | | | | 592,922 | |
| Microsoft Corp. | | | 4,950 | | | | 1,271,308 | |
| Total Software | | | | | | | 1,864,230 | |
| | | | | | | | | |
| Telecommunications — 3.3% | |
| Verizon Communications, Inc. | | | 29,822 | | | | 1,513,466 | |
| | | | | | | | | |
| Transportation — 1.4% | |
| Norfolk Southern Corp. | | | 2,869 | | | | 652,095 | |
Total Common Stocks
(Cost $42,936,319) | | | | | | | 44,202,689 | |
| | | | | | | | | |
| MONEY MARKET FUND — 4.7% | |
Allspring Government Money Market Fund — Institutional Class, 1.20%(b)
(Cost $2,173,736) | | | 2,173,736 | | | | 2,173,736 | |
| | | | | | | | | |
Total Investments — 100.0%
(Cost $45,110,055) | | | | | | | 46,376,425 | |
| Other Assets in Excess of Liabilities — 0.0%** | | | | | | | 1,755 | |
| Net Assets — 100.0% | | | | | | $ | 46,378,180 | |
PLC — Public Limited Company
REITS — Real Estate Investment Trusts
| * | Non-income producing security. |
| (a) | American Depositary Receipt. |
| (b) | Rate shown reflects the 7-day yield as of June 30, 2022. |
See accompanying Notes to Financial Statements.
ADVISORSHARES DOUBLELINE VALUE EQUITY ETF
Schedule of Investments (continued)
June 30, 2022
Fair Value Measurements
The following is a summary of the inputs used, as of June 30, 2022, in valuing the Fund’s assets and liabilities carried at fair value. These inputs are summarized in three broad levels. Level 1 includes quoted prices in active markets for identical securities. Level 2 includes other significant observable inputs (including quoted prices for similar securities, interest rates, prepayment speeds and credit risk). Level 3 includes significant unobservable inputs (including the Fund’s own assumptions in determining the fair value of investments). The level assigned to the securities valuations may not be an indication of the risk or liquidity associated with investing in those securities.
| Assets | | Level 1 | | | Level 2 | | | Level 3 | | | Total | |
| Common Stocks | | $ | 44,202,689 | | | $ | — | | | $ | — | | | $ | 44,202,689 | |
| Money Market Fund | | | 2,173,736 | | | | — | | | | — | | | | 2,173,736 | |
| Total | | $ | 46,376,425 | | | $ | — | | | $ | — | | | $ | 46,376,425 | |
SUMMARY OF SCHEDULE OF INVESTMENTS
| | | % of
Net Assets | |
| Aerospace/Defense | | | 4.4 | % |
| Agriculture | | | 2.5 | |
| Banks | | | 9.4 | |
| Beverages | | | 2.0 | |
| Biotechnology | | | 1.3 | |
| Chemicals | | | 3.2 | |
| Commercial Services | | | 1.2 | |
| Computers | | | 2.2 | |
| Diversified Financial Services | | | 3.1 | |
| Electronics | | | 4.4 | |
| Food | | | 3.8 | |
| Healthcare – Products | | | 3.8 | |
| Healthcare – Services | | | 2.3 | |
| Insurance | | | 6.6 | |
| Internet | | | 4.4 | |
SUMMARY OF SCHEDULE OF INVESTMENTS (continued)
| | | % of
Net Assets | |
| Media | | | 3.2 | % |
| Mining | | | 1.7 | |
| Oil & Gas | | | 7.7 | |
| Pharmaceuticals | | | 10.9 | |
| REITS | | | 2.5 | |
| Retail | | | 5.2 | |
| Semiconductors | | | 0.8 | |
| Software | | | 4.0 | |
| Telecommunications | | | 3.3 | |
| Transportation | | | 1.4 | |
| Money Market Fund | | | 4.7 | |
| Total Investments | | | 100.0 | |
| Other Assets in Excess of Liabilities | | | 0.0 | ** |
| Net Assets | | | 100.0 | % |
See accompanying Notes to Financial Statements.
ADVISORSHARES DRONE TECHNOLOGY ETF
Schedule of Investments
June 30, 2022
| Investments | |
Shares | | | Value | |
| COMMON STOCKS — 82.8% | |
| | | | | | | | | |
| Aerospace/Defense — 28.6% | |
| AeroVironment, Inc.* | | | 120 | | | $ | 9,864 | |
| Airbus SE (France)(a) | | | 370 | | | | 8,988 | |
| Archer Aviation, Inc., Class A*(b) | | | 3,700 | | | | 11,396 | |
| Boeing Co. (The)* | | | 35 | | | | 4,785 | |
| Elbit Systems Ltd. (Israel) | | | 30 | | | | 6,880 | |
| Joby Aviation, Inc.*(b) | | | 6,030 | | | | 29,607 | |
| Kratos Defense & Security Solutions, Inc.* | | | 1,075 | | | | 14,921 | |
| L3Harris Technologies, Inc. | | | 50 | | | | 12,085 | |
| Lockheed Martin Corp. | | | 50 | | | | 21,498 | |
| Northrop Grumman Corp. | | | 25 | | | | 11,964 | |
| Teledyne Technologies, Inc.* | | | 30 | | | | 11,253 | |
| Thales SA (France)(a) | | | 230 | | | | 5,633 | |
| Vertical Aerospace Ltd. (United Kingdom)*(b) | | | 2,745 | | | | 8,647 | |
| Total Aerospace/Defense | | | | | | | 157,521 | |
| | | | | | | | | |
| Airlines — 2.7% | |
| Lilium NV (Germany)*(b) | | | 6,415 | | | | 15,139 | |
| | | | | | | | | |
| Auto Manufacturers — 0.4% | |
| Workhorse Group, Inc.*(b) | | | 970 | | | | 2,522 | |
| | | | | | | | | |
| Computers — 1.8% | |
| Draganfly, Inc. (Canada)* | | | 11,150 | | | | 10,088 | |
| | | | | | | | | |
| Electronics — 11.5% | |
| GoPro, Inc., Class A* | | | 2,910 | | | | 16,092 | |
| Honeywell International, Inc. | | | 30 | | | | 5,214 | |
| Jabil, Inc. | | | 420 | | | | 21,508 | |
| Trimble, Inc.* | | | 350 | | | | 20,381 | |
| Total Electronics | | | | | | | 63,195 | |
| | | | | | | | | |
| Engineering & Construction — 2.7% | |
| EHang Holdings Ltd. (China)*(a)(b) | | | 1,615 | | | | 14,939 | |
| | | | | | | | | |
| Internet — 6.7% | |
| Alphabet, Inc., Class C* | | | 5 | | | | 10,937 | |
| Amazon.com, Inc.* | | | 100 | | | | 10,621 | |
| Blade Air Mobility, Inc.* | | | 3,430 | | | | 15,298 | |
| Total Internet | | | | | | | 36,856 | |
| | | | | | | | | |
| Machinery – Diversified — 2.4% | |
| AgEagle Aerial Systems, Inc.* | | | 20,150 | | | | 13,019 | |
| | | | | | | | | |
| Metal Fabricate / Hardware — 0.9% | |
| Alpine 4 Holdings, Inc.* | | | 6,900 | | | | 4,896 | |
| Investments | | Shares/
Pricipal | | | Value | |
| COMMON STOCKS (continued) | |
| | | | | | | | | |
| Miscellaneous Manufacturing — 7.5% | |
| Axon Enterprise, Inc.* | | | 70 | | | $ | 6,522 | |
| Red Cat Holdings, Inc.* | | | 14,315 | | | | 29,203 | |
| Textron, Inc. | | | 90 | | | | 5,496 | |
| Total Miscellaneous Manufacturing | | | | | | | 41,221 | |
| | | | | | | | | |
| Semiconductors — 8.5% | |
| Ambarella, Inc.* | | | 35 | | | | 2,291 | |
| Intel Corp. | | | 265 | | | | 9,914 | |
| NVIDIA Corp. | | | 50 | | | | 7,580 | |
| QUALCOMM, Inc. | | | 210 | | | | 26,825 | |
| Total Semiconductors | | | | | | | 46,610 | |
| | | | | | | | | |
| Telecommunications — 1.9% | |
| Ondas Holdings, Inc.*(b) | | | 1,995 | | | | 10,753 | |
| | | | | | | | | |
| Transportation — 7.2% | |
| Drone Delivery Canada Corp. (Canada)* | | | 13,500 | | | | 6,045 | |
| FedEx Corp. | | | 55 | | | | 12,469 | |
| United Parcel Service, Inc., Class B | | | 115 | | | | 20,992 | |
| Total Transportation | | | | | | | 39,506 | |
Total Common Stocks
(Cost $533,221) | | | | | | | 456,265 | |
| | | | | | | | | |
| MONEY MARKET FUND — 7.9% | |
BlackRock Liquidity Funds Treasury Trust Fund Portfolio, Institutional Class, 1.03%(c)
(Cost $43,779) | | | 43,779 | | | | 43,779 | |
| | | | | | | | | |
| REPURCHASE AGREEMENT — 15.4%(d) | |
Daiwa Capital Markets America, dated 06/30/22, due 07/01/22, 1.49%, total to be received $84,534, (collateralized by various U.S. Government Agency Obligations, 0.00%-7.63%, 7/26/22-2/15/50, totaling $86,221)
(Cost $84,530) | | $ | 84,530 | | | | 84,530 | |
| | | | | | | | | |
Total Investments — 106.1%
(Cost $661,530) | | | | | | | 584,574 | |
| Liabilities in Excess of Other Assets — (6.1%) | | | | | | | (33,656 | ) |
| Net Assets — 100.0% | | | | | | $ | 550,918 | |
| * | Non-income producing security. |
See accompanying Notes to Financial Statements.
ADVISORSHARES DRONE TECHNOLOGY ETF
Schedule of Investments (continued)
June 30, 2022
| (a) | American Depositary Receipt. |
| (b) | All or a portion of security is on loan. The aggregate market value of the securities on loan is $81,880; the aggregate market value of the collateral held by the fund is $84,530. |
| (c) | Rate shown reflects the 7-day yield as of June 30, 2022. |
| (d) | Collateral received from brokers for securities lending was invested in these short-term investments. |
See accompanying Notes to Financial Statements.
ADVISORSHARES DRONE TECHNOLOGY ETF
Schedule of Investments (continued)
June 30, 2022
Fair Value Measurements
The following is a summary of the inputs used, as of June 30, 2022, in valuing the Fund’s assets and liabilities carried at fair value. These inputs are summarized in three broad levels. Level 1 includes quoted prices in active markets for identical securities. Level 2 includes other significant observable inputs (including quoted prices for similar securities, interest rates, prepayment speeds and credit risk). Level 3 includes significant unobservable inputs (including the Fund’s own assumptions in determining the fair value of investments). The level assigned to the securities valuations may not be an indication of the risk or liquidity associated with investing in those securities.
| Assets | | Level 1 | | | Level 2 | | | Level 3 | | | Total | |
| Common Stocks | | $ | 456,265 | | | $ | — | | | $ | — | | | $ | 456,265 | |
| Money Market Fund | | | 43,779 | | | | — | | | | — | | | | 43,779 | |
| Repurchase Agreement | | | — | | | | 84,530 | | | | — | | | | 84,530 | |
| Total | | $ | 500,044 | | | $ | 84,530 | | | $ | — | | | $ | 584,574 | |
SUMMARY OF SCHEDULE OF INVESTMENTS
| | | % of
Net Assets | |
| Aerospace/Defense | | | 28.6 | % |
| Airlines | | | 2.7 | |
| Auto Manufacturers | | | 0.4 | |
| Computers | | | 1.8 | |
| Electronics | | | 11.5 | |
| Engineering & Construction | | | 2.7 | |
| Internet | | | 6.7 | |
| Machinery – Diversified | | | 2.4 | |
| Metal Fabricate / Hardware | | | 0.9 | |
| Miscellaneous Manufacturing | | | 7.5 | |
| Semiconductors | | | 8.5 | |
| Telecommunications | | | 1.9 | |
| Transportation | | | 7.2 | |
| Money Market Fund | | | 7.9 | |
| Repurchase Agreement | | | 15.4 | |
| Total Investments | | | 106.1 | |
| Liabilities in Excess of Other Assets | | | (6.1 | ) |
| Net Assets | | | 100.0 | % |
See accompanying Notes to Financial Statements.
ADVISORSHARES FOCUSED EQUITY ETF
Schedule of Investments
June 30, 2022
| Investments | | Shares | | | Value | |
| COMMON STOCKS — 99.4% | |
| | | | | | | | | |
| Aerospace/Defense — 4.5% | |
| HEICO Corp. | | | 9,689 | | | $ | 1,270,422 | |
| | | | | | | | | |
| Auto Parts & Equipment — 3.4% | |
| Miller Industries, Inc. | | | 42,371 | | | | 960,551 | |
| | | | | | | | | |
| Building Materials — 5.3% | |
| Carrier Global Corp. | | | 25,985 | | | | 926,625 | |
| Trex Co., Inc.* | | | 10,394 | | | | 565,642 | |
| Total Building Materials | | | | | | | 1,492,267 | |
| | | | | | | | | |
| Chemicals — 7.2% | |
| Sherwin-Williams Co. (The) | | | 3,985 | | | | 892,281 | |
| Stepan Co. | | | 11,257 | | | | 1,140,897 | |
| Total Chemicals | | | | | | | 2,033,178 | |
| | | | | | | | | |
| Commercial Services — 3.4% | |
| Moody’s Corp. | | | 3,551 | | | | 965,765 | |
| | | | | | | | | |
| Computers — 5.5% | |
| Science Applications International Corp. | | | 16,486 | | | | 1,534,847 | |
| | | | | | | | | |
| Diversified Financial Services — 3.4% | |
| Intercontinental Exchange, Inc. | | | 10,200 | | | | 959,208 | |
| | | | | | | | | |
| Food — 5.6% | |
| Hershey Co. (The) | | | 7,309 | | | | 1,572,604 | |
| | | | | | | | | |
| Healthcare — Products — 15.4% | |
| Abbott Laboratories | | | 9,897 | | | | 1,075,309 | |
| Danaher Corp. | | | 4,264 | | | | 1,081,009 | |
| Stryker Corp. | | | 5,141 | | | | 1,022,699 | |
| Thermo Fisher Scientific, Inc. | | | 2,110 | | | | 1,146,321 | |
| Total Healthcare — Products | | | | | | | 4,325,338 | |
| | | | | | | | | |
| Household Products/Wares — 9.0% | |
| Church & Dwight Co., Inc. | | | 13,866 | | | | 1,284,824 | |
| Reynolds Consumer Products, Inc. | | | 45,513 | | | | 1,241,139 | |
| Total Household Products/Wares | | | | | | | 2,525,963 | |
| | | | | | | | | |
| Insurance — 4.7% | |
| Aflac, Inc. | | | 23,818 | | | | 1,317,850 | |
| | | | | | | | | |
| Machinery — Diversified — 4.1% | |
| Otis Worldwide Corp. | | | 16,126 | | | | 1,139,624 | |
| | | | | | | | | |
| Media — 3.9% | |
| FactSet Research Systems, Inc. | | | 2,861 | | | | 1,100,255 | |
| Investments | | Shares | | | Value | |
| COMMON STOCKS (continued) | |
| | | | | | | | | |
| Packaging & Containers — 4.8% | |
| Silgan Holdings, Inc. | | | 32,659 | | | $ | 1,350,450 | |
| | | | | | | | | |
| Pharmaceuticals — 3.5% | |
| Zoetis, Inc. | | | 5,677 | | | | 975,820 | |
| | | | | | | | | |
| Retail — 3.1% | |
| Ross Stores, Inc. | | | 12,226 | | | | 858,632 | |
| | | | | | | | | |
| Software — 12.6% | |
| Broadridge Financial Solutions, Inc. | | | 7,629 | | | | 1,087,514 | |
| Fair Isaac Corp.* | | | 3,185 | | | | 1,276,866 | |
| Fiserv, Inc.* | | | 13,307 | | | | 1,183,924 | |
| Total Software | | | | | | | 3,548,304 | |
Total Common Stocks
(Cost $26,086,136) | | | | | | | 27,931,078 | |
| | | | | | | | | |
| MONEY MARKET FUND — 0.7% | |
BlackRock Liquidity Funds Treasury Trust Fund Portfolio, Institutional Class, 1.03%(a)
(Cost $189,769) | | | 189,769 | | | | 189,769 | |
| | | | | | | | | |
Total Investments — 100.1%
(Cost $26,275,905) | | | | | | | 28,120,847 | |
| Liabilities in Excess of Other Assets — (0.1%) | | | | | | | (22,886 | ) |
| Net Assets — 100.0% | | | | | | $ | 28,097,961 | |
| * | Non-income producing security. |
| (a) | Rate shown reflects the 7-day yield as of June 30, 2022. |
See accompanying Notes to Financial Statements.
ADVISORSHARES FOCUSED EQUITY ETF
Schedule of Investments (continued)
June 30, 2022
Fair Value Measurements
The following is a summary of the inputs used, as of June 30, 2022, in valuing the Fund’s assets and liabilities carried at fair value. These inputs are summarized in three broad levels. Level 1 includes quoted prices in active markets for identical securities. Level 2 includes other significant observable inputs (including quoted prices for similar securities, interest rates, prepayment speeds and credit risk). Level 3 includes significant unobservable inputs (including the Fund’s own assumptions in determining the fair value of investments). The level assigned to the securities valuations may not be an indication of the risk or liquidity associated with investing in those securities.
| Assets | | Level 1 | | | Level 2 | | | Level 3 | | | Total | |
| Common Stocks | | $ | 27,931,078 | | | $ | — | | | $ | — | | | $ | 27,931,078 | |
| Money Market Fund | | | 189,769 | | | | — | | | | — | | | | 189,769 | |
| Total | | $ | 28,120,847 | | | $ | — | | | $ | — | | | $ | 28,120,847 | |
SUMMARY OF SCHEDULE OF INVESTMENTS
| | | % of
Net Assets | |
| Aerospace/Defense | | | 4.5 | % |
| Auto Parts & Equipment | | | 3.4 | |
| Building Materials | | | 5.3 | |
| Chemicals | | | 7.2 | |
| Commercial Services | | | 3.4 | |
| Computers | | | 5.5 | |
| Diversified Financial Services | | | 3.4 | |
| Food | | | 5.6 | |
| Healthcare – Products | | | 15.4 | |
| Household Products/Wares | | | 9.0 | |
| Insurance | | | 4.7 | |
| Machinery – Diversified | | | 4.1 | |
| Media | | | 3.9 | |
| Packaging & Containers | | | 4.8 | |
| Pharmaceuticals | | | 3.5 | |
| Retail | | | 3.1 | |
| Software | | | 12.6 | |
| Money Market Fund | | | 0.7 | |
| Total Investments | | | 100.1 | |
| Liabilities in Excess of Other Assets | | | (0.1 | ) |
| Net Assets | | | 100.0 | % |
See accompanying Notes to Financial Statements.
ADVISORSHARES GERBER KAWASAKI ETF
Schedule of Investments
June 30, 2022
| Investments | | Shares | | | Value | |
| COMMON STOCKS — 99.1% | |
| | | | | | | | | |
| Aerospace/Defense — 2.0% | |
| Northrop Grumman Corp. | | | 668 | | | $ | 319,685 | |
| | | | | | | | | |
| Apparel — 2.0% | |
| NIKE, Inc., Class B | | | 3,104 | | | | 317,229 | |
| | | | | | | | | |
| Auto Manufacturers — 13.6% | |
| Arcimoto, Inc.*(a) | | | 33,739 | | | | 110,326 | |
| BYD Co., Ltd. (China)(b) | | | 1,485 | | | | 119,513 | |
| Polestar Automotive Holding UK PLC, Class A (Hong Kong)*(a)(b) | | | 36,435 | | | | 320,992 | |
| Tesla, Inc.* | | | 2,376 | | | | 1,600,046 | |
| Total Auto Manufacturers | | | | | | | 2,150,877 | |
| | | | | | | | | |
| Banks — 1.0% | |
| SVB Financial Group* | | | 394 | | | | 155,626 | |
| | | | | | | | | |
| Biotechnology — 1.3% | |
| Moderna, Inc.* | | | 1,406 | | | | 200,847 | |
| | | | | | | | | |
| Commercial Services — 0.7% | |
| Block, Inc.* | | | 1,834 | | | | 112,718 | |
| | | | | | | | | |
| Computers — 5.9% | |
| Apple, Inc. | | | 5,466 | | | | 747,312 | |
| Crowdstrike Holdings, Inc., Class A* | | | 1,077 | | | | 181,539 | |
| Total Computers | | | | | | | 928,851 | |
| | | | | | | | | |
| Diversified Financial Services — 1.6% | |
| LPL Financial Holdings, Inc. | | | 1,344 | | | | 247,941 | |
| | | | | | | | | |
| Electric — 1.9% | |
| NextEra Energy, Inc. | | | 3,957 | | | | 306,509 | |
| | | | | | | | | |
| Energy – Alternate Sources — 3.8% | |
| SolarEdge Technologies, Inc.* | | | 1,430 | | | | 391,362 | |
| SunPower Corp.* | | | 13,345 | | | | 210,985 | |
| Total Energy — Alternate Sources | | | | | | | 602,347 | |
| | | | | | | | | |
| Entertainment — 0.5% | |
| Cedar Fair LP* | | | 1,945 | | | | 85,405 | |
| | | | | | | | | |
| Healthcare — Products — 1.9% | |
| Thermo Fisher Scientific, Inc. | | | 549 | | | | 298,261 | |
| | | | | | | | | |
| Home Builders — 2.2% | |
| Lennar Corp., Class A | | | 4,964 | | | | 350,309 | |
| Investments | | Shares | | | Value | |
| COMMON STOCKS (continued) | |
| | | | | | | | | |
| Internet — 8.4% | |
| Alphabet, Inc., Class C* | | | 264 | | | $ | 577,487 | |
| Amazon.com, Inc.* | | | 985 | | | | 104,617 | |
| Netflix, Inc.* | | | 2,252 | | | | 393,807 | |
| Twitter, Inc.* | | | 6,843 | | | | 255,860 | |
| Total Internet | | | | | | | 1,331,771 | |
| | | | | | | | | |
| Leisure Time — 2.0% | |
| Callaway Golf Co.* | | | 15,094 | | | | 307,918 | |
| | | | | | | | | |
| Lodging — 4.9% | |
| MGM Resorts International | | | 26,533 | | | | 768,130 | |
| | | | | | | | | |
| Machinery — Diversified — 2.7% | |
| Deere & Co. | | | 1,441 | | | | 431,536 | |
| | | | | | | | | |
| Media — 2.0% | |
| Walt Disney Co. (The)* | | | 3,429 | | | | 323,698 | |
| | | | | | | | | |
| Mining — 2.3% | |
| MP Materials Corp.* | | | 11,535 | | | | 370,043 | |
| | | | | | | | | |
| Pharmaceuticals — 5.8% | |
| Pfizer, Inc. | | | 10,645 | | | | 558,118 | |
| Zoetis, Inc. | | | 2,125 | | | | 365,266 | |
| Total Pharmaceuticals | | | | | | | 923,384 | |
| | | | | | | | | |
| REITS — 8.4% | |
| Crown Castle International Corp. | | | 827 | | | | 139,250 | |
| Innovative Industrial Properties, Inc. | | | 4,200 | | | | 461,454 | |
| Prologis, Inc. | | | 3,394 | | | | 399,304 | |
| VICI Properties, Inc. | | | 11,029 | | | | 328,554 | |
| Total REITS | | | | | | | 1,328,562 | |
| | | | | | | | | |
| Retail — 4.0% | |
| Home Depot, Inc. (The) | | | 1,159 | | | | 317,879 | |
| Petco Health & Wellness Co., Inc.*(a) | | | 21,889 | | | | 322,644 | |
| Total Retail | | | | | | | 640,523 | |
| | | | | | | | | |
| Semiconductors — 6.0% | |
| ASML Holding NV (Netherlands) | | | 453 | | | | 215,574 | |
| NVIDIA Corp. | | | 4,365 | | | | 661,690 | |
| ON Semiconductor Corp.* | | | 1,476 | | | | 74,257 | |
| Total Semiconductors | | | | | | | 951,521 | |
See accompanying Notes to Financial Statements.
ADVISORSHARES GERBER KAWASAKI ETF
Schedule of Investments (continued)
June 30, 2022
| Investments | | Shares/
Principal | | | Value | |
| COMMON STOCKS (continued) | |
| | | | | | | | | |
| Software — 8.8% | |
| Electronic Arts, Inc. | | | 1,112 | | | $ | 135,275 | |
| Microsoft Corp. | | | 3,492 | | | | 896,850 | |
| ROBLOX Corp., Class A*(a) | | | 7,367 | | | | 242,080 | |
| Take-Two Interactive Software, Inc.* | | | 985 | | | | 120,692 | |
| Total Software | | | | | | | 1,394,897 | |
| | | | | | | | | |
| Transportation — 1.4% | |
| ZIM Integrated Shipping Services Ltd. (Israel)(a) | | | 4,683 | | | | 221,178 | |
| | | | | | | | | |
| Venture Capital — 4.0% | |
| Blackstone, Inc. | | | 7,004 | | | | 638,975 | |
Total Common Stocks
(Cost $21,659,655) | | | | | | | 15,708,741 | |
| | | | | | | | | |
| MONEY MARKET FUND — 1.1% | |
BlackRock Liquidity Funds Treasury Trust Fund Portfolio, Institutional Class, 1.03%(c)
(Cost $176,496) | | | 176,496 | | | | 176,496 | |
| | | | | | | | | |
| REPURCHASE AGREEMENTS — 8.6%(d) | |
| BofA Securities, Inc., dated 06/30/22, due 07/01/22, 1.55%, total to be received $319,068, (collateralized by various U.S. Government Agency Obligations, 1.00%-8.50%, 1/20/24-6/20/52, totaling $325,435) | | $ | 319,054 | | | | 319,054 | |
| Citigroup Global Markets, Inc., dated 06/30/22, due 07/01/22, 1.50%, total to be received $94,533, (collateralized by various U.S. Government Agency Obligations, 1.88%-3.25%, 6/30/24-5/15/52, totaling $96,420) | | | 94,529 | | | | 94,529 | |
| Investments | |
Principal | | | Value | |
| REPURCHASE AGREEMENTS (continued) | |
| Daiwa Capital Markets America, dated 06/30/22, due 07/01/22, 1.55%, total to be received $319,068, (collateralized by various U.S. Government Agency Obligations, 0.00%-6.50%, 7/31/22-7/1/52, totaling $325,435) | | $ | 319,054 | | | $ | 319,054 | |
| RBC Dominion Securities, Inc., dated 06/30/22, due 07/01/22, 1.55%, total to be received $319,068, (collateralized by various U.S. Government Agency Obligations, 0.00%-6.88%, 8/16/22-5/20/52, totaling $325,435) | | | 319,054 | | | | 319,054 | |
| Truist Securities, Inc., dated 06/30/22, due 07/01/22, 1.55%, total to be received $319,068, (collateralized by various U.S. Government Agency Obligations, 3.25%-5.50%, 6/30/27-7/1/52, totaling $325,436) | | | 319,054 | | | | 319,054 | |
Total Repurchase Agreements
(Cost $1,370,745) | | | | | | | 1,370,745 | |
| | | | | | | | | |
Total Investments — 108.8%
(Cost $23,206,896) | | | | | | | 17,255,982 | |
| Liabilities in Excess of Other Assets — (8.8%) | | | | | | | (1,409,755 | ) |
| Net Assets — 100.0% | | | | | | $ | 15,846,227 | |
ETF — Exchange Traded Fund
LP — Limited Partnership
PLC — Public Limited Company
REITS — Real Estate Investment Trusts
| * | Non-income producing security. |
| (a) | All or a portion of security is on loan. The aggregate market value of the securities on loan is $1,208,027; the aggregate market value of the collateral held by the fund is $1,392,123. The aggregate market value of the collateral includes non-cash U.S. Treasury securities collateral having a value of $21,378. |
| (b) | American Depositary Receipt. |
| (c) | Rate shown reflects the 7-day yield as of June 30, 2022. |
| (d) | Collateral received from brokers for securities lending was invested in these short-term investments. |
See accompanying Notes to Financial Statements.
ADVISORSHARES GERBER KAWASAKI ETF
Schedule of Investments (continued)
June 30, 2022
Fair Value Measurements
The following is a summary of the inputs used, as of June 30, 2022, in valuing the Fund’s assets and liabilities carried at fair value. These inputs are summarized in three broad levels. Level 1 includes quoted prices in active markets for identical securities. Level 2 includes other significant observable inputs (including quoted prices for similar securities, interest rates, prepayment speeds and credit risk). Level 3 includes significant unobservable inputs (including the Fund’s own assumptions in determining the fair value of investments). The level assigned to the securities valuations may not be an indication of the risk or liquidity associated with investing in those securities.
| Assets | | Level 1 | | | Level 2 | | | Level 3 | | | Total | |
| Common Stocks | | $ | 15,708,741 | | | $ | — | | | $ | — | | | $ | 15,708,741 | |
| Money Market Fund | | | 176,496 | | | | — | | | | — | | | | 176,496 | |
| Repurchase Agreements | | | — | | | | 1,370,745 | | | | — | | | | 1,370,745 | |
| Total | | $ | 15,885,237 | | | $ | 1,370,745 | | | $ | — | | | $ | 17,255,982 | |
SUMMARY OF SCHEDULE OF INVESTMENTS
| | | % of
Net Assets | |
| Aerospace/Defense | | | 2.0 | % |
| Apparel | | | 2.0 | |
| Auto Manufacturers | | | 13.6 | |
| Banks | | | 1.0 | |
| Biotechnology | | | 1.3 | |
| Commercial Services | | | 0.7 | |
| Computers | | | 5.9 | |
| Diversified Financial Services | | | 1.6 | |
| Electric | | | 1.9 | |
| Energy – Alternate Sources | | | 3.8 | |
| Entertainment | | | 0.5 | |
| Healthcare – Products | | | 1.9 | |
| Home Builders | | | 2.2 | |
| Internet | | | 8.4 | |
| Leisure Time | | | 2.0 | |
| Lodging | | | 4.9 | |
SUMMARY OF SCHEDULE OF INVESTMENTS (continued)
| | | % of
Net Assets | |
| Machinery – Diversified | | | 2.7 | % |
| Media | | | 2.0 | |
| Mining | | | 2.3 | |
| Pharmaceuticals | | | 5.8 | |
| REITS | | | 8.4 | |
| Retail | | | 4.0 | |
| Semiconductors | | | 6.0 | |
| Software | | | 8.8 | |
| Transportation | | | 1.4 | |
| Venture Capital | | | 4.0 | |
| Money Market Fund | | | 1.1 | |
| Repurchase Agreements | | | 8.6 | |
| Total Investments | | | 108.8 | |
| Liabilities in Excess of Other Assets | | | (8.8 | ) |
| Net Assets | | | 100.0 | % |
See accompanying Notes to Financial Statements.
ADVISORSHARES GERBER KAWASAKI ETF
Schedule of Investments (continued)
June 30, 2022
Affiliated holdings are funds which are managed by the Trust or an affiliate of the Trust. Transactions with affiliated companies during the year ended June 30, 2022 were as follows:
| Affiliated Holding Name | | Value at 6/30/2021 | | | Purchases/ Additions | | | Sales/ Reductions | | | Realized Gain (Loss) | | | Change in Unrealized Gain (Loss) | | | Number of Shares at 6/30/2022 | | | Value at 6/30/2022 | | | Capital Gains Distributions | |
| AdvisorShares Pure US Cannabis ETF | | $ | — | | | $ | 1,237,096 | | | $ | (636,040 | ) | | $ | (601,056 | ) | | $ | — | | | | — | | | $ | — | | | $ | 1,862 | |
See accompanying Notes to Financial Statements.
ADVISORSHARES HOTEL ETF
Schedule of Investments
June 30, 2022
| Investments | |
Shares | | | Value | |
| COMMON STOCKS — 93.7% | |
| | | | | | | | | |
| Entertainment — 22.2% | |
| Golden Entertainment, Inc.* | | | 6,940 | | | $ | 274,477 | |
| Marriott Vacations Worldwide Corp. | | | 1,092 | | | | 126,891 | |
| Monarch Casino & Resort, Inc.* | | | 4,735 | | | | 277,803 | |
| Penn National Gaming, Inc.* | | | 4,420 | | | | 134,456 | |
| Red Rock Resorts, Inc., Class A | | | 11,737 | | | | 391,546 | |
| Vail Resorts, Inc. | | | 465 | | | | 101,393 | |
| Total Entertainment | | | | | | | 1,306,566 | |
| | | | | | | | | |
| Internet — 9.0% | |
| Airbnb, Inc., Class A* | | | 2,832 | | | | 252,275 | |
| Booking Holdings, Inc.* | | | 60 | | | | 104,939 | |
| Expedia Group, Inc.* | | | 1,845 | | | | 174,961 | |
| Total Internet | | | | | | | 532,175 | |
| | | | | | | | | |
| Leisure Time — 3.0% | |
| Carnival Corp.*(a) | | | 4,093 | | | | 35,404 | |
| Norwegian Cruise Line Holdings Ltd.*(a) | | | 9,476 | | | | 105,373 | |
| Royal Caribbean Cruises Ltd.* | | | 1,050 | | | | 36,656 | |
| Total Leisure Time | | | | | | | 177,433 | |
| | | | | | | | | |
| Lodging — 51.3% | |
| Bluegreen Vacations Holding Corp. | | | 19,118 | | | | 477,185 | |
| Boyd Gaming Corp. | | | 5,359 | | | | 266,610 | |
| Century Casinos, Inc.* | | | 13,266 | | | | 95,515 | |
| Choice Hotels International, Inc. | | | 2,324 | | | | 259,428 | |
| Full House Resorts, Inc.* | | | 33,322 | | | | 202,598 | |
| Hilton Grand Vacations, Inc.* | | | 2,425 | | | | 86,645 | |
| Hilton Worldwide Holdings, Inc. | | | 969 | | | | 107,986 | |
| Hyatt Hotels Corp., Class A* | | | 1,531 | | | | 113,156 | |
| InterContinental Hotels Group PLC (United Kingdom)(a)(b) | | | 2,607 | | | | 140,908 | |
| Marriott International, Inc., Class A | | | 2,005 | | | | 272,700 | |
| Playa Hotels & Resorts NV* | | | 41,294 | | | | 283,690 | |
| Target Hospitality Corp.* | | | 64,961 | | | | 370,927 | |
| Travel + Leisure Co. | | | 2,120 | | | | 82,299 | |
| Wyndham Hotels & Resorts, Inc. | | | 4,039 | | | | 265,443 | |
| Total Lodging | | | | | | | 3,025,090 | |
| Investments | | Shares/
Principal | | | Value | |
| COMMON STOCKS (continued) | |
| | | | | | | | | |
| REITS — 8.2% | |
| Gaming and Leisure Properties, Inc. | | | 5,419 | | | $ | 248,515 | |
| VICI Properties, Inc. | | | 7,893 | | | | 235,133 | |
| Total REITS | | | | | | | 483,648 | |
Total Common Stocks
(Cost $7,099,692) | | | | | | | 5,524,912 | |
| | | | | | | | | |
| MONEY MARKET FUND — 6.6% | |
BlackRock Liquidity Funds Treasury Trust Fund Portfolio, Institutional Class, 1.03%(c)
(Cost $391,740) | | | 391,740 | | | | 391,740 | |
| | |
| REPURCHASE AGREEMENT — 3.1%(d) | | | | | | | | |
RBC Dominion Securities, Inc., dated 06/30/22, due 07/01/22, 1.55%, total to be received $185,297, (collateralized by various U.S. Government Agency Obligations, 0.00%-6.88%, 8/16/22-5/20/52, totaling $188,995)
(Cost $185,289) | | $ | 185,289 | | | | 185,289 | |
| | | | | | | | | |
Total Investments — 103.4%
(Cost $7,676,721) | | | | | | | 6,101,941 | |
| Liabilities in Excess of Other Assets — (3.4%) | | | | | | | (204,990 | ) |
| Net Assets — 100.0% | | | | | | $ | 5,896,951 | |
PLC — Public Limited Company
REITS — Real Estate Investment Trusts
| * | Non-income producing security. |
| (a) | All or a portion of security is on loan. The aggregate market value of the securities on loan is $265,924; the aggregate market value of the collateral held by the fund is $275,927. The aggregate market value of the collateral includes non-cash U.S. Treasury securities collateral having a value of $90,638. |
| (b) | American Depositary Receipt. |
| (c) | Rate shown reflects the 7-day yield as of June 30, 2022. |
| (d) | Collateral received from brokers for securities lending was invested in these short-term investments. |
See accompanying Notes to Financial Statements.
ADVISORSHARES HOTEL ETF
Schedule of Investments (continued)
June 30, 2022
Fair Value Measurements
The following is a summary of the inputs used, as of June 30, 2022, in valuing the Fund’s assets and liabilities carried at fair value. These inputs are summarized in three broad levels. Level 1 includes quoted prices in active markets for identical securities. Level 2 includes other significant observable inputs (including quoted prices for similar securities, interest rates, prepayment speeds and credit risk). Level 3 includes significant unobservable inputs (including the Fund’s own assumptions in determining the fair value of investments). The level assigned to the securities valuations may not be an indication of the risk or liquidity associated with investing in those securities.
| Assets | | Level 1 | | | Level 2 | | | Level 3 | | | Total | |
| Common Stocks | | $ | 5,524,912 | | | $ | — | | | $ | — | | | $ | 5,524,912 | |
| Money Market Fund | | | 391,740 | | | | — | | | | — | | | | 391,740 | |
| Repurchase Agreement | | | — | | | | 185,289 | | | | — | | | | 185,289 | |
| Total | | $ | 5,916,652 | | | $ | 185,289 | | | $ | — | | | $ | 6,101,941 | |
SUMMARY OF SCHEDULE OF INVESTMENTS
| | | % of
Net Assets | |
| Entertainment | | | 22.2 | % |
| Internet | | | 9.0 | |
| Leisure Time | | | 3.0 | |
| Lodging | | | 51.3 | |
| REITS | | | 8.2 | |
| Money Market Fund | | | 6.6 | |
| Repurchase Agreement | | | 3.1 | |
| Total Investments | | | 103.4 | |
| Liabilities in Excess of Other Assets | | | (3.4 | ) |
| Net Assets | | | 100.0 | % |
See accompanying Notes to Financial Statements.
ADVISORSHARES LET BOB AI POWERED MOMENTUM ETF
Schedule of Investments
June 30, 2022
| Investments | | Shares | | | Value | |
| COMMON STOCKS — 11.0% | |
| | | | | | | | | |
| Biotechnology — 3.6% | |
| Biohaven Pharmaceutical Holding Co., Ltd.* | | | 2,288 | | | $ | 333,384 | |
| ChemoCentryx, Inc.* | | | 13,100 | | | | 324,618 | |
| Deciphera Pharmaceuticals, Inc.* | | | 718 | | | | 9,442 | |
| Evolus, Inc.* | | | 17,030 | | | | 197,548 | |
| Total Biotechnology | | | | | | | 864,992 | |
| | | | | | | | | |
| Computers — 1.4% | |
| Dell Technologies, Inc., Class C | | | 6,500 | | | | 300,365 | |
| Grid Dynamics Holdings, Inc.* | | | 2,472 | | | | 41,579 | |
| Total Computers | | | | | | | 341,944 | |
| | | | | | | | | |
| Food — 0.2% | |
| Pilgrim’s Pride Corp.* | | | 1,482 | | | | 46,283 | |
| | | | | | | | | |
| Retail — 0.8% | |
| Caleres, Inc. | | | 7,072 | | | | 185,569 | |
| | | | | | | | | |
| Software — 3.7% | |
| Aspen Technology, Inc.* | | | 1,600 | | | | 293,888 | |
| Synopsys, Inc.* | | | 1,030 | | | | 312,811 | |
| Zoom Video Communications, Inc., Class A* | | | 2,700 | | | | 291,519 | |
| Total Software | | | | | | | 898,218 | |
| | | | | | | | | |
| Telecommunications — 1.3% | |
| NeoPhotonics Corp.* | | | 21,000 | | | | 330,330 | |
Total Common Stocks
(Cost $2,757,729) | | | | | | | 2,667,336 | |
| | | | | | | | | |
| MONEY MARKET FUND — 88.9% | |
BlackRock Liquidity Funds Treasury Trust Fund Portfolio, Institutional Class, 1.03%(a)
(Cost $21,501,449) | | | 21,501,449 | | | | 21,501,449 | |
| | | | | | | | | |
Total Investments — 99.9%
(Cost $24,259,178) | | | | | | | 24,168,785 | |
| Other Assets in Excess of Liabilities — 0.1% | | | | | | | 14,530 | |
| Net Assets — 100.0% | | | | | | $ | 24,183,315 | |
| * | Non-income producing security. |
| (a) | Rate shown reflects the 7-day yield as of June 30, 2022. |
See accompanying Notes to Financial Statements.
ADVISORSHARES LET BOB AI POWERED MOMENTUM ETF
Schedule of Investments (continued)
June 30, 2022
Fair Value Measurements
The following is a summary of the inputs used, as of June 30, 2022, in valuing the Fund’s assets and liabilities carried at fair value. These inputs are summarized in three broad levels. Level 1 includes quoted prices in active markets for identical securities. Level 2 includes other significant observable inputs (including quoted prices for similar securities, interest rates, prepayment speeds and credit risk). Level 3 includes significant unobservable inputs (including the Fund’s own assumptions in determining the fair value of investments). The level assigned to the securities valuations may not be an indication of the risk or liquidity associated with investing in those securities.
| Assets | | Level 1 | | | Level 2 | | | Level 3 | | | Total | |
| Common Stocks | | $ | 2,667,336 | | | $ | — | | | $ | — | | | $ | 2,667,336 | |
| Money Market Fund | | | 21,501,449 | | | | — | | | | — | | | | 21,501,449 | |
| Total | | $ | 24,168,785 | | | $ | — | | | $ | — | | | $ | 24,168,785 | |
SUMMARY OF SCHEDULE OF INVESTMENTS
| | | % of
Net Assets | |
| Biotechnology | | | 3.6 | % |
| Computers | | | 1.4 | |
| Food | | | 0.2 | |
| Retail | | | 0.8 | |
| Software | | | 3.7 | |
| Telecommunications | | | 1.3 | |
| Money Market Fund | | | 88.9 | |
| Total Investments | | | 99.9 | |
| Other Assets in Excess of Liabilities | | | 0.1 | |
| Net Assets | | | 100.0 | % |
See accompanying Notes to Financial Statements.
ADVISORSHARES MANAGED BITCOIN STRATEGY ETF
Schedule of Investments
June 30, 2022
| Investments | | Shares | | | Value | |
| EXCHANGE TRADED FUNDS — 96.7% | |
| | | | | | | | | |
| Alternative Investments — 96.7% | |
| ProShares Bitcoin Strategy ETF* | | | 39,152 | | | $ | 454,555 | |
| Valkyrie Bitcoin Strategy ETF* | | | 6,261 | | | | 45,329 | |
Total Exchange Traded Funds
(Cost $635,214) | | | | | | | 499,884 | |
| | | | | | | | | |
Total Investments — 96.7%
(Cost $635,214) | | | | | | | 499,884 | |
| Other Assets in Excess of Liabilities — 3.3% | | | | | | | 16,845 | |
| Net Assets — 100.0% | | | | | | $ | 516,729 | |
ETF — Exchange Traded Fund
| * | Non-income producing security. |
See accompanying Notes to Financial Statements.
ADVISORSHARES MANAGED BITCOIN STRATEGY ETF
Schedule of Investments (continued)
June 30, 2022
Fair Value Measurements
The following is a summary of the inputs used, as of June 30, 2022, in valuing the Fund’s assets and liabilities carried at fair value. These inputs are summarized in three broad levels. Level 1 includes quoted prices in active markets for identical securities. Level 2 includes other significant observable inputs (including quoted prices for similar securities, interest rates, prepayment speeds and credit risk). Level 3 includes significant unobservable inputs (including the Fund’s own assumptions in determining the fair value of investments). The level assigned to the securities valuations may not be an indication of the risk or liquidity associated with investing in those securities.
| Assets | | Level 1 | | | Level 2 | | | Level 3 | | | Total | |
| Exchange Traded Funds | | $ | 499,884 | | | $ | — | | | $ | — | | | $ | 499,884 | |
| Total | | $ | 499,884 | | | $ | — | | | $ | — | | | $ | 499,884 | |
SUMMARY OF SCHEDULE OF INVESTMENTS
| | | % of
Net Assets | |
| Alternative Investments | | | 96.7 | % |
| Total Investments | | | 96.7 | |
| Other Assets in Excess of Liabilities | | | 3.3 | |
| Net Assets | | | 100.0 | % |
See accompanying Notes to Financial Statements.
ADVISORSHARES NEWFLEET MULTI-SECTOR INCOME ETF
Schedule of Investments
June 30, 2022
| Investments | | Principal | | | Value | |
| ASSET BACKED SECURITIES — 34.1% | |
| ACC Auto Trust, Class B, Series 2021-A, 1.79%, 04/15/27‡ | | $ | 265,000 | | | $ | 253,562 | |
| Accelerated LLC, Class A, Series 2021-1H, 1.35%, 10/20/40‡ | | | 196,517 | | | | 182,895 | |
| ACM Auto Trust, Class B, Series 2022-1A, 4.47%, 04/20/29‡ | | | 190,000 | | | | 188,733 | |
| Affirm Asset Securitization Trust, Class A, Series 2021-A, 0.88%, 08/15/25‡ | | | 455,000 | | | | 449,395 | |
| Affirm Asset Securitization Trust, Class A, Series 2022-A, 4.30%, 05/17/27‡ | | | 235,000 | | | | 231,663 | |
| American Credit Acceptance Receivables Trust, Class C, Series 2021-1, 0.83%, 03/15/27‡ | | | 455,000 | | | | 444,807 | |
| American Credit Acceptance Receivables Trust, Class C, Series 2021-2, 0.97%, 07/13/27‡ | | | 265,000 | | | | 257,209 | |
| American Credit Acceptance Receivables Trust, Class C, Series 2021-3, 0.98%, 11/15/27‡ | | | 260,000 | | | | 249,489 | |
| American Credit Acceptance Receivables Trust, Class D, Series 2020-4, 1.77%, 12/14/26‡ | | | 145,000 | | | | 139,047 | |
| AmeriCredit Automobile Receivables Trust, Class D, Series 2018-1, 3.82%, 03/18/24 | | | 285,000 | | | | 285,956 | |
| Amur Equipment Finance Receivables IX LLC, Class B, Series 2021-1A, 1.38%, 02/22/27‡ | | | 135,000 | | | | 126,781 | |
| Amur Equipment Finance Receivables VIII LLC, Class B, Series 2020-1A, 2.50%, 03/20/26‡ | | | 212,227 | | | | 208,401 | |
| Aqua Finance Trust, Class A, Series 2019-A, 3.14%, 07/16/40‡ | | | 141,276 | | | | 137,031 | |
| Aqua Finance Trust, Class B, Series 2020-AA, 2.79%, 07/17/46‡ | | | 335,000 | | | | 314,663 | |
| Aqua Finance Trust, Class C, Series 2019-A, 4.01%, 07/16/40‡ | | | 470,000 | | | | 451,684 | |
| Arbys Funding LLC, Class A2, Series 2020-1A, 3.24%, 07/30/50‡ | | | 289,838 | | | | 261,731 | |
| Investments | | Principal | | | Value | |
| ASSET BACKED SECURITIES (continued) | |
| Arivo Acceptance Auto Loan Receivables Trust, Class A, Series 2021-1A, 1.19%, 01/15/27‡ | | $ | 171,675 | | | $ | 166,890 | |
| Avant Credit Card Master Trust, Class A, Series 2021-1A, 1.37%, 04/15/27‡ | | | 260,000 | | | | 237,887 | |
| Bankers Healthcare Group Securitization Trust, Class A, Series 2020-A, 2.56%, 09/17/31‡ | | | 56,079 | | | | 55,208 | |
| BHG Securitization Trust, Class A, Series 2021-A, 1.42%, 11/17/33‡ | | | 266,513 | | | | 249,768 | |
| BHG Securitization Trust, Class B, Series 2021-B, 1.67%, 10/17/34‡ | | | 210,000 | | | | 187,639 | |
| BRE Grand Islander Timeshare Issuer LLC, Class A, Series 2017-1A, 2.94%, 05/25/29‡ | | | 133,843 | | | | 130,845 | |
| Business Jet Securities LLC, Class A, Series 2020-1A, 2.98%, 11/15/35‡ | | | 49,894 | | | | 45,849 | |
| BXG Receivables Note Trust, Class A, Series 2015-A, 2.88%, 05/02/30‡ | | | 110,986 | | | | 109,030 | |
| BXG Receivables Note Trust, Class A, Series 2022-A, 4.12%, 09/28/37‡ | | | 171,548 | | | | 169,199 | |
| Carnow Auto Receivables Trust, Class D, Series 2019-1A, 4.62%, 12/16/24‡ | | | 260,000 | | | | 260,569 | |
| Carvana Auto Receivables Trust, Class C, Series 2021-N2, 1.07%, 03/10/28 | | | 250,000 | | | | 241,242 | |
| Carvana Auto Receivables Trust, Class C, Series 2022-N1, 3.32%, 12/11/28‡ | | | 240,000 | | | | 233,852 | |
| Carvana Auto Receivables Trust, Class D, Series 2019-2A, 3.28%, 01/15/25‡ | | | 245,000 | | | | 243,762 | |
| Carvana Auto Receivables Trust, Class D, Series 2019-3A, 3.04%, 04/15/25‡ | | | 170,000 | | | | 168,637 | |
| Carvana Auto Receivables Trust, Class D, Series 2021-N3, 1.58%, 06/12/28 | | | 210,000 | | | | 196,707 | |
| Carvana Auto Receivables Trust, Class E, Series 2019-3A, 4.60%, 07/15/26‡ | | | 235,000 | | | | 233,721 | |
| CCG Receivables Trust, Class B, Series 2019-2, 2.55%, 03/15/27‡ | | | 210,000 | | | | 207,684 | |
| CCG Receivables Trust, Class C, Series 2021-1, 0.84%, 06/14/27‡ | | | 270,000 | | | | 253,076 | |
See accompanying Notes to Financial Statements.
ADVISORSHARES NEWFLEET MULTI-SECTOR INCOME ETF
Schedule of Investments (continued)
June 30, 2022
| Investments | | Principal | | | Value | |
| ASSET BACKED SECURITIES (continued) | |
| CFMT Issuer Trust, Class A, Series 2021-GRN1, 1.10%, 03/20/41‡ | | $ | 223,748 | | | $ | 213,297 | |
| CLI Funding VI LLC, Class A, Series 2020-1A, 2.08%, 09/18/45‡ | | | 334,458 | | | | 299,731 | |
| Commonbond Student Loan Trust, Class A, Series 2020-1, 1.69%, 10/25/51‡ | | | 76,633 | | | | 67,982 | |
| Commonbond Student Loan Trust, Class A1, Series 2019-AGS, 2.54%, 01/25/47‡ | | | 73,038 | | | | 68,870 | |
| CPS Auto Receivables Trust, Class D, Series 2018-D, 4.34%, 09/16/24‡ | | | 75,250 | | | | 75,381 | |
| CPS Auto Receivables Trust, Class E, Series 2019-D, 3.86%, 10/15/25‡ | | | 245,000 | | | | 240,291 | |
| Credit Acceptance Auto Loan Trust, Class A, Series 2022-1A, 4.60%, 06/15/32‡ | | | 230,000 | | | | 229,244 | |
| Credit Acceptance Auto Loan Trust, Class B, Series 2019-3A, 2.86%, 01/16/29‡ | | | 250,000 | | | | 248,105 | |
| Credito Real USA Auto Receivables Trust, Class A, Series 2021-1A, 1.35%, 02/16/27‡ | | | 114,773 | | | | 111,901 | |
| Crossroads Asset Trust, Class A2, Series 2021-A, 0.82%, 03/20/24‡ | | | 375,885 | | | | 370,063 | |
| Dext ABS LLC, Class A, Series 2020-1, 1.46%, 02/16/27‡ | | | 145,287 | | | | 143,173 | |
| Diamond Resorts Owner Trust, Class B, Series 2019-1A, 3.53%, 02/20/32‡ | | | 98,776 | | | | 96,774 | |
| Drive Auto Receivables Trust, Class C, Series 2019-3, 2.90%, 08/15/25 | | | 75,613 | | | | 75,649 | |
| DT Auto Owner Trust, Class C, Series 2019-4A, 2.73%, 07/15/25‡ | | | 102,697 | | | | 102,659 | |
| DT Auto Owner Trust, Class C, Series 2020-2A, 3.28%, 03/16/26‡ | | | 165,000 | | | | 164,034 | |
| DT Auto Owner Trust, Class D, Series 2021-1A, 1.16%, 11/16/26‡ | | | 270,000 | | | | 250,692 | |
| Encina Equipment Finance LLC, Class B, Series 2022-1A, 5.15%, 01/16/29‡ | | | 185,000 | | | | 185,043 | |
| Exeter Automobile Receivables Trust, Class C, Series 2019-4A, 2.44%, 09/16/24‡ | | | 44,704 | | | | 44,706 | |
| Investments | | Principal | | | Value | |
| ASSET BACKED SECURITIES (continued) | |
| Exeter Automobile Receivables Trust, Class D, Series 2018-4A, 4.35%, 09/16/24‡ | | $ | 89,658 | | | $ | 89,912 | |
| Exeter Automobile Receivables Trust, Class E, Series 2019-2A, 4.68%, 05/15/26‡ | | | 660,000 | | | | 661,508 | |
| FHF Trust, Class A, Series 2020-1A, 2.59%, 12/15/23‡ | | | 14,541 | | | | 14,531 | |
| First Investors Auto Owner Trust, Class B, Series 2021-1A, 0.89%, 03/15/27‡ | | | 350,000 | | | | 339,572 | |
| First Investors Auto Owner Trust, Class C, Series 2019-1A, 3.26%, 03/17/25‡ | | | 138,835 | | | | 138,927 | |
| First Investors Auto Owner Trust, Class C, Series 2021-2A, 1.47%, 11/15/27‡ | | | 260,000 | | | | 238,008 | |
| First Investors Auto Owner Trust, Class C, Series 2022-1A, 3.13%, 05/15/28‡ | | | 245,000 | | | | 232,547 | |
| Flagship Credit Auto Trust, Class C, Series 2020-1, 2.24%, 01/15/26‡ | | | 430,000 | | | | 421,715 | |
| Flagship Credit Auto Trust, Class C, Series 2020-3, 1.73%, 09/15/26‡ | | | 145,000 | | | | 139,103 | |
| Flagship Credit Auto Trust, Class C, Series 2020-4, 1.28%, 02/16/27‡ | | | 145,000 | | | | 139,488 | |
| Flagship Credit Auto Trust, Class C, Series 2021-1, 0.91%, 03/15/27‡ | | | 455,000 | | | | 426,610 | |
| Foundation Finance Trust, Class A, Series 2017-1A, 3.30%, 07/15/33‡ | | | 13,385 | | | | 13,394 | |
| Foundation Finance Trust, Class A, Series 2021-1A, 1.27%, 05/15/41‡ | | | 213,896 | | | | 198,069 | |
| Foursight Capital Automobile Receivables Trust, Class B, Series 2022-1, 2.15%, 05/17/27‡ | | | 195,000 | | | | 183,331 | |
| Foursight Capital Automobile Receivables Trust, Class C, Series 2021-2, 1.57%, 07/15/27‡ | | | 310,000 | | | | 286,756 | |
| Foursight Capital Automobile Receivables Trust, Class E, Series 2019-1, 4.30%, 09/15/25‡ | | | 130,000 | | | | 129,555 | |
| Freed ABS Trust, Class C, Series 2022-1FP, 2.51%, 03/19/29‡ | | | 145,000 | | | | 137,216 | |
See accompanying Notes to Financial Statements.
ADVISORSHARES NEWFLEET MULTI-SECTOR INCOME ETF
Schedule of Investments (continued)
June 30, 2022
| Investments | | Principal | | | Value | |
| ASSET BACKED SECURITIES (continued) | |
| GCI Funding I LLC, Class A, Series 2021-1 (Bermuda), 2.38%, 06/18/46‡ | | $ | 181,422 | | | $ | 161,071 | |
| Genesis Sales Finance Master Trust, Class A, Series 2020-AA, 1.65%, 09/22/25‡ | | | 315,000 | | | | 310,046 | |
| Global SC Finance VII Srl, Class A, Series 2020-1A (Barbados), 2.17%, 10/17/40‡ | | | 249,385 | | | | 228,843 | |
| GLS Auto Receivables Issuer Trust, Class B, Series 2019-3A, 2.72%, 06/17/24‡ | | | 42,261 | | | | 42,274 | |
| GLS Auto Receivables Issuer Trust, Class B, Series 2020-2A, 3.16%, 06/16/25‡ | | | 180,000 | | | | 179,744 | |
| GLS Auto Receivables Issuer Trust, Class C, Series 2019-4A, 3.06%, 08/15/25‡ | | | 135,000 | | | | 133,416 | |
| GLS Auto Receivables Issuer Trust, Class C, Series 2021-3A, 1.11%, 09/15/26‡ | | | 210,000 | | | | 195,702 | |
| GLS Auto Receivables Issuer Trust, Class D, Series 2019-4A, 4.09%, 08/17/26‡ | | | 110,000 | | | | 107,397 | |
| Gold Key Resorts LLC, Class A, Series 2014-A, 3.22%, 03/17/31‡ | | | 17,933 | | | | 17,693 | |
| Goldenttree Loan Management US CLO 1 Ltd., Class A, Series 2021-9A (Cayman Islands), 2.13%, (3-Month USD LIBOR + 1.07%), 01/20/33@‡ | | | 250,000 | | | | 244,651 | |
| Hertz Vehicle Financing III LLC, Class C, Series 2022-1A, 2.63%, 06/25/26‡ | | | 295,000 | | | | 273,685 | |
| Hertz Vehicle Financing LLC, Class A, Series 2021-1A, 1.21%, 12/26/25‡ | | | 390,000 | | | | 365,511 | |
| Hilton Grand Vacations Trust, Class B, Series 2022-1D, 4.10%, 06/20/34‡ | | | 258,955 | | | | 254,418 | |
| Hin Timeshare Trust, Class C, Series 2020-A, 3.42%, 10/09/39‡ | | | 166,499 | | | | 156,423 | |
| Jersey Mike’s Funding, Class A2, Series 2019-1A, 4.43%, 02/15/50‡ | | | 194,025 | | | | 185,414 | |
| Lendbuzz Securitization Trust, Class A, Series 2022-1A, 4.22%, 05/17/27‡ | | | 270,004 | | | | 266,015 | |
| Lendingpoint Asset Securitization Trust, Class A, Series 2021-A, 1.00%, 12/15/28‡ | | | 59,491 | | | | 59,007 | |
| Investments | | Principal | | | Value | |
| ASSET BACKED SECURITIES (continued) | |
| Lendingpoint Asset Securitization Trust, Class B, Series 2022-A, 2.41%, 06/15/29‡ | | $ | 245,000 | | | $ | 236,071 | |
| Ll ABS Trust, Class A, Series 2021-1A, 1.07%, 05/15/29‡ | | | 145,760 | | | | 140,611 | |
| Mariner Finance Issuance Trust, Class A, Series 2019-AA, 2.96%, 07/20/32‡ | | | 120,000 | | | | 119,091 | |
| Mariner Finance Issuance Trust, Class A, Series 2020-AA, 2.19%, 08/21/34‡ | | | 355,000 | | | | 341,156 | |
| Marlette Funding Trust, Class B, Series 2021-1A, 1.00%, 06/16/31‡ | | | 275,000 | | | | 269,554 | |
| Mercury Financial Credit Card Master Trust, Class A, Series 2021-1A, 1.54%, 03/20/26‡ | | | 230,000 | | | | 218,990 | |
| Mercury Financial Credit Card Master Trust, Class A, Series 2022-1A, 2.50%, 09/21/26‡ | | | 145,000 | | | | 137,509 | |
| Mission Lane Credit Card Master Trust, Class A, Series 2021-A, 1.59%, 09/15/26‡ | | | 325,000 | | | | 313,129 | |
| MVW LLC, Class A, Series 2020-1A, 1.74%, 10/20/37‡ | | | 225,373 | | | | 211,712 | |
| MVW LLC, Class B, Series 2021-1WA, 1.44%, 01/22/41‡ | | | 374,436 | | | | 340,259 | |
| MVW Owner Trust, Class A, Series 2019-1A, 2.89%, 11/20/36‡ | | | 74,992 | | | | 72,610 | |
| Navient Private Education Refi Loan Trust, Class A, Series 2021-EA, 0.97%, 12/16/69‡ | | | 253,304 | | | | 227,626 | |
| NBC Funding LLC, Class A2, Series 2021-1, 2.99%, 07/30/51‡ | | | 307,675 | | | | 274,030 | |
| NMEF Funding LLC, Class B, Series 2019-A, 3.06%, 08/17/26‡ | | | 76,003 | | | | 75,892 | |
| NMEF Funding LLC, Class B, Series 2021-A, 1.85%, 12/15/27‡ | | | 290,000 | | | | 273,610 | |
| NMEF Funding LLC, Class B, Series 2022-A, 3.35%, 10/16/28‡ | | | 195,000 | | | | 184,993 | |
| Oasis Securitization Funding LLC, Class A, Series 2021-1A, 2.58%, 02/15/33‡ | | | 90,007 | | | | 88,982 | |
See accompanying Notes to Financial Statements.
ADVISORSHARES NEWFLEET MULTI-SECTOR INCOME ETF
Schedule of Investments (continued)
June 30, 2022
| Investments | | Principal | | | Value | |
| ASSET BACKED SECURITIES (continued) | |
| Octane Receivables Trust, Class A, Series 2020-1A, 1.71%, 02/20/25‡ | | $ | 46,346 | | | $ | 45,902 | |
| Octane Receivables Trust, Class A, Series 2021-1A, 0.93%, 03/22/27‡ | | | 140,895 | | | | 137,168 | |
| Oportun Funding LLC, Class A, Series 2022-1, 3.25%, 06/15/29‡ | | | 239,827 | | | | 236,640 | |
| Oportun Funding XIV LLC, Class A, Series 2021-A, 1.21%, 03/08/28‡ | | | 280,000 | | | | 262,312 | |
| Oportun Issuance Trust, Class A, Series 2021-C, 2.18%, 10/08/31‡ | | | 260,000 | | | | 240,938 | |
| Orange Lake Timeshare Trust, Class B, Series 2019-A, 3.36%, 04/09/38‡ | | | 253,249 | | | | 244,082 | |
| Oscar US Funding XII LLC, Class A4, Series 2021-1A (Japan), 1.00%, 04/10/28‡ | | | 190,000 | | | | 175,066 | |
| Palmer Square Loan Funding Ltd., Class A1, Series 2021-1A (Cayman Islands), 1.96%, (3-Month USD LIBOR + 0.90%), 04/20/29@‡ | | | 162,370 | | | | 160,789 | |
| Pawnee Equipment Receivables Series, Class A, Series 2020-1, 1.37%, 11/17/25‡ | | | 33,880 | | | | 33,429 | |
| Planet Fitness Master Issuer LLC, Class A2II, Series 2018-1A, 4.67%, 09/05/48‡ | | | 283,938 | | | | 277,219 | |
| Purchasing Power Funding LLC, Class A, Series 2021-A, 1.57%, 10/15/25‡ | | | 265,000 | | | | 254,181 | |
| Regional Management Issuance Trust, Class A, Series 2021-1, 1.68%, 03/17/31‡ | | | 455,000 | | | | 420,439 | |
| Santander Consumer Auto Receivables Trust, Class C, Series 2021-AA, 1.03%, 11/16/26‡ | | | 395,000 | | | | 366,149 | |
| Santander Drive Auto Receivables Trust, Class C, Series 2021-3, 0.95%, 09/15/27 | | | 250,000 | | | | 240,723 | |
| Sierra Timeshare Receivables Funding LLC, Class B, Series 2020-2A, 2.32%, 07/20/37‡ | | | 57,297 | | | | 55,044 | |
| Skopos Auto Receivables Trust, Class C, Series 2019-1A, 3.63%, 09/16/24‡ | | | 193,189 | | | | 192,723 | |
| Sofi Professional Loan Program LLC, Class A2B, Series 2017-C, 2.63%, 07/25/40‡ | | | 86,929 | | | | 86,100 | |
| Investments | | Principal | | | Value | |
| ASSET BACKED SECURITIES (continued) | |
| Tricolor Auto Securitization Trust, Class C, Series 2022-1A, 4.71%, 08/15/25‡ | | $ | 235,000 | | | $ | 232,311 | |
| TRP LLC, Class A, Series 2021-1, 2.07%, 06/19/51‡ | | | 319,675 | | | | 282,533 | |
| Upstart Pass-Through Trust Series, Class A, Series 2021-ST2, 2.50%, 04/20/27‡ | | | 146,896 | | | | 141,115 | |
| Upstart Securitization Trust, Class A, Series 2021-1, 0.87%, 03/20/31‡ | | | 64,556 | | | | 63,882 | |
| Upstart Securitization Trust, Class A, Series 2022-2, 4.37%, 05/20/32‡ | | | 235,000 | | | | 232,389 | |
| Upstart Securitization Trust, Class B, Series 2021-2, 1.75%, 06/20/31‡ | | | 240,000 | | | | 225,934 | |
| Upstart Securitization Trust, Class B, Series 2021-3, 1.66%, 07/20/31‡ | | | 345,000 | | | | 318,392 | |
| US Auto Funding, Class B, Series 2021-1A, 1.49%, 03/17/25‡ | | | 315,000 | | | | 303,811 | |
| USASF Receivables LLC, Class B, Series 2020-1A, 3.22%, 05/15/24‡ | | | 205,133 | | | | 204,070 | |
| Veros Auto Receivables Trust, Class B, Series 2021-1, 1.49%, 10/15/26‡ | | | 370,000 | | | | 352,242 | |
| Veros Auto Receivables Trust, Class B, Series 2022-1, 4.39%, 08/16/27‡ | | | 285,000 | | | | 281,003 | |
| VFI ABS LLC, Class B, Series 2022-1A, 3.04%, 07/24/28‡ | | | 320,000 | | | | 306,168 | |
| Welk Resorts LLC, Class B, Series 2019-AA, 2.99%, 06/15/38‡ | | | 209,075 | | | | 204,492 | |
| Westgate Resorts LLC, Class B, Series 2022-1A, 2.29%, 08/20/36‡ | | | 173,260 | | | | 165,777 | |
| Westlake Automobile Receivables Trust, Class B, Series 2022-1A, 2.75%, 03/15/27‡ | | | 385,000 | | | | 373,770 | |
| Westlake Automobile Receivables Trust, Class C, Series 2020-3A, 1.24%, 11/17/25‡ | | | 145,000 | | | | 141,478 | |
| Westlake Automobile Receivables Trust, Class D, Series 2021-3A, 2.12%, 01/15/27‡ | | | 245,000 | | | | 228,136 | |
Total Asset Backed Securities
(Cost $29,915,049) | | | | | | | 28,545,991 | |
See accompanying Notes to Financial Statements.
ADVISORSHARES NEWFLEET MULTI-SECTOR INCOME ETF
Schedule of Investments (continued)
June 30, 2022
| Investments | | Principal | | | Value | |
| MORTGAGE BACKED SECURITIES — 26.3% | |
| | | | | | | | | |
| Commercial Mortgage Backed Securities — 3.5% | |
| BPR Trust, Class A, Series 2021-KEN, 2.57%, (1-Month USD LIBOR + 1.25%), 02/15/29@‡ | | $ | 95,000 | | | $ | 93,771 | |
| BX Trust, Class B, Series 2018-GW, 2.34%, (1-Month USD LIBOR + 1.02%), 05/15/35@‡ | | | 700,000 | | | | 676,469 | |
| CF Hippolyta LLC, Class A1, Series 2020-1, 1.69%, 07/15/60‡ | | | 105,858 | | | | 96,157 | |
| Commercial Mortgage Trust, Class B, Series 2020-CBM, 3.10%, 02/10/37‡ | | | 150,000 | | | | 140,693 | |
| CSMC Trust, Class A1, Series 2020-NQM1, 1.21%, 05/25/65‡ | | | 254,145 | | | | 242,088 | |
| GCT Commercial Mortgage Trust, Class A, Series 2021-GCT, 2.12%, (1-Month USD LIBOR + 0.80%), 02/15/38@‡ | | | 315,000 | | | | 305,377 | |
| GS Mortgage Securities Corp. Trust, Class A, Series 2020-TWN3, 3.32%, (1-Month USD LIBOR + 2.00%), 11/15/37@‡ | | | 175,000 | | | | 173,612 | |
| GS Mortgage Securities Trust, Class AS, Series 2020-GC45, 3.17%, 02/13/53@* | | | 175,000 | | | | 158,230 | |
| KKR Industrial Portfolio Trust, Class C, Series 2021-KDIP, 2.32%, (1-Month USD LIBOR + 1.00%), 12/15/37@‡ | | | 382,500 | | | | 365,901 | |
| Morgan Stanley Bank of America Merrill Lynch Trust, Class A4, Series 2013-C10, 4.21%, 07/15/46@* | | | 275,000 | | | | 274,113 | |
| Provident Funding Mortgage Trust, Class A2, Series 2019-1, 3.00%, 12/25/49@‡* | | | 33,731 | | | | 30,569 | |
| Sutherland Commercial Mortgage Loans, Class A, Series 2017-SBC6, 3.19%, 05/25/37@‡* | | | 17,762 | | | | 17,722 | |
| Velocity Commercial Capital Loan Trust, Class AFX, Series 2020-1, 2.61%, 02/25/50@‡* | | | 78,270 | | | | 74,848 | |
| WFRBS Commercial Mortgage Trust, Class AS, Series 2014-C24, 3.93%, 11/15/47 | | | 250,000 | | | | 245,354 | |
| Total Commercial Mortgage Backed Securities | | | | | | | 2,894,904 | |
| Investments | | Principal | | | Value | |
| Mortgage Backed Security — 0.1% | |
| CIM Trust, Class A1, Series 2022-R2, 3.75%, 12/25/61@‡* | | $ | 97,908 | | | $ | 94,926 | |
| | | | | | | | | |
| Residential Mortgage Backed Securities — 22.7% | |
| Ajax Mortgage Loan Trust, Class A1, Series 2021-A, 1.07%, 09/25/65@‡* | | | 369,135 | | | | 339,071 | |
| American Homes 4 Rent Trust, Class A, Series 2014-SFR3, 3.68%, 12/17/36‡ | | | 146,214 | | | | 144,833 | |
| Angel Oak Mortgage Trust, Class A1, Series 2020-6, 1.26%, 05/25/65@‡* | | | 46,941 | | | | 45,068 | |
| Angel Oak Mortgage Trust, Class A1, Series 2020-4, 1.47%, 06/25/65@‡* | | | 84,997 | | | | 81,554 | |
| Angel Oak Mortgage Trust, Class A1, Series 2021-5, 0.95%, 07/25/66@‡* | | | 142,243 | | | | 127,349 | |
| Angel Oak Mortgage Trust, Class A1, Series 2021-7, 1.98%, 10/25/66@‡* | | | 453,312 | | | | 398,722 | |
| Angel Oak Mortgage Trust I LLC, Class A1, Series 2018-3, 3.65%, 09/25/48@‡* | | | 3,243 | | | | 3,230 | |
| Angel Oak Mortgage Trust I LLC, Class A1, Series 2019-2, 3.63%, 03/25/49@‡* | | | 5,381 | | | | 5,369 | |
| Angel Oak SB Commercial Mortgage Trust, Class A1, Series 2020-SBC1, 2.07%, 05/25/50@‡* | | | 63,812 | | | | 61,478 | |
| Arroyo Mortgage Trust, Class A1, Series 2019-1, 3.81%, 01/25/49@‡* | | | 536,435 | | | | 518,769 | |
| Arroyo Mortgage Trust, Class A1, Series 2019-2, 3.35%, 04/25/49@‡* | | | 64,914 | | | | 63,260 | |
| Arroyo Mortgage Trust, Class A1B, Series 2020-1, 2.10%, 03/25/55‡ | | | 153,826 | | | | 148,559 | |
| Banc of America Funding Trust, Class 1A1, Series 2005-1, 5.50%, 02/25/35 | | | 54,380 | | | | 49,767 | |
| Bayview Koitere Fund Trust, Class A, Series 2017-RT4, 3.50%, 07/28/57@‡* | | | 65,953 | | | | 64,461 | |
| Bravo Residential Funding Trust, Class A1, Series 2021-NQM3, 1.70%, 04/25/60@‡* | | | 68,738 | | | | 66,273 | |
| Cafl Issuer LLC, Class A1, Series 2021-RTL1, 2.24%, 03/28/29‡ | | | 105,000 | | | | 98,880 | |
See accompanying Notes to Financial Statements.
ADVISORSHARES NEWFLEET MULTI-SECTOR INCOME ETF
Schedule of Investments (continued)
June 30, 2022
| Investments | | Principal | | | Value | |
| MORTGAGE BACKED SECURITIES (continued) | |
| | | | | | | | | |
| Residential Mortgage Backed Securities (continued) | |
| Citigroup Mortgage Loan Trust, Inc., Class A, Series 2014-A, 4.00%, 01/25/35@‡* | | $ | 120,687 | | | $ | 115,977 | |
| Citigroup Mortgage Loan Trust, Inc., Class A1, Series 2015-PS1, 3.75%, 09/25/42@‡* | | | 33,198 | | | | 32,341 | |
| Citigroup Mortgage Loan Trust, Inc., Class A1, Series 2018-RP1, 3.00%, 09/25/64@‡* | | | 69,302 | | | | 68,212 | |
| Citigroup Mortgage Loan Trust, Inc., Class A1, Series 2019-RP1, 3.50%, 01/25/66@‡* | | | 622,622 | | | | 607,677 | |
| COLT Funding LLC, Class A1, Series 2021-3R, 1.05%, 12/25/64@‡* | | | 168,688 | | | | 156,490 | |
| COLT Mortgage Loan Trust, Class A2, Series 2021-2, 1.13%, 08/25/66@‡* | | | 85,753 | | | | 75,846 | |
| COLT Mortgage Loan Trust, Class A1, Series 2022-1, 2.28%, 12/27/66@‡* | | | 278,120 | | | | 250,570 | |
| COLT Mortgage Loan Trust, Class A1, Series 2022-3, 3.90%, 02/25/67@‡* | | | 464,696 | | | | 450,613 | |
| COLT Mortgage Loan Trust, Class A1, Series 2022-5, 4.55%, 04/25/67@‡* | | | 321,459 | | | | 318,057 | |
| COLT Mortgage Pass-Through Certificates, Class A1, Series 2021-1R, 0.86%, 05/25/65@‡* | | | 225,704 | | | | 221,627 | |
| Corevest American Finance Trust, Class A, Series 2020-3, 1.36%, 08/15/53‡ | | | 352,885 | | | | 319,566 | |
| Credit Suisse Commercial Mortgage Trust, Class A2, Series 2014-IVR2, 3.81%, 04/25/44@‡* | | | 106,880 | | | | 99,665 | |
| CSMC Trust, Class A1, Series 2021-AFC1, 0.83%, 03/25/56@‡* | | | 153,886 | | | | 132,397 | |
| CSMC Trust, Class A1, Series 2020-RPL4, 2.00%, 01/25/60@‡* | | | 71,251 | | | | 67,014 | |
| CSMC Trust, Class A1, Series 2021-RPL3, 2.00%, 01/25/60@‡* | | | 562,272 | | | | 530,234 | |
| CSMC Trust, Class A1, Series 2021-NQM1, 0.81%, 05/25/65@‡* | | | 486,084 | | | | 468,065 | |
| CSMC Trust, Class A1, Series 2021-NQM2, 1.18%, 02/25/66@‡* | | | 124,474 | | | | 118,532 | |
| Investments | | Principal | | | Value | |
| MORTGAGE BACKED SECURITIES (continued) | |
| | | | | | | | | |
| Residential Mortgage Backed Securities (continued) | |
| Dominion Mortgage Trust, Class A1, Series 2021-RTL1, 2.49%, 07/25/27‡ | | $ | 315,000 | | | $ | 297,721 | |
| Ellington Financial Mortgage Trust, Class A3, Series 2019-2, 3.05%, 11/25/59@‡* | | | 23,378 | | | | 22,703 | |
| Ellington Financial Mortgage Trust, Class A1, Series 2020-1, 2.01%, 05/25/65@‡* | | | 122,007 | | | | 118,877 | |
| Ellington Financial Mortgage Trust, Class A1, Series 2020-2, 1.18%, 10/25/65@‡* | | | 161,997 | | | | 156,552 | |
| Ellington Financial Mortgage Trust, Class A2, Series 2021-1, 1.00%, 02/25/66@‡* | | | 87,960 | | | | 79,618 | |
| Ellington Financial Mortgage Trust, Class A1, Series 2021-2, 0.93%, 06/25/66@‡* | | | 202,395 | | | | 184,092 | |
| Firstkey Homes Trust, Class B, Series 2020-SFR2, 1.57%, 10/19/37‡ | | | 175,000 | | | | 159,686 | |
| Firstkey Homes Trust, Class A, Series 2020-SFR2, 1.27%, 10/19/37‡ | | | 165,819 | | | | 153,025 | |
| Firstkey Homes Trust, Class D, Series 2021-SFR1, 2.19%, 08/17/38‡ | | | 240,000 | | | | 212,312 | |
| Galton Funding Mortgage Trust, Class A21, Series 2017-1, 3.50%, 07/25/56@‡* | | | 47,476 | | | | 46,006 | |
| GS Mortgage-Backed Securities Trust, Class A3, Series 2020-NQM1, 2.35%, 09/27/60@‡* | | | 140,661 | | | | 135,676 | |
| GSR Mortgage Loan Trust, Class 1A6, Series 2003-3F, 6.00%, 04/25/33 | | | 59,548 | | | | 58,436 | |
| JPMorgan Mortgage Trust, Class 2A2, Series 2014-2, 3.50%, 06/25/29@‡* | | | 80,324 | | | | 77,626 | |
| JPMorgan Mortgage Trust, Class AM, Series 2014-2, 3.36%, 06/25/29@‡* | | | 157,871 | | | | 151,402 | |
| JPMorgan Mortgage Trust, Class 4A1, Series 2006-A2, 3.09%, 08/25/34@* | | | 41,533 | | | | 41,999 | |
| JPMorgan Mortgage Trust, Class A2, Series 2015-5, 2.35%, 05/25/45@‡* | | | 105,143 | | | | 104,516 | |
| Lhome Mortgage Trust, Class A1, Series 2021-RTL2, 2.09%, 06/25/26‡ | | | 205,000 | | | | 195,498 | |
See accompanying Notes to Financial Statements.
ADVISORSHARES NEWFLEET MULTI-SECTOR INCOME ETF
Schedule of Investments (continued)
June 30, 2022
| Investments | | Principal | | | Value | |
| MORTGAGE BACKED SECURITIES (continued) | |
| | | | | | | | | |
| Residential Mortgage Backed Securities (continued) | |
| MetLife Securitization Trust, Class A, Series 2018-1A, 3.75%, 03/25/57@‡* | | $ | 273,036 | | | $ | 266,664 | |
| MetLife Securitization Trust, Class A1A, Series 2019-1A, 3.75%, 04/25/58@‡* | | | 333,439 | | | | 330,249 | |
| MFA Trust, Class A1, Series 2020-NQM3, 1.01%, 01/26/65@‡* | | | 219,171 | | | | 211,783 | |
| MFA Trust, Class A1, Series 2021-NQM1, 1.15%, 04/25/65@‡* | | | 177,747 | | | | 165,538 | |
| Mill City Mortgage Loan Trust, Class M2, Series 2017-3, 3.25%, 01/25/61@‡* | | | 123,454 | | | | 118,913 | |
| New Residential Mortgage Loan Trust, Class B1, Series 2018-4A, 2.67%, (1-Month USD LIBOR + 1.05%), 01/25/48@‡ | | | 487,788 | | | | 471,807 | |
| New Residential Mortgage Loan Trust, Class AFX3, Series 2014-3A, 3.75%, 11/25/54@‡* | | | 109,317 | | | | 106,149 | |
| New Residential Mortgage Loan Trust, Class A1, Series 2016-3A, 3.75%, 09/25/56@‡* | | | 222,460 | | | | 214,898 | |
| New Residential Mortgage Loan Trust, Class A1, Series 2016-4A, 3.75%, 11/25/56@‡* | | | 161,877 | | | | 157,160 | |
| New Residential Mortgage Loan Trust, Class A3, Series 2017-2A, 4.00%, 03/25/57@‡* | | | 522,711 | | | | 510,566 | |
| New Residential Mortgage Loan Trust, Class A1, Series 2021-NQ2R, 0.94%, 10/25/58@‡* | | | 187,574 | | | | 181,331 | |
| Newrez Warehouse Securitization Trust, Class C, Series 2021-1, 2.67%, (1-Month USD LIBOR + 1.05%), 05/25/55@‡ | | | 300,000 | | | | 294,386 | |
| NLT Trust, Class A1, Series 2021-INV2, 1.16%, 08/25/56@‡* | | | 276,419 | | | | 251,414 | |
| NYMT Loan Trust, Class A1, Series 2021-CP1, 2.04%, 07/25/61‡ | | | 82,369 | | | | 77,964 | |
| OBX Trust, Class A3, Series 2019-INV1, 4.50%, 11/25/48@‡* | | | 33,723 | | | | 33,495 | |
| PRPM LLC, Class A1, Series 2021-RPL1, 1.32%, 07/25/51‡ | | | 598,060 | | | | 554,795 | |
| Investments | | Principal | | | Value | |
| MORTGAGE BACKED SECURITIES (continued) | |
| | | | | | | | | |
| Residential Mortgage Backed Securities (continued) | |
| PRPM LLC, Class A1, Series 2021-RPL2, 1.46%, 10/25/51@‡* | | $ | 86,534 | | | $ | 79,146 | |
| RCKT Mortgage Trust, Class A1, Series 2020-1, 3.00%, 02/25/50@‡* | | | 42,219 | | | | 37,913 | |
| Residential Mortgage Loan Trust, Class A1, Series 2020-1, 2.38%, 01/26/60@‡* | | | 67,935 | | | | 65,839 | |
| SG Residential Mortgage Trust, Class A1, Series 2019-3, 2.70%, 09/25/59@‡* | | | 70,562 | | | | 69,155 | |
| Star Trust, Class A1, Series 2021-1, 1.22%, 05/25/65@‡* | | | 345,256 | | | | 325,910 | |
| Starwood Mortgage Residential Trust, Class A2, Series 2021-3, 1.40%, 06/25/56@‡* | | | 90,211 | | | | 81,150 | |
| Starwood Mortgage Residential Trust, Class A1, Series 2020-3, 1.49%, 04/25/65@‡* | | | 282,450 | | | | 275,686 | |
| Structured Asset Securities Corp., Class A3A, Series 2004-4XS, 5.15%, 02/25/34 | | | 236,812 | | | | 220,810 | |
| Towd Point HE Trust, Class M1, Series 2021-HE1, 1.50%, 02/25/63@‡* | | | 98,634 | | | | 94,392 | |
| Towd Point Mortgage Trust, Class M1, Series 2015-6, 3.75%, 04/25/55@‡* | | | 100,000 | | | | 98,354 | |
| Towd Point Mortgage Trust, Class A2, Series 2017-1, 3.50%, 10/25/56@‡* | | | 385,000 | | | | 378,642 | |
| Towd Point Mortgage Trust, Class A2, Series 2017-2, 3.25%, 04/25/57@‡* | | | 260,000 | | | | 255,655 | |
| Towd Point Mortgage Trust, Class A1A, Series 2018-6, 3.75%, 03/25/58@‡* | | | 605,403 | | | | 602,219 | |
| Towd Point Mortgage Trust, Class A1, Series 2018-4, 3.00%, 06/25/58@‡* | | | 339,366 | | | | 326,603 | |
| Towd Point Mortgage Trust, Class A2, Series 2020-MH1, 2.50%, 02/25/60@‡* | | | 130,000 | | | | 117,427 | |
| VCAT Asset Securitization, LLC, Class A1, Series 2021-NPL4, 1.87%, 08/25/51‡ | | | 242,863 | | | | 228,845 | |
| VCAT Asset Securitization, LLC, Class A1, Series 2021-NPL6, 1.92%, 09/25/51‡ | | | 184,143 | | | | 173,646 | |
See accompanying Notes to Financial Statements.
ADVISORSHARES NEWFLEET MULTI-SECTOR INCOME ETF
Schedule of Investments (continued)
June 30, 2022
| Investments | | Principal | | | Value | |
| MORTGAGE BACKED SECURITIES (continued) | |
| | | | | | | | | |
| Residential Mortgage Backed Securities (continued) | |
| Verus Securitization Trust, Class A1, Series 2019-INV2, 2.91%, 07/25/59@‡* | | $ | 37,429 | | | $ | 37,382 | |
| Verus Securitization Trust, Class A1, Series 2020-1, 2.42%, 01/25/60‡ | | | 42,698 | | | | 41,980 | |
| Verus Securitization Trust, Class A1, Series 2021-R1, 0.82%, 10/25/63@‡* | | | 264,250 | | | | 258,077 | |
| Verus Securitization Trust, Class A1, Series 2021-R3, 1.02%, 04/25/64@‡* | | | 208,430 | | | | 199,138 | |
| Verus Securitization Trust, Class A1, Series 2020-4, 1.50%, 05/25/65‡ | | | 442,522 | | | | 423,178 | |
| Verus Securitization Trust, Class A1, Series 2021-1, 0.82%, 01/25/66@‡* | | | 176,310 | | | | 161,850 | |
| Verus Securitization Trust, Class A1, Series 2021-2, 1.03%, 02/25/66@‡* | | | 261,310 | | | | 237,586 | |
| Verus Securitization Trust, Class A1, Series 2021-3, 1.05%, 06/25/66@‡* | | | 533,574 | | | | 474,466 | |
| Verus Securitization Trust, Class A1, Series 2022-4, 4.47%, 04/25/67‡ | | | 272,224 | | | | 269,501 | |
| Visio Trust, Class A1, Series 2019-2, 2.72%, 11/25/54@‡* | | | 411,170 | | | | 395,818 | |
| Visio Trust, Class A2, Series 2019-2, 2.92%, 11/25/54@‡* | | | 181,370 | | | | 174,612 | |
| Visio Trust, Class A1, Series 2021-1R, 1.28%, 05/25/56‡ | | | 262,047 | | | | 246,568 | |
| VOLT XCV LLC, Class A1, Series 2021-NPL4, 2.24%, 03/27/51‡ | | | 127,651 | | | | 122,332 | |
| Wells Fargo Mortgage Backed Securities Trust, Class 2A12, Series 2004-K, 3.49%, 07/25/34@* | | | 19,601 | | | | 19,506 | |
| Wells Fargo Mortgage Backed Securities Trust, Class 1A2, Series 2004-K, 3.62%, 07/25/34@* | | | 50,425 | | | | 51,076 | |
| Investments | | Principal | | | Value | |
| MORTGAGE BACKED SECURITIES (continued) | |
| | | | | | | | | |
| Residential Mortgage Backed Securities (continued) | |
| Wells Fargo Mortgage Backed Securities Trust, Class A1, Series 2004-U, 2.99%, 10/25/34@* | | $ | 70,578 | | | $ | 66,637 | |
| Total Residential Mortgage Backed Securities | | | | | | | 19,003,482 | |
Total Mortgage Backed Securities
(Cost $23,308,497) | | | | | | | 21,993,312 | |
| | | | | | | | | |
| CORPORATE BONDS — 17.1% | |
| | | | | | | | | |
| Communication Services — 1.0% | |
| Commscope, Inc., 4.75%, 09/01/29‡ | | | 170,000 | | | | 137,615 | |
| Level 3 Financing, Inc., 4.63%, 09/15/27‡ | | | 100,000 | | | | 85,541 | |
| Level 3 Financing, Inc., 4.25%, 07/01/28‡ | | | 140,000 | | | | 113,546 | |
| Sprint Spectrum Co. LLC / Sprint Spectrum Co. II LLC / Sprint Spectrum Co. III LLC, 4.74%, 03/20/25‡ | | | 178,750 | | | | 178,997 | |
| T-Mobile USA, Inc., 2.05%, 02/15/28 | | | 140,000 | | | | 121,908 | |
| TripAdvisor, Inc., 7.00%, 07/15/25‡ | | | 115,000 | | | | 111,678 | |
| Twitter, Inc., 3.88%, 12/15/27‡(a) | | | 100,000 | | | | 94,204 | |
| Total Communication Services | | | | | | | 843,489 | |
| | | | | | | | | |
| Consumer Discretionary — 0.3% | |
| General Motors Co., 6.13%, 10/01/25 | | | 150,000 | | | | 155,404 | |
| General Motors Financial Co., Inc., 1.25%, 01/08/26 | | | 55,000 | | | | 48,577 | |
| Total Consumer Discretionary | | | | | | | 203,981 | |
| | | | | | | | | |
| Consumer Staples — 0.2% | |
| Albertsons Cos., Inc. / Safeway, Inc. / New Albertsons LP / Albertsons LLC, 3.25%, 03/15/26‡ | | | 145,000 | | | | 126,731 | |
| | | | | | | | | |
| Energy — 1.3% | |
| Boardwalk Pipelines LP, 4.95%, 12/15/24 | | | 245,000 | | | | 247,067 | |
| Chesapeake Energy Corp., 5.50%, 02/01/26‡ | | | 135,000 | | | | 128,509 | |
| CrownRock LP / CrownRock Finance, Inc., 5.63%, 10/15/25‡ | | | 100,000 | | | | 94,271 | |
See accompanying Notes to Financial Statements.
ADVISORSHARES NEWFLEET MULTI-SECTOR INCOME ETF
Schedule of Investments (continued)
June 30, 2022
| Investments | | Principal | | | Value | |
| CORPORATE BONDS (continued) | |
| | | | | | | | | |
| Energy (continued) | |
| CrownRock LP / CrownRock Finance, Inc., 5.00%, 05/01/29‡ | | $ | 55,000 | | | $ | 49,411 | |
| DT Midstream, Inc., 4.13%, 06/15/29‡ | | | 155,000 | | | | 131,424 | |
| Energy Transfer LP, 4.20%, 04/15/27 | | | 105,000 | | | | 101,056 | |
| EQM Midstream Partners LP, 6.00%, 07/01/25‡ | | | 50,000 | | | | 48,210 | |
| NGPL PipeCo. LLC, 4.88%, 08/15/27‡ | | | 118,000 | | | | 117,049 | |
| Occidental Petroleum Corp., 5.88%, 09/01/25 | | | 145,000 | | | | 144,668 | |
| Total Energy | | | | | | | 1,061,665 | |
| | | | | | | | | |
| Financials — 6.5% | |
| Athene Global Funding, 2.45%, 08/20/27‡ | | | 240,000 | | | | 210,710 | |
| Bank of America Corp., 2.13%, (3-Month USD LIBOR + 0.77%), 02/05/26@ | | | 113,000 | | | | 110,328 | |
| Bank of America Corp., 1.73%, (SOFR + 0.96%), 07/22/27@ | | | 630,000 | | | | 563,095 | |
| Bank of America Corp., 2.55%, (SOFR + 1.05%), 02/04/28@ | | | 93,000 | | | | 84,770 | |
| Blackstone Private Credit Fund, 2.63%, 12/15/26‡ | | | 116,000 | | | | 97,407 | |
| Blackstone Private Credit Fund, 4.00%, 01/15/29‡ | | | 50,000 | | | | 41,097 | |
| Charles Schwab Corp. (The), Series G, 5.38%, (US 5 Year CMT T-Note + 4.97%)#@ | | | 44,000 | | | | 43,670 | |
| Charles Schwab Corp. (The), Series H, 4.00%, (US 10 Year CMT T-Note + 3.08%)#@ | | | 220,000 | | | | 168,356 | |
| Citadel LP, 4.88%, 01/15/27‡ | | | 170,000 | | | | 164,834 | |
| Citigroup, Inc., 3.53%, (3-Month USD LIBOR + 1.25%), 07/01/26@ | | | 210,000 | | | | 205,867 | |
| Citigroup, Inc., 2.62%, (SOFR + 1.28%), 02/24/28@ | | | 126,000 | | | | 120,958 | |
| Drawbridge Special Opportunities Fund LP / Drawbridge Special Opportunities Finance, 3.88%, 02/15/26‡ | | | 250,000 | | | | 229,776 | |
| F&G Global Funding, 1.75%, 06/30/26‡ | | | 198,000 | | | | 175,832 | |
| Goldman Sachs Group, Inc. (The), 3.20%, (3-Month USD LIBOR + 1.60%), 11/29/23@ | | | 270,000 | | | | 271,007 | |
| Investments | | Principal | | | Value | |
| CORPORATE BONDS (continued) | |
| | | | | | | | | |
| Financials (continued) | |
| Goldman Sachs Group, Inc. (The), 3.85%, 01/26/27 | | $ | 105,000 | | | $ | 101,744 | |
| Goldman Sachs Group, Inc. (The), 2.99%, (3-Month USD LIBOR + 1.75%), 10/28/27@ | | | 280,000 | | | | 277,020 | |
| JPMorgan Chase & Co., Series HH, 4.60%, (SOFR + 3.13%)#@ | | | 562,000 | | | | 476,122 | |
| JPMorgan Chase & Co., 2.49%, (SOFR + 1.18%), 02/24/28@ | | | 200,000 | | | | 192,403 | |
| Ladder Capital Finance Holdings LLLP / Ladder Capital Finance Corp., 4.25%, 02/01/27‡ | | | 145,000 | | | | 117,296 | |
| Liberty Mutual Group, Inc., 4.13%, (US 5 Year CMT T-Note + 3.32%), 12/15/51@‡ | | | 160,000 | | | | 127,878 | |
| Lincoln National Corp., 3.10%, (3-Month USD LIBOR + 2.04%), 04/20/67@ | | | 285,000 | | | | 193,821 | |
| MetLife, Inc., Series D, 5.88%, (3-Month USD LIBOR + 2.96%)#@(a) | | | 155,000 | | | | 144,323 | |
| Morgan Stanley, 2.58%, (3-Month USD LIBOR + 1.40%), 10/24/23@ | | | 280,000 | | | | 280,026 | |
| Navient Corp., 5.88%, 10/25/24 | | | 240,000 | | | | 221,104 | |
| OWL Rock Core Income Corp., 5.50%, 03/21/25‡ | | | 68,000 | | | | 65,401 | |
| Prudential Financial, Inc., 5.63%, (3-Month USD LIBOR + 3.92%), 06/15/43@ | | | 244,000 | | | | 238,127 | |
| Spirit Realty LP, 4.45%, 09/15/26 | | | 96,429 | | | | 95,118 | |
| Texas Capital Bancshares, Inc., 4.00%, (US 5 Year CMT T-Note + 3.15%), 05/06/31@ | | | 135,000 | | | | 124,565 | |
| Wells Fargo & Co., 4.10%, 06/03/26 | | | 325,000 | | | | 320,631 | |
| Total Financials | | | | | | | 5,463,286 | |
| | | | | | | | | |
| Health Care — 1.8% | |
| Baxter International, Inc., 1.92%, 02/01/27 | | | 149,000 | | | | 133,745 | |
| Baxter International, Inc., 2.27%, 12/01/28 | | | 150,000 | | | | 131,453 | |
| Bio-Rad Laboratories, Inc., 3.30%, 03/15/27 | | | 138,000 | | | | 130,525 | |
| HCA, Inc., 5.38%, 02/01/25 | | | 215,000 | | | | 215,711 | |
| Mylan NV, 3.95%, 06/15/26 | | | 50,000 | | | | 47,253 | |
| Royalty Pharma PLC, 1.20%, 09/02/25 | | | 23,000 | | | | 20,550 | |
See accompanying Notes to Financial Statements.
ADVISORSHARES NEWFLEET MULTI-SECTOR INCOME ETF
Schedule of Investments (continued)
June 30, 2022
| Investments | | Principal | | | Value | |
| CORPORATE BONDS (continued) | |
| | | | | | | | | |
| Health Care (continued) | |
| Royalty Pharma PLC, 1.75%, 09/02/27 | | $ | 323,000 | | | $ | 276,049 | |
| Tenet Healthcare Corp., 4.88%, 01/01/26‡ | | | 95,000 | | | | 87,729 | |
| Universal Health Services, Inc., 1.65%, 09/01/26‡ | | | 260,000 | | | | 225,975 | |
| Viatris, Inc., 2.30%, 06/22/27 | | | 275,000 | | | | 238,277 | |
| Viatris, Inc., 2.30%, 06/22/27‡ | | | 157 | | | | 136 | |
| Total Health Care | | | | | | | 1,507,403 | |
| | | | | | | | | |
| Industrials — 1.2% | |
| Alaska Airlines Pass-Through Trust, Class A, Series 2020-1, 4.80%, 08/15/27‡ | | | 180,896 | | | | 179,057 | |
| Boeing Co. (The), 4.88%, 05/01/25 | | | 120,000 | | | | 119,755 | |
| Boeing Co. (The), 5.04%, 05/01/27 | | | 112,000 | | | | 110,752 | |
| General Electric Co., Series D, 5.16%, (3-Month USD LIBOR + 3.33%)#@ | | | 285,000 | | | | 250,786 | |
| Huntington Ingalls Industries, Inc., 2.04%, 08/16/28 | | | 276,000 | | | | 236,344 | |
| Spirit AeroSystems, Inc., 5.50%, 01/15/25‡ | | | 105,000 | | | | 97,309 | |
| Total Industrials | | | | | | | 994,003 | |
| | | | | | | | | |
| Information Technology — 1.7% | |
| Block, Inc., 2.75%, 06/01/26‡ | | | 115,000 | | | | 102,324 | |
| CDW LLC / CDW Finance Corp., 2.67%, 12/01/26 | | | 98,000 | | | | 87,495 | |
| CDW LLC / CDW Finance Corp., 3.28%, 12/01/28 | | | 98,000 | | | | 84,719 | |
| Citrix Systems, Inc., 1.25%, 03/01/26 | | | 25,000 | | | | 24,247 | |
| Dell International LLC / EMC Corp., 4.90%, 10/01/26 | | | 210,000 | | | | 210,758 | |
| Entegris Escrow Corp., 4.75%, 04/15/29‡ | | | 285,000 | | | | 266,254 | |
| Flex Ltd., 3.75%, 02/01/26 | | | 191,000 | | | | 183,196 | |
| Kyndryl Holdings, Inc., 2.05%, 10/15/26‡ | | | 108,000 | | | | 91,179 | |
| Kyndryl Holdings, Inc., 2.70%, 10/15/28‡ | | | 105,000 | | | | 83,881 | |
| Oracle Corp., 2.30%, 03/25/28 | | | 100,000 | | | | 86,283 | |
| TD Synnex Corp., 1.75%, 08/09/26‡ | | | 107,000 | | | | 94,528 | |
| TD Synnex Corp., 2.38%, 08/09/28‡ | | | 110,000 | | | | 93,023 | |
| Total Information Technology | | | | | | | 1,407,887 | |
| Investments | | Principal | | | Value | |
| CORPORATE BONDS (continued) | |
| | | | | | | | | |
| Materials — 1.1% | |
| Ardagh Packaging Finance PLC / Ardagh Holdings USA, Inc., 4.13%, 08/15/26‡ | | $ | 200,000 | | | $ | 169,876 | |
| Bayport Polymers LLC, 4.74%, 04/14/27‡ | | | 240,000 | | | | 233,616 | |
| International Flavors & Fragrances, Inc., 1.23%, 10/01/25‡ | | | 118,000 | | | | 106,723 | |
| International Flavors & Fragrances, Inc., 1.83%, 10/15/27‡ | | | 233,000 | | | | 201,278 | |
| Silgan Holdings, Inc., 1.40%, 04/01/26‡ | | | 271,000 | | | | 242,723 | |
| Total Materials | | | | | | | 954,216 | |
| | | | | | | | | |
| Real Estate — 1.3% | |
| EPR Properties, 4.95%, 04/15/28 | | | 145,000 | | | | 133,730 | |
| GLP Capital LP / GLP Financing II, Inc., 5.25%, 06/01/25 | | | 195,000 | | | | 191,618 | |
| Office Properties Income Trust, 4.50%, 02/01/25 | | | 225,000 | | | | 215,962 | |
| Office Properties Income Trust, 2.65%, 06/15/26 | | | 105,000 | | | | 89,467 | |
| Retail Opportunity Investments Partnership LP, 5.00%, 12/15/23 | | | 231,000 | | | | 232,699 | |
| Service Properties Trust, 4.65%, 03/15/24 | | | 200,000 | | | | 172,208 | |
| VICI Properties LP / VICI Note Co., Inc., 4.63%, 06/15/25‡ | | | 75,000 | | | | 71,472 | |
| Total Real Estate | | | | | | | 1,107,156 | |
| | | | | | | | | |
| Utilities — 0.7% | |
| FirstEnergy Transmission LLC, 2.87%, 09/15/28‡ | | | 119,000 | | | | 100,955 | |
| NRG Energy, Inc., 3.75%, 06/15/24‡ | | | 175,000 | | | | 171,949 | |
| Puget Energy, Inc., 2.38%, 06/15/28 | | | 151,000 | | | | 132,429 | |
| Southern Co. (The), Series 21-A, 3.75%, (US 5 Year CMT T-Note + 2.92%), 09/15/51@ | | | 254,000 | | | | 216,451 | |
| Total Utilities | | | | | | | 621,784 | |
Total Corporate Bonds
(Cost $15,911,151) | | | | | | | 14,291,601 | |
See accompanying Notes to Financial Statements.
ADVISORSHARES NEWFLEET MULTI-SECTOR INCOME ETF
Schedule of Investments (continued)
June 30, 2022
| Investments | | Principal | | | Value | |
| TERM LOANS — 7.2% | |
| | | | | | | | | |
| Aerospace — 0.8% | |
| Air Canada, 4.25%, (3-Month USD LIBOR + 3.50%), 08/11/28@ | | $ | 28,235 | | | $ | 26,047 | |
| Brown Group Holding LLC, 4.17%, (1-Month USD LIBOR + 2.50%), 06/07/28@ | | | 129,763 | | | | 123,397 | |
| KKR Apple Bidco LLC, 4.42%, (1-Month USD LIBOR + 2.75%), 07/14/28@ | | | 79,600 | | | | 75,371 | |
| Mileage Plus Holdings LLC, 7.31%, (3-Month USD LIBOR + 5.25%), 06/21/27@ | | | 85,000 | | | | 84,193 | |
| SkyMiles IP Ltd, 4.75%, (3-Month USD LIBOR + 3.75%), 09/16/27@ | | | 120,000 | | | | 119,550 | |
| TransDigm, Inc., 3.92%, (1-Month USD LIBOR + 2.25%), 08/22/24@ | | | 161,623 | | | | 156,328 | |
| TransDigm, Inc., 3.92%, (1-Month USD LIBOR + 2.25%), 05/30/25@ | | | 68,688 | | | | 65,448 | |
| Total Aerospace | | | | | | | 650,334 | |
| | | | | | | | | |
| Chemicals — 0.4% | |
| Ineos US Finance LLC, 3.67%, (1-Month USD LIBOR + 2.00%), 04/01/24@ | | | 237,641 | | | | 230,475 | |
| Nouryon USA LLC, 5.25%, (3-Month USD LIBOR + 3.00%), 10/01/25@ | | | 70,811 | | | | 67,159 | |
| Total Chemicals | | | | | | | 297,634 | |
| | | | | | | | | |
| Consumer Durables — 0.3% | |
| Fluidra Finco SL, 3.63%, (1-Month USD LIBOR + 2.00%), 01/21/29@ | | | 179,063 | | | | 174,250 | |
| Resideo Funding, Inc., 3.65%, (3-Month USD LIBOR + 2.25%), 02/11/28@ | | | 113,636 | | | | 109,943 | |
| Total Consumer Durables | | | | | | | 284,193 | |
| | | | | | | | | |
| Energy — 0.3% | |
| Freeport LNG Investments LLLP, 4.56%, (3-Month USD LIBOR + 3.50%), 11/17/28@ | | | 84,723 | | | | 73,709 | |
| Oryx Midstream Services Permian Basin LLC, 4.71%, (3-Month USD LIBOR + 3.25%), 09/30/28@ | | | 154,225 | | | | 147,157 | |
| Total Energy | | | | | | | 220,866 | |
| Investments | | Principal | | | Value | |
| TERM LOANS (continued) | |
| | | | | | | | | |
| Financials — 0.3% | |
| Avolon TLB Borrower 1 US LLC, 3.85%, (1-Month USD LIBOR + 2.25%), 12/01/27@ | | $ | 145,934 | | | $ | 139,048 | |
| Citadel Securities LP, 4.14%, (1-Month USD LIBOR + 2.50%), 02/02/28@ | | | 137,100 | | | | 132,238 | |
| Total Financials | | | | | | | 271,286 | |
| | | | | | | | | |
| Food/Tobacco — 0.4% | |
| Aramark Services, Inc., 3.42%, (1-Month USD LIBOR + 1.75%), 03/11/25@ | | | 85,000 | | | | 81,855 | |
| Aramark Services, Inc., 4.17%, (1-Month USD LIBOR + 2.50%), 04/06/28@ | | | 109,607 | | | | 105,177 | |
| Hostess Brands LLC, 3.49%, (3-Month USD LIBOR + 2.25%), 08/03/25@ | | | 117,988 | | | | 113,585 | |
| Total Food/Tobacco | | | | | | | 300,617 | |
| | | | | | | | | |
| Forest Prod/Containers — 0.2% | |
| Berry Global, Inc., 4.18%, (3-Month USD LIBOR + 1.75%), 07/01/26@ | | | 124,377 | | | | 120,455 | |
| Mauser Packaging Solutions Holding Co., 5.04%, (1-Month USD LIBOR + 3.25%), 04/03/24@ | | | 88,601 | | | | 83,599 | |
| Total Forest Prod/Containers | | | | | | | 204,054 | |
| | | | | | | | | |
| Gaming/Leisure — 0.6% | |
| Caesars Resort Collection LLC, 4.42%, (1-Month USD LIBOR + 2.75%), 12/23/24@ | | | 153,125 | | | | 147,813 | |
| Hilton Worldwide Finance LLC, 3.37%, (1-Month USD LIBOR + 1.75%), 06/22/26@ | | | 85,000 | | | | 81,915 | |
| Scientific Games, 5.04%, (1-Month USD LIBOR + 3.00%), 04/07/29@ | | | 50,000 | | | | 47,615 | |
| Stars Group Holdings BV, 4.50%, (3-Month USD LIBOR + 2.25%), 07/21/26@ | | | 97,772 | | | | 93,268 | |
| Station Casinos LLC, 3.92%, (1-Month USD LIBOR + 2.25%), 02/08/27@ | | | 93,352 | | | | 88,088 | |
| UFC Holdings LLC, 3.50%, (3-Month USD LIBOR + 2.75%), 04/29/26@ | | | 88,681 | | | | 82,872 | |
| Total Gaming/Leisure | | | | | | | 541,571 | |
See accompanying Notes to Financial Statements.
ADVISORSHARES NEWFLEET MULTI-SECTOR INCOME ETF
Schedule of Investments (continued)
June 30, 2022
| Investments | | Principal | | | Value | |
| TERM LOANS (continued) | |
| | | | | | | | | |
| Health Care — 0.4% | |
| Agiliti Health Inc, 4.50%, (1-Month USD LIBOR + 2.75%), 01/04/26@ | | $ | 59,538 | | | $ | 57,306 | |
| Elanco Animal Health, Inc., 3.46%, (1-Month USD LIBOR + 1.75%), 08/01/27@ | | | 100,030 | | | | 94,741 | |
| Horizon Therapeutics USA, Inc., 3.38%, (1-Month USD LIBOR + 1.75%), 03/15/28@ | | | 102,939 | | | | 99,690 | |
| Phoenix Newco Inc, 4.92%, (1-Month USD LIBOR + 3.25%), 08/11/28@ | | | 24,938 | | | | 23,485 | |
| Select Medical Corp., 4.17%, (1-Month USD LIBOR + 2.50%), 03/06/25@ | | | 90,000 | | | | 86,400 | |
| Total Health Care | | | | | | | 361,622 | |
| | | | | | | | | |
| Housing — 0.5% | |
| American Builders & Contractors Supply Co., Inc., 3.67%, (1-Month USD LIBOR + 2.00%), 01/15/27@ | | | 88,096 | | | | 83,540 | |
| CPG International (Azek), 4.09%, (3-Month USD LIBOR + 2.50%), 04/20/29@ | | | 90,000 | | | | 83,925 | |
| Quikrete Holdings, Inc., 4.67%, (1-Month USD LIBOR + 3.00%), 06/11/28@ | | | 89,700 | | | | 84,834 | |
| Standard Industries Inc/NJ, 3.79%, (3-Month USD LIBOR + 2.50%), 08/06/28@ | | | 133,813 | | | | 129,655 | |
| Total Housing | | | | | | | 381,954 | |
| | | | | | | | | |
| Information Technology — 0.7% | |
| Boxer Parent Co Inc, 5.42%, (1-Month USD LIBOR + 3.75%), 10/02/25@ | | | 89,134 | | | | 83,267 | |
| CCC Intelligent Solutions Inc, 4.50%, (3-Month USD LIBOR + 2.25%), 09/15/28@ | | | 94,475 | | | | 89,893 | |
| Go Daddy Operating Co. LLC, 3.42%, (1-Month USD LIBOR + 1.75%), 02/15/24@ | | | 181,165 | | | | 175,617 | |
| Tenable, Inc., 3.27%, (3-Month USD LIBOR + 2.75%), 07/07/28@ | | | 89,413 | | | | 85,687 | |
| UKG Inc, 5.54%, (3-Month USD LIBOR + 3.25%), 05/04/26@ | | | 129,575 | | | | 121,740 | |
| Total Information Technology | | | | | | | 556,204 | |
| Investments | | Principal | | | Value | |
| TERM LOANS (continued) | |
| | | | | | | | | |
| Manufacturing — 0.4% | |
| Gates Global LLC, 4.17%, (1-Month USD LIBOR + 2.50%), 03/31/27@ | | $ | 88,089 | | | $ | 83,376 | |
| NCR Corp., 3.74%, (3-Month USD LIBOR + 2.50%), 08/28/26@ | | | 147,335 | | | | 143,406 | |
| Tenneco, Inc., 4.67%, (1-Month USD LIBOR + 3.00%), 10/01/25@ | | | 88,622 | | | | 85,734 | |
| Total Manufacturing | | | | | | | 312,516 | |
| | | | | | | | | |
| Media/Telecom — Broadcasting — 0.1% | |
| Nexstar Media Group, Inc., 4.17%, (1-Month USD LIBOR + 2.50%), 09/18/26@ | | | 68,652 | | | | 67,856 | |
| | | | | | | | | |
| Media/Telecom — Cable/Wireless Video — 0.6% | |
| Charter Communications Operating LLC, 3.42%, (1-Month USD LIBOR + 1.75%), 02/01/27@ | | | 147,406 | | | | 140,904 | |
| CSC Holdings, LLC (fka CSC Holdings, Inc. (Cablevision)), 3.57%, (1-Month USD LIBOR + 2.25%), 07/17/25@ | | | 180,709 | | | | 168,602 | |
| Directv Financing LLC, 6.67%, (1-Month USD LIBOR + 5.00%), 07/22/27@ | | | 90,627 | | | | 83,698 | |
| Virgin Media Bristol LLC, 3.82%, (1-Month USD LIBOR + 2.50%), 01/31/28@ | | | 145,000 | | | | 136,219 | |
| Total Media/Telecom — Cable/Wireless Video | | | | | | | 529,423 | |
| | | | | | | | | |
| Media/Telecom — Diversified Media — 0.1% | |
| Clear Channel, 4.74%, (3-Month USD LIBOR + 3.50%), 08/21/26@ | | | 91,975 | | | | 79,489 | |
| | | | | | | | | |
| Media/Telecom — Telecommunications — 0.1% | |
| CenturyLink, Inc., 3.92%, (1-Month USD LIBOR + 2.25%), 03/15/27@ | | | 122,127 | | | | 112,623 | |
| | | | | | | | | |
| Media/Telecom — Wireless Communications — 0.1% | |
| SBA Senior Finance II LLC, 3.42%, (1-Month USD LIBOR + 1.75%), 04/11/25@ | | | 128,000 | | | | 123,676 | |
| | | | �� | | | | | |
| Retail — 0.1% | |
| PetSmart, Inc., 4.50%, (3-Month USD LIBOR + 3.75%), 02/11/28@ | | | 99,250 | | | | 93,717 | |
See accompanying Notes to Financial Statements.
ADVISORSHARES NEWFLEET MULTI-SECTOR INCOME ETF
Schedule of Investments (continued)
June 30, 2022
| Investments | | Principal | | | Value | |
| TERM LOANS (continued) | |
| | | | | | | | | |
| Service — 0.7% | |
| Asplundh Tree Expert LLC, 3.42%, (1-Month USD LIBOR + 1.75%), 09/07/27@ | | $ | 113,204 | | | $ | 109,596 | |
| Dun & Bradstreet Corp. (The), 4.87%, (1-Month USD LIBOR + 3.25%), 02/06/26@ | | | 87,587 | | | | 82,879 | |
| Dun & Bradstreet Corp/The, 4.75%, (1-Month USD LIBOR + 3.25%), 01/05/29@ | | | 19,950 | | | | 18,703 | |
| NAB Holdings LLC, 3.76%, (3-Month USD LIBOR + 3.00%), 11/17/28@ | | | 89,500 | | | | 83,963 | |
| Pike Corp., 4.67%, (1-Month USD LIBOR + 3.00%), 01/21/28@ | | | 85,479 | | | | 81,508 | |
| PODS LLC, 4.67%, (1-Month USD LIBOR + 3.00%), 03/31/28@ | | | 98,654 | | | | 92,044 | |
| Sedgwick Claims Management Services Inc, 4.92%, (1-Month USD LIBOR + 3.25%), 12/31/25@ | | | 99,229 | | | | 93,449 | |
| Total Service | | | | | | | 562,142 | |
| | | | | | | | | |
| Utilities — 0.1% | |
| Vistra Operations Co. LLC, 3.27%, (1-Month USD LIBOR + 1.75%), 12/31/25@ | | | 134,398 | | | | 129,022 | |
Total Term Loans
(Cost $6,362,738) | | | | | | | 6,080,799 | |
| | | | | | | | | |
| U.S. TREASURY NOTES — 6.3% | |
| | | | | | | | | |
| U.S. Treasury Note, 0.13%, 03/31/23 | | | 2,245,000 | | | | 2,201,321 | |
| U.S. Treasury Note, 0.13%, 04/30/23 | | | 315,000 | | | | 307,937 | |
| U.S. Treasury Note, 2.50%, 04/30/24(a) | | | 1,400,000 | | | | 1,389,145 | |
| U.S. Treasury Note, 1.00%, 12/15/24 | | | 1,475,000 | | | | 1,406,263 | |
Total U.S. Treasury Notes
(Cost $5,405,377) | | | | | | | 5,304,666 | |
| | | | | | | | | |
| FOREIGN BONDS — 5.4% | |
| | | | | | | | | |
| Consumer Staples — 0.7% | |
| Bacardi Ltd. (Bermuda), 4.70%, 05/15/28‡ | | | 210,000 | | | | 207,981 | |
| BAT Capital Corp. (United Kingdom), 2.26%, 03/25/28 | | | 330,000 | | | | 277,249 | |
| Investments | | Principal | | | Value | |
| FOREIGN BONDS (continued) | |
| | | | | | | | | |
| Consumer Staples (continued) | |
| Central American Bottling Corp. / CBC Bottling Holdco SL / Beliv Holdco SL (Guatemala), 5.25%, 04/27/29‡ | | $ | 80,000 | | | $ | 69,836 | |
| Total Consumer Staples | | | | | | | 555,066 | |
| | | | | | | | | |
| Energy — 0.6% | |
| BP Capital Markets PLC (United Kingdom), 4.88%, (US 5 Year CMT T-Note + 4.40%)#@ | | | 205,000 | | | | 179,276 | |
| Lundin Energy Finance BV (Netherlands), 2.00%, 07/15/26‡ | | | 400,000 | | | | 358,256 | |
| Total Energy | | | | | | | 537,532 | |
| | | | | | | | | |
| Financials — 1.0% | |
| AerCap Ireland Capital DAC / AerCap Global Aviation Trust (Ireland), 2.45%, 10/29/26 | | | 150,000 | | | | 130,892 | |
| AerCap Ireland Capital DAC / AerCap Global Aviation Trust (Ireland), 3.00%, 10/29/28 | | | 155,000 | | | | 130,947 | |
| Banco Santander (Chile), 2.70%, 01/10/25‡ | | | 150,000 | | | | 143,759 | |
| Brookfield Finance, Inc. (Canada), 3.90%, 01/25/28 | | | 210,000 | | | | 201,185 | |
| Danske Bank A/S (Denmark), 3.77%, (US 1 Year CMT T-Note + 1.45%), 03/28/25@‡ | | | 200,000 | | | | 196,941 | |
| Total Financials | | | | | | | 803,724 | |
| | | | | | | | | |
| Industrials — 1.0% | |
| Ashtead Capital, Inc. (United Kingdom), 4.38%, 08/15/27‡ | | | 445,000 | | | | 414,388 | |
| British Airways Pass-Through Trust, Class A, Series 2021-1 (United Kingdom), 2.90%, 03/15/35‡ | | | 214,400 | | | | 189,802 | |
| Doric Nimrod Air Finance Alpha Ltd. Class A Pass-Through Trust, Series 2012-1A (Guernsey), 5.13%, 11/30/22‡ | | | 69,518 | | | | 68,917 | |
| GFL Environmental, Inc. (Canada), 3.75%, 08/01/25‡ | | | 145,000 | | | | 134,739 | |
| Total Industrials | | | | | | | 807,846 | |
See accompanying Notes to Financial Statements.
ADVISORSHARES NEWFLEET MULTI-SECTOR INCOME ETF
Schedule of Investments (continued)
June 30, 2022
| Investments | | Principal | | | Value | |
| FOREIGN BONDS (continued) | |
| | | | | | | | | |
| Information Technology — 0.3% | |
| Open Text Corp. (Canada), 3.88%, 02/15/28‡ | | $ | 100,000 | | | $ | 89,087 | |
| SK Hynix, Inc. (South Korea), 1.50%, 01/19/26‡ | | | 200,000 | | | | 180,177 | |
| Total Information Technology | | | | | | | 269,264 | |
| | | | | | | | | |
| Materials — 0.7% | |
| FMG Resources August Pty Ltd. (Australia), 5.88%, 04/15/30‡ | | | 145,000 | | | | 131,751 | |
| Glencore Funding LLC (Australia), 1.63%, 09/01/25‡ | | | 245,000 | | | | 224,471 | |
| NOVA Chemicals Corp. (Canada), 5.00%, 05/01/25‡ | | | 180,000 | | | | 164,841 | |
| Suzano Austria GMBH (Brazil), 2.50%, 09/15/28 | | | 80,000 | | | | 65,117 | |
| Total Materials | | | | | | | 586,180 | |
| | | | | | | | | |
| Oil & Gas — 0.2% | |
| Petroleos Mexicanos (Mexico), 4.63%, 09/21/23 | | | 180,000 | | | | 176,368 | |
| | | | | | | | | |
| Sovereign Government — 0.9% | |
| Dominican Republic International Bond (Dominican Republic), 5.50%, 02/22/29‡ | | | 195,000 | | | | 170,219 | |
| Oman Government International Bond (Oman), 5.63%, 01/17/28‡ | | | 200,000 | | | | 192,907 | |
| Qatar Government International Bond (Qatar), 3.40%, 04/16/25‡ | | | 200,000 | | | | 199,292 | |
| Republic of South Africa Government International Bond (South Africa), 5.88%, 09/16/25 | | | 200,000 | | | | 198,538 | |
| Total Sovereign Government | | | | | | | 760,956 | |
Total Foreign Bonds
(Cost $4,999,102) | | | | | | | 4,496,936 | |
| | | | | | | | | |
| MONEY MARKET FUND — 3.7% | |
JPMorgan U.S. Government Money Market Fund — Institutional Class, 1.29%(b)
(Cost $3,085,679) | | | 3,085,679 | | | | 3,085,679 | |
| Investments | | Principal | | | Value | |
| REPURCHASE AGREEMENT — 0.3%(c) | |
RBC Dominion Securities, Inc., dated 06/30/22, due 07/01/22, 1.55%, total to be received $239,255, (collateralized by various U.S. Government Agency Obligations, 0.00%-6.88%, 8/16/22-5/20/52, totaling $244,030)
(Cost $239,245) | | $ | 239,245 | | | $ | 239,245 | |
| | | | | | | | | |
Total Investments — 100.4%
(Cost $89,226,838) | | | | | | | 84,038,229 | |
| Liabilities in Excess of Other Assets — (0.4%) | | | | | | | (356,629 | ) |
| Net Assets — 100.0% | | | | | | $ | 83,681,600 | |
CMT — Constant Maturity Treasury Index
LIBOR — London Interbank Offered Rate
LP — Limited Partnership
PLC — Public Limited Company
SOFR — Secured Overnight Financing Rate
USD — United States Dollar
| # | Perpetual security with no stated maturity date. |
| @ | Variable rate instrument. The interest rate shown reflects the rate in effect at June 30, 2022. |
| * | Adjustable rate security with an interest rate that is not based on a published reference index and spread. The rate is based on the structure of the agreement and current market conditions. |
| ‡ | Security was purchased pursuant to Rule 144A under the Securities Act of 1933 and may not be resold subject to that rule except to qualified institutional buyers. Unless otherwise noted, 144A securities are deemed to be liquid. |
| (a) | All or a portion of security is on loan. The aggregate market value of the securities on loan is $883,186; the aggregate market value of the collateral held by the fund is $905,857. The aggregate market value of the collateral includes non-cash U.S. Treasury securities collateral having a value of $666,612. |
| (b) | Rate shown reflects the 7-day yield as of June 30, 2022. |
| (c) | Collateral received from brokers for securities lending was invested in these short-term investments. |
See accompanying Notes to Financial Statements.
ADVISORSHARES NEWFLEET MULTI-SECTOR INCOME ETF
Schedule of Investments (continued)
June 30, 2022
Fair Value Measurements
The following is a summary of the inputs used, as of June 30, 2022, in valuing the Fund’s assets and liabilities carried at fair value. These inputs are summarized in three broad levels. Level 1 includes quoted prices in active markets for identical securities. Level 2 includes other significant observable inputs (including quoted prices for similar securities, interest rates, prepayment speeds and credit risk). Level 3 includes significant unobservable inputs (including the Fund’s own assumptions in determining the fair value of investments). The level assigned to the securities valuations may not be an indication of the risk or liquidity associated with investing in those securities.
| Assets | | Level 1 | | | Level 2 | | | Level 3 | | | Total | |
| Asset Backed Securities | | $ | — | | | $ | 28,545,991 | | | $ | — | | | $ | 28,545,991 | |
| Mortgage Backed Securities | | | — | | | | 21,993,312 | | | | — | | | | 21,993,312 | |
| Corporate Bonds | | | — | | | | 14,291,601 | | | | — | | | | 14,291,601 | |
| Term Loans | | | — | | | | 6,080,799 | | | | — | | | | 6,080,799 | |
| U.S. Treasury Notes | | | — | | | | 5,304,666 | | | | — | | | | 5,304,666 | |
| Foreign Bonds | | | — | | | | 4,496,936 | | | | — | | | | 4,496,936 | |
| Money Market Fund | | | 3,085,679 | | | | — | | | | — | �� | | | 3,085,679 | |
| Repurchase Agreement | | | — | | | | 239,245 | | | | — | | | | 239,245 | |
| Total | | $ | 3,085,679 | | | $ | 80,952,550 | | | $ | — | | | $ | 84,038,229 | |
SUMMARY OF SCHEDULE OF INVESTMENTS
| | | % of
Net Assets | |
| Aerospace | | | 0.8 | % |
| Asset Backed Securities | | | 34.1 | |
| Chemicals | | | 0.4 | |
| Commercial Mortgage Backed Securities | | | 3.5 | |
| Communication Services | | | 1.0 | |
| Consumer Discretionary | | | 0.3 | |
| Consumer Durables | | | 0.3 | |
| Consumer Staples | | | 0.9 | |
| Energy | | | 2.2 | |
| Financials | | | 7.8 | |
| Food/Tobacco | | | 0.4 | |
| Forest Prod/Containers | | | 0.2 | |
| Gaming/Leisure | | | 0.6 | |
| Health Care | | | 2.2 | |
| Housing | | | 0.5 | |
| Industrials | | | 2.2 | |
| Information Technology | | | 2.7 | |
| Manufacturing | | | 0.4 | |
| Materials | | | 1.8 | |
| Media/Telecom – Broadcasting | | | 0.1 | |
| Media/Telecom – Cable/Wireless Video | | | 0.6 | |
| Media/Telecom – Diversified Media | | | 0.1 | |
| Media/Telecom – Telecommunications | | | 0.1 | |
SUMMARY OF SCHEDULE OF INVESTMENTS
(continued)
| | | % of
Net Assets | |
| Media/Telecom – Wireless Communications | | | 0.1 | % |
| Mortgage Backed Security | | | 0.1 | |
| Oil & Gas | | | 0.2 | |
| Real Estate | | | 1.3 | |
| Residential Mortgage Backed Securities | | | 22.7 | |
| Retail | | | 0.1 | |
| Service | | | 0.7 | |
| Sovereign Government | | | 0.9 | |
| U.S. Treasury Notes | | | 6.3 | |
| Utilities | | | 0.8 | |
| Money Market | | | 3.7 | |
| Repurchase Agreement | | | 0.3 | |
| Total Investments | | | 100.4 | |
| Liabilities in Excess of Other Assets | | | (0.4 | ) |
| Net Assets | | | 100.0 | % |
See accompanying Notes to Financial Statements.
ADVISORSHARES NORTH SQUARE MCKEE CORE RESERVES ETF
(formerly AdvisorShares Sage Core Reserves ETF)
Schedule of Investments
June 30, 2022
| Investments | | Principal | | | Value | |
| ASSET BACKED SECURITIES — 38.6% | |
| | | | | | | | | |
| Diversified Financial Services — 38.6% | |
| American Credit Acceptance Receivables Trust, Class D, Series 2019-3, 2.89%, 09/12/25‡ | | $ | 485,636 | | | $ | 484,829 | |
| American Credit Acceptance Receivables Trust, Class D, Series 2020-4, 1.77%, 12/14/26‡ | | | 355,000 | | | | 340,424 | |
| American Express Credit Account Master Trust, Class A, Series 2019-3, 2.00%, 04/15/25 | | | 540,000 | | | | 540,687 | |
| AmeriCredit Automobile Receivables Trust, Class A3, Series 2021-2, 0.34%, 12/18/26 | | | 600,000 | | | | 582,102 | |
| AmeriCredit Automobile Receivables Trust, Class A3, Series 2021-3, 0.76%, 08/18/26 | | | 400,000 | | | | 384,102 | |
| Carvana Auto Receivables Trust, Class A1, Series 2021-N4, 0.83%, 09/11/28 | | | 255,122 | | | | 250,277 | |
| Carvana Auto Receivables Trust, Class A1, Series 2022-N1, 2.31%, 12/11/28‡ | | | 259,327 | | | | 254,857 | |
| CIG Auto Receivables Trust, Class A, Series 2021-1A, 0.69%, 04/14/25‡ | | | 365,876 | | | | 358,354 | |
| Conn’s Receivables Funding LLC, Class A, Series 2021-A, 1.05%, 05/15/26‡ | | | 225,679 | | | | 224,317 | |
| Enterprise Fleet Funding LLC, Class A2, Series 2021-1, 0.44%, 12/21/26‡ | | | 494,490 | | | | 480,138 | |
| Exeter Automobile Receivables Trust, Class A3, Series 2021-2A, 0.30%, 10/15/24 | | | 195,805 | | | | 195,534 | |
| Exeter Automobile Receivables Trust, Class B, Series 2021-1A, 0.50%, 02/18/25 | | | 97,774 | | | | 97,457 | |
| First Investors Auto Owner Trust, Class A, Series 2022-1A, 2.03%, 01/15/27‡ | | | 296,319 | | | | 289,979 | |
| Flagship Credit Auto Trust, Class A, Series 2021-4, 0.81%, 07/17/26‡ | | | 389,765 | | | | 376,371 | |
| Flagship Credit Auto Trust, Class A, Series 2022-1, 1.79%, 10/15/26‡ | | | 421,358 | | | | 410,305 | |
| Ford Credit Auto Lease Trust, Class A2, Series 2021-B, 0.24%, 04/15/24 | | | 415,272 | | | | 411,463 | |
| Investments | | Principal | | | Value | |
| ASSET BACKED SECURITIES (continued) | |
| | | | | | | | | |
| Diversified Financial Services (continued) | |
| Ford Credit Floorplan Master Owner Trust, Class A, Series 2017-3, 2.48%, 09/15/24 | | $ | 630,000 | | | $ | 630,055 | |
| GLS Auto Receivables Issuer Trust, Class A, Series 2021-3A, 0.42%, 01/15/25‡ | | | 97,105 | | | | 95,953 | |
| GLS Auto Receivables Issuer Trust, Class A, Series 2021-4A, 0.84%, 07/15/25‡ | | | 324,194 | | | | 318,261 | |
| GLS Auto Receivables Issuer Trust, Class B, Series 2021-3A, 0.78%, 11/17/25‡ | | | 195,000 | | | | 186,985 | |
| GLS Auto Receivables Trust, Class A, Series 2022-1A, 1.98%, 08/15/25‡ | | | 583,122 | | | | 576,153 | |
| GM Financial Automobile Leasing Trust, Class C, Series 2020-2, 2.56%, 07/22/24 | | | 160,000 | | | | 158,629 | |
| GM Financial Consumer Automobile Receivables Trust, Class A2, Series 2021-2, 0.27%, 06/17/24 | | | 193,673 | | | | 192,873 | |
| GreatAmerica Leasing Receivables Funding LLC, Class A2, Series 2021-2, 0.38%, 03/15/24‡ | | | 650,000 | | | | 637,313 | |
| Honda Auto Receivables Owner Trust, Class A2, Series 2021-3, 0.20%, 02/20/24 | | | 280,375 | | | | 277,815 | |
| OneMain Financial Issuance Trust, Class A, Series 2020-1A, 3.84%, 05/14/32‡ | | | 436,751 | | | | 435,641 | |
| Oscar US Funding XIV LLC, Class A2, Series 2022-1A (Japan), 1.60%, 03/10/25‡ | | | 690,000 | | | | 678,292 | |
| Santander Drive Auto Receivables Trust, Class A3, Series 2022-1, 1.94%, 11/17/25 | | | 490,000 | | | | 478,700 | |
| Santander Drive Auto Receivables Trust, Class B, Series 2020-4, 0.73%, 03/17/25 | | | 147,385 | | | | 147,117 | |
| Santander Drive Auto Receivables Trust, Class C, Series 2020-3, 1.12%, 01/15/26 | | | 325,000 | | | | 322,546 | |
See accompanying Notes to Financial Statements.
ADVISORSHARES NORTH SQUARE MCKEE CORE RESERVES ETF
Schedule of Investments (continued)
June 30, 2022
| Investments | | Principal | | | Value | |
| ASSET BACKED SECURITIES (continued) | |
| | | | | | | | | |
| Diversified Financial Services (continued) | |
| Santander Drive Auto Receivables Trust, Class C, Series 2021-1, 0.75%, 02/17/26 | | $ | 675,000 | | | $ | 658,819 | |
| Tesla Auto Lease Trust, Class A2, Series 2021-A, 0.36%, 03/20/25‡ | | | 178,287 | | | | 175,541 | |
| Toyota Auto Receivables Owner Trust, Class A2A, Series 2022-B, 2.35%, 01/15/25 | | | 375,000 | | | | 372,530 | |
| United Auto Credit Securitization Trust, Class A, Series 2022-1, 1.11%, 07/10/24‡ | | | 312,277 | | | | 309,958 | |
| Verizon Owner Trust, Class A1A, Series 2019-A, 2.93%, 09/20/23 | | | 6,452 | | | | 6,457 | |
| Verizon Owner Trust, Class B, Series 2020-A, 1.98%, 07/22/24 | | | 500,000 | | | | 494,694 | |
| Westlake Automobile Receivables Trust, Class A2, Series 2021-3A, 0.57%, 09/16/24‡ | | | 399,690 | | | | 395,181 | |
| Westlake Automobile Receivables Trust, Class A2A, Series 2021-2A, 0.32%, 04/15/25‡ | | | 336,916 | | | | 332,650 | |
Total Asset Backed Securities
(Cost $13,736,601) | | | | | | | 13,563,359 | |
| | | | | | | | | |
| CORPORATE BONDS — 31.2% | |
| | | | | | | | | |
| Banks — 11.1% | |
| Bank of America Corp., 3.00%, (3-Month USD LIBOR + 0.79%), 12/20/23@ | | | 1,000,000 | | | | 997,176 | |
| Goldman Sachs Group, Inc. (The), 2.03%, (SOFR + 0.62%), 12/06/23@ | | | 600,000 | | | | 593,111 | |
| JPMorgan Chase Bank NA, Series 2, 1.71%, (3-Month USD LIBOR + 0.10%), 12/04/23@ | | | 245,000 | | | | 244,564 | |
| Morgan Stanley, 4.88%, 11/01/22 | | | 920,000 | | | | 926,664 | |
| Wells Fargo & Co., Series M, 3.45%, 02/13/23 | | | 1,116,000 | | | | 1,117,484 | |
| Total Banks | | | | | | | 3,878,999 | |
| | | | | | | | | |
| Biotechnology — 1.3% | |
| Biogen, Inc., 3.63%, 09/15/22 | | | 443,000 | | | | 443,083 | |
| Investments | | Principal | | | Value | |
| CORPORATE BONDS (continued) | |
| | | | | | | | | |
| Diversified Financial Services — 2.3% | |
| Aircastle Ltd., 4.40%, 09/25/23 | | $ | 325,000 | | | $ | 321,116 | |
| American Express Co., 1.83%, (SOFR + 0.72%), 05/03/24@ | | | 495,000 | | | | 491,574 | |
| Total Diversified Financial Services | | | | | | | 812,690 | |
| | | | | | | | | |
| Electric — 3.8% | |
| Edison International, 2.40%, 09/15/22 | | | 735,000 | | | | 733,549 | |
| OGE Energy Corp., 0.70%, 05/26/23 | | | 113,000 | | | | 110,152 | |
| Pacific Gas and Electric Co., 3.25%, 02/16/24 | | | 500,000 | | | | 487,633 | |
| Total Electric | | | | | | | 1,331,334 | |
| | | | | | | | | |
| Entertainment — 1.0% | |
| Magallanes, Inc., 3.53%, 03/15/24‡ | | | 375,000 | | | | 367,707 | |
| | | | | | | | | |
| Gas — 2.8% | |
| CenterPoint Energy Resources Corp., 2.11%, (3-Month USD LIBOR + 0.50%), 03/02/23@ | | | 523,000 | | | | 521,617 | |
| Southern California Gas Co., 2.09%, (3-Month USD LIBOR + 0.35%), 09/14/23@ | | | 466,000 | | | | 463,187 | |
| Total Gas | | | | | | | 984,804 | |
| | | | | | | | | |
| Healthcare — Services — 1.7% | |
| Humana, Inc., 3.15%, 12/01/22 | | | 581,000 | | | | 581,250 | |
| | | | | | | | | |
| Insurance — 2.3% | |
| Athene Global Funding, 2.26%, (SOFR + 0.72%), 01/07/25@‡ | | | 825,000 | | | | 799,509 | |
| | | | | | | | | |
| Media — 0.6% | |
| DISH DBS Corp., 5.88%, 07/15/22 | | | 220,000 | | | | 220,734 | |
| | | | | | | | | |
| Pharmaceuticals — 1.9% | |
| AbbVie, Inc., 2.90%, 11/06/22 | | | 670,000 | | | | 670,066 | |
| | | | | | | | | |
| Pipelines — 1.4% | |
| Kinder Morgan Energy Partners LP, 3.45%, 02/15/23 | | | 509,000 | | | | 509,612 | |
| | | | | | | | | |
| Retail — 1.0% | |
| QVC, Inc., 4.38%, 03/15/23 | | | 336,000 | | | | 335,370 | |
Total Corporate Bonds
(Cost $11,070,899) | | | | | | | 10,935,158 | |
See accompanying Notes to Financial Statements.
ADVISORSHARES NORTH SQUARE MCKEE CORE RESERVES ETF
Schedule of Investments (continued)
June 30, 2022
| Investments | |
Principal | | | Value | |
| CORPORATE BONDS (continued) | |
| | | | | | | | | |
| U.S. TREASURY NOTES — 12.4% | |
| U.S. Treasury Note, 1.50%, 08/15/22 | | $ | 1,500,000 | | | $ | 1,500,104 | |
| U.S. Treasury Note, 0.13%, 10/31/22 | | | 2,000,000 | | | | 1,986,855 | |
| U.S. Treasury Note, 0.13%, 03/31/23 | | | 575,000 | | | | 563,813 | |
| U.S. Treasury Note, 2.75%, 08/31/23 | | | 300,000 | | | | 299,461 | |
Total U.S. Treasury Notes
(Cost $4,361,836) | | | | | | | 4,350,233 | |
| | | | | | | | | |
| MORTGAGE BACKED SECURITIES — 12.1% | |
| | | | | | | | | |
| Commercial Mortgage Backed Securities — 12.1% | |
| Arroyo Mortgage Trust, Class A1, Series 2019-1, 3.81%, 01/25/49@‡* | | | 134,487 | | | | 130,058 | |
| Federal Home Loan Mortgage Corp., Class A2, Series 2013-K025, 2.68%, 10/25/22 | | | 464,728 | | | | 464,630 | |
| Federal Home Loan Mortgage Corp., Class A2, Series 2013-K026, 2.51%, 11/25/22 | | | 531,293 | | | | 530,789 | |
| Federal Home Loan Mortgage Corp., Class A1, Series 2013-K033, 2.87%, 02/25/23 | | | 601,740 | | | | 601,173 | |
| Federal Home Loan Mortgage Corp., Class A1, Series 2015-K051, 2.89%, 04/25/25 | | | 397,516 | | | | 394,427 | |
| Federal Home Loan Mortgage Corp., Class PA, Series 2016-4614, 3.00%, 12/15/43 | | | 1,097,617 | | | | 1,091,834 | |
| Federal Home Loan Mortgage Corp., Class LB, Series 2017-4673, 2.50%, 04/15/44 | | | 55,784 | | | | 55,303 | |
| Federal Home Loan Mortgage Corp., Class QM, Series 2018-4776, 3.00%, 06/15/45 | | | 309,625 | | | | 307,513 | |
| Federal National Mortgage Association, Class LB, Series 2014-85, 3.00%, 02/25/33 | | | 359,235 | | | | 358,837 | |
| FREMF Mortgage Trust, Class B, Series 2012-K22, 3.76%, 08/25/45@‡* | | | 310,000 | | | | 309,788 | |
Total Mortgage Backed Securities
(Cost $4,265,408) | | | | | | | 4,244,352 | |
| Investments | | Principal/
Shares | | | Value | |
| FOREIGN BONDS — 3.9% | |
| | | | | | | | | |
| Banks — 3.0% | |
| Credit Suisse Group Funding Guernsey Ltd., 3.80%, 09/15/22 (Switzerland) | | $ | 1,050,000 | | | $ | 1,050,954 | |
| | | | | | | | | |
| Oil & Gas — 0.9% | |
| Ecopetrol SA, 5.88%, 09/18/23 (Colombia) | | | 328,000 | | | | 329,432 | |
Total Foreign Bonds
(Cost $1,397,042) | | | | | | | 1,380,386 | |
| | | | | | | | | |
| U.S. GOVERNMENT BOND AND NOTE — 0.4% | |
Federal Home Loan Banks, 2.50%, 04/29/27
(Cost $149,850) | | | 150,000 | | | | 149,325 | |
| | | | | | | | | |
| MONEY MARKET FUND — 4.4% | |
JPMorgan U.S. Government Money Market Fund — Institutional Class, 1.29%(a)
(Cost $1,529,219) | | | 1,529,219 | | | | 1,529,219 | |
| | | | | | | | | |
Total Investments — 103.0%
(Cost $36,510,855) | | | | | | | 36,152,032 | |
| Liabilities in Excess of Other Assets — (3.0%) | | | | | | | (1,065,371 | ) |
| Net Assets — 100.0% | | | | | | $ | 35,086,661 | |
LIBOR — London Interbank Offered Rate
LP — Limited Partnership
SOFR — Secured Overnight Financing Rate
USD — United States Dollar
| @ | Variable rate instrument. The interest rate shown reflects the rate in effect at June 30, 2022. |
| * | Adjustable rate security with an interest rate that is not based on a published reference index and spread. The rate is based on the structure of the agreement and current market conditions. |
| ‡ | Security was purchased pursuant to Rule 144A under the Securities Act of 1933 and may not be resold subject to that rule except to qualified institutional buyers. Unless otherwise noted, 144A securities are deemed to be liquid. |
| (a) | Rate shown reflects the 7-day yield as of June 30, 2022. |
See accompanying Notes to Financial Statements.
ADVISORSHARES NORTH SQUARE MCKEE CORE RESERVES ETF
Schedule of Investments (continued)
June 30, 2022
Fair Value Measurements
The following is a summary of the inputs used, as of June 30, 2022, in valuing the Fund’s assets and liabilities carried at fair value. These inputs are summarized in three broad levels. Level 1 includes quoted prices in active markets for identical securities. Level 2 includes other significant observable inputs (including quoted prices for similar securities, interest rates, prepayment speeds and credit risk). Level 3 includes significant unobservable inputs (including the Fund’s own assumptions in determining the fair value of investments). The level assigned to the securities valuations may not be an indication of the risk or liquidity associated with investing in those securities.
| Assets | | Level 1 | | | Level 2 | | | Level 3 | | | Total | |
| Asset Backed Securities | | $ | — | | | $ | 13,563,359 | | | $ | — | | | $ | 13,563,359 | |
| Corporate Bonds | | | — | | | | 10,935,158 | | | | — | | | | 10,935,158 | |
| U.S. Treasury Notes | | | — | | | | 4,350,233 | | | | — | | | | 4,350,233 | |
| Mortgage Backed Securities | | | — | | | | 4,244,352 | | | | — | | | | 4,244,352 | |
| Foreign Bonds | | | — | | | | 1,380,386 | | | | — | | | | 1,380,386 | |
| U.S. Government Bond and Note | | | — | | | | 149,325 | | | | — | | | | 149,325 | |
| Money Market Fund | | | 1,529,219 | | | | — | | | | — | | | | 1,529,219 | |
| Total | | $ | 1,529,219 | | | $ | 34,622,813 | | | $ | — | | | $ | 36,152,032 | |
SUMMARY OF SCHEDULE OF INVESTMENTS
| | | % of
Net Assets | |
| Banks | | | 14.1 | % |
| Biotechnology | | | 1.3 | |
| Commercial Mortgage Backed Securities | | | 12.1 | |
| Diversified Financial Services | | | 40.9 | |
| Electric | | | 3.8 | |
| Entertainment | | | 1.0 | |
| Gas | | | 2.8 | |
| Healthcare — Services | | | 1.7 | |
| Insurance | | | 2.3 | |
| Media | | | 0.6 | |
| Oil & Gas | | | 0.9 | |
| Pharmaceuticals | | | 1.9 | |
| Pipelines | | | 1.4 | |
| Retail | | | 1.0 | |
| U.S. Government Bond and Note | | | 0.4 | |
| U.S. Treasury Notes | | | 12.4 | |
| Money Market Fund | | | 4.4 | |
| Total Investments | | | 103.0 | |
| Liabilities in Excess of Other Assets | | | (3.0 | ) |
| Net Assets | | | 100.0 | % |
See accompanying Notes to Financial Statements.
ADVISORSHARES NORTH SQUARE MCKEE ESG CORE BOND ETF
(formerly AdvisorShares FolioBeyond Smart Core Bond ETF)
Schedule of Investments
June 30, 2022
| Investments | | Principal | | | Value | |
| U.S. GOVERNMENT BONDS AND NOTES — 28.7% | |
| Federal Agricultural Mortgage Corp., 4.17%, 05/24/29 | | $ | 16,000 | | | $ | 16,001 | |
| Federal Farm Credit Banks Funding Corp., 1.30%, 09/20/28 | | | 21,000 | | | | 18,651 | |
| Federal Farm Credit Banks Funding Corp., 1.77%, 02/04/31 | | | 26,000 | | | | 22,254 | |
| Federal Farm Credit Banks Funding Corp., 2.20%, 12/09/31 | | | 28,000 | | | | 24,675 | |
| Federal Farm Credit Banks Funding Corp., 2.20%, 11/01/33 | | | 36,000 | | | | 30,661 | |
| Federal Farm Credit Banks Funding Corp., 2.20%, 09/02/36 | | | 33,000 | | | | 26,943 | |
| Federal Farm Credit Banks Funding Corp., 2.28%, 02/14/28 | | | 45,000 | | | | 42,138 | |
| Federal Farm Credit Banks Funding Corp., 2.43%, 11/16/34 | | | 28,000 | | | | 24,701 | |
| Federal Farm Credit Banks Funding Corp., 2.45%, 02/23/28 | | | 12,000 | | | | 11,461 | |
| Federal Farm Credit Banks Funding Corp., 2.48%, 01/19/34 | | | 37,000 | | | | 32,239 | |
| Federal Farm Credit Banks Funding Corp., 2.48%, 02/01/34 | | | 36,000 | | | | 31,486 | |
| Federal Farm Credit Banks Funding Corp., 2.55%, 12/21/34 | | | 46,000 | | | | 39,328 | |
| Federal Farm Credit Banks Funding Corp., 2.75%, 02/02/37 | | | 37,000 | | | | 32,014 | |
| Federal Farm Credit Banks Funding Corp., 2.87%, 02/25/30 | | | 72,000 | | | | 67,700 | |
| Federal Farm Credit Banks Funding Corp., 3.00%, 03/08/32 | | | 20,000 | | | | 18,935 | |
| Federal Farm Credit Banks Funding Corp., 3.25%, 02/23/35 | | | 54,000 | | | | 50,087 | |
| Federal Farm Credit Banks Funding Corp., 3.36%, 02/23/37 | | | 92,000 | | | | 84,771 | |
| Federal Farm Credit Banks Funding Corp., 3.80%, 04/05/32 | | | 35,000 | | | | 34,253 | |
| Investments | | Principal | | | Value | |
| U.S. GOVERNMENT BONDS AND NOTES (continued) | |
| Federal Farm Credit Banks Funding Corp., 4.00%, 04/19/32 | | $ | 14,000 | | | $ | 13,880 | |
| Federal Farm Credit Banks Funding Corp., 4.20%, 04/07/36 | | | 20,000 | | | | 19,608 | |
| Federal Farm Credit Banks Funding Corp., 4.74%, 05/24/33 | | | 13,000 | | | | 12,968 | |
| Federal Farm Credit Banks Funding Corp., 4.90%, 05/24/35 | | | 18,000 | | | | 17,963 | |
| Federal Home Loan Banks, 2.00%, 02/25/27 | | | 75,000 | | | | 70,837 | |
| Federal Home Loan Banks, 2.00%, 03/25/30 | | | 37,500 | | | | 33,275 | |
| Federal Home Loan Banks, 2.50%, 04/29/27 | | | 100,000 | | | | 99,550 | |
| Federal Home Loan Banks, 2.75%, 02/22/34 | | | 15,000 | | | | 13,696 | |
| Federal Home Loan Banks, 2.90%, 02/18/37 | | | 15,000 | | | | 13,133 | |
| Federal Home Loan Banks, 4.44%, 05/26/32 | | | 20,000 | | | | 19,852 | |
| Federal Home Loan Mortgage Corp., 1.15%, 08/26/30 | | | 40,000 | | | | 33,397 | |
Total U.S. Government Bonds and Notes
(Cost $1,026,856) | | | | | | | 956,457 | |
| | | | | | | | | |
| CORPORATE BONDS — 27.7% | |
| | | | | | | | | |
| Aerospace/Defense — 0.4% | |
| Boeing Co. (The), 4.88%, 05/01/25 | | | 5,000 | | | | 4,990 | |
| Boeing Co. (The), 2.20%, 02/04/26 | | | 10,000 | | | | 9,023 | |
| Total Aerospace/Defense | | | | | | | 14,013 | |
| | | | | | | | | |
| Agriculture — 0.2% | |
| Altria Group, Inc., 4.80%, 02/14/29 | | | 7,000 | | | | 6,673 | |
| | | | | | | | | |
| Auto Manufacturers — 0.7% | |
| American Honda Finance Corp., 2.00%, 03/24/28 | | | 16,000 | | | | 14,215 | |
| General Motors Financial Co., Inc., 4.30%, 04/06/29(a) | | | 9,000 | | | | 8,284 | |
| Total Auto Manufacturers | | | | | | | 22,499 | |
See accompanying Notes to Financial Statements.
ADVISORSHARES NORTH SQUARE MCKEE ESG CORE BOND ETF
Schedule of Investments (continued)
June 30, 2022
| Investments | | Principal | | | Value | |
| CORPORATE BONDS (continued) | |
| | | | | | | | | |
| Banks — 8.3% | |
| Bank of America Corp., Series N, 1.66%, (SOFR + 0.91%), 03/11/27@ | | $ | 47,000 | | | $ | 42,250 | |
| Citigroup, Inc., 4.66%, (SOFR + 1.89%), 05/24/28@ | | | 9,000 | | | | 8,963 | |
| Goldman Sachs Group, Inc. (The), 1.43%, (SOFR + 0.80%), 03/09/27@ | | | 57,000 | | | | 50,680 | |
| Goldman Sachs Group, Inc. (The), 1.99%, (SOFR + 1.09%), 01/27/32@ | | | 33,000 | | | | 26,171 | |
| JPMorgan Chase & Co., 0.97%, (TSFR3M + 0.58%), 06/23/25@ | | | 9,000 | | | | 8,424 | |
| JPMorgan Chase & Co., 2.01%, (TSFR3M + 1.59%), 03/13/26@ | | | 44,000 | | | | 41,292 | |
| JPMorgan Chase & Co., 1.58%, (SOFR + 0.89%), 04/22/27@ | | | 15,000 | | | | 13,389 | |
| JPMorgan Chase & Co., 1.95%, (SOFR + 1.07%), 02/04/32@ | | | 7,000 | | | | 5,616 | |
| Morgan Stanley, 0.79%, (SOFR + 0.53%), 05/30/25@ | | | 8,000 | | | | 7,471 | |
| Morgan Stanley, 1.59%, (SOFR + 0.88%), 05/04/27@ | | | 20,000 | | | | 17,809 | |
| PNC Financial Services Group, Inc. (The), 1.15%, 08/13/26 | | | 5,000 | | | | 4,481 | |
| PNC Financial Services Group, Inc. (The), 2.55%, 01/22/30 | | | 33,000 | | | | 28,799 | |
| Wells Fargo & Co., 3.53%, (SOFR + 1.51%), 03/24/28@ | | | 21,000 | | | | 19,938 | |
| Total Banks | | | | | | | 275,283 | |
| | | | | | | | | |
| Beverages — 0.3% | |
| Coca-Cola Co. (The), 1.65%, 06/01/30 | | | 10,000 | | | | 8,510 | |
| | | | | | | | | |
| Biotechnology — 0.3% | |
| Amgen, Inc., 3.00%, 02/22/29 | | | 10,000 | | | | 9,250 | |
| | | | | | | | | |
| Chemicals — 0.1% | |
| DuPont de Nemours, Inc., 4.49%, 11/15/25 | | | 5,000 | | | | 5,046 | |
| | | | | | | | | |
| Computers — 2.9% | |
| Apple, Inc., 2.05%, 09/11/26 | | | 13,000 | | | | 12,266 | |
| Apple, Inc., 1.20%, 02/08/28 | | | 19,000 | | | | 16,673 | |
| Apple, Inc., 4.65%, 02/23/46 | | | 49,000 | | | | 50,825 | |
| International Business Machines Corp., 5.88%, 11/29/32 | | | 17,000 | | | | 18,623 | |
| Total Computers | | | | | | | 98,387 | |
| Investments | | Principal | | | Value | |
| CORPORATE BONDS (continued) | |
| | | | | | | | | |
| Diversified Financial Services — 1.0% | |
| Capital One Financial Corp., 1.34%, (SOFR + 0.69%), 12/06/24@ | | $ | 16,000 | | | $ | 15,353 | |
| Capital One Financial Corp., 1.88%, (SOFR + 0.86%), 11/02/27@ | | | 21,000 | | | | 18,461 | |
| Total Diversified Financial Services | | | | | | | 33,814 | |
| | | | | | | | | |
| Electric — 2.5% | |
| Alabama Power Co., 3.45%, 10/01/49 | | | 12,000 | | | | 9,605 | |
| Consolidated Edison Co. of New York, Inc., Series 20A, 3.35%, 04/01/30 | | | 9,000 | | | | 8,414 | |
| Consolidated Edison Co. of New York, Inc., 3.95%, 03/01/43 | | | 10,000 | | | | 8,644 | |
| Consolidated Edison Co. of New York, Inc., Series E, 4.65%, 12/01/48 | | | 10,000 | | | | 9,516 | |
| Duke Energy Carolinas LLC, 5.30%, 02/15/40 | | | 26,000 | | | | 27,164 | |
| Duke Energy Corp., 2.45%, 06/01/30 | | | 8,000 | | | | 6,768 | |
| Entergy Corp., 1.90%, 06/15/28 | | | 8,000 | | | | 6,884 | |
| Pacific Gas And Electric Co., 1.37%, 03/10/23 | | | 5,000 | | | | 4,925 | |
| Total Electric | | | | | | | 81,920 | |
| | | | | | | | | |
| Environmental Control — 0.2% | |
| Waste Connections, Inc., 4.25%, 12/01/28 | | | 8,000 | | | | 7,915 | |
| | | | | | | | | |
| Healthcare – Services — 0.6% | |
| UnitedHealth Group, Inc., 2.00%, 05/15/30 | | | 24,000 | | | | 20,639 | |
| | | | | | | | | |
| Internet — 0.3% | |
| Amazon.Com, Inc., 3.88%, 08/22/37 | | | 10,000 | | | | 9,536 | |
| | | | | | | | | |
| Media — 1.0% | |
| Walt Disney Co. (The), 3.50%, 05/13/40 | | | 37,000 | | | | 31,749 | |
| | | | | | | | | |
| Oil & Gas — 1.0% | |
| BP Capital Markets America, Inc., 2.72%, 01/12/32 | | | 22,000 | | | | 19,016 | |
| Exxon Mobil Corp., 4.23%, 03/19/40 | | | 16,000 | | | | 15,221 | |
| Total Oil & Gas | | | | | | | 34,237 | |
See accompanying Notes to Financial Statements.
ADVISORSHARES NORTH SQUARE MCKEE ESG CORE BOND ETF
Schedule of Investments (continued)
June 30, 2022
| Investments | | Principal | | | Value | |
| CORPORATE BONDS (continued) | |
| | | | | | | | | |
| Pharmaceuticals — 1.3% | |
| CVS Health Corp., 4.78%, 03/25/38 | | $ | 47,000 | | | $ | 44,706 | |
| | | | | | | | | |
| Retail — 1.8% | |
| Home Depot, Inc. (The), 2.95%, 06/15/29 | | | 21,000 | | | | 19,658 | |
| Lowe’s Cos., Inc., 3.10%, 05/03/27 | | | 4,000 | | | | 3,818 | |
| Starbucks Corp., 3.55%, 08/15/29 | | | 17,000 | | | | 16,013 | |
| Starbucks Corp., 3.00%, 02/14/32(a) | | | 14,000 | | | | 12,205 | |
| Walmart, Inc., 2.50%, 09/22/41 | | | 10,000 | | | | 7,833 | |
| Total Retail | | | | | | | 59,527 | |
| | | | | | | | | |
| Semiconductors — 0.5% | |
| Intel Corp., 3.73%, 12/08/47 | | | 20,000 | | | | 17,106 | |
| | | | | | | | | |
| Software — 1.4% | |
| Oracle Corp., 3.25%, 11/15/27 | | | 14,000 | | | | 12,946 | |
| Oracle Corp., 3.60%, 04/01/40 | | | 45,000 | | | | 33,750 | |
| Total Software | | | | | | | 46,696 | |
| | | | | | | | | |
| Telecommunications — 1.5% | |
| AT&T, Inc., 1.70%, 03/25/26 | | | 11,000 | | | | 10,081 | |
| AT&T, Inc., 4.35%, 03/01/29 | | | 12,000 | | | | 11,847 | |
| Verizon Communications, Inc., 2.10%, 03/22/28 | | | 11,000 | | | | 9,800 | |
| Verizon Communications, Inc., 2.65%, 11/20/40 | | | 15,000 | | | | 11,116 | |
| Verizon Communications, Inc., 3.40%, 03/22/41 | | | 7,000 | | | | 5,721 | |
| Total Telecommunications | | | | | | | 48,565 | |
| | | | | | | | | |
| Transportation — 1.4% | |
| CSX Corp., 3.80%, 03/01/28 | | | 10,000 | | | | 9,781 | |
| FedEx Corp. 2020-1 Class AA Pass-Through Trust, 1.88%, 02/20/34 | | | 18,396 | | | | 16,050 | |
| Union Pacific Corp., 3.95%, 09/10/28 | | | 21,000 | | | | 20,808 | |
| Total Transportation | | | | | | | 46,639 | |
Total Corporate Bonds
(Cost $1,052,246) | | | | | | | 922,710 | |
| | | | | | | | | |
| U.S. GOVERNMENT AGENCY SECURITIES — 24.5% | |
| Federal Home Loan Mortgage Corp., 2.00%, 11/01/51 | | | 62,193 | | | | 54,366 | |
| Federal Home Loan Mortgage Corp., 3.50%, 10/01/34 | | | 12,846 | | | | 12,882 | |
| Investments | | Principal | | | Value | |
| U.S. GOVERNMENT AGENCY SECURITIES (continued) | |
| Federal Home Loan Mortgage Corp., 3.50%, 07/01/47 | | $ | 23,541 | | | $ | 23,061 | |
| Federal Home Loan Mortgage Corp., 4.00%, 06/01/33 | | | 50,696 | | | | 51,576 | |
| Federal Home Loan Mortgage Corp., Class BA, Series 2022-5199, 3.00%, 06/25/48 | | | 39,009 | | | | 37,669 | |
| Federal Home Loan Mortgage Corp., Class GA, Series 2020-4994, 2.00%, 03/25/44 | | | 20,407 | | | | 19,561 | |
| Federal Home Loan Mortgage Corp., Class GH, Series 2020-5019, 2.00%, 06/25/42 | | | 6,986 | | | | 6,633 | |
| Federal Home Loan Mortgage Corp., Class HA, Series 2011-3816, 3.50%, 11/15/25 | | | 47,763 | | | | 48,020 | |
| Federal Home Loan Mortgage Corporation, 3.00%, 05/01/42 | | | 24,776 | | | | 23,420 | |
| Federal National Mortgage Association, 2.50%, 02/01/41 | | | 25,608 | | | | 23,230 | |
| Federal National Mortgage Association, 2.50%, 04/01/48 | | | 19,149 | | | | 17,422 | |
| Federal National Mortgage Association, 2.50%, 05/01/50 | | | 73,543 | | | | 65,429 | |
| Federal National Mortgage Association, 2.50%, 10/01/51 | | | 28,976 | | | | 26,258 | |
| Federal National Mortgage Association, 3.00%, 01/01/40 | | | 17,682 | | | | 16,875 | |
| Federal National Mortgage Association, 3.00%, 11/01/46 | | | 24,941 | | | | 23,831 | |
| Federal National Mortgage Association, 3.00%, 11/01/46 | | | 41,948 | | | | 39,776 | |
| Federal National Mortgage Association, 3.00%, 02/01/47 | | | 23,072 | | | | 22,048 | |
| Federal National Mortgage Association, 3.00%, 02/01/49 | | | 25,286 | | | | 23,887 | |
| Federal National Mortgage Association, 3.00%, 02/01/50 | | | 22,705 | | | | 21,468 | |
| Federal National Mortgage Association, 3.00%, 10/01/51 | | | 56,459 | | | | 52,798 | |
| Federal National Mortgage Association, 3.00%, 02/01/52 | | | 24,284 | | | | 22,721 | |
See accompanying Notes to Financial Statements.
ADVISORSHARES NORTH SQUARE MCKEE ESG CORE BOND ETF
Schedule of Investments (continued)
June 30, 2022
| Investments | | Principal | | | Value | |
| U.S. GOVERNMENT AGENCY SECURITIES (continued) | |
| Federal National Mortgage Association, 3.00%, 02/01/52 | | $ | 23,370 | | | $ | 21,856 | |
| Federal National Mortgage Association, 3.50%, 09/01/32 | | | 11,696 | | | | 11,717 | |
| Federal National Mortgage Association, 3.50%, 02/01/33 | | | 24,566 | | | | 24,636 | |
| Federal National Mortgage Association, 3.50%, 02/01/35 | | | 47,904 | | | | 47,728 | |
| Federal National Mortgage Association, 3.50%, 03/01/48 | | | 12,305 | | | | 12,048 | |
| Federal National Mortgage Association, 3.50%, 06/01/49 | | | 25,783 | | | | 25,161 | |
| Federal National Mortgage Association, Class LA, Series 2019-39, 3.00%, 02/25/49 | | | 2,856 | | | | 2,769 | |
| Government National Mortgage Association, 3.00%, 10/20/51 | | | 32,408 | | | | 30,669 | |
| Government National Mortgage Association, Class ME, Series 2013-28, 1.75%, 11/20/42 | | | 8,325 | | | | 7,945 | |
Total U.S. Government Agency Securities
(Cost $889,475) | | | | | | | 817,460 | |
| | | | | | | | | |
| ASSET BACKED SECURITIES — 6.8% | |
| | | | | | | | | |
| Auto Manufacturers — 2.3% | |
| AmeriCredit Automobile Receivables Trust, Class A3, Series 2021-3, 0.76%, 08/18/26 | | | 30,000 | | | | 28,808 | |
| Exeter Automobile Receivables Trust, Class B, Series 2021-3A, 0.69%, 01/15/26 | | | 50,000 | | | | 48,921 | |
| Total Auto Manufacturers | | | | | | | 77,729 | |
| | | | | | | | | |
| Diversified Financial Services — 4.5% | |
| Carvana Auto Receivables Trust 2022-P2, Class A2, Series 2022-P2, 3.33%, 07/10/25 | | | 15,000 | | | | 14,916 | |
| CIG Auto Receivables Trust, Class A, Series 2021-1A, 0.69%, 04/14/25‡ | | | 16,383 | | | | 16,046 | |
| Drive Auto Receivables Trust, Class A3, Series 2021-3, 0.79%, 10/15/25 | | | 44,000 | | | | 43,049 | |
| Investments | | Principal | | | Value | |
| ASSET BACKED SECURITIES (continued) | |
| | | | | | | | | |
| Diversified Financial Services (continued) | |
| Santander Retail Auto Lease Trust 2022-B, Class A2, Series 2022-B, 2.84%, 05/20/25‡ | | $ | 10,000 | | | $ | 9,940 | |
| Verizon Owner Trust, Class B, Series 2020-C, 0.67%, 04/21/25 | | | 50,000 | | | | 47,688 | |
| Volvo Financial Equipment LLC Series, Class A3, Series 2019-2A, 2.04%, 11/15/23‡ | | | 9,475 | | | | 9,466 | |
| Westlake Automobile Receivables Trust, Class A3, Series 2021-3A, 0.95%, 06/16/25‡ | | | 10,000 | | | | 9,697 | |
| Total Diversified Financial Services | | | | | | | 150,802 | |
Total Asset Backed Securities
(Cost $234,287) | | | | | | | 228,531 | |
| | | | | | | | | |
| FOREIGN BONDS — 5.2% | |
| | | | | | | | | |
| Agriculture — 0.4% | |
| BAT Capital Corp., 3.56%, 08/15/27 (United Kingdom) | | | 8,000 | | | | 7,336 | |
| BAT Capital Corp., 4.91%, 04/02/30 (United Kingdom) | | | 7,000 | | | | 6,523 | |
| Total Agriculture | | | | | | | 13,859 | |
| | | | | | | | | |
| Banks — 2.0% | |
| Bank of Montreal, 1.85%, 05/01/25 (Canada) | | | 15,000 | | | | 14,252 | |
| Bank of Nova Scotia (The), 1.30%, 06/11/25 (Canada) | | | 11,000 | | | | 10,204 | |
| Canadian Imperial Bank of Commerce, 2.25%, 01/28/25 (Canada) | | | 8,000 | | | | 7,682 | |
| Canadian Imperial Bank of Commerce, 3.60%, 04/07/32 (Canada) | | | 7,000 | | | | 6,380 | |
| Royal Bank of Canada, Series G, 2.30%, 11/03/31 (Canada) | | | 11,000 | | | | 9,207 | |
| Toronto-Dominion Bank (The), 1.25%, 09/10/26 (Canada) | | | 13,000 | | | | 11,538 | |
| Westpac Banking Corp., 1.95%, 11/20/28 (Australia) | | | 9,000 | | | | 7,877 | |
| Total Banks | | | | | | | 67,140 | |
| | | | | | | | | |
| Beverages — 0.3% | |
| Anheuser-Busch Cos. LLC / Anheuser-Busch InBev Worldwide, Inc., 4.90%, 02/01/46 (Belgium) | | | 10,000 | | | | 9,471 | |
See accompanying Notes to Financial Statements.
ADVISORSHARES NORTH SQUARE MCKEE ESG CORE BOND ETF
Schedule of Investments (continued)
June 30, 2022
| Investments | |
Principal | | | Value | |
| FOREIGN BONDS (continued) | |
| | | | | | | | | |
| Beverages (continued) | |
| Anheuser-Busch InBev Worldwide, Inc., 4.75%, 01/23/29 (Belgium) | | $ | 1,000 | | | $ | 1,020 | |
| Total Beverages | | | | | | | 10,491 | |
| | | | | | | | | |
| Multi-National — 1.3% | |
| International Bank For Reconstruction & Development, 2.70%, 12/28/37 (Supranational) | | | 49,000 | | | | 42,987 | |
| | | | | | | | | |
| Oil & Gas — 0.6% | |
| Shell International Finance BV, 2.38%, 11/07/29 (Netherlands) | | | 20,000 | | | | 17,717 | |
| | | | | | | | | |
| Pipelines — 0.6% | |
| TransCanada Pipelines Ltd., 4.10%, 04/15/30 (Canada) | | | 21,000 | | | | 20,126 | |
Total Foreign Bonds
(Cost $195,790) | | | | | | | 172,320 | |
| | | | | | | | | |
| CERTIFICATE OF DEPOSITS — 2.6% | |
| Capital One Bank USA NA, 3.10%, 06/02/25 | | | 20,000 | | | | 19,846 | |
| Capital One NA, 3.10%, 06/02/25 | | | 34,000 | | | | 33,739 | |
| Discover Bank, 3.10%, 06/02/25 | | | 34,000 | | | | 33,738 | |
Total Certificate of Deposits
(Cost $87,836) | | | | | | | 87,323 | |
| | | | | | | | | |
| U.S. TREASURY BONDS — 2.2% | |
| U.S. Treasury Bond, 2.00%, 11/15/41 | | | 88,000 | | | | 70,324 | |
| U.S. Treasury Bond, 2.25%, 02/15/52(a) | | | 3,000 | | | | 2,491 | |
Total U.S. Treasury Bonds
(Cost $90,177) | | | | | | | 72,815 | |
| | | | | | | | | |
| U.S. TREASURY NOTES — 0.6% | |
| U.S. Treasury Note, 1.88%, 02/15/32 | | | 18,000 | | | | 16,355 | |
| U.S. Treasury Note, 2.88%, 05/15/32(a) | | | 4,000 | | | | 3,967 | |
Total U.S. Treasury Notes
(Cost $21,263) | | | | | | | 20,322 | |
| Investments | | Principal/
Shares | | | Value | |
| MORTGAGE BACKED SECURITIES — 0.6% | |
| | | | | | | | | |
| Diversified Financial Services — 0.6% | |
| Citigroup Commercial Mortgage Trust, Class A1, Series 2018-C6, 3.30%, 11/10/51 | | $ | 6,739 | | | $ | 6,707 | |
| Connecticut Avenue Securities Trust, Class 1M1, Series 2022-R01, 1.93%, (SOFR + 1.00%), 12/25/41@‡ | | | 13,426 | | | | 13,146 | |
Total Mortgage Backed Securities
(Cost $20,298) | | | | | | | 19,853 | |
| | | | | | | | | |
| MONEY MARKET FUND — 1.0% | |
BlackRock Liquidity Funds FedFund Portfolio, Institutional Class, 1.03%(b)
(Cost $32,907) | | | 32,907 | | | | 32,907 | |
| | | | | | | | | |
Total Investments — 99.9%
(Cost $3,651,135) | | | | | | | 3,330,698 | |
| Other Assets in Excess of Liabilities — 0.1% | | | | | | | 2,399 | |
| Net Assets — 100.0% | | | | | | $ | 3,333,097 | |
SOFR — Secured Overnight Financing Rate
| @ | Variable rate instrument. The interest rate shown reflects the rate in effect at June 30, 2022. |
| ‡ | Security was purchased pursuant to Rule 144A under the Securities Act of 1933 and may not be resold subject to that rule except to qualified institutional buyers. Unless otherwise noted, 144A securities are deemed to be liquid. |
| (a) | All or a portion of security is on loan. The aggregate market value of the securities on loan is $25,416; the aggregate market value of the collateral held by the fund is $26,075. The aggregate market value of the collateral includes non-cash U.S. Treasury securities collateral having a value of $26,075. |
| (b) | Rate shown reflects the 7-day yield as of June 30, 2022. |
See accompanying Notes to Financial Statements.
ADVISORSHARES NORTH SQUARE MCKEE ESG CORE BOND ETF
Schedule of Investments (continued)
June 30, 2022
Fair Value Measurements
The following is a summary of the inputs used, as of June 30, 2022, in valuing the Fund’s assets and liabilities carried at fair value. These inputs are summarized in three broad levels. Level 1 includes quoted prices in active markets for identical securities. Level 2 includes other significant observable inputs (including quoted prices for similar securities, interest rates, prepayment speeds and credit risk). Level 3 includes significant unobservable inputs (including the Fund’s own assumptions in determining the fair value of investments). The level assigned to the securities valuations may not be an indication of the risk or liquidity associated with investing in those securities.
| Assets | | Level 1 | | | Level 2 | | | Level 3 | | | Total | |
| U.S. Government Bonds and Notes | | $ | — | | | $ | 956,457 | | | $ | — | | | $ | 956,457 | |
| Corporate Bonds | | | — | | | | 922,710 | | | | — | | | | 922,710 | |
| U.S. Government Agency Securities | | | — | | | | 817,460 | | | | — | | | | 817,460 | |
| Asset Backed Securities | | | — | | | | 228,531 | | | | — | | | | 228,531 | |
| Foreign Bonds | | | — | | | | 172,320 | | | | — | | | | 172,320 | |
| Certificate of Deposits | | | — | | | | 87,323 | | | | — | | | | 87,323 | |
| U.S. Treasury Bonds | | | — | | | | 72,815 | | | | — | | | | 72,815 | |
| U.S. Treasury Notes | | | — | | | | 20,322 | | | | — | | | | 20,322 | |
| Mortgage Backed Securities | | | — | | | | 19,853 | | | | — | | | | 19,853 | |
| Money Market Fund | | | 32,907 | | | | — | | | | — | | | | 32,907 | |
| Total | | $ | 32,907 | | | $ | 3,297,791 | | | $ | — | | | $ | 3,330,698 | |
SUMMARY OF SCHEDULE OF INVESTMENTS
| | | % of
Net Assets | |
| Aerospace/Defense | | | 0.4 | % |
| Agriculture | | | 0.6 | |
| Auto Manufacturers | | | 3.0 | |
| Banks | | | 10.3 | |
| Beverages | | | 0.6 | |
| Biotechnology | | | 0.3 | |
| Certificate Of Deposits | | | 2.6 | |
| Chemicals | | | 0.1 | |
| Computers | | | 2.9 | |
| Diversified Financial Services | | | 30.6 | |
| Electric | | | 2.5 | |
| Environmental Control | | | 0.2 | |
| Healthcare – Services | | | 0.6 | |
| Internet | | | 0.3 | |
| Media | | | 1.0 | |
SUMMARY OF SCHEDULE OF INVESTMENTS
(continued)
| | | % of
Net Assets |
| Multi-National | | | 1.3 | % |
| Oil & Gas | | | 1.6 | |
| Pharmaceuticals | | | 1.3 | |
| Pipelines | | | 0.6 | |
| Retail | | | 1.8 | |
| Semiconductors | | | 0.5 | |
| Software | | | 1.4 | |
| Telecommunications | | | 1.5 | |
| Transportation | | | 1.4 | |
| U.S. Government Bonds and Notes | | | 28.7 | |
| U.S. Treasury Bonds | | | 2.2 | |
| U.S. Treasury Notes | | | 0.6 | |
| Money Market Fund | | | 1.0 | |
| Total Investments | | | 99.9 | |
| Other Assets in Excess of Liabilities | | | 0.1 | |
| Net Assets | | | 100.0 | % |
ADVISORSHARES POSEIDON DYNAMIC CANNABIS ETF
Schedule of Investments
June 30, 2022
| Investments | | Shares/
Principal | | | Value | |
| COMMON STOCKS — 10.2% | |
| | | | | | | | | |
| Agriculture — 2.3% | |
| Village Farms International, Inc. (Canada)* | | | 37,651 | | | $ | 98,269 | |
| | | | | | | | | |
| Pharmaceuticals — 5.9% | |
| Intercure Ltd. (Israel)* | | | 21,821 | | | | 126,344 | |
| Sundial Growers, Inc. (Canada)* | | | 401,607 | | | | 130,964 | |
| Total Pharmaceuticals | | | | | | | 257,308 | |
| | | | | | | | | |
| Software — 2.0% | |
| WM Technology, Inc.*(a) | | | 27,057 | | | | 89,017 | |
Total Common Stocks
(Cost $580,726) | | | | | | | 444,594 | |
| | | | | | | | | |
| MONEY MARKET FUND — 143.4% | |
BlackRock Liquidity Funds Treasury Trust Fund Portfolio, Institutional Class, 1.03%(b)**
(Cost $6,247,534) | | | 6,247,534 | | | | 6,247,534 | |
| | | | | | | | | |
| REPURCHASE AGREEMENTS — 0.9%(c) | |
| Credit Suisse AG, dated 06/30/22, due 07/01/22, 1.49%, total to be received $7,000, (collateralized by various U.S. Government Agency Obligations, 0.13%-0.25%, 3/15/24-7/15/31, totaling $7,140) | | $ | 7,000 | | | | 7,000 | |
| Daiwa Capital Markets America, dated 06/30/22, due 07/01/22, 1.49%, total to be received $7,000, (collateralized by various U.S. Government Agency Obligations, 0.00%-7.63%, 7/26/22-2/15/50, totaling $7,140) | | | 7,000 | | | | 7,000 | |
| Deutsche Bank Securities, Inc., dated 06/30/22, due 07/01/22, 1.49%, total to be received $7,000, (collateralized by various U.S. Government Agency Obligations, 0.00%-0.75%, 1/15/25-8/15/39, totaling $7,140) | | | 7,000 | | | | 7,000 | |
| HSBC Securities USA, Inc., dated 06/30/22, due 07/01/22, 1.49%, total to be received $7,000, (collateralized by various U.S. Government Agency Obligations, 0.00%-6.50%, 11/15/23-8/15/51, totaling $7,140) | | | 7,000 | | | | 7,000 | |
| Investments | | Shares/
Principal | | | Value | |
| REPURCHASE AGREEMENTS (continued) | |
| JP Morgan Securities LLC, dated 06/30/22, due 07/01/22, 1.49%, total to be received $7,000, (collateralized by various U.S. Government Agency Obligations, 2.88%-3.38%, 5/15/44-5/15/49, totaling $7,140) | | $ | 7,000 | | | $ | 7,000 | |
| Mizuho Securities USA, Inc., dated 06/30/22, due 07/01/22, 1.50%, total to be received $3,852, (collateralized by various U.S. Government Agency Obligations, 2.88%, 5/15/28, totaling $3,929) | | | 3,852 | | | | 3,852 | |
Total Repurchase Agreements
(Cost $38,852) | | | | | | | 38,852 | |
| | | | | | | | | |
Total Investments — 154.5%
(Cost $6,867,112) | | | | | | | 6,730,980 | |
| Liabilities in Excess of Other Assets — (54.5%) | | | | | | | (2,374,205 | ) |
| Net Assets — 100.0% | | | | | | $ | 4,356,775 | |
SOFR — Secured Overnight Financing Rate
| * | Non-income producing security. |
| ** | Amount includes $5,428,346 of segregated collateral for swaps. |
| (a) | All or a portion of security is on loan. The aggregate market value of the securities on loan is $51,854; the aggregate market value of the collateral held by the fund is $50,852, which includes $12,000 of uninvested cash collateral. |
| (b) | Rate shown reflects the 7-day yield as of June 30, 2022. |
| (c) | Collateral received from brokers for securities lending was invested in these short-term investments. |
See accompanying Notes to Financial Statements.
ADVISORSHARES POSEIDON DYNAMIC CANNABIS ETF
Schedule of Investments (continued)
June 30, 2022
Fair Value Measurements
The following is a summary of the inputs used, as of June 30, 2022, in valuing the Fund’s assets and liabilities carried at fair value. These inputs are summarized in three broad levels. Level 1 includes quoted prices in active markets for identical securities. Level 2 includes other significant observable inputs (including quoted prices for similar securities, interest rates, prepayment speeds and credit risk). Level 3 includes significant unobservable inputs (including the Fund’s own assumptions in determining the fair value of investments). The level assigned to the securities valuations may not be an indication of the risk or liquidity associated with investing in those securities.
| Assets | | Level 1 | | | Level 2 | | | Level 3 | | | Total | |
| Common Stocks | | $ | 444,594 | | | $ | — | | | $ | — | | | $ | 444,594 | |
| Money Market Fund | | | 6,247,534 | | | | — | | | | — | | | | 6,247,534 | |
| Repurchase Agreements | | | — | | | | 38,852 | | | | — | | | | 38,852 | |
| Total | | $ | 6,692,128 | | | $ | 38,852 | | | $ | — | | | $ | 6,730,980 | |
| Liabilities | | Level 1 | | | Level 2 | | | Level 3 | | | Total | |
| Swaps† | | $ | — | | | $ | (11,562 | ) | | $ | — | | | $ | (11,562 | ) |
| † | Derivative instruments, including swap contracts, are valued at the net unrealized gain (loss) on the instrument. |
SUMMARY OF SCHEDULE OF INVESTMENTS
| | | % of
Net Assets | |
| Agriculture | | | 2.3 | % |
| Pharmaceuticals | | | 5.9 | |
| Software | | | 2.0 | |
| Money Market Fund | | | 143.4 | |
| Repurchase Agreements | | | 0.9 | |
| Total Investments | | | 154.5 | |
| Liabilities in Excess of Other Assets | | | (54.5 | ) |
| Net Assets | | | 100.0 | % |
See accompanying Notes to Financial Statements.
ADVISORSHARES POSEIDON DYNAMIC CANNABIS ETF
Schedule of Investments (continued)
June 30, 2022
Total Return Swap contracts outstanding as of June 30, 2022:
| Reference Entity | | Annual Financing Rate Paid | | Payment Frequency | | Termination Date | | Notional Amounts | | | Fair
Value | | | Unrealized Appreciation/ (Depreciation) | |
| Ascend Well | | SOFR + 1.00% | | Monthly | | 11/20/2023 | | $ | 644,536 | | | $ | 642,687 | | | $ | (1,849 | ) |
| AYR Wellness | | SOFR + 1.00% | | Monthly | | 11/20/2023 | | | 144,851 | | | | 144,534 | | | | (317 | ) |
| Columbia Care | | SOFR + 1.00% | | Monthly | | 11/20/2023 | | | 167,340 | | | | 166,703 | | | | (637 | ) |
| Cresco Labs | | SOFR + 1.00% | | Monthly | | 11/20/2023 | | | 141,427 | | | | 140,845 | | | | (582 | ) |
| Curaleaf Holdings SUB VOT | | SOFR + 1.00% | | Monthly | | 11/20/2023 | | | 865,360 | | | | 863,424 | | | | (1,936 | ) |
| Green Thumb Industries SUB VOT | | SOFR + 1.00% | | Monthly | | 11/20/2023 | | | 794,393 | | | | 792,344 | | | | (2,049 | ) |
| Terrascend | | SOFR + 1.00% | | Monthly | | 11/20/2023 | | | 129,731 | | | | 129,123 | | | | (608 | ) |
| Trulieve Cannabis | | SOFR + 1.00% | | Monthly | | 11/20/2023 | | | 844,931 | | | | 842,969 | | | | (1,962 | ) |
| Verano Holdings | | SOFR + 1.00% | | Monthly | | 11/20/2023 | | | 608,303 | | | | 606,681 | | | | (1,622 | ) |
| Net Unrealized Depreciation | | | | | | | | | | | | | | | | $ | (11,562 | ) |
Cowen acts as the counterparty to the total return swap contracts listed above. The Fund either receives fees from, or pays fees to, the counterparty, depending upon the total return of the benchmark, and the agreed-upon floating financing rate.
See accompanying Notes to Financial Statements.
ADVISORSHARES PSYCHEDELICS ETF
Schedule of Investments
June 30, 2022
| Investments | | Shares/
Principal | | | Value | |
| COMMON STOCKS — 80.7% | |
| | | | | | | | | |
| Biotechnology — 53.3% | |
| ATAI Life Sciences NV (Germany)* | | | 138,703 | | | $ | 504,879 | |
| Bright Minds Biosciences, Inc. (Canada)* | | | 289,576 | | | | 237,221 | |
| Cybin, Inc. (Canada)*(a) | | | 1,047,730 | | | | 586,729 | |
| Enveric Biosciences, Inc.* | | | 1,252,390 | | | | 268,387 | |
| GH Research PLC (Ireland)* | | | 24,835 | | | | 247,853 | |
| Mind Medicine MindMed, Inc.*(a) | | | 750,151 | | | | 480,172 | |
| PsyBio Therapeutics Corp.* | | | 2,583,122 | | | | 198,254 | |
| Seelos Therapeutics, Inc.* | | | 364,597 | | | | 248,035 | |
| Small Pharma, Inc. (Canada)* | | | 2,000,937 | | | | 165,918 | |
| Total Biotechnology | | | | | | | 2,937,448 | |
| | | | | | | | | |
| Healthcare — Services — 11.1% | |
| Field Trip Health Ltd. (Canada)* | | | 315,236 | | | | 264,830 | |
| Greenbrook TMS, Inc. (Canada)* | | | 128,256 | | | | 182,124 | |
| Numinus Wellness, Inc. (Canada)* | | | 895,346 | | | | 165,997 | |
| Total Healthcare — Services | | | | | | | 612,951 | |
| | | | | | | | | |
| Pharmaceuticals — 16.3% | |
| Compass Pathways PLC (United Kingdom)*(b) | | | 60,348 | | | | 652,965 | |
| FSD Pharma, Inc., Class B (Canada)* | | | 306,807 | | | | 242,378 | |
| Total Pharmaceuticals | | | | | | | 895,343 | |
Total Common Stocks
(Cost $10,966,652) | | | | | | | 4,445,742 | |
| | | | | | | | | |
| MONEY MARKET FUND — 14.4% | |
BlackRock Liquidity Funds Treasury Trust Fund Portfolio, Institutional Class, 1.03%(c)
(Cost $791,742) | | | 791,742 | | | | 791,742 | |
| | | | | | | | | |
| REPURCHASE AGREEMENTS — 17.3%(d) | |
| BofA Securities, Inc., dated 06/30/22, due 07/01/22, 1.55%, total to be received $249,011, (collateralized by various U.S. Government Agency Obligations, 1.00%-8.50%, 1/20/24-6/20/52, totaling $253,980) | | $ | 249,000 | | | | 249,000 | |
| Investments | | Shares/ Principal | | | Value | |
| REPURCHASE AGREEMENTS (continued) | |
| Daiwa Capital Markets America, dated 06/30/22, due 07/01/22, 1.55%, total to be received $249,011, (collateralized by various U.S. Government Agency Obligations, 0.00%-6.50%, 7/31/22-7/1/52, totaling $253,980) | | $ | 249,000 | | | $ | 249,000 | |
| Nomura Securities International, Inc., dated 06/30/22, due 07/01/22, 1.54%, total to be received $207,438, (collateralized by various U.S. Government Agency Obligations, 1.50%-6.50%, 7/1/27-6/1/52, totaling $211,578) | | | 207,429 | | | | 207,429 | |
| RBC Dominion Securities, Inc., dated 06/30/22, due 07/01/22, 1.55%, total to be received $249,011, (collateralized by various U.S. Government Agency Obligations, 0.00%-6.88%, 8/16/22-5/20/52, totaling $253,980) | | | 249,000 | | | | 249,000 | |
Total Repurchase Agreements
(Cost $954,429) | | | | | | | 954,429 | |
| | | | | | | | | |
Total Investments — 112.4%
(Cost $12,712,823) | | | | | | | 6,191,913 | |
| Liabilities in Excess of Other Assets — (12.4%) | | | | | | | (683,209 | ) |
| Net Assets — 100.0% | | | | | | $ | 5,508,704 | |
PLC — Public Limited Company
| * | Non-income producing security. |
| (a) | All or a portion of security is on loan. The aggregate market value of the securities on loan is $587,365; the aggregate market value of the collateral held by the fund is $954,429. |
| (b) | American Depositary Receipt. |
| (c) | Rate shown reflects the 7-day yield as of June 30, 2022. |
| (d) | Collateral received from brokers for securities lending was invested in these short-term investments. |
See accompanying Notes to Financial Statements.
ADVISORSHARES PSYCHEDELICS ETF
Schedule of Investments (continued)
June 30, 2022
Fair Value Measurements
The following is a summary of the inputs used, as of June 30, 2022, in valuing the Fund’s assets and liabilities carried at fair value. These inputs are summarized in three broad levels. Level 1 includes quoted prices in active markets for identical securities. Level 2 includes other significant observable inputs (including quoted prices for similar securities, interest rates, prepayment speeds and credit risk). Level 3 includes significant unobservable inputs (including the Fund’s own assumptions in determining the fair value of investments). The level assigned to the securities valuations may not be an indication of the risk or liquidity associated with investing in those securities.
| Assets | | Level 1 | | | Level 2 | | | Level 3 | | | Total | |
| Common Stocks | | $ | 4,445,742 | | | $ | — | | | $ | — | | | $ | 4,445,742 | |
| Money Market Fund | | | 791,742 | | | | — | | | | — | | | | 791,742 | |
| Repurchase Agreements | | | — | | | | 954,429 | | | | — | | | | 954,429 | |
| Total | | $ | 5,237,484 | | | $ | 954,429 | | | $ | — | | | $ | 6,191,913 | |
| Liabilities | | Level 1 | | | Level 2 | | | Level 3 | | | Total | |
| Swaps† | | $ | — | | | $ | (493,154 | ) | | $ | — | | | $ | (493,154 | ) |
| † | Derivative instruments, including swap contracts, are valued at the net unrealized gain (loss) on the instrument. |
SUMMARY OF SCHEDULE OF INVESTMENTS
| | | % of
Net Assets | |
| Biotechnology | | | 53.3 | % |
| Healthcare – Services | | | 11.1 | |
| Pharmaceuticals | | | 16.3 | |
| Money Market Fund | | | 14.4 | |
| Repurchase Agreements | | | 17.3 | |
| Total Investments | | | 112.4 | |
| Liabilities in Excess of Other Assets | | | (12.4 | ) |
| Net Assets | | | 100.0 | % |
See accompanying Notes to Financial Statements.
ADVISORSHARES PSYCHEDELICS ETF
Schedule of Investments (continued)
June 30, 2022
Total Return Swap contracts outstanding as of June 30, 2022:
| Reference Entity | | Annual Financing Rate Paid | | | Payment Frequency | | | Termination Date | | | Notional Amounts | | | Fair Value | | | Unrealized Appreciation/ (Depreciation) | |
| Betterlife Pharma | | — | | | — | | | 8/25/2026 | | | $ | 24,937 | | | $ | 8,030 | | | $ | (16,907 | ) |
| Core One Labs | | — | | | — | | | 8/25/2026 | | | | 99,947 | | | | 27,585 | | | | (72,362 | ) |
| Empower Clinics | | — | | | — | | | 8/25/2026 | | | | 30,268 | | | | 6,750 | | | | (23,518 | ) |
| Haven Life Sciences | | — | | | — | | | 8/25/2026 | | | | 19,090 | | | | 4,305 | | | | (14,785 | ) |
| Mindcure Health | | — | | | — | | | 8/25/2026 | | | | 30,395 | | | | 8,010 | | | | (22,385 | ) |
| Mindset Pharma | | — | | | — | | | 8/25/2026 | | | | 76,701 | | | | 37,180 | | | | (39,521 | ) |
| Mydecine Innovations | | — | | | — | | | 8/25/2026 | | | | 93,634 | | | | 4,416 | | | | (89,218 | ) |
| Numinus Wellness | | — | | | — | | | 8/25/2026 | | | | 27,600 | | | | 6,229 | | | | (21,371 | ) |
| Optimi Health | | — | | | — | | | 8/25/2026 | | | | 21,688 | | | | 8,400 | | | | (13,288 | ) |
| Psyched Wellness | | — | | | — | | | 8/25/2026 | | | | 23,201 | | | | 10,456 | | | | (12,745 | ) |
| Red Light Holland | | — | | | — | | | 8/25/2026 | | | | 19,988 | | | | 7,763 | | | | (12,225 | ) |
| Revive Therapeutics | | — | | | — | | | 8/25/2026 | | | | 60,721 | | | | 56,000 | | | | (4,721 | ) |
| Tryp Therapeutics | | — | | | — | | | 8/25/2026 | | | | 39,075 | | | | 13,020 | | | | (26,055 | ) |
| Wesana Health | | — | | | — | | | 8/25/2026 | | | | 134,192 | | | | 10,139 | | | | (124,053 | ) |
| Net Unrealized Depreciation | | | | | | | | | | | | | | | | | | | $ | (493,154 | ) |
Cowen acts as the counterparty to the total return swap contracts listed above. The Fund either receives fees from, or pays fees to, the counterparty, depending upon the total return of the benchmark, and the agreed-upon floating financing rate.
See accompanying Notes to Financial Statements.
ADVISORSHARES PURE CANNABIS ETF
Schedule of Investments
June 30, 2022
| Investments | | Shares/
Principal | | | Value | |
| COMMON STOCKS — 55.1% | |
| | | | | | | | | |
| Agriculture — 17.6% | |
| Village Farms International, Inc. (Canada)*† | | $ | 4,845,831 | | | $ | 12,647,619 | |
| | | | | | | | | |
| Distributors — 1.3% | |
| Greenlane Holdings, Inc., Class A* | | | 865,417 | | | | 169,968 | |
| High Tide, Inc. (Canada)*(a) | | | 394,503 | | | | 781,116 | |
| Total Distributors | | | | | | | 951,084 | |
| | | | | | | | | |
| Interactive Media & Services — 1.2% | |
| Leafly Holdings, Inc.*(a) | | | 193,448 | | | | 870,516 | |
| | | | | | | | | |
| Investment Company — 3.7% | |
| RIV Capital, Inc. (Canada)* | | | 4,985,540 | | | | 2,628,138 | |
| | | | | | | | | |
| Pharmaceuticals — 18.8% | |
| Canopy Growth Corp. (Canada)*(a) | | | 647,046 | | | | 1,844,081 | |
| Cardiol Therapeutics, Inc., Class A (Canada)*(a) | | | 945,222 | | | | 1,238,362 | |
| cbdMD, Inc.* | | | 867,649 | | | | 381,939 | |
| Charlottes Web Holdings, Inc.*(a) | | | 1,210,315 | | | | 544,194 | |
| Clever Leaves Holdings, Inc. (Canada)*(a) | | | 639,558 | | | | 624,145 | |
| Hempfusion Wellness, Inc. (Canada)*(a) | | | 1,785,852 | | | | 100,008 | |
| IM Cannabis Corp. (Canada)* | | | 987,142 | | | | 630,093 | |
| Intercure Ltd. (Israel)*(a) | | | 177,006 | | | | 1,124,873 | |
| Jazz Pharmaceuticals PLC* | | | 20,109 | | | | 3,137,205 | |
| Organigram Holdings, Inc. (Canada)* | | | 406,342 | | | | 372,656 | |
| PharmaCielo Ltd. (Canada)*(a) | | | 359,009 | | | | 121,066 | |
| Tilray Brands, Inc., Class 2 (Canada)*(a) | | | 958,098 | | | | 2,989,266 | |
| Valens Co., Inc. (The) (Canada)*(a) | | | 531,372 | | | | 341,904 | |
| Total Pharmaceuticals | | | | | | | 13,449,792 | |
| | | | | | | | | |
| REITS — 7.8% | |
| Innovative Industrial Properties, Inc. | | | 46,674 | | | | 5,128,072 | |
| Power REIT* | | | 38,155 | | | | 485,713 | |
| Total REITS | | | | | | | 5,613,785 | |
| | | | | | | | | |
| Software — 2.1% | |
| WM Technology, Inc.* | | | 461,424 | | | | 1,518,085 | |
| Investments | | Shares/
Principal | | | Value | |
| COMMON STOCKS (continued) | |
| | | | | | | | | |
| Specialty Retail — 2.6% | |
| Agrify Corp.*(a) | | | 64,826 | | | $ | 127,707 | |
| GrowGeneration Corp.*(a) | | | 486,823 | | | | 1,747,694 | |
| Total Specialty Retail | | | | | | | 1,875,401 | |
Total Common Stocks
(Cost $159,014,384) | | | | | | | 39,554,420 | |
| | | | | | | | | |
| EXCHANGE TRADED FUND — 34.4% | |
| | |
| Equity Fund — 34.4% | |
AdvisorShares Pure US Cannabis ETF*†
(Cost $67,510,803) | | | 2,388,400 | | | | 24,719,940 | |
| | | | | | | | | |
| MONEY MARKET FUNDS — 5.4% | |
BlackRock Liquidity Funds FedFund Portfolio, Institutional Class, Institutional
Class, 1.03%(b)(c) | | | 92,000 | | | | 92,000 | |
| BlackRock Liquidity Funds Treasury Trust Fund Portfolio, Institutional Class, 1.03%(b)** | | | 3,149,271 | | | | 3,149,271 | |
| Goldman Sachs Financial Square Government Fund — Institutional Shares, Institutional Class, 1.37%(b)(c) | | | 165,000 | | | | 165,000 | |
| Invesco Government & Agency Portfolio, Institutional Class, Institutional Class, 1.39%(b)(c) | | | 186,000 | | | | 186,000 | |
| Morgan Stanley Institutional Liquidity Funds — Government Portfolio, Institutional Class, 1.38%(b)(c) | | | 275,000 | | | | 275,000 | |
Total Money Market Funds
(Cost $3,867,271) | | | | | | | 3,867,271 | |
| | | | | | | | | |
| REPURCHASE AGREEMENTS — 11.2%(c) | |
| BofA Securities, Inc., dated 06/30/22, due 07/01/22, 1.55%, total to be received $2,039,074, (collateralized by various U.S. Government Agency Obligations, 1.00%-8.50%, 1/20/24-6/20/52, totaling $2,079,766) | | $ | 2,038,986 | | | | 2,038,986 | |
| Daiwa Capital Markets America, dated 06/30/22, due 07/01/22, 1.55%, total to be received $2,039,074, (collateralized by various U.S. Government Agency Obligations, 0.00%-6.50%, 7/31/22-7/1/52, totaling $2,079,766) | | | 2,038,986 | | | | 2,038,986 | |
See accompanying Notes to Financial Statements.
ADVISORSHARES PURE CANNABIS ETF
Schedule of Investments (continued)
June 30, 2022
| Investments | | Principal | | | Value | |
| REPURCHASE AGREEMENTS (continued) | |
| Nomura Securities International, Inc., dated 06/30/22, due 07/01/22, 1.54%, total to be received $1,925,053, (collateralized by various U.S. Government Agency Obligations, 1.50%-6.50%, 7/1/27-6/1/52, totaling $1,963,471) | | $ | 1,924,971 | | | $ | 1,924,971 | |
| RBC Dominion Securities, Inc., dated 06/30/22, due 07/01/22, 1.55%, total to be received $2,039,074, (collateralized by various U.S. Government Agency Obligations, 0.00%-6.88%, 8/16/22-5/20/52, totaling $2,079,766) | | | 2,038,986 | | | | 2,038,986 | |
Total Repurchase Agreements
(Cost $8,041,929) | | | | | | | 8,041,929 | |
| | | | | | | | | |
Total Investments — 106.1%
(Cost $238,434,387) | | | | | | | 76,183,560 | |
| Liabilities in Excess of Other Assets — (6.1%) | | | | | | | (4,367,008 | ) |
| Net Assets — 100.0% | | | | | | $ | 71,816,552 | |
ETF — Exchange Traded Fund
PLC — Public Limited Company
REITS — Real Estate Investment Trusts
| * | Non-income producing security. |
| ** | Amount includes $63,295 of segregated collateral for swaps. |
| (a) | All or a portion of security is on loan. The aggregate market value of the securities on loan is $8,809,100; the aggregate market value of the collateral held by the fund is $10,447,503. The aggregate market value of the collateral includes non-cash U.S. Treasury securities collateral having a value of $1,687,574. |
| (b) | Rate shown reflects the 7-day yield as of June 30, 2022. |
| (c) | Collateral received from brokers for securities lending was invested in these short-term investments. |
See accompanying Notes to Financial Statements.
ADVISORSHARES PURE CANNABIS ETF
Schedule of Investments (continued)
June 30, 2022
Fair Value Measurements
The following is a summary of the inputs used, as of June 30, 2022, in valuing the Fund’s assets and liabilities carried at fair value. These inputs are summarized in three broad levels. Level 1 includes quoted prices in active markets for identical securities. Level 2 includes other significant observable inputs (including quoted prices for similar securities, interest rates, prepayment speeds and credit risk). Level 3 includes significant unobservable inputs (including the Fund’s own assumptions in determining the fair value of investments). The level assigned to the securities valuations may not be an indication of the risk or liquidity associated with investing in those securities.
| Assets | | Level 1 | | | Level 2 | | | Level 3 | | | Total | |
| Common Stocks | | $ | 39,554,420 | | | $ | — | | | $ | — | | | $ | 39,554,420 | |
| Exchange Traded Fund | | | 24,719,940 | | | | — | | | | — | | | | 24,719,940 | |
| Money Market Funds | | | 3,867,271 | | | | — | | | | — | | | | 3,867,271 | |
| Repurchase Agreements | | | — | | | | 8,041,929 | | | | — | | | | 8,041,929 | |
| Total | | $ | 68,141,631 | | | $ | 8,041,929 | | | $ | — | | | $ | 76,183,560 | |
| Liabilities | | Level 1 | | | Level 2 | | | Level 3 | | | Total | |
| Swaps† | | $ | — | | | $ | (21,822,874 | ) | | $ | — | | | $ | (21,822,874 | ) |
| † | Derivative instruments, including swap contracts, are valued at the net unrealized gain (loss) on the instrument. |
SUMMARY OF SCHEDULE OF INVESTMENTS
| | | % of
Net Assets | |
| Agriculture | | | 17.6 | % |
| Distributors | | | 1.3 | |
| Equity Fund | | | 34.4 | |
| Interactive Media & Services | | | 1.2 | |
| Investment Company | | | 3.7 | |
| Pharmaceuticals | | | 18.8 | |
| REITS | | | 7.8 | |
| Software | | | 2.1 | |
| Specialty Retail | | | 2.6 | |
| Money Market Funds | | | 5.4 | |
| Repurchase Agreements | | | 11.2 | |
| Total Investments | | | 106.1 | |
| Liabilities in Excess of Other Assets | | | (6.1 | ) |
| Net Assets | | | 100.0 | % |
See accompanying Notes to Financial Statements.
ADVISORSHARES PURE CANNABIS ETF
Schedule of Investments (continued)
June 30, 2022
Total Return Swap contracts outstanding as of June 30, 2022:
| Reference Entity | | Annual Financing Rate Paid | | | Payment Frequency | | | Termination Date | | | Notional Amounts | | | Fair Value | | | Unrealized Appreciation/ (Depreciation) | |
| Ianthus Capital ORD | | | — | | | | — | | | 7/01/2022 | | | $ | 108,903 | | | $ | 30,025 | | | $ | (78,878 | ) |
| SOL Global Investments Corp | | | — | | | | — | | | 7/01/2022 | | | | 12,046,261 | | | | 1,034,166 | | | | (11,012,095 | ) |
| Terrascend ORD | | | — | | | | — | | | 7/01/2022 | | | | 13,695,901 | | | | 2,964,000 | | | | (10,731,901 | ) |
| Net Unrealized Depreciation | | | | | | | | | | | | | | | | | | | | | $ | (21,822,874 | ) |
Cowen acts as the counterparty to the total return swap contracts listed above. The Fund either receives fees from, or pays fees to, the counterparty, depending upon the total return of the benchmark, and the agreed-upon floating financing rate.
Affiliated holdings are funds which are managed by the Trust or an affiliate of the Trust. Transactions with affiliated companies during the year ended June 30, 2022 were as follows:
| Affiliated Holding Name | | Value at 6/30/2021 | | | Purchases/ Additions | | | Sales/ Reductions | | | Realized Gain
(Loss) | | | Change in Unrealized Gain (Loss) | | | Number of Shares at 6/30/2022 | | | Value at 6/30/2022 | | | Capital Gain Distributions | |
| AdvisorShares Pure US Cannabis ETF | | $ | — | | | $ | 74,432,891 | | | $ | (5,087,572 | ) | | $ | (1,834,516 | ) | | $ | (42,790,863 | ) | | | 2,388,400 | | | $ | 24,719,940 | | | $ | 180,376 | |
| Intec Pharma Ltd.* | | | 1,537,238 | | | | — | | | | (899,998 | ) | | | (2,574,872 | ) | | | 1,937,632 | | | | — | | | | — | | | | — | |
| Village Farms International, Inc. | | | 53,391,095 | | | | 3,430,741 | | | | (7,781,408 | ) | | | 729,893 | | | | (37,122,702 | ) | | | 4,845,831 | | | | 12,647,619 | | | | — | |
| Total | | $ | 54,928,333 | | | $ | 77,863,632 | | | $ | (13,768,978 | ) | | $ | (3,679,495 | ) | | $ | (77,975,933 | ) | | | 7,234,231 | | | | 37,367,559 | | | $ | 180,376 | |
| * | Security is no longer an affiliated company at year end. |
See accompanying Notes to Financial Statements.
ADVISORSHARES PURE US CANNABIS ETF
Schedule of Investments
June 30, 2022
| Investments | | Shares/
Principal | | | Value | |
| COMMON STOCKS — 9.8% | |
| | | | | | | | | |
| Investment Company — 0.5% | |
| RIV Capital, Inc. (Canada)* | | | 4,512,850 | | | $ | 2,378,959 | |
| | | | | | | | | |
| Machinery — 0.6% | |
| Urban-GRO, Inc.*† | | | 615,065 | | | | 2,976,915 | |
| | | | | | | | | |
| Pharmaceuticals — 0.1% | |
| Hempfusion Wellness, Inc. (Canada)* | | | 7,877,767 | | | | 441,155 | |
| | | | | | | | | |
| REITS — 4.8% | |
| AFC Gamma, Inc. | | | 151,406 | | | | 2,321,054 | |
| Innovative Industrial Properties, Inc. | | | 166,683 | | | | 18,313,461 | |
| Power REIT*† | | | 288,572 | | | | 3,673,522 | |
| Total REITS | | | | | | | 24,308,037 | |
| | | | | | | | | |
| Specialty Retail — 3.8% | |
| Agrify Corp.*(a) | | | 908,105 | | | | 1,788,967 | |
| GrowGeneration Corp.*†(a) | | | 3,614,976 | | | | 12,977,764 | |
| Hydrofarm Holdings Group, Inc.*(a) | | | 1,553,276 | | | | 5,405,400 | |
| Total Specialty Retail | | | | | | | 20,172,131 | |
Total Common Stocks
(Cost $200,599,894) | | | | | | | 50,277,197 | |
| | | | | | | | | |
| MONEY MARKET FUND — 83.4% | |
BlackRock Liquidity Funds Treasury Trust Fund Portfolio, Institutional Class, 1.03%(b)**
(Cost $429,506,784) | | | 429,506,784 | | | | 429,506,784 | |
| | | | | | | | | |
| REPURCHASE AGREEMENTS — 0.2%(c) | |
| Daiwa Capital Markets America, dated 06/30/22, due 07/01/22, 1.55%, total to be received $253,380, (collateralized by various U.S. Government Agency Obligations, 0.00%-6.50%, 7/31/22-7/1/52, totaling $258,436) | | $ | 253,369 | | | | 253,369 | |
| Deutsche Bank Securities, Inc., dated 06/30/22, due 07/01/22, 1.48%, total to be received $75,019, (collateralized by various U.S. Government Agency Obligations, 0.00%-0.75%, 1/15/25-8/15/39, totaling $76,516) | | | 75,016 | | | | 75,016 | |
| Investments | |
Principal | | | Value | |
| REPURCHASE AGREEMENTS (continued) | |
| Nomura Securities International, Inc., dated 06/30/22, due 07/01/22, 1.54%, total to be received $253,380, (collateralized by various U.S. Government Agency Obligations, 1.50%-6.50%, 7/1/27-6/1/52, totaling $258,436) | | $ | 253,369 | | | $ | 253,369 | |
| RBC Dominion Securities, Inc., dated 06/30/22, due 07/01/22, 1.55%, total to be received $253,380, (collateralized by various U.S. Government Agency Obligations, 0.00%-6.88%, 8/16/22-5/20/52, totaling $258,436) | | | 253,369 | | | | 253,369 | |
| Truist Securities, Inc., dated 06/30/22, due 07/01/22, 1.55%, total to be received $253,380, (collateralized by various U.S. Government Agency Obligations, 3.25%-5.50%, 6/30/27-7/1/52, totaling $258,437) | | | 253,369 | | | | 253,369 | |
Total Repurchase Agreements
(Cost $1,088,492) | | | | | | | 1,088,492 | |
| | | | | | | | | |
Total Investments — 93.4%
(Cost $631,195,170) | | | | | | | 480,872,473 | |
| Other Assets in Excess of Liabilities — 6.6% | | | | | | | 33,818,549 | |
| Net Assets — 100.0% | | | | | | $ | 514,691,022 | |
REITS — Real Estate Investment Trusts
SOFR — Secured Overnight Financing Rate
| * | Non-income producing security. |
| ** | Amount includes $364,793,258 of segregated collateral for swaps. |
| (a) | All or a portion of security is on loan. The aggregate market value of the securities on loan is $1,123,353; the aggregate market value of the collateral held by the fund is $1,178,256. The aggregate market value of the collateral includes non-cash U.S. Treasury securities collateral having a value of $89,764. |
| (b) | Rate shown reflects the 7-day yield as of June 30, 2022. |
| (c) | Collateral received from brokers for securities lending was invested in these short-term investments. |
See accompanying Notes to Financial Statements.
ADVISORSHARES PURE US CANNABIS ETF
Schedule of Investments (continued)
June 30, 2022
Fair Value Measurements
The following is a summary of the inputs used, as of June 30, 2022, in valuing the Fund’s assets and liabilities carried at fair value. These inputs are summarized in three broad levels. Level 1 includes quoted prices in active markets for identical securities. Level 2 includes other significant observable inputs (including quoted prices for similar securities, interest rates, prepayment speeds and credit risk). Level 3 includes significant unobservable inputs (including the Fund’s own assumptions in determining the fair value of investments). The level assigned to the securities valuations may not be an indication of the risk or liquidity associated with investing in those securities.
| Assets | | Level 1 | | | Level 2 | | | Level 3 | | | Total | |
| Common Stocks | | $ | 50,277,197 | | | $ | — | | | $ | — | | | $ | 50,277,197 | |
| Money Market Fund | | | 429,506,784 | | | | — | | | | — | | | | 429,506,784 | |
| Repurchase Agreements | | | — | | | | 1,088,492 | | | | — | | | | 1,088,492 | |
| Swaps† | | | — | | | | 30,906 | | | | — | | | | 30,906 | |
| Total | | $ | 479,783,981 | | | $ | 1,119,398 | | | $ | — | | | $ | 480,903,379 | |
| Liabilities | | Level 1 | | | Level 2 | | | Level 3 | | | Total | |
| Swaps† | | $ | — | | | $ | (387,333,508 | ) | | $ | — | | | $ | (387,333,508 | ) |
| † | Derivative instruments, including swap contracts, are valued at the net unrealized gain (loss) on the instrument. |
SUMMARY OF SCHEDULE OF INVESTMENTS
| | | % of
Net Assets | |
| Investment Company | | | 0.5 | % |
| Machinery | | | 0.6 | |
| Pharmaceuticals | | | 0.1 | |
| REITS | | | 4.8 | |
| Specialty Retail | | | 3.8 | |
| Money Market Fund | | | 83.4 | |
| Repurchase Agreements | | | 0.2 | |
| Total Investments | | | 93.4 | |
| Other Assets in Excess of Liabilities | | | 6.6 | |
| Net Assets | | | 100.0 | % |
See accompanying Notes to Financial Statements.
ADVISORSHARES PURE US CANNABIS ETF
Schedule of Investments (continued)
June 30, 2022
Total Return Swap contracts outstanding as of June 30, 2022:
| Reference Entity | | Annual
Financing Rate
Paid | | | Payment
Frequency | | | Termination
Date | | Notional
Amounts | | | Fair
Value | | | Unrealized
Appreciation/ (Depreciation) | |
| 4Front Ventures ORD | | — | | | — | | | 9/02/2022 | | $ | 27,357,014 | | | $ | 11,009,114 | | | $ | (16,347,900 | ) |
| 4Front Ventures ORD | | SOFR + 1.00% | | | Monthly | | | 9/02/2022 | | | 477,047 | | | | 467,500 | | | | (9,547 | ) |
| Acreage Holdings FX SUB VOT CL E ORD | | — | | | — | | | 9/02/2022 | | | 4,978,202 | | | | 1,849,090 | | | | (3,129,112 | ) |
| AYR Wellness | | — | | | — | | | 9/02/2022 | | | 31,799,150 | | | | 5,604,574 | | | | (26,194,576 | ) |
| AYR Wellness | | SOFR + 1.00% | | | Monthly | | | 9/02/2022 | | | 15,761,631 | | | | 15,727,084 | | | | (34,547 | ) |
| C21 Investments ORD | | — | | | — | | | 9/02/2022 | | | 10,556,677 | | | | 2,149,707 | | | | (8,406,970 | ) |
| Columbia Care ORD | | — | | | — | | | 9/02/2022 | | | 20,113,964 | | | | 3,806,620 | | | | (16,307,344 | ) |
| Columbia Care ORD | | SOFR + 1.00% | | | Monthly | | | 9/02/2022 | | | 17,487,096 | | | | 17,442,807 | | | | (44,289 | ) |
| Cresco Labs ORD | | — | | | — | | | 9/02/2022 | | | 51,001,012 | | | | 9,777,564 | | | | (41,223,448 | ) |
| Cresco Labs ORD | | SOFR + 1.00% | | | Monthly | | | 9/02/2022 | | | 25,595,484 | | | | 25,529,045 | | | | (66,439 | ) |
| Curaleaf Holdings SUB VOT ORD | | — | | | — | | | 9/02/2022 | | | 55,903,614 | | | | 18,988,000 | | | | (36,915,614 | ) |
| Curaleaf Holdings SUB VOT ORD | | SOFR + 1.00% | | | Monthly | | | 9/02/2022 | | | 65,170,493 | | | | 65,035,390 | | | | (135,103 | ) |
| Glass House Brands | | — | | | — | | | 9/02/2022 | | | 5,736,870 | | | | 2,137,500 | | | | (3,599,370 | ) |
| Glass House Brands | | SOFR + 1.00% | | | Monthly | | | 8/25/2026 | | | 254,094 | | | | 285,000 | | | | 30,906 | |
| Goodness Growth Hold | | — | | | — | | | 9/02/2022 | | | 12,790,362 | | | | 5,092,483 | | | | (7,697,879 | ) |
| Gramf Tpco ORD | | — | | | — | | | 9/02/2022 | | | 34,143,873 | | | | 3,635,416 | | | | (30,508,457 | ) |
| Green Thumb Industries SUB VOT ORD | | — | | | — | | | 9/02/2022 | | | 49,101,881 | | | | 12,377,424 | | | | (36,724,457 | ) |
| Green Thumb Industries SUB VOT ORD | | SOFR + 1.00% | | | Monthly | | | 9/02/2022 | | | 60,522,358 | | | | 60,384,336 | | | | (138,022 | ) |
| Jushi Holdings CL B SUB VOT ORD | | — | | | — | | | 9/02/2022 | | | 32,092,168 | | | | 8,841,911 | | | | (23,250,257 | ) |
| Jushi Holdings CL B SUB VOT ORD | | SOFR + 1.00% | | | Monthly | | | 9/02/2022 | | | 6,004,000 | | | | 5,609,000 | | | | (395,000 | ) |
| Lowell Farms ORD | | — | | | — | | | 9/02/2022 | | | 6,072,549 | | | | 1,049,836 | | | | (5,022,713 | ) |
| Planet 13 Holdings ORD | | — | | | — | | | 9/02/2022 | | | 19,117,097 | | | | 3,019,335 | | | | (16,097,762 | ) |
| Planet 13 Holdings ORD | | SOFR + 1.00% | | | Monthly | | | 9/02/2022 | | | 5,127,712 | | | | 4,535,342 | | | | (592,370 | ) |
| Terrascend ORD | | — | | | — | | | 9/02/2022 | | | 30,829,425 | | | | 7,081,805 | | | | (23,747,620 | ) |
| Terrascend ORD | | SOFR + 1.00% | | | Monthly | | | 9/02/2022 | | | 17,954,832 | | | | 17,901,821 | | | | (53,011 | ) |
| Trulieve Cannabis ORD | | — | | | — | | | 9/02/2022 | | | 76,030,014 | | | | 25,113,531 | | | | (50,916,483 | ) |
| Trulieve Cannabis ORD | | SOFR + 1.00% | | | Monthly | | | 9/02/2022 | | | 62,215,288 | | | | 62,079,104 | | | | (136,184 | ) |
| Vapen Mj Ventures ORD | | — | | | — | | | 9/02/2022 | | | 4,387,543 | | | | 1,504,468 | | | | (2,883,075 | ) |
| Verano Holdings ORD | | — | | | — | | | 9/02/2022 | | | 56,537,696 | | | | 19,884,453 | | | | (36,653,243 | ) |
| Verano Holdings ORD | | SOFR + 1.00% | | | Monthly | | | 9/02/2022 | | | 45,145,116 | | | | 45,042,400 | | | | (102,716 | ) |
| Net Unrealized Depreciation | | | | | | | | | | | | | | | | | | $ | (387,302,602 | ) |
Cowen and Nomura act as the counterparties to the total return swap contracts listed above. The Fund either receives fees from, or pays fees to, the counterparty, depending upon the total return of the benchmark, and the agreed-upon floating financing rate. As of June 30, 2022, cash in the amount of $7,170,000 has been segregated as collateral from the broker for Swap contracts.
See accompanying Notes to Financial Statements.
ADVISORSHARES PURE US CANNABIS ETF
Schedule of Investments (continued)
June 30, 2022
Affiliated holdings are funds which are managed by the Trust or an affiliate of the Trust. Transactions with affiliated companies during the year ended June 30, 2022 were as follows:
| Affiliated Holding Name | | Value at 6/30/2021 | | | Purchases/ Additions | | | Sales/ Reductions | | | Realized Gain
(Loss) | | | Change in Unrealized Gain (Loss) | | | Number of Shares at 6/30/2022 | | | Value at 6/30/2022 | | | Dividend Income | |
| GrowGeneration Corp. | | $ | 40,177,305 | | | $ | 72,070,290 | | | $ | (15,153,367 | ) | | $ | (25,847,337 | ) | | $ | (58,269,127 | ) | | | 3,614,976 | | | $ | 12,977,764 | | | $ | — | |
| Power REIT | | | 6,923,139 | | | | 8,475,013 | | | | (1,450,898 | ) | | | (606,636 | ) | | | (9,667,096 | ) | | | 288,572 | | | | 3,673,522 | | | | — | |
| Urban-GRO, Inc. | | | — | | | | 9,477,249 | | | | (1,954,791 | ) | | | (623,388 | ) | | | (3,922,155 | ) | | | 615,065 | | | | 2,976,915 | | | | — | |
| Total | | $ | 47,100,444 | | | $ | 90,022,552 | | | $ | (18,559,056 | ) | | $ | (27,077,361 | ) | | $ | (71,858,378 | ) | | | 4,518,613 | | | | 19,628,201 | | | $ | — | |
See accompanying Notes to Financial Statements.
ADVISORSHARES Q DYNAMIC GROWTH ETF
Schedule of Investments
June 30, 2022
| Investments | | Shares | | | Value | |
| EXCHANGE TRADED FUNDS — 96.7% | |
| | | | | | | | | |
| Commodity Fund — 3.6% | |
| SPDR Gold Shares* | | | 8,518 | | | $ | 1,434,942 | |
| | | | | | | | | |
| Equity Fund — 93.1% | |
| Invesco QQQ Trust Series 1 | | | 55,504 | | | | 15,556,661 | |
| iShares Core S&P Small-Cap ETF | | | 18,766 | | | | 1,734,166 | |
| iShares US Technology ETF | | | 85,427 | | | | 6,829,889 | |
| Technology Select Sector SPDR Fund | | | 94,803 | | | | 12,051,357 | |
| Vanguard Total Stock Market ETF | | | 7,254 | | | | 1,368,250 | |
| Total Equity Fund | | | | | | | 37,540,323 | |
Total Exchange Traded Funds
(Cost $49,225,533) | | | | | | | 38,975,265 | |
| | | | | | | | | |
| MONEY MARKET FUND — 3.4% | |
Fidelity Investments Money Market Government Portfolio — Class I, 1.21%(a)
(Cost $1,353,893) | | | 1,353,893 | | | | 1,353,893 | |
| | | | | | | | | |
Total Investments — 100.1%
(Cost $50,579,426) | | | | | | | 40,329,158 | |
| Liabilities in Excess of Other Assets — (0.1%) | | | | | | | (30,125 | ) |
| Net Assets — 100.0% | | | | | | $ | 40,299,033 | |
ETF — Exchange Traded Fund
| * | Non-income producing security. |
| (a) | Rate shown reflects the 7-day yield as of June 30, 2022. |
See accompanying Notes to Financial Statements.
ADVISORSHARES Q DYNAMIC GROWTH ETF
Schedule of Investments (continued)
June 30, 2022
Fair Value Measurements
The following is a summary of the inputs used, as of June 30, 2022, in valuing the Fund’s assets and liabilities carried at fair value. These inputs are summarized in three broad levels. Level 1 includes quoted prices in active markets for identical securities. Level 2 includes other significant observable inputs (including quoted prices for similar securities, interest rates, prepayment speeds and credit risk). Level 3 includes significant unobservable inputs (including the Fund’s own assumptions in determining the fair value of investments). The level assigned to the securities valuations may not be an indication of the risk or liquidity associated with investing in those securities.
| Assets | | Level 1 | | | Level 2 | | | Level 3 | | | Total | |
| Exchange Traded Funds | | $ | 38,975,265 | | | $ | — | | | $ | — | | | $ | 38,975,265 | |
| Money Market Fund | | | 1,353,893 | | | | — | | | | — | | | | 1,353,893 | |
| Total | | $ | 40,329,158 | | | $ | — | | | $ | — | | | $ | 40,329,158 | |
SUMMARY OF SCHEDULE OF INVESTMENTS
| | | % of
Net Assets | |
| Commodity Fund | | | 3.6 | % |
| Equity Fund | | | 93.1 | |
| Money Market Fund | | | 3.4 | |
| Total Investments | | | 100.1 | |
| Liabilities in Excess of Other Assets | | | (0.1 | ) |
| Net Assets | | | 100.0 | % |
See accompanying Notes to Financial Statements.
ADVISORSHARES Q PORTFOLIO BLENDED ALLOCATION ETF
Schedule of Investments
June 30, 2022
| Investments | | Shares/
Principal | | | Value | |
| EXCHANGE TRADED FUNDS — 97.5% | |
| | | | | | | | | |
| Commodity Fund — 11.5% | |
| SPDR Gold Shares*(a) | | | 1,831 | | | $ | 308,450 | |
| | | | | | | | | |
| Debt Fund — 35.0% | |
| iShares 20+ Year Treasury Bond ETF(a) | | | 7,174 | | | | 824,077 | |
| Vanguard Total Bond Market ETF | | | 1,480 | | | | 111,385 | |
| Total Debt Fund | | | | | | | 935,462 | |
| | | | | | | | | |
| Equity Fund — 51.0% | |
| Invesco QQQ Trust Series 1 | | | 2,184 | | | | 612,132 | |
| iShares US Technology ETF | | | 3,459 | | | | 276,547 | |
| Technology Select Sector SPDR Fund | | | 3,752 | | | | 476,954 | |
| Total Equity Fund | | | | | | | 1,365,633 | |
Total Exchange Traded Funds
(Cost $2,980,402) | | | | | | | 2,609,545 | |
| | | | | | | | | |
| MONEY MARKET FUND — 3.2% | |
Fidelity Investments Money Market Government Portfolio — Class I, 1.21%(b)
(Cost $85,262) | | | 85,262 | | | | 85,262 | |
| | | | | | | | | |
| REPURCHASE AGREEMENTS — 42.7%(c) | |
| BofA Securities, Inc., dated 06/30/22, due 07/01/22, 1.55%, total to be received $266,435, (collateralized by various U.S. Government Agency Obligations, 1.00%-8.50%, 1/20/24-6/20/52, totaling $271,752) | | $ | 266,424 | | | | 266,424 | |
| Citigroup Global Markets, Inc., dated 06/30/22, due 07/01/22, 1.50%, total to be received $78,942, (collateralized by various U.S. Government Agency Obligations, 1.88%-3.25%, 6/30/24-5/15/52, totaling $80,518) | | | 78,939 | | | | 78,939 | |
| Daiwa Capital Markets America, dated 06/30/22, due 07/01/22, 1.55%, total to be received $266,435, (collateralized by various U.S. Government Agency Obligations, 0.00%-6.50%, 7/31/22-7/1/52, totaling $271,752) | | | 266,424 | | | | 266,424 | |
| Investments | |
Principal | | | Value | |
| REPURCHASE AGREEMENTS (continued) | |
| RBC Dominion Securities, Inc., dated 06/30/22, due 07/01/22, 1.55%, total to be received $266,435, (collateralized by various U.S. Government Agency Obligations, 0.00%-6.88%, 8/16/22-5/20/52, totaling $271,752) | | $ | 266,424 | | | $ | 266,424 | |
| Truist Securities, Inc., dated 06/30/22, due 07/01/22, 1.55%, total to be received $266,435, (collateralized by various U.S. Government Agency Obligations, 3.25%-5.50%, 6/30/27-7/1/52, totaling $271,753) | | | 266,424 | | | | 266,424 | |
Total Repurchase Agreements
(Cost $1,144,635) | | | | | | | 1,144,635 | |
| | | | | | | | | |
Total Investments — 143.4%
(Cost $4,210,299) | | | | | | | 3,839,442 | |
| Liabilities in Excess of Other Assets — (43.4%) | | | | | | | (1,161,588 | ) |
| Net Assets — 100.0% | | | | | | $ | 2,677,854 | |
ETF — Exchange Traded Fund
| * | Non-income producing security. |
| (a) | All or a portion of security is on loan. The aggregate market value of the securities on loan is $1,126,295; the aggregate market value of the collateral held by the fund is $1,144,635. |
| (b) | Rate shown reflects the 7-day yield as of June 30, 2022. |
| (c) | Collateral received from brokers for securities lending was invested in these short-term investments. |
See accompanying Notes to Financial Statements.
ADVISORSHARES Q PORTFOLIO BLENDED ALLOCATION ETF
Schedule of Investments (continued)
June 30, 2022
Fair Value Measurements
The following is a summary of the inputs used, as of June 30, 2022, in valuing the Fund’s assets and liabilities carried at fair value. These inputs are summarized in three broad levels. Level 1 includes quoted prices in active markets for identical securities. Level 2 includes other significant observable inputs (including quoted prices for similar securities, interest rates, prepayment speeds and credit risk). Level 3 includes significant unobservable inputs (including the Fund’s own assumptions in determining the fair value of investments). The level assigned to the securities valuations may not be an indication of the risk or liquidity associated with investing in those securities.
| Assets | | Level 1 | | | Level 2 | | | Level 3 | | | Total | |
| Exchange Traded Funds | | $ | 2,609,545 | | | $ | — | | | $ | — | | | $ | 2,609,545 | |
| Money Market Fund | | | 85,262 | | | | — | | | | — | | | | 85,262 | |
| Repurchase Agreements | | | — | | | | 1,144,635 | | | | — | | | | 1,144,635 | |
| Total | | $ | 2,694,807 | | | $ | 1,144,635 | | | $ | — | | | $ | 3,839,442 | |
SUMMARY OF SCHEDULE OF INVESTMENTS
| | | % of
Net Assets | |
| Commodity Fund | | | 11.5 | % |
| Debt Fund | | | 35.0 | |
| Equity Fund | | | 51.0 | |
| Money Market Fund | | | 3.2 | |
| Repurchase Agreements | | | 42.7 | |
| Total Investments | | | 143.4 | |
| Liabilities in Excess of Other Assets | | | (43.4 | ) |
| Net Assets | | | 100.0 | % |
See accompanying Notes to Financial Statements.
ADVISORSHARES RANGER EQUITY BEAR ETF
Schedule of Investments
June 30, 2022
| Investments | | Principal/
Shares | | | Value | |
| U.S. TREASURY BILLS — 35.4% | |
| U.S. Treasury Bill, 1.97%, 04/20/23(a) | | $ | 50,000,000 | | | $ | 48,980,604 | |
| U.S. Treasury Bill, 2.85%, 06/15/23(a) | | | 10,000,000 | | | | 9,740,673 | |
Total U.S. Treasury Bills
(Cost $58,894,548) | | | | | | | 58,721,277 | |
| | | | | | | | | |
| EXCHANGE TRADED FUND — 11.7% | |
| | | | | | | | | |
| Debt Fund — 11.7% | |
AdvisorShares North Square McKee Core Reserves ETF†
(Cost $19,886,000) | | | 200,000 | | | | 19,476,000 | |
| | | | | | | | | |
| MONEY MARKET FUNDS — 38.9% | |
| BlackRock Liquidity Funds FedFund Portfolio, Institutional Class, 1.32%(b)(c) | | | 52,231,905 | | | | 52,231,905 | |
| Fidelity Institutional Money Market Government Portfolio — Class III, 0.96%(b) | | | 12,399,588 | | | | 12,399,588 | |
Total Money Market Funds
(Cost $64,631,493) | | | | | | | 64,631,493 | |
Total Investments Before Securities Sold, Not Yet Purchased
(Cost $143,412,041) | | | | | | | 142,828,770 | |
| | | | | | | | | |
| Securities Sold, Not Yet Purchased — (96.9)%(d) | |
| | | | | | | | | |
| COMMON STOCKS — (96.9)% | |
| | | | | | | | | |
| Advertising — (1.1)% | |
| Trade Desk, Inc. (The), Class A* | | | (42,500 | ) | | | (1,780,325 | ) |
| | | | | | | | | |
| Apparel — (1.3)% | |
| Skechers USA, Inc., Class A* | | | (60,000 | ) | | | (2,134,800 | ) |
| | | | | | | | | |
| Banks — (8.7)% | |
| Citigroup, Inc. | | | (50,000 | ) | | | (2,299,500 | ) |
| Deutsche Bank AG (Germany) | | | (700,000 | ) | | | (6,118,000 | ) |
| Signature Bank | | | (15,000 | ) | | | (2,688,150 | ) |
| Silvergate Capital Corp., Class A* | | | (30,000 | ) | | | (1,605,900 | ) |
| Sumitomo Mitsui Financial Group, Inc. (Japan)(e) | | | (300,000 | ) | | | (1,770,000 | ) |
| Total Banks | | | | | | | (14,481,550 | ) |
| Investments | |
Shares | | | Value | |
| COMMON STOCKS (continued) | |
| | | | | | | | | |
| Commercial Services — (10.5)% | |
| Affirm Holdings, Inc.* | | | (50,000 | ) | | $ | (903,000 | ) |
| Coursera, Inc.* | | | (146,570 | ) | | | (2,078,362 | ) |
| MarketAxess Holdings, Inc. | | | (10,000 | ) | | | (2,560,100 | ) |
| Moody’s Corp. | | | (27,500 | ) | | | (7,479,175 | ) |
| Paylocity Holding Corp.* | | | (10,000 | ) | | | (1,744,200 | ) |
| Payoneer Global, Inc.* | | | (300,000 | ) | | | (1,176,000 | ) |
| ZipRecruiter, Inc., Class A* | | | (100,000 | ) | | | (1,482,000 | ) |
| Total Commercial Services | | | | | | | (17,422,837 | ) |
| | | | | | | | | |
| Computers — (5.5)% | |
| CyberArk Software Ltd.* | | | (20,000 | ) | | | (2,559,200 | ) |
| EPAM Systems, Inc.* | | | (5,000 | ) | | | (1,473,900 | ) |
| KnowBe4, Inc., Class A* | | | (105,000 | ) | | | (1,640,100 | ) |
| Rapid7, Inc.* | | | (30,000 | ) | | | (2,004,000 | ) |
| Varonis Systems, Inc.* | | | (50,000 | ) | | | (1,466,000 | ) |
| Total Computers | | | | | | | (9,143,200 | ) |
| | | | | | | | | |
| Diversified Financial Services — (9.7)% | |
| Bread Financial Holdings, Inc. | | | (20,000 | ) | | | (741,200 | ) |
| Coinbase Global, Inc., Class A* | | | (55,000 | ) | | | (2,586,100 | ) |
| Hannon Armstrong Sustainable Infrastructure Capital, Inc. | | | (50,000 | ) | | | (1,893,000 | ) |
| Nomura Holdings, Inc. (Japan)(e) | | | (750,000 | ) | | | (2,685,000 | ) |
| OneMain Holdings, Inc. | | | (150,000 | ) | | | (5,607,000 | ) |
| Tradeweb Markets, Inc., Class A | | | (38,000 | ) | | | (2,593,500 | ) |
| Total Diversified Financial Services | | | | | | | (16,105,800 | ) |
| | | | | | | | | |
| Electrical Components & Equipment — (4.9)% | |
| Universal Display Corp. | | | (80,000 | ) | | | (8,091,200 | ) |
| | | | | | | | | |
| Engineering & Construction — (1.2)% | |
| Exponent, Inc. | | | (21,000 | ) | | | (1,920,870 | ) |
| | | | | | | | | |
| Entertainment — (0.7)% | |
| DraftKings, Inc., Class A* | | | (100,000 | ) | | | (1,167,000 | ) |
| | | | | | | | | |
| Food — (2.7)% | |
| McCormick & Co., Inc. | | | (30,000 | ) | | | (2,497,500 | ) |
| United Natural Foods, Inc.* | | | (50,000 | ) | | | (1,970,000 | ) |
| Total Food | | | | | | | (4,467,500 | ) |
See accompanying Notes to Financial Statements.
ADVISORSHARES RANGER EQUITY BEAR ETF
Schedule of Investments (continued)
June 30, 2022
| Investments | | Shares | | | Value | |
| COMMON STOCKS (continued) | |
| | | | | | | | | |
| Food Service — (0.5)% | |
| Healthcare Services Group, Inc. | | | (50,000 | ) | | $ | (870,500 | ) |
| | | | | | | | | |
| Home Furnishings — (3.0)% | |
| Sonos, Inc.* | | | (100,000 | ) | | | (1,804,000 | ) |
| Tempur Sealy International, Inc. | | | (150,000 | ) | | | (3,205,500 | ) |
| Total Home Furnishings | | | | | | | (5,009,500 | ) |
| | | | | | | | | |
| Insurance — (0.8)% | |
| Goosehead Insurance, Inc., Class A | | | (30,000 | ) | | | (1,370,100 | ) |
| | | | | | | | | |
| Internet — (4.9)% | |
| DoorDash, Inc., Class A* | | | (50,000 | ) | | | (3,208,500 | ) |
| Okta, Inc.* | | | (20,000 | ) | | | (1,808,000 | ) |
| Revolve Group, Inc.* | | | (50,000 | ) | | | (1,295,500 | ) |
| Yelp, Inc.* | | | (65,000 | ) | | | (1,805,050 | ) |
| Total Internet | | | | | | | (8,117,050 | ) |
| | | | | | | | | |
| Media — (2.4)% | |
| Paramount Global, Class B | | | (100,000 | ) | | | (2,468,000 | ) |
| Thomson Reuters Corp. (Canada) | | | (15,000 | ) | | | (1,563,150 | ) |
| Total Media | | | | | | | (4,031,150 | ) |
| | | | | | | | | |
| Miscellaneous Manufacturing — (1.6)% | |
| 3M Co. | | | (20,000 | ) | | | (2,588,200 | ) |
| | | | | | | | | |
| Retail — (8.1)% | |
| CarMax, Inc.* | | | (30,000 | ) | | | (2,714,400 | ) |
| Freshpet, Inc.* | | | (50,000 | ) | | | (2,594,500 | ) |
| O’Reilly Automotive, Inc.* | | | (4,000 | ) | | | (2,527,040 | ) |
| Restaurant Brands International, Inc. (Canada) | | | (75,000 | ) | | | (3,761,250 | ) |
| Walgreens Boots Alliance, Inc. | | | (50,000 | ) | | | (1,895,000 | ) |
| Total Retail | | | | | | | (13,492,190 | ) |
| | | | | | | | | |
| Software — (26.9)% | |
| Alteryx, Inc., Class A* | | | (20,000 | ) | | | (968,400 | ) |
| Amplitude, Inc., Class A* | | | (150,000 | ) | | | (2,143,500 | ) |
| AppFolio, Inc., Class A* | | | (15,200 | ) | | | (1,377,728 | ) |
| Autodesk, Inc.* | | | (20,000 | ) | | | (3,439,200 | ) |
| Bill.Com Holdings, Inc.* | | | (10,000 | ) | | | (1,099,400 | ) |
| Clear Secure, Inc., Class A* | | | (100,000 | ) | | | (2,000,000 | ) |
| Cloudflare, Inc., Class A* | | | (80,000 | ) | | | (3,500,000 | ) |
| CS Disco, Inc.* | | | (104,269 | ) | | | (1,881,013 | ) |
| Investments | | Shares | | | Value | |
| COMMON STOCKS (continued) | |
| | | | | | | | | |
| Software (continued) | |
| Descartes Systems Group, Inc. (The) (Canada)* | | | (20,000 | ) | | $ | (1,241,200 | ) |
| Elastic NV* | | | (30,000 | ) | | | (2,030,100 | ) |
| Enfusion, Inc., Class A* | | | (150,000 | ) | | | (1,531,500 | ) |
| Global-e Online Ltd. (Israel)* | | | (80,000 | ) | | | (1,613,600 | ) |
| Guidewire Software, Inc.* | | | (20,000 | ) | | | (1,419,800 | ) |
| Jamf Holding Corp.* | | | (50,000 | ) | | | (1,238,500 | ) |
| MicroStrategy, Inc., Class A* | | | (27,000 | ) | | | (4,436,100 | ) |
| nCino, Inc.* | | | (52,289 | ) | | | (1,616,776 | ) |
| Paycom Software, Inc.* | | | (8,000 | ) | | | (2,240,960 | ) |
| Paycor HCM, Inc.* | | | (50,000 | ) | | | (1,300,000 | ) |
| Procore Technologies, Inc.* | | | (20,000 | ) | | | (907,800 | ) |
| SentinelOne, Inc., Class A* | | | (101,000 | ) | | | (2,356,330 | ) |
| Snowflake, Inc., Class A* | | | (6,000 | ) | | | (834,360 | ) |
| Splunk, Inc.* | | | (30,000 | ) | | | (2,653,800 | ) |
| Sprout Social, Inc., Class A* | | | (30,000 | ) | | | (1,742,100 | ) |
| SPS Commerce, Inc.* | | | (10,000 | ) | | | (1,130,500 | ) |
| Total Software | | | | | | | (44,702,667 | ) |
| | | | | | | | | |
| Telecommunications — (2.4)% | |
| Telephone and Data Systems, Inc. | | | (100,000 | ) | | | (1,579,000 | ) |
| Ubiquiti, Inc. | | | (10,000 | ) | | | (2,482,100 | ) |
| Total Telecommunications | | | | | | | (4,061,100 | ) |
Total Common Stocks
(Cost $(171,514,117)) | | | | | | | (160,957,539 | ) |
| | | | | | | | | |
| Total Securities Sold, Not Yet Purchased [Proceeds Received $(171,514,117)] | | | | | | | (160,957,539 | ) |
| | | | | | | | | |
Total Investments — (10.9)%
(Cost $(28,102,076)) | | | | | | | (18,128,769 | ) |
| Other Assets in Excess of Liabilities — 110.9% | | | | | | | 184,313,512 | |
| Net Assets — 100.0% | | | | | | $ | 166,184,743 | |
ETF — Exchange Traded Fund
| * | Non-income producing security. |
| (a) | Represents a zero coupon bond. Rate shown reflects the effective yield. |
| (b) | Rate shown reflects the 7-day yield as of June 30, 2022. |
| (c) | A portion of this security has been pledged as collateral for securities sold, not yet purchased. |
| (d) | As of June 30, 2022 cash in the amount of $147,514,181 has been segregated as collateral from the broker for securities sold, not yet purchased. |
| (e) | American Depositary Receipt. |
See accompanying Notes to Financial Statements.
ADVISORSHARES RANGER EQUITY BEAR ETF
Schedule of Investments (continued)
June 30, 2022
Fair Value Measurements
The following is a summary of the inputs used, as of June 30, 2022, in valuing the Fund’s assets and liabilities carried at fair value. These inputs are summarized in three broad levels. Level 1 includes quoted prices in active markets for identical securities. Level 2 includes other significant observable inputs (including quoted prices for similar securities, interest rates, prepayment speeds and credit risk). Level 3 includes significant unobservable inputs (including the Fund’s own assumptions in determining the fair value of investments). The level assigned to the securities valuations may not be an indication of the risk or liquidity associated with investing in those securities.
| Assets | | Level 1 | | | Level 2 | | | Level 3 | | | Total | |
| U.S. Treasury Bills | | $ | — | | | $ | 58,721,277 | | | $ | — | | | $ | 58,721,277 | |
| Exchange Traded Fund | | | 19,476,000 | | | | — | | | | — | | | | 19,476,000 | |
| Money Market Funds | | | 64,631,493 | | | | — | | | | — | | | | 64,631,493 | |
| Total | | $ | 84,107,493 | | | $ | 58,721,277 | | | $ | — | | | $ | 142,828,770 | |
| Liabilities | | Level 1 | | | Level 2 | | | Level 3 | | | Total | |
| Common Stocks | | $ | (160,957,539 | ) | | $ | — | | | $ | — | | | $ | (160,957,539 | ) |
SUMMARY OF SCHEDULE OF INVESTMENTS
| | | % of
Net Assets | |
| Advertising | | | (1.1 | )% |
| Apparel | | | (1.3 | ) |
| Banks | | | (8.7 | ) |
| Commercial Services | | | (10.5 | ) |
| Computers | | | (5.5 | ) |
| Debt Fund | | | 11.7 | |
| Diversified Financial Services | | | (9.7 | ) |
| Electrical Components & Equipment | | | (4.9 | ) |
| Engineering & Construction | | | (1.2 | ) |
| Entertainment | | | (0.7 | ) |
| Food | | | (2.7 | ) |
| Food Service | | | (0.5 | ) |
| Home Furnishings | | | (3.0 | ) |
| Insurance | | | (0.8 | ) |
| Internet | | | (4.9 | ) |
| Media | | | (2.4 | ) |
| Miscellaneous Manufacturing | | | (1.6 | ) |
| Retail | | | (8.1 | ) |
| Software | | | (26.9 | ) |
| Sovereign | | | 35.4 | |
| Telecommunications | | | (2.4 | ) |
| Money Market Funds | | | 38.9 | |
| Total Investments | | | (10.9 | ) |
| Other Assets in Excess of Liabilities | | | 110.9 | |
| Net Assets | | | 100.0 | % |
See accompanying Notes to Financial Statements.
ADVISORSHARES RANGER EQUITY BEAR ETF
Schedule of Investments (continued)
June 30, 2022
Affiliated holdings are funds which are managed by the Trust or an affiliate of the Trust. Transactions with affiliated companies during the year ended June 30, 2022 were as follows:
| Affiliated Holding Name | | Value at 6/30/2021 | | | Purchases/ Additions | | | Sales/ Reductions | | | Realized Gain
(Loss) | | | Change in Unrealized Gain (Loss) | | | Number of Shares at 6/30/2022 | | | Value at 6/30/2022 | | | Dividend Income | |
| AdvisorShares North Square McKee Core Reserves ETF | | $ | 19,736,000 | | | $ | — | | | $ | — | | | $ | — | | | $ | (260,000 | ) | | | 200,000 | | | $ | 19,476,000 | | | $ | 107,670 | |
See accompanying Notes to Financial Statements.
ADVISORSHARES RESTAURANT ETF
Schedule of Investments
June 30, 2022
| Investments | |
Shares | | | Value | |
| COMMON STOCKS — 74.7% | |
| | | | | | | | | |
| Entertainment — 2.4% | |
| RCI Hospitality Holdings, Inc. | | | 1,350 | | | $ | 65,286 | |
| | | | | | | | | |
| Retail — 72.3% | |
| Arcos Dorados Holdings, Inc., Class A (Brazil) | | | 40,732 | | | | 274,534 | |
| BBQ Holdings, Inc.* | | | 19,708 | | | | 205,357 | |
| Bloomin’ Brands, Inc. | | | 7,000 | | | | 116,340 | |
| Carrols Restaurant Group, Inc. | | | 6,687 | | | | 13,508 | |
| Cheesecake Factory, Inc. (The) | | | 998 | | | | 26,367 | |
| Chipotle Mexican Grill, Inc.* | | | 74 | | | | 96,737 | |
| Chuy’s Holdings, Inc.* | | | 1,605 | | | | 31,972 | |
| Cracker Barrel Old Country Store, Inc. | | | 600 | | | | 50,094 | |
| Darden Restaurants, Inc. | | | 587 | | | | 66,401 | |
| Dave & Buster’s Entertainment, Inc.* | | | 3,667 | | | | 120,204 | |
| Denny’s Corp.* | | | 9,236 | | | | 80,169 | |
| Domino’s Pizza, Inc. | | | 67 | | | | 26,111 | |
| Dutch Bros, Inc., Class A*(a) | | | 9,048 | | | | 286,369 | |
| El Pollo Loco Holdings, Inc.* | | | 2,912 | | | | 28,654 | |
| Jack in the Box, Inc. | | | 1,313 | | | | 73,607 | |
| McDonald’s Corp. | | | 146 | | | | 36,045 | |
| ONE Group Hospitality, Inc. (The)* | | | 16,028 | | | | 118,126 | |
| Papa John’s International, Inc. | | | 576 | | | | 48,108 | |
| Restaurant Brands International, Inc. (Canada) | | | 611 | | | | 30,642 | |
| Shake Shack, Inc., Class A* | | | 601 | | | | 23,727 | |
| Starbucks Corp. | | | 281 | | | | 21,466 | |
| Sweetgreen, Inc., Class A*(a) | | | 2,636 | | | | 30,709 | |
| Texas Roadhouse, Inc. | | | 370 | | | | 27,084 | |
| Wendy’s Co. (The) | | | 3,696 | | | | 69,780 | |
| Total Retail | | | | | | | 1,902,111 | |
Total Common Stocks
(Cost $2,516,195) | | | | | | | 1,967,397 | |
| | | | | | | | | |
| MONEY MARKET FUND — 25.7% | |
BlackRock Liquidity Funds Treasury Trust Fund Portfolio, Institutional Class, 1.03%(b)
(Cost $674,847) | | | 674,847 | | | | 674,847 | |
| Investments | | Shares/
Principal | | | Value | |
| REPURCHASE AGREEMENTS — 11.4%(c) | |
| Citigroup Global Markets, Inc., dated 06/30/22, due 07/01/22, 1.50%, total to be received $50,885, (collateralized by various U.S. Government Agency Obligations, 1.88%-3.25%, 6/30/24-5/15/52, totaling $51,901) | | $ | 50,883 | | | $ | 50,883 | |
| RBC Dominion Securities, Inc., dated 06/30/22, due 07/01/22, 1.55%, total to be received $249,011, (collateralized by various U.S. Government Agency Obligations, 0.00%-6.88%, 8/16/22-5/20/52, totaling $253,980) | | | 249,000 | | | | 249,000 | |
Total Repurchase Agreements
(Cost $299,883) | | | | | | | 299,883 | |
| | | | | | | | | |
Total Investments — 111.8%
(Cost $3,490,925) | | | | | | | 2,942,127 | |
| Liabilities in Excess of Other Assets — (11.8%) | | | | | | | (311,281 | ) |
| Net Assets — 100.0% | | | $ | 2,630,846 | |
| * | Non-income producing security. |
| (a) | All or a portion of security is on loan. The aggregate market value of the securities on loan is $273,544; the aggregate market value of the collateral held by the fund is $299,883. |
| (b) | Rate shown reflects the 7-day yield as of June 30, 2022. |
| (c) | Collateral received from brokers for securities lending was invested in these short-term investments. |
See accompanying Notes to Financial Statements.
ADVISORSHARES RESTAURANT ETF
Schedule of Investments (continued)
June 30, 2022
Fair Value Measurements
The following is a summary of the inputs used, as of June 30, 2022, in valuing the Fund’s assets and liabilities carried at fair value. These inputs are summarized in three broad levels. Level 1 includes quoted prices in active markets for identical securities. Level 2 includes other significant observable inputs (including quoted prices for similar securities, interest rates, prepayment speeds and credit risk). Level 3 includes significant unobservable inputs (including the Fund’s own assumptions in determining the fair value of investments). The level assigned to the securities valuations may not be an indication of the risk or liquidity associated with investing in those securities.
| Assets | | Level 1 | | | Level 2 | | | Level 3 | | | Total | |
| Common Stocks | | $ | 1,967,397 | | | $ | — | | | $ | — | | | $ | 1,967,397 | |
| Money Market Fund | | | 674,847 | | | | — | | | | — | | | | 674,847 | |
| Repurchase Agreements | | | — | | | | 299,883 | | | | — | | | | 299,883 | |
| Total | | $ | 2,642,244 | | | $ | 299,883 | | | $ | — | | | $ | 2,942,127 | |
SUMMARY OF SCHEDULE OF INVESTMENTS
| | | % of
Net Assets | |
| Entertainment | | | 2.4 | % |
| Retail | | | 72.3 | |
| Money Market Fund | | | 25.7 | |
| Repurchase Agreements | | | 11.4 | |
| Total Investments | | | 111.8 | |
| Liabilities in Excess of Other Assets | | | (11.8 | ) |
| Net Assets | | | 100.0 | % |
See accompanying Notes to Financial Statements.
ADVISORSHARES STAR GLOBAL BUY-WRITE ETF
Schedule of Investments
June 30, 2022
| Investments | |
Shares | | | Value | |
| EXCHANGE TRADED FUNDS – 95.8% | |
| | | | | | | | | |
| Debt Fund — 26.8% | |
| iShares 10-20 Year Treasury Bond ETF | | | 6,252 | | | $ | 751,178 | |
| iShares Core Total USD Bond Market ETF(a)(b) | | | 100,386 | | | | 4,700,072 | |
| iShares TIPS Bond ETF | | | 16,030 | | | | 1,825,977 | |
| iShares U.S. Treasury Bond ETF | | | 116,090 | | | | 2,774,551 | |
| Total Debt Fund | | | | | | | 10,051,778 | |
| | | | | | | | | |
| Equity Fund — 69.0% | |
| iShares MSCI EAFE ETF | | | 74,802 | | | | 4,674,377 | |
| iShares MSCI Emerging Markets ETF | | | 37,122 | | | | 1,488,592 | |
| iShares Russell 2000 ETF(a) | | | 6,471 | | | | 1,095,929 | |
| iShares Russell Mid-Cap Growth ETF(a) | | | 30,095 | | | | 2,384,126 | |
| SPDR S&P 500 ETF Trust(b) | | | 41,158 | | | | 15,526,855 | |
| Vanguard High Dividend Yield ETF | | | 7,381 | | | | 750,648 | |
| Total Equity Fund | | | | | | | 25,920,527 | |
Total Exchange Traded Funds
(Cost $40,276,250) | | | | | | | 35,972,305 | |
| | | | | | | | | |
| MONEY MARKET FUNDS — 5.6% | |
| BlackRock Liquidity Funds T-Fund Portfolio, Institutional Class, 1.33%(c) | | | 1,610,156 | | | | 1,610,156 | |
| Goldman Sachs Financial Square Government Fund — Institutional Shares, Institutional Class, 1.36%(c)(d) | | | 477,000 | | | | 477,000 | |
Total Money Market Funds
(Cost $2,087,156) | | | | | | | 2,087,156 | |
| Investments | | Shares/
Principal | | | Value | |
| REPURCHASE AGREEMENTS — 2.3%(d) | |
| BofA Securities, Inc., dated 06/30/22, due 07/01/22, 1.55%, total to be received $315,488, (collateralized by various U.S. Government Agency Obligations, 1.00%-8.50%, 1/20/24-6/20/52, totaling $321,784) | | $ | 315,474 | | | $ | 315,474 | |
| Daiwa Capital Markets America, dated 06/30/22, due 07/01/22, 1.55%, total to be received $247,330, (collateralized by various U.S. Government Agency Obligations, 0.00%-6.50%, 7/31/22-7/1/52, totaling $252,265) | | | 247,319 | | | | 247,319 | |
| RBC Dominion Securities, Inc., dated 06/30/22, due 07/01/22, 1.55%, total to be received $315,488, (collateralized by various U.S. Government Agency Obligations, 0.00%-6.88%, 8/16/22-5/20/52, totaling $321,784) | | | 315,474 | | | | 315,474 | |
Total Repurchase Agreements
(Cost $878,267) | | | | | | | 878,267 | |
Total Investments Before Written Options — 103.7%
(Cost $43,241,673) | | | | | | | 38,937,728 | |
See accompanying Notes to Financial Statements.
ADVISORSHARES STAR GLOBAL BUY-WRITE ETF
Schedule of Investments (continued)
June 30, 2022
| Investments | | Notional
Amount | | | Contracts | | | Value | |
| WRITTEN CALL OPTION — (0.0)%** | |
SPDR S&P 500 ETF Trust, expiring 07/15/22, Strike Price $405.00
[Premium Received $(44,074)] | | $ | (14,175,000 | ) | | | (350 | ) | | $ | (15,925 | ) |
| | | | | | | | | | | | | |
Total Investments — 103.7%
(Cost $43,197,599) | | | | | | | | | | | 38,921,803 | |
| Liabilities in Excess of Other Assets — (3.7%) | | | | | | | | | | | (1,374,768 | ) |
| Net Assets — 100.0% | | | | | | | | | | $ | 37,547,035 | |
ETF — Exchange Traded Fund
TIPS — Treasury Inflation Protected Securities
| (a) | All or a portion of security is on loan. The aggregate market value of the securities on loan is $1,313,007; the aggregate market value of the collateral held by the fund is $1,355,267. |
| (b) | All or a portion of this security has been pledged as collateral for option contracts. The aggregate market value of the collateral was $2,180,199 as of June 30, 2022. |
| (c) | Rate shown reflects the 7-day yield as of June 30, 2022. |
| (d) | Collateral received from brokers for securities lending was invested in these short-term investments. |
See accompanying Notes to Financial Statements.
ADVISORSHARES STAR GLOBAL BUY-WRITE ETF
Schedule of Investments (continued)
June 30, 2022
Fair Value Measurements
The following is a summary of the inputs used, as of June 30, 2022, in valuing the Fund’s assets and liabilities carried at fair value. These inputs are summarized in three broad levels. Level 1 includes quoted prices in active markets for identical securities. Level 2 includes other significant observable inputs (including quoted prices for similar securities, interest rates, prepayment speeds and credit risk). Level 3 includes significant unobservable inputs (including the Fund’s own assumptions in determining the fair value of investments). The level assigned to the securities valuations may not be an indication of the risk or liquidity associated with investing in those securities.
| Assets | | Level 1 | | | Level 2 | | | Level 3 | | | Total | |
| Exchange Traded Funds | | $ | 35,972,305 | | | $ | — | | | $ | — | | | $ | 35,972,305 | |
| Money Market Funds | | | 2,087,156 | | | | — | | | | — | | | | 2,087,156 | |
| Repurchase Agreements | | | — | | | | 878,267 | | | | — | | | | 878,267 | |
| Total | | $ | 38,059,461 | | | $ | 878,267 | | | $ | — | | | $ | 38,937,728 | |
| Liabilities | | Level 1 | | | Level 2 | | | Level 3 | | | Total | |
| Written Call Option | | $ | (15,925 | ) | | $ | — | | | $ | — | | | $ | (15,925 | ) |
SUMMARY OF SCHEDULE OF INVESTMENTS
| | | % of
Net Assets | |
| Debt Fund | | | 26.8 | % |
| Equity Fund | | | 69.0 | |
| Written Call Option | | | (0.0 | )** |
| Money Market Funds | | | 5.6 | |
| Repurchase Agreements | | | 2.3 | |
| Total Investments | | | 103.7 | |
| Liabilities in Excess of Other Assets | | | (3.7 | ) |
| Net Assets | | | 100.0 | % |
See accompanying Notes to Financial Statements.
ADVISORSHARES VICE ETF
Schedule of Investments
June 30, 2022
| Investments | | Shares | | | Value | |
| COMMON STOCKS — 89.2% | |
| | | | | | | | | |
| Agriculture — 13.6% | |
| Altria Group, Inc. | | | 1,918 | | | $ | 80,115 | |
| British American Tobacco PLC (United Kingdom)(a) | | | 3,117 | | | | 133,750 | |
| Philip Morris International, Inc. | | | 1,166 | | | | 115,131 | |
| Turning Point Brands, Inc. | | | 14,114 | | | | 382,913 | |
| Universal Corp. | | | 3,964 | | | | 239,822 | |
| Vector Group Ltd. | | | 21,868 | | | | 229,614 | |
| Total Agriculture | | | | | | | 1,181,345 | |
| | | | | | | | | |
| Apparel — 2.8% | |
| LVMH Moet Hennessy Louis Vuitton SE (France)(a) | | | 2,001 | | | | 244,562 | |
| | | | | | | | | |
| Beverages — 25.0% | |
| Anheuser-Busch InBev SA/NV (Belgium)(a) | | | 1,894 | | | | 102,181 | |
| Boston Beer Co., Inc. (The), Class A* | | | 279 | | | | 84,529 | |
| Brown-Forman Corp., Class B | | | 1,205 | | | | 84,543 | |
| Constellation Brands, Inc., Class A | | | 923 | | | | 215,114 | |
Diageo PLC (United
Kingdom)(a) | | | 1,568 | | | | 273,020 | |
| Duckhorn Portfolio, Inc. (The)* | | | 20,004 | | | | 421,284 | |
| MGP Ingredients, Inc. | | | 5,592 | | | | 559,703 | |
| Molson Coors Beverage Co., Class B | | | 7,196 | | | | 392,254 | |
| Pernod Ricard SA (France)(a) | | | 1,170 | | | | 42,963 | |
| Total Beverages | | | | | | | 2,175,591 | |
| | | | | | | | | |
| Entertainment — 19.7% | |
| Caesars Entertainment, Inc.* | | | 3,539 | | | | 135,544 | |
| Everi Holdings, Inc.* | | | 32,608 | | | | 531,836 | |
| Monarch Casino & Resort, Inc.* | | | 5,566 | | | | 326,557 | |
| Penn National Gaming, Inc.* | | | 7,068 | | | | 215,008 | |
| RCI Hospitality Holdings, Inc. | | | 3,052 | | | | 147,595 | |
| Red Rock Resorts, Inc., Class A | | | 10,638 | | | | 354,884 | |
| Total Entertainment | | | | | | | 1,711,424 | |
| | | | | | | | | |
| Lodging — 6.3% | |
| Boyd Gaming Corp. | | | 8,071 | | | | 401,532 | |
| Full House Resorts, Inc.*(b) | | | 24,345 | | | | 148,018 | |
| Total Lodging | | | | | | | 549,550 | |
| Investments | | Shares | | | Value | |
| COMMON STOCKS (continued) | |
| | | | | | | | | |
| REITS — 7.0% | |
| Gaming and Leisure Properties, Inc. | | | 10,032 | | | $ | 460,068 | |
| VICI Properties, Inc.(b) | | | 5,000 | | | | 148,950 | |
| Total REITS | | | | | | | 609,018 | |
| | | | | | | | | |
| Retail — 8.0% | |
| Chuy’s Holdings, Inc.* | | | 3,963 | | | | 78,943 | |
| Dave & Buster’s Entertainment, Inc.* | | | 12,300 | | | | 403,194 | |
| Jack in the Box, Inc. | | | 2,594 | | | | 145,419 | |
| McDonald’s Corp. | | | 260 | | | | 64,189 | |
| Total Retail | | | | | | | 691,745 | |
| | | | | | | | | |
| Semiconductors — 4.1% | |
| NVIDIA Corp. | | | 2,364 | | | | 358,359 | |
| | | | | | | | | |
| Software — 2.7% | |
| Activision Blizzard, Inc. | | | 1,780 | | | | 138,591 | |
| Take-Two Interactive Software, Inc.* | | | 789 | | | | 96,676 | |
| Total Software | | | | | | | 235,267 | |
Total Common Stocks
(Cost $8,538,096) | | | | | | | 7,756,861 | |
| | | | | | | | | |
| MONEY MARKET FUND — 11.1% | |
BlackRock Liquidity Funds Treasury Trust Fund Portfolio, Institutional Class, 1.03%(c)
(Cost $961,362) | | | 961,362 | | | | 961,362 | |
| | | | | | | | | |
Total Investments — 100.3%
(Cost $9,499,458) | | | | | | | 8,718,223 | |
| Liabilities in Excess of Other Assets — (0.3%) | | | | | | | (23,664 | ) |
| Net Assets — 100.0% | | | | | | $ | 8,694,559 | |
PLC — Public Limited Company
REITS — Real Estate Investment Trusts
| * | Non-income producing security. |
| (a) | American Depositary Receipt. |
| (b) | All or a portion of security is on loan. The aggregate market value of the securities on loan is $219,527; the aggregate market value of the collateral held by the fund is $228,960. The aggregate market value of the collateral includes non-cash U.S. Treasury securities collateral having a value of $228,960. |
| (c) | Rate shown reflects the 7-day yield as of June 30, 2022. |
See accompanying Notes to Financial Statements.
ADVISORSHARES VICE ETF
Schedule of Investments (continued)
June 30, 2022
Fair Value Measurements
The following is a summary of the inputs used, as of June 30, 2022, in valuing the Fund’s assets and liabilities carried at fair value. These inputs are summarized in three broad levels. Level 1 includes quoted prices in active markets for identical securities. Level 2 includes other significant observable inputs (including quoted prices for similar securities, interest rates, prepayment speeds and credit risk). Level 3 includes significant unobservable inputs (including the Fund’s own assumptions in determining the fair value of investments). The level assigned to the securities valuations may not be an indication of the risk or liquidity associated with investing in those securities.
| Assets | | Level 1 | | | Level 2 | | | Level 3 | | | Total | |
| Common Stocks | | $ | 7,756,861 | | | $ | — | | | $ | — | | | $ | 7,756,861 | |
| Money Market Fund | | | 961,362 | | | | — | | | | — | | | | 961,362 | |
| Total | | $ | 8,718,223 | | | $ | — | | | $ | — | | | $ | 8,718,223 | |
SUMMARY OF SCHEDULE OF INVESTMENTS
| | | % of
Net Assets | |
| Agriculture | | | 13.6 | % |
| Apparel | | | 2.8 | |
| Beverages | | | 25.0 | |
| Entertainment | | | 19.7 | |
| Lodging | | | 6.3 | |
| REITS | | | 7.0 | |
| Retail | | | 8.0 | |
| Semiconductors | | | 4.1 | |
| Software | | | 2.7 | |
| Money Market Fund | | | 11.1 | |
| Total Investments | | | 100.3 | |
| Liabilities in Excess of Other Assets | | | (0.3 | ) |
| Net Assets | | | 100.0 | % |
See accompanying Notes to Financial Statements.
ADVISORSHARES TRUST
Statements of Assets and Liabilities
June 30, 2022
| | | AdvisorShares
Alpha DNA
Equity
Sentiment ETF | | | AdvisorShares
Dorsey Wright
ADR ETF | | | AdvisorShares
Dorsey Wright
Alpha Equal
Weight ETF | | | AdvisorShares
Dorsey Wright
FSM All Cap
World ETF | |
| ASSETS | | | | | | | | | | | | | | | | |
| Investments, at Cost | | $ | 56,673,531 | | | $ | 44,376,466 | | | $ | 44,480,349 | | | $ | 90,962,947 | |
| Repurchase Agreements, at Cost (Note 2) | | | 199,490 | | | | 8,234,577 | | | | — | | | | — | |
| Total Cost of Investments | | | 56,873,021 | | | | 52,611,043 | | | | 44,480,349 | | | | 90,962,947 | |
| Investments, at Market Value (including securities on loan) (Note 2)(a) | | | 50,609,947 | | | | 42,892,350 | | | | 42,717,429 | | | | 84,280,717 | |
| Repurchase Agreements, at Market Value (Note 2) | | | 199,490 | | | | 8,234,577 | | | | — | | | | — | |
| Total Market Value of Investments | | | 50,809,437 | | | | 51,126,927 | | | | 42,717,429 | | | | 84,280,717 | |
| Dividends and Interest Receivable | | | 39,886 | | | | 209,436 | | | | 39,853 | | | | 347 | |
| Receivable from Securities Sold | | | — | | | | 68,061 | | | | — | | | | — | |
| Reclaim Receivable | | | — | | | | 15,383 | | | | — | | | | — | |
| Prepaid Expenses | | | — | | | | 109 | | | | 328 | | | | 805 | |
| Total Assets | | | 50,849,323 | | | | 51,419,916 | | | | 42,757,610 | | | | 84,281,869 | |
| LIABILITIES | | | | | | | | | | | | | | | | |
| Cash collateral for securities on loan(b) | | | 199,490 | | | | 9,361,577 | | | | — | | | | — | |
| Advisory Fees Payable | | | 34,239 | | | | 20,221 | | | | 12,529 | | | | 38,815 | |
| Trustee Fees Payable | | | 8 | | | | — | | | | — | | | | — | |
| Due to Custodian | | | — | | | | 42,856 | | | | — | | | | — | |
| Accrued Expenses | | | 42,254 | | | | 57,442 | | | | 48,173 | | | | 66,378 | |
| Total Liabilities | | | 275,991 | | | | 9,482,096 | | | | 60,702 | | | | 105,193 | |
| NET ASSETS | | $ | 50,573,332 | | | $ | 41,937,820 | | | $ | 42,696,908 | | | $ | 84,176,676 | |
| COMPONENTS OF NET ASSETS | | | | | | | | | | | | | | | | |
| Capital Stock at Zero Par Value | | $ | 72,164,962 | | | $ | 94,179,627 | | | $ | 64,255,712 | | | $ | 109,059,637 | |
| Total Distributable Earnings/Accumulated (Loss) | | | (21,591,630 | ) | | | (52,241,807 | ) | | | (21,558,804 | ) | | | (24,882,961 | ) |
| NET ASSETS | | $ | 50,573,332 | | | $ | 41,937,820 | | | $ | 42,696,908 | | | $ | 84,176,676 | |
| SHARES ISSUED AND OUTSTANDING | | | | | | | | | | | | | | | | |
| Shares Outstanding (Unlimited Shares Authorized) | | | 2,430,000 | | | | 865,000 | | | | 2,060,000 | | | | 2,775,000 | |
| Net Asset Value (NAV) Per Share | | $ | 20.81 | | | $ | 48.48 | | | $ | 20.73 | | | $ | 30.33 | |
| | | | | | | | | | | | | | | | | |
| (a) Market value of securities on loan | | $ | 1,038,480 | | | $ | 9,038,711 | | | $ | — | | | $ | — | |
| (b) Non-cash collateral for securities on loan | | $ | 910,227 | | | $ | — | | | $ | — | | | $ | — | |
See accompanying Notes to Financial Statements.
ADVISORSHARES TRUST
Statements of Assets and Liabilities
June 30, 2022
| | | AdvisorShares
Dorsey Wright
FSM US
Core ETF | | | AdvisorShares
Dorsey Wright
Micro-Cap ETF | | | AdvisorShares
Dorsey Wright
Short ETF | | | AdvisorShares
DoubleLine Value
Equity ETF | |
| ASSETS | | | | | | | | | | | | | | | | |
| Investments, at Cost | | $ | 89,700,151 | | | $ | 7,717,782 | | | $ | 37,855,278 | | | $ | 45,110,055 | |
| Investments in Affiliates, at Cost (Note 8) | | | — | | | | — | | | | 9,862,980 | | | | — | |
| Repurchase Agreements, at Cost (Note 2) | | | 27,461,888 | | | | 287,973 | | | | — | | | | — | |
| Total Cost of Investments | | | 117,162,039 | | | | 8,005,755 | | | | 47,718,258 | | | | 45,110,055 | |
| Investments, at Market Value (including securities on loan) (Note 2)(a) | | | 82,642,791 | | | | 7,397,005 | | | | 37,855,278 | | | | 46,376,425 | |
| Investments in Affiliates, at Market Value (Note 8) | | | — | | | | — | | | | 9,738,000 | | | | — | |
| Repurchase Agreements, at Market Value (Note 2) | | | 27,461,888 | | | | 287,973 | | | | — | | | | — | |
| Total Market Value of Investments | | | 110,104,679 | | | | 7,684,978 | | | | 47,593,278 | | | | 46,376,425 | |
| Cash | | | 279 | | | | 280 | | | | — | | | | — | |
| Cash collateral held at brokers | | | — | | | | — | | | | 38,725,679 | | | | — | |
| Dividends and Interest Receivable | | | 6,698 | | | | 8,179 | | | | 54,088 | | | | 66,414 | |
| Receivable from Securities Sold | | | — | | | | — | | | | 7,795,477 | | | | — | |
| Capital Shares Receivable | | | — | | | | — | | | | 833,491 | | | | — | |
| Reclaim Receivable | | | — | | | | — | | | | — | | | | 8,991 | |
| Due from Investment Advisor | | | — | | | | 5,631 | | | | — | | | | — | |
| Prepaid Expenses | | | 482 | | | | 6 | | | | 444 | | | | 132 | |
| Total Assets | | | 110,112,138 | | | | 7,699,074 | | | | 95,002,457 | | | | 46,451,962 | |
| LIABILITIES | | | | | | | | | | | | | | | | |
| Cash collateral for securities on loan | | | 30,258,888 | | | | 287,973 | | | | — | | | | — | |
| Advisory Fees Payable | | | 34,383 | | | | — | | | | 28,338 | | | | 27,381 | |
| Securities Sold, Not Yet Purchased(b) | | | — | | | | — | | | | 45,594,721 | | | | — | |
| Payable for Securities Purchased | | | — | | | | — | | | | 2,288,790 | | | | — | |
| CCO Fees Payable | | | — | | | | — | | | | 1,591 | | | | — | |
| Dividend Payable on Securities Sold, Not Yet Purchased | | | — | | | | — | | | | 18,262 | | | | — | |
| Accrued Expenses | | | 55,339 | | | | 35,557 | | | | 71,496 | | | | 46,401 | |
| Total Liabilities | | | 30,348,610 | | | | 323,530 | | | | 48,003,198 | | | | 73,782 | |
| NET ASSETS | | $ | 79,763,528 | | | $ | 7,375,544 | | | $ | 46,999,259 | | | $ | 46,378,180 | |
| COMPONENTS OF NET ASSETS | | | | | | | | | | | | | | | | |
| Capital Stock at Zero Par Value | | $ | 88,203,380 | | | $ | 9,751,709 | | | $ | 124,810,552 | | | $ | 68,785,686 | |
| Total Distributable Earnings/Accumulated (Loss) | | | (8,439,852 | ) | | | (2,376,165 | ) | | | (77,811,293 | ) | | | (22,407,506 | ) |
| NET ASSETS | | $ | 79,763,528 | | | $ | 7,375,544 | | | $ | 46,999,259 | | | $ | 46,378,180 | |
| SHARES ISSUED AND OUTSTANDING | | | | | | | | | | | | | | | | |
| Shares Outstanding (Unlimited Shares Authorized) | | | 2,480,000 | | | | 245,000 | | | | 4,480,000 | | | | 540,000 | |
| Net Asset Value (NAV) Per Share | | $ | 32.16 | | | $ | 30.10 | | | $ | 10.49 | | | $ | 85.89 | |
| | | | | | | | | | | | | | | | | |
| (a) Market value of securities on loan | | $ | 29,423,216 | | | $ | 280,489 | | | $ | — | | | $ | — | |
| (b) Proceeds Received from Securities Sold, Not Yet Purchased | | $ | — | | | $ | — | | | $ | 57,291,239 | | | $ | — | |
See accompanying Notes to Financial Statements.
ADVISORSHARES TRUST
Statements of Assets and Liabilities
June 30, 2022
| | | AdvisorShares
Drone Technology
ETF | | | AdvisorShares
Focused Equity ETF | | | AdvisorShares
Gerber Kawasaki
ETF | | | AdvisorShares
Hotel ETF | |
| ASSETS | | | | | | | | | | | | | | | | |
| Investments, at Cost | | $ | 577,000 | | | $ | 26,275,905 | | | $ | 21,836,151 | | | $ | 7,491,432 | |
| Repurchase Agreements, at Cost (Note 2) | | | 84,530 | | | | — | | | | 1,370,745 | | | | 185,289 | |
| Total Cost of Investments | | | 661,530 | | | | 26,275,905 | | | | 23,206,896 | | | | 7,676,721 | |
| Investments, at Market Value (including securities on loan) (Note 2)(a) | | | 500,044 | | | | 28,120,847 | | | | 15,885,237 | | | | 5,916,652 | |
| Repurchase Agreements, at Market Value (Note 2) | | | 84,530 | | | | — | | | | 1,370,745 | | | | 185,289 | |
| Total Market Value of Investments | | | 584,574 | | | | 28,120,847 | | | | 17,255,982 | | | | 6,101,941 | |
| Dividends and Interest Receivable | | | 1,839 | | | | 15,044 | | | | 17,177 | | | | 5,445 | |
| Due from Investment Advisor | | | 41,265 | | | | 2,566 | | | | 9,511 | | | | — | |
| Prepaid Organizational Fees | | | 14,184 | | | | — | | | | — | | | | — | |
| Prepaid Expenses | | | — | | | | — | | | | 13 | | | | 5 | |
| Total Assets | | | 641,862 | | | | 28,138,457 | | | | 17,282,683 | | | | 6,107,391 | |
| LIABILITIES | | | | | | | | | | | | | | | | |
| Cash collateral for securities on loan(b) | | | 84,530 | | | | — | | | | 1,370,745 | | | | 185,289 | |
| Advisory Fees Payable | | | — | | | | — | | | | — | | | | 1,501 | |
| Trustee Fees Payable | | | 1 | | | | 69 | | | | — | | | | — | |
| Payable for Securities Purchased | | | — | | | | — | | | | 40,645 | | | | — | |
| CCO Fees Payable | | | 11 | | | | — | | | | 8 | | | | 141 | |
| Accrued Expenses | | | 6,402 | | | | 40,427 | | | | 25,058 | | | | 23,509 | |
| Total Liabilities | | | 90,944 | | | | 40,496 | | | | 1,436,456 | | | | 210,440 | |
| NET ASSETS | | $ | 550,918 | | | $ | 28,097,961 | | | $ | 15,846,227 | | | $ | 5,896,951 | |
| COMPONENTS OF NET ASSETS | | | | | | | | | | | | | | | | |
| Capital Stock at Zero Par Value | | $ | 625,000 | | | $ | 26,659,155 | | | $ | 25,705,567 | | | $ | 7,896,819 | |
| Total Distributable Earnings/Accumulated (Loss) | | | (74,082 | ) | | | 1,438,806 | | | | (9,859,340 | ) | | | (1,999,868 | ) |
| NET ASSETS | | $ | 550,918 | | | $ | 28,097,961 | | | $ | 15,846,227 | | | $ | 5,896,951 | |
| SHARES ISSUED AND OUTSTANDING | | | | | | | | | | | | | | | | |
| Shares Outstanding (Unlimited Shares Authorized) | | | 25,000 | | | | 665,000 | | | | 970,000 | | | | 300,000 | |
| Net Asset Value (NAV) Per Share | | $ | 22.04 | | | $ | 42.25 | | | $ | 16.34 | | | $ | 19.66 | |
| | | | | | | | | | | | | | | | | |
| (a) Market value of securities on loan | | $ | 81,880 | | | $ | — | | | $ | 1,208,027 | | | $ | 265,924 | |
| (b) Non-cash collateral for securities on loan | | $ | — | | | $ | — | | | $ | 21,378 | | | $ | 90,638 | |
See accompanying Notes to Financial Statements.
ADVISORSHARES TRUST
Statements of Assets and Liabilities
June 30, 2022
| | | AdvisorShares
Let Bob AI
Powered
Momentum ETF | | | AdvisorShares
Managed Bitcoin
Strategy
ETF | | | AdvisorShares
Newfleet
Multi-Sector
Income ETF | | | AdvisorShares
North Square
McKee Core
Reserves ETF(1) | |
| ASSETS | | | | | | | | | | | | | | | | |
| Investments, at Cost | | $ | 24,259,178 | | | $ | 635,214 | | | $ | 88,987,593 | | | $ | 36,510,855 | |
| Repurchase Agreements, at Cost (Note 2) | | | — | | | | — | | | | 239,245 | | | | — | |
| Total Cost of Investments | | | 24,259,178 | | | | 635,214 | | | | 89,226,838 | | | | 36,510,855 | |
| Investments, at Market Value (including securities on loan) (Note 2)(a) | | | 24,168,785 | | | | 499,884 | | | | 83,798,984 | | | | 36,152,032 | |
| Repurchase Agreements, at Market Value (Note 2) | | | — | | | | — | | | | 239,245 | | | | — | |
| Total Market Value of Investments | | | 24,168,785 | | | | 499,884 | | | | 84,038,229 | | | | 36,152,032 | |
| Cash | | | 981,200 | | | | 225,799 | | | | 32,969 | | | | 961,430 | |
| Dividends and Interest Receivable | | | 14,859 | | | | 775 | | | | 288,603 | | | | 121,191 | |
| Receivable from Securities Sold | | | — | | | | — | | | | 885,389 | | | | — | |
| Due from Investment Advisor | | | 7,203 | | | | 807 | | | | — | | | | 5,244 | |
| Prepaid Organizational Fees | | | 11,316 | | | | 80,269 | | | | — | | | | — | |
| Prepaid Expenses | | | 19 | | | | — | | | | 410 | | | | 429 | |
| Total Assets | | | 25,183,382 | | | | 807,534 | | | | 85,245,600 | | | | 37,240,326 | |
| LIABILITIES | | | | | | | | | | | | | | | | |
| Cash collateral for securities on loan(b) | | | — | | | | — | | | | 239,245 | | | | — | |
| Advisory Fees Payable | | | — | | | | — | | | | 21,439 | | | | — | |
| Trustee Fees Payable | | | — | | | | 1 | | | | — | | | | — | |
| Payable for Securities Purchased | | | 981,200 | | | | 283,512 | | | | 1,230,782 | | | | 2,110,103 | |
| CCO Fees Payable | | | 131 | | | | 3 | | | | — | | | | — | |
| Accrued Expenses | | | 18,736 | | | | 7,289 | | | | 72,534 | | | | 43,562 | |
| Total Liabilities | | | 1,000,067 | | | | 290,805 | | | | 1,564,000 | | | | 2,153,665 | |
| NET ASSETS | | $ | 24,183,315 | | | $ | 516,729 | | | $ | 83,681,600 | | | $ | 35,086,661 | |
| COMPONENTS OF NET ASSETS | | | | | | | | | | | | | | | | |
| Capital Stock at Zero Par Value | | $ | 25,935,550 | | | $ | 685,894 | | | $ | 97,390,323 | | | $ | 36,469,329 | |
| Total Distributable Earnings/Accumulated (Loss) | | | (1,752,235 | ) | | | (169,165 | ) | | | (13,708,723 | ) | | | (1,382,668 | ) |
| NET ASSETS | | $ | 24,183,315 | | | $ | 516,729 | | | $ | 83,681,600 | | | $ | 35,086,661 | |
| SHARES ISSUED AND OUTSTANDING | | | | | | | | | | | | | | | | |
| Shares Outstanding (Unlimited Shares Authorized) | | | 1,040,000 | | | | 35,000 | | | | 1,835,000 | | | | 360,000 | |
| Net Asset Value (NAV) Per Share | | $ | 23.25 | | | $ | 14.76 | | | $ | 45.60 | | | $ | 97.46 | |
| | | | | | | | | | | | | | | | | |
| (a) Market value of securities on loan | | $ | — | | | $ | — | | | $ | 883,186 | | | $ | — | |
| (b) Non-cash collateral for securities on loan | | $ | — | | | $ | — | | | $ | 666,612 | | | $ | — | |
| (1) | Formerly known as AdvisorShares Sage Core Reserves ETF. |
See accompanying Notes to Financial Statements.
ADVISORSHARES TRUST
Statements of Assets and Liabilities
June 30, 2022
| | | AdvisorShares
North Square
McKee
ESG Core
Bond ETF(1) | | | AdvisorShares
Poseidon
Dynamic
Cannabis ETF | | | AdvisorShares
Psychedelics
ETF | | | AdvisorShares
Pure Cannabis
ETF | |
| ASSETS | | | | | | | | | | | | | | | | |
| Investments, at Cost | | $ | 3,651,135 | | | $ | 6,828,260 | | | $ | 11,758,394 | | | $ | 111,741,414 | |
| Investments in Affiliates, at Cost (Note 8) | | | — | | | | — | | | | — | | | | 118,651,044 | |
| Repurchase Agreements, at Cost (Note 2) | | | — | | | | 38,852 | | | | 954,429 | | | | 8,041,929 | |
| Total Cost of Investments | | | 3,651,135 | | | | 6,867,112 | | | | 12,712,823 | | | | 238,434,387 | |
| Investments, at Market Value (including securities on loan) (Note 2)(a) | | | 3,330,698 | | | | 6,692,128 | | | | 5,237,484 | | | | 30,774,072 | |
| Investments in Affiliates, at Market Value (Note 8) | | | — | | | | — | | | | — | | | | 37,367,559 | |
| Repurchase Agreements, at Market Value (Note 2) | | | — | | | | 38,852 | | | | 954,429 | | | | 8,041,929 | |
| Total Market Value of Investments | | | 3,330,698 | | | | 6,730,980 | | | | 6,191,913 | | | | 76,183,560 | |
| Cash | | | — | | | | 12,000 | | | | — | | | | 387,500 | |
| Foreign currency(b) | | | — | | | | — | | | | — | | | | 209,012 | |
| Cash collateral held at brokers | | | 1,340 | | | | — | | | | — | | | | — | |
| Dividends and Interest Receivable | | | 19,114 | | | | 1,961 | | | | 3,662 | | | | 167,871 | |
| Receivable from Securities Sold | | | — | | | | 152,057 | | | | — | | | | — | |
| Due from Investment Advisor | | | 18,154 | | | | 6,764 | | | | 19,054 | | | | 34,337 | |
| OTC Swaps Contracts | | | — | | | | — | | | | 701,425 | | | | 25,850,701 | |
| Prepaid Organizational Fees | | | — | | | | 25,919 | | | | 61,580 | | | | — | |
| Prepaid Expenses | | | 19 | | | | 5,732 | | | | 4 | | | | 1,352 | |
| Total Assets | | | 3,369,325 | | | | 6,935,413 | | | | 6,977,638 | | | | 102,834,333 | |
| LIABILITIES | | | | | | | | | | | | | | | | |
| Unrealized Depreciation on OTC Swap Contracts | | | — | | | | 11,562 | | | | 493,154 | | | | 21,822,874 | |
| Cash collateral for securities on loan(c) | | | — | | | | 50,852 | | | | 954,429 | | | | 8,759,929 | |
| Trustee Fees Payable | | | 3 | | | | — | | | | — | | | | — | |
| Payable for Securities Purchased | | | — | | | | 6,855 | | | | — | | | | 387,500 | |
| Capital Shares Payable | | | — | | | | 552,381 | | | | — | | | | — | |
| CCO Fees Payable | | | 13 | | | | 239 | | | | 10 | | | | — | |
| Due to Broker | | | — | | | | 1,929,997 | | | | — | | | | — | |
| Accrued Expenses | | | 36,212 | | | | 26,752 | | | | 21,341 | | | | 47,478 | |
| Total Liabilities | | | 36,228 | | | | 2,578,638 | | | | 1,468,934 | | | | 31,017,781 | |
| NET ASSETS | | $ | 3,333,097 | | | $ | 4,356,775 | | | $ | 5,508,704 | | | $ | 71,816,552 | |
| COMPONENTS OF NET ASSETS | | | | | | | | | | | | | | | | |
| Capital Stock at Zero Par Value | | $ | 4,681,181 | | | $ | 13,246,799 | | | $ | 14,000,202 | | | $ | 314,066,496 | |
| Total Distributable Earnings/Accumulated (Loss) | | | (1,348,084 | ) | | | (8,890,024 | ) | | | (8,491,498 | ) | | | (242,249,944 | ) |
| NET ASSETS | | $ | 3,333,097 | | | $ | 4,356,775 | | | $ | 5,508,704 | | | $ | 71,816,552 | |
| SHARES ISSUED AND OUTSTANDING | | | | | | | | | | | | | | | | |
| Shares Outstanding (Unlimited Shares Authorized) | | | 145,000 | | | | 1,780,000 | | | | 2,155,000 | | | | 13,605,000 | |
| Net Asset Value (NAV) Per Share | | $ | 22.99 | | | $ | 2.45 | | | $ | 2.56 | | | $ | 5.28 | |
| | | | | | | | | | | | | | | | | |
| (a) Market value of securities on loan | | $ | 25,416 | | | $ | 51,854 | | | $ | 587,365 | | | $ | 8,809,100 | |
| (b) Foreign currency at cost | | $ | — | | | $ | — | | | $ | — | | | $ | 209,886 | |
| (c) Non-cash collateral for securities on loan | | $ | 26,075 | | | $ | — | | | $ | — | | | $ | 1,687,574 | |
| (1) | Formerly known as AdvisorShares FolioBeyond Smart Core Bond ETF. |
See accompanying Notes to Financial Statements.
ADVISORSHARES TRUST
Statements of Assets and Liabilities
June 30, 2022
| | | AdvisorShares
Pure US
Cannabis ETF | | | AdvisorShares
Q Dynamic
Growth ETF | | | AdvisorShares
Q Portfolio Blended
Allocation ETF | | | AdvisorShares
Ranger Equity
Bear ETF | |
| ASSETS | | | | | | | | | | | | | | | | |
| Investments, at Cost | | $ | 541,850,101 | | | $ | 50,579,426 | | | $ | 3,065,664 | | | $ | 123,526,041 | |
| Investments in Affiliates, at Cost (Note 8) | | | 88,256,577 | | | | — | | | | — | | | | 19,886,000 | |
| Repurchase Agreements, at Cost (Note 2) | | | 1,088,492 | | | | — | | | | 1,144,635 | | | | — | |
| Total Cost of Investments | | | 631,195,170 | | | | 50,579,426 | | | | 4,210,299 | | | | 143,412,041 | |
| Investments, at Market Value (including securities on loan) (Note 2)(a) | | | 460,155,780 | | | | 40,329,158 | | | | 2,694,807 | | | | 123,352,770 | |
| Investments in Affiliates, at Market Value (Note 8) | | | 19,628,201 | | | | — | | | | — | | | | 19,476,000 | |
| Repurchase Agreements, at Market Value (Note 2) | | | 1,088,492 | | | | — | | | | 1,144,635 | | | | — | |
| Total Market Value of Investments | | | 480,872,473 | | | | 40,329,158 | | | | 3,839,442 | | | | 142,828,770 | |
| Cash | | | — | | | | — | | | | — | | | | 147,514,181 | |
| Cash collateral held at brokers | | | 7,170,000 | | | | — | | | | — | | | | — | |
| Unrealized Appreciation on OTC Swaps Contracts | | | 30,906 | | | | — | | | | — | | | | — | |
| Dividends and Interest Receivable | | | 676,274 | | | | 32,940 | | | | 1,356 | | | | 127,802 | |
| Receivable from Securities Sold | | | 158,750 | | | | — | | | | — | | | | 33,227,611 | |
| Capital Shares Receivable | | | — | | | | — | | | | — | | | | 3,737,590 | |
| Due from Investment Advisor | | | — | | | | — | | | | 15,085 | | | | — | |
| Premiums paid on OTC Swaps Contracts | | | 528,541,688 | | | | — | | | | — | | | | — | |
| Prepaid Expenses | | | — | | | | — | | | | — | | | | 458 | |
| Total Assets | | | 1,017,450,091 | | | | 40,362,098 | | | | 3,855,883 | | | | 327,436,412 | |
| LIABILITIES | | | | | | | | | | | | | | | | |
| Unrealized Depreciation on OTC Swaps Contracts | | | 387,333,508 | | | | — | | | | — | | | | — | |
| Cash collateral for securities on loan(b) | | | 1,088,492 | | | | — | | | | 1,144,635 | | | | — | |
| Advisory Fees Payable | | | 199,988 | | | | 30,615 | | | | — | | | | 182,805 | |
| Trustee Fees Payable | | | 283 | | | | — | | | | — | | | | — | |
| Securities Sold, Not Yet Purchased(c) | | | — | | | | — | | | | — | | | | 160,957,539 | |
| Capital Shares Payable | | | 1,927,440 | | | | — | | | | — | | | | — | |
| CCO Fees Payable | | | — | | | | 58 | | | | 2 | | | | — | |
| Due to Custodian - Foreign Currency | | | 28 | | | | — | | | | — | | | | — | |
| Due to Broker | | | 111,920,941 | | | | — | | | | — | | | | — | |
| Dividend Payable on Securities Sold, Not Yet Purchased | | | — | | | | — | | | | — | | | | 56,066 | |
| Accrued Expenses | | | 288,389 | | | | 32,392 | | | | 33,392 | | | | 55,259 | |
| Total Liabilities | | | 502,759,069 | | | | 63,065 | | | | 1,178,029 | | | | 161,251,669 | |
| NET ASSETS | | $ | 514,691,022 | | | $ | 40,299,033 | | | $ | 2,677,854 | | | $ | 166,184,743 | |
| COMPONENTS OF NET ASSETS | | | | | | | | | | | | | | | | |
| Capital Stock at Zero Par Value | | $ | 1,769,170,164 | | | $ | 55,824,260 | | | $ | 3,858,802 | | | $ | 500,800,057 | |
| Total Distributable Earnings/Accumulated (Loss) | | | (1,254,479,142 | ) | | | (15,525,227 | ) | | | (1,180,948 | ) | | | (334,615,314 | ) |
| NET ASSETS | | $ | 514,691,022 | | | $ | 40,299,033 | | | $ | 2,677,854 | | | $ | 166,184,743 | |
| SHARES ISSUED AND OUTSTANDING | | | | | | | | | | | | | | | | |
| Shares Outstanding (Unlimited Shares Authorized) | | | 49,740,000 | | | | 1,830,000 | | | | 130,000 | | | | 5,217,500 | |
| Net Asset Value (NAV) Per Share | | $ | 10.35 | | | $ | 22.02 | | | $ | 20.60 | | | $ | 31.85 | |
| | | | | | | | | | | | | | | | | |
| (a) Market value of securities on loan | | $ | 1,123,353 | | | $ | — | | | $ | 1,126,295 | | | $ | — | |
| (b) Non-cash collateral for securities on loan | | $ | 89,764 | | | $ | — | | | $ | — | | | $ | — | |
| (c) Proceeds Received from Securities Sold, Not Yet Purchased | | $ | — | | | $ | — | | | $ | — | | | $ | 171,514,117 | |
See accompanying Notes to Financial Statements.
ADVISORSHARES TRUST
Statements of Assets and Liabilities
June 30, 2022
| | | AdvisorShares
Restaurant
ETF | | | AdvisorShares
STAR Global Buy-
Write ETF | | | AdvisorShares
Vice ETF | |
| ASSETS | | | | | | | | | | | | |
| Investments, at Cost | | $ | 3,191,042 | | | $ | 42,363,406 | | | $ | 9,499,458 | |
| Repurchase Agreements, at Cost (Note 2) | | | 299,883 | | | | 878,267 | | | | — | |
| Total Cost of Investments | | | 3,490,925 | | | | 43,241,673 | | | | 9,499,458 | |
| Investments, at Market Value (including securities on loan) (Note 2)(a) | | | 2,642,244 | | | | 38,059,461 | | | | 8,718,223 | |
| Repurchase Agreements, at Market Value (Note 2) | | | 299,883 | | | | 878,267 | | | | — | |
| Total Market Value of Investments | | | 2,942,127 | | | | 38,937,728 | | | | 8,718,223 | |
| Dividends and Interest Receivable | | | 11,396 | | | | 67,433 | | | | 8,118 | |
| Reclaim Receivable | | | 33 | | | | — | | | | 1,513 | |
| Due from Investment Advisor | | | 2,552 | | | | — | | | | 1,620 | |
| Prepaid Expenses | | | — | | | | 99 | | | | 121 | |
| Total Assets | | | 2,956,108 | | | | 39,005,260 | | | | 8,729,595 | |
| LIABILITIES | | | | | | | | | | | | |
| Cash collateral for securities on loan(b) | | | 299,883 | | | | 1,355,267 | | | | — | |
| Advisory Fees Payable | | | — | | | | 39,131 | | | | — | |
| Trustee Fees Payable | | | 168 | | | | — | | | | — | |
| Options Written, at value(c) | | | — | | | | 15,925 | | | | — | |
| Due to Broker | | | — | | | | 11,798 | | | | — | |
| Accrued Expenses | | | 25,211 | | | | 36,104 | | | | 35,036 | |
| Total Liabilities | | | 325,262 | | | | 1,458,225 | | | | 35,036 | |
| NET ASSETS | | $ | 2,630,846 | | | $ | 37,547,035 | | | $ | 8,694,559 | |
| COMPONENTS OF NET ASSETS | | | | | | | | | | | | |
| Capital Stock at Zero Par Value | | $ | 4,007,007 | | | $ | 41,618,091 | | | $ | 10,018,252 | |
| Total Distributable Earnings/Accumulated (Loss) | | | (1,376,161 | ) | | | (4,071,056 | ) | | | (1,323,693 | ) |
| NET ASSETS | | $ | 2,630,846 | | | $ | 37,547,035 | | | $ | 8,694,559 | |
| SHARES ISSUED AND OUTSTANDING | | | | | | | | | | | | |
| Shares Outstanding (Unlimited Shares Authorized) | | | 155,000 | | | | 1,085,000 | | | | 345,000 | |
| Net Asset Value (NAV) Per Share | | $ | 16.97 | | | $ | 34.61 | | | $ | 25.20 | |
| | | | | | | | | | | | | |
| (a) Market value of securities on loan | | $ | 273,544 | | | $ | 1,313,007 | | | $ | 219,527 | |
| (b) Non-cash collateral for securities on loan | | $ | — | | | $ | — | | | $ | 228,960 | |
| (c) Premiums received for options written | | $ | — | | | $ | 44,074 | | | $ | — | |
See accompanying Notes to Financial Statements.
ADVISORSHARES TRUST
Statements of Operations
Year Ended June 30, 2022
| | | AdvisorShares
Alpha DNA Equity
Sentiment ETF | | | AdvisorShares
Dorsey Wright
ADR ETF | | | AdvisorShares
Dorsey Wright
Alpha Equal
Weight ETF | | | AdvisorShares
Dorsey Wright
FSM All Cap
World ETF | |
| INVESTMENT INCOME: | | | | | | | | | | | | | | | | |
| Dividend Income | | $ | 617,853 | | | $ | 2,551,129 | | | $ | 608,653 | | | $ | 1,137,453 | |
| Securities lending income (net) (Note 2) | | | 18,832 | | | | 61,959 | | | | 2,241 | | | | 71,036 | |
| Foreign withholding tax | | | (1,422 | ) | | | (111,801 | ) | | | — | | | | — | |
| Total Investment Income | | | 635,263 | | | | 2,501,287 | | | | 610,894 | | | | 1,208,489 | |
| | | | | | | | | | | | | | | | | |
| EXPENSES: | | | | | | | | | | | | | | | | |
| Advisory Fees | | | 523,383 | | | | 524,696 | | | | 507,003 | | | | 976,255 | |
| Accounting & Administration Fees | | | 43,522 | | | | 93,023 | | | | 75,265 | | | | 92,441 | |
| Professional Fees | | | 35,090 | | | | 25,588 | | | | 33,937 | | | | 49,732 | |
| Exchange Listing Fees | | | 8,010 | | | | 6,908 | | | | 4,611 | | | | 7,626 | |
| Custody Fees | | | 18,748 | | | | 6,870 | | | | 10,160 | | | | 12,534 | |
| Report to Shareholders | | | 12,979 | | | | 26,982 | | | | 16,757 | | | | 36,334 | |
| Trustee Fees | | | 5,795 | | | | 5,799 | | | | 5,783 | | | | 6,050 | |
| CCO Fees | | | 3,428 | | | | 4,616 | | | | 4,606 | | | | 8,852 | |
| Pricing Fees | | | — | | | | 294 | | | | 4,041 | | | | 8,457 | |
| Transfer Agent Fees | | | 5,164 | | | | 5,247 | | | | 5,067 | | | | 9,762 | |
| Insurance Fees | | | 1,489 | | | | 1,055 | | | | 1,807 | | | | 4,303 | |
| Registration Fees | | | 4,543 | | | | — | | | | 1,708 | | | | 3,706 | |
| Organizational Fees | | | 9,165 | | | | — | | | | — | | | | — | |
| Miscellaneous Fees | | | 3,551 | | | | 1,654 | | | | 3,275 | | | | 4,702 | |
| Total Expenses | | | 674,867 | | | | 702,732 | | | | 674,020 | | | | 1,220,754 | |
| Advisory Fees Waived/Recoupment | | | — | | | | (12,898 | ) | | | (43,933 | ) | | | (32,530 | ) |
| Net Expenses | | | 674,867 | | | | 689,834 | | | | 630,087 | | | | 1,188,224 | |
| Net Investment Income (Loss) | | | (39,604 | ) | | | 1,811,453 | | | | (19,193 | ) | | | 20,265 | |
| | | | | | | | | | | | | | | | | |
| REALIZED AND UNREALIZED GAIN (LOSS) ON: | | | | | | | | | | | | | | | | |
| Net Realized Gain (Loss) on: | | | | | | | | | | | | | | | | |
| Investments | | | (16,115,829 | ) | | | (2,650,479 | ) | | | (19,138,892 | ) | | | (18,232,522 | ) |
| In-Kind Redemptions | | | 4,874,586 | | | | 4,540,198 | | | | 4,031,025 | | | | 1,226,654 | |
| Purchased Options | | | 1,566,321 | | | | — | | | | — | | | | — | |
| Net Change in Unrealized Appreciation (Depreciation) on: | | | | | | | | | | | | | | | | |
| Investments | | | (8,507,113 | ) | | | (20,545,915 | ) | | | (2,397,719 | ) | | | (2,715,526 | ) |
| Net Realized and Unrealized Gain (Loss) | | | (18,182,035 | ) | | | (18,656,196 | ) | | | (17,505,586 | ) | | | (19,721,394 | ) |
| NET INCREASE (DECREASE) IN NET ASSETS RESULTING FROM OPERATIONS | | $ | (18,221,639 | ) | | $ | (16,844,743 | ) | | $ | (17,524,779 | ) | | $ | (19,701,129 | ) |
See accompanying Notes to Financial Statements.
ADVISORSHARES TRUST
Statements of Operations
Year Ended June 30, 2022
| | | AdvisorShares
Dorsey
Wright FSM
US Core ETF | | | AdvisorShares
Dorsey Wright
Micro-Cap
ETF | | | AdvisorShares
Dorsey Wright
Short ETF | | | AdvisorShares
DoubleLine Value
Equity ETF | |
| INVESTMENT INCOME: | | | | | | | | | | | | | | | | |
| Dividend Income | | $ | 1,054,117 | | | $ | 114,976 | | | $ | 57,955 | | | $ | 989,803 | |
| Dividend Income from Affiliates | | | — | | | | — | | | | 53,835 | | | | — | |
| Securities lending income (net) (Note 2) | | | 99,325 | | | | 40,243 | | | | — | | | | 3,044 | |
| Foreign withholding tax | | | — | | | | (93 | ) | | | — | | | | (6,715 | ) |
| Total Investment Income | | | 1,153,442 | | | | 155,126 | | | | 111,790 | | | | 986,132 | |
| | | | | | | | | | | | | | | | | |
| EXPENSES: | | | | | | | | | | | | | | | | |
| Advisory Fees | | | 717,468 | | | | 68,524 | | | | 233,598 | | | | 336,776 | |
| Accounting & Administration Fees | | | 82,616 | | | | 74,309 | | | | 90,537 | | | | 72,195 | |
| Professional Fees | | | 39,105 | | | | 19,695 | | | | 13,202 | | | | 28,246 | |
| Exchange Listing Fees | | | 5,251 | | | | 372 | | | | 1,712 | | | | 8,017 | |
| Custody Fees | | | 9,357 | | | | 3,436 | | | | 4,377 | | | | 5,178 | |
| Report to Shareholders | | | 26,963 | | | | 4,152 | | | | 8,878 | | | | — | |
| Trustee Fees | | | 5,893 | | | | 5,500 | | | | 5,603 | | | | 5,683 | |
| CCO Fees | | | 6,125 | | | | 580 | | | | 878 | | | | 2,721 | |
| Pricing Fees | | | 4,375 | | | | — | | | | 348 | | | | — | |
| Transfer Agent Fees | | | 7,172 | | | | 685 | | | | 2,336 | | | | 3,608 | |
| Insurance Fees | | | 2,340 | | | | 82 | | | | 2,237 | | | �� | 1,254 | |
| Registration Fees | | | 1,919 | | | | 342 | | | | — | | | | — | |
| Interest on Securities Sold, Not Yet Purchased | | | — | | | | — | | | | 76,415 | | | | — | |
| Dividend Expense | | | — | | | | — | | | | 378,502 | | | | — | |
| Miscellaneous Fees | | | 1,939 | | | | 118 | | | | 859 | | | | 482 | |
| Total Expenses | | | 910,523 | | | | 177,795 | | | | 819,482 | | | | 464,160 | |
| Advisory Fees Waived/Recoupment | | | (24,662 | ) | | | (63,589 | ) | | | 24,096 | | | | (31,171 | ) |
| Net Expenses | | | 885,861 | | | | 114,206 | | | | 843,578 | | | | 432,989 | |
| Net Investment Income (Loss) | | | 267,581 | | | | 40,920 | | | | (731,788 | ) | | | 553,143 | |
| | | | | | | | | | | | | | | | | |
| REALIZED AND UNREALIZED GAIN (LOSS) ON: | | | | | | | | | | | | | | | | |
| Net Realized Gain (Loss) on: | | | | | | | | | | | | | | | | |
| Investments | | | (1,855,358 | ) | | | (1,199,037 | ) | | | 4,489 | | | | 4,969,712 | |
| In-Kind Redemptions | | | 9,525,810 | | | | 1,393,979 | | | | — | | | | 845,821 | |
| Short Sales | | | — | | | | — | | | | (4,323,800 | ) | | | — | |
| Net Change in Unrealized Appreciation (Depreciation) on: | | | | | | | | | | | | | | | | |
| Investments | | | (21,632,697 | ) | | | (2,235,824 | ) | | | — | | | | (10,804,313 | ) |
| Investments in Affiliates | | | — | | | | — | | | | (130,000 | ) | | | — | |
| Short Sales | | | — | | | | — | | | | 12,013,100 | | | | — | |
| Net Realized and Unrealized Gain (Loss) | | | (13,962,245 | ) | | | (2,040,882 | ) | | | 7,563,789 | | | | (4,988,780 | ) |
| NET INCREASE (DECREASE) IN NET ASSETS RESULTING FROM OPERATIONS | | $ | (13,694,664 | ) | | $ | (1,999,962 | ) | | $ | 6,832,001 | | | $ | (4,435,637 | ) |
See accompanying Notes to Financial Statements.
ADVISORSHARES TRUST
Statements of Operations
Year Ended June 30, 2022
| | | AdvisorShares
Drone
Technology
ETF(1) | | | AdvisorShares
Focused Equity
ETF | | | AdvisorShares
Gerber
Kawasaki
ETF(2) | | | AdvisorShares
Hotel ETF | |
| INVESTMENT INCOME: | | | | | | | | | | | | | | | | |
| Dividend Income | | $ | 921 | | | $ | 311,427 | | | $ | 180,482 | | | $ | 73,456 | |
| Securities lending income (net) (Note 2) | | | 2,002 | | | | 749 | | | | 19,490 | | | | 1,500 | |
| Foreign withholding tax | | | (31 | ) | | | — | | | | (11,595 | ) | | | — | |
| Total Investment Income | | | 2,892 | | | | 312,176 | | | | 188,377 | | | | 74,956 | |
| | | | | | | | | | | | | | | | | |
| EXPENSES: | | | | | | | | | | | | | | | | |
| Advisory Fees | | | 674 | | | | 200,099 | | | | 133,777 | | | | 49,132 | |
| Accounting & Administration Fees | | | 2,787 | | | | 72,476 | | | | 22,365 | | | | 4,448 | |
| Professional Fees | | | 33,662 | | | | 23,212 | | | | 34,370 | | | | 17,005 | |
| Exchange Listing Fees | | | 5,799 | | | | 8,135 | | | | 17,023 | | | | 7,733 | |
| Custody Fees | | | 108 | | | | 3,634 | | | | 5,036 | | | | 1,468 | |
| Report to Shareholders | | | 3,520 | | | | 16,057 | | | | 6,683 | | | | 5,575 | |
| Trustee Fees | | | 1,253 | | | | 5,687 | | | | 5,577 | | | | 5,292 | |
| CCO Fees | | | 21 | | | | 1,886 | | | | 1,304 | | | | — | |
| Transfer Agent Fees | | | 8 | | | | 2,309 | | | | 1,338 | | | | 614 | |
| Insurance Fees | | | 417 | | | | 886 | | | | 574 | | | | 694 | |
| Registration Fees | | | — | | | | 230 | | | | — | | | | 562 | |
| Organizational Fees | | | 842 | | | | — | | | | 14,960 | | | | 16,053 | |
| Miscellaneous Fees | | | 586 | | | | 230 | | | | 897 | | | | 552 | |
| Total Expenses | | | 49,677 | | | | 334,841 | | | | 243,904 | | | | 109,128 | |
| Advisory Fees Waived/Recoupment | | | (674 | ) | | | (134,742 | ) | | | (110,127 | ) | | | (28,064 | ) |
| Expense Reimbursement | | | (47,960 | ) | | | — | | | | — | | | | — | |
| Net Expenses | | | 1,043 | | | | 200,099 | | | | 133,777 | | | | 81,064 | |
| Net Investment Income (Loss) | | | 1,849 | | | | 112,077 | | | | 54,600 | | | | (6,108 | ) |
| | | | | | | | | | | | | | | | | |
| REALIZED AND UNREALIZED GAIN (LOSS) ON: | | | | | | | | | | | | | | | | |
| Net Realized Gain (Loss) on: | | | | | | | | | | | | | | | | |
| Investments | | | 1,025 | | | | (31,114 | ) | | | (3,461,686 | ) | | | (390,941 | ) |
| Investments in Affiliates | | | — | | | | — | | | | (590,164 | ) | | | — | |
| In-Kind Redemptions | | | — | | | | 3,224,104 | | | | 108,459 | | | | 414,565 | |
| In-Kind Redemptions in Affiliates | | | — | | | | — | | | | (10,892 | ) | | | — | |
| Distributions by other Affiliated Investment Companies | | | — | | | | — | | | | 1,862 | | | | — | |
| Net Change in Unrealized Appreciation (Depreciation) on: | | | | | | | | | | | | | | | | |
| Investments | | | (76,956 | ) | | | (6,401,532 | ) | | | (5,950,914 | ) | | | (1,292,991 | ) |
| Net Realized and Unrealized Gain (Loss) | | | (75,931 | ) | | | (3,208,542 | ) | | | (9,903,335 | ) | | | (1,269,367 | ) |
| NET INCREASE (DECREASE) IN NET ASSETS RESULTING FROM OPERATIONS | | $ | (74,082 | ) | | $ | (3,096,465 | ) | | $ | (9,848,735 | ) | | $ | (1,275,475 | ) |
| (1) | Represents the period April 27, 2022 (commencement of operations) to June 30, 2022. |
| (2) | Represents the period July 2, 2021 (commencement of operations) to June 30, 2022. |
See accompanying Notes to Financial Statements.
ADVISORSHARES TRUST
Statements of Operations
Year Ended June 30, 2022
| | | AdvisorShares
Let Bob AI
Powered
Momentum
ETF(1) | | | AdvisorShares
Managed
Bitcoin Strategy
ETF(2) | | | AdvisorShares
Newfleet
Multi-Sector
Income ETF | | | AdvisorShares
North Square McKee Core
Reserves ETF(3) | |
| INVESTMENT INCOME: | | | | | | | | | | | | | | | | |
| Dividend Income | | $ | 48,518 | | | $ | 277 | | | $ | 3,761 | | | $ | 2,490 | |
| Interest Income | | | — | | | | — | | | | 2,035,336 | | | | 326,183 | |
| Securities lending income (net) (Note 2) | | | 94 | | | | 2,185 | | | | 3,718 | | | | 341 | |
| Total Investment Income | | | 48,612 | | | | 2,462 | | | | 2,042,815 | | | | 329,014 | |
| | | | | | | | | | | | | | | | | |
| EXPENSES: | | | | | | | | | | | | | | | | |
| Advisory Fees | | | 60,369 | | | | 1,981 | | | | 494,201 | | | | 114,044 | |
| Accounting & Administration Fees | | | 7,005 | | | | 2,387 | | | | 131,364 | | | | 72,118 | |
| Professional Fees | | | 32,714 | | | | 100,247 | | | | 37,592 | | | | 27,114 | |
| Exchange Listing Fees | | | 7,592 | | | | 5,799 | | | | 8,039 | | | | 10,297 | |
| Custody Fees | | | 1,901 | | | | 216 | | | | 20,787 | | | | 5,602 | |
| Report to Shareholders | | | 8,468 | | | | 1,444 | | | | 34,276 | | | | 8,293 | |
| Trustee Fees | | | 2,665 | | | | 1,255 | | | | 5,930 | | | | 5,644 | |
| CCO Fees | | | 745 | | | | 27 | | | | 6,689 | | | | 373 | |
| Pricing Fees | | | — | | | | — | | | | 2,627 | | | | — | |
| Transfer Agent Fees | | | 647 | | | | 17 | | | | 7,413 | | | | 2,851 | |
| Insurance Fees | | | 1,758 | | | | 417 | | | | 2,448 | | | | 2,111 | |
| Registration Fees | | | — | | | | — | | | | 2,693 | | | | — | |
| Organizational Fees | | | 3,684 | | | | 16,028 | | | | — | | | | — | |
| Miscellaneous Fees | | | 393 | | | | 361 | | | | 1,241 | | | | — | |
| Total Expenses | | | 127,941 | | | | 130,179 | | | | 755,300 | | | | 248,447 | |
| Advisory Fees Waived/Recoupment | | | (42,558 | ) | | | (1,981 | ) | | | (13,998 | ) | | | (114,044 | ) |
| Expense Reimbursement | | | — | | | | (124,918 | ) | | | — | | | | (1,352 | ) |
| Net Expenses | | | 85,383 | | | | 3,280 | | | | 741,302 | | | | 133,051 | |
| Net Investment Income (Loss) | | | (36,771 | ) | | | (818 | ) | | | 1,301,513 | | | | 195,963 | |
| | | | | | | | | | | | | | | | | |
| REALIZED AND UNREALIZED GAIN (LOSS) ON: | | | | | | | | | | | | | | | | |
| Net Realized Gain (Loss) on: | | | | | | | | | | | | | | | | |
| Investments | | | (1,625,071 | ) | | | (139,604 | ) | | | (606,602 | ) | | | 44,153 | |
| In-Kind Redemptions | | | — | | | | (19,099 | ) | | | — | | | | — | |
| Futures | | | — | | | | — | | | | — | | | | 1,062 | |
| Net Change in Unrealized Appreciation (Depreciation) on: | | | | | | | | | | | | | | | | |
| Investments | | | (90,393 | ) | | | (135,330 | ) | | | (5,873,888 | ) | | | (490,590 | ) |
| Futures | | | — | | | | — | | | | — | | | | (2,152 | ) |
| Net Realized and Unrealized Gain (Loss) | | | (1,715,464 | ) | | | (294,033 | ) | | | (6,480,490 | ) | | | (447,527 | ) |
| NET INCREASE (DECREASE) IN NET ASSETS RESULTING FROM OPERATIONS | | $ | (1,752,235 | ) | | $ | (294,851 | ) | | $ | (5,178,977 | ) | | $ | (251,564 | ) |
| (1) | Represents the period February 9, 2022 (commencement of operations) to June 30, 2022. |
| (2) | Represents the period April 27, 2022 (commencement of operations) to June 30, 2022. |
| (3) | Formerly known as AdvisorShares Sage Core Reserves ETF. |
See accompanying Notes to Financial Statements.
ADVISORSHARES TRUST
Statements of Operations
Year Ended June 30, 2022
| | | AdvisorShares
North Square
McKee ESG Core
Bond ETF(1) | | | AdvisorShares
Poseidon
Dynamic
Cannabis
ETF(2) | | | AdvisorShares
Psychedelics
ETF(3) | | | AdvisorShares
Pure Cannabis
ETF | |
| INVESTMENT INCOME: | | | | | | | | | | | | | | | | |
| Dividend Income | | $ | 60,081 | | | $ | 3,645 | | | $ | 1,036 | | | $ | 736,628 | |
| Interest Income | | | 45,920 | | | | — | | | | — | | | | — | |
| Securities lending income (net) (Note 2) | | | 1,424 | | | | 4 | | | | 20,108 | | | | 760,094 | |
| Total Investment Income | | | 107,425 | | | | 3,649 | | | | 21,144 | | | | 1,496,722 | |
| | | | | | | | | | | | | | | | | |
| EXPENSES: | | | | | | | | | | | | | | | | |
| Advisory Fees | | | 14,278 | | | | 33,296 | | | | 26,729 | | | | 1,177,503 | |
| Accounting & Administration Fees | | | 81,143 | | | | 9,742 | | | | 15,094 | | | | 143,904 | |
| Professional Fees | | | 20,909 | | | | 28,943 | | | | 39,861 | | | | 71,957 | |
| Exchange Listing Fees | | | 8,040 | | | | 9,548 | | | | 10,992 | | | | 8,490 | |
| Custody Fees | | | 4,688 | | | | 2,123 | | | | 3,467 | | | | 26,249 | |
| Report to Shareholders | | | — | | | | 9,377 | | | | 6,759 | | | | 239,722 | |
| Trustee Fees | | | 5,464 | | | | 4,042 | | | | 5,505 | | | | 6,601 | |
| CCO Fees | | | 154 | | | | 546 | | | | 2,231 | | | | 15,984 | |
| Transfer Agent Fees | | | 305 | | | | 312 | | | | 334 | | | | 14,709 | |
| Insurance Fees | | | 200 | | | | 1,729 | | | | 3,000 | | | | 8,318 | |
| Registration Fees | | | — | | | | — | | | | — | | | | 17,933 | |
| Organizational Fees | | | — | | | | 6,569 | | | | 23,671 | | | | — | |
| Miscellaneous Fees | | | — | | | | 565 | | | | 647 | | | | 4,089 | |
| Total Expenses | | | 135,181 | | | | 106,792 | | | | 138,290 | | | | 1,735,459 | |
| Advisory Fees Waived/Recoupment | | | (14,278 | ) | | | (33,296 | ) | | | (26,729 | ) | | | (452,143 | ) |
| Expense Reimbursement | | | (93,449 | ) | | | (32,289 | ) | | | (67,446 | ) | | | — | |
| Net Expenses | | | 27,454 | | | | 41,207 | | | | 44,115 | | | | 1,283,316 | |
| Net Investment Income (Loss) | | | 79,971 | | | | (37,558 | ) | | | (22,971 | ) | | | 213,406 | |
| | | | | | | | | | | | | | | | | |
| REALIZED AND UNREALIZED GAIN (LOSS) ON: | | | | | | | | | | | | | | | | |
| Net Realized Gain (Loss) on: | | | | | | | | | | | | | | | | |
| Investments | | | 21,294 | | | | (531,882 | ) | | | (1,342,421 | ) | | | (23,513,919 | ) |
| Investments in Affiliates | | | — | | | | — | | | | — | | | | (3,788,027 | ) |
| In-Kind Redemptions | | | (8,921 | ) | | | (4,097 | ) | | | — | | | | 2,694,798 | |
| In-Kind Redemptions in Affiliates | | | — | | | | — | | | | — | | | | 108,532 | |
| Distributions by Other Affiliated Investment Companies | | | — | | | | — | | | | — | | | | 180,376 | |
| Swaps | | | — | | | | (8,171,959 | ) | | | (120,573 | ) | | | (25,924,285 | ) |
| Foreign Currency Transactions | | | — | | | | — | | | | — | | | | (33,361 | ) |
| Net Change in Unrealized Appreciation (Depreciation) on: | | | | | | | | | | | | | | | | |
| Investments | | | (442,297 | ) | | | (136,132 | ) | | | (6,520,910 | ) | | | (75,531,924 | ) |
| Investments in Affiliates | | | — | | | | — | | | | — | | | | (77,975,933 | ) |
| Swaps | | | — | | | | (11,562 | ) | | | (493,154 | ) | | | (24,246,526 | ) |
| Foreign Currency Translations | | | — | | | | — | | | | — | | | | (424 | ) |
| Net Realized and Unrealized Gain (Loss) | | | (429,924 | ) | | | (8,855,632 | ) | | | (8,477,058 | ) | | | (228,030,693 | ) |
| NET INCREASE (DECREASE) IN NET ASSETS RESULTING FROM OPERATIONS | | $ | (349,953 | ) | | $ | (8,893,190 | ) | | $ | (8,500,029 | ) | | $ | (227,817,287 | ) |
| (1) | Formerly known as AdvisorShares FolioBeyond Smart Core Bond ETF. |
| (2) | Represents the period November 17, 2021 (commencement of operations) to June 30, 2022. |
| (3) | Represents the period September 16, 2021 (commencement of operations) to June 30, 2022. |
See accompanying Notes to Financial Statements.
ADVISORSHARES TRUST
Statements of Operations
Year Ended June 30, 2022
| | | AdvisorShares
Pure US
Cannabis ETF | | | AdvisorShares
Q Dynamic
Growth
ETF | | | AdvisorShares
Q Portfolio
Blended
Allocation
ETF | | | AdvisorShares
Ranger Equity
Bear ETF | |
| INVESTMENT INCOME: | | | | | | | | | | | | | | | | |
| Dividend Income | | $ | 2,854,991 | | | $ | 506,643 | | | $ | 47,873 | | | $ | 217,021 | |
| Dividend Income from Affiliates | | | — | | | | — | | | | — | | | | 107,670 | |
| Interest Income | | | — | | | | — | | | | — | | | | 64,668 | |
| Securities lending income (net) (Note 2) | | | 82,040 | | | | 57,259 | | | | 2,756 | | | | — | |
| Total Investment Income | | | 2,937,031 | | | | 563,902 | | | | 50,629 | | | | 389,359 | |
| | | | | | | | | | | | | | | | | |
| EXPENSES: | | | | | | | | | | | | | | | | |
| Advisory Fees | | | 5,493,656 | | | | 869,105 | | | | 29,700 | | | | 1,289,112 | |
| Accounting & Administration Fees | | | 515,743 | | | | 50,823 | | | | 35,404 | | | | 72,444 | |
| Professional Fees | | | 197,885 | | | | 37,647 | | | | 22,241 | | | | 23,473 | |
| Exchange Listing Fees | | | 10,511 | | | | 8,300 | | | | 8,400 | | | | 7,307 | |
| Custody Fees | | | 77,999 | | | | 9,133 | | | | 2,036 | | | | 7,940 | |
| Report to Shareholders | | | 309,524 | | | | 19,600 | | | | 12,635 | | | | 22,348 | |
| Trustee Fees | | | 11,047 | | | | 5,864 | | | | 5,498 | | | | 5,910 | |
| CCO Fees | | | 66,621 | | | | 6,570 | | | | — | | | | 1,628 | |
| Pricing Fees | | | — | | | | — | | | | — | | | | 7,815 | |
| Transfer Agent Fees | | | 68,677 | | | | 6,828 | | | | 324 | | | | 6,446 | |
| Insurance Fees | | | 22,396 | | | | 1,529 | | | | 55 | | | | 2,454 | |
| Registration Fees | | | 70,800 | | | | 4,620 | | | | 257 | | | | — | |
| Interest on Securities Sold, Not Yet Purchased | | | — | | | | — | | | | — | | | | 1,136,642 | |
| Dividend Expense | | | — | | | | — | | | | — | | | | 982,230 | |
| Organizational Fees | | | 39,339 | | | | 9,095 | | | | 9,095 | | | | — | |
| Miscellaneous Fees | | | 14,811 | | | | 2,322 | | | | 128 | | | | 3,753 | |
| Total Expenses | | | 6,899,009 | | | | 1,031,436 | | | | 125,773 | | | | 3,569,502 | |
| Advisory Fees Waived/Recoupment | | | (275,331 | ) | | | 7,123 | | | | (29,700 | ) | | | — | |
| Expense Reimbursement | | | — | | | | — | | | | (53,486 | ) | | | — | |
| Net Expenses | | | 6,623,678 | | | | 1,038,559 | | | | 42,587 | | | | 3,569,502 | |
| Net Investment Income (Loss) | | | (3,686,647 | ) | | | (474,657 | ) | | | 8,042 | | | | (3,180,143 | ) |
| | | | | | | | | | | | | | | | | |
| REALIZED AND UNREALIZED GAIN (LOSS) ON: | | | | | | | | | | | | | | | | |
| Net Realized Gain (Loss) on: | | | | | | | | | | | | | | | | |
| Investments | | | (61,520,106 | ) | | | (4,530,014 | ) | | | (532,576 | ) | | | — | |
| Investments in Affiliates | | | (27,321,462 | ) | | | — | | | | — | | | | — | |
| In-Kind Redemptions | | | 3,337,143 | | | | (334,662 | ) | | | 1,150 | | | | — | |
| In-Kind Redemptions in Affiliates | | | 244,101 | | | | — | | | | — | | | | — | |
| Swaps | | | (637,418,579 | ) | | | — | | | | — | | | | — | |
| Short Sales | | | — | | | | — | | | | — | | | | 26,673,974 | |
| Foreign Currency Transactions | | | (9,012 | ) | | | — | | | | — | | | | — | |
| Distributions by other Investment Companies | | | — | | | | — | | | | 939 | | | | — | |
| Net Change in Unrealized Appreciation (Depreciation) on: | | | | | | | | | | | | | | | | |
| Investments | | | (76,510,381 | ) | | | (15,140,779 | ) | | | (554,167 | ) | | | (173,271 | ) |
| Investments in Affiliates | | | (69,658,370 | ) | | | — | | | | — | | | | (260,000 | ) |
| Short Sales | | | — | | | | — | | | | — | | | | 11,535,915 | |
| Swaps | | | (326,779,605 | ) | | | — | | | | — | | | | — | |
| Foreign Currency Translations | | | 1 | | | | — | | | | — | | | | — | |
| Net Realized and Unrealized Gain (Loss) | | | (1,195,636,270 | ) | | | (20,005,455 | ) | | | (1,084,654 | ) | | | 37,776,618 | |
| NET INCREASE (DECREASE) IN NET ASSETS RESULTING FROM OPERATIONS | | $ | (1,199,322,917 | ) | | $ | (20,480,112 | ) | | $ | (1,076,612 | ) | | $ | 34,596,475 | |
See accompanying Notes to Financial Statements.
ADVISORSHARES TRUST
Statements of Operations
Year Ended June 30, 2022
| | | AdvisorShares
Restaurant
ETF | | | AdvisorShares
STAR Global
Buy-Write
ETF | | | AdvisorShares
Vice ETF | |
| INVESTMENT INCOME: | | | | | | | | | | | | |
| Dividend Income | | $ | 35,260 | | | $ | 610,747 | | | $ | 180,398 | |
| Securities lending income (net) (Note 2) | | | 31,788 | | | | 14,316 | | | | 1,384 | |
| Foreign withholding tax | | | (468 | ) | | | — | | | | (2,146 | ) |
| Total Investment Income | | | 66,580 | | | | 625,063 | | | | 179,636 | |
| | | | | | | | | | | | | |
| EXPENSES: | | | | | | | | | | | | |
| Advisory Fees | | | 25,611 | | | | 387,522 | | | | 68,268 | |
| Accounting & Administration Fees | | | 8,237 | | | | 73,942 | | | | 77,871 | |
| Professional Fees | | | 20,904 | | | | 25,104 | | | | 13,396 | |
| Exchange Listing Fees | | | 7,733 | | | | 7,993 | | | | 8,469 | |
| Custody Fees | | | 1,175 | | | | 4,051 | | | | 3,047 | |
| Report to Shareholders | | | 3,189 | | | | 13,167 | | | | 6,954 | |
| Trustee Fees | | | 5,440 | | | | 5,529 | | | | 5,488 | |
| CCO Fees | | | — | | | | 1,582 | | | | 812 | |
| Pricing Fees | | | — | | | | — | | | | 765 | |
| Transfer Agent Fees | | | 320 | | | | 2,153 | | | | 853 | |
| Insurance Fees | | | 677 | | | | 465 | | | | 329 | |
| Registration Fees | | | 424 | | | | 197 | | | | — | |
| Organizational Fees | | | 16,054 | | | | — | | | | — | |
| Miscellaneous Fees | | | 466 | | | | 263 | | | | 343 | |
| Total Expenses | | | 90,230 | | | | 521,968 | | | | 186,595 | |
| Advisory Fees Waived/Recoupment | | | (25,611 | ) | | | 9,081 | | | | (68,268 | ) |
| Expense Reimbursement | | | (22,359 | ) | | | — | | | | (5,686 | ) |
| Net Expenses | | | 42,260 | | | | 531,049 | | | | 112,641 | |
| Net Investment Income (Loss) | | | 24,320 | | | | 94,014 | | | | 66,995 | |
| | | | | | | | | | | | | |
| REALIZED AND UNREALIZED GAIN (LOSS) ON: | | | | | | | | | | | | |
| Net Realized Gain (Loss) on: | | | | | | | | | | | | |
| Investments | | | (804,392 | ) | | | 107,217 | | | | (282,990 | ) |
| In-Kind Redemptions | | | 35,387 | | | | 108,548 | | | | 156,897 | |
| Options Written | | | — | | | | 304,360 | | | | — | |
| Net Change in Unrealized Appreciation (Depreciation) on: | | | | | | | | | | | | |
| Investments | | | (517,861 | ) | | | (5,857,570 | ) | | | (3,846,483 | ) |
| Options Written | | | — | | | | 30,787 | | | | — | |
| Net Realized and Unrealized Gain (Loss) | | | (1,286,866 | ) | | | (5,306,658 | ) | | | (3,972,576 | ) |
| NET INCREASE (DECREASE) IN NET ASSETS RESULTING FROM OPERATIONS | | $ | (1,262,546 | ) | | $ | (5,212,644 | ) | | $ | (3,905,581 | ) |
See accompanying Notes to Financial Statements.
ADVISORSHARES TRUST
Statements of Changes in Net Assets
| | | AdvisorShares
Alpha DNA Equity Sentiment
ETF | | | AdvisorShares
Dorsey Wright ADR
ETF | |
| | | Year ended
June 30,
2022 | | | For the period
February 2,
2021* to
June 30,
2021 | | | Year ended
June 30,
2022 | | | Year ended
June 30,
2021 | |
| INCREASE (DECREASE) IN NET ASSETS | | | | | | | | | | | | | | | | |
| OPERATIONS | | | | | | | | | | | | | | | | |
| Net Investment Income (Loss) | | $ | (39,604 | ) | | $ | (160,118 | ) | | $ | 1,811,453 | | | $ | 356,321 | |
| Net Realized Gain (Loss) | | | (9,674,922 | ) | | | 2,719,382 | | | | 1,889,719 | | | | 19,387,682 | |
| Net Change in Unrealized Appreciation (Depreciation) | | | (8,507,113 | ) | | | 2,443,529 | | | | (20,545,915 | ) | | | (1,463,361 | ) |
| Net Increase (Decrease) In Net Assets Resulting From Operations | | | (18,221,639 | ) | | | 5,002,793 | | | | (16,844,743 | ) | | | 18,280,642 | |
| DISTRIBUTIONS TO SHAREHOLDERS | | | | | | | | | | | | | | | | |
| Distributions | | | — | | | | — | | | | (1,200,067 | ) | | | (284,565 | ) |
| Total Distributions | | | — | | | | — | | | | (1,200,067 | ) | | | (284,565 | ) |
| CAPITAL STOCK TRANSACTIONS | | | | | | | | | | | | | | | | |
| Proceeds from Shares Issued | | | 40,215,570 | | | | 96,371,099 | | | | — | | | | 10,147,730 | |
| Value of Shares Redeemed | | | (41,327,340 | ) | | | (31,467,151 | ) | | | (28,853,838 | ) | | | (15,186,661 | ) |
| Net Increase (Decrease) From Capital Stock Transactions | | | (1,111,770 | ) | | | 64,903,948 | | | | (28,853,838 | ) | | | (5,038,931 | ) |
| Net Increase (Decrease) in Net Assets | | | (19,333,409 | ) | | | 69,906,741 | | | | (46,898,648 | ) | | | 12,957,146 | |
| Net Assets: | | | | | | | | | | | | | | | | |
| Beginning of Year/Period | | | 69,906,741 | | | | — | | | | 88,836,468 | | | | 75,879,322 | |
| End of Year/Period | | $ | 50,573,332 | | | $ | 69,906,741 | | | $ | 41,937,820 | | | $ | 88,836,468 | |
| Changes in Shares Outstanding | | | | | | | | | | | | | | | | |
| Shares Outstanding, Beginning of Year/Period | | | 2,535,000 | | | | — | | | | 1,335,000 | | | | 1,425,000 | |
| Shares Sold | | | 1,445,000 | | | | 3,705,000 | | | | — | | | | 170,000 | |
| Shares Repurchased | | | (1,550,000 | ) | | | (1,170,000 | ) | | | (470,000 | ) | | | (260,000 | ) |
| Shares Outstanding, End of Year/Period | | | 2,430,000 | | | | 2,535,000 | | | | 865,000 | | | | 1,335,000 | |
| * | Commencement of operations. |
See accompanying Notes to Financial Statements.
ADVISORSHARES TRUST
Statements of Changes in Net Assets
| | | AdvisorShares
Dorsey Wright Alpha
Equal Weight
ETF | | | AdvisorShares
Dorsey Wright FSM All
Cap World
ETF | |
| | | Year ended
June 30,
2022 | | | Year ended
June 30,
2021 | | | Year ended
June 30,
2022 | | | Year ended
June 30,
2021 | |
| INCREASE (DECREASE) IN NET ASSETS | | | | | | | | | | | | | | | | |
| OPERATIONS | | | | | | | | | | | | | | | | |
| Net Investment Income (Loss) | | $ | (19,193 | ) | | $ | (276,933 | ) | | $ | 20,265 | | | $ | (438,845 | ) |
| Net Realized Gain (Loss) | | | (15,107,867 | ) | | | 18,631,882 | | | | (17,005,868 | ) | | | 38,026,512 | |
| Net Change in Unrealized Appreciation (Depreciation) | | | (2,397,719 | ) | | | (2,677,985 | ) | | | (2,715,526 | ) | | | (8,322,601 | ) |
| Net Increase (Decrease) In Net Assets Resulting From Operations | | | (17,524,779 | ) | | | 15,676,964 | | | | (19,701,129 | ) | | | 29,265,066 | |
| DISTRIBUTIONS TO SHAREHOLDERS | | | | | | | | | | | | | | | | |
| Distributions | | | (1,162,299 | ) | | | (14,018 | ) | | | (2,192,696 | ) | | | (215,144 | ) |
| Total Distributions | | | (1,162,299 | ) | | | (14,018 | ) | | | (2,192,696 | ) | | | (215,144 | ) |
| CAPITAL STOCK TRANSACTIONS | | | | | | | | | | | | | | | | |
| Proceeds from Shares Issued | | | 68,469,951 | | | | 85,533,754 | | | | 86,954,010 | | | | 295,124,496 | |
| Value of Shares Redeemed | | | (86,479,636 | ) | | | (61,136,384 | ) | | | (136,556,384 | ) | | | (242,186,339 | ) |
| Net Increase (Decrease) From Capital Stock Transactions | | | (18,009,685 | ) | | | 24,397,370 | | | | (49,602,374 | ) | | | 52,938,157 | |
| Net Increase (Decrease) in Net Assets | | | (36,696,763 | ) | | | 40,060,316 | | | | (71,496,199 | ) | | | 81,988,079 | |
| Net Assets: | | | | | | | | | | | | | | | | |
| Beginning of Year/Period | | | 79,393,671 | | | | 39,333,355 | | | | 155,672,875 | | | | 73,684,796 | |
| End of Year/Period | | $ | 42,696,908 | | | $ | 79,393,671 | | | $ | 84,176,676 | | | $ | 155,672,875 | |
| Changes in Shares Outstanding | | | | | | | | | | | | | | | | |
| Shares Outstanding, Beginning of Year/Period | | | 2,850,000 | | | | 1,925,000 | | | | 4,250,000 | | | | 2,625,000 | |
| Shares Sold | | | 2,440,000 | | | | 3,085,000 | | | | 2,270,000 | | | | 8,535,000 | |
| Shares Repurchased | | | (3,230,000 | ) | | | (2,160,000 | ) | | | (3,745,000 | ) | | | (6,910,000 | ) |
| Shares Outstanding, End of Year/Period | | | 2,060,000 | | | | 2,850,000 | | | | 2,775,000 | | | | 4,250,000 | |
See accompanying Notes to Financial Statements.
ADVISORSHARES TRUST
Statements of Changes in Net Assets
| | | AdvisorShares Dorsey Wright FSM US Core
ETF | | | AdvisorShares
Dorsey Wright Micro-Cap
ETF | |
| | | Year ended
June 30,
2022 | | | Year ended
June 30,
2021 | | | Year ended
June 30,
2022 | | | Year ended
June 30,
2021 | |
| INCREASE (DECREASE) IN NET ASSETS | | | | | | | | | | | | | | | | |
| OPERATIONS | | | | | | | | | | | | | | | | |
| Net Investment Income (Loss) | | $ | 267,581 | | | $ | (151,194 | ) | | $ | 40,920 | | | $ | (5,175 | ) |
| Net Realized Gain (Loss) | | | 7,670,452 | | | | 8,461,136 | | | | 194,942 | | | | 484,121 | |
| Net Change in Unrealized Appreciation (Depreciation) | | | (21,632,697 | ) | | | 11,295,797 | | | | (2,235,824 | ) | | | 1,419,273 | |
| Net Increase (Decrease) In Net Assets Resulting From Operations | | | (13,694,664 | ) | | | 19,605,739 | | | | (1,999,962 | ) | | | 1,898,219 | |
| DISTRIBUTIONS TO SHAREHOLDERS | | | | | | | | | | | | | | | | |
| Distributions | | | (367,102 | ) | | | (144,245 | ) | | | (38,855 | ) | | | — | |
| Return of Capital | | | — | | | | — | | | | (9,609 | ) | | | — | |
| Total Distributions | | | (367,102 | ) | | | (144,245 | ) | | | (48,464 | ) | | | — | |
| CAPITAL STOCK TRANSACTIONS | | | | | | | | | | | | | | | | |
| Proceeds from Shares Issued | | | 48,884,270 | | | | 67,515,703 | | | | 6,397,157 | | | | 5,434,395 | |
| Value of Shares Redeemed | | | (48,707,954 | ) | | | (40,095,468 | ) | | | (5,872,501 | ) | | | (545,097 | ) |
| Net Increase (Decrease) From Capital Stock Transactions | | | 176,316 | | | | 27,420,235 | | | | 524,656 | | | | 4,889,298 | |
| Net Increase (Decrease) in Net Assets | | | (13,885,450 | ) | | | 46,881,729 | | | | (1,523,770 | ) | | | 6,787,517 | |
| Net Assets: | | | | | | | | | | | | | | | | |
| Beginning of Year/Period | | | 93,648,978 | | | | 46,767,249 | | | | 8,899,314 | | | | 2,111,797 | |
| End of Year/Period | | $ | 79,763,528 | | | $ | 93,648,978 | | | $ | 7,375,544 | | | $ | 8,899,314 | |
| Changes in Shares Outstanding | | | | | | | | | | | | | | | | |
| Shares Outstanding, Beginning of Year/Period | | | 2,525,000 | | | | 1,700,000 | | | | 235,000 | | | | 100,000 | |
| Shares Sold | | | 1,355,000 | | | | 1,945,000 | | | | 170,000 | | | | 160,000 | |
| Shares Repurchased | | | (1,400,000 | ) | | | (1,120,000 | ) | | | (160,000 | ) | | | (25,000 | ) |
| Shares Outstanding, End of Year/Period | | | 2,480,000 | | | | 2,525,000 | | | | 245,000 | | | | 235,000 | |
See accompanying Notes to Financial Statements.
ADVISORSHARES TRUST
Statements of Changes in Net Assets
| | | AdvisorShares
Dorsey Wright Short
ETF | | | AdvisorShares
DoubleLine Value Equity
ETF | |
| | | Year ended
June 30,
2022 | | | Year ended
June 30,
2021 | | | Year ended
June 30,
2022 | | | Year ended
June 30,
2021 | |
| INCREASE (DECREASE) IN NET ASSETS | | | | | | | | | | | | | | | | |
| OPERATIONS | | | | | | | | | | | | | | | | |
| Net Investment Income (Loss) | | $ | (731,788 | ) | | $ | (1,864,666 | ) | | $ | 553,143 | | | $ | 537,254 | |
| Net Realized Gain (Loss) | | | (4,319,311 | ) | | | (27,066,731 | ) | | | 5,815,533 | | | | 5,873,938 | |
| Net Change in Unrealized Appreciation (Depreciation) | | | 11,883,100 | | | | (19,190,288 | ) | | | (10,804,313 | ) | | | 10,696,504 | |
| Net Increase (Decrease) In Net Assets Resulting From Operations | | | 6,832,001 | | | | (48,121,685 | ) | | | (4,435,637 | ) | | | 17,107,696 | |
| DISTRIBUTIONS TO SHAREHOLDERS | | | | | | | | | | | | | | | | |
| Distributions | | | — | | | | — | | | | (520,610 | ) | | | (614,874 | ) |
| Total Distributions | | | — | | | | — | | | | (520,610 | ) | | | (614,874 | ) |
| CAPITAL STOCK TRANSACTIONS | | | | | | | | | | | | | | | | |
| Proceeds from Shares Issued | | | 31,836,759 | | | | 23,413,492 | | | | 6,473,012 | | | | 964,855 | |
| Value of Shares Redeemed | | | (16,833,886 | ) | | | (63,225,521 | ) | | | (3,381,200 | ) | | | (10,698,303 | ) |
| Net Increase (Decrease) From Capital Stock Transactions | | | 15,002,873 | | | | (39,812,029 | ) | | | 3,091,812 | | | | (9,733,448 | ) |
| Net Increase (Decrease) in Net Assets | | | 21,834,874 | | | | (87,933,714 | ) | | | (1,864,435 | ) | | | 6,759,374 | |
| Net Assets: | | | | | | | | | | | | | | | | |
| Beginning of Year/Period | | | 25,164,385 | | | | 113,098,099 | | | | 48,242,615 | | | | 41,483,241 | |
| End of Year/Period | | $ | 46,999,259 | | | $ | 25,164,385 | | | $ | 46,378,180 | | | $ | 48,242,615 | |
| Changes in Shares Outstanding | | | | | | | | | | | | | | | | |
| Shares Outstanding, Beginning of Year/Period | | | 2,930,000 | | | | 5,850,000 | | | | 505,000 | | | | 625,000 | |
| Shares Sold | | | 3,390,000 | | | | 1,475,000 | | | | 70,000 | | | | 10,000 | |
| Shares Repurchased | | | (1,840,000 | ) | | | (4,395,000 | ) | | | (35,000 | ) | | | (130,000 | ) |
| Shares Outstanding, End of Year/Period | | | 4,480,000 | | | | 2,930,000 | | | | 540,000 | | | | 505,000 | |
See accompanying Notes to Financial Statements.
ADVISORSHARES TRUST
Statements of Changes in Net Assets
| | | AdvisorShares
Drone Technology
ETF | | | AdvisorShares
Focused Equity
ETF | |
| | | For the period
April 27,
2022* to
June 30,
2022 | | | Year ended
June 30,
2022 | | | Year ended
June 30,
2021 | |
| INCREASE (DECREASE) IN NET ASSETS | | | | | | | | | | | | |
| OPERATIONS | | | | | | | | | | | | |
| Net Investment Income (Loss) | | $ | 1,849 | | | $ | 112,077 | | | $ | 58,217 | |
| Net Realized Gain (Loss) | | | 1,025 | | | | 3,192,990 | | | | 1,044,419 | |
| Net Change in Unrealized Appreciation (Depreciation) | | | (76,956 | ) | | | (6,401,532 | ) | | | 4,977,298 | |
| Net Increase (Decrease) In Net Assets Resulting From Operations | | | (74,082 | ) | | | (3,096,465 | ) | | | 6,079,934 | |
| DISTRIBUTIONS TO SHAREHOLDERS | | | | | | | | | | | | |
| Distributions | | | — | | | | (52,120 | ) | | | (62,748 | ) |
| Total Distributions | | | — | | | | (52,120 | ) | | | (62,748 | ) |
| CAPITAL STOCK TRANSACTIONS | | | | | | | | | | | | |
| Proceeds from Shares Issued | | | 625,000 | | | | 11,183,176 | | | | 7,478,401 | |
| Value of Shares Redeemed | | | — | | | | (8,857,828 | ) | | | (4,190,848 | ) |
| Net Increase (Decrease) From Capital Stock Transactions | | | 625,000 | | | | 2,325,348 | | | | 3,287,553 | |
| Net Increase (Decrease) in Net Assets | | | 550,918 | | | | (823,237 | ) | | | 9,304,739 | |
| Net Assets: | | | | | | | | | | | | |
| Beginning of Year/Period | | | — | | | | 28,921,198 | | | | 19,616,459 | |
| End of Year/Period | | $ | 550,918 | | | $ | 28,097,961 | | | $ | 28,921,198 | |
| Changes in Shares Outstanding | | | | | | | | | | | | |
| Shares Outstanding, Beginning of Year/Period | | | — | | | | 620,000 | | | | 550,000 | |
| Shares Sold | | | 25,000 | | | | 215,000 | | | | 170,000 | |
| Shares Repurchased | | | — | | | | (170,000 | ) | | | (100,000 | ) |
| Shares Outstanding, End of Year/Period | | | 25,000 | | | | 665,000 | | | | 620,000 | |
| * | Commencement of operations. |
See accompanying Notes to Financial Statements.
ADVISORSHARES TRUST
Statements of Changes in Net Assets
| | | AdvisorShares
Gerber Kawasaki
ETF | | | AdvisorShares
Hotel
ETF | |
| | | For the Period
July 2,
2021* to
June 30,
2022 | | | Year ended
June 30,
2022 | | | For the period
April 20,
2021* to
June 30,
2021 | |
| INCREASE (DECREASE) IN NET ASSETS | | | | | | | | | | | | |
| OPERATIONS | | | | | | | | | | | | |
| Net Investment Income (Loss) | | $ | 54,600 | | | $ | (6,108 | ) | | $ | 22,750 | |
| Net Realized Gain (Loss) | | | (3,952,421 | ) | | | 23,624 | | | | (41,231 | ) |
| Net Change in Unrealized Appreciation (Depreciation) | | | (5,950,914 | ) | | | (1,292,991 | ) | | | (281,789 | ) |
| Net Increase (Decrease) In Net Assets Resulting From Operations | | | (9,848,735 | ) | | | (1,275,475 | ) | | | (300,270 | ) |
| DISTRIBUTIONS TO SHAREHOLDERS | | | | | | | | | | | | |
| Distributions | | | (9,594 | ) | | | (32,154 | ) | | | — | |
| Total Distributions | | | (9,594 | ) | | | (32,154 | ) | | | — | |
| CAPITAL STOCK TRANSACTIONS | | | | | | | | | | | | |
| Proceeds from Shares Issued | | | 28,966,567 | | | | 5,342,715 | | | | 8,023,869 | |
| Value of Shares Redeemed | | | (3,262,011 | ) | | | (5,861,734 | ) | | | — | |
| Net Increase (Decrease) From Capital Stock Transactions | | | 25,704,556 | | | | (519,019 | ) | | | 8,023,869 | |
| Net Increase (Decrease) in Net Assets | | | 15,846,227 | | | | (1,826,648 | ) | | | 7,723,599 | |
| Net Assets: | | | | | | | | | | | | |
| Beginning of Year/Period | | | — | | | | 7,723,599 | | | | — | |
| End of Year/Period | | $ | 15,846,227 | | | $ | 5,896,951 | | | $ | 7,723,599 | |
| Changes in Shares Outstanding | | | | | | | | | | | | |
| Shares Outstanding, Beginning of Year/Period | | | — | | | | 315,000 | | | | — | |
| Shares Sold | | | 1,125,000 | | | | 220,000 | | | | 315,000 | |
| Shares Repurchased | | | (155,000 | ) | | | (235,000 | ) | | | — | |
| Shares Outstanding, End of Year/Period | | | 970,000 | | | | 300,000 | | | | 315,000 | |
| * | Commencement of operations. |
See accompanying Notes to Financial Statements.
ADVISORSHARES TRUST
Statements of Changes in Net Assets
| | | AdvisorShares
Let Bob AI Powered
Momentum
ETF | | | AdvisorShares
Managed Bitcoin
Strategy
ETF | |
| | | For the period
February 9,
2022* to
June 30,
2022 | | | For the period
April 27,
2022* to
June 30,
2022 | |
| INCREASE (DECREASE) IN NET ASSETS | | | | | | | | |
| OPERATIONS | | | | | | | | |
| Net Investment Income (Loss) | | $ | (36,771 | ) | | $ | (818 | ) |
| Net Realized Gain (Loss) | | | (1,625,071 | ) | | | (158,703 | ) |
| Net Change in Unrealized Appreciation (Depreciation) | | | (90,393 | ) | | | (135,330 | ) |
| Net Increase (Decrease) In Net Assets Resulting From Operations | | | (1,752,235 | ) | | | (294,851 | ) |
| DISTRIBUTIONS TO SHAREHOLDERS | | | | | | | | |
| Distributions | | | — | | | | — | |
| Total Distributions | | | — | | | | — | |
| CAPITAL STOCK TRANSACTIONS | | | | | | | | |
| Proceeds from Shares Issued | | | 25,935,550 | | | | 21,000,864 | |
| Value of Shares Redeemed | | | — | | | | (20,189,284 | ) |
| Net Increase (Decrease) From Capital Stock Transactions | | | 25,935,550 | | | | 811,580 | |
| Net Increase (Decrease) in Net Assets | | | 24,183,315 | | | | 516,729 | |
| Net Assets: | | | | | | | | |
| Beginning of Year/Period | | | — | | | | — | |
| End of Year/Period | | $ | 24,183,315 | | | $ | 516,729 | |
| Changes in Shares Outstanding | | | | | | | | |
| Shares Outstanding, Beginning of Year/Period | | | — | | | | — | |
| Shares Sold | | | 1,040,000 | | | | 1,070,000 | |
| Shares Repurchased | | | — | | | | (1,035,000 | ) |
| Shares Outstanding, End of Year/Period | | | 1,040,000 | | | | 35,000 | |
| * | Commencement of operations. |
See accompanying Notes to Financial Statements.
ADVISORSHARES TRUST
Statements of Changes in Net Assets
| | | AdvisorShares
Newfleet Multi-Sector Income
ETF | | | AdvisorShares
North Square McKee
Core Reserves
ETF(1) | |
| | | Year ended
June 30,
2022 | | | Year ended
June 30,
2021 | | | Year ended
June 30,
2022 | | | Year ended
June 30,
2021 | |
| INCREASE (DECREASE) IN NET ASSETS | | | | | | | | | | | | | | | | |
| OPERATIONS | | | | | | | | | | | | | | | | |
| Net Investment Income (Loss) | | $ | 1,301,513 | | | $ | 1,195,721 | | | $ | 195,963 | | | $ | 613,130 | |
| Net Realized Gain (Loss) | | | (606,602 | ) | | | 440,439 | | | | 45,215 | | | | 323,325 | |
| Net Change in Unrealized Appreciation (Depreciation) | | | (5,873,888 | ) | | | 406,669 | | | | (492,742 | ) | | | 30,243 | |
| Net Increase (Decrease) In Net Assets Resulting From Operations | | | (5,178,977 | ) | | | 2,042,829 | | | | (251,564 | ) | | | 966,698 | |
| DISTRIBUTIONS TO SHAREHOLDERS | | | | | | | | | | | | | | | | |
| Distributions | | | (1,469,967 | ) | | | (1,321,431 | ) | | | (206,678 | ) | | | (647,683 | ) |
| Total Distributions | | | (1,469,967 | ) | | | (1,321,431 | ) | | | (206,678 | ) | | | (647,683 | ) |
| CAPITAL STOCK TRANSACTIONS | | | | | | | | | | | | | | | | |
| Proceeds from Shares Issued | | | 8,066,264 | | | | 55,802,623 | | | | 2,455,644 | | | | 19,742,687 | |
| Value of Shares Redeemed | | | (14,694,308 | ) | | | (17,332,533 | ) | | | (9,343,134 | ) | | | (78,550,212 | ) |
| Net Increase (Decrease) From Capital Stock Transactions | | | (6,628,044 | ) | | | 38,470,090 | | | | (6,887,490 | ) | | | (58,807,525 | ) |
| Net Increase (Decrease) in Net Assets | | | (13,276,988 | ) | | | 39,191,488 | | | | (7,345,732 | ) | | | (58,488,510 | ) |
| Net Assets: | | | | | | | | | | | | | | | | |
| Beginning of Year/Period | | | 96,958,588 | | | | 57,767,100 | | | | 42,432,393 | | | | 100,920,903 | |
| End of Year/Period | | $ | 83,681,600 | | | $ | 96,958,588 | | | $ | 35,086,661 | | | $ | 42,432,393 | |
| Changes in Shares Outstanding | | | | | | | | | | | | | | | | |
| Shares Outstanding, Beginning of Year/Period | | | 1,985,000 | | | | 1,200,000 | | | | 430,000 | | | | 1,025,000 | |
| Shares Sold | | | 165,000 | | | | 1,140,000 | | | | 25,000 | | | | 200,000 | |
| Shares Repurchased | | | (315,000 | ) | | | (355,000 | ) | | | (95,000 | ) | | | (795,000 | ) |
| Shares Outstanding, End of Year/Period | | | 1,835,000 | | | | 1,985,000 | | | | 360,000 | | | | 430,000 | |
| (1) | Formerly known as AdvisorShares Sage Core Reserves ETF. |
See accompanying Notes to Financial Statements.
ADVISORSHARES TRUST
Statements of Changes in Net Assets
| | | AdvisorShares
North Square McKee ESG
Core Bond
ETF(1) | | | AdvisorShares
Poseidon Dynamic
Cannabis
ETF | |
| | | Year ended
June 30,
2022 | | | Year ended
June 30,
2021 | | | For the period
November 17,
2021* to
June 30,
2022 | |
| INCREASE (DECREASE) IN NET ASSETS | | | | | | | | | | | | |
| OPERATIONS | | | | | | | | | | | | |
| Net Investment Income (Loss) | | $ | 79,971 | | | $ | 109,511 | | | $ | (37,558 | ) |
| Net Realized Gain (Loss) | | | 12,373 | | | | 83,801 | | | | (8,707,938 | ) |
| Net Change in Unrealized Appreciation (Depreciation) | | | (442,297 | ) | | | 54,063 | | | | (147,694 | ) |
| Net Increase (Decrease) In Net Assets Resulting From Operations | | | (349,953 | ) | | | 247,375 | | | | (8,893,190 | ) |
| DISTRIBUTIONS TO SHAREHOLDERS | | | | | | | | | | | | |
| Distributions | | | (82,126 | ) | | | (120,549 | ) | | | — | |
| Total Distributions | | | (82,126 | ) | | | (120,549 | ) | | | — | |
| CAPITAL STOCK TRANSACTIONS | | | | | | | | | | | | |
| Proceeds from Shares Issued | | | 512,358 | | | | — | | | | 13,802,346 | |
| Value of Shares Redeemed | | | (2,328,053 | ) | | | (2,857,937 | ) | | | (552,381 | ) |
| Net Increase (Decrease) From Capital Stock Transactions | | | (1,815,695 | ) | | | (2,857,937 | ) | | | 13,249,965 | |
| Net Increase (Decrease) in Net Assets | | | (2,247,774 | ) | | | (2,731,111 | ) | | | 4,356,775 | |
| Net Assets: | | | | | | | | | | | | |
| Beginning of Year/Period | | | 5,580,871 | | | | 8,311,982 | | | | — | |
| End of Year/Period | | $ | 3,333,097 | | | $ | 5,580,871 | | | $ | 4,356,775 | |
| Changes in Shares Outstanding | | | | | | | | | | | | |
| Shares Outstanding, Beginning of Year/Period | | | 215,000 | | | | 325,000 | | | | — | |
| Shares Sold | | | 20,000 | | | | — | | | | 1,995,000 | |
| Shares Repurchased | | | (90,000 | ) | | | (110,000 | ) | | | (215,000 | ) |
| Shares Outstanding, End of Year/Period | | | 145,000 | | | | 215,000 | | | | 1,780,000 | |
| (1) | Formerly known as AdvisorShares FolioBeyond Smart Core Bond ETF. |
| * | Commencement of operations. |
See accompanying Notes to Financial Statements.
ADVISORSHARES TRUST
Statements of Changes in Net Assets
| | | AdvisorShares
Psychedelics
ETF | | | AdvisorShares
Pure Cannabis
ETF | |
| | | For the period
September 16,
2021* to
June 30,
2022 | | | Year ended
June 30,
2022 | | | Year ended
June 30,
2021 | |
| INCREASE (DECREASE) IN NET ASSETS | | | | | | | | | | | | |
| OPERATIONS | | | | | | | | | | | | |
| Net Investment Income (Loss) | | $ | (22,971 | ) | | $ | 213,406 | | | $ | 444,125 | |
| Net Realized Gain (Loss) | | | (1,462,994 | ) | | | (50,275,886 | ) | | | 35,943,090 | |
| Net Change in Unrealized Appreciation (Depreciation) | | | (7,014,064 | ) | | | (177,754,807 | ) | | | 17,051,093 | |
| Net Increase (Decrease) In Net Assets Resulting From Operations | | | (8,500,029 | ) | | | (227,817,287 | ) | | | 53,438,308 | |
| DISTRIBUTIONS TO SHAREHOLDERS | | | | | | | | | | | | |
| Distributions | | | — | | | | (7,501,781 | ) | | | (728,447 | ) |
| Return of Capital | | | — | | | | (252,376 | ) | | | — | |
| Total Distributions | | | — | | | | (7,754,157 | ) | | | (728,447 | ) |
| CAPITAL STOCK TRANSACTIONS | | | | | | | | | | | | |
| Proceeds from Shares Issued | | | 14,008,733 | | | | 1,430,696 | | | | 295,185,617 | |
| Value of Shares Redeemed | | | — | | | | (48,450,969 | ) | | | (38,990,037 | ) |
| Net Increase (Decrease) From Capital Stock Transactions | | | 14,008,733 | | | | (47,020,273 | ) | | | 256,195,580 | |
| Net Increase (Decrease) in Net Assets | | | 5,508,704 | | | | (282,591,717 | ) | | | 308,905,441 | |
| Net Assets: | | | | | | | | | | | | |
| Beginning of Year/Period | | | — | | | | 354,408,269 | | | | 45,502,828 | |
| End of Year/Period | | $ | 5,508,704 | | | $ | 71,816,552 | | | $ | 354,408,269 | |
| Changes in Shares Outstanding | | | | | | | | | | | | |
| Shares Outstanding, Beginning of Year/Period | | | — | | | | 16,755,000 | | | | 4,475,000 | |
| Shares Sold | | | 2,155,000 | | | | 210,000 | | | | 13,935,000 | |
| Shares Repurchased | | | — | | | | (3,360,000 | ) | | | (1,655,000 | ) |
| Shares Outstanding, End of Year/Period | | | 2,155,000 | | | | 13,605,000 | | | | 16,755,000 | |
| * | Commencement of operations. |
See accompanying Notes to Financial Statements.
ADVISORSHARES TRUST
Statements of Changes in Net Assets
| | | AdvisorShares
Pure US Cannabis
ETF | | | AdvisorShares
Q ynamic Growth
ETF | |
| | | Year ended
June 30,
2022 | | | For the period
September 1,
2020* to
June 30,
2021 | | | Year ended
June 30,
2022 | | | For the period
December 28,
2020* to
June 30,
2021 | |
| INCREASE (DECREASE) IN NET ASSETS | | | | | | | | | | | | | | | | |
| OPERATIONS | | | | | | | | | | | | | | | | |
| Net Investment Income (Loss) | | $ | (3,686,647 | ) | | $ | (2,315,252 | ) | | $ | (474,657 | ) | | $ | (115,613 | ) |
| Net Realized Gain (Loss) | | | (722,687,915 | ) | | | 6,245,620 | | | | (4,864,676 | ) | | | (585,027 | ) |
| Net Change in Unrealized Appreciation (Depreciation) | | | (472,948,355 | ) | | | (64,676,943 | ) | | | (15,140,779 | ) | | | 4,890,511 | |
| Net Increase (Decrease) In Net Assets Resulting From Operations | | | (1,199,322,917 | ) | | | (60,746,575 | ) | | | (20,480,112 | ) | | | 4,189,871 | |
| DISTRIBUTIONS TO SHAREHOLDERS | | | | | | | | | | | | | | | | |
| Distributions | | | (3,055,414 | ) | | | — | | | | — | | | | — | |
| Total Distributions | | | (3,055,414 | ) | | | — | | | | — | | | | — | |
| CAPITAL STOCK TRANSACTIONS | | | | | | | | | | | | | | | | |
| Proceeds from Shares Issued | | | 968,257,354 | | | | 1,101,452,333 | | | | 55,320,778 | | | | 64,573,046 | |
| Value of Shares Redeemed | | | (201,882,496 | ) | | | (90,011,263 | ) | | | (63,304,550 | ) | | | — | |
| Net Increase (Decrease) From Capital Stock Transactions | | | 766,374,858 | | | | 1,011,441,070 | | | | (7,983,772 | ) | | | 64,573,046 | |
| Net Increase (Decrease) in Net Assets | | | (436,003,473 | ) | | | 950,694,495 | | | | (28,463,884 | ) | | | 68,762,917 | |
| Net Assets: | | | | | | | | | | | | | | | | |
| Beginning of Year/Period | | | 950,694,495 | | | | — | | | | 68,762,917 | | | | — | |
| End of Year/Period | | $ | 514,691,022 | | | $ | 950,694,495 | | | $ | 40,299,033 | | | $ | 68,762,917 | |
| Changes in Shares Outstanding | | | | | | | | | | | | | | | | |
| Shares Outstanding, Beginning of Year/Period | | | 23,640,000 | | | | — | | | | 2,445,000 | | | | — | |
| Shares Sold | | | 34,520,000 | | | | 25,900,000 | | | | 1,885,000 | | | | 2,445,000 | |
| Shares Repurchased | | | (8,420,000 | ) | | | (2,260,000 | ) | | | (2,500,000 | ) | | | — | |
| Shares Outstanding, End of Year/Period | | | 49,740,000 | | | | 23,640,000 | | | | 1,830,000 | | | | 2,445,000 | |
| * | Commencement of operations. |
See accompanying Notes to Financial Statements.
ADVISORSHARES TRUST
Statements of Changes in Net Assets
| | | AdvisorShares
Q Portfolio Blended Allocation
ETF | | | AdvisorShares
Ranger Equity Bear
ETF(1) | |
| | | Year ended
June 30,
2022 | | | For the period
December 28,
2020* to
June 30,
2021 | | | Year ended
June 30,
2022 | | | Year ended
June 30,
2021 | |
| INCREASE (DECREASE) IN NET ASSETS | | | | | | | | | | | | | | | | |
| OPERATIONS | | | | | | | | | | | | | | | | |
| Net Investment Income (Loss) | | $ | 8,042 | | | $ | 1,165 | | | $ | (3,180,143 | ) | | $ | (4,083,134 | ) |
| Net Realized Gain (Loss) | | | (530,487 | ) | | | (378,559 | ) | | | 26,673,974 | | | | (65,099,412 | ) |
| Net Change in Unrealized Appreciation (Depreciation) | | | (554,167 | ) | | | 183,310 | | | | 11,102,644 | | | | 1,581,889 | |
| Net Increase (Decrease) In Net Assets Resulting From Operations | | | (1,076,612 | ) | | | (194,084 | ) | | | 34,596,475 | | | | (67,600,657 | ) |
| DISTRIBUTIONS TO SHAREHOLDERS | | | | | | | | | | | | | | | | |
| Distributions | | | (16,342 | ) | | | — | | | | — | | | | — | |
| Total Distributions | | | (16,342 | ) | | | — | | | | — | | | | — | |
| CAPITAL STOCK TRANSACTIONS | | | | | | | | | | | | | | | | |
| Proceeds from Shares Issued | | | 2,689,075 | | | | 10,699,062 | | | | 131,971,269 | | | | 44,585,473 | |
| Value of Shares Redeemed | | | (2,396,849 | ) | | | (7,026,396 | ) | | | (51,038,274 | ) | | | (88,348,866 | ) |
| Net Increase (Decrease) From Capital Stock Transactions | | | 292,226 | | | | 3,672,666 | | | | 80,932,995 | | | | (43,763,393 | ) |
| Net Increase (Decrease) in Net Assets | | | (800,728 | ) | | | 3,478,582 | | | | 115,529,470 | | | | (111,364,050 | ) |
| Net Assets: | | | | | | | | | | | | | | | | |
| Beginning of Year/Period | | | 3,478,582 | | | | — | | | | 50,655,273 | | | | 162,019,323 | |
| End of Year/Period | | $ | 2,677,854 | | | $ | 3,478,582 | | | $ | 166,184,743 | | | $ | 50,655,273 | |
| Changes in Shares Outstanding | | | | | | | | | | | | | | | | |
| Shares Outstanding, Beginning of Year/Period | | | 135,000 | | | | — | | | | 2,202,500 | | | | 3,337,500 | |
| Shares Sold | | | 100,000 | | | | 430,000 | | | | 4,975,000 | | | | 1,300,000 | |
| Shares Repurchased | | | (105,000 | ) | | | (295,000 | ) | | | (1,960,000 | ) | | | (2,435,000 | ) |
| Shares Outstanding, End of Year/Period | | | 130,000 | | | | 135,000 | | | | 5,217,500 | | | | 2,202,500 | |
| * | Commencement of operations. |
| (1) | After the close of business on February 5, 2021, the Fund’s applicable class underwent a reverse stock split.The per share data presented here has been retroactively adjusted to reflect this split.See Note 1 of the Notes to Financial Statements. |
See accompanying Notes to Financial Statements.
ADVISORSHARES TRUST
Statements of Changes in Net Assets
| | | AdvisorShares
Restaurant
ETF | | | AdvisorShares
STAR Global Buy-Write
ETF | |
| | | Year ended
June 30,
2022 | | | For the period
April 20,
2021* to
June 30,
2021 | | | Year ended
June 30,
2022 | | | Year ended
June 30,
2021 | |
| INCREASE (DECREASE) IN NET ASSETS | | | | | | | | | | | | | | | | |
| OPERATIONS | | | | | | | | | | | | | | | | |
| Net Investment Income (Loss) | | $ | 24,320 | | | $ | (194 | ) | | $ | 94,014 | | | $ | (53,752 | ) |
| Net Realized Gain (Loss) | | | (769,005 | ) | | | (37,625 | ) | | | 520,125 | | | | 3,452,454 | |
| Net Change in Unrealized Appreciation (Depreciation) | | | (517,861 | ) | | | (30,937 | ) | | | (5,826,783 | ) | | | (732,181 | ) |
| Net Increase (Decrease) In Net Assets Resulting From Operations | | | (1,262,546 | ) | | | (68,756 | ) | | | (5,212,644 | ) | | | 2,666,521 | |
| DISTRIBUTIONS TO SHAREHOLDERS | | | | | | | | | | | | | | | | |
| Distributions | | | (6,358 | ) | | | — | | | | (166,381 | ) | | | (36,638 | ) |
| Total Distributions | | | (6,358 | ) | | | — | | | | (166,381 | ) | | | (36,638 | ) |
| CAPITAL STOCK TRANSACTIONS | | | | | | | | | | | | | | | | |
| Proceeds from Shares Issued | | | — | | | | 6,299,395 | | | | 25,014,673 | | | | 11,496,290 | |
| Value of Shares Redeemed | | | (2,088,536 | ) | | | (242,353 | ) | | | (411,757 | ) | | | (8,684,765 | ) |
| Net Increase (Decrease) From Capital Stock Transactions | | | (2,088,536 | ) | | | 6,057,042 | | | | 24,602,916 | | | | 2,811,525 | |
| Net Increase (Decrease) in Net Assets | | | (3,357,440 | ) | | | 5,988,286 | | | | 19,223,891 | | | | 5,441,408 | |
| Net Assets: | | | | | | | | | | | | | | | | |
| Beginning of Year/Period | | | 5,988,286 | | | | — | | | | 18,323,144 | | | | 12,881,736 | |
| End of Year/Period | | $ | 2,630,846 | | | $ | 5,988,286 | | | $ | 37,547,035 | | | $ | 18,323,144 | |
| Changes in Shares Outstanding | | | | | | | | | | | | | | | | |
| Shares Outstanding, Beginning of Year/Period | | | 245,000 | | | | — | | | | 460,000 | | | | 400,000 | |
| Shares Sold | | | — | | | | 255,000 | | | | 635,000 | | | | 290,000 | |
| Shares Repurchased | | | (90,000 | ) | | | (10,000 | ) | | | (10,000 | ) | | | (230,000 | ) |
| Shares Outstanding, End of Year/Period | | | 155,000 | | | | 245,000 | | | | 1,085,000 | | | | 460,000 | |
| * | Commencement of operations. |
See accompanying Notes to Financial Statements.
ADVISORSHARES TRUST
Statements of Changes in Net Assets
| | | AdvisorShares Vice ETF | |
| | | Year ended
June 30,
2022 | | | Year ended
June 30,
2021 | |
| INCREASE (DECREASE) IN NET ASSETS | | | | | | | | |
| OPERATIONS | | | | | | | | |
| Net Investment Income (Loss) | | $ | 66,995 | | | $ | 72,734 | |
| Net Realized Gain (Loss) | | | (126,093 | ) | | | 1,636,316 | |
| Net Change in Unrealized Appreciation (Depreciation) | | | (3,846,483 | ) | | | 3,470,745 | |
| Net Increase (Decrease) In Net Assets Resulting From Operations | | | (3,905,581 | ) | | | 5,179,795 | |
| DISTRIBUTIONS TO SHAREHOLDERS | | | | | | | | |
| Distributions | | | (118,472 | ) | | | (128,419 | ) |
| Total Distributions | | | (118,472 | ) | | | (128,419 | ) |
| CAPITAL STOCK TRANSACTIONS | | | | | | | | |
| Proceeds from Shares Issued | | | — | | | | 1,682,551 | |
| Value of Shares Redeemed | | | (1,170,108 | ) | | | (1,970,784 | ) |
| Net Increase (Decrease) From Capital Stock Transactions | | | (1,170,108 | ) | | | (288,233 | ) |
| Net Increase (Decrease) in Net Assets | | | (5,194,161 | ) | | | 4,763,143 | |
| Net Assets: | | | | | | | | |
| Beginning of Year/Period | | | 13,888,720 | | | | 9,125,577 | |
| End of Year/Period | | $ | 8,694,559 | | | $ | 13,888,720 | |
| Changes in Shares Outstanding | | | | | | | | |
| Shares Outstanding, Beginning of Year/Period | | | 385,000 | | | | 400,000 | |
| Shares Sold | | | — | | | | 50,000 | |
| Shares Repurchased | | | (40,000 | ) | | | (65,000 | ) |
| Shares Outstanding, End of Year/Period | | | 345,000 | | | | 385,000 | |
See accompanying Notes to Financial Statements.
ADVISORSHARES TRUST
Financial Highlights
| | | | | | For the period
February 2, | |
| | | Year ended
June 30, | | | 2021* to
June 30, | |
| AdvisorShares Alpha DNA Equity Sentiment ETF | | 2022 | | | 2021 | |
| Selected Data for a Share of Capital Stock Outstanding | | | | | | | | |
| Net Asset Value, Beginning of Year/Period | | $ | 27.58 | | | $ | 25.35 | |
| Investment Operations | | | | | | | | |
| Net Investment Loss(1) | | | (0.01 | ) | | | (0.07 | ) |
| Net Realized and Unrealized Gain (Loss) | | | (6.76 | ) | | | 2.30 | |
| Net Increase (Decrease) in Net Assets Resulting from Investment Operations(2) | | | (6.77 | ) | | | 2.23 | |
| Net Asset Value, End of Year/Period | | $ | 20.81 | | | $ | 27.58 | |
| Market Value, End of Year/Period | | $ | 20.73 | | | $ | 27.58 | |
| Total Return | | | | | | | | |
| Total Investment Return Based on Net Asset Value(3) | | | (24.53 | )% | | | 8.78 | % |
| Total Investment Return Based on Market(3) | | | (24.84 | )% | | | 8.80 | % |
| Ratios/Supplemental Data | | | | | | | | |
| Net Assets, End of Year/Period (000’s omitted) | | $ | 50,573 | | | $ | 69,907 | |
| Ratio to Average Net Assets of: | | | | | | | | |
| Expenses, net of expense waivers and reimbursements(4) | | | 0.98 | % | | | 1.08 | % |
| Expenses, prior to expense waivers and reimbursements(4) | | | 0.98 | % | | | 1.08 | % |
| Net Investment Loss(4) | | | (0.06 | )% | | | (0.67 | )% |
| Portfolio Turnover Rate(5) | | | 537 | % | | | 244 | % |
| | | Years Ended June 30, | |
| AdvisorShares Dorsey Wright ADR ETF | | 2022 | | | 2021 | | | 2020 | | | 2019 | | | 2018 | |
| Selected Data for a Share of Capital Stock Outstanding | | | | | | | | | | | | | | | | | | | | |
| Net Asset Value, Beginning of Year/Period | | $ | 66.54 | | | $ | 53.25 | | | $ | 49.75 | | | $ | 53.34 | | | $ | 46.56 | |
| Investment Operations | | | | | | | | | | | | | | | | | | | | |
| Net Investment Income (Loss)(1) | | | 1.62 | | | | 0.27 | | | | (0.03 | ) | | | 0.23 | | | | 0.55 | |
| Net Realized and Unrealized Gain (Loss) | | | (18.48 | ) | | | 13.23 | | | | 3.54 | | | | (3.51 | ) | | | 6.66 | |
| Net Increase (Decrease) in Net Assets Resulting from Investment Operations(2) | | | (16.86 | ) | | | 13.50 | | | | 3.51 | | | | (3.28 | ) | | | 7.21 | |
| Distributions from Net Investment Income | | | (1.20 | ) | | | (0.21 | ) | | | (0.01 | ) | | | (0.31 | ) | | | (0.43 | ) |
| Total Distributions | | | (1.20 | ) | | | (0.21 | ) | | | (0.01 | ) | | | (0.31 | ) | | | (0.43 | ) |
| Net Asset Value, End of Year/Period | | $ | 48.48 | | | $ | 66.54 | | | $ | 53.25 | | | $ | 49.75 | | | $ | 53.34 | |
| Market Value, End of Year/Period | | $ | 48.47 | | | $ | 66.49 | | | $ | 52.97 | | | $ | 49.69 | | | $ | 53.19 | |
| Total Return | | | | | | | | | | | | | | | | | | | | |
| Total Investment Return Based on Net Asset Value(3) | | | (25.51 | )% | | | 25.39 | % | | | 7.06 | % | | | (6.16 | )% | | | 15.45 | % |
| Total Investment Return Based on Market(3) | | | (25.45 | )% | | | 25.95 | % | | | 6.62 | % | | | (6.00 | )% | | | 15.01 | % |
| Ratios/Supplemental Data | | | | | | | | | | | | | | | | | | | | |
| Net Assets, End of Year/Period (000’s omitted) | | $ | 41,938 | | | $ | 88,836 | | | $ | 75,879 | | | $ | 108,198 | | | $ | 246,701 | |
| Ratio to Average Net Assets of: | | | | | | | | | | | | | | | | | | | | |
| Expenses, net of expense waivers and reimbursements(4) | | | 0.99 | % | | | 1.10 | % | | | 1.02 | % | | | 0.88 | % | | | 1.02 | % |
| Expenses, prior to expense waivers and reimbursements(4) | | | 1.00 | % | | | 0.96 | % | | | 0.97 | % | | | 1.07 | % | | | 0.95 | % |
| Net Investment Income (Loss)(4) | | | 2.59 | % | | | 0.44 | % | | | (0.06 | )% | | | 0.47 | % | | | 0.96 | % |
| Portfolio Turnover Rate(5) | | | 79 | % | | | 85 | % | | | 48 | % | | | 120 | % | | | 71 | % |
| * | Commencement of operations. |
| (1) | Based on average shares outstanding. |
| (2) | The amount shown for a share distribution throughout the period may not correlate with the Statement of Operations for the period due to the timing of sales and repurchases of Fund Shares in relation to income earned and/or fluctuating fair value of the investments of the Fund. |
| (3) | Net asset value total investment return is calculated assuming an initial investment made at the net asset value at the beginning of the period, reinvestment of all dividends and distributions on ex-date, if any, at net asset value during the period, and redemption on the last day of the period. Periods less than one year are not annualized. Market value total return is calculated assuming an initial investment made at the market value at the beginning of the period, reinvestment of all dividends and distributions at market value during the period on pay date, and sale at the market value on the last day of the period. |
| (4) | Ratios of periods of less than one year have been annualized. Excludes expenses incurred by the underlying investments in other funds. |
| (5) | Portfolio turnover rate is not annualized and excludes the value of portfolio securities received or delivered as in-kind creations or redemptions of the Fund’s capital shares. |
See accompanying Notes to Financial Statements.
ADVISORSHARES TRUST
Financial Highlights
| | | Years Ended | | | For the period
December 26,
2019* to | |
| | | June 30, | | | June 30, | |
| AdvisorShares Dorsey Wright Alpha Equal Weight ETF | | 2022 | | | 2021 | | | 2020 | |
| Selected Data for a Share of Capital Stock Outstanding | | | | | | | | | | | | |
| Net Asset Value, Beginning of Year/Period | | $ | 27.86 | | | $ | 20.43 | | | $ | 25.09 | |
| Investment Operations | | | | | | | | | | | | |
| Net Investment Income (Loss)(1) | | | (0.01 | ) | | | (0.11 | ) | | | 0.01 | |
| Net Realized and Unrealized Gain (Loss) | | | (6.73 | ) | | | 7.55 | | | | (4.67 | ) |
| Net Increase (Decrease) in Net Assets Resulting from Investment Operations(2) | | | (6.74 | ) | | | 7.44 | | | | (4.66 | ) |
| Distributions from Net Investment Income | | | — | | | | (0.01 | ) | | | — | |
| Distributions from Realized Capital Gains | | | (0.39 | ) | | | — | | | | — | |
| Total Distributions | | | (0.39 | ) | | | (0.01 | ) | | | — | |
| Net Asset Value, End of Year/Period | | $ | 20.73 | | | $ | 27.86 | | | $ | 20.43 | |
| Market Value, End of Year/Period | | $ | 20.68 | | | $ | 27.90 | | | $ | 20.44 | |
| Total Return | | | | | | | | | | | | |
| Total Investment Return Based on Net Asset Value(3) | | | (24.56 | )% | | | 36.36 | % | | | (18.57 | )% |
| Total Investment Return Based on Market(3) | | | (24.85 | )% | | | 36.52 | % | | | (18.53 | )% |
| Ratios/Supplemental Data | | | | | | | | | | | | |
| Net Assets, End of Year/Period (000’s omitted) | | $ | 42,697 | | | $ | 79,394 | | | $ | 39,333 | |
| Ratio to Average Net Assets of: | | | | | | | | | | | | |
| Expenses, net of expense waivers and reimbursements(4) | | | 0.93 | % | | | 0.96 | % | | | 0.99 | % |
| Expenses, prior to expense waivers and reimbursements(4) | | | 1.00 | % | | | 0.91 | % | | | 1.19 | % |
| Net Investment Income (Loss)(4) | | | (0.03 | )% | | | (0.42 | )% | | | 0.09 | % |
| Portfolio Turnover Rate(5) | | | 495 | % | | | 372 | % | | | 147 | % |
| | | Years Ended | | | For the period
December 26,
2019* to | |
| | | June 30, | | | June 30, | |
| AdvisorShares Dorsey Wright FSM All Cap World ETF | | 2022 | | | 2021 | | | 2020 | |
| Selected Data for a Share of Capital Stock Outstanding | | | | | | | | | | | | |
| Net Asset Value, Beginning of Year/Period | | $ | 36.63 | | | $ | 28.07 | | | $ | 25.12 | |
| Investment Operations | | | | | | | | | | | | |
| Net Investment Income (Loss)(1) | | | 0.01 | | | | (0.12 | ) | | | (0.02 | ) |
| Net Realized and Unrealized Gain (Loss) | | | (5.76 | ) | | | 8.74 | | | | 2.97 | |
| Net Increase (Decrease) in Net Assets Resulting from Investment Operations(2) | | | (5.75 | ) | | | 8.62 | | | | 2.95 | |
| Distributions from Realized Capital Gains | | | (0.55 | ) | | | (0.06 | ) | | | — | |
| Total Distributions | | | (0.55 | ) | | | (0.06 | ) | | | — | |
| Net Asset Value, End of Year/Period | | $ | 30.33 | | | $ | 36.63 | | | $ | 28.07 | |
| Market Value, End of Year/Period | | $ | 30.34 | | | $ | 36.67 | | | $ | 28.07 | |
| Total Return | | | | | | | | | | | | |
| Total Investment Return Based on Net Asset Value(3) | | | (15.98 | )% | | | 30.70 | % | | | 11.76 | % |
| Total Investment Return Based on Market(3) | | | (16.06 | )% | | | 30.85 | % | | | 11.74 | % |
| Ratios/Supplemental Data | | | | | | | | | | | | |
| Net Assets, End of Year/Period (000’s omitted) | | $ | 84,177 | | | $ | 155,673 | | | $ | 73,685 | |
| Ratio to Average Net Assets of:(6) | | | | | | | | | | | | |
| Expenses, net of expense waivers and reimbursements(4) | | | 0.91 | % | | | 0.88 | % | | | 0.99 | % |
| Expenses, prior to expense waivers and reimbursements(4) | | | 0.94 | % | | | 0.86 | % | | | 1.12 | % |
| Net Investment Income (Loss)(4) | | | 0.02 | % | | | (0.34 | )% | | | (0.17 | )% |
| Portfolio Turnover Rate(5) | | | 244 | % | | | 209 | % | | | 46 | % |
| * | Commencement of operations. |
| (1) | Based on average shares outstanding. |
| (2) | The amount shown for a share distribution throughout the period may not correlate with the Statement of Operations for the period due to the timing of sales and repurchases of Fund Shares in relation to income earned and/or fluctuating fair value of the investments of the Fund. |
| (3) | Net asset value total investment return is calculated assuming an initial investment made at the net asset value at the beginning of the period, reinvestment of all dividends and distributions on ex-date, if any, at net asset value during the period, and redemption on the last day of the period. Periods less than one year are not annualized. Market value total return is calculated assuming an initial investment made at the market value at the beginning of the period, reinvestment of all dividends and distributions at market value during the period on pay date, and sale at the market value on the last day of the period. |
| (4) | Ratios of periods of less than one year have been annualized. Excludes expenses incurred by the underlying investments in other funds. |
| (5) | Portfolio turnover rate is not annualized and excludes the value of portfolio securities received or delivered as in-kind creations or redemptions of the Fund’s capital shares. |
| (6) | The Fund invests in other funds and indirectly bear their proportionate shares of fees and expenses incurred by the funds in which the Fund is invested. These ratios do not include these indirect fees and expenses. |
See accompanying Notes to Financial Statements.
ADVISORSHARES TRUST
Financial Highlights
| | | Years Ended | | | For the period
December 26,
2019* to | |
| | | June 30, | | | June 30, | |
| AdvisorShares Dorsey Wright FSM US Core ETF | | 2022 | | | 2021 | | | 2020 | |
| Selected Data for a Share of Capital Stock Outstanding | | | | | | | | | | | | |
| Net Asset Value, Beginning of Year/Period | | $ | 37.09 | | | $ | 27.51 | | | $ | 25.14 | |
| Investment Operations | | | | | | | | | | | | |
| Net Investment Income (Loss)(1) | | | 0.11 | | | | (0.07 | ) | | | 0.05 | |
| Net Realized and Unrealized Gain (Loss) | | | (4.90 | ) | | | 9.72 | | | | 2.32 | |
| Net Increase (Decrease) in Net Assets Resulting from Investment Operations(2) | | | (4.79 | ) | | | 9.65 | | | | 2.37 | |
| Distributions from Net Investment Income | | | — | | | | (0.03 | ) | | | — | |
| Distributions from Realized Capital Gains | | | (0.14 | ) | | | (0.04 | ) | | | — | |
| Total Distributions | | | (0.14 | ) | | | (0.07 | ) | | | — | |
| Net Asset Value, End of Year/Period | | $ | 32.16 | | | $ | 37.09 | | | $ | 27.51 | |
| Market Value, End of Year/Period | | $ | 32.08 | | | $ | 37.16 | | | $ | 27.46 | |
| Total Return | | | | | | | | | | | | |
| Total Investment Return Based on Net Asset Value(3) | | | (12.97 | )% | | | 35.08 | % | | | 9.43 | % |
| Total Investment Return Based on Market(3) | | | (13.36 | )% | | | 35.59 | % | | | 9.23 | % |
| Ratios/Supplemental Data | | | | | | | | | | | | |
| Net Assets, End of Year/Period (000’s omitted) | | $ | 79,764 | | | $ | 93,649 | | | $ | 46,767 | |
| Ratio to Average Net Assets of:(4) | | | | | | | | | | | | |
| Expenses, net of expense waivers and reimbursements(5) | | | 0.93 | % | | | 0.92 | % | | | 0.99 | % |
| Expenses, prior to expense waivers and reimbursements(5) | | | 0.95 | % | | | 0.89 | % | | | 1.15 | % |
| Net Investment Income (Loss)(5) | | | 0.28 | % | | | (0.22 | )% | | | 0.37 | % |
| Portfolio Turnover Rate(6) | | | 50 | % | | | 64 | % | | | 53 | % |
| | | | | | For the period
July 11,
2018* to | |
| | | Years Ended June 30, | | | June 30, | |
| AdvisorShares Dorsey Wright Micro-Cap ETF | | 2022 | | | 2021 | | | 2020 | | | 2019 | |
| Selected Data for a Share of Capital Stock Outstanding | | | | | | | | | | | | | | | | |
| Net Asset Value, Beginning of Year/Period | | $ | 37.87 | | | $ | 21.12 | | | $ | 23.04 | | | $ | 24.71 | |
| Investment Operations | | | | | | | | | | | | | | | | |
| Net Investment Income (Loss)(1) | | | 0.16 | | | | (0.04 | ) | | | (0.01 | ) | | | (0.02 | ) |
| Net Realized and Unrealized Gain (Loss) | | | (7.77 | ) | | | 16.79 | | | | (1.89 | ) | | | (1.65 | ) |
| Net Increase (Decrease) in Net Assets Resulting from Investment Operations(2) | | | (7.61 | ) | | | 16.75 | | | | (1.90 | ) | | | (1.67 | ) |
| Distributions from Net Investment Income | | | (0.13 | ) | | | — | | | | (0.02 | ) | | | — | |
| Return of Capital | | | (0.03 | ) | | | — | | | | — | | | | — | |
| Total Distributions | | | (0.16 | ) | | | — | | | | (0.02 | ) | | | — | |
| Net Asset Value, End of Year/Period | | $ | 30.10 | | | $ | 37.87 | | | $ | 21.12 | | | $ | 23.04 | |
| Market Value, End of Year/Period | | $ | 29.84 | | | $ | 37.92 | | | $ | 20.80 | | | $ | 23.02 | |
| Total Return | | | | | | | | | | | | | | | | |
| Total Investment Return Based on Net Asset Value(3) | | | (20.17 | )% | | | 79.33 | % | | | (8.26 | )% | | | (6.79 | )% |
| Total Investment Return Based on Market(3) | | | (20.99 | )% | | | 82.31 | % | | | (9.58 | )% | | | (6.86 | )% |
| Ratios/Supplemental Data | | | | | | | | | | | | | | | | |
| Net Assets, End of Year/Period (000’s omitted) | | $ | 7,376 | | | $ | 8,899 | | | $ | 2,112 | | | $ | 2,304 | |
| Ratio to Average Net Assets of: | | | | | | | | | | | | | | | | |
| Expenses, net of expense waivers and reimbursements(5) | | | 1.25 | % | | | 1.25 | % | | | 1.17 | % | | | 0.99 | % |
| Expenses, prior to expense waivers and reimbursements(5) | | | 1.95 | % | | | 3.17 | % | | | 4.98 | % | | | 4.79 | % |
| Net Investment Income (Loss)(5) | | | 0.45 | % | | | (0.12 | )% | | | (0.05 | )% | | | (0.11 | )% |
| Portfolio Turnover Rate(6) | | | 104 | % | | | 163 | % | | | 119 | % | | | 103 | % |
| * | Commencement of operations. |
| (1) | Based on average shares outstanding. |
| (2) | The amount shown for a share distribution throughout the period may not correlate with the Statement of Operations for the period due to the timing of sales and repurchases of Fund Shares in relation to income earned and/or fluctuating fair value of the investments of the Fund. |
| (3) | Net asset value total investment return is calculated assuming an initial investment made at the net asset value at the beginning of the period, reinvestment of all dividends and distributions on ex-date, if any, at net asset value during the period, and redemption on the last day of the period. Periods less than one year are not annualized. Market value total return is calculated assuming an initial investment made at the market value at the beginning of the period, reinvestment of all dividends and distributions at market value during the period on pay date, and sale at the market value on the last day of the period. |
| (4) | The Fund invests in other funds and indirectly bear their proportionate shares of fees and expenses incurred by the funds in which the Fund is invested. These ratios do not include these indirect fees and expenses. |
| (5) | Ratios of periods of less than one year have been annualized. Excludes expenses incurred by the underlying investments in other funds. |
| (6) | Portfolio turnover rate is not annualized and excludes the value of portfolio securities received or delivered as in-kind creations or redemptions of the Fund’s capital shares. |
See accompanying Notes to Financial Statements.
ADVISORSHARES TRUST
Financial Highlights
| | | | | | For the period
July 11,
2018* to | |
| | | Years Ended June 30, | | | June 30, | |
| AdvisorShares Dorsey Wright Short ETF | | 2022 | | | 2021 | | | 2020 | | | 2019 | |
| Selected Data for a Share of Capital Stock Outstanding | | | | | | | | | | | | | | | | |
| Net Asset Value, Beginning of Year/Period | | $ | 8.59 | | | $ | 19.33 | | | $ | 24.90 | | | $ | 25.00 | |
| Investment Operations | | | | | | | | | | | | | | | | |
| Net Investment Income (Loss)(1) | | | (0.21 | ) | | | (0.46 | ) | | | (0.65 | ) | | | 0.13 | |
| Net Realized and Unrealized Gain (Loss) | | | 2.11 | | | | (10.28 | ) | | | (4.89 | ) | | | (0.19 | ) |
| Net Increase (Decrease) in Net Assets Resulting from Investment Operations(2) | | | 1.90 | | | | (10.74 | ) | | | (5.54 | ) | | | (0.06 | ) |
| Distributions from Net Investment Income | | | — | | | | — | | | | (0.03 | ) | | | (0.04 | ) |
| Total Distributions | | | — | | | | — | | | | (0.03 | ) | | | (0.04 | ) |
| Net Asset Value, End of Year/Period | | $ | 10.49 | | | $ | 8.59 | | | $ | 19.33 | | | $ | 24.90 | |
| Market Value, End of Year/Period | | $ | 10.45 | | | $ | 8.56 | | | $ | 19.36 | | | $ | 24.93 | |
| Total Return | | | | | | | | | | | | | | | | |
| Total Investment Return Based on Net Asset Value(3) | | | 22.15 | % | | | (55.58 | )% | | | (22.26 | )% | | | (0.27 | )% |
| Total Investment Return Based on Market(3) | | | 22.08 | % | | | (55.79 | )% | | | (22.24 | )% | | | (0.18 | )% |
| Ratios/Supplemental Data | | | | | | | | | | | | | | | | |
| Net Assets, End of Year/Period (000’s omitted) | | $ | 46,999 | | | $ | 25,164 | | | $ | 113,098 | | | $ | 24,281 | |
| Ratio to Average Net Assets of: | | | | | | | | | | | | | | | | |
| Expenses, net of expense waivers and reimbursements(4) | | | 2.71 | %(5) | | | 3.48 | %(5) | | | 3.56 | %(5) | | | 2.70 | %(5) |
| Expenses, prior to expense waivers and reimbursements(4) | | | 2.63 | %(5) | | | 3.55 | %(5) | | | 3.56 | %(5) | | | 3.26 | %(5) |
| Net Investment Income (Loss)(4) | | | (2.35 | )% | | | (3.18 | )% | | | (2.58 | )% | | | 0.53 | % |
| Portfolio Turnover Rate(6) | | | 190 | % | | | 243 | % | | | 555 | % | | | 357 | % |
| | | Years Ended June 30, | |
| AdvisorShares DoubleLine Value Equity ETF | | 2022 | | | 2021 | | | 2020 | | | 2019 | | | 2018 | |
| Selected Data for a Share of Capital Stock Outstanding | | | | | | | | | | | | | | | | | | | | |
| Net Asset Value, Beginning of Year/Period | | $ | 95.53 | | | $ | 66.37 | | | $ | 68.21 | | | $ | 67.88 | | | $ | 66.23 | |
| Investment Operations | | | | | | | | | | | | | | | | | | | | |
| Net Investment Income(1) | | | 1.10 | | | | 0.95 | | | | 0.82 | | | | 0.62 | | | | 0.53 | |
| Net Realized and Unrealized Gain (Loss) | | | (9.68 | ) | | | 29.23 | | | | (1.84 | ) | | | 0.45 | | | | 1.59 | |
| Net Increase (Decrease) in Net Assets Resulting from Investment Operations(2) | | | (8.58 | ) | | | 30.18 | | | | (1.02 | ) | | | 1.07 | | | | 2.12 | |
| Distributions from Net Investment Income | | | (1.06 | ) | | | (1.02 | ) | | | (0.82 | ) | | | (0.74 | ) | | | (0.47 | ) |
| Total Distributions | | | (1.06 | ) | | | (1.02 | ) | | | (0.82 | ) | | | (0.74 | ) | | | (0.47 | ) |
| Net Asset Value, End of Year/Period | | $ | 85.89 | | | $ | 95.53 | | | $ | 66.37 | | | $ | 68.21 | | | $ | 67.88 | |
| Market Value, End of Year/Period | | $ | 85.78 | | | $ | 95.41 | | | $ | 66.28 | | | $ | 68.13 | | | $ | 67.88 | |
| Total Return | | | | | | | | | | | | | | | | | | | | |
| Total Investment Return Based on Net Asset Value(3) | | | (9.12 | )% | | | 45.78 | % | | | (1.63 | )% | | | 1.74 | % | | | 3.15 | % |
| Total Investment Return Based on Market(3) | | | (9.12 | )% | | | 45.79 | % | | | (1.65 | )% | | | 1.63 | % | | | 3.26 | % |
| Ratios/Supplemental Data | | | | | | | | | | | | | | | | | | | | |
| Net Assets, End of Year/Period (000’s omitted) | | $ | 46,378 | | | $ | 48,243 | | | $ | 41,483 | | | $ | 61,386 | | | $ | 95,034 | |
| Ratio to Average Net Assets of: | | | | | | | | | | | | | | | | | | | | |
| Expenses, net of expense waivers and reimbursements(4) | | | 0.90 | % | | | 0.90 | % | | | 0.90 | % | | | 0.90 | % | | | 0.87 | % |
| Expenses, prior to expense waivers and reimbursements(4) | | | 0.96 | % | | | 1.05 | % | | | 1.07 | % | | | 1.17 | % | | | 1.07 | % |
| Net Investment Income(4) | | | 1.15 | % | | | 1.18 | % | | | 1.18 | % | | | 0.93 | % | | | 0.77 | % |
| Portfolio Turnover Rate(6) | | | 32 | % | | | 40 | % | | | 93 | % | | | 218 | % | | | 171 | % |
| * | Commencement of operations. |
| (1) | Based on average shares outstanding. |
| (2) | The amount shown for a share distribution throughout the period may not correlate with the Statement of Operations for the period due to the timing of sales and repurchases of Fund Shares in relation to income earned and/or fluctuating fair value of the investments of the Fund. |
| (3) | Net asset value total investment return is calculated assuming an initial investment made at the net asset value at the beginning of the period, reinvestment of all dividends and distributions on ex-date, if any, at net asset value during the period, and redemption on the last day of the period. Periods less than one year are not annualized. Market value total return is calculated assuming an initial investment made at the market value at the beginning of the period, reinvestment of all dividends and distributions at market value during the period on pay date, and sale at the market value on the last day of the period. |
| (4) | Ratios of periods of less than one year have been annualized. Excludes expenses incurred by the underlying investments in other funds. |
| (5) | The expense ratio includes interest and dividend expenses on short sales of 1.46%, 2.46%, 2.47% and 1.71% for the period ended June 30, 2022, June 30, 2021, June 30, 2020 and June 30, 2019, respectively. |
| (6) | Portfolio turnover rate is not annualized and excludes the value of portfolio securities received or delivered as in-kind creations or redemptions of the Fund’s capital shares. |
See accompanying Notes to Financial Statements.
ADVISORSHARES TRUST
Financial Highlights
| | | For the period
April 27,
2022* to | |
| | | June 30, | |
| AdvisorShares Drone Technology ETF | | 2022 | |
| Selected Data for a Share of Capital Stock Outstanding | | | | |
| Net Asset Value, Beginning of Year/Period | | $ | 25.00 | |
| Investment Operations | | | | |
| Net Investment Income(1) | | | 0.07 | |
| Net Realized and Unrealized Loss | | | (3.03 | ) |
| Net Decrease in Net Assets Resulting from Investment Operations(2) | | | (2.96 | ) |
| Net Asset Value, End of Year/Period | | $ | 22.04 | |
| Market Value, End of Year/Period | | $ | 22.03 | |
| Total Return | | | | |
| Total Investment Return Based on Net Asset Value(3) | | | (11.86 | )% |
| Total Investment Return Based on Market(3) | | | (11.88 | )% |
| Ratios/Supplemental Data | | | | |
| Net Assets, End of Year/Period (000’s omitted) | | $ | 551 | |
| Ratio to Average Net Assets of: | | | | |
| Expenses, net of expense waivers and reimbursements(4) | | | 0.99 | % |
| Expenses, prior to expense waivers and reimbursements(4) | | | 47.15 | % |
| Net Investment Income(4) | | | 1.75 | % |
| Portfolio Turnover Rate(5) | | | 13 | % |
| | | Years Ended June 30, | |
| AdvisorShares Focused Equity ETF | | 2022 | | | 2021 | | | 2020 | | | 2019 | | | 2018 | |
| Selected Data for a Share of Capital Stock Outstanding | | | | | | | | | | | | | | | | | | | | |
| Net Asset Value, Beginning of Year/Period | | $ | 46.65 | | | $ | 35.67 | | | $ | 34.42 | | | $ | 31.80 | | | $ | 28.59 | |
| Investment Operations | | | | | | | | | | | | | | | | | | | | |
| Net Investment Income(1) | | | 0.17 | | | | 0.10 | | | | 0.14 | | | | 0.16 | | | | 0.13 | |
| Net Realized and Unrealized Gain (Loss) | | | (4.49 | ) | | | 11.00 | | | | 1.26 | | | | 3.21 | | | | 3.17 | |
| Net Increase (Decrease) in Net Assets Resulting from Investment Operations(2) | | | (4.32 | ) | | | 11.10 | | | | 1.40 | | | | 3.37 | | | | 3.30 | |
| Distributions from Net Investment Income | | | (0.08 | ) | | | (0.12 | ) | | | (0.15 | ) | | | (0.16 | ) | | | (0.09 | ) |
| Distributions from Realized Capital Gains | | | — | | | | — | | | | — | | | | (0.59 | ) | | | — | |
| Total Distributions | | | (0.08 | ) | | | (0.12 | ) | | | (0.15 | ) | | | (0.75 | ) | | | (0.09 | ) |
| Net Asset Value, End of Year/Period | | $ | 42.25 | | | $ | 46.65 | | | $ | 35.67 | | | $ | 34.42 | | | $ | 31.80 | |
| Market Value, End of Year/Period | | $ | 42.21 | | | $ | 46.68 | | | $ | 34.88 | | | $ | 34.31 | | | $ | 31.79 | |
| Total Return | | | | | | | | | | | | | | | | | | | | |
| Total Investment Return Based on Net Asset Value(3) | | | (9.28 | )% | | | 31.15 | % | | | 4.02 | % | | | 11.09 | % | | | 11.57 | % |
| Total Investment Return Based on Market(3) | | | (9.44 | )% | | | 34.20 | % | | | 2.06 | % | | | 10.74 | % | | | 11.51 | % |
| Ratios/Supplemental Data | | | | | | | | | | | | | | | | | | | | |
| Net Assets, End of Year/Period (000’s omitted) | | $ | 28,098 | | | $ | 28,921 | | | $ | 19,616 | | | $ | 17,211 | | | $ | 14,311 | |
| Ratio to Average Net Assets of: | | | | | | | | | | | | | | | | | | | | |
| Expenses, net of expense waivers and reimbursements(4) | | | 0.65 | % | | | 0.66 | % | | | 0.77 | % | | | 0.72 | % | | | 0.68 | % |
| Expenses, prior to expense waivers and reimbursements(4) | | | 1.09 | % | | | 1.19 | % | | | 1.43 | % | | | 1.63 | % | | | 1.39 | % |
| Net Investment Income(4) | | | 0.36 | % | | | 0.24 | % | | | 0.41 | % | | | 0.49 | % | | | 0.42 | % |
| Portfolio Turnover Rate(5) | | | 24 | % | | | 25 | % | | | 23 | % | | | 19 | % | | | 26 | % |
| * | Commencement of operations. |
| (1) | Based on average shares outstanding. |
| (2) | The amount shown for a share distribution throughout the period may not correlate with the Statement of Operations for the period due to the timing of sales and repurchases of Fund Shares in relation to income earned and/or fluctuating fair value of the investments of the Fund. |
| (3) | Net asset value total investment return is calculated assuming an initial investment made at the net asset value at the beginning of the period, reinvestment of all dividends and distributions on ex-date, if any, at net asset value during the period, and redemption on the last day of the period. Periods less than one year are not annualized. Market value total return is calculated assuming an initial investment made at the market value at the beginning of the period, reinvestment of all dividends and distributions at market value during the period on pay date, and sale at the market value on the last day of the period. |
| (4) | Ratios of periods of less than one year have been annualized. Excludes expenses incurred by the underlying investments in other funds. |
| (5) | Portfolio turnover rate is not annualized and excludes the value of portfolio securities received or delivered as in-kind creations or redemptions of the Fund’s capital shares. |
See accompanying Notes to Financial Statements.
ADVISORSHARES TRUST
Financial Highlights
| | | For the period
July 2,
2021* to | |
| | | June 30, | |
| AdvisorShares Gerber Kawasaki ETF | | 2022 | |
| Selected Data for a Share of Capital Stock Outstanding | | | | |
| Net Asset Value, Beginning of Year/Period | | $ | 25.03 | |
| Investment Operations | | | | |
| Net Investment Income(1) | | | 0.07 | |
| Net Realized and Unrealized Loss | | | (8.75 | ) |
| Distributions of Net Realized Gains by other investment companies | | | 0.00 | (2) |
| Net Decrease in Net Assets Resulting from Investment Operations(3) | | | (8.68 | ) |
| Distributions from Net Investment Income | | | (0.01 | ) |
| Total Distributions | | | (0.01 | ) |
| Net Asset Value, End of Year/Period | | $ | 16.34 | |
| Market Value, End of Year/Period | | $ | 16.35 | |
| Total Return | | | | |
| Total Investment Return Based on Net Asset Value(4) | | | (34.71 | )% |
| Total Investment Return Based on Market(4) | | | (34.65 | )% |
| Ratios/Supplemental Data | | | | |
| Net Assets, End of Year/Period (000’s omitted) | | $ | 15,846 | |
| Ratio to Average Net Assets of: | | | | |
| Expenses, net of expense waivers and reimbursements(5) | | | 0.75 | % |
| Expenses, prior to expense waivers and reimbursements(5) | | | 1.37 | % |
| Net Investment Income(5) | | | 0.31 | % |
| Portfolio Turnover Rate(6) | | | 66 | % |
| | | Year ended | | | For the period
April 20,
2021* to | |
| | | June 30, | | | June 30, | |
| AdvisorShares Hotel ETF | | 2022 | | | 2021 | |
| Selected Data for a Share of Capital Stock Outstanding | | | | | | | | |
| Net Asset Value, Beginning of Year/Period | | $ | 24.52 | | | $ | 24.32 | |
| Investment Operations | | | | | | | | |
| Net Investment Income (Loss)(1) | | | (0.02 | ) | | | 0.13 | |
| Net Realized and Unrealized Gain (Loss) | | | (4.75 | ) | | | 0.07 | |
| Net Increase (Decrease) in Net Assets Resulting from Investment Operations(3) | | | (4.77 | ) | | | 0.20 | |
| Distributions from Net Investment Income | | | (0.09 | ) | | | — | |
| Total Distributions | | | (0.09 | ) | | | — | |
| Net Asset Value, End of Year/Period | | $ | 19.66 | | | $ | 24.52 | |
| Market Value, End of Year/Period | | $ | 19.61 | | | $ | 24.56 | |
| Total Return | | | | | | | | |
| Total Investment Return Based on Net Asset Value(4) | | | (19.54 | )% | | | 0.81 | % |
| Total Investment Return Based on Market(4) | | | (19.87 | )% | | | 0.99 | % |
| Ratios/Supplemental Data | | | | | | | | |
| Net Assets, End of Year/Period (000’s omitted) | | $ | 5,897 | | | $ | 7,724 | |
| Ratio to Average Net Assets of: | | | | | | | | |
| Expenses, net of expense waivers and reimbursements(5) | | | 0.99 | % | | | 0.99 | % |
| Expenses, prior to expense waivers and reimbursements(5) | | | 1.33 | % | | | 6.60 | % |
| Net Investment Income (Loss)(5) | | | (0.07 | )% | | | 2.70 | % |
| Portfolio Turnover Rate(6) | | | 74 | % | | | 21 | % |
| * | Commencement of operations. |
| (1) | Based on average shares outstanding. |
| (2) | Amount represents less than $0.005 or 0.005%. |
| (3) | The amount shown for a share distribution throughout the period may not correlate with the Statement of Operations for the period due to the timing of sales and repurchases of Fund Shares in relation to income earned and/or fluctuating fair value of the investments of the Fund. |
| (4) | Net asset value total investment return is calculated assuming an initial investment made at the net asset value at the beginning of the period, reinvestment of all dividends and distributions on ex-date, if any, at net asset value during the period, and redemption on the last day of the period. Periods less than one year are not annualized. Market value total return is calculated assuming an initial investment made at the market value at the beginning of the period, reinvestment of all dividends and distributions at market value during the period on pay date, and sale at the market value on the last day of the period. |
| (5) | Ratios of periods of less than one year have been annualized. Excludes expenses incurred by the underlying investments in other funds. |
| (6) | Portfolio turnover rate is not annualized and excludes the value of portfolio securities received or delivered as in-kind creations or redemptions of the Fund’s capital shares. |
See accompanying Notes to Financial Statements.
ADVISORSHARES TRUST
Financial Highlights
| | | For the period
February 9,
2022* to | |
| | | June 30, | |
| AdvisorShares Let Bob AI Powered Momentum ETF | | 2022 | |
| Selected Data for a Share of Capital Stock Outstanding | | | | |
| Net Asset Value, Beginning of Year/Period | | $ | 25.00 | |
| Investment Operations | | | | |
| Net Investment Loss(1) | | | (0.04 | ) |
| Net Realized and Unrealized Loss | | | (1.71 | ) |
| Net Decrease in Net Assets Resulting from Investment Operations(2) | | | (1.75 | ) |
| Net Asset Value, End of Year/Period | | $ | 23.25 | |
| Market Value, End of Year/Period | | $ | 23.22 | |
| Total Return | | | | |
| Total Investment Return Based on Net Asset Value(3) | | | (6.99 | )% |
| Total Investment Return Based on Market(3) | | | (7.12 | )% |
| Ratios/Supplemental Data | | | | |
| Net Assets, End of Year/Period (000’s omitted) | | $ | 24,183 | |
| Ratio to Average Net Assets of: | | | | |
| Expenses, net of expense waivers and reimbursements(4) | | | 0.99 | % |
| Expenses, prior to expense waivers and reimbursements(4) | | | 1.48 | % |
| Net Investment Loss(4) | | | (0.43 | )% |
| Portfolio Turnover Rate(6) | | | 497 | % |
| | | For the period
April 27,
2022* to | |
| | | June 30, | |
| AdvisorShares Managed Bitcoin Strategy ETF | | 2022 | |
| Selected Data for a Share of Capital Stock Outstanding | | | | |
| Net Asset Value, Beginning of Year/Period | | $ | 25.00 | |
| Investment Operations | | | | |
| Net Investment Loss(1) | | | (0.01 | ) |
| Net Realized and Unrealized Loss | | | (10.23 | ) |
| Net Decrease in Net Assets Resulting from Investment Operations(2) | | | (10.24 | ) |
| Net Asset Value, End of Year/Period | | $ | 14.76 | |
| Market Value, End of Year/Period | | $ | 14.73 | |
| Total Return | | | | |
| Total Investment Return Based on Net Asset Value(3) | | | (40.95 | )% |
| Total Investment Return Based on Market(3) | | | (41.08 | )% |
| Ratios/Supplemental Data | | | | |
| Net Assets, End of Year/Period (000’s omitted) | | $ | 517 | |
| Ratio to Average Net Assets of: (5) | | | | |
| Expenses, net of expense waivers and reimbursements(4) | | | 1.49 | % |
| Expenses, prior to expense waivers and reimbursements(4) | | | 59.15 | % |
| Net Investment Loss(4) | | | (0.37 | )% |
| Portfolio Turnover Rate(6) | | | 42 | % |
| * | Commencement of operations. |
| (1) | Based on average shares outstanding. |
| (2) | The amount shown for a share distribution throughout the period may not correlate with the Statement of Operations for the period due to the timing of sales and repurchases of Fund Shares in relation to income earned and/or fluctuating fair value of the investments of the Fund. |
| (3) | Net asset value total investment return is calculated assuming an initial investment made at the net asset value at the beginning of the period, reinvestment of all dividends and distributions on ex-date, if any, at net asset value during the period, and redemption on the last day of the period. Periods less than one year are not annualized. Market value total return is calculated assuming an initial investment made at the market value at the beginning of the period, reinvestment of all dividends and distributions at market value during the period on pay date, and sale at the market value on the last day of the period. |
| (4) | Ratios of periods of less than one year have been annualized. Excludes expenses incurred by the underlying investments in other funds. |
| (5) | The Fund invests in other funds and indirectly bear their proportionate shares of fees and expenses incurred by the funds in which the Fund is invested. These ratios do not include these indirect fees and expenses. |
| (6) | Portfolio turnover rate is not annualized and excludes the value of portfolio securities received or delivered as in-kind creations or redemptions of the Fund’s capital shares. |
See accompanying Notes to Financial Statements.
ADVISORSHARES TRUST
Financial Highlights
| AdvisorShares Newfleet Multi-Sector Income ETF | | Years Ended June 30, | |
| | 2022 | | | 2021 | | | 2020 | | | 2019 | | | 2018 | |
| Selected Data for a Share of Capital Stock Outstanding | | | | | | | | | | | | | | | | | | | | |
| Net Asset Value, Beginning of Year/Period | | $ | 48.85 | | | $ | 48.14 | | | $ | 48.44 | | | $ | 47.86 | | | $ | 48.68 | |
| Investment Operations | | | | | | | | | | | | | | | | | | | | |
| Net Investment Income(1) | | | 0.63 | | | | 0.78 | | | | 1.21 | | | | 1.35 | | | | 1.05 | |
| Net Realized and Unrealized Gain (Loss) | | | (3.17 | ) | | | 0.83 | | | | (0.22 | ) | | | 0.65 | | | | (0.62 | ) |
| Net Increase (Decrease) in Net Assets Resulting from Investment Operations(2) | | | (2.54 | ) | | | 1.61 | | | | 0.99 | | | | 2.00 | | | | 0.43 | |
| Distributions from Net Investment Income | | | (0.71 | ) | | | (0.90 | ) | | | (1.29 | ) | | | (1.42 | ) | | | (1.25 | ) |
| Total Distributions | | | (0.71 | ) | | | (0.90 | ) | | | (1.29 | ) | | | (1.42 | ) | | | (1.25 | ) |
| Net Asset Value, End of Year/Period | | $ | 45.60 | | | $ | 48.85 | | | $ | 48.14 | | | $ | 48.44 | | | $ | 47.86 | |
| Market Value, End of Year/Period | | $ | 45.61 | | | $ | 48.83 | | | $ | 48.17 | | | $ | 48.38 | | | $ | 47.79 | |
| Total Return | | | | | | | | | | | | | | | | | | | | |
| Total Investment Return Based on Net Asset Value(3) | | | (5.24 | )% | | | 3.36 | % | | | 2.10 | % | | | 4.27 | % | | | 0.87 | % |
| Total Investment Return Based on Market(3) | | | (5.19 | )% | | | 3.27 | % | | | 2.28 | % | | | 4.29 | % | | | 0.70 | % |
| Ratios/Supplemental Data | | | | | | | | | | | | | | | | | | | | |
| Net Assets, End of Year/Period (000’s omitted) | | $ | 83,682 | | | $ | 96,959 | | | $ | 57,767 | | | $ | 75,080 | | | $ | 155,529 | |
| Ratio to Average Net Assets of: | | | | | | | | | | | | | | | | | | | | |
| Expenses, net of expense waivers and reimbursements(4) | | | 0.75 | % | | | 0.75 | % | | | 0.75 | % | | | 0.75 | % | | | 0.75 | % |
| Expenses, prior to expense waivers and reimbursements(4) | | | 0.76 | % | | | 0.78 | % | | | 0.82 | % | | | 0.96 | % | | | 0.84 | % |
| Net Investment Income(4) | | | 1.32 | % | | | 1.61 | % | | | 2.51 | % | | | 2.81 | % | | | 2.17 | % |
| Portfolio Turnover Rate(5) | | | 54 | % | | | 95 | % | | | 63 | % | | | 40 | % | | | 66 | % |
| AdvisorShares North Square McKee Core Reserves ETF(6) | | Years Ended June 30, | |
| | 2022 | | | 2021 | | | 2020 | | | 2019 | | | 2018 | |
| Selected Data for a Share of Capital Stock Outstanding | | | | | | | | | | | | | | | | | | | | |
| Net Asset Value, Beginning of Year/Period | | $ | 98.68 | | | $ | 98.46 | | | $ | 99.64 | | | $ | 99.21 | | | $ | 99.43 | |
| Investment Operations | | | | | | | | | | | | | | | | | | | | |
| Net Investment Income(1) | | | 0.51 | | | | 0.83 | | | | 2.03 | | | | 2.37 | | | | 1.53 | |
| Net Realized and Unrealized Gain (Loss) | | | (1.19 | ) | | | 0.23 | | | | (1.19 | ) | | | 0.33 | | | | (0.16 | ) |
| Net Increase (Decrease) in Net Assets Resulting from Investment Operations(2) | | | (0.68 | ) | | | 1.06 | | | | 0.84 | | | | 2.70 | | | | 1.37 | |
| Distributions from Net Investment Income | | | (0.54 | ) | | | (0.84 | ) | | | (2.02 | ) | | | (2.27 | ) | | | (1.59 | ) |
| Total Distributions | | | (0.54 | ) | | | (0.84 | ) | | | (2.02 | ) | | | (2.27 | ) | | | (1.59 | ) |
| Net Asset Value, End of Year/Period | | $ | 97.46 | | | $ | 98.68 | | | $ | 98.46 | | | $ | 99.64 | | | $ | 99.21 | |
| Market Value, End of Year/Period | | $ | 97.38 | | | $ | 98.68 | | | $ | 98.35 | | | $ | 99.61 | | | $ | 99.19 | |
| Total Return | | | | | | | | | | | | | | | | | | | | |
| Total Investment Return Based on Net Asset Value(3) | | | (0.68 | )% | | | 1.09 | % | | | 0.83 | % | | | 2.74 | % | | | 1.38 | % |
| Total Investment Return Based on Market(3) | | | (0.76 | )% | | | 1.21 | % | | | 0.75 | % | | | 2.74 | % | | | 1.34 | % |
| Ratios/Supplemental Data | | | | | | | | | | | | | | | | | | | | |
| Net Assets, End of Year/Period (000’s omitted) | | $ | 35,087 | | | $ | 42,432 | | | $ | 100,921 | | | $ | 72,240 | | | $ | 52,087 | |
| Ratio to Average Net Assets of: | | | | | | | | | | | | | | | | | | | | |
| Expenses, net of expense waivers and reimbursements(4) | | | 0.35 | % | | | 0.35 | % | | | 0.35 | % | | | 0.35 | % | | | 0.35 | % |
| Expenses, prior to expense waivers and reimbursements(4) | | | 0.65 | % | | | 0.57 | % | | | 0.53 | % | | | 0.65 | % | | | 0.65 | % |
| Net Investment Income(4) | | | 0.52 | % | | | 0.84 | % | | | 2.05 | % | | | 2.39 | % | | | 1.53 | % |
| Portfolio Turnover Rate(5) | | | 99 | % | | | 103 | % | | | 101 | % | | | 91 | % | | | 74 | % |
| (1) | Based on average shares outstanding. |
| (2) | The amount shown for a share distribution throughout the period may not correlate with the Statement of Operations for the period due to the timing of sales and repurchases of Fund Shares in relation to income earned and/or fluctuating fair value of the investments of the Fund. |
| (3) | Net asset value total investment return is calculated assuming an initial investment made at the net asset value at the beginning of the period, reinvestment of all dividends and distributions on ex-date, if any, at net asset value during the period, and redemption on the last day of the period. Periods less than one year are not annualized. Market value total return is calculated assuming an initial investment made at the market value at the beginning of the period, reinvestment of all dividends and distributions at market value during the period on pay date, and sale at the market value on the last day of the period. |
| (4) | Ratios of periods of less than one year have been annualized. Excludes expenses incurred by the underlying investments in other funds. |
| (5) | Portfolio turnover rate is not annualized and excludes the value of portfolio securities received or delivered as in-kind creations or redemptions of the Fund’s capital shares. |
| (6) | Formerly known as AdvisorShares Sage Core Reserves ETF. |
See accompanying Notes to Financial Statements.
ADVISORSHARES TRUST
Financial Highlights
| AdvisorShares North Square McKee ESG Core Bond ETF(1) | | Years Ended June 30, | |
| | 2022 | | | 2021 | | | 2020 | | | 2019 | | | 2018 | |
| Selected Data for a Share of Capital Stock Outstanding | | | | | | | | | | | | | | | | | | | | |
| Net Asset Value, Beginning of Year/Period | | $ | 25.96 | | | $ | 25.58 | | | $ | 25.71 | | | $ | 25.39 | | | $ | 25.88 | |
| Investment Operations | | | | | | | | | | | | | | | | | | | | |
| Net Investment Income(2) | | | 0.50 | | | | 0.43 | | | | 0.81 | | | | 1.04 | | | | 0.90 | |
| Net Realized and Unrealized Gain (Loss) | | | (2.98 | ) | | | 0.36 | | | | (0.10 | ) | | | 0.38 | | | | (0.50 | ) |
| Distributions of Net Realized Gains by other investment companies | | | — | | | | 0.08 | | | | — | | | | — | | | | — | |
| Net Increase (Decrease) in Net Assets Resulting from Investment Operations(3) | | | (2.48 | ) | | | 0.87 | | | | 0.71 | | | | 1.42 | | | | 0.40 | |
| Distributions from Net Investment Income | | | (0.49 | ) | | | (0.49 | ) | | | (0.84 | ) | | | (1.10 | ) | | | (0.89 | ) |
| Total Distributions | | | (0.49 | ) | | | (0.49 | ) | | | (0.84 | ) | | | (1.10 | ) | | | (0.89 | ) |
| Net Asset Value, End of Year/Period | | $ | 22.99 | | | $ | 25.96 | | | $ | 25.58 | | | $ | 25.71 | | | $ | 25.39 | |
| Market Value, End of Year/Period | | $ | 22.83 | | | $ | 25.96 | | | $ | 25.57 | | | $ | 25.70 | | | $ | 25.38 | |
| Total Return | | | | | | | | | | | | | | | | | | | | |
| Total Investment Return Based on Net Asset Value(4) | | | (9.67 | )% | | | 3.44 | % | | | 2.73 | % | | | 5.82 | % | | | 1.55 | % |
| Total Investment Return Based on Market(4) | | | (10.29 | )% | | | 3.46 | % | | | 2.75 | % | | | 5.80 | % | | | 1.47 | % |
| Ratios/Supplemental Data | | | | | | | | | | | | | | | | | | | | |
| Net Assets, End of Year/Period (000’s omitted) | | $ | 3,333 | | | $ | 5,581 | | | $ | 8,312 | | | $ | 5,785 | | | $ | 18,405 | |
| Ratio to Average Net Assets of: | | | | | | | | | | | | | | | | | | | | |
| Expenses, net of expense waivers and reimbursements(5) | | | 0.68 | % | | | 0.95 | % | | | 0.95 | % | | | 0.95 | % | | | 0.95 | % |
| Expenses, prior to expense waivers and reimbursements(5) | | | 3.33 | % | | | 2.15 | % | | | 1.50 | % | | | 1.49 | % | | | 1.22 | % |
| Net Investment Income(5) | | | 1.97 | % | | | 1.65 | % | | | 3.14 | % | | | 4.14 | % | | | 3.47 | % |
| Portfolio Turnover Rate(6) | | | 430 | % | | | 256 | % | | | 765 | % | | | 150 | % | | | 39 | % |
| | | For the period
November 17,
2021* to
June 30, | |
| AdvisorShares Poseidon Dynamic Cannabis ETF | | 2022 | |
| Selected Data for a Share of Capital Stock Outstanding | | | | |
| Net Asset Value, Beginning of Year/Period | | $ | 10.00 | |
| Investment Operations | | | | |
| Net Investment Loss(2) | | | (0.03 | ) |
| Net Realized and Unrealized Loss | | | (7.52 | ) |
| Net Decrease in Net Assets Resulting from Investment Operations(3) | | | (7.55 | ) |
| Net Asset Value, End of Year/Period | | $ | 2.45 | |
| Market Value, End of Year/Period | | $ | 2.45 | |
| Total Return | | | | |
| Total Investment Return Based on Net Asset Value(4) | | | (75.52 | )% |
| Total Investment Return Based on Market(4) | | | (75.50 | )% |
| Ratios/Supplemental Data | | | | |
| Net Assets, End of Year/Period (000’s omitted) | | $ | 4,357 | |
| Ratio to Average Net Assets of: | | | | |
| Expenses, net of expense waivers and reimbursements(5) | | | 0.99 | % |
| Expenses, prior to expense waivers and reimbursements(5) | | | 2.57 | % |
| Net Investment Loss(5) | | | (0.90 | )% |
| Portfolio Turnover Rate(6) | | | 159 | % |
| * | Commencement of operations. |
| (1) | Formerly known as AdvisorShares FolioBeyond Smart Core Bond ETF. |
| (2) | Based on average shares outstanding. |
| (3) | The amount shown for a share distribution throughout the period may not correlate with the Statement of Operations for the period due to the timing of sales and repurchases of Fund Shares in relation to income earned and/or fluctuating fair value of the investments of the Fund. |
| (4) | Net asset value total investment return is calculated assuming an initial investment made at the net asset value at the beginning of the period, reinvestment of all dividends and distributions on ex-date, if any, at net asset value during the period, and redemption on the last day of the period. Periods less than one year are not annualized. Market value total return is calculated assuming an initial investment made at the market value at the beginning of the period, reinvestment of all dividends and distributions at market value during the period on pay date, and sale at the market value on the last day of the period. |
| (5) | Ratios of periods of less than one year have been annualized. Excludes expenses incurred by the underlying investments in other funds. |
| (6) | Portfolio turnover rate is not annualized and excludes the value of portfolio securities received or delivered as in-kind creations or redemptions of the Fund’s capital shares. |
See accompanying Notes to Financial Statements.
ADVISORSHARES TRUST
Financial Highlights
| | | For the period
September 16,
2021* to
June 30, | |
| AdvisorShares Psychedelics ETF | | 2022 | |
| Selected Data for a Share of Capital Stock Outstanding | | | | |
| Net Asset Value, Beginning of Year/Period | | $ | 10.00 | |
| Investment Operations | | | | |
| Net Investment Loss(1) | | | (0.02 | ) |
| Net Realized and Unrealized Loss | | | (7.42 | ) |
| Net Decrease in Net Assets Resulting from Investment Operations(2) | | | (7.44 | ) |
| Net Asset Value, End of Year/Period | | $ | 2.56 | |
| Market Value, End of Year/Period | | $ | 2.65 | |
| Total Return | | | | |
| Total Investment Return Based on Net Asset Value(3) | | | (74.44 | )% |
| Total Investment Return Based on Market(3) | | | (73.50 | )% |
| Ratios/Supplemental Data | | | | |
| Net Assets, End of Year/Period (000’s omitted) | | $ | 5,509 | |
| Ratio to Average Net Assets of: | | | | |
| Expenses, net of expense waivers and reimbursements(4) | | | 0.99 | % |
| Expenses, prior to expense waivers and reimbursements(4) | | | 3.10 | % |
| Net Investment Loss(4) | | | (0.52 | )% |
| Portfolio Turnover Rate(5) | | | 27 | % |
| | | | | | For the period
April 17,
2019* to | |
| | | Years Ended June 30, | | | June 30, | |
| AdvisorShares Pure Cannabis ETF | | 2022 | | | 2021 | | | 2020 | | | 2019 | |
| Selected Data for a Share of Capital Stock Outstanding | | | | | | | | | | | | | | | | |
| Net Asset Value, Beginning of Year/Period | | $ | 21.15 | | | $ | 10.17 | | | $ | 22.99 | | | $ | 25.00 | |
| Investment Operations | | | | | | | | | | | | | | | | |
| Net Investment Income(1) | | | 0.01 | | | | 0.04 | | | | 0.70 | | | | 0.06 | |
| Net Realized and Unrealized Gain (Loss) | | | (15.35 | ) | | | 11.05 | | | | (12.75 | ) | | | (2.07 | ) |
| Net Increase (Decrease) in Net Assets Resulting from Investment Operations(2) | | | (15.34 | ) | | | 11.09 | | | | (12.05 | ) | | | (2.01 | ) |
| Distributions from Net Investment Income | | | — | | | | (0.11 | ) | | | (0.70 | ) | | | — | |
| Distributions from Realized Capital Gains | | | (0.51 | ) | | | — | | | | (0.07 | ) | | | — | |
| Return of Capital | | | (0.02 | ) | | | — | | | | — | | | | — | |
| Total Distributions | | | (0.53 | ) | | | (0.11 | ) | | | (0.77 | ) | | | — | |
| Net Asset Value, End of Year/Period | | $ | 5.28 | | | $ | 21.15 | | | $ | 10.17 | | | $ | 22.99 | |
| Market Value, End of Year/Period | | $ | 5.28 | | | $ | 21.12 | | | $ | 10.18 | | | $ | 23.02 | |
| Total Return | | | | | | | | | | | | | | | | |
| Total Investment Return Based on Net Asset Value(3) | | | (73.99 | )% | | | 109.96 | % | | | (52.76 | )% | | | (8.06 | )% |
| Total Investment Return Based on Market(3) | | | (73.93 | )% | | | 109.35 | % | | | (52.70 | )% | | | (7.92 | )% |
| Ratios/Supplemental Data | | | | | | | | | | | | | | | | |
| Net Assets, End of Year/Period (000’s omitted) | | $ | 71,817 | | | $ | 354,408 | | | $ | 45,503 | | | $ | 59,762 | |
| Ratio to Average Net Assets of: | | | | | | | | | | | | | | | | |
| Expenses, net of expense waivers and reimbursements(4) | | | 0.65 | % | | | 0.74 | % | | | 0.74 | % | | | 0.74 | % |
| Expenses, prior to expense waivers and reimbursements(4) | | | 0.88 | % | | | 0.69 | % | | | 1.17 | % | | | 1.10 | % |
| Net Investment Income(4) | | | 0.11 | % | | | 0.21 | % | | | 5.67 | % | | | 1.35 | % |
| Portfolio Turnover Rate(5) | | | 28 | % | | | 46 | % | | | 59 | % | | | 26 | % |
| * | Commencement of operations. |
| (1) | Based on average shares outstanding. |
| (2) | The amount shown for a share distribution throughout the period may not correlate with the Statement of Operations for the period due to the timing of sales and repurchases of Fund Shares in relation to income earned and/or fluctuating fair value of the investments of the Fund. |
| (3) | Net asset value total investment return is calculated assuming an initial investment made at the net asset value at the beginning of the period, reinvestment of all dividends and distributions on ex-date, if any, at net asset value during the period, and redemption on the last day of the period. Periods less than one year are not annualized. Market value total return is calculated assuming an initial investment made at the market value at the beginning of the period, reinvestment of all dividends and distributions at market value during the period on pay date, and sale at the market value on the last day of the period. |
| (4) | Ratios of periods of less than one year have been annualized. Excludes expenses incurred by the underlying investments in other funds. |
| (5) | Portfolio turnover rate is not annualized and excludes the value of portfolio securities received or delivered as in-kind creations or redemptions of the Fund’s capital shares. |
See accompanying Notes to Financial Statements.
ADVISORSHARES TRUST
Financial Highlights
| | | Year ended
June 30, | | | For the period
September 1,
2020* to
June 30, | |
| AdvisorShares Pure US Cannabis ETF | | 2022 | | | 2021 | |
| Selected Data for a Share of Capital Stock Outstanding | | | | | | |
| Net Asset Value, Beginning of Year/Period | | $ | 40.22 | | | $ | 25.00 | |
| Investment Operations | | | | | | | | |
| Net Investment Loss(1) | | | (0.09 | ) | | | (0.17 | ) |
| Net Realized and Unrealized Gain (Loss) | | | (29.71 | ) | | | 15.39 | |
| Net Increase (Decrease) in Net Assets Resulting from Investment Operations(2) | | | (29.80 | ) | | | 15.22 | |
| Distributions from Realized Capital Gains | | | (0.07 | ) | | | — | |
| Total Distributions | | | (0.07 | ) | | | — | |
| Net Asset Value, End of Year/Period | | $ | 10.35 | | | $ | 40.22 | |
| Market Value, End of Year/Period | | $ | 10.37 | | | $ | 40.08 | |
| Total Return | | | | | | | | |
| Total Investment Return Based on Net Asset Value(3) | | | (74.20 | )% | | | 60.86 | % |
| Total Investment Return Based on Market(3) | | | (74.06 | )% | | | 60.32 | % |
| Ratios/Supplemental Data | | | | | | | | |
| Net Assets, End of Year/Period (000’s omitted) | | $ | 514,691 | | | $ | 950,694 | |
| Ratio to Average Net Assets of: | | | | | | | | |
| Expenses, net of expense waivers and reimbursements(4) | | | 0.72 | % | | | 0.69 | % |
| Expenses, prior to expense waivers and reimbursements(4) | | | 0.75 | % | | | 0.69 | % |
| Net Investment Loss(4) | | | (0.40 | )% | | | (0.49 | )% |
| Portfolio Turnover Rate(5) | | | 48 | % | | | 68 | % |
| | | Year ended
June 30, | | | For the period
December 28,
2020* to
June 30, | |
| AdvisorShares Q Dynamic Growth ETF | | 2022 | | | 2021 | |
| Selected Data for a Share of Capital Stock Outstanding | | | | | | | | |
| Net Asset Value, Beginning of Year/Period | | $ | 28.12 | | | $ | 25.00 | |
| Investment Operations | | | | | | | | |
| Net Investment Loss(1) | | | (0.15 | ) | | | (0.09 | ) |
| Net Realized and Unrealized Gain (Loss) | | | (5.95 | ) | | | 3.21 | |
| Net Increase (Decrease) in Net Assets Resulting from Investment Operations(2) | | | (6.10 | ) | | | 3.12 | |
| Net Asset Value, End of Year/Period | | $ | 22.02 | | | $ | 28.12 | |
| Market Value, End of Year/Period | | $ | 22.01 | | | $ | 28.13 | |
| Total Return | | | | | | | | |
| Total Investment Return Based on Net Asset Value(3) | | | (21.70 | )% | | | 12.50 | % |
| Total Investment Return Based on Market(3) | | | (21.76 | )% | | | 12.52 | % |
| Ratios/Supplemental Data | | | | | | | | |
| Net Assets, End of Year/Period (000’s omitted) | | $ | 40,299 | | | $ | 68,763 | |
| Ratio to Average Net Assets of:(6) | | | | | | | | |
| Expenses, net of expense waivers and reimbursements(4) | | | 1.14 | % | | | 1.43 | % |
| Expenses, prior to expense waivers and reimbursements(4) | | | 1.13 | % | | | 1.49 | % |
| Net Investment Loss(4) | | | (0.52 | )% | | | (0.65 | )% |
| Portfolio Turnover Rate(5) | | | 106 | % | | | 61 | % |
| * | Commencement of operations. |
| (1) | Based on average shares outstanding. |
| (2) | The amount shown for a share distribution throughout the period may not correlate with the Statement of Operations for the period due to the timing of sales and repurchases of Fund Shares in relation to income earned and/or fluctuating fair value of the investments of the Fund. |
| (3) | Net asset value total investment return is calculated assuming an initial investment made at the net asset value at the beginning of the period, reinvestment of all dividends and distributions on ex-date, if any, at net asset value during the period, and redemption on the last day of the period. Periods less than one year are not annualized. Market value total return is calculated assuming an initial investment made at the market value at the beginning of the period, reinvestment of all dividends and distributions at market value during the period on pay date, and sale at the market value on the last day of the period. |
| (4) | Ratios of periods of less than one year have been annualized. Excludes expenses incurred by the underlying investments in other funds. |
| (5) | Portfolio turnover rate is not annualized and excludes the value of portfolio securities received or delivered as in-kind creations or redemptions of the Fund’s capital shares. |
| (6) | The Fund invests in other funds and indirectly bear their proportionate shares of fees and expenses incurred by the funds in which the Fund is invested. These ratios do not include these indirect fees and expenses. |
See accompanying Notes to Financial Statements.
ADVISORSHARES TRUST
Financial Highlights
| | | Year ended
June 30, | | | For the period
December 28,
2020* to
June 30, | |
| AdvisorShares Q Portfolio Blended Allocation ETF | | 2022 | | | 2021 | |
| Selected Data for a Share of Capital Stock Outstanding | | | | | | |
| Net Asset Value, Beginning of Year/Period | | $ | 25.77 | | | $ | 25.00 | |
| Investment Operations | | | | | | | | |
| Net Investment Income(1) | | | 0.05 | | | | 0.01 | |
| Net Realized and Unrealized Gain (Loss) | | | (5.15 | ) | | | 0.76 | |
| Distributions of Net Realized Gains by other investment companies | | | 0.01 | | | | 0.00 | (2) |
| Net Increase (Decrease) in Net Assets Resulting from Investment Operations(3) | | | (5.09 | ) | | | 0.77 | |
| Distributions from Net Investment Income | | | (0.08 | ) | | | — | |
| Total Distributions | | | (0.08 | ) | | | — | |
| Net Asset Value, End of Year/Period | | $ | 20.60 | | | $ | 25.77 | |
| Market Value, End of Year/Period | | $ | 20.60 | | | $ | 25.76 | |
| Total Return | | | | | | | | |
| Total Investment Return Based on Net Asset Value(4) | | | (19.83 | )% | | | 3.07 | % |
| Total Investment Return Based on Market(4) | | | (19.81 | )% | | | 3.04 | % |
| Ratios/Supplemental Data | | | | | | | | |
| Net Assets, End of Year/Period (000’s omitted) | | $ | 2,678 | | | $ | 3,479 | |
| Ratio to Average Net Assets of:(5) | | | | | | | | |
| Expenses, net of expense waivers and reimbursements(6) | | | 0.99 | % | | | 0.99 | % |
| Expenses, prior to expense waivers and reimbursements(6) | | | 2.91 | % | | | 3.59 | % |
| Net Investment Income(6) | | | 0.19 | % | | | 0.04 | % |
| Portfolio Turnover Rate(7) | | | 291 | % | | | 248 | % |
| AdvisorShares Ranger Equity Bear ETF | | Years Ended June 30, | |
| | 2022 | | | 2021(8) | | | 2020(8) | | | 2019(8) | | | 2018(8) | |
| Selected Data for a Share of Capital Stock Outstanding | | | | | | | | | | | | | | | | | | | | |
| Net Asset Value, Beginning of Year/Period | | $ | 23.00 | | | $ | 48.55 | | | $ | 63.84 | | | $ | 78.01 | | | $ | 85.65 | |
| Investment Operations | | | | | | | | | | | | | | | | | | | | |
| Net Investment Income (Loss)(1) | | | (0.97 | ) | | | (1.59 | ) | | | (0.64 | ) | | | 0.13 | | | | (1.34 | ) |
| Net Realized and Unrealized Gain (Loss) | | | 9.82 | | | | (23.96 | ) | | | (14.55 | ) | | | (14.30 | ) | | | (6.30 | ) |
| Distributions of Net Realized Gains by other investment companies | | | — | | | | 0.00 | (2) | | | — | | | | — | | | | — | |
| Net Increase (Decrease) in Net Assets Resulting from Investment Operations(3) | | | 8.85 | | | | (25.55 | ) | | | (15.19 | ) | | | (14.17 | ) | | | (7.64 | ) |
| Distributions from Net Investment Income | | | — | | | | — | | | | (0.10 | ) | | | — | | | | — | |
| Total Distributions | | | — | | | | — | | | | (0.10 | ) | | | — | | | | — | |
| Net Asset Value, End of Year/Period | | $ | 31.85 | | | $ | 23.00 | | | $ | 48.55 | | | $ | 63.84 | | | $ | 78.01 | |
| Market Value, End of Year/Period | | $ | 31.96 | | | $ | 23.00 | | | $ | 48.50 | | | $ | 63.90 | | | $ | 77.80 | |
| Total Return | | | | | | | | | | | | | | | | | | | | |
| Total Investment Return Based on Net Asset Value(4) | | | 38.48 | % | | | (52.62 | )% | | | (23.79 | )% | | | (18.16 | )% | | | (8.92 | )% |
| Total Investment Return Based on Market(4) | | | 38.96 | % | | | (52.58 | )% | | | (23.94 | )% | | | (17.87 | )% | | | (9.01 | )% |
| Ratios/Supplemental Data | | | | | | | | | | | | | | | | | | | | |
| Net Assets, End of Year/Period (000’s omitted) | | $ | 166,185 | | | $ | 50,655 | | | $ | 162,019 | | | $ | 135,814 | | | $ | 133,587 | |
| Ratio to Average Net Assets of: | | | | | | | | | | | | | | | | | | | | |
| Expenses, net of expense waivers and reimbursements(6) | | | 4.15 | %(9) | | | 4.90 | %(9) | | | 3.10 | %(9) | | | 2.94 | %(9) | | | 2.52 | %(9) |
| Expenses, prior to expense waivers and reimbursements(6) | | | 4.15 | %(9) | | | 4.90 | %(9) | | | 3.10 | %(9) | | | 2.94 | %(9) | | | 2.52 | %(9) |
| Net Investment Income (Loss)(6) | | | (3.70 | )% | | | (4.49 | )% | | | (1.07 | )% | | | 0.18 | % | | | (1.63 | )% |
| Portfolio Turnover Rate(7) | | | 1,462 | % | | | 669 | % | | | 593 | % | | | 338 | % | | | 301 | % |
| * | Commencement of operations. |
| (1) | Based on average shares outstanding. |
| (2) | Amount represents less than $0.005 or 0.005%. |
| (3) | The amount shown for a share distribution throughout the period may not correlate with the Statement of Operations for the period due to the timing of sales and repurchases of Fund Shares in relation to income earned and/or fluctuating fair value of the investments of the Fund. |
| (4) | Net asset value total investment return is calculated assuming an initial investment made at the net asset value at the beginning of the period, reinvestment of all dividends and distributions on ex-date, if any, at net asset value during the period, and redemption on the last day of the period. Periods less than one year are not annualized. Market value total return is calculated assuming an initial investment made at the market value at the beginning of the period, reinvestment of all dividends and distributions at market value during the period on pay date, and sale at the market value on the last day of the period. |
| (5) | The Fund invests in other funds and indirectly bear their proportionate shares of fees and expenses incurred by the funds in which the Fund is invested. These ratios do not include these indirect fees and expenses. |
| (6) | Ratios of periods of less than one year have been annualized. Excludes expenses incurred by the underlying investments in other funds. |
| (7) | Portfolio turnover rate is not annualized and excludes the value of portfolio securities received or delivered as in-kind creations or redemptions of the Fund’s capital shares. |
| (8) | After the close of business on February 5, 2021, the Fund’s applicable class underwent a reverse stock split. The per share data presented here has been retroactively adjusted to reflect this split. See Note 1 of the Notes to Financial Statements. |
| (9) | The expense ratio includes interest and dividend expenses on short sales of 2.47%, 3.14%, 1.42%, 1.22%, 0.84%, and 1.03% for the periods ended June 30, 2022, June 30, 2021, June 30, 2020, June 30, 2019, June 30, 2018, and June 30, 2017, respectively. |
See accompanying Notes to Financial Statements.
ADVISORSHARES TRUST
Financial Highlights
| | | Year ended
June 30, | | | For the period
April 20,
2021* to
June 30, | |
| AdvisorShares Restaurant ETF | | 2022 | | | 2021 | |
| Selected Data for a Share of Capital Stock Outstanding | | | | | | | | |
| Net Asset Value, Beginning of Year/Period | | $ | 24.44 | | | $ | 24.69 | |
| Investment Operations | | | | | | | | |
| Net Investment Income(1) | | | 0.13 | | | | 0.00 | (2) |
| Net Realized and Unrealized Loss | | | (7.56 | ) | | | (0.25 | ) |
| Net Decrease in Net Assets Resulting from Investment Operations(3) | | | (7.43 | ) | | | (0.25 | ) |
| Distributions from Net Investment Income | | | (0.04 | ) | | | — | |
| Total Distributions | | | (0.04 | ) | | | — | |
| Net Asset Value, End of Year/Period | | $ | 16.97 | | | $ | 24.44 | |
| Market Value, End of Year/Period | | $ | 16.93 | | | $ | 24.44 | |
| Total Return | | | | | | | | |
| Total Investment Return Based on Net Asset Value(4) | | | (30.46 | )% | | | (1.01 | )% |
| Total Investment Return Based on Market(4) | | | (30.62 | )% | | | (1.01 | )% |
| Ratios/Supplemental Data | | | | | | | | |
| Net Assets, End of Year/Period (000’s omitted) | | $ | 2,631 | | | $ | 5,988 | |
| Ratio to Average Net Assets of: | | | | | | | | |
| Expenses, net of expense waivers and reimbursements(5) | | | 0.99 | % | | | 0.99 | % |
| Expenses, prior to expense waivers and reimbursements(5) | | | 2.11 | % | | | 7.93 | % |
| Net Investment Income (Loss)(5) | | | 0.57 | % | | | (0.03 | )% |
| Portfolio Turnover Rate(6) | | | 86 | % | | | 26 | % |
| | | Years Ended June 30, | |
| AdvisorShares STAR Global Buy-Write ETF | | 2022 | | | 2021 | | | 2020 | | | 2019 | | | 2018 | |
| Selected Data for a Share of Capital Stock Outstanding | | | | | | | | | | | | | | | | | | | | |
| Net Asset Value, Beginning of Year/Period | | $ | 39.83 | | | $ | 32.20 | | | $ | 32.28 | | | $ | 30.99 | | | $ | 29.13 | |
| Investment Operations | | | | | | | | | | | | | | | | | | | | |
| Net Investment Income (Loss)(1) | | | 0.13 | | | | (0.16 | ) | | | 0.09 | | | | 0.13 | | | | 0.11 | |
| Net Realized and Unrealized Gain (Loss) | | | (5.12 | ) | | | 7.89 | | | | (0.02 | ) | | | 1.29 | | | | 1.75 | |
| Distributions of Net Realized Gains by other investment companies | | | — | | | | 0.00 | (2) | | | — | | | | — | | | | 0.00 | (2) |
| Net Increase (Decrease) in Net Assets Resulting from Investment Operations(3) | | | (4.99 | ) | | | 7.73 | | | | 0.07 | | | | 1.42 | | | | 1.86 | |
| Distributions from Net Investment Income | | | — | | | | (0.10 | ) | | | (0.15 | ) | | | (0.13 | ) | | | — | |
| Distributions from Realized Capital Gains | | | (0.23 | ) | | | — | | | | — | | | | — | | | | — | |
| Total Distributions | | | (0.23 | ) | | | (0.10 | ) | | | (0.15 | ) | | | (0.13 | ) | | | — | |
| Net Asset Value, End of Year/Period | | $ | 34.61 | | | $ | 39.83 | | | $ | 32.20 | | | $ | 32.28 | | | $ | 30.99 | |
| Market Value, End of Year/Period | | $ | 34.62 | | | $ | 39.83 | | | $ | 32.25 | | | $ | 32.19 | | | $ | 31.01 | |
| Total Return | | | | | | | | | | | | | | | | | | | | |
| Total Investment Return Based on Net Asset Value(4) | | | (12.64 | )% | | | 24.04 | % | | | 0.20 | % | | | 4.62 | % | | | 6.41 | % |
| Total Investment Return Based on Market(4) | | | (12.60 | )% | | | 23.86 | % | | | 0.63 | % | | | 4.27 | % | | | 6.45 | % |
| Ratios/Supplemental Data | | | | | | | | | | | | | | | | | | | | |
| Net Assets, End of Year/Period (000’s omitted) | | $ | 37,547 | | | $ | 18,323 | | | $ | 12,882 | | | $ | 14,527 | | | $ | 17,047 | |
| Ratio to Average Net Assets of:(7) | | | | | | | | | | | | | | | | | | | | |
| Expenses, net of expense waivers and reimbursements(5) | | | 1.85 | % | | | 1.85 | % | | | 1.85 | % | | | 1.85 | % | | | 1.85 | % |
| Expenses, prior to expense waivers and reimbursements(5) | | | 1.82 | % | | | 2.48 | % | | | 2.20 | % | | | 2.34 | % | | | 2.18 | % |
| Net Investment Income (Loss)(5) | | | 0.33 | % | | | (0.43 | )% | | | 0.26 | % | | | 0.43 | % | | | 0.38 | % |
| Portfolio Turnover Rate(6) | | | 41 | % | | | 55 | % | | | 47 | % | | | 49 | % | | | 12 | % |
| * | Commencement of operations. |
| (1) | Based on average shares outstanding. |
| (2) | Amount represents less than $0.005 or 0.005%. |
| (3) | The amount shown for a share distribution throughout the period may not correlate with the Statement of Operations for the period due to the timing of sales and repurchases of Fund Shares in relation to income earned and/or fluctuating fair value of the investments of the Fund. |
| (4) | Net asset value total investment return is calculated assuming an initial investment made at the net asset value at the beginning of the period, reinvestment of all dividends and distributions on ex-date, if any, at net asset value during the period, and redemption on the last day of the period. Periods less than one year are not annualized. Market value total return is calculated assuming an initial investment made at the market value at the beginning of the period, reinvestment of all dividends and distributions at market value during the period on pay date, and sale at the market value on the last day of the period. |
| (5) | Ratios of periods of less than one year have been annualized. Excludes expenses incurred by the underlying investments in other funds. |
| (6) | Portfolio turnover rate is not annualized and excludes the value of portfolio securities received or delivered as in-kind creations or redemptions of the Fund’s capital shares. |
| (7) | The Fund invests in other funds and indirectly bear their proportionate shares of fees and expenses incurred by the funds in which the Fund is invested. These ratios do not include these indirect fees and expenses. |
See accompanying Notes to Financial Statements.
ADVISORSHARES TRUST
Financial Highlights
| | | | | | For the period
December 12,
2017* to | |
| | | Years Ended June 30, | | | June 30, | |
| AdvisorShares Vice ETF | | 2022 | | | 2021 | | | 2020 | | | 2019 | | | 2018 | |
| Selected Data for a Share of Capital Stock Outstanding | | | | | | | | | | | | | | | |
| Net Asset Value, Beginning of Year/Period | | $ | 36.07 | | | $ | 22.81 | | | $ | 25.11 | | | $ | 25.60 | | | $ | 25.00 | |
| Investment Operations | | | | | | | | | | | | | | | | | | | | |
| Net Investment Income(1) | | | 0.18 | | | | 0.19 | | | | 0.42 | | | | 0.45 | | | | 0.23 | |
| Net Realized and Unrealized Gain (Loss) | | | (10.73 | ) | | | 13.44 | | | | (2.10 | ) | | | (0.57 | ) | | | 0.41 | |
| Net Increase (Decrease) in Net Assets Resulting from Investment Operations(2) | | | (10.55 | ) | | | 13.63 | | | | (1.68 | ) | | | (0.12 | ) | | | 0.64 | |
| Distributions from Net Investment Income | | | (0.14 | ) | | | (0.37 | ) | | | (0.62 | ) | | | (0.37 | ) | | | (0.04 | ) |
| Distributions from Realized Capital Gains | | | (0.18 | ) | | | — | | | | — | | | | — | | | | — | |
| Total Distributions | | | (0.32 | ) | | | (0.37 | ) | | | (0.62 | ) | | | (0.37 | ) | | | (0.04 | ) |
| Net Asset Value, End of Year/Period | | $ | 25.20 | | | $ | 36.07 | | | $ | 22.81 | | | $ | 25.11 | | | $ | 25.60 | |
| Market Value, End of Year/Period | | $ | 25.13 | | | $ | 36.06 | | | $ | 22.80 | | | $ | 25.12 | | | $ | 25.68 | |
| Total Return | | | | | | | | | | | | | | | | | | | | |
| Total Investment Return Based on Net Asset Value(3) | | | (29.45 | )% | | | 59.98 | % | | | (6.91 | )% | | | (0.22 | )% | | | 2.58 | % |
| Total Investment Return Based on Market(3) | | | (29.62 | )% | | | 60.05 | % | | | (6.99 | )% | | | (0.50 | )% | | | 2.89 | % |
| Ratios/Supplemental Data | | | | | | | | | | | | | | | | | | | | |
| Net Assets, End of Year/Period (000’s omitted) | | $ | 8,695 | | | $ | 13,889 | | | $ | 9,126 | | | $ | 13,183 | | | $ | 12,800 | |
| Ratio to Average Net Assets of: | | | | | | | | | | | | | | | | | | | | |
| Expenses, net of expense waivers and reimbursements(4) | | | 0.99 | % | | | 0.99 | % | | | 0.90 | % | | | 0.75 | % | | | 0.75 | % |
| Expenses, prior to expense waivers and reimbursements(4) | | | 1.64 | % | | | 1.71 | % | | | 1.59 | % | | | 1.43 | % | | | 2.18 | % |
| Net Investment Income(4) | | | 0.59 | % | | | 0.63 | % | | | 1.77 | % | | | 1.79 | % | | | 1.64 | % |
| Portfolio Turnover Rate(5) | | | 83 | % | | | 125 | % | | | 41 | % | | | 76 | % | | | 25 | % |
| * | Commencement of operations. |
| (1) | Based on average shares outstanding. |
| (2) | The amount shown for a share distribution throughout the period may not correlate with the Statement of Operations for the period due to the timing of sales and repurchases of Fund Shares in relation to income earned and/or fluctuating fair value of the investments of the Fund. |
| (3) | Net asset value total investment return is calculated assuming an initial investment made at the net asset value at the beginning of the period, reinvestment of all dividends and distributions on ex-date, if any, at net asset value during the period, and redemption on the last day of the period. Periods less than one year are not annualized. Market value total return is calculated assuming an initial investment made at the market value at the beginning of the period, reinvestment of all dividends and distributions at market value during the period on pay date, and sale at the market value on the last day of the period. |
| (4) | Ratios of periods of less than one year have been annualized. Excludes expenses incurred by the underlying investments in other funds. |
| (5) | Portfolio turnover rate is not annualized and excludes the value of portfolio securities received or delivered as in-kind creations or redemptions of the Fund’s capital shares. |
See accompanying Notes to Financial Statements.
ADVISORSHARES TRUST
Notes to Financial Statements
June 30, 2022
1. Organization
AdvisorShares Trust (the “Trust”) was organized as a Delaware statutory trust on July 30, 2007 and has authorized capital of unlimited shares. The Funds are investment companies and accordingly follow the investment company accounting and reporting guidance of the Financial Accounting Standards Board (“FASB”) Accounting Standard Codification Topic 946 “Financial Services — Investment Companies”.
The Trust is an open-end management investment company, registered under the Investment Company Act of 1940, as amended (the “Act”). As of June 30, 2022, the Trust is comprised of 27 active funds (the “Funds” or “ETFs” and individually, the “Fund” or “ETF”):
| Fund | | Ticker | | Commencement of
Operations | |
| AdvisorShares Alpha DNA Equity Sentiment ETF | | SENT | | February 2, 2021 | |
| AdvisorShares Dorsey Wright ADR ETF | | AADR | | July 21, 2010 | |
| AdvisorShares Dorsey Wright Alpha Equal Weight ETF | | DWEQ | | December 26, 2019 | |
| AdvisorShares Dorsey Wright FSM All Cap World ETF | | DWAW | | December 26, 2019 | |
| AdvisorShares Dorsey Wright FSM US Core ETF | | DWUS | | December 26, 2019 | |
| AdvisorShares Dorsey Wright Micro Cap ETF | | DWMC | | July 11, 2018 | |
| AdvisorShares Dorsey Wright Short ETF | | DWSH | | July 11, 2018 | |
| AdvisorShares DoubleLine Value Equity ETF | | DBLV | | October 4, 2011 | |
| AdvisorShares Drone Technology ETF | | UAV | | April 27, 2022 | |
| AdvisorShares Focused Equity ETF | | CWS | | September 20, 2016 | |
| AdvisorShares Gerber Kawasaki ETF | | GK | | July 2, 2021 | |
| AdvisorShares Hotel ETF | | BEDZ | | April 20, 2021 | |
| AdvisorShares Let Bob AI Powered Momentum ETF | | LETB | | February 9, 2022 | |
| AdvisorShares Managed Bitcoin Strategy ETF | | CRYP | | April 27, 2022 | |
| AdvisorShares Newfleet Multi-Sector Income ETF | | MINC | | March 19, 2013 | |
| AdvisorShares North Square McKee Core Reserves ETF* | | HOLD | | January 14, 2014 | |
| AdvisorShares North Square McKee ESG Core Bond ETF** | | MENV | | June 21, 2011 | |
| AdvisorShares Poseidon Dynamic Cannabis ETF | | PSDN | | November 17, 2021 | |
| AdvisorShares Psychedelics ETF | | PSIL | | September 16, 2021 | |
| AdvisorShares Pure Cannabis ETF | | YOLO | | April 17, 2019 | |
| AdvisorShares Pure US Cannabis ETF | | MSOS | | September 1, 2020 | |
| AdvisorShares Q Dynamic Growth ETF | | QPX | | December 28, 2020 | |
| AdvisorShares Q Portfolio Blended Allocation ETF | | QPT | | December 28, 2020 | |
| AdvisorShares Ranger Equity Bear ETF | | HDGE | | January 27, 2011 | |
| AdvisorShares Restaurant ETF | | EATZ | | April 20, 2021 | |
| AdvisorShares STAR Global Buy-Write ETF | | VEGA | | September 17, 2012 | |
| AdvisorShares Vice ETF | | VICE | | December 12, 2017 | |
| * | Effective November 1, 2021, AdvisorShares Sage Core Reserves ETF changed its name to AdvisorShares North Square McKee Core Reserve ETF. |
| ** | Effective November 1, 2021, AdvisorShares FolioBeyond Smart Core Bond ETF changed its name and ticker to AdvisorShares North Square McKee ESG Core Bond ETF (MENV). |
ADVISORSHARES TRUST
Notes to Financial Statements (Continued)
June 30, 2022
1. Organization – (continued)
AdvisorShares Alpha DNA Equity Sentiment ETF (“Alpha DNA Equity Sentiment ETF”) seeks to provide long-term capital appreciation.
AdvisorShares Dorsey Wright ADR ETF (“Dorsey Wright ADR ETF”) seeks long-term capital appreciation above international benchmarks such as the MSCI EAFE Index.
AdvisorShares Dorsey Wright Alpha Equal Weight ETF (“Dorsey Wright Alpha Equal Weight ETF”) seeks to provide long-term capital appreciation.
AdvisorShares Dorsey Wright FSM All Cap World ETF (“Dorsey Wright FSM All Cap World ETF”) seeks to provide long-term capital appreciation with capital preservation as a secondary objective.
AdvisorShares Dorsey Wright FSM US Core ETF (“Dorsey Wright FSM US Core ETF”) seeks to provide long-term capital appreciation with capital preservation as a secondary objective.
AdvisorShares Dorsey Wright Micro-Cap ETF (“Dorsey Wright Micro-Cap ETF”) seeks long term capital appreciation.
AdvisorShares Dorsey Wright Short ETF (“Dorsey Wright Short ETF”) seeks capital appreciation through short selling securities.
AdvisorShares DoubleLine Value Equity ETF (“DoubleLine Value Equity ETF”) seeks to generate long-term capital appreciation.
AdvisorShares Drone Technology ETF (“Drone Technology ETF”) seeks long-term capital appreciation.
AdvisorShares Focused Equity ETF (“Focused Equity ETF”) seeks long-term capital appreciation.
AdvisorShares Gerber Kawasaki ETF (“Gerber Kawasaki ETF”) seeks long-term capital appreciation.
AdvisorShares Hotel ETF (“Hotel ETF”) seeks to provide long-term capital appreciation.
AdvisorShares Let Bob AI Powered Momentum ETF (“Let Bob AI Powered Momentum ETF”) seeks long-term capital appreciation.
AdvisorShares Managed Bitcoin Strategy ETF (“Managed Bitcoin Strategy ETF”) seeks long-term capital appreciation.
AdvisorShares Newfleet Multi-Sector Income ETF (“Newfleet Multi-Sector Income ETF”) seeks to provide current income consistent with preservation of capital, while limiting fluctuations in net asset value (“NAV”) due to changes in interest rates.
AdvisorShares North Square McKee Core Reserves ETF (“North Square McKee Core Reserves ETF”) seeks to preserve capital while maximizing income.
AdvisorShares North Square McKee ESG Core Bond ETF (“North Square McKee ESG Core Bond ETF”) seeks investment results that exceed the price and yield performance of its benchmark, the Bloomberg U.S. Aggregate Bond Index.
AdvisorShares Poseidon Dynamic Cannabis ETF (“Poseidon Dynamic Cannabis ETF”) seeks long-term capital appreciation.
AdvisorShares Psychedelics ETF (“Psychedelics ETF”) seeks long-term capital appreciation.
AdvisorShares Pure Cannabis ETF (“Pure Cannabis ETF”) seeks long-term capital appreciation.
ADVISORSHARES TRUST
Notes to Financial Statements (Continued)
June 30, 2022
1. Organization – (continued)
AdvisorShares Pure US Cannabis ETF (“Pure US Cannabis ETF”) seeks long-term capital appreciation.
AdvisorShares Q Dynamic Growth ETF (“Q Dynamic Growth ETF”) seeks to achieve long-term growth.
AdvisorShares Q Portfolio Blended Allocation ETF (“Q Portfolio Blended Allocation ETF”) seeks to maximize total return over the long-term.
AdvisorShares Ranger Equity Bear ETF (“Ranger Equity Bear ETF”) seeks capital appreciation through short sales of domestically traded equity securities.
AdvisorShares Restaurant ETF (“Restaurant ETF”) seeks to provide long-term capital appreciation.
AdvisorShares STAR Global Buy-Write ETF (”STAR Global Buy-Write ETF”) seeks consistent repeatable returns across all market cycles.
AdvisorShares Vice ETF (“Vice ETF”) seeks long-term capital appreciation.
Some of the Funds are considered “funds of funds” and seek to achieve their investment objectives by investing primarily in other affiliated and unaffiliated exchange-traded funds (“ETFs”), as well as other exchange-traded products (“ETPs”), including, but not limited to, exchange-traded notes (“ETNs”) and closed-end funds (collectively with ETFs, ETNs, and ETPs), that offer diversified exposure to various global regions, credit qualities, durations and maturity dates.
Each Fund, except the AdvisorShares Drone Technology ETF, AdvisorShares Gerber Kawasaki ETF, AdvisorShares Hotel ETF, AdvisorShares Managed Bitcoin Strategy, AdvisorShares Poseidon Dynamic Cannabis ETF, AdvisorShares Psychedelics ETF, AdvisorShares Pure Cannabis ETF, AdvisorShares Pure US Cannabis ETF and AdvisorShares Restaurant ETF, is a diversified investment company under the Investment Company Act of 1940 (the “1940 Act”).
For the year ended June 30, 2022, the Funds held significant positions (greater than 25% of net assets), except those invested in short term money market instruments, in other funds as follows:
| Funds | | Security Name | | Market
Value as of
June 30,
2022 | | | % of Fund
Net Assets as of
June 30,
2022 | | | Reference location | |
| Dorsey Wright FSM All Cap World ETF | | Invesco S&P 500 Low Volatility ETF | | $ | 42,757,866 | | | | 50.8 | % | | https://www.invesco.com | |
| | | Invesco S&P 500 Pure Value ETF | | | 40,707,040 | | | | 48.3 | | | https://www.invesco.com | |
| | | | | | | | | | | | | | |
| Dorsey Wright FSM US Core ETF | | Invesco S&P 500 Equal Weight ETF | | | 38,747,772 | | | | 48.6 | | | https://www.invesco.com | |
| | | Invesco S&P 500 Low Volatility ETF | | | 40,743,300 | | | | 51.1 | | | https://www.invesco.com | |
| | | | | | | | | | | | | | |
| Managed Bitcoin Strategy ETF | | ProShares Bitcoin Strategy ETF | | | 454,555 | �� | | | 88.0 | | | https://www.proshares.com | |
| | | | | | | | | | | | | | |
| Pure Cannabis | | AdvisorShares Pure US Cannabis | | | 24,719,940 | | | | 34.4 | | | Contained within this report. | |
ADVISORSHARES TRUST
Notes to Financial Statements (Continued)
June 30, 2022
1. Organization – (continued)
| Funds | | Security Name | | Market
Value as of
June 30,
2022 | | | % of Fund
Net Assets as of
June 30,
2022 | | | Reference location | |
| Q Dynamic Growth ETF | | Invesco QQQ Trust Series 1 | | $ | 15,556,661 | | | | 38.6 | % | | https://www.invesco.com | |
| | | Technology Select Sector SPDR Fund | | | 12,051,357 | | | | 29.9 | | | https://www.ssga.com | |
| | | | | | | | | | | | | | |
| Q Portfolio Blended Allocation ETF | | iShares 20+ Year Treasury Bond ETF | | | 824,077 | | | | 30.8 | | | https://www.ishares.com | |
| | | | | | | | | | | | | | |
| STAR Global Buy-Write ETF | | SPDR S&P 500 ETF Trust | | | 15,526,855 | | | | 41.4 | | | https://us.spdrs.com | |
Reverse Split
After the close of the markets on February 5, 2021 (the Record Date), the AdvisorShares Ranger Equity Bear ETF effected a reverse split of its issued and outstanding shares, with a 1 for 10 ratio, with approval by the Board. Shares of the Fund began trading on the NYSE Arca on a split-adjusted basis on February 8, 2021.
The effect of the reverse split was reducing the number of Shares outstanding and resulted in a proportionate increase in the NAV per Share of the Fund. Therefore, the reverse split did not change the aggregate value of a shareholder’s investment or the total market value of the shares outstanding.
The reverse split was applied retroactively for all periods presented in the financial statements.
2. Summary of Significant Accounting Policies
These financial statements are prepared in accordance with U.S. generally accepted accounting principles (“GAAP”) which require management to make estimates and assumptions that affect the reported amounts of assets and liabilities and disclosures of contingent assets and liabilities at the date of the financial statements and the reported amounts of increases and decreases in net assets from operations during the reporting period. Actual results could differ from those estimates.
Investment Valuation
In computing each Fund’s NAV, the Fund’s securities holdings are valued based on their last readily available market price. Price information on listed securities, including Underlying ETFs, is taken from the exchange where the security is primarily traded. Securities regularly traded in an Over-the-Counter (“OTC”) market are valued at the latest quoted sales price on the primary exchange or national securities market on which such securities are traded. Securities not listed on an exchange or national securities market, or securities in which there was no last reported sales price, are valued at the most recent bid price. Other portfolio securities and assets for which market quotations are not readily available are valued based on fair value as determined in good faith by the Board of Trustees of the Trust.
ADVISORSHARES TRUST
Notes to Financial Statements (Continued)
June 30, 2022
2. Summary of Significant Accounting Policies – (continued)
Investment Transactions
Investment transactions are accounted for on the trade date. Realized gains and losses on sales of investment securities are calculated using the identified cost method. Dividend income and distributions to shareholders are recognized on the ex-dividend date and interest income and expenses are recognized on the accrual basis. Premiums and discounts are amortized over the life of the bond using the effective interest method.
Distributions received from investments in Real Estate Investment Trusts (“REITs”) are recorded as dividend income on ex-dividend date, subject to reclassification upon notice of the character of such distributions by the issuer. The portion of dividend attributable to the return of capital is recorded against the cost basis of the security.
Foreign Taxes
The Funds may be subject to foreign taxes (a portion of which may be reclaimable) on income, capital gains on investments, certain foreign currency transactions or other corporate events. All foreign taxes are recorded in accordance with the applicable foreign tax regulations and rates that exist in the foreign jurisdictions in which the Funds invest. These foreign taxes, if any, are paid by the Funds and are reflected in their Statements of Operations.
Expenses
Expenses of the Trust, which are directly identifiable to a specific Fund, are applied to that Fund. Expenses which are not readily identifiable to a specific Fund are allocated in such a manner as deemed equitable, taking into consideration the nature and type of expense and the relative net assets of each Fund.
Futures Contracts
Certain Funds may invest in futures contracts (“futures”), in order to hedge its investments against fluctuations in value caused by changes in prevailing interest rates or market conditions. Such Funds may invest in futures as a primary investment strategy. Investments in futures may increase or leverage exposure to a particular market risk, thereby increasing price volatility of derivative instruments a Fund holds. No monies are paid or received by a Fund upon the purchase or sale of a futures contract. Initially, a Fund will be required to deposit with the broker an amount of cash or cash equivalents, known as initial margin, based on the value of the contract. Subsequent payments, called variation margin, to and from the broker, will be made on a daily basis as the price of the underlying instruments fluctuates, making the long and short positions in the futures contract more or less valuable, a process known as ‘marking-to-the-market’. Once a final determination of variation margin is made, additional cash is required to be paid by or released to a Fund, and a Fund will realize a loss or gain. The Funds may be subject to the risk that the change in the value of the futures contract may not correlate perfectly with the underlying index. Use of long futures contracts subjects the Funds to risk of loss in excess of the amounts shown on the Statements of Assets and Liabilities, up to the notional value of the futures contracts. Use of short futures contracts subjects the Funds to unlimited risk of loss. The Funds may enter into futures contracts only on exchanges or boards of trade. The exchange or board of trade acts as the counterparty to each futures contract; therefore, the Funds’ credit risk is limited to failure of the exchange or board of trade. Under some circumstances, futures exchanges may establish daily limits on the amount that the price of a futures contract can vary from the previous day’s settlement price, which could effectively prevent liquidation of unfavorable positions.
ADVISORSHARES TRUST
Notes to Financial Statements (Continued)
June 30, 2022
2. Summary of Significant Accounting Policies – (continued)
Swap Agreements
Certain funds may invest in equity swaps to obtain exposure to the underlying referenced security, obtain leverage or enjoy the returns from ownership without actually owning equity. Equity swaps are two-party contracts that generally obligate one party to pay the positive return and the other party to pay the negative return on a specified reference security, basket of securities, security index or index component during the period of the swap. Equity swap contracts are marked to market daily based on the value of the underlying security and the change, if any, is recorded as an unrealized gain or loss.
Equity swaps normally do not involve the delivery of securities or other underlying assets. Accordingly, the risk of loss with respect to equity swaps is normally limited to the net amount of payments that a Fund is contractually obligated to make. If the other party to an equity swap defaults a Fund’s risk of loss consists of the net amount of payments that the Fund is contractually entitled to receive, if any.
Equity swaps are derivatives and their value can be very volatile. To the extent that the Advisor or Sub-Advisor, as applicable, do not accurately analyze and predict future market trends, the values of assets or economic factors, the Funds may suffer a loss, which may be substantial. The swap markets in which many types of swap transactions are traded have grown substantially in recent years, with a large number of banks and investment banking firms acting both as principals and as agents. As a result, the markets for certain types of swaps have become relatively liquid. Periodic payments received or paid by the Funds are recorded as realized gains or losses.
Repurchase Agreements
The Funds may enter into repurchase agreements provided that the value of the underlying collateral, including accrued interest, will equal or exceed the value of the repurchase agreement during the term of the agreement. The underlying collateral for all repurchase agreements is held in safekeeping by the Fund’s custodian or at the Federal Reserve Bank. If the seller defaults and the value of the collateral declines, or if bankruptcy proceedings commence with respect to the seller of the security, realization of the collateral by the Fund may be delayed or limited.
At June 30, 2022, the market values of repurchase agreements outstanding are included as cash collateral for securities on loan on the Statements of Assets and Liabilities.
Short Sales
Certain Funds may sell securities it does not own as a hedge against some of its long positions and/or in anticipation of a decline in the market value of that security (short sale). When the Funds make a short sale, it must borrow the security sold short and deliver it to the broker-dealer through which it made the short sale. The Funds may have to pay a fee to borrow the particular security and may be obligated to remit any interest or dividends received on such borrowed securities. Dividends declared on short positions open are recorded on the ex-date as an expense. A gain, limited to the price at which the Funds sold the security short, or a loss, unlimited in magnitude, will be recognized upon the termination of a short sale if the market price at termination is less than or greater than, respectively, the proceeds originally received. The Funds are also subject to the risk that it may be unable to reacquire a security to terminate a short position except at a price substantially in excess of the last quoted price.
ADVISORSHARES TRUST
Notes to Financial Statements (Continued)
June 30, 2022
2. Summary of Significant Accounting Policies – (continued)
The Funds are required to pledge cash or securities to the broker as collateral for the securities sold short. Collateral requirements are calculated daily based on the current market value of the short positions. Cash deposited with broker for collateral for securities sold short is recorded as an asset on the Statements of Assets and Liabilities and securities segregated as collateral are denoted in the Schedule of Investments. The Funds may receive or pay the net of the following amounts: (i) a portion of the income from the investment of cash collateral; (ii) the broker’s fee on the borrowed securities; and (iii) a financing charge for the difference in the market value of the short position and cash collateral deposited with the broker. This income or fee is calculated daily based upon the market value of each borrowed security and a variable rate that is dependent on the availability of the security. The net amount of income or fees paid to Ranger Equity Bear ETF for the year ended June 30, 2022 was $1,136,642, which is included as Interest on Securities Sold, Not Yet Purchased in the Statements of Operations.
Deposits with brokers and segregated cash for securities sold short represent cash balances on deposit with the Funds’ prime brokers and custodian. The Funds are subject to credit risk should the prime brokers be unable to meet its obligations to the Funds.
Term Loans
Certain Funds invests in senior secured corporate loans or bank loans, some of which may be partially or entirely unfunded and purchased on a when-issued or delayed delivery basis, that pay interest at rates which are periodically reset by reference to a base lending rate plus a spread. Bank loans generally pay interest at rates which are periodically determined by reference to a base lending rate plus a premium. All loans carry a variable rate of interest. These base lending rates are generally (i) the Prime Rate offered by one or more major United States banks, (ii) the lending rate offered by one or more European banks such as the London Interbank Offered Rate (“LIBOR”) or (iii) the Certificate of Deposit rate. Bank Loans, while exempt from registration, under the Securities Act of 1933, contain certain restrictions on resale and cannot be sold publicly. Floating rate bank loans often require prepayments from excess cash flow or permit the borrower to repay at its election. The degree to which borrowers repay, whether as a contractual requirement or at their election, cannot be predicted with accuracy. As a result, actual maturity may be substantially less than the stated maturity. Bank loans in which the Fund invests are generally readily marketable, but may be subject to certain restrictions on resale.
Options
Certain Funds are authorized to write and purchase put and call options. When a Fund writes an option, an amount equal to the premium received by the Fund is reflected as an asset and an equivalent liability. The amount of the liability is subsequently marked to market to reflect the current market value of the option written. When a security is purchased or sold through an exercise of an option, the related premium paid (or received) is added to (or deducted from) the basis of the security acquired or deducted from (or added to) the proceeds of the security sold. When an option expires (or the Fund enters into a closing transaction), the Fund realizes a gain or loss on the option to the extent of the premiums received or paid (or gain or loss to the extent the cost of the closing transaction exceeds the premium paid or received). The Fund, as writer of an option, bears the market risk of an unfavorable change in the price of the security underlying the written option. Written and purchased options are non-income producing investments.
ADVISORSHARES TRUST
Notes to Financial Statements (Continued)
June 30, 2022
2. Summary of Significant Accounting Policies – (continued)
Short-Term Investments
Each Fund may invest in high-quality short-term debt securities and money market instruments on an ongoing basis to maintain liquidity or pending selection of investments in accordance with its policies. These short-term debt securities and money market instruments include shares of other mutual funds, commercial paper, certificates of deposit, bankers’ acceptances, U.S. Government securities and repurchase agreements.
Securities Lending
The Funds participate in a securities lending program offered by The Bank of New York Mellon (“BNYM”) (the “Program”), providing for the lending of securities to qualified brokers. Securities lending income includes earnings of such temporary cash investments, plus or minus any rebate to a borrower. These earnings (after any rebate) are then divided between BNYM, as a fee for its services under the Program, and the Funds, according to agreed-upon rates. Collateral on all securities loaned is accepted as cash and non-cash and is maintained at a minimum level of 102% (105% in the case of certain foreign securities) of the market value, plus interest, if applicable, of investments on loan. It is the Fund’s policy to obtain additional collateral from or return excess collateral to the borrower by the end of the next business day, following the valuation date of the securities loaned. Therefore, the value of the collateral held may be temporarily less than the value of the securities on loan. Lending securities entails a risk of loss to the Funds if and to the extent that the market value of the securities loaned were to increase and the borrower did not increase the collateral accordingly, and the borrower fails to return the securities. Under the terms of the Program, the Funds are indemnified for such losses by BNYM. Cash collateral is held in a separate account managed by BNYM, who is authorized to exclusively enter into money market instruments and overnight repurchase agreements, which are collateralized at 102% with securities issued or fully guaranteed by the U.S. Treasury; U.S. Government or any agency, instrumentality or authority of the U.S. government. The securities purchased with cash collateral received are reflected in the Schedule of Investments. BNYM bears the risk of any deficiency in the amount of the cash collateral available for return to the borrower due to any loss on the collateral invested.
The money market instruments and repurchase agreements income related to the Program earned by the Funds is disclosed on the Statements of Operations.
The value of loaned securities and related collateral outstanding at June 30, 2022 are shown in the Schedules of Investments and Statements of Assets and Liabilities. Non-cash collateral received by the Funds may not be sold or re-pledged except to satisfy a borrower default. Therefore, non-cash collateral is not included on the Fund’s Schedules of Investments or Statements of Asset and Liabilities.
ADVISORSHARES TRUST
Notes to Financial Statements (Continued)
June 30, 2022
2. Summary of Significant Accounting Policies – (continued)
| | | Gross
Amounts of | | | Gross
Amounts
Offset in the
Statements | | | Net Amounts
Presented
in the
Statements | | | Gross Amounts not
offset in the
Statements of
Assets and Liabilities | | | | |
| Fund and Description | | Recognized
Assets and
(Liabilities) | | | of Assets
and
(Liabilities) | | | of Assets
and
(Liabilities) | | | Financial
Instruments | | | Collateral
Pledged/
Received | | | Net
Amount | |
| Alpha DNA Equity Sentiment ETF | | | | | | | | | | | | | | | | | | | | | | | | |
| Securities Lending | | $ | (199,490 | ) | | $ | — | | | $ | (199,490 | ) | | $ | 199,490 | (1) | | $ | — | | | $ | — | |
| Repurchase Agreements | | | 199,490 | | | | — | | | | 199,490 | | | | 199,490 | (2) | | | — | | | | — | |
| Dorsey Wright ADR ETF | | | | | | | | | | | | | | | | | | | | | | | | |
| Securities Lending | | | (9,361,577 | ) | | | — | | | | (9,361,577 | ) | | | 9,361,577 | (1) | | | — | | | | — | |
| Repurchase Agreements | | | 9,361,577 | | | | — | | | | 9,361,577 | | | | 9,361,577 | (2) | | | — | | | | — | |
| Dorsey Wright FSM US Core ETF | | | | | | | | | | | | | | | | | | | | | | | | |
| Securities Lending | | | (30,258,888 | ) | | | — | | | | (30,258,888 | ) | | | 30,258,888 | (1) | | | — | | | | — | |
| Repurchase Agreements | | | 30,258,888 | | | | — | | | | 30,258,888 | | | | 30,258,888 | (2) | | | — | | | | — | |
| Dorsey Wright Micro-Cap ETF | | | | | | | | | | | | | | | | | | | | | | | | |
| Securities Lending | | | (287,973 | ) | | | — | | | | (287,973 | ) | | | 287,973 | (1) | | | — | | | | — | |
| Repurchase Agreements | | | 287,973 | | | | — | | | | 287,973 | | | | 287,973 | (2) | | | — | | | | — | |
| Drone Technology ETF | | | | | | | | | | | | | | | | | | | | | | | | |
| Securities Lending | | | (84,530 | ) | | | — | | | | (84,530 | ) | | | 84,530 | (1) | | | — | | | | — | |
| Repurchase Agreements | | | 84,530 | | | | — | | | | 84,530 | | | | 84,530 | (2) | | | — | | | | — | |
| Gerber Kawasaki ETF | | | | | | | | | | | | | | | | | | | — | | | | — | |
| Securities Lending | | | (1,370,745 | ) | | | — | | | | (1,370,745 | ) | | | 1,370,745 | (1) | | | — | | | | — | |
| Repurchase Agreements | | | 1,370,745 | | | | — | | | | 1,370,745 | | | | 1,370,745 | (2) | | | | | | | | |
| Hotel ETF | | | | | | | | | | | | | | | | | | | | | | | | |
| Securities Lending | | | (185,289 | ) | | | — | | | | (185,289 | ) | | | 185,289 | (1) | | | — | | | | — | |
| Repurchase Agreements | | | 185,289 | | | | — | | | | 185,289 | | | | 185,289 | (2) | | | — | | | | — | |
| Newfleet Multi-Sector Income ETF | | | | | | | | | | | | | | | | | | | | | | | | |
| Securities Lending | | | (239,245 | ) | | | — | | | | (239,245 | ) | | | 239,245 | (1) | | | — | | | | — | |
| Repurchase Agreements | | | 239,245 | | | | — | | | | 239,245 | | | | 239,245 | (2) | | | — | | | | — | |
| Poseidon Dynamics ETF | | | | | | | | | | | | | | | | | | | | | | | | |
| Securities Lending | | | (50,852 | )(3) | | | — | | | | (50,852 | ) | | | 50,852 | (1) | | | — | | | | — | |
| Repurchase Agreements | | | 50,852 | | | | — | | | | 50,852 | | | | 50,852 | (2) | | | — | | | | — | |
| Swaps | | | (11,562 | ) | | | — | | | | (11,562 | ) | | | — | | | | — | | | | (11,562 | ) |
| Psychedelics ETF | | | | | | | | | | | | | | | | | | | | | | | | |
| Securities Lending | | | (954,429 | ) | | | — | | | | (954,429 | ) | | | 954,429 | (1) | | | — | | | | — | |
| Repurchase Agreements | | | 954,429 | | | | — | | | | 954,429 | | | | 954,429 | (2) | | | — | | | | — | |
| Swaps | | | (493,154 | ) | | | — | | | | (493,154 | ) | | | — | | | | — | | | | (493,154 | ) |
| Pure Cannabis ETF | | | | | | | | | | | | | | | | | | | | | | | | |
| Securities Lending | | | (8,759,929 | ) | | | — | | | | (8,759,929 | ) | | | 8,759,929 | (1) | | | — | | | | — | |
| Repurchase Agreements | | | 8,759,929 | | | | — | | | | 8,759,929 | | | | 8,759,929 | (2) | | | — | | | | — | |
| Swaps | | | (21,822,874 | ) | | | — | | | | (21,822,874 | ) | | | — | | | | — | | | | (21,822,874 | ) |
| Pure US Cannabis ETF | | | | | | | | | | | | | | | | | | | | | | | | |
| Securities Lending | | | (1,088,492 | ) | | | — | | | | (1,088,492 | ) | | | 1,088,492 | (1) | | | — | | | | — | |
| Repurchase Agreements | | | 1,088,492 | | | | — | | | | 1,088,492 | | | | 1,088,492 | (2) | | | — | | | | — | |
| Swaps | | | (387,302,603 | ) | | | — | | | | (387,302,603 | ) | | | — | | | | — | | | | (387,302,603 | ) |
ADVISORSHARES TRUST
Notes to Financial Statements (Continued)
June 30, 2022
2. Summary of Significant Accounting Policies – (continued)
| | | Gross
Amounts of | | | Gross
Amounts
Offset in the
Statements | | | Net Amounts
Presented
in the
Statements | | | Gross Amounts not
offset in the
Statements of
Assets and Liabilities | | | | |
| Fund and Description | | Recognized
Assets and
(Liabilities) | | | of Assets
and
(Liabilities) | | | of Assets
and
(Liabilities) | | | Financial
Instruments | | | Collateral
Pledged/
Received | | | Net
Amount | |
| AdvisorShares Q Portfolio Blended Allocation ETF | | | | | | | | | | | | | | | | | | | | | | | | |
| Securities Lending | | $ | (1,144,635 | ) | | $ | — | | | $ | (1,144,635 | ) | | $ | 1,144,635 | (1) | | $ | — | | | $ | — | |
| Repurchase Agreements | | | 1,144,635 | | | | — | | | | 1,144,635 | | | | 1,144,635 | (2) | | | — | | | | — | |
| AdvisorShares Restaurant ETF | | | | | | | | | | | | | | | | | | | | | | | | |
| Securities Lending | | | (299,883 | ) | | | — | | | | (299,883 | ) | | | 299,883 | (1) | | | — | | | | — | |
| Repurchase Agreements | | | 299,883 | | | | — | | | | 299,883 | | | | 299,883 | (2) | | | — | | | | — | |
| STAR Global Buy-Write ETF | | | | | | | | | | | | | | | | | | | | | | | | |
| Securities Lending | | | (1,355,267 | ) | | | — | | | | (1,355,267 | ) | | | 1,355,267 | (1) | | | — | | | | — | |
| Repurchase Agreements | | | 1,355,267 | | | | — | | | | 1,355,267 | | | | 1,355,267 | (2) | | | — | | | | — | |
| (1) | Collateral for securities on loan is included in the Schedules of Investments and consists of Repurchase Agreements and shares of Money Market instruments. |
| (2) | Repurchase agreements are collateralized by U.S. Government Agency Obligations in the event the other party to the repurchase agreement defaults on its obligation. Amounts may also include Money Market instruments. |
| (3) | Includes $12,000 of uninvested cash collateral. |
Dividends and Distributions
Each Fund will generally pay out dividends to shareholders at least annually. Each Fund will distribute its net capital gains, if any, to shareholders annually. Income and capital gain distributions are determined in accordance with income tax regulations which may differ from U.S. generally accepted accounting principles. Distributions are recorded on ex-dividend date.
Indemnifications
In the normal course of business, each Fund enters into contracts that contain a variety of representations which provide general indemnifications. The Trust’s maximum exposure under these arrangements cannot be known; however, the Trust expects any risk of loss to be remote.
Recent Accounting Pronouncement
Accounting Standards Update 2020-04 Reference Rate Reform
In March 2020, the Financial Accounting Standards Board issued Accounting Standards Update (ASU) No. 2020-04, Reference Rate Reform (Topic 848) — Facilitation of the Effects of Reference Rate Reform on Financial Reporting. The amendments in the ASU provides optional temporary financial reporting relief from the effect of certain types of contract modifications due to the planned discontinuation of the LIBOR and other interbank-offered based reference rates as of the end of 2021. The ASU is effective for certain reference rate-related contract modifications that occur during the period March 12, 2020 through December 31, 2022. Management has reviewed the requirements and believes the adoption of this ASU will not have a material impact on the consolidated financial statements.
ADVISORSHARES TRUST
Notes to Financial Statements (Continued)
June 30, 2022
3. Investment Advisory Agreement and Other Agreements
Investment Advisory Agreement
Each Fund has entered into an investment advisory agreement with AdvisorShares Investments, LLC (the “Advisor”) pursuant to which the Advisor acts as the Fund’s investment advisor. Pursuant to the agreement, the Advisor has overall responsibility for the general management and investment of each Fund’s securities portfolio, and has ultimate responsibility (subject to oversight by the Trust’s Board of Trustees) for oversight of the Trust’s sub-advisors, if applicable. For its services, each Fund pays the Advisor an annual management fee and which is calculated daily and paid monthly based on average daily net assets. From time to time, the Advisor may waive all or a portion of its fee.
The Advisor’s annual management fee for each Fund is as follows:
| Fund: | | Rate: | |
| Alpha DNA Equity Sentiment ETF | | | 0.76 | % |
| Dorsey Wright ADR ETF | | | 0.75 | % |
| Dorsey Wright Alpha Equal Weight ETF | | | 0.75 | % |
| Dorsey Wright FSM All Cap World ETF | | | 0.75 | % |
| Dorsey Wright FSM US Core ETF | | | 0.75 | % |
| Dorsey Wright Micro-CAP ETF | | | 0.75 | % |
| Dorsey Wright Short ETF | | | 0.75 | % |
| DoubleLine Value Equity ETF | | | 0.70 | % |
| Drone Technology ETF | | | 0.64 | % |
| Focused Equity ETF | | | 0.75 | %* |
| Gerber Kawasaki ETF | | | 0.75 | % |
| Hotel ETF | | | 0.60 | % |
| Let Bob AI Powered Momentum ETF | | | 0.70 | % |
| Managed Bitcoin Strategy ETF | | | 0.90 | % |
| Newfleet Multi-Sector Income ETF | | | 0.50 | % |
| North Square McKee Core Reserves ETF | | | 0.30 | %** |
| North Square McKee ESG Core Bond ETF | | | 0.24 | %*** |
| Poseidon Dynamic Cannabis ETF | | | 0.80 | % |
| Psychedelics ETF | | | 0.60 | % |
| Pure Cannabis ETF | | | 0.60 | %**** |
| Pure US Canabis ETF | | | 0.60 | % |
| Q Dynamic Growth ETF | | | 1.00 | %* |
| Q Portfolio Blended Allocation ETF | | | 0.74 | %* |
| Ranger Equity Bear ETF | | | 1.50 | % |
| Restaurant ETF | | | 0.60 | % |
| STAR Global Buy-Write ETF | | | 1.35 | % |
| Vice ETF | | | 0.60 | % |
| * | The Advisor’s advisory fee has two components – the base fee (disclosed in the table above) and the performance fee adjustment. The base fee is the pre-determined rate at which the Advisor is paid when the Fund’s net performance is in line with Fund’s pre-determined performance benchmark. The base fee is subject to an upward or downward adjustment by the performance fee. If the Fund outperforms the performance benchmark, the Advisor may receive an upward fee adjustment. If the Fund underperforms the performance benchmark, the Advisor may receive a downward fee adjustment. The Advisor’s annual base fee based on the Fund’s average daily net assets. The performance fee adjustment is derived by comparing the Fund’s performance over a rolling twelve-month period to its performance benchmark, which is set forth in the table below. The base fee is adjusted at a rate of 0.02% for every 0.25% to 0.50% of out-performance |
ADVISORSHARES TRUST
Notes to Financial Statements (Continued)
June 30, 2022
3. Investment Advisory Agreement and Other Agreements – (continued)
or under-performance compared to the performance benchmark, but only up to 2.00% of the performance benchmark. As a result, the maximum possible performance fee adjustment, up or down, to the base fee is 0.10%. Accordingly, the Advisor’s annual advisory fee may range as follows, based on the Fund’s average daily net assets:
| Fund | | Performance
Benchmark | | Annual Advisory
Fee Range | |
| Focused Equity ETF | | S&P 500 Index | | 0.65% to 0.85% | |
| Q Dynamic Growth ETF | | S&P 500 Index | | 0.90% to 1.10% | |
| Q Portfolio Blended Allocation ETF | | Blended 60% S&P 500 Index/40% Bloomberg US Aggregate Bond Index | | 0.64% to 0.84% | |
| ** | Effective November 1, 2021, AdvisorShares Sage Core Reserves ETF changed its name to AdvisorShares North Square McKee Core Reserves ETF and the Fund’s investment advisory fee of 0.30% did not change. |
| *** | Effective November 1, 2021, AdvisorShares FolioBeyond Smart Core Bond ETF changed its name to AdvisorShares North Square McKee ESG Core Bond ETF and the Fund’s investment advisory fee changed from 0.50% to 0.24%. |
| **** | Prior to November 24, 2021, the advisory fee was 0.60%. Effective November 24, 2021, the advisory fee is 0.60% less the acquired fund fees and expenses related to any investment in AdvisorShares Pure US Cannabis ETF. |
Sub-Advisory Agreements
Each Fund’s investment sub-advisor provides investment advice and management services to the Fund. The Advisor supervises the day-to-day investment and reinvestment of the assets in each Fund and is responsible for monitoring the Fund’s adherence to its investment mandate. Pursuant to an investment sub-advisory agreement between each sub-advisor and the Advisor, the sub-advisor is entitled to a fee, which is paid by the Advisor and is not an additional expense of the applicable Fund, and is calculated daily and paid monthly by the Advisor, at an annual rate based on the average daily net assets of its respective Fund(s) as follows:
| | | Sub-Advisor | | Sub-Advisory
Fee Rate | |
| AdvisorShares Alpha DNA Equity Sentiment ETF | | Alpha DNA Investment Management LLC | | | 0.45 | % |
| AdvisorShares Dorsey Wright ADR ETF | | Dorsey, Wright & Associates, LLC | | | 0.25 | % |
| AdvisorShares Dorsey Wright Micro Cap ETF | | Dorsey, Wright & Associates, LLC | | | 0.25 | % |
| AdvisorShares Dorsey Wright Short ETF | | Dorsey, Wright & Associates, LLC | | | 0.25 | % |
| AdvisorShares DoubleLine Value ETF | | DoubleLine Equity LP | | | 0.35 | % |
| AdvisorShares Gerber Kawasaki ETF | | Gerber Kawasaki, Inc. | | | 0.50 | % |
| AdvisorShares Managed Bitcoin ETF | | Morgan Creek Capital Management, LLC | | | 0.45 | % |
| AdvisorShares Newfleet Multi-Sector Income ETF | | Newfleet Asset Management, LLC | | | 0.25 | % |
| AdvisorShares North Square McKee Core Reserves ETF | | CMS Advisors, LLC | | | 0.12 | %** |
| AdvisorShares North Square McKee ESG Core Bond ETF | | CMS Advisors, LLC | | | 0.12 | % |
| AdvisorShares Poseidon Dynamic Cannabis ETF | | Poseidon Investment Management, LLC | | | 0.50 | % |
| AdvisorShares Q Dynamic Growth ETF | | ThinkBetter, LLC | | | 0.65 | %* |
| AdvisorShares Q Portfolio Blended Allocation ETF | | ThinkBetter, LLC | | | 0.50 | %* |
| AdvisorShares Ranger Equity Bear ETF | | Ranger Alternative Management, L.P. | | | 1.00 | % |
| AdvisorShares STAR Global Buy-Write ETF | | CreativeOne Wealth, LLC | | | 0.85 | % |
| * | The sub-advisory fee has two components – the base fee (disclosed in the table above) and the performance fee adjustment. The base fee is the pre-determined rate at which the sub-adviser is paid when net performance is in line with a pre-determined performance benchmark. The base fee is subject to an upward or downward adjustment by the performance fee. If a Fund outperforms the performance benchmark, the sub-adviser may receive an upward fee adjustment. If a Fund underperforms the performance benchmark, the sub-adviser may receive a downward fee adjustment. The performance fee adjustment is derived |
ADVISORSHARES TRUST
Notes to Financial Statements (Continued)
June 30, 2022
3. Investment Advisory Agreement and Other Agreements – (continued)
by comparing a Fund’s performance over a rolling twelve-month period to its performance benchmark, which is the S&P 500 Index for AdvisorShares Q Dynamic Growth ETF and Blended 60% S&P 500 Index/40% Bloomberg US Aggregate Bond Index for AdvisorShares Q Portfolio Blended Allocation ETF. The base fee is adjusted at a rate of 0.02% for every 0.25% to 0.50% of out-performance or under-performance compared to the performance benchmark, but only up to 2.00% of the performance benchmark. As a result, the maximum possible performance fee adjustment, up or down, to the base fee is 0.10%. Accordingly, the sub-adviser’s annual sub-advisory fee may range from 0.90% to 1.10% of AdvisorShares Q Portfolio Blended Allocation ETF’s average daily net assets and 0.64% to 0.84% of AdvisorShares Q Dynamic Growth ETF’s average daily net assets.
| ** | Effective November 1, 2021, the Fund’s sub-advisory fee was changed from 0.15% to 0.12% of the Fund’s daily net assets. The fees reflected prior to November 1, 2021 represent the sub-advisory fees paid to Sage Advisory Services, Ltd. Co., the Fund’s former investment sub-advisor. |
From time to time, each sub-advisor may waive all or a portion of its fee.
Expense Limitation Agreement
The Advisor has contractually agreed to waive its fees and/or reimburse expenses in order to keep net expenses (excluding amounts payable pursuant to any plan adopted in accordance with Rule 12b-1, interest expense, taxes, brokerage commissions, acquired fund fees and expenses, other expenditures which are capitalized in accordance with generally accepted accounting principles, and extraordinary expenses) from exceeding a specified percentage of each Fund’s average daily net assets for at least one year from the date of the Fund’s currently effective prospectus. The expense limitation agreement may be terminated without payment of any penalty (i) by the Trust for any reason and at any time and (ii) by the Advisor, for any reason, upon ninety (90) days’ prior written notice to the Trust, such termination to be effective as of the close of business on the last day of the then-current one-year period. If at any point it becomes unnecessary for the Advisor to waive fees or reimburse expenses, the Board may permit the Advisor to retain the difference between the Fund’s total annual operating expenses and the expense limitation currently in effect, or, if the current expense limitation is lower, the expense limitation that was in effect at the time of the waiver and/or reimbursement, to recapture all or a portion of its prior fee waivers or expense reimbursements within three years of the date they were waived or reimbursed. The expense limits in effect for each Fund during the year ended June 30, 2022 were as follows:
| Fund: | | Rate: | |
| Alpha DNA Equity Sentiment ETF | | 1.35% | |
| Dorsey Wright ADR ETF | | 1.10%(a) | |
| Dorsey Wright Alpha Equal Weight ETF | | 0.99% | |
| Dorsey Wright FSM All Cap World ETF | | 0.99% | |
| Dorsey Wright FSM US Core ETF | | 0.99% | |
| Dorsey Wright Micro-Cap ETF | | 1.25%(b) | |
| Dorsey Wright Short ETF | | 1.25%(b) | |
| DoubleLine Value Equity ETF | | 0.90% | |
| Drone Technology ETF | | 0.99% | |
| Focused Equity ETF | | 0.65%-0.85%(c) | |
| Gerber Kawasaki ETF | | 0.75% | |
| Hotel ETF | | 0.99% | |
| Let Bob AI Powered Momentum ETF | | 0.99% | |
| Managed Bitcoin Strategy ETF | | 1.49% | |
ADVISORSHARES TRUST
Notes to Financial Statements (Continued)
June 30, 2022
3. Investment Advisory Agreement and Other Agreements – (continued)
| Fund: | | Rate: | |
| Newfleet Multi-Sector Income ETF | | 0.75% | |
| North Square McKee Core Reserves ETF | | 0.35% | |
| North Square McKee ESG Core Bond ETF | | 0.47%(d) | |
| Poseidon Dynamic Cannabis ETF | | 0.99% | |
| Psychedelics ETF | | 0.99% | |
| Pure Cannabis ETF | | 0.74% | |
| Pure US Cannabis ETF | | 0.74% | |
| Q Dynamic Growth ETF | | 1.45% | |
| Q Portfolio Blended Allocation ETF | | 0.99% | |
| Ranger Equity Bear ETF | | 1.85% | |
| Restaurant ETF | | 0.99% | |
| STAR Global Buy-Write ETF | | 1.85% | |
| Vice ETF | | 0.99%(e) | |
| (a) | Prior to November 1, 2019, the expense limit was 0.88%. |
| (b) | Prior to November 1, 2019, the expense limit was 0.99%. |
| (c) | The expense limit is equal to the annual rate of the Advisor’s contractual advisory fee, which can range from 0.65% to 0.85%. |
| (d) | Prior to November 1, 2021, the expense limit was 0.95% |
| (e) | Prior to November 1, 2019, the expense limit was 0.75%. |
The Advisor may recapture operating expenses waived and/or reimbursed within three years after the date on which such waiver or reimbursement occurred. The Funds must pay their ordinary operating expenses before the Advisor is permitted to recapture and must remain in compliance with any applicable expense limitation. All or a portion of the following Advisor waived and/or reimbursed expenses may be recaptured during the fiscal years indicated:
| Fund | | Expenses
Reimbursed | | | Recoupment
Balance | | | Recoupment
Expiration | |
| Dorsey Wright ADR ETF | | $ | 12,898 | | | $ | 12,898 | | | 6/30/2025 | |
| Total | | | 12,898 | | | | 12,898 | | | | |
| | | | | | | | | | | | |
| Dorsey Wright Alpha Equal Weight ETF | | | 43,933 | | | | 43,933 | | | 6/30/2025 | |
| Total | | | 43,933 | | | | 43,933 | | | | |
| | | | | | | | | | | | |
| Dorsey Wright FSM All Cap World ETF | | | 32,530 | | | | 32,530 | | | 6/30/2025 | |
| Total | | | 32,530 | | | | 32,530 | | | | |
| | | | | | | | | | | | |
| Dorsey Wright FSM US Core ETF | | | 24,662 | | | | 24,662 | | | 6/30/2025 | |
| Total | | | 24,662 | | | | 24,662 | | | | |
| | | | | | | | | | | | |
| Dorsey Wright Micro Cap ETF | | | 77,363 | | | | 77,363 | | | 6/30/2023 | |
| | | | 82,864 | | | | 82,864 | | | 6/30/2024 | |
| | | | 63,589 | | | | 63,589 | | | 6/30/2025 | |
| Total | | | 223,816 | | | | 223,816 | | | | |
ADVISORSHARES TRUST
Notes to Financial Statements (Continued)
June 30, 2022
3. Investment Advisory Agreement and Other Agreements – (continued)
| Fund | | Expenses
Reimbursed | | | Recoupment
Balance | | | Recoupment
Expiration | |
| Dorsey Wright Short ETF | | $ | 42,681 | | | $ | 18,585 | | | 6/30/2024 | |
| Total | | | 42,681 | | | | 18,585 | | | | |
| | | | | | | | | | | | |
| DoubleLine Value Equity ETF | | | 91,372 | | | | 91,372 | | | 6/30/2023 | |
| | | | 67,609 | | | | 67,609 | | | 6/30/2024 | |
| | | | 31,171 | | | | 31,171 | | | 6/30/2025 | |
| Total | | | 190,152 | | | | 190,152 | | | | |
| | | | | | | | | | | | |
| Drone Technology ETF | | | 48,634 | | | | 48,634 | | | 6/30/2025 | |
| Total | | | 48,634 | | | | 48,634 | | | | |
| | | | | | | | | | | | |
| Focused Equity ETF | | | 125,699 | | | | 125,699 | | | 6/30/2023 | |
| | | | 125,958 | | | | 125,958 | | | 6/30/2024 | |
| | | | 134,742 | | | | 134,742 | | | 6/30/2025 | |
| Total | | | 386,399 | | | | 386,399 | | | | |
| | | | | | | | | | | | |
| Gerber Kawasaki ETF | | | 110,127 | | | | 110,127 | | | 6/30/2025 | |
| Total | | | 110,127 | | | | 110,127 | | | | |
| | | | | | | | | | | | |
| Hotel ETF | | | 47,304 | | | | 47,304 | | | 6/30/2024 | |
| | | | 28,064 | | | | 28,064 | | | 6/30/2025 | |
| Total | | | 75,368 | | | | 75,368 | | | | |
| | | | | | | | | | | | |
| Let Bob AI Powered Momentum ETF | | | 42,558 | | | | 42,558 | | | 6/30/2025 | |
| Total | | | 42,558 | | | | 42,558 | | | | |
| | | | | | | | | | | | |
| Managed Bitcoin Strategy ETF | | | 126,899 | | | | 126,899 | | | 6/30/2025 | |
| Total | | | 126,899 | | | | 126,899 | | | | |
| | | | | | | | | | | | |
| Newfleet Multi-Sector Income ETF | | | 50,459 | | | | 50,459 | | | 6/30/2023 | |
| | | | 21,007 | | | | 21,007 | | | 6/30/2024 | |
| | | | 13,998 | | | | 13,998 | | | 6/30/2025 | |
| Total | | | 85,464 | | | | 85,464 | | | | |
| | | | | | | | | | | | |
| North Square McKee Core Reserves ETF | | | 165,567 | | | | 165,567 | | | 6/30/2023 | |
| | | | 158,115 | | | | 158,115 | | | 6/30/2024 | |
| | | | 115,396 | | | | 115,396 | | | 6/30/2025 | |
| Total | | | 439,078 | | | | 439,078 | | | | |
| | | | | | | | | | | | |
| North Square McKee ESG Core Bond ETF | | | 39,057 | | | | 39,057 | | | 6/30/2023 | |
| | | | 79,609 | | | | 79,609 | | | 6/30/2024 | |
| | | | 107,727 | | | | 107,727 | | | 6/30/2025 | |
| Total | | | 226,393 | | | | 226,393 | | | | |
| | | | | | | | | | | | |
| Poseidon Dynamic Cannabis ETF | | | 65,585 | | | | 65,585 | | | 6/30/2025 | |
| Total | | | 65,585 | | | | 65,585 | | | | |
ADVISORSHARES TRUST
Notes to Financial Statements (Continued)
June 30, 2022
3. Investment Advisory Agreement and Other Agreements – (continued)
| Fund | | Expenses
Reimbursed | | | Recoupment
Balance | | | Recoupment
Expiration | |
| Psychedelics ETF | | $ | 94,175 | | | $ | 94,175 | | | 6/30/2025 | |
| Total | | | 94,175 | | | | 94,175 | | | | |
| | | | | | | | | | | | |
| Pure Cannabis ETF | | | 114,084 | | | | 114,084 | | | 6/30/2023 | |
| | | | 318,586 | | | | 283,232 | | | 6/30/2025 | |
| Total | | | 432,670 | | | | 397,316 | | | | |
| | | | | | | | | | | | |
| Pure US Cannabis ETF | | | 16,091 | | | | — | | | 6/30/2024 | |
| | | | 301,514 | | | | 291,422 | | | 6/30/2025 | |
| Total | | | 317,605 | | | | 291,422 | | | | |
| | | | | | | | | | | | |
| Q Dynamic Growth ETF | | | 3,158 | | | | 3,158 | | | 6/30/2025 | |
| Total | | | 3,158 | | | | 3,158 | | | | |
| | | | | | | | | | | | |
| Q Portfolio Blended Allocation ETF | | | 71,767 | | | | 71,767 | | | 6/30/2024 | |
| | | | 83,186 | | | | 83,186 | | | 6/30/2025 | |
| Total | | | 154,953 | | | | 154,953 | | | | |
| | | | | | | | | | | | |
| Restaurant ETF | | | 47,820 | | | | 47,820 | | | 6/30/2024 | |
| | | | 47,970 | | | | 47,970 | | | 6/30/2025 | |
| Total | | | 95,790 | | | | 95,790 | | | | |
| | | | | | | | | | | | |
| STAR Global Buy-Write ETF | | | 49,370 | | | | 36,534 | | | 6/30/2023 | |
| | | | 78,833 | | | | 78,833 | | | 6/30/2024 | |
| | | | 3,755 | | | | 3,755 | | | 6/30/2025 | |
| Total | | | 131,958 | | | | 119,122 | | | | |
| | | | | | | | | | | | |
| | | | | | | | | | | | |
| Vice ETF | | | 79,289 | | | | 79,289 | | | 6/30/2023 | |
| | | | 83,764 | | | | 83,764 | | | 6/30/2024 | |
| | | | 73,954 | | | | 73,954 | | | 6/30/2025 | |
| Total | | | 237,007 | | | | 237,007 | | | | |
Administrator, Custodian, Fund Accountant and Transfer Agent
The Bank of New York Mellon (“BNYM”) (in each capacity, the “Administrator”, “Custodian”, “Fund Accountant” or “Transfer Agent”), serves as the Fund’s Administrator, Custodian, Fund Accountant and Transfer Agent pursuant to a certain Fund Administration and Accounting Agreement, a Custody Agreement or a Transfer Agency and Service Agreement, as the case may be.
Distribution Arrangement
Foreside Fund Services, LLC (the “Distributor”) serves as the Fund’s distributor of Creation Units for the Fund pursuant to the distribution agreement. The Distributor does not maintain any secondary market shares. The Funds have adopted a Distribution and Service Plan (“Plan”) pursuant to Rule 12b-1 under the 1940 Act. In accordance with its Plan, each Fund is authorized to pay an amount up to 0.25% of its average daily net assets each year for certain distribution-related activities. No fees are currently paid by each Fund under the Plan, and there are no current plans to impose these fees. However, in the event Rule 12b-1 fees were charged, over time they would increase the cost of an investment in each Fund.
ADVISORSHARES TRUST
Notes to Financial Statements (Continued)
June 30, 2022
4. Creation and Redemption Transactions
The Funds issue and redeem shares on a continuous basis at NAV in groups of 25,000 shares, at minimum, called “Creation Units.” Except when aggregated in Creation Units, shares are not redeemable securities of a Fund. Only “Authorized Participants” may purchase or redeem shares directly from each Fund. An Authorized Participant is either (i) a broker-dealer or other participant in the clearing process through the Continuous Net Settlement System of the National Securities Clearing Corporation or (ii) a DTC participant and, in each case, must have executed a Participant Agreement with the Distributor. Most retail investors will not qualify as Authorized Participants or have the resources to buy and sell whole Creation Units. Therefore, they will be unable to purchase or redeem the shares directly from the Fund. Rather, most retail investors will purchase shares in the secondary market with the assistance of a broker and will be subject to customary brokerage commissions or fees.
5. Summary of Fair Value Disclosure
The Financial Accounting Standard Board’s (“FASB”) Accounting Standards Codification (“ASC”) 820-10, Fair Value Measurements and Disclosures, defines fair value, establishes an authoritative framework for measuring fair value in accordance with generally accepted accounting principles, and expands disclosure about fair value measurements. Various inputs are used in determining the value of the Fund’s investments. These inputs are summarized in the three broad levels listed below:
| ● | Level 1 — Unadjusted quoted prices in active markets for identical assets or liabilities that the company has the ability to access. |
| ● | Level 2 — Observable inputs other than quoted prices included in Level 1 that are observable for the asset or liability either directly or indirectly. These inputs may include quoted prices for the identical instrument on an inactive market, prices for similar instruments, interest rates, prepayment speeds, credit risk, yield curves, default rates, and similar data. |
| ● | Level 3 — Unobservable inputs for the asset or liability to the extent that relevant observable inputs are not available, representing the company’s own assumptions about the assumptions that a market participant would use in valuing the asset or liability, and that would be based on the best information available. |
Investments that use Level 2 or Level 3 inputs may include, but are not limited to: (i) an unlisted security related to corporate actions; (ii) a restricted security (e.g., one that may not be publicly sold without registration under the Securities Act of 1933 as amended); (iii) a security whose trading has been suspended or which has been de-listed from its primary trading exchange; (iv) a security that is thinly traded; (v) a security in default or bankruptcy proceedings for which there is no current market quotation; (vi) a security affected by currency controls or restrictions; and (vii) a security affected by a significant event (e.g., an event that occurs after the close of the markets on which the security is traded but before the time as of which a Fund’s net asset value is computed and that may materially affect the value of the Fund’s investment). Examples of events that may be ”significant events” are government actions, natural disasters, armed conflicts and acts of terrorism. The inputs or methodology used for valuing securities are not necessarily an indication of the risk associated with investing in those securities.
For more detailed categories, see the accompanying Schedules of Investments.
ADVISORSHARES TRUST
Notes to Financial Statements (Continued)
June 30, 2022
6. Derivative Instruments
The Funds have adopted authoritative standards of accounting for derivative instruments which establish enhanced disclosure requirements. These standards improve financial reporting for derivative instruments by requiring enhanced disclosures that enables investors to understand how and why a fund uses derivative instruments, how derivative instruments are accounted for and how derivative instruments affect a fund’s financial position and results of operations. The Funds use derivative instruments as part of their principal investment strategy to achieve their investment objective.
At June 30, 2022, the fair values of derivative instruments were as follows:
Statements of Assets and Liabilities:
| Fund: | | Asset Derivatives: | | Equity Risk | |
| Alpha DNA Equity Sentiment ETF | | Purchased Options, At Value | | $ | 2,204,356 | |
| Pure U.S. Cannabis ETF | | Unrealized Appreciation on Swaps Contracts | | | 30,906 | |
| Fund: | | Liability Derivatives: | | Equity Risk | |
| Poseidon Dynamic Cannabis ETF | | Unrealized Depreciation on Swaps Contracts | | $ | (11,562 | ) |
| Psychedelics ETF | | Unrealized Depreciation on Swaps Contracts | | | (493,154 | ) |
| Pure Cannabis ETF | | Unrealized Depreciation on Swaps Contracts | | | (21,822,874 | ) |
| Pure US Cannabis ETF | | Unrealized Depreciation on Swaps Contracts | | | (387,333,508 | ) |
| STAR Global Buy-Write ETF | | Options Written, At Value | | | (15,925 | ) |
Transactions in derivative instruments during the year ended June 30, 2022, were as follows:
Statements of Operations:
| Fund: | | Realized Gain (Loss): | | Equity Risk | | | Credit Risk | |
| Alpha DNA Equity Sentiment ETF | | Purchased Options | | $ | 1,566,321 | | | $ | — | |
| North Square McKee Core Reserves ETF | | Futures | | | — | | | | 1,062 | |
| Poseidon Dynamic Cannabis ETF | | Swaps | | | (8,171,959 | ) | | | — | |
| Psychedelics ETF | | Swaps | | | (120,573 | ) | | | — | |
| Pure Cannabis ETF | | Swaps | | | (25,924,285 | ) | | | — | |
| Pure US Cannabis ETF | | Swaps | | | (637,418,579 | ) | | | — | |
| STAR Global Buy-Write ETF | | Options Written | | | 304,360 | | | | — | |
| STAR Global Buy-Write ETF | | Purchased Options | | | (101,470 | ) | | | — | |
| Fund: | | Change in Unrealized Gain (Loss): | | Equity Risk | | | Credit Risk | |
| Alpha DNA Equity Sentiment ETF | | Purchased Options | | $ | 806,618 | | | $ | — | |
| Poseidon Dynamic Cannabis ETF | | Swaps | | | (11,562 | ) | | | — | |
| Psychedelics ETF | | Swaps | | | (493,154 | ) | | | — | |
| Pure Cannabis ETF | | Swaps | | | (24,246,526 | ) | | | — | |
| Pure US Cannabis ETF | | Swaps | | | (326,779,605 | ) | | | — | |
| STAR Global Buy-Write ETF | | Options Written | | | 30,787 | | | | — | |
| STAR Global Buy-Write ETF | | Purchased Options | | | 46,220 | | | | | |
ADVISORSHARES TRUST
Notes to Financial Statements (Continued)
June 30, 2022
6. Derivative Instruments – (continued)
For the year ended June 30, 2022, the average volume of the derivatives opened by the Funds was as follows:
| | | Alpha
DNA
Equity
Sentiment
ETF | | | Poseidon
Dynamic
Cannabis
ETF | | | Psychedelics
ETF | | | Pure
Cannabis
ETF | | | Pure US
Cannabis
ETF | | | STAR
Global
Buy-
Write ETF | |
| Long Swaps Contracts | | $ | — | | | $ | 25,103 | | | $ | 49,822 | | | $ | 1,084,736 | | | $ | 1,283,747 | | | $ | — | |
| Purchased Options Contracts | | | 471,935 | | | | — | | | | — | | | | — | | | | — | | | | 45,390 | |
| Written Options Contracts | | | — | | | | — | | | | — | | | | — | | | | — | | | | 21,099 | |
7. Federal Income Tax
Each Fund intends to qualify as a “regulated investment company” under Sub-chapter M of the Internal Revenue Code of 1986, as amended. If so qualified, the Funds will not be subject to Federal income tax to the extent it distributes substantially all of its net investment income and net capital gains to its shareholders. Accounting for Uncertainty in Income Taxes provides guidance for how uncertain tax positions should be recognized, measured, presented and disclosed in the financial statements, and requires the evaluation of tax positions taken or expected to be taken in the course of preparing a Fund’s tax returns to determine whether the tax positions are “more-likely-than-not” of being sustained by the applicable tax authority. Tax positions not deemed to meet the more-than-likely-than-not threshold would be recorded as a tax benefit or expense in the current year. Interest and penalty related to income taxes would be recorded as income tax expense. Management of the Funds is required to analyze all open tax years (2019 − 2021), as defined by IRS statute of limitations, for all major jurisdictions, including federal tax authorities and certain state tax authorities. As of June 30, 2022, the Funds did not have a liability for any unrecognized tax benefits. The Funds have no examination in progress and is not aware of any tax positions for which it is reasonably possible that the amounts of unrecognized tax benefits will significantly change in the next twelve months.
At June 30, 2022, the approximate cost of investments, excluding short positions, and net unrealized appreciation (depreciation) for federal income tax purposes was as follows:
| Fund | | Cost | | | Gross
Unrealized
Appreciation | | | Gross Unrealized
(Depreciation) | | | Net
Unrealized
Appreciation
(Depreciation) | | | Other
Derivatives
Net
Unrealized
Appreciation
(Depreciation) | |
| Alpha DNA Equity Sentiment ETF | | $ | 57,410,758 | | | $ | 490,899 | | | $ | (7,092,220 | ) | | $ | 6,601,321 | | | $ | — | |
| Dorsey Wright ADR ETF | | | 52,611,361 | | | | 3,330,740 | | | | (4,815,174 | ) | | | (1,484,434 | ) | | | — | |
| Dorsey Wright Alpha Equal Weight ETF | | | 44,480,349 | | | | 548,951 | | | | (2,311,871 | ) | | | (1,762,920 | ) | | | — | |
| Dorsey Wright FSM All Cap World ETF | | | 90,962,947 | | | | — | | | | (6,682,230 | ) | | | (6,682,230 | ) | | | — | |
| Dorsey Wright FSM US Core ETF | | | 117,162,039 | | | | — | | | | (7,057,360 | ) | | | (7,057,360 | ) | | | — | |
| Dorsey Wright Micro-Cap ETF | | | 8,003,388 | | | | 664,238 | | | | (982,648 | ) | | | (318,410 | ) | | | — | |
| Dorsey Wright Short ETF | | | 47,718,258 | | | | 531,541 | | | | (656,521 | ) | | | (124,980 | ) | | | 11,374,038 | |
| DoubleLine Value Equity ETF | | | 45,634,377 | | | | 5,914,250 | | | | (5,172,202 | ) | | | 742,048 | | | | — | |
| Drone Technology ETF | | | 662,346 | | | | 4,387 | | | | (82,159 | ) | | | (77,772 | ) | | | — | |
| Focused Equity ETF | | | 26,328,257 | | | | 4,542,585 | | | | (2,749,995 | ) | | | 1,792,590 | | | | — | |
ADVISORSHARES TRUST
Notes to Financial Statements (Continued)
June 30, 2022
7. Federal Income Tax – (continued)
| Fund | | Cost | | | Gross Unrealized
Appreciation | | | Gross Unrealized
(Depreciation) | | | Net
Unrealized
Appreciation
(Depreciation) | | | Other
Derivatives
Net
Unrealized
Appreciation
(Depreciation) | |
| Gerber Kawasaki ETF | | $ | 23,427,204 | | | $ | 75,332 | | | $ | (6,246,554 | ) | | $ | (6,171,222 | ) | | $ | — | |
| Hotel ETF | | | 7,823,226 | | | | 104,504 | | | | (1,825,789 | ) | | | (1,721,285 | ) | | | — | |
| Let Bob AI Powered Momentum ETF | | | 24,259,178 | | | | 19,676 | | | | (110,069 | ) | | | (90,393 | ) | | | — | |
| Managed Bitcoin Strategy ETF | | | 668,231 | | | | — | | | | (168,347 | ) | | | (168,347 | ) | | | — | |
| Newfleet Multi-Sector Income ETF | | | 89,226,838 | | | | 7,008 | | | | (5,195,617 | ) | | | (5,188,609 | ) | | | — | |
| North Square McKee Core Reserves ETF | | | 36,510,860 | | | | 5,980 | | | | (364,808 | ) | | | (358,828 | ) | | | — | |
| North Square McKee ESG Core Bond ETF | | | 3,657,295 | | | | 448 | | | | (327,045 | ) | | | (326,597 | ) | | | — | |
| Poseidon Dynamic Cannabis ETF | | | 6,867,769 | | | | 4,330,636 | | | | (4,467,425 | ) | | | (136,789 | ) | | | (11,562 | ) |
| Psychedelics ETF | | | 13,684,847 | | | | 498,553 | | | | (7,991,487 | ) | | | (7,492,934 | ) | | | (493,154 | ) |
| Pure Cannabis ETF | | | 241,841,786 | | | | 22,041,620 | | | | (187,699,846 | ) | | | (165,658,226 | ) | | | (21,823,749 | ) |
| Pure US Cannabis ETF | | | 661,527,575 | | | | 1,025,319,476 | | | | (1,205,974,578 | ) | | | 180,655,102 | | | | (387,302,601 | ) |
| Q Dynamic Growth ETF | | | 50,581,792 | | | | — | | | | (10,252,634 | ) | | | (10,252,634 | ) | | | — | |
| Q Portfolio Blended Allocation ETF | | | 4,248,336 | | | | 4,716 | | | | (413,610 | ) | | | (408,894 | ) | | | — | |
| Ranger Equity Bear ETF | | | 143,412,041 | | | | 10,675,878 | | | | (11,259,149 | ) | | | (583,271 | ) | | | 8,628,682 | |
| Restaurant ETF | | | 3,527,721 | | | | 90,434 | | | | (676,028 | ) | | | (585,594 | ) | | | — | |
| STAR Global Buy-Write ETF | | | 43,424,870 | | | | 931,838 | | | | (5,418,980 | ) | | | (4,487,142 | ) | | | 28,149 | |
| Vice ETF | | | 9,608,147 | | | | 700,166 | | | | (1,590,090 | ) | | | (889,924 | ) | | | — | |
At June 30, 2022, the components of distributable earnings/loss on a tax basis were as follows:
| Fund | | Undistributed Ordinary Income | | | Undistributed Long-Term Capital Gains | | | Capital Loss Carryforward | | | Timing Differences | | | Post-October/ Late-year Ordinary Deferrals | | | Net Unrealized Appreciation (Depreciation) | | | Total Earnings (Losses) | |
| Alpha DNA Equity Sentiment ETF | | $ | — | | | $ | — | | | $ | (14,980,896 | ) | | $ | (9,413 | ) | | $ | — | | | $ | (6,601,321 | ) | | $ | (21,591,630 | ) |
| Dorsey Wright ADR ETF | | | — | | | | — | | | | (50,757,373 | ) | | | — | | | | — | | | | (1,484,434 | ) | | | (52,241,807 | ) |
| Dorsey Wright Alpha Equal Weight ETF | | | — | | | | — | | | | (19,783,574 | ) | | | (12,310 | ) | | | — | | | | (1,762,920 | ) | | | (21,558,804 | ) |
| Dorsey Wright FSM All Cap World ETF | | | 19,315 | | | | — | | | | (18,208,687 | ) | | | (11,359 | ) | | | — | | | | (6,682,230 | ) | | | (24,882,961 | ) |
| Dorsey Wright FSM U.S. Core ETF | | | 91,791 | | | | — | | | | (1,462,924 | ) | | | (11,359 | ) | | | — | | | | (7,057,360 | ) | | | (8,439,852 | ) |
| Dorsey Wright Micro Cap ETF | | | — | | | | — | | | | (2,057,755 | ) | | | — | | | | — | | | | (318,410 | ) | | | (2,376,165 | ) |
| Dorsey Wright Short ETF | | | — | | | | — | | | | (88,777,131 | ) | | | — | | | | (283,220 | ) | | | 11,249,058 | | | | (77,811,293 | ) |
| DoubleLine Value Equity ETF | | | 353,782 | | | | — | | | | (23,503,336 | ) | | | — | | | | — | | | | 742,048 | | | | (22,407,506 | ) |
| Drone Technology ETF | | | 1,841 | | | | — | | | | — | | | | 4,325 | | | | (2,476 | ) | | | (77,772 | ) | | | (74,082 | ) |
| Focused Equity ETF | | | 89,330 | | | | — | | | | (443,114 | ) | | | — | | | | — | | | | 1,792,590 | | | | 1,438,806 | |
| Gerber Kawasaki ETF | | | 56,161 | | | | — | | | | (3,734,986 | ) | | | (9,293 | ) | | | — | | | | (6,171,222 | ) | | | (9,859,340 | ) |
| Hotel ETF | | | — | | | | — | | | | (264,886 | ) | | | (13,697 | ) | | | — | | | | (1,721,285 | ) | | | (1,999,868 | ) |
| Let Bob AI Powered Momentum ETF | | | — | | | | — | | | | (1,625,071 | ) | | | 1,594 | | | | (38,365 | ) | | | (90,393 | ) | | | (1,752,235 | ) |
Managed Bitcoin Strategy
ETF | | | 12,134 | | | | — | | | | — | | | | (12,952 | ) | | | — | | | | (168,347 | ) | | | (169,165 | ) |
| Newfleet Multi-Sector Income ETF | | | 66,974 | | | | — | | | | (8,587,088 | ) | | | — | | | | — | | | | (5,188,609 | ) | | | (13,708,723 | ) |
| North Square McKee Core Reserves ETF | | | 13,536 | | | | — | | | | (1,037,376 | ) | | | — | | | | — | | | | (358,828 | ) | | | (1,382,668 | ) |
ADVISORSHARES TRUST
Notes to Financial Statements (Continued)
June 30, 2022
7. Federal Income Tax – (continued)
| Fund | | Undistributed Ordinary Income | | | Undistributed Long-Term Capital Gains | | | Capital Loss Carryforward | | | Timing Differences | | | Post-October/ Late-year Ordinary Deferrals | | | Net Unrealized Appreciation (Depreciation) | | | Total Earnings (Losses) | |
| North Square McKee ESG Core Bond ETF | | $ | 2,339 | | | $ | — | | | $ | (1,023,826 | ) | | $ | — | | | $ | — | | | $ | (326,597 | ) | | $ | (1,348,084 | ) |
Poseidon Dynamic Cannabis
ETF | | | — | | | | — | | | | (8,641,397 | ) | | | (1,125 | ) | | | (99,151 | ) | | | (148,351 | ) | | | (8,890,024 | ) |
| Psychedelics ETF | | | — | | | | — | | | | (488,128 | ) | | | (17,282 | ) | | | — | | | | (7,986,088 | ) | | | (8,491,498 | ) |
| Pure Cannabis ETF | | | — | | | | — | | | | (54,767,969 | ) | | | — | | | | — | | | | (187,481,975 | ) | | | (242,249,944 | ) |
| Pure US Cannabis ETF | | | — | | | | — | | | | (679,868,708 | ) | | | (116,209 | ) | | | (6,536,522 | ) | | | (567,957,703 | ) | | | (1,254,479,142 | ) |
| Q Dynamic Growth ETF | | | — | | | | — | | | | (5,014,927 | ) | | | (11,335 | ) | | | (246,331 | ) | | | (10,252,634 | ) | | | (15,525,227 | ) |
| Q Portfolio Blended Allocation ETF | | | 4,201 | | | | — | | | | (764,919 | ) | | | (11,336 | ) | | | — | | | | (408,894 | ) | | | (1,180,948 | ) |
| Ranger Equity Bear ETF | | | — | | | | — | | | | (341,525,836 | ) | | | — | | | | (1,134,889 | ) | | | 8,045,411 | | | | (334,615,314 | ) |
| Restaurant ETF | | | 31,465 | | | | — | | | | (808,335 | ) | | | (13,697 | ) | | | — | | | | (585,594 | ) | | | (1,376,161 | ) |
| STAR Global Buy-Write ETF | | | 650,538 | | | | 67,078 | | | | — | | | | (329,679 | ) | | | — | | | | (4,458,993 | ) | | | (4,071,056 | ) |
| Vice ETF | | | — | | | | — | | | | (433,769 | ) | | | — | | | | — | | | | (889,924 | ) | | | (1,323,693 | ) |
The differences between book and tax basis components of net assets are primarily attributed to wash sale loss deferrals and other book/tax differences.
At June 30, 2022, the effect of permanent book/tax reclassifications resulted in increases/(decreases) to the components of net assets as follows:
| Fund | | Distributable
Earnings
(Loss) | | | Paid-in
Capital | |
| Alpha DNA Equity Sentiment ETF | | $ | (4,425,975 | ) | | $ | 4,425,975 | |
| Dorsey Wright ADR ETF | | | (4,478,554 | ) | | | 4,478,554 | |
| Dorsey Wright Alpha Equal Weight ETF | | | (3,912,046 | ) | | | 3,912,046 | |
| Dorsey Wright FSM All Cap World ETF | | | (1,202,819 | ) | | | 1,202,819 | |
| Dorsey Wright FSM U.S. Core ETF | | | (9,088,222 | ) | | | 9,088,222 | |
| Dorsey Wright Micro Cap ETF | | | (1,393,774 | ) | | | 1,393,774 | |
| Dorsey Wright Short ETF | | | 832,322 | | | | (832,322 | ) |
| DoubleLine Value Equity ETF | | | (763,133 | ) | | | 763,133 | |
| Drone Technology ETF | | | — | | | | — | |
| Focused Equity ETF | | | (3,192,396 | ) | | | 3,192,396 | |
| Gerber Kawasaki ETF | | | (1,011 | ) | | | 1,011 | |
| Hotel ETF | | | (391,969 | ) | | | 391,969 | |
| Let Bob AI Powered Momentum ETF | | | — | | | | — | |
| Managed Bitcoin Strategy ETF | | | 125,686 | | | | (125,686 | ) |
| Newfleet Multi-Sector Income ETF | | | (9,609 | ) | | | 9,609 | |
| North Square McKee Core Reserves ETF | | | — | | | | — | |
| North Square McKee ESG Core Bond ETF | | | 38,921 | | | | (38,921 | ) |
| Poseidon Dynamic Cannabis ETF | | | 3,166 | | | | (3,166 | ) |
| Psychedelics ETF | | | 8,531 | | | | (8,531 | ) |
| Pure Cannabis ETF | | | (1,508,566 | ) | | | 1,508,566 | |
| Pure US Cannabis ETF | | | 13,216,790 | | | | (13,216,790 | ) |
ADVISORSHARES TRUST
Notes to Financial Statements (Continued)
June 30, 2022
7. Federal Income Tax – (continued)
| Fund | | Distributable
Earnings
(Loss) | | | Paid-in
Capital | |
| Q Dynamic Growth ETF | | $ | 764,940 | | | $ | (764,940 | ) |
| Q Portfolio Blended Allocation ETF | | | 80,468 | | | | (80,468 | ) |
| Ranger Equity Bear ETF | | | 2,551,656 | | | | (2,551,656 | ) |
| Restaurant ETF | | | (28,777 | ) | | | 28,777 | |
| STAR Global Buy-Write ETF | | | (108,548 | ) | | | 108,548 | |
| Vice ETF | | | (105,824 | ) | | | 105,824 | |
For financial reporting purposes, capital accounts are adjusted to reflect the tax character of permanent book/tax differences. Reclassifications are primarily due to the tax treatment of net operating losses and distributions reclassifications.
The tax character of distributions paid during the fiscal years ended June 30, 2022 and 2021 were as follows:
| Fund | | 2022
Ordinary
Income | | | 2022
Long Term
Capital Gains | | | 2022
Return
of Capital | | | 2021
Ordinary
Income | | | 2021
Long Term
Capital Gains | |
| Alpha DNA Equity Sentiment ETF | | $ | — | | | $ | — | | | | | | | $ | — | | | $ | — | |
| Dorsey Wright ADR ETF | | | 1,200,067 | | | | — | | | | | | | | 284,565 | | | | — | |
| Dorsey Wright Alpha Equal Weight ETF | | | 1,162,299 | | | | — | | | | | | | | 14,018 | | | | — | |
| Dorsey Wright FSM All Cap World ETF | | | 2,192,696 | | | | — | | | | | | | | 215,144 | | | | — | |
| Dorsey Wright FSM US Core ETF | | | 367,102 | | | | — | | | | | | | | 144,245 | | | | — | |
| Dorsey Wright Micro-Cap ETF | | | 38,855 | | | | — | | | | 9,609 | | | | — | | | | — | |
| Dorsey Wright Short ETF | | | — | | | | — | | | | | | | | — | | | | — | |
| DoubleLine Value Equity ETF | | | 520,610 | | | | — | | | | | | | | 614,874 | | | | — | |
| Drone Technology ETF | | | — | | | | — | | | | | | | | | | | | | |
| Focused Equity ETF | | | 52,120 | | | | — | | | | | | | | 62,748 | | | | — | |
| Gerber Kawasaki ETF | | | 9,594 | | | | — | | | | | | | | | | | | | |
| Hotel ETF | | | 32,154 | | | | — | | | | | | | | — | | | | — | |
| Let Bob AI Powered Momentum ETF | | | — | | | | — | | | | | | | | | | | | | |
| Managed Bitcoin Strategy ETF | | | — | | | | — | | | | | | | | | | | | | |
| Newfleet Multi-Sector Income ETF | | | 1,469,967 | | | | — | | | | | | | | 1,321,431 | | | | — | |
| North Square McKee Core Reserves ETF | | | 206,678 | | | | — | | | | | | | | 120,549 | | | | — | |
| North Square McKee ESG Core Bond ETF | | | 82,126 | | | | — | | | | | | | | 647,683 | | | | — | |
| Poseidon Dynamic Cannabis ETF | | | — | | | | — | | | | | | | | | | | | | |
| Psychedelics ETF | | | — | | | | — | | | | | | | | | | | | | |
| Pure Cannabis ETF | | | 7,501,781 | | | | — | | | | 252,376 | | | | 728,447 | | | | — | |
| Pure US Cannabis ETF | | | 3,055,414 | | | | — | | | | — | | | | — | | | | — | |
| Q Dynamic Growth ETF | | | — | | | | — | | | | | | | | — | | | | — | |
| Q Portfolio Blended Allocation ETF | | | 16,342 | | | | — | | | | | | | | — | | | | — | |
| Ranger Equity Bear ETF | | | — | | | | — | | | | | | | | — | | | | — | |
| Restaurant ETF | | | 6,358 | | | | — | | | | | | | | — | | | | — | |
| STAR Global Buy-Write ETF | | | 166,381 | | | | — | | | | | | | | 36,638 | | | | — | |
| Vice ETF | | | 118,472 | | | | — | | | | | �� | | | 128,419 | | | | — | |
ADVISORSHARES TRUST
Notes to Financial Statements (Continued)
June 30, 2022
7. Federal Income Tax – (continued)
Under current tax regulations, capital losses on securities transactions realized after October 31 (“Post-October Losses”) may be deferred and treated as occurring on the first business day of the following fiscal year. Under the recently enacted Regulated Investment Company Modernization Act of 2010, the Funds will be permitted to defer taxable ordinary income losses incurred after December 31 and treat as occurring on the first business day of the following fiscal year. Post-October losses and ordinary income losses deferred to July 1, 2022 are as follows:
| Fund | | Late Year
Ordinary Loss
Deferral | | | Short-Term
Capital Post-
October Loss | | | Long-Term
Capital
Post-October
Loss | |
| Alpha DNA Equity Sentiment ETF | | $ | — | | | $ | — | | | $ | — | |
| Dorsey Wright ADR ETF | | | — | | | | — | | | | — | |
| Dorsey Wright Alpha Equal Weight ETF | | | — | | | | — | | | | — | |
| Dorsey Wright FSM All Cap World ETF | | | — | | | | — | | | | — | |
| Dorsey Wright FSM US Core ETF | | | — | | | | — | | | | — | |
| Dorsey Wright Micro-Cap ETF | | | — | | | | — | | | | — | |
| Dorsey Wright Short ETF | | | 283,220 | | | | — | | | | — | |
| DoubleLine Value Equity ETF | | | — | | | | — | | | | — | |
| Drone Technology ETF | | | 2,476 | | | | — | | | | — | |
| Focused Equity ETF | | | — | | | | — | | | | — | |
| Gerber Kawasaki ETF | | | — | | | | — | | | | — | |
| Hotel ETF | | | — | | | | — | | | | — | |
| Let Bob AI Powered Momentum ETF | | | 38,365 | | | | — | | | | — | |
| Managed Bitcoin Strategy ETF | | | — | | | | — | | | | — | |
| Newfleet Multi-Sector Income ETF | | | — | | | | — | | | | — | |
| North Square McKee Core Reserves ETF | | | — | | | | — | | | | — | |
| North Square McKee ESG Core Bond ETF | | | — | | | | — | | | | — | |
| Poseidon Dynamic Cannabis ETF | | | 99,151 | | | | — | | | | — | |
| Psychedelics ETF | | | — | | | | — | | | | — | |
| Pure Cannabis ETF | | | — | | | | — | | | | — | |
| Pure US Cannabis ETF | | | 6,536,522 | | | | — | | | | — | |
| Q Dynamic Growth ETF | | | 246,331 | | | | — | | | | — | |
| Q Portfolio Blended Allocation ETF | | | — | | | | — | | | | — | |
| Ranger Equity Bear ETF | | | 1,134,889 | | | | — | | | | — | |
| Restaurant ETF | | | — | | | | — | | | | — | |
| STAR Global Buy-Write ETF | | | — | | | | — | | | | — | |
| Vice ETF | | | — | | | | — | | | | — | |
ADVISORSHARES TRUST
Notes to Financial Statements (Continued)
June 30, 2022
7. Federal Income Tax – (continued)
The following Funds have capital loss carryforwards available to offset future realized gains of:
| Fund | | Short-Term
No Expiration | | | Long-Term
No Expiration | | | Total | |
| Alpha DNA Equity Sentiment ETF | | $ | 14,425,150 | | | $ | 555,746 | | | $ | 14,980,896 | |
| Dorsey Wright ADR ETF | | | 50,757,373 | | | | — | | | | 50,757,373 | |
| Dorsey Wright Alpha Equal Weight ETF | | | 19,783,574 | | | | — | | | | 19,783,574 | |
| Dorsey Wright FSM All Cap World ETF | | | 18,208,687 | | | | — | | | | 18,208,687 | |
| Dorsey Wright FSM US Core ETF | | | 1,462,924 | | | | — | | | | 1,462,924 | |
| Dorsey Wright Micro-Cap ETF | | | 2,057,755 | | | | — | | | | 2,057,755 | |
| Dorsey Wright Short ETF | | | 88,638,060 | | | | 139,071 | | | | 88,777,131 | |
| DoubleLine Value Equity ETF | | | 23,503,336 | | | | — | | | | 23,503,336 | |
| Drone Technology ETF | | | — | | | | — | | | | — | |
| Focused Equity ETF | | | 38,582 | | | | 404,532 | | | | 443,114 | |
| Gerber Kawasaki ETF | | | 3,730,577 | | | | 4,409 | | | | 3,734,986 | |
| Hotel ETF | | | 264,886 | | | | — | | | | 264,886 | |
| Let Bob AI Powered Momentum ETF | | | 1,625,071 | | | | — | | | | 1,625,071 | |
| Managed Bitcoin Strategy ETF | | | — | | | | — | | | | — | |
| Newfleet Multi-Sector Income ETF | | | 2,491,383 | | | | 6,095,705 | | | | 8,587,088 | |
| North Square McKee Core Reserves ETF | | | 1,037,376 | | | | — | | | | 1,037,376 | |
| North Square McKee ESG Core Bond ETF | | | 337,482 | | | | 686,344 | | | | 1,023,826 | |
| Poseidon Dynamic Cannabis ETF | | | 8,641,397 | | | | — | | | | 8,641,397 | |
| Psychedelics ETF | | | 488,128 | | | | — | | | | 488,128 | |
| Pure Cannabis ETF | | | 34,438,177 | | | | 20,329,792 | | | | 54,767,969 | |
| Pure US Cannabis ETF | | | 674,182,150 | | | | 5,686,558 | | | | 679,868,708 | |
| Q Dynamic Growth ETF | | | 4,968,218 | | | | 46,709 | | | | 5,014,927 | |
| Q Portfolio Blended Allocation ETF | | | 612,397 | | | | 152,522 | | | | 764,919 | |
| Ranger Equity Bear ETF | | | 340,961,488 | | | | 564,348 | | | | 341,525,836 | |
| Restaurant ETF | | | 758,938 | | | | 49,397 | | | | 808,335 | |
| STAR Global Buy-Write ETF | | | — | | | | — | | | | — | |
| Vice ETF | | | 433,769 | | | | — | | | | 433,769 | |
The following Funds utilized capital loss carryforwards to offset taxable gains realized during the year ended June 30, 2022:
| Fund | | Utilized
Amount | |
| Alpha DNA Equity Sentiment ETF | | $ | — | |
| Dorsey Wright ADR ETF | | | — | |
| Dorsey Wright Alpha Equal Weight ETF | | | — | |
| Dorsey Wright FSM All Cap World ETF | | | — | |
| Dorsey Wright FSM US Core ETF | | | — | |
| Dorsey Wright Micro-Cap ETF | | | — | |
| Dorsey Wright Short ETF | | | — | |
| DoubleLine Value Equity ETF | | | 4,875,911 | |
ADVISORSHARES TRUST
Notes to Financial Statements (Continued)
June 30, 2022
7. Federal Income Tax – (continued)
| Fund | | Utilized
Amount | |
| Drone Technology ETF | | $ | — | |
| Focused Equity ETF | | | 3,730 | |
| Gerber Kawasaki ETF | | | — | |
| Hotel ETF | | | — | |
| Let Bob AI Powered Momentum ETF | | | — | |
| Managed Bitcoin Strategy ETF | | | — | |
| Newfleet Multi-Sector Income ETF | | | — | |
| North Square McKee Core Reserves ETF | | | 26,678 | |
| North Square McKee ESG Core Bond ETF | | | — | |
| Poseidon Dynamic Cannabis ETF | | | — | |
| Psychedelics ETF | | | — | |
| Pure Cannabis ETF | | | — | |
| Pure US Cannabis ETF | | | — | |
| Q Dynamic Growth ETF | | | — | |
| Q Portfolio Blended Allocation ETF | | | — | |
| Ranger Equity Bear ETF | | | 27,747,068 | |
| Restaurant ETF | | | — | |
| STAR Global Buy-Write ETF | | | — | |
| Vice ETF | | | — | |
8. Investment Transactions
Purchases and sales of investments and securities sold short (excluding short term securities) for the year ended June 30, 2022 were as follows:
| | | Purchases | | | Sales | |
| Fund | | Long Term | | | U.S.
Government | | | In-Kind | | | Long Term | | | U.S.
Government | | | In-Kind | |
| Alpha DNA Equity Sentiment ETF | | $ | 367,229,604 | | | $ | — | | | $ | 39,035,860 | | | $ | 365,180,800 | | | $ | — | | | $ | 40,391,784 | |
| Dorsey Wright ADR ETF | | | 55,651,803 | | | | — | | | | — | | | | 54,474,035 | | | | — | | | | 28,437,591 | |
| Dorsey Wright Alpha Equal Weight ETF | | | 305,544,943 | | | | — | | | | 68,418,134 | | | | 321,531,935 | | | | — | | | | 85,254,009 | |
| Dorsey Wright FSM All Cap World ETF | | | 313,303,482 | | | | — | | | | 86,777,763 | | | | 316,742,113 | | | | — | | | | 135,365,318 | |
| Dorsey Wright FSM US Core ETF | | | 47,851,561 | | | | — | | | | 48,769,386 | | | | 48,781,571 | | | | — | | | | 47,747,456 | |
| Dorsey Wright Micro-Cap ETF | | | 9,494,504 | | | | — | | | | 6,361,524 | | | | 9,296,715 | | | | — | | | | 5,865,374 | |
| Dorsey Wright Short ETF | | | 76,490,786 | | | | — | | | | — | | | | 104,935,483 | | | | — | | | | — | |
| DoubleLine Value Equity ETF | | | 15,020,020 | | | | — | | | | 6,286,639 | | | | 15,386,309 | | | | — | | | | 3,313,241 | |
| Drone Technology ETF | | | 70,224 | | | | — | | | | 589,976 | | | | 128,003 | | | | — | | | | — | |
| Focused Equity ETF | | | 7,328,105 | | | | — | | | | 11,081,430 | | | | 7,238,042 | | | | — | | | | 8,658,490 | |
| Gerber Kawasaki ETF | | | 11,819,197 | | | | — | | | | 28,460,612 | | | | 11,386,154 | | | | — | | | | 3,271,543 | |
| Hotel ETF | | | 5,843,359 | | | | — | | | | 5,098,184 | | | | 6,118,603 | | | | — | | | | 5,663,007 | |
| Let Bob AI Powered Momentum ETF | | | 28,501,128 | | | | — | | | | 1,504,664 | | | | 25,622,992 | | | | — | | | | — | |
| Managed Bitcoin Strategy ETF | | | 294,264 | | | | — | | | | 15,091,533 | | | | 386,974 | | | | — | | | | 14,204,906 | |
| Newfleet Multi-Sector Income ETF | | | 46,393,839 | | | | 4,173,095 | | | | — | | | | 57,150,619 | | | | 2,675,160 | | | | — | |
| North Square McKee Core Reserves ETF | | | 28,300,518 | | | | 1,237,740 | | | | — | | | | 32,281,971 | | | | 368,950 | | | | — | |
| North Square McKee ESG Core Bond ETF | | | 16,152,741 | | | | 1,847,963 | | | | — | | | | 15,792,461 | | | | 1,716,830 | | | | 2,317,629 | |
| Poseidon Dynamic Cannabis ETF | | | 1,081,267 | | | | — | | | | 2,719,679 | | | | 2,532,386 | | | | — | | | | 152,057 | |
| Psychedelics ETF | | | 2,467,464 | | | | — | | | | 11,034,207 | | | | 1,192,598 | | | | — | | | | — | |
ADVISORSHARES TRUST
Notes to Financial Statements (Continued)
June 30, 2022
8. Investment Transactions – (continued)
| | | Purchases | | | Sales | |
| Fund | | Long Term | | | U.S.
Government | | | In-Kind | | | Long Term | | | U.S.
Government | | | In-Kind | |
| Pure Cannabis ETF | | $ | 94,170,788 | | | $ | — | | | $ | 1,204,735 | | | $ | 41,958,811 | | | $ | — | | | $ | 30,465,404 | |
| Pure US Cannabis ETF | | | 134,988,508 | | | | — | | | | 145,667,411 | | | | 79,964,445 | | | | — | | | | 30,740,210 | |
| Q Dynamic Growth ETF | | | 92,366,958 | | | | — | | | | 53,789,749 | | | | 92,695,749 | | | | — | | | | 61,585,418 | |
| Q Portfolio Blended Allocation ETF | | | 11,947,681 | | | | — | | | | 2,607,982 | | | | 11,926,683 | | | | — | | | | 2,331,188 | |
| Ranger Equity Bear ETF | | | 1,282,355,648 | | | | — | | | | — | | | | 1,431,175,231 | | | | — | | | | — | |
| Restaurant ETF | | | 3,522,493 | | | | — | | | | — | | | | 4,168,094 | | | | — | | | | 2,047,826 | |
| STAR Global Buy-Write ETF | | | 12,491,257 | | | | — | | | | 23,436,893 | | | | 11,159,621 | | | | — | | | | 383,776 | |
| Vice ETF | | | 9,242,667 | | | | — | | | | — | | | | 10,284,961 | | | | — | | | | 1,116,574 | |
9. Risks Involved with Investing in the Funds
As with any investment, an investor could lose all or part of their investment in a Fund and the Fund’s performance could trail that of other investments. A Fund may be subject to the principal risks noted below, any of which may adversely affect the Fund’s NAV, trading price, yield, total return and ability to meet its investment objective. Additional principal risks are disclosed in each Fund’s prospectus. Please refer to each Fund’s currently effective prospectus for the specific list and description of the principal risks of investing in the Fund.
Credit Risk
Credit risk is the risk that an issuer or guarantor of debt instruments or the counterparty to a financial transaction, including derivatives contracts, repurchase agreements or loans of portfolio securities, is unable or unwilling to make timely interest and/or principal payments or to otherwise honor its obligations. The Fund’s, and its affiliates, manage counterparty credit risk by entering into transactions only with counterparties that they believe have the financial resources to honor their obligations and by monitoring the financial stability of those counterparties. Financial assets, which potentially expose the Funds to issuer and counterparty credit risks, consist principally of financial instruments and receivables due from counterparties. The extent of each Fund’s exposure to credit and counterparty risks with respect to those financial assets is approximated by their value recorded in its Statements of Assets and Liabilities. High yield securities may also be subject to greater levels of credit or default risk than higher-rated securities and high yield securities may be less liquid and more difficult to sell at an advantageous time or price or to value than higher-rated securities. In particular, high yield securities are often issued by smaller, less creditworthy companies or by highly leveraged (indebted) companies, which are generally less able than more financially stable companies to make scheduled payments of interest and principal.
Fund of Funds Risk
Some of the Funds’ investment performance, because they are fund of funds, depends on the investment performance of the Underlying ETFs in which they invest. An investment in these Funds is subject to the risk associated with the Underlying ETFs that comprise their Underlying Index. The Funds will indirectly pay a proportional share of the asset-based fees, if any, of the Underlying ETFs in which they invest.
ADVISORSHARES TRUST
Notes to Financial Statements (Continued)
June 30, 2022
9. Risks Involved with Investing in the Funds – (continued)
Liquidity Risk
In certain circumstances, it may be difficult for the Fund to purchase and sell particular investments within a reasonable time at a fair price. To the extent that there is not an established retail market for instruments in which the Fund may invest, trading in such instruments may be relatively inactive. Trading in shares may be halted because of market conditions or for reasons that, in the view of the Exchange, make trading in shares inadvisable. In addition, trading in shares is subject to trading halts caused by extraordinary market volatility pursuant to “circuit breaker” rules. There can be no assurance that the requirements necessary to maintain the listing of the shares of the Fund will continue to be met or will remain unchanged.
Market Risk
Investments in securities, in general, are subject to market risks that may cause their prices to fluctuate over time. The Fund’s investments may decline in value due to factors affecting securities markets generally, or particular countries, segments, economic sectors, industries or companies within those markets. The value of a security held in a short position may increase due to general economic and market conditions which are not specifically related to a particular issuer, such as real or perceived positive economic conditions or changes in interest or currency rates. Because the market value of ETF shares may differ from their net asset value, the shares may trade at a premium or discount. An investment in the Fund may lose money.
A novel strain of coronavirus (COVID-19) outbreak was declared a pandemic by the World Health Organization on March 11, 2020. The situation is evolving with various cities and countries around the world responding in different ways to address the outbreak. There are direct and indirect economic effects developing for various industries and individual companies throughout the world. Management will continue to monitor the impact COVID-19 has on the Funds and reflect the consequences as appropriate in the Funds’ accounting and financial reporting. The recent pandemic spread of the novel coronavirus and related geopolitical events could lead to increased market volatility, disruption to U.S. and world economies and markets and may have significant adverse effects on the Funds and their investments.
Russia’s military invasion of Ukraine in February 2022, the resulting responses by the United States and other countries, and the potential for wider conflict could increase volatility and uncertainty in the financial markets and adversely affect regional and global economies. The United States and other countries have imposed broad-ranging economic sanctions on Russia, certain Russian individuals, banking entities and corporations, and Belarus as a response to Russia’s invasion of Ukraine, and may impose sanctions on other countries that provide military or economic support to Russia. The extent and duration of Russia’s military actions and the repercussions of such actions (including any retaliatory actions or countermeasures that may be taken by those subject to sanctions, including cyber attacks) are impossible to predict, but could result in significant market disruptions, including in certain industries or sectors, such as the oil and natural gas markets, and may negatively affect global supply chains, inflation and global growth. These and any related events could significantly impact the Fund’s performance and the value of an investment in the Fund, even if the Fund does not have direct exposure to Russian issuers or issuers in other countries affected by the invasion.
ADVISORSHARES TRUST
Notes to Financial Statements (Continued)
June 30, 2022
9. Risks Involved with Investing in the Funds – (continued)
New Fund Risk
Some of the Funds are new funds. As new funds, there can be no assurance that the Funds will grow to or maintain an economically viable size, than it otherwise would be at higher asset levels or it could ultimately liquidate.
Cannabis-Related Company Risk
Cannabis-related companies are subject to various laws and regulations that may differ at the state/local and federal level. These laws and regulations may (i) significantly affect a cannabis-related company’s ability to secure financing, (ii) impact the market for marijuana industry sales and services, and (iii) set limitations on marijuana use, production, transportation, and storage. Cannabis-related companies may also be required to secure permits and authorizations from government agencies to cultivate or research marijuana. In addition, cannabis-related companies are subject to the risks associated with the greater agricultural industry, including changes to or trends that affect commodity prices, labor costs, weather conditions, and laws and regulations related to environmental protection, health and safety. Cannabis-related companies may also be subject to risks associated with the biotechnology and pharmaceutical industries. These risks include increased government regulation, the use and enforcement of intellectual property rights and patents, technological change and obsolescence, product liability lawsuits, and the risk that research and development may not necessarily lead to commercially successful products.
Bitcoin Strategy Risk
The Fund, primarily through Bitcoin ETFs and/or the Subsidiary, invests in Bitcoin Futures. The Fund does not invest directly in or hold bitcoin. The price of Bitcoin Futures may differ, sometimes significantly, from the current cash price of bitcoin, which is sometimes referred to as the “spot” price of bitcoin. Consequently, the performance of the Fund should be expected to perform differently from the spot price of bitcoin. Furthermore, if the Fund’s ability to obtain exposure to Bitcoin Futures consistent with its investment objective is disrupted for any reason, including, for example, limited liquidity in the Bitcoin Futures market, a disruption to the Bitcoin Futures market, or as a result of margin requirements or position limits imposed by futures commission merchants (“FCMs”), the CME, or the CFTC, the Fund may not be able to achieve its investment objective. Any disruption in the Fund’s ability to obtain exposure to Bitcoin Futures will cause the Fund’s performance to deviate from the performance of bitcoin and Bitcoin Futures. Volatility in the Bitcoin Futures market, particularly during times outside of the Fund’s trading hours, could cause the trading prices of the Fund’s shares to deviate significantly from net asset value (“NAV”).
Drone Companies Risk
Drone companies may have limited product lines, markets, financial resources or personnel and are subject to the risks of changes in business cycles, world economic growth, technological progress, and government regulation. Securities of drone companies, especially smaller, start-up companies, tend to be more volatile than securities of companies that do not rely heavily on technology. These companies may face intense competition and potentially rapid product obsolescence. In addition, drone companies may be dependent on the U.S. government and its agencies for a significant portion of their sales, and their success and growth may be dependent on their ability to win future government contracts. As a result, such companies may be negatively affected by budgetary constraints, spending reductions, congressional appropriations, and administrative allocations of funds that affect the U.S. government and its agencies. Drone companies may rely on a combination of patents, copyrights, trademarks and trade secret laws to establish and protect their proprietary rights in their products
ADVISORSHARES TRUST
Notes to Financial Statements (Continued)
June 30, 2022
9. Risks Involved with Investing in the Funds – (continued) |
and technologies, and may be adversely affected by loss or impairment of those rights. Legal and regulatory changes may have an impact on a drone company’s products or services. In addition, drone companies may also be subject to increasing regulatory constraints that may limit the sale or use of a company’s products, including the need to obtain regulatory approvals from certain government agencies. Drone companies typically engage in significant amounts of spending on research and development, and there is no guarantee that the products or services produced by these companies will be successful.
10. Subsequent Events
The Funds have evaluated subsequent events through the issuance of the financial statements and determined that no events have occurred that require additional disclosure.
11. Unaudited Tax Information
Qualified Dividend Income — Certain dividends paid by the Funds may be subject to a minimum tax rate of 15%, as provided by the Jobs and Growth Tax Relief Reconciliation Act of 2003. The percentage of ordinary income distributions for the year ended June 30, 2022, taxed at a minimum rate of 15% were as follows:
| Fund | | Percentage | |
| Alpha DNA Equity Sentiment ETF | | | 0.00 | % |
| Dorsey Wright ADR ETF | | | 100.00 | |
| Dorsey Wright Alpha Equal Weight ETF | | | 22.42 | |
| Dorsey Wright FSM All Cap World ETF | | | 25.69 | |
| Dorsey Wright FSM U.S. Core ETF | | | 100.00 | |
| Dorsey Wright Micro Cap ETF | | | 100.00 | |
| Dorsey Wright Short ETF | | | 0.00 | |
| DoubleLine Value Equity ETF | | | 61.71 | |
| Drone Technology ETF | | | 0.00 | |
| Focused Equity ETF | | | 100.00 | |
| Gerber Kawasaki ETF | | | 100.00 | |
| Hotel ETF | | | 0.00 | |
| Let Bob AI Powered Momentum ETF | | | 0.00 | |
| Managed Bitcoin Strategy ETF | | | 0.00 | |
| Newfleet Multi-Sector Income ETF | | | 0.00 | |
| North Square McKee Core Reserves ETF | | | 0.00 | |
| North Square McKee ESG Core Bond ETF | | | 0.00 | |
| Poseidon Dynamic Cannabis ETF | | | 0.00 | |
| Psychedelics ETF | | | 0.00 | |
| Pure Cannabis ETF | | | 7.86 | |
| Pure US Cannabis ETF | | | 0.00 | |
| Q Dynamic Growth ETF | | | 0.00 | |
| Q Portfolio Blended Allocation ETF | | | 62.45 | |
| Ranger Equity Bear ETF | | | 0.00 | |
| Restaurant ETF | | | 0.00 | |
| STAR Global Buy-Write ETF | | | 85.58 | |
| Vice ETF | | | 100.00 | |
ADVISORSHARES TRUST
Notes to Financial Statements (Continued)
June 30, 2022
| 11. Unaudited Tax Information – (continued) |
Dividends Received Deduction — For corporate shareholders, the percentage of ordinary income distributions for the year ended June 30, 2022 that qualifies for the dividends received deduction were as follows:
| Fund | | Percentage | |
| Alpha DNA Equity Sentiment ETF | | | 0.00 | % |
| Dorsey Wright ADR ETF | | | 0.00 | |
| Dorsey Wright Alpha Equal Weight ETF | | | 21.43 | |
| Dorsey Wright FSM All Cap World ETF | | | 25.20 | |
| Dorsey Wright FSM U.S. Core ETF | | | 100.00 | |
| Dorsey Wright Micro Cap ETF | | | 100.00 | |
| Dorsey Wright Short ETF | | | 0.00 | |
| DoubleLine Value Equity ETF | | | 61.71 | |
| Drone Technology ETF | | | 0.00 | |
| Focused Equity ETF | | | 100.00 | |
| Gerber Kawasaki ETF | | | 100.00 | |
| Hotel ETF | | | 0.00 | |
| Let Bob AI Powered Momentum ETF | | | 0.00 | |
| Managed Bitcoin Strategy ETF | | | 0.00 | |
| Newfleet Multi-Sector Income ETF | | | 0.00 | |
| North Square McKee Core Reserves ETF | | | 0.00 | |
| North Square McKee ESG Core Bond ETF | | | 0.00 | |
| Poseidon Dynamic Cannabis ETF | | | 0.00 | |
| Psychedelics ETF | | | 0.00 | |
| Pure Cannabis ETF | | | 7.86 | |
| Pure US Cannabis ETF | | | 0.00 | |
| Q Dynamic Growth ETF | | | 0.00 | |
| Q Portfolio Blended Allocation ETF | | | 60.58 | |
| Ranger Equity Bear ETF | | | 0.00 | |
| Restaurant ETF | | | 0.00 | |
| STAR Global Buy-Write ETF | | | 80.42 | |
| Vice ETF | | | 100.00 | |
Qualified Interest Income — For nonresident alien shareholders, the percentage of ordinary income distributions for the year ended June 30, 2022 that qualified interest income were as follows:
| Fund | | Percentage | |
| Alpha DNA Equity Sentiment ETF | | | 0.00 | % |
| Dorsey Wright ADR ETF | | | 0.00 | |
| Dorsey Wright Alpha Equal Weight ETF | | | 0.00 | |
| Dorsey Wright FSM All Cap World ETF | | | 0.00 | |
| Dorsey Wright FSM U.S. Core ETF | | | 0.00 | |
| Dorsey Wright Micro Cap ETF | | | 0.00 | |
| Dorsey Wright Short ETF | | | 0.00 | |
| DoubleLine Value Equity ETF | | | 0.00 | |
| Drone Technology ETF | | | 0.00 | |
| Focused Equity ETF | | | 0.00 | |
| Gerber Kawasaki ETF | | | 0.00 | |
ADVISORSHARES TRUST
Notes to Financial Statements (Continued)
June 30, 2022
| 11. Unaudited Tax Information – (continued) |
| Fund | | Percentage | |
| Hotel ETF | | | 0.00 | % |
| Let Bob AI Powered Momentum ETF | | | 0.00 | |
| Managed Bitcoin Strategy ETF | | | 0.00 | |
| Newfleet Multi-Sector Income ETF | | | 99.78 | |
| North Square McKee Core Reserves ETF | | | 100.00 | |
| North Square McKee ESG Core Bond ETF | | | 93.80 | |
| Poseidon Dynamic Cannabis ETF | | | 0.00 | |
| Psychedelics ETF | | | 0.00 | |
| Pure Cannabis ETF | | | 0.00 | |
| Pure US Cannabis ETF | | | 0.00 | |
| Q Dynamic Growth ETF | | | 0.00 | |
| Q Portfolio Blended Allocation ETF | | | 0.00 | |
| Ranger Equity Bear ETF | | | 0.00 | |
| Restaurant ETF | | | 0.00 | |
| STAR Global Buy-Write ETF | | | 0.00 | |
| Vice ETF | | | 0.00 | |
The following Funds intend to elect to pass through to shareholders the credit for taxes paid to foreign countries. The gross foreign source income and foreign taxes paid were as follows:
| Fund | | Foreign
Taxes Paid | | | Gross
Foreign
Income | |
| Alpha DNA Equity Sentiment ETF | | $ | — | | | $ | — | |
| Dorsey Wright ADR ETF | | | 111,711 | | | | 2,496,089 | |
| Dorsey Wright Alpha Equal Weight ETF | | | — | | | | — | |
| Dorsey Wright FSM All Cap World ETF | | | — | | | | — | |
| Dorsey Wright FSM U.S. Core ETF | | | — | | | | — | |
| Dorsey Wright Micro Cap ETF | | | — | | | | — | |
| Dorsey Wright Short ETF | | | — | | | | — | |
| DoubleLine Value Equity ETF | | | — | | | | — | |
| Drone Technology ETF | | | — | | | | — | |
| Focused Equity ETF | | | — | | | | — | |
| Gerber Kawasaki ETF | | | — | | | | — | |
| Hotel ETF | | | — | | | | — | |
| Let Bob AI Powered Momentum ETF | | | — | | | | — | |
| Managed Bitcoin Strategy ETF | | | — | | | | — | |
| Newfleet Multi-Sector Income ETF | | | — | | | | — | |
| North Square McKee Core Reserves ETF | | | — | | | | — | |
| North Square McKee ESG Core Bond ETF | | | — | | | | — | |
| Poseidon Dynamic Cannabis ETF | | | — | | | | — | |
| Psychedelics ETF | | | — | | | | — | |
| Pure Cannabis ETF | | | — | | | | — | |
| Pure US Cannabis ETF | | | — | | | | — | |
| Q Dynamic Growth ETF | | | — | | | | — | |
ADVISORSHARES TRUST
Notes to Financial Statements (Continued)
June 30, 2022
| 11. Unaudited Tax Information – (continued) |
| Fund | | Foreign
Taxes Paid | | | Gross
Foreign
Income | |
| Q Portfolio Blended Allocation ETF | | $ | — | | | $ | — | |
| Ranger Equity Bear ETF | | | — | | | | — | |
| Restaurant ETF | | | — | | | | — | |
| STAR Global Buy-Write ETF | | | 3,670 | | | | 28,539 | |
| Vice ETF | | | — | | | | — | |

REPORT OF INDEPENDENT REGISTERED PUBLIC ACCOUNTING FIRM
To the Shareholders and Board of Trustees
of AdvisorShares Trust
Opinion on the Financial Statements
We have audited the accompanying statements of assets and liabilities of the Alpha DNA Equity Sentiment ETF, Dorsey Wright ADR ETF, Dorsey Wright Alpha Equal Weight ETF, Dorsey Wright FSM All Cap World ETF, Dorsey Wright FSM US Core ETF, Dorsey Wright Micro-Cap ETF, Dorsey Wright Short ETF, DoubleLine Value Equity ETF, Drone Technology ETF, Focused Equity ETF, Gerber Kawasaki ETF, Hotel ETF, Let Bob Al Powered Momentum ETF, Managed Bitcoin Strategy ETF, Newfleet Multi-Sector Income ETF, North Square McKee Core Reserves ETF (formerly known as AdvisorShares Sage Core Reserves ETF), North Square McKee ESG Core Bond ETF (formerly known as AdvisorShares FolioBeyond Smart Core Bond ETF), Poseidon Dynamic Cannabis ETF, Psychedelics ETF, Pure Cannabis ETF, Pure US Cannabis ETF, Q Dynamic Growth ETF, Q Portfolio Blended Allocation ETF, Ranger Equity Bear ETF, Restaurant ETF, STAR Global Buy-Write ETF, Vice ETF, each a series of AdvisorShares Trust (the “Trust”), including the schedules of investments, as of June 30, 2022, the related statements of operations, the statements of changes in net assets, and financial highlights for each of the periods indicated in the table below, and the related notes (collectively referred to as the “financial statements”). In our opinion, the financial statements present fairly, in all material respects, the financial position of the Funds as of June 30, 2022, the results of their operations, the changes in their net assets and their financial highlights for each of the periods indicated in the table below, in conformity with accounting principles generally accepted in the United States of America.
Individual Funds constituting
AdvisorShares Trust | | Statement of
operations | | Statements of
changes in net assets | | Financial highlights |
| Dorsey Wright ADR ETF, DoubleLine Value Equity ETF, Focused Equity ETF, Newfleet Multi-Sector Income ETF, North Square McKee Core Reserves ETF, North Square McKee ESG Core Bond ETF, Ranger Equity Bear ETF, STAR Global Buy-Write ETF | | For the year ended June 30, 2022 | | For each of the two years in the period ended June 30, 2022 | | For each of the five years in the period ended June 30, 2022 |
| | | | | | | |
| Vice ETF | | For the year ended June 30, 2022 | | For each of the two years in the period ended June 30, 2022 | | For each of the four years in the period ended June 30, 2022 and for the period December 12, 2017 (commencement of operations) through June 30, 2018 |
| | | | | | | |
| Dorsey Wright Micro-Cap ETF, Dorsey Wright Short ETF | | For the year ended June 30, 2022 | | For each of the two years in the period ended June 30, 2022 | | For each of the three years in the period ended June 30, 2022 and for the period July 11, 2018 (commencement of operations) through June 30, 2019 |
| REPORT OF INDEPENDENT REGISTERED PUBLIC ACCOUNTING FIRM (Continued) |
| |
Individual Funds constituting
AdvisorShares Trust | | Statement of
operations | | Statements of
changes in net assets | | Financial highlights |
| Pure Cannabis ETF | | For the year ended June 30, 2022 | | For each of the two years in the period ended June 30, 2022 | | For each of the three years in the period ended June 30, 2022 and for the period April 17, 2019 (commencement of operations) through June 30, 2019 |
| | | | | | | |
| Dorsey Wright Alpha Equal Weight ETF, Dorsey Wright FSM All Cap World ETF, Dorsey Wright FSM US Core ETF | | For the year ended June 30, 2022 | | For each of the two years in the period ended June 30, 2022 | | For each of the two years in the period ended June 30, 2022 and the period December 26, 2019 (commencement of operations) through June 30, 2020 |
| | | | | | | |
| Pure US Cannabis ETF | | For the year ended June 30, 2022 | | For the year ended June 30, 2022 and the period September 1, 2020 through June 30, 2021 | | For the year ended June 30, 2022 and the period September 1, 2020 (commencement of operations) through June 30, 2021 |
| | | | | | | |
| Q Dynamic Growth ETF, Q Portfolio Blended Allocation ETF | | For the year ended June 30, 2022 | | For the year ended June 30, 2022 and the period December 28, 2020 through June 30, 2021 | | For the year ended June 30, 2022 and the period December 28, 2020 (commencement of operations) through June 30, 2021 |
| | | | | | | |
| Alpha DNA Equity Sentiment ETF | | For the year ended June 30, 2022 | | For the year ended June 30, 2022 and the period February 2, 2021 through June 30, 2021 | | For the year ended June 30, 2022 and the period February 2, 2021 (commencement of operations) through June 30, 2021 |
| | | | | | | |
| Hotel ETF, Restaurant ETF | | For the year ended June 30, 2022 | | For the year ended June 30, 2022 and the period April 20, 2021 through June 30, 2021 | | For the year ended June 30, 2022 and the period April 20, 2021 (commencement of operations) through June 30, 2021 |
| | | | | | | |
| Gerber Kawasaki ETF | | For the period July 2, 2021 through June 30, 2022 | | For the period July 2, 2021 through June 30, 2022 | | For the period July 2, 2021 (commencement of operations) through June 30, 2022 |
| | | | | | | |
| Psychedelics ETF | | For the period September 16, 2021 through June 30, 2022 | | For the period September 16, 2021 through June 30, 2022 | | For the period September 16, 2021 (commencement of operations) through June 30, 2022 |
| | | | | | | |
| Poseidon Dynamic Cannabis ETF | | For the period November 17, 2021 through June 30, 2022 | | For the period November 17, 2021 through June 30, 2022 | | For the period November 17, 2021 (commencement of operations) through June 30, 2022 |
| | | | | | | |
| Let Bob Al Powered Momentum ETF | | For the period February 9, 2022 through June 30, 2022 | | For the period February 9, 2022 through June 30, 2022 | | For the period February 9, 2022 (commencement of operations) through June 30, 2022 |
| | | | | | | |
| Drone Technology ETF, Managed Bitcoin Strategy ETF | | For the period April 27, 2022 through June 30, 2022 | | For the period April 27, 2022 through June 30, 2022 | | For the period April 27, 2022 (commencement of operations) through June 30, 2022 |
| REPORT OF INDEPENDENT REGISTERED PUBLIC ACCOUNTING FIRM (Continued) |
Basis for Opinion
These financial statements are the responsibility of the Trust’s management. Our responsibility is to express an opinion on the Funds’ financial statements based on our audits. We are a public accounting firm registered with the Public Company Accounting Oversight Board (United States) (“PCAOB”) and are required to be independent with respect to the Funds in accordance with the U.S. federal securities laws and the applicable rules and regulations of the Securities and Exchange Commission and the PCAOB. We have served as the auditor of one or more of the funds in the Trust since 2009.
We conducted our audits in accordance with the standards of the PCAOB. Those standards require that we plan and perform the audits to obtain reasonable assurance about whether the financial statements are free of material misstatement, whether due to error or fraud. The Funds are not required to have, nor were we engaged to perform, an audit of the Funds’ internal control over financial reporting. As part of our audits we are required to obtain an understanding of internal control over financial reporting, but not for the purpose of expressing an opinion on the effectiveness of the Funds’ internal control over financial reporting. Accordingly, we express no such opinion.
Our audits included performing procedures to assess the risks of material misstatement of the financial statements, whether due to error or fraud, and performing procedures that respond to those risks. Such procedures included examining, on a test basis, evidence regarding the amounts and disclosures in the financial statements. Our audits also included evaluating the accounting principles used and significant estimates made by management, as well as evaluating the overall presentation of the financial statements. Our procedures included confirmation of securities owned as of June 30, 2022 by correspondence with the custodian, agent banks, and brokers or by other appropriate auditing procedures where replies were not received. We believe that our audits provide a reasonable basis for our opinion.
Philadelphia, Pennsylvania
August 29, 2022
| BOARD REVIEW OF INVESTMENT ADVISORY AND SUB-ADVISORY AGREEMENTS |
Renewal of the Advisory Agreement for Each Fund and the Sub-Advisory Agreements
for the AdvisorShares Newfleet Multi-Sector Income ETF and AdvisorShares
STAR Global Buy-Write ETF
At meetings of the Board of Trustees (the “Board”) of AdvisorShares Trust (the “Trust”) held on February 16, 2022 and May 17, 2022, the Board, including those trustees who are not “interested persons” of the Trust, as that term is defined in the Investment Company Act of 1940 (the “1940 Act”) (the “Independent Trustees”), considered the approval of the renewal of (a) separate sub-advisory agreements (collectively, the “Sub-Advisory Agreements”) between AdvisorShares Investments, LLC (the “Advisor”) and (1) Newfleet Asset Management, LLC, on behalf of the AdvisorShares Newfleet Multi-Sector Income ETF and (2) ChangePath, LLC, on behalf of the AdvisorShares STAR Global Buy-Write ETF (together, the “Sub-Advisors”), pursuant to which the Sub-Advisors perform portfolio management and related services, and (b) the investment advisory agreement between the Advisor and the Trust (together with the Sub-Advisory Agreements, the “Advisory Agreements”), on behalf of each series of the Trust (each, a “Fund” and, collectively, the “Funds”).
Pursuant to Section 15 of the 1940 Act and related exemptive relief, to continue after their initial two-year term, the Advisory Agreements must be approved annually: (i) by the vote of the Board or by a vote of the shareholders of the Funds and (ii) by the vote of a majority of the Independent Trustees cast at a meeting called for the purpose of voting on such approval. Each year, the Board calls and holds a meeting to decide whether to renew the Advisory Agreements for an additional one-year term. In preparation for the meeting, the Board requests and reviews a wide variety of information from the Advisor and Sub-Advisors. The Board uses this information, as well as other information that the Advisor, Sub-Advisors and other service providers may submit to the Board at the meeting and over the course of the prior year, to help evaluate the Advisor’s and each Sub-Advisor’s fee and other aspects of the Advisory Agreements and decide whether to renew the Advisory Agreements for an additional year.
As discussed in further detail below, prior to and at the meeting, the Board, including the Independent Trustees, was presented with information to help it evaluate the Advisor’s and each Sub-Advisor’s fee and other aspects of the Advisory Agreements. The Board reviewed written materials from the Advisor and each Sub-Advisor regarding, among other things: (i) the nature, extent and quality of the services provided by the Advisor and each Sub-Advisor; (ii) the performance by the Advisor and each Sub-Advisor of its duties; (iii) the investment performance of each Fund; (iv) the costs of the services provided and profits realized by the Advisor and each Sub-Advisor; (v) the potential for economies of scale for the benefit of each Fund’s shareholders; and (vi) any ancillary benefits to the Adviser and each Sub-Advisor. The Board received an overview of the Advisor’s and each Sub-Advisor’s operations and management of the Funds, including comparative fee data and profitability analysis for each Fund, and was also provided with information with respect to compliance oversight. The Board reviewed the management of each Fund, including the Fund’s strategy, the focus in the markets, the Fund’s positioning in the market, and its attractive and unique offering. The Board reviewed the Advisor’s and each Sub-Advisor’s overall business generally, including any noteworthy personnel changes.
The Board deliberated on the renewal of the Advisory Agreements in light of the written materials that it received before the meeting, information it received at the meeting, and information it had received at prior board meetings. In its deliberations, the Board considered the factors and reached the conclusions described below relating to the selection of the Advisor and each Sub-Advisor and the renewal of each Advisory Agreement. The Board did not identify any single piece of information discussed below that was paramount, controlling or determinative of its decision.
Nature, Extent and Quality of Services. In considering the nature, extent and quality of the services provided by the Advisor and each Sub-Advisor, the Board reviewed the services provided to each Fund by the Advisor and applicable Sub-Advisor, noting that these services include, among other things, furnishing a continuous investment program for the Funds, including arranging for, or implementing, the purchase and sale of portfolio securities, the provision of related services, such as
| BOARD REVIEW OF INVESTMENT ADVISORY AND SUB-ADVISORY AGREEMENTS (Continued) |
portfolio management compliance services, and the preparation and filing of certain reports on behalf of the Funds. The Trustees reviewed the extensive responsibilities that the Advisor has as investment advisor to each Fund, including the oversight of the activities and operations of the Sub-Advisors, as applicable, and other service providers, oversight of general fund compliance with federal and state laws, and the implementation of Board directives as they relate to the Funds. The most recent Form ADV for the Advisor and each Sub-Advisor was provided to the Board, as were responses to a detailed series of questions that, among other things, requested information about their business, services, and financial condition. The Board considered, among other things, the professional experience and qualifications of the senior management and key professional personnel of the Advisor and each Sub-Advisor, including those individuals responsible for portfolio management, the Advisor’s and each Sub-Advisor’s operational capabilities and resources, and their experience in managing investment portfolios. Based on its review, within the context of its full deliberations, the Board determined that it was satisfied with the nature, extent and quality of the services provided to the Funds by the Advisor and each Sub-Advisor.
Performance of the Funds. The Board was provided with information regarding each Fund’s performance for various periods, as well as comparative performance information. The Advisor and each Sub-Advisor provided information regarding factors impacting the performance of the Funds, outlining current market conditions, and explaining its expectations and strategies for the future. The Board noted that each Fund is actively managed and that it receives regular reports regarding each Fund’s performance at its quarterly meetings. Based on this information, the Board concluded that it was satisfied with the investment results that the Advisor and each Sub-Advisor had been able to achieve for its respective Fund.
Cost of Services and Profitability. In considering whether the advisory and sub-advisory fees payable with respect to each Fund are reasonable, the Board reviewed the advisory fee paid by each Fund to the Advisor, the sub-advisory fee paid by the Advisor to each Sub-Advisor, the fees waived and/or expenses reimbursed by the Advisor and each Sub-Advisor over the period, the costs and other expenses incurred by the Advisor and each Sub-Advisor in providing advisory services, and the Advisor’s and each Sub-Advisor’s profitability analysis with respect to each Fund, as applicable. In discussing the fee arrangements between the Advisor and each Sub-Advisor, the Board noted that the Advisor pays each Sub-Advisor out of the advisory fee it receives from the respective Fund. The Board also reviewed information comparing each Fund’s fee to the fee paid by comparable funds. The Board also considered the Advisor’s contractual arrangement to waive its advisory fee and/or reimburse expenses in an effort to control the expense ratios of the Funds. Based on its review, in the context of its full deliberations, the Board concluded for each Fund that the advisory fees appear to be reasonable in light of the services rendered.
Economies of Scale. The Board considered for each Fund whether economies of scale were realized, noting any fee waivers and/or expense reimbursements by the Advisor and Sub-Advisors and whether the Advisor’s and/or Sub-Advisors’ fees include breakpoints. The Board determined to continue to assess on an ongoing basis whether the aggregate advisory fee for each Fund appropriately takes into account any economies of scale that had been realized as a result of any significant asset growth of a Fund.
Ancillary Benefits. The Board noted the potential benefits to be received by the Advisor and each Sub-Advisor as a result of its relationship with a Fund (other than the advisory or sub-advisory fee), including the intangible benefits of its association with the Trust generally and any favorable publicity arising in connection with a Fund’s performance.
Conclusion. Based on its deliberations and evaluation of the information described above, the Board, including the Independent Trustees, unanimously: (i) concluded that the terms of each Advisory Agreement are fair and reasonable; (ii) concluded that the Advisor’s fees are reasonable in light of the services that it provides to the Funds; (iii) concluded that each Sub-Advisor’s fee is reasonable in light of the services that it provides to its respective Fund; and (iv) agreed to renew each Advisory Agreement for another year.
| BOARD REVIEW OF INVESTMENT ADVISORY AND SUB-ADVISORY AGREEMENTS (Continued) |
Approval of the Advisory Agreement for AdvisorShares Let Bob AI Powered Momentum ETF
At a meeting held on November 16, 2021, the Board, including the Independent Trustees, considered the approval of the investment advisory agreement (the “Advisory Agreement”) between the Trust and the Advisor on behalf of the AdvisorShares Let Bob AI Powered Momentum ETF (the “Fund”). The Board noted that the Advisor provides investment advisory services to the other series of the Trust and that an annual in-depth review of the Advisor with respect to those series most recently had been conducted in May 2021.
In connection with its consideration of the Advisory Agreement, the Board, including the Independent Trustees, requested, received and evaluated materials from the Advisor about the services proposed to be provided thereunder, including information about the key features of the Fund and related matters. The Board also reviewed information regarding the proposed investment advisory fee rate and various other materials that it considered relevant to its consideration and approval of the proposed agreement.
In considering the Advisory Agreement, the Board considered and discussed information and analysis provided by the Advisor. In its deliberations, the Board did not identify any single piece of information that was paramount or controlling and individual trustees may have attributed different weights to various factors.
Nature, Extent and Quality of Services. In considering the nature, extent and quality of the services to be provided by the Advisor to the Fund, the Board reviewed the services to be provided by the Advisor, noting that these services include, among other things, furnishing a continuous investment program for the Fund, including implementing the purchase and sale of portfolio securities, the provision of related services such as portfolio management compliance services, and the preparation and filing of certain reports on behalf of the Trust. The Trustees reviewed the extensive responsibilities that the Advisor will have as investment advisor to the Fund, including the oversight of service providers, oversight of general fund compliance with federal and state laws, and the implementation of Board directives as they relate to the Fund. The Board also considered, among other things, the professional experience and qualifications of the senior management and key professional personnel of the Advisor, including those individuals responsible for portfolio management, the Advisor’s operational capabilities and resources, and its experience in managing investment portfolios. The Board concluded that, within the context of its full deliberations, it was satisfied with the nature, extent and quality of the services expected to be provided to the Fund by the Advisor.
Performance. In connection with the assessment of the ability of the Advisor to perform its duties under the Advisory Agreement, the Board considered its investment performance and experience generally and whether it has the resources necessary to carry out its functions. The Board concluded that the Advisor has the resources necessary to perform its obligations under the Advisory Agreement.
Cost of Services and Profitability. The Board considered the cost of the services to be provided by the Advisor, reviewed the fee to be paid pursuant to the Advisory Agreement, and considered the estimated profitability projected by the Advisor from its relationship with the Fund. The Board also reviewed information provided by the Advisor regarding advisory fees of comparable funds and evaluated the proposed fee arrangement in light of this information and the factors that judicial decisions have specified as pertinent generally. The Board also considered the Advisor’s contractual arrangement to waive its advisory fee and/or reimburse expenses in an effort to control the expense ratio of the Fund. Based on its review, within the context of its full deliberations, the Board determined that the fee proposed to be paid to the Advisor appears to be reasonable in light of the services to be provided.
| BOARD REVIEW OF INVESTMENT ADVISORY AND SUB-ADVISORY AGREEMENTS (Continued) |
Economies of Scale. The Board considered the potential for economies of scale and determined that it would reconsider this factor at an appropriate time in the future. In the event there were to be significant asset growth in the Fund, the Board determined to reassess whether the investment advisory fee appropriately took into account any economies of scale that had been realized as a result of that growth. The Board also considered the Advisor’s willingness to enter into a contractual expense limitation agreement for the Fund, noting that this would protect shareholders from high operational costs.
Ancillary Benefits. The Board noted the potential benefits to be received by the Advisor as a result of its relationship with the Fund (other than the advisory fee), including the intangible benefits of its association with the Trust generally and any favorable publicity arising in connection with the Fund’s performance.
Conclusion. Based on its deliberations and evaluation of the information described above, the Board, including the Independent Trustees, unanimously: (i) concluded that the terms of the Advisory Agreement are fair and reasonable; (ii) concluded that the fee to be paid to the Advisor is fair and reasonable in light of the services that it will provide to the Fund; and (iii) agreed to approve the Advisory Agreement for an initial term of two years.
Approval of the Advisory Agreement for AdvisorShares Drone Technology ETF
At a meeting held on February 16, 2022, the Board, including the Independent Trustees, considered the approval of the investment advisory agreement (the “Advisory Agreement”) between the Trust and the Advisor on behalf of the AdvisorShares Drone Technology ETF (the “Fund”). The Board noted that the Advisor provides investment advisory services to the other series of the Trust and that an annual in-depth review of the Advisor with respect to those series most recently had been conducted in May 2021.
In connection with its consideration of the Advisory Agreement, the Board, including the Independent Trustees, requested, received and evaluated materials from the Advisor about the services proposed to be provided thereunder, including information about the key features of the Fund and related matters. The Board also reviewed information regarding the proposed investment advisory fee rate and various other materials that it considered relevant to its consideration and approval of the proposed agreement.
In considering the Advisory Agreement, the Board considered and discussed information and analysis provided by the Advisor. In its deliberations, the Board did not identify any single piece of information that was paramount or controlling and individual trustees may have attributed different weights to various factors.
Nature, Extent and Quality of Services. In considering the nature, extent and quality of the services to be provided by the Advisor to the Fund, the Board reviewed the services to be provided by the Advisor, noting that these services include, among other things, furnishing a continuous investment program for the Fund, including implementing the purchase and sale of portfolio securities, the provision of related services such as portfolio management compliance services, and the preparation and filing of certain reports on behalf of the Trust. The Trustees reviewed the extensive responsibilities that the Advisor will have as investment advisor to the Fund, including the oversight of service providers, oversight of general fund compliance with federal and state laws, and the implementation of Board directives as they relate to the Fund. The Board also considered, among other things, the professional experience and qualifications of the senior management and key professional personnel of the Advisor, including those individuals responsible for portfolio management, the Advisor’s operational capabilities and resources, and its experience in managing investment portfolios. The Board concluded that, within the context of its full deliberations, it was satisfied with the nature, extent and quality of the services expected to be provided to the Fund by the Advisor.
| BOARD REVIEW OF INVESTMENT ADVISORY AND SUB-ADVISORY AGREEMENTS (Continued) |
Performance. In connection with the assessment of the ability of the Advisor to perform its duties under the Advisory Agreement, the Board considered its investment performance and experience generally and whether it has the resources necessary to carry out its functions. The Board concluded that the Advisor has the resources necessary to perform its obligations under the Advisory Agreement.
Cost of Services and Profitability. The Board considered the cost of the services to be provided by the Advisor, reviewed the fee to be paid pursuant to the Advisory Agreement, and considered the estimated profitability projected by the Advisor from its relationship with the Fund. The Board also reviewed information provided by the Advisor regarding advisory fees of comparable funds and evaluated the proposed fee arrangement in light of this information and the factors that judicial decisions have specified as pertinent generally. The Board also considered the Advisor’s contractual arrangement to waive its advisory fee and/or reimburse expenses in an effort to control the expense ratio of the Fund. Based on its review, within the context of its full deliberations, the Board determined that the fee proposed to be paid to the Advisor appears to be reasonable in light of the services to be provided.
Economies of Scale. The Board considered the potential for economies of scale and determined that it would reconsider this factor at an appropriate time in the future. In the event there were to be significant asset growth in the Fund, the Board determined to reassess whether the investment advisory fee appropriately took into account any economies of scale that had been realized as a result of that growth. The Board also considered the Advisor’s willingness to enter into a contractual expense limitation agreement for the Fund, noting that this would protect shareholders from high operational costs.
Ancillary Benefits. The Board noted the potential benefits to be received by the Advisor as a result of its relationship with the Fund (other than the advisory fee), including the intangible benefits of its association with the Trust generally and any favorable publicity arising in connection with the Fund’s performance.
Conclusion. Based on its deliberations and evaluation of the information described above, the Board, including the Independent Trustees, unanimously: (i) concluded that the terms of the Advisory Agreement are fair and reasonable; (ii) concluded that the fee to be paid to the Advisor is fair and reasonable in light of the services that it will provide to the Fund; and (iii) agreed to approve the Advisory Agreement for an initial term of two years.
Approval of the Advisory and Sub-Advisory Agreements for AdvisorShares
Managed Bitcoin Strategy ETF
At a meeting held on February 16, 2022, the Board, including the Independent Trustees, considered the approval of the investment advisory agreement (the “Advisory Agreement”) between the Trust and the Advisor on behalf of the AdvisorShares Managed Bitcoin Strategy ETF (the “Fund”). The Board noted that the Advisor provides investment advisory services to the other series of the Trust and that an annual in-depth review of the Advisor with respect to those series was most recently conducted in May 2021. The Board also considered the approval of a separate sub-advisory agreement (the “Sub-Advisory Agreement” and together with the Advisory Agreement, the “Agreements”) between the Advisor and Morgan Creek Capital Management, LLC (the “Sub-Advisor”), on behalf of the Fund, pursuant to which the Sub-Advisor would perform portfolio management and related services.
In connection with its consideration of the Agreements, the Board, including the Independent Trustees, requested, received and evaluated materials from the Advisor and Sub-Advisor about the Agreements and the services proposed to be provided thereunder, including information about the key features of the Fund and related matters. The Board also reviewed information regarding the proposed investment advisory fee rates and various other materials that it considered relevant to its consideration and approval of the proposed Agreements.
| BOARD REVIEW OF INVESTMENT ADVISORY AND SUB-ADVISORY AGREEMENTS (Continued) |
In considering each of the Agreements, the Board considered and discussed information and analysis provided by the Advisor and Sub-Advisor. In its deliberations, the Board did not identify any single piece of information that was paramount or controlling and individual trustees may have attributed different weights to various factors.
Nature, Extent and Quality of Services. In considering the nature, extent and quality of the services to be provided by the Advisor and Sub-Advisor to the Fund, the Board reviewed the services to be provided by the Advisor and Sub-Advisor, noting that these services include, among other things, furnishing a continuous investment program for the Fund, including arranging for, or implementing, the purchase and sale of portfolio securities, the provision of related services such as portfolio management compliance services, and the preparation and filing of certain reports on behalf of the Trust. The Trustees reviewed the extensive responsibilities that the Advisor will have as investment advisor to the Fund, including the oversight of the activities and operations of the Sub-Advisor and other service providers, oversight of general fund compliance with federal and state laws, and the implementation of Board directives as they relate to the Fund. The Board received the most recent Form ADV for the Sub-Advisor as well as responses to a detailed series of questions that, among other things, requested information about the Sub-Advisor’s business, services, and financial condition. The Board considered, among other things, the professional experience and qualifications of the senior management and key professional personnel of the Advisor and Sub-Advisor, including those individuals responsible for portfolio management, the Advisor’s and Sub-Advisor’s operational capabilities and resources, and their experience in managing investment portfolios. The Board concluded that, within the context of its full deliberations, it was satisfied with the nature, extent and quality of the services expected to be provided to the Fund by the Advisor and the Sub-Advisor.
Performance. In connection with the assessment of the ability of each of the Advisor and Sub-Advisor to perform its duties under its Agreement, the Board considered its investment performance and experience generally and whether it has the resources necessary to carry out its functions. The Board concluded that each of the Advisor and Sub-Advisor has the resources necessary to perform its obligations under its Agreement.
Cost of Services and Profitability. The Board considered the cost of the services to be provided by the Advisor and Sub-Advisor, reviewed the fees to be paid pursuant to the Agreements, and considered the estimated profitability projected by each of the Advisor and Sub-Advisor from its relationship with the Fund. In addition, the Board discussed the fee arrangement between the Advisor and Sub-Advisor, noting that the Advisor would pay the Sub-Advisor out of the advisory fee it receives from the Fund. The Board also reviewed information provided by the Advisor regarding advisory fees of comparable funds and evaluated the proposed fee arrangements in light of this information and the factors that judicial decisions have specified as pertinent generally. The Board also considered the Advisor’s contractual arrangement to waive its advisory fee and/or reimburse expenses in an effort to control the expense ratio of the Fund. Based on its review, within the context of its full deliberations, the Board determined that the fees proposed to be paid to the Advisor and Sub-Advisor appear to be reasonable in light of the services to be provided.
Economies of Scale. The Board considered the potential for economies of scale and determined that it would reconsider this factor at an appropriate time in the future. In the event there were to be significant asset growth in the Fund, the Board determined to reassess whether the investment advisory and sub-advisory fees appropriately took into account any economies of scale that had been realized as a result of that growth. The Board also considered the Advisor’s willingness to enter into a contractual expense limitation agreement for the Fund, noting that this would protect shareholders from high operational costs.
Ancillary Benefits. The Board noted the potential benefits to be received by each of the Advisor and Sub-Advisor as a result of its relationship with the Fund (other than the advisory or sub-advisory fee), including the intangible benefits of its association with the Trust generally and any favorable publicity arising in connection with the Fund’s performance.
| BOARD REVIEW OF INVESTMENT ADVISORY AND SUB-ADVISORY AGREEMENTS (Continued) |
Conclusion. Based on its deliberations and evaluation of the information described above, the Board, including the Independent Trustees, unanimously: (i) concluded that the terms of the Agreements are fair and reasonable; (ii) concluded that the fees to be paid to the Advisor are fair and reasonable in light of the services that it will provide to Fund; (iii) concluded that the fees to be paid to the Sub-Advisor are fair and reasonable in light of the services that the Sub-Advisor will provide to the Fund; and (iv) agreed to approve each of the Agreements for an initial term of two years.
Approval of New Sub-Advisory Agreement for AdvisorShares Newfleet Multi-Sector Income ETF
On July 1, 2022, Virtus Investment Partners, Inc. (“Virtus”), the parent company of Newfleet Asset Management, LLC (“Newfleet”), the investment sub-advisor to the AdvisorShares Newfleet Multi-Sector Income ETF (the “Fund”) since its inception, concluded an organizational restructuring pursuant to which Virtus’s three fixed income advisory entities combined into a single entity named Virtus Fixed Income Advisers, LLC (“VFIA”).
Accordingly, at a meeting held on June 29, 2022, the Board, including the Independent Trustees, approved a new investment sub-advisory agreement between the Adviser and VFIA (the “New Sub-Advisory Agreement”), which contains substantially the same terms as the sub-advisory agreement with Newfleet including the rate of compensation. Therefore, effective July 1, 2022, VFIA, doing business as Newfleet, became the sub-advisor to the Fund.
At the meeting, the Board noted that it most recently had considered and approved the annual renewal of the sub-advisory agreement with Newfleet at its May 2022 meeting. In considering whether to approve the New Sub-Advisory Agreement, the Board reviewed and discussed additional information and analysis provided by VFIA and the Adviser. In its deliberations, the Board did not identify any single factor that was paramount or controlling and individual trustees may have attributed different weights to various factors.
Nature, Extent and Quality of the Services to be Provided. In considering the nature, extent and quality of the services to be provided by VFIA, the Board reviewed the services to be provided by VFIA, noting that these services include, among other things, furnishing a continuous investment program for the Fund, including arranging for, or implementing, the purchase and sale of portfolio securities. The Board further noted that these services are the same as the services currently provided by VFIA. The Board received responses to a detailed series of questions that, among other things, requested information about VFIA’s business, services, and financial condition. The Board considered, among other things, the organizational structure and professional experience of the senior management and key professional personnel of VFIA, the firm’s operational capabilities and its compliance program. The Board noted that the Fund’s current portfolio managers would continue to manage the Fund as VFIA employees. The Board also noted the Trust’s chief compliance officer’s ongoing review of VFIA’s compliance program. Based on its review, the Board concluded that it was satisfied with the nature, extent and quality of the services to be provided to the Fund by VFIA.
Performance. In connection with the assessment of the ability of VFIA to perform its duties under its Agreement, the Board considered its investment performance and experience generally and whether it has the resources necessary to carry out its functions. The Board also considered the performance of the portfolio managers with respect to the Fund. The Board concluded that VFIA has the resources necessary to perform its obligations under the New Sub-Advisory Agreement.
Cost of Services and Profitability. The Board considered the cost of the services to be provided by VFIA, reviewed the fee to be paid pursuant to the New Sub-Advisory Agreement, and considered the estimated profitability projected by VFIA from its relationship with the Fund. The Board noted that the proposed fee under the New Sub-Advisory Agreement is the same as the sub-advisory fee paid to Newfleet. The Board also considered information provided by Newfleet for its May 2022 meeting
| BOARD REVIEW OF INVESTMENT ADVISORY AND SUB-ADVISORY AGREEMENTS (Continued) |
regarding advisory fees of comparable accounts and evaluated the proposed fee arrangements in light of this information and the factors that judicial decisions have specified as pertinent generally. Based on its review, within the context of its full deliberations, the Board concluded that the fee appeared reasonable in light of the services to be rendered.
Economies of Scale. The Board considered whether economies of scale would be realized by the Fund at higher asset levels and determined to reassess in the future whether the Fund’s advisory fees appropriately took into account any economies of scale that may be realized as a result of significant growth of assets of the Fund.
Ancillary Benefits. The Board noted the potential benefits to be received by VFIA as a result of its relationship with the Fund (other than the sub-advisory fee), including the intangible benefits of its association with the Trust generally and any favorable publicity arising in connection with the Fund’s performance.
Conclusion. Based on its deliberations, the Board, including the Independent Trustees, unanimously concluded that the terms of the New Sub-Advisory Agreement, including the fee, are fair and reasonable in light of the services to be provided to the Fund and approved the New Sub-Advisory Agreement for an initial term of two years.
| BOARD OF TRUSTEES AND OFFICERS (Unaudited) |
The business of the Trust is managed under the direction of the Trust’s Board of Trustees. The Board elects the officers of the Trust who are responsible for administering the Trust’s day-to-day operations.
The name, age, address, and principal occupations during the past five years for each Trustee and officer of the Trust is set forth below, along with the other public directorships held by the Trustees. More information about the Trustees is in the Trust’s Statement of Additional Information, which is available without charge by calling 1-877-843-3831.
Name, Address, and Date of
Birth of Trustee/Officer | | Position(s)
Held with
the Trust, Term
of Office and
Length of
Time Served | | Principal Occupation(s)
During Past 5 Years | | Number of
Portfolios
in Fund
Complex
Overseen
by Trustee | | Other
Directorships
Held by
Trustee
During Past
5 Years |
| Interested Trustee | | | | | | | | |
| | | | | | | | | |
Noah Hamman*
4800 Montgomery Lane
Suite 150
Bethesda, MD 20814
(1968) | | Trustee (no set term); served since 2009 | | Chief Executive Officer, President, and Founder of AdvisorShares Investments,
LLC (2006–present) | | 27 | | None |
| | | | | | | | | |
| Independent Trustees | | | | | | | | |
| | | | | | | | | |
Elizabeth (“Betsy”) Piper/Bach
4800 Montgomery Lane
Suite 150
Bethesda, MD 20814
(1952) | | Trustee (no set term); served since 2009 | | President of ASAE Business Services, Inc. (2017–present), ASAE Insurance Company (2020–present), ASAE Investments, LLC (2018–present), ASAE Real Estate (2017–present) (ASAE (American Society of Association Executives) is a membership organization serving the association and non-profit community); President of P/B Wealth Consulting (2017–present); Vice-President/Chief Operating Officer of NADA (National Automobile Dealers Association) Retirement Administrators, Inc. (2009–2017) | | 27 | | None |
| | | | | | | | | |
William G. McVay
4800 Montgomery Lane
Suite 150
Bethesda, MD 20814
(1954) | | Trustee (no set term); served since 2011 | | Principal of Red Tortoise LLC (a boutique investment counseling firm) (May 2017–present); Founder of RDK Strategies, LLC (2007–present) | | 27 | | None |
| | | | | | | | | |
| Officers | | | | | | | | |
| | | | | | | | | |
Noah Hamman
4800 Montgomery Lane
Suite 150
Bethesda, MD 20814
(1968) | | President (no set term); served since 2009 | | Chief Executive Officer, President, and Founder of AdvisorShares Investments, LLC (2006–present) | | N/A | | N/A |
| | | | | | | | | |
Dan Ahrens
6046 Goodwin Avenue
Dallas, TX 75206
(1966) | | Secretary & Treasurer (no set terms); served since 2009 | | Managing Director of AdvisorShares Investments, LLC (2013–present); Chief Compliance Officer of the Trust (2009–2013); Executive Vice President of AdvisorShares Investments, LLC (2008–2013) | | N/A | | N/A |
| | | | | | | | | |
Stefanie Little
11 Gina Marie Lane
Elkton, MD 21921
(1967) | | Chief Compliance Officer (no set term); served since 2013 | | Founder of Chenery Compliance Group, LLC (2015-present); Chief Compliance Officer of AdvisorShares Investments, LLC and the Trust (2013–present); President of LCG Compliance Alliance (2011–present) | | N/A | | N/A |
| BOARD OF TRUSTEES AND OFFICERS (Unaudited) (Continued) |
Name, Address, and Date of
Birth of Trustee/Officer | | Position(s)
Held with
the Trust, Term
of Office and
Length of
Time Served | | Principal Occupation(s)
During Past 5 Years | | Number of
Portfolios
in Fund
Complex
Overseen
by Trustee | | Other
Directorships
Held by
Trustee
During Past
5 Years |
Julio J. Lugo
51 Stonehedge Drive
East Windsor, NJ 08520
(1963) | | Vice President | | Head of Fund Operations of AdvisorShares
Investments, LLC (2021-present); President of ETP Consulting, LLC (2020-2021); Principal of BNYMellon Depositary Receipts (2004-2020) | | N/A | | N/A |
| * | Mr. Hamman is an “interested” person of the Trust, as that term is defined in the 1940 Act, by virtue of his ownership and controlling interest in the Advisor. |
Quarterly Portfolio Holdings Information
The Funds are required to file their complete schedule of portfolio holdings with the SEC for their first and third quarters as an exhibit to their reports on Form N-PORT. Copies of the filings are available without charge on the SEC’s website at www.sec.gov.
Proxy Voting Information
A description of the Funds proxy voting policies and procedures, as well as a record of how the Funds voted proxies during the most recent 12-month period ended June 30, is available without charge upon request by calling 1-877-843-3831. This information is also available on the SEC’s website at www.sec.gov.
Premium/Discount Information
Information about the differences between the daily market price on the secondary market for the shares of a Fund and the Fund’s net asset value may be found on the Fund’s website at www.advisorshares.com.
| ADVISORSHARES TRUST |
| |
Investment Advisor AdvisorShares Investments, LLC
4800 Montgomery Lane, Suite 150
Bethesda, MD 20814 Sub-Advisors Alpha DNA Investment Management LLC 8860 Columbia 100 Parkway, Suite 301 Columbia, MD 21045 CMS Advisors, LLC 420 Fort Duquesne Boulevard Pittsburgh, PA 15222 CreativeOne Wealth, LLC 6330 Sprint Parkway, Suite 400 Overland Park, KS 66211 Dorsey, Wright & Associates, LLC 3300 W. Leigh Street Richmond, VA 23230 DoubleLine Equity LP 505 N. Brand Boulevard, Suite 860 Glendale, CA 91203 Gerber Kawasaki, Inc. 2716 Ocean Park Boulevard Santa Monica, CA 90405 Morgan Creek Capital Management, LLC 301 W. Barbee Chapel Road, Suite 200 Chapel Hill, NC 27517 Newfleet Asset Management, LLC 1 Financial Plaza Hartford, CT 06103 Poseidon Investment Management, LLC 330 Fell Street, Suite 200 San Francisco, CA 94102 Ranger Alternative Management, L.P. 2828 N. Harwood Street, Suite 1900 Dallas, TX 75201 ThinkBetter, LLC 1549 Ringling Boulevard, Suite 510 Sarasota, FL 34236 | | Distributor Foreside Fund Services, LLC
Three Canal Plaza, Suite 100
Portland, ME 04101 Custodian/Fund Administrator/Transfer Agent The Bank of New York Mellon
240 Greenwich Street
New York, NY 10286 Legal Counsel Morgan, Lewis & Bockius LLP
1111 Pennsylvania Avenue, NW
Washington, D.C. 20004 Independent Registered Public Accounting Firm Tait, Weller & Baker LLP
50 South 16th Street, Suite 2900
Philadelphia, PA 19102 |
This report is submitted for the general information of the shareholders of each Fund. It is not authorized for distribution to prospective investors unless preceded or accompanied by an effective prospectus, which includes information regarding a Fund’s risks, objectives, fees and expenses, experience of management and other information.
Item 2. Code of Ethics.
| (a) | The registrant, as of the end of the period covered by this report, has adopted a code of ethics that applies to the registrant’s principal executive officer, principal financial officer, principal accounting officer or controller, or persons performing similar functions, regardless of whether these individuals are employed by the registrant or a third party. |
| (c) | There have been no amendments, during the period covered by this report, to a provision of the code of ethics that applies to the registrant’s principal executive officer, principal financial officer, principal accounting officer or controller, or persons performing similar functions, regardless of whether these individuals are employed by the registrant or a third party, and that relates to any element of the code of ethics description. |
| (d) | The registrant has not granted any waivers, including an implicit waiver, from a provision of the code of ethics that applies to the registrant’s principal executive officer, principal financial officer, principal accounting officer or controller, or persons performing similar functions, regardless of whether these individuals are employed by the registrant or a third party, that relates to one or more of the items set forth in paragraph (b) of this item’s instructions. |
Item 3. Audit Committee Financial Expert.
The Registrant’s Board of Trustees has one audit committee financial expert serving on its audit committee, an “independent” Trustee, Elizabeth Piper/Bach. Under applicable securities laws, a person who is determined to be an audit committee financial expert will not be deemed an “expert” for any purpose, including without limitation for the purposes of Section 11 of the Securities Act of 1933, as a result of being designated or identified as an audit committee financial expert. The designation or identification of a person as an audit committee financial expert does not impose on such person any duties, obligations, or liabilities that are greater than the duties, obligations, and liabilities imposed on such person as a member of the audit committee and Board of Trustees in the absence of such designation or identification.
Item 4. Principal Accountant Fees and Services.
Audit Fees
| (a) | The aggregate fees billed for each of the last two fiscal years for professional services rendered by the principal accountant for the audit of the registrant’s annual financial statements or services that are normally provided by the accountant in connection with statutory and regulatory filings or engagements for those fiscal years are $397,450 for 2022 and $292,500 for 2021. |
Audit-Related Fees
| (b) | The aggregate fees billed in each of the last two fiscal years for assurance and related services by the principal accountant that are reasonably related to the performance of the audit of the registrant’s financial statements and are not reported under paragraph (a) of this Item are $0 for 2022 and $0 for 2021. |
Tax Fees
| (c) | The aggregate fees billed in each of the last two fiscal years for professional services rendered by the principal accountant for tax compliance, tax advice, and tax planning are $75,000 for 2022 and $57,000 for 2021. |
All Other Fees
| (d) | The aggregate fees billed in each of the last two fiscal years for products and services provided by the principal accountant, other than the services reported in paragraphs (a) through (c) of this Item are $0 for 2022 and $0 for 2021. |
| (e)(1) | Disclose the audit committee’s pre-approval policies and procedures described in paragraph (c)(7) of Rule 2-01 of Regulation S-X. |
Per Rule 2-01(c)(7)(A), the Audit Committee pre-approves all of the Audit, Audit-Related, Tax and Other Fees of the Registrant.
| (e)(2) | The percentage of services described in each of paragraphs (b) through (d) of this Item that were approved by the audit committee pursuant to paragraph (c)(7)(i)(C) of Rule 2-01 of Regulation S-X are as follows: |
(b) N/A
(c) 100%
(d) N/A
| (g) | The aggregate non-audit fees billed by the registrant’s accountant for services rendered to the registrant, and rendered to the registrant’s investment adviser (not including any sub-adviser whose role is primarily portfolio management and is subcontracted with or overseen by another investment adviser), and any entity controlling, controlled by, or under common control with the adviser that provides ongoing services to the registrant for each of the last two fiscal years of the registrant was $0 for 2022 and $0 for 2021. |
Item 5. Audit Committee of Listed Registrants.
| (a) | The Fund has a designated Audit Committee in accordance with Section 3(a)(58)(A) of the Securities and Exchange Act of 1934 (the “Exchange Act”) and the member of such committee is Elizabeth Piper/Bach and William G. McVay. |
Item 6. Investments.
Schedule of Investments in securities of unaffiliated issuers as of the close of the reporting period is included as part of the report to shareholders filed under Item 1(a) of this form.
Item 7. Disclosure of Proxy Voting Policies and Procedures for Closed-End Management Investment Companies.
Not applicable.
Item 8. Portfolio Managers of Closed-End Management Investment Companies.
Not applicable.
Item 9. Purchases of Equity Securities by Closed-End Management Investment Company and Affiliated Purchasers.
Not applicable.
Item 10. Submission of Matters to a Vote of Security Holders.
There have been no material changes to the procedures by which the shareholders may recommend nominees to the registrant’s board of directors, where those changes were implemented after the registrant last provided disclosure in response to the requirements of Item 407(c)(2)(iv) of Regulation S-K (17 CFR 229.407) (as required by Item 22(b)(15) of Schedule 14A (17 CFR 240.14a-101)), or this Item.
Item 11. Controls and Procedures.
| (a) | The registrant’s principal executive and principal financial officers, or persons performing similar functions, have concluded that the registrant’s disclosure controls and procedures (as defined in Rule 30a-3(c) under the Investment Company Act of 1940, as amended (the “1940 Act”) (17 CFR 270.30a-3(c))) are effective, as of a date within 90 days of the filing date of the report that includes the disclosure required by this paragraph, based on their evaluation of these controls and procedures required by Rule 30a-3(b) under the 1940 Act (17 CFR 270.30a-3(b)) and Rules 13a-15(b) or 15d-15(b) under the Securities Exchange Act of 1934, as amended (17 CFR 240.13a-15(b) or 240.15d-15(b)). |
| (b) | There were no changes in the registrant’s internal control over financial reporting (as defined in Rule 30a-3(d) under the 1940 Act (17 CFR 270.30a-3(d))) that occurred during the period covered by this report that has materially affected, or is reasonably likely to materially affect, the registrant’s internal control over financial reporting. |
Item 12. Disclosure of Securities Lending Activities for Closed-End Management Investment Companies.
Not applicable.
Item 13. Exhibits.
SIGNATURES
Pursuant to the requirements of the Securities Exchange Act of 1934 and the Investment Company Act of 1940, the registrant has duly caused this report to be signed on its behalf by the undersigned, thereunto duly authorized.
| (Registrant) | AdvisorShares Trust | |
| | | |
| By (Signature and Title)* | /s/ Noah Hamman | |
| | Noah Hamman, Chief Executive Officer | |
| | (principal executive officer) | |
| | | |
| Date | September 1, 2022 | |
Pursuant to the requirements of the Securities Exchange Act of 1934 and the Investment Company Act of 1940, this report has been signed below by the following persons on behalf of the registrant and in the capacities and on the dates indicated.
| By (Signature and Title)* | /s/ Noah Hamman | |
| | Noah Hamman, Chief Executive Officer | |
| | (principal executive officer) | |
| | | |
| Date | September 1, 2022 | |
| | | |
| By (Signature and Title)* | /s/ Dan Ahrens | |
| | Dan Ahrens, Treasurer | |
| | (principal financial officer) | |
| | | |
| Date | September 1, 2022 | |
| * | Print the name and title of each signing officer under his or her signature. |