As filed with the Securities and Exchange Commission on February 12, 2021
Registration No. 333-
UNITED STATES
SECURITIES AND EXCHANGE COMMISSION
Washington, D.C. 20549
FORM S-3
REGISTRATION STATEMENT
UNDER
THE SECURITIES ACT OF 1933
PROSHARES TRUST II
(Exact name of registrant as specified in its charter)
| Delaware | 6221 | 87-6284802 | ||
| (State of Organization) | (Primary Standard Industrial Classification Code Number) | (I.R.S. Employer Identification Number) |
7501 Wisconsin Avenue
Suite 1000E
Bethesda, Maryland 20814
(240) 497-6400
(Address, including zip code, and telephone number, including area code, of registrant’s principal executive offices)
Michael L. Sapir
c/o ProShare Capital Management LLC
7501 Wisconsin Avenue
Suite 1000E
Bethesda, Maryland 20814
(240) 497-6400
(Name, address, including zip code, and telephone number, including area code, of agent for service)
Copies to:
Michael M. Philipp c/o Morgan, Lewis & Bockius LLP 77 West Wacker Drive Chicago, Illinois 60601 | Richard F. Morris c/o ProShare Capital Management LLC 7501 Wisconsin Avenue Suite 1000E Bethesda, MD 20814 |
Approximate date of commencement of proposed sale to the public:
As promptly as practicable after the effective date of this Registration Statement.
If the only securities being registered on this Form are being offered pursuant to dividend or interest reinvestment plans, please check the following box: ☐
If any of the securities being registered on this Form are to be offered on a delayed or continuous basis pursuant to Rule 415 under the Securities Act of 1933, other than securities offered only in connection with dividend or interest reinvestment plans, check the following box. ☒
If this Form is filed to register additional securities for an offering pursuant to Rule 462(b) under the Securities Act, please check the following box and list the Securities Act registration statement number of the earlier effective registration statement for the same offering. ☐
If this Form is a post-effective amendment filed pursuant to Rule 462(c) under the Securities Act, check the following box and list the Securities Act registration statement number of the earlier effective registration statement for the same offering. ☐
If this Form is a registration statement pursuant to General Instruction I.D. or a post-effective amendment thereto that shall become effective upon filing with the Commission pursuant to Rule 462(e) under the Securities Act, check the following box. ☐
If this Form is a post-effective amendment to a registration statement filed pursuant to General Instruction I.D. filed to register additional securities or additional classes of securities pursuant to Rule 413(b) under the Securities Act, check the following box. ☐
Indicate by check mark whether the registrant is a large accelerated filer, an accelerated filer, a non-accelerated filer, smaller reporting company, or an emerging growth company. See the definitions of “large accelerated filer,” “accelerated filer,” “smaller reporting company,” and “emerging growth company” in Rule 12b-2 of the Exchange Act.
ProShares Ultra VIX Short Term Futures ETF
| Large accelerated filer | ☐ | Accelerated filer | ☒ | |||
| Non-accelerated filer | ☐ (Do not check if a smaller reporting company) | Smaller reporting company | ☐ | |||
Emerging growth company | ☐ | |||||
If an emerging growth company, indicate by check mark if the registrant has elected not to use the extended transition period for complying with any new or revised financial accounting standards provided pursuant to Section 7(a)(2)(B) of the Securities Act. ☐
ProShares Short VIX Short-Term Futures ETF
| Large accelerated filer | ☐ | Accelerated filer | ☒ | |||
| Non-accelerated filer | ☐ (Do not check if a smaller reporting company) | Smaller reporting company | ☐ | |||
Emerging growth company | ☐ | |||||
If an emerging growth company, indicate by check mark if the registrant has elected not to use the extended transition period for complying with any new or revised financial accounting standards provided pursuant to Section 7(a)(2)(B) of the Securities Act. ☐
ProShares VIX Short Term Futures ETF
| Large accelerated filer | ☐ | Accelerated filer | ☒ | |||
| Non-accelerated filer | ☐ (Do not check if a smaller reporting company) | Smaller reporting company | ☐ | |||
Emerging growth company | ☐ | |||||
If an emerging growth company, indicate by check mark if the registrant has elected not to use the extended transition period for complying with any new or revised financial accounting standards provided pursuant to Section 7(a)(2)(B) of the Securities Act ☐
CALCULATION OF REGISTRATION FEE
| ||||
| Title of Securities to be Registered | Proposed Maximum Aggregate Offering Price(1) | Amount of Registration Fee | ||
ProShares Ultra VIX Short-Term Futures ETF Common Units of Beneficial Interest | $6,292,466,130(2) | $543,187(2) | ||
ProShares Short VIX Short-Term Futures ETF Common Units of Beneficial Interest | $1,662,363,577(3) | $192,668(3) | ||
ProShares VIX Short-Term Futures ETF Common Units of Beneficial Interest | $1,504,027,518(4) | $130,667(4) | ||
TOTAL | $9,458,857,225 | $866,522 | ||
| ||||
| ||||
| (1) | Estimated solely for the purpose of calculating the registration fee in accordance with Rule 457(d) under the Securities Act of 1933, as amended (“1933 Act”). |
| (2) | Pursuant to the provisions of Rule 415(a)(6) under the 1933 Act, the Registrant carries forward the value of the unsold Common Units of Beneficial Interest relating to ProShares Ultra VIX Short-Term Futures ETF from the Registration Statement on Form S-3, as amended (File No. 333-238175), which was initially filed with the Securities and Exchange Commission (the “SEC”) on May 11, 2020 and declared effective by the SEC on September 9, 2020 (the “Prior S-3 Registration Statement”) ($4,492,466,130, the “Unsold Securities”) for which the Registrant has paid the associated registration fees to the SEC ($346,807). Pursuant to Rule 415(a)(6), the offering of the Unsold Securities of ProShares Ultra VIX Short-Term Futures ETF covered by the Prior S-3 Registration Statement will be deemed terminated as of the date of effectiveness of this Registration Statement. Another series of the Registrant that is registering the offering of Common Units of Beneficial Interest pursuant to this Registration Statement, ProShares Short VIX Short-Term Futures ETF, is carrying forward a portion of the value of the unsold Common Units of Beneficial Interest offered thereby pursuant to the Prior S-3 Registration Statement, as described in footnote 3 below. ProShares Short VIX Short-Term Futures ETF is not carrying forward the remaining $2,200,000,000 value of the unsold Common Units of Beneficial Interest offered thereby pursuant to the Prior S-3 Registration Statement. See footnote 3 and the Explanatory Note below. This Registration Statement also constitutes Post-Effective Amendment No. 1 to the Prior S-3 Registration Statement and deregisters an aggregate total of $2,200,000,000 value of the unsold Common Units of Beneficial Interest offered by ProShares Short VIX Short-Term Futures ETF. Pursuant to Rule 457(p) under the 1933 Act, the Registrant hereby offsets the remaining amount of the registration fee due in connection with the registration of $1,800,000,000 in additional value of Common Units of Beneficial Interest relating to ProShares Ultra VIX Short-Term Futures ETF by allocating a portion ($196,380) of the credit received from the aggregate registration fees previously paid ($265,941) in connection with such aggregate $2,200,000,000 value of the unsold Common Units of Beneficial Interest relating to ProShares Short VIX Short-Term Futures ETF. |
| (3) | Pursuant to the provisions of Rule 415(a)(6) under the 1933 Act, the Registrant carries forward the value of the unsold Common Units of Beneficial Interest relating to ProShares Short VIX Short-Term Futures ETF from the Prior S-3 Registration Statement ($1,662,363,577, the “Unsold Securities”), for which the issuer has paid the associated registration fees to the SEC ($192,668). No additional ProShares Short VIX Short-Term Futures ETF Common Units of Beneficial Interest are being registered concurrently with the filing of this Registration Statement. Pursuant to Rule 415(a)(6), the offering of the Unsold Securities of ProShares Short VIX Short-Term Futures ETF covered by the Prior S-3 Registration Statement will be deemed terminated as of the date of effectiveness of this Registration Statement. The Registrant is carrying forward the remaining value of the Unsold Securities for which the issuer has paid the associated registration fees in respect of the offering of Common Units of Beneficial Interest relating to ProShares Ultra VIX Short-Term Futures ETF, as set forth in footnote 2 above, and ProShares VIX Short-Term Futures ETF, as set forth in footnote 4 below. |
| (4) | Pursuant to the provisions of Rule 415(a)(6) under the 1933 Act, the Registrant carries forward the value of the unsold Common Units of Beneficial Interest relating to ProShares VIX Short-Term Futures ETF from the Prior S-3 Registration Statement $1,104,027,518, the “Unsold Securities”), for which the issuer has paid the associated registration fees to the SEC ($87,027). Another series of the Registrant that is registering the offering of Common Units of Beneficial Interest pursuant to this Registration Statement, ProShares Short VIX Short-Term Futures ETF, is carrying forward a portion of the value of the unsold Common Units of Beneficial Interest offered thereby pursuant to the Prior S-3 Registration Statement, as described in footnote 3 above. ProShares Short VIX Short-Term Futures ETF is not carrying forward the remaining $2,200,000,000 value of the unsold Common Units of Beneficial Interest offered thereby pursuant to the Prior S-3 Registration Statement. See footnote 3 above and the Explanatory Note below. This Registration Statement also constitutes Post-Effective Amendment No. 1 to the Prior S-3 Registration Statement and deregisters an aggregate total of $2,200,000,000 value of the unsold Common Units of Beneficial Interest offered by ProShares Short VIX Short-Term Futures ETF. Pursuant to Rule 457(p) under the 1933 Act, the Registrant hereby offsets the remaining amount of the registration fee due in connection with the registration of $400,000,000 in additional value of Common Units of Beneficial Interest relating to ProShares Ultra VIX Short-Term Futures ETF by allocating a portion ($43,640) of the credit received from the aggregate registration fees previously paid ($265,941) in connection with the aggregate $2,200,000,000 value of the unsold Common Units of Beneficial Interest relating to ProShares Short VIX Short-Term Futures ETF. |
Pursuant to Rule 429(b) under the 1933 Act, upon effectiveness, this Registration Statement shall constitute Post-Effective Amendment No. 1 to the registration statement on Form S-3 (File No. 333-238175), which post-effective amendment shall hereafter become effective concurrently with the effectiveness of this Registration Statement in accordance with Section 8(c) of the 1933 Act.
The registrant hereby amends this Registration Statement on such date or dates as may be necessary to delay its effective date until the registrant shall file a further amendment which specifically states that this Registration Statement shall thereafter become effective in accordance with Section 8(a) of the Securities Act of 1933 or until this Registration Statement shall become effective on such date as the Commission, acting pursuant to said Section 8(a), may determine.
EXPLANATORY NOTE
Deregistration of Securities from the Registration Statement on Form S-3 (File No. 333-238175)
ProShares Short VIX Short-Term Futures ETF (the “Short VIX Fund”) previously registered its offering of Common Units of Beneficial Interest on the Prior S-3 Registration Statement with a maximum aggregate offering price of $3,862,363,577. The Short VIX Fund is deregistering an aggregate of $2,200,000,000 value of the unsold Common Units of Beneficial Interest offered thereby pursuant to this Post-Effective Amendment No. 1 to the Prior S-3 Registration Statement. Pursuant to Rule 457(p) under the 1933 Act, the Registrant hereby offsets a portion of the registration fee due in connection with the registration of (i) $1,800,000,000 in additional value of Common Units of Beneficial Interest relating to ProShares Ultra VIX Short-Term Futures ETF by allocating the credit received from the registration fees previously paid ($196,380) in connection with such value of the unsold Common Units of Beneficial Interest relating to the Short VIX Fund and (ii) $400,000,000 in additional value of Common Units of Beneficial Interest relating to ProShares VIX Short-Term Futures ETF by allocating the credit received from the registration fees previously paid ($43,640) in connection with such value of the unsold Common Units of Beneficial Interest relating to the Short VIX Fund. See footnote 2 and footnote 4 above. The Prior S-3 Registration Statement is hereby amended, as appropriate, to reflect the deregistration of the securities referred to above.
Title of Securities to be Registered | Benchmark | Proposed Maximum Aggregate Offering Price Per Fund |
ProShares VIX Short-Term Futures ETF (VIXY) | S&P 500® VIX Short-Term Futures Index | $1,504,027,518 |
ProShares Ultra VIX Short-Term Futures ETF (UVXY) | S&P 500® VIX Short-Term Futures Index | $6,292,466,130 |
ProShares Short VIX Short-Term Futures ETF (SVXY) | S&P 500® VIX Short-Term Futures Index | $1,662,363,577 |
RISK DISCLOSURE STATEMENT
SUMMARY | |
Important Information About the Funds | |
Overview | |
The Matching Fund | |
The Ultra Fund | |
The Short Fund | |
All Funds | |
Purchases and Sales in the Secondary Market | |
Creation and Redemption Transactions | |
Breakeven Amounts | |
Important Tax Information | |
RISK FACTOR SUMMARY | |
Risks Related to All Funds | |
Risks Specific to the Geared Funds | |
RISK FACTORS | |
CAUTIONARY NOTE REGARDING FORWARD-LOOKING STATEMENTS | |
DESCRIPTION OF EACH FUND’S BENCHMARK | |
The S&P 500 VIX Short-Term Futures Index | |
Information about the Index Licensor | |
INVESTMENT OBJECTIVES AND PRINCIPAL INVESTMENT STRATEGIES | |
Investment Objectives | |
PERFORMANCE OF THE OFFERED COMMODITY POOLS OPERATED BY THE COMMODITY POOL OPERATOR | |
MANAGEMENT’S DISCUSSION AND ANALYSIS OF FINANCIAL CONDITION AND RESULTS OF OPERATIONS | |
CHARGES | |
Breakeven Table | |
MATERIAL U.S. FEDERAL INCOME TAX CONSIDERATIONS | |
Status of the Funds | |
U.S. Shareholders | |
Page | |
PERFORMANCE OF THE OTHER COMMODITY POOLS OPERATED BY THE COMMODITY POOL OPERATOR | |
USE OF PROCEEDS | |
WHO MAY SUBSCRIBE | |
CREATION AND REDEMPTION OF SHARES | |
Creation Procedures | |
Redemption Procedures | |
Creation and Redemption Transaction Fee | |
Special Settlement | |
LITIGATION | |
DESCRIPTION OF THE SHARES; THE FUNDS; CERTAIN MATERIAL TERMS OF THE TRUST AGREEMENT | |
Description of the Shares | |
Principal Office; Location of Records; Fiscal Year | |
The Funds | |
The Trustee | |
The Sponsor | |
Duties of the Sponsor | |
Ownership or Beneficial Interest in the Funds | |
Management; Voting by Shareholders | |
Recognition of the Trust and the Funds in Certain States | |
Possible Repayment of Distributions Received by Shareholders | |
Shares Freely Transferable | |
Book-Entry Form | |
Reports to Shareholders | |
Net Asset Value (“NAV”) | |
Indicative Optimized Portfolio Value (“IOPV”) | |
Termination Events | |
DISTRIBUTIONS | |
THE ADMINISTRATOR | |
THE CUSTODIAN | |
THE TRANSFER AGENT | |
THE DISTRIBUTOR | |
Description of SEI | |
THE SECURITIES DEPOSITORY; BOOK-ENTRY ONLY SYSTEM; GLOBAL SECURITY | |
SHARE SPLITS OR REVERSE SPLITS | |
CONFLICTS OF INTEREST | |
MATERIAL CONTRACTS | |
Administration and Accounting Agreement | |
Transfer Agency and Service Agreement | |
Custody Agreement | |
Distribution Agreement | |
PURCHASES BY EMPLOYEE BENEFIT PLANS | |
General | |
“Plan Assets” | |
Ineligible Purchasers | |
Page | |
PLAN OF DISTRIBUTION | |
Buying and Selling Shares | |
Authorized Participants | |
Likelihood of Becoming a Statutory Underwriter | |
General | |
LEGAL MATTERS | |
EXPERTS | |
WHERE INVESTORS CAN FIND MORE INFORMATION | |
RECENT FINANCIAL INFORMATION AND ANNUAL REPORTS | |
PRIVACY POLICY | |
The Trust’s Commitment to Investors | |
The Information the Trust Collects About Investors | |
How the Trust Handles Investors’ Personal Information | |
How the Trust Safeguards Investors’ Personal Information | |
INCORPORATION BY REFERENCE OF CERTAIN DOCUMENTS | |
Litigation and Regulatory Disclosure Relating to FCMs | |
SWAP COUNTERPARTIES | |
Litigation and Regulatory Disclosure Relating to Swap Counterparties | |
APPENDIX A—GLOSSARY OF DEFINED TERMS | 1 |
Fund Name | Index |
ProShares VIX Short-Term Futures ETF | S&P 500® VIX Short-Term Futures Index |
ProShares Ultra VIX Short-Term Futures ETF | S&P 500® VIX Short-Term Futures Index |
ProShares Short VIX Short-Term Futures ETF | S&P 500® VIX Short-Term Futures Index |
Create/Redeem Cut-off | NAV Calculation Time |
2:00 p.m. (Eastern Time) | 4:00 p.m. (Eastern Time) |
Fund Name | Breakeven Amount (% Per Annum of Average Daily NAV)* | Assumed Selling Price Per Share* | Breakeven Amount ($ for the Assumed Selling Price Per Share)* |
ProShares Ultra VIX Short-Term Futures ETF | 1.71% | $10.00 | $0.17 |
ProShares Short VIX Short-Term Futures ETF | 1.15% | $40.00 | $0.46 |
ProShares VIX Short-Term Futures ETF* | 1.05% | $15.00 | $0.16 |
*
Index XYZ | Fund XYZ | |||
Level | Daily Performance | Daily Performance | Net Asset Value | |
Start | 100.00 | $100.00 | ||
Day 1 | 97.00 | -3.00% | -4.50% | $95.50 |
Day 2 | 99.91 | 3.00% | 4.50% | $99.80 |
Day 3 | 96.91 | -3.00% | -4.50% | $95.31 |
Day 4 | 99.82 | 3.00% | 4.50% | $99.60 |
Day 5 | 96.83 | -3.00% | -4.50% | $95.11 |
Day 6 | 99.73 | 3.00% | 4.50% | $99.39 |
Day 7 | 96.74 | -3.00% | -4.50% | $94.92 |
Total Return | -3.26% | -5.08% | ||
Index XYZ | Fund XYZ | |||
Level | Daily Performance | Daily Performance | Net Asset Value | |
Start | 100.00 | $100.00 | ||
Day 1 | 103.00 | 3.00% | 4.50% | $104.50 |
Day 2 | 99.91 | -3.00% | -4.50% | $99.80 |
Day 3 | 102.91 | 3.00% | 4.50% | $104.29 |
Day 4 | 99.82 | -3.00% | -4.50% | $99.60 |
Day 5 | 102.81 | 3.00% | 4.50% | $104.08 |
Day 6 | 99.73 | -3.00% | -4.50% | $99.39 |
Day 7 | 102.72 | 3.00% | 4.50% | $103.87 |
Total Return | 2.72% | 3.87% | ||
(Annualized Benchmark Volatility 77%)
(Annualized Benchmark Volatility 77%)

(Annualized Benchmark Volatility 77%)

(Annualized Benchmark Volatility 77%)
(Annualized Benchmark Volatility 77%)
(Annualized Benchmark Volatility 77%)
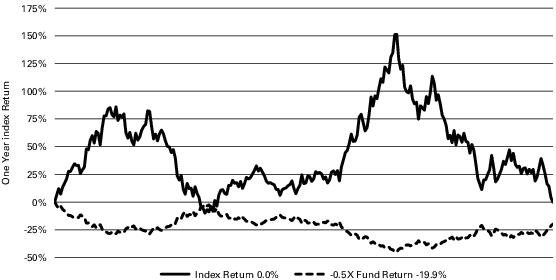
One Year Index Performance | One-Half the Invers (-0.5x) One Year Index Performance | Index Volatility | |||||||||||||||
0% | 5% | 10% | 15% | 20% | 25% | 30% | 35% | 40% | 45% | 50% | 55% | 60% | 65% | 70% | 75% | ||
-60% | 30.0% | 58.1% | 58.0% | 57.5% | 56.8% | 55.8% | 54.5% | 52.9% | 51.0% | 48.9% | 46.6% | 44.0% | 41.2% | 38.1% | 34.9% | 31.6% | 28.0% |
-55% | 27.5% | 49.1% | 48.9% | 48.5% | 47.8% | 46.9% | 45.6% | 44.1% | 42.4% | 40.4% | 38.2% | 35.7% | 33.1% | 30.2% | 27.2% | 24.0% | 20.7% |
-50% | 25.0% | 41.4% | 41.3% | 40.9% | 40.2% | 39.3% | 38.1% | 36.7% | 35.1% | 33.2% | 31.1% | 28.8% | 26.3% | 23.6% | 20.7% | 17.7% | 14.5% |
-45% | 22.5% | 34.8% | 34.7% | 34.3% | 33.7% | 32.8% | 31.7% | 30.4% | 28.8% | 27.0% | 25.0% | 22.8% | 20.4% | 17.8% | 15.1% | 12.2% | 9.2% |
-40% | 20.0% | 29.1% | 29.0% | 28.6% | 28.0% | 27.2% | 26.1% | 24.8% | 23.3% | 21.6% | 19.7% | 17.5% | 15.3% | 12.8% | 10.2% | 7.4% | 4.5% |
-35% | 17.5% | 24.0% | 23.9% | 23.6% | 23.0% | 22.2% | 21.2% | 19.9% | 18.5% | 16.8% | 15.0% | 12.9% | 10.7% | 8.4% | 5.9% | 3.2% | 0.4% |
-30% | 15.0% | 19.5% | 19.4% | 19.1% | 18.5% | 17.7% | 16.8% | 15.6% | 14.2% | 12.6% | 10.8% | 8.8% | 6.7% | 4.4% | 2.0% | -0.5% | -3.2% |
-25% | 12.5% | 15.5% | 15.4% | 15.0% | 14.5% | 13.8% | 12.8% | 11.6% | 10.3% | 8.7% | 7.0% | 5.1% | 3.1% | 0.9% | -1.4% | -3.9% | -6.5% |
-20% | 10.0% | 11.8% | 11.7% | 11.4% | 10.9% | 10.1% | 9.2% | 8.1% | 6.8% | 5.3% | 3.6% | 1.8% | -0.2% | -2.3% | -4.6% | -7.0% | -9.5% |
-15% | 7.5% | 8.5% | 8.4% | 8.1% | 7.6% | 6.9% | 6.0% | 4.9% | 3.6% | 2.1% | 0.5% | -1.2% | -3.2% | -5.2% | -7.4% | -9.7% | -12.2% |
-10% | 5.0% | 5.4% | 5.3% | 5.0% | 4.5% | 3.8% | 3.0% | 1.9% | 0.7% | -0.7% | -2.3% | -4.0% | -5.9% | -7.9% | -10.0% | -12.3% | -14.6% |
-5% | 2.5% | 2.6% | 2.5% | 2.2% | 1.7% | 1.1% | 0.2% | -0.8% | -2.0% | -3.4% | -4.9% | -6.6% | -8.4% | -10.4% | -12.4% | -14.6% | -16.9% |
0% | 0.0% | 0.0% | -0.1% | -0.4% | -0.8% | -1.5% | -2.3% | -3.3% | -4.5% | -5.8% | -7.3% | -8.9% | -10.7% | -12.6% | -14.7% | -16.8% | -19.0% |
5% | -2.5% | -2.4% | -2.5% | -2.8% | -3.2% | -3.9% | -4.7% | -5.6% | -6.8% | -8.1% | -9.5% | -11.1% | -12.9% | -14.7% | -16.7% | -18.8% | -21.0% |
10% | -5.0% | -4.7% | -4.7% | -5.0% | -5.5% | -6.1% | -6.9% | -7.8% | -8.9% | -10.2% | -11.6% | -13.2% | -14.9% | -16.7% | -18.6% | -20.7% | -22.8% |
15% | -7.5% | -6.7% | -6.8% | -7.1% | -7.5% | -8.1% | -8.9% | -9.8% | -10.9% | -12.2% | -13.6% | -15.1% | -16.7% | -18.5% | -20.4% | -22.4% | -24.5% |
20% | -10.0% | -8.7% | -8.8% | -9.1% | -9.5% | -10.1% | -10.8% | -11.7% | -12.8% | -14.0% | -15.4% | -16.9% | -18.5% | -20.2% | -22.1% | -24.0% | -26.1% |
25% | -12.5% | -10.6% | -10.6% | -10.9% | -11.3% | -11.9% | -12.6% | -13.5% | -14.6% | -15.8% | -17.1% | -18.6% | -20.1% | -21.9% | -23.7% | -25.6% | -27.6% |
30% | -15.0% | -12.3% | -12.4% | -12.6% | -13.0% | -13.6% | -14.3% | -15.2% | -16.2% | -17.4% | -18.7% | -20.1% | -21.7% | -23.4% | -25.1% | -27.0% | -29.0% |
35% | -17.5% | -13.9% | -14.0% | -14.3% | -14.7% | -15.2% | -15.9% | -16.8% | -17.8% | -18.9% | -20.2% | -21.6% | -23.2% | -24.8% | -26.5% | -28.4% | -30.3% |
40% | -20.0% | -15.5% | -15.6% | -15.8% | -16.2% | -16.7% | -17.4% | -18.3% | -19.3% | -20.4% | -21.7% | -23.0% | -24.5% | -26.2% | -27.9% | -29.7% | -31.6% |
45% | -22.5% | -17.0% | -17.0% | -17.3% | -17.7% | -18.2% | -18.9% | -19.7% | -20.7% | -21.8% | -23.0% | -24.4% | -25.9% | -27.4% | -29.1% | -30.9% | -32.7% |
50% | -25.0% | -18.4% | -18.4% | -18.7% | -19.0% | -19.6% | -20.2% | -21.1% | -22.0% | -23.1% | -24.3% | -25.7% | -27.1% | -28.7% | -30.3% | -32.1% | -33.9% |
55% | -27.5% | -19.7% | -19.8% | -20.0% | -20.4% | -20.9% | -21.5% | -22.3% | -23.3% | -24.4% | -25.6% | -26.9% | -28.3% | -29.8% | -31.4% | -33.2% | -35.0% |
60% | -30.0% | -20.9% | -21.0% | -21.2% | -21.6% | -22.1% | -22.8% | -23.6% | -24.5% | -25.5% | -26.7% | -28.0% | -29.4% | -30.9% | -32.5% | -34.2% | -36.0% |
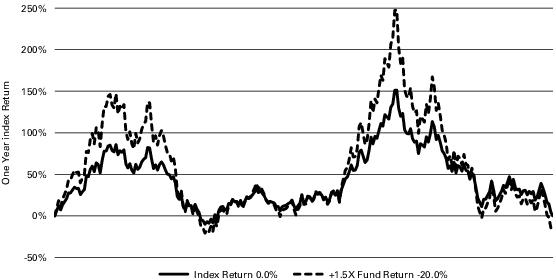
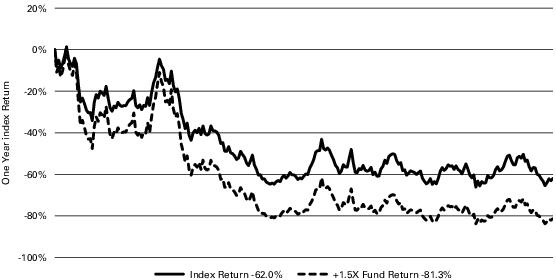
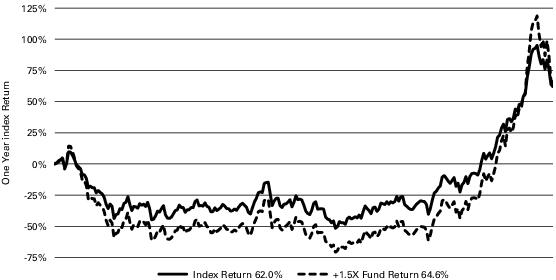
One Year Index Performance | One and One-Half Times (1.5x) One Year Index Performance | Index Volatility | |||||||||||||||
0% | 5% | 10% | 15% | 20% | 25% | 30% | 35% | 40% | 45% | 50% | 55% | 60% | 65% | 70% | 75% | ||
-60% | -90.0% | -74.7% | -74.7% | -74.8% | -74.9% | -75.1% | -75.3% | -75.5% | -75.8% | -76.2% | -76.6% | -77.0% | -77.4% | -77.9% | -78.4% | -78.9% | -79.5% |
-55% | -82.5% | -69.8% | -69.8% | -69.9% | -70.1% | -70.3% | -70.5% | -70.8% | -71.2% | -71.6% | -72.0% | -72.5% | -73.1% | -73.6% | -74.2% | -74.9% | -75.6% |
-50% | -75.0% | -64.6% | -64.7% | -64.8% | -64.9% | -65.2% | -65.5% | -65.8% | -66.2% | -66.7% | -67.2% | -67.8% | -68.4% | -69.1% | -69.8% | -70.6% | -71.4% |
-45% | -67.5% | -59.2% | -59.2% | -59.4% | -59.6% | -59.8% | -60.2% | -60.6% | -61.0% | -61.6% | -62.2% | -62.9% | -63.6% | -64.4% | -65.2% | -66.1% | -67.0% |
-40% | -60.0% | -53.5% | -53.6% | -53.7% | -53.9% | -54.2% | -54.6% | -55.1% | -55.6% | -56.2% | -56.9% | -57.7% | -58.5% | -59.4% | -60.3% | -61.3% | -62.4% |
-35% | -52.5% | -47.6% | -47.6% | -47.8% | -48.0% | -48.4% | -48.8% | -49.3% | -49.9% | -50.6% | -51.4% | -52.3% | -53.2% | -54.2% | -55.3% | -56.4% | -57.6% |
-30% | -45.0% | -41.4% | -41.5% | -41.7% | -41.9% | -42.3% | -42.8% | -43.4% | -44.1% | -44.8% | -45.7% | -46.7% | -47.7% | -48.8% | -50.0% | -51.3% | -52.6% |
-25% | -37.5% | -35.0% | -35.1% | -35.3% | -35.6% | -36.0% | -36.6% | -37.2% | -38.0% | -38.8% | -39.8% | -40.9% | -42.0% | -43.3% | -44.6% | -46.0% | -47.4% |
-20% | -30.0% | -28.4% | -28.5% | -28.7% | -29.0% | -29.5% | -30.1% | -30.8% | -31.7% | -32.6% | -33.7% | -34.8% | -36.1% | -37.5% | -38.9% | -40.5% | -42.1% |
-15% | -22.5% | -21.6% | -21.7% | -21.9% | -22.3% | -22.8% | -23.4% | -24.2% | -25.2% | -26.2% | -27.4% | -28.6% | -30.0% | -31.5% | -33.1% | -34.8% | -36.5% |
-10% | -15.0% | -14.6% | -14.7% | -14.9% | -15.3% | -15.9% | -16.6% | -17.5% | -18.5% | -19.6% | -20.9% | -22.3% | -23.8% | -25.4% | -27.1% | -29.0% | -30.9% |
-5% | -7.5% | -7.4% | -7.5% | -7.8% | -8.2% | -8.8% | -9.6% | -10.5% | -11.6% | -12.8% | -14.2% | -15.7% | -17.3% | -19.1% | -21.0% | -22.9% | -25.0% |
0% | 0.0% | 0.0% | -0.1% | -0.4% | -0.8% | -1.5% | -2.3% | -3.3% | -4.5% | -5.8% | -7.3% | -8.9% | -10.7% | -12.6% | -14.7% | -16.8% | -19.0% |
5% | 7.5% | 7.6% | 7.5% | 7.2% | 6.7% | 6.0% | 5.1% | 4.0% | 2.8% | 1.3% | -0.3% | -2.0% | -3.9% | -6.0% | -8.2% | -10.5% | -12.9% |
10% | 15.0% | 15.4% | 15.3% | 14.9% | 14.4% | 13.7% | 12.7% | 11.5% | 10.2% | 8.7% | 6.9% | 5.0% | 3.0% | 0.8% | -1.5% | -4.0% | -6.6% |
15% | 22.5% | 23.3% | 23.2% | 22.9% | 22.3% | 21.5% | 20.5% | 19.2% | 17.8% | 16.1% | 14.3% | 12.3% | 10.1% | 7.7% | 5.3% | 2.6% | -0.1% |
20% | 30.0% | 31.5% | 31.3% | 31.0% | 30.3% | 29.5% | 28.4% | 27.1% | 25.6% | 23.8% | 21.8% | 19.7% | 17.4% | 14.9% | 12.2% | 9.4% | 6.5% |
25% | 37.5% | 39.8% | 39.6% | 39.2% | 38.6% | 37.7% | 36.5% | 35.1% | 33.5% | 31.6% | 29.5% | 27.2% | 24.8% | 22.1% | 19.3% | 16.3% | 13.2% |
30% | 45.0% | 48.2% | 48.1% | 47.7% | 47.0% | 46.0% | 44.8% | 43.3% | 41.6% | 39.6% | 37.4% | 35.0% | 32.3% | 29.5% | 26.5% | 23.3% | 20.0% |
35% | 52.5% | 56.9% | 56.7% | 56.3% | 55.5% | 54.5% | 53.2% | 51.7% | 49.8% | 47.7% | 45.4% | 42.8% | 40.0% | 37.0% | 33.9% | 30.5% | 27.0% |
40% | 60.0% | 65.7% | 65.5% | 65.0% | 64.3% | 63.2% | 61.8% | 60.2% | 58.2% | 56.0% | 53.5% | 50.8% | 47.9% | 44.7% | 41.4% | 37.8% | 34.1% |
45% | 67.5% | 74.6% | 74.4% | 73.9% | 73.1% | 72.0% | 70.6% | 68.8% | 66.8% | 64.4% | 61.8% | 59.0% | 55.9% | 52.6% | 49.0% | 45.3% | 41.4% |
50% | 75.0% | 83.7% | 83.5% | 83.0% | 82.2% | 81.0% | 79.5% | 77.6% | 75.5% | 73.0% | 70.3% | 67.3% | 64.0% | 60.5% | 56.8% | 52.9% | 48.8% |
55% | 82.5% | 93.0% | 92.8% | 92.3% | 91.4% | 90.1% | 88.5% | 86.6% | 84.3% | 81.7% | 78.9% | 75.7% | 72.3% | 68.6% | 64.7% | 60.6% | 56.3% |
60% | 90.0% | 102.4% | 102.2% | 101.6% | 100.7% | 99.4% | 97.7% | 95.7% | 93.3% | 90.6% | 87.6% | 84.3% | 80.7% | 76.8% | 72.7% | 68.4% | 63.9% |
Swaps | Futures | Options | ||||
Low | High | Low | High | Low | High | |
ProShares Ultra VIX Short-Term Futures ETF | 0% | 25% | 125% | 150% | 0% | |
ProShares Short VIX Short-Term Futures ETF | 0% | -50% | 0% | |||
ProShares VIX Short-Term Futures ETF | 0% | 100% | 0% | |||
THE COMMODITY POOL OPERATOR
Name of Pool: | ProShares Short VIX Short-Term Futures ETF |
Type of Pool: | Public, Exchange-listed Commodity Pool |
Date of Inception of Trading: | October 3, 2011 |
Aggregate Gross Capital Subscriptions1 as of December 31, 2020 | $13,926,289,509 |
Aggregate Net Capital Subscriptions2 as of December 31, 2020 | $676,470,239 |
Net Asset Value as of December 31, 2020 | $409,371,468 |
Net Asset Value per Share3 as of December 31, 2020 | $41.42 |
Worst Monthly Loss:4 | -89.59% (February 2018) |
Worst Peak-to-Valley Loss:5 | -93.91% (December 2017-March 2020) |
Rate of Return:6 | 2016 | 2017 | 2018 | 2019 | 2020 |
January | -22.30% | 29.23% | -6.82% | 13.90% | -4.78% |
February | -6.58% | 4.35% | -89.59% | 6.11% | -17.55% |
March | 37.26% | 14.69% | -6.11% | 2.17% | -39.79% |
April | 2.22% | 3.04% | 6.43% | 6.59% | 6.11% |
May | 20.79% | 6.44% | 4.45% | -10.42% | 4.76% |
June | -20.28% | 3.53% | -0.86% | 9.13% | -8.93% |
July | 32.73% | 14.75% | 8.40% | 2.47% | 7.92% |
August | 11.27% | -12.55% | 3.03% | -9.81% | 2.36% |
September | -1.33% | 16.54% | 3.56% | 7.05% | 1.96% |
October | -1.36% | 14.64% | -18.15% | 7.63% | -4.62% |
November | 17.32% | 4.39% | 4.39% | 8.89% | 22.61% |
December | 8.55% | 13.56% | -16.11% | 3.84% | 0.12% |
Annual | 79.54% | 179.12% | -91.68% | 54.92% | -36.89% |
Year-to-Date | N/A | N/A | N/A | N/A | N/A |
Name of Pool: | ProShares Ultra VIX Short-Term Futures ETF |
Type of Pool: | Public, Exchange-listed Commodity Pool |
Date of Inception of Trading: | October 3, 2011 |
Aggregate Gross Capital Subscriptions1 as of December 31, 2020 | $23,598,353,858 |
Aggregate Net Capital Subscriptions2 as of December 31, 2020 | $6,348,484,227 |
Net Asset Value as of December 31, 2020 | $1,356,204,199 |
Net Asset Value per Share3 as of December 31, 2020 | $10.67 |
Worst Monthly Loss:4 | -51.67% (March 2016) |
Worst Peak-to-Valley Loss:5 | -100.00% (Inception - December 2020) |
Rate of Return:6 | 2016 | 2017 | 2018 | 2019 | 2020 |
January | 34.25% | -42.60% | 10.20% | -35.48% | 9.33% |
February | 5.64% | -11.29% | 48.44% | -17.46% | 58.78% |
March | -51.67% | -26.86% | 12.39% | -10.08% | 165.90% |
April | -13.26% | -12.79% | -20.67% | -18.62% | -27.02% |
May | -36.41% | -23.70% | -16.23% | 25.96% | -22.77% |
June | -14.07% | -8.79% | -2.98% | -24.06% | -0.13% |
July | -45.21% | -25.99% | -23.74% | -9.46% | -24.15% |
August | -21.67% | -0.75% | -11.63% | 17.21% | -9.21% |
September | -13.70% | -28.54% | -11.59% | -21.26% | -11.13% |
October | -1.25% | -26.02% | 67.32% | -23.74% | 7.28% |
November | -35.39% | -10.74% | -16.43% | -23.67% | -48.56% |
December | -19.36% | -24.16% | 59.59% | -14.19% | -4.09% |
Annual | -93.81% | -94.06% | 57.60% | -84.44% | -15.84% |
Year-to-Date | N/A | N/A | N/A | N/A | N/A |
Name of Pool: | ProShares VIX Short-Term Futures ETF |
Type of Pool: | Public, Exchange-listed Commodity Pool |
Date of Inception of Trading: | January 3, 2011 |
Aggregate Gross Capital Subscriptions1 as of December 31, 2020 | $4,379,385,802 |
Aggregate Net Capital Subscriptions2 as of December 31, 2020 | $965,810,466 |
Net Asset Value as of December 31, 2020 | $293,390,549 |
Net Asset Value per Share3 as of December 31, 2020 | $13.76 |
Worst Monthly Loss:4 | -35.26% (November 2020) |
Worst Peak-to-Valley Loss:5 | -99.89% (September 2011 - December 2019) |
Rate of Return:6 | 2016 | 2017 | 2018 | 2019 | 2020 |
January | 19.62% | -23.72% | 5.70% | -24.67% | 7.12% |
February | 4.01% | -5.32% | 47.34% | -11.73% | 38.55% |
March | -29.41% | -13.98% | 9.38% | -6.13% | 107.86% |
April | -5.45% | -5.35% | -13.62% | -12.54% | -17.16% |
May | -19.23% | -10.71% | -10.45% | 18.61% | -14.30% |
June | 1.63% | -4.18% | -1.11% | -16.49% | 3.69% |
July | -25.53% | -13.63% | -16.10% | -5.94% | -16.22% |
August | -11.04% | 3.95% | -7.34% | 13.97% | -5.91% |
September | -4.60% | -15.03% | -7.58% | -14.19% | -6.72% |
October | 0.02% | -13.61% | 42.86% | -15.80% | 5.88% |
November | -17.88% | -5.09% | -10.42% | -16.26% | -35.26% |
December | -9.47% | -12.58% | 37.96% | -9.11% | -2.25% |
Annual | -67.96% | -72.49% | 65.26% | -68.12% | 11.87% |
Year-to-Date | N/A | N/A | N/A | N/A | N/A |
FINANCIAL CONDITION AND RESULTS OF OPERATIONS
Ticker | Fund | Split Ratio | Old Cusip | New Cusip |
UCO | ProShares Ultra Bloomberg Crude Oil | 1:25 | 74347W247 | 74347Y888 |
BOIL | ProShares Ultra Bloomberg Natural Gas | 1:10 | 74347Y706 | 74347Y870 |
Shares outstanding: | Ultra Bloomberg Crude Oil | Ultra Bloomberg Natural Gas |
Shares outstanding, at December 31, 2019 | 608,453 | 537,815 |
Shares outstanding, at December 31, 2018 | 1,128,453 | 57,815 |
Net asset value, beginning of period | Net investment income (loss) | Net realized and unrealized gain (loss) | Change in net asset value from operations | Net asset value, end of period | Market value per share, end of period | |
Ultra Bloomberg Crude Oil | ||||||
For the Year Ended December 31, 2019 | 326.46 | 4.72 | 178.05 | 182.77 | 509.23 | 511.50 |
For the Year Ended December 31, 2018 | 591.62 | 4.88 | (270.04) | (265.16) | 326.46 | 332.50 |
For the Year Ended December 31, 2017 | 583.38 | (0.82) | 9.06 | 8.24 | 591.62 | 586.00 |
Ultra Bloomberg Natural Gas | ||||||
For the Year Ended December 31, 2019 | 252.83 | 0.74 | (169.60) | (168.86) | 83.97 | 83.40 |
For the Year Ended December 31, 2018 | 326.39 | 0.93 | (74.49) | (73.56) | 252.83 | 258.20 |
For the Year Ended December 31, 2017 | 942.42 | (2.32) | (613.71) | (616.03) | 326.39 | 325.00 |
Expenses(1) | Dollar Amount and Percentage of Expenses per Fund | |
ProShares Ultra VIX Short-Term Futures ETF | ||
Selling price per share | $10.00 | |
Management fee(2) | $0.09 | 0.95% |
Brokerage commissions and fees | $0.10 | 0.97% |
Variable create/redeem fees(4) | $(0.02) | (0.21)% |
Other expenses | $0.00 | 0.00% |
Total fees and expenses | $0.17 | 1.71% |
Interest income(5) | $0.00 | 0.00% |
Amount of trading income required for the NAV at the end of one year to equal the initial selling price per share (12-Month breakeven)(6) | $0.17 | 1.71% |
Expenses(1) | Dollar Amount and Percentage of Expenses per Fund | |
ProShares Short VIX Short-Term Futures ETF | ||
Selling price per share | $40.00 | |
Management fee(2) | $0.38 | 0.95% |
Brokerage commissions and fees | $0.15 | 0.37% |
Variable create/redeem fees(4) | $(0.07) | (0.17)% |
Other expenses | $0.00 | 0.00% |
Total fees and expenses | $0.46 | 1.15% |
Interest income(5) | $0.00 | 0.00% |
Amount of trading income required for the NAV at the end of one year to equal the initial selling price per share (12-Month breakeven)(6) | $0.46 | 1.15% |
Expenses(1) | Dollar Amount and Percentage of Expenses per Fund | |
ProShares VIX Short-Term Futures ETF | ||
Selling price per share | $15.00 | |
Management fee(2) | $0.13 | 0.85% |
Brokerage commissions and fees | $(3)0.05 | (3)0.33% |
Variable create/redeem fees(4) | $(3)(0.02) | (3)(0.13)% |
Other expenses | $0.00 | 0.00% |
Total fees and expenses | $0.16 | 1.05% |
Interest income(5) | $0.00 | 0.00% |
Amount of trading income required for the NAV at the end of one year to equal the initial selling price per share (12-Month breakeven)(6) | $0.16 | 1.05% |
1.
OPERATED BY THE COMMODITY POOL OPERATOR
Name of Pool: | ProShares Short Euro |
Type of Pool: | Public, Exchange-listed Commodity Pool |
Date of Inception of Trading: | June 26, 2012 |
Aggregate Gross Capital Subscriptions1 as of December 31, 2020 | $59,505,176 |
Aggregate Net Capital Subscriptions2 as of December 31, 2020 | $1,218,090 |
Net Asset Value as of December 31, 2020 | $4,191,955 |
Net Asset Value per Share3 as of December 31, 2020 | $41.92 |
Worst Monthly Loss:4 | -4.67% (July 2020) |
Worst Peak-to-Valley Loss:5 | -14.14% (December 2016 -January 2018) |
Rate of Return:6 | 2016 | 2017 | 2018 | 2019 | 2020 |
January | 0.24% | -2.43% | -3.26% | 0.43% | 1.40% |
February | -0.51% | 1.93% | 1.88% | 0.96% | 0.66% |
March | -4.43% | -0.66% | -0.63% | 1.70% | -0.08% |
April | -0.64% | -2.00% | 2.08% | 0.36% | 0.73% |
May | 2.92% | -2.95% | 3.52% | 0.77% | -1.39% |
June | 0.18% | -1.53% | 0.31% | -1.47% | -1.21% |
July | -0.76% | -3.43% | 0.11% | 3.06% | -4.67% |
August | 0.25% | -0.44% | 0.99% | 1.05% | -1.38% |
September | -0.69% | 0.80% | 0.20% | 1.16% | 1.78% |
October | 2.39% | 1.57% | 2.81% | -1.89% | 0.64% |
November | 3.58% | -2.02% | 0.36% | 1.45% | -2.38% |
December | 0.71% | -0.54% | -0.85% | -1.57% | -2.41% |
Annual | 3.04% | -11.24% | 7.58% | 6.05% | -8.17% |
Year-to-Date | N/A | N/A | N/A | N/A | N/A |
Name of Pool: | ProShares Ultra Bloomberg Crude Oil† |
Type of Pool: | Public, Exchange-listed Commodity Pool |
Date of Inception of Trading: | November 24, 2008 |
Aggregate Gross Capital Subscriptions1 as of December 31, 2020 | $15,639,552,253 |
Aggregate Net Capital Subscriptions2 as of December 31, 2020 | $1,945,758,340 |
Net Asset Value as of December 31, 2020 | $902,739,250 |
Net Asset Value per Share3 as of December 31, 2020 | $36.38 |
Worst Monthly Loss:4 | -85.06% (March 2020) |
Worst Peak-to-Valley Loss:5 | -99.94% (Inception -April 2020) |
Rate of Return:6 | 2016 | 2017 | 2018 | 2019 | 2020 |
January | -24.75% | -7.28% | 14.44% | 37.17% | -28.51% |
Rate of Return:6 | 2016 | 2017 | 2018 | 2019 | 2020 |
February | -16.75% | 2.10% | -8.64% | 10.52% | -26.25% |
March | 14.14% | -14.18% | 11.06% | 8.71% | -85.06% |
April | 31.14% | -6.77% | 11.67% | 12.78% | -63.40% |
May | 9.78% | -6.09% | -4.72% | -30.81% | 70.27% |
June | -6.05% | -10.82% | 17.42% | 16.85% | 14.42% |
July | -28.95% | 16.64% | -10.52% | -0.54% | 5.91% |
August | 9.10% | -10.36% | 4.71% | -12.95% | 9.49% |
September | 11.46% | 15.62% | 11.19% | -5.39% | -13.36% |
October | -7.66% | 8.73% | -20.14% | 0.73% | -20.52% |
November | 6.48% | 10.15% | -40.66% | 2.59% | 42.35% |
December | 12.93% | 10.42% | -22.95% | 22.63% | 11.90% |
Annual | -7.23% | 1.42% | -44.82% | 55.99% | -92.86% |
Year-to-Date | N/A | N/A | N/A | N/A | N/A |
Name of Pool: | ProShares Ultra Bloomberg Natural Gas |
Type of Pool: | Public, Exchange-listed Commodity Pool |
Date of Inception of Trading: | October 4, 2011 |
Aggregate Gross Capital Subscriptions1 as of December 31, 2020 | $1,351,478,391 |
Aggregate Net Capital Subscriptions2 as of December 31, 2020 | $325,250,870 |
Net Asset Value as of December 31, 2020 | $169,800,371 |
Net Asset Value per Share3 as of December 31, 2020 | $21.00 |
Worst Monthly Loss:4 | -57.08% (December 2018) |
Worst Peak-to-Valley Loss:5 | -99.95% (Inception -December 2020) |
Rate of Return:6 | 2016 | 2017 | 2018 | 2019 | 2020 |
January | -6.84% | -30.47% | 4.81% | -5.56% | -27.78% |
February | -46.12% | -23.59% | -21.65% | -4.00% | -20.88% |
March | 16.16% | 22.55% | 2.50% | -11.33% | -12.94% |
April | 15.98% | 0.42% | -1.95% | -10.47% | 23.44% |
May | -4.07% | -17.02% | 10.78% | -12.61% | -29.43% |
June | 47.36% | -4.46% | -1.88% | -12.90% | -22.20% |
July | -4.53% | -15.95% | -8.21% | -5.36% | -1.64% |
August | -8.03% | 14.11% | 8.41% | -1.50% | 68.97% |
September | -7.09% | -6.73% | 4.13% | -0.33% | -26.98% |
October | -0.83% | -17.07% | 12.17% | 3.06% | 23.90% |
November | 8.57% | -1.20% | 75.57% | -31.78% | -32.50% |
December | 20.88% | -8.83% | -57.68% | -7.22% | -26.94% |
Annual | 1.50% | -65.37% | -22.53% | -66.80% | -75.00% |
Year-to-Date | N/A | N/A | N/A | N/A | N/A |
Name of Pool: | ProShares Ultra Euro |
Type of Pool: | Public, Exchange-listed Commodity Pool |
Date of Inception of Trading: | November 24, 2008 |
Aggregate Gross Capital Subscriptions1 as of December 31, 2020 | $87,330,837 |
Aggregate Net Capital Subscriptions2 as of December 31, 2020 | $5,642,677 |
Net Asset Value as of December 31, 2020 | $4,737,350 |
Net Asset Value per Share3 as of December 31, 2020 | $15.79 |
Worst Monthly Loss:4 | -7.10% (November 2016) |
Worst Peak-to-Valley Loss:5 | -60.98% (November 2009 -April 2020) |
Rate of Return:6 | 2016 | 2017 | 2018 | 2019 | 2020 |
January | -0.90% | 4.71% | 6.66% | -0.67% | -2.57% |
February | 0.54% | -3.92% | -3.83% | -1.60% | -1.27% |
March | 9.10% | 1.00% | 1.16% | -3.14% | -0.73% |
April | 1.03% | 3.97% | -4.05% | -0.41% | -1.62% |
May | -5.83% | 5.96% | -6.67% | -1.20% | 2.37% |
June | -0.96% | 2.98% | -0.72% | 3.18% | 2.26% |
July | 1.22% | 7.08% | -0.11% | -5.64% | 9.61% |
August | -0.80% | 0.74% | -1.93% | -1.86% | 2.39% |
September | 1.13% | -1.72% | -0.35% | -1.97% | -3.67% |
October | -4.80% | -3.17% | -5.20% | 4.25% | -1.55% |
November | -7.10% | 3.96% | -0.54% | -2.69% | 4.68% |
December | -1.76% | 1.13% | 1.90% | 3.22% | 4.52% |
Annual | -9.63% | 24.42% | -13.48% | -8.64% | 14.54% |
Year-to-Date | N/A | N/A | N/A | N/A | N/A |
Name of Pool: | ProShares Ultra Gold |
Type of Pool: | Public, Exchange-listed Commodity Pool |
Date of Inception of Trading: | December 1, 2008 |
Aggregate Gross Capital Subscriptions1 as of December 31, 2020 | $894,481,017 |
Aggregate Net Capital Subscriptions2 as of December 31, 2020 | $213,080,910 |
Net Asset Value as of December 31, 2020 | $263,540,473 |
Net Asset Value per Share3 as of December 31, 2020 | $67.57 |
Worst Monthly Loss:4 | -14.67% (November 2016) |
Worst Peak-to-Valley Loss:5 | -70.62% (August 2011 -September 2018) |
Rate of Return:6 | 2016 | 2017 | 2018 | 2019 | 2020 |
January | 9.75% | 11.40% | 8.07% | 5.88% | 7.74% |
February | 22.46% | 6.82% | -4.34% | -1.41% | -3.01% |
March | -0.20% | -2.09% | 0.49% | -3.69% | 1.93% |
April | 7.59% | 3.15% | -2.03% | -1.98% | 11.92% |
May | -11.52% | -0.44% | -1.61% | 3.03% | 5.16% |
June | 18.01% | -4.11% | -8.63% | 16.14% | 5.31% |
July | 2.86% | 3.76% | -5.06% | 1.59% | 17.50% |
August | -5.20% | 6.64% | -3.42% | 12.99% | -1.41% |
September | 1.70% | -4.68% | -2.90% | -7.40% | -8.52% |
October | -7.84% | -2.41% | 4.15% | 5.73% | -1.89% |
November | -14.67% | 1.25% | -0.01% | -6.44% | -11.42% |
December | -5.81% | 1.36% | 9.73% | 6.92% | 12.92% |
Annual | 10.68% | 21.19% | -6.90% | 32.56% | 37.32% |
Year-to-Date | N/A | N/A | N/A | N/A | N/A |
Name of Pool: | ProShares Ultra Silver |
Type of Pool: | Public, Exchange-listed Commodity Pool |
Date of Inception of Trading: | December 1, 2008 |
Aggregate Gross Capital Subscriptions1 as of December 31, 2020 | $3,620,569,630 |
Aggregate Net Capital Subscriptions2 as of December 31, 2020 | $1,479,074,734 |
Net Asset Value as of December 31, 2020 | $745,304,028 |
Net Asset Value per Share3 as of December 31, 2020 | $50.71 |
Worst Monthly Loss:4 | -34.13% (September 2020) |
Worst Peak-to-Valley Loss:5 | -97.51% (April 2011 - March 2020) |
Rate of Return:6 | 2016 | 2017 | 2018 | 2019 | 2020 |
January | 2.96% | 12.62% | 3.85% | 6.81% | 0.67% |
February | 8.87% | 11.21% | -9.39% | -6.68% | -18.09% |
March | 7.86% | -3.08% | -2.37% | -6.79% | -29.61% |
April | 33.68% | -7.53% | 0.65% | -2.92% | 7.86% |
May | -19.67% | -1.72% | 1.56% | -5.62% | 51.00% |
June | 29.58% | -9.94% | -6.78% | 9.58% | -1.37% |
July | 17.59% | 2.62% | -7.87% | 14.13% | 65.32% |
August | -13.33% | 6.18% | -10.29% | 22.48% | 31.26% |
September | 5.61% | -6.06% | -5.18% | -15.15% | -34.13% |
October | -16.49% | -1.01% | -0.15% | 12.79% | 0.07% |
November | -13.12% | -3.35% | -2.05% | -12.10% | -11.20% |
December | -5.94% | 3.12% | 17.23% | 9.49% | 35.08% |
Annual | 23.57% | 0.34% | -21.34% | 20.10% | 59.97% |
Year-to-Date | N/A | N/A | N/A | N/A | N/A |
Name of Pool: | ProShares Ultra Yen |
Type of Pool: | Public, Exchange-listed Commodity Pool |
Date of Inception of Trading: | November 24, 2008 |
Aggregate Gross Capital Subscriptions1 as of December 31, 2020 | $30,492,596 |
Aggregate Net Capital Subscriptions2 as of December 31, 2020 | $4,371,389 |
Net Asset Value as of December 31, 2020 | $2,989,499 |
Net Asset Value per Share3 as of December 31, 2020 | $59.83 |
Worst Monthly Loss:4 | -16.28% (November 2016) |
Worst Peak-to-Valley Loss:5 | -63.78% (August 2011 - January 2016) |
Rate of Return:6 | 2016 | 2017 | 2018 | 2019 | 2020 |
January | -1.64% | 6.67% | 6.19% | 0.85% | 0.25% |
February | 14.96% | 0.80% | 4.26% | -4.85% | 0.79% |
March | 0.08% | 1.38% | 0.02% | 0.80% | -0.34% |
April | 11.41% | -0.44% | -5.66% | -1.55% | -0.04% |
May | -7.91% | 0.96% | 0.56% | 5.34% | -1.07% |
June | 14.33% | -3.38% | -3.90% | 0.67% | -0.47% |
July | 1.96% | 3.81% | -2.31% | -2.22% | 3.83% |
August | -3.10% | 0.20% | 0.83% | 4.35% | -0.25% |
September | 3.70% | -4.86% | -4.75% | -3.74% | 0.69% |
October | -6.77% | -2.33% | 0.98% | -0.15% | 1.31% |
November | -16.28% | 1.76% | -1.54% | -2.93% | 0.39% |
December | -4.62% | -0.67% | 6.54% | 0.94% | 1.97% |
Annual | 1.24% | 3.42% | 0.35% | -2.96% | 7.17% |
Year-to-Date | N/A | N/A | N/A | N/A | N/A |
Name of Pool: | ProShares UltraShort Australian Dollar |
Type of Pool: | Public, Exchange-listed Commodity Pool |
Date of Inception of Trading: | July 17, 2012 |
Aggregate Gross Capital Subscriptions1 as of December 31, 2020 | $40,408,052 |
Aggregate Net Capital Subscriptions2 as of December 31, 2020 | $(2,261,782) |
Net Asset Value as of December 31, 2020 | $2,222,639 |
Net Asset Value per Share3 as of December 31, 2020 | $44.45 |
Worst Monthly Loss:4 | -14.12% (March 2016) |
Worst Peak-to-Valley Loss:5 | -33.48% (September 2015 - January 2018) |
Rate of Return:6 | 2016 | 2017 | 2018 | 2019 | 2020 |
January | 5.13% | -9.74% | -6.36% | -6.11% | 10.07% |
February | -2.33% | -2.50% | 7.45% | 4.98% | 5.53% |
March | -14.12% | 0.30% | 2.05% | -0.17% | 10.40% |
April | 0.88% | 3.82% | 4.04% | 1.45% | -11.53% |
May | 9.89% | 1.27% | -1.11% | 3.46% | -4.79% |
June | -6.95% | -6.84% | 4.28% | -2.34% | -7.42% |
July | -4.20% | -7.95% | -0.93% | 5.47% | -7.02% |
August | 1.80% | 1.03% | 6.65% | 3.35% | -6.34% |
September | -4.13% | 2.52% | -1.25% | -0.36% | 5.75% |
October | 0.94% | 4.76% | 4.19% | -3.94% | 3.47% |
November | 5.65% | 2.16% | -6.29% | 3.98% | -8.54% |
December | 4.25% | -6.21% | 7.54% | -7.07% | -9.58% |
Annual | -5.45% | -17.26% | 20.68% | 1.68% | -21.18% |
Year-to-Date | N/A | N/A | N/A | N/A | N/A |
Name of Pool: | ProShares UltraShort Bloomberg Crude Oil† |
Type of Pool: | Public, Exchange-listed Commodity Pool |
Date of Inception of Trading: | November 24, 2008 |
Aggregate Gross Capital Subscriptions1 as of December 31, 2020 | $6,915,608,195 |
Aggregate Net Capital Subscriptions2 as of December 31, 2020 | $(13,587,075) |
Net Asset Value as of December 31, 2020 | $96,839,233 |
Net Asset Value per Share3 as of December 31, 2020 | $11.61 |
Worst Monthly Loss:4 | -50.78% (May 2020) |
Worst Peak-to-Valley Loss:5 | -88.56% (February 2009 - December 2020) |
Rate of Return:6 | 2016 | 2017 | 2018 | 2019 | 2020 |
January | 17.85% | 5.18% | -13.38% | -29.89% | 36.14% |
February | 1.14% | -3.06% | 7.43% | -11.14% | 30.49% |
March | -18.27% | 13.56% | -11.79% | -9.00% | 126.55% |
April | -29.23% | 5.81% | -12.16% | -12.55% | -5.34% |
May | -11.42% | 2.69% | 2.56% | 38.83% | -50.78% |
June | 0.72% | 8.90% | -16.97% | -17.80% | -19.95% |
July | 33.66% | -16.58% | 9.02% | -2.51% | -7.74% |
August | -13.03% | 8.88% | -6.01% | 6.76% | -9.90% |
September | -16.03% | -14.83% | -11.15% | -6.54% | 9.25% |
October | 5.69% | -9.51% | 21.99% | -2.22% | 18.70% |
November | -13.39% | -10.56% | 56.22% | -5.59% | -33.10% |
December | -13.41% | -10.59% | 15.00% | -19.44% | -12.00% |
Annual | -52.41% | -23.30% | 22.52% | -59.07% | -4.76% |
Year-to-Date | N/A | N/A | N/A | N/A | N/A |
Name of Pool: | ProShares UltraShort Bloomberg Natural Gas |
Type of Pool: | Public, Exchange-listed Commodity Pool |
Date of Inception of Trading: | October 4, 2011 |
Aggregate Gross Capital Subscriptions1 as of December 31, 2020 | $654,921,816 |
Aggregate Net Capital Subscriptions2 as of December 31, 2020 | $(8,566,667) |
Net Asset Value as of December 31, 2020 | $24,977,745 |
Net Asset Value per Share3 as of December 31, 2020 | $47.59 |
Worst Monthly Loss:4 | -63.45% (November 2018) |
Worst Peak-to-Valley Loss:5 | -86.13% (February 2016 - November 2018) |
Rate of Return:6 | 2016 | 2017 | 2018 | 2019 | 2020 |
January | 1.27% | 29.38% | -9.49% | -7.09% | 34.40% |
February | 71.49% | 23.73% | 24.33% | 1.36% | 20.18% |
March | -17.44% | -20.93% | -3.50% | 11.30% | 1.86% |
April | -19.84% | -3.34% | 0.55% | 10.26% | -28.73% |
May | -0.52% | 15.56% | -11.06% | 11.49% | 26.90% |
June | -35.93% | 1.52% | 0.64% | 10.46% | 17.25% |
July | -2.13% | 14.05% | 7.99% | 0.50% | -8.93% |
August | 4.35% | -13.95% | -8.74% | -1.67% | -49.67% |
September | 4.33% | 4.07% | -6.38% | -3.19% | 24.38% |
October | -3.38% | 18.01% | -13.86% | -5.90% | -23.92% |
November | -12.71% | -3.35% | -63.45% | 35.41% | 36.88% |
December | -24.57% | 2.21% | 92.78% | 2.78% | 19.29% |
Annual | -50.35% | 70.91% | -45.27% | 78.32% | 23.56% |
Year-to-Date | N/A | N/A | N/A | N/A | N/A |
Name of Pool: | ProShares UltraShort Euro |
Type of Pool: | Public, Exchange-listed Commodity Pool |
Date of Inception of Trading: | November 24, 2008 |
Aggregate Gross Capital Subscriptions1 as of December 31, 2020 | $2,753,037,396 |
Aggregate Net Capital Subscriptions2 as of December 31, 2020 | $(118,375,847) |
Net Asset Value as of December 31, 2020 | $52,953,339 |
Net Asset Value per Share3 as of December 31, 2020 | $22.53 |
Worst Monthly Loss:4 | -9.10% (July 2020) |
Worst Peak-to-Valley Loss:5 | -26.84% (November 2015 - January 2018) |
Rate of Return:6 | 2016 | 2017 | 2018 | 2019 | 2020 |
January | 0.51% | -4.87% | -6.44% | 0.67% | 2.68% |
February | -1.04% | 3.89% | 3.78% | 1.72% | 1.25% |
March | -8.72% | -1.32% | -1.30% | 3.28% | -0.19% |
April | -1.26% | -4.03% | 4.20% | 0.55% | 1.29% |
May | 5.90% | -5.89% | 7.00% | 1.39% | -2.62% |
June | 0.28% | -3.09% | 0.53% | -3.00% | -2.52% |
July | -1.42% | -6.81% | 0.11% | 6.04% | -9.10% |
August | 0.51% | -0.92% | 1.84% | 1.96% | -2.62% |
September | -1.32% | 1.57% | 0.31% | 2.09% | 3.51% |
October | 4.77% | 3.10% | 5.54% | -3.98% | 1.27% |
November | 7.26% | -3.99% | 0.51% | 2.79% | -4.72% |
December | 1.38% | -1.19% | -1.82% | -3.11% | -4.65% |
Annual | 6.05% | -21.69% | 14.41% | 10.39% | -15.89% |
Year-to-Date | N/A | N/A | N/A | N/A | N/A |
Name of Pool: | ProShares UltraShort Gold |
Type of Pool: | Public, Exchange-listed Commodity Pool |
Date of Inception of Trading: | December 1, 2008 |
Aggregate Gross Capital Subscriptions1 as of December 31, 2020 | $942,022,659 |
Aggregate Net Capital Subscriptions2 as of December 31, 2020 | $106,045,391 |
Net Asset Value as of December 31, 2020 | $20,337,376 |
Net Asset Value per Share3 as of December 31, 2020 | $31.43 |
Worst Monthly Loss:4 | -20.47% (February 2016) |
Worst Peak-to-Valley Loss:5 | -94.08% (Inception - August 2020) |
Rate of Return:6 | 2016 | 2017 | 2018 | 2019 | 2020 |
January | -9.65% | -11.36% | -7.80% | -5.65% | -7.46% |
February | -20.47% | -6.93% | 4.22% | 1.21% | 1.68% |
March | -1.45% | 1.41% | -0.85% | 3.49% | -7.76% |
April | -8.04% | -3.59% | 1.81% | 1.87% | -12.77% |
May | 11.92% | -0.13% | 1.31% | -3.14% | -5.94% |
June | -16.76% | 3.71% | 9.25% | -14.44% | -6.07% |
July | -3.43% | -4.01% | 5.18% | -1.85% | -15.62% |
August | 4.85% | -6.83% | 3.26% | -12.09% | -1.03% |
September | -2.22% | 4.45% | 2.74% | 7.21% | 8.19% |
October | 7.78% | 2.00% | -4.40% | -5.71% | 1.08% |
November | 15.76% | -1.48% | -0.23% | 6.48% | 10.58% |
December | 5.16% | -1.62% | -8.98% | -6.65% | -12.24% |
Annual | -21.19% | -22.83% | 3.98% | -27.67% | -40.72% |
Year-to-Date | N/A | N/A | N/A | N/A | N/A |
Name of Pool: | ProShares UltraShort Silver |
Type of Pool: | Public, Exchange-listed Commodity Pool |
Date of Inception of Trading: | December 1, 2008 |
Aggregate Gross Capital Subscriptions1 as of December 31, 2020 | $2,582,736,679 |
Aggregate Net Capital Subscriptions2 as of December 31, 2020 | $263,698,226 |
Net Asset Value as of December 31, 2020 | $28,885,775 |
Net Asset Value per Share3 as of December 31, 2020 | $6.93 |
Worst Monthly Loss:4 | -44.81% (July 2020) |
Worst Peak-to-Valley Loss:5 | -99.72% (Inception - December 2020) |
Rate of Return:6 | 2016 | 2017 | 2018 | 2019 | 2020 |
January | -5.29% | -12.52% | -4.21% | -6.80% | -2.04% |
February | -10.36% | -11.09% | 9.56% | 6.50% | 17.73% |
March | -9.47% | 1.26% | 1.93% | 6.31% | 18.38% |
April | -27.13% | 7.04% | -1.41% | 2.60% | -14.00% |
May | 22.15% | 0.55% | -2.14% | 5.22% | -36.62% |
June | -24.93% | 9.89% | 6.22% | -9.65% | -1.45% |
July | -18.65% | -4.92% | 7.90% | -13.11% | -44.81% |
August | 12.60% | -7.78% | 10.68% | -19.88% | -35.87% |
September | -8.04% | 4.97% | 4.91% | 12.25% | 39.57% |
October | 16.98% | 0.11% | -0.59% | -11.99% | -4.55% |
November | 10.18% | 2.91% | 1.20% | 12.60% | 6.08% |
December | 3.60% | -3.73% | -15.29% | -9.59% | -29.38% |
Annual | -42.24% | -14.97% | 17.05% | -27.94% | -74.10% |
Year-to-Date | N/A | N/A | N/A | N/A | N/A |
Name of Pool: | ProShares UltraShort Yen |
Type of Pool: | Public, Exchange-listed Commodity Pool |
Date of Inception of Trading: | November 24, 2008 |
Aggregate Gross Capital Subscriptions1 as of December 31, 2020 | $1,953,071,279 |
Aggregate Net Capital Subscriptions2 as of December 31, 2020 | $(172,602,767) |
Net Asset Value as of December 31, 2020 | $23,691,070 |
Net Asset Value per Share3 as of December 31, 2020 | $67.83 |
Worst Monthly Loss:4 | -13.65% (February 2016) |
Worst Peak-to-Valley Loss:5 | -36.16% (May 2015 - September 2016) |
Rate of Return:6 | 2016 | 2017 | 2018 | 2019 | 2020 |
January | 1.18% | -6.99% | -6.02% | -0.88% | -0.28% |
February | -13.65% | -1.08% | -4.36% | 5.17% | -1.06% |
March | -0.43% | -1.72% | -0.23% | -0.72% | -1.68% |
April | -11.15% | 0.19% | 5.87% | 1.61% | -0.28% |
May | 8.16% | -1.30% | -0.69% | -5.00% | 0.83% |
June | -13.59% | 3.24% | 4.01% | -0.51% | 0.14% |
July | -3.07% | -3.88% | 2.31% | 2.30% | -3.99% |
August | 2.67% | -0.42% | -0.85% | -4.33% | -0.07% |
September | -4.04% | 4.73% | 4.94% | 3.96% | -0.88% |
October | 6.83% | 2.26% | -0.96% | 0.18% | -1.53% |
November | 18.56% | -1.88% | 1.65% | 2.94% | -0.78% |
December | 4.42% | 0.58% | -6.16% | -0.89% | -2.14% |
Annual | -8.76% | -6.61% | -1.39% | 3.36% | -11.19% |
Year-to-Date | N/A | N/A | N/A | N/A | N/A |
Name of Pool: | ProShares VIX Mid-Term Futures ETF |
Type of Pool: | Public, Exchange-listed Commodity Pool |
Date of Inception of Trading: | January 3, 2011 |
Aggregate Gross Capital Subscriptions1 as of December 31, 2020 | $722,704,316 |
Aggregate Net Capital Subscriptions2 as of December 31, 2020 | $220,091,632 |
Net Asset Value as of December 31, 2020 | $72,075,095 |
Net Asset Value per Share3 as of December 31, 2020 | $36.73 |
Worst Monthly Loss:4 | -15.06% (March 2016) |
Worst Peak-to-Valley Loss:5 | -94.26% (September 2011 - September 2018) |
Rate of Return:6 | 2016 | 2017 | 2018 | 2019 | 2020 |
January | 8.60% | -12.29% | -0.14% | -11.93% | -0.69% |
February | 5.89% | -3.69% | 16.38% | -8.36% | 10.48% |
March | -15.06% | -10.39% | 7.55% | 0.62% | 65.97% |
April | 3.55% | -5.88% | -7.00% | -2.16% | 1.44% |
May | -6.39% | -2.30% | -6.44% | 8.04% | -0.13% |
June | 1.71% | -6.36% | -0.53% | -6.37% | 2.98% |
July | -8.54% | -8.17% | -6.61% | 1.09% | -1.80% |
August | -0.56% | 3.85% | -1.45% | 9.33% | 1.33% |
September | -3.24% | -3.77% | -2.95% | -0.75% | 1.96% |
October | -2.07% | -8.44% | 21.33% | -3.45% | 1.64% |
November | -4.58% | 1.65% | -5.13% | -2.19% | -13.82% |
December | -1.41% | -9.22% | 12.55% | -4.16% | 2.28% |
Annual | -21.91% | -49.47% | 25.17% | -20.21% | 72.71% |
Year-to-Date | N/A | N/A | N/A | N/A | N/A |
Name of Pool: | ProShares Managed Futures Strategya |
Type of Pool: | Public, Exchange-listed Commodity Pool |
Date of Inception Trading: | October 1, 2014 |
Aggregate Gross Capital Subscriptions1 as of March 30, 2016 | $19,699,612 |
Aggregate Net Capital Subscriptions2 as of March 30, 2016 | $7,378,135 |
Net Asset Value as of March 30, 2016 | $— |
Net Asset Value per Share3 as of March 30, 2016 | $— |
Worst Monthly Loss:4 | -3.56% (April 2015) |
Worst Peak-to-Valley Loss:5 | -7.96% (January 2015—March 2016) |
Rate of Return:6 | 2016 | 2017 | 2018 | 2019 | 2020 | 2021 |
January | -1.53% | N/A | N/A | N/A | N/A | N/A |
February | 1.62% | N/A | N/A | N/A | N/A | N/A |
March | -2.42% | N/A | N/A | N/A | N/A | N/A |
April | N/A | N/A | N/A | N/A | N/A | N/A |
May | N/A | N/A | N/A | N/A | N/A | N/A |
June | N/A | N/A | N/A | N/A | N/A | N/A |
July | N/A | N/A | N/A | N/A | N/A | N/A |
August | N/A | N/A | N/A | N/A | N/A | N/A |
September | N/A | N/A | N/A | N/A | N/A | N/A |
October | N/A | N/A | N/A | N/A | N/A | N/A |
November | N/A | N/A | N/A | N/A | N/A | N/A |
December | N/A | N/A | N/A | N/A | N/A | N/A |
Annual | N/A | N/A | N/A | N/A | N/A | N/A |
Year-to-Date | -2.36% | N/A | N/A | N/A | N/A | N/A |
Name of Pool: | ProShares Ultra Bloomberg Commoditya |
Type of Pool: | Public, Exchange-listed Commodity Pool |
Date of Inception of Trading: | November 24, 2008 |
Aggregate Gross Capital Subscriptions1 as of September 1, 2016 | $57,464,446 |
Aggregate Net Capital Subscriptions2 as of September 1, 2016 | $1,435,107 |
Net Asset Value as of September 1, 2016 | $— |
Net Asset Value per Share3 as of September 1, 2016 | $— |
Worst Monthly Loss:4 | -20.40% (July 2015) |
Worst Peak-to-Valley Loss:5 | -84.25% (April 2011—February 2016) |
Rate of Return:6 | 2016 | 2017 | 2018 | 2019 | 2020 | 2021 |
January | -3.71% | N/A | N/A | N/A | N/A | N/A |
February | -3.64% | N/A | N/A | N/A | N/A | N/A |
March | 7.39% | N/A | N/A | N/A | N/A | N/A |
April | 17.25% | N/A | N/A | N/A | N/A | N/A |
May | -0.72% | N/A | N/A | N/A | N/A | N/A |
June | 8.02% | N/A | N/A | N/A | N/A | N/A |
July | -10.28% | N/A | N/A | N/A | N/A | N/A |
August | 1.62% | N/A | N/A | N/A | N/A | N/A |
September | N/A | N/A | N/A | N/A | N/A | N/A |
October | N/A | N/A | N/A | N/A | N/A | N/A |
November | N/A | N/A | N/A | N/A | N/A | N/A |
December | N/A | N/A | N/A | N/A | N/A | N/A |
Annual | N/A | N/A | N/A | N/A | N/A | N/A |
Year-to-Date | 14.23% | N/A | N/A | N/A | N/A | N/A |
Name of Pool: | ProShares UltraPro 3x Crude Oil ETFa |
Type of Pool: | Public, Exchange-listed Commodity Pool |
Date of Inception of Trading: | March 24, 2017 |
Aggregate Gross Capital Subscriptions1 as of April 3, 2020 | $891,992,538 |
Aggregate Net Capital Subscriptions2 as of April 3, 2020 | $376,396,221 |
Net Asset Value as of April 3, 2020 | $— |
Net Asset Value per Share3 as of April 3, 2020 | $— |
Worst Monthly Loss:4 | -97.33% (March 2020) |
Worst Peak-to-Valley Loss:5 | -99.67% (September 2018—March 2020) |
Rate of Return:6 | 2016 | 2017 | 2018 | 2019 | 2020 | 2021 |
January | 21.88% | 58.31% | -40.24% | N/A | ||
February | -13.37% | 15.30% | -37.70% | N/A | ||
Marchb | 16.98% | 16.04% | 12.85% | -97.33% | N/A | |
April | -10.47% | 17.06% | 19.04% | N/A | N/A | |
May | -10.32% | -7.95% | -43.50% | N/A | N/A | |
June | -16.85% | 25.86% | 24.34% | N/A | N/A | |
July | 24.62% | -16.39% | -2.06% | N/A | N/A | |
August | -15.97% | 6.39% | -21.33% | N/A | N/A | |
September | 23.61% | 16.64% | -11.23% | N/A | N/A | |
October | 12.65% | -29.41% | 0.44% | N/A | N/A | |
November | 15.00% | -55.93% | 2.64% | N/A | N/A | |
December | 15.42% | -35.43% | 35.12% | N/A | N/A | |
Annual | 51.15% | -65.37% | 64.10% | N/A | N/A | |
Year-to-Date | N/A | N/A | N/A | N/A | -99.01% | N/A |
Name of Pool: | ProShares UltraPro 3x Short Crude Oil ETFa |
Type of Pool: | Public, Exchange-listed Commodity Pool |
Date of Inception of Trading: | March 24, 2017 |
Aggregate Gross Capital Subscriptions1 as of April 13, 2020 | $464,876,088 |
Aggregate Net Capital Subscriptions2 as of April 13, 2020 | $(81,065,469) |
Net Asset Value as of April 13, 2020 | $— |
Net Asset Value per Share3 as of April 13, 2020 | $— |
Worst Monthly Loss:4 | -42.29% (January 2019) |
Worst Peak-to-Valley Loss:5 | -89.93% (June 2017—December 2019) |
Rate of Return:6 | 2016 | 2017 | 2018 | 2019 | 2020 | 2021 |
January | -19.72% | -42.29% | 57.34% | N/A | ||
February | 10.44% | -16.88% | 47.11% | N/A | ||
Marchb | -15.37% | -17.91% | -13.66% | 84.56% | N/A | |
April | 8.31% | -18.40% | -18.72% | N/A | N/A | |
May | 2.69% | 2.79% | 61.35% | N/A | N/A | |
June | 12.44% | -25.26% | -26.77% | N/A | N/A | |
July | -24.62% | 12.74% | -4.90% | N/A | N/A | |
August | 12.49% | -9.50% | 7.38% | N/A | N/A | |
September | -21.91% | -16.69% | -15.78% | N/A | N/A | |
October | -14.52% | 33.47% | -3.92% | N/A | N/A | |
November | -15.95% | 90.61% | -9.40% | N/A | N/A | |
December | -15.95% | 19.22% | -28.09% | N/A | N/A | |
Annual | -57.67% | 17.63% | -78.59% | N/A | N/A | |
Year-to-Date | N/A | N/A | N/A | 327.18% | N/A |
Name of Pool: | ProShares UltraShort Bloomberg Commoditya |
Type of Pool: | Public, Exchange-listed Commodity Pool |
Date of Inception of Trading: | November 24, 2008 |
Aggregate Gross Capital Subscriptions1 as of September 1, 2016 | $95,173,249 |
Aggregate Net Capital Subscriptions2 as of September 1, 2016 | $1,803,800 |
Net Asset Value as of September 1, 2016 | $— |
Net Asset Value per Share3 as of September 1, 2016 | $— |
Worst Monthly Loss:4 | -15.82% (April 2016) |
Worst Peak-to-Valley Loss:5 | -29.14% (February 2016—June 2016) |
Rate of Return:6 | 2016 | 2017 | 2018 | 2019 | 2020 | 2021 |
January | 2.68% | N/A | N/A | N/A | N/A | N/A |
February | 2.49% | N/A | N/A | N/A | N/A | N/A |
March | -7.86% | N/A | N/A | N/A | N/A | N/A |
April | -15.82% | N/A | N/A | N/A | N/A | N/A |
May | -0.22% | N/A | N/A | N/A | N/A | N/A |
June | -8.44% | N/A | N/A | N/A | N/A | N/A |
July | 10.33% | N/A | N/A | N/A | N/A | N/A |
August | -2.25% | N/A | N/A | N/A | N/A | N/A |
September | N/A | N/A | N/A | N/A | N/A | N/A |
October | N/A | N/A | N/A | N/A | N/A | N/A |
November | N/A | N/A | N/A | N/A | N/A | N/A |
December | N/A | N/A | N/A | N/A | N/A | N/A |
Annual | N/A | N/A | N/A | N/A | N/A | N/A |
Year-to-Date | -19.58% | N/A | N/A | N/A | N/A | N/A |
TERMS OF THE TRUST AGREEMENT
Name | Position |
Michael L. Sapir | Chief Executive Officer and Principal of the Sponsor |
Louis M. Mayberg | Principal of the Sponsor |
William E. Seale | Principal of the Sponsor |
Sapir Family Trust | Principal of the Sponsor |
Northstar Trust | Principal of the Sponsor |
Timothy N. Coakley | Chief Financial Officer and Principal of the Sponsor |
Edward J. Karpowicz | Principal Financial Officer of the Trust and Principal of the Sponsor |
Todd B. Johnson* | Principal Executive Officer of the Trust and Chief Investment Officer and Principal of the Sponsor |
Hratch Najarian | Director, Portfolio Management and Principal of the Sponsor |
Alexander Ilyasov | Senior Portfolio Manager of the Sponsor |
James Linneman | Portfolio Manager of the Sponsor |
Benjamin McAbee | Portfolio Manager of the Sponsor |
Victor M. Frye | Principal of the Sponsor |
*
Fund | NAV Calculation Time |
ProShares Ultra VIX Short-Term Futures ETF | 4:00p.m. (Eastern Time) |
ProShares Short VIX Short-Term Futures ETF | 4:00p.m. (Eastern Time) |
ProShares VIX Short-Term Futures ETF | 4:00p.m. (Eastern Time) |
c/o ProShare Capital Management LLC
7501 Wisconsin Avenue
Suite 1000E
Bethesda, Maryland 20814
Telephone: (240) 497-6400
1933 Act | Securities Act of 1933, as amended |
1934 Act | Securities Exchange Act of 1934, as amended |
1940 Act | Investment Company Act of 1940, as amended |
Administrator | The Bank of New York Mellon, as administrator for the Funds |
Advisers Act | The Investment Advisers Act of 1940 |
Authorized Participant | Those who may purchase (i.e., create) or redeem Creation Units directly from the Funds |
Authorized Participant Agreement | The agreement that is entered into between an Authorized Participant, the Sponsor and the Trust that allows an Authorized Participant to purchase or redeem Creation Units directly from the Funds |
Authorized Participant Procedures Handbook | A handbook that details the procedures for placing and processing Purchase Orders and Redemption Orders in Creation Units |
BNYM | The Bank of New York Mellon |
Business Day | Any day on which the NAV of a specified Fund is determined. |
Cboe | Chicago Board Options Exchange, Incorporated |
CBOT | Chicago Board of Trade |
CEA | Commodity Exchange Act, as amended |
CFE | Cboe Futures Exchange |
CFTC | United States Commodity Futures Trading Commission |
CME | Chicago Mercantile Exchange |
Code | Internal Revenue Code of 1986, as amended |
Creation Unit | A block of 25,000 or 50,000 Shares, as applicable, that is created for sale by the Trust to Authorized Participants and/or submitted to the Trust for redemption by an Authorized Participant. |
Custodian | The Bank of New York Mellon, as custodian for the Funds |
Distributor | SEI Investments Distribution Co., as distributor for the Funds |
Dodd-Frank Act | Dodd-Frank Wall Street Reform and Consumer Protection Act |
DSTA | Delaware Statutory Trust Act |
DTC | Depository Trust Company |
EU | European Union |
Exchange | The exchange on which a Fund is primarily listed and traded ( i.e., Cboe BZX Exchange, Inc.). |
FCM | Futures Commission Merchant |
Financial Instruments | Instruments whose value is derived from the value of an an equity market volatility index, including futures contracts, swap agreements, forward contracts, option contracts, and other instruments. |
FINRA | Financial Industry Regulatory Authority, Inc. |
Fund(s) | One or more of the series of the Trust offered herein. |
Geared Fund(s) | The Short Fund and/or the Ultra Fund |
ICE | Intercontinental Exchange |
Index | S&P 500 VIX Short-Term Futures Index |
IRS | United States Internal Revenue Service |
Matching Fund | ProShares VIX Short-Term Futures ETF |
NAV | Net Asset Value |
NFA | National Futures Association |
NSCC | National Securities Clearing Corporation |
1933 Act | Securities Act of 1933, as amended |
NYMEX | New York Mercantile Exchange |
NYSE | New York Stock Exchange |
NYSE Arca | NYSE Arca Equities, Inc. |
Other Fund | A series of the Trust that is not being offered pursuant to this Prospectus. |
PDI | ProFunds Distributors, Inc. |
PTP | Publicly-traded partnership |
Reference Asset | The underlying asset that is used to determine the value of a Financial Instrument |
Regulations | The income tax regulations promulgated under the Code. |
S&P | Standard & Poor’s |
SEC | United States Securities & Exchange Commission |
SEI | SEI Investments Distribution Co. |
Shares | Common units of beneficial interest that represent units of fractional undivided beneficial interest in and ownership of a Fund. |
Short Fund | ProShares Short VIX Short-Term Futures ETF |
Sponsor | ProShare Capital Management LLC |
Title VII | Title VII of the Dodd-Frank Act. |
Transfer Agent | The Bank of New York Mellon, as transfer agent for the Funds |
Trust | ProShares Trust II |
Trust Agreement | The Amended and Restated Trust Agreement of ProShares Trust II, as amended by Amendment No. 1 |
Trustee | Wilmington Trust Company |
U.S. | United States of America |
Ultra Fund | ProShares Ultra VIX Short-Term Futures ETF |
VIX | Cboe Volatility Index |
VIX Index | Cboe Volatility Index |

PART II
Information Not Required in Prospectus
| Item 14. | Other Expenses of Issuance and Distribution. |
The following chart reflects estimated amounts required to prepare and file this Registration Statement and complete the offering of the Shares registered hereby.
| Approximate Amount* | ||||
Securities and Exchange Commission Registration Fee* | $ | 892,443 | ||
FINRA Filing Fee | $ | 0 | ||
Printing Expenses | $ | 15,000 | ||
Fees of Certified Public Accountants | $ | 7,500 | ||
Fees of Counsel | $ | 15,000 | ||
|
| |||
Total | $ | 929,943 | ||
|
| |||
| * | Paid in connection with the Registration Statement on Form S-3 (File No. 333-238175), which was declared effective by the Securities and Exchange Commission (the “SEC”) on September 9, 2020, and the Registration Statement on Form S-3 (File No. 333- ), which was filed with the SEC on . |
| Item 15. | Indemnification of Directors and Officers. |
The amended and restated Trust Agreement of the Trust provides for, and as amended from time-to-time, will provide for, the indemnification of the Sponsor. The Sponsor (including Covered Persons as will be provided under each amended and restated Trust Agreement) shall be indemnified by the Trust (or any Fund separately to the extent the matter in question relates to a single Fund or is otherwise disproportionate), against any losses, judgments, liabilities, expenses and amounts paid in settlement of any claims sustained by it in connection with the defense or disposition of any action, suit or other proceeding, whether civil or criminal, before any court or administrative or legislative body, in which such Sponsor may be or may have been involved as a party or otherwise or with which such Sponsor may be or may have been threatened, while in office or thereafter, by reason of any alleged act or omission as the Sponsor or by reason of his or her being or having been the Sponsor except with respect to any matter as to which such Sponsor shall have been finally adjudicated in any such action, suit or other proceeding not to have acted in good faith in the reasonable belief that such Sponsor’s action was in the best interests of the Trust and except that the Sponsor shall not be indemnified against any liability to the Trust or its Shareholders by reason of willful misconduct or gross negligence of such Sponsor.
| Item 16. | Exhibits. |
The following documents (unless otherwise indicated) are filed herewith and made a part of this Registration Statement:
| (a) | Exhibits. The following exhibits are filed herewith: |
II-1
| (1) | Incorporated by reference to the Trust’s Registration Statement, filed on September 18, 2008. |
| (2) | Incorporated by reference to the Trust’s Registration Statement, filed on November 17, 2008. |
| (3) | Incorporated by reference to the Trust’s Registration Statement, filed on August 15, 2008. |
| (4) | Incorporated by reference to the Trust’s Form 8-K, filed on September 26, 2018. |
| (5) | Incorporated by reference to the Trust’s Registration Statement filed, on September 16, 2011. |
| (6) | Incorporated by reference to the Trust’s Registration Statement, filed on March 6, 2020. |
| (b) | Financial Statements. No financial statements are filed herewith. |
| Item 17. | Undertakings. |
| (a) | The undersigned registrant hereby undertakes: |
| (1) | To file, during any period in which offers or sales are being made, a post-effective amendment to this registration statement; |
| (i) | To include any prospectus required by section 10(a)(3) of the Securities Act of 1933, as amended; |
| (ii) | To reflect in the prospectus any facts or events arising after the effective date of the registration statement (or the most recent post-effective amendment thereof) which, individually or in the aggregate, represent a fundamental change in the information set forth in the registration statement. |
Notwithstanding the foregoing, any increase or decrease in volume of securities offered (if the total dollar value of securities offered would not exceed that which was registered) and any deviation from the low or high end of the estimated maximum offering range may be reflected in the form of prospectus filed with the Commission pursuant to Rule 424(b) if, in the aggregate, the changes in volume and price represent no more than a 20 per cent change in the maximum aggregate offering price set forth in the “Calculation of Registration Fee” table in the effective registration statement;
| (iii) | To include any material information with respect to the plan of distribution not previously disclosed in the registration statement or any material change to such information in the registration statement; |
Provided, however, that paragraphs (a)(1)(i), (a)(1)(ii) and (a)(1)(iii) of this section do not apply if the registration statement is on Form S–3 or Form F–3 and the information required to be included in a post-effective amendment by those paragraphs is contained in reports filed with or furnished to the Commission by the registrant pursuant to section 13 or section 15(d) of the Securities Exchange Act of 1934 that are incorporated by reference in the registration statement, or is contained in a form of prospectus filed pursuant to Rule 424(b) that is part of the registration statement.
| (2) | That, for the purpose of determining any liability under the Securities Act of 1933, each such post-effective amendment shall be deemed to be a new registration statement relating to the securities offered therein, and the offering of such securities at that time shall be deemed to be the bona fide offering thereof. |
| (3) | To remove from registration by means of a post-effective amendment any of the securities being registered which remain unsold at the termination of the offering. |
| (4) | That, for the purpose of determining liability under the Securities Act of 1933 to any purchaser: |
| (i) | If the registrant is relying on Rule 430B: |
(A) Each prospectus filed by the registrant pursuant to Rule 424(b)(3) shall be deemed to be a part of the registration statement as of the date the filed prospectus was deemed part of and included in the registration statement; and
II-2
(B) Each prospectus required to be filed pursuant to Rule 424(b)(2), (b)(5), or (b)(7) as part of a registration statement in reliance on Rule 430B relating to an offering made pursuant to Rule 415(a)(1)(i), (vii), or (x) for the purpose of providing the information required by section 10(a) of the Securities Act of 1933 shall be deemed to be part of and included in the registration statement as of the earlier of the date such form of prospectus is first used after effectiveness or the date of the first contract of sale of securities in the offering described in the prospectus. As provided in Rule 430B, for liability purposes of the issuer and any person that is at that date an underwriter, such date shall be deemed to be a new effective date of the registration statement relating to the securities in the registration statement to which that prospectus relates, and the offering of such securities at that time shall be deemed to be the initial bona fide offering thereof. Provided, however, that no statement made in a registration statement or prospectus that is part of the registration statement or made in a document incorporated or deemed incorporated by reference into the registration statement or prospectus that is part of the registration statement will, as to a purchaser with a time of contract of sale prior to such effective date, supersede or modify any statement that was made in the registration statement or prospectus that was part of the registration statement or made in any such document immediately prior to such effective date.
| (5) | That, for the purpose of determining liability of the registrant under the Securities Act of 1933 to any purchaser in the initial distribution of the securities: |
The undersigned registrant undertakes that in a primary offering of securities of the undersigned registrant pursuant to this registration statement, regardless of the underwriting method used to sell the securities to the purchaser, if the securities are offered or sold to such purchaser by means of any of the following communications, the undersigned registrant will be a seller to the purchaser and will be considered to offer or sell such securities to such purchaser:
| (i) | Any preliminary prospectus or prospectus of the undersigned registrant relating to the offering required to be filed pursuant to Rule 424; |
| (ii) | Any free writing prospectus relating to the offering prepared by or on behalf of the undersigned registrant or used or referred to by the undersigned registrant; |
| (iii) | The portion of any other free writing prospectus relating to the offering containing material information about the undersigned registrant or their securities provided by or on behalf of the undersigned registrant; and |
| (iv) | Any other communication that is an offer in the offering made by the undersigned registrant to the purchaser. |
| (b) | The undersigned registrant hereby undertakes that, for purposes of determining any liability under the Securities Act of 1933, each filing of the registrant’s annual report pursuant to Section 13(a) or Section 15(d) of the Securities Exchange Act of 1934 (and, where applicable, each filing of an employee benefit plan’s annual report pursuant to Section 15(d) of the Securities Exchange Act of 1934) that is incorporated by reference in the registration statement shall be deemed to be a new registration statement relating to the securities offered therein, and the offering of such securities at that time shall be deemed to be the initial bona fide offering thereof. |
| (c) | Insofar as indemnification for liabilities under the Securities Act of 1933 may be permitted to directors, officers or persons controlling the registrant pursuant to the provisions described in Item 15 above, or otherwise, the registrant has been informed that in the opinion of the Securities and Exchange Commission such indemnification is against public policy as expressed in the Act and is, therefore, unenforceable. In the event that a claim for indemnification against such liabilities (other than the payment by the registrant of expenses incurred or paid by a director, officer or controlling person of the registrant in the successful defense of any such action, suit or proceeding) is asserted by such director, officer or controlling person in connection with the securities being registered, the registrant will, unless in the opinion of their respective counsel the matter has been settled by controlling precedent, submit to a court of appropriate jurisdiction the question whether such indemnification by it is against public policy as expressed in the Act and will be governed by the final adjudication of such issue. |
II-3
Pursuant to the requirements of the Securities Act of 1933, the Registrant has duly caused this Registration Statement on Form S-3 to be signed on its behalf by the undersigned, thereunto duly authorized, in the city of Bethesda, State of Maryland, on the 12th day of February, 2021.
| ProShares Trust II | ||
| By: | /s/ Todd B. Johnson | |
| Name: | Todd B. Johnson | |
| Title: | Principal Executive Officer | |
Pursuant to the requirements of the Securities Act of 1933, this Registration Statement on Form S-3 has been signed by the following persons in the capacities and on the date indicated.
/s/ Todd B. Johnson
Name: Todd B. Johnson | Principal Executive Officer | February 12, 2021 | ||
/s/ Edward Karpowicz
Name: Edward Karpowicz | Principal Financial Officer Principal Accounting Officer | February 12, 2021 | ||
Each of the undersigned members of ProShare Capital Management LLC, the sponsor of the Registrant, hereby constitutes Todd B. Johnson, Richard F. Morris, and Robert J. Borzone, Jr., individually and not jointly, his true and lawful attorneys-in-fact and agents, with full power of substitution and resubstitution, for him and in his name, place and stead, in any and all capacities, to sign under the Securities Act of 1933, as amended (including post-effective amendments to the registration statement and any such related registration statements), and to file the same, with all exhibits thereto, and any other documents in connection therewith, granting unto said attorneys-in-fact and agents full power and authority to do and perform each and every act and thing requisite and necessary to be done in and about the premises, as fully to all intents and purposes as he might or could do in person, hereby ratifying and confirming that said attorneys-in-fact and agents, or their substitute or substitutes, may lawfully do or cause to be done by virtue hereof.
Pursuant to the requirements of the Securities Act of 1933, this Registration Statement on Form S-3 has been signed by the following persons on behalf of the Sponsor in the capacities and on the date indicated.
/s/ Louis M. Mayberg
Name: Louis M. Mayberg | Member of the Sponsor (Director) | February 12, 2021 | ||
/s/ Michael L. Sapir
Name: Michael L. Sapir | Member of the Sponsor (Director) | February 12, 2021 | ||
II-4