UNITED STATES
SECURITIES AND EXCHANGE COMMISSION
Washington, D.C. 20549
| | | | | |
| ☒ | ANNUAL REPORT PURSUANT TO SECTION 13 OR 15(d) OF THE SECURITIES EXCHANGE ACT OF 1934 |
For the fiscal year ended December 31, 2024
OR | | | | | |
| ☐ | TRANSITION REPORT PURSUANT TO SECTION 13 OR 15(d) OF THE SECURITIES EXCHANGE ACT OF 1934 |
For the transition period from to
Commission File Number: 001-34177 Warner Bros. Discovery, Inc.
(Exact name of Registrant as specified in its charter)
| | | | | | | | | | | |
| Delaware | | 35-2333914 |
(State or other jurisdiction of
incorporation or organization) | | (I.R.S. Employer
Identification No.) |
| | |
| 230 Park Avenue South | | 10003 |
| New York, New York | | (Zip Code) |
| (Address of principal executive offices) | | |
(212) 548-5555
(Registrant’s telephone number, including area code)
Securities registered pursuant to Section 12(b) of the Act:
| | | | | | | | |
| Title of Each Class | Trading Symbols | Name of Each Exchange on Which Registered |
| Series A Common Stock | WBD | The Nasdaq Global Select Market |
| 4.302% Senior Notes due 2030 | WBDI30 | The Nasdaq Global Market |
| 4.693% Senior Notes due 2033 | WBDI33 | The Nasdaq Global Market |
Securities registered pursuant to Section 12(g) of the Act:
None
Indicate by check mark if the Registrant is a well-known seasoned issuer, as defined in Rule 405 of the Securities Act. Yes ý No ¨
Indicate by check mark if the Registrant is not required to file reports pursuant to Section 13 or Section 15(d) of the Act. Yes ¨ No ý
Indicate by check mark whether the Registrant (1) has filed all reports required to be filed by Section 13 or 15(d) of the Securities Exchange Act of 1934 during the preceding 12 months (or for such shorter period that the Registrant was required to file such reports), and (2) has been subject to such filing requirements for the past 90 days. Yes ý No ¨
Indicate by check mark whether the Registrant has submitted electronically every Interactive Data File required to be submitted pursuant to Rule 405 of Regulation S-T (§232.405 of this chapter) during the preceding 12 months (or for such shorter period that the Registrant was required to submit such files). Yes ý No ¨
Indicate by check mark whether the Registrant is a large accelerated filer, an accelerated filer, a non-accelerated filer, smaller reporting company or an emerging growth company. See the definitions of “large accelerated filer,” “accelerated filer,” “smaller reporting company,” and “emerging growth company” in Rule 12b-2 of the Exchange Act. | | | | | | | | | | | | | | | | | | | | |
| | | | | | |
| Large accelerated filer | | ý | | Accelerated filer | | ☐ |
| | | |
| Non-accelerated filer | | ☐ | | Smaller reporting company | | ☐ |
| | | | | | |
| | | | Emerging growth company | | ☐ |
If an emerging growth company, indicate by check mark if the registrant has elected not to use the extended transition period for complying with any new or revised financial accounting standards provided pursuant to Section 13(a) of the Exchange Act. ¨
Indicate by check mark whether the registrant has filed a report on and attestation to its management’s assessment of the effectiveness of its internal control over financial reporting under Section 404(b) of the Sarbanes-Oxley Act (15 U.S.C. 7262(b)) by the registered public accounting firm that prepared or issued its audit report. ☒
If securities are registered pursuant to Section 12(b) of the Act, indicate by check mark whether the financial statements of the registrant included in the filing reflect the correction of an error to previously issued financial statements. ¨
Indicate by check mark whether any of those error corrections are restatements that required a recovery analysis of incentive-based compensation received by any of the registrant’s executive officers during the relevant recovery period pursuant to §240.10D-1(b). ¨
Indicate by check mark whether the Registrant is a shell company (as defined in Rule 12b-2 of the Exchange Act). Yes ☐ No ý
The aggregate market value of voting and non-voting common stock held by non-affiliates of the Registrant computed by reference to the last sales price of such stock, as of the last business day of the Registrant’s most recently completed second fiscal quarter, which was June 30, 2024, was approximately $18 billion.
Total number of shares outstanding of each class of the Registrant’s common stock as of February 13, 2025 was:
| | | | | |
| Series A Common Stock, par value $0.01 per share | 2,454,764,337 | |
DOCUMENTS INCORPORATED BY REFERENCE
Certain information required in Item 10 through Item 14 of Part III of this Annual Report on Form 10-K is incorporated herein by reference to the Registrant’s definitive Proxy Statement for its 2025 Annual Meeting of Stockholders, which shall be filed with the Securities and Exchange Commission pursuant to Regulation 14A of the Securities Exchange Act of 1934, as amended.
WARNER BROS. DISCOVERY, INC.
FORM 10-K
TABLE OF CONTENTS
PART I
CAUTIONARY NOTE CONCERNING FORWARD-LOOKING STATEMENTS
Certain statements in this Annual Report on Form 10-K constitute forward-looking statements within the meaning of the Private Securities Litigation Reform Act of 1995, including statements regarding our business, marketing and operating strategies, integration of acquired businesses, new product and service offerings, financial prospects and anticipated sources and uses of capital. Words such as “anticipate,” “assume,” “believe,” “continue,” “estimate,” “expect,” “forecast,” “future,” “intend,” “plan,” “potential,” “predict,” “project,” “strategy,” “target” and similar terms, and future or conditional tense verbs like “could,” “may,” “might,” “should,” “will” and “would,” among other terms of similar substance used in connection with any discussion of future operating or financial performance identify forward-looking statements. Where, in any forward-looking statement, we express an expectation or belief as to future results or events, such expectation or belief is expressed in good faith and believed to have a reasonable basis, but there can be no assurance that the expectation or belief will result or be accomplished. The following is a list of some, but not all, of the factors that could cause actual results or events to differ materially from those anticipated:
•more intense competitive pressure from existing or new competitors in the industries in which we operate;
•reduced spending on domestic and foreign television advertising, due to macroeconomic, industry or consumer behavior trends or unexpected reductions in our number of subscribers;
•uncertainties associated with product and service development and market acceptance, including the development and provision of programming for new television and telecommunications technologies, and the success of our streaming services;
•market demand for foreign first-run and existing content libraries;
•negative publicity or damage to our brands, reputation or talent;
•realizing direct-to-consumer subscriber goals;
•disagreements with our distributors or other business partners;
•continued consolidation of distribution customers and production studios;
•industry trends, including the timing of, and spending on, sports programming, feature film, television and television commercial production;
•the possibility or duration of an industry-wide strike, such as the strikes of the Writers Guild of America (“WGA”) and Screen Actors Guild-American Federation of Television and Radio Artists (“SAG-AFTRA”) in 2023, player lock-outs or other job action affecting a major entertainment industry union, athletes or others involved in the development and production of our sports programming, television programming, feature films and interactive entertainment (e.g., games) who are covered by collective bargaining agreements;
•inherent uncertainties involved in the estimates and assumptions used in the preparation of financial forecasts;
•our level of debt, including the significant indebtedness incurred in connection with the acquisition of the WarnerMedia Business, and our future compliance with debt covenants;
•changes to our corporate or debt-specific credit ratings or outlook;
•unforeseen costs, execution risks, and operational challenges related to our efforts to integrate the WarnerMedia Business;
•changes in, or failure or inability to comply with, laws and government regulations, including, without limitation, regulations of the U.S. government and other international governments, the Federal Communications Commission and similar authorities internationally and data privacy regulations;
•adverse outcomes of legal proceedings or disputes, including those related to our acquisition of the WarnerMedia Business, or adverse outcomes from regulatory proceedings;
•threatened or actual cyber-attacks and cybersecurity breaches;
•theft of our content and unauthorized duplication, distribution and exhibition of such content; and
•general economic and business conditions, fluctuations in foreign currency exchange rates, global events such as pandemics, natural disasters impacting the geographic areas where our businesses and operations are located, and political uncertainty or unrest in the markets in which we operate.
Forward-looking statements are subject to various risks and uncertainties which change over time, are based on management’s expectations and assumptions at the time the statements are made and are not guarantees of future results.
These risks have the potential to impact the recoverability of the assets recorded on our balance sheets, including goodwill and other intangibles. Management’s expectations and assumptions, and the continued validity of any forward-looking statements we make, cannot be foreseen with certainty and are subject to change due to a broad range of factors affecting the U.S. and global economies and regulatory environments, factors specific to Warner Bros. Discovery and other factors described under Item 1A, “Risk Factors” and elsewhere in this Annual Report on Form 10-K, including under Item 7, “Management’s Discussion and Analysis of Financial Condition and Results of Operations.”
Actual outcomes and results may differ materially from what is expressed in our forward-looking statements and from our historical financial results due to the factors discussed in this section and elsewhere in this Annual Report on Form 10-K or disclosed in our other SEC filings. These forward-looking statements and such risks, uncertainties, and other factors speak only as of the date of this Annual Report on Form 10-K, and we expressly disclaim any obligation or undertaking to disseminate any updates or revisions to any forward-looking statement contained herein, to reflect any change in our expectations with regard thereto, or any other change in events, conditions or circumstances on which any such statement is based.
ITEM 1. Business.
For convenience, the terms “Warner Bros. Discovery”, “WBD”, the “Company,” “we,” “us” or “our” are used in this Annual Report on Form 10-K to refer to both Warner Bros. Discovery, Inc. and collectively to Warner Bros. Discovery, Inc. and one or more of its consolidated subsidiaries, unless the context otherwise requires.
Industry Trends
The WGA and SAG-AFTRA went on strike in May and July 2023, respectively, following the expiration of their respective collective bargaining agreements with the Alliance of Motion Picture and Television Producers (“AMPTP”). The WGA strike ended on September 27, 2023, and a new collective bargaining agreement was ratified on October 9, 2023. The SAG-AFTRA strike ended on November 9, 2023, and a new collective bargaining agreement was ratified on December 5, 2023.
The strikes had a material impact on the operations and results of the Company in 2023, including a pause on certain theatrical and television productions. Effects included a positive impact on cash flow from operations attributed to delayed production spend, and a negative impact on the results of operations attributed to timing and performance of the 2023 film slate, as well as the Company’s ability to produce, license, and deliver content. The Company experienced content completion and delivery delays in the first quarter of 2024 due to the pause in television and theatrical productions in 2023, but did not experience any material impacts for the remainder of 2024.
Other headwinds in the industry, such as continued pressures on linear distribution and continued softness in the U.S. linear advertising market, have had, and are expected to continue to have, a material impact on the operations and results of the Company, including a negative impact on the results of operations attributed to declines in linear advertising revenue. In addition, declines in linear subscribers are expected to continue. The increase of digital advertising available in the marketplace has also resulted in, and is expected to continue to result in, increased competition for advertising expenditures for both traditional linear networks and ad-supported tiers in streaming services.
We continue to closely monitor the ongoing impact of industry trends to our business; however, the full effects on our operations and results will depend on future developments, which are highly uncertain and cannot be predicted.
Description of Business
Warner Bros. Discovery is a leading global media and entertainment company that creates and distributes a differentiated and comprehensive portfolio of content and products across television, film, streaming, interactive gaming, publishing, themed experiences, and consumer products through brands including: Discovery Channel, Max, CNN, DC Studios, TNT Sports, HBO, Food Network, TLC, TBS, Warner Bros. Motion Picture Group, Warner Bros. Television Group, Warner Bros. Games, Adult Swim, Turner Classic Movies, and others.
We are home to one of the largest collections of owned content in the world with assets and intellectual property across sports, news, lifestyle, and entertainment in most languages and regions of the globe. We create some of the best-in-class content using our renowned library, beloved franchises, and acclaimed creative expertise to serve our audiences and consumers. Our asset mix strongly positions us to execute our key strategies: grow our direct-to-consumer (“DTC”) business globally, enhance our Studios segment, and manage our linear networks for the best possible success in order to create long-term value for our shareholders.
We generate revenue from fees charged to distributors that carry our network brands and programming, including cable, direct-to-home (“DTH”) satellite, telecommunication and digital service providers, as well as through DTC subscription services (distribution revenue); the sale of advertising on our networks and digital platforms (advertising revenue); the release of feature films for initial exhibition in theaters, the licensing of feature films and television programs to various television, subscription video on demand (“SVOD”) and other digital markets, distribution of feature films and television programs in the physical and digital home entertainment markets, sales of console games and mobile in-game content, sublicensing of sports rights, and licensing of intellectual property such as characters and brands (content revenue); and other sources such as studio tours and production services (other revenue).
Corporate Reorganization
On December 12, 2024, the Company announced that its board of directors had authorized the Company to implement a new corporate structure designed to enhance the Company’s strategic flexibility and create potential opportunities to unlock shareholder value. Under the new corporate structure, the Company will serve as the parent company for two distinct operating divisions: Global Linear Networks and Streaming & Studios. To facilitate the implementation of this new structure and the movement of entities and assets to align with the new operating divisions, on January 1, 2025, the Company completed certain transactions, including (1) a merger of Discovery Holding Company with and into a newly formed subsidiary of WarnerMedia Holdings, Inc. (the “DHC Merger”) and (2) a merger of a second newly formed subsidiary of WarnerMedia Holdings, Inc. with and into Scripps Networks Interactive, Inc. (the “Scripps Merger”). As a result of the DHC Merger, Discovery Communications, LLC became an indirect subsidiary of WarnerMedia Holdings, Inc. As a result of the Scripps Merger, Scripps Networks Interactive, Inc. became a direct subsidiary of WarnerMedia Holdings, Inc.
Segments
As of December 31, 2024, we classified our operations in three reportable segments:
•Studios - Our Studios segment primarily consists of the production and release of feature films for initial exhibition in theaters, production and initial licensing of television programs to our networks/DTC services as well as third parties, distribution of our films and television programs to various third party and internal television and streaming services, distribution through the home entertainment market (physical and digital), related consumer products and themed experience licensing, and interactive gaming.
•Networks - Our Networks segment primarily consists of our domestic and international television networks.
•DTC - Our DTC segment primarily consists of our premium pay-TV and streaming services.
Our segment presentation aligns with our management structure and the financial information management uses to make decisions about operating matters, such as the allocation of resources and business performance assessments. Financial information for our segments and the geographical areas in which we do business is set forth in Item 7, “Management’s Discussion and Analysis of Financial Condition and Results of Operations” and Note 23 to the consolidated financial statements included in Item 8, “Financial Statements and Supplementary Data” in this Annual Report on Form 10-K.
Studios
WBD’s Studios business includes the Warner Bros. Motion Picture Group (“WBMPG”), DC Studios, Warner Bros. Television Group (“WBTVG”), Consumer Products, Themed Entertainment and Brand Licensing, DC Comics Publishing, Content Licensing, Home Entertainment, Studio Operations, and Interactive Gaming.
WBMPG is comprised of Warner Bros. Pictures, New Line Cinema, and Warner Bros. Pictures Animation. WBMPG partners with captivating storytellers to create filmed entertainment for a global audience.
DC Studios, tasked with developing properties licensed from DC Comics for film, television, animation, and games, continues the tradition of high-quality storytelling within the DC Universe, while building a sustainable growth business out of the iconic characters.
WBTVG consists of Warner Bros. Television, the Company’s flagship television production unit for live-action scripted programming, as well as Warner Bros. Unscripted Television, which produces unscripted and alternative programming through its four production units – Warner Horizon Unscripted Television, Telepictures, Warner Bros. International Television Production, and Shed Media. WBTVG also includes Warner Bros. Animation, Cartoon Network Studios, and Hanna-Barbera Studios Europe.
Among the Studios segment’s content highlights for 2024 were Dune: Part Two, Beetlejuice, Beetlejuice and Godzilla x Kong: The New Empire on the film side, with Warner Bros. Discovery becoming the first studio to cross the $1 billion mark at the worldwide box office that year. Award-winning TV titles for 2024 include Abbott Elementary, Shrinking, and The Voice. As of December 31, 2024, the new series The Penguin remains one of the most-watched debut seasons globally of any current HBO or Max show, behind only House of the Dragon and The Last of Us.
Beyond its production operations, the Studios segment includes various businesses that facilitate consumer interaction with the intellectual property it creates.
Global Consumer Products, Themed Entertainment and Brand Licensing, and world-renowned comic and publishing powerhouse DC Comics, all drive opportunities for consumers to engage with WBD’s leading entertainment brands and franchises.
Global distribution of most of WBD’s content is handled by Content Sales, which provides content for viewers across streaming, cable, satellite and broadcast networks, local television stations, and airlines. Warner Bros. Home Entertainment oversees the global distribution of content through physical goods (Blu-ray Disc™ and DVD) and digital media in the form of electronic sell-through and video-on-demand via cable, satellite, online, and mobile channels.
The Studios segment also includes Warner Bros. Games, a worldwide publisher, developer, licensor, and distributor of content for the interactive space across all platforms, including console, handheld, mobile, and PC-based gaming for both internal and third-party game titles.
In September 2024, WBD announced a new global structure for the Company’s worldwide studio tours, retail destinations, touring exhibitions, and all location-based experiences. WBD Global Experiences brings together the previous Global Themed Entertainment licensing group and the Studio Tours & Retail owned and operated group into a single worldwide division to develop and execute on global strategies that offer partners a mix of both group models, putting WBD in a position to drive growth and become a worldwide leader in the creation, development, licensing, and operation of location-based entertainment inspired by Harry Potter, DC, Looney Tunes, Scooby-Doo, Game of Thrones, Friends, Discovery and more.
For the year ended December 31, 2024, content and other revenues were 92% and 8%, respectively, of total revenues for this segment.
Networks
WBD’s linear network operations include general entertainment, lifestyle, and news networks in the U.S., as well as a host of international media networks and global sports networks.
General and lifestyle entertainment networks in the U.S. include TNT, TBS, Turner Classic Movies, OWN, HGTV, Food Network, TLC, Discovery Channel and Adult Swim, among many others.
In 2024, CNN, our global news brand, launched CNN International in Europe on Max, giving audiences the ability to access a combination of on-air CNN content and exclusive programming on WBD’s streaming service in Spain, Nordics, Belgium, Netherlands, and Central and Eastern Europe.
TNT Sports is a global leader in the delivery of premium sports content. The TNT Sports U.S. portfolio includes expansive, multi-platform partnerships with the National Basketball Association (“NBA”), Major League Baseball, the National Collegiate Athletic Association (“NCAA”) Division I Men’s Basketball Championship, National Hockey League, United States Soccer Federation, Unrivaled, National Association for Stock Car Auto Racing, Roland-Garros, NCAA Big 12 Football and Men’s Basketball, and NCAA Big East Men’s and Women’s Basketball. Additionally, TNT Sports co-manages NCAA.com and NCAA March Madness Live, along with NBA Digital including NBA TV, the NBA App and NBA.com. Bleacher Report and House of Highlights, digital destinations for young adult sports fans, are owned and operated by TNT Sports. In March 2024, TNT Sports also premiered a primetime sports programming block on truTV consisting of live sports, original sports shows, and ancillary sports content.
TNT Sports in the United Kingdom and Ireland includes live coverage of Australian Open and Roland-Garros tennis; Grand Tour cycling; the Union Cycliste Internationale Mountain Bike World Series; World Championship and World Cup winter sports events; British and World Superbikes; snooker; Olympic Games 2026-2032; Premier League; Union of European Football Associations club football; Premiership men’s and women’s rugby; MotoGP; international cricket; Ultimate Fighting Championship and boxing, which are all available on TNT Sports and its streaming home, discovery+.
TNT Sports’ owned-and-operated platforms include Bleacher Report, Eurosport.com, House of Highlights, Golf Digest, and a full suite of digital and social brands.
For the year ended December 31, 2024, distribution, advertising, content, and other revenues were 53%, 36%, 9%, and 2%, respectively, of total revenues for this segment.
DTC
WBD’s DTC business includes our streaming services, such as Max and discovery+, and premium pay-TV services, such as HBO. Our streaming services are available on most mobile and connected TV devices. As of December 31, 2024, we had 116.9 million DTC subscribers1. Our strong subscriber growth this year has driven increased revenue and profitability for the DTC segment. In 2025 and 2026, we anticipate additional launches of our streaming services in major markets.
HBO is one of the most respected and innovative entertainment brands in the world, serving iconic, award-winning programming through the HBO linear channels and our DTC streaming service, Max. In 2024, HBO’s crime drama The Penguin earned positive reviews and grew its premiere-night audience by 54% from debut to finale. The Penguin also earned Colin Farrell a Golden Globe Award in the category for Best Performance by a Male Actor in a Limited Series, Anthology Series, or a Motion Picture Made for Television. Another standout was True Detective: Night Country, which became the series’ most watched season, receiving 19 Emmy nominations and one win for Jodie Foster’s performance. New HBO series highlights include Dune: Prophecy and Like Water for Chocolate, both of which have already been renewed for a second season. Other hit HBO series that returned to critical acclaim in 2024 included House of the Dragon and Hacks, a Golden Globe winner for Best Television Series - Musical or Comedy.
Max is a streaming destination for a variety of programming including HBO Originals, Warner Bros. films, Max Originals, the DC universe, the Wizarding World of Harry Potter, CNN, and programming across food, home, reality, lifestyle, and documentaries from leading brands like HGTV, Food Network, Discovery Channel, and more. Our strategy to grow our DTC business globally delivered success in 2024 with the launch of Max in 73 new markets across Latin America, the Caribbean, Europe, and Asia and the addition of 19.3 million global subscribers to our DTC products.
In 2025, our content pipeline for HBO and Max includes the highly anticipated returns of The White Lotus, The Last of Us, Hacks, ...And Just Like That, Peacemaker, and The Gilded Age, as well as the series premieres of It: Welcome to Derry and The Eastern Gate.
discovery+ is WBD’s non-fiction, real-life subscription-based streaming service. discovery+ features a wide range of series across popular passion verticals, including lifestyle and relationships; home and food; true crime; paranormal; adventure and natural history; science, tech, and the environment; and a slate of high-quality documentaries. discovery+ highlights for 2024 included the premiere of Quiet on Set and the return of the Curious Case of Natalia Grace.
Max and discovery+ currently feature both ad-free and ad-lite versions in most markets.
For the year ended December 31, 2024, distribution, advertising, and content revenues were 87%, 8%, and 4%, respectively, of total revenues for this segment.
1 Direct-to-Consumer subscriber - We define a “Core DTC Subscription” as:
(i) a retail subscription to discovery+, HBO, HBO Max, Max, or a Premium Sports Product (defined below) for which we have recognized subscription revenue, whether directly or through a third party, from a direct-to-consumer platform; (ii) a wholesale subscription to discovery+, HBO, HBO Max, Max, or a Premium Sports Product for which we have recognized subscription revenue from a fixed-fee arrangement with a third party and where the individual user has activated their subscription; (iii) a wholesale subscription to discovery+, HBO, HBO Max, Max, or a Premium Sports Product for which we have recognized subscription revenue on a per subscriber basis; (iv) a retail or wholesale subscription to an independently-branded, regional product sold on a stand-alone basis that includes discovery+, HBO, HBO Max, Max, and/or a Premium Sports Product, for which we have recognized subscription revenue (as per (i)-(iii) above); and (v) users on free trials who convert to a subscription for which we have recognized subscription revenue within the first seven days of the calendar month immediately following the month in which their free trial expires.
The Company defines a “Premium Sports Product” as a strategically prioritized, sports-focused product sold on a stand-alone basis and made available directly to consumers. The current “independently-branded, regional products” referred to in (iv) above consist of TVN/Player and BluTV. Subscribers to multiple WBD DTC products (listed above) are counted as a paid subscriber for each individual WBD DTC product subscription. We may refer to the aggregate number of DTC Subscriptions as “subscribers”.
The reported number of “subscribers” included herein and the definition of “DTC Subscription” as used herein excludes: (i) individuals who subscribe to DTC products, other than discovery+, HBO, HBO Max, Max, a Premium Sports Product, and independently-branded, regional products (currently consisting of TVN/Player and BluTV) that may be offered by us or by certain joint venture partners or affiliated parties from time to time; (ii) a limited number of international discovery+ subscribers that are part of non-strategic partnerships or short-term arrangements as may be identified by the Company from time to time; (iii) domestic and international Cinemax subscribers, and international basic HBO subscribers; and (iv) users on free trials except for those users on free trial that convert to a DTC Subscription within the first seven days of the next month as noted above.
Domestic subscriber - We define a Domestic subscriber as a subscription based either in the United States of America or Canada.
International subscriber - We define an International subscriber as a subscription based outside of the United States of America or Canada.
COMPETITION
Providing content across various distribution platforms is a highly competitive business worldwide. We experience competition for the development and acquisition of content, distribution and sale of our content, sale of commercial time on our networks and viewership. There is competition from other production studios, other television networks, and online-based content providers for the acquisition of content and creative talent such as writers, producers and directors. In addition, the composition of our competitors has evolved with the entrance of new market participants, including companies in adjacent sectors with significant financial, marketing, and other resources, greater efficiencies of scale, fewer regulatory burdens and more competitive pricing. Our ability to produce and acquire popular content is an important competitive factor for the distribution of our content, attracting viewers and the sale of advertising. Our success in securing popular content and creative talent depends on various factors such as the number of competitors providing content that targets the same genre and audience, the distribution of our content, viewership, and the production, marketing and advertising support we provide.
Our networks compete with other television networks, including broadcast, cable and local, and with other studios and production companies for the distribution of our content and fees charged to cable television operators, DTH satellite service providers, and other distributors that carry our content. Our ability to secure distribution agreements is necessary to ensure the retention of our audiences. Our contractual agreements with distributors are renewed or renegotiated from time to time in the ordinary course of business. Growth in the number of networks distributed, consolidation and other market conditions in the cable and satellite distribution industry, and increased popularity of other platforms may adversely affect our ability to obtain and maintain contractual terms for the distribution of our content that are as favorable as those currently in place. The ability to secure distribution agreements is dependent upon the production, acquisition and packaging of content, viewership, the marketing and advertising support and incentives provided to distributors, the product offering across a series of networks within a region, and the prices charged for carriage.
Our networks and streaming services, which include Max, HBO Max, and discovery+, compete for the sale of advertising with other television networks, including broadcast, cable, local networks, other content distribution outlets and new market participants for their target audiences and the sale of advertising. Our success in selling advertising is a function of the size and demographics of our audiences, quantitative and qualitative characteristics of the audience of each network, the perceived quality of the network and of the particular content, the brand appeal of the network and ratings as determined by third-party research companies, prices charged for advertising and overall advertiser demand in the marketplace.
Our networks, studios and streaming services also compete for their target audiences with all forms of content and other media provided to viewers, including broadcast, cable and local networks, streaming services, pay-per-view and video-on-demand (“VOD”) services, online activities and other forms of news, information and media entertainment.
INTELLECTUAL PROPERTY
We are one of the world’s leading creators, owners and distributors of intellectual property. Our intellectual property assets include copyrights in films, television programs, software, comic books and mobile apps; trademarks in names, logos and characters; patents or patent applications for inventions related to products and services; websites; and licenses of intellectual property rights of various kinds from third parties. We have made and will continue to make investments in developing technology platforms to support our digital products and streaming services, including Max and discovery+, and consider these platforms to be intellectual property assets as well.
We are a global media and entertainment company and the protection of our content and brands is of primary importance. To protect our intellectual property assets, we rely upon a combination of copyright, trademark, patent, unfair competition, and internet/domain name statutes and laws, and contract provisions. However, there can be no assurance of the degree to which these measures will be successful. Moreover, effective intellectual property protection may be either unavailable or limited in certain foreign territories, and new legislative or regulatory initiatives could impact our operations.
We seek to limit unauthorized use of our intellectual property through a combination of approaches. However, the steps taken to prevent the infringement of our intellectual property by unauthorized third parties may not be effective. Piracy, which encompasses the theft of our signals, and the unauthorized use of our intellectual property in the digital environment, continues to present a threat to revenues from products and services based on our intellectual property. Piracy also includes the unauthorized use of our intellectual property on physical goods. We have a team dedicated to disrupting and curbing piracy and other forms of intellectual property infringement and use external vendors to detect and remove infringements, whether digital in nature or on physical goods. We also engage with intermediaries that facilitate piracy, leverage our membership in a range of industry groups, and initiate enforcement actions, including litigation, to address piracy issues. In general, policing unauthorized use of our products and services and related intellectual property is difficult and costly. Further, new technologies such as generative AI and their impact on our intellectual property rights remain uncertain, and development of the law in this area could impact our ability to protect against infringing uses or result in infringement claims against us.
Third parties may challenge the validity or scope of our intellectual property from time to time, and the success of any such challenges could result in the limitation or loss of intellectual property rights. Irrespective of their validity, such claims may also result in substantial costs and diversion of resources which could have an adverse effect on our operations.
REGULATORY MATTERS
Our businesses are subject to and affected by regulations of U.S. federal, state and local government authorities, and our international operations are subject to laws and regulations of the countries and international bodies, such as the E.U., in which we operate. Content networks, such as those owned by us, are regulated in certain limited respects by the Federal Communications Commission (“FCC”), including some regulations that only apply to content networks affiliated with a cable television operator. Other FCC regulations, although imposed on cable television operators and direct broadcast satellite (“DBS”) operators and other distributors, affect content networks indirectly. The rules, regulations, policies and procedures affecting our businesses are constantly subject to change. These descriptions are summary in nature and describe only the most significant regulations we face; they do not purport to describe all present and proposed laws and regulations affecting our businesses.
Program Access
The Communications Act (the “Act”) and the FCC’s program access rules prevent a content vendor in which a cable operator has an “attributable” ownership interest from discriminating against unaffiliated multichannel video programming distributors (“MVPDs”), such as cable and DBS operators, in the rates, terms and conditions for the sale or delivery of the vendor’s content networks, on the basis of the non-affiliation. These rules permit the unaffiliated MVPD to initiate a complaint to the FCC against the content vendor and content networks if it believes this rule has been violated.
Program Carriage
The Act and the FCC’s program carriage rules prohibit MVPDs from favoring their affiliated content networks over unaffiliated, similarly situated content networks in the rates, terms and conditions of their carriage agreements in a manner that unreasonably restrains the ability of the unaffiliated content network to compete fairly. These rules permit the unaffiliated content network to initiate a complaint to the FCC against the MVPD if it believes these rules have been violated, but court decisions interpreting the regulations have made it difficult for us to challenge a distributor’s decision to decline to carry one of our content networks or discriminate against one of our content networks.
“Must-Carry”/Retransmission Consent
The Act imposes “must-carry” regulations on cable systems, requiring them to carry, as part of their cable service, the signals of most local broadcast television stations in their market if they elect mandatory carriage. DBS systems are also subject to their own must-carry rules. The FCC’s implementation of “must-carry” obligations requires cable operators and DBS providers to give broadcasters preferential access to channel space and favorable channel positions. This reduces the amount of channel space that is available for carriage of our content networks by cable and DBS operators on television. The Act also gives certain broadcasters the choice of opting out of must-carry and invoking the right to retransmission consent, which refers to a broadcaster’s right to require MVPDs, such as cable and satellite operators, to obtain the broadcaster’s consent before distributing the broadcaster’s signal to the MVPDs’ subscribers, often at a substantial cost that reduces the content funds available for programmers not affiliated with broadcasters, such as us.
Accessibility, Children’s Advertising Restrictions, Emergency Alerts and CALM Act
Certain of our content networks and some of our IP-delivered video content must provide closed-captioning and audio description of some of their programming and comply with other regulations designed to make our content more accessible to persons with disabilities. The U.S. Congress, the FCC, and the U.S. Department of Justice periodically consider proposals to implement additional accessibility requirements, and are considering a number of such proposals now, some of which would increase our obligations substantially. Our television programming intended primarily for children 12 years of age and under must comply with certain limits on the amount and type of permissible advertising, and certain regulations extend to our digital products when they are referenced by web address in our television programming. We may not include actual or simulated emergency alert tones or signals in our content. Commercials embedded in our networks’ television content stream also must adhere to certain standards for ensuring that those commercials are not transmitted at louder volumes than our program material.
Obscenity Restrictions
MVPDs are prohibited from transmitting obscene content, and our distribution agreements generally require us to refrain from including such content on our networks.
Regulation of Digital Products and Services
We operate a variety of free, advertising-based and subscription-based digital products and streaming services providing news, information and entertainment to consumers in the U.S. and international markets via web, mobile and connected TV platforms. In some cases, those products and services are provided directly to consumers, and in other cases, they can be used and/or purchased through a third-party distributor, such as Xfinity or Hulu. Our digital products and services are subject to federal and state laws in the U.S. relating to the privacy and security of personal information collected from our users, including laws pertaining to the acquisition of personal information from children. Some examples of these laws include the federal Children’s Online Privacy Protection Act (COPPA), the federal Controlling the Assault of Non-Solicited Pornography and Marketing Act (CAN SPAM), the Video Privacy Protection Act (VPPA), and the California Consumer Privacy Act (CCPA). Additional U.S. state and federal laws addressing data security and data breach notification obligations also may apply to the Company in some instances. These laws and their public and private enforcement are continually evolving. More than a dozen comprehensive U.S. state privacy laws have taken effect in the last few years, and a number of others have been introduced and may pass in the future. Additional U.S. federal and state laws and regulations apply or may be adopted with respect to our digital products and services, covering such issues as data privacy and security, the online safety of children and teens, dissemination or moderation of user-generated content, advertising, competition, pricing, content, copyrights and trademarks, access by persons with disabilities, distribution, taxation and characteristics and quality of products and services. The scope of regulation may differ depending on how these products and services are used and/or purchased. In addition, the FCC from time to time considers whether some or all digital services should be considered MVPDs and regulated as such, or otherwise subjected to rules that apply to traditional communications providers. Such determination would increase our regulatory burdens substantially.
Intellectual Property Laws and Regulations
Our intellectual property assets are discussed under “Business – Intellectual Property” above. Our content, whether distributed over broadcast, cable, DBS, wireless, or internet-based services, or through other means, is protected under intellectual property law, including copyright, trademark, patent, unfair competition, and internet/domain name statutes and laws and license agreements. Changes to these laws and regulations could either strengthen or weaken our ability to license and protect our content and combat its theft or misuse.
Foreign Laws and Regulations
The foreign jurisdictions in which our products and services are offered have, in varying degrees, laws and regulations governing our businesses, including relating to the production, monetization and distribution of content. By way of example, our digital offerings available to consumers in international jurisdictions are subject to laws and regulations relating to, without limitation, consumer protection, data privacy and security, advertising, competition, intellectual property, and content limitations.
Similar to the U.S., new laws and regulations in international jurisdictions may be adopted with respect to our intellectual property, products and services. In particular, we face increased efforts in international jurisdictions to regulate streaming services, which may constrain our offerings. Further, international laws and regulations around intellectual property could limit our ability to license and protect our content, as well as impose additional burdens on our business.
HUMAN CAPITAL
As of December 31, 2024, we had approximately 35,000 employees, including full-time and part-time employees of our wholly-owned subsidiaries and consolidated ventures, with 50% located in the U.S. and 50% located outside of the U.S.
We are a talent-driven business, aiming to attract, develop, and motivate top talent throughout our company. To support these objectives, our people and culture programs are designed to provide competitive, locally-relevant benefits, performance-based pay, and nonfinancial support and incentives. We also strive to enhance our culture through efforts aimed at making our workplace engaging and inclusive, and to develop our talent to prepare them for critical roles and leadership positions for the future. We also provide opportunities for our employees to make an impact in their communities through social good initiatives around the world.
Some examples of our people and culture programs and initiatives are described below.
Compensation
Our compensation philosophy is to pay for performance, encourage excellence and reward employees who innovate and deliver high-quality results. Our compensation programs are designed to implement our compensation philosophy by:
•paying competitively, across salary grades and geographies;
•applying compensation policies in an internally consistent manner; and
•incentivizing our employees to deliver on our short- and long-term objectives.
Benefits
We provide an array of benefits and programs that support our employees in their personal and professional lives. Highlights include:
•local medical, dental, and vision plans in many countries around the world to support our employees with access to health care, supplementing any state-provided health care;
•on-site wellness centers in our New York, Los Angeles, Atlanta, and Chiswick (London) offices, fully-equipped fitness centers in our New York, Los Angeles and Atlanta offices, and access to virtual fitness classes and wellbeing programs;
•family support programs, including on-site childcare in certain offices, childcare locator services, back-up childcare, maternity/paternity leave, adoption assistance and elder care;
•tools and resources to support the mental wellbeing of our employees and their families, including mental health counselors in our on-site wellness centers and a confidential, dedicated line for employees to contact and speak with a counselor in the event they need mental health support;
•products and services to support employees’ financial wellbeing, including life, accident, and disability insurance plans, discount benefits, financial planning tools, a 401(k) savings plan in the U.S. and retirement/pension plans in over 20 countries, with competitive contributions from the Company for employees at all levels; and
•offering an employee stock purchase plan, which allows certain employees globally (where legislation permits) an opportunity to buy WBD Series A common stock (“WBD common stock”) at a discounted price through convenient after-tax payroll deductions with no commission charges.
Learning and Development
Our Global Learning & Development (“L&D”) team provides learning opportunities for employees around the world. The L&D team uses a variety of delivery methods suitable to the content and audience, including live in-person sessions, virtual workshops, webinars, and asynchronous online learning through our global learning management platform. The L&D team also provides tuition reimbursement for eligible courses.
AVAILABLE INFORMATION
All of our filings with the U.S. Securities and Exchange Commission (the “SEC”), including reports on Form 10-K, Form 10-Q, and Form 8-K, and all amendments to such filings are available free of charge at the investor relations section of our website, ir.wbd.com, as soon as reasonably practicable after such material is filed with, or furnished to, the SEC. Our annual report, corporate governance guidelines, code of business ethics, audit committee charter, compensation committee charter, and nominating and corporate governance committee charter are also available on our website. In addition, we will provide a printed copy of any of these documents, free of charge, upon written request to: Investor Relations, Warner Bros. Discovery, Inc., 230 Park Avenue South, New York, NY 10003. Additionally, the SEC maintains a website at www.sec.gov that contains quarterly, annual and current reports, proxy and information statements, and other information regarding issuers that file electronically with the SEC, including the Company.
We also routinely post on our website news releases, announcements and other statements about our business and results of operations, some of which may contain information that may be deemed to be material to investors. Therefore, we encourage investors to monitor our website and review the information we post there. The information contained on our website is not part of this Annual Report on Form 10-K and is not incorporated by reference herein.
ITEM 1A. Risk Factors.
Investing in our securities involves risk. In addition to the other information contained in this Annual Report on Form 10-K, you should consider the following risk factors before investing in our securities. Additional risks and uncertainties not presently known to us or that we currently believe not to be material may also adversely impact our business, results of operations, financial position and cash flows.
Risks Related to Our Business and Industry
Our businesses operate in highly competitive industries and if we are unable to compete effectively, our business, financial condition and results of operations could suffer.
The media and entertainment industries in which we compete for viewers, distribution and advertising are highly competitive. See the discussion under “Business – Competition” that appears above. We face increased competitive pressure for talent, content, audiences, subscribers, service providers, advertising spending and production infrastructure. We compete with a broad range of companies engaged in media, entertainment and communications services, some of whom have interests in multiple media and entertainment businesses that are often vertically integrated, all vying for consumer time, attention and discretionary spending. In addition, the composition of our competitors has evolved with the entrance of new market participants, including companies in adjacent sectors with significant financial, marketing and other resources, greater efficiencies of scale, fewer regulatory burdens and more competitive pricing. Such competitors could also have preferential access to important technologies, customer data or other competitive information. Our competitors may also consolidate or enter into business combinations or alliances that strengthen their competitive positions.
Our ability to compete successfully depends on a number of factors, including our ability to consistently acquire and produce high quality content and our ability to identify and successfully execute strategies and partnerships to distribute our content amidst a rapidly evolving competitive landscape. In addition, new technology, including generative artificial intelligence (“AI”), is evolving rapidly and our ability to compete could be adversely affected if our competitors gain an advantage by using such technologies. There can be no assurance that we will be able to compete successfully in the future against existing or new competitors, or that competition in the marketplace will not have an adverse effect on our business, financial condition or results of operations.
Our advertising revenues have been, and may continue to be, adversely impacted by several factors, including the changing landscape of television advertising spending and advertising market conditions.
We derive substantial revenues from the sale of advertising, and a continuing decline in advertising revenues could have a material adverse effect on our business, financial condition or results of operations.
Shifting consumer preferences toward streaming services and other digital products and the increasing number of entertainment choices has intensified audience fragmentation and reduced content viewership through traditional linear distribution models. This has changed the landscape of traditional television advertising spending, prompting advertisers to shift their strategies, and ultimately advertising spend, toward streaming services and other digital products to reach target audiences. In addition, a number of other streaming services with larger subscriber bases and greater household penetration have recently introduced ad-supported tiers. The increase of digital advertising available in the marketplace, due to both the introduction of ad-supported tiers in competing streaming services and the expansion of free ad-supported television (“FAST”) products, has increased, and is expected to continue to increase, the competition we face for advertising expenditures for both our traditional linear networks and the ad-supported tiers in our streaming services, and has also limited our ability to demand higher rates for our linear and digital advertising inventory or even the same rates that we previously charged for our advertising inventory prior to the surge in digital advertising. There can be no assurance that we can successfully navigate the evolving streaming and digital advertising market or that the advertising revenues we generate in that market will replace the declines in advertising revenues generated from our traditional linear business.
The advertising market is also sensitive to general economic conditions and consumer buying patterns. Financial instability or a general decline in economic conditions in the U.S. and other countries where our content is distributed could adversely affect the spending priorities of our advertising partners who might reduce their spending, which could result in a decrease in advertising rates and volume and in our overall advertising revenues. Natural and other disasters, pandemics, acts of terrorism, political uncertainty or hostilities could also lead to a reduction in domestic and international advertising expenditures, which could also have an adverse effect on our advertising revenues.
Our advertising revenues are also dependent on our ability to measure viewership and audience engagement across all platforms and in all geographic regions. Although audience measurement systems have evolved and improved to capture the viewership of programming across multiple platforms, they still do not fully capture all viewership across streaming and other digital platforms and advertisers may not be willing to pay advertising rates based on the viewership that is not being measured. In certain geographic regions, our ability to fully capture viewership information may be limited by local laws and regulations.
As further discussed in other parts of this Item 1a. Risk Factors, our ability to generate advertising revenue is also dependent on our ability to compete in highly competitive, rapidly evolving industries, our ability to respond to changes in consumer behavior and our ability to consistently achieve audience acceptance of our content and brands.
Changes in consumer behavior, as well as evolving technologies and distribution models, may negatively affect our business, financial condition or results of operations.
Our success depends on our ability to anticipate and adapt to changes in consumer behavior and shifting content consumption patterns. The ways in which viewers consume content, and technology and distribution models in the media and entertainment industries, continue to evolve, and new distribution platforms, as well as increased competition from new entrants and emerging technologies, have added to the complexity of maintaining predictable revenues. Technological advancements have empowered consumers to seek more control over how they consume content and have affected the options available to advertisers for reaching target audiences. This trend has impacted certain traditional distribution models, as demonstrated by industry-wide declines in cable ratings, declines in subscribers to the traditional cable bundle, the development of alternative distribution platforms for content, and reduced theatergoing.
Declines in linear television viewership are expected to continue and possibly accelerate, which could adversely affect our advertising and distribution revenues. In order to respond to this decline, changing consumer behavior, increasing preferences to consume content on demand, and changes in content distribution models in the media and entertainment industries, we have invested in, developed and launched streaming services including Max and discovery+. We have incurred and will likely continue to incur significant costs to develop and market our streaming services, including costs related to international expansion, technological enhancements, and subscriber acquisition. There can be no assurance, however, that consumers and advertisers will embrace our offerings, that subscribers will activate or renew a subscription, particularly given the significant number of streaming services in the marketplace, or that our DTC business or other strategies we implement will be as successful or as profitable as our traditional linear television business.
The film industry has also been impacted by shifting consumer preferences and technological innovation, including, among other things, consumer preferences for viewing movies at home, a vast library of which is available to them through one or more streaming subscriptions, and shorter theatrical release windows. As a response to changing consumer preferences, film studios such as ours can seek to invest in creating compelling films and seek to promote events in connection with feature films in order to enhance the consumer’s movie theater experience. If the film industry (of which we are a part) and exhibitors are unable to successfully create and market “event” films and ultimately evolve and enhance the movie theater experience in response to shifting consumer preferences, the profitability, financial condition and results of operations of our studios business may be negatively impacted.
Each distribution model has different risks and economic consequences for us, and the rapid evolution of consumer preferences may have an economic impact that is not ultimately predictable. Further, technology in the media and entertainment industries continues to evolve rapidly. For example, AI is a new technology for which the advantages and risks associated with its use in our industry are currently largely uncertain and unregulated. If we are not able to access our targeted audience with appealing category-specific content and adapt to new technologies, distribution methods, platforms and business models, we may experience a decline in viewership and ultimately a decline in the demand for our programming, which could lead to lower distribution and advertising revenues, materially and adversely affecting our business, financial condition and results of operations.
The success of our business depends on the acceptance of our content and brands by our U.S. and international viewers, which may be unpredictable and volatile.
The production and distribution of television programs, feature films, sports and news content are inherently risky businesses because the revenue we derive and our ability to distribute our content depend primarily on consumer tastes and preferences that often change in unpredictable ways. The appeal, success and performance of our content with consumers, as well as with third-party licensees and other distribution partners, are critical factors that can affect the revenue that we receive with respect to our content-related business. Our success depends on our ability to consistently create and acquire content that meets the changing preferences of viewers in general, in special interest groups, in specific demographic categories and in various international marketplaces. For example, generally, feature films that perform well upon initial release also have commercial success in subsequent distribution channels. Therefore, the underperformance of a feature film, especially an “event” film, upon its theatrical release can result in lower-than-expected revenues for our business which could limit our ability to create future content. We are required to make substantial investments in the production or acquisition and marketing of our television programs, feature films, sports and news content before we learn whether such content will reach anticipated levels of popularity with consumers. Failing to gain the level of audience acceptance we expect for our content may negatively impact our business, financial condition and results of operations.
The commercial success of our content also depends upon the quality and acceptance of competing content available in the applicable marketplace. For example, as some foreign film and filmmaking industries grow and the availability of popular local content rises, the demand from foreign audiences for American films may decrease, which could negatively impact our revenue. Other factors, including the availability of alternative forms of entertainment and leisure time activities, piracy, and our ability to develop strong brand awareness may also affect the audience demand for our content. Consequently, reduced public acceptance of our television programs, feature films, sports and news content or negative publicity regarding individuals or operations associated with our content or brands may decrease our audience share and customer/viewer reach and adversely affect our business, financial condition and results of operations.
If our DTC products fail to attract and retain subscribers, our business, financial condition and results of operations may be adversely impacted.
Our Max and discovery+ offerings are subscription-based streaming services and are among many such services in a crowded and highly competitive landscape. Their success and the success of other subscription-based streaming services we may offer in the future will be largely dependent on our ability to initially attract, and ultimately retain, subscribers. If we are unable to effectively market our DTC products or if consumers do not perceive the pricing and related features of our DTC products to be of value versus our competitors, we may not be able to attract and retain subscribers.
Further, decreases in consumer discretionary spending in the markets where our DTC products are offered may reduce our ability to attract and retain subscribers to our services, which could have a negative impact on our business. Relatedly, a decrease in viewing subscribers on our advertising-supported DTC products could also have a negative impact on the rates we are able to charge advertisers for advertising-supported services. The ability to attract and retain subscribers will also depend in part on our ability to provide compelling content choices that are differentiated from that of our competitors and that are more attractive than other sources of entertainment that consumers could choose in their free time. Furthermore, our ability to provide a quality subscriber experience and our relative service levels, may also impact our ability to attract and retain subscribers. In addition, from time to time, we have entered into, and may enter into, partnerships to offer our streaming services as part of a bundle with other streaming services, which may not lead to the anticipated financial benefit or growth in subscribers. Even if such bundling partnerships are successful, if we are unable to maintain existing or create new bundling partnerships, our ability to retain subscribers and grow our business could be adversely impacted.
If existing subscribers, including those who receive subscriptions through wireless, broadband, or streaming bundling arrangements with third parties or through wholesale arrangements with MVPDs, cancel or discontinue their subscriptions for any reason, including as a result of selecting an alternative wireless or broadband plan that does not bundle our products, canceling or discontinuing their MVPD subscription, or due to the availability of competing offerings that are perceived to offer greater value compared to our DTC products, our business may be adversely affected. We would need to add new subscribers both to replace subscribers who cancel or discontinue their subscriptions and to grow our business. If we are unable to attract and retain subscribers and offset the losses of subscribers who cancel or discontinue their subscriptions to our DTC products, our business, financial condition and results of operations could be adversely affected.
Failure to renew, renewal with less favorable terms, or termination of our content licenses and similar distribution agreements may cause a decline in our revenue.
Because our content and pay-TV networks are licensed to and distributed through third parties, such as traditional television and pay-TV broadcasters (such as cable and satellite operators) and operators of digital platforms, which in turn make such content available, directly and indirectly, to consumers, we are dependent upon the maintenance of these licensing and distribution agreements with such third parties. These agreements generally provide for the scope of licensed rights, including geographic territory, exploitation rights, holdbacks and/or other restrictions, including exclusivity or non-exclusivity, window(s) of exploitation (including first and second pay-TV and free to air broadcast), for the level of carriage our networks will receive, such as channel placement and programming package inclusion (widely distributed, broader programming packages compared to lesser distributed, specialized programming packages), and for payment of a license fee to us based on a number of factors, including the scope of the rights granted, the popularity of the content (as measured in the case of films, for example, by box office performance for certain downstream exploitation) and the date of its first theatrical or pay-TV exhibition.
Our agreements generally have a limited term which varies by territory and distributor, and there can be no assurance that these agreements will be renewed in the future or that they will be renewed on terms that are favorable to us. Whether or not a distributor is willing to renew an agreement on terms that are favorable to us may be dependent upon our decision to make our content available on both our linear networks and our streaming platforms. Failure to renew an agreement prior to its expiration could lead to service blackout, which could in turn affect both our revenues and our reputation with viewers.
While the number of subscribers associated with our networks impacts our ability to generate advertising revenue (as further described elsewhere in this Item 1A), subscription-based revenue also represents a significant portion of our revenue. The license fees and other commercial terms that we receive are dependent, among other factors, on the acceptance and performance of our content with consumers. A reduction in the license fees that we receive or in the number of subscribers for which we are paid, including as a result of a loss or reduction in carriage for our networks or a reduction in distributor penetration, or as a result of changes in consumer habits, could adversely affect our distribution revenue. Such a loss or reduction in carriage could also decrease the potential audience for our programs thereby adversely affecting our advertising revenue. Changes in distribution strategy and variations on traditional theatrical distribution and other licensing models, such as shortening traditional windows, may also drive changes in the license fees that distributors and other downstream licensees in the value chain may be willing to pay for content, which may in turn negatively affect our revenue. As a result of industry consolidation, our distributors have become and may continue to become larger, and as a result have gained or could gain additional market power. Such consolidation gives these distributors leverage in negotiating their distribution agreements with us which could subject our affiliate fee revenue to reduction or discounts, which could have an adverse effect on our financial condition.
In addition, content distribution and license agreements are complex and individually negotiated. For example, some of our distribution agreements contain “most favored nation” clauses, which typically provide that if we enter into an agreement with another distributor which contains certain more favorable terms, we must offer some of those terms to our existing distributors. If we were to disagree with one of the counterparties on the interpretation of a content distribution and license agreement, it could damage our relationship with that counterparty as well as materially adversely impact our business, financial condition and results of operations.
We rely on platforms owned by our competitors for digital and linear distribution of our content.
We rely on platforms owned by third parties, some of which compete directly with us or have investments in competing streaming services, to make our content available to our subscribers and viewers. If these third parties do not continue to provide access to our service on their platforms or are unwilling to do so on terms acceptable to us, our business could be adversely affected. If we are not successful in maintaining existing or creating new relationships with these third parties, our ability to retain subscribers and grow our business could be adversely impacted.
We invest significant resources to acquire and maintain licenses to produce sports programming and there can be no assurance that we will continue to be successful in our efforts to obtain or maintain licenses to recurring sports events or recoup our investment when the content is distributed.
We face significant competition to acquire and maintain licenses to sports programming, which leads to significant expenditure of funds and resources. As a result of an increasing number of market entrants in the programming space, we have seen upward pressure on programming costs in recent years, particularly in connection with the licensing and acquisition of sports content from third parties. We may also be impacted by such upward pressures driven by increasing investment in programming by competitors. In certain international markets, regulations concerning content quotas or content investment requirements may be a further factor driving increasing programming costs. In addition, businesses, including ours, that offer multiple services or that may be vertically integrated and offer both video distribution and programming content, may face closer regulatory review from the competition authorities in the countries in which we currently have operations. If our distributors have to pay higher rates to other holders of sports broadcasting rights, it might be difficult for us to negotiate higher rates for the distribution of our networks. This difficulty could be amplified if we are unable to obtain or maintain licenses for sports programming that we can bundle with our other programming for distribution. There can be no assurance that we will be able to compete successfully in the future against existing or new competitors to obtain and/or maintain licenses to recurring sports events. For example, in 2024, the Company was engaged in a legal dispute, which has since been settled, with the NBA regarding our license to distribute NBA games and NBA-related content. If our licenses to recurring sports events are not renewed, such nonrenewal could limit our ability to negotiate higher rates for the distribution of our networks. Increasing competition for programming licenses and regulatory review from competition authorities could have a material adverse effect on our business, financial condition or results of operations.
There can also be no assurance that we will recoup our investment in sports programming or that revenue from our content distribution agreements will exceed our costs for the rights for sports programming, as well as the other costs of producing and distributing the programming. The impact of these licenses on our results of operations over the term of the licenses depends on a number of factors, including the strength of advertising markets and subscription levels and rates for programming. Our success with sports programming is highly dependent on consumer acceptance of this content and the size of our viewing audience. If viewers do not find our sports programming content acceptable, we could see low viewership, which could lead to low distribution and advertising revenues and adversely affect our business, financial condition and results of operations.
Our businesses have been, and in the future may be, subject to labor disruption.
We and some of our suppliers and business partners retain the services of writers, directors, actors, announcers, athletes, technicians, trade employees and others involved in the development and production of our television programs, feature films and interactive entertainment (e.g., games) who are covered by collective bargaining agreements. If negotiations to renew expiring collective bargaining agreements are not successful or become unproductive, the affected unions could take, and have taken, actions such as strikes, work slowdowns or work stoppages. Strikes, work slowdowns, work stoppages, or the possibility of such actions, including the 2023 WGA and SAG-AFTRA strikes and potential future strikes by other unions involved in development and production, have resulted in, and could in the future result in, delays in the production of, or the release of, our television programs, feature films, and interactive entertainment. For example, the 2023 WGA and SAG-AFTRA strikes caused delays in the production of our television programs and feature films and in the release of certain programming. The impact of these strike-related delays and other consequences of these strikes have continued to impact our business even after the strikes were ultimately resolved.
If the media and entertainment industries experience prolonged strikes, work slowdowns or work stoppages, we may be unable to produce, distribute or license programming, feature films, and interactive entertainment, which could result in reduced revenue and have a material adverse effect on our business, financial condition and results of operations. For example, the 2023 WGA and SAG-AFTRA strikes had a material impact on the operations and results of the Company. See the discussion under “Business – Industry Trends” that appears above. In addition, the pausing and restarting of certain productions resulted in incremental costs, delayed the completion and release of some of our content (films, television programs, and licensed programs) and could cause an impairment of our investment in film, television programs, or licensed program rights if the incremental costs are significant or we are unable to efficiently complete the production of the film, television show or program or decide to abandon the production.
We may also enter into new collective bargaining agreements or renew collective bargaining agreements on less favorable terms and incur higher costs as a result of prolonged strikes, work slowdowns, or work stoppages. Many of the collective bargaining agreements that cover individuals providing services to the Company are industry-wide agreements, and we may lack practical control over the negotiations and terms of these agreements. Union or labor disputes or player lock-outs relating to certain professional sports leagues may preclude us from producing and telecasting scheduled games or events and could negatively impact our promotional and marketing opportunities. Depending on their duration, union or labor disputes or player lock-outs could have a material adverse effect on our business, financial condition and results of operations.
We have recognized, and could continue to recognize, impairment charges related to goodwill and other intangible assets.
We have a significant amount of goodwill and other intangible assets on our consolidated balance sheets. In accordance with U.S. generally accepted accounting principles (“U.S. GAAP”), management periodically assesses these assets to determine if they are impaired. (See Note 2 to the accompanying consolidated financial statements.) The occurrence of certain events or circumstances has resulted in, and could continue to result in, a downward revision in the estimated fair value of a reporting unit or intangible assets. For example, continued negative industry or economic trends, including the decline of traditional linear television viewership and linear ad revenues, declining levels of global GDP growth and soft advertising markets in the U.S., disruptions to our business, inability to effectively integrate acquired businesses, execution risk associated with anticipated growth in our DTC products, underperformance of our content, failure to renew content licenses and distribution agreements, including affiliate and sports rights renewals, unexpected significant changes or planned changes in use of the assets, including in connection with restructuring initiatives, divestitures and continued decline in our market capitalization could negatively affect our estimates of the fair value of our reporting units. When events or changes in circumstances such as this occur, we have needed to, and may in the future need to, write down the value of our goodwill and other intangible assets. If we determine that our estimate of the fair value of a reporting unit is below the recorded value of that unit on our balance sheet, we may record a non-cash impairment loss for the goodwill. For example, in 2024, we determined that our estimate of the fair value of our Networks reporting unit was below its recorded value on our balance sheet and we recorded a $9.1 billion pre-tax, non-cash impairment of goodwill. Any charges relating to the impairment of our goodwill and other intangible assets could materially adversely affect our results of operations in the periods recognized.
We consider all current information when determining the need for, or calculating, any impairment loss. However, future changes in events or circumstances, such as a continuation or worsening of the current negative industry and economic trends and the other events and circumstances described above, could result in decreases in the fair value of our goodwill and other intangible assets and require us to record additional impairment losses that could materially adversely affect our results of operations in the periods recognized.
Service disruptions or the failure of communications satellites or transmitter facilities we rely upon could adversely impact our business, financial condition and results of operations.
We rely on communications satellites and transmitter facilities and other technical infrastructure, including fiber, to transmit programming to affiliates and other distributors. Shutdowns of communications satellites and transmitter facilities or service disruptions will pose significant risks to our operations. Such disruptions may be caused by power outages, natural disasters, extreme weather, terrorist attacks, war, failures or impairments of communications satellites or on-ground uplinks or downlinks or other technical facilities and services used to transmit programming, failure of service providers to meet contractual requirements, or other similar events. If a communications satellite or other transmission means (e.g., fiber) is not able to transmit our programming, or if any material component thereof fails or becomes inoperable, we may not be able to secure an alternative communications path in a timely manner because, among other factors, there are a limited number of service providers and other means available for the transmission of programming, and any alternatives may require lead time and additional technical resources and infrastructure to implement. If such an event were to occur, there could be a disruption in the delivery of our programming, which could harm our reputation and materially adversely affect our business, financial condition and results of operations.
Risks Related to Our Financial, Capital and Corporate Structure
Forecasting our financial results requires us to make judgments and estimates which may differ materially from actual results.
Given the dynamic nature of our business, the current uncertain economic climate and the inherent limitations in predicting the future, forecasts of our revenues, adjusted earnings before interest, taxes, depreciation, and amortization (as defined in Note 23 to the accompanying consolidated financial statements, “Adjusted EBITDA”), free cash flow and subscriber growth, and other financial and operating data, may differ materially from actual results, including as a result of events outside of our control and other risks and uncertainties described herein. Such discrepancies could cause a decline in the trading price of our common stock.
We have a significant amount of debt and may incur additional debt, which could adversely affect our financial health and our ability to react to changes in our business and our ability to incur debt, and the use of our funds could be limited by the restrictive covenants in the agreements governing our credit agreements and senior notes.
Our consolidated indebtedness as of December 31, 2024 was $39,505 million, of which $2,748 million is current. In addition, we have the ability to draw down on a $6.0 billion revolving credit facility in the ordinary course, which would have the effect of further increasing our debt to the extent drawn. We are also permitted, subject to certain restrictions under our existing debt agreements, to obtain additional long-term debt and working capital lines of credit to meet future financing needs. This would have the effect of further increasing our leverage ratio.
Our loan agreements contain restrictive covenants, as well as requirements to comply with certain leverage ratio and other financial maintenance tests. These covenants and requirements could limit our ability to take various actions, including incurring additional debt, guaranteeing indebtedness and engaging in various types of transactions, including mergers, acquisitions and sales of assets, or to take advantage of other opportunities, which could have an adverse effect on our business.
In addition, our corporate or debt-specific credit rating could be downgraded, which may increase our borrowing costs or subject us to even more restrictive covenants when we incur new debt in the future, which could reduce profitability and diminish operational flexibility. In 2024, S&P and Moody’s revised our ratings outlook from stable to negative in part due to declines in our linear business, including as a result of the weak operating environment for linear networks, and our leverage ratio. Credit rating agencies may continue to review and adjust our ratings or outlook.
If we are unable to effectively reduce and sustain our leverage ratio, it could have significant negative consequences on our financial condition and results of operations, including:
•impairing our ability to meet one or more of the financial ratio covenants contained in our revolving credit facility or our term loan credit facility or to generate cash sufficient to pay the interest or principal, which could result in an acceleration of some or all of our outstanding debt in the event that an uncured default occurs;
•increasing our vulnerability to adverse economic and market conditions;
•limiting our ability to obtain additional debt or equity financing;
•requiring the dedication of a substantial portion of our cash flow from operations to service our debt, thereby reducing the amount of cash flow available for other purposes such as capital expenditures, investments, share repurchases, and mergers and acquisitions;
•requiring us to sell debt or equity securities or to sell some of our core assets, possibly on unfavorable terms, to meet payment obligations;
•limiting our flexibility in planning for, or reacting to, changes in our business and the markets in which we compete; and
•placing us at a possible competitive disadvantage with less leveraged competitors and competitors that may have better access to capital resources.
We could be unable to obtain cash in amounts sufficient to meet our financial obligations or other commitments.
Our ability to meet our financial obligations and other contractual commitments will depend upon our ability to access cash. We are a holding company, and our sources of cash include our available cash balances, net cash from the operating activities of our subsidiaries, any dividends and interest we may receive from our investments, availability under our credit facilities or any credit facilities that we may obtain in the future and proceeds from any asset sales we may undertake in the future. The ability of our subsidiaries, including WarnerMedia Holdings, Inc., Scripps Networks Interactive, Inc., and Discovery Communications, LLC to pay dividends or to make other payments or advances to us will depend on their individual operating results and any statutory, regulatory or contractual restrictions, including restrictions under our credit facilities, to which they may be or may become subject. Under the 2017 Tax Cuts and Jobs Act, we were subject to U.S. taxes for the deemed repatriation of certain cash balances held by foreign corporations. The Company intends to continue to permanently reinvest some of these funds outside of the U.S., and current plans do not demonstrate a need to repatriate them to fund our U.S. operations.
Corporate restructurings, strategic transactions and acquisitions present many risks and we may not realize the financial and strategic goals that were contemplated at the time of any transaction.
From time to time we may enter into strategic transactions, make investments or make acquisitions. Our success may depend on opportunities to buy other businesses or technologies that could complement, enhance or expand our current business or products or that might otherwise offer us growth opportunities. Such transactions may result in dilutive issuances of our equity securities, use of our cash resources, and incurrence of significant debt and amortization expenses related to intangible assets. We may also incur unanticipated expenses, fail to realize anticipated benefits, have difficulty integrating the acquired businesses, disrupt relationships with current and new employees, subscribers, affiliates and vendors, or have to delay or not proceed with announced transactions. Additionally, regulatory agencies, such as the FCC or U.S. Department of Justice, may impose additional restrictions on the operation of our business as a result of our seeking regulatory approvals for any strategic transactions and significant acquisitions. The occurrence of any of these events could have an adverse effect on our business.
In addition, from time to time we may adjust our corporate structure, reporting and operating segments, or business strategies in connection with significant transactions, changes occurring across an evolving media landscape, macroeconomic conditions and/or other changes related to our business. For example, during fiscal year 2022, in connection with the completion of the acquisition (the “Merger”) in which we acquired the WarnerMedia business (the “WarnerMedia Business”) from AT&T Inc. (“AT&T”), we changed our segment presentation and implemented various restructuring and transformation initiatives. During fiscal year 2024, we announced a new corporate structure whereby the Company would reorganize into two distinct operating divisions, anticipated to be implemented during 2025. Such changes could incur unforeseen costs and disruptions, are subject to execution risk, and may not produce the anticipated benefits.
Certain of our businesses are conducted through joint ventures or partnerships with one or more third parties, in which we share ownership, management, and profits of the business operation to varying degrees.
Certain of our businesses are conducted through joint ventures or partnerships with one or more third parties, where we have varying degrees of ownership and influence. From time to time, we may disagree with our joint venture partners on the strategy or management of a joint venture business but may be constrained in our ability to make decisions unilaterally as a result of legal or contractual obligations to our joint venture partners, which could adversely affect our business, financial condition and results of operations. In addition, we believe our relationship with our third-party partners is an important factor in the success of any joint venture or partnership. If a partner changes, our relationship may be adversely affected and we may not realize the anticipated benefits from such joint venture or partnership.
We have directors who also serve as directors of Liberty Media Corporation (“Liberty Media”), Liberty Global Ltd. (“Liberty Global”), Qurate Retail, Inc. f/k/a Liberty Interactive Corporation (“Qurate Retail”), Liberty Broadband Corporation (“Liberty Broadband”), and Liberty Latin America Ltd. (“LLA”), which may lead to conflicting interests for those directors or result in the diversion of business opportunities or other potential conflicts.
Dr. John C. Malone, chairman of Liberty Media, Liberty Global and Liberty Broadband and member of the board of directors of Qurate Retail, serves on our board of directors. Our board of directors also currently includes two other persons who serve on the board of directors of Liberty Global and the board of directors of LLA. Liberty Media, Liberty Global, Qurate Retail, and Liberty Broadband, LLA (together, the “Liberty Entities”) own interests in various U.S. and international media, communications and entertainment companies, such as Charter Communications, Inc., that directly or indirectly own or operate domestic or foreign content services that may compete with the content services we offer. We have no rights in respect of U.S. or international content opportunities developed by or presented to any of the Liberty Entities or their respective subsidiaries, and the pursuit of these opportunities by any of the Liberty Entities or their respective subsidiaries may adversely affect our interests and those of our stockholders.
None of the Liberty Entities own any interest in us. Dr. Malone beneficially owns: shares of Liberty Media representing approximately 48% of the aggregate voting power of its outstanding stock, shares representing approximately 30% of the aggregate voting power of Liberty Global, shares representing approximately 6% of the aggregate voting power of Qurate Retail, shares representing approximately 48% of the aggregate voting power of Liberty Broadband and shares representing less than 1% of our outstanding common stock. Our other directors who are also directors of the Liberty Entities hold stock and stock-based compensation in the Liberty Entities and hold our stock and stock-based compensation. These ownership interests and/or business positions could create conflicts of interest or the appearance of conflicts of interest when these individuals are faced with decisions that could have different implications for us and/or one or more of the Liberty Entities. For example, there may be the potential for a conflict of interest when we, on the one hand, or one or more of the Liberty Entities, on the other hand, consider acquisitions and other corporate opportunities that may be suitable for the other.
The members of our board of directors have fiduciary duties to us and our stockholders. Likewise, those persons who serve in similar capacities at a Liberty Entity have fiduciary duties to those companies. Therefore, such persons may have conflicts of interest or the appearance of conflicts of interest with respect to matters involving or affecting both respective companies, and there can be no assurance that the terms of any transactions will be as favorable to us or our subsidiaries as would be the case in the absence of a conflict of interest.
It may be difficult for a third party to acquire us, even if such acquisition would be beneficial to our stockholders.
Certain provisions of our charter and bylaws may discourage, delay or prevent a change in control that a stockholder may consider favorable. These provisions include the following:
•authorizing the issuance of “blank check” preferred stock without stockholder approval, which could be issued by our board of directors to increase the number of outstanding shares and thwart a takeover attempt;
•classifying our board of directors with staggered three-year terms until the election of directors at our 2025 annual meeting of stockholders, which may lengthen the time required to gain control of our board of directors;
•limiting who may call special meetings of stockholders;
•prohibiting stockholder action by written consent, thereby requiring stockholder action to be taken at a meeting of the stockholders;
•establishing advance notice requirements for nominations of candidates for election to our board of directors or for proposing matters that can be acted upon by stockholders at stockholder meetings;
•the existence of authorized and unissued stock which would allow our board of directors to issue shares to persons friendly to current management, thereby protecting the continuity of our management, or which could be used to dilute the stock ownership of persons seeking to obtain control of us.
In addition, under our charter, we have not opted out of the protections of Section 203 of the Delaware General Corporation Law, and we are therefore governed by Section 203. Accordingly, it is expected that Section 203 will have an anti-takeover effect with respect to transactions that our board of directors does not approve in advance and that Section 203 may discourage takeover attempts that might result in a premium over the market price of WBD capital stock.
These provisions are intended to protect our stockholders from coercive or otherwise unfair takeover tactics by requiring potential acquirers to negotiate with our board of directors and by providing our board of directors with more time to assess any acquisition proposal. These provisions are not intended to make us immune from takeovers. As noted above, these provisions apply even if the offer may be considered beneficial by some stockholders and could delay or prevent an acquisition that our board of directors determines is not in our best interests and the best interests of our stockholders. Accordingly, if our board of directors determines that a potential business combination transaction is not in our best interests and the best interests of our stockholders, but certain stockholders believe that such a transaction would be beneficial to us and our stockholders, such stockholders may elect to sell their shares in WBD and the market price of WBD common stock could decrease.
Risks Related to Domestic and Foreign Laws and Regulations; Other Risks Related to International Operations
Changes in domestic and foreign laws and regulations and other risks related to international operations could adversely impact our business, financial condition and results of operations.
Programming services like ours, and the distributors of our services, including cable operators, satellite operators and other multi-channel video programming distributors, are regulated by U.S. federal laws and regulations issued and administered by various federal agencies, including the FCC, as well as by state and local governments, in ways that affect the daily conduct of our video content business. These laws and regulations are constantly subject to change. Current obligations and regulations, among other things, require closed captioning of programming for the hearing impaired, require certain content providers to make available audio descriptions of programming for the visually impaired, impose other accessibility requirements, and limit the amount and content of commercial matter that may be shown during programming aimed primarily at an audience of children aged 12 and under. See the discussion under “Business – Regulatory Matters” that appears above. The U.S. Congress, the FCC, the Federal Trade Commission (“FTC”), U.S. state legislatures, and the courts currently have under consideration, and may adopt or interpret in the future, new laws, regulations and policies regarding a wide variety of matters that could, directly or indirectly, affect the operations of our U.S. media properties or modify the terms under which we offer our services and operate. Additionally, certain Executive Orders from the U.S. government could affect our business, operations, strategies, and increase our costs of compliance.
In addition, we distribute programming outside the U.S. As a result, our business is, and may increasingly be, subject to certain risks inherent in international business, many of which are beyond our control. These risks include:
•laws and policies affecting trade and taxes, including tariffs and laws and policies relating to the repatriation of funds and withholding taxes, and changes in these laws;
•local regulatory requirements (and any changes to such requirements), including restrictions on content, censorship, imposition of local content quotas, local production levies and investment obligations, and restrictions or prohibitions on foreign ownership, outsourcing, consumer protection, targeted advertising, intellectual property and related rights, including copyright and rightsholder rights and remuneration;
•our ability to obtain the appropriate licenses and other regulatory approvals we need to distribute content in foreign countries as well as regulatory intervention on how we currently operate, including how we license and distribute content;
•differing degrees of protection for intellectual property and varying attitudes towards the piracy of intellectual property;
•foreign exchange regulations, or significant fluctuations in foreign currency value and foreign exchange rates, as further described below in this Item 1A;
•capital, currency exchange and central banking controls;
•the instability of foreign economies and governments;
•the potential for political, social, or economic unrest, terrorism, hostilities, cyber-attacks or war, including the ongoing conflicts in Europe and the Middle East;
•anti-corruption laws and regulations such as the Foreign Corrupt Practices Act and the U.K. Bribery Act that impose stringent requirements on how we conduct our foreign operations and changes in these laws and regulations;
•sanction laws and regulations such as those administered by the Office of Foreign Assets Control that restrict our dealings with certain sanctioned countries, territories, individuals and entities; these laws and regulations are complex, frequently changing, and increasing in number, and may impose additional prohibitions or compliance obligations on our dealings in certain countries and territories, including sanctions imposed on Russia and certain Ukrainian territories as well as sanctions imposed on China;
•challenges implementing effective controls to monitor business activities across our expanded international operations;
•restrictions on transfers of personal data under foreign privacy and data protection laws and U.S. national security regulations, including the Preventing Access to U.S. Sensitive Personal Data and Government-Related Data by Countries of Concern or Covered Persons Rule issued by the U.S. Department of Justice;
•foreign privacy and data protection laws and regulations and changes in these laws and regulations; and
•shifting consumer preferences regarding the viewing of video programming and consumption of entertainment content overall.
Events or developments related to these and other risks associated with international trade could adversely affect our revenues from non-U.S. sources as well as our costs, which could have a material adverse effect on our business, financial condition and results of operations. Furthermore, some foreign markets where we and our partners operate may be more adversely affected by current economic conditions than the U.S. We also may incur substantial expense as a result of changes, including the imposition of new restrictions, in the existing regulatory, economic or political environment in the regions where we do business.
The evolving regulatory environment in international markets may also impact strategy, costs and results of operations, including with respect to local programming levies and investment obligations, satisfaction of local content quotas, access to local production incentive schemes, and direct and indirect digital taxes or levies on internet-based programming services.
We are subject to domestic and international privacy and data protection laws, which impact our ability to collect and use personal information. Our efforts to comply with such laws, which are continually evolving, could impose costly obligations on us and generate additional regulatory and litigation risk.
We are subject to domestic and international laws associated with the acquisition, storage, disclosure, use and protection of personal data, including under the European General Data Protection Regulation, more than a dozen U.S. federal and state privacy laws, including, but not limited to, the CCPA, and many other international laws and regulations. These laws and regulations are continually evolving and many more U.S. state and federal laws and international laws may pass this year and over the next few years. See the discussion above in “Business – Regulatory Matters”. These evolving privacy, security, and data protection laws may require us to expend significant resources to implement additional data protection measures, and our actual or alleged failure to comply with such laws could result in legal claims, regulatory enforcement actions and significant fines and penalties.
Environmental, social and governance laws, and regulations may adversely impact our businesses.
U.S. regulators, international regulators, investors, consumers and other stakeholders are increasingly focused on environmental, social, and governance considerations. For example, domestic and international laws and regulations relating to environmental, social and governance matters, including environmental sustainability and climate change, human capital management, AI, and cybersecurity, are under consideration or have been adopted. Many such laws, including the European Union’s Corporate Sustainability Reporting Directive and the greenhouse gas emission regulations that have already been adopted in the state of California and that have been proposed in other jurisdictions, include specific, quantitative disclosures regarding our global operations, both upstream and downstream. These increased disclosure obligations have required and may continue to require us to implement new practices and reporting processes, and have created and may continue to create additional compliance risk. They may also result in increased costs relating to tracking, reporting and compliance.
Additionally, if we are unable to live up to evolving stakeholder expectations and industry standards for environmental, social and governance issues, or if we are perceived by consumers, stockholders or employees to have not responded appropriately with respect to these issues, our reputation, and therefore our ability to sell our products and services, could be negatively impacted. If, as a result of their assessment of our position on environmental, social, and governance matters, certain investors are unsatisfied with our actions, they may reconsider their investment in the Company. Providers of debt and equity financing may also consider our position on these issues and the ratings of external firms (which we have limited ability to influence) in their decisions involving the Company, which could impact our cost of capital and adversely affect our business.
Foreign exchange rate fluctuations may adversely affect our operating results and financial conditions.
We have significant operations in a number of foreign jurisdictions and certain of our operations are conducted and certain of our debt obligations are denominated in foreign currencies. The value of these foreign currencies fluctuates relative to the U.S. dollar. As a result, we have exposure to foreign currency risk as we enter into transactions and make investments denominated in multiple currencies. Adverse business performance and financial results from unforeseen changes in foreign currency exchange rates could increase our cost of borrowing or make it more difficult for us to obtain future financing, which could materially adversely affect our operating results and financial conditions. Where appropriate, we manage our exposure to foreign currency risk by entering into derivative instruments with counterparty banks, which exposes us to counterparty credit risk.
Our consolidated financial statements are denominated in U.S. dollars, and to prepare those financial statements we must translate the amounts of the assets, liabilities, net sales, other revenues and expenses of our operations outside of the U.S. from local currencies into U.S. dollars using exchange rates for the current period. This exposure to exchange rate fluctuations could have an adverse effect on our reported results of operations and net asset balances.
Increasing complexity of global tax policy and regulations could increase our tax liability and adversely impact our business and results of operations.
We continue to face the increasing complexity of operating a global business, and we are subject to ever-changing tax policy and regulations around the world. Many foreign jurisdictions are contemplating additional taxes and/or levies on over-the-top services, as well as on media advertising. Other changes in tax laws and the interpretations thereof, or the enactment of new tax legislation in the U.S. or abroad, could have a material impact on our tax liability. In addition, many foreign jurisdictions have increased scrutiny and have either changed, or plan to change, their international tax systems due to the Organisation for Economic Co-operation and Development’s Base Erosion and Profit Shifting recommendations. These recommendations include, among other things, profit reallocation rules and a 15% global minimum corporate income tax rate. Certain countries in which we operate have adopted legislation, and other countries are expected to introduce legislation, to implement these recommendations. The application of this legislation is evolving, and we continue to assess the potential impact on our future tax liability.
Additional complexity has also arisen with respect to state aid; i.e., state resources used to provide recipients an advantage on a selective basis that has or could distort competition and affect trade between European member states. In recent years the European Commission has increased their scrutiny of state aid and has deviated from historical E.U. state aid practices. We receive material amounts of financial incentives for conducting our content production activities in various jurisdictions that offer such incentives. If the E.U. were to restrict our ability to receive these incentives, such restrictions could have a material impact on our results of operations.
Risks Related to Our Acquisition and Integration of the WarnerMedia Business
Our efforts to operate as Warner Bros. Discovery following the integration of the legacy Discovery business and the WarnerMedia Business, continue to evolve due to the complicated nature of a business such as ours and the highly competitive, rapidly changing media industry. We may incur incremental, unforeseen costs, execution risks, and operational challenges, including those related to new operational systems and shifting priorities across business units, and the amount and timing of any such costs or challenges could materially adversely affect our business, financial condition, and results of operations.
On April 8, 2022, we completed the Merger in which we acquired the business, operations and activities that constituted the WarnerMedia Business of AT&T. Following the Merger, the size and complexity of the business of the combined Company increased significantly and we have undertaken considerable integration activities since that time. We have incurred significant costs following the closing of the Merger, including costs relating to organization restructuring, facility consolidation activities and other contract termination costs, which costs we believe were necessary to realize the anticipated cost synergies from the Merger. Our success depends, in part, upon our ability to continue to manage the expanded business of the combined Company following the Merger, in a highly competitive, rapidly changing industry, which could pose substantial challenges for management, including challenges related to the management and monitoring of diverse, complex operations and associated increased costs. To support the complex operations of the combined Company, we continue to implement integration initiatives, including integrating and enhancing the businesses’ administrative, accounting and information technology infrastructure and continuing to align and expand the geographic footprint of the DTC products for global customers. We have also announced plans to implement a reorganization of our corporate structure during 2025 to better align the combined Company with our strategic and operational objectives. Such integration and reorganization activities could result in business disruption or unexpected issues, higher than expected costs and an overall process that takes longer than originally anticipated. Even if the integration and reorganization are completed successfully, the full benefits of the Merger may not be achieved or sustained by the combined Company. All of these factors could materially adversely affect our stock price, business, financial condition, results of operations or cash flows.
We have been engaged in legal proceedings and disputes related to the Merger and could be subject to additional legal proceedings and disputes related to the Merger, the outcomes of which are uncertain and could negatively impact our business, financial condition and results of operations.
In connection with the Merger, multiple putative class action lawsuits relating to the Merger were filed on behalf of stockholders of the Company against the Company and/or certain of our directors, executive officers and large stockholders seeking damages and other relief, and we have been engaged in other disputes arising out of definitive agreements entered into in connection with the Merger. Additional lawsuits relating to the Merger, including claims for indemnification by other defendants in lawsuits relating to the Merger, or disputes arising out of definitive agreements entered into in connection with the Merger, could arise in the future. The outcomes of Merger-related lawsuits and disputes are uncertain and could negatively and materially impact our business, financial condition and results of operations. Even if we ultimately prevail in a lawsuit or dispute, defending against the claim or resolving the dispute could be time-consuming and costly and divert our management’s attention and resources away from our business, which could negatively and materially impact our business, financial condition and results of operations.
General Risks
Theft of our intellectual property, unauthorized duplication, distribution and exhibitions of our intellectual property, and other impairments of our intellectual property rights may decrease revenues and adversely affect our business, financial condition, and results of operations.
The success of our business depends in part on effective and deterrent laws efficiently implemented by law enforcement to enable our ability to maintain and enforce the intellectual property rights underlying our content and brands. We are a global media and entertainment company, and piracy or other infringement of our intellectual property (including digital content, feature films, television programming, gaming, and other content), brands and other intellectual property has the potential to materially adversely affect us. Piracy is particularly prevalent in parts of the world that do not effectively enforce intellectual property rights and laws. Even in territories like the U.S. that have stronger intellectual property laws, legal frameworks that are unresponsive to modern realities, combined with the lack of effective technological prevention and enforcement measures, may impede our enforcement efforts. Our enforcement activities depend in part on third parties, including technology and platform providers, whose cooperation and effectiveness cannot be assured to any degree. In addition, technological advances that allow the almost instantaneous unauthorized copying and downloading of content into digital formats without any degradation of quality from the original facilitate the rapid creation, transmission, and sharing of high-quality unauthorized copies. This is also true for broadcast signals, which can be retransmitted without any degradation of quality from the original via unauthorized services. Unauthorized distribution of copyrighted material over the internet is a threat to copyright owners’ ability to maintain the exclusive control over their copyrighted material and thus the value of their property. The proliferation of unauthorized use of our content may have a material adverse effect on our business and profitability. For example, it may reduce the revenue that we potentially could receive from the legitimate sale and distribution of our content. We may also need to spend significant amounts of money on improvement of technological platform security and enforcement activities, including litigation, to protect our intellectual property rights. Further, new technologies such as generative AI and their impact on our intellectual property rights remain uncertain, and development of the law in this area could impact our ability to protect against infringing uses or result in infringement claims against us.
Additionally, any impairment of our intellectual property rights, including due to changes in U.S. or foreign laws, the absence of effective legal protections or enforcement measures, or the inability to negotiate license or distribution agreements with third parties, could materially adversely impact our business, financial condition, and results of operations. As a global company, we are subject to laws in the U.S. and abroad, as well as trade agreements which may limit our ability to exploit our intellectual property. For example, in certain countries, including China, laws and regulations limit the number of foreign films exhibited in such countries in a calendar year.
Further, from time to time, third parties may also challenge the validity or scope of our intellectual property and may assert infringement claims against us, and the success of any such challenges could result in the limitation or loss of intellectual property rights. Irrespective of their validity, such claims may result in substantial costs and diversion of resources which could have an adverse effect on our operations.
Our success depends on attracting, developing, motivating and retaining key employees and creative talent within our business. Significant shortfalls in recruitment or retention, or failure to adequately motivate or compensate employees or creative talent, could adversely affect our ability to compete and achieve our strategic goals.
Attracting, developing, motivating and retaining talented employees are essential to the successful delivery of our products and services and success in the marketplace. Our business depends upon the continued efforts, abilities and expertise of our corporate and divisional executive teams and entertainment personalities, and the ability to attract and retain these talented employees and personalities is critical in the development and delivery of products and services, which is an integral component of our growth strategy. Competition for employees and personalities can be intense and if we are unable to successfully integrate, motivate and reward our current employees, we may not be able to retain them. If we are unable to retain these employees or attract new employees in the future, our ability to effectively compete with our competitors and to grow our business could be materially adversely affected. Additionally, following the Merger, we have undertaken a number of restructuring and transformation initiatives, including headcount reduction. This headcount reduction and other restructuring initiatives could disrupt our operations, adversely impact employee morale and our reputation as an employer, which could make it more difficult for us to retain existing employees and hire new employees in the future, distract management and harm our business overall.
In addition, we employ or contract with talent who may have loyal audiences. These individuals are important to audience endorsement of our programs and other content. There can be no assurance that these individuals will remain with us or retain their current audiences. If we fail to retain or attract key individuals or if our talent loses their current audience base or suffer negative publicity, our business, financial condition and results of operations could be materially adversely affected.
We face cybersecurity and related risks, which could lead to the disclosure of confidential information, disruption of our programming services, damage to our brands and reputation, legal liabilities, and financial losses.
We and our partners rely on various technology systems, including cloud services, content delivery, and other networks, in connection with the production, distribution and broadcast of our programming, and our online, mobile and app offerings, as well as our internal systems, involve the storage and transmission of personal and proprietary information. We are subject to risks caused by the misappropriation, misuse, falsification, or intentional or accidental release or loss of business or personal data or content maintained in our or our service providers’ systems, including personal and proprietary information of third parties, employees and users of our online, mobile and app offerings, business information, including intellectual property, or other confidential information. Additionally, remote access to our networks and systems and the networks and systems of our partners is substantial and may cause such networks and systems to be more vulnerable to cyberattacks or incidents.
In the ordinary course of our business, cyber criminals and other malicious actors consistently target us and our service providers. Our systems and our service providers’ systems have been breached in the past due to cybersecurity attacks. These systems may continue to be breached in the future due to employee error or misconduct, system vulnerabilities, malicious code, hacking and phishing attacks, malware, ransomware, or otherwise. In addition, despite efforts to detect cyber breaches,
cybersecurity attacks can persist for an extended period of time before being detected, and following detection, it may take
considerable time to understand the nature, scope, impact and timing of the cyberattack. The risk of cyberattacks may continue to increase as technologies evolve and cyber criminals conduct their attacks using more sophisticated methods, including those which use AI. We may be unable to anticipate these methods and implement adequate preventative measures.
The risk of cyberattacks has also increased and is expected to continue to increase in connection with geopolitical events and dynamics, including ongoing conflicts in Europe and the Middle East and tensions with Russia, China, North Korea, Iran and other states. State-sponsored parties or their supporters may launch retaliatory cyberattacks, and may attempt to cause supply chain disruptions, or carry out other geopolitically motivated retaliatory actions that may adversely disrupt or degrade our operations and may result in data compromise. In addition, our high-profile sports and entertainment programming and extensive news coverage of elections, sociopolitical events and public controversies may subject us to heightened cybersecurity risks. Cybersecurity threats originate from a wide variety of sources/malicious actors, including, but not limited to, persons who constitute an insider threat, who are involved with organized crime, or who may be linked to terrorist organizations or hostile foreign governments. Malicious actors have attempted to, and may continue to attempt to, fraudulently induce employees, customers, or other users of our systems to disclose sensitive information in order to gain access to our data systems or that of our service providers, customers or clients through social engineering, phishing, mobile phone malware, account takeovers, SIM card swapping, or similar methods.
We have implemented processes, strategies and incident response plans designed to identify, assess and manage cyber risks and information security vulnerabilities (as further described in Item 1C. Cybersecurity). However, our procedures may not be sufficient to adequately mitigate the negative impacts of a cyber breach or adverse event and we may not have adequate insurance coverage to compensate us for any losses that may occur. If our or our service providers’ information security systems or data are compromised, such compromises could result in a disruption of services or a reduction of the revenues we are able to generate from such services, damage to our brands and reputation, a loss of confidence in the security of our offerings and services, and significant legal, regulatory and financial exposure, each of which could potentially have an adverse effect on our business.
Our business, financial condition and results of operations may be negatively impacted by the outcome of uncertainties related to litigation.
From time to time, we are subject to a number of legal claims, regulatory investigations, litigation actions (asserted individually and/or on behalf of a class), and/or arbitration proceedings, both in the U.S. and in foreign countries, including, at any particular time, claims relating to antitrust, intellectual property, employment, wage and hour, consumer privacy, regulatory and tax proceedings, contractual and commercial disputes, and the production, distribution, and licensing of our content. We also spend substantial resources complying with various government standards, including any related investigations and litigation. We may incur significant expenses defending such suits or government charges and may be required to pay amounts or otherwise change our operations in ways that could materially adversely affect our business, financial condition and results of operations. This could result in an increase in our cost for defense or settlement of claims or indemnification obligations if we were to be found liable in excess of our historical experience. Even if we believe a claim is without merit, and/or we ultimately prevail, defending against the claim could be time-consuming and costly and divert our management’s attention and resources away from our business.
In addition, our insurance may not be adequate to protect us from all significant expenses related to pending and future claims and our current levels of insurance may not be available in the future at commercially reasonable prices. Any of these factors could adversely affect our business, financial condition and results of operations.
Global economic conditions and other global events may have an adverse effect on our business.
Our business is significantly affected by prevailing economic conditions and levels of consumer discretionary spending. A downturn in global economic conditions may negatively affect our current and potential customers, particularly advertisers whose expenditures are sensitive to general economic conditions, vendors and others with whom we do business and their ability to satisfy their obligations to us. For example, the imposition of tariffs by the U.S. government on imported goods and any retaliatory tariffs from foreign governments could result in increased costs and uncertainty that negatively affect global economic conditions and activity. In addition, inflationary conditions or an increase in price levels generally increases our content production costs and other costs of doing business, which could negatively affect our profitability. Further, a high interest rate environment, whether arising out of a policy response to inflationary conditions or otherwise, increases the costs of our securitization portfolio, which may also negatively affect our results of operations.
Decreases in consumer discretionary spending in the U.S. and other countries where our content is distributed may cause a decrease in cable television subscriptions, subscriptions to our DTC products, or movie theater attendance to view our feature films, among others, all of which may negatively affect our revenues and results of operations.
In addition, our business and operations has been, and in the future could be, disrupted or impacted by other global events, including political, social, or economic unrest, terrorism, hostilities, natural disasters such as earthquakes, or pandemics. For example, the COVID-19 pandemic had numerous effects on our business including a decrease in advertising revenues, a postponement of significant live events, and reduced movie theater attendance. Other global events in the future could disrupt our business and operations in unpredictable ways.
The market price of our common stock has been highly volatile and may continue to be volatile due, in part, to circumstances beyond our control.
The market price of our common stock has fluctuated, and may continue to fluctuate, due to many factors, some of which may be beyond our control. These factors include, without limitation:
•actual or anticipated variations in our financial and operating results;
•changes in our estimates, guidance or business plans;
•variations between our actual results and expectations of securities analysts, or changes in financial estimates and recommendations by securities analysts;
•market sentiment about our industry in general or our business in particular, including our level of debt, our leverage ratio, credit ratings, and our ability to effectively compete in the categories and industries in which we operate;
•sales of our stock in the public market by our stockholders, some of whom, together with their affiliates, hold large amounts of our stock;
•the activities, operating results or stock price of our competitors, or other industry participants;
•spending on domestic and foreign television and digital advertising;
•the announcement or completion of significant transactions by us or a competitor;
•overall general market fluctuations and other events affecting the stock market generally; and
•the economic and political conditions in the U.S. and internationally, as well as other factors described in this Item 1A.
Some of these factors may adversely impact the price of our common stock, regardless of our operating performance. Further, volatility in the price of our common stock may negatively impact our business, including by limiting our financing options for acquisitions and other business expansion.
Our participation in multiemployer defined benefit pension plans could subject us to liabilities that could adversely affect our business, financial condition and results of operations.
We contribute to various multiemployer defined benefit pension plans (the “multiemployer plans”) under the terms of collective bargaining agreements that cover certain of our union-represented employees which could subject us to liabilities in certain circumstances. The amount of funds we may be obligated to contribute to multiemployer plans in the future cannot be estimated, as these amounts are based on future levels of work of the union-represented employees covered by the multiemployer plans, investment returns and the funding status of such plans. As of December 31, 2024, we were an employer that provided more than 5% of total contributions to certain of the multiemployer plans in which we participate. If we choose to stop participating or substantially reduce participation in certain of these plans, we may be subject to a withdrawal liability. In addition, actions taken by any other participating employer that lead to a deterioration of the financial health of a multiemployer plan may result in the unfunded obligations of the multiemployer plan being borne by its remaining participating employers, including us. To the extent a multiemployer plan is underfunded or in endangered, seriously endangered or critical status, additional required contributions and benefit reductions may apply. We currently contribute to multiemployer plans that are underfunded, and, as such, under federal law we may be subject to substantial liabilities in the event of a complete or partial withdrawal from, or a voluntary or involuntary withdrawal from, or termination of, such plans. There can be no assurance that we will not be subject to liabilities in the future due to the foregoing or other circumstances that may arise in connection with these plans or that we can adequately mitigate these costs, any of which could materially adversely affect our business, financial condition and results of operations.
ITEM 1B. Unresolved Staff Comments.
None.
ITEM 1C. Cybersecurity.
We have a cybersecurity program to assess and manage risks to the confidentiality, integrity, and availability of our data, networks and technology assets across WBD. Our board of directors oversees risk management at WBD and has delegated functional oversight of cybersecurity and information technology risks to the Audit Committee. Our Chief Information Security Officer (“CISO”) is responsible for the management of such risks and oversees a global organization whose responsibilities include proactively managing and monitoring information and content security, cybersecurity risk, and processes to enable secure and resilient access to, and use of, WBD products and services. Our cybersecurity risk management processes are aligned and integrated into our overall enterprise risk management approach.
Risk Management and Strategy
We have a cybersecurity risk management strategy for safeguarding our digital assets that includes both technical and non-technical cybersecurity controls. Our multi-layered technical defense involves a series of protective measures across various levels of our technology environment. This includes fortifying our network perimeter through intrusion detection and prevention systems, securing individual devices with antivirus solutions and endpoint detection, implementing network security measures, and ensuring the resilience of applications. In addition to these technical security solutions, we also leverage non-technical methods, such as promoting a cybersecurity-conscious culture throughout WBD which includes mandatory annual cybersecurity training for all employees, a regular cadence of cybersecurity messaging to our employees, and frequent phishing simulations. Further, we engage independent third parties to conduct annual internal and external penetration testing and independent assessments of our cybersecurity risk management practices using the National Institute of Standards and Technology’s cybersecurity framework and other leading industry practices as guidelines. We also engage an independent third party to conduct a biennial cybersecurity maturity assessment to evaluate the maturity of our entire cybersecurity program.
We also invest in cybersecurity incident detection and response. Our Cybersecurity Operations Center provides continuous threat monitoring and anomaly detection that is intended to prevent or minimize damage from a cybersecurity attack. We have a Cybersecurity Incident Response Plan that establishes procedures, roles, responsibilities, and communication protocols for WBD executive management and technical staff in the event of a cybersecurity incident. We test the efficacy of the Cybersecurity Incident Response Plan and assess our response capabilities by conducting annual tabletop exercises that simulate cybersecurity threat scenarios.
We have ongoing processes to identify and assess cybersecurity risks associated with current and prospective third-party service providers. These processes include a vendor cybersecurity compliance assessment at the time of onboarding, contract renewal and/or as needed in the event of a cybersecurity incident affecting such third-party vendor. In addition, we require our providers to meet appropriate security requirements, controls and responsibilities and notify us in the event of a cybersecurity incident that impacts us.
We have established cybersecurity information sharing and collaboration practices with both government agencies and industry partners, which we believe enhances our overall cybersecurity resilience.
Governance
We have established a cybersecurity governance structure to engage appropriate stakeholders. Our CISO is informed about and monitors our prevention, detection, mitigation and remediation efforts related to cyber threats through regular communication and reporting from our information security team. Our Chief Financial Officer, our Chief Legal Officer, our Chief Audit and Risk Officer and our Chief Information Officer also have input and involvement in our cybersecurity program. Our board of directors has an active role, as a whole and at the committee level, in overseeing the Company’s overall risk management, including cybersecurity risks. Our board of directors has delegated responsibility for cybersecurity and information technology risks to our Audit Committee and is regularly informed about such risks through committee reports and other presentations. Our Audit Committee regularly reviews and discusses our cybersecurity risks and is updated quarterly by our CISO on how we identify, assess and mitigate those risks. Our Audit Committee receives quarterly updates from our CISO on our cybersecurity risk posture, the status of projects to strengthen and enhance our cybersecurity program, the evolving threat landscape, and cybersecurity incident reports and learnings. The Audit Committee also periodically devotes additional meeting time, as needed, to in-depth discussions on a particularly relevant cybersecurity topic or to education on developments in the realm of cybersecurity. In addition to the quarterly incident reports, cybersecurity incidents meeting pre-determined criteria are reported to the Audit Committee outside of regularly scheduled quarterly updates and to WBD executive management as needed.
Our CISO has over 30 years of expertise in global digital and information security, cybersecurity risk management, data privacy and compliance across diverse industries including media and entertainment, biotechnology, pharmaceuticals, financial services, and government defense sectors and holds multiple industry-recognized certifications including, among others, a Certificate of Cybersecurity Oversight from the National Association of Corporate Directors and a Certified Information Systems Security Professional certification.
We periodically experience cybersecurity incidents, but, as of December 31, 2024, we are not aware of any such incidents that have materially impacted or are reasonably likely to materially impact our business, financial condition or results of operations. However, despite our efforts, we cannot eliminate all risks from cybersecurity threats or provide assurances that we have not experienced undetected cybersecurity incidents or will not discover additional information about previously detected events. See Item 1A, “Risk Factors” for details on the risks from cybersecurity threats that we face.
ITEM 2. Properties.
The Company’s headquarters are located in New York City at 230 Park Ave. South. The Company owns and leases approximately 17 million square feet of offices; studios; technical, production and warehouse spaces; and other properties in numerous locations in the U.S. and around the world for its businesses. Each property is considered to be in good condition, adequate for its purpose, and suitably utilized according to the individual nature and requirements of the relevant operations housed within. The following table sets forth information as of December 31, 2024 with respect to the Company’s principal properties: | | | | | | | | | | | | | | | | | | | | |
| Location | | Principal Use | | Approximate
Square Footage | | Type of Ownership; Expiration Date of Lease |
Burbank, CA
4000 Warner Blvd. | | Studios | | 2,600,000 | | | Owned. |
New York, NY
30 Hudson Yards | | Studios, Networks, DTC, and Corporate | | 1,500,000 | | | Leased; expires in 2034. |
Leavesden, UK
Warner Drive (Studios); Studio Tour Drive (Studio Tour); 5 and 6 Hercules Way (Leavesden Park) | | Studios | | 1,300,000 | | | Owned. |
Atlanta, GA
1050 Techwood Drive | | Studios, Networks, DTC, and Corporate | | 1,170,000 | | | Owned. |
Burbank, CA
100 and 200 South California Street | | Studios and Corporate | | 811,000 | | | Leased; Tower 1 expires in 2037 and Tower 2 expires in 2039. |
| | | | | | | | | | | | | | | | | | | | |
| Location | | Principal Use | | Approximate
Square Footage | | Type of Ownership; Expiration Date of Lease |
Santiago, Chile
Pedro Montt 2354 | | Studios and Networks | | 610,000 | | | Owned |
Tokyo, Japan
1-1625-1, Kasuga-cho, Nerima-ku | | Studios | | 531,000 | | | Leased; expires in 2053. |
Burbank, CA
3000 West Alameda Avenue | | Studios | | 460,000 | | | Leased; expires in 2027. |
New York, NY
230 Park Ave. South | | Headquarters, Studios, Networks, DTC, and Corporate | | 360,000 | | | Leased; expires in 2037. |
Warsaw, Poland
Wiertnicza 166 | | Studios, Networks, DTC, and Corporate | | 335,000 | | | Owned. |
Culver City, CA
8900 Venice Boulevard | | Networks and DTC | | 244,000 | | | Leased; expires in 2036. |
Cardington, Bedfordshire, UK
Cardington Airfield, Shed 1 | | Studios | | 220,000 | | | Leased; expires in 2027. |
Radlett, UK
Ventura Park, Old Parkbury Lane | | Studios | | 198,000 | | | Leased; expires in 2028 and 2034. |
Atlanta, GA
3700 Atlanta Industrial Pkwy. | | Studios | | 177,000 | | | Leased; expires in 2025. |
Krakow, Poland
Plk. Dadka 2 | | Studios and Networks | | 151,000 | | | Leased; expires in 2026. |
London, England
98 Theobalds Road | | Networks, DTC, and Corporate | | 135,000 | | | Leased; expires in 2034. |
Buenos Aires, Argentina
599 and 533 Defensa Street | | Studios, Networks, DTC, and Corporate | | 129,000 | | | Owned. |
London, UK
160 Old Street | | Studios, Networks, DTC, and Corporate | | 116,000 | | | Leased; expires in 2034. |
London, UK
Chiswick Park, Bldg. 2 | | Studios, Networks, DTC, and Corporate | | 115,000 | | | Leased; expires in 2034. |
Richmond, Canada
13480 Crestwood Place | | Studios | | 114,000 | | | Leased; expires in 2030. |
Seattle, WA
1099 Stewart Street | | DTC | | 112,000 | | | Leased; expires in 2025. |
Hyderabad, India
Block A, International Tech Park | | Corp. | | 110,000 | | | Leased; expires in 2028. |
Washington, DC
820 First Street | | Studios and Networks | | 109,000 | | | Leased; expires in 2031. |
Mexico City, Mexico
Paseo de las Palmas, 425 Col.
Lomas de Chapultepec | | Corp. | | 85,000 | | | Leased; expires in 2029 |
Paris, France
L’Amiral, ZAC Forum Seine | | Networks, DTC, and Corporate | | 81,000 | | | Leased; expires in 2031. |
Auckland, New Zealand
2 and 3 Flower Street | | Studios, Networks, DTC, and Corporate | | 57,000 | | | Leased; expires in 2025. |
Sterling, VA
45580 Terminal Drive | | Studios, Networks, DTC, and Corporate | | 54,000 | | | Owned. |
Knoxville, TN
265 Brookview Center Way | | Networks and Corp. | | 53,000 | | | Leased; expires in 2033. |
Bellevue, WA
225 108th Avenue NE | | DTC | | 48,000 | | | Leased; expires in 2030. |
| | | | | | | | | | | | | | | | | | | | |
| Location | | Principal Use | | Approximate
Square Footage | | Type of Ownership; Expiration Date of Lease |
Silver Spring, MD
8403 Colesville Road | | Networks and Corporate | | 47,000 | | | Leased; expires in 2030. |
| | | | | | |
| Many of the listed locations are occupied by multiple segments; the most critical or the principal occupiers are listed here. |
ITEM 3. Legal Proceedings.
From time to time, in the normal course of its operations, the Company is subject to various litigation matters and claims, including claims related to employees, stockholders, vendors, other business partners, government regulations, or intellectual property, as well as disputes and matters involving counterparties to contractual agreements, such as disputes arising out of definitive agreements entered into in connection with the Merger. A determination as to the amount of the accrual required for such contingencies is highly subjective and requires judgment about future events. The Company may not currently be able to estimate the reasonably possible loss or range of loss for certain matters until developments in such matters have provided sufficient information to support an assessment of such loss. In the absence of sufficient information to support an assessment of the reasonably possible loss or range of loss, no accrual for such contingencies is made and no loss or range of loss is disclosed. (See Note 22 to the accompanying consolidated financial statements.) Although the outcome of these matters cannot be predicted with certainty and the impact of the final resolution of these matters on the Company’s results of operations in a particular subsequent reporting period is not known, management does not currently believe that the resolution of these matters will have a material adverse effect on the Company’s future consolidated financial position, future results of operations, or cash flows.
Between September 23, 2022 and October 24, 2022, two purported class action lawsuits (Collinsville Police Pension Board v. Discovery, Inc., et al., Case No. 1:22-cv-08171; Todorovski v. Discovery, Inc., et al., Case No. 1:22-cv-09125) were filed in the United States District Court for the Southern District of New York. The complaints named Warner Bros. Discovery, Inc., Discovery, Inc., David Zaslav, and Gunnar Wiedenfels as defendants. The complaints generally alleged that the defendants made false and misleading statements in SEC filings and in certain public statements relating to the Merger, in violation of Sections 11, 12(a)(2), and 15 of the Securities Act of 1933, as amended, and sought damages and other relief. On November 4, 2022, the court consolidated the Collinsville and Todorovski complaints under case number 1:22-CV-8171, and on December 12, 2022, the court appointed lead plaintiffs and lead counsel. On February 15, 2023, the lead plaintiffs filed an amended complaint adding Advance/Newhouse Partnership, Advance/Newhouse Programming Partnership, Steven A. Miron, Robert J. Miron, and Steven O. Newhouse as defendants. The amended complaint asserted violations of Sections 11, 12(a)(2), and 15 of the Securities Act of 1933, as amended, and sought damages and other relief. On February 5, 2024, the court dismissed the amended complaint with prejudice. On March 4, 2024, plaintiffs filed an appeal. On November 1, 2024, the United States Court of Appeals for the Second Circuit affirmed the February 5, 2024 judgment.
ITEM 4. Mine Safety Disclosures.
Not applicable.
Executive Officers of Warner Bros. Discovery, Inc.
As of February 27, 2025, the following individuals are the executive officers of the Company.
David M. Zaslav, President, Chief Executive Officer, and a director
Age: 65
Executive Officer since 2007
Mr. Zaslav has served as our President and Chief Executive Officer and a member of our board of directors since the closing of the Merger on April 8, 2022. Prior to the closing, Mr. Zaslav served as Discovery’s President and Chief Executive Officer from January 2007 until April 2022 and a common stock director of Discovery from September 2008 until April 2022.
Gunnar Wiedenfels, Chief Financial Officer
Age: 47
Executive Officer since 2017
Mr. Wiedenfels has served as our Chief Financial Officer since the closing of the Merger on April 8, 2022. Prior to the closing, Mr. Wiedenfels served as Discovery’s Chief Financial Officer from April 2017 until April 2022.
Priya Aiyar, Chief Legal Officer
Age: 50
Executive Officer since 2025
Ms. Aiyar joined the Company as our Chief Legal Officer on February 24, 2025. Prior to joining the Company, Ms. Aiyar served at American Airlines Group Inc., a global airline, as its Executive Vice President, Corporate Affairs and Chief Legal Officer from September 2022 to February 2025, its Senior Vice President, Corporate Affairs and Chief Legal Officer from January 2022 to September 2022, and its Senior Vice President and General Counsel from September 2019 to January 2022.
Bruce L. Campbell, Chief Revenue and Strategy Officer
Age: 57
Executive Officer since 2008
Mr. Campbell has served as our Chief Revenue and Strategy Officer since the closing of the Merger on April 8, 2022. Prior to the closing, he served as Discovery’s Chief Development, Distribution and Legal Officer. Mr. Campbell has served in several senior executive roles at Discovery, including as Chief Distribution Officer from October 2015 to April 2022, Chief Development Officer from August 2010 to April 2022, General Counsel from December 2010 to April 2017, Digital Media Officer from August 2014 to October 2015 and President, Digital Media & Corporate Development from March 2007 to August 2010.
Lori Locke, Chief Accounting Officer
Age: 61
Executive Officer since 2019
Ms. Locke has served as our Chief Accounting Officer since the closing of the Merger on April 8, 2022. Prior to the closing, Ms. Locke served as Discovery’s Chief Accounting Officer from June 2019 to April 2022.
Jean-Briac Perrette, CEO and President, Global Streaming and Games
Age: 53
Executive Officer since 2014
Mr. Perrette has served as our CEO and President of Global Streaming and Games since the closing of the Merger on April 8, 2022. Prior to the closing, he served as President and CEO of Discovery International (formerly referred to as Discovery Networks International) from June 2016 until April 2022, and served as President of Discovery Networks International from March 2014 to June 2016. Prior to that, Mr. Perrette served as Discovery’s Chief Digital Officer from October 2011 to February 2014.
Jennifer Remling, Chief People and Culture Officer
Age: 59
Executive Officer since 2024
Ms. Remling joined the Company in January 2024 and has served as our Chief People and Culture Officer since April 1, 2024. Prior to joining the Company, Ms. Remling served as Chief People Officer of WPP, a global advertising and marketing services company, from January 2016 to December 2023.
Gerhard Zeiler, President, International
Age: 69
Executive Officer since 2022
Mr. Zeiler has served as our President, International since the closing of the Merger on April 8, 2022. Prior to the closing, Mr. Zeiler served as President of WarnerMedia International from August 2020 to April 2022 and prior to that, Chief Revenue Officer of WarnerMedia from March 2019 to August 2020. Mr. Zeiler was President of Turner Broadcasting System International from May 2012 to February 2019.
PART II
ITEM 5. Market for Registrant’s Common Equity, Related Stockholder Matters and Issuer Purchases of Equity Securities.
WBD common stock is listed and traded on the Nasdaq Global Select Market (“Nasdaq”) under the symbol “WBD”.
As of February 13, 2025, there were approximately 669,356 holders of record of WBD common stock. This amount does not include the number of shareholders whose shares are held of record by banks, brokerage houses or other institutions, but includes each such institution as one shareholder.
We have not paid any cash dividends on WBD common stock and we have no present intention to do so. Payment of cash dividends, if any, will be determined by our board of directors after consideration of our earnings, financial condition and other relevant factors such as our credit facility’s restrictions on our ability to declare dividends in certain situations.
Stock Performance Graph
The following graph shows a comparison of cumulative total shareholder return, calculated on a dividend-reinvested basis, for (a) WBD common stock (which began trading on April 11, 2022) and Discovery Series A common stock, Series B convertible common stock, and Series C common stock (which ceased trading on April 8, 2022), (b) the Standard and Poor’s 500 Stock Index (“S&P 500 Index”), and (c) the Standard & Poor’s 500 Media and Entertainment Industry Group Index (“S&P 500 Media & Entertainment Index”) for the five years ended December 31, 2024. The graph assumes $100 was invested in each of Discovery Series A common stock, Series B convertible common stock, and Series C common stock, the S&P 500 Index, and the S&P 500 Media & Entertainment Index on December 31, 2019, and that $100 was invested in WBD common stock on April 11, 2022, the date on which it began trading. Note that historic stock price performance is not necessarily indicative of future stock price performance.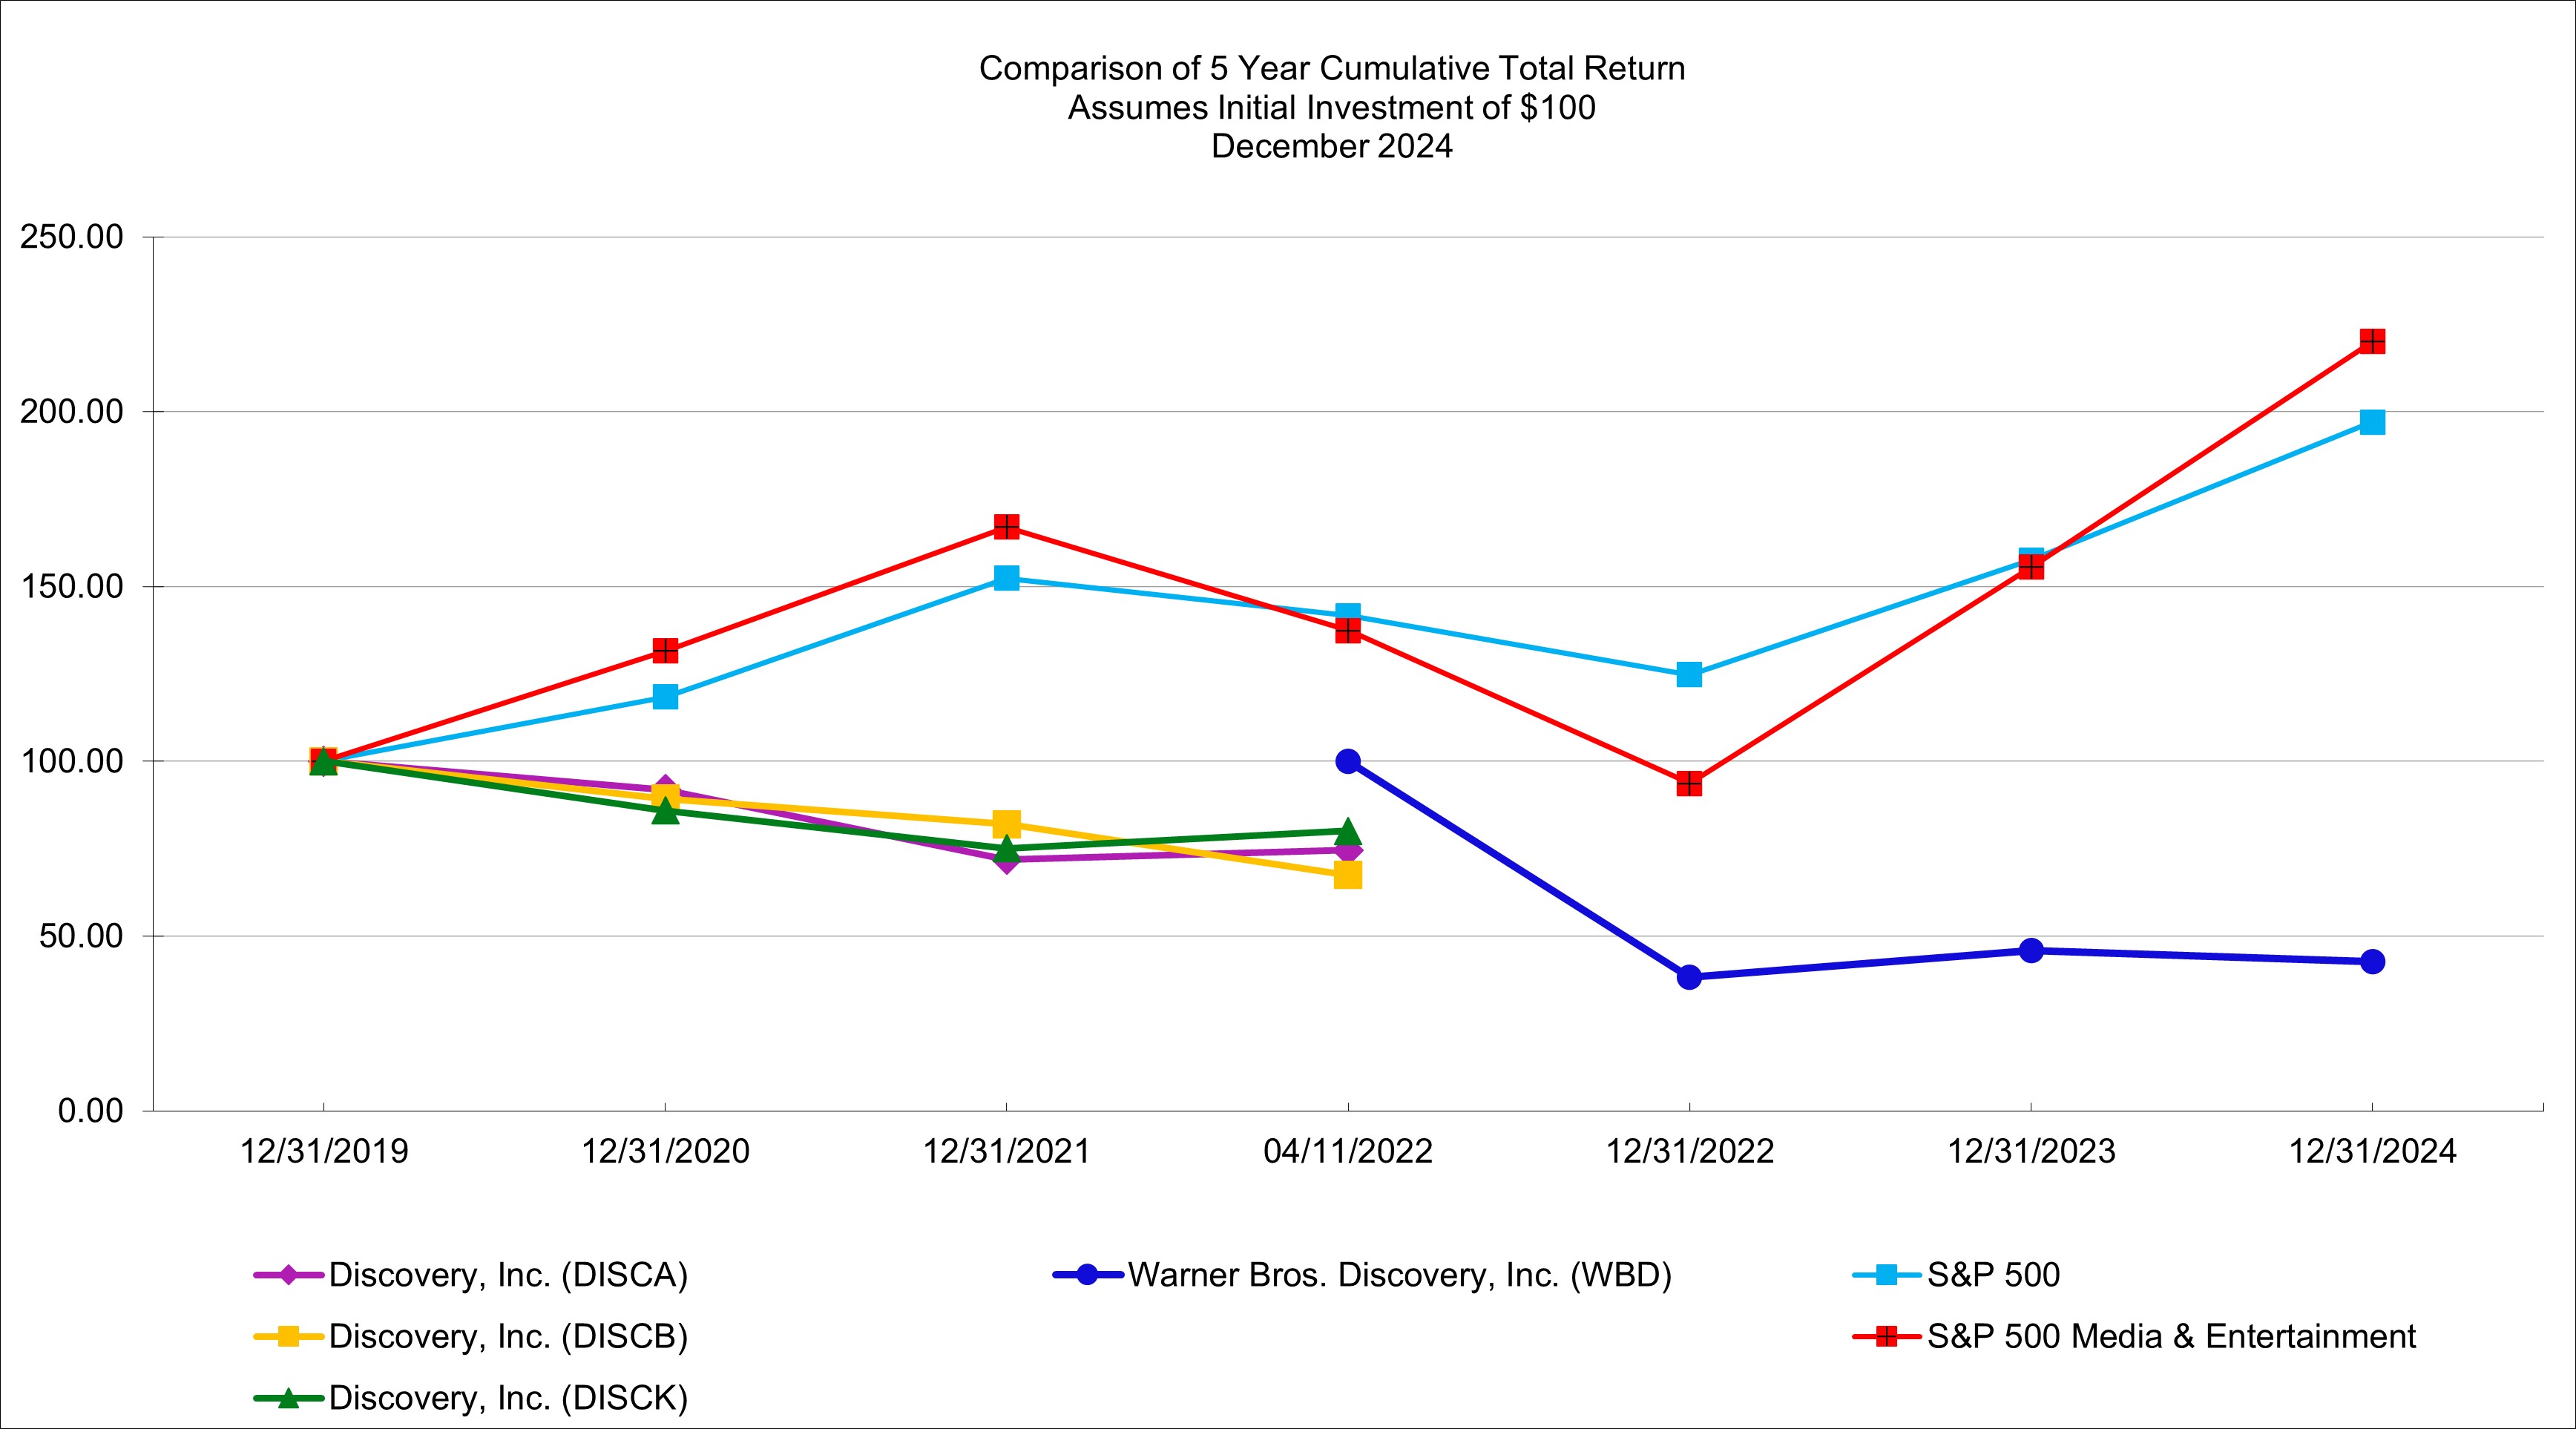
Note: Peer group indices use beginning of period market capitalization weighting.
Note: Index Data: Copyright Standard and Poor’s, Inc. Used with permission. All rights reserved.
Note: Prepared by Zacks Investment Research, Inc. Used with permission. All rights reserved. Copyright 1980-2025.
| | | | | | | | | | | | | | | | | | | | | | | | | | | | | | | | | | | | | | | | | | | | |
| | December 31, | | April 11, | | December 31, |
| | 2019 | | 2020 | | 2021 | | 2022 | | 2022 | | 2023 | | 2024 |
| WBD | | | | | | | | $ | 100.00 | | | $ | 38.26 | | | $ | 45.92 | | | $ | 42.66 | |
| DISCA | | $ | 100.00 | | | $ | 91.91 | | | $ | 71.90 | | | $ | 74.62 | | | $ | — | | | $ | — | | | $ | — | |
| DISCB | | $ | 100.00 | | | $ | 89.35 | | | $ | 82.05 | | | $ | 67.43 | | | $ | — | | | $ | — | | | $ | — | |
| DISCK | | $ | 100.00 | | | $ | 85.90 | | | $ | 75.11 | | | $ | 80.09 | | | $ | — | | | $ | — | | | $ | — | |
| S&P 500 Index | | $ | 100.00 | | | $ | 118.40 | | | $ | 152.39 | | | $ | 141.64 | | | $ | 124.79 | | | $ | 157.59 | | | $ | 197.02 | |
| S&P 500 Media & Entertainment Index | | $ | 100.00 | | | $ | 131.54 | | | $ | 166.98 | | | $ | 137.39 | | | $ | 93.66 | | | $ | 155.53 | | | $ | 220.01 | |
| | | | | | | | | | | | | | |
ITEM 6. [Reserved].
ITEM 7. Management’s Discussion and Analysis of Financial Condition and Results of Operations.
Management’s discussion and analysis of financial condition and results of operations is a supplement to and should be read in conjunction with the accompanying consolidated financial statements and related notes. This section provides additional information regarding our businesses, current developments, results of operations, cash flows, financial condition, contractual commitments, critical accounting policies, and estimates that require significant judgment and thus have the most significant potential impact on our consolidated financial statements. This discussion and analysis is intended to better allow investors to view the company from management’s perspective.
This section provides an analysis of our financial results for the fiscal year ended December 31, 2024 compared to the fiscal year ended December 31, 2023. A discussion of our results of operations and liquidity for the fiscal year ended December 31, 2023 compared to the fiscal year ended December 31, 2022 can be found under Item 7 in our Annual Report on Form 10-K for the fiscal year ended December 31, 2023, filed on February 23, 2024, which is available free of charge on the SEC’s website at www.sec.gov and our Investor Relations website at ir.wbd.com. The information contained on our website is not part of this Annual Report on Form 10-K and is not incorporated by reference herein.
BUSINESS OVERVIEW
On April 8, 2022, Discovery, a global media company that provides content across multiple distribution platforms, including linear, free-to-air, and broadcast television, authenticated GO applications, digital distribution arrangements, content licensing arrangements, and DTC subscription products, completed its Merger with the WarnerMedia Business of AT&T and changed its name from “Discovery, Inc.” to “Warner Bros. Discovery, Inc.” On April 11, 2022, our shares started trading on Nasdaq under the trading symbol WBD. (See Note 3 and Note 4 to the accompanying consolidated financial statements.)
Warner Bros. Discovery is a leading global media and entertainment company that creates and distributes a differentiated and comprehensive portfolio of content and products across television, film, streaming, interactive gaming, publishing, themed experiences, and consumer products through brands including: Discovery Channel, Max, CNN, DC Studios, TNT Sports, HBO, Food Network, TLC, TBS, Warner Bros. Motion Picture Group, Warner Bros. Television Group, Warner Bros. Games, Adult Swim, Turner Classic Movies, and others. For a discussion of our global portfolio see our business overview set forth in Item 1, “Business” in this Annual Report on Form 10-K.
In connection with the Merger, we have announced and taken actions to implement projects to achieve cost synergies for the Company. We finalized the framework supporting our ongoing restructuring and transformation initiatives during the year ended December 31, 2022, which included, among other things, strategic content programming assessments, organization restructuring, facility consolidation activities, and other contract termination costs. At that time, we expected to incur approximately $4.1 - $5.3 billion in pre-tax restructuring charges, of which we have incurred $4.7 billion as of December 31, 2024. Of the total expected pre-tax restructuring charges, we expected total cash expenditures to be $1.0 - $1.5 billion. While our restructuring efforts are ongoing, the Merger-related restructuring program was substantially completed at the end of 2024. During 2023, we initiated a strategic realignment plan associated with our Warner Bros. Pictures Animation group and during 2024, we initiated two additional restructuring initiatives; an organizational and personnel restructuring plan and a restructuring initiative associated with our Warner Bros. Games group.
As of December 31, 2024, we classified our operations in three reportable segments:
•Studios - Our Studios segment primarily consists of the production and release of feature films for initial exhibition in theaters, production and initial licensing of television programs to our networks/DTC services as well as third parties, distribution of our films and television programs to various third party and internal television and streaming services, distribution through the home entertainment market (physical and digital), related consumer products and themed experience licensing, and interactive gaming.
•Networks - Our Networks segment primarily consists of our domestic and international television networks.
•DTC - Our DTC segment primarily consists of our premium pay-TV and streaming services.
Our segment presentation was aligned with our management structure and the financial information management uses to make decisions about operating matters, such as the allocation of resources and business performance assessments.
For further discussion of financial information for our segments and the geographical areas in which we do business, our content development activities, and revenues, see our business overview set forth in Item 1, “Business” and Note 23 to the consolidated financial statements included in Item 8, “Financial Statements and Supplementary Data” in this Annual Report on Form 10-K.
RESULTS OF OPERATIONS
Foreign Exchange Impacting Comparability
The impact of exchange rates on our business is an important factor in understanding period-to-period comparisons of our results. For example, our international revenues are favorably impacted as the U.S. dollar weakens relative to other foreign currencies, and unfavorably impacted as the U.S. dollar strengthens relative to other foreign currencies. We believe the presentation of results on a constant currency basis (“ex-FX”), in addition to results reported in accordance with U.S. GAAP provides useful information about our operating performance because the presentation ex-FX excludes the effects of foreign currency volatility and highlights our core operating results. The presentation of results on a constant currency basis should be considered in addition to, but not a substitute for, measures of financial performance reported in accordance with U.S. GAAP.
The ex-FX change represents the percentage change on a period-over-period basis adjusted for foreign currency impacts. The ex-FX change is calculated as the difference between the current year amounts translated at a baseline rate, which is a spot rate for each of our currencies determined early in the fiscal year as part of our forecasting process (the “2024 Baseline Rate”), and the prior year amounts translated at the same 2024 Baseline Rate. In addition, consistent with the assumption of a constant currency environment, our ex-FX results exclude the impact of our foreign currency hedging activities, as well as realized and unrealized foreign currency transaction gains and losses. Results on a constant currency basis, as we present them, may not be comparable to similarly titled measures used by other companies.
Consolidated Results of Operations – 2024 vs. 2023
Our consolidated results of operations for 2024 and 2023 were as follows (in millions).
| | | | | | | | | | | | | | | | | | | | | | | | | | | | | | | | | |
| | Year Ended December 31, | | | | | | | |
| | 2024 | | 2023 | | | % Change | | % Change (ex-FX) | | |
| | | | | | | | | | | | | | | |
| Revenues: | | | | | | | | | | | | | | | |
| Distribution | | $ | 19,701 | | | | | $ | 20,237 | | | | | | (3) | % | | (1) | % | | |
| Advertising | | 8,090 | | | | | 8,700 | | | | | | (7) | % | | (7) | % | | |
| Content | | 10,297 | | | | | 11,203 | | | | | | (8) | % | | (8) | % | | |
| Other | | 1,233 | | | | | 1,181 | | | | | | 4 | % | | 4 | % | | |
| Total revenues | | 39,321 | | | | | 41,321 | | | | | | (5) | % | | (4) | % | | |
| Costs of revenues, excluding depreciation and amortization | | 22,970 | | | | | 24,526 | | | | | | (6) | % | | (6) | % | | |
| Selling, general and administrative | | 9,296 | | | | | 9,696 | | | | | | (4) | % | | (3) | % | | |
| Depreciation and amortization | | 7,037 | | | | | 7,985 | | | | | | (12) | % | | (12) | % | | |
| Restructuring and other charges | | 447 | | | | | 585 | | | | | | (24) | % | | (23) | % | | |
| Impairments and loss on dispositions | | 9,603 | | | | | 77 | | | | | | NM | | NM | | |
| Total costs and expenses | | 49,353 | | | | | 42,869 | | | | | | 15 | % | | 16 | % | | |
| Operating loss | | (10,032) | | | | | (1,548) | | | | | | NM | | NM | | |
| Interest expense, net | | (2,017) | | | | | (2,221) | | | | | | | | | | |
| Gain on extinguishment of debt | | 632 | | | | | 17 | | | | | | | | | | |
| Loss from equity investees, net | | (121) | | | | | (82) | | | | | | | | | | |
| Other income (expense), net | | 150 | | | | | (29) | | | | | | | | | | |
| Loss before income taxes | | (11,388) | | | | | (3,863) | | | | | | | | | | |
| Income tax (expense) benefit | | (94) | | | | | 784 | | | | | | | | | | |
| Net loss | | (11,482) | | | | | (3,079) | | | | | | | | | | |
| Net loss (income) attributable to noncontrolling interests | | 129 | | | | | (38) | | | | | | | | | | |
| Net loss (income) attributable to redeemable noncontrolling interests | | 42 | | | | | (9) | | | | | | | | | | |
| Net loss available to Warner Bros. Discovery, Inc. | | $ | (11,311) | | | | | $ | (3,126) | | | | | | | | | | |
| | | | | | | | | | | | | | | |
|
NM - Not meaningful
Unless otherwise indicated, the discussion of percent changes below is on an ex-FX basis. The ex-FX percent changes of line items below operating loss in the table above are not included as the activity is principally in U.S. dollars.
Revenues
Distribution revenues are generated from fees charged to network distributors, which include cable, DTH satellite, telecommunications and digital service providers, and DTC subscribers. The largest component of distribution revenue is comprised of linear distribution rights to our networks from cable, DTH satellite, and telecommunication service providers. We have contracts with distributors representing most cable and satellite service providers around the world, including the largest operators in the U.S. and major international distributors. Distribution revenues are largely dependent on the rates negotiated in the agreements, the number of subscribers that receive our networks, the number of platforms covered in the distribution agreement, and the market demand for the content that we provide. From time to time, renewals of multi-year carriage agreements include significant year one market adjustments to reset subscriber rates. In some cases, we have provided distributors launch incentives, in the form of cash payments or free periods, to carry our networks.
Distribution revenue decreased 1% in 2024, primarily attributable to an 8% decline in Networks domestic linear subscribers and our exit from our regional sports business (“AT&T SportsNets”) in the U.S., which had an unfavorable impact of $225 million for the year, partially offset by a 5% increase in domestic contractual affiliate rates, a 20% increase in DTC subscribers, and an increase in pricing following the launch of Max in Europe in 2024.
Advertising revenues are principally generated from the sale of commercial time on linear (television networks and authenticated TVE applications) and digital platforms (DTC subscription services and websites), and sold primarily on a national basis in the U.S. and on a pan-regional or local-language feed basis outside the U.S. Advertising contracts generally have a term of one year or less. Advertising revenue is dependent upon a number of factors, including the number of subscribers to our channels, viewership demographics, the popularity of our content, our ability to sell commercial time over a group of channels, the stage of development of television markets, and the popularity of free-to-air television. Revenue from advertising is subject to seasonality, market-based variations, the mix in sales of commercial time between the upfront and scatter markets, and general economic conditions. Advertising revenue is typically highest in the second and fourth quarters. In some cases, advertising sales are subject to ratings guarantees that require us to provide additional advertising time if the guaranteed audience levels are not achieved. We also generate revenue from the sale of advertising through our digital platforms on a stand-alone basis and as part of advertising packages with our television networks.
Advertising revenue decreased 7% in 2024, primarily attributable to audience declines in domestic linear networks of 18%, partially offset by an increase in domestic Max ad-lite subscribers.
Content revenues are generated from the release of feature films for initial exhibition in theaters, production of programs licensed for initial television/SVOD exhibition, the additional licensing of feature films and television programs to various television, SVOD and other digital markets, distribution of feature films and television programs in the physical and digital home entertainment market, sales of console games and mobile in-game content, sublicensing of sports rights, and licensing of intellectual property such as characters and brands.
Content revenue decreased 8% in 2024, primarily attributable to a 53% decrease in games revenue due to the strong performance of the 2023 slate, including Hogwarts Legacy, compared to the 2024 slate, and a 4% decrease in theatrical product revenue due to the strong prior year performance of Barbie, which was released in 2023, partially offset by the sublicensing of Olympic sports rights in Europe in the current year, which had a favorable impact of $576 million in 2024.
Other revenue primarily consists of studio production services and tours.
Other revenue increased 4% in 2024, primarily attributable to the opening of Warner Bros. Studio Tour Tokyo in June 2023, partially offset by the timing of services provided to the unconsolidated TNT Sports UK joint venture.
Costs of Revenues
Our principal component of costs of revenues is content expense. Content expense includes television/digital series, specials, films, games, and sporting events. Amortization related to both historical cost basis and any fair value adjustments to content arising from business combinations is included in costs of revenues. The costs of producing a content asset and bringing that asset to market consist of production costs, participation costs, and exploitation costs.
Costs of revenues decreased 6% in 2024, primarily attributable to lower content expense related to the amortization of purchase accounting fair value step-up for content, lower content expense commensurate with lower content revenue at DTC, and our exit from the AT&T SportsNet business, partially offset by the broadcast of the Olympics in Europe in the current year. The exit from the AT&T SportsNet business had a favorable impact to costs of revenues of $277 million for the year. The broadcast of the Olympics in Europe in the current year had an unfavorable impact to costs of revenues of $664 million.
Selling, General and Administrative
Selling, general and administrative expenses consist principally of employee costs, marketing costs, research costs, occupancy, and back office support fees.
Selling, general and administrative expenses decreased 3% in 2024, primarily attributable to lower marketing costs due to lower theatrical and games marketing expenses and the prior year launch of Max in the U.S., partially offset by the continuation of Max launches internationally.
Depreciation and Amortization
Depreciation and amortization expense includes depreciation of fixed assets and amortization of finite-lived intangible assets.
Depreciation and amortization decreased 12% in 2024, primarily attributable to intangible assets acquired during the Merger that are being amortized on an accelerated basis, partially offset by the shortening of the useful lives of certain intangible assets. (See Note 5 to the accompanying consolidated financial statements.)
Restructuring and Other Charges
Restructuring and other charges decreased 23% in 2024. Restructuring and other charges primarily includes contract terminations, facility consolidation activities, organizational restructuring, and other charges. (See Note 6 to the accompanying consolidated financial statements.)
Impairments and Loss on Dispositions
Impairments and loss on dispositions was a $9,603 million and $77 million loss in 2024 and 2023, respectively. The loss in 2024 was primarily attributable to a $9.1 billion pre-tax, non-cash goodwill impairment charge related to the Networks reporting unit during the second quarter of 2024 (see Note 5 to the accompanying consolidated financial statements) and $411 million right-of-use asset (“ROU asset”) impairment charges primarily related to the Hudson Yards, New York office lease. (See Note 12 to the accompanying consolidated financial statements.) The loss in 2023 was primarily attributable to lease ROU asset impairments and costs associated with our exit from AT&T SportsNets.
Interest Expense, net
Actual interest expense, net decreased $204 million in 2024, primarily attributable to lower debt during the period. (See Note 11 and Note 13 to the accompanying consolidated financial statements.)
Gain on extinguishment of debt
During 2024, we repaid in full at maturity $40 million of aggregate principal amount outstanding of our floating rate notes due March 2024 and we repurchased or repaid $5,923 million of aggregate principal amount outstanding of our senior notes. (See Note 11 to the accompanying consolidated financial statements.)
Loss from Equity Investees, net
Actual losses from our equity method investees were $121 million and $82 million in 2024 and 2023, respectively. The losses are attributable to our share of earnings and losses from our equity investees. (See Note 10 to the accompanying consolidated financial statements.)
Other Income (Expense), net
Other income (expense), net was $150 million and $(29) million in 2024 and 2023, respectively. The increase was primarily attributable to our gain on sale of equity method investments and an increase to the Merger related tax indemnification receivable accrual, partially offset by foreign currency losses. (See Note 18 to the accompanying consolidated financial statements.)
Income Tax Expense (Benefit)
Income tax expense (benefit) was $94 million and $(784) million, and the Company’s effective tax rate was (1)% and 20% for 2024 and 2023, respectively. In 2024, the Company recorded a non-cash goodwill impairment charge of $9.1 billion, the majority of which was not deductible for tax purposes. (See Note 5 to the accompanying consolidated financial statements.) For the year ended December 31, 2024, the increase in income tax expense compared to the same period in 2023 was primarily attributable to a decrease in pre-tax book loss (excluding the non-cash goodwill impairment charge), an increase in state and local income taxes (including a state deferred tax adjustment recorded in the year ended December 31, 2024 and a one-time favorable release of an unrecognized state tax benefit in 2023 that did not recur in 2024), and a one-time favorable release of an unrecognized U.S. tax benefit in 2023 that did not recur in 2024. (See Note 16 to the accompanying consolidated financial statements.)
Income tax expense for 2024 reflects an effective income tax rate that differs from the federal statutory tax rate primarily attributable to the non-deductible goodwill impairment charge and the effect of foreign operations.
The Organisation for Economic Co-operation and Development’s (“OECD”) Pillar Two Global Anti-Base Erosion (“GloBE”) model rules, issued under the OECD Inclusive Framework on Base Erosion and Profit Shifting, introduce a global minimum tax of 15% applicable to multinational enterprise groups with consolidated financial statement revenue in excess of €750 million. Numerous foreign jurisdictions have already enacted tax legislation based on the GloBE rules, with some effective as early as January 1, 2024. As of December 31, 2024, we recognized a nominal income tax expense for Pillar Two GloBE minimum tax. The Company is continuously monitoring the evolving application of this legislation and assessing its potential impact on our future tax liability.
Segment Results of Operations – 2024 vs. 2023
The Company evaluates the operating performance of its operating segments based on financial measures such as revenues and Adjusted EBITDA. Adjusted EBITDA is defined as operating income excluding:
•employee share-based compensation;
•depreciation and amortization;
•restructuring and facility consolidation;
•certain impairment charges;
•gains and losses on business and asset dispositions;
•third-party transaction and integration costs;
•amortization of purchase accounting fair value step-up for content;
•amortization of capitalized interest for content; and
•other items impacting comparability.
Management believes that Adjusted EBITDA is an appropriate measure for evaluating the operating performance of the Company’s operating segments because it is the primary measure used by the Company’s chief operating decision maker to assess the operating results and performance of the segments, perform analytical comparisons, identify strategies to improve performance, and allocate resources to each segment. (See Note 23 to the accompanying consolidated financial statements.)
The table below presents our Adjusted EBITDA by segment (in millions).
| | | | | | | | | | | | | | | | | | | | | | |
| | | Year Ended December 31, | | | | |
| | | 2024 | | 2023 | | % Change | | |
| | | | | | | | |
| | | | | | | | |
| | | | | | | | |
| | | | | | | | |
| | | | | | | | |
| | | | | | | | |
| | | | | | | | |
| | | | | | | | |
| | | | | | | | |
| | | | | | | | |
| | | | | | | | |
| | | | | | | | |
| | | | | | | | |
| | | | | | | | |
| | | | | | | | |
| | | | | | | | |
| | | | | | | | |
| | | | | | | | |
| | | | | | | | |
| | | | | | | | |
| | | | | | | | |
| | | | | | | | |
| Studios | | $ | 1,652 | | | $ | 2,183 | | | (24) | % | | |
| Networks | | 8,149 | | | 9,063 | | | (10) | % | | |
| DTC | | 677 | | | 103 | | | NM | | |
| Corporate | | (1,260) | | | (1,242) | | | (1) | % | | |
| Inter-segment eliminations | | (186) | | | 93 | | | NM | | |
| | | | | | | | |
Studios Segment
The following table presents, for our Studios segment, revenues by type, certain operating expenses, Adjusted EBITDA and a reconciliation of Adjusted EBITDA to operating income (in millions). | | | | | | | | | | | | | | | | | | | | | | | | | | | | | | | | | |
| | | Year Ended December 31, | | | | | | | |
| | | 2024 | | 2023 | | | % Change | | % Change (ex-FX) | | |
| | | | | | | | | | | | | | | |
| Revenues: | | | | | | | | | | | | | | | |
| Distribution | | $ | 8 | | | | | $ | 17 | | | | | | (53) | % | | (53) | % | | |
| Advertising | | 5 | | | | | 15 | | | | | | (67) | % | | (67) | % | | |
| Content | | 10,717 | | | | | 11,358 | | | | | | (6) | % | | (5) | % | | |
| Other | | 877 | | | | | 802 | | | | | | 9 | % | | 9 | % | | |
| Total revenues | | 11,607 | | | | | 12,192 | | | | | | (5) | % | | (5) | % | | |
| Costs of revenues, excluding depreciation and amortization | | 7,530 | | | | | 7,296 | | | | | | 3 | % | | 3 | % | | |
| Selling, general and administrative | | 2,425 | | | | | 2,713 | | | | | | (11) | % | | (11) | % | | |
| Adjusted EBITDA | | 1,652 | | | | | 2,183 | | | | | | (24) | % | | (23) | % | | |
| Depreciation and amortization | | 702 | | | | | 667 | | | | | | | | | | |
| Employee share-based compensation | | (1) | | | | | — | | | | | | | | | | |
| Restructuring and other charges | | 263 | | | | | 225 | | | | | | | | | | |
| Transaction and integration costs | | 2 | | | | | 7 | | | | | | | | | | |
| Facility consolidation costs | | 1 | | | | | — | | | | | | | | | | |
| Impairment and amortization of fair value step-up for content | | 96 | | | | | 995 | | | | | | | | | | |
| Amortization of capitalized interest for content | | 46 | | | | | 46 | | | | | | | | | | |
| Inter-segment eliminations | | — | | | | | 31 | | | | | | | | | | |
| Impairments and loss on dispositions | | 14 | | | | | 1 | | | | | | | | | | |
| Operating income | | $ | 529 | | | | | $ | 211 | | | | | | | | | | |
| | | | | | | | | | | | | | | |
|
Unless otherwise indicated, the discussion of percent changes below is on an ex-FX basis. The Studios discussion below also includes intra-segment revenue and expense between product lines, which represented less than 3% of total revenues and operating expenses for this segment for the year ended December 31, 2024. Intra-segment revenue and expense are eliminated at the Studios segment level.
Fluctuations in results for our Studios segment may occur due to various factors, including (but not limited to) the timing and number of new film releases each quarter, the timing of marketing expenses recognized relative to (i.e., prior to) a film’s release, and the mix of content distributed each period.
Revenues
Content revenue decreased 5% in 2024, primarily attributable to a 53% decrease in games revenue, and a 4% decrease in theatrical product revenue, partially offset by a 9% increase in television product revenue.
•The decrease in games revenue was primarily attributable to the strong performance of the 2023 slate, including Hogwarts Legacy, compared to the 2024 slate.
•The decrease in theatrical product revenue was attributable to lower film rental revenue and intra-segment licensing revenue, partially offset by higher home entertainment revenue. Film rental revenue decreased due to the strong prior year performance of Barbie, which was released in 2023, partially offset by higher carryover releases from 2023 compared to 2022. Home entertainment revenue increased due to the performance of Dune: Part Two, Godzilla x Kong: The New Empire, Wonka, Aquaman 2, and Beetlejuice Beetlejuice and higher catalog sales.
•The increase in television product revenue was attributable to higher intercompany content sales and higher initial telecast revenue due to the impact of the WGA and SAG-AFTRA strikes in the prior year, partially offset by lower third-party content sales.
Other revenue increased 9% in 2024, primarily attributable to the opening of Warner Bros. Studio Tour Tokyo in June 2023.
Costs of Revenues
Costs of revenues increased 3% in 2024, primarily attributable to a 4% increase in theatrical product content expense due to product mix and higher development costs, and a 1% increase in games content expense due to impairments of $384 million, partially offset by lower intra-segment licensing costs. Television product content expense was flat in 2024, as higher content expense commensurate with higher revenues was offset by favorable product mix and lower development costs.
Selling, General and Administrative
Selling, general and administrative expenses decreased 11% in 2024, primarily attributable to lower theatrical marketing expenses due to fewer new releases and lower games marketing expenses.
Adjusted EBITDA
Adjusted EBITDA decreased 23% in 2024.
Networks Segment
The table below presents, for our Networks segment, revenues by type, certain operating expenses, Adjusted EBITDA and a reconciliation of Adjusted EBITDA to operating (loss) income (in millions). | | | | | | | | | | | | | | | | | | | | | | | | | | | | | | | | | |
| | | Year Ended December 31, | | | | | | | |
| | | 2024 | | 2023 | | | % Change | | % Change (ex-FX) | | |
| | | | | | | | | | | | | | | |
| Revenues: | | | | | | | | | | | | | | | |
| Distribution | | $ | 10,680 | | | | | $ | 11,521 | | | | | | (7) | % | | (6) | % | | |
| Advertising | | 7,306 | | | | | 8,342 | | | | | | (12) | % | | (12) | % | | |
| Content | | 1,848 | | | | | 1,005 | | | | | | 84 | % | | 83 | % | | |
| Other | | 341 | | | | | 376 | | | | | | (9) | % | | (10) | % | | |
| Total revenues | | 20,175 | | | | | 21,244 | | | | | | (5) | % | | (4) | % | | |
| Costs of revenues, excluding depreciation and amortization | | 9,238 | | | | | 9,342 | | | | | | (1) | % | | — | % | | |
| Selling, general and administrative | | 2,788 | | | | | 2,839 | | | | | | (2) | % | | (1) | % | | |
| Adjusted EBITDA | | 8,149 | | | | | 9,063 | | | | | | (10) | % | | (10) | % | | |
| Depreciation and amortization | | 4,172 | | | | | 4,961 | | | | | | | | | | |
| | | | | | | | | | | | | | | |
| Restructuring and other charges | | 85 | | | | | 201 | | | | | | | | | | |
| Transaction and integration costs | | 2 | | | | | 3 | | | | | | | | | | |
| | | | | | | | | | | | | | | |
| Impairment and amortization of fair value step-up for content | | 495 | | | | | 473 | | | | | | | | | | |
| | | | | | | | | | | | | | | |
| Inter-segment eliminations | | — | | | | | 90 | | | | | | | | | | |
| Impairments and loss on dispositions | | 9,154 | | | | | 13 | | | | | | | | | | |
| Operating (loss) income | | $ | (5,759) | | | | | $ | 3,322 | | | | | | | | | | |
| | | | | | | | | | | | | | | |
|
Unless otherwise indicated, the discussion of percent changes below is on an ex-FX basis.
Revenues
Distribution revenue decreased 6% in 2024, primarily attributable to an 8% decline in domestic linear subscribers for the year, partially offset by a 5% increase in domestic contractual affiliate rates. In addition, the exit from the AT&T SportsNet business had an unfavorable impact of $225 million for the year. Declines in linear subscribers are expected to continue.
Advertising revenue decreased 12% in 2024, primarily attributable to audience declines in domestic networks of 18% for the year, and continued softness in the U.S. linear advertising market.
Content revenue increased by 83% in 2024, primarily attributable to the sublicensing of Olympic sports rights in Europe in the current year, which had a favorable impact of $576 million, and timing of third-party licensing deals.
Other revenue decreased 10% in 2024, primarily attributable to the timing of services provided to the unconsolidated TNT Sports UK joint venture.
Costs of Revenues
Costs of revenues was flat in 2024. Sports-related content expense increased in 2024 primarily due to the broadcast of the Olympics in Europe in the current year and the acquisition of new sports rights, partially offset by our exit from the AT&T SportsNet business and the allocation of U.S. sports costs to DTC. The increase in sports-related content expense was further offset by lower entertainment content expense in 2024. Our exit from the AT&T SportsNet business had a favorable impact to costs of revenues of $277 million and the broadcast of the Olympics in Europe had an unfavorable impact to costs of revenues of $664 million in the current year.
Selling, General and Administrative
Selling, general and administrative expenses decreased 1% in 2024.
Adjusted EBITDA
Adjusted EBITDA decreased 10% in 2024.
DTC Segment
The following table presents, for our DTC segment, revenues by type, certain operating expenses, Adjusted EBITDA and a reconciliation of Adjusted EBITDA to operating loss (in millions). | | | | | | | | | | | | | | | | | | | | | | | | | | | | | | | | | |
| | | Year Ended December 31, | | | | | | | |
| | | 2024 | | 2023 | | | % Change | | % Change (ex-FX) | | |
| | | | | | | | | | | | | | | |
| Revenues: | | | | | | | | | | | | | | | |
| Distribution | | $ | 9,022 | | | | | $ | 8,703 | | | | | | 4 | % | | 5 | % | | |
| Advertising | | 855 | | | | | 548 | | | | | | 56 | % | | 57 | % | | |
| Content | | 428 | | | | | 886 | | | | | | (52) | % | | (51) | % | | |
| Other | | 8 | | | | | 17 | | | | | | (53) | % | | (50) | % | | |
| Total revenues | | 10,313 | | | | | 10,154 | | | | | | 2 | % | | 2 | % | | |
| Costs of revenues, excluding depreciation and amortization | | 7,459 | | | | | 7,623 | | | | | | (2) | % | | (2) | % | | |
| Selling, general and administrative | | 2,177 | | | | | 2,428 | | | | | | (10) | % | | (9) | % | | |
| Adjusted EBITDA | | 677 | | | | | 103 | | | | | | NM | | NM | | |
| Depreciation and amortization | | 1,831 | | | | | 2,063 | | | | | | | | | | |
| | | | | | | | | | | | | | | |
| | | | | | | | | | | | | | | |
| Restructuring and other charges | | 3 | | | | | 66 | | | | | | | | | | |
| Transaction and integration costs | | (1) | | | | | 4 | | | | | | | | | | |
| | | | | | | | | | | | | | | |
| Impairment and amortization of fair value step-up for content | | 282 | | | | | 460 | | | | | | | | | | |
| | | | | | | | | | | | | | | |
| Inter-segment eliminations | | — | | | | | 72 | | | | | | | | | | |
| Impairments and loss on dispositions | | 47 | | | | | 3 | | | | | | | | | | |
| Operating loss | | $ | (1,485) | | | | | $ | (2,565) | | | | | | | | | | |
| | | | | | | | | | | | | | | |
|
Unless otherwise indicated, the discussion of percent changes below is on an ex-FX basis.
Revenues
Subscriber information (as defined under Item 1. “Business”) consisted of the following (in millions).
| | | | | | | | | | | | | | | | | | | | |
| | December 31, 2024 | | December 31, 2023 | | % Change |
| Total Domestic subscribers | | 57.1 | | | 52.0 | | | 10 | % |
| Total International subscribers | | 59.8 | | | 45.6 | | | 31 | % |
| Total DTC subscribers | | 116.9 | | | 97.7 | | | 20 | % |
Distribution revenue increased 5% in 2024, primarily attributable to a 20% increase in subscribers and an increase in pricing following the launch of Max in Europe and Latin America in 2024, partially offset by continued domestic linear wholesale subscriber declines.
Advertising revenue increased 57% in 2024, primarily attributable to an increase in domestic ad-lite subscribers.
Global ARPU consisted of the following.
| | | | | | | | | | | | | | | | | | | | | | |
| | Year Ended December 31, | | | | |
| | 2024 | | 2023 | | % Change (ex-FX) | | |
| Domestic ARPU | | $ | 11.89 | | | $ | 11.20 | | | 6 | % | | |
| International ARPU | | $ | 3.85 | | | $ | 3.85 | | | 4 | % | | |
| Global ARPU1 | | $ | 7.76 | | | $ | 7.78 | | | 1 | % | | |
Global ARPU increased 1% in 2024, primarily attributable to subscriber growth of the ad-lite tier domestically, higher pricing, and a continuing subscriber mix shift from linear wholesale, partially offset by growth in lower ARPU international markets.
Content revenue decreased 51% in 2024, primarily attributable to fewer third-party licensing deals.
Costs of Revenues
Cost of revenues decreased 2% in 2024, primarily attributable to lower content expense commensurate with lower content revenue, partially offset by the allocation of U.S. sports from the Networks segment.
Selling, General, and Administrative Expenses
Selling, general and administrative expenses decreased 9% in 2024, primarily attributable to lower marketing costs due to the launch of Max in 2023 in the U.S., partially offset by higher overhead expenses and the continuation of Max launches internationally.
Adjusted EBITDA
Adjusted EBITDA increased $574 million in 2024. The broadcast of the Olympics in Europe negatively impacted Adjusted EBITDA by $33 million.
Corporate
The following table presents our Adjusted EBITDA and a reconciliation of Adjusted EBITDA to operating loss (in millions): | | | | | | | | | | | | | | | | | | | | | | | | | | | | | | | | | |
| | | Year Ended December 31, | | | | | | | |
| | | 2024 | | 2023 | | | % Change | | % Change (ex-FX) | | |
| | | | | | | | | | | | | | | |
| | | | | | | | | | | | | | | |
| | | | | | | | | | | | | | | |
| | | | | | | | | | | | | | | |
| Adjusted EBITDA | | $ | (1,260) | | | | | $ | (1,242) | | | | | | (1) | % | | (3) | % | | |
| Employee share-based compensation | | 547 | | | | | 488 | | | | | | | | | | |
| Depreciation and amortization | | 332 | | | | | 294 | | | | | | | | | | |
| Restructuring and other charges | | 96 | | | | | 95 | | | | | | | | | | |
| Transaction and integration costs | | 239 | | | | | 148 | | | | | | | | | | |
| Impairments and loss on dispositions | | 388 | | | | | 60 | | | | | | | | | | |
| Facility consolidation costs | | 3 | | | | | 32 | | | | | | | | | | |
| Impairment and amortization of fair value step-up for content | | 2 | | | | | (6) | | | | | | | | | | |
| | | | | | | | | | | | | | | |
| Inter-segment eliminations | | — | | | | | (193) | | | | | | | | | | |
| Operating loss | | $ | (2,867) | | | | | $ | (2,160) | | | | | | | | | | |
Corporate operations primarily consist of executive management and administrative support services, which are recorded in selling, general and administrative expense, as well as substantially all of our share-based compensation and third-party transaction and integration costs.
Adjusted EBITDA decreased 3% in 2024, primarily attributable to higher securitization expenses and overhead expenses, partially offset by lower facility costs due to office consolidations and closures and lower personnel costs.
1ARPU: The Company defines DTC Average Revenue Per User (“ARPU”) as total subscription revenue plus net advertising revenue for the period divided by the daily average number of paying subscribers for the period. Where daily values are not available, the sum of beginning of period and end of period divided by two is used.
Excluded from the ARPU calculation are: (i) Revenue and subscribers for DTC products, other than discovery+, HBO, HBO Max, Max, a Premium Sports Product, and independently-branded, regional products (currently consisting of TVN/Player and BluTV), that may be offered by us or by certain joint venture partners or affiliated parties from time to time; (ii) A limited amount of international discovery+ revenue and subscribers that are part of non-strategic partnerships or short-term arrangements as may be identified by the Company from time to time; (iii) Cinemax, Max/HBO hotel and bulk institution (i.e., subscribers billed on a bulk basis), and international basic HBO revenue and subscribers; and (iv) Users on free trials who convert to a subscription for which we have recognized subscription revenue within the first seven days of the calendar month immediately following the month in which their free trial expires.
Inter-segment Eliminations
The following table presents our inter-segment eliminations by revenue and expense, Adjusted EBITDA and a reconciliation of Adjusted EBITDA to operating loss (in millions): | | | | | | | | | | | | | | | | | | | |
| | | Year Ended December 31, |
| | | 2024 | | 2023 |
| | | | | | | | | |
| Inter-segment revenue eliminations | | $ | (2,782) | | | | | $ | (2,269) | | | | |
| Inter-segment expense eliminations | | (2,596) | | | | | (2,362) | | | | |
| Adjusted EBITDA | | (186) | | | | | 93 | | | | |
| | | | | | | | | |
| | | | | | | | | |
| Restructuring and other charges | | — | | | | | (2) | | | | |
| | | | | | | | | |
| | | | | | | | | |
| Impairment and amortization of fair value step-up for content | | 264 | | | | | 451 | | | | |
| | | | | | | | | |
| | | | | | | | | |
| Operating loss | | $ | (450) | | | | | $ | (356) | | | | |
Inter-segment revenue and expense eliminations primarily represent inter-segment content transactions and marketing and promotion activity between reportable segments. In our current segment structure, in certain instances, production and distribution activities are in different segments. Inter-segment content transactions are generally presented at market value (i.e., the segment producing and/or licensing the content reports revenue and profit from inter-segment transactions in a manner similar to the reporting of third-party transactions, and the required eliminations are reported on the separate “Eliminations” line when presenting our summary of segment results). Generally, timing of revenue recognition is similar to the reporting of third-party transactions. The segment distributing the content, e.g., via our DTC or linear services, capitalizes the cost of inter-segment content transactions, including “mark-ups” and amortizes the costs over the shorter of the license term, if applicable, or the expected period of use. The content amortization expense related to the inter-segment profit is also eliminated on the separate “Eliminations” line when presenting our summary of segment results.
LIQUIDITY AND CAPITAL RESOURCES
Liquidity
Sources of Cash
Historically, we have generated a significant amount of cash from operations. During 2024, we funded our working capital needs primarily through cash flows from operations. As of December 31, 2024, we had $5.3 billion of cash and cash equivalents on hand. We are a well-known seasoned issuer and have the ability to conduct registered offerings of securities, including debt securities, common stock and preferred stock, on short notice, subject to market conditions. Access to sufficient capital from the public market is not assured. We have a $6.0 billion revolving credit facility and commercial paper program described below. We also participate in a revolving receivables program and an accounts receivable factoring program described below.
•Debt
Senior Notes
During the year ended December 31, 2024, we issued €650 million of 4.302% fixed rate senior notes due January 2030 and €850 million of 4.693% fixed rate senior notes due May 2033. After December 2029 and February 2033, respectively, the senior notes are redeemable at par plus accrued and unpaid interest.
Revolving Credit Facility and Commercial Paper
We have a multicurrency revolving credit agreement (the “Credit Agreement”) and have the capacity to borrow up to $6.0 billion under the Credit Agreement (the “Credit Facility”). We may also request additional commitments up to $1.0 billion from the lenders upon the satisfaction of certain conditions. The Credit Agreement contains customary representations and warranties as well as affirmative and negative covenants. As of December 31, 2024, we were in compliance with all covenants and there were no events of default under the Credit Agreement.
Additionally, our commercial paper program is supported by the Credit Facility. Under the commercial paper program, we may issue up to $1.0 billion. Borrowing capacity under the Credit Facility is effectively reduced by any outstanding borrowings under the commercial paper program.
During the year ended December 31, 2024, we borrowed and repaid $14,203 million under our Credit Facility and commercial paper program. As of December 31, 2024 and 2023, we had no outstanding borrowings under the Credit Facility or the commercial paper program.
Term Loans
In January 2025, we entered into a new $1,500 million 364-day senior unsecured term loan credit facility. The proceeds were used to the fund the redemption of $1,500 million aggregate principal amount of our 6.412% senior notes due 2026.
•Revolving Receivables Program
We have a revolving agreement to transfer up to $5,200 million of certain receivables through our bankruptcy-remote subsidiary, Warner Bros. Discovery Receivables Funding, LLC, to various financial institutions on a recurring basis in exchange for cash equal to the gross receivables transferred. We service the sold receivables for the financial institution for a fee and pay fees to the financial institution in connection with this revolving agreement. As customers pay their balances, our available capacity under this revolving agreement increases and typically we transfer additional receivables into the program. In some cases, we may have collections that have not yet been remitted to the bank, resulting in a liability. The outstanding portfolio of receivables derecognized from our consolidated balance sheets was $4,637 million as of December 31, 2024.
•Accounts Receivable Factoring
We have a factoring agreement to sell certain of our non-U.S. trade accounts receivable on a limited recourse basis to a third-party financial institution. For the year ended December 31, 2024, total trade accounts receivable sold under our factoring arrangement was $313 million.
•Investments
In May 2024, we sold our 50% interest in All3Media, an equity method investment, for proceeds of $324 million.
In October 2024, we sold our minority interests in Formula E, which were recorded as an equity method investment and an investment without readily determinable fair value, to Liberty Global, a related party, for total proceeds of $217 million.
•Derivatives
We received investing proceeds of $136 million during the year ended December 31, 2024 from the unwind and settlement of derivative instruments. (See Note 13 to the accompanying consolidated financial statements.)
Uses of Cash
Our primary uses of cash include the creation and acquisition of new content, business acquisitions, income taxes, personnel costs, costs to develop and market our enhanced streaming service Max, principal and interest payments on our outstanding senior notes, funding for various equity method and other investments, and repurchases of our capital stock.
•Content Acquisition
We plan to continue to invest significantly in the creation and acquisition of new content, as well as certain sports rights. Additional information regarding contractual commitments to acquire content is set forth in “Material Cash Requirements from Known Contractual and Other Obligations” in Item 7, “Management’s Discussion and Analysis of Financial Condition and Results of Operations.”
•Debt
Floating Rate Notes
During the year ended December 31, 2024, we repaid $40 million of aggregate principal amount of our floating rate notes due March 2024.
Senior Notes
During the year ended December 31, 2024, we repurchased or repaid $5,923 million of aggregate principal amount outstanding of our senior notes. In addition, we have $2,748 million of senior notes coming due in 2025.
In February 2025, we redeemed in full $1,500 million aggregate principal amount of our 6.412% senior notes due 2026. The redemption was funded with the proceeds of borrowings pursuant to the new $1,500 million 364-day senior unsecured term loan credit facility entered into in January 2025.
We may from time to time seek to prepay, retire or purchase our other outstanding indebtedness through prepayments, redemptions, open market purchases, privately negotiated transactions, tender offers or otherwise. Any such repurchases or exchanges will be dependent upon several factors, including our liquidity requirements, contractual restrictions, general market conditions, as well as applicable regulatory, legal and accounting factors. Whether or not we repurchase or exchange any debt and the size and timing of any such repurchases or exchanges will be determined at our discretion.
•Capital Expenditures
We effected capital expenditures of $948 million in 2024, including amounts capitalized to support Max. In addition, we expect to continue to incur significant costs to develop and market Max.
•Investments and Business Combinations
Our uses of cash have included investments in equity method investments and equity investments without readily determinable fair value. (See Note 10 to the accompanying consolidated financial statements.) We also provide funding to our investees from time to time. We contributed $109 million and $112 million in 2024 and 2023, respectively, for investments in and advances to our investees.
•Redeemable Noncontrolling Interest and Noncontrolling Interest
We had redeemable equity balances of $109 million at December 31, 2024, which may require the use of cash in the event holders of noncontrolling interests put their interests to us. Distributions to noncontrolling interests and redeemable noncontrolling interests totaled $193 million and $301 million in 2024 and 2023, respectively.
•Common Stock Repurchases
Historically, we have funded our stock repurchases through a combination of cash on hand, cash generated by operations and the issuance of debt. In February 2020, our board of directors authorized additional stock repurchases of up to $2 billion upon completion of our existing $1 billion authorization announced in May 2019. Under the new stock repurchase authorization, management is authorized to purchase shares from time to time through open market purchases at prevailing prices or privately negotiated purchases subject to market conditions and other factors. (See Note 3 to the accompanying consolidated financial statements.) There were no common stock repurchases during 2024 or 2023.
•Income Taxes and Interest
We expect to continue to make payments for income taxes and interest on our outstanding senior notes. During 2024 and 2023, we made cash payments of $1,113 million and $1,440 million for income taxes and $1,996 million and $2,237 million for interest on our outstanding debt, respectively.
Cash Flows
The following table presents changes in cash and cash equivalents (in millions). | | | | | | | | | | | | | | | | |
| | Year Ended December 31, | | |
| | 2024 | | 2023 | | |
| Cash, cash equivalents, and restricted cash, beginning of period | | $ | 4,319 | | | $ | 3,930 | | | |
| Cash provided by operating activities | | 5,375 | | | 7,477 | | | |
| Cash used in investing activities | | (349) | | | (1,259) | | | |
| Cash used in financing activities | | (3,749) | | | (5,837) | | | |
| Effect of exchange rate changes on cash, cash equivalents, and restricted cash | | (180) | | | 8 | | | |
| Net change in cash, cash equivalents, and restricted cash | | 1,097 | | | 389 | | | |
| Cash, cash equivalents, and restricted cash, end of period | | $ | 5,416 | | | $ | 4,319 | | | |
Operating Activities
Cash provided by operating activities was $5,375 million and $7,477 million in 2024 and 2023, respectively. The decrease in cash provided by operating activities was primarily attributable to a decrease in net income excluding non-cash items. Cash flow for the year ended December 31, 2023 was also positively impacted by the WGA and SAG-AFTRA strikes.
Investing Activities
Cash used in investing activities was $349 million and $1,259 million in 2024 and 2023, respectively. The decrease in cash used in investing activities was primarily attributable to higher proceeds from the sale of investments and fewer purchases of property and equipment during the year ended December 31, 2024.
Financing Activities
Cash used in financing activities was $3,749 million and $5,837 million in 2024 and 2023, respectively. The decrease in cash used in financing activities was primarily attributable to lower net debt activity and lower distributions to noncontrolling interests and redeemable noncontrolling interests during the year ended December 31, 2024.
Capital Resources
As of December 31, 2024, capital resources were comprised of the following (in millions).
| | | | | | | | | | | | | | | | | | | | | | |
| | | December 31, 2024 |
| | | Total
Capacity | | | | Outstanding
Indebtedness | | Unused
Capacity |
| Cash and cash equivalents | | $ | 5,312 | | | | | $ | — | | | $ | 5,312 | |
| Revolving credit facility and commercial paper program | | 6,000 | | | | | — | | | 6,000 | |
| | | | | | | | |
Senior notes (a) | | 39,527 | | | | | 39,527 | | | — | |
| Total | | $ | 50,839 | | | | | $ | 39,527 | | | $ | 11,312 | |
| | | | | | | | |
(a) Interest on senior notes is paid annually, semi-annually, or quarterly. Our senior notes outstanding as of December 31, 2024 had interest rates that ranged from 1.90% to 8.30% and will mature between 2025 and 2062. |
We expect that our cash balance, cash generated from operations, and availability under the Credit Agreement will be sufficient to fund our cash needs for both the short-term and the long-term. Our borrowing costs and access to capital markets can be affected by short and long-term debt ratings assigned by independent rating agencies which are based, in part, on our performance as measured by credit metrics such as interest coverage and leverage ratios. Credit rating agencies may continue to review and adjust our ratings or outlook. For example, in 2024, S&P and Moody’s revised our ratings outlook from stable to negative in part due to declines in our linear business, including as a result of the weak operating environment for linear networks, and our leverage ratio.
The 2017 Tax Cuts and Jobs Act features a participation exemption regime with current taxation of certain foreign income and imposed a mandatory repatriation toll tax on unremitted foreign earnings. Notwithstanding the U.S. taxation of these amounts, we intend to continue to reinvest some of these funds outside of the U.S. Our current plans do not demonstrate a need to repatriate them to the U.S. However, if these funds were to be needed in the U.S., we would be required to accrue and pay non-U.S. taxes to repatriate them. The determination of the amount of unrecognized deferred income tax liability with respect to these undistributed foreign earnings is not practicable.
MATERIAL CASH REQUIREMENTS FROM KNOWN CONTRACTUAL AND OTHER OBLIGATIONS
As of December 31, 2024, our significant contractual and other obligations were as follows (in millions).
| | | | | | | | | | | | | | | | | | | | |
| | Total | | Short-term | | Long-term |
| Long-term debt: | | | | | | |
| Principal payments | | $ | 39,527 | | | $ | 2,749 | | | $ | 36,778 | |
| Interest payments | | 27,336 | | | 1,792 | | | 25,544 | |
| Purchase obligations: | | | | | | |
| Content | | 21,530 | | | 5,956 | | | 15,574 | |
| Other | | 2,911 | | | 1,119 | | | 1,792 | |
| Finance lease obligations | | 535 | | | 130 | | | 405 | |
| Operating lease obligations | | 3,902 | | | 432 | | | 3,470 | |
| Pension and other employee obligations | | 1,422 | | | 494 | | | 928 | |
| Total | | $ | 97,163 | | | $ | 12,672 | | | $ | 84,491 | |
Long-term Debt
Principal payments on long-term debt reflect the repayment of our outstanding senior notes, at face value, assuming repayment will occur upon maturity. Interest payments on our outstanding senior notes are projected based on their contractual interest rates and maturity dates.
Additionally, we have a multicurrency revolving Credit Agreement and have the capacity to borrow up to $6.0 billion under the Credit Facility. We may also request additional commitments up to $1.0 billion from the lenders upon the satisfaction of certain conditions. Additionally, our commercial paper program is supported by the Credit Facility. Under the commercial paper program, we may issue up to $1.0 billion. Borrowing capacity under the Credit Facility is effectively reduced by any outstanding borrowings under the commercial paper program. As of December 31, 2024, we had no outstanding borrowings under the Credit Facility or the commercial paper program. (See Note 11 to the accompanying consolidated financial statements.)
Purchase Obligations
Content purchase obligations include commitments associated with third-party producers and sports associations for content that airs on our television networks and DTC services. Production and licensing contracts generally require the purchase of a specified number of episodes and payments during production or over the term of a license, and include both programs that have been delivered and are available for airing and programs that have not yet been produced or sporting events that have not yet taken place. If the content is ultimately never produced, our commitments expire without obligation. We expect to enter into additional production contracts and content licenses to meet our future content needs.
Other purchase obligations include agreements with certain vendors and suppliers for the purchase of goods and services whereby the underlying agreements are enforceable, legally binding and specify all significant terms. Significant purchase obligations include transmission services, television rating services, marketing commitments and research, equipment purchases, and information technology and other services. Some of these contracts do not require the purchase of fixed or minimum quantities and generally may be terminated with a 30-day to 60-day advance notice without penalty, and are not included in the table above past the 30-day to 60-day advance notice period. Other purchase obligations also include future funding commitments to equity method investees. Although the Company had funding commitments to equity method investees as of December 31, 2024, the Company may also provide uncommitted additional funding to its equity method investments in the future. (See Note 10 to the accompanying consolidated financial statements.)
Content and other purchase obligations presented above exclude liabilities recognized on our consolidated balance sheets.
Finance Lease Obligations
We acquire satellite transponders and other equipment through multi-year finance lease arrangements. Principal payments on finance lease obligations reflect amounts due under our finance lease agreements. Interest payments on our outstanding finance lease obligations are based on the stated or implied rate in our finance lease agreements. (See Note 12 to the accompanying consolidated financial statements.)
Operating Lease Obligations
We obtain office space and equipment under multi-year lease arrangements. Most operating leases are not cancelable prior to their expiration. Payments for operating leases represent the amounts due under the agreements assuming the agreements are not canceled prior to their expiration. (See Note 12 to the accompanying consolidated financial statements.)
Pension and Other Employee Obligations
The Company participates in and/or sponsors a qualified defined benefit pension plan that covers certain U.S. based employees and several U.S. and non-U.S. nonqualified defined benefit pension plans that are noncontributory (“Pension Plans”). The Company’s Pension Plans consist of both funded and unfunded plans. (See Note 17 to the accompanying consolidated financial statements.)
Contractual commitments include payments to meet minimum funding requirements of our Pension Plans in 2025 and estimated benefit payments. Benefit payments have been estimated over a ten-year period. While benefit payments under the Pension Plans are expected to continue beyond 2034, we believe it is not practicable to estimate payments beyond this period.
Other employee obligations are primarily related to employment agreements with creative talent for certain broadcast networks.
We are unable to reasonably predict the ultimate amount of any payments due to cash-settled share-based compensation awards. As of December 31, 2024, the current portion of the liability for cash-settled share-based compensation awards was $27 million.
Unrecognized Tax Benefits
Although we can reasonably estimate the total amount of unrecognized tax benefits related to certain of the Company’s uncertain tax positions that may decrease over the next twelve months, we are unable to reasonably predict the ultimate amount and timing of cash settlement with the respective taxing authorities.
Six Flags Guarantee
In connection with the WarnerMedia Business’ former investment in the Six Flags (as defined below) theme parks located in Georgia and Texas (collectively, the “Parks”), in 1997, certain subsidiaries of the Company agreed to guarantee (the “Six Flags Guarantee”) certain obligations of the partnerships that hold the Parks (the “Partnerships”) for the benefit of the limited partners in such Partnerships, including annual payments made to the Parks or to the limited partners and additional obligations at the end of the respective terms for the Partnerships in 2027 and 2028 (the “Guaranteed Obligations”). Six Flags Entertainment Corporation (formerly known as Six Flags, Inc. and Premier Parks Inc.) (“Six Flags”), which has the controlling interest in the Parks, has agreed, pursuant to a subordinated indemnity agreement (the “Subordinated Indemnity Agreement”), to guarantee the performance of the Guaranteed Obligations when due and to indemnify the Company, among others, if the Six Flags Guarantee is called upon. If Six Flags defaults on its indemnification obligations, the Company has the right to acquire control of the managing partner of the Parks. Six Flags’ obligations to the Company are further secured by its interest in all limited partnership units held by Six Flags.
In December 2024, Six Flags provided notice of its exercise of the option related to the theme parks located in Georgia that requires the redemption of all the limited partnership units that Six Flags does not then own in the Georgia Partnership in January 2027. Pursuant to the exercise of the option, all of such outstanding limited partnership interests will be redeemed, and Six Flags will also acquire certain related entity general partnership and managing member interests.
Based on the Company’s evaluation of the current facts and circumstances surrounding the Guaranteed Obligations and the Subordinated Indemnity Agreement, it is unable to predict the loss, if any, that may be incurred under the Guaranteed Obligations, and no liability for the arrangements has been recognized as of December 31, 2024. Because of the specific circumstances surrounding the arrangements and the fact that no active or observable market exists for this type of financial guarantee, the Company is unable to determine a current fair value for the Guaranteed Obligations and related Subordinated Indemnity Agreement. The aggregate gross undiscounted estimated future cash flow requirements covered by the Six Flags Guarantee over the remaining term (through 2028) are $589 million. To date, no payments have been made by the Company pursuant to the Six Flags Guarantee.
Other Contingent Commitments
Other contingent commitments primarily include contingent payments for post-production term advance obligations on a certain co-financing arrangement, as well as operating lease commitment guarantees, letters of credit, bank guarantees, and surety bonds, which generally support performance and payments for a wide range of global contingent and firm obligations, including insurance, litigation appeals, real estate leases, and other operational needs. Our other contingent commitments at December 31, 2024 were immaterial.
Put Rights
We have granted put rights to certain consolidated subsidiaries, but we are unable to reasonably predict the ultimate amount or timing of any payment. We recorded the carrying value of the noncontrolling interest in the equity associated with the put rights as a component of redeemable noncontrolling interest in the amount of $109 million. (See Note 19 to the accompanying consolidated financial statements.)
Noncontrolling Interest
The Food Network and Cooking Channel are operated and organized under the terms of the TV Food Network Partnership (the “Partnership”). We hold interests in the Partnership, along with another noncontrolling owner. The Partnership agreement specifies a dissolution date of December 31, 2025. If the term of the Partnership is not extended prior to that date, the Partnership agreement permits us, as holder of 80% of the applicable votes, to reconstitute the Partnership and continue its business. If for some reason the Partnership is not continued, it will be required to limit its activities to winding up, settling debts, liquidating assets and distributing proceeds to the partners in proportion to their partnership interests.
Summarized Guarantor Financial Information
Basis of Presentation
As of December 31, 2024, the Company has outstanding senior notes issued by Discovery Communications, LLC (“DCL”), which are guaranteed by the Company, Scripps Networks Interactive, Inc. (“Scripps Networks”), and WarnerMedia Holdings, Inc. (“WMH”); senior notes issued by WMH, which are guaranteed by the Company, Scripps Networks, and DCL; senior notes issued by the legacy WarnerMedia Business (not guaranteed); and senior notes issued by Scripps Networks (not guaranteed). (See Note 11 to the accompanying consolidated financial statements.) DCL, Scripps Networks, and WMH are wholly owned by the Company.
The tables below present the summarized financial information as combined for Warner Bros. Discovery, Inc. (the “Parent”), Scripps Networks, DCL, and WMH (collectively, the “Obligors”). All guarantees of DCL and WMH’s senior notes (the “Note Guarantees”) are full and unconditional, joint and several and unsecured, and cover all payment obligations arising under the senior notes.
Note Guarantees issued by Scripps Networks, DCL or WMH, or any subsidiary of the Parent that in the future issues a Note Guarantee (each, a “Subsidiary Guarantor”) may be released and discharged (i) concurrently with any direct or indirect sale or disposition of such Subsidiary Guarantor or any interest therein, (ii) at any time that such Subsidiary Guarantor is released from all of its obligations under its guarantee of payment, (iii) upon the merger or consolidation of any Subsidiary Guarantor with and into DCL, WMH or the Parent or another Subsidiary Guarantor, as applicable, or upon the liquidation of such Subsidiary Guarantor and (iv) other customary events constituting a discharge of the Obligors’ obligations.
Summarized Financial Information
The Company has included the accompanying summarized combined financial information of the Obligors after the elimination of intercompany transactions and balances among the Obligors and the elimination of equity in earnings from and investments in any subsidiary of the Parent that is a non-guarantor (in millions).
| | | | | | | | | | |
| | December 31, 2024 | | |
| Current assets | | $ | 2,194 | | | |
| Non-guarantor intercompany trade receivables, net | | 404 | | | |
| Noncurrent assets | | 4,077 | | | |
| Current liabilities | | 3,948 | | | |
| Noncurrent liabilities | | 37,118 | | | |
| | | | |
| | Year Ended December 31, 2024 | | |
| Revenues | | $ | 1,916 | | | |
| Operating loss | | (245) | | | |
| Net loss | | (1,080) | | | |
| Net loss available to Warner Bros. Discovery, Inc. | | (1,037) | | | |
Additional information regarding the changes in our outstanding indebtedness and the significant terms and provisions of our revolving credit facility and outstanding indebtedness is discussed in Note 11 to the accompanying consolidated financial statements included in Item 8, “Financial Statements and Supplementary Data” in this Annual Report on Form 10-K.
RELATED PARTY TRANSACTIONS
In the ordinary course of business, we enter into transactions with related parties, primarily the Liberty Entities and our equity method investees. Information regarding transactions and amounts with related parties is discussed in Note 21 to the accompanying consolidated financial statements included in Item 8, “Financial Statements and Supplementary Data” in this Annual Report on Form 10-K.
NEW ACCOUNTING AND REPORTING PRONOUNCEMENTS
We adopted certain accounting and reporting standards during 2024. Information regarding our adoption of new accounting and reporting standards is discussed in Note 2 to the accompanying consolidated financial statements included in Item 8, “Financial Statements and Supplementary Data” in this Annual Report on Form 10-K.
CRITICAL ACCOUNTING ESTIMATES
Our consolidated financial statements are prepared in accordance with U.S. GAAP, which requires management to make estimates, judgments and assumptions that affect the reported amounts of assets, liabilities, revenues and expenses and related disclosure of contingent assets and liabilities.
On an ongoing basis, we evaluate our estimates and assumptions, including those related to unrecognized tax benefits, goodwill and intangible assets, content rights, consolidation and revenue recognition. We base our estimates on historical experience, current developments and on various other assumptions that we believe to be reasonable under these circumstances, the results of which form the basis for making judgments about carrying values of assets and liabilities that cannot readily be determined from other sources. There can be no assurance that actual results will not differ from those estimates.
Management considers an accounting estimate to be critical if it required assumptions to be made that were uncertain at the time the estimate was made and changes in the estimate or different estimates could have a material effect on our results of operations.
The development and selection of these critical accounting estimates have been determined by management and the related disclosures have been reviewed with the Audit Committee of the board of directors of the Company. We believe the following accounting estimates are critical to our business operations and the understanding of our results of operations and involve the more significant judgments and estimates used in the preparation of our consolidated financial statements.
Uncertain Tax Positions
We are subject to income taxes in numerous U.S. and foreign jurisdictions. From time to time, we engage in transactions or take filing positions in which the tax consequences may be uncertain and may recognize tax liabilities based on estimates of whether additional taxes and interest will be due. We establish a reserve for unrecognized tax benefits unless we determine that such positions are more likely than not to be sustained upon examination based on their technical merits, including the resolution of any appeals or litigation processes. We include interest and where appropriate, potential penalties, as a component of income tax expense on the consolidated statements of operations. This assessment relies on estimates and assumptions and may involve a series of complex judgments about future events including the status and results of income tax audits with the relevant tax authorities. Significant judgment is exercised in evaluating all relevant information, the technical merits of the tax positions, and the accurate measurement of unrecognized tax benefits when determining the amount of reserve and whether positions taken on our tax returns are more likely than not to be sustained. This also involves the use of significant estimates and assumptions with respect to the potential outcome of positions taken on tax returns that may be reviewed by tax authorities.
Goodwill and Intangible Assets
Goodwill is allocated to our reporting units, which are our operating segments or one level below our operating segments (the component level). Reporting units are determined by the discrete financial information available for the component and whether it is regularly reviewed by segment management. Components are aggregated into a single reporting unit if they share similar economic characteristics. Our reporting units are Studios, Networks, and DTC.
We evaluate our goodwill for impairment annually as of October 1 or earlier upon the occurrence of substantive unfavorable changes in economic conditions, industry trends, costs, cash flows, or ongoing declines in market capitalization. If we believe that as a result of our qualitative assessment it is not more likely than not that the fair value of a reporting unit is greater than its carrying amount, a quantitative impairment test is required. The quantitative impairment test requires significant judgment in determining the fair value of the reporting units. We determine the fair value of our reporting units by using a combination of the income approach, which incorporates the use of the discounted cash flow (“DCF”) method and the market multiple approach, which incorporates the use of EBITDA and revenue multiples based on market data. For the DCF method, we use projections specific to the reporting unit, as well as those based on general economic conditions, which require the use of significant estimates and assumptions. Determining fair value specific to each reporting unit requires us to exercise judgment when selecting the appropriate discount rates, control premiums, terminal growth rates, relevant comparable company earnings multiples and the amount and timing of expected future cash flows, including revenue growth rates and profit margins. The cash flows employed in the DCF analysis for each reporting unit are based on the reporting unit’s budget, long range plan, and recent operating performance. Discount rate assumptions are based on an assessment of the risk inherent in the future cash flows of the respective reporting unit and market conditions.
2024 Impairment Analysis
During the second quarter 2024, we performed goodwill and intangible assets impairment monitoring procedures for all of our reporting units and concluded the delta between market capitalization and book value, continued softness in the U.S. linear advertising market, and uncertainty related to affiliate and sports rights renewals, including the NBA, represented a triggering event for the Networks reporting unit.
As a result, we elected to perform a quantitative impairment assessment for all of our reporting units in the second quarter of 2024. For the Networks reporting unit, fair value was determined using a DCF method. The key judgments and assumptions used in the DCF method to determine the fair value of the Networks reporting unit were as follows:
• The expected future cash flows in terms of their amount and timing. These cash flows, utilized in the DCF analysis, are derived from the reporting unit’s budget and its strategic long-term plan, which reflect expectations based upon operating performance and assumptions consistent with those of a market participant with regards to affiliate revenue, sports rights, and continued softness in the U.S. linear advertising market.
• Long-term growth rate of negative 3%.
• A discount rate of 10.5%. This is reflective of the risks inherent in the future cash flows of the reporting unit and market conditions.
Given the inherent uncertainty in determining the assumptions underlying a DCF analysis, actual results may differ from those used in the valuations.
The carrying value of the Networks reporting unit exceeded its fair value and we recorded a pre-tax, non-cash goodwill impairment charge of $9.1 billion during the second quarter of 2024 in impairments and loss on dispositions in the consolidated statements of operations. The goodwill impairment charge does not have an impact on the calculation of our financial covenants under our debt arrangements.
As of October 1, 2024, we performed a quantitative goodwill impairment assessment for all of our reporting units. The estimated fair value of each reporting unit exceeded its carrying value and, therefore, no impairment was recorded. The DTC reporting unit had headroom of 20%. The Studios reporting unit, which had headroom of 16%, and the Networks reporting unit, which had headroom of 12%, both had fair values in excess of carrying value of less than 20%. The fair values of the reporting units were determined using a combination of DCF and market valuation methodologies. A 0.5% increase in the discount rate and a 1% decrease in the long-term growth rate would not result in an impairment loss across the reporting units.
We continue to monitor our reporting units for triggers that could impact the recoverability of goodwill. Long-term trends and risks we are monitoring in our ongoing assessment include, but are not limited to, the following:
•the delta between market capitalization and book value;
•uncertainty related to affiliate rights renewals associated with our Networks and DTC reporting units;
•declining levels of global GDP growth and continued softness in the U.S. linear advertising market associated with our Networks reporting unit;
•content licensing trends and volatility related to the performance of theatrical film and game slates in our Studios reporting unit; and
•risks in executing the projected growth strategies of our DTC reporting unit.
Content Rights
We capitalize the costs to produce or acquire feature films and television programs, and we amortize costs and test for impairment based on whether the content is predominantly monetized individually, or as a group.
For films and television programs predominantly monetized individually, the amount of capitalized film and television production costs (net of incentives) amortized and the amount of participations and residuals to be recognized as expense in a particular period are determined using the individual film forecast method. Under this method, the amortization of capitalized costs and the accrual of participations and residuals are based on the proportion of the film’s or television program’s revenues recognized for such period to the film’s or television program’s estimated remaining ultimate revenues (i.e., the total revenue to be received throughout a film’s or television program’s remaining life cycle).
For theatrical films, which are monetized on an individual basis, the process of estimating ultimate revenues requires us to make a series of judgments related to future revenue-generating activities associated with a particular film. Prior to the theatrical release of a film, our estimates are based on factors such as the historical performance of similar films, the star power of the lead actors, the rating and genre of the film, pre-release market research (including test market screenings), international distribution plans and the expected number of theaters in which the film will be released. Subsequent to release, ultimate revenues are updated to reflect initial performance, which is often predictive of future performance.
For television programs that are monetized on an individual basis, ultimate revenues are estimated based on factors including the performance of similar programs in each applicable market, firm commitments in hand from customers that license the program in the future, and the popularity of the program in its initial markets.
For a film or television program that is predominantly monetized on its own but also monetized with other films and/or programs (such as on our DTC or linear services), we make a reasonable estimate of the value attributable to the film or program’s exploitation while monetized with other films/programs, based on relative market rates, and expense such costs as the film or television program is exhibited.
Ultimates for content monetized on an individual basis are reviewed and updated (as applicable) on a quarterly basis; any adjustments are applied prospectively as of the beginning of the fiscal year of the change.
For programs monetized as a group, including licensed programming, amortization expense for network programs is generally based on projected usage, generally resulting in an accelerated or straight-line amortization pattern. Adjustments for projected usage are applied prospectively in the period of the change. Streaming and premium pay-TV content amortization is based on estimated viewing patterns, as there are generally limited to no direct revenues to associate to the individual content assets for premium pay-TV. As such, viewership is most representative of the use of the title.
Judgment is required to determine the useful lives and amortization patterns of our content assets that are predominantly monetized as a group. Critical assumptions include: (i) the grouping of content with similar characteristics, (ii) the application of a quantitative revenue forecast model or historical viewership model based on the adequacy of historical data, and (iii) determining the appropriate historical periods to utilize and the relative weighting of those historical periods in the forecast model. We then consider the appropriate application of the quantitative assessment given forecasted content use, expected content investment and market trends. Content use and future revenues may differ from estimates based on changes in expectations related to market acceptance, network affiliate fee rates, advertising demand, the number of cable and satellite television subscribers receiving our networks, the number of subscribers to our streaming services, and program usage. Accordingly, we review our estimates and planned usage at least quarterly and revise our assumptions if necessary.
Consolidation
We have ownership and other interests in and contractual arrangements with various entities, including corporations, partnerships, and limited liability companies. For each such entity, we evaluate our ownership, other interests and contractual arrangements to determine whether we should consolidate the entity or account for its interest as an investment at inception and upon reconsideration events. As part of its evaluation, we initially determine whether the entity is a variable interest entity (“VIE”). Management evaluates key considerations through a qualitative and quantitative analysis in determining whether an entity is a VIE including whether (i) the entity has sufficient equity to finance its activities without additional financial support from other parties, (ii) the ability or inability to make significant decisions about the entity’s operations, and (iii) the proportionality of voting rights of investors relative to their obligations to absorb the expected losses (or receive the expected returns) of the entity. If the entity is a VIE and if we have a variable interest in the entity, we use judgment in determining if we are the primary beneficiary and are thus required to consolidate the entity. In making this determination, we evaluate whether we or another party involved with the VIE (1) has the power to direct the activities of the VIE that most significantly impact the VIE’s economic performance and (2) has the obligation to absorb losses of or receive benefits from the VIE that could be significant to the VIE.
If it is concluded that an entity is not a VIE, we consider our proportional voting interests in the entity and consolidate majority-owned subsidiaries in which a controlling financial interest is maintained. A controlling financial interest is determined by majority ownership and the absence of substantive third-party participation rights. Key factors we consider in determining the presence of substantive third-party participation rights include, but are not limited to, control of the board of directors, budget approval or veto rights, or operational rights that significantly impact the economic performance of the business such as programming, creative development, marketing, and selection of key personnel. Ownership interests in unconsolidated entities for which we have significant influence are accounted for as equity method.
We evaluated reconsideration events during the year ended December 31, 2024 and concluded there were no changes to our consolidation assessments.
Revenue Recognition
As described in Note 2, revenue is recognized upon transfer of control of promised services or goods to customers in an amount that reflects the consideration that we expect to receive in exchange for those services or goods. Significant estimates and judgments are applied in determining the timing of revenue recognition for certain types of transactions, such as bundled arrangements for advertising sales and content licensing arrangements.
A substantial portion of the advertising contracts in the U.S. and certain international markets guarantee the advertiser a minimum audience level that either the program in which their advertisements are aired or the advertisement will reach. These advertising campaigns are considered to represent a single, distinct performance obligation. For such contracts, judgment is required in measuring progress across our single performance obligation. Various factors such as pricing specific to the channel, daypart and targeted demographic, as well as audience guarantees, are considered in determining how to appropriately measure progress across the campaigns. Revenues are ultimately recognized based on the guaranteed audience level delivered multiplied by the average price per impression.
Our content licensing arrangements often include fixed license fees from the licensing of feature films and television programs in the off-network cable, premium pay, syndication, streaming, and international television and streaming markets. For arrangements that include multiple titles and/or staggered availabilities across geographical regions, the availability of each title and/or each region is considered a separate performance obligation, and the fixed fee is allocated to each title/region based on comparable market rates and recognized as revenue when the title is available for use by the licensee.
See Item 1A, “Risk Factors” for details on significant risks that could impact our ability to successfully grow our cash flows. For an in-depth discussion of each of our significant accounting policies, including our critical accounting policies and further information regarding estimates and assumptions involved in their application, see Note 2 to the accompanying consolidated financial statements included in Item 8, “Financial Statements and Supplementary Data” in this Annual Report on Form 10-K.
ITEM 7A. Quantitative and Qualitative Disclosures about Market Risk.
Our financial position, earnings, and cash flows are exposed to market risks and can be affected by, among other things, economic conditions, interest rate changes, foreign currency fluctuations, and changes in the market values of investments. We have established policies, procedures, and internal processes governing our management of market risks and the use of financial instruments to manage our exposure to such risks.
Interest Rates
We are exposed to the impact of interest rate changes primarily through our actual and potential borrowing activities. During the year ended December 31, 2024, we entered into a new $6.0 billion multicurrency revolving credit agreement, replacing the existing $6.0 billion multicurrency revolving credit agreement. We had no outstanding borrowings as of December 31, 2024. We also have access to a commercial paper program, which had no outstanding borrowings as of December 31, 2024. The interest rate on borrowings under the revolving credit facility is based on a floating rate based on the applicable currency of the borrowing plus a margin. The revolving credit facility matures in October 2029, with the option for up to two additional 364-day renewal periods. As of December 31, 2024, we had $39.5 billion of fixed-rate senior notes, at par value.
Our current objectives in managing exposure to interest rate changes are to limit the impact of interest rates on earnings and cash flows. To achieve these objectives, we may enter into derivative instruments, effectively converting fixed rate borrowings to variable rate borrowings indexed to benchmark interest rates in order to reduce the amount of interest paid, or to limit the impact of volatility in interest rates on future issuances of fixed rate debt. (See Note 13 to the accompanying consolidated financial statements.)
As of December 31, 2024, the fair value of our outstanding senior notes, including accrued interest, was $34.9 billion. The fair value of our long-term debt may vary as a result of market conditions and other factors. A change in market interest rates will impact the fair market value of our fixed rate debt. The potential change in fair value of these senior notes from a 100 basis-point increase in quoted interest rates across all maturities, often referred to as a parallel shift in the yield curve, would be a decrease in fair value of approximately $2.1 billion as of December 31, 2024.
Foreign Currency Exchange Rates
We transact business globally and are subject to risks associated with changing foreign currency exchange rates. Market risk refers to the risk of loss arising from adverse changes in foreign currency exchange rates. The risk of loss can be assessed from the perspective of adverse changes in fair values, cash flows, and future earnings. We operate from hubs in EMEA, Latin America, and Asia, with net earnings reinvested locally and working capital requirements met from existing liquid funds. To the extent such funds are not sufficient to meet working capital requirements, drawdowns in the appropriate local currency are available from intercompany borrowings or from our revolving credit facility. The earnings of certain international operations are expected to be reinvested in those businesses indefinitely.
The functional currency of most of our international subsidiaries is the local currency. We are exposed to foreign currency risk to the extent that we enter into transactions denominated in currencies other than our subsidiaries’ respective functional currencies (“non-functional currency risk”). Such transactions include affiliate and ad sales arrangements, content arrangements, equipment and other vendor purchases, and intercompany transactions. Changes in exchange rates with respect to amounts recorded in our consolidated balance sheets related to these items will result in unrealized foreign currency transaction gains and losses based upon period-end exchange rates. We also record realized foreign currency transaction gains and losses upon settlement of the transactions. Moreover, we will experience fluctuations in our revenues and expenses solely as a result of changes in foreign currency exchange rates.
We also are exposed to unfavorable and potentially volatile fluctuations of the U.S. dollar, which is our reporting currency, against the currencies of our operating subsidiaries when their respective financial statements are translated into U.S. dollars for inclusion in our consolidated financial statements. Cumulative translation adjustments are recorded in accumulated other comprehensive loss as a separate component of equity. Any increase or decrease in the value of the U.S. dollar against any foreign functional currency of one of our operating subsidiaries will cause us to experience unrealized foreign currency translation gains or losses with respect to amounts already invested in such foreign currencies. Accordingly, we may experience a negative impact on our net loss, other comprehensive loss, and equity with respect to our holdings solely as a result of changes in foreign currency.
The majority of our foreign currency exposure is tied to Europe and Latin America. We may enter into derivative instruments that change in value as foreign currency exchange rates change to hedge certain exposures associated with affiliate revenue, the cost of producing or acquiring content, certain intercompany transactions, or in connection with forecasted business combinations. These contracts hedge forecasted foreign currency transactions in order to mitigate fluctuations in our earnings and cash flows associated with changes in foreign currency exchange rates. Our objective in managing exposure to foreign currency fluctuations is to reduce volatility of earnings and cash flows. Most of our non-functional currency risks related to our revenue, operating expenses, and capital expenditures were not hedged as of December 31, 2024. We generally do not hedge against the risk that we may incur non-cash losses upon the translation of the financial statements of our subsidiaries and affiliates into U.S. dollars. (See Note 13 to the accompanying consolidated financial statements.)
Derivatives
We may use derivative financial instruments to modify our exposure to exogenous events and market risks from changes in foreign currency exchange rates and interest rates. We do not use derivatives unless there is an underlying exposure. While derivatives are used to mitigate cash flow risk and the risk of declines in fair value, they also limit potential economic benefits to our business in the event of positive shifts in foreign currency exchange rates and interest rates. We do not hold or enter into financial instruments for speculative trading purposes. (See Note 13 to the accompanying consolidated financial statements.)
Market Values of Investments and Liabilities
In addition to derivatives, we had investments in entities accounted for as equity method investments, equity investments, and other highly liquid instruments, such as money market funds and mutual funds, that are accounted for at fair value. We also have liabilities, such as deferred compensation, that are accounted for at fair value (See Note 10 and Note 14 to the accompanying consolidated financial statements). Investments in mutual funds include both fixed- and floating-rate interest earning securities that carry a degree of interest rate risk. Fixed-rate securities may have their fair market value adversely impacted by a rise in interest rates, while floating-rate securities may produce less income than predicted if interest rates fall. Due in part to these factors, our income from such investments may decrease in the future. Liabilities carried at fair value, such as deferred compensation, may experience capital gains that result in increased liabilities and expenses as the capital gains occur. We may enter into derivative financial instruments to hedge the risk of these market value changes. (See Note 13 to the accompanying consolidated financial statements.)
ITEM 8. Financial Statements and Supplementary Data.
MANAGEMENT’S REPORT ON INTERNAL CONTROL OVER FINANCIAL REPORTING
Management of Warner Bros. Discovery, Inc. (the “Company”) is responsible for establishing and maintaining adequate internal control over financial reporting, as such term is defined in Rule 13a-15(f) and Rule 15d-15(f) of the Securities Exchange Act of 1934, as amended. The Company’s internal control over financial reporting includes those policies and procedures that (i) pertain to the maintenance of records that, in reasonable detail, accurately and fairly reflect the transactions and disposition of the assets of the Company; (ii) provide reasonable assurance that transactions are recorded as necessary to permit preparation of financial statements in accordance with generally accepted accounting principles, and provide reasonable assurance that receipts and expenditures of the Company are being made only in accordance with authorizations of management and the directors of the Company; and (iii) provide reasonable assurance regarding prevention or timely detection of unauthorized acquisition, use, or disposition of the Company’s assets that could have a material effect on the consolidated financial statements.
Internal control over financial reporting is designed to provide reasonable assurance regarding the reliability of financial reporting and the preparation of financial statements prepared for external purposes in accordance with generally accepted accounting principles. Because of its inherent limitations, internal control over financial reporting may not prevent or detect misstatements. Also, projections of any evaluation of effectiveness to future periods are subject to the risk that controls may become inadequate because of changes in conditions, or that the degree of compliance with the policies or procedures may deteriorate.
The Company’s management, with the participation of its Chief Executive Officer and Chief Financial Officer, conducted an evaluation of the effectiveness of the Company’s internal control over financial reporting as of December 31, 2024 based on the framework set forth in Internal Control – Integrated Framework (2013) issued by the Committee of Sponsoring Organizations of the Treadway Commission. Based on its evaluation, management concluded that, as of December 31, 2024, the Company’s internal control over financial reporting was effective to provide reasonable assurance regarding the reliability of financial reporting and the preparation of financial statements for external purposes in accordance with generally accepted accounting principles.
The effectiveness of the Company’s internal control over financial reporting as of December 31, 2024 has been audited by PricewaterhouseCoopers LLP, an independent registered public accounting firm, as stated in their report in Item 8 of Part II of this Annual Report on Form 10-K under the caption “Report of Independent Registered Public Accounting Firm.”
Report of Independent Registered Public Accounting Firm
To the Board of Directors and Stockholders of Warner Bros. Discovery, Inc.
Opinions on the Financial Statements and Internal Control over Financial Reporting
We have audited the accompanying consolidated balance sheets of Warner Bros. Discovery, Inc. and its subsidiaries (the “Company”) as of December 31, 2024 and 2023, and the related consolidated statements of operations, of comprehensive (loss) income, of equity and of cash flows for each of the three years in the period ended December 31, 2024, including the related notes and schedule of valuation and qualifying accounts for each of the three years in the period ended December 31, 2024 appearing under Item 15(a)(2) (collectively referred to as the “consolidated financial statements”). We also have audited the Company's internal control over financial reporting as of December 31, 2024, based on criteria established in Internal Control - Integrated Framework (2013) issued by the Committee of Sponsoring Organizations of the Treadway Commission (COSO).
In our opinion, the consolidated financial statements referred to above present fairly, in all material respects, the financial position of the Company as of December 31, 2024 and 2023, and the results of its operations and its cash flows for each of the three years in the period ended December 31, 2024 in conformity with accounting principles generally accepted in the United States of America. Also in our opinion, the Company maintained, in all material respects, effective internal control over financial reporting as of December 31, 2024, based on criteria established in Internal Control - Integrated Framework (2013) issued by the COSO.
Basis for Opinions
The Company's management is responsible for these consolidated financial statements, for maintaining effective internal control over financial reporting, and for its assessment of the effectiveness of internal control over financial reporting, included in the accompanying Management’s Report on Internal Control Over Financial Reporting. Our responsibility is to express opinions on the Company’s consolidated financial statements and on the Company's internal control over financial reporting based on our audits. We are a public accounting firm registered with the Public Company Accounting Oversight Board (United States) (PCAOB) and are required to be independent with respect to the Company in accordance with the U.S. federal securities laws and the applicable rules and regulations of the Securities and Exchange Commission and the PCAOB.
We conducted our audits in accordance with the standards of the PCAOB. Those standards require that we plan and perform the audits to obtain reasonable assurance about whether the consolidated financial statements are free of material misstatement, whether due to error or fraud, and whether effective internal control over financial reporting was maintained in all material respects.
Our audits of the consolidated financial statements included performing procedures to assess the risks of material misstatement of the consolidated financial statements, whether due to error or fraud, and performing procedures that respond to those risks. Such procedures included examining, on a test basis, evidence regarding the amounts and disclosures in the consolidated financial statements. Our audits also included evaluating the accounting principles used and significant estimates made by management, as well as evaluating the overall presentation of the consolidated financial statements. Our audit of internal control over financial reporting included obtaining an understanding of internal control over financial reporting, assessing the risk that a material weakness exists, and testing and evaluating the design and operating effectiveness of internal control based on the assessed risk. Our audits also included performing such other procedures as we considered necessary in the circumstances. We believe that our audits provide a reasonable basis for our opinions.
Definition and Limitations of Internal Control over Financial Reporting
A company’s internal control over financial reporting is a process designed to provide reasonable assurance regarding the reliability of financial reporting and the preparation of financial statements for external purposes in accordance with generally accepted accounting principles. A company’s internal control over financial reporting includes those policies and procedures that (i) pertain to the maintenance of records that, in reasonable detail, accurately and fairly reflect the transactions and dispositions of the assets of the company; (ii) provide reasonable assurance that transactions are recorded as necessary to permit preparation of financial statements in accordance with generally accepted accounting principles, and that receipts and expenditures of the company are being made only in accordance with authorizations of management and directors of the company; and (iii) provide reasonable assurance regarding prevention or timely detection of unauthorized acquisition, use, or disposition of the company’s assets that could have a material effect on the financial statements.
Because of its inherent limitations, internal control over financial reporting may not prevent or detect misstatements. Also, projections of any evaluation of effectiveness to future periods are subject to the risk that controls may become inadequate because of changes in conditions, or that the degree of compliance with the policies or procedures may deteriorate.
Critical Audit Matters
The critical audit matter communicated below is a matter arising from the current period audit of the consolidated financial statements that was communicated or required to be communicated to the audit committee and that (i) relates to accounts or disclosures that are material to the consolidated financial statements and (ii) involved our especially challenging, subjective, or complex judgments. The communication of critical audit matters does not alter in any way our opinion on the consolidated financial statements, taken as a whole, and we are not, by communicating the critical audit matter below, providing a separate opinion on the critical audit matter or on the accounts or disclosures to which it relates.
Interim and Annual Goodwill Impairment Assessments – Networks and DTC Reporting Units
As described in Notes 2 and 5 to the consolidated financial statements, the Company’s consolidated goodwill balance was $25.7 billion as of December 31, 2024, and the goodwill associated with the Networks and DTC reporting units was $8.4 billion and $8.1 billion, respectively. Management evaluates goodwill for impairment annually as of October 1, or if an event or other circumstance indicates that it may not recover the carrying value of the asset. If a qualitative assessment indicates that it is more likely than not that the carrying value of a reporting unit goodwill exceeds its fair value, a quantitative impairment test is performed. If the carrying amount of the reporting unit exceeds the fair value of the reporting unit, an impairment charge is recorded for the amount by which the carrying amount exceeds the fair value, not to exceed the amount of goodwill recorded for that reporting unit. During the second quarter of 2024, management concluded that the delta between market capitalization and book value, continued softness in the U.S. linear advertising market, and uncertainty related to affiliate and sports rights renewals, including the NBA, represented a triggering event for the Networks reporting unit. The carrying value of the Networks reporting unit exceeded its fair value and the Company recorded a goodwill impairment charge of $9.1 billion. Fair value was determined using a discounted cash flow method. Significant judgments and assumptions for the quantitative goodwill assessments performed include discount rates, control premiums, terminal growth rates, relevant comparable company earnings multiples, and the amount and timing of expected future cash flows, including the revenue projections and profit margins.
The principal considerations for our determination that performing procedures relating to the interim and annual goodwill impairment assessments of the Networks reporting unit and the annual goodwill impairment assessment of the DTC reporting unit is a critical audit matter are (i) the significant judgment by management when developing the fair value estimate of the Networks and DTC reporting units; (ii) a high degree of auditor judgment, subjectivity, and effort in performing procedures and evaluating management’s significant assumptions related to revenue projections for both the Networks and DTC reporting units, as well as discount rates for the Networks reporting unit; and (iii) the audit effort involved the use of professionals with specialized skill and knowledge.
Addressing the matter involved performing procedures and evaluating audit evidence in connection with forming our overall opinion on the consolidated financial statements. These procedures included testing the effectiveness of controls relating to management’s goodwill impairment assessments, including controls over the valuation of the Networks and DTC reporting units. These procedures also included, among others, (i) testing management’s process for developing the fair value estimates of the Networks and DTC reporting units, (ii) evaluating the appropriateness of the discounted cash flow method used by management; (iii) testing the completeness and accuracy of underlying data used in the discounted cash flow method; and (iv) evaluating the reasonableness of the significant assumptions used by management related to revenue projections for both the Networks and DTC reporting units, as well as discount rates for the Networks reporting unit. Evaluating management’s assumptions related to revenue projections involved evaluating whether the assumptions were reasonable considering (i) the current and past performance of the Networks and DTC reporting units; (ii) the consistency with external market and industry data; and (iii) whether the assumptions were consistent with evidence obtained in other areas of the audit. Professionals with specialized skill and knowledge were used to assist in evaluating (i) the appropriateness of the discounted cash flow method and (ii) the reasonableness of the discount rate assumptions.
/s/ PricewaterhouseCoopers LLP
Washington, District of Columbia
February 27, 2025
We have served as the Company’s auditor since 2008.
WARNER BROS. DISCOVERY, INC.
CONSOLIDATED STATEMENTS OF OPERATIONS
(in millions, except per share amounts)
| | | | | | | | | | | | | | | | | | | | |
| | Year Ended December 31, |
| | 2024 | | 2023 | | 2022 |
| Revenues: | | | | | | |
| Distribution | | $ | 19,701 | | | $ | 20,237 | | | $ | 16,142 | |
| Advertising | | 8,090 | | | 8,700 | | | 8,524 | |
| Content | | 10,297 | | | 11,203 | | | 8,360 | |
| Other | | 1,233 | | | 1,181 | | | 791 | |
| Total revenues | | 39,321 | | | 41,321 | | | 33,817 | |
| Costs and expenses: | | | | | | |
| Costs of revenues, excluding depreciation and amortization | | 22,970 | | | 24,526 | | | 20,442 | |
| Selling, general and administrative | | 9,296 | | | 9,696 | | | 9,678 | |
| Depreciation and amortization | | 7,037 | | | 7,985 | | | 7,193 | |
| | | | | | |
| Restructuring and other charges | | 447 | | | 585 | | | 3,757 | |
| Impairments and loss on dispositions | | 9,603 | | | 77 | | | 117 | |
| Total costs and expenses | | 49,353 | | | 42,869 | | | 41,187 | |
| Operating loss | | (10,032) | | | (1,548) | | | (7,370) | |
| Interest expense, net | | (2,017) | | | (2,221) | | | (1,777) | |
| Gain on extinguishment of debt | | 632 | | | 17 | | | — | |
| Loss from equity investees, net | | (121) | | | (82) | | | (160) | |
| Other income (expense), net | | 150 | | | (29) | | | 347 | |
| Loss before income taxes | | (11,388) | | | (3,863) | | | (8,960) | |
| Income tax (expense) benefit | | (94) | | | 784 | | | 1,663 | |
| Net loss | | (11,482) | | | (3,079) | | | (7,297) | |
| Net loss (income) attributable to noncontrolling interests | | 129 | | | (38) | | | (68) | |
| Net loss (income) attributable to redeemable noncontrolling interests | | 42 | | | (9) | | | (6) | |
| Net loss available to Warner Bros. Discovery, Inc. | | $ | (11,311) | | | $ | (3,126) | | | $ | (7,371) | |
| Net loss per share available to Warner Bros. Discovery, Inc. Series A common stockholders: | | | | | | |
| Basic | | $ | (4.62) | | | $ | (1.28) | | | $ | (3.82) | |
| Diluted | | $ | (4.62) | | | $ | (1.28) | | | $ | (3.82) | |
| Weighted average shares outstanding: | | | | | | |
| Basic | | 2,450 | | | 2,436 | | | 1,940 | |
| Diluted | | 2,450 | | | 2,436 | | | 1,940 | |
| | | | | | |
| The accompanying notes are an integral part of these consolidated financial statements. |
WARNER BROS. DISCOVERY, INC.
CONSOLIDATED STATEMENTS OF COMPREHENSIVE (LOSS) INCOME
(in millions)
| | | | | | | | | | | | | | | | | | | | |
| | Year Ended December 31, |
| | 2024 | | 2023 | | 2022 |
| Net loss | | $ | (11,482) | | | $ | (3,079) | | | $ | (7,297) | |
| Other comprehensive income (loss): | | | | | | |
| Currency translation | | | | | | |
| Change in net unrealized (losses) gains | | (358) | | | 799 | | | (651) | |
| Less: Reclassification adjustment for net losses (gains) included in net income | | 49 | | | — | | | (2) | |
| Net change, net of income tax benefit (expense) of $3, $30 and $(53) | | (309) | | | 799 | | | (653) | |
| Pension plans, net of income tax benefit (expense) of $5, $(3) and $21 | | (14) | | | (21) | | | (26) | |
| Derivatives | | | | | | |
| Change in net unrealized gains | | 32 | | | 16 | | | 4 | |
| Less: Reclassification adjustment for net gains included in net income | | (35) | | | (12) | | | (18) | |
| Net change, net of income tax benefit (expense) of $2, $(2) and $2 | | (3) | | | 4 | | | (14) | |
| Comprehensive loss | | (11,808) | | | (2,297) | | | (7,990) | |
| Comprehensive loss (income) attributable to noncontrolling interests | | 132 | | | (38) | | | (68) | |
| Comprehensive loss (income) attributable to redeemable noncontrolling interests | | 42 | | | (9) | | | (6) | |
| Comprehensive loss attributable to Warner Bros. Discovery, Inc. | | $ | (11,634) | | | $ | (2,344) | | | $ | (8,064) | |
| | | | | | |
| The accompanying notes are an integral part of these consolidated financial statements. |
WARNER BROS. DISCOVERY, INC.
CONSOLIDATED BALANCE SHEETS
(in millions, except par value)
| | | | | | | | | | | | | | |
| | December 31, |
| | 2024 | | 2023 |
| ASSETS | | | | |
| Current assets: | | | | |
| Cash and cash equivalents | | $ | 5,312 | | | $ | 3,780 | |
| Receivables, net | | 4,947 | | | 6,047 | |
| | | | |
| Prepaid expenses and other current assets | | 3,819 | | | 4,391 | |
| Total current assets | | 14,078 | | | 14,218 | |
| Film and television content rights and games | | 19,102 | | | 21,229 | |
| Property and equipment, net | | 6,087 | | | 5,957 | |
| Goodwill | | 25,667 | | | 34,969 | |
| Intangible assets, net | | 32,299 | | | 38,285 | |
| | | | |
| Other noncurrent assets | | 7,327 | | | 8,099 | |
| Total assets | | $ | 104,560 | | | $ | 122,757 | |
| LIABILITIES AND EQUITY | | | | |
| Current liabilities: | | | | |
| Accounts payable | | $ | 1,055 | | | $ | 1,260 | |
| Accrued liabilities | | 10,438 | | | 10,368 | |
| Deferred revenues | | 1,569 | | | 1,924 | |
| Current portion of debt | | 2,748 | | | 1,780 | |
| Total current liabilities | | 15,810 | | | 15,332 | |
| Noncurrent portion of debt | | 36,757 | | | 41,889 | |
| Deferred income taxes | | 6,985 | | | 8,736 | |
| Other noncurrent liabilities | | 10,070 | | | 10,328 | |
| Total liabilities | | 69,622 | | | 76,285 | |
| Commitments and contingencies (See Note 22) | | | | |
| Redeemable noncontrolling interests | | 109 | | | 165 | |
| | | | |
| Warner Bros. Discovery, Inc. stockholders’ equity: | | | | |
| Series A common stock: $0.01 par value; 10,800 and 10,800 shares authorized; 2,684 and 2,669 shares issued; and 2,454 and 2,439 shares outstanding | | 27 | | | 27 | |
| Preferred stock: $0.01 par value; 1,200 and 1,200 shares authorized, 0 shares issued and outstanding | | — | | | — | |
| Additional paid-in capital | | 55,560 | | | 55,112 | |
| Treasury stock, at cost: 230 and 230 shares | | (8,244) | | | (8,244) | |
| Accumulated deficit | | (12,239) | | | (928) | |
| Accumulated other comprehensive loss | | (1,067) | | | (741) | |
| Total Warner Bros. Discovery, Inc. stockholders’ equity | | 34,037 | | | 45,226 | |
| Noncontrolling interests | | 792 | | | 1,081 | |
| Total equity | | 34,829 | | | 46,307 | |
| Total liabilities and equity | | $ | 104,560 | | | $ | 122,757 | |
| | | | |
| The accompanying notes are an integral part of these consolidated financial statements. |
WARNER BROS. DISCOVERY, INC.
CONSOLIDATED STATEMENTS OF CASH FLOWS
(in millions)
| | | | | | | | | | | | | | | | | | | | |
| | | Year Ended December 31, |
| | | 2024 | | 2023 | | 2022 |
| Operating Activities | | | | | | |
| Net loss | | $ | (11,482) | | | $ | (3,079) | | | $ | (7,297) | |
| Adjustments to reconcile net income to cash provided by operating activities: | | | | | | |
| Content rights amortization and impairment | | 13,946 | | | 16,024 | | | 14,161 | |
| Content restructuring impairments and write-offs | | 165 | | | 115 | | | 2,808 | |
| Depreciation and amortization | | 7,037 | | | 7,985 | | | 7,193 | |
| Deferred income taxes | | (1,732) | | | (2,344) | | | (2,842) | |
| Preferred stock conversion premium | | — | | | — | | | 789 | |
| Equity in losses of equity method investee companies and cash distributions | | 167 | | | 157 | | | 211 | |
| Gain on extinguishment of debt | | (632) | | | (17) | | | — | |
| Share-based compensation expense | | 557 | | | 500 | | | 412 | |
| Impairments and loss on dispositions | | 9,603 | | | 77 | | | 116 | |
| Gain from derivative instruments, net | | (16) | | | (151) | | | (501) | |
| Gain on sale of investments | | (227) | | | — | | | (199) | |
| Other, net | | 115 | | | 199 | | | 435 | |
| Changes in operating assets and liabilities, net of acquisitions and dispositions: | | | | | | |
| Receivables, net | | 1,012 | | | 312 | | | 181 | |
| Film and television content rights, games and production payables, net | | (12,349) | | | (12,305) | | | (12,562) | |
| Accounts payable, accrued liabilities, deferred revenues and other noncurrent liabilities | | (529) | | | (820) | | | 1,529 | |
| Foreign currency, prepaid expenses and other assets, net | | (260) | | | 824 | | | (130) | |
| Cash provided by operating activities | | 5,375 | | | 7,477 | | | 4,304 | |
| Investing Activities | | | | | | |
| Purchases of property and equipment | | (948) | | | (1,316) | | | (987) | |
| Cash (used for) acquired from business acquisitions and working capital settlement | | — | | | (50) | | | 3,612 | |
| | | | | | |
| Investments in and advances to equity investments | | (109) | | | (112) | | | (168) | |
| Proceeds from sales and maturities of investments | | 541 | | | — | | | 306 | |
| | | | | | |
| Proceeds from derivative instruments, net | | 136 | | | 121 | | | 752 | |
| | | | | | |
| | | | | | |
| | | | | | |
| Other investing activities, net | | 31 | | | 98 | | | 9 | |
| Cash (used in) provided by investing activities | | (349) | | | (1,259) | | | 3,524 | |
| Financing Activities | | | | | | |
| Principal repayments of term loans | | — | | | (4,000) | | | (6,000) | |
| Principal repayments of debt, including premiums and discounts to par value | | (5,043) | | | (2,860) | | | (1,315) | |
| Borrowings from debt, net of discount and issuance costs | | 1,617 | | | 1,496 | | | — | |
| | | | | | |
| | | | | | |
| | | | | | |
| Distributions to noncontrolling interests and redeemable noncontrolling interests | | (193) | | | (301) | | | (300) | |
| Purchase of redeemable noncontrolling interest | | — | | | (49) | | | — | |
| | | | | | |
| Borrowings under commercial paper program and revolving credit facility | | 14,203 | | | 5,207 | | | 2,393 | |
| | | | | | |
| Repayments under commercial paper program and revolving credit facility | | (14,203) | | | (5,214) | | | (2,395) | |
| | | | | | |
| Other financing activities, net | | (130) | | | (116) | | | (125) | |
| Cash used in financing activities | | (3,749) | | | (5,837) | | | (7,742) | |
| Effect of exchange rate changes on cash, cash equivalents, and restricted cash | | (180) | | | 8 | | | (61) | |
| Net change in cash, cash equivalents, and restricted cash | | 1,097 | | | 389 | | | 25 | |
| Cash, cash equivalents, and restricted cash, beginning of period | | 4,319 | | | 3,930 | | | 3,905 | |
| Cash, cash equivalents, and restricted cash, end of period | | $ | 5,416 | | | $ | 4,319 | | | $ | 3,930 | |
| | | | | | |
| The accompanying notes are an integral part of these consolidated financial statements. |
WARNER BROS. DISCOVERY, INC.
CONSOLIDATED STATEMENTS OF EQUITY
(in millions)
| | | | | | | | | | | | | | | | | | | | | | | | | | | | | | | | | | | | | | | | | | | | | | | | | | | | | | | | | | | | | | | | | | | | | | | | | | | | | | | | |
| | Discovery, Inc.
Preferred Stock | | Discovery, Inc.
Common Stock | | Warner Bros.
Discovery, Inc.
Common Stock | | Additional
Paid-In
Capital | | Treasury
Stock | | Retained
Earnings
(Accumulated Deficit) | | Accumulated
Other
Comprehensive
Loss | | Warner Bros. Discovery,
Inc.
Stockholders’
Equity | | Noncontrolling
Interests | | Total
Equity |
| | Shares | | Par Value | | Shares | | Par Value | | Shares | | Par Value | | | | | | | |
| December 31, 2021 | | 12 | | | $ | — | | | 736 | | | $ | 7 | | | — | | | $ | — | | | $ | 11,086 | | | $ | (8,244) | | | $ | 9,580 | | | $ | (830) | | | $ | 11,599 | | | $ | 1,434 | | | $ | 13,033 | |
| Net (loss) income available to Warner Bros. Discovery, Inc. and attributable to noncontrolling interests | | — | | | — | | | — | | | — | | | — | | | — | | | — | | | — | | | (7,371) | | | — | | | (7,371) | | | 68 | | | (7,303) | |
| Other comprehensive loss | | — | | | — | | | — | | | — | | | — | | | — | | | — | | | — | | | — | | | (693) | | | (693) | | | — | | | (693) | |
| Share-based compensation | | — | | | — | | | — | | | — | | | — | | | — | | | 399 | | | — | | | — | | | — | | | 399 | | | — | | | 399 | |
| Conversion and issuance of common stock and noncontrolling interest in connection with the acquisition of the WarnerMedia Business | | (12) | | | — | | | (739) | | | (7) | | | 2,658 | | | 27 | | | 43,173 | | | — | | | — | | | — | | | 43,193 | | | 2 | | | 43,195 | |
| | | | | | | | | | | | | | | | | | | | | | | | | | |
| Tax settlements associated with share-based plans | | — | | | — | | | — | | | — | | | — | | | — | | | (54) | | | — | | | — | | | — | | | (54) | | | — | | | (54) | |
| Dividends paid to noncontrolling interests | | — | | | — | | | — | | | — | | | — | | | — | | | — | | | — | | | — | | | — | | | — | | | (250) | | | (250) | |
| Issuance of stock in connection with share-based plans | | — | | | — | | | 3 | | | — | | | 2 | | | — | | | 26 | | | — | | | — | | | — | | | 26 | | | — | | | 26 | |
| Redeemable noncontrolling interest adjustments to redemption value | | — | | | — | | | — | | | — | | | — | | | — | | | — | | | — | | | (4) | | | — | | | (4) | | | — | | | (4) | |
| December 31, 2022 | | — | | | — | | | — | | | — | | | 2,660 | | | 27 | | | 54,630 | | | (8,244) | | | 2,205 | | | (1,523) | | | 47,095 | | | 1,254 | | | 48,349 | |
| | | | | | | | | | | | | | | | | | | | | | | | | | |
| | | | | | | | | | | | | | | | | | | | | | | | | | |
| Net (loss) income available to Warner Bros. Discovery, Inc. and attributable to noncontrolling interests | | — | | | — | | | — | | | — | | | — | | | — | | | — | | | — | | | (3,126) | | | — | | | (3,126) | | | 38 | | | (3,088) | |
| Other comprehensive income | | — | | | — | | | — | | | — | | | — | | | — | | | — | | | — | | | — | | | 782 | | | 782 | | | — | | | 782 | |
| | | | | | | | | | | | | | | | | | | | | | | | | | |
| Share-based compensation | | — | | | — | | | — | | | — | | | — | | | — | | | 452 | | | — | | | — | | | — | | | 452 | | | — | | | 452 | |
| | | | | | | | | | | | | | | | | | | | | | | | | | |
| Reclassification of redeemable noncontrolling interest to noncontrolling interest and change in noncontrolling interest ownership (See Note 19) | | — | | | — | | | — | | | — | | | — | | | — | | | 2 | | | — | | | — | | | — | | | 2 | | | 60 | | | 62 | |
| Tax settlements associated with share-based plans | | — | | | — | | | — | | | — | | | — | | | — | | | (70) | | | — | | | — | | | — | | | (70) | | | — | | | (70) | |
| Redemption of redeemable noncontrolling interest | | — | | | — | | | — | | | — | | | — | | | — | | | 73 | | | — | | | — | | | — | | | 73 | | | — | | | 73 | |
| Dividends paid to noncontrolling interests | | — | | | — | | | — | | | — | | | — | | | — | | | — | | | — | | | — | | | — | | | — | | | (271) | | | (271) | |
| Issuance of stock in connection with share-based plans | | — | | | — | | | — | | | — | | | 9 | | | — | | | 26 | | | — | | | — | | | — | | | 26 | | | — | | | 26 | |
| Redeemable noncontrolling interest adjustments to redemption value | | — | | | — | | | — | | | — | | | — | | | — | | | 1 | | | — | | | (5) | | | — | | | (4) | | | — | | | (4) | |
| Other adjustments to stockholders' equity | | — | | | — | | | — | | | — | | | — | | | — | | | (2) | | | — | | | (2) | | | — | | | (4) | | | — | | | (4) | |
| December 31, 2023 | | — | | | — | | | — | | | — | | | 2,669 | | | 27 | | | 55,112 | | | (8,244) | | | (928) | | | (741) | | | 45,226 | | | 1,081 | | | 46,307 | |
| | | | | | | | | | | | | | | | | | | | | | | | | | |
| | | | | | | | | | | | | | | | | | | | | | | | | | |
| Net loss available to Warner Bros. Discovery, Inc. and attributable to noncontrolling interests | | — | | | — | | | — | | | — | | | — | | | — | | | — | | | — | | | (11,311) | | | — | | | (11,311) | | | (129) | | | (11,440) | |
| Other comprehensive loss | | — | | | — | | | — | | | — | | | — | | | — | | | — | | | — | | | — | | | (326) | | | (326) | | | (3) | | | (329) | |
| Share-based compensation | | — | | | — | | | — | | | — | | | — | | | — | | | 497 | | | — | | | — | | | — | | | 497 | | | — | | | 497 | |
| | | | | | | | | | | | | | | | | | | | | | | | | | |
| | | | | | | | | | | | | | | | | | | | | | | | | | |
| Tax settlements associated with share-based plans | | — | | | — | | | — | | | — | | | — | | | — | | | (71) | | | — | | | — | | | — | | | (71) | | | — | | | (71) | |
| Dividends paid to noncontrolling interests | | — | | | — | | | — | | | — | | | — | | | — | | | — | | | — | | | — | | | — | | | — | | | (157) | | | (157) | |
| Issuance of stock in connection with share-based plans | | — | | | — | | | — | | | — | | | 15 | | | — | | | 43 | | | — | | | — | | | — | | | 43 | | | — | | | 43 | |
| Redeemable noncontrolling interest adjustments to redemption value | | — | | | — | | | — | | | — | | | — | | | — | | | (21) | | | — | | | — | | | — | | | (21) | | | — | | | (21) | |
| | | | | | | | | | | | | | | | | | | | | | | | | | |
| December 31, 2024 | | — | | | $ | — | | | — | | | $ | — | | | 2,684 | | | $ | 27 | | | $ | 55,560 | | | $ | (8,244) | | | $ | (12,239) | | | $ | (1,067) | | | $ | 34,037 | | | $ | 792 | | | $ | 34,829 | |
| | | | | | | | | | | | | | | | | | | | | | | | | | |
| The accompanying notes are an integral part of these consolidated financial statements. |
WARNER BROS. DISCOVERY, INC.
NOTES TO CONSOLIDATED FINANCIAL STATEMENTS
NOTE 1. DESCRIPTION OF BUSINESS AND BASIS OF PRESENTATION
Description of Business
Warner Bros. Discovery is a leading global media and entertainment company that creates and distributes a differentiated and comprehensive portfolio of content and products across television, film, streaming, interactive gaming, publishing, themed experiences, and consumer products through brands including: Discovery Channel, Max, CNN, DC Studios, TNT Sports, HBO, Food Network, TLC, TBS, Warner Bros. Motion Picture Group, Warner Bros. Television Group, Warner Bros. Games, Adult Swim, Turner Classic Movies, and others.
As of December 31, 2024, we classified our operations in three reportable segments:
•Studios - Our Studios segment primarily consists of the production and release of feature films for initial exhibition in theaters, production and initial licensing of television programs to our networks/DTC services as well as third parties, distribution of our films and television programs to various third party and internal television and streaming services, distribution through the home entertainment market (physical and digital), related consumer products and themed experience licensing, and interactive gaming.
•Networks - Our Networks segment primarily consists of our domestic and international television networks.
•DTC - Our DTC segment primarily consists of our premium pay-TV and streaming services.
In December 2024, the Company announced that its board of directors had authorized the Company to implement a new corporate structure. There were no changes to the Company’s reportable segments as a result of this announcement.
Merger with the WarnerMedia Business of AT&T
On April 8, 2022 (the “Closing Date”), Discovery, Inc. (“Discovery”) completed its merger (the “Merger”) with the WarnerMedia business (the “WarnerMedia Business”, “WM Business” or “WM”) of AT&T, Inc. (“AT&T”) and changed its name to Warner Bros. Discovery, Inc. On April 11, 2022, the Company’s shares started trading on Nasdaq under the trading symbol WBD.
The Merger was executed through a Reverse Morris Trust type transaction, under which WM was distributed to AT&T’s shareholders via a pro rata distribution, and immediately thereafter, combined with Discovery. (See Note 3 and Note 4). Prior to the Merger, WMH distributed $40.5 billion to AT&T (subject to working capital and other adjustments) in a combination of cash, debt securities, and WM’s retention of certain debt. Discovery transferred purchase consideration of $42.4 billion in equity to AT&T shareholders in the Merger. In August 2022, the Company and AT&T finalized the post-closing working capital settlement process, which resulted in the Company receiving a $1.2 billion payment from AT&T in the third quarter of 2022 in lieu of adjusting the equity issued as purchase consideration in the Merger. AT&T shareholders received shares of WBD Series A common stock (“WBD common stock”) in the Merger representing 71% of the combined Company and the Company’s pre-Merger shareholders continued to own 29% of the combined Company, in each case on a fully diluted basis.
Discovery was deemed to be the accounting acquirer of the WM Business for accounting purposes under U.S. GAAP; therefore, Discovery is considered the Company’s predecessor and the historical financial statements of Discovery prior to April 8, 2022, are reflected in this Annual Report on Form 10-K as the Company’s historical financial statements. Accordingly, the financial results of the Company as of and for any periods prior to April 8, 2022 do not include the financial results of the WM Business and current and future results will not be comparable to results prior to the Merger.
Labor Disruption
The WGA and SAG-AFTRA went on strike in May and July 2023, respectively, following the expiration of their respective collective bargaining agreements with the AMPTP. The WGA strike ended on September 27, 2023, and a new collective bargaining agreement was ratified on October 9, 2023. The SAG-AFTRA strike ended on November 9, 2023, and a new collective bargaining agreement was ratified on December 5, 2023. As a result of the strikes, we paused certain theatrical and television productions, which resulted in delayed production spending amongst other impacts.
The strikes had a material impact on the operations and results of the Company in 2023. This included a positive impact on cash flow from operations attributed to delayed production spend, and a negative impact on the results of operations attributed to timing and performance of the 2023 film slate, as well as the Company’s ability to produce, license, and deliver content. The Company experienced content completion and delivery delays in the first quarter of 2024 due to the pause in television and theatrical productions in 2023, but did not experience any material impacts for the remainder of 2024.
WARNER BROS. DISCOVERY, INC.
NOTES TO CONSOLIDATED FINANCIAL STATEMENTS
Basis of Consolidation
The consolidated financial statements include the accounts of the Company and its majority-owned subsidiaries in which a controlling interest is maintained, including variable interest entities (“VIE”) for which the Company is the primary beneficiary. For each non-wholly owned subsidiary, the Company evaluates its ownership and other interests to determine whether it should consolidate the entity or account for its ownership interest as an unconsolidated investment. As part of its evaluation, the Company makes judgments in determining whether the entity is a VIE and, if so, whether it is the primary beneficiary of the VIE and is thus required to consolidate the entity. (See Note 10.) If it is concluded that an entity is not a VIE, then the Company considers its proportional voting interests in the entity. The Company consolidates majority-owned subsidiaries in which a controlling financial interest is maintained. A controlling financial interest is determined by majority ownership and the absence of significant third-party participating rights. Ownership interests in entities for which the Company has significant influence that are not consolidated are accounted for as equity method investments.
Intercompany accounts and transactions between consolidated entities have been eliminated.
Use of Estimates
The preparation of financial statements in accordance with U.S. GAAP requires management to make estimates, judgments and assumptions that affect the amounts reported in the consolidated financial statements and accompanying notes. Actual results may differ from these estimates.
Significant estimates and judgments inherent in the preparation of the consolidated financial statements include accounting for asset impairments, revenue recognition, estimated credit losses, content rights, leases, depreciation and amortization, the determination of ultimate revenues as they relate to amortization of capitalized content rights and accruals of participations and residuals, business combinations, share-based compensation, income taxes, other financial instruments, contingencies, estimated defined benefit plan liabilities, and the determination of whether the Company should consolidate certain entities.
NOTE 2. SUMMARY OF SIGNIFICANT ACCOUNTING POLICIES
Foreign Currency
The reporting currency of the Company is the U.S. dollar. Financial statements of subsidiaries whose functional currency is not the U.S. dollar are translated at exchange rates in effect at the balance sheet date for assets and liabilities and at average exchange rates for revenues and expenses for the respective periods. Translation adjustments are recorded in accumulated other comprehensive loss. Cash flows from the Company’s operations in foreign countries are generally translated at the weighted average rate for the respective periods.
The Company is exposed to foreign currency risk to the extent that it enters into transactions denominated in currencies other than its subsidiaries’ respective functional currencies. Transactions denominated in currencies other than subsidiaries’ functional currencies are recorded based on exchange rates at the time such transactions arise. Such transactions include affiliate and ad sales arrangements, content licensing arrangements, equipment and other vendor purchases and intercompany transactions. Changes in exchange rates with respect to amounts recorded in the Company’s consolidated balance sheets related to these items will result in unrealized foreign currency transaction gains and losses based upon period-end exchange rates. The Company also records realized foreign currency transaction gains and losses upon settlement of the transactions. Foreign currency transaction gains and losses resulting from the conversion of the transaction currency to functional currency are included in other income (expense), net.
Cash and Cash Equivalents
Cash and cash equivalents include cash on hand and highly liquid investments with original maturities of 90 days or less.
Receivables
The Company’s accounts receivable balances and the related credit losses arise primarily from distribution, advertising and content revenue. Receivables include amounts billed and currently due from customers and are presented net of an estimate for credit losses. To assess collectability, the Company analyzes market trends, economic conditions, the aging of receivables and customer specific risks, and records a provision for estimated credit losses expected over the lifetime of receivables. The corresponding expense for the expected credit losses is reflected in selling, general and administrative expenses. The Company does not require collateral with respect to trade receivables.
WARNER BROS. DISCOVERY, INC.
NOTES TO CONSOLIDATED FINANCIAL STATEMENTS
Revolving Receivables Program
The Company has a revolving agreement to transfer up to $5,200 million of certain receivables through its bankruptcy-remote subsidiary, Warner Bros. Discovery Receivables Funding, LLC, to various financial institutions on a recurring basis in exchange for cash equal to the gross receivables transferred. The Company services the sold receivables for the financial institution for a fee and pays fees to the financial institution in connection with this revolving agreement. The agreement is a continuation of the agreement the WarnerMedia Business had in place prior to the Merger. This agreement is subject to renewal on an annual basis and the transfer limit may be expanded or reduced from time to time. As customers pay their balances, the Company’s available capacity under this revolving agreement increases and typically the Company transfers additional receivables into the program.
The gross value of the proceeds received results in derecognition of receivables and the obligations assumed are recorded at fair value. Cash received is reflected as cash provided by operating activities in the consolidated statements of cash flows. The obligations assumed when proceeds are received relate to expected credit losses on sold receivables and estimated fee payments made on outstanding sold receivables already transferred. The obligations are subsequently adjusted for changes in estimated expected credit losses and interest rates, which are considered Level 3 fair value measurements since the inputs are unobservable (See Note 8). In some cases, the Company may have collections that have not yet been remitted to the bank, resulting in a liability. Increases to accounts payable and subsequent payments are reported as financing activities in the consolidated statements of cash flows.
Accounts Receivable Factoring
The Company has a factoring agreement to sell certain of its non-U.S. trade accounts receivable on a limited recourse basis to a third-party financial institution. The Company accounts for these transactions as sales in accordance with ASC 860, “Transfers and Servicing”, as its continuing involvement subsequent to the transfer is limited to providing certain servicing and collection actions on behalf of the purchaser of the designated trade accounts receivable. Proceeds from amounts factored are recorded as an increase to cash and cash equivalents and a reduction to receivables, net in the consolidated balance sheets. Cash received is also reflected as cash provided by operating activities in the consolidated statements of cash flows. The accounts receivable factoring program is separate and distinct from the revolving receivables program.
Film and Television Content Rights
The Company capitalizes costs to produce television programs and feature films, including direct production costs, production overhead, interest, acquisition costs and development costs, as well as advances for live programming rights, such as sports. Costs to acquire licensed television series and feature film programming rights are capitalized when the license period has begun and the program is accepted and available for airing. Production incentives received from various jurisdictions where the Company produces content are recorded as a reduction to capitalized production costs. All capitalized content and prepaid license fees are classified as noncurrent assets, with the exception of content acquired with an initial license period of 12 months or less and prepaid sports rights expected to air within 12 months.
The Company groups its film and television content rights by monetization strategy: content that is predominantly monetized individually and content that is predominantly monetized as a group.
Content Monetized Individually
For films and television programs predominantly monetized individually, the amount of capitalized film and television production costs (net of incentives) amortized and the amount of participations and residuals to be recognized as expense in a particular period are determined using the individual film forecast method. Under this method, the amortization of capitalized costs and the accrual of participations and residuals are based on the proportion of the film’s or television program’s revenues recognized for such period to the film’s or television program’s estimated remaining ultimate revenues (i.e., the total revenue to be received throughout a film’s or television program’s remaining life cycle).
WARNER BROS. DISCOVERY, INC.
NOTES TO CONSOLIDATED FINANCIAL STATEMENTS
The process of estimating ultimate revenues requires us to make a series of judgments related to future revenue-generating activities associated with a particular film. Prior to the theatrical release of a film, the Company’s estimates are based on factors such as the historical performance of similar films, the star power of the lead actors, the rating and genre of the film, pre-release market research (including test market screenings), international distribution plans and the expected number of theaters in which the film will be released. Subsequent to release, ultimate revenues are updated to reflect initial performance, which is often predictive of future performance. For a film or television program that is predominantly monetized on its own but also monetized with other films and/or programs (such as on the Company’s DTC or linear services), the Company makes a reasonable estimate of the value attributable to the film or program’s exploitation while monetized with other films/programs and expenses such costs as the film or television program is exhibited. For theatrical films, the period over which ultimate revenues from all applicable sources and exhibition windows are estimated does not exceed 10 years from the date of the film’s initial release. For television programs, the ultimate period does not exceed 10 years from delivery of the first episode, or, if still in production, five years from delivery of the most recent episode, if later. For games, the ultimate period does not exceed two years from the date of the game’s initial release. Ultimates for produced content monetized on an individual basis are reviewed and updated (as applicable) on a quarterly basis; any adjustments are applied prospectively as of the beginning of the fiscal year of the change.
Content Monetized as a Group
For programs monetized as a group, including licensed programming, the Company’s film groups are generally aligned along the Company’s networks and digital content offerings, except for certain international territories wherein content assets are grouped by genre or territory. Adjustments for projected usage are applied prospectively in the period of the change. Participations and residuals are generally expensed in line with the pattern of usage. Streaming content and premium pay-TV amortization for each period is recognized based on estimated viewing patterns as there are generally little to no direct revenues to associate to the individual content assets. As such, viewership is most representative of the use of the title. Licensed rights to film and television programming are typically amortized over the useful life of the program’s license period on a straight-line or accelerated basis. The Company allocates the cost of multi-year sports programming arrangements over the contract period to each event or season based on its projected advertising revenue and an allocation of distribution revenue (estimated relative value). If annual contractual payments related to each season approximate each season’s estimated relative value, the Company expenses the related contractual payments during the applicable season. Amortization of sports rights takes place when the content airs.
Quarterly, the Company prepares analyses to support its content amortization expense. Critical assumptions used in determining content amortization for programming predominantly monetized as a group include: (i) the grouping of content with similar characteristics, (ii) the application of a quantitative revenue forecast model or historical viewership model based on the adequacy of historical data, and (iii) determining the appropriate historical periods to utilize and the relative weighting of those historical periods in the forecast model. The Company then considers the appropriate application of the quantitative assessment given forecasted content use, expected content investment and market trends. Content use and future revenues may differ from estimates based on changes in expectations related to market acceptance, network affiliate fee rates, advertising demand, the number of cable and satellite television subscribers receiving the Company’s networks, the number of subscribers to its streaming services, and program usage. Accordingly, the Company reviews its estimates and planned usage at least quarterly and revises its assumptions if necessary. Any material adjustments from the Company’s review of the amortization rates for assets in film groups are applied prospectively in the period of the change.
Unamortized Film Costs Impairment Assessment
Unamortized film costs are tested for impairment whenever events or changes in circumstances indicate that the fair value of a film (or television program) predominantly monetized on its own, or a film group, may be less than its unamortized costs. In addition, a change in the predominant monetization strategy is considered a triggering event for impairment testing before a title is accounted for as part of a film group. If the carrying value of an individual feature film or television program, or film group, exceeds the estimated fair value, an impairment charge will be recorded in the amount of the difference. For content that is predominantly monetized individually, the Company utilizes estimates including ultimate revenues and additional costs to be incurred (including exploitation and participation costs), in order to determine whether the carrying value of a film or television program is impaired.
Game Development Costs
Game development costs are expensed as incurred before the applicable game reaches technological feasibility, or for online hosted arrangements, before the preliminary project phase is complete and it is probable the project will be completed and the software will be used to perform the function intended. Commencing upon a title’s release, the capitalized game development costs are amortized based on the proportion of the game’s revenues recognized for such period to the game’s total current and anticipated revenues, or, if greater, for non-hosted games, on a straight-line basis over the title’s estimated economic life. Unamortized capitalized game production and development costs are stated at the lower of cost, less accumulated amortization, or net realizable value and reported in “Film and television content rights and games” on the consolidated balance sheets.
WARNER BROS. DISCOVERY, INC.
NOTES TO CONSOLIDATED FINANCIAL STATEMENTS
Investments
The Company holds investments in equity method investees and equity investments with and without readily determinable fair values. (See Note 10.)
Equity Method Investments
Investments in equity method investees are those for which the Company has the ability to exercise significant influence but does not control and is not the primary beneficiary or the entity is not a VIE and the Company does not have a controlling financial interest. Under this method of accounting, the Company typically records its proportionate share of the net earnings or losses of equity method investees in loss from equity investees, net and a corresponding increase or decrease to the investment balances. Cash payments to equity method investees such as additional investments, loans and advances and expenses incurred on behalf of investees, as well as payments from equity method investees such as dividends, distributions and repayments of loans and advances are recorded as adjustments to investment balances.
The Company evaluates its equity method investments for impairment whenever events or changes in circumstances indicate that the carrying amounts of such investments may not be recoverable. (See “Asset Impairment Analysis” below.)
Equity Investments with Readily Determinable Fair Values
Investments in entities or other securities in which the Company has no control or significant influence and is not the primary beneficiary, and have a readily determinable fair value are recorded at fair value based on quoted market prices and are classified as equity securities or equity investments with readily determinable fair value. The investments are measured at fair value based on a quoted market price per unit in active markets multiplied by the number of units held without consideration of transaction costs (Level 1). Gains and losses are recorded in other income (expense), net on the consolidated statements of operations. (See Note 10 and Note 18.)
Equity Investments without Readily Determinable Fair Values
Equity investments without readily determinable fair values include ownership rights that either (i) do not meet the definition of in-substance common stock or (ii) do not provide the Company with control or significant influence and these investments do not have readily determinable fair values. Equity investments without readily determinable fair values are recorded at cost and adjusted for subsequent observable price changes as of the date that an observable transaction takes place. Adjustments for observable price changes are recorded in other income (expense), net. (See Note 10 and Note 18.)
Property and Equipment
Property and equipment are stated at cost less accumulated depreciation and impairments. Internal use software costs are capitalized during the application development stage; software costs incurred during the preliminary project and post implementation stages are expensed as incurred. Repairs and maintenance expenditures that do not enhance the use or extend the life of property and equipment are expensed as incurred. Depreciation for most property and equipment is recognized using the straight-line method over the estimated useful lives of the assets. (See Note 18.)
Leases
The Company determines if an arrangement is a lease at its inception. Operating lease right-of-use (“ROU”) assets are included in other noncurrent assets. Finance lease ROU assets are included in property and equipment, net. Operating and finance lease liabilities are included in accrued liabilities and other noncurrent liabilities in the consolidated balance sheets. The Company elected the short-term lease recognition exemption and leases with initial terms of one year or less are not recorded in the consolidated balance sheets.
A rate implicit in the lease when readily determinable is used in arriving at the present value of lease payments. As most of the Company’s leases do not provide sufficient information to determine an implicit rate, the Company uses an incremental borrowing rate based on information available at lease commencement date for most of its leases. The incremental borrowing rate is based on the Company's U.S. dollar denominated senior unsecured borrowing curves using public credit ratings adjusted down to a collateralized basis using a combination of recovery rate and credit notching approaches and translated into major contract currencies as applicable.
WARNER BROS. DISCOVERY, INC.
NOTES TO CONSOLIDATED FINANCIAL STATEMENTS
The Company’s lease terms may include options to extend or terminate the lease when it is reasonably certain that it will exercise that option. The Company does not separate lease components from non-lease components across all lease categories. Instead, each separate lease component and non-lease component are accounted for as a single lease component. In addition, variable lease payments that are based on an index or rate are included in the measurement of ROU assets and lease liabilities at lease inception. All other variable lease payments are expensed as incurred and are not included in the measurement of ROU assets and lease liabilities. Lease expense for operating leases and short-term leases is recognized on a straight-line basis. For finance leases, the Company recognizes interest expense on lease liabilities using the effective interest method and amortization of ROU assets on a straight-line basis.
Defined Benefit Plans
The Company participates in and/or sponsors a qualified defined benefit pension plan that covers certain U.S. based employees and several U.S. and non-U.S. nonqualified defined benefit pension plans that are noncontributory. Defined benefit plan obligations are based on various assumptions used by the Company’s actuaries in calculating these amounts. These assumptions include discount rates, compensation rate increases, expected return on plan assets, retirement rates and mortality rates. Actual results that differ from the assumptions and changes in assumptions could affect future expenses and obligations.
Asset Impairment Analysis
Goodwill
Goodwill is allocated to the Company’s reporting units, which are its operating segments or one level below its operating segments. The Company evaluates goodwill for impairment annually as of October 1, or earlier if an event or other circumstance indicates that it may not recover the carrying value of the asset. If the Company believes that, as a result of its qualitative assessment, it is more likely than not that the fair value of a reporting unit is greater than its carrying amount, a quantitative impairment test is not required. If a qualitative assessment indicates that it is more likely than not that the carrying value of a reporting unit exceeds its fair value, a quantitative impairment test is performed. If the carrying amount of the reporting unit exceeds its fair value, an impairment charge is recorded for the amount by which the carrying amount exceeds the fair value, not to exceed the amount of goodwill recorded for that reporting unit. The Company typically performs a quantitative impairment test at least every three years, irrespective of the outcome of the Company’s qualitative assessment.
Long-lived Assets
Long-lived assets such as amortizing trademarks and trade names; affiliate, advertising, and subscriber relationships; franchises and other intangible assets; lease ROU assets; and property and equipment are not required to be tested for impairment annually, but rather whenever circumstances indicate that the carrying amount of the asset may not be recoverable. If an impairment analysis is required, the impairment test employed is based on whether the Company’s intent is to hold the asset for continued use or to hold the asset for sale.
•If the intent is to hold the asset for continued use, the impairment test requires a comparison of undiscounted future cash flows to the carrying value of the asset group. If the carrying value of the asset group exceeds the undiscounted cash flows, an impairment loss would be recognized equal to the excess of the asset group’s carrying value over its fair value, which is typically determined by discounting the future cash flows associated with that asset group.
•If the intent is to hold the asset for sale and certain other criteria are met, the impairment test involves comparing the asset’s carrying value to its estimated fair value less costs to sell. If the carrying value of the asset exceeds the fair value, an impairment loss would be recognized equal to the difference.
Significant judgments used for long-lived asset impairment assessments include identifying the appropriate asset groupings that represent the lowest level for which cash flows are largely independent and primary assets within those groupings, determining whether events or circumstances indicate that the carrying amount of the asset may not be recoverable, determining the future cash flows for the assets involved and assumptions applied in determining fair value, which include reasonable discount rates, growth rates, market risk premiums and other assumptions about the economic environment.
Equity Method Investments and Equity Investments Without Readily Determinable Fair Value
Equity method investments are reviewed for indicators of other-than-temporary impairment on a quarterly basis and are written down to fair value if there is evidence of a loss in value that is other-than-temporary. The estimation of fair value and whether an other-than-temporary impairment has occurred requires the application of significant judgment and future results may vary from current assumptions. If declines in the value of the equity method investments are determined to be other-than-temporary, a loss is recorded in earnings in the current period as a component of loss from equity investees, net on the consolidated statements of operations.
WARNER BROS. DISCOVERY, INC.
NOTES TO CONSOLIDATED FINANCIAL STATEMENTS
For equity investments without readily determinable fair value, investments are recorded at cost and adjusted for subsequent observable price changes as of the date that an observable transaction takes place. The Company performs a qualitative assessment on a quarterly basis to determine if any observable price changes have occurred. If the qualitative assessment indicates that an observable price change has occurred, a gain or loss is recorded equal to the difference between the fair value and carrying value in the current period as a component of other income (expense), net. (See Note 10.)
Derivative Instruments
The Company uses derivative financial instruments to modify its exposure to market risks from changes in foreign currency exchange rates, interest rates, and from market volatility related to certain investments measured at fair value. At the inception of a derivative contract, the Company designates the derivative based on the Company’s intentions and expectations as to the likely effectiveness as a hedge (see Note 13), as follows:
•a hedge of a forecasted transaction or the exposure to variability of cash flows to be received or paid related to a recognized asset or liability (“cash flow hedge”);
•a hedge of the foreign currency exposure from net investments in foreign operations (“net investment hedge”);
•a hedge of the exposure to changes in fair value of a recognized asset or liability or of an unrecognized firm commitment (“fair value hedge”); or
•an instrument with no hedging designation.
Cash Flow Hedges
The Company may designate derivative instruments as cash flow hedges to mitigate foreign currency risk arising from third-party revenue agreements, intercompany licensing agreements, production expenses and rebates, or to hedge the interest rate risk for certain senior notes and forecasted debt issuances. For instruments accounted for as cash flow hedges, the change in the fair value of the forward contract is recorded in other comprehensive loss and reclassified into the statements of operations in the same line item in which the hedged item is recorded and in the same period as the hedged item affects earnings.
Net Investment Hedges
The Company may designate derivative instruments as hedges of net investments in foreign operations. The Company assesses the effectiveness of net investment hedges utilizing the spot-method. The entire change in the fair value of derivatives that qualify as net investment hedges is initially recorded in the currency translation adjustment component of other comprehensive loss. While the change in fair value attributable to hedge effectiveness remains in accumulated other comprehensive loss until the net investment is sold or liquidated, the change in fair value attributable to components excluded from the assessment of hedge effectiveness (e.g., forward points, cross currency basis, etc.) is reflected as a component of interest expense, net in the current period.
Fair Value Hedges
The Company may designate derivative instruments as fair value hedges to mitigate the variability in the fair value of a recognized asset or liability or of an unrecognized firm commitment. For those derivative instruments designated as fair value hedges, the changes in fair value of the derivative instruments, including offsetting changes in fair value of the hedged items are recorded in the statements of operations in the same line item where the hedged risk occurs.
No Hedging Designation
The Company may also enter into derivative instruments that do not qualify for hedge accounting or are not designated as hedges. These instruments are intended to mitigate economic exposures due to exogenous events and changes in foreign currency exchange rates, interest rates, and from market volatility related to certain investments measured at fair value. The changes in fair value of derivatives not designated as hedges are recorded in the statements of operations in the same line item where the hedged risk occurs.
Financial Statement Presentation
Unsettled derivative contracts are recorded at their gross fair values on the consolidated balance sheets. The portion of the fair value that represents cash flows occurring within one year is classified as current, and the portion related to cash flows occurring beyond one year is classified as noncurrent.
Cash flows from designated derivative instruments used as hedges are classified in the consolidated statements of cash flows in the same section as the cash flows of the hedged item. Cash flows from periodic settlement of interest on cross currency swaps and derivative contracts not designated as hedges are reported as investing activities in the consolidated statements of cash flows.
WARNER BROS. DISCOVERY, INC.
NOTES TO CONSOLIDATED FINANCIAL STATEMENTS
Treasury Stock
When stock is acquired for purposes other than formal or constructive retirement, the purchase price of the acquired stock is recorded in a separate treasury stock account, which is separately reported as a reduction of equity. Treasury stock held by Discovery prior to the Merger was not retired.
When stock is retired or purchased for formal or constructive retirement, the purchase price is initially recorded as a reduction to the par value of the shares repurchased, with any excess purchase price over par value recorded as a reduction to additional paid-in capital related to the series of shares repurchased and any remaining excess purchase price recorded as a reduction to retained earnings. If the purchase price exceeds the amounts allocated to par value and additional paid-in capital related to the series of shares repurchased and retained earnings, the remainder is allocated to additional paid-in capital related to other series of shares.
To determine the cost of treasury stock that is either sold or reissued, the Company uses the last in, first out method. If the proceeds from the re-issuance of treasury stock are greater than the cost, the excess is recorded as additional paid-in capital. If the proceeds from re-issuance of treasury stock are less than the cost, the excess cost first reduces any additional paid-in capital arising from previous treasury stock transactions for that class of stock, and any additional excess is recorded as a reduction of retained earnings.
Revenue Recognition
Revenue is recognized upon transfer of control of promised services or goods to customers in an amount that reflects the consideration that the Company expects to receive in exchange for those services or goods. Revenues do not include taxes collected from customers on behalf of taxing authorities such as sales tax and value-added tax. However, certain revenues include taxes that customers pay to taxing authorities on the Company’s behalf, such as foreign withholding tax. Revenue recognition for each source of revenue is also based on the following policies.
Advertising
Advertising revenues are principally generated from the sale of commercial time on linear (television networks and authenticated TVE applications) and digital platforms (DTC subscription services and websites). A substantial portion of the linear and digital advertising contracts in the U.S. and certain international markets guarantee the advertiser a minimum audience level that either the program in which their advertisements are aired or the advertisement will reach. On the linear platform, the Company provides a service to deliver an advertising campaign which is satisfied by the provision of a minimum number of advertising spots in exchange for a fixed fee over a contract period of one year or less. The Company delivers spots in accordance with these contracts during a variety of day parts and programs. In the agreements governing these advertising campaigns, the Company has also promised to deliver to its customers a guaranteed minimum number of viewers (“impressions”) on a specific television network within a particular demographic (e.g. men aged 18-35). These advertising campaigns are considered to represent a single, distinct performance obligation. Revenues are recognized based on the guaranteed audience level multiplied by the average price per impression. The Company provides the advertiser with advertising until the guaranteed audience level is delivered, and invoiced advertising revenue receivables may exceed the value of the audience delivery. As such, revenues are deferred until the guaranteed audience level is delivered or the rights associated with the guarantee lapse, which is typically less than one year. Audience guarantees are initially developed internally, based on planned programming, historical audience levels, the success of pilot programs, and market trends. Actual audience and delivery information is published by independent ratings services.
Digital advertising contracts typically contain promises to deliver guaranteed impressions in specific markets against a targeted demographic during a stipulated period of time. If the specified number of impressions is not delivered, the transaction price is reduced by the number of impressions not delivered multiplied by the contractually stated price per impression. Each promise is considered a separate performance obligation. For digital contracts with an audience guarantee, advertising revenues are recognized as impressions are delivered. Actual audience delivery is typically reported by independent third parties.
For contracts without an audience guarantee, advertising revenues are recognized as each spot airs. The airing of individual spots without a guaranteed audience level are each distinct, individual performance obligations. The Company allocates the consideration to each spot based on its relative standalone selling price.
WARNER BROS. DISCOVERY, INC.
NOTES TO CONSOLIDATED FINANCIAL STATEMENTS
Distribution
Distribution revenues are generated from fees charged to network distributors, which include cable, direct-to-home (“DTH”) satellite, telecommunications and digital service providers, and DTC subscribers. Cable operators, DTH satellite operators and telecommunications service providers typically pay royalties via a per-subscriber fee for the right to distribute the Company’s programming under the terms of distribution contracts. The majority of the Company’s distribution fees are collected monthly throughout the year and distribution revenue is recognized over the term of the contracts based on contracted programming rates and reported subscriber levels. The amount of distribution fees due to the Company is reported by distributors based on actual subscriber levels. Such information is generally not received until after the close of the reporting period. In these cases, the Company estimates the number of subscribers receiving the Company’s programming to estimate royalty revenue. Historical adjustments to recorded estimates have not been material. Distribution revenue from fixed-fee contracts is recognized over the contract term based on the continuous delivery of the content to the affiliate. Any monetary incentives provided to distributors other than for distinct goods or services acquired at fair value are recognized as a reduction of revenue over the term.
Although the delivery of linear feeds and digital products, such as video-on-demand (“VOD”) and authenticated TVE applications, are considered distinct performance obligations within a distribution arrangement, on-demand offerings generally match the programs that are airing on the linear network. Therefore, the Company recognizes revenue for licensing arrangements as the license fee is earned and based on continuous delivery for fixed fee contracts.
Revenues associated with digital distribution arrangements are recognized when the Company transfers control of the programming and the rights to distribute the programming to the customer.
For DTC subscription services, the Company recognizes revenue as the service fee is earned over the subscription period.
When linear and DTC distribution arrangements are offered in a bundle deal, consideration is allocated to each deliverable based on its relative standalone selling price, and revenue is recognized as described above.
Content
Content revenues are generated from the release of feature films for initial exhibition in theaters, production of programs licensed for initial television/SVOD exhibition, the additional licensing of feature films and television programs to various television, SVOD and other digital markets, distribution of feature films and television programs in the physical and digital home entertainment market, sales of console games and mobile in-game content, sublicensing of sports rights, and licensing of intellectual property such as characters and brands.
In general, fixed payments for the licensing of intellectual property are recognized as revenue at either the inception of the license term or as sales-based royalties as underlying sales occur if the intellectual property has significant standalone functionality (“functional IP,” such as a produced film or television series), or over the corresponding license term if the licensee’s ability to derive utility is dependent upon our continued support of the intellectual property throughout the license term (“symbolic IP,” such as a character or a brand). Feature films may be produced or acquired for initial exhibition in theaters or direct release on our streaming service. Arrangements with theaters for exhibiting a film over a certain period are generally sales-based royalties and recorded as revenue as the underlying sales of the exhibitors occur.
Television programs are initially produced for broadcast networks, cable networks, premium pay services, first-run syndication or streaming services; revenues are recognized when the programs are available for use by the licensee. Fixed license fee revenues from the subsequent licensing of feature films and television programs in the off-network cable, premium pay, syndication, streaming and international television and streaming markets are also recognized upon availability of the content for use by the licensee. For television/streaming service licenses that include multiple titles with a fixed license fee across all titles, the availability of each title is considered a separate performance obligation, and the fixed fee is allocated to each title based on its estimated relative standalone selling price and recognized as revenue when the title is available for use by the licensee. When the term of an existing agreement is renewed or extended, revenues are recognized when the licensed content becomes available under the renewal or extension. Certain arrangements (e.g., certain pay-TV/SVOD licenses) may include variable license fees that are based on sales of the licensee; these are recognized as revenue as the applicable underlying sales occur.
Revenues from home entertainment sales of feature films and television programs in physical format are generally recognized at the later of the delivery date or the date when made widely available for sale or rental by retailers (“street date”) based on gross sales less a provision for estimated returns, rebates and pricing allowances. The provision is based on management’s estimates by analyzing vendor sales of our product, historical return trends, current economic conditions and changes in customer demand. Revenues from the licensing of television programs and films for electronic sell-through or video-on-demand are recognized when the product has been purchased by and made available to the consumer to either download or stream.
WARNER BROS. DISCOVERY, INC.
NOTES TO CONSOLIDATED FINANCIAL STATEMENTS
Revenues from sales of console games generally follow the same recognition methods as film and television programs in the home entertainment market. Revenues from digital sales of in-game purchases are assessed for deferral based on type of digital item purchased (e.g., consumable vs. durable) and estimated life of consumer game play and recognized upon purchase or
over time as applicable.
Revenues from the licensing of intellectual property such as characters or brands (e.g., for merchandising or theme parks) are
recognized either straight-line over the license term or as the licensee’s underlying product sales occur (sales-based royalty) depending on which method is most reflective of the earnings process.
Contract Assets and Liabilities
A contract asset is recorded when revenue is recognized in advance of the Company’s right to bill and receive consideration and that right is conditioned upon something other than the passage of time. A contract liability, such as deferred revenue, is recorded when the Company has recorded billings in conjunction with its contractual right or when cash is received in advance of the Company’s performance.
Deferred revenue primarily consists of TV/SVOD content licensing arrangements where the content has not yet been made available to the customer, consumer products and themed experience licensing arrangements with fixed payments, advance payment for DTC subscriptions, cash billed/received for television advertising in advance or for which the guaranteed viewership has not been provided, and advance fees related to the sublicensing of Olympic rights. The amounts classified as current are expected to be earned within the next year.
Payment terms vary by the type and location of the customer and the products or services offered. The term between invoicing and when payment is due is not significant. For certain products or services and customer types, the Company requires payment before the products or services are delivered to the customer.
Share-Based Compensation Expense
The Company has incentive plans under which performance-based restricted stock units (“PRSUs”), service-based restricted stock units (“RSUs”), and stock options may be issued. In addition, the Company offers an Employee Stock Purchase Plan (the “ESPP”). Share-based compensation expense for all awards is recorded as a component of selling, general and administrative expense. Forfeitures for all awards are recognized as incurred. Excess tax benefits realized from the exercise of stock options and vested RSUs, PRSUs and the ESPP are reported as cash inflows from operating activities on the consolidated statements of cash flows.
PRSUs
PRSUs represent the contingent right to receive shares of WBD common stock, and typically vest over one to three years based on continuous service and the attainment of qualitative and quantitative performance targets. The number of PRSUs that vest typically ranges from 0% to 300% based on a sliding scale where achieving or exceeding the performance target will result in 100% to 300% of the PRSUs vesting and achieving 70% or less of the target will result in no portion of the PRSUs vesting. Additionally, for certain PRSUs, the Company’s Compensation Committee has discretion in determining the final number of units that vest, but may not increase the amount of any PRSU award above 100%. Upon vesting, each PRSU becomes convertible into one share of WBD common stock. Holders of PRSUs do not receive payments of dividends in the event the Company pays a cash dividend until such PRSUs are converted into shares of WBD common stock.
Compensation expense for PRSUs is based on the fair value of WBD common stock on the date of grant. Compensation expense for PRSUs that vest based on achieving subjective operating performance conditions or in situations where the employee may withhold taxes in excess of the maximum statutory requirement, is remeasured at fair value each reporting period until the award is settled. Compensation expense for all PRSUs is recognized ratably over the vesting period only when it is probable that the operating performance conditions will be achieved. The Company records a cumulative adjustment to compensation expense for PRSUs if there is a change in the determination of the probability that the operating performance conditions will be achieved.
RSUs
RSUs represent the contingent right to receive shares of WBD common stock, substantially all of which vest ratably each year over periods of three to five years based on continuous service. Compensation expense for RSUs is based on the fair value of the award on the date of grant and is recognized ratably during the vesting period. RSU awards generally provide for accelerated vesting upon termination from the Company if the employee has reached a specified age and years of service and if the grant has been held at least six months from the grant date.
WARNER BROS. DISCOVERY, INC.
NOTES TO CONSOLIDATED FINANCIAL STATEMENTS
Stock Options
Stock options are granted with an exercise price equal to or in excess of the closing market price of WBD common stock on the date of grant and vest ratably over three or four years from the grant date based on continuous service and expire seven years from the date of grant. Compensation expense for stock options is based on the fair value of the award on the date of grant and is recognized ratably during the vesting period. Stock options generally provide for accelerated vesting upon termination from the Company if the employee has reached a specified age and years of service and if the grant has been held at least six months from the grant date.
The fair values of stock options are estimated using the Black-Scholes option-pricing model. Because the Black-Scholes option-pricing model requires the use of subjective assumptions, changes in these assumptions can materially affect the fair value of awards. For stock options the simplified method is utilized to calculate the expected term, since the Company does not have sufficient historical exercise data to provide a reasonable basis upon which to estimate the expected term. The simplified method considers the period from the date of grant through the mid-point between the vesting date and the end of the contractual term of the award. Expected volatility is based on a combination of implied volatilities from traded options on WBD common stock and historical realized volatility of WBD and peer group common stock. The dividend yield is assumed to be zero because the Company has no history of paying cash dividends and no present intention to pay dividends. The risk-free interest rate is based on U.S. Treasury zero-coupon issues with a remaining term equal to the expected term of the award.
ESPP
The ESPP enables eligible employees to purchase shares of WBD common stock through payroll deductions or other permitted means. The Company recognizes the fair value of the discount associated with shares purchased under the ESPP as share-based compensation expense.
Advertising Costs
Advertising costs are expensed as incurred and are presented in selling, general and administrative expenses. Third-party advertising costs were $2,152 million, $2,428 million and $2,519 million for years ended December 31, 2024, 2023 and 2022, respectively.
Collaborative Arrangements
The Company’s collaborative arrangements primarily relate to arrangements entered into with third parties to jointly finance and distribute certain theatrical and television productions, arrangements entered into with third parties to bundle streaming services, and an arrangement entered into with CBS Broadcasting, Inc. (“CBS”) surrounding The National Collegiate Athletic Association (the “NCAA”).
Co-financing arrangements generally represent the assignment of an economic interest in a film or television series to a producing partner. The Company generally records the amounts received for the assignment of an interest as a reduction of production cost, as the partner assumes the risk for their share of the film or series asset. The substance of these arrangements is that the third-party partner owns an interest in the film or series; therefore, in each period, based on the terms of the arrangement, the Company reflects the estimate of the third-party partner’s interest in the profits or losses incurred on the film or series, using the individual film forecast method, in cost of revenues, excluding depreciation and amortization in the consolidated statements of operations. On occasion, the Company acquires the economic interest in a film from a producing partner; in this case, the Company capitalizes the acquisition cost as a content asset in film and television content rights and games and accounts for the third-party partner’s share in applicable distribution results as described above.
Bundled streaming service arrangements are evaluated at inception to determine whether it is a collaborative agreement based on the facts and circumstances. In the cases of bundled collaborative agreements, the partners share the expenses incurred and revenues generated. In each period, the Company reflects its share of expenses and revenues in the consolidated statements of operations.
The arrangement among Turner, CBS and the NCAA provides Turner and CBS with rights to the NCAA Division I Men’s Basketball Championship Tournament (the “NCAA Tournament”) in the U.S. and its territories and possessions through 2032. The aggregate programming rights fee, production costs, advertising revenues and sponsorship revenues related to the NCAA Tournament and related programming are shared equally by the Company and CBS. However, if the amount paid for the programming rights fee and production costs in any given year exceeds advertising and sponsorship revenues for that year, CBS’ share of such shortfall is limited to specified annual caps. The amounts recorded pursuant to the loss cap were not material during the years ended December 31, 2024 and 2023. In accounting for this arrangement, the Company records advertising revenue for the advertisements aired on its networks and amortizes its share of the programming rights fee based on the estimated relative value of each season over the term of the arrangement.
WARNER BROS. DISCOVERY, INC.
NOTES TO CONSOLIDATED FINANCIAL STATEMENTS
For our collaborative arrangements entered into with third parties to jointly finance and distribute certain theatrical and television productions, net participation costs of $632 million and $393 million were recorded in cost of revenues, excluding depreciation and amortization for the years ended December 31, 2024 and 2023, respectively.
Income Taxes
Income taxes are recorded using the asset and liability method of accounting for income taxes. Deferred income taxes reflect the net tax effect of temporary differences between the carrying amounts of assets and liabilities for financial reporting purposes and the amounts used for income tax purposes. Deferred taxes are measured using rates the Company expects to apply to taxable income in years in which those temporary differences are expected to reverse. A valuation allowance is provided for deferred tax assets if it is more likely than not such assets will be unrealized.
From time to time, the Company engages in transactions in which the tax consequences may be uncertain. Significant judgment is required in assessing and estimating the tax consequences of these transactions. The Company prepares and files tax returns based on its interpretation of tax laws and regulations. In the normal course of business, the Company’s tax returns are subject to examination by various taxing authorities. Such examinations may result in future tax and interest assessments by these taxing authorities.
In determining the Company’s tax provision for financial reporting purposes, the Company establishes a reserve for unrecognized tax benefits unless the Company determines that such positions are more likely than not to be sustained upon examination based on their technical merits, including the resolution of any appeals or litigation processes. The Company includes interest and where appropriate, penalties, as a component of income tax expense on the consolidated statements of operations. Significant judgment is exercised in evaluating all relevant information, the technical merits of the tax positions, and the accurate measurement of unrecognized tax benefits when determining the amount of reserve and whether positions taken on the Company’s tax returns are more likely than not to be sustained. This also involves the use of significant estimates and assumptions with respect to the potential outcome of positions taken on tax returns that may be reviewed by tax authorities. The Company adjusts its unrecognized tax benefits periodically because of ongoing examinations by, and settlements with, various taxing authorities, as well as changes in tax laws, regulations and interpretations.
In connection with the Merger, the Company entered into a tax matters agreement (“TMA”) with AT&T. Pursuant to the TMA, the Company is responsible for tax liabilities of the WM Business related to the periods prior to AT&T’s ownership of the WM Business (June 14, 2018), and AT&T is responsible for tax liabilities of the WM Business related to the period for which they owned the WM Business (June 15, 2018 through April 8, 2022). With respect to unrecognized tax benefits related to jurisdictions that have joint and several liability among members of the AT&T tax filing group during the AT&T ownership period, the Company has not recorded any liabilities for unrecognized tax benefits or indemnification receivables related to matters that were attributable to jurisdictions that have joint and several liability among members of the AT&T filing group since AT&T was determined to be the primary obligor.
Concentrations Risk
Customers
No individual customer accounted for more than 10% of total consolidated revenues for 2024, 2023 or 2022. The Company had one customer that represented more than 10% of distribution revenue in 2024, which totaled 13%. As of December 31, 2024 and 2023, the Company’s trade receivables do not represent a significant concentration of credit risk as the customers and markets in which the Company operates are varied and dispersed across many geographic areas.
Financial Institutions
Cash and cash equivalents are maintained with several financial institutions. The Company has deposits held with banks that exceed the amount of insurance provided on such deposits. Generally, these deposits may be redeemed upon demand and are maintained with financial institutions of reputable credit and, therefore, bear minimal credit risk.
Counterparty Credit Risk
The Company is exposed to the risk that the counterparties to outstanding derivative financial instruments will default on their obligations. The Company manages these credit risks through the evaluation and monitoring of the creditworthiness of, and concentration of risk with, the respective counterparties. In this regard, credit risk associated with outstanding derivative financial instruments is spread across a relatively broad counterparty base of banks and financial institutions. The Company also has a limited number of arrangements where collateral is required to be posted in the instance that certain fair value thresholds are exceeded. Additionally, the Company may be required to post collateral related to its revolving receivables program. As of December 31, 2024, the Company had posted $105 million of collateral under these arrangements.
WARNER BROS. DISCOVERY, INC.
NOTES TO CONSOLIDATED FINANCIAL STATEMENTS
Accounting and Reporting Pronouncements Adopted
Segment Reporting
In November 2023, the FASB issued guidance updating the disclosure requirements for reportable segments, primarily through enhanced disclosures about significant segment expenses. The amendments are effective for fiscal years beginning after December 15, 2023, and for interim periods within fiscal years beginning after December 15, 2024 and should be applied retrospectively to all prior periods presented in the financial statements. The Company adopted the guidance effective January 1, 2024 and has provided the required annual disclosures in Note 23.
Accounting and Reporting Pronouncements Not Yet Adopted
Income Taxes
In December 2023, the FASB issued guidance updating the disclosure requirements for income taxes, primarily through standardization and disaggregation of rate reconciliation categories and income taxes paid by jurisdiction. The amendments are effective for fiscal years beginning after December 15, 2024, with early adoption permitted. The amendments should be applied prospectively; however, retrospective application is permitted. The Company did not early adopt the amendments as of December 31, 2024. The Company is currently evaluating the impact of this guidance and will update its tax disclosures upon adoption.
Disaggregation of Income Statement Expenses
In November 2024, the FASB issued guidance updating the disclosure requirements for income statement expenses, primarily through disaggregation of certain types of expenses presented on the income statement. The amendments are effective for fiscal years beginning after December 15, 2026 and for interim periods within fiscal years beginning after December 15, 2027. Early adoption is permitted. The amendments may be applied either: (1) prospectively to financial statements issued for reporting periods after the effective date, or (2) retrospectively to all prior periods presented in the financial statements. The Company is currently evaluating the impact this guidance will have on its disclosures.
NOTE 3. EQUITY AND EARNINGS PER SHARE
Common Stock Issued in Connection with the WarnerMedia Merger
In connection with the Merger, each issued and outstanding share of Discovery Series A common stock, Discovery Series B convertible common stock, and Discovery Series C common stock, was reclassified and automatically converted into one share of WBD common stock, and each issued and outstanding share of Discovery Series A-1 convertible preferred stock (“Series A-1 Preferred Stock”) and Series C-1 convertible preferred stock was reclassified and automatically converted into 13.1135 and 19.3648 shares of WBD common stock, respectively.
The Merger required the consent of Advance/Newhouse Programming Partnership under Discovery’s certificate of incorporation as the sole holder of the Series A-1 Preferred Stock. In connection with Advance/Newhouse Programming Partnership’s entry into the consent agreement and related forfeiture of the significant rights attached to the Series A-1 Preferred Stock in the reclassification of the shares of Series A-1 Preferred Stock into common stock, it received an increase to the number of shares of common stock of the Company into which the Series A-1 Preferred Stock converted. The impact of the issuance of such additional shares of common stock was $789 million and was recorded as a transaction expense in selling, general and administrative expense upon the closing of the Merger in the year ended December 31, 2022.
On April 8, 2022, the Company issued 1.7 billion shares of WBD common stock as consideration paid for the acquisition of WM. (See Note 4).
Repurchase Programs
Common Stock
Under the Company’s stock repurchase program, management is authorized to purchase shares of WBD common stock from time to time through open market purchases, privately negotiated transactions at prevailing prices, pursuant to one or more accelerated stock repurchase agreements, or other derivative arrangements as permitted by securities laws and other legal requirements, and subject to stock price, business and market conditions and other factors.
WARNER BROS. DISCOVERY, INC.
NOTES TO CONSOLIDATED FINANCIAL STATEMENTS
In February 2020, the Company’s board of directors authorized additional stock repurchases of up to $2 billion upon completion of its existing $1 billion repurchase authorization announced in May 2019. All common stock repurchases, including prepaid common stock repurchase contracts, have been made through open market transactions and have been recorded as treasury stock on the consolidated balance sheets. During the years ended December 31, 2024, 2023 and 2022, the Company did not repurchase any of its common stock. Over the life of the Company’s repurchase programs and prior to the Merger and conversion of Discovery common stock to WBD common stock, the Company had repurchased 3 million and 229 million shares of Discovery Series A and Discovery Series C common stock, respectively, for the aggregate purchase price of $171 million and $8.2 billion, respectively.
Earnings Per Share
All share and per share amounts have been retrospectively adjusted to reflect the reclassification and automatic conversion into WBD common stock, except for Series A-1 Preferred Stock, which has not been recast because the conversion of Series A-1 Preferred Stock into WBD common stock in connection with the Merger was considered a discrete event and treated prospectively.
The table below sets forth the Company’s calculated earnings per share (in millions). Earnings per share amounts may not recalculate due to rounding. | | | | | | | | | | | | | | | | | | | | |
| | Year Ended December 31, |
| | 2024 | | 2023 | | 2022 |
| Numerator: | | | | | | |
| Net loss | | $ | (11,482) | | | $ | (3,079) | | | $ | (7,297) | |
| Less: | | | | | | |
| Allocation of undistributed income to Series A-1 convertible preferred stock | | — | | | — | | | (49) | |
| Net loss (income) attributable to noncontrolling interests | | 129 | | | (38) | | | (68) | |
| Net loss (income) attributable to redeemable noncontrolling interests | | 42 | | | (9) | | | (6) | |
| Redeemable noncontrolling interest adjustments of carrying value to redemption value (redemption value does not equal fair value) | | (3) | | | — | | | — | |
| Net loss available to Warner Bros. Discovery, Inc. Series A common stockholders for basic and diluted earnings per share | | $ | (11,314) | | | $ | (3,126) | | | $ | (7,420) | |
| | | | | | |
| | | | | | |
| | | | | | |
| | | | | | |
| | | | | | |
| Denominator — weighted average: | | | | | | |
| Common shares outstanding — basic and diluted | | 2,450 | | | 2,436 | | | 1,940 | |
| | | | | | |
| | | | | | |
| | | | | | |
| | | | | | |
| Basic net loss per share allocated to common stockholders | | $ | (4.62) | | | $ | (1.28) | | | $ | (3.82) | |
| Diluted net loss per share allocated to common stockholders | | $ | (4.62) | | | $ | (1.28) | | | $ | (3.82) | |
The table below presents the details of share-based awards that were excluded from the calculation of diluted earnings per share (in millions).
| | | | | | | | | | | | | | | | | | | | |
| | Year Ended December 31, |
| | 2024 | | 2023 | | 2022 |
| Anti-dilutive share-based awards | | 76 | | | 69 | | | 49 | |
| | | | | | |
| | | | | | |
| | | | | | |
NOTE 4. ACQUISITIONS AND DISPOSITIONS
Acquisitions
WarnerMedia
On April 8, 2022, the Company completed its Merger with the WarnerMedia Business of AT&T. The Merger was executed through a Reverse Morris Trust type transaction, under which WM was distributed to AT&T’s shareholders via a pro-rata distribution, and immediately thereafter, combined with Discovery. Discovery was deemed to be the accounting acquirer of WM.
The Merger combined WM’s content library and valuable intellectual property with Discovery’s global footprint, collection of local-language content and deep regional expertise across more than 220 countries and territories. The Company expects this broad, worldwide portfolio of brands, coupled with its DTC potential and the attractiveness of the combined assets, to result in increased market penetration globally. The Merger is also expected to create significant cost synergies for the Company.
WARNER BROS. DISCOVERY, INC.
NOTES TO CONSOLIDATED FINANCIAL STATEMENTS
Purchase Price
The following table summarizes the components of the aggregate purchase consideration paid to acquire WM (in millions).
| | | | | | | | |
Fair value of WBD common stock issued to AT&T shareholders (1) | | $ | 42,309 | |
Estimated fair value of share-based compensation awards attributable to pre-combination services (2) | | 94 | |
Settlement of preexisting relationships (3) | | (27) | |
| Purchase consideration | | $ | 42,376 | |
| | |
|
(1) The fair value of WBD common stock issued to AT&T shareholders represents approximately 1,732 million shares of WBD common stock multiplied by the closing share price for Discovery Series A common stock of $24.43 on Nasdaq on the Closing Date. The number of shares of WBD common stock issued in the Merger was determined based on the number of fully diluted shares of Discovery, Inc. common stock immediately prior to the closing of the Merger, multiplied by the quotient of 71%/29%.
(2) This amount represents the value of AT&T restricted stock unit awards that were not vested and were replaced by WBD restricted stock unit awards with similar terms and conditions as the original AT&T awards. The conversion was based on the ratio of the volume-weighted average per share closing price of AT&T common stock on the ten trading days prior to the Closing Date and the volume-weighted average per share closing price of WBD common stock on the ten trading days following the Closing Date. The fair value of replacement equity-based awards attributable to pre-Merger service was recorded as part of the consideration transferred in the Merger. See Note 15 for additional information.
(3) The amount represents the effective settlement of outstanding payables and receivables between the Company and WM. No gain or loss was recognized upon settlement as amounts were determined to be reflective of fair market value.
Balances reflect rounding of dollar and share amounts to millions, which may result in differences for recalculated standalone amounts compared with the amounts presented above. In August 2022, the Company and AT&T finalized the post-closing working capital settlement process, which resulted in the Company receiving a $1.2 billion payment from AT&T in the third quarter of 2022. AT&T has raised certain claims associated with the Merger that the Company believes are without merit. In connection with the dispute, the Company established an immaterial accrual in the first quarter of 2024.
Purchase Price Allocation
The Company applied the acquisition method of accounting to WM, whereby the excess of the fair value of the purchase price paid over the fair value of identifiable net assets acquired and liabilities assumed was allocated to goodwill. Goodwill reflects the assembled workforce of WM as well as revenue enhancements, cost savings and operating synergies that are expected to result from the Merger. The goodwill recorded as part of the Merger was allocated to the Studios, Networks and DTC reportable segments in the amounts of $9,308 million, $7,074 million and $5,727 million, respectively, and is not deductible for tax purposes.
During 2023, the Company finalized the fair value of assets acquired and liabilities assumed. Measurement period adjustments were reflected in the period in which the adjustments occurred. Adjustments recorded in 2023 were $368 million, primarily related to taxes, and were recorded in other noncurrent assets, deferred income taxes, and other noncurrent liabilities, with an offset to goodwill. The allocation of the purchase price to the assets acquired and liabilities assumed, measurement period adjustments, and a reconciliation to total consideration transferred is presented in the table below (in millions).
| | | | | | | | | | | | | | | | | | | | |
| | Preliminary
April 8, 2022 | | Measurement Period
Adjustments | | Final
April 8, 2022 |
| Cash | | $ | 2,419 | | | $ | (10) | | | $ | 2,409 | |
| Accounts receivable | | 4,224 | | | (60) | | | 4,164 | |
| Other current assets | | 4,619 | | | (133) | | | 4,486 | |
| Film and television content rights and games | | 28,729 | | | (344) | | | 28,385 | |
| Property and equipment | | 4,260 | | | 13 | | | 4,273 | |
| Goodwill | | 21,513 | | | 596 | | | 22,109 | |
| Intangible assets | | 44,889 | | | 100 | | | 44,989 | |
| Other noncurrent assets | | 5,206 | | | 283 | | | 5,489 | |
| Current liabilities | | (10,544) | | | 12 | | | (10,532) | |
| Debt assumed | | (41,671) | | | (9) | | | (41,680) | |
| Deferred income taxes | | (13,264) | | | 492 | | | (12,772) | |
| Other noncurrent liabilities | | (8,004) | | | (940) | | | (8,944) | |
| Total consideration paid | | $ | 42,376 | | | $ | — | | | $ | 42,376 | |
| | | | | | |
|
WARNER BROS. DISCOVERY, INC.
NOTES TO CONSOLIDATED FINANCIAL STATEMENTS
The fair values of the assets acquired and liabilities assumed were determined using several valuation approaches including, but not limited to, various cost approaches and income approaches, such as relief from royalty, multi-period excess earnings, and with-or-without methods.
The table below presents a summary of intangible assets acquired, exclusive of content assets, and the weighted average useful life of these assets.
| | | | | | | | | | | | | | | | | |
| | Fair Value | | Weighted Average Useful Life in Years | | | |
| Trade names | | $ | 21,084 | | | 34 | | | |
| Affiliate, advertising and subscriber relationships | | 14,800 | | | 6 | | | |
| Franchises | | 7,900 | | | 35 | | | |
| Other intangible assets | | 1,205 | | | | | | |
| Total intangible assets acquired | | $ | 44,989 | | | | | | |
| |
| | | | | | | |
|
The Company incurred acquisition-related costs of $162 million and $406 million for the years ended December 31, 2023 and 2022, respectively. These costs were associated with legal and professional services and integration activities and were recognized as operating expenses on the consolidated statements of operations. Additionally, the expense related to the issuance of additional shares of common stock in connection with the conversion of Advance/Newhouse Programming’s Series A-1 Preferred Stock was $789 million and was recorded as a transaction expense in selling, general and administrative expense upon the closing of the Merger. (See Note 3.)
As a result of the Merger, WM’s assets, liabilities, and operations were included in the Company’s consolidated financial statements from the Closing Date. The following table presents WM revenue and earnings as reported within the consolidated financial statements (in millions).
| | | | | | | | |
| | Year Ended December 31, 2022 |
| Revenues: | | |
| Advertising | | $ | 2,849 | |
| Distribution | | 10,980 | |
| Content | | 10,001 | |
| Other | | 720 | |
| Total revenues | | 24,550 | |
| Inter-segment eliminations | | (2,225) | |
| Net revenues | | $ | 22,325 | |
| Net loss available to Warner Bros. Discovery, Inc. | | $ | (7,202) | |
| | |
|
Pro Forma Combined Financial Information
The following unaudited pro forma combined financial information presents the combined results of the Company and WM as if the Merger had been completed on January 1, 2021. The unaudited pro forma combined financial information is presented for informational purposes and is not indicative of the results of operations that would have been achieved if the Merger had occurred on January 1, 2021, nor is it indicative of future results. The following table presents the Company’s pro forma combined revenues and net loss (in millions).
| | | | | | | | | | |
| | | Year Ended December 31, 2022 |
| | | | |
| Revenues | | | | $ | 43,095 | |
| Net loss available to Warner Bros. Discovery, Inc. | | | | (5,359) | |
| | | | |
| | | | |
WARNER BROS. DISCOVERY, INC.
NOTES TO CONSOLIDATED FINANCIAL STATEMENTS
The unaudited pro forma combined financial information includes, where applicable, adjustments for (i) additional costs of revenues from the fair value step-up of film and television library, (ii) additional amortization expense related to acquired intangible assets, (iii) additional depreciation expense from the fair value of property and equipment, (iv) transaction costs and other one-time non-recurring costs, (v) additional interest expense for borrowings related to the Merger and amortization associated with fair value adjustments of debt assumed, (vi) changes to align accounting policies, (vii) elimination of intercompany activity, and (viii) associated tax-related impacts of adjustments. These pro forma adjustments are based on available information as of the date hereof and upon assumptions that the Company believes are reasonable to reflect the impact of the Merger with WM on the Company’s historical financial information on a supplemental pro forma basis. Adjustments do not include costs related to integration activities, cost savings or synergies that have been or may be achieved by the combined business.
BluTV
The Company previously held a 35% interest in BluTV, a SVOD platform entity and content distributor in Turkey that was accounted for as an equity method investment. In December 2023, the Company acquired the remaining 65% of BluTV for $50 million.
Dispositions
In May 2024, the Company sold its 50% interest in All3Media, an equity method investment, for proceeds of $324 million and recorded a gain of $203 million in other income (expense), net in the consolidated statements of operations.
In October 2024, the Company sold its minority interests in Formula E, which were recorded as an equity method investment and an investment without readily determinable fair value, to Liberty Global, a related party, for total proceeds of $217 million and recorded a gain of $61 million in other income (expense), net in the consolidated statements of operations.
During 2023, the Company sold or exited all of the AT&T SportsNets.
In October 2022, the Company sold its 49% stake in Golden Maple Limited (known as Tencent Video VIP) for proceeds of $143 million and recorded a gain of $55 million, and in April 2022 completed the sale of its minority interest in Discovery Education for proceeds of $138 million and recorded a gain of $133 million.
In September 2022, the Company sold 75% of its interest in The CW Network to Nexstar Media Inc. (“Nexstar”), in exchange for Nexstar agreeing to fund a majority of The CW Network’s expenses and the retention of the Company’s share of certain receivables that existed prior to the transaction. There was no cash consideration exchanged in the transaction. The Company recorded an immaterial gain and retained a 12.5% ownership interest in The CW Network, which is accounted for as an equity method investment.
NOTE 5. GOODWILL AND OTHER INTANGIBLE ASSETS
Goodwill
Changes in the carrying value of goodwill attributable to each business unit were as follows (in millions).
| | | | | | | | | | | | | | | | | | | | | | | | | | | | |
| | Studios | | Networks | | DTC | | | | Total |
| December 31, 2022 | | $ | 8,963 | | | $ | 17,557 | | | $ | 7,918 | | | | | $ | 34,438 | |
| | | | | | | | | | |
| Acquisitions (See Note 4) | | 245 | | | (24) | | | 127 | | | | | 348 | |
| | | | | | | | | | |
| | | | | | | | | | |
| Foreign currency translation and other adjustments | | 64 | | | 97 | | | 22 | | | | | 183 | |
| December 31, 2023 | | $ | 9,272 | | | $ | 17,630 | | | $ | 8,067 | | | | | $ | 34,969 | |
| | | | | | | | | | |
| | | | | | | | | | |
| | | | | | | | | | |
| Impairment of goodwill | | — | | | (9,147) | | | — | | | | | (9,147) | |
| Foreign currency translation and other adjustments | | (75) | | | (64) | | | (16) | | | | | (155) | |
| December 31, 2024 | | $ | 9,197 | | | $ | 8,419 | | | $ | 8,051 | | | | | $ | 25,667 | |
The carrying amount of goodwill at the Networks segment included accumulated impairments of $10.8 billion and $1.6 billion as of December 31, 2024 and 2023, respectively. The Studios and DTC segments did not include any accumulated impairments as of December 31, 2024 and 2023.
WARNER BROS. DISCOVERY, INC.
NOTES TO CONSOLIDATED FINANCIAL STATEMENTS
Intangible Assets
Finite-lived intangible assets subject to amortization consisted of the following (in millions, except years).
| | | | | | | | | | | | | | | | | | | | | | | | | | | | | | | | | | | | | | | | | |
| | Weighted
Average
Amortization
Period (Years) | | December 31, 2024 | | December 31, 2023 |
| Gross | | Accumulated
Amortization | | Net | | Gross | | Accumulated
Amortization | | Net |
| Trademarks and trade names | 27 | | $ | 22,835 | | | $ | (4,212) | | | $ | 18,623 | | | $ | 22,935 | | | $ | (2,688) | | | $ | 20,247 | |
| Affiliate, advertising and subscriber relationships | 8 | | 24,240 | | | (18,528) | | | 5,712 | | | 24,335 | | | (14,730) | | | 9,605 | |
| Franchises | 35 | | 7,900 | | | (789) | | | 7,111 | | | 7,900 | | | (426) | | | 7,474 | |
| Character rights | 14 | | 995 | | | (197) | | | 798 | | | 995 | | | (125) | | | 870 | |
| Other | 6 | | 586 | | | (531) | | | 55 | | | 591 | | | (502) | | | 89 | |
| Total | | | $ | 56,556 | | | $ | (24,257) | | | $ | 32,299 | | | $ | 56,756 | | | $ | (18,471) | | | $ | 38,285 | |
Amortization expense for finite-lived intangible assets reflects the pattern in which the assets’ economic benefits are consumed over their estimated useful lives. For assets whose economic benefits are anticipated to be consumed evenly, a straight-line method is utilized. For assets in which the economic benefits are expected to be recognized unevenly over the useful life of the asset, an accelerated method such as the sum-of-the-months’ digits method is utilized. Amortization expense related to finite-lived intangible assets was $5,935 million, $6,854 million and $6,237 million for the years ended December 31, 2024, 2023 and 2022, respectively.
During 2024, as a result of the goodwill impairment charge discussed below and recorded in the second quarter of 2024, and the long-term trends and risks associated with the Company’s Networks reporting unit, the Company reassessed and shortened the useful lives for certain of its linear networks trade names. This change was considered a change in estimate, was accounted for prospectively, and resulted in incremental amortization expense of $184 million for the year ended December 31, 2024.
During 2023, the Company reassessed the useful lives and amortization methods for its linear networks and HBO trademarks and trade names, and its DC franchise, and concluded the pattern of amortization should be accelerated. Accordingly, the Company has changed the amortization method for these assets from the straight-line method to the sum-of-the-months’ digits method. This change was considered a change in estimate, was accounted for prospectively, and resulted in incremental amortization expense of $368 million for the year ended December 31, 2023.
Amortization expense relating to intangible assets subject to amortization for each of the next five years and thereafter is estimated to be as follows (in millions). | | | | | | | | | | | | | | | | | | | | | | | | | | | | | | | | | | | | | | |
| | 2025 | | 2026 | | 2027 | | 2028 | | 2029 | | Thereafter |
| Amortization expense | | $ | 4,578 | | | $ | 3,423 | | | $ | 2,636 | | | $ | 2,013 | | | $ | 1,768 | | | $ | 17,881 | |
Impairment Analysis
We perform fair value-based impairment tests of goodwill and intangible assets with indefinite lives on an annual basis, and between annual tests if an event occurs or if circumstances change that would more likely than not reduce the fair value of a reporting unit or an indefinite-lived intangible asset below its carrying value.
Significant judgments and assumptions for all quantitative goodwill tests performed include discount rates, control premiums, terminal growth rates, relevant comparable company earnings multiples and the amount and timing of expected future cash flows, including revenue growth rates and profit margins.
2024 Impairment Analysis
During the second quarter of 2024, the Company performed goodwill and intangible assets impairment monitoring procedures for all of its reporting units and concluded the delta between market capitalization and book value, continued softness in the U.S. linear advertising market, and uncertainty related to affiliate and sports rights renewals, including the NBA, represented a triggering event for the Networks reporting unit.
WARNER BROS. DISCOVERY, INC.
NOTES TO CONSOLIDATED FINANCIAL STATEMENTS
As a result, the Company elected to perform a quantitative impairment assessment for all of its reporting units in the second quarter of 2024. For the Networks reporting unit, fair value was determined using a DCF method. The key judgments and assumptions used in the DCF method to determine the fair value of the Networks reporting unit were as follows:
• The expected future cash flows in terms of their amount and timing. These cash flows, utilized in the DCF analysis, are derived from the reporting unit’s budget and its strategic long-term plan, which reflect expectations based upon operating performance and assumptions consistent with those of a market participant with regards to affiliate revenue, sports rights, and continued softness in the U.S. linear advertising market.
• Long-term growth rate of negative 3%.
• A discount rate of 10.5%. This is reflective of the risks inherent in the future cash flows of the reporting unit and market conditions.
Given the inherent uncertainty in determining the assumptions underlying a DCF analysis, actual results may differ from those used in the valuations.
The carrying value of the Networks reporting unit exceeded its fair value and the Company recorded a pre-tax, non-cash goodwill impairment charge of $9.1 billion during the second quarter of 2024 in impairments and loss on dispositions in the consolidated statements of operations. The goodwill impairment charge does not have an impact on the calculation of the Company’s financial covenants under the Company’s debt arrangements.
As of October 1, 2024, the Company performed a quantitative goodwill impairment assessment for all of its reporting units. The estimated fair value of each reporting unit exceeded its carrying value and, therefore, no impairment was recorded. The DTC reporting unit had headroom of 20%. The Studios reporting unit, which had headroom of 16%, and the Networks reporting unit, which had headroom of 12%, both had fair values in excess of carrying value of less than 20%. The fair values of the reporting units were determined using a combination of DCF and market valuation methodologies.
The Company continues to monitor its reporting units for triggers that could impact the recoverability of goodwill. Long-term trends and risks the Company is monitoring in its ongoing assessment include, but are not limited to, the following:
•the delta between market capitalization and book value;
•uncertainty related to affiliate rights renewals associated with the Company’s Networks and DTC reporting units;
•declining levels of global GDP growth and continued softness in the U.S. linear advertising market associated with the Company’s Networks reporting unit;
•content licensing trends and volatility related to the performance of theatrical film and game slates in the Company’s Studios reporting unit; and
•risks in executing the projected growth strategies of the Company’s DTC reporting unit.
2023 and 2022 Impairment Analysis
For the 2023 and 2022 annual impairment tests, the Company performed a quantitative goodwill impairment assessment for all reporting units. The estimated fair value of each reporting unit exceeded its carrying value and, therefore, no impairment was recorded.
Fair Value Measurements
The determination of fair value of the Company’s reporting units represents a Level 3 fair value measurement in the fair value hierarchy due to its use of internal projections and unobservable measurement inputs. Changes in significant judgments and estimates could significantly impact the determined fair value of the reporting unit or the valuation of intangible assets. Changes to assumptions that would decrease the fair value of the reporting unit may result in corresponding increases to the impairment of goodwill at the reporting unit.
NOTE 6. RESTRUCTURING AND OTHER CHARGES
In connection with the completion of its Merger with the WarnerMedia Business of AT&T on April 8, 2022, the Company has announced and has taken actions to implement projects to achieve cost synergies for the Company, which include, among other things, strategic content programming assessments, organization restructuring, facility consolidation activities, and other contract termination costs. While the Company’s restructuring efforts are ongoing, the merger-related restructuring program was considered to be substantially completed as of December 31, 2024. During 2023, the Company initiated a strategic realignment plan associated with its Warner Bros. Pictures Animation group. During 2024, the Company initiated two additional restructuring initiatives; an organizational and personnel restructuring plan and a restructuring initiative associated with its Warner Bros. Games group.
WARNER BROS. DISCOVERY, INC.
NOTES TO CONSOLIDATED FINANCIAL STATEMENTS
Restructuring and other charges by reportable segment and corporate and inter-segment eliminations were as follows (in millions).
| | | | | | | | | | | | | | | | | | | | |
| | Year Ended December 31, |
| | 2024 | | 2023 | | 2022 |
| Studios | | $ | 263 | | | $ | 225 | | | $ | 1,050 | |
| Networks | | 85 | | | 201 | | | 1,003 | |
| DTC | | 3 | | | 66 | | | 1,551 | |
| Corporate and inter-segment eliminations | | 96 | | | 93 | | | 153 | |
| Total restructuring and other charges | | $ | 447 | | | $ | 585 | | | $ | 3,757 | |
During the year ended December 31, 2024, restructuring and other charges primarily included organization restructuring costs of $246 million, content impairments and other content development costs and write-offs of $165 million, and contract terminations and other restructuring costs of $36 million. Facility consolidation impairment charges of $411 million were recorded in impairment and loss on dispositions in the consolidated statements of operations during the year ended December 31, 2024.
During the year ended December 31, 2023, restructuring and other charges primarily included content impairments and other content development costs and write-offs of $115 million, contract terminations and facility consolidation activities of $111 million, and organization restructuring costs of $359 million.
During the year ended December 31, 2022, restructuring and other charges primarily included charges related to strategic content programming initiatives, inclusive of content impairments, content development costs and write-offs, content contract terminations, and other content related charges of $3,133 million. In addition, there were restructuring charges related to organization restructuring of $607 million and facility consolidation activities and other contract terminations of $17 million.
Changes in restructuring liabilities recorded in accrued liabilities and other noncurrent liabilities by major category and by reportable segment and corporate were as follows (in millions).
| | | | | | | | | | | | | | | | | | | | | | | | | | | | | | | | | | | | |
| | | | | | Studios | | Networks | | DTC | | Corporate | | Total |
| December 31, 2022 | | | | | | $ | 156 | | | $ | 361 | | | $ | 188 | | | $ | 159 | | | $ | 864 | |
| | | | | | | | | | | | | | |
| Contract termination accruals, net | | | | | | 48 | | | 16 | | | 8 | | | 15 | | | 87 | |
| Employee termination accruals, net | | | | | | 47 | | | 175 | | | 60 | | | 78 | | | 360 | |
| Other accruals | | | | | | — | | | 2 | | | — | | | — | | | 2 | |
| Cash paid | | | | | | (153) | | | (352) | | | (176) | | | (172) | | | (853) | |
| December 31, 2023 | | | | | | 98 | | | 202 | | | 80 | | | 80 | | | 460 | |
| Contract termination accruals, net | | | | | | — | | | 1 | | | — | | | 3 | | | 4 | |
| Employee termination accruals, net | | | | | | 79 | | | 84 | | | 24 | | | 78 | | | 265 | |
| Other accruals | | | | | | 1 | | | (2) | | | (20) | | | 4 | | | (17) | |
| Cash paid | | | | | | (83) | | | (180) | | | (53) | | | (107) | | | (423) | |
| December 31, 2024 | | | | | | $ | 95 | | | $ | 105 | | | $ | 31 | | | $ | 58 | | | $ | 289 | |
WARNER BROS. DISCOVERY, INC.
NOTES TO CONSOLIDATED FINANCIAL STATEMENTS
NOTE 7. REVENUES
Disaggregated Revenue
The following table presents the Company’s revenues disaggregated by revenue source (in millions).
| | | | | | | | | | | | | | | | | | | | | | | | | | | | | |
| Year Ended December 31, 2024 |
| Studios | | Networks | | DTC | | Corporate and Inter-segment Eliminations | | Total |
| Revenues: | | | | | | | | | |
| Distribution | $ | 8 | | | $ | 10,680 | | | $ | 9,022 | | | $ | (9) | | | $ | 19,701 | |
| Advertising | 5 | | | 7,306 | | | 855 | | | (76) | | | 8,090 | |
| Content | 10,717 | | | 1,848 | | | 428 | | | (2,696) | | | 10,297 | |
| Other | 877 | | | 341 | | | 8 | | | 7 | | | 1,233 | |
| Totals | $ | 11,607 | | | $ | 20,175 | | | $ | 10,313 | | | $ | (2,774) | | | $ | 39,321 | |
| | | | | | | | | | | | | | | | | | | | | | | | | | | | | |
| Year Ended December 31, 2023 |
| Studios | | Networks | | DTC | | Corporate and Inter-segment Eliminations | | Total |
| Revenues: | | | | | | | | | |
| Distribution | $ | 17 | | | $ | 11,521 | | | $ | 8,703 | | | $ | (4) | | | $ | 20,237 | |
| Advertising | 15 | | | 8,342 | | | 548 | | | (205) | | | 8,700 | |
| Content | 11,358 | | | 1,005 | | | 886 | | | (2,046) | | | 11,203 | |
| Other | 802 | | | 376 | | | 17 | | | (14) | | | 1,181 | |
| Totals | $ | 12,192 | | | $ | 21,244 | | | $ | 10,154 | | | $ | (2,269) | | | $ | 41,321 | |
| | | | | | | | | | | | | | | | | | | | | | | | | | | | | |
| Year Ended December 31, 2022 |
| Studios | | Networks | | DTC | | Corporate and Inter-segment Eliminations | | Total |
| Revenues: | | | | | | | | | |
| Distribution | $ | 12 | | | $ | 9,759 | | | $ | 6,371 | | | $ | — | | | $ | 16,142 | |
| Advertising | 15 | | | 8,224 | | | 371 | | | (86) | | | 8,524 | |
| Content | 9,156 | | | 1,120 | | | 522 | | | (2,438) | | | 8,360 | |
| Other | 548 | | | 245 | | | 10 | | | (12) | | | 791 | |
| Totals | $ | 9,731 | | | $ | 19,348 | | | $ | 7,274 | | | $ | (2,536) | | | $ | 33,817 | |
Accounts Receivable and Credit Losses
The allowance for credit losses was not material at December 31, 2024 and 2023.
Contract Assets and Liabilities
The following table presents contract liabilities on the consolidated balance sheets (in millions).
| | | | | | | | | | | | | | | | | | | | |
| Category | | Balance Sheet Location | | December 31, 2024 | | December 31, 2023 |
| | | | | | |
| | | | | | |
| Contract liabilities | | Deferred revenues | | $ | 1,569 | | | $ | 1,924 | |
| Contract liabilities | | Other noncurrent liabilities | | 206 | | | 160 | |
The change in deferred revenue for the year ended December 31, 2024 primarily reflects cash payments received or contracted billings recorded for which the performance obligations were not satisfied prior to the end of the period, partially offset by $1,643 million of revenues recognized that were included in the deferred revenue balance at December 31, 2023. Revenue recognized for the year ended December 31, 2023 related to the deferred revenue balance at December 31, 2022 was $1,354 million. Contract assets were not material as of December 31, 2024 and 2023.
WARNER BROS. DISCOVERY, INC.
NOTES TO CONSOLIDATED FINANCIAL STATEMENTS
Transaction Price Allocated to Remaining Performance Obligations
Most of the Company’s distribution contracts are licenses of functional intellectual property where revenue is derived from royalty-based arrangements, for which revenues are recorded as a function of royalties earned to date instead of estimating incremental royalty contract revenue. However, there are certain other distribution arrangements that are fixed price or contain minimum guarantees that extend beyond one year. The Company recognizes revenue for fixed fee distribution contracts monthly based on minimum monthly fees by calculating one twelfth of annual license fees specified in its distribution contracts, or based on the pro-rata fees earned calculated on the license fees specified in the distribution contract.
The Company’s content licensing contracts and sports sublicensing deals are licenses of functional intellectual property.
The Company’s brand licensing contracts are licenses of symbolic intellectual property.
The Company’s advertising contracts are principally generated from the sale of advertising campaigns comprised of multiple commercial units. In contracts with guaranteed impressions, we have identified the overall advertising campaign as the performance obligation to be satisfied over time, and impressions delivered against the satisfaction of our guarantee as the measure of progress. Certain of these arrangements extend beyond one year.
The following table presents a summary of remaining performance obligations by contract type (in millions).
| | | | | | | | | | | | | | |
| Contract Type | | December 31, 2024 | | Duration |
| Distribution - fixed price or minimum guarantee | | $ | 2,407 | | | Through 2031 |
| Content licensing and sports sublicensing | | 4,416 | | | Through 2032 |
| Brand licensing | | 3,006 | | | Through 2052 |
| Advertising | | 757 | | | Through 2030 |
| Other | | 133 | | | Through 2029 |
| Total | | $ | 10,719 | | | |
The value of unsatisfied performance obligations disclosed above does not include: (i) contracts involving variable consideration for which revenues are recognized in accordance with the sales or usage-based royalty exception, which typically have a similar duration as the contracts disclosed above, and (ii) contracts with an original expected length of one year or less, such as most advertising contracts; however for content licensing revenues, including revenues associated with the licensing of theatrical and television product for television and streaming services, the Company has included all contracts regardless of duration.
NOTE 8. SALES OF RECEIVABLES
Revolving Receivables Program
During 2024, the Company amended its revolving receivables program to reduce the facility limit to $5,200 million and extend the program to June 2025. The outstanding portfolio of receivables derecognized from our consolidated balance sheets was $4,637 million and $5,200 million as of December 31, 2024 and 2023, respectively.
For the years ended December 31, 2024, 2023 and 2022, the Company recognized $116 million, $79 million, and $256 million, respectively, in selling, general and administrative expenses from the revolving receivables program in the consolidated statements of operations (net of non-designated derivatives in 2024 and 2023). (See Note 13.)
The following table presents a summary of receivables sold (in millions).
| | | | | | | | | | | |
| Year Ended December 31, |
| 2024 | | 2023 |
| Gross receivables sold/cash proceeds received | $ | 15,254 | | | $ | 13,340 | |
| Collections reinvested under revolving receivables program | (15,818) | | | (13,506) | |
| Net cash proceeds remitted | $ | (564) | | | $ | (166) | |
| Net receivables sold | $ | 15,153 | | | $ | 13,178 | |
| Obligations recorded (Level 3) | $ | 361 | | | $ | 405 | |
|
WARNER BROS. DISCOVERY, INC.
NOTES TO CONSOLIDATED FINANCIAL STATEMENTS
The following table presents a summary of the amounts transferred or pledged (in millions).
| | | | | | | | | | | |
| December 31, 2024 | | December 31, 2023 |
| Gross receivables pledged as collateral | $ | 2,402 | | | $ | 3,088 | |
| Restricted cash pledged as collateral | $ | 100 | | | $ | 500 | |
| Balance sheet classification: | | | |
| Receivables, net | $ | 2,039 | | | $ | 2,780 | |
| Prepaid expenses and other current assets | $ | 100 | | | $ | 500 | |
| Other noncurrent assets | $ | 363 | | | $ | 308 | |
Accounts Receivable Factoring
Total trade accounts receivable sold under the Company’s factoring arrangement was $313 million and $383 million for the years ended December 31, 2024 and 2023, respectively. The impact to the consolidated statements of operations was immaterial for the years ended December 31, 2024, 2023 and 2022. This accounts receivable factoring agreement is separate and distinct from the revolving receivables program.
NOTE 9. CONTENT RIGHTS
For purposes of amortization and impairment, capitalized content costs are grouped based on their predominant monetization strategy: individually or as a group. Programming rights are presented as two separate captions: licensed content and advances and live programming and advances. Live programming includes licensed sports rights and related advances. The table below presents the components of content rights (in millions).
| | | | | | | | | | | | | | | | | | | | |
| December 31, 2024 |
| | Predominantly Monetized Individually | | Predominantly Monetized as a Group | | Total |
| Theatrical film production costs: | | | | | | |
| Released, less amortization | | $ | 1,478 | | | $ | — | | | $ | 1,478 | |
| Completed and not released | | 480 | | | — | | | 480 | |
| In production and other | | 1,308 | | | — | | | 1,308 | |
| | | | | | |
| Television production costs: | | | | | | |
| Released, less amortization | | 1,470 | | | 5,678 | | | 7,148 | |
| Completed and not released | | 314 | | | 767 | | | 1,081 | |
| In production and other | | 392 | | | 2,008 | | | 2,400 | |
| Total theatrical film and television production costs | | $ | 5,442 | | | $ | 8,453 | | | $ | 13,895 | |
| Licensed content and advances, net | | | | | | 4,369 | |
| Live programming and advances, net | | | | | | 1,375 | |
| Game development costs, less amortization | | | | | | 247 | |
| Total film and television content rights and games | | | | | | 19,886 | |
| Less: Current content rights and prepaid license fees, net | | | | | | (784) | |
| Total noncurrent film and television content rights and games | | | | | | $ | 19,102 | |
WARNER BROS. DISCOVERY, INC.
NOTES TO CONSOLIDATED FINANCIAL STATEMENTS
| | | | | | | | | | | | | | | | | | | | |
| December 31, 2023 |
| | Predominantly Monetized Individually | | Predominantly Monetized as a Group | | Total |
| Theatrical film production costs: | | | | | | |
| Released, less amortization | | $ | 2,823 | | | $ | — | | | $ | 2,823 | |
| Completed and not released | | 107 | | | — | | | 107 | |
| In production and other | | 1,300 | | | — | | | 1,300 | |
| | | | | | |
| Television production costs: | | | | | | |
| Released, less amortization | | 1,471 | | | 5,317 | | | 6,788 | |
| Completed and not released | | 380 | | | 606 | | | 986 | |
| In production and other | | 417 | | | 2,624 | | | 3,041 | |
| Total theatrical film and television production costs | | $ | 6,498 | | | $ | 8,547 | | | $ | 15,045 | |
| Licensed content and advances, net | | | | | | 4,519 | |
| Live programming and advances, net | | | | | | 1,943 | |
| Game development costs, less amortization | | | | | | 565 | |
| Total film and television content rights and games | | | | | | 22,072 | |
| Less: Current content rights and prepaid license fees, net | | | | | | (843) | |
| Total noncurrent film and television content rights and games | | | | | | $ | 21,229 | |
Content amortization consisted of the following (in millions).
| | | | | | | | | | | | | | | | | | | | |
| | Year Ended December 31, |
| | 2024 | | 2023 | | 2022 |
| | | | | | |
| Predominantly monetized individually | | $ | 3,999 | | | $ | 5,165 | | | $ | 5,175 | |
| | | | | | |
| | | | | | |
| | | | | | |
| | | | | | |
| Predominantly monetized as a group | | 9,554 | | | 10,648 | | | 8,935 | |
| | | | | | |
| | | | | | |
| Total content amortization | | $ | 13,553 | | | $ | 15,813 | | | $ | 14,110 | |
Content expense includes amortization, impairments, and development expense and is generally a component of costs of revenues on the consolidated statements of operations. For the year ended December 31, 2024, total content impairments were $558 million, of which content impairments and other content development costs and write-offs of $165 million were primarily due to the abandonment of certain titles in connection with the fourth quarter 2024 restructuring initiative associated with the Warner Bros. Games group and are reflected in restructuring and other charges in the Studios segment.
For the year ended December 31, 2023, total content impairments were $326 million, of which content impairments and other content development costs and write-offs of $115 million were primarily due to the abandonment of certain films in connection with the third quarter 2023 strategic realignment plan associated with the Warner Bros. Pictures Animation group and are reflected in restructuring and other charges in the Studios segment.
For the year ended December 31, 2022, total content impairments were $2,807 million. Content impairments of $2,756 million and content development write-offs of $377 million were due to the abandonment of certain content categories in connection with the strategic realignment of content following the Merger and are reflected in restructuring and other charges in the Studios, Networks and DTC segments. (See Note 6.)
WARNER BROS. DISCOVERY, INC.
NOTES TO CONSOLIDATED FINANCIAL STATEMENTS
The table below presents the expected future amortization expense of the Company’s film and television content rights, licensed content and advances, live programming rights and advances, and games as of December 31, 2024 (in millions).
| | | | | | | | | | | | | | | | | | | | |
| | Year Ending December 31, |
| | 2025 | | 2026 | | 2027 |
| Released investment in films and television content: | | | | | | |
| Monetized individually | | $ | 946 | | | $ | 547 | | | $ | 468 | |
| Monetized as a group | | 2,312 | | | 1,284 | | | 804 | |
| Licensed content and advances | | 1,394 | | | 812 | | | 603 | |
| Live programming and advances | | 1,136 | | | 33 | | | 25 | |
| Games | | 66 | | | 3 | | | — | |
| | | | | | |
| Completed and not released investment in films and television content: | | | | | | |
| Monetized individually | | $ | 647 | | | | | |
| Monetized as a group | | 309 | | | | | |
At December 31, 2024, acquired film and television libraries are being amortized using straight-line or other accelerated amortization methods through 2033.
NOTE 10. INVESTMENTS
The Company’s equity investments consisted of the following, net of investments recorded in other noncurrent liabilities (in millions).
| | | | | | | | | | | | | | | | | | | | | | | | | | |
| Category | | Balance Sheet Location | | Ownership | | December 31, 2024 | | December 31, 2023 |
| Equity method investments: | | | | | | | | |
| The Chernin Group (TCG) 2.0-A, LP | | Other noncurrent assets | | 44% | | $ | 240 | | | $ | 249 | |
| nC+ | | Other noncurrent assets | | 32% | | 128 | | | 142 | |
| TNT Sports | | Other noncurrent assets | | 50% | | 92 | | | 102 | |
| Other | | Other noncurrent assets | | | | 261 | | | 503 | |
| Total equity method investments | | | | | | 721 | | | 996 | |
| | | | | | | | |
| | | | | | | | |
| | | | | | | | |
| Investments with readily determinable fair values | | Other noncurrent assets | | | | 41 | | | 53 | |
| | | | | | | | |
| | | | | | | | |
| Investments without readily determinable fair values | | Other noncurrent assets (a) | | | | 353 | | | 438 | |
| Total investments | | | | | | $ | 1,115 | | | $ | 1,487 | |
(a) Investments without readily determinable fair values included $17 million as of December 31, 2024 and December 31, 2023 that were included in prepaid expenses and other current assets.
Equity Method Investments
Certain of the Company’s other equity method investments are VIEs, for which the Company is not the primary beneficiary. As of December 31, 2024, the Company’s maximum exposure for all its unconsolidated VIEs, including the investment carrying values and unfunded contractual commitments made on behalf of VIEs, was approximately $569 million. The Company’s maximum estimated exposure excludes the non-contractual future funding of VIEs. The aggregate carrying values of these VIE investments were $550 million and $697 million as of December 31, 2024 and 2023, respectively. The Company recognized its portion of VIE operating results with losses of $24 million, $75 million, and $87 million for the years ended December 31, 2024, 2023 and 2022, respectively, in loss from equity investees, net, on the consolidated statements of operations.
WARNER BROS. DISCOVERY, INC.
NOTES TO CONSOLIDATED FINANCIAL STATEMENTS
Equity Investments Without Readily Determinable Fair Values Assessed Under the Measurement Alternative
The Company recorded impairments and upward adjustments for its other equity investments without readily determinable fair values of $27 million and $16 million during the year ended December 31, 2024, respectively, as a result of observable price changes in orderly transactions for the identical or similar investment of the same issuer. The changes in fair value as a result of observable price changes is recorded in other income (expense), net on the consolidated statements of operations. (See Note 18.) As of December 31, 2024, the Company had recorded cumulative impairments of $260 million and cumulative upward adjustments of $25 million for its equity method investments without readily determinable fair values.
NOTE 11. DEBT
The table below presents the components of outstanding debt (in millions). | | | | | | | | | | | | | | | | | | | | |
| | | | December 31, |
| | Weighted-Average Interest Rate as of 12/31/2024 | | 2024 | | 2023 |
| | | | | | |
| Floating rate senior notes with maturities of 5 years or less | | — | % | | $ | — | | | $ | 40 | |
| Senior notes with maturities of 5 years or less | | 4.11 | % | | 13,744 | | | 13,664 | |
| Senior notes with maturities between 5 and 10 years | | 4.37 | % | | 7,853 | | | 8,607 | |
| Senior notes with maturities greater than 10 years | | 5.20 | % | | 17,930 | | | 21,644 | |
| Total debt | | | | 39,527 | | | 43,955 | |
| Unamortized discount, premium, debt issuance costs, and fair value adjustments for acquisition accounting, net | | | | (22) | | | (286) | |
| Debt, net of unamortized discount, premium, debt issuance costs, and fair value adjustments for acquisition accounting | | | | 39,505 | | | 43,669 | |
| Current portion of debt | | | | (2,748) | | | (1,780) | |
| Noncurrent portion of debt | | | | $ | 36,757 | | | $ | 41,889 | |
During the year ended December 31, 2024, the Company commenced a tender offer to purchase for cash up to $2.61 billion in aggregate purchase price (excluding accrued and unpaid interest) of (i) DCL’s outstanding 3.900% Senior Notes due 2024, 4.000% Senior Notes due 2055, 4.650% Senior Notes due 2050, 4.950% Senior Notes due 2042, 4.875% Senior Notes due 2043, 5.200% Senior Notes due 2047, and 5.300% Senior Notes due 2049; (ii) Scripps Networks Interactive, Inc.’s (“Scripps Networks”) outstanding 3.900% Senior Notes due 2024; (iii) the legacy WarnerMedia Business’s outstanding 4.650% Senior Notes due 2044, 4.850% Senior Notes due 2045, 4.900% Senior Notes due 2042, and 5.350% Senior Notes due 2043; and (iv) WMH’s outstanding 5.050% Senior Notes due 2042, which was funded using the aggregate net proceeds from debt financing transactions together with available cash on hand and other available sources of liquidity. The Company completed the tender offer in June 2024 by purchasing senior notes in the aggregate principal amount of $3,399 million validly tendered and accepted for purchase pursuant to the offer and recorded a gain on extinguishment of $542 million.
During the year ended December 31, 2024, the Company also repaid in full at maturity $296 million of aggregate principal amount outstanding of its senior notes due November 2024; £400 million ($529 million equivalent at repayment) of aggregate principal amount outstanding of its senior notes due September 2024; $48 million of aggregate principal amount outstanding of its senior notes due June 2024; $726 million of aggregate principal amount outstanding of its senior notes due February and March 2024; and completed open market repurchases for $965 million of aggregate principal amount outstanding of its senior notes.
During the year ended December 31, 2024, the Company issued €650 million of 4.302% fixed rate senior notes due January 2030 and €850 million of 4.693% fixed rate senior notes due May 2033, the proceeds of which were used to fund the aforementioned tender offer. After December 2029 and February 2033, respectively, the senior notes are redeemable at par plus accrued and unpaid interest.
WARNER BROS. DISCOVERY, INC.
NOTES TO CONSOLIDATED FINANCIAL STATEMENTS
During the year ended December 31, 2023, the Company’s wholly-owned subsidiaries, Warner Media, LLC (“WML”), Historic TW Inc. (“TWI”), DCL, and WMH, commenced cash tender offers to purchase for cash any and all of (i) WML’s outstanding 4.050% Senior Notes due 2023 and 3.550% Senior Notes due 2024; (ii) TWI’s outstanding 7.570% Senior Notes due 2024; (iii) DCL’s outstanding 3.800% Senior Notes due 2024; and (iv) WMH’s outstanding 3.528% Senior Notes due 2024 and 3.428% Senior Notes due 2024. The Company completed the tender offers in August 2023 by purchasing senior notes in the amount of $1.9 billion validly tendered and accepted for purchase pursuant to the offers. During the year ended December 31, 2023, the Company also commenced a tender offer to purchase for cash any and all of its outstanding Floating Rate Notes due in 2024. The Company completed the tender offer in June 2023 by purchasing Floating Rate Notes in the amount of $460 million validly tendered and accepted for purchase pursuant to the offer.
During the year ended December 31, 2023, the Company also repaid $4.0 billion of aggregate principal amount outstanding of its term loan prior to the due date of April 2025; repaid in full at maturity $42 million of aggregate principal amount outstanding of its senior notes due December 2023, $178 million of aggregate principal amount outstanding of its senior notes due September 2023, and $106 million of aggregate principal amount outstanding of its senior notes due February 2023; and completed open market repurchases for $183 million of aggregate principal amount outstanding of its senior notes.
During the year ended December 31, 2023, the Company issued $1.5 billion of 6.412% fixed rate senior notes due March 2026. After March 2024, the senior notes are redeemable at par plus accrued and unpaid interest.
As of December 31, 2024, all senior notes are fully and unconditionally guaranteed by the Company, Scripps Networks, DCL (to the extent it is not the primary obligor on such senior notes), and WMH (to the extent it is not the primary obligor on such senior notes), except for $1,043 million of senior notes of the legacy WarnerMedia Business assumed by the Company in connection with the Merger and $11 million of un-exchanged senior notes issued by Scripps Networks.
Revolving Credit Facility and Commercial Paper Programs
In October 2024, DCL and certain subsidiaries of the Company, as borrowers, entered into a multicurrency revolving credit agreement (the “Credit Agreement”), replacing the existing $6.0 billion multicurrency revolving credit agreement dated June 9, 2021 (as amended). The Credit Agreement provides for a senior revolving credit facility (the “Credit Facility”) with aggregate commitments of $6.0 billion and includes a $150 million sublimit for the issuance of standby letters of credit. DCL may also request additional commitments up to $1.0 billion from the lenders upon satisfaction of certain conditions. The obligations of the borrowers under the Credit Agreement are unsecured and are guaranteed by the Company, Scripps Networks, and WMH. The Credit Agreement is available on a revolving basis until October 2029, with an option for up to two additional 364-day renewal periods subject to the lenders’ consent.
Additionally, the Company's commercial paper program is supported by the Credit Facility. Under the commercial paper program, the Company may issue up to $1.0 billion. Borrowing capacity under the Credit Facility is effectively reduced by any outstanding borrowings under the commercial paper program.
As of December 31, 2024 and 2023, the Company had no outstanding borrowings under the Credit Facility or the commercial paper program.
The Credit Agreement contains customary representations and warranties as well as affirmative and negative covenants, and also requires maintenance of a minimum consolidated interest coverage ratio of 3.00 to 1.00 and a maximum consolidated leverage ratio of 4.50 to 1.00. As of December 31, 2024, the Company was in compliance with all applicable covenants and there were no events of default under the Credit Agreement.
Long-term Debt Repayment Schedule
The following table presents a summary of scheduled debt and estimated interest payments, excluding the revolving credit facility and commercial paper borrowings, for the next five years based on the amount of the Company’s debt outstanding as of December 31, 2024 (in millions). | | | | | | | | | | | | | | | | | | | | | | | | | | | | | | | | | | | | | | |
| | 2025 | | 2026 | | 2027 | | 2028 | | 2029 | | Thereafter |
| Long-term debt repayments | | $ | 2,749 | | | $ | 2,239 | | | $ | 4,677 | | | $ | 1,767 | | | $ | 2,312 | | | $ | 25,783 | |
| Interest payments | | $ | 1,792 | | | $ | 1,674 | | | $ | 1,532 | | | $ | 1,408 | | | $ | 1,324 | | | $ | 19,606 | |
WARNER BROS. DISCOVERY, INC.
NOTES TO CONSOLIDATED FINANCIAL STATEMENTS
NOTE 12. LEASES
The Company has operating and finance leases for transponders, office space, studio facilities, software, and other equipment. The Company’s leases were reflected in the Company’s consolidated balance sheets as follows (in millions).
| | | | | | | | | | | | | | | | | |
| | | December 31, |
| | | 2024 | | 2023 |
| Operating Leases | Location on Balance Sheet | | | | |
| Operating lease right-of-use assets | Other noncurrent assets | | $ | 2,373 | | | $ | 3,074 | |
| | | | | |
| Operating lease liabilities (current) | Accrued liabilities | | $ | 307 | | | $ | 332 | |
| Operating lease liabilities (noncurrent) | Other noncurrent liabilities | | 2,731 | | | 3,019 | |
| Total operating lease liabilities | | | $ | 3,038 | | | $ | 3,351 | |
| | | | | |
| Finance Leases | | | | | |
| Finance lease right-of-use assets | Property and equipment, net | | $ | 432 | | | $ | 249 | |
| | | | | |
| Finance lease liabilities (current) | Accrued liabilities | | $ | 107 | | | $ | 74 | |
| Finance lease liabilities (noncurrent) | Other noncurrent liabilities | | 356 | | | 191 | |
| Total finance lease liabilities | | | $ | 463 | | | $ | 265 | |
Supplemental information related to leases was as follows.
| | | | | | | | | | | | | | |
| | December 31, |
| | 2024 | | 2023 |
| Weighted average remaining lease term (in years): | | | | |
| Operating leases | | 11 | | 11 |
| Finance leases | | 6 | | 5 |
| | | | |
| Weighted average discount rate | | | | |
| Operating leases | | 4.43 | % | | 4.42 | % |
| Finance leases | | 5.11 | % | | 4.17 | % |
The Company’s leases have remaining lease terms of up to 28 years, some of which include multiple options to extend the leases for up to a total of 20 years. Most leases are not cancelable prior to their expiration.
The components of lease cost were as follows (in millions):
| | | | | | | | | | | | | | | | | | | | |
| | Year Ended December 31, |
| | 2024 | | 2023 | | 2022 |
| Operating lease cost | | $ | 441 | | | $ | 540 | | | $ | 372 | |
| | | | | | |
| Finance lease cost: | | | | | | |
| Amortization of right-of-use assets | | $ | 111 | | | $ | 85 | | | $ | 78 | |
| Interest on lease liabilities | | 19 | | | 8 | | | 8 | |
| Total finance lease cost | | $ | 130 | | | $ | 93 | | | $ | 86 | |
| | | | | | |
Variable fees and other(a) | | $ | 44 | | | $ | 74 | | | $ | 66 | |
| Total lease cost | | $ | 615 | | | $ | 707 | | | $ | 524 | |
(a) Includes variable lease payments related to our operating and finance leases and costs of leases with initial terms of less than one year.
WARNER BROS. DISCOVERY, INC.
NOTES TO CONSOLIDATED FINANCIAL STATEMENTS
Supplemental cash flow information related to leases was as follows (in millions):
| | | | | | | | | | | | | | | | | | | | |
| | Year Ended December 31, |
| | 2024 | | 2023 | | 2022 |
| Cash paid for amounts included in the measurement of lease liabilities: | | | | | | |
| Operating cash flows from operating leases | | $ | (476) | | | $ | (501) | | | $ | (360) | |
| Operating cash flows from finance leases | | $ | (19) | | | $ | (19) | | | $ | (15) | |
| Financing cash flows from finance leases | | $ | (95) | | | $ | (74) | | | $ | (70) | |
| | | | | | |
| Right-of-use assets obtained in exchange for lease obligations: | | | | | | |
| Operating leases | | $ | 78 | | | $ | 364 | | | $ | 490 | |
| Finance leases | | $ | 300 | | | $ | 95 | | | $ | 39 | |
Maturities of lease liabilities as of December 31, 2024 were as follows (in millions):
| | | | | | | | | | | | | | |
| | Operating Leases | | Finance Leases |
| 2025 | | $ | 432 | | | $ | 130 | |
| 2026 | | 377 | | | 112 | |
| 2027 | | 349 | | | 91 | |
| 2028 | | 338 | | | 57 | |
| 2029 | | 334 | | | 30 | |
| Thereafter | | 2,072 | | | 115 | |
| Total lease payments | | 3,902 | | | 535 | |
| Less: Imputed interest | | (864) | | | (72) | |
| Total | | $ | 3,038 | | | $ | 463 | |
During the year ended December 31, 2024, ROU asset impairment charges were $411 million and were primarily related to impairments of the Company’s Hudson Yards, New York office as a result of recoverability tests performed during the year as subleases for the office were executed. The impairment charges were recorded in impairment and loss on dispositions in the consolidated statements of operations.
As of December 31, 2024, the Company has additional leases that have not yet commenced with total minimum lease payments of approximately $66 million.
NOTE 13. DERIVATIVE FINANCIAL INSTRUMENTS
In the normal course of business, the Company is exposed to foreign currency exchange rate market risk and interest rate fluctuations. As part of its risk management strategy, the Company uses derivative financial instruments, primarily foreign currency forward contracts, fixed-to-fixed currency swaps, total return swaps, and interest rate swaps, to hedge certain foreign currency, market value and interest rate exposures. The Company’s objective is to reduce earnings volatility by offsetting gains and losses resulting from these exposures with losses and gains on the derivative contracts used to hedge them. The Company does not enter into or hold derivative financial instruments for speculative trading purposes.
WARNER BROS. DISCOVERY, INC.
NOTES TO CONSOLIDATED FINANCIAL STATEMENTS
There were no amounts eligible to be offset under master netting agreements as of December 31, 2024 and 2023. The fair value of the Company’s derivative financial instruments at December 31, 2024 and 2023 was determined using a market-based approach (Level 2). The following table summarizes the Company’s derivative financial instruments recorded on its consolidated balance sheets (in millions).
| | | | | | | | | | | | | | | | | | | | | | | | | | | | | | | | | | | | | | | | | | | | | | | | | | | | | | | | | | | |
| December 31, 2024 | | December 31, 2023 |
| | | Fair Value | | | | Fair Value |
| Notional | | Prepaid expenses and other current assets | | Other non-
current assets | | Accrued liabilities | | Other non-
current liabilities | | Notional | | Prepaid expenses and other current assets | | Other non-
current assets | | Accrued liabilities | | Other non-
current liabilities |
| Cash flow hedges: | | | | | | | | | | | | | | | | | | | |
| Foreign exchange | $ | 1,608 | | | $ | 47 | | | $ | 14 | | | $ | 25 | | | $ | 28 | | | $ | 1,484 | | | $ | 40 | | | $ | 8 | | | $ | 37 | | | $ | 8 | |
| | | | | | | | | | | | | | | | | | | |
| | | | | | | | | | | | | | | | | | | |
Net investment hedges: (a) | | | | | | | | | | | | | | | | | | | |
| Cross-currency swaps | 421 | | | 6 | | | — | | | — | | | 4 | | | 1,779 | | | 23 | | | 12 | | | 7 | | | 42 | |
| | | | | | | | | | | | | | | | | | | |
| Fair value hedges: | | | | | | | | | | | | | | | | | | | |
| Interest rate swaps | — | | | — | | | — | | | — | | | — | | | 1,500 | | | 7 | | | — | | | — | | | 5 | |
| No hedging designation: | | | | | | | | | | | | | | | | | | | |
| Foreign exchange | 951 | | | 18 | | | 7 | | | 14 | | | 122 | | | 1,058 | | | 1 | | | 1 | | | 1 | | | 83 | |
| Cross-currency swaps | 210 | | | 2 | | | — | | | — | | | 1 | | | — | | | — | | | — | | | — | | | — | |
| | | | | | | | | | | | | | | | | | | |
| Total return swaps | 454 | | | — | | | — | | | 16 | | | — | | | 395 | | | 19 | | | — | | | — | | | — | |
| | | | | | | | | | | | | | | | | | | |
| | | | | | | | | | | | | | | | | | | |
| Total | | | $ | 73 | | | $ | 21 | | | $ | 55 | | | $ | 155 | | | | | $ | 90 | | | $ | 21 | | | $ | 45 | | | $ | 138 | |
(a) Excludes €1,500 million of euro-denominated notes ($1,558 million equivalent at December 31, 2024) and £402 million of sterling notes ($513 million equivalent at December 31, 2023) designated as net investment hedges. (See Note 11.)
Derivatives Designated for Hedge Accounting
Cash Flow Hedges
The Company uses foreign exchange forward contracts to mitigate the foreign currency risk related to revenues, production rebates, and production expenses. As production spend occurs or when rebate receivables are recognized, foreign forward exchange contracts designated as cash flow hedges are de-designated. Upon de-designation, gains and losses on these derivatives directly impact earnings in the same line and same period as the hedged risk. These cash flow hedges are carried at fair market value on the Company’s consolidated balance sheets. Hedge effectiveness is assessed using the spot method, with fair market value changes recorded in other comprehensive loss until the hedged item affects earnings. Excluded components, including forward points, are included in current earnings.
The Company is exposed to foreign currency risk associated with its British Pound Sterling denominated debt and executed a fixed-to-fixed cross-currency swap in 2022 to mitigate this risk. During the year ended December 31, 2023, the Company unwound the cross-currency swaps related to its Sterling debt and recognized a gain of $76 million as an adjustment to other comprehensive income.
The Company is exposed to interest rate risk associated with future issuances of debt and unwound the forward starting swap derivatives designated as hedging instruments to mitigate this risk in 2022. Realized gains from these derivatives will remain in other comprehensive loss until the debt is issued during the hedging window or the hedging window expires, which extends through 2025, and interest payments are made. An immaterial portion of the realized gain was released in 2024 since no debt was issued during this period of the hedging window.
WARNER BROS. DISCOVERY, INC.
NOTES TO CONSOLIDATED FINANCIAL STATEMENTS
The following table presents the pre-tax impact of derivatives designated as cash flow hedges on income and other comprehensive loss (in millions).
| | | | | | | | | | | | | | | | | | | | |
| | Year Ended December 31, |
| | 2024 | | 2023 | | 2022 |
| Gains (losses) recognized in accumulated other comprehensive loss: | | | | | | |
| Foreign exchange - derivative adjustments | | $ | 37 | | | $ | 23 | | | $ | 7 | |
| | | | | | |
| Gains (losses) reclassified into income from accumulated other comprehensive loss: | | | | | | |
| Foreign exchange - distribution revenue | | 22 | | | (5) | | | (1) | |
| Foreign exchange - advertising revenue | | 2 | | | 1 | | | 1 | |
| Foreign exchange - costs of revenues | | 7 | | | 3 | | | 25 | |
| | | | | | |
| Foreign exchange - other income (expense), net | | — | | | 18 | | | — | |
| Interest rate - interest expense, net | | (5) | | | (1) | | | (2) | |
| Interest rate - gain (loss) on extinguishment of debt | | (4) | | | 1 | | | — | |
| Interest rate - other income (expense), net | | 20 | | | — | | | — | |
| | | | | | |
| | | | | | |
If current fair values of designated cash flow hedges as of December 31, 2024 remained static over the next twelve months, the amount the Company would reclassify from accumulated other comprehensive loss into income in the next twelve months would not be material for the current fiscal year. The maximum length of time the Company is hedging exposure to the variability in future cash flows is 31 years.
Net Investment Hedges
The Company is exposed to foreign currency risk associated with the net assets of non-USD functional entities and uses fixed-to-fixed cross currency swaps to mitigate this risk.
During the year ended December 31, 2024, to mitigate the currency risk associated with the net assets of non-USD functional entities, the Company designated its €1,500 million denominated debt issued in May 2024 as a net investment hedge (see Note 11) and subsequently de-designated and re-designated €225 million of its Euro denominated debt.
During the year ended December 31, 2024, the Company also designated an additional €900 million of fixed-to-fixed cross currency swaps as a net investment hedge and subsequently settled €300 million and de-designated €200 million of fixed-to-fixed cross currency swaps designated as a net investment hedge.
During the year ended December 31, 2023, to mitigate the risk associated with the net assets of non-USD functional entities, the Company re-designated its Sterling denominated debt due in 2024 as a net investment hedge after the unwind of the cash flow hedge previously noted. During the year ended December 31, 2024, the Company de-designated £255 million of the Sterling debt, repaid the Sterling debt in full at maturity, and settled the remaining £145 million designated as a net investment hedge.
The Company is also exposed to foreign currency risk stemming from foreign denominated debt. During the year ended December 31, 2023, the Company settled its Euro denominated debt that was acquired in connection with the Merger and was designated as the hedging instrument in a net investment hedge.
WARNER BROS. DISCOVERY, INC.
NOTES TO CONSOLIDATED FINANCIAL STATEMENTS
The following table presents the pre-tax impact of derivatives designated as net investment hedges on other comprehensive loss (in millions). Other than amounts excluded from effectiveness testing, there were no other material gains (losses) reclassified from accumulated other comprehensive loss to income during the years ended December 31, 2024, 2023 and 2022.
| | | | | | | | | | | | | | | | | | | | | | | | | | | | | | | | | | | | | | | | | | | | | | | | | | |
| | Year Ended December 31, | | |
| | Amount of gain (loss) recognized in AOCI | | | | | | Location of gain (loss) recognized in income on derivative (amount excluded from effectiveness testing) | | Amount of gain (loss) recognized in income on derivative (amount excluded from effectiveness testing) |
| | 2024 | | 2023 | | 2022 | | | | | | | | 2024 | | 2023 | | 2022 |
| Cross currency swaps | | $ | 70 | | | $ | 43 | | | $ | 46 | | | | | | | | | Interest expense, net | | $ | 4 | | | $ | 24 | | | $ | 33 | |
| | | | | | | | | | | | | | | | | | | | |
| Euro denominated notes (foreign denominated debt) | | 78 | | | 3 | | | 4 | | | | | | | | | N/A | | — | | | — | | | — | |
| Sterling denominated notes (foreign denominated debt) | | (5) | | | (11) | | | 112 | | | | | | | | | N/A | | — | | | — | | | — | |
| Total | | $ | 143 | | | $ | 35 | | | $ | 162 | | | | | | | | | | | $ | 4 | | | $ | 24 | | | $ | 33 | |
Fair Value Hedges
During the year ended December 31, 2023, the Company issued $1.5 billion of 6.412% fixed rate senior notes due March 2026. Simultaneously, the Company entered into a fixed-to-floating interest rate swap designated as a fair value hedge to allow the Company to mitigate the variability in the fair value of its senior notes due to fluctuations in the benchmark interest rate. Changes in the fair value of the senior note and the interest rate swap were recorded in interest expense, net. The fair value hedge was settled during the year ended December 31, 2024.
Derivatives Not Designated for Hedge Accounting
The Company has deferred compensation plans that have risk related to the fair market value gains and losses on investments and uses total return swaps to mitigate this risk. The gains and losses associated with these swaps are recorded to selling, general and administrative expenses, offsetting the deferred compensation investment gains and losses.
The Company is exposed to risk of secured overnight financing rate changes in connection with securitization interest paid on the receivables securitization program. To mitigate this risk, the Company entered into and unwound and settled $3.0 billion notional of non-designated interest rate swaps for an immaterial realized gain during the year ended December 31, 2024. The Company entered into and unwound and settled $6.0 billion notional of non-designated interest rate swaps for a total realized gain of $63 million during the year ended December 31, 2023. The gains and losses on these derivatives are recorded to selling, general and administrative expenses, offsetting securitization interest expense.
The following table presents the pre-tax gains (losses) on derivatives not designated as hedges and recognized in selling, general and administrative expense and other income (expense), net in the consolidated statements of operations (in millions).
| | | | | | | | | | | | | | | | | | | | |
| | Year Ended December 31, |
| | | 2024 | | 2023 | | 2022 |
| Interest rate swaps | | $ | 19 | | | $ | 63 | | | $ | — | |
| Total return swaps | | 31 | | | 46 | | | 5 | |
| Total in selling, general and administrative expense | | 50 | | | 109 | | | 5 | |
| | | | | | |
| Interest rate swaps | | (3) | | | 20 | | | 512 | |
| Cross-currency swaps | | 1 | | | 1 | | | — | |
| Foreign exchange derivatives | | (27) | | | 7 | | | (37) | |
| | | | | | |
| Total in other income (expense), net | | (29) | | | 28 | | | 475 | |
| Total | | $ | 21 | | | $ | 137 | | | $ | 480 | |
NOTE 14. FAIR VALUE MEASUREMENTS
Fair value is defined as the amount that would be received for selling an asset or paid to transfer a liability in an orderly transaction between market participants. Assets and liabilities carried at fair value are classified in the following three categories:
Level 1 - Quoted prices for identical instruments in active markets.
WARNER BROS. DISCOVERY, INC.
NOTES TO CONSOLIDATED FINANCIAL STATEMENTS
Level 2 - Quoted prices for similar instruments in active markets; quoted prices for identical or similar instruments in markets that are not active; and model-derived valuations in which all significant inputs and significant value drivers are observable in active markets.
Level 3 - Valuations derived from techniques in which one or more significant inputs are unobservable.
The table below presents assets and liabilities measured at fair value on a recurring basis (in millions).
| | | | | | | | | | | | | | | | | | | | | | | | | | | | | | | | |
| | | | December 31, 2024 |
| Category | | Balance Sheet Location | | Level 1 | | Level 2 | | Level 3 | | Total |
| Assets | | | | | | | | | | |
| Cash equivalents: | | | | | | | | | | |
| Time deposits | | Cash and cash equivalents | | $ | — | | | $ | 95 | | | $ | — | | | $ | 95 | |
| Equity securities: | | | | | | | | | | |
| Money market funds | | Cash and cash equivalents | | 46 | | | — | | | — | | | 46 | |
| Mutual funds | | Prepaid expenses and other current assets | | 16 | | | — | | | — | | | 16 | |
| Company-owned life insurance contracts | | Prepaid expenses and other current assets | | — | | | 1 | | | — | | | 1 | |
| Mutual funds | | Other noncurrent assets | | 216 | | | — | | | — | | | 216 | |
| Company-owned life insurance contracts | | Other noncurrent assets | | — | | | 102 | | | — | | | 102 | |
| | | | | | | | | | |
| Total | | | | $ | 278 | | | $ | 198 | | | $ | — | | | $ | 476 | |
| Liabilities | | | | | | | | | | |
| Deferred compensation plan | | Accrued liabilities | | $ | 62 | | | $ | — | | | $ | — | | | $ | 62 | |
| Deferred compensation plan | | Other noncurrent liabilities | | 650 | | | — | | | — | | | 650 | |
| Total | | | | $ | 712 | | | $ | — | | | $ | — | | | $ | 712 | |
| | | | | | | | | | | | | | | | | | | | | | | | | | | | | | | | |
| | | | December 31, 2023 |
| Category | | Balance Sheet Location | | Level 1 | | Level 2 | | Level 3 | | Total |
| Assets | | | | | | | | | | |
| Cash equivalents: | | | | | | | | | | |
| Time deposits | | Cash and cash equivalents | | $ | — | | | $ | 105 | | | $ | — | | | $ | 105 | |
| | | | | | | | | | |
| Equity securities: | | | | | | | | | | |
| Money market funds | | Cash and cash equivalents | | 1 | | | — | | | — | | | 1 | |
| Mutual funds | | Prepaid expenses and other current assets | | 42 | | | — | | | — | | | 42 | |
| Company-owned life insurance contracts | | Prepaid expenses and other current assets | | — | | | 1 | | | — | | | 1 | |
| Mutual funds | | Other noncurrent assets | | 233 | | | — | | | — | | | 233 | |
| Company-owned life insurance contracts | | Other noncurrent assets | | — | | | 97 | | | — | | | 97 | |
| | | | | | | | | | |
| Total | | | | $ | 276 | | | $ | 203 | | | $ | — | | | $ | 479 | |
| Liabilities | | | | | | | | | | |
| Deferred compensation plan | | Accrued liabilities | | $ | 67 | | | $ | — | | | $ | — | | | $ | 67 | |
| Deferred compensation plan | | Other noncurrent liabilities | | 614 | | | — | | | — | | | 614 | |
| Total | | | | $ | 681 | | | $ | — | | | $ | — | | | $ | 681 | |
Equity securities include money market funds, investments in mutual funds held in separate trusts, which are owned as part of the Company’s supplemental retirement plans, and company-owned life insurance contracts. (See Note 17.) The fair value of the deferred compensation plan liability was determined based on the fair value of the related investments elected by employees. Company-owned life insurance contracts are recorded at their cash surrender value, which approximates fair value (Level 2).
In addition to the financial instruments listed in the tables above, the Company holds other financial instruments, including cash deposits, accounts receivable, accounts payable, and senior notes. The carrying values for such financial instruments, other than the senior notes, each approximated their fair values as of December 31, 2024 and 2023. The estimated fair value of the Company’s outstanding senior notes, including accrued interest, using quoted prices from over-the-counter markets, considered Level 2 inputs, was $34.9 billion and $40.5 billion as of December 31, 2024 and 2023, respectively.
WARNER BROS. DISCOVERY, INC.
NOTES TO CONSOLIDATED FINANCIAL STATEMENTS
The Company’s derivative financial instruments are discussed in Note 13, its investments with readily determinable fair value are discussed in Note 10, and the obligation for its revolving receivable program is discussed in Note 8.
NOTE 15. SHARE-BASED COMPENSATION
The Company has various incentive plans under which PRSUs, RSUs, and stock options have been issued. Upon exercise or vesting of stock awards, the Company issues new shares from its existing authorized but unissued shares. As of December 31, 2024, there were 192 million shares of common stock in reserves that were available for future issuance under the incentive plans.
Share-Based Compensation Expense
The table below presents the components of share-based compensation expense (in millions).
| | | | | | | | | | | | | | | | | | | | |
| | Year Ended December 31, |
| | 2024 | | 2023 | | 2022 |
| PRSUs | | $ | 89 | | | $ | 65 | | | $ | 2 | |
| RSUs | | 415 | | | 375 | | | 337 | |
| Stock options | | 53 | | | 60 | | | 71 | |
| SARs | | — | | | — | | | 2 | |
| | | | | | |
| Total share-based compensation expense | | $ | 557 | | | $ | 500 | | | $ | 412 | |
| Tax benefit recognized | | $ | 96 | | | $ | 97 | | | $ | 79 | |
Liability-classified share-based compensation awards include certain PRSUs. The Company recorded total liabilities for cash-settled and other liability-classified share-based compensation awards of $66 million and $36 million as of December 31, 2024 and 2023, respectively. The current portion of the liability for cash-settled and other liability-classified awards was $27 million and $10 million as of December 31, 2024 and 2023, respectively.
Share-Based Award Activity
PRSUs
The table below presents PRSU activity (in millions, except years and weighted-average grant price).
| | | | | | | | | | | | | | | | | | | | | | | | | | |
| | PRSUs | | Weighted-
Average
Grant
Date Fair Value | | Weighted-Average
Remaining
Contractual
Term
(years) | | Aggregate
Fair
Value |
| Outstanding as of December 31, 2023 | | 4.2 | | | $ | 16.36 | | | 1.4 | | $ | 48 | |
| Granted | | 6.1 | | | $ | 8.66 | | | | | |
| Performance adjustments | | 2.4 | | | $ | 15.26 | | | | | |
| Converted | | (2.9) | | | $ | 16.70 | | | | | $ | 25 | |
| | | | | | | | |
| Outstanding as of December 31, 2024 | | 9.8 | | | $ | 11.20 | | | 1.2 | | $ | 104 | |
| Vested and expected to vest as of December 31, 2024 | | 9.8 | | | $ | 11.20 | | | 1.2 | | $ | 104 | |
| Convertible as of December 31, 2024 | | 0.9 | | | $ | 15.34 | | | 0.0 | | $ | 10 | |
As of December 31, 2024, there was $49 million of unrecognized compensation cost related to PRSUs.
WARNER BROS. DISCOVERY, INC.
NOTES TO CONSOLIDATED FINANCIAL STATEMENTS
RSUs
The table below presents RSU activity (in millions, except years and weighted-average grant price).
| | | | | | | | | | | | | | | | | | | | | | | | | | |
| |
RSUs | | Weighted-
Average
Grant
Date Fair Value | | Weighted-Average
Remaining
Contractual
Term
(years) | | Aggregate
Fair
Value |
| Outstanding as of December 31, 2023 | | 44.0 | | | $ | 18.52 | | | 1.3 | | $ | 501 | |
| Granted | | 56.8 | | | $ | 8.64 | | | | | |
| Vested | | (17.0) | | | $ | 19.71 | | | | | $ | 153 | |
| Forfeited | | (5.0) | | | $ | 13.78 | | | | | |
| Outstanding as of December 31, 2024 | | 78.8 | | | $ | 11.41 | | | 1.6 | | $ | 835 | |
| Vested and expected to vest as of December 31, 2024 | | 78.8 | | | $ | 11.41 | | | 1.6 | | $ | 835 | |
As of December 31, 2024, there was $493 million of unrecognized compensation cost related to RSUs, of which $19 million is related to cash settled RSUs. Stock settled RSUs are expected to be recognized over a weighted-average period of 1.6 years, and cash settled RSUs are expected to be recognized over a weighted-average period of 1.5 years.
Stock Options
The table below presents stock option activity (in millions, except years and weighted-average exercise price).
| | | | | | | | | | | | | | | | | | | | | | | | | | |
| | Stock Options | | Weighted-
Average
Exercise
Price | | Weighted-
Average
Remaining
Contractual
Term
(years) | | Aggregate
Intrinsic
Value |
| Outstanding as of December 31, 2023 | | 32.1 | | | $ | 33.73 | | | 3.3 | | $ | — | |
| Granted | | 4.1 | | | $ | 8.67 | | | | | |
| | | | | | | | |
| Forfeited | | (0.2) | | | $ | 25.63 | | | | | |
| Outstanding as of December 31, 2024 | | 36.0 | | | $ | 30.90 | | | 2.7 | | $ | 7.8 | |
| Vested and expected to vest as of December 31, 2024 | | 36.0 | | | $ | 30.90 | | | 2.7 | | $ | 7.8 | |
| Exercisable as of December 31, 2024 | | 18.2 | | | $ | 30.99 | | | 1.3 | | $ | — | |
The Company received cash payments from the exercise of stock options totaling $0 million, $0 million, and $1 million during 2024, 2023 and 2022, respectively. As of December 31, 2024, there was $80 million of unrecognized compensation cost related to stock options, which is expected to be recognized over a weighted-average period of 1.8 years.
The fair value of stock options is estimated using the Black-Scholes option-pricing model. The weighted-average assumptions used to determine the fair value of stock options as of the date of grant during 2024, 2023 and 2022 were as follows.
| | | | | | | | | | | | | | | | | | | | |
| | Year Ended December 31, |
| | 2024 | | 2023 | | 2022 |
| Risk-free interest rate | | 4.19 | % | | 4.35 | % | | 1.46 | % |
| Expected term (years) | | 4.7 | | 4.5 | | 5.0 |
| Expected volatility | | 54.37 | % | | 54.80 | % | | 42.15 | % |
| | | | | | |
The weighted-average grant date fair value of options granted during 2024, 2023 and 2022 was $4.30, $7.43 and $9.60, respectively, per option. The total intrinsic value of options exercised during 2024, 2023 and 2022 was $0 million.
WARNER BROS. DISCOVERY, INC.
NOTES TO CONSOLIDATED FINANCIAL STATEMENTS
NOTE 16. INCOME TAXES
The domestic and foreign components of loss before income taxes were as follows (in millions).
| | | | | | | | | | | | | | | | | | | | |
| | | Year Ended December 31, |
| | | 2024 | | 2023 | | 2022 |
| Domestic | | $ | (11,843) | | | $ | (4,702) | | | $ | (8,747) | |
| Foreign | | 455 | | | 839 | | | (213) | |
| Loss before income taxes | | $ | (11,388) | | | $ | (3,863) | | | $ | (8,960) | |
The components of the provision for income taxes were as follows (in millions).
| | | | | | | | | | | | | | | | | | | | |
| | | Year Ended December 31, |
| | | 2024 | | 2023 | | 2022 |
| Current: | | | | | | |
| Federal | | $ | 983 | | | $ | 753 | | | $ | 629 | |
| State and local | | 321 | | | 57 | | | 143 | |
| Foreign | | 522 | | | 750 | | | 407 | |
| | 1,826 | | | 1,560 | | | 1,179 | |
| Deferred: | | | | | | |
| Federal | | (1,488) | | | (1,845) | | | (2,367) | |
| State and local | | (276) | | | (548) | | | (418) | |
| Foreign | | 32 | | | 49 | | | (57) | |
| | (1,732) | | | (2,344) | | | (2,842) | |
| Income tax expense (benefit) | | $ | 94 | | | $ | (784) | | | $ | (1,663) | |
The following table reconciles the Company’s effective income tax rates to the U.S. federal statutory income tax rates.
| | | | | | | | | | | | | | | | | | | | | | | | | | | | | | | | | | | | | | |
| | Year Ended December 31, |
| | 2024 | | 2023 | | 2022 |
| Pre-tax income at U.S. federal statutory income tax rate | | $ | (2,391) | | | 21 | % | | $ | (811) | | | 21 | % | | $ | (1,881) | | | 21 | % |
| Non-deductible goodwill impairment | | 1,881 | | | (17) | % | | — | | | — | % | | — | | | — | % |
| State and local income taxes, net of federal tax benefit | | 30 | | | — | % | | (388) | | | 10 | % | | (218) | | | 3 | % |
| Effect of foreign operations | | 331 | | | (3) | % | | 342 | | | (9) | % | | 246 | | | (3) | % |
| Preferred stock conversion premium charge | | — | | | — | % | | — | | | — | % | | 166 | | | (2) | % |
| | | | | | | | | | | | |
| | | | | | | | | | | | |
| Change in unrecognized tax benefits | | 153 | | | (1) | % | | 33 | | | (1) | % | | (6) | | | — | % |
| | | | | | | | | | | | |
| | | | | | | | | | | | |
| | | | | | | | | | | | |
| | | | | | | | | | | | |
| | | | | | | | | | | | |
| | | | | | | | | | | | |
| | | | | | | | | | | | |
| | | | | | | | | | | | |
| | | | | | | | | | | | |
| | | | | | | | | | | | |
| Other, net | | 90 | | | (1) | % | | 40 | | | (1) | % | | 30 | | | — | % |
| Income tax expense (benefit) | | $ | 94 | | | (1) | % | | $ | (784) | | | 20 | % | | $ | (1,663) | | | 19 | % |
Income tax expense (benefit) was $94 million and $(784) million, and the Company’s effective tax rate was (1)% and 20% for 2024 and 2023, respectively. In 2024, the Company recorded a non-cash goodwill impairment charge of $9.1 billion, the majority of which was not deductible for tax purposes. (See Note 5.) For the year ended December 31, 2024, the increase in income tax expense compared to the same period in 2023 was primarily attributable to a decrease in pre-tax book loss (excluding the non-cash goodwill impairment charge), an increase in state and local income taxes (including a state deferred tax adjustment recorded in the year ended December 31, 2024 and a one-time favorable release of an unrecognized state tax benefit in 2023 that did not recur in 2024), and a one-time favorable release of an unrecognized U.S. tax benefit in 2023 that did not recur in 2024.
WARNER BROS. DISCOVERY, INC.
NOTES TO CONSOLIDATED FINANCIAL STATEMENTS
Income tax benefit was $(784) million and $(1,663) million, and the Company’s effective tax rate was 20% and 19% for 2023 and 2022, respectively. The decrease in tax benefit for the year ended December 31, 2023 was primarily attributable to a decrease in pre-tax book loss and the effect of foreign operations, including taxation and allocation of income and losses across various foreign jurisdictions. These decreases were partially offset by an unrecognized state tax benefit remeasurement following a multi-year tax settlement and a favorable state deferred tax adjustment recorded in the year ended December 31, 2023. The decrease for the year ended December 31, 2023 was further offset by a one-time expense incurred in 2022 related to a preferred stock conversion transaction expense that was not deductible for tax purposes. (See Note 3.)
Components of deferred income tax assets and liabilities were as follows (in millions).
| | | | | | | | | | | | | | |
| | | December 31, |
| | | 2024 | | 2023 |
| Deferred income tax assets: | | | | |
| Accounts receivable | | $ | — | | | $ | (86) | |
| Tax attribute carry-forward | | 2,661 | | | 2,908 | |
| | | | |
| Lease liabilities | | 793 | | | 851 | |
| Accrued liabilities and other | | 1,180 | | | 919 | |
| Total deferred income tax assets | | 4,634 | | | 4,592 | |
| Valuation allowance | | (2,043) | | | (2,191) | |
| Net deferred income tax assets | | 2,591 | | | 2,401 | |
| Deferred income tax liabilities: | | | | |
| Accounts receivable | | (267) | | | — | |
| Intangible assets | | (6,916) | | | (7,988) | |
| Right-of-use assets | | (636) | | | (796) | |
| Content rights | | (342) | | | (685) | |
| Equity method investments and other outside basis differences | | (61) | | | (411) | |
| | | | |
| | | | |
| Other | | (741) | | | (560) | |
| Total deferred income tax liabilities | | (8,963) | | | (10,440) | |
| Net deferred income tax liabilities | | $ | (6,372) | | | $ | (8,039) | |
As of December 31, 2024, the company maintains a valuation allowance of $2,043 million to offset deferred tax assets attributable to certain foreign net operating losses, and to a lesser extent U.S. federal and state tax attribute carryforwards.
The Company’s net deferred income tax assets and liabilities were reported on the consolidated balance sheets as follows (in millions).
| | | | | | | | | | | | | | |
| | | December 31, |
| | | 2024 | | 2023 |
| Noncurrent deferred income tax assets (included within other noncurrent assets) | | $ | 613 | | | $ | 697 | |
| Deferred income tax liabilities | | (6,985) | | | (8,736) | |
| Net deferred income tax liabilities | | $ | (6,372) | | | $ | (8,039) | |
The Company’s loss carry-forwards were reported on the consolidated balance sheets as follows (in millions).
| | | | | | | | | | | | | | | | | | | | |
| | Federal | | State | | Foreign |
| Loss carry-forwards | | $ | 47 | | | $ | 1,350 | | | $ | 8,255 | |
| Deferred tax asset related to loss carry-forwards | | 11 | | | 71 | | | 1,972 | |
| Valuation allowance against loss carry-forwards | | (6) | | | (46) | | | (1,544) | |
| Earliest expiration date of loss carry-forwards | | 2028 | | 2025 | | 2025 |
WARNER BROS. DISCOVERY, INC.
NOTES TO CONSOLIDATED FINANCIAL STATEMENTS
A reconciliation of the beginning and ending amounts of unrecognized tax benefits (without related interest and penalty amounts) is as follows (in millions).
| | | | | | | | | | | | | | | | | | | | |
| | | Year Ended December 31, |
| | | 2024 | | 2023 | | 2022 |
| Beginning balance | | $ | 2,147 | | | $ | 1,929 | | | $ | 420 | |
| Additions based on tax positions related to the current year | | 148 | | | 147 | | | 302 | |
| Additions for tax positions of prior years | | 250 | | | 195 | | | 35 | |
| Additions for tax positions acquired in business combinations | | — | | | 247 | | | 1,353 | |
| Reductions for tax positions of prior years | | (76) | | | (275) | | | (114) | |
| Settlements | | (30) | | | (46) | | | (20) | |
| Reductions due to lapse of statutes of limitations | | (51) | | | (62) | | | (34) | |
| Changes due to foreign currency exchange rates | | (17) | | | 12 | | | (13) | |
| Ending balance | | $ | 2,371 | | | $ | 2,147 | | | $ | 1,929 | |
As of December 31, 2024, if the Company were to recognize the full amount of unrecognized tax benefits, $2,182 million would reduce the Company’s income tax expense and effective tax rate after giving effect to interest deductions and offsetting benefits from other tax jurisdictions.
The Company and its subsidiaries file income tax returns in the U.S. and various state and foreign jurisdictions. The Company is currently under audit by the Internal Revenue Service for its 2012 to 2019 consolidated federal income tax returns. It is difficult to predict the final outcome or timing of resolution of any particular tax matter. With few exceptions, the Company is no longer subject to audit by any jurisdiction for years prior to 2008. Adjustments that arose from the completion of audits for certain tax years have been included in the change in unrecognized tax benefits in the table above.
It is reasonably possible that the total amount of unrecognized tax benefits related to certain of the Company’s unrecognized tax benefits could decrease by as much as $67 million within the next twelve months as a result of ongoing audits, foreign judicial proceedings, lapses of statutes of limitations, or regulatory developments.
As of December 31, 2024, 2023, and 2022, the Company had accrued approximately $732 million, $571 million, and $413 million, respectively, of total interest and penalties payable related to unrecognized tax benefits. The Company recognizes interest and penalties related to unrecognized tax benefits as a component of income tax expense.
The 2017 Tax Cuts and Jobs Act features a participation exemption regime with current taxation of certain foreign income and imposed a mandatory repatriation toll tax on unremitted foreign earnings. Notwithstanding the U.S. taxation of these amounts, we intend to continue to reinvest some of these funds outside of the U.S. Our current plans do not demonstrate a need to repatriate them to the U.S. However, if these funds were to be needed in the U.S., we would be required to accrue and pay non-U.S. taxes to repatriate them. The determination of the amount of unrecognized deferred income tax liability with respect to these undistributed foreign earnings is not practicable.
The Organisation for Economic Co-operation and Development’s (“OECD”) Pillar Two Global Anti-Base Erosion (“GloBE”) model rules, issued under the OECD Inclusive Framework on Base Erosion and Profit Shifting, introduce a global minimum tax of 15% applicable to multinational enterprise groups with consolidated financial statement revenue in excess of €750 million. Numerous foreign jurisdictions have already enacted tax legislation based on the GloBE rules, with some effective as early as January 1, 2024. As of December 31, 2024, we recognized a nominal income tax expense for Pillar Two GloBE minimum tax. The Company is continuously monitoring the evolving application of this legislation and assessing its potential impact on our future tax liability.
NOTE 17. RETIREMENT SAVINGS PLANS
The Company has defined contribution, defined benefit, and other savings plans for the benefit of its employees that meet eligibility requirements.
WARNER BROS. DISCOVERY, INC.
NOTES TO CONSOLIDATED FINANCIAL STATEMENTS
Defined Contribution Plans
Eligible employees may contribute a portion of their compensation to the plans, which may be subject to certain statutory limitations. The Company contributes to certain of the plans to either match qualifying employee contributions or as discretionary contributions. The Company made total contributions of $204 million, $210 million, and $188 million for the years ended December 31, 2024, 2023 and 2022, respectively. The Company’s contributions were recorded in cost of revenues and selling, general and administrative expense on the consolidated statements of operations.
Executive Deferred Compensation Plans
The Company has deferred compensation plans through which certain senior-level employees may elect to defer a portion of their eligible compensation. Distributions from the deferred compensation plans are generally made following separation from service or other events as specified in the plan. In certain plans, the Company may make discretionary contributions to employee accounts. While these plans are unfunded, the Company has established separate rabbi trusts used to provide for certain of these benefits. The accounts of the separate rabbi trusts are included in the Company’s consolidated financial statements. The investments are included in prepaid expenses and other current assets and other noncurrent assets on the consolidated balance sheets. The deferred compensation obligation is included in accrued liabilities and other noncurrent liabilities in the consolidated balance sheets. The values of the investments and deferred compensation obligation are recorded at fair value. Changes in the fair value of the investments are included as a component of other income (expense), net, on the consolidated statements of operations. Changes in the fair value of the deferred compensation obligation are included as a component of selling, general and administrative expenses on the consolidated statements of operations. (See Note 14 and Note 18.)
Multiemployer Benefit Plans
The Company contributes to various multiemployer defined benefit pension plans under the terms of collective-bargaining agreements that cover certain of our union-represented employees. The risks of participating in multiemployer pension plans are different from single-employer pension plans in that (i) contributions made by the Company to the multiemployer pension plans may be used to provide benefits to employees of other participating employers; (ii) if the Company chooses to stop participating in the multiemployer pension plans, it may be required to pay those plans an amount based on the underfunded status of the plan, which is referred to as a withdrawal liability; and (iii) actions taken by a participating employer that lead to a deterioration of the financial health of a multiemployer pension plan may result in the unfunded obligations of the multiemployer pension plan being borne by its remaining participating employers. The Company also contributes to various other multiemployer benefit plans that provide health and welfare benefits to both active and retired participants. The Company does not participate in any multiemployer benefit plans that are individually significant to the Company.
The following table summarizes the Company’s contributions to multiemployer pension and health and welfare benefit plans (in millions).
| | | | | | | | | | | | | | | | | |
| Year Ended December 31, |
| 2024 | | 2023 | | 2022 |
| Pension benefits | $ | 115 | | | $ | 128 | | | $ | 112 | |
| Health and welfare benefits | 248 | | | 153 | | | 182 | |
| Total contributions | $ | 363 | | | $ | 281 | | | $ | 294 | |
Defined Benefit Plans
The Company participates in and/or sponsors a qualified defined benefit pension plan that covers certain U.S. based employees and several U.S. and non-U.S. nonqualified defined benefit pension plans that are noncontributory. The Company’s pension plans consist of both funded and unfunded plans.
The Company also holds net assets and net liabilities on behalf of other U.S. and non-U.S. pension plans. The plan provisions vary by plan and by country. Some of these plans are unfunded and all are noncontributory. At a plan level, net asset positions are recorded in other noncurrent assets, and net liability positions are recorded in accrued liabilities and/or other noncurrent liabilities on the consolidated balance sheets.
WARNER BROS. DISCOVERY, INC.
NOTES TO CONSOLIDATED FINANCIAL STATEMENTS
Discount rates, long-term rate of return on plan assets, increases in compensation levels, and mortality rates are key assumptions used in determining the benefit obligation. The table below describes how the assumptions are determined.
| | | | | | | | |
| Assumption | | Description |
| Discount rate | | Based on a bond portfolio approach that includes high-quality debt instruments with maturities matching the Company’s expected benefit payments from the plans. |
| Long-term rate of return on plan assets | | Based on the weighted-average expected rate of return and capital market forecasts for each asset class employed and also considers the Company’s historical compounded return on plan assets for 10 and 15-year periods. |
| Increase in compensation levels | | Based on past experience and the near-term outlook. |
| Mortality | | Various mortality tables adjusted and projected using mortality improvement rates. |
Net Periodic Pension Cost
Expense recognized for the pension plans is based upon actuarial valuations. Inherent in those valuations are key assumptions, including discount rates and, where applicable, expected returns on assets. The service cost component of net periodic pension cost is recorded in operating expenses on the consolidated statements of operations, while the remaining components are recorded in other income (expense), net. Net periodic pension cost was not material for the years ended December 31, 2024, 2023 and 2022.
WARNER BROS. DISCOVERY, INC.
NOTES TO CONSOLIDATED FINANCIAL STATEMENTS
Obligations and Funded Status
The following tables present information about plan assets and obligations of the pension plans based upon a valuation as of December 31, 2024 and 2023, respectively (in millions).
| | | | | | | | | | | | | | | | | | |
| | December 31, 2024 | | December 31, 2023 |
| | | | | | | | |
| Accumulated benefit obligation | | $ | 683 | | | | | $ | 753 | | | |
| Change in projected benefit obligation: | | | | | | | | |
| Projected benefit obligation at beginning of year | | $ | 753 | | | | | $ | 762 | | | |
| | | | | | | | |
| Service cost | | 2 | | | | | 3 | | | |
| Interest cost | | 33 | | | | | 35 | | | |
| Benefits paid | | (45) | | | | | (40) | | | |
| Actuarial gains | | (48) | | | | | — | | | |
| | | | | | | | |
| Settlement charges | | (2) | | | | | (11) | | | |
| Effects of foreign currency exchange rate changes and other | | (10) | | | | | 4 | | | |
| Projected benefit obligation at end of year | | 683 | | | | | 753 | | | |
| Plan assets: | | | | | | | | |
| Fair value at beginning of year | | 540 | | | | | 533 | | | |
| | | | | | | | |
| Actual return on plan assets | | (46) | | | | | 9 | | | |
| Company contributions | | 32 | | | | | 33 | | | |
| Benefits paid | | (45) | | | | | (40) | | | |
| Settlement charges | | (3) | | | | | (11) | | | |
| Effects of foreign currency exchange rate changes and other | | (7) | | | | | 16 | | | |
| Fair value at end of year | | 471 | | | | | 540 | | | |
| Under funded status | | $ | (212) | | | | | $ | (213) | | | |
| Amounts recognized as assets and liabilities on the consolidated balance sheets: | | | | | | | | |
| Other noncurrent assets | | $ | 65 | | | | | $ | 82 | | | |
| Accrued liabilities | | (29) | | | | | (31) | | | |
| Other noncurrent liabilities | | (248) | | | | | (264) | | | |
| Total | | $ | (212) | | | | | $ | (213) | | | |
| Amounts recognized in accumulated other comprehensive loss consist of: | | | | | | | | |
| Net loss | | $ | 104 | | | | | $ | 79 | | | |
The weighted average assumptions used to determine benefit obligations of the pension plans were as follows.
| | | | | | | | | | | | | | | |
| December 31, 2024 | | December 31, 2023 |
| Discount rate | 5.20 | % | | | | 4.62 | % | | |
| Rate of compensation increases | 3.16 | % | | | | 3.18 | % | | |
WARNER BROS. DISCOVERY, INC.
NOTES TO CONSOLIDATED FINANCIAL STATEMENTS
Plan Assets
The Company’s investment policy is to maximize the total rate of return on plan assets to meet the long-term funding obligations of the pension plans. There are no restrictions on the types of investments held in the pension plans, which are invested using a combination of active management and passive investment strategies. Risk is controlled through diversification among multiple asset classes, managers, styles, and securities. Risk is further controlled both at the manager and asset class levels by assigning return targets and evaluating performance against these targets. The following table presents the weighted average pension plans asset allocations by asset category (in millions).
| | | | | | | | | | | | | | |
| | December 31, 2024 |
| Investment Type | | Target | | Actual |
| Debt securities | | 4 | % | | 4 | % |
| Equity securities | | 10 | % | | 10 | % |
| Fixed income securities | | 73 | % | | 65 | % |
| | | | |
| Multi-asset credit fund | | 5 | % | | 11 | % |
| Real assets | | 4 | % | | 2 | % |
| Hedge funds | | 2 | % | | 7 | % |
| Cash | | 2 | % | | 1 | % |
| Total | | 100 | % | | 100 | % |
Fair Value Measurements
Fair value is an exit price, representing the amount that would be received to sell an asset or paid to transfer a liability in an orderly transaction between market participants at the measurement date. See Note 14 for a discussion of the fair value hierarchy that prioritizes the inputs to the valuation techniques used to measure fair value (in millions).
| | | | | | | | | | | | | | | | | | | | | | | | | | |
| | December 31, 2024 |
| | Total | | Level 1 | | Level 2 | | Level 3 |
| Debt securities | | $ | 19 | | | $ | 19 | | | $ | — | | | $ | — | |
| Equity securities | | 55 | | | 25 | | | 30 | | | — | |
| Fixed income securities | | 444 | | | 22 | | | 356 | | | 66 | |
| Multi-asset credit fund | | 77 | | | — | | | 77 | | | — | |
| | | | | | | | |
| Cash | | 6 | | | 6 | | | — | | | — | |
| Total plan assets measured at fair value | | $ | 601 | | | $ | 72 | | | $ | 463 | | | $ | 66 | |
| Assets held at net asset value practical expedient | | | | | | | | |
| Real assets | | $ | 16 | | | | | | | |
| Hedge funds | | 44 | | | | | | | |
| Total assets held at net asset value practical expedient | | $ | 60 | | | | | | | |
| Liabilities: | | | | | | | | |
| Derivatives | | (190) | | | | | | | |
| Total plan assets | | $ | 471 | | | | | | | |
The table below sets forth a summary of changes in the fair value of the Level 3 pension assets for the year ended December 31, 2024 (in millions).
| | | | | |
| Fixed Income Funds |
| Fair value at beginning of year | $ | 76 | |
| Unrealized losses | (5) | |
| |
| Purchases, issuances, sales and settlements, net | (5) | |
| Balance at end of year | $ | 66 | |
WARNER BROS. DISCOVERY, INC.
NOTES TO CONSOLIDATED FINANCIAL STATEMENTS
| | | | | | | | | | | | | | | | | | | | | | | | | | |
| | December 31, 2023 |
| | Total | | Level 1 | | Level 2 | | Level 3 |
| | | | | | | | |
| Equity securities | | $ | 64 | | | $ | 36 | | | $ | 28 | | | $ | — | |
| Fixed income securities | | 541 | | | 12 | | | 453 | | | 76 | |
| | | | | | | | |
| | | | | | | | |
| Multi-asset credit fund | | 24 | | | — | | | 24 | | | — | |
| Cash | | 9 | | | 9 | | | — | | | — | |
| | | | | | | | |
| Total plan assets measured at fair value | | $ | 638 | | | $ | 57 | | | $ | 505 | | | $ | 76 | |
| Assets held at net asset value practical expedient | | | | | | | | |
| Real assets | | $ | 18 | | | | | | | |
| Hedge funds | | 22 | | | | | | | |
| Total assets held at net asset value practical expedient | | $ | 40 | | | | | | | |
| Liabilities: | | | | | | | | |
| Derivatives | | (138) | | | | | | | |
| Total plan assets | | $ | 540 | | | | | | | |
The table below sets forth a summary of changes in the fair value of the Level 3 pension assets for the year ended December 31, 2023 (in millions).
| | | | | |
| Fixed Income Funds |
| Fair value at beginning of year | $ | 72 | |
| Unrealized gains | 9 | |
| Transfers out | (5) | |
| |
| Balance at end of year | $ | 76 | |
Estimated Benefit Payments
The following table presents the estimated future benefit payments expected to be paid out for the defined benefits plans over the next ten years (in millions).
| | | | | | | | | | |
| | Pension Plans | | |
| 2025 | | $ | 51 | | | |
| 2026 | | 45 | | | |
| 2027 | | 45 | | | |
| 2028 | | 47 | | | |
| 2029 | | 46 | | | |
| Thereafter | | 228 | | | |
WARNER BROS. DISCOVERY, INC.
NOTES TO CONSOLIDATED FINANCIAL STATEMENTS
NOTE 18. SUPPLEMENTAL DISCLOSURES
Property and equipment
Property and equipment consisted of the following (in millions).
| | | | | | | | | | | | | | | | | |
| | | | December 31, |
| | Useful Lives | | 2024 | | 2023 |
| | | | | |
Equipment, furniture, fixtures and other (a) | 3 - 7 years | | $ | 2,613 | | | $ | 2,056 | |
| Capitalized software costs | 1 - 5 years | | 3,076 | | | 2,629 | |
Land, buildings and leasehold improvements (b) | 15- 30 years | | 3,832 | | | 4,013 | |
| Property and equipment, at cost | | | 9,521 | | | 8,698 | |
| Accumulated depreciation | | | (4,035) | | | (3,085) | |
| | | 5,486 | | | 5,613 | |
| Assets under construction | | | 601 | | | 344 | |
| Property and equipment, net | | | $ | 6,087 | | | $ | 5,957 | |
| | | | | |
(a) Property and equipment includes assets acquired under finance lease arrangements. Assets acquired under finance lease arrangements are generally amortized using the straight-line method over the lesser of the estimated useful lives of the assets or the terms of the related leases. (See Note 12.) |
| | | | | |
(b) Land has an indefinite life and is not depreciated. Leasehold improvements generally have an estimated useful life equal to the lease term. |
Capitalized software costs are for internal use. The net book value of capitalized software costs was $1,246 million and $1,301 million as of December 31, 2024 and 2023, respectively.
Depreciation expense for property and equipment totaled $1,102 million, $1,097 million and $957 million for the years ended December 31, 2024, 2023 and 2022, respectively.
Prepaid expenses and other current assets
Prepaid expenses and other current assets consisted of the following (in millions).
| | | | | | | | | | | |
| December 31, |
| 2024 | | 2023 |
| Production receivables | $ | 979 | | | $ | 1,265 | |
| Content rights and prepaid license fees | 784 | | | 843 | |
| Other current assets | 2,056 | | | 2,283 | |
| Total prepaid expenses and other current assets | $ | 3,819 | | | $ | 4,391 | |
Accrued liabilities
Accrued liabilities consisted of the following (in millions).
| | | | | | | | | | | |
| December 31, |
| 2024 | | 2023 |
| Accrued participation and residuals | $ | 2,953 | | | $ | 3,071 | |
| Accrued production and content rights payable | 1,758 | | | 2,118 | |
| Accrued payroll and related benefits | 1,495 | | | 1,541 | |
| Other accrued liabilities | 4,232 | | | 3,638 | |
| Total accrued liabilities | $ | 10,438 | | | $ | 10,368 | |
WARNER BROS. DISCOVERY, INC.
NOTES TO CONSOLIDATED FINANCIAL STATEMENTS
Other Income (Expense), net
Other income (expense), net, consisted of the following (in millions).
| | | | | | | | | | | | | | | | | | | | |
| | | Year Ended December 31, |
| | | 2024 | | 2023 | | 2022 |
| Foreign currency losses, net | | $ | (323) | | | $ | (173) | | | $ | (150) | |
| (Losses) gains on derivative instruments, net | | (9) | | | 28 | | | 475 | |
| | | | | | |
| Change in the value of investments with readily determinable fair value | | (1) | | | 37 | | | (105) | |
| Change in the value of equity investments without readily determinable fair value | | (11) | | | (73) | | | (142) | |
| Gain on sale of equity method investments | | 194 | | | — | | | 195 | |
| | | | | | |
| Interest income | | 210 | | | 179 | | | 67 | |
| Indemnification receivable accrual | | 77 | | | (53) | | | — | |
| Other income, net | | 13 | | | 26 | | | 7 | |
| Total other income (expense), net | | $ | 150 | | | $ | (29) | | | $ | 347 | |
Supplemental Cash Flow Information
| | | | | | | | | | | | | | | | | | | | |
| | Year Ended December 31, |
| | 2024 | | 2023 | | 2022 |
| Cash paid for taxes, net | | $ | 1,113 | | | $ | 1,440 | | | $ | 1,027 | |
| Cash paid for interest | | 1,996 | | | 2,237 | | | 1,539 | |
| Non-cash investing and financing activities: | | | | | | |
| Accrued purchases of property and equipment | | 36 | | | 41 | | | 66 | |
| Assets acquired under finance lease and other arrangements | | 390 | | | 235 | | | 53 | |
| Non-cash settlement of PRSU awards | | 59 | | | 35 | | | — | |
| Accrued advances for Venu Sports | | 11 | | | — | | | — | |
| Non-cash consideration related to the sale and purchase of the Ranch and Burbank Studios Lots | | — | | | 350 | | | — | |
| Non-cash consideration related to the transaction agreements with JCOM | | — | | | 70 | | | — | |
| | | | | | |
| Non-cash consideration related to MegaMedia put exercise | | — | | | 36 | | | — | |
| Equity issued for the acquisition of WarnerMedia | | — | | | — | | | 42,309 | |
| Non-cash consideration related to the sale of The CW Network | | — | | | — | | | 126 | |
| Accrued consideration for the joint venture with BT | | — | | | — | | | 90 | |
| | | | | | |
Cash, Cash Equivalents, and Restricted Cash
| | | | | | | | | | | | | | | | | | |
| | | | | | | December 31, 2024 | | December 31, 2023 |
| Cash and cash equivalents | | | | | | $ | 5,312 | | | $ | 3,780 | |
Restricted cash - other current assets (a) | | | | | | 104 | | | 539 | |
| Total cash, cash equivalents, and restricted cash | | | | | | $ | 5,416 | | | $ | 4,319 | |
| | | | | | | | |
(a) Restricted cash at December 31, 2024 primarily included cash posted as collateral related to the Company’s revolving receivables program. Restricted cash at December 31, 2023 primarily included cash posted as collateral related to the Company’s revolving receivables and hedging programs. (See Note 8 and Note 13.) |
Assets Held for Sale
In 2022, the Company classified its Ranch Lot and Knoxville office building and land as assets held for sale. The Company reclassified $209 million to prepaid expenses and other current assets on the consolidated balance sheet during 2022 and stopped recording depreciation on the assets. The Knoxville office building and land and the Ranch Lot were sold during 2023. The Burbank Studios Lot was purchased during 2023 in exchange for the Ranch Lot and cash.
WARNER BROS. DISCOVERY, INC.
NOTES TO CONSOLIDATED FINANCIAL STATEMENTS
Supplier Finance Programs
Consistent with customary industry practice, the Company generally pays certain content producers at or near the completion of the production cycle. In these arrangements, content producers may earn fees upon contractual milestones to be invoiced at or near completion of production. In these instances, the Company accrues the content in progress in accordance with the contractual milestones. Certain of the Company’s content producers sell their related receivables to a bank intermediary who provides payments that coincide with these contractual production milestones upon confirmation with the Company of our obligation to the content producer. This confirmation does not involve a security interest in the underlying content or otherwise result in the payable receiving seniority with respect to other payables of the Company. Invoices processed through the program are subject to a one-year maximum tenor. The Company does not incur any fees or expenses associated with the paying agent services, and this service may be terminated by the Company or the financial institution upon 30 days’ notice. At, or near, the production completion date (invoice due date), the Company pays the financial institution the stated amounts for confirmed producer invoices. These payments are reported as cash flows from operating activities.
Changes in confirmed accrued content producer liabilities were as follows (in millions). These amounts were outstanding and unpaid by the Company and were recorded in accrued liabilities on the consolidated balance sheets, given the principal purpose of the arrangement is to allow producers access to funds prior to the typical payment due date and the arrangement does not significantly change the nature of the payables and does not significantly extend the payment terms beyond the industry norms.
| | | | | | | | | | | | | | |
| | Year Ended December 31, |
| | 2024 | | 2023 |
| Obligations outstanding at the beginning of the year | | $ | 338 | | | $ | 273 | |
| Invoices confirmed during the year | | 949 | | | 735 | |
| Invoices paid during the year | | (980) | | | (671) | |
| Foreign currency translation and other adjustments | | — | | | 1 | |
| Obligations outstanding at the end of the year | | $ | 307 | | | $ | 338 | |
Accumulated Other Comprehensive Loss
The table below presents the changes in the components of accumulated other comprehensive loss, net of taxes (in millions). | | | | | | | | | | | | | | | | | | | | | | | | | | |
| | Currency Translation | | Derivative Adjustments | | Pension Plans | | Accumulated
Other
Comprehensive Income (Loss) |
| December 31, 2021 | | $ | (845) | | | $ | 28 | | | $ | (13) | | | $ | (830) | |
| Other comprehensive income (loss) before reclassifications | | (651) | | | 4 | | | (26) | | | (673) | |
| Reclassifications from accumulated other comprehensive loss to net income | | (2) | | | (18) | | | — | | | (20) | |
| Other comprehensive income (loss) | | (653) | | | (14) | | | (26) | | | (693) | |
| | | | | | | | |
| | | | | | | | |
| December 31, 2022 | | (1,498) | | | 14 | | | (39) | | | (1,523) | |
| Other comprehensive income (loss) before reclassifications | | 799 | | | 16 | | | (21) | | | 794 | |
| Reclassifications from accumulated other comprehensive loss to net income | | — | | | (12) | | | — | | | (12) | |
| Other comprehensive income (loss) | | 799 | | | 4 | | | (21) | | | 782 | |
| | | | | | | | |
| | | | | | | | |
| December 31, 2023 | | (699) | | | 18 | | | (60) | | | (741) | |
| Other comprehensive income (loss) before reclassifications | | (358) | | | 32 | | | (14) | | | (340) | |
| Reclassifications from accumulated other comprehensive loss to net income | | 49 | | | (35) | | | — | | | 14 | |
| Other comprehensive income (loss) | | (309) | | | (3) | | | (14) | | | (326) | |
| | | | | | | | |
| | | | | | | | |
| | | | | | | | |
| December 31, 2024 | | $ | (1,008) | | | $ | 15 | | | $ | (74) | | | $ | (1,067) | |
WARNER BROS. DISCOVERY, INC.
NOTES TO CONSOLIDATED FINANCIAL STATEMENTS
NOTE 19. REDEEMABLE NONCONTROLLING INTERESTS
Redeemable noncontrolling interests are presented outside of permanent equity on the Company’s consolidated balance sheets when the put right is outside of the Company’s control. Redeemable noncontrolling interests reflected as of the balance sheet date are the greater of the noncontrolling interest balances adjusted for comprehensive income items and distributions or the redemption values remeasured at the period end foreign exchange rates. Adjustments to the carrying amount of redeemable noncontrolling interests to redemption value as a result of changes in exchange rates are reflected in currency translation adjustments, a component of other comprehensive loss. Such currency translation adjustments to redemption value are allocated to the Company’s stockholders only. Redeemable noncontrolling interest adjustments of carrying value to redemption value are reflected in retained earnings, unless there is an accumulated deficit, in which case the adjustments are reflected in additional paid-in capital. The adjustment of carrying value to the redemption value that reflects a redemption in excess of fair value is included as an adjustment to income from continuing operations available to the Company’s stockholders in the calculation of earnings per share. (See Note 3.) The table below summarizes the Company’s redeemable noncontrolling interests balances (in millions).
| | | | | | | | | | | | | | |
| | December 31, |
| | 2024 | | 2023 |
| Discovery Family | | $ | 86 | | | $ | 156 | |
| | | | |
| Other | | 23 | | | 9 | |
| Total | | $ | 109 | | | $ | 165 | |
The table below presents the reconciliation of changes in redeemable noncontrolling interests (in millions).
| | | | | | | | | | | | | | | | | | | | |
| | December 31, |
| | 2024 | | 2023 | | 2022 |
| Beginning balance | | $ | 165 | | | $ | 318 | | | $ | 363 | |
| | | | | | |
| | | | | | |
| Cash distributions to redeemable noncontrolling interests | | (35) | | | (30) | | | (50) | |
| Reclassification of redeemable noncontrolling interest to noncontrolling interest | | — | | | (22) | | | — | |
| Redemption of redeemable noncontrolling interest | | — | | | (111) | | | — | |
| Comprehensive income adjustments: | | | | | | |
| Net income attributable to redeemable noncontrolling interests | | (42) | | | 9 | | | 6 | |
| | | | | | |
| Currency translation on redemption values | | — | | | (3) | | | (5) | |
| Retained earnings adjustments: | | | | | | |
| Adjustments of carrying value to redemption value (redemption value does not equal fair value) | | 18 | | | 2 | | | — | |
| Adjustments of carrying value to redemption value (redemption value equals fair value) | | 3 | | | 2 | | | 4 | |
| | | | | | |
| Ending balance | | $ | 109 | | | $ | 165 | | | $ | 318 | |
The Company’s significant redeemable noncontrolling interests are described below.
Discovery Family
Hasbro Inc. (“Hasbro”) had the right to put the entirety of its remaining 40% interest in Discovery Family to the Company at any time during the one-year period beginning December 31, 2021, or in the event the Company’s performance obligation related to Discovery Family was not met. Embedded in the redeemable noncontrolling interest was a call right that was exercisable for one year after December 31, 2021. Neither the put nor the call was exercised in 2022. In December 2022, Hasbro and WBD signed an amendment to the previous agreement extending the put-call election to the period January 31, 2025 to March 31, 2025. Upon the exercise of the put or call options, the price to be paid for the redeemable noncontrolling interest is a function of the then-current fair market value of the redeemable noncontrolling interest, to which certain discounts and redemption floor values may apply in specified situations depending upon the party exercising the put or call and the basis for the exercise of the put or call.
MTG
GoldenTree acquired a put right that required the Company to either purchase all of GoldenTree’s noncontrolling 32.5% interest in the joint venture at fair value or participate in an initial public offering for the joint venture. In 2022, GoldenTree exercised its put right and in 2023, the Company finalized its purchase of GoldenTree’s 32.5% noncontrolling interest for $49 million.
WARNER BROS. DISCOVERY, INC.
NOTES TO CONSOLIDATED FINANCIAL STATEMENTS
Other
In August 2023, the Company and JCOM Co., Ltd. (“JCOM”) executed a series of transaction agreements to which the Company and JCOM each contributed certain rights, liabilities, or rights via license agreements to Discovery Japan, Inc. (“JVCo”), an existing 80/20 joint venture between the Company and JCOM, in exchange for new common shares of JVCo, resulting in the Company and JCOM owning 51% and 49% of JVCo, respectively. Retaining controlling financial interest subsequent to the transaction, the Company continues to consolidate the joint venture. As the terms of the agreement no longer incorporate JCOM’s option to put its noncontrolling interest to the Company, JCOM’s noncontrolling interest was reclassified from redeemable noncontrolling interest to noncontrolling interest outside of stockholders’ equity on the Company’s consolidated balance sheet.
NOTE 20. NONCONTROLLING INTEREST
The Company has a controlling interest in the TV Food Network Partnership (the “Partnership”), which includes the Food Network and Cooking Channel. Food Network and Cooking Channel are operated and organized under the terms of the Partnership. The Company holds 80% of the voting interest and 68.7% of the economic interest in the Partnership. During the fourth quarter of 2024, the Partnership agreement was extended and specified a dissolution date of December 31, 2025. If the term of the Partnership is not extended prior to the dissolution date of December 31, 2025, the Partnership agreement permits the Company, as holder of 80% of the applicable votes, to reconstitute the Partnership and continue its business. If for some reason the Partnership is not continued, it will be required to limit its activities to winding up, settling debts, liquidating assets and distributing proceeds to the partners in proportion to their partnership interests. Ownership interests attributable to the noncontrolling owner are presented as noncontrolling interests on the Company’s consolidated financial statements. Under the terms of the Partnership agreement, the noncontrolling owner cannot force a redemption outside of the Company’s control. As such, the noncontrolling interests in the Partnership are reflected as a component of permanent equity in the Company’s consolidated financial statements.
NOTE 21. RELATED PARTY TRANSACTIONS
In the normal course of business, the Company enters into transactions with related parties. Related parties include entities that share common directorship, such as Liberty Global plc (“Liberty Global”), Liberty Broadband Corporation (“Liberty Broadband”) and their subsidiaries and affiliates (collectively the “Liberty Group”). The Company’s board of directors includes Dr. John Malone, who is Chairman of the Board of Liberty Global and Liberty Broadband and beneficially owns approximately 30% and 48% of the aggregate voting power with respect to the election of directors of Liberty Global and Liberty Broadband, respectively. The majority of the revenue earned from the Liberty Group relates to multi-year network distribution arrangements. Related party transactions also include revenues and expenses for content and services provided to or acquired from equity method investees, or minority partners of consolidated subsidiaries.
The table below presents a summary of the transactions with related parties (in millions).
| | | | | | | | | | | | | | | | | | | | |
| | Year Ended December 31, |
| | 2024 | | 2023 | | 2022 |
| | | | | | |
| | | | | | |
| | | | | | |
| | | | | | |
Revenues and service charges (a) | | $ | 1,404 | | | $ | 2,790 | | | $ | 2,533 | |
| | | | | | |
| Expenses | | $ | 268 | | | $ | 357 | | | $ | 406 | |
| Distributions to noncontrolling interests and redeemable noncontrolling interests | | $ | 193 | | | $ | 301 | | | $ | 300 | |
(a) The decrease in revenue and service charges in 2024 is primarily attributable to transactions with certain entities that are no longer considered related parties, as such entities and the Company ceased to share common directorship in 2024.
The table below presents receivables due from and payables due to related parties (in millions).
| | | | | | | | | | | | | | |
| | December 31, |
| | 2024 | | 2023 |
| Receivables | | $ | 254 | | | $ | 363 | |
| Payables | | $ | 13 | | | $ | 18 | |
In October 2024, the Company sold its minority interests in Formula E to Liberty Global and recorded a $61 million gain not included in the table above. (See Note 4.)
In September 2022, the Company sold 75% of its interest in The CW Network to Nexstar, a related party, and recorded an immaterial gain not included in the table above. (See Note 4.)
WARNER BROS. DISCOVERY, INC.
NOTES TO CONSOLIDATED FINANCIAL STATEMENTS
NOTE 22. COMMITMENTS, CONTINGENCIES, AND GUARANTEES
Commitments
In the normal course of business, the Company enters into various commitments, which primarily include programming and talent arrangements, operating and finance leases (see Note 12), arrangements to purchase various goods and services, long-term debt (see Note 11), pension funding and payments (see Note 17), and future funding commitments to equity method investees (see Note 10) (in millions).
| | | | | | | | | | | | | | | | | | | | | | | | | | |
| Year Ending December 31, | | Content | | Other Purchase Obligations | | Other Employee Obligations | | Total |
| 2025 | | $ | 5,956 | | | $ | 1,119 | | | $ | 443 | | | $ | 7,518 | |
| 2026 | | 3,976 | | | 819 | | | 269 | | | 5,064 | |
| 2027 | | 3,241 | | | 755 | | | 108 | | | 4,104 | |
| 2028 | | 2,589 | | | 173 | | | 52 | | | 2,814 | |
| 2029 | | 1,447 | | | 39 | | | 24 | | | 1,510 | |
| Thereafter | | 4,321 | | | 6 | | | 64 | | | 4,391 | |
| Total | | $ | 21,530 | | | $ | 2,911 | | | $ | 960 | | | $ | 25,401 | |
The commitments disclosed above exclude liabilities recognized on the consolidated balance sheets.
Content purchase obligations include commitments associated with third-party producers and sports associations for content that airs on our television networks and DTC services. Production and licensing contracts generally require the purchase of a specified number of episodes and payments during production or over the term of a license, and include both programs that have been delivered and are available for airing and programs that have not yet been produced or sporting events that have not yet taken place. If the content is ultimately never produced, our commitments expire without obligation.
Other purchase obligations include agreements with certain vendors and suppliers for the purchase of goods and services whereby the underlying agreements are enforceable, legally binding and specify all significant terms. Significant purchase obligations include transmission services, television rating services, marketing commitments and research, equipment purchases, and information technology and other services. Some of these contracts do not require the purchase of fixed or minimum quantities and generally may be terminated with a 30-day to 60-day advance notice without penalty, and are not included in the table above past the 30-day to 60-day advance notice period. Other purchase obligations also include future funding commitments to equity method investees. Although the Company had funding commitments to equity method investees as of December 31, 2024, the Company may also provide uncommitted additional funding to its equity method investments in the future. (See Note 10.)
Other employee obligations are primarily related to employment agreements with creative talent for certain broadcast networks.
Six Flags Guarantee
In connection with the WarnerMedia Business’ former investment in the Six Flags (as defined below) theme parks located in Georgia and Texas (collectively, the “Parks”), in 1997, certain subsidiaries of the Company agreed to guarantee (the “Six Flags Guarantee”) certain obligations of the partnerships that hold the Parks (the “Partnerships”) for the benefit of the limited partners in such Partnerships, including annual payments made to the Parks or to the limited partners and additional obligations at the end of the respective terms for the Partnerships in 2027 and 2028 (the “Guaranteed Obligations”). Six Flags Entertainment Corporation (formerly known as Six Flags, Inc. and Premier Parks Inc.) (“Six Flags”), which has the controlling interest in the Parks, has agreed, pursuant to a subordinated indemnity agreement (the “Subordinated Indemnity Agreement”), to guarantee the performance of the Guaranteed Obligations when due and to indemnify the Company, among others, if the Six Flags Guarantee is called upon. If Six Flags defaults on its indemnification obligations, the Company has the right to acquire control of the managing partner of the Parks. Six Flags’ obligations to the Company are further secured by its interest in all limited partnership units held by Six Flags.
In December 2024, Six Flags provided notice of its exercise of the option related to the theme parks located in Georgia that requires the redemption of all the limited partnership units that Six Flags does not then own in the Georgia Partnership in January 2027. Pursuant to the exercise of the option, all of such outstanding limited partnership interests will be redeemed, and Six Flags will also acquire certain related entity general partnership and managing member interests.
WARNER BROS. DISCOVERY, INC.
NOTES TO CONSOLIDATED FINANCIAL STATEMENTS
Based on the Company’s evaluation of the current facts and circumstances surrounding the Guaranteed Obligations and the Subordinated Indemnity Agreement, it is unable to predict the loss, if any, that may be incurred under the Guaranteed Obligations, and no liability for the arrangements has been recognized as of December 31, 2024. Because of the specific circumstances surrounding the arrangements and the fact that no active or observable market exists for this type of financial guarantee, the Company is unable to determine a current fair value for the Guaranteed Obligations and related Subordinated Indemnity Agreement. The aggregate gross undiscounted estimated future cash flow requirements covered by the Six Flags Guarantee over the remaining term (through 2028) are $589 million. To date, no payments have been made by the Company pursuant to the Six Flags Guarantee.
Contingencies
Other Contingent Commitments
Other contingent commitments primarily include contingent payments for post-production term advance obligations on a certain co-financing arrangement, as well as operating lease commitment guarantees, letters of credit, bank guarantees, and surety bonds, which generally support performance and payments for a wide range of global contingent and firm obligations, including insurance, litigation appeals, real estate leases, and other operational needs. The Company’s other contingent commitments at December 31, 2024 were immaterial.
Put Rights
The Company has granted put rights to non-controlling interest holders in certain consolidated subsidiaries, but the Company is unable to reasonably predict the ultimate amount or timing of any payment. (See Note 19.)
Legal Matters
From time to time, in the normal course of its operations, the Company is subject to various litigation matters and claims, including claims related to employees, stockholders, vendors, other business partners, government regulations, or intellectual property, as well as disputes and matters involving counterparties to contractual agreements, such as disputes arising out of definitive agreements entered into in connection with the Merger. A determination as to the amount of the accrual required for such contingencies is highly subjective and requires judgment about future events. In connection with a contract dispute arising out of definitive agreements entered into in connection with the Merger, the Company established an immaterial accrual in the first quarter of 2024. At this time, the Company is not able to estimate the reasonably possible range of loss or any loss in excess of the accrual associated with such matter. There can be no assurance that any settlement of such dispute will be reached and, if a settlement is reached, what the total dollar amount will be of any such settlement.
The Company may not currently be able to estimate the reasonably possible loss or range of loss for certain matters until developments in such matters have provided sufficient information to support an assessment of such loss. In the absence of sufficient information to support an assessment of the reasonably possible loss or range of loss, no accrual for such contingencies is made and no loss or range of loss is disclosed. Although the outcome of these matters cannot be predicted with certainty and the impact of the final resolution of these matters on the Company’s results of operations in a particular subsequent reporting period is not known, management does not currently believe that the resolution of these matters will have a material adverse effect on the Company’s future consolidated financial position, future results of operations, or cash flows.
Guarantees
There were no guarantees recorded under ASC 460 as of December 31, 2024 and 2023.
In the normal course of business, the Company may provide or receive indemnities that are intended to allocate certain risks associated with business transactions. Similarly, the Company may remain contingently liable for certain obligations of a divested business in the event that a third party does not fulfill its obligations under an indemnification obligation. The Company records a liability for its indemnification obligations and other contingent liabilities when probable and estimable. There were no material amounts for indemnifications or other contingencies recorded as of December 31, 2024 and 2023.
NOTE 23. REPORTABLE SEGMENTS
The Company’s operating segments are determined based on: (i) financial information reviewed by its chief operating decision maker (“CODM”), the Chief Executive Officer (“CEO”), (ii) internal management and related reporting structure, and (iii) the basis upon which the CEO makes resource allocation decisions.
WARNER BROS. DISCOVERY, INC.
NOTES TO CONSOLIDATED FINANCIAL STATEMENTS
The accounting policies of the reportable segments are the same as the Company’s, except that certain inter-segment transactions that are eliminated for consolidation are not eliminated at the segment level. Inter-segment transactions primarily include advertising and content licenses. The Company generally records inter-segment transactions of content licenses at market value. The Company does not report assets by segment because it is not used to allocate resources or evaluate segment performance.
The Company evaluates the operating performance of its operating segments based on financial measures such as revenues and Adjusted EBITDA. Adjusted EBITDA is defined as operating income excluding:
•employee share-based compensation;
•depreciation and amortization;
•restructuring and facility consolidation;
•certain impairment charges;
•gains and losses on business and asset dispositions;
•third-party transaction and integration costs;
•amortization of purchase accounting fair value step-up for content;
•amortization of capitalized interest for content; and
•other items impacting comparability.
The CODM uses this measure to assess the operating results and performance of the segments, perform analytical comparisons, identify strategies to improve performance, and allocate resources to each segment. The Company believes Adjusted EBITDA is relevant to investors because it allows them to analyze the operating performance of each segment using the same metric management uses. The Company excludes employee share-based compensation, restructuring, certain impairment charges, gains and losses on business and asset dispositions, and transaction and integration costs from the calculation of Adjusted EBITDA due to their impact on comparability between periods. Integration costs include transformative system implementations and integrations, such as Enterprise Resource Planning systems, and may take several years to complete. The Company also excludes the depreciation of fixed assets and amortization of intangible assets, amortization of purchase accounting fair value step-up for content (which is included in consolidated costs of revenues), and amortization of capitalized interest for content, as these amounts do not represent cash payments in the current reporting period. We prospectively updated certain corporate allocations at the beginning of 2024. The impact to prior periods was immaterial.
The tables below present summarized financial information for each of the Company’s reportable segments, corporate, and inter-segment eliminations, and other (in millions).
Revenues
| | | | | | | | | | | | | | | | | | | | |
| | Year Ended December 31, |
| | 2024 | | 2023 | | 2022 |
| Studios | | $ | 11,607 | | | $ | 12,192 | | | $ | 9,731 | |
| Networks | | 20,175 | | | 21,244 | | | 19,348 | |
| DTC | | 10,313 | | | 10,154 | | | 7,274 | |
| Corporate | | 8 | | | — | | | 30 | |
| Inter-segment eliminations | | (2,782) | | | (2,269) | | | (2,566) | |
| Total revenues | | $ | 39,321 | | | $ | 41,321 | | | $ | 33,817 | |
WARNER BROS. DISCOVERY, INC.
NOTES TO CONSOLIDATED FINANCIAL STATEMENTS
Reconciliation of Revenues to Segment Adjusted EBITDA
| | | | | | | | | | | | | | | | | | | | | | | | | | |
| | Year Ended December 31, 2024 |
| | Studios | | Networks | | DTC | | | | | | |
| Revenues | | $ | 11,607 | | | $ | 20,175 | | | $ | 10,313 | | | | | | | |
| | | | | | | | | | | | |
| | | | | | | | | | | | |
| | | | | | | | | | | | |
| | | | | | | | | | | | |
| | | | | | | | | | | | |
| | | | | | | | | | | | |
| Less: | | | | | | | | | | | | |
Content expense (a) | | 7,260 | | | 7,135 | | | 6,183 | | | | | | | |
Personnel expense (b) | | 943 | | | 2,153 | | | 773 | | | | | | | |
| Marketing expense | | 1,064 | | | 454 | | | 1,147 | | | | | | | |
Other segment expenses (c) | | 688 | | | 2,284 | | | 1,533 | | | | | | | |
| Segment Adjusted EBITDA | | $ | 1,652 | | | $ | 8,149 | | | $ | 677 | | | | | | | |
| | | | | | | | | | | | | | | | | | | | | | | | | | |
| | Year Ended December 31, 2023 |
| | Studios | | Networks | | DTC | | | | | | |
| Revenues | | $ | 12,192 | | | $ | 21,244 | | | $ | 10,154 | | | | | | | |
| | | | | | | | | | | | |
| | | | | | | | | | | | |
| | | | | | | | | | | | |
| | | | | | | | | | | | |
| | | | | | | | | | | | |
| | | | | | | | | | | | |
| Less: | | | | | | | | | | | | |
Content expense (a) | | 7,112 | | | 7,140 | | | 6,454 | | | | | | | |
Personnel expense (b) | | 927 | | | 2,173 | | | 844 | | | | | | | |
| Marketing expense | | 1,268 | | | 439 | | | 1,313 | | | | | | | |
Other segment expenses (c) | | 702 | | | 2,429 | | | 1,440 | | | | | | | |
| Segment Adjusted EBITDA | | $ | 2,183 | | | $ | 9,063 | | | $ | 103 | | | | | | | |
| | | | | | | | | | | | | | | | | | | | | | | | | | |
| | Year Ended December 31, 2022 |
| | Studios | | Networks | | DTC | | | | | | |
| Revenues | | $ | 9,731 | | | $ | 19,348 | | | $ | 7,274 | | | | | | | |
| | | | | | | | | | | | |
| | | | | | | | | | | | |
| | | | | | | | | | | | |
| | | | | | | | | | | | |
| | | | | | | | | | | | |
| | | | | | | | | | | | |
| Less: | | | | | | | | | | | | |
Content expense (a) | | 6,208 | | | 6,061 | | | 5,727 | | | | | | | |
Personnel expense (b) | | 712 | | | 2,124 | | | 837 | | | | | | | |
| Marketing expense | | 647 | | | 505 | | | 1,583 | | | | | | | |
Other segment expenses (c) | | 392 | | | 1,933 | | | 723 | | | | | | | |
| Segment Adjusted EBITDA | | $ | 1,772 | | | $ | 8,725 | | | $ | (1,596) | | | | | | | |
(a) Content expense includes amortization, impairments, participations, residuals, development expense, and production costs, including talent costs, and is a component of costs of revenues. Content expense excludes content impairments and other development costs recorded in restructuring and other charges, amortization of purchase accounting fair value step-up for content, and amortization of capitalized interest for content as these items are excluded from the calculation of Adjusted EBITDA.
(b) Personnel expense is a component of costs of revenues and selling, general and administrative expense. Personnel expense includes marketing personnel compensation and excludes commissions (included in other segment expenses) and talent costs (included in content expense).
(c) Other segment expenses include distribution costs, other direct costs, software and hardware costs, IT services, professional and consulting fees, commissions, and certain other overhead costs. Other segment items exclude depreciation and amortization, amortization of purchase accounting fair value step-up for content, amortization of capitalized interest for content, employee share-based compensation, third-party transaction and integration costs, and other items impacting comparability as these items are excluded from the calculation of Adjusted EBITDA.
WARNER BROS. DISCOVERY, INC.
NOTES TO CONSOLIDATED FINANCIAL STATEMENTS
Reconciliation of Segment Adjusted EBITDA to loss before income taxes
| | | | | | | | | | | | | | | | | | | | |
| | Year Ended December 31, |
| | 2024 | | 2023 | | 2022 |
| Studios | | $ | 1,652 | | | $ | 2,183 | | | $ | 1,772 | |
| Networks | | 8,149 | | | 9,063 | | | 8,725 | |
| DTC | | 677 | | | 103 | | | (1,596) | |
| Segment Adjusted EBITDA | | $ | 10,478 | | | $ | 11,349 | | | $ | 8,901 | |
| Depreciation and amortization | | 7,037 | | | 7,985 | | | 7,193 | |
| Employee share-based compensation | | 546 | | | 488 | | | 410 | |
| Restructuring and other charges | | 447 | | | 585 | | | 3,757 | |
| Transaction and integration costs | | 242 | | | 162 | | | 1,195 | |
| Facility consolidation costs | | 4 | | | 32 | | | — | |
| Impairment and amortization of fair value step-up for content | | 1,139 | | | 2,373 | | | 2,416 | |
| Amortization of capitalized interest for content | | 46 | | | 46 | | | — | |
| Impairments and loss on dispositions | | 9,603 | | | 77 | | | 117 | |
| Corporate | | 1,260 | | | 1,242 | | | 1,200 | |
| Inter-segment eliminations | | 186 | | | (93) | | | (17) | |
| Operating loss | | (10,032) | | | (1,548) | | | (7,370) | |
| Other (income) expense, net | | (150) | | | 29 | | | (347) | |
| Loss from equity investees, net | | 121 | | | 82 | | | 160 | |
| Gain on extinguishment of debt | | (632) | | | (17) | | | — | |
| Interest expense, net | | 2,017 | | | 2,221 | | | 1,777 | |
| Loss before income taxes | | $ | (11,388) | | | $ | (3,863) | | | $ | (8,960) | |
| | | | | | |
| | | | | | |
| | | | | | |
| | | | | | |
Content Amortization and Impairment Expense
| | | | | | | | | | | | | | | | | | | | |
| | Year Ended December 31, |
| | 2024 | | 2023 | | 2022 |
| Studios | | $ | 5,692 | | | $ | 5,074 | | | $ | 5,950 | |
| Networks | | 4,250 | | | 6,630 | | | 6,171 | |
| DTC | | 6,416 | | | 6,138 | | | 6,800 | |
| Corporate | | 3 | | | (6) | | | (1) | |
| Inter-segment eliminations | | (2,250) | | | (1,697) | | | (1,951) | |
| Total content amortization and impairment expense | | $ | 14,111 | | | $ | 16,139 | | | $ | 16,969 | |
Content expense is generally a component of costs of revenue on the consolidated statements of operations. (See Note 9.)
Revenues by Geography
| | | | | | | | | | | | | | | | | | | | |
| | | Year Ended December 31, |
| | | 2024 | | 2023 | | 2022 |
| U.S. | | $ | 26,434 | | | $ | 28,004 | | | $ | 22,697 | |
| Non-U.S. | | 12,887 | | | 13,317 | | | 11,120 | |
| Total revenues | | $ | 39,321 | | | $ | 41,321 | | | $ | 33,817 | |
Revenues are attributed to each country based on the customer or viewer location.
WARNER BROS. DISCOVERY, INC.
NOTES TO CONSOLIDATED FINANCIAL STATEMENTS
Property and Equipment by Geography
| | | | | | | | | | | | | | |
| | | December 31, |
| | | 2024 | | 2023 |
| U.S. | | $ | 4,430 | | | $ | 4,295 | |
| U.K. | | 991 | | | 980 | |
| | | | |
| Other non-U.S. | | 666 | | | 682 | |
| Total property and equipment, net | | $ | 6,087 | | | $ | 5,957 | |
NOTE 24. SUBSEQUENT EVENTS
Venu Sports
On February 6, 2024, the Company announced that it would enter into a joint venture with ESPN, a subsidiary of The Walt Disney Company (“Disney”), and Fox Corporation (“Fox”) to form Venu Sports, a sports-centric streaming service in the United States. On February 20, 2024, FuboTV Inc. and FuboTV Media Inc. (collectively, “Fubo”) filed a lawsuit against Disney, including certain affiliates, Fox, and WBD (collectively, the “Defendants”) in the U.S. District Court for the Southern District of New York alleging claims under federal and New York antitrust laws.
On January 6, 2025, Disney announced that it had entered into a definitive agreement to combine certain of Hulu Live TV’s assets with Fubo (the “Fubo Transaction”) and provide Fubo a senior unsecured term loan of up to $145 million in January 2026 (the “Fubo Loan”). If Disney funds the Fubo Loan prior to the consummation of the Fubo Transaction, the Company and Fox will participate in a portion of the Fubo Loan by providing loans to Disney with substantially the same economic terms as the Fubo Loan. A $130 million termination fee will be payable by Disney to Fubo if the transaction is terminated under certain circumstances. The Company and Fox have agreed to reimburse a portion of the termination fee to Disney if it becomes payable. In addition, the Defendants reached a settlement with Fubo related to Fubo’s antitrust claims and collectively paid $220 million to Fubo in January 2025, of which the Company’s share was $55 million.
On January 10, 2025, the Defendants announced their decision to discontinue the Venu Sports joint venture and not launch its streaming service effective immediately.
Debt
On January 28, 2025, WMH issued a conditional notice for the redemption in full of all $1,500 million aggregate principal amount of its outstanding 6.412% Senior Notes due 2026 (the “Notes”), in accordance with the terms of the indenture governing the Notes. Such redemption was funded with the proceeds of borrowings pursuant to a new $1,500 million 364-day senior unsecured term loan credit facility entered into on January 28, 2025 by DCL, WBD, certain wholly-owned subsidiaries of WBD party thereto, the lenders party thereto, and Mizuho Bank, Ltd. The Notes were redeemed on February 7, 2025.
Joint Venture
On January 31, 2025, the Company contributed a 70% interest in its music catalog to a joint venture with Cutting Edge Group in exchange for net proceeds of $601 million. The Company will retain a controlling financial interest and consolidate the joint venture as a VIE.
ITEM 9. Changes in and Disagreements With Accountants on Accounting and Financial Disclosure.
None.
ITEM 9A. Controls and Procedures.
Evaluation of Disclosure Controls and Procedures
Our management, with the participation of our Chief Executive Officer and Chief Financial Officer, has evaluated the effectiveness of our disclosure controls and procedures as of December 31, 2024. The term “disclosure controls and procedures,” as defined in Rules 13a-15(e) and 15d-15(e) of the Securities Exchange Act of 1934, as amended (the “Exchange Act”), means controls and other procedures of a company that are designed to provide reasonable assurance that information required to be disclosed by a company in the reports that it files or submits under the Exchange Act is recorded, processed, summarized and reported, within the time periods specified in the SEC’s rules and forms. Disclosure controls and procedures include, without limitation, controls and procedures designed to provide reasonable assurance that information required to be disclosed by a company in the reports that it files or submits under the Exchange Act is accumulated and communicated to the company’s management, including its principal executive and principal financial officers, or persons performing similar functions, as appropriate to allow timely decisions regarding required disclosure. Management recognizes that any controls and procedures, no matter how well designed and operated, can provide only reasonable assurance of achieving their objectives and management necessarily applies its judgment in evaluating the cost-benefit relationship of possible controls and procedures. Based on the evaluation of our disclosure controls and procedures as of December 31, 2024, our Chief Executive Officer and Chief Financial Officer concluded that, as of such date, our disclosure controls and procedures were effective at the reasonable assurance level.
Management’s Annual Report on Internal Control Over Financial Reporting
Management’s report on internal control over financial reporting is set forth in Item 8 of this Annual Report on Form 10-K under the caption “Management’s Report on Internal Control Over Financial Reporting,” which is incorporated herein by reference.
Report of the Independent Registered Public Accounting Firm
The report of our independent registered public accounting firm regarding internal control over financial reporting is set forth in Item 8 of this Annual Report on Form 10-K under the caption “Report of Independent Registered Public Accounting Firm,” which is incorporated herein by reference.
Changes in Internal Control Over Financial Reporting
During the three months ended December 31, 2024, there were no changes in our internal control over financial reporting, as defined in Exchange Act Rule 13a-15(f), that have materially affected, or are reasonably likely to materially affect, our internal control over financial reporting.
ITEM 9B. Other Information.
None.
ITEM 9C. Disclosure Regarding Foreign Jurisdictions that Prevent Inspections.
Not applicable.
PART III
Certain information required in Item 10 through Item 14 of Part III of this Annual Report on Form 10-K is incorporated herein by reference to our definitive Proxy Statement for our 2025 Annual Meeting of Stockholders (“2025 Proxy Statement”), which shall be filed with the SEC pursuant to Regulation 14A of the Exchange Act within 120 days of our fiscal year end.
ITEM 10. Directors, Executive Officers and Corporate Governance.
Information regarding our directors, compliance with Section 16(a) of the Exchange Act, and our Audit Committee, including committee members and its financial expert, will be set forth in our 2025 Proxy Statement under the captions “Proposal 1: Election of Directors,” “Stock Ownership - Security Ownership of Management - Delinquent Section 16(a) Reports,” if applicable, and “Corporate Governance – Board Meetings and Committees – Board Committee Structure – Audit Committee,” respectively, which are incorporated herein by reference.
Information regarding our executive officers is set forth in Part I of this Annual Report on Form 10-K under the caption “Executive Officers of Warner Bros. Discovery, Inc.” as permitted by General Instruction G(3) to Form 10-K.
We have adopted a Code of Ethics (the “Code”) that is applicable to all of our directors, officers and employees. Our board of directors approved an updated Code in January 2023 and reviews it regularly. A copy of the Code and any amendments or waivers that would be required to be disclosed under applicable SEC rules are available free of charge at our Investor Relations website at ir.wbd.com. The information contained on our website is not part of this Annual Report on Form 10-K and is not incorporated by reference herein. In addition, we will provide a printed copy of the Code, free of charge, upon written request to: Investor Relations, Warner Bros. Discovery, Inc., 230 Park Avenue South, New York, NY 10003.
We have adopted an insider trading policy which governs transactions in our securities, as well as the securities of publicly traded companies with whom we have a business relationship, by any of our directors, officers and employees, and other covered persons. While the Company’s insider trading policy is designed to apply to individuals, as described above, rather than transactions by the Company in its own securities, it is the Company’s practice with respect to transactions in its securities to comply with all applicable insider trading laws and Nasdaq standards. We believe the policy is reasonably designed to promote compliance with insider trading laws, rules and regulations applicable to the Company. A copy of our insider trading policy is filed with this Annual Report on Form 10-K as Exhibit 19.
ITEM 11. Executive Compensation.
Information regarding executive compensation will be set forth in our 2025 Proxy Statement under the captions “Executive Compensation – Compensation Discussion and Analysis” and “Executive Compensation – Executive Compensation Tables,” which are incorporated herein by reference.
Information regarding compensation policies and practices as they relate to our risk management, director compensation, and compensation committee interlocks and insider participation will be set forth in our 2025 Proxy Statement under the captions “Executive Compensation – Other Compensation-Related Matters – Risk Considerations in our Compensation Programs,” “Corporate Governance – Director Compensation,” and “Corporate Governance – Board Meetings and Committees – Board Committee Structure – Compensation Committee,” respectively, which are incorporated herein by reference.
Information regarding the compensation committee report will be set forth in our 2025 Proxy Statement under the caption “Executive Compensation – Compensation Committee Report” which is incorporated herein by reference.
ITEM 12. Security Ownership of Certain Beneficial Owners and Management and Related Stockholder Matters.
Information regarding securities authorized for issuance under equity compensation plans will be set forth in our 2025 Proxy Statement under the caption “Securities Authorized for Issuance under Equity Compensation Plans,” which is incorporated herein by reference.
Information regarding security ownership of certain beneficial owners and management will be set forth in our 2025 Proxy Statement under the captions “Stock Ownership – Security Ownership of Certain Beneficial Owners” and “Stock Ownership – Security Ownership of Management,” which are incorporated herein by reference.
ITEM 13. Certain Relationships and Related Transactions, and Director Independence.
Information regarding certain relationships and related transactions, and director independence will be set forth in our 2025 Proxy Statement under the captions “Corporate Governance – Transactions with Related Persons” and “Corporate Governance – Director Independence,” respectively, which are incorporated herein by reference.
ITEM 14. Principal Accountant Fees and Services.
Information regarding principal accountant fees and services will be set forth in our 2025 Proxy Statement under the captions “Audit Matters – Audit Firm Fees and Services” and “Audit Matters – Audit Committee Pre-Approval Procedures,” which are incorporated herein by reference.
PART IV
ITEM 15. Exhibits and Financial Statement Schedules.
(a) The following documents are filed as part of this Annual Report on Form 10-K:
(1) The following consolidated financial statements of Warner Bros. Discovery, Inc. are filed as part of Item 8 of this Annual Report on Form 10-K:
(2) Financial Statement Schedule
Schedule II: Valuation and Qualifying Accounts
Changes in valuation and qualifying accounts consisted of the following (in millions):
| | | | | | | | | | | | | | | | | | | | | | | | | | | | | | | |
| | Beginning
of Year | | Additions | | | | Deductions | | | | End
of Year | |
| 2024 | | | | | | | | | | | | | |
| Allowance for credit losses | | $ | 161 | | | 127 | | | | | (127) | | | | | $ | 161 | | |
| Deferred tax valuation allowance | | $ | 2,191 | | | 179 | | | | | (327) | | | | | $ | 2,043 | | |
| 2023 | | | | | | | | | | | | | |
| Allowance for credit losses | | $ | 123 | | | 152 | | | | | (114) | | | | | $ | 161 | | |
| Deferred tax valuation allowance | | $ | 1,849 | | | 429 | | | | | (87) | | | | | $ | 2,191 | | |
| 2022 | | | | | | | | | | | | | |
Allowance for credit losses (a) | | $ | 54 | | | 165 | | | | | (96) | | | | | $ | 123 | | |
Deferred tax valuation allowance (b) | | $ | 305 | | | 1,617 | | | | | (73) | | | | | $ | 1,849 | | |
| | | | | | | | | | | | | |
(a) Increase in the allowance for credit losses is related to the acquisition of WM in 2022. | |
(b) Additions to the deferred tax valuation allowance include $343 million related to the acquisition of WM in 2022. | |
All other financial statement schedules required to be filed pursuant to Item 8 and Item 15(c) of Form 10-K have been omitted as the required information is not applicable, not material, or is set forth in the consolidated financial statements or notes thereto.
(3) The following exhibits are filed or furnished as part of this Annual Report on Form 10-K pursuant to Item 601 of SEC Regulation S-K and Item 15(b) of Form 10-K:
| | | | | | | | |
| EXHIBITS INDEX |
| Exhibit No. | Description |
| 2.1 | | |
| | |
| 2.2 | | |
| | |
| 2.3 | | |
| | |
| 2.4 | | |
| | |
| 2.5 | | Letter Agreement, dated as of March 29, 2022, by and among Warner Bros. Discovery, Inc. (f/k/a Discovery, Inc.), AT&T Inc., WarnerMedia Holdings, Inc. (f/k/a Magallanes, Inc.) and Drake Subsidiary, Inc. (incorporated by reference to Exhibit 2.2 to the Form 10-Q filed on August 5, 2022 (SEC File No. 001-34177)) |
| | |
| 2.6 | | Amendment No. 2 to Agreement and Plan of Merger, dated as of April 8, 2022, by and among Warner Bros. Discovery, Inc. (f/k/a Discovery, Inc.), AT&T Inc., WarnerMedia Holdings, Inc. (f/k/a Magallanes, Inc.) and Drake Subsidiary, Inc. (incorporated by reference to Exhibit 2.1 to the Form 10-Q filed on August 5, 2022 (SEC File No. 001-34177)) |
| | |
| 2.7 | | Letter Agreement, dated as of April 8, 2022, by and among Warner Bros. Discovery, Inc. (f/k/a Discovery, Inc.), AT&T Inc., WarnerMedia Holdings, Inc. (f/k/a Magallanes, Inc.) and Drake Subsidiary, Inc. (incorporated by reference to Exhibit 2.3 to the Form 10-Q filed on August 5, 2022 (SEC File No. 001-34177)) |
| | |
| 2.8 | | |
| | |
| 2.9 | | |
| | |
| 3.1 | | |
| | |
| 3.2 | | |
| | |
| 4.1 | | |
| | |
| | | | | | | | |
| EXHIBITS INDEX |
| Exhibit No. | Description |
| 4.2 | | |
| |
| 4.3 | | |
| | |
| 4.4 | | |
| | |
| 4.5 | | |
| | |
| 4.6 | | |
| | |
| 4.7 | | |
| | |
| 4.8 | | Eighth Supplemental Indenture, dated as of March 19, 2015, among Discovery Communications, LLC, Discovery Communications, Inc., U.S. Bank National Association, as Trustee, and Elavon Financial Services Limited, UK Branch, as London Paying Agent (incorporated by reference to Exhibit 4.1 to the Form 8-K filed on March 19, 2015 (SEC File No. 001-34177)) |
| | |
| 4.9 | | |
| | |
| 4.10 | | |
| | |
| 4.11 | | Fourteenth Supplemental Indenture, dated as of April 2, 2018, among Discovery Communications, LLC, Discovery, Inc., Scripps Networks Interactive, Inc. and U.S. Bank National Association, as Trustee (incorporated by reference to Exhibit 4.3 to the Form 8-K filed on April 4, 2018 (SEC File No. 001-34177)) |
| | |
| 4.12 | | Fifteenth Supplemental Indenture, dated as of April 3, 2018, among Discovery Communications, LLC, Discovery, Inc., Scripps Networks Interactive, Inc. and U.S. Bank National Association, as Trustee (incorporated by reference to Exhibit 4.1 to the Form 8-K filed on April 4, 2018 (SEC File No. 001-34177)) |
| | |
| 4.13 | | Sixteenth Supplemental Indenture, dated as of June 29, 2018, among Discovery Communications, LLC, Discovery, Inc., Scripps Networks Interactive, Inc. and U.S. Bank National Association, as Trustee (incorporated by reference to Exhibit 4.1 to the Form 10-Q filed November 9, 2018 (SEC File No. 001-34177)) |
| | |
| 4.14 | | Seventeenth Supplemental Indenture, dated as of May 21, 2019, among Discovery Communications, LLC, Discovery, Inc., Scripps Networks Interactive, Inc. and U.S. Bank National Association, as Trustee (incorporated by reference to Exhibit 4.1 to the Form 8-K filed on May 21, 2019 (SEC File No. 001-34177)) |
| | | | | | | | |
| EXHIBITS INDEX |
| Exhibit No. | Description |
| | |
| 4.15 | | Eighteenth Supplemental Indenture, dated as of May 18, 2020, among Discovery Communications, LLC, Discovery, Inc., Scripps Networks Interactive, Inc. and U.S. Bank National Association, as Trustee (incorporated by reference to Exhibit 4.1 to the Form 8-K filed on May 18, 2020 (SEC File No. 001-34177)) |
| | |
| 4.16 | | Nineteenth Supplemental Indenture, dated as of September 21, 2020, among Discovery Communications, LLC, Discovery, Inc., Scripps Networks Interactive, Inc. and U.S. Bank National Association, as Trustee (incorporated by reference to Exhibit 4.1 to the Form 8-K filed on September 21, 2020 (SEC File No. 001-34177)) |
| | |
| 4.17 | | Twentieth Supplemental Indenture, dated as of April 8, 2022, by and among Discovery Communications, LLC, Warner Bros. Discovery, Inc., Magallanes, Inc. and U.S. Bank Trust Company, National Association, as trustee (incorporated by reference to Exhibit 4.1 to the Form 8-K filed on April 12, 2022 (SEC File No. 001-34177)) |
| | |
| 4.18 | | Twenty-First Supplemental Indenture, dated as of April 8, 2022, by and among Discovery Communications, LLC, Warner Bros. Discovery, Inc., Magallanes, Inc. and U.S. Bank Trust Company, National Association, as trustee (incorporated by reference to Exhibit 4.2 to the Form 8-K filed on April 12, 2022 (SEC File No. 001-34177)) |
| | |
| 4.19 | | Twenty-Second Supplemental Indenture, dated as of January 1, 2025, by and among Discovery Communications, LLC, Warner Bros. Discovery, Inc., Scripps Networks Interactive, Inc. and U.S. Bank Trust Company, National Association, as trustee (filed herewith) |
| | |
| 4.20 | | |
| | |
| 4.21 | | First Supplemental Indenture, dated as of April 8, 2022, by and among Magallanes, Inc., Warner Bros. Discovery, Inc., Discovery Communications, LLC, Scripps Networks Interactive, Inc., and U.S. Bank Trust Company, National Association, as Trustee (incorporated by reference to Exhibit 4.4 to the Form 8-K filed on April 12, 2022 (SEC File No. 001-34177)) |
| | |
| 4.22 | | |
| | |
| 4.23 | | First Supplemental Indenture, dated as of March 10, 2023, by and among WarnerMedia Holdings, Inc., Warner Bros. Discovery, Inc., Discovery Communications, LLC, Scripps Networks Interactive, Inc. and U.S. Bank Trust Company, National Association, as trustee (incorporated by reference to Exhibit 4.2 to the Form 8-K filed on March 10, 2023 (SEC File No. 001-34177)) |
| | |
| 4.24 | | Second Supplemental Indenture, dated as of May 17, 2024, among WarnerMedia Holdings, Inc., Warner Bros. Discovery, Inc., Discovery Communications, LLC, Scripps Networks Interactive, Inc., Elavon Financial Services DAC, UK Branch, as paying agent, and U.S. Bank Trust Company, National Association, as trustee (incorporated by reference to Exhibit 4.2 to the Form 8-K filed on May 17, 2024 (File No. 001-34177)) |
| | |
| 10.1 | | |
| | |
| | | | | | | | |
| EXHIBITS INDEX |
| Exhibit No. | Description |
| 10.2 | | |
| | |
| 10.3 | | |
| | |
| 10.4 | | |
| | |
| 10.5 | | |
| | |
| 10.6 | | |
| | |
| 10.7 | | |
| | |
| 10.8 | | Credit Agreement, dated as of October 4, 2024, among Discovery Communications, LLC, Warner Bros. Discovery, Inc. (“WBD”), as facility guarantor, certain wholly-owned subsidiaries of WBD, as borrowers, Scripps Networks Interactive, Inc. and WarnerMedia Holdings, Inc., as subsidiary guarantors, the lenders from time to time party thereto and Bank of America, N.A., as administrative agent, swing line lender and L/C issuer (incorporated by reference to Exhibit 10.1 to the Form 8-K filed on October 9, 2024 (SEC File No. 001-34177)) (2) |
| | |
| 10.9 | | |
| | |
| 10.10 | | |
| | |
| 10.11 | | |
| | |
| 10.12 | | |
| | |
| 10.13 | | |
| | | | | | | | |
| EXHIBITS INDEX |
| Exhibit No. | Description |
| | |
| 10.14 | | |
| | |
| 10.15 | | Fourth Amended and Restated Receivables Purchase Agreement, dated as of August 30, 2022, by and among Warner Bros. Discovery Receivables Funding, LLC, the persons from time to time party thereto, PNC Bank, National Association, Turner Broadcasting System, Inc. and PNC Capital Markets LLC (incorporated by reference to Exhibit 10.5 to the Form 10-Q filed on November 4, 2022 (SEC File No. 001-34177)) (2) |
| | |
| 10.16 | | First Amendment to Fourth Amended and Restated Receivables Purchase Agreement, dated as of August 11, 2023, by and among Warner Bros. Discovery Receivables Funding, LLC, the persons from time to time party thereto, PNC Bank, National Association, Turner Broadcasting System, Inc. and PNC Capital Markets LLC (incorporated by reference to Exhibit 10.1 to the Form 10-Q filed on November 8, 2023 (SEC File No. 001-34177)) (2) |
| | |
| 10.17 | | Second Amendment to the Fourth Amended and Restated Receivables Purchase Agreement, dated as of June 28, 2024, by and among Warner Bros. Discovery Receivables Funding, LLC, the other persons from time to time party thereto, PNC Bank, National Association, Turner Broadcasting System, Inc. and PNC Capital Markets LLC (incorporated by reference to Exhibit 10.2 to the Form 10-Q filed on August 7, 2024 (SEC File No. 001-34177)) |
| | |
| 10.18 | | |
| | |
| 10.19 | | |
| | |
| 10.20 | | |
| | |
| 10.21 | | |
| | |
| 10.22 | | |
| | |
| 10.23 | | |
| | |
| 10.24 | | |
| | |
| 10.25 | | |
| |
| | | | | | | | |
| EXHIBITS INDEX |
| Exhibit No. | Description |
| 10.26 | | |
| | |
| 10.27 | | |
| | |
| 10.28 | | |
| | |
| 10.29 | | |
| | |
| 10.30 | | |
| | |
| 10.31 | | |
| | |
| 10.32 | | |
| | |
| 10.33 | | |
| | |
| 10.34 | | |
| | |
| 10.35 | | |
| | |
| 10.36 | | |
| | |
| 10.37 | | |
| | |
| 10.38 | | |
| | |
| 10.39 | | |
| | |
| | | | | | | | |
| EXHIBITS INDEX |
| Exhibit No. | Description |
| 10.40 | | |
| | |
| 10.41 | | |
| | |
| 10.42 | | |
| | |
| 10.43 | | |
| | |
| 10.44 | | |
| | |
| 10.45 | | |
| | |
| 10.46 | | |
| | |
| 10.47 | | |
| | |
| 10.48 | | |
| | |
| 10.49 | | |
| | |
| 10.50 | | |
| | |
| 10.51 | | |
| | |
| 10.52 | | |
| | |
| | | | | | | | |
| EXHIBITS INDEX |
| Exhibit No. | Description |
| 10.53 | | |
| | |
| 10.54 | | |
| | |
| 10.55 | | |
| | |
| 10.56 | | |
| | |
| 10.57 | | |
| | |
| 10.58 | | |
| | |
| 10.59 | | |
| | |
| 10.60 | | |
| | |
| 10.61 | | |
| | |
| 19 | | |
| | |
| 21 | | |
| | |
| 22 | | |
| | |
| 23 | | |
| |
| 31.1 | | |
| |
| | | | | | | | |
| EXHIBITS INDEX |
| Exhibit No. | Description |
| 31.2 | | |
| |
| 32.1 | | |
| |
| 32.2 | | |
| | |
| 97 | | |
| | |
| 101.INS | | XBRL Instance Document - the instance document does not appear in the Interactive Data File because its XBRL tags are embedded within the Inline XBRL document. |
| |
| 101.SCH | | Inline XBRL Taxonomy Extension Schema Document (filed herewith)† |
| |
| 101.CAL | | Inline XBRL Taxonomy Extension Calculation Linkbase Document (filed herewith)† |
| |
| 101.DEF | | Inline XBRL Taxonomy Extension Definition Linkbase Document (filed herewith)† |
| |
| 101.LAB | | Inline XBRL Taxonomy Extension Label Linkbase Document (filed herewith)† |
| | |
| 101.PRE | | Inline XBRL Taxonomy Extension Presentation Linkbase Document (filed herewith)† |
| |
| 104 | | Cover Page Interactive Data File (formatted as inline XBRL and contained in Exhibit 101) |
* Indicates management contract or compensatory plan, contract or arrangement.
(1) Other instruments defining the rights of holders of long-term debt of the registrant and its consolidated subsidiaries may be omitted from Exhibit 4 in accordance with Item 601(b)(4)(iii)(A) of Regulation S-K. Copies of any such agreements will be supplementally provided to the SEC upon request.
(2) Exhibits, schedules and annexes have been omitted pursuant to Item 601(a)(5) of Regulation S-K and will be supplementally provided to the SEC upon request.
(3) Certain provisions of this exhibit have been omitted pursuant to Item 601(b)(10)(iv) of Regulation S-K and will be supplementally provided to the SEC upon request.
†Attached as Exhibit 101 to this Annual Report on Form 10-K are the following formatted in Inline XBRL (Extensible Business Reporting Language): (i) Consolidated Balance Sheets as of December 31, 2024 and December 31, 2023, (ii) Consolidated Statements of Operations for the Years Ended December 31, 2024, 2023, and 2022, (iii) Consolidated Statements of Comprehensive Income for the Years Ended December 31, 2024, 2023, and 2022, (iv) Consolidated Statements of Cash Flows for the Years Ended December 31, 2024, 2023, and 2022, (v) Consolidated Statements of Equity for the Years Ended December 31, 2024, 2023, and 2022, and (vi) Notes to Consolidated Financial Statements.
ITEM 16. Form 10-K Summary
Not Applicable.
SIGNATURES
Pursuant to the requirements of Section 13 or 15(d) of the Securities Exchange Act of 1934, the registrant has duly caused this report to be signed on its behalf by the undersigned, thereunto duly authorized.
| | | | | | | | | | | | | | |
| | | | |
| | WARNER BROS. DISCOVERY, INC. (Registrant) |
| | |
| Date: February 27, 2025 | | By: | | /s/ David M. Zaslav |
| | | | David M. Zaslav |
| | | | President and Chief Executive Officer |
Pursuant to the requirements of the Securities Exchange Act of 1934, this report has been signed below by the following persons on behalf of the registrant and in the capacities and on the date indicated.
| | | | | | | | | | | | | | |
| | | | |
| Signature | | Title | | Date |
| | |
| /s/ David M. Zaslav | | President and Chief Executive Officer, and Director (Principal Executive Officer) | | February 27, 2025 |
| David M. Zaslav | | | |
| | |
| /s/ Gunnar Wiedenfels | | Chief Financial Officer
(Principal Financial Officer) | | February 27, 2025 |
| Gunnar Wiedenfels | | | |
| | | | |
| /s/ Lori C. Locke | | Executive Vice President and Chief Accounting Officer
(Principal Accounting Officer) | | February 27, 2025 |
| Lori C. Locke | | | |
| | | | |
| /s/ Samuel A. Di Piazza, Jr. | | Director | | February 27, 2025 |
| Samuel A. Di Piazza, Jr. | | | | |
| | |
| /s/ Richard W. Fisher | | Director | | February 27, 2025 |
| Richard W. Fisher | | | | |
| | |
| /s/ Paul A. Gould | | Director | | February 27, 2025 |
| Paul A. Gould | | | | |
| | |
| /s/ Debra L. Lee | | Director | | February 27, 2025 |
| Debra L. Lee | | | | |
| | |
| /s/ Joseph M. Levin | | Director | | February 27, 2025 |
| Joseph M. Levin | | | | |
| | | | |
| /s/ Kenneth W. Lowe | | Director | | February 27, 2025 |
| Kenneth W. Lowe | | | | |
| | | | |
| /s/ Dr. John C. Malone | | Director | | February 27, 2025 |
| Dr. John C. Malone | | | | |
| | |
| /s/ Fazal F. Merchant | | Director | | February 27, 2025 |
| Fazal F. Merchant | | | | |
| | |
| /s/ Anthony J. Noto | | Director | | February 27, 2025 |
| Anthony J. Noto | | | | |
| | | | |
| /s/ Paula A. Price | | Director | | February 27, 2025 |
| Paula A. Price | | | | |
| | |
| /s/ Daniel E. Sanchez | | Director | | February 27, 2025 |
| Daniel E. Sanchez | | | | |
| | | | |
| /s/ Geoffrey Y. Yang | | Director | | February 27, 2025 |
| Geoffrey Y. Yang | | | | |